Meta-QTL analysis of the genetic control of crop height in elite European winter wheat germplasm
13
Meta-QTL analysis of the genetic control of crop height in elite European winter wheat germplasm Simon Griffiths • James Simmonds • Michelle Leverington • Yingkun Wang • Lesley Fish • Liz Sayers • Leodie Alibert • Simon Orford • Luzie Wingen • John Snape Received: 13 September 2010 / Accepted: 11 November 2010 / Published online: 2 December 2010 Ó Springer Science+Business Media B.V. 2010 Abstract In bread wheat (Triticum aestivum L.), crop height is an important determinant of agronomic performance. The aim of this study was to identify genes controlling variation in crop height segregating in elite European winter wheat germplasm. Four doubled haploid populations derived from the crosses Avalon 9 Cadenza, Savannah 9 Rialto, Spark 9 - Rialto and Charger 9 Badger were selected, repre- senting wide diversity in European winter wheat breeding programmes. Genetic maps based on simple sequence repeat (SSR) and Diversity Arrays Tech- nology (DArT) markers were constructed for each population. One hundred and four significant quan- titative trait loci (QTL) were identified in the four populations. A meta-analysis was conducted and the effects condensed into sixteen meta-QTL on chro- mosomes 1A, 1B, 1D, 2A (two meta-QTL), 2B, 2D, 3A, 3B, 4B, 4D, 5A, 5B, 6A, 6B and 6D. These include QTL with additive effects equivalent to Rht- D1 and a potentially new allele of Rht8. The description of these effects offers new opportunities for the manipulation of crop height, biomass and yield in wheat breeding programmes. Keywords Wheat Á Height Á QTL Á Meta QTL Introduction Crop height is an important trait for the performance of a wheat crop (Triticum aestivum L.). In particular, tall plants are much more susceptible to lodging (Berry et al. 2003), so crop height reduction has been an important target for wheat breeding programmes for many decades. A large number of major dwarfing genes have been identified, including natural variants, induced mutations (Konzak 1988) and effects identi- fied using aneuploid lines (Snape et al. 1977). However, efforts to breed for reduced crop height are complicated by the tight coupling of stem extension with other developmental and physiological processes. Reduced crop height is often associated with a reduction in grain yield (Law et al. 1978) or earlier ear emergence, so the identification of genes with alleles that reduce crop height, without reducing grain yield potential, is important for wheat breeding. Genes in this category include the major gibberellic acid (GA)-insensitive dwarfing genes Rht-D1b and Rht-B1b, the height-reducing alleles of which actually increase grain yield in most environments (Flintham et al. 1997). Other height-reducing effects widely Electronic supplementary material The online version of this article (doi:10.1007/s11032-010-9534-x) contains supplementary material, which is available to authorized users. S. Griffiths (&) Á J. Simmonds Á M. Leverington Á Y. Wang Á L. Fish Á L. Sayers Á L. Alibert Á S. Orford Á L. Wingen Á J. Snape Crop Genetics, John Innes Centre, Norwich Research Park, Colney, Norwich NR4 7UH, UK e-mail: simon.griffi[email protected] 123 Mol Breeding (2012) 29:159–171 DOI 10.1007/s11032-010-9534-x
Transcript of Meta-QTL analysis of the genetic control of crop height in elite European winter wheat germplasm

Meta-QTL analysis of the genetic control of crop heightin elite European winter wheat germplasm
Simon Griffiths • James Simmonds • Michelle Leverington •
Yingkun Wang • Lesley Fish • Liz Sayers • Leodie Alibert •
Simon Orford • Luzie Wingen • John Snape
Received: 13 September 2010 / Accepted: 11 November 2010 / Published online: 2 December 2010
� Springer Science+Business Media B.V. 2010
Abstract In bread wheat (Triticum aestivum L.),
crop height is an important determinant of agronomic
performance. The aim of this study was to identify
genes controlling variation in crop height segregating
in elite European winter wheat germplasm. Four
doubled haploid populations derived from the crosses
Avalon 9 Cadenza, Savannah 9 Rialto, Spark 9 -
Rialto and Charger 9 Badger were selected, repre-
senting wide diversity in European winter wheat
breeding programmes. Genetic maps based on simple
sequence repeat (SSR) and Diversity Arrays Tech-
nology (DArT) markers were constructed for each
population. One hundred and four significant quan-
titative trait loci (QTL) were identified in the four
populations. A meta-analysis was conducted and the
effects condensed into sixteen meta-QTL on chro-
mosomes 1A, 1B, 1D, 2A (two meta-QTL), 2B, 2D,
3A, 3B, 4B, 4D, 5A, 5B, 6A, 6B and 6D. These
include QTL with additive effects equivalent to Rht-
D1 and a potentially new allele of Rht8. The
description of these effects offers new opportunities
for the manipulation of crop height, biomass and
yield in wheat breeding programmes.
Keywords Wheat � Height � QTL � Meta QTL
Introduction
Crop height is an important trait for the performance
of a wheat crop (Triticum aestivum L.). In particular,
tall plants are much more susceptible to lodging
(Berry et al. 2003), so crop height reduction has been
an important target for wheat breeding programmes
for many decades. A large number of major dwarfing
genes have been identified, including natural variants,
induced mutations (Konzak 1988) and effects identi-
fied using aneuploid lines (Snape et al. 1977).
However, efforts to breed for reduced crop height
are complicated by the tight coupling of stem
extension with other developmental and physiological
processes. Reduced crop height is often associated
with a reduction in grain yield (Law et al. 1978) or
earlier ear emergence, so the identification of genes
with alleles that reduce crop height, without reducing
grain yield potential, is important for wheat breeding.
Genes in this category include the major gibberellic
acid (GA)-insensitive dwarfing genes Rht-D1b and
Rht-B1b, the height-reducing alleles of which actually
increase grain yield in most environments (Flintham
et al. 1997). Other height-reducing effects widely
Electronic supplementary material The online versionof this article (doi:10.1007/s11032-010-9534-x) containssupplementary material, which is available to authorized users.
S. Griffiths (&) � J. Simmonds � M. Leverington �Y. Wang � L. Fish � L. Sayers � L. Alibert �S. Orford � L. Wingen � J. Snape
Crop Genetics, John Innes Centre, Norwich Research
Park, Colney, Norwich NR4 7UH, UK
e-mail: [email protected]
123
Mol Breeding (2012) 29:159–171
DOI 10.1007/s11032-010-9534-x

deployed in world agriculture include Rht8 on 2DS
(Korzun et al. 1998), and the photoperiod-insensitive
alleles of the ear emergence time genes Ppd-D1 on
2DS and Ppd-B1 on 2BS which have pleiotropic
effects on crop height (Borner et al. 1993).
In addition to the major crop height genes,
quantitative trait loci (QTL) for crop height have
been identified in a number of studies (Ahmed et al.
2000; Cadalen et al. 1998; Kato et al. 1999;
McCartney et al. 2005; Quarrie et al. 2005; Sourdille
et al. 2003). Together, these studies provide an
invaluable survey of the genetic control of crop
height in wheat. However, there is relatively little
data available that shows which genes are still
segregating for variation in crop height in modern
elite Western European winter wheat germplasm.
Wheat yields in Western Europe are amongst the
highest in the world and the rate of progress in yield
potential made by Western European wheat breeding
companies is the highest in the world. In spite of this,
crosses between modern elite UK winter wheat
varieties usually exhibit significant segregation for
crop height, even though the populations are fixed for
the major semi-dwarfing genes. It is not known
whether the allelic variation responsible for this
variation is maintained in elite germplasm, because it
has insignificant, neutral or beneficial effects on crop
performance.
Here we aim to identify QTL responsible for crop
height variation segregating in four doubled haploid
populations derived from six winter and one alterna-
tive wheat varieties that represent a broad cross-
section of elite Western European germplasm.
Methods
Plant materials and development of genetic maps
The doubled haploid wheat populations and genetic
maps used in this study have been described previ-
ously (Griffiths et al. 2009). They are: Charger 9
Badger (C 9 B), 93 doubled haploid lines; Spark 9
Rialto (S 9 R), 129 double haploids lines, Savan-
nah 9 Rialto (Sv 9 R), 126 doubled haploid lines,
and Avalon 9 Cadenza (A 9 C), 202 doubled hap-
loids. The parents of these populations represent a
broad spectrum of the variation present in the UK
elite winter germplasm pool, and are generally
crosses between varieties developed by different
plant breeding companies.
Framework genetic maps were primarily devel-
oped using publicly available single sequence repeat
(SSR) markers aiming for a marker density of one
every 10–20 cM. Primer sets were used from JIC
(psp), IPK Gatersleben (gwm/gdm), Wheat Microsat-
ellite Consortium (wmc), Beltsville Agricultural
Research Station (barc) and INRA (cfd/cfa) collec-
tions; see GrainGenes website (http://www.wheat.
pw.usda.gov/). Targeted markers were selected to
provide good genome coverage using published
consensus maps (Somers et al. 2004), and for their
ease of scoring. DNA fragments were amplified with
PCR and run on 5% polyacrylamide gels for sepa-
ration. The silver staining technique was used to
visualise fragments (Bassam et al. 1991). To further
improve map density, DNAs of the S 9 R, A 9 C
and Sv 9 R populations were subjected to Diversity
Arrays Technology (DArT) genome profiling (Wenzl
et al. 2004) at Triticarte Pty Ltd, Australia (http://
www.triticarte.com.au). Single strand conformation
polymorphism (SSCP) analysis was carried out as
described by Bertin et al. (2005).
Joinmap v3.0 (Stam 1993) was used for genetic
linkage map construction, set at the default settings
with the Kosambi mapping function. Linkage groups
were selected at a minimum LOD of 3 for reliable
associations.
Field trials
Field trials were conducted at five sites: Norwich,
Norfolk, UK; Sandringham, Norfolk, UK; Balmonth,
Fife, UK; Bohnshausen, Langenstein, Germany; and
Froissy, near Amiens, France. Experimental details
are shown in Table 1. The populations S 9 R, C 9 B
and Sv 9 R were part of parallel experiments grown
in the same years; A 9 C data was collected later but
is included here because it is now the UK reference
population under the UK Department of Environment
Food and Rural Affairs (DEFRA) Wheat Genetic
Improvement Network (WGIN http://www.wgin.
org.uk/). Each line was grown in three replicate,
5.5-m2 plots, in a randomised block design, grown
according to standard agronomic practice including
the use of chemical plant growth regulators. Crop
height was measured from soil level to the collar of
160 Mol Breeding (2012) 29:159–171
123
each wheat ear; the mean of two measurements was
taken for each plot.
Statistical analysis
Basic statistical analyses were carried out using
Minitab v15. Analysis of variance was used to
demonstrate the genetic contribution to variation in
crop height for each population and site. Mean values
from the three replicates on each site were used to
calculate correlations of crop height between envi-
ronments and for the detection of QTL. QTL effects
were estimated using the single marker analysis and
composite interval mapping functions of QTL Car-
tographer v2.5 (Basten et al. 1994) using default
settings. QTL with LOD scores greater than 2 were
taken further for inclusion in the meta-analysis.
Additive effect and percentage of total variation for
each QTL identified was calculated using the multi-
ple interval mapping (MIM) function of QTL
Cartographer. Epistatic interactions were detected
using the ‘Refine MIM model’ and ‘QTL interac-
tions’ options in the QTL Cartographer MIM module.
Meta-QTL analysis was performed using Biomer-
cator software v2.1 (Arcade et al. 2004). The genetic
linkage maps of the four populations were projected
onto the published consensus map (Somers et al.
2004) joined with S 9 R and A 9 C WheatDArTm-
aps v1.2 (http://www.triticarte.com.au). QTL and
confidence intervals (CI) were projected together
with the genetic linkage maps; CI were approximated
by the software following Darvasi and Soller (1997).
Meta-analysis was carried out separately for all
chromosomes with three and more QTL. The number
of meta-QTL present was determined as the model
which minimised the Akaike criterion (AIC).
Alternative methods of QTL detection designed
for multi-trait multi-environment (MTME) data
(Malosetti et al. 2008) were also employed. Mixed
model multi-environment QTL analysis was carried
out for each population separately in the GenStat 12.1
(VSN international) QTL suite. Mean phenotypic
data from the different environments and the respec-
tive population map and genotype data were used.
The best suitable variance–covariance structure was
detected for each of the four populations. Genetic
predictors were computed for a step size of 4 cM.
The genetic model was built using the suggested
candidate QTL from single QTL scans. QTL signif-
icance levels and effects were determined by a final
backward selection step at a significant level of 0.05.
Results
Extent of variation in crop height
All populations exhibited significant genetic variation
for crop height within each year/environment combi-
nation (ANOVA not shown). The distribution of
doubled haploid lines into crop height classes in each
environment studied is shown in Fig. 1. Crop height for
each population was highly correlated between envi-
ronments, never falling below a r2 value of 0.69 (0.81–
0.95 for A 9 C; 0.69–0.88 for C 9 B; 0.83–0.94 for
S 9 R; and 0.89–0.96 for Sv 9 R).
Identification of QTL controlling crop height
Analysis of the data using QTL Cartographer with the
threshold criteria described identified a total of 104
QTL. The closest genetic marker, estimated additive
effect and portion of variation accounted for by each
QTL are shown in Electronic Supplementary Material
Table S1. If the assumption is made that QTL
identified in the same genetic interval in one
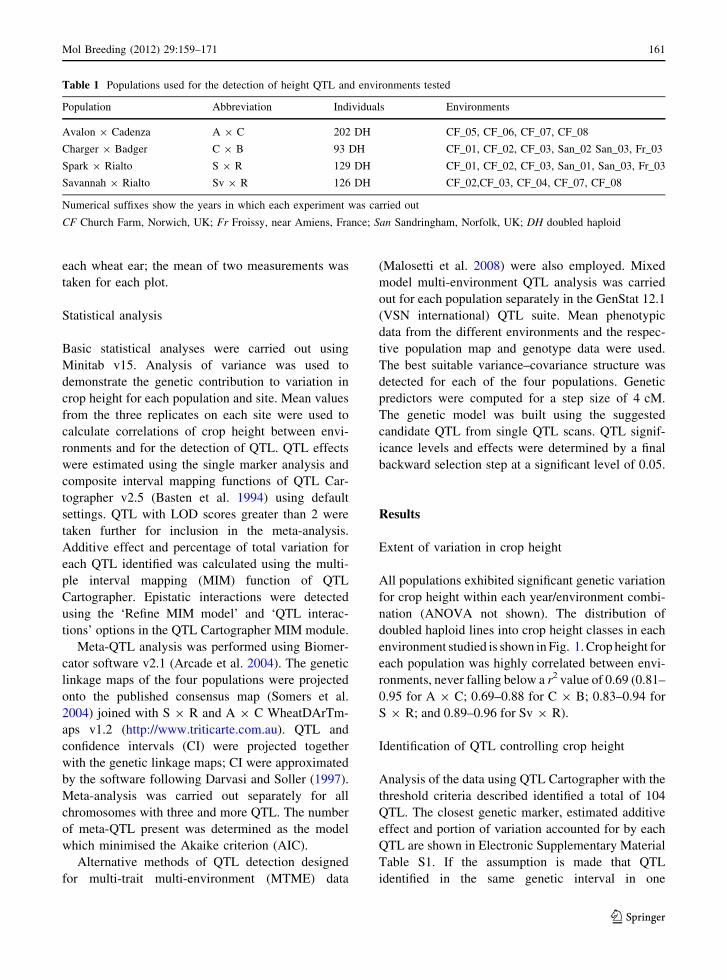
Table 1 Populations used for the detection of height QTL and environments tested
Population Abbreviation Individuals Environments
Avalon 9 Cadenza A 9 C 202 DH CF_05, CF_06, CF_07, CF_08
Charger 9 Badger C 9 B 93 DH CF_01, CF_02, CF_03, San_02 San_03, Fr_03
Spark 9 Rialto S 9 R 129 DH CF_01, CF_02, CF_03, San_01, San_03, Fr_03
Savannah 9 Rialto Sv 9 R 126 DH CF_02,CF_03, CF_04, CF_07, CF_08
Numerical suffixes show the years in which each experiment was carried out
CF Church Farm, Norwich, UK; Fr Froissy, near Amiens, France; San Sandringham, Norfolk, UK; DH doubled haploid
Mol Breeding (2012) 29:159–171 161
123

population, across multiple environments, are due to
the same genes then the numbers of independent QTL
can be reduced to ten in A 9 C, seven in S 9 R,
seven in C 9 B and seven in Sv 9 R (Fig. 2).
Common markers allow the alignment of the genetic
maps used in this study and the projection of the QTL
onto a consensus linkage map showing sixteen meta-
QTL on chromosomes 1A, 1B, 1D, 2A (two meta-
QTL), 2B, 2D, 3A, 3B, 4B, 4D, 5A, 5B, 6A, 6B and
6D (Tables 2 and S2). The MTME approach was used
to complement this analysis. In all cases this approach
identified fewer QTL; six in A 9 C, three in C 9 B,
four in S 9 R and nine in Sv 9 R. In general this is
due to differences in threshold criteria; MTME
analysis detects the QTL but rejects them. However,
in other cases MTME analysis does increase the
significance of QTL located on 1D in S 9 R; 2B in
C 9 B and Sv 9 R; and 7D in Sv 9 R. MTME QTL
locations are shown in Fig. 2 and associated statistics
are shown in Table S3. The effects identified using
QTL Cartographer are now described in more detail,
for each homoeologous chromosome group.
020
4060 CxB CF_01
0204060
45 55 65 75 85 95 105 115 125
CxB CF_02
0204060
45 55 65 75 85 95 105 115 125
CxB Sand_02
0204060
45 55 65 75 85 95 105 115 125
CxB CF_03
0204060
45 55 65 75 85 95 105 115 125
CxB Fra_03
0204060
45 55 65 75 85 95 105 115 125
CxB San_03
0204060
45 55 65 75 85 95 105 115 125
SvxR CF_03
0204060
45 55 65 75 85 95 105 115 125
SvxR CF_02
0204060
45 55 65 75 85 95 105 115 125
SvxR CF_07
0204060
45 55 65 75 85 95 105 115 125
SxR CF_01
0204060
45 55 65 75 85 95 105 115 125
SxR San_01
0204060
45 55 65 75 85 95 105 115 125
SxR CF_02
0204060
45 55 65 75 85 95 105 115 125
SxR San_02
0204060
45 55 65 75 85 95 105 115 125
SxR CF_03
0204060
45 55 65 75 85 95 105 115 125
SxR Fra_03
0204060
45 55 65 75 85 95 105 115 125
SxR San_03
0204060
45 55 65 75 85 95 105 115 125
AxC CF_05
0204060
45 55 65 75 85 95 105 115 125
AxC CF_06
0204060
45 55 65 75 85 95 105 115 125
AxC CF_07
0204060
45 55 65 75 85 95 105 115 125
AxC CF_08
0102030
45 55 65 75 85 95 105 115 125
SvxR
Fig. 1 Distribution of crop height in different environments for the A 9 C, C 9 B, Sv 9 R, and S 9 R doubled haploid populations
used in this study
162 Mol Breeding (2012) 29:159–171
123
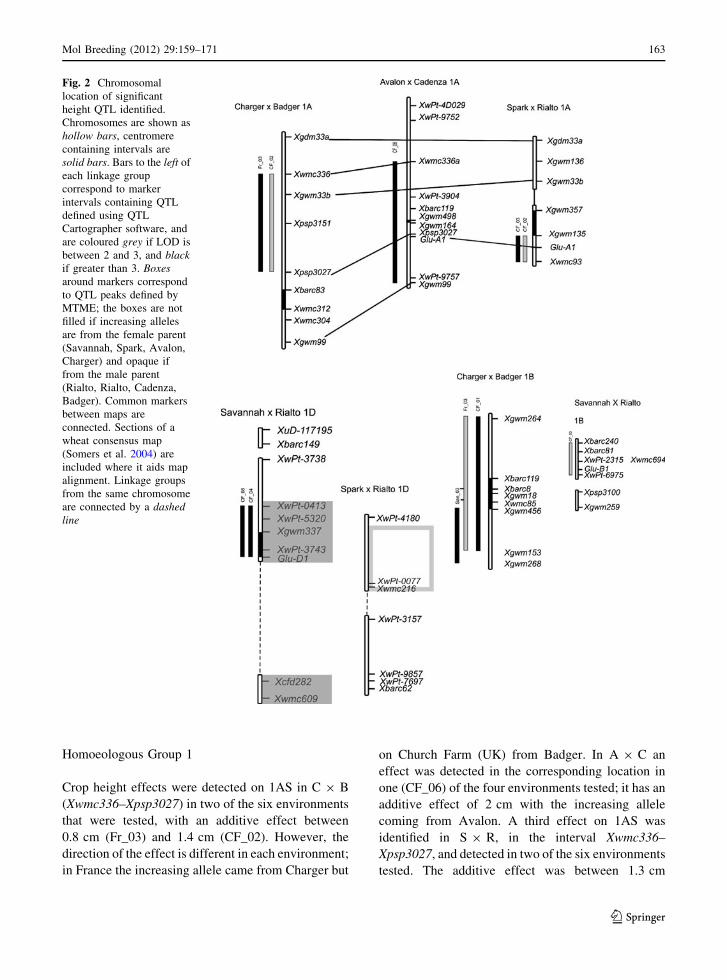
Homoeologous Group 1
Crop height effects were detected on 1AS in C 9 B
(Xwmc336–Xpsp3027) in two of the six environments
that were tested, with an additive effect between
0.8 cm (Fr_03) and 1.4 cm (CF_02). However, the
direction of the effect is different in each environment;
in France the increasing allele came from Charger but
on Church Farm (UK) from Badger. In A 9 C an
effect was detected in the corresponding location in
one (CF_06) of the four environments tested; it has an
additive effect of 2 cm with the increasing allele
coming from Avalon. A third effect on 1AS was
identified in S 9 R, in the interval Xwmc336–
Xpsp3027, and detected in two of the six environments
tested. The additive effect was between 1.3 cm
Fig. 2 Chromosomal
location of significant
height QTL identified.
Chromosomes are shown as
hollow bars, centromere
containing intervals are
solid bars. Bars to the left of
each linkage group
correspond to marker
intervals containing QTL
defined using QTL
Cartographer software, and
are coloured grey if LOD is
between 2 and 3, and blackif greater than 3. Boxesaround markers correspond
to QTL peaks defined by
MTME; the boxes are not
filled if increasing alleles
are from the female parent
(Savannah, Spark, Avalon,
Charger) and opaque if
from the male parent
(Rialto, Rialto, Cadenza,
Badger). Common markers
between maps are
connected. Sections of a
wheat consensus map
(Somers et al. 2004) are
included where it aids map
alignment. Linkage groups
from the same chromosome
are connected by a dashedline
Mol Breeding (2012) 29:159–171 163
123
(CF_02) and 1.8 cm (CF_03) with the increasing
allele coming from Rialto.
An effect was detected on 1B in three of the
six environments tested for C 9 B (Xgwm264–
Xgwm268); the additive effect ranged from 1.3 cm
(CF_01) to 2.2 cm (San_03) with the increasing
allele coming from Charger. For Sv 9 R a single
effect was detected in the interval Xbarc240–XwPt-
6975 on 1B (CF_03) with an additive effect of 1.5 cm
and the increasing allele coming from Savannah.
The only crop height effects located on 1D were
identified in Sv 9 R in the interval XwPt-0413–Glu-
D1 in two of the four environments tested. The
additive effect ranged from 1.6 cm (CF_08) to
1.7 cm (CF_04) with the increasing allele coming
from Rialto.
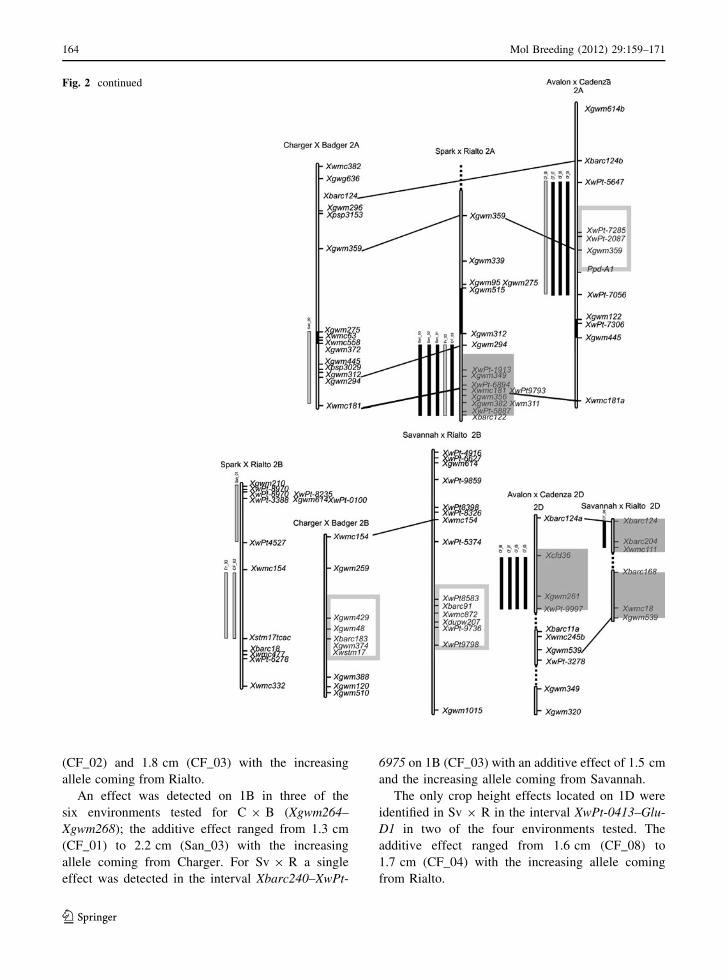
Fig. 2 continued
164 Mol Breeding (2012) 29:159–171
123

Homoeologous Group 2
Crop height effects were identified on 2AS (XwPt-
5647–XwPt-7056) in A 9 C in all of the environments
tested. The additive effect ranged from 2.2 cm (CF_08)
to 3.3 cm (CF_06) with the increasing allele coming
from Avalon. An effect was identified on 2AL in one
(San_02) of six environments for C 9 B (Xgwm275–
Xwmc181) with an additive effect of 1.8 cm and the
increasing allele coming from Badger. In S 9 R a 2AL
effect (Xgwm294-Xbarc122) was identified in five of six
environments tested, with additive effects ranging from
1.3 cm (Fr_03) to 3.3 cm (San_02) and the increasing
alleles coming from Rialto.
In S 9 R separate effects were identified on 2B. In
the interval Xstm17tcac–Xwmc154 significant QTL
were detected in CF_02 and Fr_03 with additive
effects of 1.2 and 2 cm respectively, with the
increasing allele coming from Spark. In the interval
Xgwm210–XwPt4527 an effect identified in one of
Fig. 2 continued
Mol Breeding (2012) 29:159–171 165
123
the six environments tested had an additive effect of
1.6 cm with the increasing allele coming from Spark.
Crop height effects were identified on 2DS
(Xcfd36–XwPt-9997) in all environments tested for
A 9 C and in one (CF_08) for Sv 9 R (Xwmc111-
Xbarc124). For A 9 C the additive effect ranged
from 4.3 (CF_06) to 6.3 cm (CF_07) with the
increasing allele coming from Cadenza. For Sv 9 R
the additive effect is 1.5 cm and the increasing allele
is from Rialto.
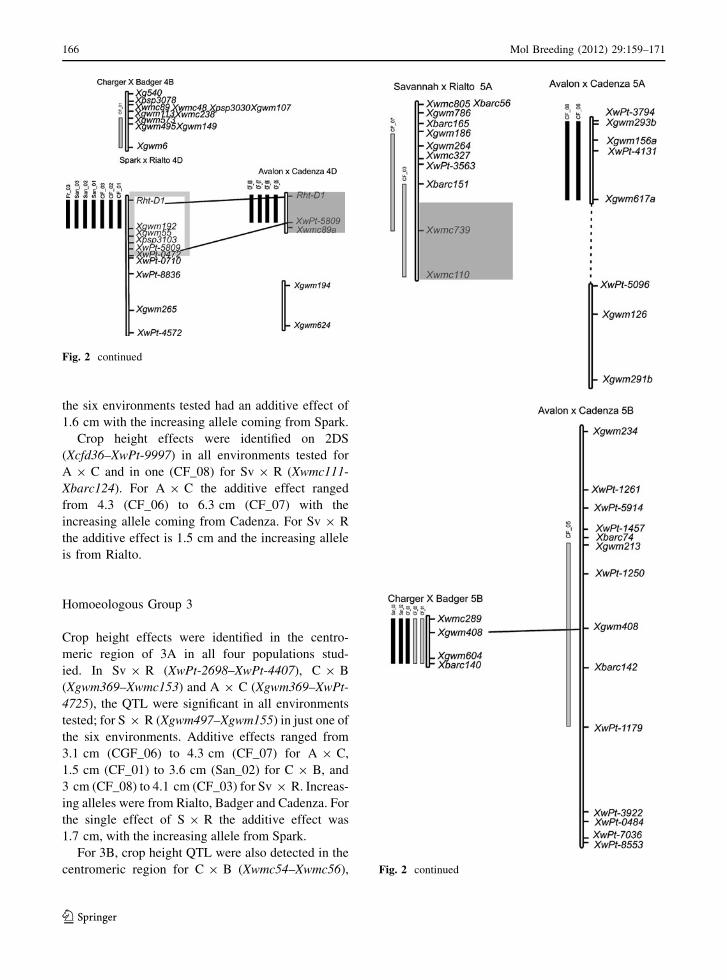
Homoeologous Group 3
Crop height effects were identified in the centro-
meric region of 3A in all four populations stud-
ied. In Sv 9 R (XwPt-2698–XwPt-4407), C 9 B
(Xgwm369–Xwmc153) and A 9 C (Xgwm369–XwPt-
4725), the QTL were significant in all environments
tested; for S 9 R (Xgwm497–Xgwm155) in just one of
the six environments. Additive effects ranged from
3.1 cm (CGF_06) to 4.3 cm (CF_07) for A 9 C,
1.5 cm (CF_01) to 3.6 cm (San_02) for C 9 B, and
3 cm (CF_08) to 4.1 cm (CF_03) for Sv 9 R. Increas-
ing alleles were from Rialto, Badger and Cadenza. For
the single effect of S 9 R the additive effect was
1.7 cm, with the increasing allele from Spark.
For 3B, crop height QTL were also detected in the
centromeric region for C 9 B (Xwmc54–Xwmc56),
Fig. 2 continued
Fig. 2 continued
166 Mol Breeding (2012) 29:159–171
123
S 9 R (Xwmc54–Xbarc229) and A 9 C (XwPt-
6973–XwPt-3005). For A 9 C these QTL were
significant in all of the environments tested. For
C 9 B and S 9 R the effects were detected in four of
the six or all environments tested repectively. Addi-
tive effects ranged from 1.3 cm (CF_01) to 2.6 cm
(San_02) for S 9 R, 1.5 (CF_08) cm to 2.9 cm for
A 9 C (CF_07), and 1.3 cm (CF_02 and CF_03) to
1.9 cm (CF_01) for C 9 B. Increasing alleles were
from Rialto, Cadenza and Charger.
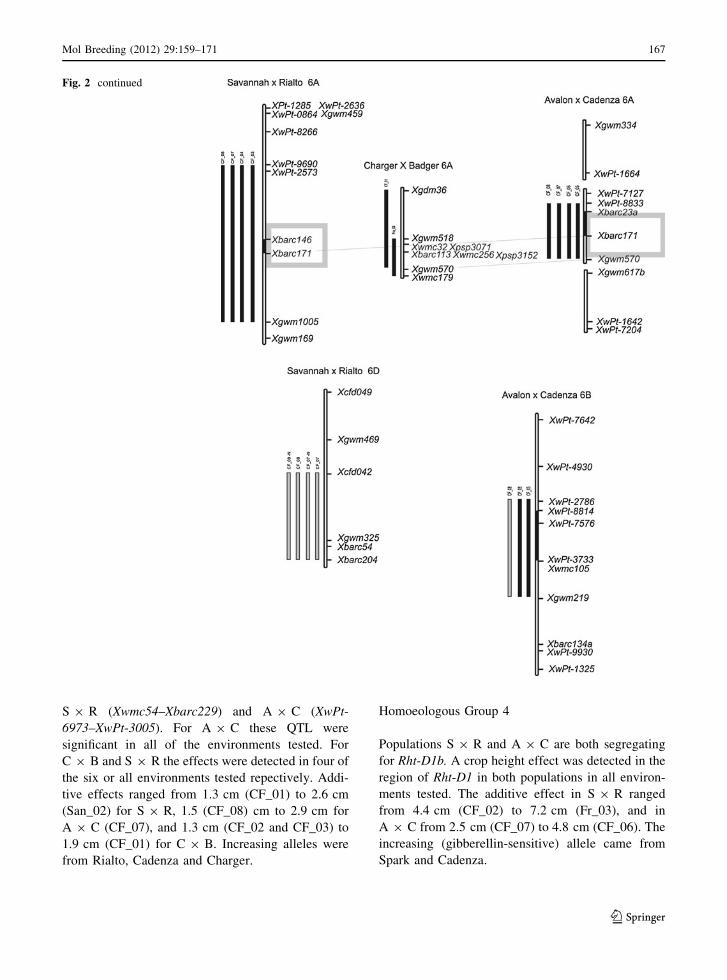
Homoeologous Group 4
Populations S 9 R and A 9 C are both segregating
for Rht-D1b. A crop height effect was detected in the
region of Rht-D1 in both populations in all environ-
ments tested. The additive effect in S 9 R ranged
from 4.4 cm (CF_02) to 7.2 cm (Fr_03), and in
A 9 C from 2.5 cm (CF_07) to 4.8 cm (CF_06). The
increasing (gibberellin-sensitive) allele came from
Spark and Cadenza.
Fig. 2 continued
Mol Breeding (2012) 29:159–171 167
123

A crop height effect was detected on 4B
(Xgwm57–-Xgwm6) in C 9 B in one of the environ-
ments tested.
Homoeologous Group 5
Crop height effects were identified on 5A in Sv 9 R
(Xgwm186–Xwmc110) and A 9 C (Xgwm293b–
Xgwm617a). Additive effects for Sv 9 R ranged
from 1.1 cm (CF_03) and 1.4 cm (CF_07) and the
increasing allele came from Savannah. In A 9 C
QTL were identified in CF_06 and CF_08 with
additive effects of 1.9 and 2.0 cm, with the increasing
allele from Cadenza.
On 5B QTL were identified in five of the six
environments tested for C 9 B (Xwmc289–Xbarc140).
Additive effects ranged from 1.1 cm (CF_01) to 2.2 cm
(San_03), with the increasing allele coming from
Badger. In A 9 C an effect was detected in just one of
the environments tested with the increasing allele of
Cadenza giving an additive effect of 1.6 cm.
Homoeologous Group 6
Crop height effects were identified in the centromeric
region of 6A in all the environments tested for
Sv 9 R (XwPt-9690–Xgwm1005) and A 9 C (XwPt-
8833–Xgwm570), and two of the six environments for
C 9 B (Xgdm36–Xwmc179). The ranges of additive
effects were 3.2 cm (CF_08) to 3.9 cm (CF_03) for
Sv 9 R; 2.7 cm (CF_06) to 3.3 cm (CF_08) for
A 9 C; and 1.6 cm (Fr_03) to 2.1 cm (CF_01)
for C 9 B. The increasing alleles came from Savan-
nah, Avalon and Badger. Independent effects were
identified in Sv 9 R on 6D (Xcfd42–Xbarc204) at
CF_07 and CF_08 with the increasing allele from
Savannah and in A 9 C on 6B (XwPt-2786–
Xgwm219) at CF_05, CF_06 and CF_08, with the
increasing allele coming from Cadenza.
Homoeologous Group 7
No significant QTL were identified on group 7 chro-
mosomes in this study using QTL Cartographer.
Additional QTL identified by MTME analysis
MTME analysis identified QTL on 2B in (C 9 B and
Sv 9 R) and 7D in Sv 9 R. The 2B C 9 B QTL had
an additive effect up to 1.9 cm (Fr_03) and was
closest to Xgwm388, with the increasing allele from
Badger. The 2B Sv 9 R QTL was estimated to have
an additive effect of 1.49 cm in all seven environ-
ments, the closest marker was Xdupw207 and the
increasing allele came from Savannah The 7D
Sv 9 R QTL had an additive effect between
Fig. 2 continued
Table 2 Meta-QTL calculated from four populations used in
this study. Positions refer to consensus genetic map (see
Electronic Supplementary Material Table S1)
Meta-QTL Chromo-
some
Position Flanking markers
QTL_height_1A_1 1A 42.7 wPt9317–wmc93
QTL_height_1B_1 1B 57.8 gwm456–gwm124
QTL_height_1D_1 1D 59.2 gwm337–wmc36
QTL_height_2A_1 2A 30 wPt6207–wmc827
QTL_height_2A_2 2A 111 cfd86–barc76
QTL_height_2B_1 2B 42 wPt4526–wmc261
QTL_height_2D_1 2D 123.6 gwm320–529tc
QTL_height_3A_1 3A 50.4 barc67–wmc269
QTL_height_3B_1 3B 75.7 wmc307–gwm853
QTL_height_4B_1 4B 42 wmc617–wPt8292
QTL_height_4D_1 4D 12 wmc285–Rht2
QTL_height_5A_1 5A 60.3 cfa2104–wmc475
QTL_height_5B_1 5B 116.4 wmc289–barc140
QTL_height_6A_1 6A 32.2 wmc182–psp3029
QTL_height_6B_1 6B 35.8 wmc486–wmc417
QTL_height_6D_1 6D 70.3 cfd19–barc96
168 Mol Breeding (2012) 29:159–171
123

0.59 cm (CF08) and 2.4 cm (CF_07) with the
increasing allele coming from Savannah; the closest
marker was Xwmc702.
Discussion
Implications for the genetic manipulation
of crop stature in wheat
The best characterised crop height effects in wheat
are the GA-insensitive dwarfing alleles of Rht-1: Rht-
D1b and Rht-B1b. Rht-D1b is prevalent in UK winter
wheat varieties. Rht-D1 is segregating in S 9 R
showing additive effects of 4.4 cm (CF_02) to 7.2 cm
(Fr_03), and in A 9 C from 2.5 cm (CF_07) to
4.8 cm (CF_06). This work confirms that, of the crop
height genes which are commonly segregating in UK
germplasm, Rht-1 generally has the largest additive
effect. However, a number of previously undescribed
QTL identified in this study have large additive
effects and a major impact on crop height variation in
segregating material of UK wheat breeding pro-
grammes. As confirmed by MTME analysis in this
study, the height QTL shown to have a large effect in
any one environment tend to be expressed in the
widest range of environments. The MTME analysis
provides a good framework for further investigation
of QTL 9 environment interactions. However, this
discussion will focus on crop height QTL, identified
using QTL Cartographer, that have an additive effect
greater than 2.5 cm. It is worth noting that all of these
QTL were detected with the application of plant
growth regulator (PGR) so the effects identified are of
the same magnitude as experienced by wheat breed-
ers, agronomists and farmers. The additive effects are
likely to be accentuated in material not treated with
PGR.
In A 9 C a QTL on 2DS had an additive effect up
to 6.4 cm, 3.8 cm greater than Rht-D1 in the same
population and environment. This effect was only
detected in A 9 C, showing that the parents of other
crosses surveyed are likely to carry the same alleles at
this locus, probably the short allele. The 2DS QTL
LOD peak coincides with Xgwm261, which has been
shown to be tightly linked to the GA-sensitive semi-
dwarfing gene Rht8 (Korzun et al. 1998). The height-
reducing allele of Rht8 from the variety Mara is
usually associated with a 192-bp allele of gwm261,
although the 192-bp allele is not universally diag-
nostic for the height-reducing allele of Rht8, espe-
cially from varieties not derived from Mara (Ellis
et al. 2007). In A 9 C, the short allele of Avalon is
linked to a 174-bp allele of Xgwm261 and the height-
increasing allele of Cadenza to a 196-bp allele. It is
possible that this A 9 C crop height QTL is an allele
of Rht8. Future work will show if this is the case, and
whether the Cadenza allele is a height-increasing
allele or, alternatively, that Avalon carries the height-
reducing allele brought into coupling with the 174-bp
allele of Xgwm261 by historical recombination. It is
intriguing that the Cadenza allele (196 bp) is rare in
winter wheat germplasm collections and that the
increased height associated with this allele is also
associated with increased yield (unpublished data).
Another QTL unique to A 9 C was identified on 2AS
in the region of Xgwm359, 10 cm distal to Ppd-A1.
This is a potentially homoeologous location to the 2D
effect.
In contrast to the 2AS and 2DS QTL of A 9 C,
some effects appeared to be segregating in the
majority of populations studied. A QTL for crop
height was segregating in the centromeric region of
3A in all populations studied, in a similar location on
3B in C 9 B, S 9 R and A 9 C, and on 6A in
Sv 9 R, C 9 B and A 9 C. This shows that allelic
variation for genes controlling crop height is common
at these loci. The summed additive effects are large.
For example, in A 9 C in environment CF_07 the
substitution effect of tall for short alleles at 2A, 2D,
3A, 3B and 6A but excluding Rht-D1 adds up to
39.6 cm. By applying marker-assisted selection at
these few loci, wheat breeding programmes could
manipulate the stature of varieties by a defined
genetic route, as they have done for Rht-1 since the
discovery of the GA sensitivity test (Gale and
Marshall 1973). In recent years the general correla-
tion of crop height and yield (Law et al. 1978) has
been dissected into single QTL effects (e.g. Maccaf-
erri et al. 2008; Zhang et al. 2004), and it has been
shown that some crop-height-increasing effects also
increase grain yield while others have a neutral effect.
There are likely to be optimal combinations of these
alleles for any particular target environment, balanc-
ing grain yield potential against standing ability and
source limitation. Prior to the introduction of GA-
insensitive semi-dwarfing genes, an important ele-
ment of the ‘green revolution’, breeding for this
Mol Breeding (2012) 29:159–171 169
123

balance was more complex and entirely empirical.
The first GA-insensitive semi-dwarfs in the UK were
shorter than their modern counterparts, which can be
thought of as ‘tall dwarves’. Increased yield potential
in these varieties is associated with their increased
biomass (Shearman et al. 2005), which often brings
with it an increase in crop height.
In the wider context of global wheat breeding, the
genes identified here also have a role to play. For
example, Rht-1 semi-dwarf alleles are widely
deployed and confer a yield advantage in many
environments. However, the beneficial effects of Rht-
1 are not expressed in all environments, for example
some non-irrigated low rainfall areas (Chapman et al.
2007) and where nitrogen fertiliser inputs are low
(Laperche et al. 2008). The genetic characterisation
of crop-height-controlling genes from Western Euro-
pean wheat varieties described here makes their
export to other international breeding programmes
via marker-assisted selection a possible mechanism to
enrich germplasm already adapted to other mega-
environments.
Coincidence of QTL for crop height
and ear emergence
The meta-QTL for crop height identified on 3A, 3B
and 6B are coincident meta-QTL for ear emergence
identified in the same populations (Griffiths et al.
2009). It is possible that the observed differences in
crop height and ear emergence are pleiotropic effects
of the same genes, as is the case for Ppd-1 in wheat
(Borner et al. 1993) and sdw1/denso in barley (Bezant
et al. 1997). Closer inspection shows that the
relationship between crop height and ear emergence
QTL in the populations studied here is not simple.
The 3A crop height QTL is calculated from effects
identified in A 9 C, Sv 9 R, S 9 R and C 9 B.
Coincident ear emergence QTL were identified in
A 9 C, Sv 9 R and S 9 R but not C 9 B. The 3B
crop height meta-QTL derived from effects identified
in C 9 B, S 9 R and A 9 C. For ear emergence, the
3B meta QTL was from C 9 B and S 9 R, with no
effect identified in A 9 C. Finally, for 6A, a crop
height meta-QTL was derived from effects identified
in Sv 9 R, C 9 B and A 9 C. For ear emergence,
6A meta-QTL were derived from A 9 C and S 9 R
data only; no effect was detected in Sv 9 R and
C 9 B. In spite of this, the direction of the effects for
the six loci in which heading date and height effects
were coincident were the same, with early and tall
alleles going together in all cases, thus providing
some evidence for consistent pleitropic effects.
This data shows that the apparent coincidence of
these effects could be a consequence of the level of
genetic resolution in the segregating populations
used, so that linked QTL occur together. This is
more likely to occur in proximal regions where the
reduced level of recombination means that the ratio
of physical to genetic distance is high. For the same
reason, the condensation of effects identified in
different populations into single meta-QTL is a
statistical tool that should be used with caution. In
some cases alleles of positive and negative effect
might be linked. Knowledge of their genetic location
will allow the identification of recombinants that
break this linkage or confirm that the two effects are
mediated by the same genes.
References
Ahmed TA, Tsujimoto H, Sasakuma T (2000) QTLs associated
with plant height and related characters in hexaploid
wheat. Breed Sci 50:267–273
Arcade A, Labourdette A, Falque M, Mangin B, Chardon F,
Charcosset A, Joets J (2004) BioMercator: integrating
genetic maps and QTL towards discovery of candidate
genes. Bioinformatics 20:2324–2326
Bassam BJ, Caetanoanolles G, Gresshoff PM (1991) Fast and
sensitive silver staining of DNA in polyacrylamide gels.
Anal Biochem 196:80–83
Basten CJ, Weir BS, Zeng Z-B (1994) Zmap-a QTL cartog-
rapher. In: Proceedings of the 5th World Congress on
Genetics Applied to Livestock Production: Computing
Strategies and Software, vol 22, Guelph, Ontario, Canada,
pp 65–66 (Organizing Committee, 5th World Congress on
Genetics Applied to Livestock Production)
Berry PM, Sterling M, Baker CJ, Spink J, Sparkes DL (2003) A
calibrated model of wheat lodging compared with field
measurements. Agric For Meteorol 119:167–180
Bertin I, Zhu JH, Gale MD (2005) SSCP-SNP in pearl millet—
a new marker system for comparative genetics. Theor
Appl Genet 110:1467–1472
Bezant J, Laurie D, Pratchett N, Chojecki J, Kearsey M (1997)
Mapping QTL controlling yield and yield components in a
spring barley (Hordeum vulgare L.) cross using marker
regression. Mol Breed 3:29–38
Borner A, Worland AJ, Plaschke J, Schumann E, Law CN
(1993) Pleiotropic effects of genes for reduced height
(Rht) and day-length insensitivity (Ppd) on yield and its
components for wheat grown in middle europe. Plant
Breed 111:204–216
170 Mol Breeding (2012) 29:159–171
123

Cadalen T, Sourdille P, Charmet G, Tixier MH, Gay G, Boeuf
C, Bernard S, Leroy P, Bernard M (1998) Molecular
markers linked to genes affecting plant height in wheat
using a doubled-haploid population. Theor Appl Genet
96:933–940
Chapman SC, Mathews KL, Trethowan RM, Singh RP (2007)
Relationships between height and yield in near-isogenic
spring wheats that contrast for major reduced height
genes. Euphytica 157:391–397
Darvasi A, Soller M (1997) A simple method to calculate
resolving power and confidence interval of QTL map
location. Behav Genet 27:125–132
Ellis MH, Bonnett DG, Rebetzke GJ (2007) A 192 bp allele at
the Xgwm261 locus is not always associated with the
Rht8 dwarfing gene in wheat (Triticum aestivum L.).
Euphytica 157:209–214
Flintham JE, Borner A, Worland AJ, Gale MD (1997) Opti-
mizing wheat grain yield: effects of Rht (gibberellin-
insensitive) dwarfing genes. J Agric Sci 128:11–25
Gale MD, Marshall GA (1973) Insensitivity to gibberellin in
dwarf wheats. Ann Bot 37:729–735
Griffiths S, Simmonds J, Leverington M, Wang Y, Fish L,
Sayers E, Alibert L, Orford S, Wingen L, Herry L, Faure
S, Laurie D, Bilham L, Snape J (2009) Meta-QTL analysis
of the genetic control of ear emergence in elite European
winter wheat germplasm. Theor Appl Genet 119:383–395
Kato K, Miura H, Sawada S (1999) QTL mapping of genes
controlling ear emergence time and plant height on
chromosome 5A of wheat. Theor Appl Genet 98:472–477
Konzak C (1988) Genetic analysis, genetic improvement and
evaluation of induced semi-dwarf mutations in wheat.
Semi-dwarf cereal mutants and their use in cross-breeding
III research coordination meeting, 16–20 December 1985.
International Atomic Energy Agency, Vienna, Austria,
pp 39–50
Korzun V, Roder MS, Ganal MW, Worland AJ, Law CN
(1998) Genetic analysis of the dwarfing gene (Rht8) in
wheat. Part I. Molecular mapping of Rht8 on the short arm
of chromosome 2D of bread wheat (Triticum aestivum L.).
Theor Appl Genet 96:1104–1109
Laperche A, Le Gouis J, Hanocq E, Brancourt-Hulmel M
(2008) Modelling nitrogen stress with probe genotypes to
assess genetic parameters and genetic determinism of
winter wheat tolerance to nitrogen constraint. Euphytica
161:259–271
Law CN, Snape JW, Worland AJ (1978) Genetic relationship
between height and yield in wheat. Heredity 40:133–151
Maccaferri M, Sanguineti MC, Corneti S, Ortega JLA, Ben
Salem M, Bort J, DeAmbrogio E, del Moral LFG,
Demontis A, El-Ahmed A, Maalouf F, Machlab H, Martos
V, Moragues M, Motawaj J, Nachit M, Nserallah N,
Ouabbou H, Royo C, Slama A, Tuberosa R (2008)
Quantitative trait loci for grain yield and adaptation of
durum wheat (Triticum durum Desf.) across a wide range
of water availability. Genetics 178:489–511
Malosetti M, Ribaut JM, Vargas M, Crossa J, vanEeuwijk FA
(2008) A multi-trait multi-environment QTL mixed model
with an application to drought and nitrogen stress trials in
maize (Zea mays L.). Euphytica 161:241–257
McCartney CA, Somers DJ, Humphreys DG, Lukow O, Ames
N, Noll J, Cloutier S, McCallum BD (2005) Mapping
quantitative trait loci controlling agronomic traits in the
spring wheat cross RL4452 9 ‘AC Domain’. Genome
48:870–883
Quarrie SA, Steed A, Calestani C, Semikhodskii A, Lebreton
C, Chinoy C, Steele N, Pljevljakusic D, Waterman E,
Weyen J, Schondelmaier J, Habash DZ, Farmer P, Saker
L, Clarkson DT, Abugalieva A, Yessimbekova M, Turu-
spekov Y, Abugalieva S, Tuberosa R, Sanguineti MC,
Hollington PA, Aragues R, Royo A, Dodig D (2005) A
high-density genetic map of hexaploid wheat (Triticumaestivum L.) from the cross Chinese Spring 9 SQ1 and its
use to compare QTLs for grain yield across a range of
environments. Theor Appl Genet 110:865–880
Shearman VJ, Sylvester-Bradley R, Scott RK, Foulkes MJ
(2005) Physiological processes associated with wheat
yield progress in the UK. Crop Sci 45:175–185
Snape JW, Law CN, Worland AJ (1977) Whole chromosome
analysis of height in wheat. Heredity 38:25–36
Somers DJ, Isaac P, Edwards K (2004) A high-density
microsatellite consensus map for bread wheat (Triticumaestivum L.). Theor Appl Genet 109:1105–1114
Sourdille P, Cadalen T, Guyomarc’h H, Snape JW, Perretant
MR, Charmet G, Boeuf C, Bernard S, Bernard M (2003)
An update of the Courtot 9 Chinese Spring intervarietal
molecular marker linkage map for the QTL detection of
agronomic traits in wheat. Theor Appl Genet 106:
530–538
Stam P (1993) Construction of integrated genetic-linkage maps
by means of a new computer package—joinmap. Plant J
3:739–744
Wenzl P, Carling J, Kudrna D, Jaccoud D, Huttner E, Klein-
hofs A, Kilian A (2004) Diversity Arrays Technology
(DArT) for whole-genome profiling of barley. Proc Natl
Acad Sci US A 101:9915–9920
Zhang ZH, Li P, Wang LX, Hu ZL, Zhu LH, Zhu YG (2004)
Genetic dissection of the relationships of biomass pro-
duction and partitioning with yield and yield related traits
in rice. Plant Sci 167:1–8
Mol Breeding (2012) 29:159–171 171
123