The Influence of Height on Academic Outcomes
29
The Influence of Height on Academic Outcomes * Devon Gorry Utah State University [email protected] August, 2016 Abstract This paper examines whether the height premium for academic outcomes is driven by unequal opportunities for tall individuals. Using data from the Na- tional Longitudinal Survey of Adolescent Health, this paper shows that taller individuals typically earn higher grades and attain more schooling, but the associations are not uniform across school size. Height is only associated with better outcomes for students attending large schools and these improvements are concentrated among males. Data suggest that height contributes more to sports participation and school satisfaction in large schools where resources are more scarce. Thus, differential opportunities or treatment across height in large schools may drive the performance differences. * I thank Steve Levitt, Emily Oster, Andy Zuppann, seminar participants, and anonymous ref- erees for helpful comments. All mistakes are my own. This research uses data from Add Health, a program project directed by Kathleen Mullan Harris and designed by J. Richard Udry, Peter S. Bearman, and Kathleen Mullan Harris at the University of North Carolina at Chapel Hill, and funded by grant P01-HD31921 from the Eunice Kennedy Shriver National Institute of Child Health and Human Development, with cooperative funding from 23 other federal agencies and foundations. Special acknowledgment is due Ronald R. Rindfuss and Barbara Entwisle for assistance in the original design. Information on how to obtain the Add Health data files is available on the Add Health website (http://www.cpc.unc.edu/addhealth). No direct support was received from grant P01-HD31921 for this analysis.
-
Upload
khangminh22 -
Category
Documents
-
view
2 -
download
0
Transcript of The Influence of Height on Academic Outcomes

The Influence of Height on Academic Outcomes∗
Devon GorryUtah State [email protected]
August, 2016
Abstract
This paper examines whether the height premium for academic outcomes isdriven by unequal opportunities for tall individuals. Using data from the Na-tional Longitudinal Survey of Adolescent Health, this paper shows that tallerindividuals typically earn higher grades and attain more schooling, but theassociations are not uniform across school size. Height is only associated withbetter outcomes for students attending large schools and these improvementsare concentrated among males. Data suggest that height contributes more tosports participation and school satisfaction in large schools where resourcesare more scarce. Thus, differential opportunities or treatment across height inlarge schools may drive the performance differences.
∗I thank Steve Levitt, Emily Oster, Andy Zuppann, seminar participants, and anonymous ref-erees for helpful comments. All mistakes are my own.
This research uses data from Add Health, a program project directed by Kathleen Mullan Harrisand designed by J. Richard Udry, Peter S. Bearman, and Kathleen Mullan Harris at the Universityof North Carolina at Chapel Hill, and funded by grant P01-HD31921 from the Eunice KennedyShriver National Institute of Child Health and Human Development, with cooperative funding from23 other federal agencies and foundations. Special acknowledgment is due Ronald R. Rindfuss andBarbara Entwisle for assistance in the original design. Information on how to obtain the Add Healthdata files is available on the Add Health website (http://www.cpc.unc.edu/addhealth). No directsupport was received from grant P01-HD31921 for this analysis.

1 Introduction
It has been well established that height is correlated with improved outcomes along
a number of dimensions, including educational achievement, labor market outcomes,
and health.1 Although taller people have better average outcomes, the reasoning
is still debated. Are taller people given more opportunities in school, favored in
the labor market, and treated differently than their shorter peers or is height just
associated with better childhood environments and a superior cognitive endowment?
The answers to these questions have different policy implications. If height leads
to differential opportunities for children in school, then policy may improve the
disparities.
Persico et al. (2004) find that teenage height, not adult height, matters for labor
market outcomes. Their finding suggests that labor market discrimination is not
a major factor contributing to the height premium and indicate that adolescent
experiences may play a role in the association between height and wages. They
argue that taller students could have more access to clubs or social activities that
develop human capital and lead to improved labor market outcomes. Thus, even
without discrimination in the labor market, there may be unfair advantages to being
tall during one’s school years.
Alternatively, Case and Paxson (2008) provide evidence for a different explanation:
1Past literature shows that taller students perform better in the classroom and on cognitive tasksand attain more schooling (Downie et al., 1997; Case and Paxson, 2008; Cohen, 2009; Heineck, 2009;Case and Paxson, 2010). Papers since early 1900s report that height is associated with improvedlabor market outcomes such as employment and wages (Gowin, 1915; Loh, 1993; Sargent andBlanchflower, 1994; Behrman and Rsenzweig, 2001; Case and Paxson, 2008; Case et al., 2009;Hubler, 2009; Case and Paxson, 2010). This height premium is often large in magnitude, withtaller workers earning 4 to 6 percent more than their shorter counterparts (Loh, 1993). Finally,research indicates that taller individuals also have better health outcomes and live longer (Caseand Paxson, 2008b; Cohen, 2009; and Case and Paxson 2010).
1

average height reflects cognitive ability. Differences in genetics, health, and early
environmental factors are related to physical growth as well as cognitive development.
Thus, children who are endowed with good genes or grow up in a healthy environment
are not only more likely to grow taller, but they also perform better in school and
excel in the workplace due to higher cognitive function. This superior cognitive
development can cause associations between height and improved outcomes. Case
and Paxson (2008) find that height premiums in wages diminish when childhood
test scores are included as a proxy for cognitive development. Furthermore, the
authors show that taller, healthier individuals achieve their growth spurts earlier
in life leading to larger height differences during adolescence. This greater height
disparity during teenage years can explain why teenage height is more significant
than adult height in the results of Persico et al. (2004).
Given that the literature provides different explanations for the association of height
and outcomes, this paper further assesses this relationship by examining whether the
associations between height and outcomes are uniform across school size. If taller
students are better at capturing limited opportunities or resources as suggested by
Persico et al. (2004), then we would expect height to matter more in large schools
where there is more competition for scarce resources. Using data from The National
Longitudinal Study of Adolescent Health (AddHealth), Table 1 shows that opportu-
nities are more limited in larger schools. Relative to the smallest quartile of schools,
the largest quartile of schools has higher student teacher ratios, fewer students par-
ticipating in school sports, and fewer students in other clubs. In addition, Table 1
shows that fewer students in large schools report that their best friends come from
the same school, suggesting that it may be harder to make close relationships in big
schools. If height helps one access more school resources or make better connec-
tions with teachers and friends, then height should matter more in large schools. If
2
these factors affect outcomes, then the association between height and educational
outcomes should be stronger in large schools. This paper tests whether height asso-
ciations differ across school size.
First, this paper confirms that height is associated with improved academic perfor-
mance. Taller students earn higher grades and attain more schooling, with perfor-
mance gains driven by improvements for tall males. Next, this paper shows that the
relationship between height and outcomes is in fact strongest in large schools. That
is, tall male students typically outperform their peers in large schools, but for stu-
dents who attend small schools height is not correlated with better outcomes. While
previous research establishes a link between height and improved outcomes, this pa-
per is the first to show that the association varies across school size. Controlling
for health and parental background often diminishes the average height relationship,
but it does not eliminate the differential relationship across school size. The results
suggest that large school settings may favor tall individuals and contribute to the
height premium.
The paper proceeds as follows: Section 2 provides an overview of the data; Section
3 details the differential associations of height across school size; Sections 4 and 5
explore the role of extracurricular participation and school satisfaction in explaining
these associations, respectively; and Section 6 concludes.
2 Data
AddHealth is a survey of health related behaviors and outcomes of adolescents from
middle and high school years into young adulthood. AddHealth is a school-based
3

survey that interviewed students from a stratified random sample of high schools
and middle schools across the country. Schools were chosen in an attempt to obtain
a representative sample of the United States with respect to region of country, ur-
banicity, school size, school type, and ethnicity. Students within each school were
surveyed at random. Due to oversampling in some categories, sample weights are
used throughout the analysis. The analysis for this study focuses on a subsample of
students who attended non-urban high schools.2 This sample includes approximately
67 schools and over 4,000 students. The schools from which students are sampled
range in size from 47 students to 2,590.
AddHealth consists of four rounds of surveys. The first wave of the study, in 1994-95,
targeted 7th through 12th graders. In addition to the in-home and parental surveys
conducted on the longitudinal participants, an in-school survey was administered to
all students as well as a separate survey for administrators. The following year, wave 2
of the study conducted another round of in-home interviews and phone conversations
with school administrators. The wave 3 and 4 follow-up surveys occurred from 2001
to 2002 and from 2008 to 2009, respectively. In addition to more in-home interviews,
the third wave also gained permission from participants to collect past high school
records.
The independent variables of interest are height and height interacted with cohort
size. This paper uses physical height measurements that are taken by the interviewer
in the second round of surveys.3 This height represents a student’s height in high
2Only non-urban schools are used in an attempt to keep other differences to a minimum. Urbanschools differ substantially from suburban and rural schools not only due to their very large size,but also on other schooling characteristics such as student resources, population in poverty, andstudent body composition. Approximately 26% of the AddHealth sample, which is representative ofthe U.S., is urban. This is consistent with reports from the National Center for Education Statistics(see U.S. Department of Education, 2005 where they report 28.8% of public school students in acentral city location). The results found in this paper do not apply for urban schools.
3Self reported height is also recorded; however, given that self reported height tends to be over
4

school, which is the relevant height measure if height matters for schooling outcomes.
This is also the height that Persico et al. (2004) found to be most predictive of adult
wages. Students who were in grade 12 were not contacted for the second round of
surveys. Therefore only participating students who initially started in grades 9-11
are included in the study. Cohort size is constructed using the schools reported
enrollment, dividing by the total number of grades at the school, and multiplying
by the number of high school grades. Thus, the size variable represents the size of
the high school cohort at one’s school. This is the relevant size variable since this is
likely the pool of students that compete for similar resources.4
The dependent variables include outcome data from the first, third, and fourth survey
waves. The wave 1 in-school questionnaire asked students to self-report their most
recent grades for English, History, Math, and Science. This reported GPA1 variable
is an average of reported grades across subjects where A is coded as 4, B is coded as
3, C is coded as 2, and “D or below” is coded as 1.5 While this variable has a large
number of responses, it does not include all classes and is subject to measurement
error. A GPA2 variable comes from student transcript data obtained in round 3 of the
survey, which represents one’s combined high school GPA for all classes. However,
the sample size is much smaller for this outcome because not all individuals provide
transcript access and the measure reflects a different composition of classes across
students. The high school diploma variable is generated from wave 3 and 4 responses.
estimated (see Brener et al., 2003) this paper uses the height that is measured by the interviewer.Results, however, are similar with self reported height. Self reported heights as well as third roundmeasured heights are used to find errors in the recording of measured heights. In particular, whenself reported height and future measured height are both much shorter or both much taller thanthe recorded height, it is assumed that the feet were recorded improperly and a correction is made.This only occurs in 6 cases and results are not sensitive to correcting, omitting, or keeping theoriginal measurements.
4The results are robust to defining size in other ways such as using school size or class size forschools that have grades 9-12 and defining school size as the size of the 9th or 10th grade cohort.
5The question does not differentiate between D and F.
5

In wave 3 respondents are asked to report their high school graduation status. Those
responding as having a diploma are coded as 1 while those who respond that they
have a GED, a certificate of completion, or none of the above are coded as 0. If wave 3
data are missing, wave 4 data are used. The highest grade completed variable comes
from wave 4 responses where students report the highest education level achieved.
The responses are categorical for 8th grade or less, some high school, high school
graduate, etc. These categorical variables are converted to years of schooling for
easier interpretation of the coefficients. To test whether there are lasting relationships
beyond schooling, wave 4 variables for household income and whether the respondent
used welfare since the last survey are also used.
Other dependent variables include whether a student participates in a sport, whether
a student participates in a club, and various measures of one’s school experience. The
sport and club variables are coded as 1 if a student reports participating in a sport
or a school club, respectively, on the in-school survey and 0 otherwise. The in-school
survey has students report whether they feel “a part of this school” or “happy to be
at this school”. These variables are coded as 1 if students strongly agree or agree
and 0 otherwise. The in-home survey asks students how much “teachers care about
you”. This variable is coded as a 1 if students report very much or quite a bit and
0 otherwise.
Controls for health and cognitive ability are included as Case and Paxson (2008)
suggest that they may drive relationships between height and outcomes. Direct
measures for health come from questions in waves 1 and 2 that ask respondents to
report on their general health. Parental schooling is included as a control because
it tends to be correlated with both health and children’s cognitive ability. Other
controls include race, gender, age, grade level, and school fixed effects.
6
Table 2 provides descriptive statistics for each of the outcome variables described,
height and school size variables, as well as the control variables. The table presents
the data separated by big and small schools and also by individuals above and below
the median height. Big schools are defined as schools above the median cohort size
in the data while small schools are at or below the median cohort size. Median
height is defined as the median height in the data by age and gender. A look at
the average outcome variables in the raw data suggests that students above median
height perform slightly better than those below the median in big schools. However,
the performance gains are smaller or reversed for students above the median height
in small schools. The next section further assesses the association of height with
outcomes.
3 Height and Outcomes
Tables 3 and 4 show the correlations between height and outcomes. The first column
for each outcome controls only for gender and race. Table 3, column 1 shows that
an extra inch of height is associated with an increase in reported GPA by about
0.013 points. This means that a foot of difference in height is associated with an
increase in GPA by approximately one-fifth of a standard deviation on average.
The results are much smaller for transcript GPA and not statistically significant.
Column 9 in Table 3 shows that an inch of height is correlated with an increase in
the probability of graduation by 0.004.6 This means that someone who is a foot
6Note that a linear probability model is used for all binary outcomes. Probit models give similarresults but interaction coefficients estimated with non-linear models are not easily interpretable andare difficult to present (see Ai and Norton (2003) and Norton, Wang, and Ai (2004)). One concernis that sometimes interaction effects change sign across predicted probabilities. Overall, this is notthe case for the results in this paper.
7

taller than their peer is almost 5 percentage points more likely to graduate from
high school on average. Column 1 of Table 4 shows that an extra inch of height is
correlated with 0.047 additional years of schooling. Thus a foot increase in height
is associated with over half a year of additional schooling on average. These results
confirm the positive associations between height and outcomes that are found in the
earlier height literature.7 Tables 3 and 4 also break down the results across gender.
This decomposition suggests that the positive correlation of height with outcomes is
driven by males.
To test whether the academic gains extend to the labor market, the last two outcomes
of Table 4 look at welfare use and household income in wave 4 of the survey. There
are no significant relationships between height and welfare or income in this data.
However, most individuals are in their late 20’s at the time and current incomes may
not be a good reflection of lifetime earnings.8
The results in the second column for each outcome in Tables 3 and 4 show that the
relationship between academic outcomes and height diminishes when additional con-
trols and school fixed effects are included. The decline in the relationship between
height and outcomes is large and the relationships are no longer significant in many
cases. Thus, on average, height is not correlated with academic improvement once
controls are included. Much of the fall is due to the addition of parental educa-
tion, which is positively and significantly related to height in this sample. Case and
Paxson (2008) show that intelligence and early life experiences related to the family
7Some papers have found nonlinearities in the relationship between height and cognitive out-comes and wages (see Hubler (2009) and Heineck (2009)). In this data, there is some evidence ofincreasing returns to height for high school graduation and female reported GPA as well as de-creasing returns for male wages, but there is little evidence of other nonlinear relationships whensquared terms are added to the regressions. Since the the main interaction results do not changewith squared terms, these terms are not included or reported here.
8See Haider and Solon (2006).
8

environment contribute positively to height correlations; thus we would expect the
fall that we see between the first and second columns. This fall in the height coeffi-
cient may lead one to conclude that intelligence, health, and family background can
explain all of the correlation we see between height and academic outcomes. The fall,
however, is not uniform across school size. While the average association of height
on outcomes tends towards zero once controls are added, in most cases, the height
premium remains for students in large schools.
The third and fourth columns for each outcome in Tables 3 and 4 look at the relation-
ship between height interacted with school size and academic outcomes. This allows
for the association of height to vary across small and large schools. These interactions
are positive and significant for all academic outcomes. That is, height has a more
positive association with grade and graduation outcomes in bigger schools than in
smaller schools. This relationship remains significant even when controls are added.
Once again, separating results by gender shows that these differential associations
of height on outcomes across school size are driven by males. For females, height
has largely insignificant associations with outcomes and does not significantly vary
across school size. While longer term outcomes such as schooling completion and
welfare show a similar pattern across school size, there is not a significant interaction
coefficient for income.
Table 5 shows the magnitude of the height relationship implied by the regressions
with full controls for individuals in schools at the 25th, 50th, 75th, and 90th percentile
of school size. In a school at the 25th percentile in size, an added inch of height is
correlated with little to no improvements in academic or labor market outcomes. The
exception is in transcript GPA where height actually has a negative association with
performance in small schools. However, in a school at the 90th percentile of size, an
9

added inch of height is correlated with an increase in reported GPA of 0.015 points, an
insignificant increase in transcript GPA, an increase in the probability of graduating
by 0.006, and an increase in years of schooling by 0.05. Moreover, the relationships
for reported grades, graduating, and years of schooling remain significant at the 75th
percentile. The break down by gender highlights the fact that for most outcomes
tall males perform better than their shorter peers in large schools. Overall, height is
not an important predictor of outcomes for females.
Although average associations with height may be accounted for by background vari-
ables, significant associations between height and most academic outcomes remain
for male students in large schools. Moreover, the significant associations with height
occur in both the 75th and 90th percentile of school size seen in this sample. This
means that height has a strong relationship with outcomes for a large portion of the
student population.
4 Height and School Programs
Different hypotheses can account for the relationship between height and school size.
One implication of the Persico et al. (2004) results is that taller adolescents are more
likely to participate in human capital building opportunities. If taller individuals
are better able to take advantage of these opportunities, this would result in an
association between height and school performance. Moreover, this theory could
explain the above results if opportunities to participate in activities are not uniform
across height and if large schools have more competition for participation.
One activity where height is an asset and opportunities are more limited as school
10

size increases is participation in school sports. It has been established that height is
an advantage in most sports. A look at the height of athletes across various sports
shows that participants are on average taller than the population at large. There
are only a few sports where a relative short stature is an advantage: these include
gymnastics, diving, and figure skating (Norton and Olds, 1996) which are not typical
high school sports. If height is an advantage in playing sports, it follows that when
there is competition for a spot on a limited sized team, the taller athlete will be
more likely to earn the spot. Moreover, athletic participation is more limited in a
large school (Postlewaite and Silverman, 2005). The AddHealth data confirm that
students who attend large schools are less likely to participate in sports. As seen
in Table 1, while 63% of the AddHealth sample who attend a school at the bottom
quartile of school size play school sports, only 43% of individuals in a school at
the top quartile of size participate.9 Thus, in a small school, where team sizes are
large relative to the student body, more individuals can participate and height is
less likely to affect participation. However, in a large school where team sizes are
relatively small compared to the student body and many students are “cut” from
the team, taller students may be more likely to earn the limited roster spots.
The pattern of sports participation that theory predicts shows up in the AddHealth
data. As seen in Table 6, the relationship between height and school sports partic-
ipation follows a pattern similar to the relationship between height and academic
outcomes. The interaction between height and school size in column 3 of Table 6
is positive and significant for the population as a whole and for each gender sepa-
rately. While this association is not significant in all cases once controls and school
fixed effects are added, all the coefficients remain positive. The first column in Table
9The data is not detailed enough to differentiate between club and varsity sports or sportsoutside of school. The differences may be even larger if we only look at varsity school sports orstarting positions.
11
8 reports the different correlations between height and sports participation by the
quantile of school size. For a school at the 25th percentile of size, an extra inch of
height is associated with a 0.011 point increase in the probability of playing sports
while for schools at the 90th percentile of size, an extra inch of height is associated
with a 0.016 increase in the probability of sports participation for the whole popu-
lation. This gap grows larger when looking at the coefficients for males and females
separately.
Sports participation can in turn impact academic outcomes. There are several rea-
sons why athletic participation might improve schooling performance. First, school
sports can provide incentives to stay in school and meet a minimum GPA in order to
stay eligible to play sports. Sports participation can also develop human capital by
teaching leadership skills, hard work, following instructions, and cooperation. In ad-
dition, sports can affect student outcomes through peer effects, by bringing together
students who otherwise would not interact. Furthermore, the literature suggests
that sports participation leads to improved academic and labor market outcomes
(Rehberg and Schafar (1968); Long and Caudill (1991); Barron, Ewing, and Wad-
dell (2000); Videon (2002); Kuhn and Weinberger (2005); Postlewaite and Silverman
(2005); Stevenson (2010); and Gorry (2016)).10 These results support the sugges-
tion made in Perisco et al. (2004) that taller students have differential access to
opportunities in school. In particular, tall students may have different opportunities
to play sports, with sports participation being more limited in large schools. These
opportunities, in turn, may lead to the differential schooling outcomes we see across
height and school size.
Although height predicts participation in sports, it is not clear whether height pre-
10The data used in this paper also shows that sports participation is associated with improvedacademic and labor market outcomes.
12
dicts participation in other clubs or if the relationship varies by school size. The
performance argument for tall individuals participating in sports does not hold for
other clubs. Thus theory does not suggest that height should be an advantage in
these clubs, but if intelligence drives height relationships or if there is a preference
towards having tall members, we may see that being tall is important for getting
into other types of school clubs as well. The second section of Table 6 shows the
same regressions run for sports participation but now the dependent variable is par-
ticipation in other clubs outside of sports. These clubs include language or subject
clubs, music clubs such as band or choir, debate team, and others. The results show
that there is, in fact, no relation between height and participation in other clubs.
The 3rd and 4th column for these outcomes also show no differential relationship
between height and club participation across school size. Thus, differential access to
clubs outside of sports cannot explain the fact that tall students outperform their
peers in large schools.
5 Height and School Satisfaction
Beyond sports participation, a second mechanism that may drive the differential re-
lationship between height and outcomes across school size is attention from one’s
teachers and peers. As shown in Table 1, bigger schools have a larger student to
teacher ratio and students are less likely to report their best friends as coming from
their own school. These facts suggest that it may be more difficult to attract teach-
ers’ attention or make friends in a large school. If height helps attract attention from
teachers and peers, then it may be more important in large schools. Moreover, if
this treatment lends itself to more instruction or higher self esteem, it may result in
13

better schooling performance. This paper looks at three different measures of school
satisfaction to test whether tall students are more satisfied with their schooling expe-
rience and assesses whether this can account for the differential height relationships
across school size. The measures are whether students claim to feel a part of their
school, happy at school, or feel that their teachers care.
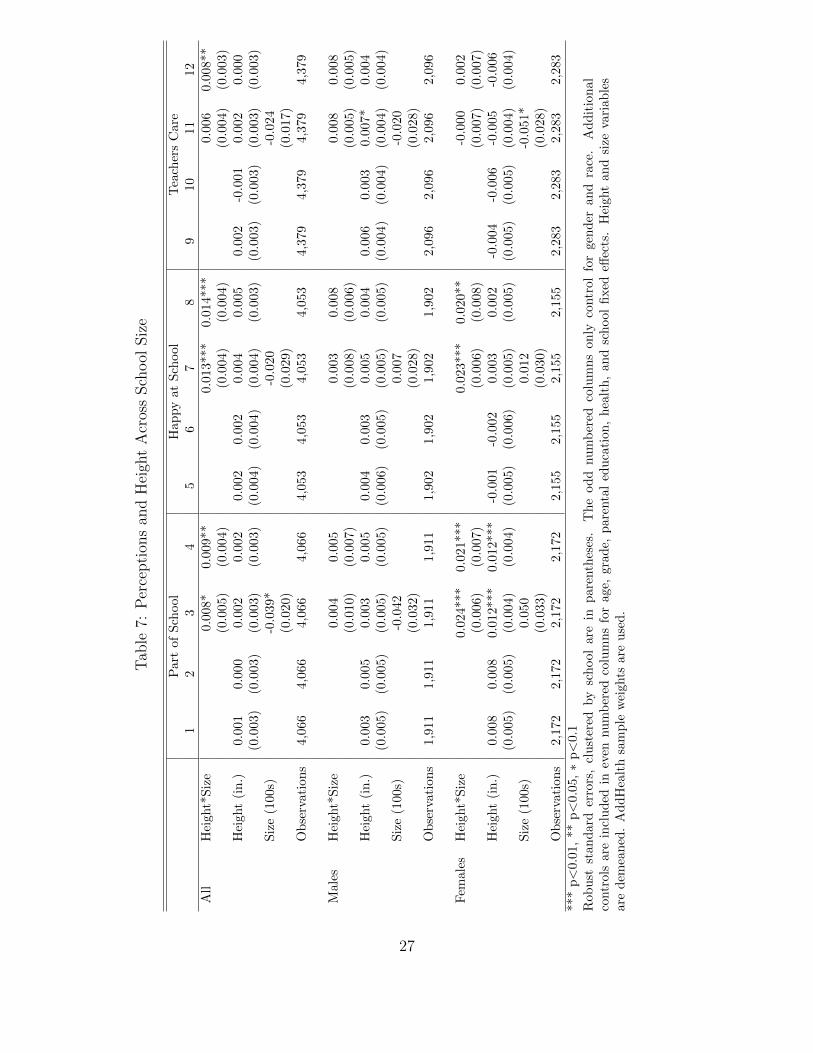
Table 7 shows the relation between height and these school perceptions. These
measures are not on average significantly related to height. However, the results
relevant to this paper show up in the last two columns for each outcome. Here the
data show that the association between height and perception measures is stronger
in large schools than small schools as the interactions with height and school size
are positive and significant. Table 8 shows that height does not have a significant
association with school perception measures for students in schools at the 25th or
50th percentile of size, but height has a positive and significant association on these
measures for students in schools at the 75th and 90th percentile of size. Similar
patterns are demonstrated when broken out by gender. The association with feeling
a part of school or happy at school is stronger for females at large schools and
the relationship between height and teachers caring is stronger for males at large
schools. Since the association between height and outcomes is stronger for males, if
these are the causal mechanisms that explain the height relationships, then it must
be that these measures are more important for predicting successful male outcomes
or that having teachers that care matters most for schooling outcomes. Overall,
the results support the argument that taller students may command more human
capital building resources in schools, particularly in large schools where there is more
competition for these resources.
14

6 Conclusion
A large literature is devoted to explaining differences in academic and labor market
outcomes and identifying the channels which propagate such disparities. There is
strong evidence that height is related to better academic, labor market, and health
outcomes. Yet the channels through which tall individuals excel are not fully under-
stood.
While there is convincing literature to suggest that height is a reflection of cogni-
tive differences, this paper provides new evidence that differential treatment across
stature may also contribute to the disparity in academic outcomes. In particular,
large school settings are relatively more advantageous for tall male students. This is
reflected through a height premium in several academic outcomes that only exists in
large schools. Furthermore, the evidence suggests that the disadvantage may develop
because the tall students are better able to acquire human capital building resources
in large school settings.
Schools are supposed to provide equality of opportunity to America’s youth and not
further enhance disparities across disadvantaged individuals. Understanding how
large schools enhance inequality across stature can guide school policy to level the
playing field across tall and short individuals. As schools continue to grow, it is
important to provide equal access to educational opportunities to all individuals or
the short students may be the ones that suffer.
15

References
Ai, Chunrong and Edward Norton, “Interaction terms in logit and probit mod-
els,” Economics Letters, 2003, 80, 123–129.
Barron, John M., Bradley T. Ewing, and Glen R. Waddell, “The Effects Of
High School Athletic Participation On Education And Labor Market Outcomes,”
The Review of Economics and Statistics, August 2000, 82 (3), 409–421.
Becker, Gary, “The Theory of the Allocation of Time,” Economics, May 2002, 45
(4), 415–444.
Berger, Abi, “Insulin-Like Growth Factor and Cognitive Function,” British Medical
Journal, January 2001, 322, 203.
Black, Sandra, Paul Devereux, and Kjell Salvones, “From the Cradle to
the Labor Market? The Effect of Birth Weight on Adult Outcomes.,” Quarterly
Journal of Economics, February 2007, 122, 409–39.
Brener, Nancy D., Tim Mcmanus, Deborah A. Galuska, Richard Lowry,
and Howell Wechsler, “Reliability and validity of self-reported height and weight
among high school students,” Journal of Adolescent Health, 2003, 32 (4), 281–287.
Case, Anne and Christina Paxson, “Height, Health, and Cognitive Function
at Older Ages,” American Economic Review: Papers and Proceedings, 2008, 98,
463–467.
and , “Stature and Status: Height, Ability, and Labor Market Outcomes,” The
Journal of Political Economy, 2008, 116 (3), 499–532.
and , “Causes and Consequences of Early-Life Health,” Demography, 2010, 47
- Supplement, S65–S85.
16

, , and Mahnaz Islam, “Making Sense of the Labor Market Height Premium:
Evidence from the British Household Panel Survey,” Economic Letters, 2009, 102,
174–176.
Cohen, Arianne, The Tall Book: A Celebration of Life from on High, Bloomsbury,
2009.
Coleman, James S., “Athletics in High School,” Annals of the American Academy
of Political and Social Science, November 1961, 338, 33–43.
Downie, A. Bruce, Jean Mulligan, Robert Stratford, Peter Betts, and
Linda Voss, “Are Short Normal Children at a Disadvantage? The Wessex Growth
Study,” British Medical Journal, January 1997, 314, 97–100.
Dunn, L.M. and L.M. Dunn, The Peabody Picture Vocabulary Test, Third Edi-
tion, American Guidance Services, 1997.
Gorry, Devon, “Heterogenous Effects of Sports Participation on Education and
Labor Market Outcomes,” Education Economics, 2016.
Haider, Steven and Gary Solon, “Life-Cycle Variation in the Association between
Current and Lifetime Earnings,” The American Economic Review, 2006, 96 (4),
1308–1320.
Harris, Kathleen Mullan, “The National Longitudinal Study of Adolescent Health
(AddHealth), Waves I&II, 1994-1996; Wave III, 2001-2002 [machine-readable data
file and documentation],” 2008. Chapel Hill, NC: Carolina Population Center,
University of North Carolina at Chapel Hill.
, Florwy Francesca, Joyce Tabor, Pater S. Bearman,
Jo Jones, and J Richard Udry, “The National Longitudinal Study
17

of Adolescent Health: Research Design [WWW document]. URL:
http://www.cpc.unc.edu/projects/addhealth/design,” 2003.
Heineck, Guido, “Too tall to be smart? The relationship between height and
cognitive abilities,” Economics Letters, 2009, 105 (1), 78–80.
Hubler, Olaf, “The nonlinear link between height and wages in Germany, 1985-
2004,” Economics and Human Biology, 2009, 7 (2), 191–199.
Kuhn, Peter and Catherine Weinberger, “Leadership Skills and Wages,” Jour-
nal of Labor Economics, 2005, 23 (3), 395–436.
Loh, Eng Seng, “The Economic Effects of Physical Appearance,” Social Science
Quarterly, October 1993, 74 (2).
Long, James E. and Steven B Caudill, “The Impact of Participation in Inter-
collegiate Athletics on Income and Graduation,” The Review of Economics and
Statistics, August 1991, 73 (3), 525–31.
Maloney, Michael T. and Robert E. McCormick, “An Examination of the
Role That Intercollegiate Athletic Participation Plays in Academic Achievement:
Athletes’ Feats in the Classroom,” The Journal of Human Resources, 1993, 28 (3),
555–570.
McCormick, Robert E. and Maurice Tinsley, “Athletics versus Academics?
Evidence from SAT Scores,” The Journal of Political Economy, October 1987, 95
(5), 1103–1116.
Norton, Edward, Hua Wang, and Chunrong Ai, “Computing interaction ef-
fects and standard errors in logit and probit models,” The Stata Journal, 2004, 4
(2), 154–167.
18

Norton, Kevin and Tim Olds, Anthropometrics: A Textbook of Body Measure-
ment for Sports and Health Outcomes, New South Wales University Press, 1996.
Persico, Nicola, Andrew Postlewaite, and Dan Silverman, “The Effect of
Adolescent Experience on Labor Market Outcomes: The Case of Height,” The
Journal of Political Economy, June 2004, 112 (5), 420–438.
Postlewaite, Andrew and Dan Silverman, “Social Isolation and Inequality,”
Journal of Economic Inequality, 2005, 3, 243–262.
Rehberg, Richard A. and Walter E. Schafer, “Participation in Interscholastic
Athletics and College Expectations,” The American Journal of Sociology, May
1968, 73 (6), 732–740.
Sargent, James and David Blanchflower, “Obesity and Stature in Adolescence
and Earnings in Young Adulthood: Analysis of a British Cohort,” Archives Pedi-
atric and Adolescent Medicine, July 1994, 148, 681–87.
Silventoinen, Karri, “Determinants of Variation in Adult Body Height,” J. Bioso-
cial Sci., April 2003, 35, 463–85.
Steckel, Richard, “Stature and Standard of Living,” Journal of Economic Litera-
ture, December 1995, 33 (4), 1903–40.
Stevenson, Betsey, “Beyond the Classroom: Using Title IX to Measure the Return
to High School Sports,” Review of Economics and Statistics, May 2010, 92 (2),
284–301.
U.S. Department of Education, National Center for Education Statis-
tics, The Condition of Education 2005 (NCES 2005-094), Washington D.C.: U.S.
Government Printing Office, 2005.
19

Videon, Tami M., “Who Plays and Who Benefits: Gender, Interscholastic Athlet-
ics, and Academic Outcomes,” Sociological Perspectives, May 2002, 45 (4), 415–
444.
20

Table 1: Resources Across School Size
Top Quartile of School Size Bottom Quartile of School Size
Student Teacher Ratio 23.51 13.66 ***
Sport Participation 0.43 0.63 ***
Club Participation 0.36 0.52 ***
Best Female Friend is From Own School 0.76 0.83 ***
Best Male Friend is From Own School 0.74 0.81 ***
Significant differences across school size are indicated. *** p<0.01, ** p<0.05, ∗ p<0.1.
21

Table 2: Summary Statistics
Big Schools Small SchoolsAbove Median Height Median Height and Below Above Median Height Median Height and Below
Height (in.) 69.72 65.37 69.70 65.23(3.42) (3.12) (3.25) (3.09)
Cohort Size 1,738 1,796 644 629(431) (468) (277) (284)
GPA1 2.87 2.77 2.82 2.77(0.74) (0.77) (0.74) (0.74)
GPA2 2.70 2.70 2.63 2.65(0.74) (0.76) (0.84) (0.76)
HS Diploma 0.92 0.86 0.88 0.87
Highest Grade 14.68 14.40 14.33 14.27(1.99) (1.95) (2.02) (2.04)
Welfare 0.14 0.21 0.25 0.24
HH Income 70,528 65,847 63,069 62,458(38,799) (39,064) (36,517) (36,335)
Female 0.50 0.49 0.52 0.53
Age (months) 177.9 179.2 178.9 179.2(10.79) (11.57) (11.46) (11.90)
Grade 9.94 9.96 9.95 9.94(0.80) (0.82) (0.82) (0.80)
Black 0.13 0.14 0.15 0.18
Asian 0.03 0.11 0.01 0.04
Native American 0.02 0.03 0.02 0.03
Hispanic 0.06 0.15 0.02 0.04
Parent High School 0.23 0.27 0.27 0.32
Parent Some College 0.23 0.21 0.23 0.21
Parent College 0.30 0.26 0.24 0.19
Parent Beyond College 0.16 0.13 0.12 0.10
General Health 1 2.04 2.10 2.10 2.12(0.89) (0.86) (0.88) (0.90)
General Health 2 2.03 2.06 2.09 2.12(0.89) (0.91) (0.87) (0.87)
School Sport 0.52 0.47 0.63 0.59
Other Club 0.41 0.44 0.50 0.48
Happy at School 0.57 0.54 0.59 0.59
Part of School 0.55 0.52 0.60 0.60
Teachers Care 0.47 0.46 0.47 0.48
Standard deviations in parentheses. Median height calculated by age and gender in sample. Big schools are definedas above the median cohort size while small schools are defined as at or below median cohort size. Add Healthsample weights are used.
22

Tab
le3:
Hei
ght
and
Sch
ool
ing
Outc
omes
Acr
oss
Sch
ool
Siz
e
GP
A1
GP
A2
Hig
hS
chool
Dip
lom
a1
23
45
67
89
10
11
12
All
Hei
ght*
Siz
e0.0
12**
0.0
11**
0.0
16***
0.0
15***
0.0
06**
0.0
05**
(0.0
06)
(0.0
06)
(0.0
06)
(0.0
05)
(0.0
03)
(0.0
03)
Hei
ght
(in
.)0.
013*
*0.
007
0.0
15**
0.0
09
0.0
03
-0.0
09
0.0
05
-0.0
06
0.0
04*
0.0
01
0.0
04**
0.0
02
(0.0
06)
(0.0
05)
(0.0
06)
(0.0
05)
(0.0
07)
(0.0
06)
(0.0
07)
(0.0
06)
(0.0
02)
(0.0
02)
(0.0
02)
(0.0
02)
Siz
e(1
00s)
-0.0
27
-0.0
07
-0.0
07
(0.0
33)
(0.0
38)
(0.0
15)
Ob
serv
atio
ns
4,37
74,3
77
4,3
77
4,3
77
2,9
94
2,9
94
2,9
942,9
94
4,0
76
4,0
76
4,0
76
4,0
76
Mal
esH
eigh
t*S
ize
0.0
23**
0.0
22**
0.0
27*
*0.0
27**
0.0
11**
0.0
09*
(0.0
11)
(0.0
10)
(0.0
13)
(0.0
10)
(0.0
05)
(0.0
05)
Hei
ght
(in
.)0.
018*
*0.
014*
0.0
20**
0.0
16**
-0.0
00
-0.0
09
0.0
03-0
.006
0.0
06*
0.0
04
0.0
07**
0.0
05
(0.0
08)
(0.0
07)
(0.0
08)
(0.0
07)
(0.0
10)
(0.0
09)
(0.0
09)
(0.0
08)
(0.0
03)
(0.0
03)
(0.0
03)
(0.0
03)
Siz
e(1
00s)
-0.0
74
-0.0
43
-0.0
30
(0.0
55)
(0.0
56)
(0.0
25)
Ob
serv
atio
ns
2,09
42,0
94
2,0
94
2,0
94
1,3
87
1,3
87
1,3
871,3
87
1,9
18
1,9
18
1,9
18
1,9
18
Fem
ales
Hei
ght*
Siz
e0.0
07
0.0
02
-0.0
01
-0.0
07
0.0
01
-0.0
02
(0.0
10)
(0.0
07)
(0.0
12)
(0.0
09)
(0.0
04)
(0.0
04)
Hei
ght
(in
.)0.
009
0.0
02
0.0
10
0.0
02
0.0
08
-0.0
03
0.0
07
-0.0
05
0.0
01
-0.0
02
0.0
01
-0.0
02
(0.0
07)
(0.0
06)
(0.0
07)
(0.0
06)
(0.0
08)
(0.0
07)
(0.0
07)
(0.0
06)
(0.0
03)
(0.0
03)
(0.0
03)
(0.0
02)
Siz
e(1
00s)
-0.0
27
0.0
780.0
10
(0.0
43)
0.0
080.0
01
Ob
serv
atio
ns
2,28
32,2
83
2,2
83
2,2
83
1,6
07
1,6
07
1,6
071,6
07
2,1
58
2,1
58
2,1
58
2,1
58
***
p<
0.01
,**
p<
0.05
,∗
p<
0.1
Rob
ust
stan
dar
der
rors
,cl
ust
ered
by
sch
ool
are
inp
are
nth
eses
.G
PA
1re
pre
sents
rep
ort
edG
PA
from
the
firs
tro
un
dof
surv
eys
an
dG
PA
2is
tran
scri
pt
GP
Aob
tain
edin
rou
nd
thre
e.T
he
od
dnu
mb
ered
colu
mn
son
lyco
ntr
ol
for
gen
der
an
dra
ce.
Ad
dit
ion
al
contr
ols
are
incl
ud
edin
even
nu
mb
ered
colu
mn
sfo
rag
e,gr
ade,
pare
nta
led
uca
tion
,h
ealt
h,
an
dsc
hool
fixed
effec
ts.
Hei
ght
an
dsi
zeva
riab
les
are
dem
ean
ed.
Ad
dH
ealt
hsa
mp
lew
eigh
tsar
eu
sed
.
23

Tab
le4:
Hei
ght
and
Lon
ger
Ter
mO
utc
omes
Acr
oss
Sch
ool
Siz
e
Hig
hG
rad
eC
om
ple
ted
Wel
fare
Hou
seh
old
Inco
me
12
34
56
78
910
11
12
All
Hei
ght*
Siz
e0.0
43**
0.0
35**
-0.0
07*
-0.0
07**
219.5
393.0
(0.0
21)
(0.0
14)
(0.0
04)
(0.0
03)
(333.4
)(2
92.8
)H
eigh
t(i
n.)
0.04
7**
0.020*
0.0
55***
0.0
26**
-0.0
02
0.0
01
-0.0
03
-0.0
00
-165.4
-397.1
-92.4
-328.8
(0.0
18)
(0.0
11)
(0.0
18)
(0.0
11)
(0.0
04)
(0.0
04)
(0.0
04)
(0.0
04)
(373.5
)(2
91.0
)(3
64.7
)(2
97.9
)S
ize
(100
s)0.1
42
-0.0
42*
4,3
43.9
*(0
.127)
(0.0
23)
(2,2
01.3
)O
bse
rvat
ion
s3,
626
3,6
26
3,6
26
3,6
26
3,6
21
3,6
21
3,6
21
3,6
21
3,2
66
3,2
66
3,2
66
3,2
66
Mal
esH
eigh
t*S
ize
0.0
71*
0.0
25
-0.0
13*
-0.0
10
877.6
574.1
(0.0
37)
(0.0
30)
(0.0
07)
(0.0
07)
(691.3
)(6
26.8
)H
eigh
t(i
n.)
0.05
7**
0.03
4**
0.0
71***
0.0
38**
-0.0
03
-0.0
03
-0.0
06
-0.0
04
-88.7
51.8
76.2
141.5
(0.0
24)
(0.0
16)
(0.0
23)
(0.0
17)
(0.0
05)
(0.0
05)
(0.0
05)
(0.0
05)
(479.7
)(3
98.1
)(4
63.0
)(4
18.3
)S
ize
(100
s)0.0
60
-0.0
13
1,8
84.5
(0.1
35)
(0.0
27)
(2,9
61.7
)O
bse
rvat
ion
s1,
655
1,6
55
1,6
55
1,6
55
1,6
53
1,6
53
1,6
53
1,6
53
1,4
96
1,4
96
1,4
96
1,4
96
Fem
ales
Hei
ght*
Siz
e0.0
13
0.0
15
-0.0
08
-0.0
10
-79.3
458.9
(0.0
41)
(0.0
26)
(0.0
08)
(0.0
06)
(763.9
)(4
56.4
)H
eigh
t(i
n.)
0.03
60.0
11
0.0
39
0.0
14
-0.0
01
0.0
01
-0.0
03
-0.0
01
-217.0
-530.8
-170.9
-437.4
(0.0
24)
(0.0
21)
(0.0
25)
(0.0
21)
(0.0
07)
(0.0
06)
(0.0
06)
(0.0
05)
(463.6
)(4
12.2
)(4
67.2
)(4
23.2
)S
ize
(100
s)0.0
12
(0.0
41)
4,4
06.1
0.0
32
1,9
68
(3,0
64.6
)O
bse
rvat
ion
s1,
971
1,9
71
1,9
71
1,9
71
1,9
68
1,9
68
1,9
68
1,9
68
1,7
70
1,7
70
1,7
70
1,7
70
***
p<
0.01
,**
p<
0.05
,∗
p<
0.1
Rob
ust
stan
dar
der
rors
,cl
ust
ered
by
sch
ool
are
inp
are
nth
eses
.T
he
od
dnu
mb
ered
colu
mn
son
lyco
ntr
ol
for
gen
der
an
dra
ce.
Ad
dit
ion
al
contr
ols
are
incl
ud
edin
even
nu
mb
ered
colu
mn
sfo
rage,
gra
de,
pare
nta
led
uca
tion
,h
ealt
h,
an
dsc
hool
fixed
effec
ts.
Hei
ght
an
dsi
zeva
riab
les
are
dem
ean
ed.
Ad
dH
ealt
hsa
mp
lew
eigh
tsare
use
d.
24

Table 5: Height Coefficients by School Size
School Size Quantile GPA1 GPA2 HS Diploma High Grade Welfare HH IncomeAll 25th 0.002 -0.015** -0.001 0.006 0.003 -495.057
(0.005) (0.006) (0.002) (0.012) (0.004) (297.492)
50th 0.007 -0.009 0.001 0.020* 0.001 -334.109(0.005) (0.006) (0.002) (0.011) (0.004) (278.050)
75th 0.018** 0.006 0.006* 0.056*** -0.006 78.293(0.008) (0.007) (0.003) (0.018) (0.005) (400.449)
90th 0.019** 0.008 0.007* 0.058*** -0.007 108.189(0.009) (0.008) (0.004) (0.019) (0.005) (415.485)
Males 25th 0.004 -0.021** 0.000 0.024 0.001 -99.309(0.007) (0.009) (0.004) (0.004) (0.006) (478.377)
50th 0.013* -0.010 0.004 0.034** -0.003 127.002(0.007) (0.008) (0.003) (0.003) (0.005) (411.919)
75th 0.035*** 0.017 0.013** 0.059* -0.013 706.888(0.013) (0.014) (0.006) (0.006) (0.009) (759.347)
90th 0.037*** 0.019 0.014** 0.061* -0.013 798.338(0.014) (0.014) (0.006) (0.006) (0.005) (798.338)
Females 25th 0.001 -0.001 -0.002 0.005 0.005 -644.868(0.007) (0.008) (0.003) (0.024) (0.007) (408.448)
50th 0.002 -0.004 -0.002 0.011 0.001 -475.434(0.006) (0.006) (0.002) (0.021) (0.005) (384.671)
75th 0.003 -0.011 -0.004 0.026 -0.009 -41.285(0.008) (0.010) (0.005) (0.033) (0.007) (615.904)
90th 0.004 -0.011 -0.004 0.027 -0.010 -9.813(0.009) (0.010) (0.005) (0.034) (0.007) (641.678)
*** p<0.01, ** p<0.05, ∗ p<0.1Robust standard errors, clustered by school are in parentheses. Each number represents themarginal correlation of height calculated from the 4th column of each outcome in Tables 3 and 4at the given quantile of school size. The quantile sizes are computed using the sample data.
25
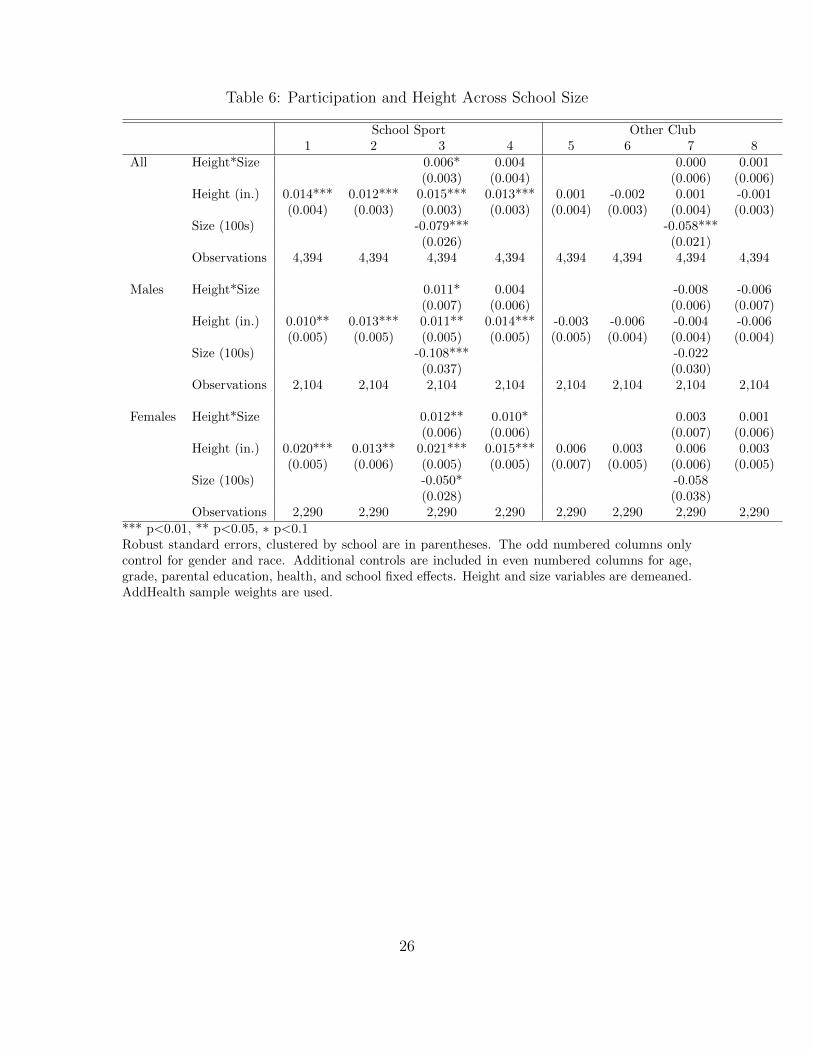
Table 6: Participation and Height Across School Size
School Sport Other Club1 2 3 4 5 6 7 8
All Height*Size 0.006* 0.004 0.000 0.001(0.003) (0.004) (0.006) (0.006)
Height (in.) 0.014*** 0.012*** 0.015*** 0.013*** 0.001 -0.002 0.001 -0.001(0.004) (0.003) (0.003) (0.003) (0.004) (0.003) (0.004) (0.003)
Size (100s) -0.079*** -0.058***(0.026) (0.021)
Observations 4,394 4,394 4,394 4,394 4,394 4,394 4,394 4,394
Males Height*Size 0.011* 0.004 -0.008 -0.006(0.007) (0.006) (0.006) (0.007)
Height (in.) 0.010** 0.013*** 0.011** 0.014*** -0.003 -0.006 -0.004 -0.006(0.005) (0.005) (0.005) (0.005) (0.005) (0.004) (0.004) (0.004)
Size (100s) -0.108*** -0.022(0.037) (0.030)
Observations 2,104 2,104 2,104 2,104 2,104 2,104 2,104 2,104
Females Height*Size 0.012** 0.010* 0.003 0.001(0.006) (0.006) (0.007) (0.006)
Height (in.) 0.020*** 0.013** 0.021*** 0.015*** 0.006 0.003 0.006 0.003(0.005) (0.006) (0.005) (0.005) (0.007) (0.005) (0.006) (0.005)
Size (100s) -0.050* -0.058(0.028) (0.038)
Observations 2,290 2,290 2,290 2,290 2,290 2,290 2,290 2,290
*** p<0.01, ** p<0.05, ∗ p<0.1Robust standard errors, clustered by school are in parentheses. The odd numbered columns onlycontrol for gender and race. Additional controls are included in even numbered columns for age,grade, parental education, health, and school fixed effects. Height and size variables are demeaned.AddHealth sample weights are used.
26
Tab
le7:
Per
cepti
ons
and
Hei
ght
Acr
oss
Sch
ool
Siz
e
Part
of
Sch
ool
Hap
py
at
Sch
ool
Tea
cher
sC
are
12
34
56
78
910
11
12
All
Hei
ght*
Siz
e0.0
08*
0.0
09**
0.0
13***
0.0
14***
0.0
06
0.0
08**
(0.0
05)
(0.0
04)
(0.0
04)
(0.0
04)
(0.0
04)
(0.0
03)
Hei
ght
(in
.)0.
001
0.000
0.0
02
0.0
02
0.0
02
0.0
02
0.0
04
0.0
05
0.0
02
-0.0
01
0.0
02
0.0
00
(0.0
03)
(0.0
03)
(0.0
03)
(0.0
03)
(0.0
04)
(0.0
04)
(0.0
04)
(0.0
03)
(0.0
03)
(0.0
03)
(0.0
03)
(0.0
03)
Siz
e(1
00s)
-0.0
39*
-0.0
20
-0.0
24
(0.0
20)
(0.0
29)
(0.0
17)
Ob
serv
atio
ns
4,06
64,
066
4,0
66
4,0
66
4,0
53
4,0
53
4,0
53
4,0
53
4,3
79
4,3
79
4,3
79
4,3
79
Mal
esH
eigh
t*S
ize
0.0
04
0.0
05
0.0
03
0.0
08
0.0
08
0.0
08
(0.0
10)
(0.0
07)
(0.0
08)
(0.0
06)
(0.0
05)
(0.0
05)
Hei
ght
(in
.)0.
003
0.005
0.0
03
0.0
05
0.0
04
0.0
03
0.0
05
0.0
04
0.0
06
0.0
03
0.0
07*
0.0
04
(0.0
05)
(0.0
05)
(0.0
05)
(0.0
05)
(0.0
06)
(0.0
05)
(0.0
05)
(0.0
05)
(0.0
04)
(0.0
04)
(0.0
04)
(0.0
04)
Siz
e(1
00s)
-0.0
42
0.0
07
-0.0
20
(0.0
32)
(0.0
28)
(0.0
28)
Ob
serv
atio
ns
1,91
11,
911
1,9
11
1,9
11
1,9
02
1,9
02
1,9
02
1,9
02
2,0
96
2,0
96
2,0
96
2,0
96
Fem
ales
Hei
ght*
Siz
e0.0
24***
0.0
21***
0.0
23***
0.0
20**
-0.0
00
0.0
02
(0.0
06)
(0.0
07)
(0.0
06)
(0.0
08)
(0.0
07)
(0.0
07)
Hei
ght
(in
.)0.
008
0.008
0.0
12***
0.0
12***
-0.0
01
-0.0
02
0.0
03
0.0
02
-0.0
04
-0.0
06
-0.0
05
-0.0
06
(0.0
05)
(0.0
05)
(0.0
04)
(0.0
04)
(0.0
05)
(0.0
06)
(0.0
05)
(0.0
05)
(0.0
05)
(0.0
05)
(0.0
04)
(0.0
04)
Siz
e(1
00s)
0.0
50
0.0
12
-0.0
51*
(0.0
33)
(0.0
30)
(0.0
28)
Ob
serv
atio
ns
2,17
22,
172
2,1
72
2,1
72
2,1
55
2,1
55
2,1
55
2,1
55
2,2
83
2,2
83
2,2
83
2,2
83
***
p<
0.01
,**
p<
0.05
,∗
p<
0.1
Rob
ust
stan
dar
der
rors
,cl
ust
ered
by
sch
ool
are
inp
are
nth
eses
.T
he
od
dnu
mb
ered
colu
mn
son
lyco
ntr
ol
for
gen
der
an
dra
ce.
Ad
dit
ion
al
contr
ols
are
incl
ud
edin
even
nu
mb
ered
colu
mn
sfo
rage,
gra
de,
pare
nta
led
uca
tion
,h
ealt
h,
an
dsc
hool
fixed
effec
ts.
Hei
ght
an
dsi
zeva
riab
les
are
dem
ean
ed.
Ad
dH
ealt
hsa
mp
lew
eigh
tsare
use
d.
27
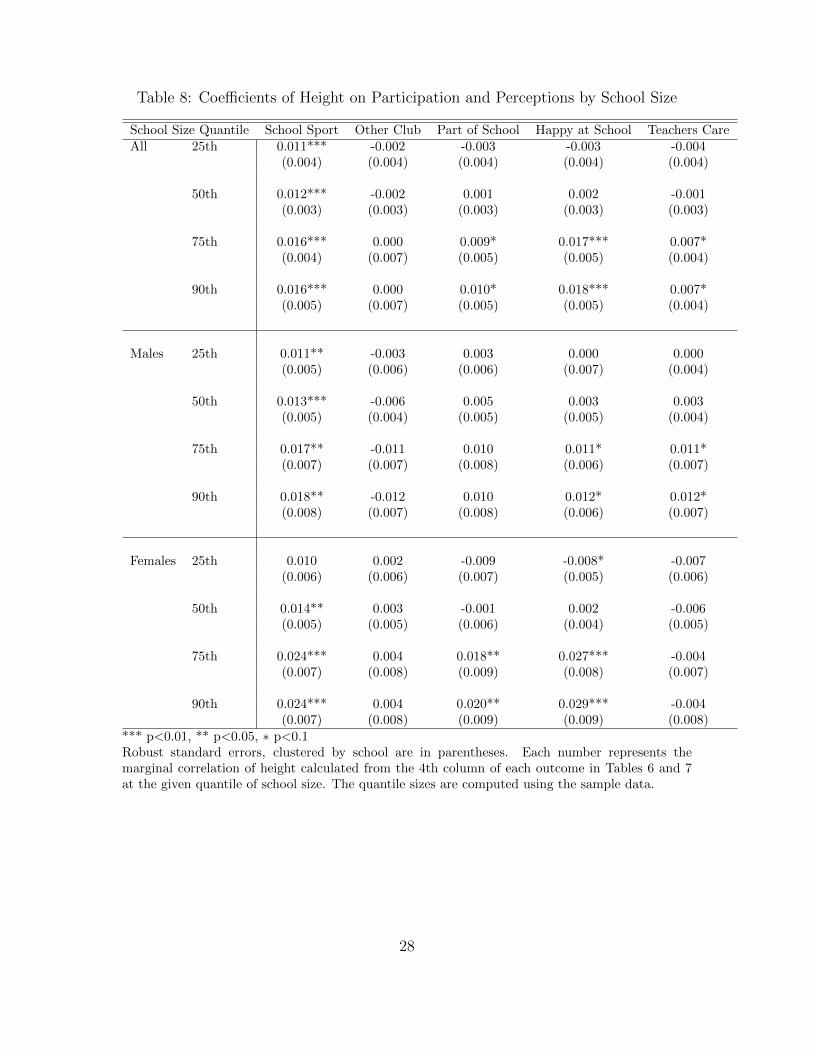
Table 8: Coefficients of Height on Participation and Perceptions by School Size
School Size Quantile School Sport Other Club Part of School Happy at School Teachers CareAll 25th 0.011*** -0.002 -0.003 -0.003 -0.004
(0.004) (0.004) (0.004) (0.004) (0.004)
50th 0.012*** -0.002 0.001 0.002 -0.001(0.003) (0.003) (0.003) (0.003) (0.003)
75th 0.016*** 0.000 0.009* 0.017*** 0.007*(0.004) (0.007) (0.005) (0.005) (0.004)
90th 0.016*** 0.000 0.010* 0.018*** 0.007*(0.005) (0.007) (0.005) (0.005) (0.004)
Males 25th 0.011** -0.003 0.003 0.000 0.000(0.005) (0.006) (0.006) (0.007) (0.004)
50th 0.013*** -0.006 0.005 0.003 0.003(0.005) (0.004) (0.005) (0.005) (0.004)
75th 0.017** -0.011 0.010 0.011* 0.011*(0.007) (0.007) (0.008) (0.006) (0.007)
90th 0.018** -0.012 0.010 0.012* 0.012*(0.008) (0.007) (0.008) (0.006) (0.007)
Females 25th 0.010 0.002 -0.009 -0.008* -0.007(0.006) (0.006) (0.007) (0.005) (0.006)
50th 0.014** 0.003 -0.001 0.002 -0.006(0.005) (0.005) (0.006) (0.004) (0.005)
75th 0.024*** 0.004 0.018** 0.027*** -0.004(0.007) (0.008) (0.009) (0.008) (0.007)
90th 0.024*** 0.004 0.020** 0.029*** -0.004(0.007) (0.008) (0.009) (0.009) (0.008)
*** p<0.01, ** p<0.05, ∗ p<0.1Robust standard errors, clustered by school are in parentheses. Each number represents themarginal correlation of height calculated from the 4th column of each outcome in Tables 6 and 7at the given quantile of school size. The quantile sizes are computed using the sample data.
28