Student School Engagement Among Sexual Minority Students: Understanding the Contributors to...
37
Running Head: SCHOOL ENGAGEMENT AMONG SEXUAL MINORITY STUDENTS 1 Student School Engagement among Sexual Minority Students: Understanding the Contributors to Predicting Academic Outcomes Kristie L. Seelman, N. Eugene Walls, and Cynthia Hazel University of Denver Hope Wisneski The Gay, Lesbian, Bisexual, and Transgender Community Center of Colorado [THIS IS THE POST-PRINT VERSION OF THIS MANUSCRIPT. THE FINAL PUBLISHED VERSION IS AVAILABLE FROM THE JOURNAL OF SOCIAL SERVICE RESEARCH: http://www.tandfonline.com/doi/abs/10.1080/01488376.2011.583829 ] Author Note Kristie L. Seelman and N. Eugene Walls, Graduate School of Social Work, University of Denver; Cynthia Hazel, Morgridge College of Education, University of Denver; Hope Wisneski, The Gay, Lesbian, Bisexual and Transgender Community Center of Colorado, Denver, Colorado. Correspondence concerning this article should be addressed to Kristie L. Seelman,
Transcript of Student School Engagement Among Sexual Minority Students: Understanding the Contributors to...
Running Head: SCHOOL ENGAGEMENT AMONG SEXUAL MINORITY STUDENTS 1
Student School Engagement among Sexual Minority Students:
Understanding the Contributors to Predicting Academic Outcomes
Kristie L. Seelman, N. Eugene Walls, and Cynthia Hazel
University of Denver
Hope Wisneski
The Gay, Lesbian, Bisexual, and Transgender Community Center of Colorado
[THIS IS THE POST-PRINT VERSION OF THIS MANUSCRIPT. THE FINAL PUBLISHED
VERSION IS AVAILABLE FROM THE JOURNAL OF SOCIAL SERVICE RESEARCH:
http://www.tandfonline.com/doi/abs/10.1080/01488376.2011.583829]
Author Note
Kristie L. Seelman and N. Eugene Walls, Graduate School of Social Work, University of
Denver; Cynthia Hazel, Morgridge College of Education, University of Denver; Hope Wisneski,
The Gay, Lesbian, Bisexual and Transgender Community Center of Colorado, Denver, Colorado.
Correspondence concerning this article should be addressed to Kristie L. Seelman,

Running Head: SCHOOL ENGAGEMENT AMONG SEXUAL MINORITY STUDENTS 2
Graduate School of Social Work, University of Denver, 2148 S. High St., Denver, Colorado,
80208. E-mail: [email protected]

Running Head: SCHOOL ENGAGEMENT AMONG SEXUAL MINORITY STUDENTS 3
Abstract
Hierarchical multiple regression is used to examine whether student school engagement predicts
GPA and fear-based truancy among 315 sexual minority youth ages 13 to 24. Results indicate
that student school engagement is a significant predictor of GPA, and this relationship is
strongest in the presence of a gay-straight alliance. Having an adult ally at school is associated
with a decrease in fear-based truancy, while student school engagement predicts a decrease in
fear-based truancy only for youth who have higher levels of subjective fear at school.
Implications for future research and for practice among school-based helping professionals are
discussed.
Keywords: academic achievement, student school engagement, gay, lesbian, bisexual,
sexual minority, gay-straight alliance, truancy
Running Head: SCHOOL ENGAGEMENT AMONG SEXUAL MINORITY STUDENTS 4
Among general populations of youth, student school engagement has been associated
with positive academic outcomes, such as higher grades, completion of high school, and
improved test scores (Fredricks, Blumenfeld, & Paris, 2004). Theories of student school
engagement are frequently used to encourage student investment at school and develop
interventions with youth to prevent dropping out (Furlong & Christenson, 2008). However, little
research has been done to examine whether student school engagement is a useful construct in
understanding and predicting the academic success of sexual minority youth,1 who often face
hostile school environments and stigma that make it difficult to achieve academic success
(Pearson, Muller, & Wilkinson, 2007). This study helps to fill this gap in the research by
examining whether student school engagement predicts two academic outcomes (GPA and fear-
based truancy) among a sample of sexual minority youth while controlling for specific school-
level characteristics (e.g., presence of a gay-straight alliance). Before moving into a discussion of
the current study, this paper will first review the literature on sexual minority youth in school
settings and definitions and theories of student school engagement.
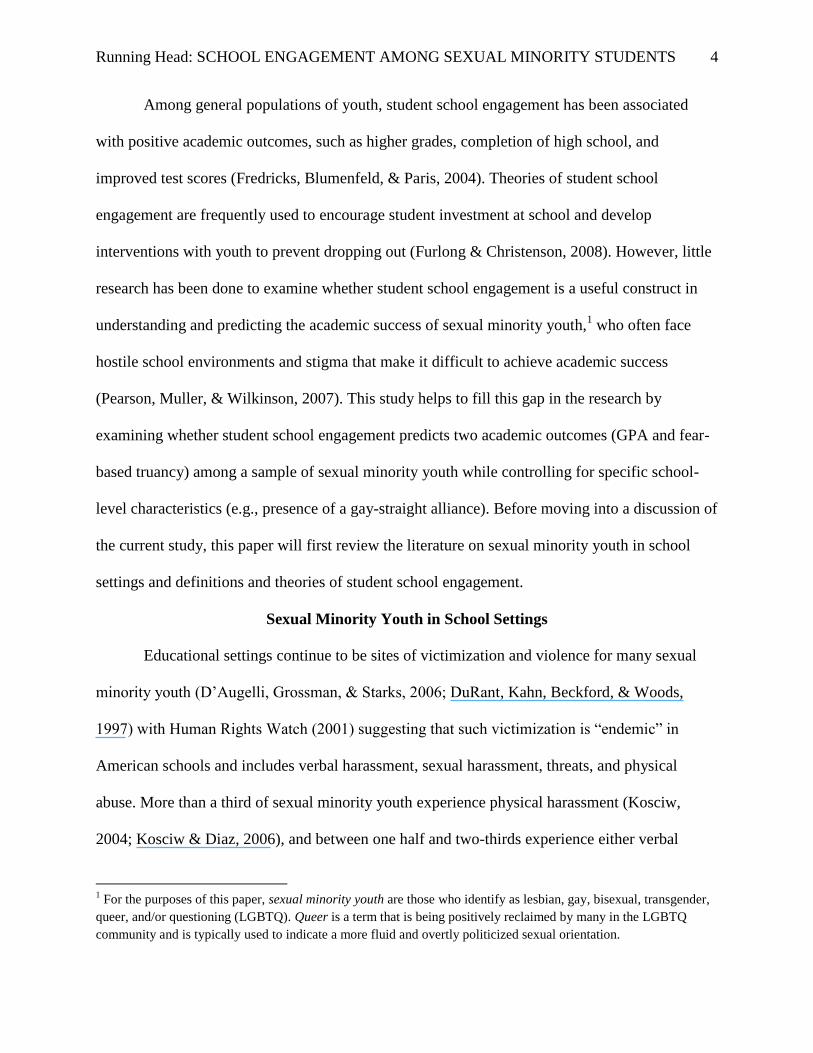
Sexual Minority Youth in School Settings
Educational settings continue to be sites of victimization and violence for many sexual
minority youth (D’Augelli, Grossman, & Starks, 2006; DuRant, Kahn, Beckford, & Woods,
1997) with Human Rights Watch (2001) suggesting that such victimization is “endemic” in
American schools and includes verbal harassment, sexual harassment, threats, and physical
abuse. More than a third of sexual minority youth experience physical harassment (Kosciw,
2004; Kosciw & Diaz, 2006), and between one half and two-thirds experience either verbal
1 For the purposes of this paper, sexual minority youth are those who identify as lesbian, gay, bisexual, transgender,
queer, and/or questioning (LGBTQ). Queer is a term that is being positively reclaimed by many in the LGBTQ
community and is typically used to indicate a more fluid and overtly politicized sexual orientation.

Running Head: SCHOOL ENGAGEMENT AMONG SEXUAL MINORITY STUDENTS 5
harassment, physical harassment, or both because of their actual or perceived sexual orientation
or gender identity (Hetrick-Martin Institute, n.d.; Kosciw & Diaz, 2006; Walls, Hancock, &
Wisneski, 2007; Walls, Kane, & Wisneski, 2010). The risks for victimization increase even
further for certain groups of sexual minority youth, including those who experience
homelessness (Millburn, Ayala, Batterham, & Rotherham-Borus, 2006; Walls et al., 2007), those
who are more open about their sexual orientation (Kiedman, 2002), and those who are gender
non-conforming (D’Augelli et al., 2006; Plöderl & Fartacek, 2007).
Sexual minority youth frequently feel powerless in figuring out how to respond and
confront harassment at school (Craig, Tucker, & Wagner, 2008), with the majority of those
harassed or assaulted at school failing to report it to school staff, their parents, or other family
members (Kosciw & Diaz, 2006). Even when schools are aware of anti-gay victimization and
bullying, it is frequently met with inaction on the part of education system employees and school
officials (National Education Association Task Force on Sexual Orientation, 2002).
Experiences of victimization can impact academic achievement in a number of negative
ways. One potential outcome is higher rates of fear-based truancy for sexual minority youth.
Avoiding school because of fear of victimization appears to be common among sexual minority
youth, with between 20% to 25% of youth skipping school at least once in the previous month
because they feel unsafe at school (Walls et al., 2007, 2010). Given the linkage between repeated
truancy and poor school performance (Chang, Chen, & Brownson, 2003), this protective coping
behavior comes at the possible cost of lower academic achievement.
A second potential outcome of experiencing a context hostile to one’s sexual identity is
the increased likelihood of bringing weapons to school as a way to protect oneself. Male sexual
minority youth are more likely to carry a weapon and fight at school than are female sexual
Running Head: SCHOOL ENGAGEMENT AMONG SEXUAL MINORITY STUDENTS 6
minority youth (DuRant et al., 1997), with much of the behavior appearing to be defensive rather
than offensive (Webster, Gainer, & Champion, 1993). Given that male sexual minority youth
report higher rates of victimization and assault at school than do female sexual minority youth,
this gendered pattern is not surprising (D'Augelli, Pilkington, & Hershberger, 2002).
Experiences of victimization are also correlated with numerous mental health issues,
including increased symptoms of post-traumatic stress disorder, depression, anxiety, social
phobias, and suicidality (D’Augelli et al., 2006; D’Augelli et al., 2002; Hershberger, Pilkington,
& D’Augelli, 1997; Menesini, Modena, & Tani, 2009; Walls, Freedenthal, & Wisneski, 2008).
Likewise, a correlation exists between being bullied and increased drug and alcohol use (Tharp-
Taylor, Haviland, & D’Amico, 2009). Mental health issues and psychological distress represent
another barrier to strong academic achievement (Fernández-Castillo & Gutiérrez-Rojas, 2009;
Hamilton, Newman, Delville, & Delville, 2008; Rothon, et al., 2009).
Although there is scant research on the academic achievement of sexual minority youth,
what does exist suggests that the educational outcomes are, indeed, negatively influenced by
these common school experiences. Sexual minority youth appear to perform poorer in schools—
whether measured by grade point average or likelihood of taking advanced coursework—than
their heterosexual counterparts (Pearson, Muller, & Wilkinson, 2007). This difference appears to
be even greater for boys than for girls. Substance use, emotional distress, lower school
attachment and school engagement, and more negative attitudes toward school, however, appear
to be greater risks for sexual minority girls than sexual minority boys. Overall, the pattern that
emerges from the Pearson et al. study suggests that sexual minority youth are more difficult to
engage in school and tend to have lower educational aspirations. Their findings led Pearson et al.
Running Head: SCHOOL ENGAGEMENT AMONG SEXUAL MINORITY STUDENTS 7
to argue that sexual minority youth face risks of low school engagement similar to that found
among youth of color and low-income youth.
In addition to having poorer academic performance, sexual minority youth are also more
likely to drop out of school than are heterosexual youth (Remafedi, 1987; U.S. Department of
Health & Human Services, as cited in Brookins-Fisher, 1995), although the presence of a gay-
straight alliance (GSA) in the school and participation in a GSA are both associated with
decreased likelihood of dropping out for sexual minority youth (Walls et al., 2010). Given these
patterns of risks, Pearson and colleagues (2007) argue that:
Same-sex attracted youth are indeed suffering in schools in ways that can impact their
opportunity for future success. Experiencing sexual stigma can lead to emotional distress
and risk-taking and can prevent adolescents from feeling like they belong in their schools,
ultimately impacting their academic performance. (p. 536)
An important point to emphasize is that schools are not helpless in improving outcomes for
sexual minority youth; rather, school personnel have the ability to decrease the negative
outcomes for sexual minority youth through improving school climate and reducing homophobic
victimization (Birkett, Espelage, & Koenig, 2009).
Given the context of victimization that many sexual minority youth experience in
educational settings, the protective and supportive relationship of strong student school
engagement with positive academic achievements may be attenuated or non-existent. While
student school engagement has been shown to be a protective factor and a strong predictor of
positive academic outcomes for general community samples of youth (Fredricks et al., 2004),
little is known about how student school engagement functions for sexual minority youth.
Likewise, student school engagement may function differently for different subpopulations of
Running Head: SCHOOL ENGAGEMENT AMONG SEXUAL MINORITY STUDENTS 8
sexual minority youth or interact with other protective factors. Before discussing the study at
hand, this paper will provide a brief review of the literature on student school engagement.
Definitions and Theories of Student School Engagement
Student school engagement has been discussed under many terms, including school
connectedness, affiliation, membership, bonding, and belonging (Jimerson, Campos, & Greif,
2003; Osterman, 2000). The most commonly used terms are student engagement (see for
example Appleton, Christenson, & Furlong, 2008; Appleton, Christenson, Kim, & Reschly,
2006; Christenson et al., 2008) and school engagement (see for example Fredricks, Blumenfeld,
Friedel, & Paris, 2005; Fredricks, et al., 2004; O’Farrell, Morrison, & Furlong, 2006). As might
be expected given the terminology differences, student school engagement does not have an
agreed upon definition (Appleton et al., 2008; Jimerson et al., 2003). There is growing
consensus, however, that student school “engagement is a multi-dimensional construct … [that]
is highly influenced by specific facilitators such as family and school expectations” (Christenson,
n.d., para. 1) and represents “the fusion of behavior, emotion, and cognition under the idea of
engagement” (Fredricks et al., 2004, p. 61). While engagement has sometimes been defined as
the opposite of disengagement (Willms, 2003), other scholars (Jimerson et al., 2003) have argued
that engagement is an active pro-education trait and much more than a lack of disengagement.
This study utilizes the conceptualization of student school engagement offered by Hazel,
Jack, Wonner, and Albanes (2009). They suggest that “student school engagement is a multi-
dimensional meta-construct representing a student’s internally and externally mediated affiliation
with and investment in schooling. Student school engagement is a biopsychosocial phenomena,
occurring in and responding to environmental contexts within a developmental trajectory” (para.
2). Further, the underlying assumptions regarding student school engagement are that (a) the
Running Head: SCHOOL ENGAGEMENT AMONG SEXUAL MINORITY STUDENTS 9
level of engagement is fluid (and therefore can be changed and increased), and (b) higher levels
of engagement typically result in improved academic performance and increased rates of high
school completion (Hazel et al., 2009).
Since the definition of student school engagement is not agreed upon, there are multiple
measurement challenges, not the least of which is the differentiation between a student’s
engagement and the variables in the environment that help or hinder a student’s performance
(Furlong & Christenson, 2008). Previous theories of engagement have been partitioned into
differing psychological constructs (i.e., behavioral engagement, cognitive engagement,
emotional engagement), leading to both measurement and practice problems. For instance, from
the measurement perspective, does participating in an extracurricular chess club indicate
behavioral, emotional, or cognitive engagement? Further, if a student is lacking in emotional
engagement, how does one intervene with that student? In response to these research and clinical
issues and based upon a comprehensive literature review of student school engagement, Hazel et
al. (2010) have proposed a three factor model of student school engagement in which more than
one aspect of psychological functioning is represented in each factor.
The Student School Engagement model posits three interrelated domains of engagement:
aspirations, belonging, and productivity (Hazel et al., 2010). Aspirations are a student’s appraisal
of the worthiness of an education, its utility to his or her future, and, therefore, his or her
investment in academic achievement. Belonging is a student’s sense that he or she is a member
of the school community and commitment to the school’s norms. Productivity encompasses a
student’s academically-oriented behaviors and cognitive strategies designed to monitor and
maximize learning. The Student School Engagement Measure (SSEM) was developed to
Running Head: SCHOOL ENGAGEMENT AMONG SEXUAL MINORITY STUDENTS 10
measure students’ perceptions of their engagement in the domains of Aspirations, Belonging, and
Productivity (Hazel et al., 2010).
Research Question
Utilizing the Student School Engagement model, this study seeks to explore the
relationship between levels of student school engagement and academic outcomes for sexual
minority youth. Specifically, this study asks: Is student school engagement able to predict
academic outcomes (GPA and fear-based truancy) for sexual minority youth, after controlling for
demographic and school-related variables?
Method
Sample Recruitment and Characteristics
Participants in this study were recruited from two primary sources: (a) youth receiving
services or attending social events at either the primary LGBT organization leading the data
collection or one of three other sexual minority youth-serving programs in the Rocky Mountain
region, and (b) youth who elected to click a web link that was prominently displayed on the
youth services section of an LGBT organization’s webpage inviting sexual minority youth and
young adults to participate in the study.
As part of its programmatic evaluation and needs assessment activities, the organization
that collects the data conducts an annual survey of the youth participating in its programs. Data
used in this study were collected in the 2007-2008 annual survey, which was administered in an
online format. Staff and volunteers at the lead organization and the youth-serving partner
agencies directly requested that youth receiving services or attending social events sponsored by
the programs take part in the survey, explaining that participation was voluntary and that
decisions not to participate would not influence the youth’s relationship with the program. Youth

Running Head: SCHOOL ENGAGEMENT AMONG SEXUAL MINORITY STUDENTS 11
who participated in the survey were able to enter themselves into a lottery for various gift
certificates. Of the sample used for this study, 44.65% had received services at one of the four
organizations, and the remaining 55.35% had not. While these youth reported not having
received services, it is possible that some of them may have attended social events organized by
one of the four agencies.
The online survey took approximately 20 minutes to complete and consisted of twelve
primary topics (e.g., demographics, school experiences, violence and safety), with each topic
consisting of a number of questions and skip patterns based on screening questions. Measures
used in the survey were modeled after questions from the National Youth Risk Behavior
Surveillance survey (Centers for Disease Control and Prevention, 2004), the GLSEN 2003
National Climate Survey (Kosciw, 2004), and other sources from the existing literature. Data
were collected anonymously and all respondents had to electronically sign a consent form prior
to completing the survey. University IRB approval was sought and obtained for secondary
analyses of the dataset, since the data were originally collected for evaluation and planning
purposes by the lead LGBT organization. Only responses from certain questions on the survey
were utilized in this analysis.
Measures
Demographic variables. The demographic variables included in the models are race (a
White/non-White dummy variable), free or reduced-price school lunch qualification (a yes/no
dummy variable used as a proxy for socioeconomic status), age (in years), sexual orientation
(lesbian, gay, bisexual, queer, or questioning, with gay as the reference group), and gender
identity (male, female, or transgender/other, with male as the reference group). In terms of the
race variable, this sample had a sizeable number of students who identified as Latino/a and youth
Running Head: SCHOOL ENGAGEMENT AMONG SEXUAL MINORITY STUDENTS 12
who identified as Bi-/Multiracial; however, there were not significant results when partitioning
youth by these identities in the final models. For the sake of parsimony, a White/non-White
dummy variable was used as an indicator of race. In regards to sexual orientation, youth could
select whether they were gay, lesbian, bisexual, heterosexual, unsure/questioning, or other; those
who selected “other” could include further information about how they self-identify. The largest
number of youth who chose “other” as their sexual orientation self-identified as queer, so this
term is used to designate this group in the statistical models.
Independent variables. Information was collected about three school-related variables:
presence of a safe adult at school (a dichotomous variable indicating whether in the past year
there was a teacher, counselor, social worker, or other adult at school that the youth felt safe to
talk to about their sexual orientation and/or gender identity); presence of a GSA at their current
or most recent school or college (a yes/no dichotomous variable); and feeling unsafe or afraid at
school in the past year (an interval-level variable with a scale ranging from 1 = Never to 5 = All
of the time).
The independent variable of primary interest in this study was student school
engagement. The nine items used to capture student school engagement were based on the SSEM
(Hazel et al., 2010), with the three domains of aspirations, belonging, and productivity. In
psychometric testing using a sample of over 350 secondary students, the instrument, comprised
of 22 items, each on a 10 point scale, was found to be reliable (Cronbach’s alphas ranged from
.89 to .93 for each domain) and model structure validated (Hazel et al., 2010). For this survey,
three items from each domain were included. Two sample items were: “The things I am learning
in school are going to be important to me in my life,” (aspirations) and “I feel like I belong at my
school” (belonging). Questions were slightly reworded for youth who were no longer in school
Running Head: SCHOOL ENGAGEMENT AMONG SEXUAL MINORITY STUDENTS 13
(e.g. “I felt like I belonged in my school”). Youth responded to each item on a scale ranging
from 1 = Strongly Agree to 4 = Strongly Disagree. The nine items were summed (with negatively
worded items being reverse-coded) to derive a composite student school engagement score for
each participant; eight was subtracted from each score so that the lowest possible score would be
1.0 for ease of interpretation.
Dependent variables. GPA was calculated by taking the youth’s reported letter grades
for the previous or most recent school year and rescoring these items as a numeric GPA (Mostly
F’s = 0.2, Mostly D’s = 0.8, Mostly C’s = 1.8, Mostly B’s = 2.8, Mostly A’s = 3.8, Straight A’s =
4.0).
Fear-based truancy was measured by the number of days the youth reported missing
school due to feeling unsafe during their most recent month of school. Possible answers ranged
from 0 days to 6 or more days; these answers were rescored to reflect the midpoint of each
answer range (e.g. 2 or 3 days = 2.5).
Analyses
Hierarchical multiple regression was used to test the study’s hypothesis with two models,
the first for predicting GPA and the second for predicting fear-based truancy. All analyses were
performed using SPSS version 16.0.
The full sample included 346 sexual minority youth between the ages of 13 and 24. Four
records were dropped as multivariate outliers on the school engagement scale. None of the
variables had more than 9.3% of data missing, and analyses of patterns of missing data indicated
that all of the independent variables were either missing completely at random or missing at
random. Eighteen records were dropped because they had too much missing data to complete
multiple imputation, and an additional 6 records were dropped because of missing data on one or
Running Head: SCHOOL ENGAGEMENT AMONG SEXUAL MINORITY STUDENTS 14
both of the dependent variables. Multiple imputation by chained equations (van Buuren,
Boshuizen, & Knook, 1999) was then used to address the remaining missing data. This left a
usable sample of 318 for the multiple regression analyses.
Results
Descriptive Statistics
Descriptive statistics were calculated only for the existing (non-imputed) data prior to any
rescoring or centering of variables. In terms of race/ethnicity, 65.2% (n = 199) of the sample
identified as White, 13.8% (n = 42) identified as bi- or multiracial, 8.9% (n = 27) identified as
Hispanic/Latino/a, 2.3% (n = 7) identified as American Indian or Alaskan Native, 2.0% (n = 6)
identified as Asian or Asian American, 2.0% (n = 6) identified as Black or African American,
and 5.9% (n = 18) identified as Other race/ethnicity. With regard to gender identity, 48.5% (n =
148) of the sample identified as female, 41.0% (n = 125) identified as male, and 10.5% (n = 32)
identified as transgender, gender variant, genderqueer, or other.
Almost one-third of the sample (32.1%, n = 100) identified as gay, 31.1% (n = 97)
identified as bisexual, 22.4% (n = 70) identified as lesbian, 8.3% (n = 26) identified as queer,
pansexual, or some other identity, and 6.1% (n = 19) were questioning. The sample ranged in age
from 13 to 24 years old, with a mean age of 17.88 years (SD = 2.32). As a proxy for social class,
just over one-third of the sample (34.7%, n = 110) reported having received a free or reduced-
price lunch at some point during their schooling. The breakdown of youth’s grade status in
school is included in Table 1.
| INSERT TABLE ONE HERE |
Two-thirds of the youth (66.6%, n = 209) reported having a teacher, counselor, social
worker, or other adult at their current or most recent school or college with whom they felt safe

Running Head: SCHOOL ENGAGEMENT AMONG SEXUAL MINORITY STUDENTS 15
talking to about their sexual orientation and/or gender identity. The majority (68.2%, n = 217)
also stated that their current or most recent school has a GSA, while the remaining youth said
that their school either did not have a GSA or they did not know whether it did. In terms of
feeling unsafe or afraid while at their most recent school or on the way to/from school, 29.4% (n
= 92) said they never felt unsafe or afraid, 38.0% (n = 119) rarely did, 23.3% (n = 73) sometimes
did, 8.6% (n = 27) felt unsafe or afraid most of the time, and 0.6% (n = 2) felt unsafe or afraid all
of the time. While the modal response was rarely feeling unsafe or afraid, almost 1/3rd
of the
youth reported feeling unsafe or afraid at least sometimes. On the measure of student school
engagement, scores spanned the entire range of the scale from 1 (low engagement) to 28 (high
engagement), with an average engagement score of 17.92 (SD = 4.94), indicating that most of the
youth scored slightly above the scale’s midpoint.
Turning to the dependent variables, youth’s GPA from their previous (or most recent)
academic year ranged from 0.2 (“mostly F’s) to 4.0 (“straight A’s”), with an average GPA of
2.79 (SD = 1.04), which is approximately equal to receiving mostly B’s. For the fear-based
truancy variable (average number of days of school per month missed school due to feeling
unsafe), answers ranged the full length of the original scale (from “0 days” to “6 or more days”).
However, this variable’s distribution was positively skewed and leptokurtic, with 83.0% of youth
reporting not missing any school days due to fear of being unsafe, 5.7% (n = 18) missing one day
of school, 6.9% (n = 22) missing two or three days, 1.6% (n = 5) missing four or five days, and
2.8% (n = 9) missed six or more days.
Inferential Statistics
For each of the regression models (one predicting GPA and the other predicting fear-
based truancy), the first block includes only the demographic variables, the second block adds
Running Head: SCHOOL ENGAGEMENT AMONG SEXUAL MINORITY STUDENTS 16
school-level variables, the third block adds student school engagement, and the fourth block
includes any significant interaction terms between student school engagement and the school-
level variables.
The assumptions of multiple regression were tested using SPSS REGRESSION and
plotting the residuals against the dependent variable. The model predicting truancy had a scatter
plot suggesting violations of assumptions of normality of errors and homoscedasticity, indicating
that the truancy variable was highly positively skewed and leptokurtic. The truancy variable was
transformed to address the violations of assumptions, but there was only one minor difference (a
slightly higher adjusted R2) when comparing the final results using the transformed dependent
variable with the untransformed version of the same variable. Therefore, for ease of
interpretation, the untransformed version of the truancy variable was used in the models reported
here.
Turning to the assumptions regarding univariate and multivariate outliers, two of the
dichotomous independent variables (having a queer/other sexual orientation, and being
questioning about one’s sexual orientation) had greater than 90:10 splits. These variables were
retained in the models, recognizing that their correlations with other variables would be deflated
due to their lopsided splits. Six records were extremely low outliers on student school
engagement, and one case was extremely high in the interaction term of engagement and feeling
unsafe/afraid. Because both of these variables’ distributions were otherwise normal, these seven
extreme records were rescored so that they remained at the tail end of their distributions, but
would not be as influential (Tabachnick & Fidell, 2007). None of the other variables had extreme
univariate outliers. Using a p < .001 criterion for Mahalanobis distance, three cases were found
to be multivariate outliers in the models predicting GPA, and three cases were found to be
Running Head: SCHOOL ENGAGEMENT AMONG SEXUAL MINORITY STUDENTS 17
multivariate outliers in the models predicting truancy. These outlier cases were significantly
older than the rest of the sample (p < .001 for the GPA models and p < .01 for truancy), and in
the case of predicting GPA were more likely to be queer-identified (p < .001). These cases were
excluded from the final analyses for the model(s) in which they were multivariate outliers so that
all of the analyses used a final sample size of 315.
Finally, to address issues of multicollinearity that were introduced by including
interaction terms in the models, the following variables were centered: age, age squared, feeling
unsafe or afraid at school, student school engagement, and the two interaction terms.
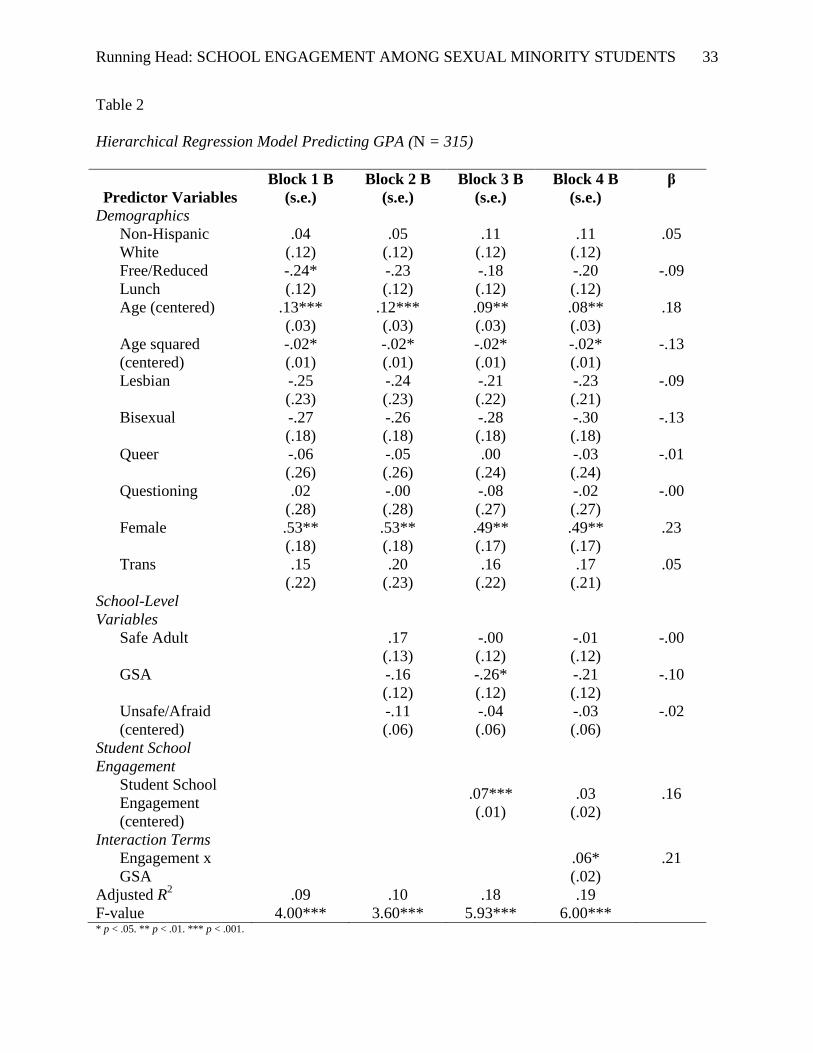
Model predicting GPA. The results of the hierarchical regression predicting GPA can be
found in Table 2. Within the first block of variables, the overall model accounted for 9% of the
variance in GPA, with receiving a free or reduced-price lunch, age squared, and being female
emerging as significant predictors of GPA when controlling for all other demographic variables.
Youth who received a free or reduced-price lunch are predicted to have a GPA that is 0.24 points
lower than other youth (p < .05). The significant age squared variable (p < .05) indicates a
curvilinear relationship between age and GPA when controlling for the other demographic
variables (discussed below). Sexual minority females are predicted to have a GPA that is 0.53
points higher than that of sexual minority males (p < .01).
| INSERT TABLE TWO HERE|
In the second block, in which school-level variables had been introduced, free/reduced-
price lunch lost its significance in predicting GPA; all other demographic variables that were
significant in the first block remained significant when controlling for all other variables. None
of the school-level variables were significant predictors of GPA. The variables included in Block
2 accounted for 10% of the variance in GPA.
Running Head: SCHOOL ENGAGEMENT AMONG SEXUAL MINORITY STUDENTS 18
All of the variables that were significant predictors in Block 2 remained so in Block 3.
Presence of a GSA became a significant predictor (p < .05) of student GPA once student school
engagement was added to the model. When controlling for the other variables, youth whose
school or college has a GSA are predicted to have a GPA that is 0.26 points lower than youth
who said their school did not have a GSA or who did not know whether their school did.
Additionally, student school engagement was a significant predictor of GPA (p < .001) when
controlling for student demographics and school-level variables; for every ten unit increase in
student school engagement, GPA is predicted to increase 0.70 points. This block accounts for
18% of the variance in GPA.
The full regression equation (Block 4) was a statistically significant model for predicting
GPA, F (15, 299) = 6.00, p < .001, and accounts for 19% of the variance in GPA. Age squared
continues to be a significant predictor of GPA (p < .05), indicating that a curvilinear relationship
remains between age and GPA even when controlling for all other variables. This relationship is
displayed in Figure 1. Females are predicted to have a GPA that is .49 points higher than males
when controlling for all other variables (p < .01). The interaction term between student school
engagement and GSA presence is also a statistically significant predictor of GPA when
controlling for all other variables, p < .05. This interaction is displayed in Figure 2. None of the
other school-level variables were significant predictors of GPA once this interaction term was
included in the model.
|INSERT FIGURES ONE AND TWO HERE|
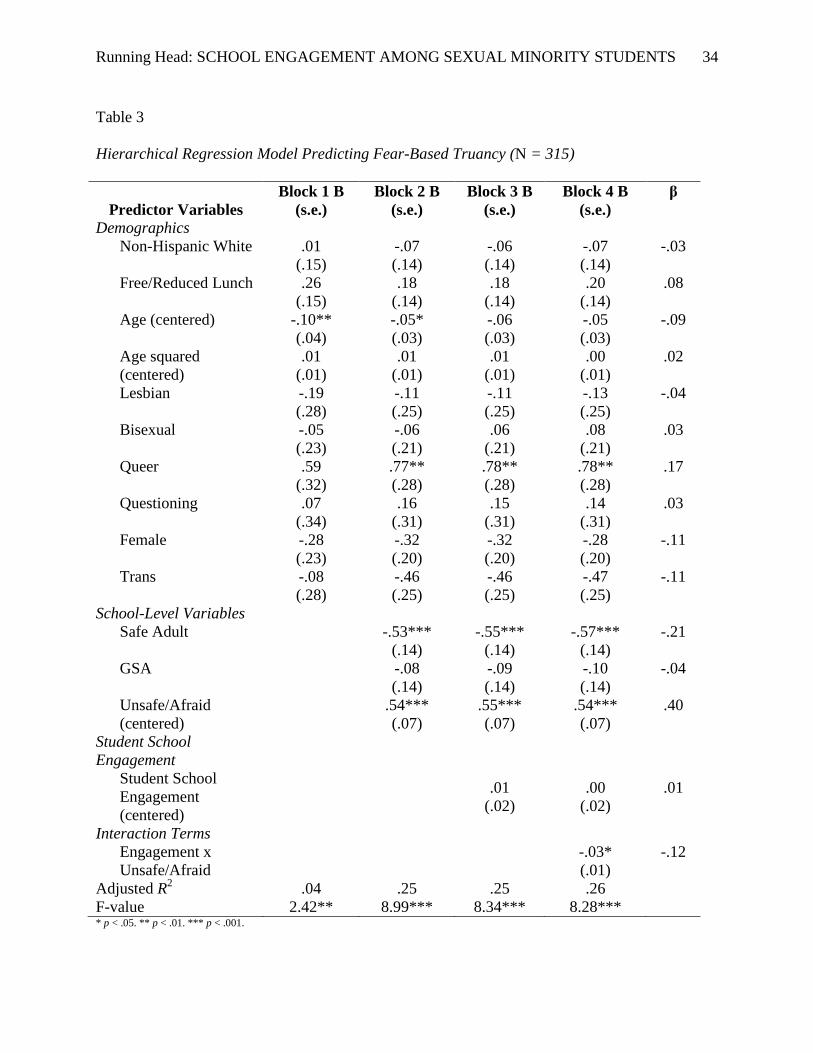
Model predicting fear-based truancy. Table 3 displays the results of the hierarchical
regression predicting the second dependent variable: fear-based truancy. The demographic
variables in the first block account for 4% of the variability in truancy. Age is the only
Running Head: SCHOOL ENGAGEMENT AMONG SEXUAL MINORITY STUDENTS 19
significant predictor (p < .01) within this first block. For every year increase in age, youth are
predicted to skip 0.10 fewer days at school in the past month due to feeling unsafe when
controlling for all other demographic variables. Put another way, for each year increase in age,
youth are predicted to miss one less day of school during a 10-month period due to feeling
unsafe.
| INSERT TABLE THREE HERE |
In the second block, age remained a statistically significant predictor (p < .05) of fear-
based truancy. Identifying as queer became a significant predictor (p < .01) of truancy: compared
to the reference group of youth who identify as gay, those who identify as queer are predicted to
miss 0.77 more days of school per month due to feeling unsafe when controlling for the other
variables. Two of the three school-level variables were also found to be statistically significant
(p < .001) predictors of fear-based truancy when controlling for all other variables. Youth who
reported having a teacher, counselor, social worker, or other adult at their school who they felt
safe talking to about their sexual orientation and/or gender identity are predicted to miss about
half a day less of school per month due to feeling unsafe than youth who did not have access to a
safe adult. Similarly, for every unit increase in feeling unsafe or afraid at school or while
traveling to/from school, youth are predicted to miss 0.54 more days of school each month due to
fear when controlling for all other variables. This block accounted for a total of 25% of the
variance in fear-based truancy.
Even after adding student school engagement in Block 3, there was no change in the total
percentage of variance in fear-based truancy accounted for by the model. Age lost its statistical
significance, and student school engagement was not a statistically significant predictor of fear-
based truancy.

Running Head: SCHOOL ENGAGEMENT AMONG SEXUAL MINORITY STUDENTS 20
The final model (Block 4) was a statistically significant predictor of fear-based truancy,
F(15, 299) = 8.28, p < .001. This model accounts for 26% of the variance in fear-based truancy
among the sexual minority youth. The only demographic variable with a significant coefficient in
this final equation was having a queer identity (p < .01); compared to their gay peers, youth who
identify as queer are predicted to miss 0.78 more days of school per month due to feeling unsafe,
when controlling for all other variables. Having a safe adult to talk to within the school was also
significant (p < .001) and had the second highest standardized beta weight (β = -.21); when
controlling for all other variables, sexual minority youth with a safe adult at school are predicted
to miss 0.57 fewer days of school per month due to feeling unsafe than youth who did not have
access to such an adult. Feeling unsafe or afraid in the context of school was also a significant
variable (p < .001) in the final model and had the largest degree of influence compared to all
other variables (β = .40). For every unit increase in feeling unsafe or afraid at school or while
traveling to/from school, youth are predicted to miss 0.54 more days of school due to fear each
month when controlling for all other variables. These findings suggest that sexual minority
students who report feeling unsafe at school all of the time are likely to miss 2.5 more days per
month than sexual minority students who report never feeling unsafe at school.
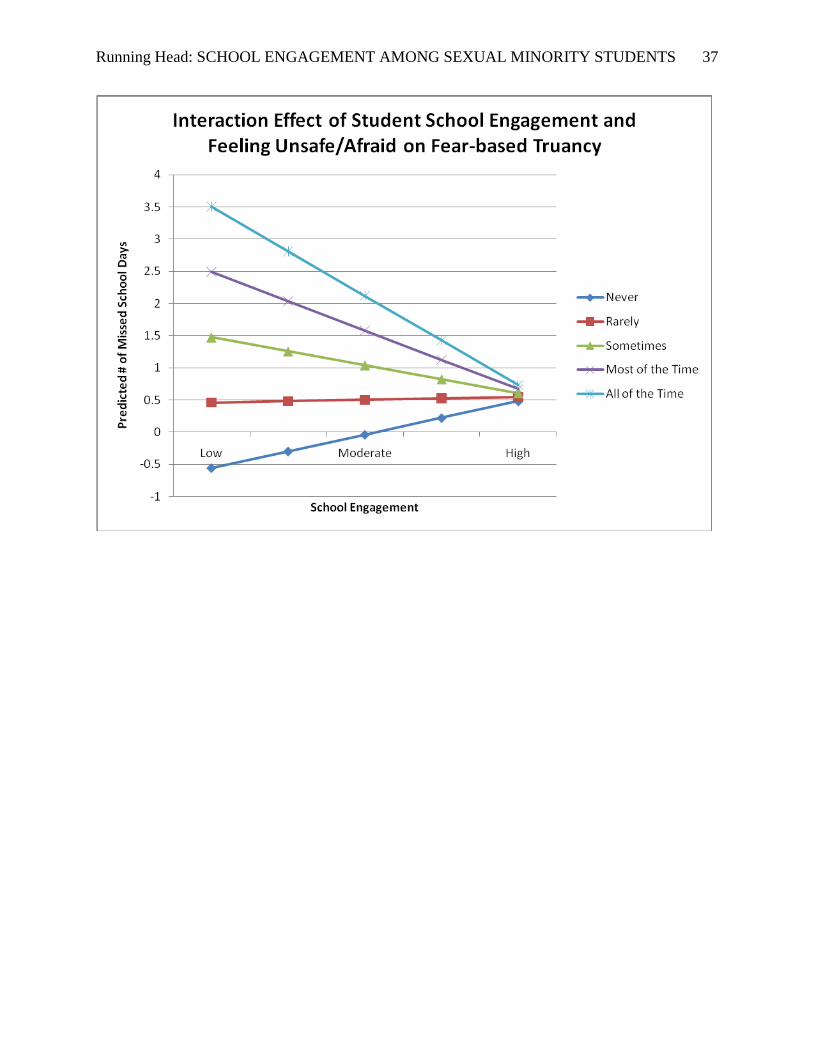
Finally, the interaction term between student school engagement and feeling unsafe or
afraid at school was a significant predictor of fear-based truancy (p < .05). This interaction is
graphed in Figure 3 for ease of interpretation. It suggests that student school engagement
functions very differently in predicting fear-based truancy based on how unsafe the youth feels at
school. Comparing students who are at a low level of engagement, there is about a 4.0 day
difference in the number of days missed in the previous month, while the students who are at a

Running Head: SCHOOL ENGAGEMENT AMONG SEXUAL MINORITY STUDENTS 21
high level of student school engagement are virtually indistinguishable from one another based
on subjective feelings of being unsafe.
|INSERT FIGURE THREE HERE|
Discussion
Limitations
One of the limitations of this study is the nature of the sample. Since youth were recruited
via either social service agencies or the website of a large LGBT organization, these youth may
not be representative of all sexual minority youth (particularly those who are less out and/or are
located in more rural regions). Further, about 45% of the youth in the sample were recruited from
organizations that offer programming specifically for sexual minority youth; the youth who were
recruited from these sites tend to have disproportionately high levels of risk factors (e.g.
homelessness) that may not be the same for the general population of sexual minority youth.
Our findings should be interpreted with a number of cautions in mind. First, the sample
included both in-school and out-of-school youth. This characteristic of the sample may have had
an unmeasured effect on youth’s abilities to accurately share information about their school
experiences, particularly if they had dropped out of school or graduated several years previously.
Secondly, since many sexual minority youth organizations offer programming to youth
throughout their teenagers years and into their mid-20s, the sample included both high school
and college students. While an age variable was included to act as a proxy for grade-level, there
may be differences between the high school and college-aged youth that could not be captured in
these models that are helpful in understanding the difference in contexts between high school and
college experiences for sexual minority youth.
Implications for Practice
Running Head: SCHOOL ENGAGEMENT AMONG SEXUAL MINORITY STUDENTS 22
Student school engagement is a construct that encapsulates a student’s feelings of
affiliation and investment in the school setting. The underlying premise of student school
engagement is that it is fluid (can be changed) and has the ability to predict academic outcomes
and high school completion. Few studies, however, have examined the effectiveness of student
school engagement as a predictor of academic outcomes among sexual minority youth. This
study addresses this gap in the research through the examination of two specific models: one that
analyzes engagement as a predictor of GPA, and a second that examines it as a predictor of fear-
based truancy.
Within the GPA model, even after controlling for demographics and school-related
variables, student school engagement was a significant predictor of student GPA: higher student
school engagement predicted higher grades, a pattern that mirrors what currently exists in the
literature regarding community representative samples of students. This suggests that, as with
heterosexual students, student school engagement can be useful in forecasting sexual minority
students’ grades. In terms of intervention, the findings suggest that school social workers,
counselors, teachers, and psychologists may find that fostering greater student school
engagement among sexual minority youth supports stronger academic achievement for these
youth. At the same time, some school-related variables were not found to significantly predict
GPA for sexual minority youth. Having a safe adult to talk with and having lower levels of fear
might be emotionally and psychologically supportive of sexual minority students, but their
impact does not seem to be strong enough to be associated with improved grades.
There initially appeared to be a negative relationship between the presence of a GSA and
GPA in Block 3; however, in Block 4, a notable interaction emerges in the model between
student school engagement and presence of a GSA (refer back to Figure 2) that illustrates a more
Running Head: SCHOOL ENGAGEMENT AMONG SEXUAL MINORITY STUDENTS 23
complex relationship: among sexual minority youth, the positive relationship between
engagement and GPA differs based on whether or not there is a GSA in the school. In both cases,
greater engagement is associated with higher GPA, but that relationship is stronger in schools
with GSAs than in schools without GSAs. This suggests that GSAs and student school
engagement may have a mutually amplifying influence on one another, strengthening the
positive relationship of the other with GPA. These results imply that school-based personnel
committed to the educational equality for sexual minority youth may find that concurrently
supporting numerous interventions (e.g., supporting both the formation and maintenance of a
GSA while also implementing programs to strengthen student school engagement) may have an
exponential impact on academic performance for those youth.
In the fear-based truancy model, in contrast, some of the strongest predictors were
school-related variables, such as having a safe adult at school and subjective experiences of fear
at school. The presence of a teacher, counselor, social worker, or other adult at school that youth
felt like they could talk to about their sexual orientation and/or gender identity is predicted to
lower the number of days of school youth miss due to feeling afraid by ½ day per month.
Similarly, youth who were less likely to feel unsafe or afraid at school or while traveling to/from
school missed fewer days of school each month due to fear. Since sexual minority youth, similar
to other vulnerable populations of youth such as youth of color, are often at higher risk for
harassment and violence from their peers or staff at school, it is important that staff pay attention
to methods for reducing these youths’ experiences of the school setting as a place of fear. This
study suggests that having a “safe adult” on campus who is willing to openly support sexual
minority youth can be a method for reducing fear-based truancy.
Running Head: SCHOOL ENGAGEMENT AMONG SEXUAL MINORITY STUDENTS 24
After controlling for school-related variables, however, engagement was not found to be
a significant predictor of fear-based truancy. Nonetheless, a significant interaction emerged
between student school engagement and feeling unsafe or afraid at school (refer back to Figure
3). For youth who were less likely to experience fear at school (at the never or seldom levels),
engagement does not appear to be related to fear-based truancy. However, for youth who more
frequently experience fear at school (at the all of the time, most of the time, or sometimes levels),
student school engagement is associated with decreases in fear-based truancy. Interventions in
schools that promote engagement may be particularly important in decreasing truancy among the
sexual minority youth who experience the most fear. Assessing the level of fear that is driving
truancy among sexual minority youth may not only provide concrete avenues for intervention to
directly address the students, faculty, or staff who are responsible for the fear or the dangerous
contexts of school (such as during lunch or gym), but may also indicate that involving these
youth in activities that develop and support their student school engagement may likewise be
helpful in reducing their truancy.
Implications for Future Research
Future studies could utilize more rigorous designs and statistical analyses to capture a
more complete understanding of the role of student school engagement for sexual minority
youth. Multi-level modeling, coupled with purposeful sampling of a larger number of schools
across the country, could be utilized to better understand how cluster-level variables at the school
level impact the relationship of engagement with academic outcomes. Structural equation models
could be used to tease out the relationship between student school engagement and GPA, given
that it could be that fear-based truancy is a mediating variable between engagement and GPA.
Furthermore, the final regression models only accounted for 19% and 26% of the variance in the
Running Head: SCHOOL ENGAGEMENT AMONG SEXUAL MINORITY STUDENTS 25
outcome variables of interest; clearly, there are other variables that impact GPA and truancy,
perhaps including family and community supports, peer influences, curricular delivery, and
individual student characteristics (e.g., previous academic success). Future studies could examine
these additional variables to determine if their inclusion helps to better capture the dynamics at
work in understanding the school experiences and outcomes for sexual minority youth.
Running Head: SCHOOL ENGAGEMENT AMONG SEXUAL MINORITY STUDENTS 26
References
Appleton, J. J., Christenson, S. L., & Furlong, M. J. (2008). Student engagement with school:
Critical conceptual and methodological issues of the construct. Psychology in the
Schools, 45, 369-386.
Appleton, J. J., Christenson, S. L., Kim, D., & Reschly, A. L. (2006). Measuring cognitive and
psychological engagement: Validation of the Student Engagement Instrument. Journal of
School Psychology, 44(5), 427-445.
Birkett, M., Espelage, D. L., & Koenig, B. (2009). LGB and questioning students in schools: The
moderating effects of homophobic bulling and school climate on negative outcomes.
Journal of Youth and Adolescence, 38, 989-1000.
Brookins-Fisher, J. (1995). Gay youth: At risk in the classroom. Salt Lake City, UT: Utah
Schools Teacher Training Guide.
Centers for Disease Control and Prevention. (2004). 2004 Youth Risk Behavior Survey. Retrieved
April 12, 2005, from http://www.cdc.gov/yrbss.
Chang, J. J., Chen, J. J., & Brownson, R. C. (2003). The role of repeat victimization in
adolescent delinquent behaviors and recidivism. Journal of Adolescent Health, 32, 272-
280.
Christenson, S. L. (n.d.). University of Minnesota, Educational Psychology Department Faculty
Biography: Sandra L. Christenson. Retrieved November 1, 2008, from University of
Minnesota, Educational Psychology Web site: http://cehd.umn.edu/EdPsych/
faculty/Christenson.html
Christenson, S. L., Reschly, A. L., Appleton, J. J., Berman-Young, S., Spanjers, D. M., & Varro,
P. (2008). Best practices in fostering student engagement. In A. Thomas & J. Grimes
Running Head: SCHOOL ENGAGEMENT AMONG SEXUAL MINORITY STUDENTS 27
(Eds.), Best practices in school psychology V (pp. 1099-1120). Bethesda, MD: National
Association of School Psychologists.
Craig, S. L., Tucker, E. W., & Wagner, E. F. (2008). Empowering lesbian, gay, bisexual, and
transgender youth: Lessons learned from a safe schools summit. Journal of Gay &
Lesbian Social Services, 20, 237-267.
D’Augelli, A. R., Grossman, A. H., & Starks, M. T. (2006). Childhood gender atypicality,
victimization, and PTSD among lesbian, gay, and bisexual youth. Journal of
Interpersonal Violence, 21, 1462-1482.
D’Augelli, A. R., Pilkington, N. W., & Hershberger, S. L. (2002). Incidence and mental health
impact of sexual orientation victimization of lesbian, gay, and bisexual youths in high
school. School Psychology Quarterly, 17, 148-167.
Durant, R. H., Kahn, J., Beckford, P. H., & Woods, E. R. (1997). The association of weapon
carrying and fighting on school property and other health risk and problem behavior
among high school students. Pediatric Adolescent Medicine, 151, 360-366.
Fernández-Castillo, A., & Gutiérrez-Rojas, M. E. (2009). Selective attention, anxiety, depressive
symptomatology and academic achievement in adolescents. Electronic Journal of
Research in Educational Psychology, 7, 49-76.
Fredricks, J. A., Blumenfeld, P., Friedel, J., & Paris, A. (2005). School engagement. In K. A.
Moore & L. H. Lippman (Eds.), What do children need to flourish? Conceptualizing and
measuring indicators of positive development (pp. 305-321). New York: Springer.
Fredricks, J. A., Blumenfeld, P., & Paris, A. (2004). School engagement: Potential of the
concept, state of the evidence. Review of Educational Research, 74, 59-109.

Running Head: SCHOOL ENGAGEMENT AMONG SEXUAL MINORITY STUDENTS 28
Furlong, M., & Christenson, S. (2008). Engaging students at school and with learning: A relevant
construct for all students. Psychology in the Schools, 45, 365-368.
Hamilton, L. D., Newman, M. L., Delville, C. L., & Delville, Y. (2008). Physiological stress
response of young adults exposed to bullying during adolescence. Physiology &
Behavior, 95, 617-624.
Hazel, C. E., Jack, C., Wonner, R., & Albanes, J. (2009). Measuring Student School
Engagement: Analysis of Three Models. Poster presented at the 41st annual national
conference of the National Association of School Psychologists, Boston, MA.
Hazel, C. E., Vazirabadi, G. E., Gallagher, J. , Albanes, J., McDonald, S., & Montano, F.,
(2010). Measuring Aspirations, Belonging, and Productivity in Secondary Students:
Validation of the Student School Engagement Measure. Manuscript submitted for
publication.
Hershberger, S. L., Pilkington, N. W., & D’Augelli, A. R. (1997). Predictors of suicide attempts
among gay, lesbian, and bisexual youth. Journal of Adolescent Research, 12, 477-497.
Hetrick-Martin Institude. (n.d.) LGBTQ youth statistics. Retrieved on November 14, 2006 from
http://www.hmi.org/HOME/Article/Params/articles/1320/default.aspx#item1320
Human Rights Watch. (2001). Hatred in the hallways: Violence and discrimination against
lesbian, gay, bisexual and transgender students in U.S. schools. New York, NY: Human
Rights Watch. Retrieved May 25, 2007 from http://hrw.org/reports/2001/uslgbt/toc.htm
Jimerson, S., Campos, E., & Greif, J. (2003). Towards an understanding of definitions and
measures of school engagement and related terms. The California School Psychologist, 8,
7-28.

Running Head: SCHOOL ENGAGEMENT AMONG SEXUAL MINORITY STUDENTS 29
Kiedman, E. A. (2002). School experiences, social support, and the educational and psychosocial
outcomes of lesbian, gay, and bisexual youth. Dissertation Abstracts International, 62,
8A. (UMI No. 3024422).
Kosciw, J.G. (2004). The 2003 National School Climate Survey: The school-related experiences
of our nation’s lesbian, gay, bisexual, and transgender youth. New York, NY: Gay,
Lesbian, Straight Education Network.
Kosciw, J. G., & Diaz, E. M. (2006). The 2005 National School Climate Survey: The experiences
of lesbian, gay, bisexual, and transgender youth in our nation’s schools. New York, NY:
Gay, Lesbian, Straight Education Network.
Menesini, E., Modena, M., & Tani, F. (2009). Bullying and victimization in adolescence:
Concurrent and stable roles and psychological health symptoms. Journal of Genetic
Psychology, 170, 115-133.
Millburn, N. G., Ayala, G., Batterham, P., & Rotherham-Borus, M. J. (2006). Discrimination and
exiting homelessness among homeless adolescents. Cultural Diversity & Ethnic Minority
Psychology, 12, 658-672.
National Education Association Task Force on Sexual Orientation. (2002). Needs of, and
problems confronting gay, lesbian, bisexual, and transgendered students and education
employees. Washington, DC: National Education Association.
O'Farrell, S. L., Morrison, G. M., & Furlong, M. J. (2006). School engagement. In G. G. Bear &
K. M. Minke (Eds.), Children's needs III: Development, prevention, and intervention (pp.
45-58). Bethesda, MD: National Association of School Psychologists.
Osterman, K. E. (2000). Students’ need for belonging in the school community. Review of
Educational Research, 70, 323–367.

Running Head: SCHOOL ENGAGEMENT AMONG SEXUAL MINORITY STUDENTS 30
Pearson, J., Muller, C., & Wilkinson, L. (2007). Adolescent same-sex attraction and academic
outcomes: The role of school attachment and engagement. Social Problems, 54, 523-542.
Plöderl, M., & Fartacek, R. (2007). Childhood gender nonconformity and harassment as
predictors of suicidality among gay, lesbian, bisexual, and heterosexual Austrians.
Archives of Sexual Behaviors, 38, 400-410.
Remafedi, G. (1987). Adolescent homosexuality: Psychosocial and medical implications.
Pediatrics, 79, 331-337.
Rothon, C., Head, J., Clark, C., Klineberg, E., Cattell, V., & Stansfeld, S. (2009). The impact of
psychological distress on the educational achievement of adolescents at the end of
compulsory education. Social Psychiatry and Psychiatric Epidemiology, 44, 421-427.
Tabachnick, B. G., & Fidell, L. S. (2007). Using multivariate statistics (5th
ed.). Boston, MA:
Pearson Education Inc.
Tharp-Taylor, Haviland, & D’Amico, E. J. (2009). Victimization from mental and physical
bullying and substance use in early adolescence. Addictive Behaviors, 34, 561-567.
van Buuren, S., Boshuizen, H. C., & Knook, D. L. (1999). Multiple imputation of missing blood
pressure covariates in survival analysis. Statistics in Medicine, 18, 681-694.
Walls, N. E., Freedenthal, S., & Wisneski, H. (2008). Suicidal ideation and attempts among
sexual minority youth receiving social services. Social Work, 53, 21-29.
Walls, N. E., Hancock, P., & Wisneski, H. (2007). Differentiating the social service needs of
homeless sexual minority youth from those of non-homeless sexual minority youth.
Journal of Children & Poverty, 13, 177-205.
Walls, N. E., Kane, S. B., & Wisneski, H. (2010). Gay-straight alliances and school experiences
of sexual minority youth. Youth & Society, 41, 307-331.

Running Head: SCHOOL ENGAGEMENT AMONG SEXUAL MINORITY STUDENTS 31
Webster, D. W., Gainer, P. S., & Champion, H. R. (1993). Weapon carrying among inner-city
junior high school students: Defensive behavior vs. aggressive delinquency. American
Journal of Public Health, 83, 1604-1608.
Willms, J.D. (2003) Student engagement at school: A sense of belonging and participation.
Results from PISA 2000. Paris, France: Organisation for Economic Co-operation and
Development.

Running Head: SCHOOL ENGAGEMENT AMONG SEXUAL MINORITY STUDENTS 32
Table 1
Current grade level or drop-out status of the sample
Current grade level Percent Frequency
9th
grade 6.4% 20
10th
grade 13.5% 42
11th
grade 20.2% 63
12th
grade equivalenta
20.8% 65
Finished high school, not attending college 4.2% 13
Attending college 25.3% 79
Finished college 1.9% 6
College graduate student 2.6% 8
Dropped out of HS or college 5.1% 16
aIncludes current 12
th grade students, alternative high school students, GED prep, and those who had earned a GED.
Running Head: SCHOOL ENGAGEMENT AMONG SEXUAL MINORITY STUDENTS 33
Table 2
Hierarchical Regression Model Predicting GPA (N = 315)
Predictor Variables
Block 1 B
(s.e.)
Block 2 B
(s.e.)
Block 3 B
(s.e.)
Block 4 B
(s.e.)
β
Demographics
Non-Hispanic
White
.04
(.12)
.05
(.12)
.11
(.12)
.11
(.12)
.05
Free/Reduced
Lunch
-.24*
(.12)
-.23
(.12)
-.18
(.12)
-.20
(.12)
-.09
Age (centered) .13***
(.03)
.12***
(.03)
.09**
(.03)
.08**
(.03)
.18
Age squared
(centered)
-.02*
(.01)
-.02*
(.01)
-.02*
(.01)
-.02*
(.01)
-.13
Lesbian -.25
(.23)
-.24
(.23)
-.21
(.22)
-.23
(.21)
-.09
Bisexual -.27
(.18)
-.26
(.18)
-.28
(.18)
-.30
(.18)
-.13
Queer -.06
(.26)
-.05
(.26)
.00
(.24)
-.03
(.24)
-.01
Questioning .02
(.28)
-.00
(.28)
-.08
(.27)
-.02
(.27)
-.00
Female .53**
(.18)
.53**
(.18)
.49**
(.17)
.49**
(.17)
.23
Trans .15
(.22)
.20
(.23)
.16
(.22)
.17
(.21)
.05
School-Level
Variables
Safe Adult
.17
(.13)
-.00
(.12)
-.01
(.12)
-.00
GSA
-.16
(.12)
-.26*
(.12)
-.21
(.12)
-.10
Unsafe/Afraid
(centered)
-.11
(.06)
-.04
(.06)
-.03
(.06)
-.02
Student School
Engagement
Student School
Engagement
(centered)
.07***
(.01)
.03
(.02)
.16
Interaction Terms
Engagement x
GSA
.06*
(.02)
.21
Adjusted R2
.09 .10 .18 .19
F-value 4.00*** 3.60*** 5.93*** 6.00*** * p < .05. ** p < .01. *** p < .001.
Running Head: SCHOOL ENGAGEMENT AMONG SEXUAL MINORITY STUDENTS 34
Table 3
Hierarchical Regression Model Predicting Fear-Based Truancy (N = 315)
Predictor Variables
Block 1 B
(s.e.)
Block 2 B
(s.e.)
Block 3 B
(s.e.)
Block 4 B
(s.e.)
β
Demographics
Non-Hispanic White .01
(.15)
-.07
(.14)
-.06
(.14)
-.07
(.14)
-.03
Free/Reduced Lunch .26
(.15)
.18
(.14)
.18
(.14)
.20
(.14)
.08
Age (centered) -.10**
(.04)
-.05*
(.03)
-.06
(.03)
-.05
(.03)
-.09
Age squared
(centered)
.01
(.01)
.01
(.01)
.01
(.01)
.00
(.01)
.02
Lesbian -.19
(.28)
-.11
(.25)
-.11
(.25)
-.13
(.25)
-.04
Bisexual -.05
(.23)
-.06
(.21)
.06
(.21)
.08
(.21)
.03
Queer .59
(.32)
.77**
(.28)
.78**
(.28)
.78**
(.28)
.17
Questioning .07
(.34)
.16
(.31)
.15
(.31)
.14
(.31)
.03
Female -.28
(.23)
-.32
(.20)
-.32
(.20)
-.28
(.20)
-.11
Trans -.08
(.28)
-.46
(.25)
-.46
(.25)
-.47
(.25)
-.11
School-Level Variables
Safe Adult
-.53***
(.14)
-.55***
(.14)
-.57***
(.14)
-.21
GSA
-.08
(.14)
-.09
(.14)
-.10
(.14)
-.04
Unsafe/Afraid
(centered)
.54***
(.07)
.55***
(.07)
.54***
(.07)
.40
Student School
Engagement
Student School
Engagement
(centered)
.01
(.02)
.00
(.02)
.01
Interaction Terms
Engagement x
Unsafe/Afraid
-.03*
(.01)
-.12
Adjusted R2
.04 .25 .25 .26
F-value 2.42** 8.99*** 8.34*** 8.28*** * p < .05. ** p < .01. *** p < .001.

Running Head: SCHOOL ENGAGEMENT AMONG SEXUAL MINORITY STUDENTS 35
Figure Captions
Figure 1. Curvilinear relationship between age and GPA.
Figure 2. Interaction between student school engagement and the presence of a GSA on GPA.
Figure 3. Interaction between student school engagement and feeling unsafe/afraid on fear-
based truancy.
13 24

Running Head: SCHOOL ENGAGEMENT AMONG SEXUAL MINORITY STUDENTS 36
Running Head: SCHOOL ENGAGEMENT AMONG SEXUAL MINORITY STUDENTS 37