Environmental contributors to the achievement gap
14
Environmental contributors to the achievement gap ☆ Marie Lynn Miranda a,* , Dohyeong Kim a,b , Jerome Reiter c , M. Alicia Overstreet Galeano a , and Pamela Maxson a a Children’s Environmental Health Initiative, Nicholas School of the Environment, Duke University, Durham, NC, United States b Department of Public Administration, North Carolina Central University, Durham, NC, United States c Department of Statistical Science, Duke University, Durham, NC, United States Abstract Extensive research shows that blacks, those of low socioeconomic status, and other disadvantaged groups continue to exhibit poorer school performance compared with middle and upper-class whites in the United States’ educational system. Environmental exposures may contribute to the observed achievement gap. In particular, childhood lead exposure has been linked to a number of adverse cognitive outcomes. In previous work, we demonstrated a relationship between early childhood lead exposure and end-of-grade (EOG) test scores on a limited dataset. In this analysis, data from the North Carolina Childhood Lead Poisoning Prevention Program surveillance registry were linked to educational outcomes available through the North Carolina Education Research Data Center for all 100 counties in NC. Our objectives were to confirm the earlier study results in a larger population- level database, determine whether there are differences in the impact of lead across the EOG distribution, and elucidate the impact of cumulative childhood social and environmental stress on educational outcomes. Multivariate and quantile regression techniques were employed. We find that early childhood lead exposure is associated with lower performance on reading EOG test scores in a clear dose-response pattern, with the effects increasingly more pronounced in moving from the high end to the low end of the test score distribution. Parental educational attainment and family poverty status also affect EOG test scores, in a similar dose-response fashion, with the effects again most pronounced at the low end of the EOG test score distribution. The effects of environmental and social stressors (especially as they stretch out the lower tail of the EOG distribution) demonstrate the particular vulnerabilities of socioeconomically and environmentally disadvantaged children. Given the higher average lead exposure experienced by African American children in the United States, lead does in fact explain part of the achievement gap. Keywords Lead levels; Environmental exposures; Achievement gap; Socioeconomic status ☆ Research was supported by the Centers for Disease Control and Prevention through the Children’s Environmental Health Branch of the North Carolina Department of the Environment and Natural Resources, contract #T07095, as well as through a grant from the USEPA, award #RD-83329301-0 and National Institute for Environmental Health Sciences, award #5P42-ES-010356-09. *Corresponding author at: Box 90328, Durham, NC 27708, United States. Tel.: +1 919 613 8088; fax: +1 919 684 3227. [email protected] (M.L. Miranda). Conflicts of interest None to report NIH Public Access Author Manuscript Neurotoxicology. Author manuscript; available in PMC 2009 December 8. Published in final edited form as: Neurotoxicology. 2009 November ; 30(6): 1019–1024. doi:10.1016/j.neuro.2009.07.012. NIH-PA Author Manuscript NIH-PA Author Manuscript NIH-PA Author Manuscript
Transcript of Environmental contributors to the achievement gap
Environmental contributors to the achievement gap☆
Marie Lynn Mirandaa,*, Dohyeong Kima,b, Jerome Reiterc, M. Alicia Overstreet Galeanoa,and Pamela Maxsonaa Children’s Environmental Health Initiative, Nicholas School of the Environment, Duke University,Durham, NC, United Statesb Department of Public Administration, North Carolina Central University, Durham, NC, UnitedStatesc Department of Statistical Science, Duke University, Durham, NC, United States
AbstractExtensive research shows that blacks, those of low socioeconomic status, and other disadvantagedgroups continue to exhibit poorer school performance compared with middle and upper-class whitesin the United States’ educational system. Environmental exposures may contribute to the observedachievement gap. In particular, childhood lead exposure has been linked to a number of adversecognitive outcomes. In previous work, we demonstrated a relationship between early childhood leadexposure and end-of-grade (EOG) test scores on a limited dataset. In this analysis, data from theNorth Carolina Childhood Lead Poisoning Prevention Program surveillance registry were linked toeducational outcomes available through the North Carolina Education Research Data Center for all100 counties in NC. Our objectives were to confirm the earlier study results in a larger population-level database, determine whether there are differences in the impact of lead across the EOGdistribution, and elucidate the impact of cumulative childhood social and environmental stress oneducational outcomes. Multivariate and quantile regression techniques were employed. We find thatearly childhood lead exposure is associated with lower performance on reading EOG test scores ina clear dose-response pattern, with the effects increasingly more pronounced in moving from thehigh end to the low end of the test score distribution. Parental educational attainment and familypoverty status also affect EOG test scores, in a similar dose-response fashion, with the effects againmost pronounced at the low end of the EOG test score distribution. The effects of environmental andsocial stressors (especially as they stretch out the lower tail of the EOG distribution) demonstrate theparticular vulnerabilities of socioeconomically and environmentally disadvantaged children. Giventhe higher average lead exposure experienced by African American children in the United States,lead does in fact explain part of the achievement gap.
KeywordsLead levels; Environmental exposures; Achievement gap; Socioeconomic status
☆Research was supported by the Centers for Disease Control and Prevention through the Children’s Environmental Health Branch ofthe North Carolina Department of the Environment and Natural Resources, contract #T07095, as well as through a grant from the USEPA,award #RD-83329301-0 and National Institute for Environmental Health Sciences, award #5P42-ES-010356-09.*Corresponding author at: Box 90328, Durham, NC 27708, United States. Tel.: +1 919 613 8088; fax: +1 919 684 [email protected] (M.L. Miranda).Conflicts of interestNone to report
NIH Public AccessAuthor ManuscriptNeurotoxicology. Author manuscript; available in PMC 2009 December 8.
Published in final edited form as:Neurotoxicology. 2009 November ; 30(6): 1019–1024. doi:10.1016/j.neuro.2009.07.012.
NIH
-PA Author Manuscript
NIH
-PA Author Manuscript
NIH
-PA Author Manuscript
1. IntroductionExtensive research shows that blacks, those of low socioeconomic status, and otherdisadvantaged groups continue to exhibit poorer school performance compared with middleand upper-class whites in the United States’ educational system (Gamoran, 2001; Hallinan,1988; Hedges and Nowell, 1999; Jencks and Phillips, 2000; Kao and Thompson, 2003; Walters,2000). Blacks score lower on tests than whites, starting in childhood and continuing throughouttheir education. Although this gap has narrowed in the last three decades, on most standardizedtests, median black scores are below 75 percent of whites (Jencks and Phillips, 2000).
Environmental exposures may contribute to the etiology of the achievement gap. Childhoodlead exposure has been linked to a number of adverse cognitive outcomes, including reducedperformance on standardized intelligence quotient (IQ) tests (Schnaas et al., 2006; Canfield etal., 2003; Tong et al., 1996; Bellinger et al., 1992; Dietrich et al., 1993; Lanphear et al.,2005; Schwartz, 1993), decreased performance on cognitive functioning tests (Lanphear et al.,2000), adverse neuropsychological outcomes (Ris et al., 2004), neurobehavioral deficits(Chiodo et al., 2004), poorer end-of-grade (EOG) test scores (Miranda et al., 2007), andclassroom attention deficit and behavioral problems (Fergusson et al., 1988; Hatzakis et al.,1985; Needleman et al., 1979; Silva et al., 1988; Thomson et al., 1989; Yule et al., 1984; Braunet al., 2006).
Socioeconomic status (measured as occupation, income, education, wealth (Conley, 2001; Orr,2003; Mayer, 1997; Brooks-Gunn and Duncan, 1997) or home ownership (Mayer, 1997; Greenand White, 1997; Aaronson, 2000; Hill and Duncan, 1987)) is positively correlated with manymeasures of educational attainment, including children’s reading levels (Department ofEducation, 2002), placement in high-achievement curricular tracks (Dougherty, 1996), notdropping out of high school (Alexander et al., 1997), college matriculation directly from highschool (Baker and Velez, 1996), elite college attendance (Baker and Velez, 1996), and collegegraduation (Baker and Velez, 1996).
In previous work (Miranda et al., 2007), we linked lead surveillance data to EOG testing datafor seven North Carolina counties. We showed that: (1) African American children in theseseven counties are routinely exposed to more lead; and (2) blood lead levels in early childhoodare negatively correlated with educational achievement in early elementary school, asmeasured by performance on EOG testing. This association holds at blood lead levels as lowas 2 μg/dL (Miranda et al., 2007).
This paper extends our previous work, and the literature more generally, in three distinct ways.First, we extended the analysis to all 100 counties in NC, which made the constituent schoolsystems and housing stock, as well as the local demographics, much more varied. In addition,this larger study area solved some of the small cell number problems noted in the 2007 paper(Miranda et al., 2007). Second, traditional multivariate regression analysis only examines whatis happening at the means of distributions. In contrast, we employ quantile regression analysisto elucidate what is happening across the entire distribution (i.e., the technique shows how thecoefficients on the explanatory variables change depending on location along the EOG testscore distribution). Thus the technique can answer questions like, “Does lead exposure have abigger or smaller effect on EOG scores at the bottom tail of the distribution compared to thetop tail?” This is especially important when thinking about the tails of EOG scores, which areparticularly relevant to educational policy/outcomes. Third, we examined the joint andcumulative effect of social and environmental stressors, again using quantile regressionanalysis. This analysis allows us to consider how combined effects of social and environmentalstress might compound in certain subpopulations.
Miranda et al. Page 2
Neurotoxicology. Author manuscript; available in PMC 2009 December 8.
NIH
-PA Author Manuscript
NIH
-PA Author Manuscript
NIH
-PA Author Manuscript
Insights from this paper provide early signals for identifying children who are particularly atrisk for poor performance in school, as well as other longer term adverse developmentaloutcomes. Early identification of such children allows health care providers and childadvocates to play a pivotal role in educating parents and connecting children at risk withrelevant resources in a timely manner.
2. MethodsThis research was conducted under the auspices of the Children’s Environmental HealthInitiative at Duke University according to a research protocol approved by the university’sInstitutional Review Board.
The North Carolina Education Research Data Center (NCERDC) maintains a database withrecords of all EOG test results for all public school systems in the state for tests from the 1995–1996 school year to present. After establishing a data sharing agreement, researchers can accessidentifying information such as name, birth date, and test scores, as well as data on parentaleducation, race, ethnicity, participation in the free or reduced lunch program, Englishproficiency, testing condition modifications, and school district. These data can be linkedlongitudinally for all years each child has taken EOG tests in NC. The North Carolina EOGreading test is designed to measure students’ mastery of the content outlined in the NorthCarolina English Language Arts Standard Course of Study (NC Department of PublicInstruction, 2008). Because states typically develop their own curricula and associated EOGexams, the North Carolina testing data cannot be directly compared to testing outcomes forchildren residing in other states.
The North Carolina Childhood Lead Poisoning Prevention Program (NCCLPPP) maintains astate registry of blood lead surveillance data. Through a negotiated confidentiality agreement,the Children’s Environmental Health Initiative has access to individual blood lead screeningdata from 1995 to present. The NCCLPPP blood lead surveillance data include child name,birth date, race, ethnicity, test date, blood lead level (BLL), and home address. A descriptionof the laboratory protocols followed by the NC State Laboratory of Public Health can be foundin Miranda et al. (2007). For children with duplicate screens, we retained entries with thehighest blood lead level, which is consistent with Lanphear et al. (1998) and several studiesby Miranda et al. (2002, 2007) and Kim et al. (2008).
To construct our integrated database, children who were screened for lead between the ages of9–36 months from 1995 through 1999 in the 100 NC counties (318,068 records for 263,403children) were linked to records in the EOG testing data in age-corresponding years (2001–2005). Our process linked 38.8% of screened children to at least one EOG record. Preliminaryanalysis was restricted to students who self-reported race as either white or black and who didnot report limited English proficiency. We conducted all analyses on 4th-grade reading scores.The final linked dataset for 4th-grade reading results contained 57,678 observations.
We used two methods to analyze the relationship between social factors and blood lead levelsand EOG test scores. We employed multivariate linear regression with EOG test scores as theresponse variable. The explanatory/predictor variables include child’s race, child’s sex,parental education, whether or not the child is enrolled in the free and reduced lunch program,whether the school is a charter school (in NC, this is typically an indicator of lowersocioeconomic status of the enrolled children), and early childhood lead exposure, as well asdummy variables for each school system in the state. Early childhood lead exposure wasmodeled using dummy variables for each blood lead level. A blood lead level (BLL) of 1 μg/dL served as the referent group, resulting in nine dummy variables (BLL = 2 μg/dL, BLL = 3,…, BLL = 9, BLL ≥ 10 μg/dL). Models that use a series of dummy variables for blood lead
Miranda et al. Page 3
Neurotoxicology. Author manuscript; available in PMC 2009 December 8.
NIH
-PA Author Manuscript
NIH
-PA Author Manuscript
NIH
-PA Author Manuscript
levels have been shown to fit better than models that use a linear function of lead exposure(Miranda et al., 2007). The child’s age at screening for lead was controlled for using two dummyvariables (screened between 18 and 27 months, and between 27 and 36 months), with thereferent group of being screened between 9 and 18 months.
The linear regression assumes that the distributions of EOG test scores at different social orenvironmental “exposures” have the same shapes but different means. This may not be thecase. For example, poverty or lead exposure may have a greater or lesser impact on thosestudents who tend to be at one end or the other of the EOG test score distribution. Thus, weemployed a second method of analysis, quantile regression (Koenker, 2005; Feudtner et al.,2006; Lal et al., 2003), which enabled us to examine distributional differences.
Quantile regressions predict conditional percentiles of an outcome variable from a set ofexplanatory variables (e.g. what is the 10th percentile of EOG test scores conditioned on earlychildhood lead exposure levels). It results in an equation for predicting conditional percentilesof interest rather than conditional means. Quantile regression has previously been used in thepediatric literature to assess the risk of chronic lung disease in small for gestational age infants(Lal et al., 2003), to assess how distance from home when death occurs is changing for childrenover time (Feudtner et al., 2006), and to describe the history of somatic growth in HIV-infectedchildren (Carey et al., 1998).
We included the same explanatory variables in the quantile regression as were used in the linearregression. We predicted the conditional percentiles of the EOG test score distributions at every5th percentile until the 95th percentile (i.e., 5th, 10th, 15th, …, 95th). This approximates theentire distribution of EOG scores. This enabled us to examine how entire distributions of EOGtest scores change with lead exposure, as well as with parental educational attainment andfamily poverty status, without assuming only a shift in means.
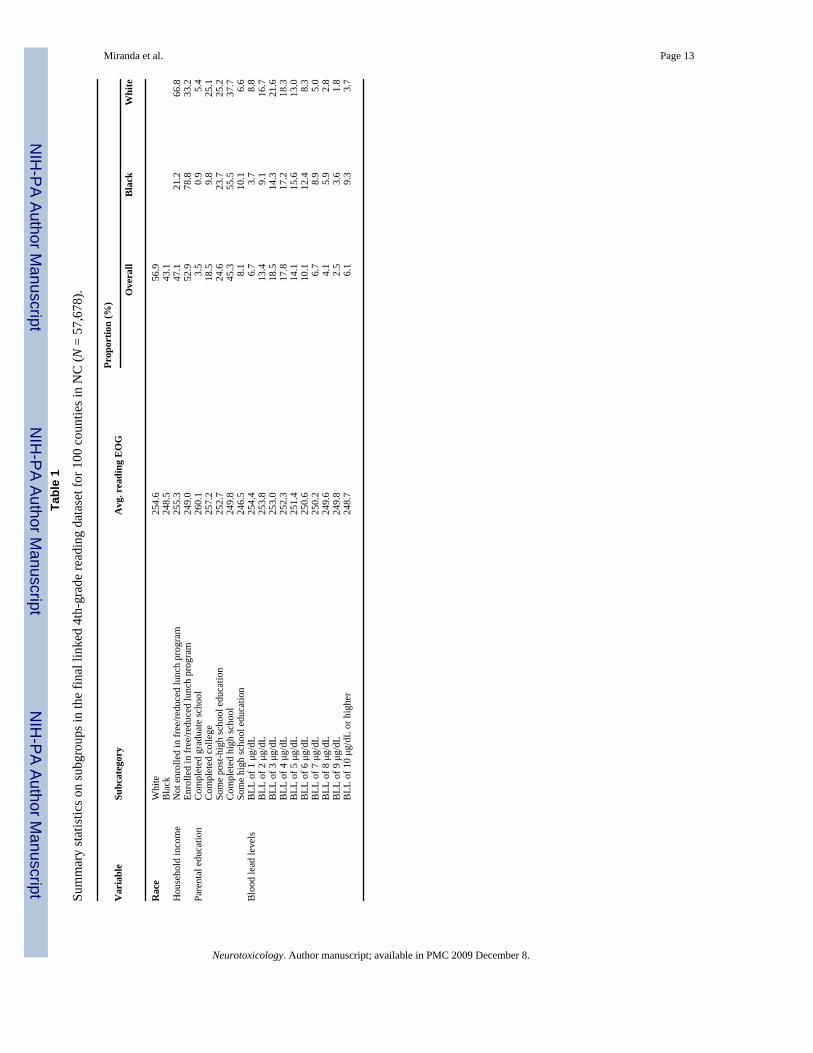
3. ResultsTable 1 provides summary statistics on subgroups within the final linked dataset for 4th-gradereading test scores. Of the total linked children: 43.1% were black (56.9% are white); 52.9%enrolled in the free or reduced lunch program; 8.1% had parents who did not complete highschool; 45.3% had parents who completed high school; and 46.6% had parents who had morethan high school education (college, graduate school, etc.). Blood lead levels for the linkedchildren ranged from 1 to 16 μg/dL, with the mean and median levels of 4.8 and 4 μg/dL,respectively. The interquartile range was 3, with the 25th and 75th percentiles equal to 3 and6 μg/dL, respectively. Average EOG test scores were lower for children enrolled in the free orreduced lunch program, children whose parents had lower levels of education, and childrenwho were exposed to more lead. Black children were overrepresented in the “riskier” end ofeach of these variables.
Table 2 presents the results of the multivariate linear regression for reading EOG test scores,controlling for the covariates in Table 1 and individual school system variability. The referentgroup is defined as white, female students, enrolled in the Wake County School System, whodo not participate in the free or reduced lunch program, whose parents graduated high school,and who have a blood lead level equal to one. The coefficients of all the covariates are of theexpected signs. We tested for interaction between blood lead levels and parental education orenrollment status in the free and reduced lunch program, but no significant interactions werefound. We also tested for interaction between lead exposure and the age indicators, and again,the results were not significant. Therefore, to simplify interpretations, we did not include theinteractions in the final model.
Miranda et al. Page 4
Neurotoxicology. Author manuscript; available in PMC 2009 December 8.
NIH
-PA Author Manuscript
NIH
-PA Author Manuscript
NIH
-PA Author Manuscript

The coefficients of the indicator variables for each blood lead level are consistently negativeand statistically significant (all p < .0001). They generally increase in absolute magnitude asblood lead levels increase. Thus, these results demonstrate a strong and statistically significantdose-response effect between early childhood lead exposure and performance on elementaryschool achievement tests (i.e., the higher the early childhood lead exposure, the lower the EOGtest scores for the child).
Table 2 also demonstrates a strong and statistically significant dose-response effect betweenparental educational attainment and performance on elementary school achievement tests (i.e.,the more education completed by the parent, the higher the EOG test scores for the child).Parental educational attainment may be serving as a proxy for family socioeconomic status orparental IQ (or some combination of the two) (Mueller et al., 2001;Davis-Kean, 2005). Thecoefficient on participation in the free or reduced lunch program is negative and significant asexpected.
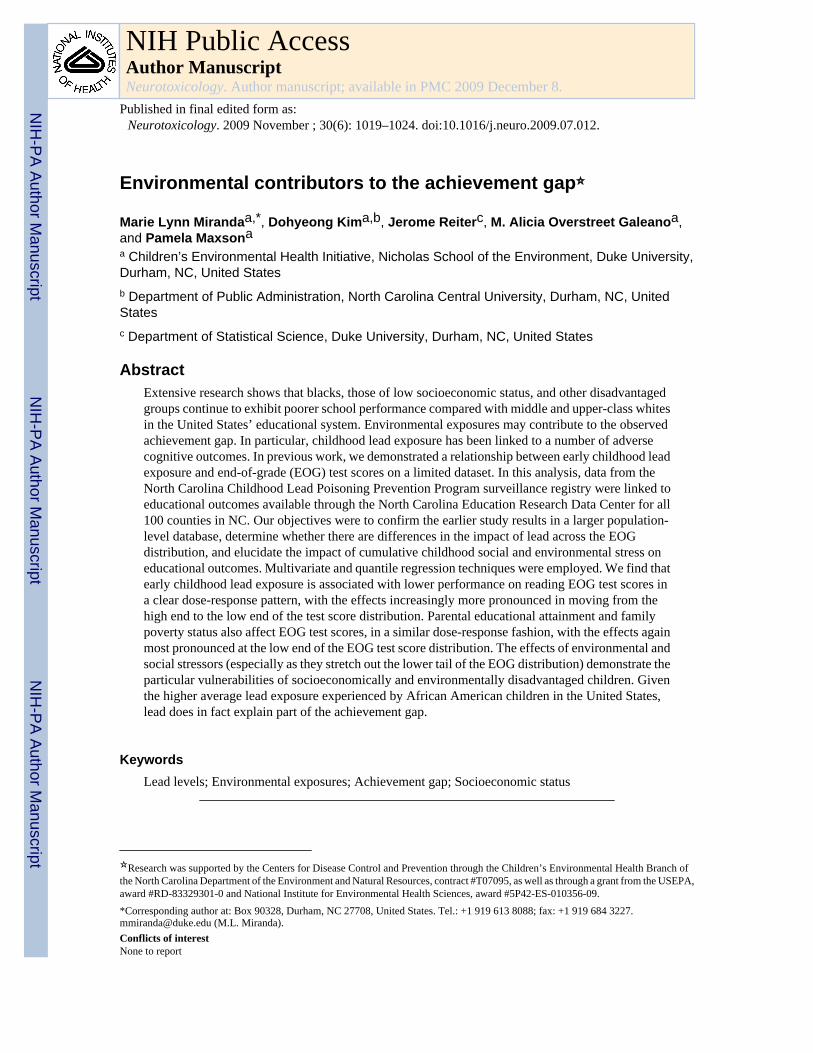
While the linear regression results provide interesting and important insights, they focus onstudy subjects at the mean of the EOG distribution curves. We are interested in both the topand bottom tails of the distribution: location on the top tail determines placement into advancedand intellectually gifted programs, and location on the bottom tail determines gradeadvancement and class placement. To understand how the environmental and social stressorsare affecting subjects/population located on different portions of the EOG curve, we employedquantile regression. Similar to the linear regression model, interaction effects among keyexplanatory variables were also tested in the quantile regression models, but were not foundto be significant. Fig. 1 displays three box and whiskers plots summarizing the results fromthe quantile regression.
The first panel of Fig. 1 displays the distributions of EOG scores for children at five differentblood lead levels. All five boxes are based on children not enrolled in free/reduced lunch andwhose parents completed high school. EOG scores generally decrease as blood lead levelsincrease. For all quantiles, the effects of increasing blood lead level from 1 μg/dL to any bloodlead level greater than 3 μg/dL are statistically significant (p < .05). The distributions forchildren with relatively high lead exposure are more spread out than those for children withrelatively low lead exposure (e.g., the difference between the 95th and 5th percentiles is 24.6for children with a blood lead level of 10 μg/dL or higher, and is 23.1 for children with a bloodlead level of 1 μg/dL). Most of this additional spread occurs on the low end of the EOGdistribution. For example, when going from a blood lead level of 1–10+ μg/dL, the 5thpercentile drops about 2.3 points whereas the 95th percentile drops only 0.8 points. Leadexposure stretches out the lower tail of the test score distribution by more than it moves themiddle portion or upper tail of the distribution. This differential effect is statistically significant(p = .04). Thus, lead effects may be even more potent in populations at the lower performanceregions of the EOG curve.
The second panel of Fig. 1 displays the distributions of EOG scores for children with differingparental education. All five boxes are based on children not enrolled in free/reduced lunch andwho have a BLL = 1 μg/dL. EOG scores tend to decrease with lower parental educationalattainment. For all quantiles, the effects of decreasing education level from any education levelmore than high school education to the level of less than high school education are statisticallysignificant (p < .05). The distributions for parents with comparatively low educationalattainment are more spread out than those for parents with higher educational attainment (e.g.,the difference between the 95th and 5th percentiles is 23.4 when parents have less than highschool education and is 20.7 when parents have graduate education). Akin to the effects of leadexposure, most of this additional spread occurs on the low end of the EOG distribution. Thereis an 8.0 point gap in the 95th percentile scores between parents who have less than high school
Miranda et al. Page 5
Neurotoxicology. Author manuscript; available in PMC 2009 December 8.
NIH
-PA Author Manuscript
NIH
-PA Author Manuscript
NIH
-PA Author Manuscript
education and parents who have graduate education, whereas the gap is 10.7 points in the 5thpercentile scores. This differential effect is statistically significant (p < .00001).
Fig. 1, in the last panel, displays the distributions of EOG scores for children enrolled or notenrolled in the free and reduced lunch program. Both boxes are based on children whose parentshave a high school degree only and who have a BLL = 1 μg/dL. EOG scores tend to be lowerfor children enrolled in the free and reduced lunch program (p < .05). The 95th percentile valuesfor the two groups differ by 1.7 points, whereas the 5th percentile values differ by 2.6 points.This differential effect is statistically significant (p = .0002).
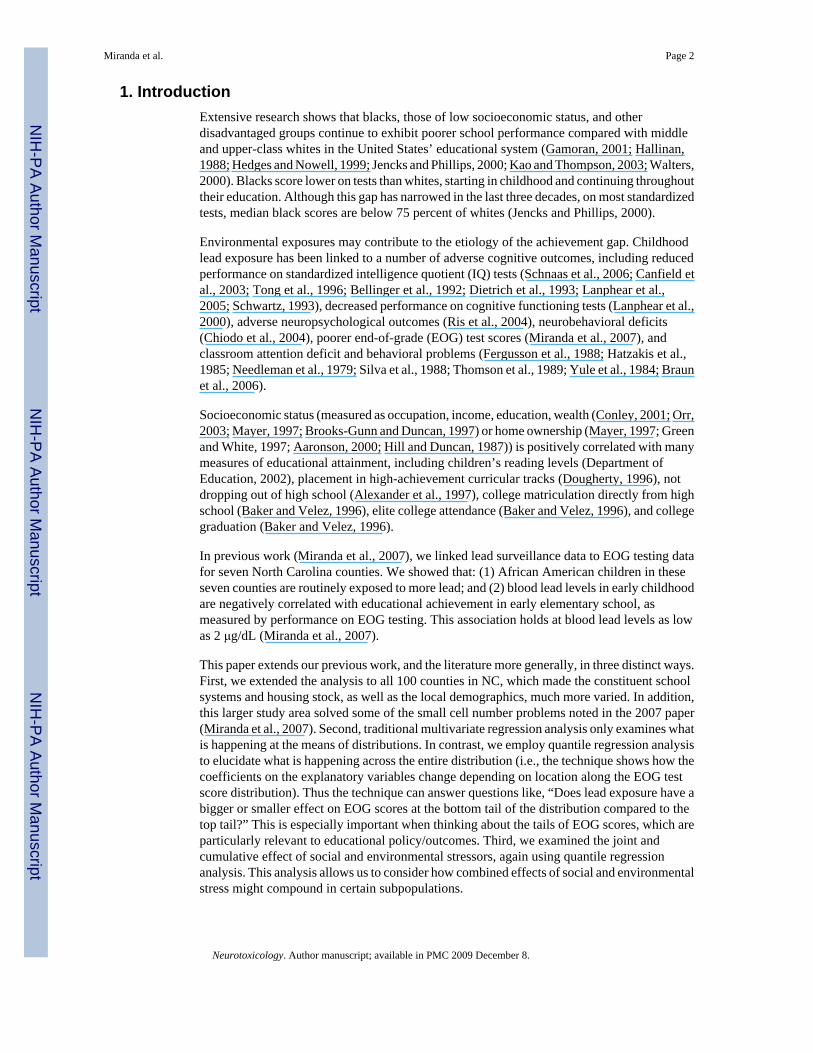
The negative effects shown in Fig. 1 are for each variable holding the other variables constant.Some children are subject to multiple risk factors that would affect test performance. This isillustrated in Fig. 2, which compares the percentiles of test scores for children who have “lowerrisk” values on all three variables (parents who have completed college, not enrolled in lunchprogram, and BLL = 1 μg/dL) with the percentiles of test scores for children who havecomparatively “higher risk” values on all three variables (parents who have only completedhigh school, enrolled in lunch program, and BLL = 5 μg/dL). For example, the 5th percentileof test scores for children in the “higher risk” group is about 10 points lower than the 5thpercentile of test scores for children in the “lower risk” group (shown in the first bar in Fig.2).
Fig. 2 reveals that parental education differences account for the largest part of the test scoredecrement at any percentile (58–65% of total decrement), and that the lunch program and leadexposure account for 25–28% and 7–16% of the total test score decrement, respectively. Ofcourse, as lead exposure increases, the proportion of the test score drop accounted for by leadexposure increases. Fig. 2 also highlights the trend seen in Fig. 1: deficits in these variablesimpact low percentiles of the test score distribution more than they impact high percentiles.Again, the combination of risk factors has a greater impact on the population at the lower endof the EOG distribution.
4. DiscussionExposure to lead does not just shift the EOG score distribution to the left. Rather, it shifts thedistribution to the left, pushes it down (i.e., introduces more variability), and stretches out thelower tail. Additional social factors, like low parental educational attainment or family poverty,can also shift the curve further to the left and stretch out the lower tail even more. Thus, childrenwho experience these cumulating deficits are especially disadvantaged when they enter theschool system. Given the higher average lead exposure experienced by African Americanchildren in the United States, lead does in fact explain part of the achievement gap.
In addition, as important as the lower tail of the distribution is, shifts at the upper tail are ofconcern as well. The use of EOG scores for placement into advanced and intellectually gifted(AIG) programs is ubiquitous in NC, and across the United States. Thus, at the high end of thedistribution, even low level lead exposure can push some children out of the score range thatwould make them eligible for these special programs. To the extent that low income andminority children are systematically exposed to more lead (U.S. GAO, 1999; Center for DiseaseControl and Prevention, 2005), then AIG programs become less economically and raciallydiverse (Gootman and Gebeloff, 2008).
Study limitations include the fact that not all children are screened for lead and, even amongthose who are screened for lead, not all can be linked to EOG test scores. In addition, we donot have measures of childhood iron deficiency, which tends to increase lead uptake and hasbeen linked to poorer neurodevelopmental outcomes. Measures of the quality of the home
Miranda et al. Page 6
Neurotoxicology. Author manuscript; available in PMC 2009 December 8.
NIH
-PA Author Manuscript
NIH
-PA Author Manuscript
NIH
-PA Author Manuscript
environment, including the availability of age-appropriate print materials, would alsostrengthen the analysis.
In future research, we hope to: include more years of EOG data in order to improve data linkagebetween the two administrative datasets; link our current data back the NC Vital Statisticsdetailed birth record data to provide another set of data relevant to child development; followthe same children over time, using subsequent performance on later-grade EOGs, to determinethe persistence of the effects found here; and undertake sibling studies to look at differentialimpacts within the same family. We also hope to include additional environmental exposures.
These results have meaningful implications for policymakers and researchers alike. First,roughly 26% of children aged 1–5 in the United States are estimated to have blood lead levelsgreater than or equal to 2 μg/dL, but <1% of children aged 1–5 have blood lead levels abovethe current Centers for Disease Control and Prevention (CDC) blood lead action level of 10μg/dL (National Center for Health Statistics, 2008). Policymakers and researchers can play asignificant role in lobbying the CDC scientific advisory group on lead to lower its current bloodlead action level. Second, results from childhood blood lead tests, which are typically providedto the pediatrician of record, serve as a very early signal that certain children would benefitsubstantially from early reading enrichment programs, including programs that simply engageparents in reading to their children. The efficacy of such enrichment activities is supported byrecent animal model research that indicates that enriched environments can ameliorate theneurobehavioral and neurochemical toxicity associated with early lead exposure (Schneider etal., 2001; Guilarte and Toscano, 2003). In addition, Bellinger and Rappaport (2002) outlinestrategies for evaluation and follow-up of lead-exposed children. Third, policymakers andresearchers have an important role to play in helping school systems both define and understandeligibility criteria for access to special educational resources—at both the low and high end ofthe distribution.
AcknowledgmentsThe authors thank Richard Auten and S. Philip Morgan for their comments and review of this manuscript.
AbbreviationsEOG end-of-grade
BLL blood lead level
NCERDC North Carolina Education Research Data Center
NCCLPPP North Carolina Childhood Lead Poisoning Prevention Program
ReferencesAaronson D. A note on the benefits of homeownership. Journal of Urban Economics 2000;47(3):356–
69.Alexander KL, Entwisle DR, Horsey CS. From first grade forward: early foundations of high school
dropout. Sociology of Education 1997;70:87–107.Baker TL, Velez W. Access to and opportunity in postsecondary education in the United States: a review.
Sociology of Education 1996;69:82–101.Bellinger, D.; Rappaport, L. Developmental assessment and interventions. In: Harvey, B., editor.
Managing elevated blood lead levels among young children: recommendations from the advisorycommittee on childhood lead poisoning prevention. Atlanta: CDC; 2002. p. 77-95.
Bellinger DC, Stiles KM, Needleman HL. Low-level lead exposure, intelligence and academicachievement: a long-term follow-up study. Pediatrics 1992;90(6):855–61. [PubMed: 1437425]
Miranda et al. Page 7
Neurotoxicology. Author manuscript; available in PMC 2009 December 8.
NIH
-PA Author Manuscript
NIH
-PA Author Manuscript
NIH
-PA Author Manuscript

Braun JM, Kahn RS, Froehlich T, Auinger P, Lanphear BP. Exposures to environmental toxicants andattention deficits hyperactivity disorder in U.S. children. Environmental Health Perspectives 2006;114(12):1904–9. [PubMed: 17185283]
Brooks-Gunn J, Duncan GJ. The effects of poverty on children. The Future of Children 1997;7(2):55–71. [PubMed: 9299837]
Canfield RL, Henderson CR, Cory-Slechta DA, Cox C, Jusko TA, Lanphear BP. Intellectual impairmentin children with blood lead concentrations below 10 μg per deciliter. New England Journal of Medicine2003;348(16):1517–26. [PubMed: 12700371]
Carey VJ, Yong FH, Frenkel LM, McKinney RE. Pediatric AIDS prognosis using somatic growthvelocity. AIDS 1998;12(11):1361–9. [PubMed: 9708417]
Center for Disease Control and Prevention. Blood lead levels: United States, 1999–2002. MMWR2005;54(20):513–6. [PubMed: 15917736]
Chiodo LM, Jacobson SW, Jacobson JL. Neurodevelopmental effects of postnatal lead exposure at verylow levels. Neurotoxicology and Teratology 2004;26(3):359–71. [PubMed: 15113598]
Conley D. Capital for college: parental assets and postsecondary schooling. Sociology of Education2001;74(1):59–72.
Davis-Kean PE. The influence of parent education and family income on child achievement: the indirectrole of parental expectations and the home environment. Journal of Family Psychology 2005;19(2):294–304. [PubMed: 15982107]
Department of Education US. No Child Left Behind: Closing the Achievement Gap in America’s Schools.[4/28/04] http://www.ed.gov/nclb/overview/welcome/closing/closing-the-gap.pdf2002
Dietrich KN, Berger OG, Succop PA, Hammond PB, Bornschein RL. The developmental consequencesof low to moderate prenatal and postnatal lead exposure: intellectual attainment in the CincinnatiLead Study Cohort following school entry. Neurotoxicology and Teratology 1993;15(1):37–44.[PubMed: 8459787]
Dougherty KJ. Opportunity-to-learn standards: a sociological critique. Sociology of Education1996;69:40–65.
Fergusson DM, Fergusson JE, Horwood LJ, Kinzett NG. A longitudinal study of dentine lead levels,intelligence, school performance and behaviour. Part III. Dentine lead levels and attention/activity.Journal of Child Psychology Psychiatry 1988;29(6):811–24.
Feudtner C, Silveira MJ, Shabbout M, Hoskins RE. Distance from home when death occurs: a population-based study of Washington State 1989–2002. Pediatrics 2006;117:932–9.
Gamoran A. American schooling and educational inequality: a forecast for the 21st century. Sociologyof Education 2001;74:135–53.
Gootman E, Gebeloff R. Gifted programs in the city are less diverse. The New York Times. 2008 June19;
Green RK, White MJ. Journal of Urban Economics 1997;41:441–61.Guilarte T, Toscano C. Environmental enrichment reverses cognitive and molecular deficits induced by
developmental lead exposure. Annals of Neurology 2003;53(1):50–6. [PubMed: 12509847]Hallinan MT. Equality of educational opportunity. Annual Review of Sociology 1988;14:249–68.Hatzakis, A.; Salaminios, F.; Kokevi, A. Blood lead and classroom behaviour of children in two
communities with different degree of lead exposure: evidence of a dose-related effect?. In: Lekkas,TD., editor. Heavy metals in the environment. Edinburgh: CEP Consultants; 1985. p. 4747
Hedges LV, Nowell A. Changes in the black–white gap in achievement test scores. Sociology ofEducation 1999;72:111–35.
Hill MS, Duncan GJ. Parental family income and the socioeconomic attainment of children. SocialScience Research 1987;16(1):39.
Jencks, C.; Phillips, M. America’s next achievement test: closing the black–white test score gap. In:Arum, R.; Beattie, I., editors. The structure of schooling: readings in the sociology of education.Mountain View: Mayfield Publishing; 2000. p. 319-25.
Kao G, Thompson JS. Racial and ethnic stratification in educational achievement and attainment. AnnualReview of Sociology 2003;29:417–42.
Miranda et al. Page 8
Neurotoxicology. Author manuscript; available in PMC 2009 December 8.
NIH
-PA Author Manuscript
NIH
-PA Author Manuscript
NIH
-PA Author Manuscript
Kim D, Overstreet Galeano MA, Hull A, Miranda ML. A framework for widespread replication of ahighly spatially resolved childhood lead exposure risk model. Environmental Health Persectives2008;116(12):1735–9.
Koenker, R. Quantile regression. Cambridge, UK: Cambridge University Press; 2005.Lal MK, Manktelow BN, Draper ES, Field DJ. Chronic lung disease of prematurity and intrauterine
growth retardation: a population-based study. Pediatrics 2003;111:483–7. [PubMed: 12612225]Lanphear BP, Byrd RS, Auinger P, Schaffer SJ. Community characteristics associated with elevated
blood lead levels in children. Pediatrics 1998;101(2):264–71. [PubMed: 9445502]Lanphear BP, Dietrich K, Auinger P, Cox C. Cognitive deficits associated with blood lead concentrations
<10 μg/dL in US children and adolescents. Public Health Reports 2000;115(6):521–9. [PubMed:11354334]
Lanphear BP, Hornung R, Khoury J, Yolton K, Baghurst P, Bellinger DC, et al. Low-level environmentallead exposure and children’s intellectual function: an international pooled analysis. EnvironmentalHealth Perspectives 2005;113(7):894–9. [PubMed: 16002379]
Mayer, S. What money can’t buy: family income and children’s life chances. Cambridge, MA: HarvardUniversity Press; 1997.
Miranda ML, Dolinoy DC, Overstreet MA. Mapping for prevention: GIS models for directing childhoodlead poisoning prevention programs. Environmental Health Perspectives 2002;110(9):947–53.[PubMed: 12204831]
Miranda ML, Kim D, Overstreet Galeano MA, Paul C, Hull A, Morgan SP. The relationship betweenearly childhood blood lead levels and performance on End of Grade Tests. Environmental HealthPerspectives 2007;115(8):1242–7. [PubMed: 17687454]
Mueller BA, Newton K, Holly EA, Preston-Martin S. Residential water source and the risk of childhoodbrain tumors. Environmental Health Perspectives 2001;109(6):551–6. [PubMed: 11445506]
NC Department of Public Instruction. North Carolina end-of-grade reading comprehension tests grades3–8. 2008. http://www.ncpublicschools.org/accountability/testing/eog/reading/
National Center for Health Statistics. National health and nutrition examination survey data 2005–2006.Hyattsville, MD: U.S. Department of Health and Human Services, Centers for Disease Control andPrevention; 2008.
Needleman HL, Gunnoe C, Leviton A, Reed R, Peresie H, Maher C, et al. Deficits in psychologic andclassroom performance of children with elevated dentine lead levels. New England Journal ofMedicine 1979;300(13):689–95. [PubMed: 763299]
Orr AJ. Black–white differences in achievement: the importance of wealth. Sociology of Education2003;76(4):281–304.
Ris MD, Dietrich KN, Succop PA, Berger OG, Bornschein RL. Early exposure to lead andneuropsychological outcome in adolescence. Journal of the International Neuropsychological Society2004;10:261–70. [PubMed: 15012846]
Schnaas L, Rothenberg SJ, Flores MF, Martinez S, Hernandez C, Osorio E, et al. Reduced intellectualdevelopment in children with prenatal lead exposure. Environmental Health Perspectives 2006;114(5):791–7. [PubMed: 16675439]
Schneider JS, Lee MH, Anderson DW, Zuck L, Lidsky TI. Enriched environment during developmentis protective against lead-induced neurotoxicity. Brain Research 2001;896(1–2):48–55. [PubMed:11277972]
Schwartz J. Beyond LOEL’s, p values, and vote counting: methods for looking at the shapes and strengthsof associations. Neurotoxicology 1993;14(2–3):237–46. [PubMed: 8247397]
Silva PA, Hughes P, Williams S, Faed JM. Blood lead, intelligence, reading attainment, and behaviourin eleven year old children in Dunedin, New Zealand. Journal of Child Psychology and Psychiatry1988;29:43–52. [PubMed: 3350882]
Thomson GO, Raab GM, Hepburn WS. Blood-lead levels and children’s behaviour: results from theEdinburgh Lead Study. Journal of Child Psychology and Psychiatry 1989;30:515–28. [PubMed:2768355]
Tong S, Baghurst P, McMichael A, Sawyer M, Mudge J. Lifetime exposure to environmental lead andchildren’s intelligence at 11–13 years: the Port Pirie cohort study. British Medical Journal 1996;312(7046):1569–75. [PubMed: 8664666]
Miranda et al. Page 9
Neurotoxicology. Author manuscript; available in PMC 2009 December 8.
NIH
-PA Author Manuscript
NIH
-PA Author Manuscript
NIH
-PA Author Manuscript
U.S. GAO. Lead poisoning: federal health care programs are not effectively reaching at-risk children.Washington, DC: United States General Accounting Office; 1999.
Walters, PB. The limits of growth: school expansion and school reform in historical perspective. In:Hallinan, MT., editor. Handbook of the sociology of education. New York: Kluwer Academic/Plenum Publishers; 2000. p. 241-61.
Yule W, Urbanowicz MA, Lansdown R. Teachers’ ratings of children’s behaviour in relation to bloodlead levels. British Journal of Developmental Psychology 1984;2:295–305.
Miranda et al. Page 10
Neurotoxicology. Author manuscript; available in PMC 2009 December 8.
NIH
-PA Author Manuscript
NIH
-PA Author Manuscript
NIH
-PA Author Manuscript
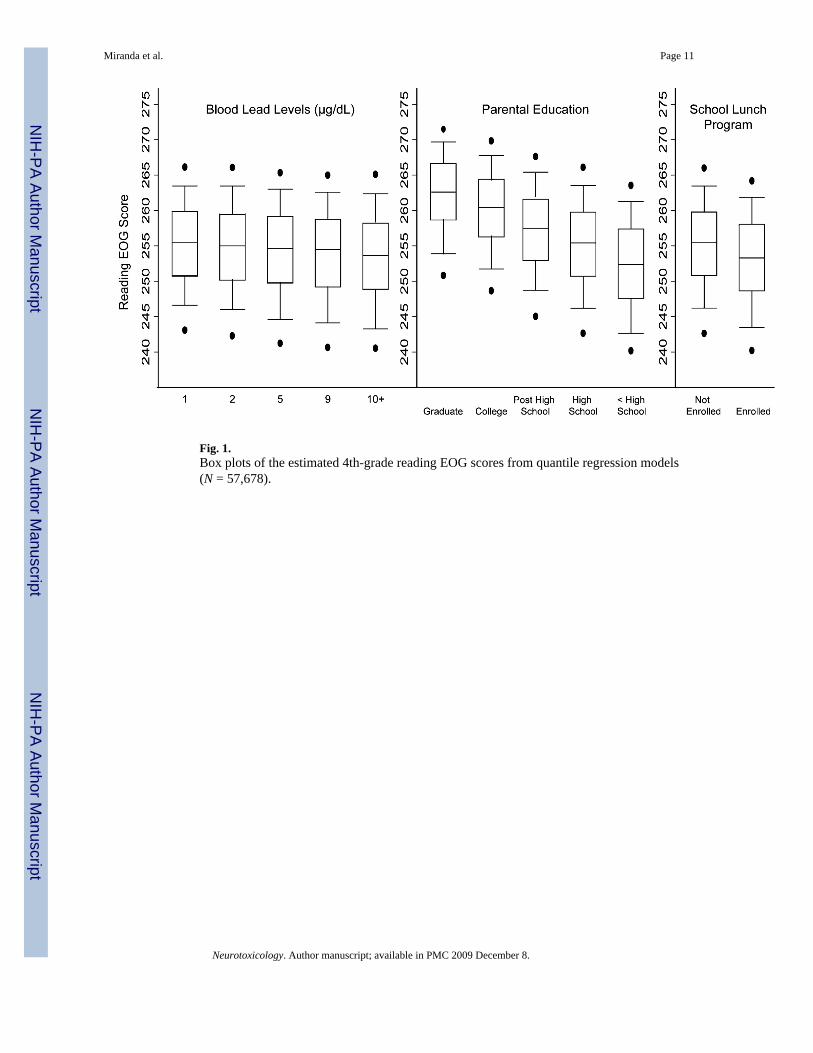
Fig. 1.Box plots of the estimated 4th-grade reading EOG scores from quantile regression models(N = 57,678).
Miranda et al. Page 11
Neurotoxicology. Author manuscript; available in PMC 2009 December 8.
NIH
-PA Author Manuscript
NIH
-PA Author Manuscript
NIH
-PA Author Manuscript
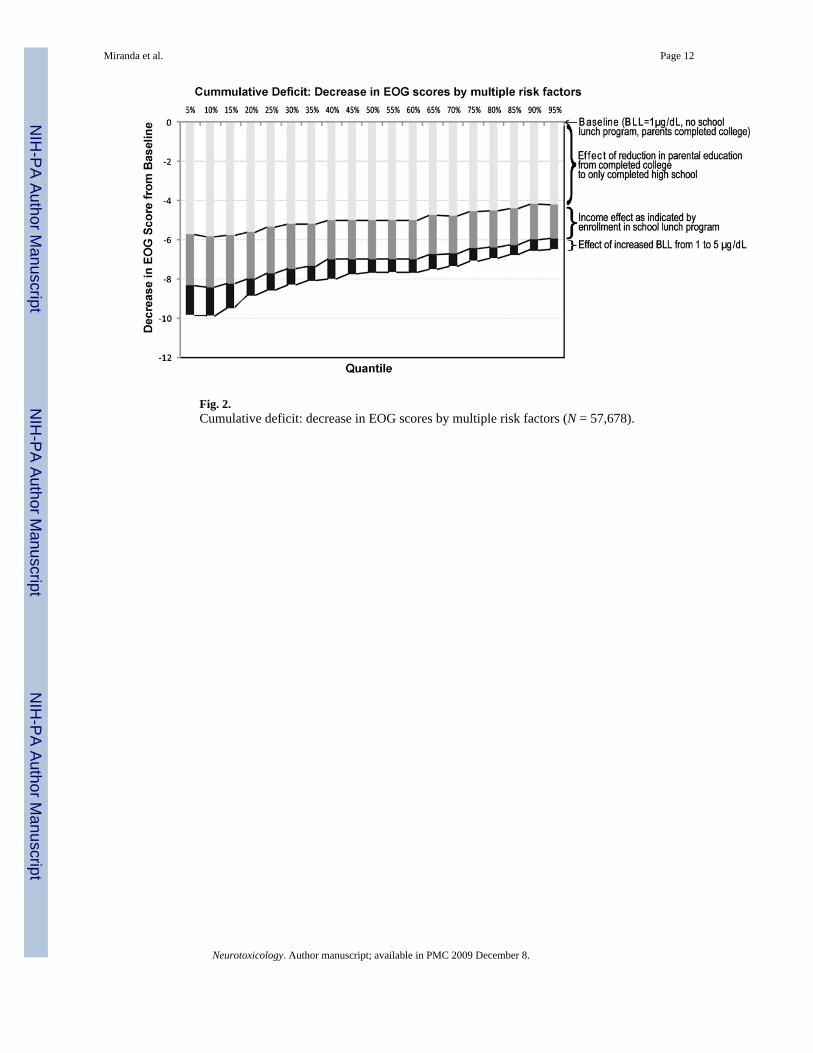
Fig. 2.Cumulative deficit: decrease in EOG scores by multiple risk factors (N = 57,678).
Miranda et al. Page 12
Neurotoxicology. Author manuscript; available in PMC 2009 December 8.
NIH
-PA Author Manuscript
NIH
-PA Author Manuscript
NIH
-PA Author Manuscript
NIH
-PA Author Manuscript
NIH
-PA Author Manuscript
NIH
-PA Author Manuscript
Miranda et al. Page 13Ta
ble
1
Sum
mar
y st
atis
tics o
n su
bgro
ups i
n th
e fin
al li
nked
4th
-gra
de re
adin
g da
tase
t for
100
cou
ntie
s in
NC
(N =
57,
678)
.
Var
iabl
eSu
bcat
egor
yA
vg. r
eadi
ng E
OG
Prop
ortio
n (%
)
Ove
rall
Bla
ckW
hite
Rac
eW
hite
254.
656
.9B
lack
248.
543
.1H
ouse
hold
inco
me
Not
enr
olle
d in
free
/redu
ced
lunc
h pr
ogra
m25
5.3
47.1
21.2
66.8
Enro
lled
in fr
ee/re
duce
d lu
nch
prog
ram
249.
052
.978
.833
.2Pa
rent
al e
duca
tion
Com
plet
ed g
radu
ate
scho
ol26
0.1
3.5
0.9
5.4
Com
plet
ed c
olle
ge25
7.2
18.5
9.8
25.1
Som
e po
st-h
igh
scho
ol e
duca
tion
252.
724
.623
.725
.2C
ompl
eted
hig
h sc
hool
249.
845
.355
.537
.7So
me
high
scho
ol e
duca
tion
246.
58.
110
.16.
6B
lood
lead
leve
lsB
LL o
f 1 μ
g/dL
254.
46.
73.
78.
8B
LL o
f 2 μ
g/dL
253.
813
.49.
116
.7B
LL o
f 3 μ
g/dL
253.
018
.514
.321
.6B
LL o
f 4 μ
g/dL
252.
317
.817
.218
.3B
LL o
f 5 μ
g/dL
251.
414
.115
.613
.0B
LL o
f 6 μ
g/dL
250.
610
.112
.48.
3B
LL o
f 7 μ
g/dL
250.
26.
78.
95.
0B
LL o
f 8 μ
g/dL
249.
64.
15.
92.
8B
LL o
f 9 μ
g/dL
249.
82.
53.
61.
8B
LL o
f 10 μg
/dL
or h
ighe
r24
8.7
6.1
9.3
3.7
Neurotoxicology. Author manuscript; available in PMC 2009 December 8.

NIH
-PA Author Manuscript
NIH
-PA Author Manuscript
NIH
-PA Author Manuscript
Miranda et al. Page 14
Table 2
Results of multivariate linear regression for 4th-grade reading EOG score data (N = 57,678)a.
Response variable: 4th-grade reading EOG scoreb Coef.p > t 95% confidence interval
Dummy for BLL equal to 2 μg/dL −0.300.04 (−0.58, −0.01)Dummy for BLL equal to 3 μg/dL −0.460.00 (−0.73, −0.19)Dummy for BLL equal to 4 μg/dL −0.520.00 (−0.79, −0.24)Dummy for BLL equal to 5 μg/dL −0.800.00 (−1.08, −0.51)Dummy for BLL equal to 6 μg/dL −0.990.00 (−1.29, −0.68)Dummy for BLL equal to 7 μg/dL −1.070.00 (−1.40, −0.74)Dummy for BLL equal to 8 μg/dL −1.350.00 (−1.73, −0.97)Dummy for BLL equal to 9 μg/dL −1.200.00 (−1.64, −0.75)Dummy for BLL equal to 10 μg/dL or higher −1.750.00 (−2.09, −1.41)Screened for lead between 18 and 27 months of age 0.360.61 (−0.10, 0.17)Screened for lead between 27 and 36 months of age −0.610.00 (−0.78, −0.43)Black (1 for black; 0 for white) −3.550.00 (−3.71, −3.40)Male (1 for male; 0 for female) −1.500.00 (−1.62, −1.38)Enrolled in free or reduced lunch program −2.090.00 (−2.24, −1.94)Parents with some high school education −2.780.00 (−3.01, −2.55)Parents with some post-high school education 2.000.00 (1.84, 2.15)Parents completed college 4.940.00 (4.75, 5.12)Parents completed graduate school 7.120.00 (6.77, 7.47)Charter schools −2.580.00 (−3.06, −2.10)Constant 255.030.00 (254.67, 255.39)
aThe individual school system level dummy variables (N = 114) are not presented.
bThe mean 4th-grade reading EOG score for this sample is 251.9, the median 252, and the standard deviation 8.5. The interquartile range was 12.
Neurotoxicology. Author manuscript; available in PMC 2009 December 8.