BinSign: Fingerprinting Binary Functions to Support ... - Hal-Inria

Increasing Accuracy and Throughput in Large-ScaleMicrosatellite Fingerprinting of Cacao FieldGermplasm Collections
Lambert A. Motilal & Dapeng Zhang &
Pathmanathan Umaharan & Sue Mischke &
Michel Boccara & Stephen Pinney
Received: 6 April 2008 /Accepted: 15 September 2008# Springer Science + Business Media, LLC 2008
Abstract In this study we report on increasing the rate andaccuracy of microsatellite fingerprinting of accessions inTheobroma cacao L. field germplasm collections with amedium-throughput capillary sequencing system. We exam-ined the use of a reduced number of microsatellite loci todecrease the time and materials required for fingerprintingand determined the best available microsatellite loci foraccurately separating accessions. A subset of nine informa-tive loci that could separate sixty accessions into the samegenetic groupings as a complete set of 37 loci was found.Stringent probability of identity values (i.e. chance of uniqueaccession) was highly influenced (r=−0.996; P<0.001) bythe number of alleles utilised in the fingerprinting set butthe composition of the primer set was more important whenchoosing discriminatory loci. DNA pooling to reduce thenumber of samples was also investigated. There was arelatively high level of mixture within plots (59% of 54plots examined) of the field genebank, which opposed the
use of a pooling strategy to fingerprint the multiple trees ofan accession plot in the collection.
Keywords Discriminatory loci . Germplasm . Identityresolution . SSR fingerprinting . Theobroma cacao L.
AbbreviationsADO allele drop outAFLP amplified fragment length polymorphismANOVA analysis of varianceCATIE Centro Agronomico Tropical de
Investigacion y Enseñanza, TurrialbaCE capillary electrophoresisDNA deoxyribonucleic acidEMBL European Molecular Biology LaboratoryHo observed heterozygosityHe expected heterozygosityICG,T International Cocoa Genebank, TrinidadMPP microsatellite primer pairPCR polymerase chain reactionPIC polymorphism information contentP(ID)sib probability of identity among full siblingsP(ID)sib COM overall probability of identity among full
siblingsRAPD randomly amplified polymorphic DNASDW sterile deionised waterSSR simple sequence repeat
Introduction
Cacao (Theobroma cacao L.), the source of chocolate andcocoa butterfat, possesses recalcitrant seeds and is anout-crossing species [75] leading to its conservation as
Tropical Plant Biol.DOI 10.1007/s12042-008-9016-z
L. A. Motilal (*) :M. BoccaraCocoa Research Unit, The University of the West Indies,St. Augustine, Trinidad, Rep. Trinidad and Tobago, West Indiese-mail: [email protected]
D. Zhang : S. Mischke : S. PinneyUSDA-ARS, BARC, PSI, SPCL,10300 Baltimore Ave., Bldg. 001, BARC-West,Beltsville, MD 20705, USA
P. UmaharanFaculty of Science and Agriculture, Department of Life Sciences,The University of the West Indies,St. Augustine, Trinidad, Rep. Trinidad and Tobago, West Indies
M. BoccaraCIRAD - UMR DAP TA A96/03,34398 Montpellier cedex 5, France
clonally propagated trees within field genebanks. Sincethe ‘discovery’ of this crop, cacao germplasm has beensought from South and Central America, wherein residesthe centre of diversity [16, 75, 13, 7]. Over fifty-fourcacao germplasm collections are present worldwide andonly two of these are Universal Collections (representingnearly all of the known genetic diversity) — CentroAgronomico Tropical de Investigacion y Enseñanza,Turrialba (CATIE) in Costa Rica and the InternationalCocoa Genebank, Trinidad (ICG,T) in Trinidad andTobago [51, 73]. The ICG,T is one of the largest cacaogermplasm collections containing over 2,000 accessions,with each accession being represented by a maximum of16 trees and an average of six trees. Formally planned in1982, the gene bank was assembled from germplasmmaterial collected in multiple expeditions (1930 onwards)from Amazonian South America, Central America and theWest Indies [31]. The ICG,T contains wild, semi-wild andcultivated material and includes germplasm from therecognised Criollo, Forastero, Refractario and Trinitariogermplasm groupings.
Mislabelled plants have been identified as a seriousproblem in germplasm collections [26]. The impact ofduplication in germplasm collections and its estimation wasdiscussed by Van Hintum [72]. Errors within germplasmcollections have been reported for French olive [32],Tunisian fig [57] and persimmon [3] using RandomlyAmplified Polymorphic DNAs (RAPDs); Cicer usingAmplified Fragment Length Polymorphisms (AFLPs;[62]); Eucalyptus with AFLPs and RAPDs [70]; Moroccanfig using inter-simple sequence repeats and SimpleSequence Repeats (SSRs; [33]) and poplar germplasm withAFLPs and SSRs [21]. Cacao germplasm collections werelikewise shown to contain mislabelled individuals [20, 12,56, 51, 50, 65]. In Trinidad, mislabelling can be attributedto the multiplicity of introductions and transfers of plantsfrom point of collection to establishment in early holdingsites, and to the subsequent recollection of budwood andrepropagation of material for establishment of the ICG,T.The potential for human error during plot demarcations andplanting may have also led to identity confusion among andwithin accession plots.
Mislabelling issues can be resolved by multilocusfingerprinting. A variety of molecular markers areavailable, and microsatellite markers are well suitedsince they are co-dominant (thus allowing the detectionof heterozygotes), found throughout the genome andhave high allelic variability [55]. In addition, SSRs arerelatively fast and easy to analyse compared to otherDNA markers [48]. Cacao microsatellites developed byLanaud et al. [37] have been extensively utilised for cacaoclone identification [20, 11, 56, 50, 15] with 15 micro-satellite primer pairs (MPPs; [58]) being recommended
for resolution of identity issues. Cacao germplasm havebeen assessed with eleven loci ([60]; 94 accessions), 14loci ([29]; 69 Trinitario accessions) and 15 loci ([77]; 141accessions).
Unambiguous identification of individuals within agermplasm collection is, however, a large-scale projectrequiring allocation of substantial resources and time. Thereare approximately 12,000 trees (2,000 accessions × sixpropagated trees) to be evaluated over 15 loci (resulting in360,000 data points). Hence, any effort to resolve identityissues in a more timely and cost-effective manner would bewelcomed by users of the ICG,T.
One way of achieving this is by reducing the number ofmicrosatellite loci required for detecting mislabelling in thegermplasm collection. Microsatellites with many alleles perlocus would favour unique fingerprinting of a large numberof accessions by relatively few loci [43]. Kottapalli et al.[36] in a study of 112 peanut accessions with 67 SSRmarkers found that a subset of 12 markers was sufficient foridentification and gave similar clustering pattern. SixteenSSR loci were sufficient to completely identify 96 sorghumaccessions [1]. Ninety cowpea [Vigna unguiculata (L.)Walp] breeding lines could be 97.8% resolved with fiveSSR primers [38]. In addition, many other cacao micro-satellites have been identified since the recommendation ofSaunders et al. [58], and therefore other MPPs may be moreuseful than the set that was initially proposed.
Another method involves bulking samples from trees ofa given accession thereby reducing the total number ofsamples to be identified. DNA pooling is a useful, cost-effective tool for large scale studies including associationstudies [61, 5, 46], single nucleotide polymorphismidentification [4, 52, 76], mapping of quantitative trait loci[28]; identification of markers for disease resistance [45]and determination of frequencies of microsatellite alleles[53, 17, 63]. DNA pooling was also applied in geneticdiversity studies with RAPDs [23], restriction fragmentlength polymorphisms [18] AFLPs [35] and in cacaomicrosatellite characterization [14].
Large datasets of natural populations are prone to erroraccumulation [41] even with high-throughput genotyping[19]. Microsatellite genotyping errors are recognised tooccur [9, 22, 25] and several approaches to reduce this errorhave been documented [25] including repeat genotyping[68, 69] and the mismatch tolerant approach [44, 30] with acombination of these two being recommended for cacaogermplasm management [77]. Barratt et al. [6] recom-mended pooling 50 individuals to balance accuracy andcost for SNP genotyping. Zou and Zhao [78] demonstratedthat measurement errors had a greater effect on DNApooling than genotyping errors had on individual geno-typing and that there was a high degree of false positiveswith DNA pooling.
Tropical Plant Biol.

This study was therefore undertaken to determine (i) thecomposition and minimum number of microsatellite locirequired for an accelerated yet reliable fingerprintingprotocol of individuals within a cacao germplasm collectionand (ii) the feasibility of using DNA pooling for assessingthe homogeneity of accession plots that contain more thanone tree.
Results
Microsatellite Assessment
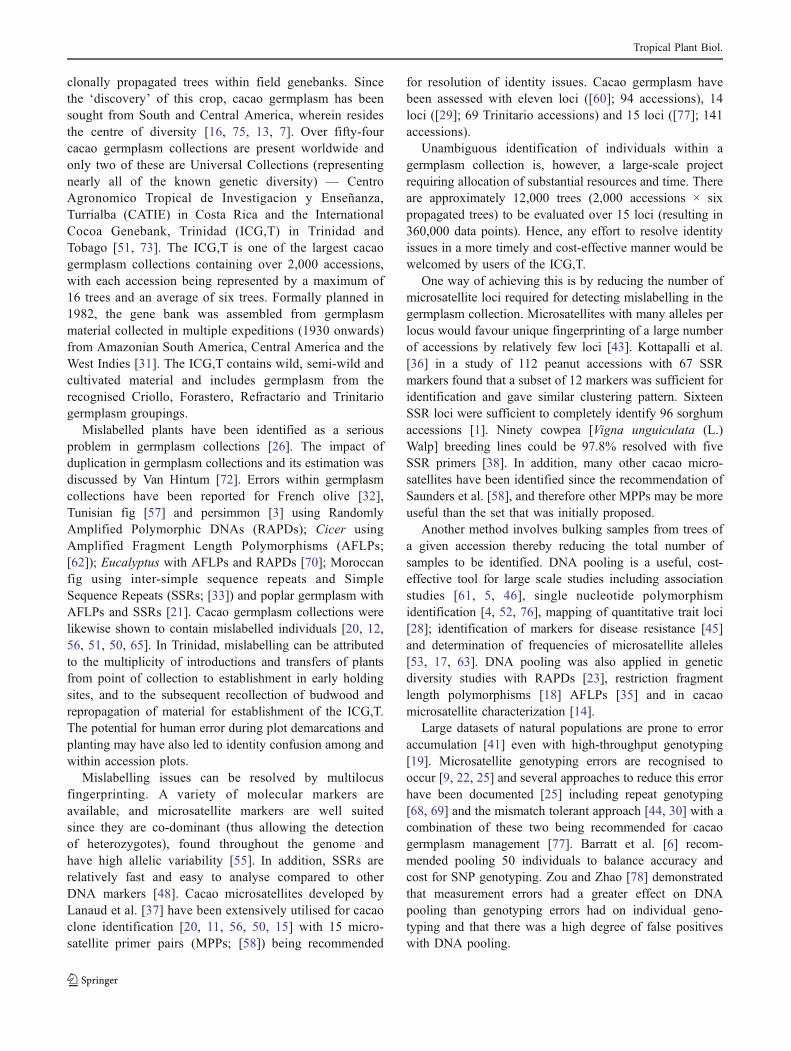
Under the experimental conditions used in this study, allPCR products of the 37 MPPs were devoid of false alleles.Six SSRs (mTcCIR 11, 17, 33, 45, 56 and 210) had anADO of at least 0.5, but 14 SSRs with an ADO of not morethan 0.15 were relatively error-free. Additional charac-teristics of the individual SSR loci based on the sixtyaccessions utilised in this study are provided in Table 1.Allele number, observed heterozygosity (Ho), expectedheterozygosity (He), PIC, P(ID)sib and ln S2 were notsignificantly affected by interruption of the repeat (imper-fect vs. perfect) or complexity of the repeat (compound vs.simple) in dimeric loci.
When microsatellite sets were compared, the P(ID)sibCOMand the separation ability were found to be significantly(P<0.001) dependent on the number of alleles involved(Figs. 1 and 2). Correlation coefficients of −0.996 and0.997 were obtained respectively for these comparisons. Atotal of 326 alleles were obtained from 37 loci, whichresolved the 60 cacao accessions into 54 (90%) groups. Sixpairs of accessions were unresolved: AC 20 vs. IB 9, BC 3vs. HF 8, CRIOLLO 22 vs. IB 2, NA 184 vs. NA 331, NA432 vs. NA 680 and NA 831 vs. NA 833. The set ofprimers currently in use for cacao fingerprinting [58]separated the 60 accessions into 47 (78.3%) groups. Theadditional accessions that were unresolved with the latterprimer set were comprised of only NA accessions, whichare known to be comprised of several sib families. Oneadditional pair was added (NA 406 vs. NA 528) and sixother NA accessions (NA 266, NA 435, NA 504, NA 734,NA 773 and NA 860) were lumped into the same group asNA 184 and NA 331.
The separation ability of a primer set was also influencedby its composition, and several sets yielded the sameseparation for a wide range of allele numbers (Table 2).Primer combinations comprising the most informative loci,as ranked by GIMLET v.1.3.3 [71], performed as well asthose recommended by Saunders et al. [58] even though theset included less loci and had a lower total number ofalleles (Fig. 3). An equivalent separation of the sixtyaccessions with nine loci, as compared to that with 37 loci,
was achieved. These loci were: (a) Group 1 — mTcCIR15,mTcCIR26, mTcCIR37; (b) Group 2 — mTcCIR33,mTcCIR57, mTcCIR42 and (c) Group 3 — mTcCIR12,mTcCIR243, mTcCIR244. Each group represent a triosuitable for post-PCR multiplexing based on allele rangesobtained in this study. In this set of nine loci, a total of 101alleles were found, with a combined P(ID) of 8.886×10
−12
and a P(ID)sibCOM of 1.437×10⁻⁴. The latter was a hundred-fold increase compared to that obtained (2.233×10⁻⁶) fromthe set of 15 loci recommended by Saunders et al. [58]. Therelationship among the sixty accessions is represented inFig. 4.
Effect of DNA pooling on Allele Sizing
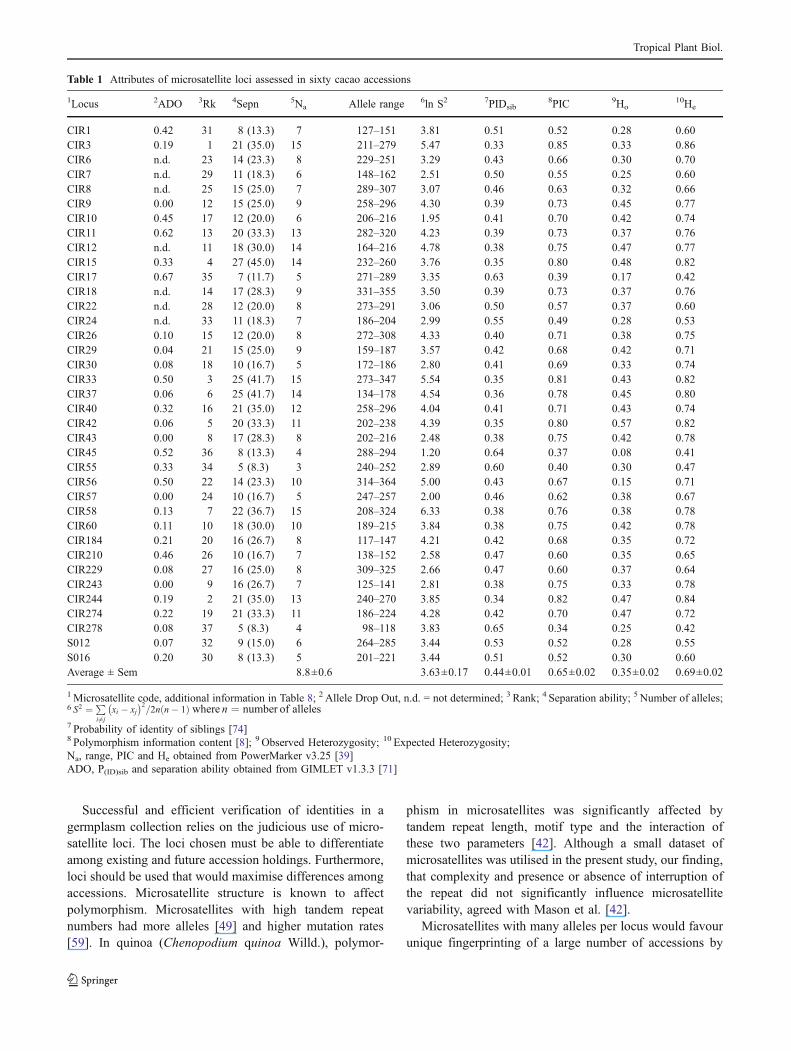
All DNA pools were amplified with minimal backgroundnoise. Selecting peaks for binning analysis was primer-dependent, being easiest with mTcCIR37 and most difficultwith mTcCIR15. A high level of consistency was achievedbetween scorers (Table 3). Type I error was low and wasencountered by one scorer for mTcCIR37 when four DNAsamples were pooled (three of eight assessments) and formTcCIR15 for pools of two (three of 15 assessments) andthree (three of 16 assessments) individuals. Type II errorwas more common being reported, by both scorers, inseven out of nine MPP-pool combinations. Type II errorswere attributed to the type of MPP (P=0.001), number ofDNA samples pooled (P<0.01) and the interaction of thesetwo terms (P<0.05). The SSRs mTcCIR15 and mTcCIR26were primarily responsible for these effects when amplify-ing pools of three or four individuals. The total number ofalleles called was significantly affected by the MPP used(P<0.05) but all alleles scored were correctly identified(Table 4).
ICG,T Plot Homogeneity
The 54 plots examined contained 22 homogenous samples(40.7%) and 32 (59.3%) mixed plots with sixteen plots(29.6%) having two genotypes (Table 5). Analysed plotsthat contained at least three trees had a mixed compositionof genetic identities in 65.9% (29 of 44 plots) of the plots(Fig. 5).
Discussion
This study examined the possibility of accelerating verifi-cation of identities in gene banks, with reduced genotypingerror, by (1) decreasing the number of loci by identificationof loci which were most efficient at differentiating cacaoaccessions and (2) decreasing the number of samples byutilising pooled samples
Tropical Plant Biol.
Successful and efficient verification of identities in agermplasm collection relies on the judicious use of micro-satellite loci. The loci chosen must be able to differentiateamong existing and future accession holdings. Furthermore,loci should be used that would maximise differences amongaccessions. Microsatellite structure is known to affectpolymorphism. Microsatellites with high tandem repeatnumbers had more alleles [49] and higher mutation rates[59]. In quinoa (Chenopodium quinoa Willd.), polymor-
phism in microsatellites was significantly affected bytandem repeat length, motif type and the interaction ofthese two parameters [42]. Although a small dataset ofmicrosatellites was utilised in the present study, our finding,that complexity and presence or absence of interruption ofthe repeat did not significantly influence microsatellitevariability, agreed with Mason et al. [42].
Microsatellites with many alleles per locus would favourunique fingerprinting of a large number of accessions by
Table 1 Attributes of microsatellite loci assessed in sixty cacao accessions
1Locus 2ADO 3Rk 4Sepn 5Na Allele range 6ln S2 7PIDsib8PIC 9Ho
10He
CIR1 0.42 31 8 (13.3) 7 127–151 3.81 0.51 0.52 0.28 0.60CIR3 0.19 1 21 (35.0) 15 211–279 5.47 0.33 0.85 0.33 0.86CIR6 n.d. 23 14 (23.3) 8 229–251 3.29 0.43 0.66 0.30 0.70CIR7 n.d. 29 11 (18.3) 6 148–162 2.51 0.50 0.55 0.25 0.60CIR8 n.d. 25 15 (25.0) 7 289–307 3.07 0.46 0.63 0.32 0.66CIR9 0.00 12 15 (25.0) 9 258–296 4.30 0.39 0.73 0.45 0.77CIR10 0.45 17 12 (20.0) 6 206–216 1.95 0.41 0.70 0.42 0.74CIR11 0.62 13 20 (33.3) 13 282–320 4.23 0.39 0.73 0.37 0.76CIR12 n.d. 11 18 (30.0) 14 164–216 4.78 0.38 0.75 0.47 0.77CIR15 0.33 4 27 (45.0) 14 232–260 3.76 0.35 0.80 0.48 0.82CIR17 0.67 35 7 (11.7) 5 271–289 3.35 0.63 0.39 0.17 0.42CIR18 n.d. 14 17 (28.3) 9 331–355 3.50 0.39 0.73 0.37 0.76CIR22 n.d. 28 12 (20.0) 8 273–291 3.06 0.50 0.57 0.37 0.60CIR24 n.d. 33 11 (18.3) 7 186–204 2.99 0.55 0.49 0.28 0.53CIR26 0.10 15 12 (20.0) 8 272–308 4.33 0.40 0.71 0.38 0.75CIR29 0.04 21 15 (25.0) 9 159–187 3.57 0.42 0.68 0.42 0.71CIR30 0.08 18 10 (16.7) 5 172–186 2.80 0.41 0.69 0.33 0.74CIR33 0.50 3 25 (41.7) 15 273–347 5.54 0.35 0.81 0.43 0.82CIR37 0.06 6 25 (41.7) 14 134–178 4.54 0.36 0.78 0.45 0.80CIR40 0.32 16 21 (35.0) 12 258–296 4.04 0.41 0.71 0.43 0.74CIR42 0.06 5 20 (33.3) 11 202–238 4.39 0.35 0.80 0.57 0.82CIR43 0.00 8 17 (28.3) 8 202–216 2.48 0.38 0.75 0.42 0.78CIR45 0.52 36 8 (13.3) 4 288–294 1.20 0.64 0.37 0.08 0.41CIR55 0.33 34 5 (8.3) 3 240–252 2.89 0.60 0.40 0.30 0.47CIR56 0.50 22 14 (23.3) 10 314–364 5.00 0.43 0.67 0.15 0.71CIR57 0.00 24 10 (16.7) 5 247–257 2.00 0.46 0.62 0.38 0.67CIR58 0.13 7 22 (36.7) 15 208–324 6.33 0.38 0.76 0.38 0.78CIR60 0.11 10 18 (30.0) 10 189–215 3.84 0.38 0.75 0.42 0.78CIR184 0.21 20 16 (26.7) 8 117–147 4.21 0.42 0.68 0.35 0.72CIR210 0.46 26 10 (16.7) 7 138–152 2.58 0.47 0.60 0.35 0.65CIR229 0.08 27 16 (25.0) 8 309–325 2.66 0.47 0.60 0.37 0.64CIR243 0.00 9 16 (26.7) 7 125–141 2.81 0.38 0.75 0.33 0.78CIR244 0.19 2 21 (35.0) 13 240–270 3.85 0.34 0.82 0.47 0.84CIR274 0.22 19 21 (33.3) 11 186–224 4.28 0.42 0.70 0.47 0.72CIR278 0.08 37 5 (8.3) 4 98–118 3.83 0.65 0.34 0.25 0.42S012 0.07 32 9 (15.0) 6 264–285 3.44 0.53 0.52 0.28 0.55S016 0.20 30 8 (13.3) 5 201–221 3.44 0.51 0.52 0.30 0.60Average ± Sem 8.8±0.6 3.63±0.17 0.44±0.01 0.65±0.02 0.35±0.02 0.69±0.02
1Microsatellite code, additional information in Table 8; 2 Allele Drop Out, n.d. = not determined; 3 Rank; 4 Separation ability; 5 Number of alleles;6 S2 ¼ P
i6¼jxi � xj� �2
=2n n� 1ð Þ where n ¼ number of alleles7 Probability of identity of siblings [74]8 Polymorphism information content [8]; 9 Observed Heterozygosity; 10 Expected Heterozygosity;Na, range, PIC and He obtained from PowerMarker v3.25 [39]ADO, P(ID)sib and separation ability obtained from GIMLET v1.3.3 [71]
Tropical Plant Biol.

relatively few loci [43]. Abu Assar et al. [1] found that 16loci with 117 polymorphic bands separated each of 96sorghum (Sorghum bicolour (L.) Moench) accessions.Khadari et al. [33] found that 18 genotype pairs of 75 fig(Ficus carica L.) accessions were unresolved when 38 SSRalleles from six loci were utilised. Aranzana et al. [2]obtained at least 87% individual identification with 113alleles from 16 loci on 212 peach (Prunus persica (L.)Batsch) cultivars. These results and the present studyconfirm that the number of alleles is a good discriminatoryfactor for individual resolution. In addition, our findingsindicated that while a high probability value was stronglycorrelated with increased allele number this was not the
exclusive factor in separating accessions from each other.The combination of loci chosen was also important whichagreed with that found for closely related bread wheatcultivars [40].
Results of the primer survey revealed that the 15 primersrecommended by Saunders et al. [58] were good discrim-inatory loci and that eight of these (mTcCIR 11, 12, 15, 18,26, 33, 37 and 60) were the most useful. However, this setof 15 primers was not the best set to detect mislabelledindividuals in the ICG,T where each germplasm group isrepresented by several families, as exemplified by thereduced ability to resolve NA genotypes. Risterucci et al.[56] suggested, from a small study of 20 genotypes and 19
Fig. 1 Probability of identityamong relatives (P(ID)sib) as afunction of allele number.Thirty-seven loci in 244 differ-ing combinations were assessedon sixty Theobroma cacao L.accessions
Fig. 2 Influence of allele num-ber on the separation ability of244 microsatellite combinationsin sixty Theobroma cacao L.accessions Separation abilitywas calculated as a percentagesuccess relative to that obtainedfrom the full complement of37 loci
Tropical Plant Biol.

loci, that 15 loci would be sufficient for cacao fingerprint-ing. Swanson et al. [66] revised this downwards to 11 loci.Recently, Zhang et al. [77] suggested that seven of thefifteen loci proposed by Saunders et al. [58] were sufficientfor cacao fingerprinting. We demonstrated that a substan-tially reduced subset of cacao microsatellite loci (andnumber of alleles) of nine recommended loci (mTcCIR12,15, 26, 33, 37, 42, 57, 243 and 244) would give speedierand more definitive resolution of identities in cacaogermplasm collections.
However, an increased (less favourable) P(ID)sibCOM of1.437×10−4 was obtained in comparison to the set of fifteen
recommended by Saunders et al. [58]. The random matchprobability (px) for unrelated individuals can be found frompx≤1-(1-α)1/N where α is the confidence level and N thepopulation size [10]. Wild cacao trees in Belize were foundto have a canopy diameter of up to 12 m [47] and the cacaoAmazonian area was estimated as 7,700,000 km2 [7] givinga conservative T. cacao population size of 6.81×10¹⁰.Setting α=0.01, N=6.81×10¹⁰ gives px of 1.48×10⁻¹³
which agreed well with the combined P(ID) of 8.886×10⁻¹²
from the recommended set of nine loci. Accessionsdeclared as similar under these circumstances may beconsidered to be genetically similar and unless morpholog-ical or agronomic evidence indicates otherwise may belumped together as the same accession.
Increasing throughput by bulking was inconvenientdue to the non-detection of alleles, an effect that wasdependent on both the primer and number of pooledsamples. A similar effect was theoretically modelled [78].The use of pooled samples for determination of mis-labelled plants in large-scale verification work was furtherlimited by the degree of mislabelling. A lower efficiencyresults when there is a high degree of mislabelling [23]due to additional genotyping since the pools must bedecomposed into individual samples and re-assayed.Furthermore, these workers demonstrated that an errorrate of 20% results in a pooling strategy being lessefficient than genotyping individual samples. This studyfound a high level (59%) of plots in the ICG,T that
Fig. 3 Comparison of resolution ability with allele number in tenprimer combinations. Resolution ability was relative to that obtainedwith all (37) loci on sixty Theobroma cacao L. accessions. Top andbottom loci are as ranked with GIMLET v.1.3.3 [71]. Saunders' 15 is
the set recommended by Saunders et al. [58]. The set “Most Alleles”consists of three loci with 15 alleles each. Rec9 is the recommendedset of nine primers from this study
Table 2 Allelic range and resolution ability of primer sets
Number ofprimer sets
Range of numberof primers used
1Resolution (%) Allele range
16 3–12 75.9 45–9019 3–7 77.8 36–5516 3–7 79.6 37–4814 4–12 83.3 42–11713 5–12 85.2 47–1209 5–15 87.0 42–15239 9–34 94.4 101–31446 9–37 100 101–326
1 Groups resolved among sixty Theobroma cacao L. accessions as arelative percentage of that obtained with the full complement of 37loci used in this study.
Tropical Plant Biol.

allegedly contained replicated clonal material but insteadcontained more than one genotype. A misidentificationlevel of around 30% was reported for cacao germplasmcollections [51, 20, 56] including the ICG,T [64]. Hence,
the use of pooled samples for verification work in the ICG,T is not recommended.
The unrooted NJ dendrogram based on 37 microsatelliteloci clustered the 60 individuals within distinct groupsroughly according to their genetic origin and hiddengenealogical relationship. All of the Criollo clones formeda tight cluster at the bottom of the dendrogram and wereclose to the Trinitario ICS clones. The Trinitario accessionswere joined by the “Refractario” accessions (e.g. JA, B,MOQ) from Ecuador. The French Guiana accessions (YAL,GU and ELP clones) formed a small tight group associatedwith several Upper Amazon Forastero clones. It indicated
Table 3 Correlation of scorer assessment for three microsatellites
Microsatellite Spearman's rs
mTcCIR15 0.641a
mTcCIR26 0.849a
mTcCIR37 0.947a
a significant at 0.1%
Fig. 4 Genetic relationshipsamong sixty Theobroma cacaoL. accessions with 37 micro-satellite loci. Criollo (C),Forastero (F), Refractario (R)and Trinitario (T) groups areindicated
Tropical Plant Biol.
the likely origin of these French Guiana clones from UpperAmazon. All of the twenty Nanay clones were groupedtogether (Fig. 4). Those individuals that formed smallclusters were likely siblings derived from same trees(Zhang et al., unpublished data).
In conclusion, nine discriminant T. cacao microsatelliteloci (mTcCIR12, 15, 26, 33, 37, 42, 57, 243 and 244) wereidentified for fingerprinting cacao germplasm collections.These primers are recommended for the detection ofmislabelling within collections by assessing individualtrees.
Methods
Plant Material, DNA Extraction and Quantification
Cacao (T. cacao L.) leaf tissue was collected fromaccessions in the ICG,T. DNA was extracted using theKobayashi protocol [34]. Leaf samples (~0.1 g as thinstrips) were placed in Lysing matrix A tubes (MPBiomedicals, Solon, Ohio, USA) with 500 μL of Buffer Iand maceration was effected in a FastPrep 120V machine(Qbiogene, Inc., California, USA) at speed = 4, t=20 sec,thrice for each sample. Precipitated DNAwas re-suspendedin sterile deionised water (SDW) and kept as stocksolutions. Dilutions (×100 or as required) of the stockDNA solutions were prepared with SDW and assayed withPicoGreen® (Molecular Probes, Eugene, Oregon, USA) ina Fluoroskan Ascent (Labsystems, Finland). Two samples(H1 and U1), extracted using a Plant Mini Kit (Qiagen,Valencia, California, USA), were obtained from a Peruvian
Table 4 ANOVA analyses for pooled DNA samples
Analysis Degrees offreedom
F-ratio
% Total Alleles DetectedMicrosatellite 2 11.13a
DNA pool 2 4.28n.s.
Scorer 1 0.00n.s.
Microsatellite × DNA pool 4 0.37n.s.
Microsatellite × Scorer 2 0.41n.s.
DNA pool × Scorer 2 0.03n.s.
Microsatellite × DNA pool × Scorer 4 1.00n.s.
% Correct Alleles of Detected PeaksMicrosatellite 2 5.44n.s.
DNA pool 2 1.02n.s.
Scorer 1 0.14n.s.
Microsatellite × DNA pool 4 2.87n.s.
Microsatellite × Scorer 2 2.09n.s.
DNA pool × Scorer 2 0.21n.s.
Microsatellite × DNA pool × Scorer 4 1.00n.s.
a Significant at the 5% level
Table 5 Plot homogeneity of accessions in the International CocoaGenebank, Trinidad
Accession UCRS Plotlocation
# Treesin plot
# Treesstudied
# Genotypes
AM 1/19 Field 5B, I771 8 8 1AM 1/28 Field 6A, A1 8 7 1AM 1/53 Field 6A, A2 7 5 1AM 1/54 Field 5B, I811 11 5 2AM 1/60 Field 5A, A26 3 3 1AM 1/70 Field 4A, F549 2 2 1AM 1/85 Field 4A, F538 3 2 1AM 2/12 Field 5B, B95 4 4 1AM 2/18 Field 5B, H679 2 2 1AM 2/61 Field 5B, H716 3 2 1AM 2/62 Field 5B, B105 13 9 3AM 2/65 Field 5B, I810 8 6 2AM 2/82 Field 5B, I806 4 4 1AM 2/83 Field 5B, B108 15 9 1AM 2/96 Field 5B, I819 8 3 2B 12/1 Field 6B, F461 9 9 4B 13/7 Field 5B, I728 12 11 2B 17/17 Field 5B, I784 10 10 2B 18/4 Field 6B, F457 14 11 3B 4/8 Field 6B, F439 5 3 3B 7/21 Field 6B. F438 9 8 7CL 10/5 Field 5B, A4 4 4 2CL 10/14 Field 5A, A1 11 7 4CL 13/27 Field 5B, A24 9 8 2CL 27/50 Field 5B, I774D 12 9 1CL 91/5 Field 5B, A64 2 2 2CL 9/17 Field 5B, A24 12 12 4CRUZ 7/8 Field 6B, B83 6 3 2DOM 27 Field 4A, B203 2 2 2ICA 70 Field 4A, C290 3 3 1JA 1/9 Field 6A, A51 3 3 1JA 4/17 Field 5B, E425 4 2 1JA 5/27 Field 5B, F483 6 5 5JA 5/39 Field 5B, D234 14 11 2JA 8/33 Field 5B, E378 3 2 1JA 10/16 Field 5B, E411 2 2 1LP 1/21 Field 5B, I746 4 4 2LP 1/21 Field 5B, I779 5 4 3LP 3/4 Field 5B, A33 16 14 4LP 4/12 Field 5B, I803 10 12 1LP 4/48 Field 5B, B140 10 9 8LP 5/19 Field 6A, B95 3 3 1LX 38 Field 5B, C206 8 7 4LX 43 Field 5B, C201 16 14 3MOQ 6/95 Field 5B, C221 5 3 3NA 176 Field 4A. D389 3 3 1NA 669 Field 4A, D418 4 3 3PA 169 Field 6B, C180 11 8 5PA 293 Field 4A, F516 4 3 2SLA 16 Field 5B, D242 8 6 2SLC 4 Field 5B, A39 6 5 1SLC 18 Field 5B, A13 9 5 2TRD 15 Field 4A, A43 2 2 2TRD 111 Field 4A, A87 3 3 1
Tropical Plant Biol.

collection held at the Sustainable Perennial Crops Labora-tory of the Agricultural Research Service (United StatesDepartment of Agriculture; USDA-ARS) in Beltsville,Maryland. The accessions utilised (Table 6) containedrepresentatives of Criollo, Forastero, Refractario andTrinitario material.
Polymerase Chain Reaction (PCR) Process
The PCR reaction mix was composed of 4 μL EppendorfHotMaster Mix (Brinkmann Instruments Inc., New York,USA) giving 2.5 mM magnesium ions, 2 mM totaldeoxynucleotide triphosphates, 0.2 Units Taq polymeraseat final composition in the reaction mix; 0.5 μL of a MPPsolution in Tris-EDTA buffer (10 μM each primer; reverseunlabeled primers from Operon Technologies, Inc., Alabama,USA; forward, WellRed-labelled primers from Proligo,Boulder, Colorado, USA); and 5.5 μL of 0.05 ng µL−1
appropriate DNA solution. Each MPP was amplified fromseparate reaction mixes. Cycling was carried out in aGeneAmp PCR System 9,700 thermal cyclers (AppliedBiosystems, Foster City, California, USA) with a touchdownprotocol: 94°C, 5 min; eight cycles with denaturation at95°C for 30 sec, annealing at 55°C for 60 sec with reductionby 0.5°C after every cycle and extension at 72°C for 1 min;25 cycles with denaturation at 94°C for 30 sec, annealing at51°C for 1 min and extension at 72°C for 1 min; finalextension at 60°C for 15 min to ensure complete A addition
followed by retention at 4°C until recovery. Each combina-tion of DNA-MPP was repeated at least once. Severalcombinations were identified for at least three PCR deter-minations based principally on the need for confirmation ofallele sizes.
Capillary Electrophoresis (CE)
Post-PCR bulking was conducted by pooling 1.5 μL ofeach MPP-PCR product. Sample loading buffer containing29.8 μL of Hi-Di formamide (Applied Biosystems,Warrington, UK) and 0.2 μL of GenomeLab™ DNA sizestandard-400 (Beckman Coulter Inc., Fullerton, California,USA) was added to each well. Samples were overlaid withone drop of mineral oil (Beckman Coulter Inc.). Fragmentswere separated on an 8-capillary CEQ™ 8,000 or 8,800(Beckmann Coulter Inc.). Products with poor standardprofiles (missing bands; improper sizing) were discardedand the appropriate PCR product pools were recomposedand run again to ensure that fragment profiling was suitablefor allele sizing. Preliminary allele binning using a 1.5nucleotide window was performed with the bundledCEQ™ fragment analysis software (Beckman CoulterInc.). Allele sizes were assessed graphically and manuallyto remove spurious and stutter alleles. Final allele bins weredecided by repeat number using the deposited sequencelength as the starting point for stepwise increase or decreasein repeat number.
MPP Assessment
The fifteen recommended MPPs [58] and twenty-twoadditional MPPS (Table 7) were assessed on a set of 60cacao accessions (Table 6). PCR and CE were repeated atleast once as described above. Allele binning was asdescribed earlier. Summary statistics including the poly-morphism information content (PIC; [8]) were obtainedwith PowerMarker v3.25 [39]. The probability of identityamong full siblings (P(ID)sib; [74]) from each SSR wasobtained with GIMLET v.1.3.3 [71]. The statistic ln S2 wasalso calculated where
S2 ¼Xi6¼j
xi � xj� �2.
2n n� 1ð Þ n ¼ number of alleles
The error level of each locus (allele drop out, ADO; falseallele) was determined with GIMLET v.1.3.3 [71] fromsamples with at least three separate PCR and correspondingCE determinations. The effect of microsatellite structure(perfect vs. imperfect; compound vs. simple) on ln S2, PIC,P(ID)sib, and number of alleles for SSRs classified as dimers,was analysed by ANOVA using IRRISTAT v.5.0 [27].
Fig. 5 Plot homogeneity assessment in the International CocoaGenebank, Trinidad. Forty-four plots with genotype data from sixmicrosatellite loci on at least three trees were evaluated with GIMLETv.1.3.3 [71]. Plot homogeneity assessed by the number (andpercentage) of genotypes within a plot that should contain only onegenotype
Tropical Plant Biol.

Table 6 Cacao accessions used for determination of best microsatellites for verification studies in field germplasm collections
Accession 1Position Group Country of origin (Status)
AC 2 [BLZ] T1 (FP1026) Criollo Belize (wild)AC 20 [BLZ] T1 (FP1032) Criollo Belize (wild)B 9/10-25 [POU] Marper Farm, C1078 Refractario Ecuador (cultivated)BC 3 [BLZ] T1 (FP1019) Criollo Belize (wild)COCA 3348/44 [CHA] UCRS, Field 6B, E374 T2 (FP1047) Forastero Ecuador (wild)CRIOLLO 22 [CRI] UCRS, Field 4A, C276 T3 Criollo Costa Rica (cultivated)EET 400 [ECU] UCRS, Field 6B, F455 T1 Forastero Ecuador (cultivated)ELP 1/S6 (FP950) Forastero French Guiana (wild)GU 241/P UWI, Campus Field 1A, x2y33 (FP500) Forastero French Guiana (wild)GU 300/P UCRS, Field 4A, B197 T4 Forastero French Guiana (wild)H 1 Not available Forastero Peru (cultivated)HF 8 [BLZ] T1 (FP987) Criollo Belize (wild)IB 2 [BLZ] T1 (FP1020) Criollo Belize (wild)IB 9 [BLZ] T1 (FP996) Criollo Belize (wild)ICS 75 San Juan Estate Block 2 Trinitario Trinidad (cultivated)ICS 97 San Juan Estate Block 1 Trinitario Trinidad (cultivated)ICS 100 San Juan Estate Block 2 Trinitario Trinidad (cultivated)IMC 3 UWI, Campus Field 3, x1y3 Forastero Peru (wild)IMC 12 Marper Farm, C1056 Forastero Peru (wild)IMC 16 Marper Farm, D603 Forastero Peru (wild)IMC 67 La Reunion Estate Forastero Peru (wild)JA 5/4 [POU] Marper Farm, C526 (FP2307) Refractario Ecuador (cultivated)JA 5/5 [POU] Marper Farm, C324 (FP1351) Refractario Ecuador (cultivated)LCT EEN 31 UCRS, Field 6A, A6 T3 (FP450) Forastero Ecuador (wild)LCT EEN 162/S-1010 UCRS, Field 5B, C216 T2 (FP2945) Forastero EcuadorMO 9 Marper Farm, D835 (FP253) Forastero Peru (wild)MO 20 Marper Farm, D809 (FP254) Forastero Peru (wild)MOQ 6/95 Marper Farm, C1 (FP582) Refractario Ecuador (cultivated)MXC 67 UWI, Campus Field 12, x3y6 Criollo Mexico (cultivated)NA 184 UCRS, Field 5B, G612 T1 Forastero Peru (wild)NA 241 UCRS, Field 4A, D383 T4 (FP2716) Forastero Peru (wild)NA 244 UCRS, Field 5B, E400 T3 (FP16) Forastero Peru (wild)NA 266 UCRS, Field 5B, G634 T3 (FP25) Forastero Peru (wild)NA 331 Marper Farm, D477 (FP383) Forastero Peru (wild)NA 406 UCRS, Field 5B, F447 T1 (FP23) Forastero Peru (wild)NA 432 Marper Farm, D717 (FP271) Forastero Peru (wild)NA 435 Marper Farm, D760 (FP260) Forastero Peru (wild)NA 504 Marper Farm, D465 (FP167) Forastero Peru (wild)NA 528 Marper Farm, D774 (FP112) Forastero Peru (wild)NA 680 UCRS, Field 5A, D337 T3 (FP649) Forastero Peru (wild)NA 702 Marper Farm, D104 (FP819) Forastero Peru (wild)NA 705 Marper Farm, C102 (FP1280) Forastero Peru (wild)NA 733 Marper Farm, D721 (FP274) Forastero Peru (wild)NA 734 Marper Farm, D546 (FP377) Forastero Peru (wild)NA 771 UCRS, Field 5B, F478 T4 (FP27) Forastero Peru (wild)NA 773 UCRS, Field 5B, F547 T3 (FP1266) Forastero Peru (wild)NA 831 Marper Farm, D741 (FP267) Forastero Peru (wild)NA 833 Marper Farm, D640 (FP297) Forastero Peru (wild)NA 860 Marper Farm, D240 (FP1167) Forastero Peru (wild)NAPO 2 [CHA] UWI, Campus Field 7, x8y9 (FP1922) Forastero Ecuador (wild)PA 279 [PER] Marper Farm, D59 (FP426) Forastero Peru (wild)PA 299 [PER] Marper Farm, C936 (FP571) Forastero Peru (wild)POR 1 [TTO] UWI, Campus Field 2, x2y12 (FP1897) Criollo VenezuelaPOUND 7/B [POU] UCRS, Field 6B, F407 T3 (FP521) Forastero Peru (wild)SCA 12 Marper Farm, D205 Forastero Peru (wild)SCA 24 Marper Farm, D569 Forastero Peru (wild)
Tropical Plant Biol.

Table 6 (continued)
Accession 1Position Group Country of origin (Status)
SPA 5 [COL] UWI, Campus Field 2, x1y15 (FP1817) Forastero Colombia or PeruU 1 Not Available Forastero Peru (cultivated)UF 613 UCRS, Field 4A, A93 T2 (FP1237) Trinitario Costa Rica (cultivated)YAL 6 Not Available Forastero French Guiana
1 FP = fingerprinting number; numeric code given to sampled reference trees
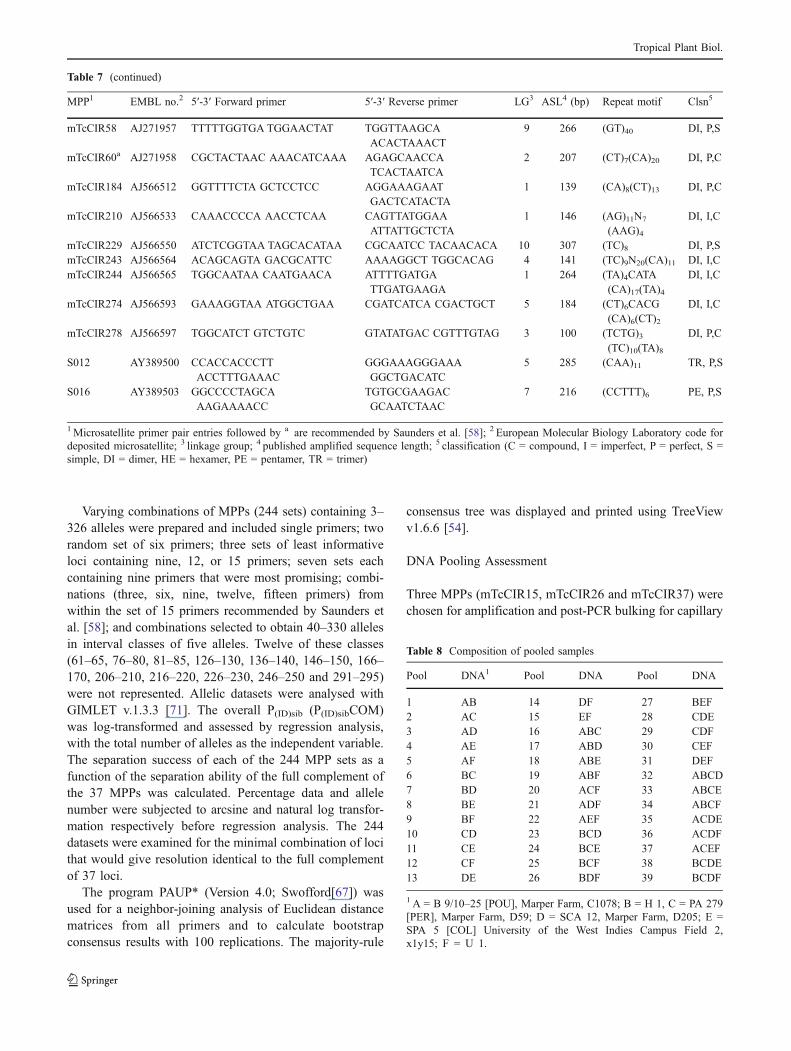
Table 7 Characteristics of the microsatellite primers for Theobroma cacao L. utilised in this study
MPP1 EMBL no.2 5′-3′ Forward primer 5′-3′ Reverse primer LG3 ASL4 (bp) Repeat motif Clsn5
mTcCIR1a Y16883 GCAGGGCAGGCTCAGTGAAGCA
TGGGCAACCAGAAAACGAT
8 143 (CT)14 DI, P,S
mTcCIR3 Y16977 CATCCCAGTATCTCATCCATTCAGT
CTGCTCATTTCTTTCATATCA
2 249 (CT)20(TA)21 DI, P,C
mTcCIR6a Y16980 TTCCCTCTAAA CTACCCTAAAT TAAAGCAAAGCAATCTAACATA
6 231 (TG)7(GA)13 DI, P,C
mTcCIR7a Y16981 ATGCGAATG ACAACTGGT GCTTTCAGT CCTTTGCTT 7 160 (GA)11 DI, P,SmTcCIR8a Y16982 CTAGTTTCC CATTTACCA TCCTCAGCA TTTTCTTTC 9 301 (TC)5TT(TC)17
T3(CT)4
DI, I,C
mTcCIR9 Y16983 ACCATGCTT CCTCCTTCA ACATTTATA CCCCAACCA 6 274 (CT)8N15(CT)5N9(TC)10
DI, I,C
mTcCIR10 Y16984 ACAGATGGC CTACACACT CAAGCAAGC CTCATACTC 5 208 (TG)13 DI, P,SmTcCIR11a Y16985 TTTGGTGAT TATTAGCAG GATTCGATT TGATGTGAG 2 298 (TC)13 DI, P,SmTcCIR12a Y16986 TCTGACCCC AAACCTGTA ATTCCAGTT AAAGCACAT 4 188 (CATA)4N18
(TG)6
DI, I,C
mTcCIR15a Y16988 CAGCCGCC TCTTGTTAG TATTTGGGA TTCTTGATG 1 254 (TC)19 DI, P,SmTcCIR17 Y16990 AAGGATGAAGG
ATGTAAGAGAGCCCATACGA GCTGTGAGT 4 271 (GT)7N4(GA)12 DI, I,C
mTcCIR18a Y16991 GATAGCTAAG GGGATTGAGGA GGTAATTCAATCATTTGAGGATA
4 345 (GA)12 DI, P,S
mTcCIR22a Y16995 ATTCTCGCAA AAACTTAG GATGGAAGGAGTGTAAATAG
1 289 (TC)12N146
(CT)10
DI, I,C
mTcCIR24a Y16996 TTTGGGGTGA TTTCTTCTGA TCTGTCTCGTCTTTTGGTGA
9 198 (AG)13 DI,
P,SmTcCIR26a Y16998 GCATTCATC AATACATTC GCACTCAAA
GTTCATACTAC8 298 (TC)9C(CT)4
TT(CT)11
DI, I,C
mTcCIR29 AJ271822 CGACATTTCG ACTTTCATC TTTTGTTTCTTTCTTTTTCATT
1 173 (CA)10 DI, P,S
mTcCIR30 AJ271823 TGAAGATCCT ACTGTTGAG TGATAATAACTGCTTAGTGG
9 184 (CA)11 DI, P,S
mTcCIR33a AJ271826 TGGGTTGA AGATTTGGT CAACAATGA AAATAGGCA 4 285 (TG)11 DI, P,SmTcCIR37a AJ271942 CTGGGTGCT GATAGATAA AATACCCTC CACACAAAT 10 150 (GT)15 DI, P,SmTcCIR40a AJ271943 AATCCGACAG TCTTTAATC CCTAGGCCAG AGAATTGA 3 286 (AC)15 DI, P,SmTcCIR42 AJ271944 TTGCTGAAGT ATCTTTTGAC GCTCCACC CCTATTTG 5 232 (CA)21 DI, P,SmTcCIR43 AJ271945 TCATGAGA ATGCATGTG CTGGACATGA
AGAAGTTAT4 206 (TG)5TA(GA)15 DI, I,C
mTcCIR45 AJ271947 GTCATTG CTGTGTG CATAGCATTAACTGTGTCTG
8 284 (GT)9 DI, P,S
mTcCIR55 AJ271954 GATATTGTCC CATTATTTG TTCCGCC TTGTTCTC 7 234 (CACACG)4 HE, P,SmTcCIR56 AJ271955 ATACTTTTA CTTCCTTTTG TCTTATTTT TCTTTACCAG 7 354 (TC)14N(TG)15 DI, I,CmTcCIR57 AJ271956 TGTAGATGTGA
TTTTATAGTTTGGGAGGGATA AGAAGCAG 4 253 (AC)13 DI, P,S
Tropical Plant Biol.
Varying combinations of MPPs (244 sets) containing 3–326 alleles were prepared and included single primers; tworandom set of six primers; three sets of least informativeloci containing nine, 12, or 15 primers; seven sets eachcontaining nine primers that were most promising; combi-nations (three, six, nine, twelve, fifteen primers) fromwithin the set of 15 primers recommended by Saunders etal. [58]; and combinations selected to obtain 40–330 allelesin interval classes of five alleles. Twelve of these classes(61–65, 76–80, 81–85, 126–130, 136–140, 146–150, 166–170, 206–210, 216–220, 226–230, 246–250 and 291–295)were not represented. Allelic datasets were analysed withGIMLET v.1.3.3 [71]. The overall P(ID)sib (P(ID)sibCOM)was log-transformed and assessed by regression analysis,with the total number of alleles as the independent variable.The separation success of each of the 244 MPP sets as afunction of the separation ability of the full complement ofthe 37 MPPs was calculated. Percentage data and allelenumber were subjected to arcsine and natural log transfor-mation respectively before regression analysis. The 244datasets were examined for the minimal combination of locithat would give resolution identical to the full complementof 37 loci.
The program PAUP* (Version 4.0; Swofford[67]) wasused for a neighbor-joining analysis of Euclidean distancematrices from all primers and to calculate bootstrapconsensus results with 100 replications. The majority-rule
consensus tree was displayed and printed using TreeViewv1.6.6 [54].
DNA Pooling Assessment
Three MPPs (mTcCIR15, mTcCIR26 and mTcCIR37) werechosen for amplification and post-PCR bulking for capillary
Table 7 (continued)
MPP1 EMBL no.2 5′-3′ Forward primer 5′-3′ Reverse primer LG3 ASL4 (bp) Repeat motif Clsn5
mTcCIR58 AJ271957 TTTTTGGTGA TGGAACTAT TGGTTAAGCAACACTAAACT
9 266 (GT)40 DI, P,S
mTcCIR60a AJ271958 CGCTACTAAC AAACATCAAA AGAGCAACCATCACTAATCA
2 207 (CT)7(CA)20 DI, P,C
mTcCIR184 AJ566512 GGTTTTCTA GCTCCTCC AGGAAAGAATGACTCATACTA
1 139 (CA)8(CT)13 DI, P,C
mTcCIR210 AJ566533 CAAACCCCA AACCTCAA CAGTTATGGAAATTATTGCTCTA
1 146 (AG)11N7
(AAG)4
DI, I,C
mTcCIR229 AJ566550 ATCTCGGTAA TAGCACATAA CGCAATCC TACAACACA 10 307 (TC)8 DI, P,SmTcCIR243 AJ566564 ACAGCAGTA GACGCATTC AAAAGGCT TGGCACAG 4 141 (TC)9N20(CA)11 DI, I,CmTcCIR244 AJ566565 TGGCAATAA CAATGAACA ATTTTGATGA
TTGATGAAGA1 264 (TA)4CATA
(CA)17(TA)4
DI, I,C
mTcCIR274 AJ566593 GAAAGGTAA ATGGCTGAA CGATCATCA CGACTGCT 5 184 (CT)6CACG(CA)6(CT)2
DI, I,C
mTcCIR278 AJ566597 TGGCATCT GTCTGTC GTATATGAC CGTTTGTAG 3 100 (TCTG)3(TC)10(TA)8
DI, P,C
S012 AY389500 CCACCACCCTTACCTTTGAAAC
GGGAAAGGGAAAGGCTGACATC
5 285 (CAA)11 TR, P,S
S016 AY389503 GGCCCCTAGCAAAGAAAACC
TGTGCGAAGACGCAATCTAAC
7 216 (CCTTT)6 PE, P,S
1Microsatellite primer pair entries followed by a are recommended by Saunders et al. [58]; 2 European Molecular Biology Laboratory code fordeposited microsatellite; 3 linkage group; 4 published amplified sequence length; 5 classification (C = compound, I = imperfect, P = perfect, S =simple, DI = dimer, HE = hexamer, PE = pentamer, TR = trimer)
Table 8 Composition of pooled samples
Pool DNA1 Pool DNA Pool DNA
1 AB 14 DF 27 BEF2 AC 15 EF 28 CDE3 AD 16 ABC 29 CDF4 AE 17 ABD 30 CEF5 AF 18 ABE 31 DEF6 BC 19 ABF 32 ABCD7 BD 20 ACF 33 ABCE8 BE 21 ADF 34 ABCF9 BF 22 AEF 35 ACDE10 CD 23 BCD 36 ACDF11 CE 24 BCE 37 ACEF12 CF 25 BCF 38 BCDE13 DE 26 BDF 39 BCDF
1A = B 9/10–25 [POU], Marper Farm, C1078; B = H 1, C = PA 279[PER], Marper Farm, D59; D = SCA 12, Marper Farm, D205; E =SPA 5 [COL] University of the West Indies Campus Field 2,x1y15; F = U 1.
Tropical Plant Biol.

electrophoresis. The characteristics of these primers areprovided in Table 7. Pooling was composed of two, three orfour samples as outlined in Table 8. Each accessioncontributed equivalently to the final DNA quantity in eachpool. MPP-PCR and CE were conducted as before.Separation patterns were examined for allele pattern andtwo independent scorers assessed the resultant electro-phoretograms. Spearman's rs for scorer consistency, wasdetermined using the freeware program PAST [24]. Scoreraccuracy was then assessed by comparing the number ofcalled alleles to the expected based on individual contribu-tions to each pool. Band intensity (as measured by peakheight) was not scored as this parameter is influenced bynumerous factors including chance uptake of PCR productsby capillaries. Appropriate quantification of this parameterwould require additional multiple CEs from the same PCRproduct and hence would increase the number of runs to bedone for any DNA-MPP combination. The possibility ofoverlooking heterogeneity is recognised for cases whenonly two peaks are obtained. The experimenter cannotdetermine whether this is a result of a heterozygousgenotype at this locus or whether it originated from amixed set of homozygous genotypes. The contribution ofType I (real allele not identified) and Type II (false alleleidentified) error effects was assessed. Analysis of variance(ANOVA) analyses were performed with the freewareprogram IRRISTAT v5.0 [27] for Type II error, and onarcsine-transformed data for the percentage of total allelesand the percentage of correctly identified alleles detected byscorer.
Plot Homogeneity Assessment in the ICG,T
Fifty-four plots (53 accessions) containing at least two treeswere assessed with six MPPs (mTcCIR1, mTcCIR6,mTcCIR7, mTcCIR8, mTcCIR33 and mTcCIR60). Treeswith missing data were excluded from subsequent analysis.Genotype data were analysed with GIMLET v.1.3.3 [71]for individual plot homogeneity using the regroup option.
Acknowledgements Eric Tillson formerly of USDA-ARS isthanked for scoring electrophoretograms and Antoinette Sankar ofCRU is thanked for extracting some of the DNA samples. We thankClaudia Bellato of USDA-ARS and David Butler of CRU forcommenting on the manuscript.
References
1. Abu Assar AH, Uptmoor R, Abdelmula AA, Salih M, Ordon F,Friedt W (2005) Genetic variation in sorghum germplasm fromSudan, ICRISAT, and USA assessed by simple sequence repeats(SSRs). Crop Sci 45:1636–1644 doi:10.2135/cropsci2003.0383
2. Aranzana MJ, Carbó J, Arús P (2003) Microsatellite variability inpeach [Prunus persica (L.) Batsch]: cultivar identification, marker
mutation, pedigree inferences and population structure. TheorAppl Genet 106:1341–1352
3. Badenes M, Garcés A, Romero C, Romero M, Clavé J, Rovira M,Llácer G (2003) Genetic diversity of introduced and local Spanishpersimmon cultivars revealed by RAPD markers. Genet ResourCrop Evol 50:579–585 doi:10.1023/A:1024474719036
4. Bader J, Bansal A, Sham P (2001) Efficient SNP-based tests ofassociation for quantitative phenotypes using pooled DNA.GeneScreen 1:143–150 doi:10.1046/j.1466-920x.2001.00036.x
5. Bansal A, van den Boom D, Kammerer S, Honisch C, Adam G,Cantor CR, Kleyn P, Braun A (2002) Association testing by DNApooling: an effective initial screen. Proc Natl Acad Sci USA99:16871–16874 doi:10.1073/pnas.262671399
6. Barratt BJ, Payne F, Rance HE, Nutland S, Todd JA, Clayton DG(2002) Identification of the sources of error in allele frequencyestimations from pooled DNA indicates an optimal experimentaldesign. Ann Hum Genet 66:393–405 doi:10.1046/j.1469-1809.2002.00125.x
7. Bartley BGD (2005) The genetic diversity of cacao and itsutilization. CABI, UK
8. Botstein D, White RL, Skolnick M, Davis RW (1980) Construc-tion of a genetic linkage map in man using restriction fragmentlength polymorphisms. Am J Hum Genet 32:314–331
9. Bradley BJ, Vigilant L (2002) False alleles derived from microbialDNA pose a potential source of error in microsatellite genotypingof DNA from faeces. Mol Ecol Notes 2:602–605 doi:10.1046/j.1471-8286.2002.00302.x
10. Budowle B, Chakraborty R, Carmody G, Monson KL (2000)Source attribution of a forensic DNA profile. Forensic ScienceCommunications 2(3):6pp http://www.fbi.gov/hq/lab/fsc/backissu/july2000/source.htm. Cited 07 Jul 2008
11. Charters MY, Wilkinson MJ (2000) The use of self-pollinatedprogenies as “in-groups” for the genetic characterization of cocoagermplasm. Theor Appl Genet 100:160–166 doi:10.1007/PL00002903
12. Christopher Y, Mooleedhar V, Bekele F, Hosein F (1999)Verification of accessions in the ICG,T using botanical descriptorsand RAPD analysis. In: Annual Report 1998 Cocoa ResearchUnit, The University of the West Indies, St. Augustine, Trinidadand Tobago, pp 15–18
13. Coe SD, Coe MD (1996) The true history of chocolate. Thames &Hudson, Ltd., London
14. Cryer NC, Butler DR, Wilkinson MJ (2005) High throughput,high resolution selection of polymorphic microsatellite loci formultiplex analysis. Plant Methods 1:3 doi:10.1186/1746-4811-1-3.Available via http://www.plantmethods.com/content/1/1/3. Cited07 Jul 2008
15. Cryer NC, Fenn MGE, Turnbull CJ, Wilkinson MJ (2006) Allelicsize standards and reference genotypes to unify internationalcocoa (Theobroma cacao L.) microsatellite data. Genet ResourCrop Evol 53(8):1643–1652 doi:10.1007/s10722-005-1286-9
16. Cuatrecasas J (1964) Cacao and its allies. A taxonomic revision ofthe genus Theobroma. Contrib U.S. Nat Herbarium 35(6).Smithsonian Institution, Washington
17. Daniels J, Holmans P, Williams N, Turic D, McGuffin P, Plomin R,Owen MJ (1998) A simple method for analysing microsatelliteallele image patterns generated from DNA pools and its applica-tions to allelic association studies. Am J Hum Genet 62:1189–1197doi:10.1086/301816
18. Dubreuil P, Rebourg C, Merlino M, Charcosset A (1999)Evaluation of a DNA-pooled sampling strategy for estimatingthe RFLP diversity of maize populations. Plant Mol Biol Rep17:123–138 doi:10.1023/A:1007571101815
19. Ewen KR, Bahlo M, Treloar SA, Levinson DF, Mowry B,Barlow JW, Foote SJ (2000) Identification and analysis of errortypes in high-throughput genotyping. Am J Hum Genet 67:727–736 doi:10.1086/303048
Tropical Plant Biol.

20. Figueira A (1998) Homonymous genotypes and misidentificationin germplasm collections of Brazil and Malaysia. INGENICNewsletter 4:4–8. Available via http://ingenic.cas.psu.edu/newsletters.htm. Cited 07 Jul 2008
21. Fossati T, Zapelli I, Bisoffi S, Micheletti A, Vietto L, Sala F,Castiglione S (2005) Genetic relationships and clonal identity in acollection of commercially relevant poplar cultivars assessed byAFLP and SSR. Tree Genet Genomes 1:11–19 doi:10.1007/s11295-004-0002-9
22. Gagneux P, Boesch C, Woodruff DS (1997) Microsatellite scoringerrors associated with noninvasive genotyping based on nuclearDNA amplified from shed hair. Mol Ecol 6:861–868 doi:10.1111/j.1365-294X.1997.tb00140.x
23. Goto S, Miyahara F, Ide Y (2001) A fast method for checking thegenetic identity of ramets in a clonal seed orchard by RAPDanalysis with a bulking procedure. Silvae Genet 50(5–6):271–275
24. Hammer O, Harper DAT, Ryan PD (2001) PAST: PaleontologicalStatistics Software Package for Education and Data Analysis.Palaeontologia Electronica 4(1) http://palaeo-electronica.org/2001_1/past/issue1_01.htm. (PAST.exe v1.79 available at http://folk.uio.no/ohammer/past. Cited 07 Jul 2008
25. Hoffman JI, Amos W (2005) Microsatellite genotyping errors:Detection approaches, common sources and consequences forparental exclusion. Mol Ecol 14:599–612
26. Hurka H, Neuffer B, Friesen N (2004) Plant genetic resources inbotanical gardens. In: Forkmann G, Michaelis (eds) Proceedingsof the 21st International Symposium on Breeding Ornamentals,Part II Acta Hort 651:35–44
27. International Rice Research International (1998 – 2005) IRRI-STAT v5.0 for Windows. Metro Manila, Philippines. Softwareavailable from download via http://www.irri.org/science/software/irristat.asp. Cited 07 Jul 2008
28. Jawaid A, Bader J, Purcell S, Cherny S, Sham P (2002) Optimalselection strategies for QTL mapping using pooled DNA samples.Eur J Hum Genet 10:125–132 doi:10.1038/sj.ejhg.5200771
29. Johnson ES, Mora A, Schnell RJ (2007) Field guide efficacy inthe identification of reallocated clonally propagated accessions ofcacao (Theobroma cacao L.). Genet Resour Crop Evol 54:1301–1313 doi:10.1007/s10722-006-9111-7
30. Kalinowski ST, Sawaya MA, Taper ML (2006) Individualidentification and distributions of genotypic differences betweenindividuals. J Wildl Manage 70(4):1148–1150 doi:10.2193/0022-541X(2006)70[1148:IIADOG]2.0.CO;2
31. Kennedy AJ, Mooleedhar V (1993) Conservation of cocoa in fieldgenebanks - the International Cocoa Genebank, Trinidad. In:Proceedings International Workshop on Conservation, Character-isation and Utilisation of Cocoa Genetic Resources in the 21stCentury, Port of Spain, Trinidad, September 13–17, 1992, TheCocoa Research Unit, Port of Spain, Trinidad, pp. 21–23
32. Khadari B, Breton C, Moutier N, Roger JP, Besnard G, Bervillé A,Dosba F (2003) The use of molecular markers for germplasmmanagement in a French olive collection. Theor Appl Genet 106(3):521–529
33. Khadari B, Oukabli A, Ater M, Mamouni A, Roger JP, KjellbergF (2005) Molecular characterization of Moroccan fig germplasmusing intersimple sequence repeat and simple sequence repeatmarkers to establish a reference collection. HortScience 40(1):29–32
34. Kobayashi N, Horikoshi T, Katsuyama H, Handa T, TakayanagiK (1998) A simple and efficient DNA extraction method forplants, especially woody plants. Plant Tissue Cult Biotechnol 4(2):76–80
35. Kölliker R, Jones ES, Jahufer MZZ, Forster JW (2001) BulkedAFLP analysis for the assessment of genetic diversity in whiteclover (Trifolium repens L.). Euphytica 121:305–315 doi:10.1023/A:1012048103585
36. Kottapalli KR, Burow MD, Burow G, Burke J, Puppala N (2007)Molecular characterization of the U.S. peanut mini corecollection using microsatellite markers. Crop Sci 47:1718–1727doi:10.2135/cropsci2006.06.0407
37. Lanaud C, Risterucci AM, Piretti I, Falque M, Bouet A, LagodaPJL (1999) Isolation and characterization of microsatellites inTheobroma cacao L. Mol Ecol 8:2141–2152 doi:10.1046/j.1365-294x.1999.00802.x
38. Li C-D, Fatokun CA, Ubi B, Singh BB, Scoles GJ (2001)Derermining genetic similarities and relationships among cowpeabreeding lines and cultivars by microsatellite markers. Crop Sci41:189–197
39. Liu K, Muse SV (2005) PowerMarker: An integrated analysisenvironment for genetic marker analysis. Bioinformatics 21:2128–2129 doi:10.1093/bioinformatics/bti282
40. Manifesto MM, Schlatter AR, Hopp HE, Suárez EY, Dubcovsky J(2001) Quantitative evaluation of genetic diversity in wheatgermplasm using molecular markers. Crop Sci 41:682–690
41. Marshall TC, Slate J, Kruuk LEB, Pemberton JM (1998)Statistical confidence for likelihood-based paternity inference innatural populations. Mol Ecol 7:639–655 doi:10.1046/j.1365-294x.1998.00374.x
42. Mason SL, Stevens MR, Jellen EN, Bonifaco A, Fairbanks DJ,Coleman CE, McCarty RR, Rasmussen AG, Maughan PJ (2005)Development and use of microsatellite markers for germplasmcharacterization in quinoa (Chenopodium quinoa Willd.). CropSci 45:1618–1630 doi:10.2135/cropsci2004.0295
43. McCouch SR, Chen X, Panaud O, Temnykh S, Xu Y, Cho YG,Huang N, Ishii T, Blair M (1997)Microsatellite marker development,mapping and application in rice genetics and breeding. Plant MolBiol 35:89–99 doi:10.1023/A:1005711431474
44. McKelvey KS, Schwartz MK (2004) Genetic errors asso-ciated with population estimation using non-invasive molec-ular tagging: Problems and new solutions. J Wildl Manage68:439–448 doi:10.2193/0022-541X(2004)068[0439:GEAWPE]2.0.CO;2
45. Michelmore RW, Paran I, Kesseli RV (1991) Identification ofmarkers linked to disease-resistance genes by bulked segregantanalysis: A rapid method to detect markers in specific genomicregions by using segregating populations. Proc Natl Acad SciUSA 88:9828–9832 doi:10.1073/pnas.88.21.9828
46. Mohlke KL, Erdos MR, Scott LJ, Fingerlin TE, Jackson AU,Silander K, Hollstein P, Boehnke M, Collins FS (2002) High-throughput screening for evidence of association using massspectrometry genotyping on DNA pools. Proc Natl Acad Sci USA99:16928–16933 doi:10.1073/pnas.262661399
47. Mooleedhar V (2000) Morphological characterisation and geneticevaluation of a relic Criollo cacao (Theobroma cacao L.)population in Belize. PhD Thesis, Dept Life Sciences, TheUniversity of the West Indies, St. Augustine, Trinidad
48. Morgante M, Olivieri AM (1993) PCR-amplified microsatellitesas markers in plant genetics. Plant J 3:175–182 doi:10.1111/j.1365-313X.1993.tb00020.x
49. Moriguchi Y, Iwata H, Ujino-Ihara T, Yoshimura K, Taira H,Tsumara Y (2003) Development and characterization of micro-satellite markers for Cryptomeria japonica D.Don. Theor ApplGenet 106:751–758
50. Motilal LA (2004) Tree identification by simple sequence repeats:a synopsis for 2000–2003. In: Annual Report 2003, CocoaResearch Unit, The University of the West Indies, St. Augustine,Trinidad and Tobago, pp. 13–21
51. Motilal L, Butler D (2003) Verification of identities in globalcacao germplasm collections. Genet Resour Crop Evol 50:799–807 doi:10.1023/A:1025950902827
52. Norton N, Williams NM, Williams HJ, Spurlock G, Kirov G,Morris DW, Hoogendoorn B, Owen MJ, O’Donovan MC (2002)
Tropical Plant Biol.

Universal, robust, highly quantitative SNP allele frequencymeasurement in DNA pools. Hum Genet 110:471–478doi:10.1007/s00439-002-0706-6
53. Pacek P, Sajantila A, Syvanen AC (1993) Determination of allelefrequencies at loci with length polymorphism by quantitativeanalysis of DNA amplified from pooled samples. PCR MethodsAppl 2:313–317
54. Page RDM (2001) TreeView v1.6.6. Available via http://taxonomy.zoology.gla.ac.uk/rod/rod.html. Cited 07 Jul 2008
55. Powell W, Morgante M, Andre C, Hanafey M, Vogel J, Tingey S,Rafalski A (1996) The comparison of RFLP, RAPD, AFLP andSSR (microsatellite) markers for germplasm analysis. Mol Breed2:225–238 doi:10.1007/BF00564200
56. Risterucci AM, Eskes B, Fargeas D, Motamayor JC, Lanaud C(2001) Use of microsatellite markers for germplasm identityanalysis in cocoa. In: Proceedings of the Third InternationalGroup for Genetic Improvement of Cocoa (INGENIC) Interna-tional Workshop on the New Technologies and Cocoa Breeding.16th-17th October 2000, Kota Kinabalu, Malaysia, pp. 25–33
57. Salhi-Hannachi A, Chatti K, Saddoud O, Mars M, Rhouma A,Marrakchi M, Trifi M (2006) Genetic diversity of different Tunisianfig (Ficus carica L.) collections revealed by RAPD fingerprints.Hereditas 143:15–22 doi:10.1111/j.2005.0018-0661.01904.x
58. Saunders JA, Hemeida AA, Mischke S (2004) Selection ofinternational molecular standard for DNA fingerprinting. TheorAppl Genet 110:41–47 doi:10.1007/s00122-004-1762-1
59. Schug MD, Wetterstrand KA, Gaudette MS, Lim RH, Hutter CM,Aquadro CF (1998) The distribution and frequency of micro-satellite loci in Drosophila melanogaster. Mol Ecol 7:57–70doi:10.1046/j.1365-294x.1998.00304.x
60. Sereno ML, Albuquerque PSB, Vencovsky R, Figueira A (2006)Genetic diversity and natural population structure of cacao(Theobroma cacao L.) from the Brazilian Amazon evaluated bymicrosatellite markers. Conserv Genet 7:13–24 doi:10.1007/s10592-005-7568-0
61. Sham P, Bader JS, Craig I, O’Donovan M, Owen M (2002) DNApooling: A tool for large-scale association studies. Nat Rev Genet3:862–871 doi:10.1038/nrg930
62. Shan F, Clarke HC, Plummer JA, Yan G, Siddique KHM (2005)Geographical patterns of genetic variation in the world collectionsof wild annual Cicer characterized by amplified fragment lengthpolymorphisms. Theor Appl Genet 110:381–391 doi:10.1007/s00122-004-1849-8
63. Shaw SH, Carrasquillo MM, Kashuk C, Puffenberger EG,Chakravarti A (1998) Allele frequency distributions in pooledDNA samples: applications to mapping complex disease genes.Genome Res 8:111–123
64. Sounigo O, Christopher Y, Bekele F, Mooleedhar V, Hosein F(2001) The detection of mislabelled trees in the InternationalCocoa Genebank, Trinidad (ICG,T). In: Proceedings of the ThirdInternational Group for Genetic Improvement of Cocoa(INGENIC) International Workshop on the New Technologiesand Cocoa Breeding, 16th–17th October 2000, Kota Kinabalu,Malaysia, pp. 34–39
65. Sounigo O, Risterucci A-M, Clément D, Fouet O, Lanaud C(2006) Identification of off-types of clones used in the Interna-tional Clone Trial using DNA analyses. In: Eskes AB, Efron Y(eds) Global Approaches to Cocoa Germplasm Utilization andConservation. Final report of the CFC/ICCO/IPGRI project on“Cocoa Germplasm Utilization and Conservation: a GlobalApproach” (1998–2004). CFC, Amsterdam, The Netherlands/ICCO, London, UK/IPGRI, Rome, Italy, pp82–86, Available viahttp://www.bioversityinternational.org/publications/pubfile.asp?ID_PUB=1172. Cited 07 Jul 2008
66. Swanson JD, Lee AC, Guiltinan MJ (2003) USDA cacao DNAfingerprinting ring test: Results from Penn State University.INGENIC Newsletter 8:22–24. Available via http://ingenic.cas.psu.edu/newsletters.htm. Cited 07 Jul 2008
67. Swofford DL (1999) PAUP: Phylogenetic analysis using parsi-mony and other methods (Sinauer Associates, Sunderland, MA),Version 4.0b
68. Taberlet P, Griffin S, Goossens B, Questiau S, Manceau V,Escaravage N, Waits LP, Bouvet J (1996) Reliable genotyping ofsamples with very low DNA quantities using PCR. Nucleic AcidsRes 24:3189–3194 doi:10.1093/nar/24.16.3189
69. Taberlet P, Luikart G (1999) Non-invasive genetic sampling andindividual identification. Biol J Linn Soc Lond 68:41–55doi:10.1111/j.1095-8312.1999.tb01157.x
70. Tripathi SB, Mathish NV, Gurumurthi K (2006) Use of geneticmarkers in the management of micropropagated Eucalyptus germ-plasm. New For 31:361–372 doi:10.1007/s11056-005-8677-9
71. Valière N (2002) GIMLET: a computer program for analysinggenetic individual identification data. Mol Ecol Notes 2:377–379doi:10.1046/j.1471-8286.2002.00228.x
72. Van Hintum Theo JL (2000) Duplication within and betweengermplasm collections. III. A quantitative model. Genet ResourCrop Evol 47:507–513 doi:10.1023/A:1008703031415
73. Wadsworth RM, Harwood T (2000) International Cocoa Germ-plasm Database, ICGD 2000 v4.1. London International Finan-cial Futures and Options Exchange and the University ofReading, UK
74. Waits LP, Luikart G, Taberlet P (2001) Estimating the probabilityof identity among genotypes in natural populations: cautions andguidelines. Mol Ecol 10(1):249–256 doi:10.1046/j.1365-294X.2001.01185.x
75. Wood GAR, Lass RA (1985) Cocoa, 4th edn. Longman,London
76. Yang Y, Zhang J, Hoh J, Matsuda F, Xu P, Lathrop M, Ott J(2003) Efficiency of single-nucleotide polymorphism haplotypeestimation from pooled DNA. Proc Natl Acad Sci USA 100(12):7225–7230 doi:10.1073/pnas.1237858100
77. Zhang D, Mischke S, Goenaga R, Hemeida AA, Saunders JA(2006) Accuracy and reliability of high-throughput microsatellitegenotyping for cacao clone identification. Crop Sci 46:2084–2092doi:10.2135/cropsci2006.01.0004
78. Zou G, Zhao H (2004) The impacts of error in individualgenotyping and DNA pooling on association studies. GenetEpidemiol 26:1–10 doi:10.1002/gepi.10277
Tropical Plant Biol.
Copyright © 2022 FDOKUMEN