A functional genomics resource for Brassica napus: development of an EMS mutagenized population and...
15
www.newphytologist.org 1 Research Blackwell Publishing Ltd A functional genomics resource for Brassica napus: development of an EMS mutagenized population and discovery of FAE1 point mutations by TILLING Nian Wang 1 , Yajie Wang 1 , Fang Tian 1 , Graham J. King 2 , Chunyu Zhang 1 , Yan Long 1 , Lei Shi 1 and Jinling Meng 1 1 National Key Laboratory of Crop Genetic Improvement, Huazhong Agricultural University, Wuhan, 430070, China; 2 Rothamsted Research, Harpenden, Hertfordshire, AL5 2JQ, UK Summary • Two ethylmethanesulfonate (EMS) mutant populations of the semi-winter rape- seed cv. Ningyou7 were constructed with high mutant load, to provide a TILLING platform for functional genomics in Brassica napus, and for introduction of novel allelic variation in rapeseed breeding. • Forward genetic screening of mutants from the M2 populations resulted in iden- tification of a large number of novel phenotypes. Reverse genetic screening focused on the potentially multi-paralogous gene FAE1 (fatty acid elongase1), which controls seed erucic acid synthesis in rapeseed. A B. napus BAC library was screened, and loci in a reference mapping population (TNDH) were mapped to conclude that there are two paralogous copies of FAE1, one on each of the B. napus A and C genomes. • A new procedure is demonstrated to identify novel mutations in situations where two or more very similar paralogous gene copies exist in a genome. The procedure involves TILLING of single plants, using existing SNPs as a positive control, and is able to distinguish novel mutations based on primer pairs designed to amplify both FAE1 paralogues simultaneously. • The procedure was applied to 1344 M2 plants, with 19 mutations identified, of which three were functionally compromised with reduced seed erucic acid content. Key words: Brassica napus, EMS mutagensis, FAE1, mutant population, point mutations, seed erucic acid content, TILLING. New Phytologist (2008) doi: 10.1111/j.1469-8137.2008.02619.x © National Key Laboratory of Crop Genetic Improvement (2008). Journal compilation © New Phytologist (2008) Author for correspondence: Jinling Meng Tel: +86 27 87282457 Fax: +86 27 87280016 Email: [email protected] Received: 15 June 2008 Accepted: 18 July 2008 Introduction Rapeseed is a staple oilseed crop of enormous economic importance worldwide. The oil derived from crushing harvested seed is a major provider of calorific value to the human food chain, with variations in fatty acid profile including combinations of erucic acid, oleic and linolenic acid that are of industrial value as oils, lubricants, surfactants and high-value plastics (Metzger & Bornscheuer, 2006). There is an increasing need to focus rapeseed crop improvement on optimizing performance characteristics such as fatty acid composition, seed oil content and yield. More generally, crop genetic improvement needs to expand the available variation present within the existing gene pool in order to make significant advances in key traits. For many years, mutant populations generated with chemical mutagens such as ethylmethanesulfonate (EMS) and N-ethyl-N-nitrosourea (ENU) have been used to induce valuable variations in crop genomes (Konzak et al., 1976). However, whilst precursory construction of an EMS population for B. napus has recently been reported (Wu et al., 2007a), the resultant mutant populations have not been large enough to generate sufficient variation, nor has an efficient method for screening such variation been developed. There remains a requirement for
-
Upload
independent -
Category
Documents
-
view
3 -
download
0
Transcript of A functional genomics resource for Brassica napus: development of an EMS mutagenized population and...

www.newphytologist.org 1
Research
Blackwell Publishing Ltd
A functional genomics resource for Brassica napus: development of an EMS mutagenized population and discovery of FAE1 point mutations by TILLING
Nian Wang1, Yajie Wang1, Fang Tian1, Graham J. King2, Chunyu Zhang1, Yan Long1, Lei Shi1 and Jinling Meng1
1National Key Laboratory of Crop Genetic Improvement, Huazhong Agricultural University, Wuhan, 430070, China; 2Rothamsted Research, Harpenden,
Hertfordshire, AL5 2JQ, UK
Summary
• Two ethylmethanesulfonate (EMS) mutant populations of the semi-winter rape-seed cv. Ningyou7 were constructed with high mutant load, to provide a TILLINGplatform for functional genomics in Brassica napus, and for introduction of novel allelicvariation in rapeseed breeding.• Forward genetic screening of mutants from the M2 populations resulted in iden-tification of a large number of novel phenotypes. Reverse genetic screening focusedon the potentially multi-paralogous gene FAE1 (fatty acid elongase1), which controlsseed erucic acid synthesis in rapeseed. A B. napus BAC library was screened, and lociin a reference mapping population (TNDH) were mapped to conclude that there aretwo paralogous copies of FAE1, one on each of the B. napus A and C genomes.• A new procedure is demonstrated to identify novel mutations in situations wheretwo or more very similar paralogous gene copies exist in a genome. The procedureinvolves TILLING of single plants, using existing SNPs as a positive control, and isable to distinguish novel mutations based on primer pairs designed to amplify bothFAE1 paralogues simultaneously.• The procedure was applied to 1344 M2 plants, with 19 mutations identified, ofwhich three were functionally compromised with reduced seed erucic acid content.
Key words: Brassica napus, EMS mutagensis, FAE1, mutant population, pointmutations, seed erucic acid content, TILLING.
New Phytologist (2008) doi: 10.1111/j.1469-8137.2008.02619.x
© National Key Laboratory of Crop Genetic Improvement (2008). Journal compilation © New Phytologist (2008)
Author for correspondence:Jinling MengTel: +86 27 87282457Fax: +86 27 87280016Email: [email protected]
Received: 15 June 2008Accepted: 18 July 2008
Introduction
Rapeseed is a staple oilseed crop of enormous economicimportance worldwide. The oil derived from crushingharvested seed is a major provider of calorific value to thehuman food chain, with variations in fatty acid profileincluding combinations of erucic acid, oleic and linolenic acidthat are of industrial value as oils, lubricants, surfactants andhigh-value plastics (Metzger & Bornscheuer, 2006). There isan increasing need to focus rapeseed crop improvement onoptimizing performance characteristics such as fatty acidcomposition, seed oil content and yield. More generally, crop
genetic improvement needs to expand the available variationpresent within the existing gene pool in order to makesignificant advances in key traits. For many years, mutantpopulations generated with chemical mutagens such asethylmethanesulfonate (EMS) and N-ethyl-N-nitrosourea(ENU) have been used to induce valuable variations in cropgenomes (Konzak et al., 1976). However, whilst precursoryconstruction of an EMS population for B. napus has recentlybeen reported (Wu et al., 2007a), the resultant mutantpopulations have not been large enough to generate sufficientvariation, nor has an efficient method for screening suchvariation been developed. There remains a requirement for

www.newphytologist.org © National Key Laboratory of Crop Genetic Improvement (2008). Journal compilation © New Phytologist (2008)
Research2
development of large mutant populations, along with suitablehigh-efficiency screening methods suitable for rapeseedimprovement.
Functional characterization of genes is an importantcomponent of plant genomic research and is increasinglyinforming crop improvement. Loss of function mutants are ofparticular interest since they provide valuable evidence for therole of specific genes in regulatory, developmental, biochemicaland metabolic networks. Several general methods such asinsertional mutagenesis and RNA interference have been usedto obtain reduction-of-function or knockout mutations, andused successfully in model plants such as Arabidopsis (Arabi-dopsis thaliana) (Long & Coupland, 1998) and crops such asrice (Waterhouse et al., 1998). However, there are particularchallenges in applying these approaches to rapeseed researchand crop improvement, primarily because of either relianceon Agrobacterium T-DNA vectors for transmission or lack ofavailability of endogenous tagging systems. Transgenesis isinefficient in B. napus, and endogenous tagging is not acceptedby regulatory bodies and consumers in most countries. TILL-ING (targeting-induced local lesions in genomes) is a morerecent reverse genetic approach that has successfully beenapplied to both model plants such as Arabidopsis (McCallumet al., 2000) and crops such as rice (Till et al., 2007), maize(Till et al., 2004b) and wheat (Slade et al., 2005). TILLINGis based on screening populations of plants that have beentreated with traditional chemical mutagens that cause pointmutations, followed by discovery in genes of interest using avery sensitive detection method. The main advantage is theability to accumulate an allelic series of mutants with a rangeof modified functions, from wild-type to almost loss offunction (Slade et al., 2005). The original TILLING methodinvolves seeds that are mutagenized by treatment with EMS,which primarily introduces G/C to A/T transitions. Theresulting M1 plants are self-fertilized, and M2 individuals areused to prepare DNA samples for mutational screening,whilst an inventory of their seeds is established for future anddownstream research (Henikoff et al., 2004). The mutationalscreening relies on an enzyme which cleaves singleton DNAmismatches, as described by Oleykowski et al. (1998). SinceTILLING relies on use of chemical mutagens that inducegenome lesions randomly, it is relatively easy to construct asufficiently large mutant population that has a high probabilityof containing mutations in all gene loci. Moreover, TILLINGis applicable to targeting induction of mutations in genes ofinterest within the genome of almost any plant species (Tillet al., 2006). Species with duplicated genomes are more tolerantof induced mutation as a result of the functional redundancyconferred by paralogous sets of genes (Slade et al., 2005).Since the rapeseed genome is particularly complex, it is likelyto be quite tolerant of mutations induced by EMS. These con-siderations suggest that TILLING is better suited to rapeseedgenomic research and trait improvement than other methodsreported to date.
Although TILLING is potentially very powerful, there aresome difficulties in applying the method to rapeseed. Themost challenging issues arise from the need to develop genelocus-specific primer pairs within the complex rapeseedgenome. B. napus (AACC, 2n = 4x = 38; c. 1150 Mbp) is anamphidiploid species originating from a spontaneous hybrid-ization of Brassica rapa (AA, 2n = 2x = 20) and Brassica oleracea(CC, 2n = 2x = 18) (U, 1935), where the oginating dip-loids have been retained essentially intact (Li et al., 2005).Moreover, the Arabidopsis, B. rapa and B. oleracea genomesappear to have arisen from a common hexaploid ancestorc. 14.5–20.4 million yr ago (Lysak et al., 2005). Sequentialduplication events within ancestral genomes have resulted inregions that are represented as single copies within Arabidopsis,being present as three segmental copies within the B. rapa andB. oleracea genomes. This compounds the complexity of theB. napus A and C genomes (Mayer et al., 2001; Park et al.,2005; Yang et al., 2006). From recent comparative genomicstudies (Park et al., 2005; Town et al., 2006), it is possible toinfer the presence of six paralogous regions in B. napus, withrandom gene loss resulting in, on average, four intact genecopies, with additional genomic rearrangements contributingfurther pseudogene fragments. Among the intact paralogousgenes, some are able to be distinguished based on differencessuch as sequence lengths and intron composition. In suchcases, it is relatively trivial to obtain gene-specific primer pairsbased on sequence polymorphisms. Slade et al. (2005) havereported successful screening using a TILLING approach forthis class of multi-paralogous gene, in both hexaploid andtetraploid wheat. For multi-paralogous genes that differ byonly a few nucleotides among different paralogues, it is verydifficult to design gene-specific primer pairs to screen formutations, and also difficult to identify mutations reliably indistinct paralogues.
We were motivated to overcome the difficulties associatedwith application of TILLING in polyploid species, owing tothe potential benefits for functional gene analysis in the closestcrop relatives to the model Arabidopsis, and specifically forpotential application in genetic crop improvement of B. napus.We therefore tested our system by focusing on screening usingTILLING for mutations in the gene FAE1 (fatty acidelongase1), which had previously been shown by Southernblotting analysis to be present with at least two very similarparalogous copies within the B. napus genome (Barret et al.,1998). FAE1 is the key gene in seed erucic acid biosynthesisin rapeseed (Roscoe et al., 2001), and was originally cloned inArabidopsis by directed transposon tagging with the maizeelement Activator (Ac) (James et al., 1995). The product ofthe gene is a condensing enzyme that extends the chain lengthof fatty acids from C18 to C20 and C22 (Lassner et al., 1996).More recently, the restriction enzyme AvrII has been used todiscriminate between the two genes present in the A and Cgenomes of the two B. napus cultivars Zhongyou 821 andZhongshuang No. 9, which possess high (HEA) and low seed
© National Key Laboratory of Crop Genetic Improvement (2008). www.newphytologist.orgJournal compilation © New Phytologist (2008)
Research 3
erucic acid (LEA) content respectively. The B. napus FAE1gene copies are intronless, with 98% sequence similaritybetween the paralogues (Wu et al., 2007b). A referencedoubled haploid population (TNDH) developed by ourlaboratory from Ningyou7 (a Chinese semi-winter cultivar)and Tapidor (a European winter cultivar) was used to detectfunctional QTL for seed erucic acid content, with evidencefrom four independent field environments (Qiu et al., 2006).Two major seed erucic acid content QTL were detected, onelocated on linkage group/chromosome A8 (A genome) andthe other on C3 (C genome), accounting for c. 71% of thegenetic variation. Taken together, such evidence indicatesthere are likely to be two intact highly identical functionalFAE1 gene paralogues in B. napus, one in each of the A and Cgenomes.
Here we report development of a TILLING platform forB. napus, involving generation of two structured EMS muta-genized populations derived from homozygous cv. Ningyou7(one parent of the TNDH mapping population). In order todemonstrate the utility of these populations for gene discovery,a forward genetic screen was carried out, resulting in a largenumber of novel phenotypes. Reverse genetics was tested withina potentially multi-paralogous gene system. Comparativegenomic sequence analysis involved screening of a B. napus cv.Tapidor (the other parent of the TNDH population) BAClibrary to obtain a more precise estimate of paralogous FAE1gene copy. BAC-derived locus-specific sequences were thenmapped to the A8 and C3 chromosomes within the TNDHmapping population (Qiu et al., 2006). Reverse geneticscreening for FAE1 mutants by TILLING resulted in identi-fication of 19 mutations from 1344 M2 plants, of which threehad altered function as revealed by marked changes in theaccumulation of erucic acid.
Materials and Methods
Construction of EMS mutant population
Self-pollinated seeds of the Brassica napus L. DH line cv.Ningyou7 were prepared in summer 2004. For the pilot
dosage-response experiment (autumn 2004), dry high-qualitymature seeds of Ningyou7 were soaked in water for 8 h atroom temperature and then sets of 300 seeds were imbibed indifferent concentrations of EMS (Sigma-Aldrich Biotech,St Louis, MO, USA) aqueous solution ranging from 0.0% (w/v)to 1.2% at 0.2% intervals in a 50 ml flask at room temperaturein the dark for 18h. Seed germination rate and germinationtime of M0-treated seed was recorded, as well as percentageself-pollinated seed set of M1 plants derived from the M0seed (Table 1). In subsequent large-scale population generationexperiments (autumn 2005), seeds of Ningyou7 (generated in2004 and stored under optimum conditions) were treated ineither 0.6% or 0.3% EMS. Large-scale DNA isolation, andstorage of M1 and M2 seed followed the methods describedfor the Arabidopsis TILLING project (McCallum et al.,2000; Colbert et al., 2001; Greene et al., 2003).
Investigation of novel phenotypes amongst the two mutantpopulations was carried out on M2 plants grown in fieldconditions (Wuhan, China at 30°35′N 108°54′E). Morpho-logical characters scored included plant architecture, leaf, floraland reproductive morpholology, with mutant phenotypes beingcompared to untreated wild type plants. Phenotypic traitcategories are outlined in Table 2. Seed oil content of M3 seedwas estimated using near infrared spectroscopy (NIR) with astandard method (Mika et al., 2003).
BAC library screening and BAC clones analysis
The JBnB BAC library was developed from DNA isolatedfrom a B. napus doubled haploid line derived from cv. Tapidor(Rana et al., 2004) and screened by hybridization of a 33P-labeled426 bp Tapidor FAE1 genomic DNA fragment (amplified byprimer pair FAE426). Primer pairs FAE426 and Fae1primer1to 5 (Table 3, Fig. 1) were designed from B. napus FAE1cDNA sequence AF274750 (GenBank accession) and B. napusFAE1 promoter sequence AF275254. BAC DNA was isolatedusing a modified mini-alkaline lysis extraction procedure(Bendahmane, 1999). PCR walking on three representationalBAC clones (BAC1, BAC7 and BAC11) followed standardprocedures (Gibbons et al., 1991). PCR products were
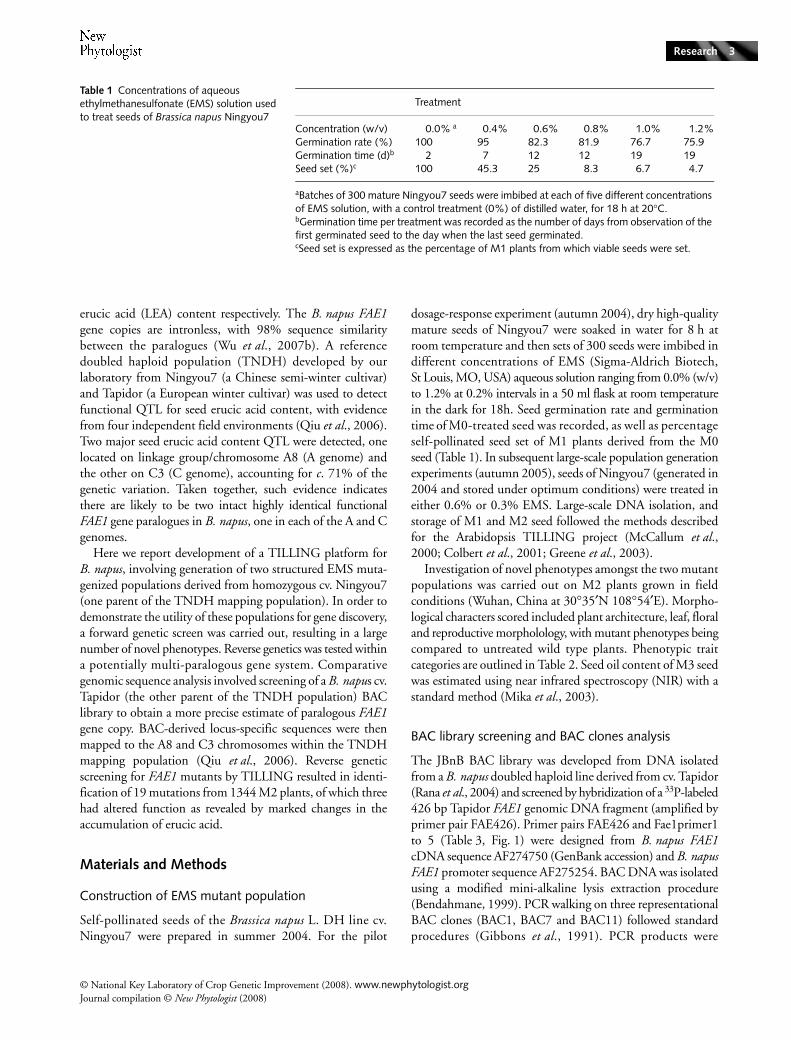
Table 1 Concentrations of aqueous ethylmethanesulfonate (EMS) solution used to treat seeds of Brassica napus Ningyou7
Treatment
Concentration (w/v) 0.0% a 0.4% 0.6% 0.8% 1.0% 1.2%Germination rate (%) 100 95 82.3 81.9 76.7 75.9Germination time (d)b 2 7 12 12 19 19Seed set (%)c 100 45.3 25 8.3 6.7 4.7
aBatches of 300 mature Ningyou7 seeds were imbibed at each of five different concentrations of EMS solution, with a control treatment (0%) of distilled water, for 18 h at 20°C.bGermination time per treatment was recorded as the number of days from observation of the first germinated seed to the day when the last seed germinated.cSeed set is expressed as the percentage of M1 plants from which viable seeds were set.

www.newphytologist.org © National Key Laboratory of Crop Genetic Improvement (2008). Journal compilation © New Phytologist (2008)
Research4
sequenced and six primer pairs (Fae1p1-1, Fae1p1-2Fae1p1-3, Fae1E1, Fae1p2-1 and Fae1E2) (Table 3, Fig. 1)were designed based on these sequences. Gene-specific primerpairs, S-FAE1-A8 and S-FAE1-C3, were designed to providespecific amplification products that distinguished betweenthe two groups of BAC clones.
Based on the FAE1 sequence obtained from the B. napus cv.Ningyou7 and Tapidor DH parents of the TNDH mappingpopulation, two polymorphic markers, FAE1-A8 and FAE1-C3(using primer pairs M-Fae1-A8 and M-Fae1-C3, Table 3,
Fig. 1), were developed. This enabled us to identify and maploci in the context of the TNDH linkage map constructedby Long et al. (2007) using JoinMap 3.0 software (http://www.kyazma.nl/index.php/mc.JoinMap). Seed erucic acidcontent data were obtained from field trials of the TNDHpopulation conducted over four environments (Qiu et al.,2006). Seed erucic acid content QTLs were detected by thecomposite interval method (CIM) using Windows QTLcartographer 2.5 software (http://statgen.ncsu.edu/qtlcart/WQTLCart.htm).
Table 2 Summary of phenotypes observed in M2 Brassica napus plants from the two ethylmethanesulfonate (EMS)-treated (0.3 and 0.6%) populationsMorphological characters
No. of plants Percentage (%)
0.3% (2604 plants) 0.6% (7110 plants) 0.3% 0.6%
ArchitectureDwarf stature 3 9 0.12 0.13Increased stature 23 112 0.88 1.58others 34 189 1.31 2.66
FlowerColors
Pure white 7 13 0.27 0.18Light-yellow/creamy 25 98 0.96 1.38
Abnormal petal 21 123 0.81 1.73Abnormal stamen 36 209 1.38 2.94Flowers absent 5 27 0.19 0.38others 21 57 0.81 0.80
LeavesAbnormal appearance 35 213 1.34 3.00Abnormal color 37 145 1.42 2.04
Reproductiveinfertile 91 457 3.49 6.43
Mutants were categorized according to architectural, floral, leaf and reproductive traits. The numbers recorded represent characters scored on individual plants and thus may represent sibling aggregates. Furthermore, since the scores are nonexclusive, a single plant may contain more than one variation.
Table 3 Primer sequences used for PCR amplificationPrimer name Forward primer sequence (5′→3′) Reverse primer sequence (5′→3′)
FAE426 TACTCATGCTACCTTCCAC ACTACAACCCATGCCACCAAFae1primer1 CCCTGTTCATTTAATATTACTAGCG ACGTTCTTGAATCTTCCTCAFae1primer2 CCTCATAACCATCGCTCC ATGATAACTTGCTCCGTCTCTFae1primer3 GCTTGTTCCGTGTTGGTG AATCCGGGACGTAGTAATGTTFae1primer4 CCCGGATTTCAAACTTGCTA ATGCAGTGTTCCCAAGGACTAFae1primer5 CCCGGATTTCAAACTTGCTA AAATACTAGAACACCATTGFae1p1-1 TTCTCTTCTTTCCGCTTCCA TGGGTGTGATGAATGCTTCTFae1p1-2 GGAGAGGAAAAGAGGAGAGGA GACGACTCTGTCCGTGTTGAFae1p1-3 CATGAATTGAAACGAGAAGG TTTCAAACCACGTGTCACFae1p2-1 GGACCCATGGCAATAGCCAAG ACGTTCTTGAATCTTCCTCAFae1E1 GGGTCAGGCTTTAAGTGTAACAG CCAATCAATTCGGGAGCCACFae1E2 GGGTCAGGCTTTAAGTGTAACAG CCGTGCGAGAGCTATTAGGACM-FAE1-A8 ATCTCCGTGAGGAGCCAGAGAGAC ACGTTCTTGAATCTTCCTCAM-FAE1-C3 CCCGGATTTCAAACTTGCTA TTAACAGAGATCCTTAACCCCS-FAE1-A8 TACTCATGCTACCTTCCAC CCGTGCGAGAGCTATTAGGACS-FAE1-C3 TACTCATGCTACCTTCCAC CCAATCAATTCGGGAGCCAC

© National Key Laboratory of Crop Genetic Improvement (2008). www.newphytologist.orgJournal compilation © New Phytologist (2008)
Research 5
FAE1 mutation screening
The primer pair FAE426 was used to screen the EMS mutantpopulations. The forward primer was labeled at the 5′ endwith 700 nm IRD fluorescence and the reverse primer waslabeled with 800 nm IRD fluorescence (MWG Biotech, Inc.,Ebersberg, Germany). DNA samples isolated from M2 plants ofthe 0.6 and 0.3% EMS populations were screened individually,with the screening protocol following that used in rice andArabidopsis TILLING projects (Till et al., 2004b; Till et al.,2006). CEL 1 was extracted from celery and stored in −80°C(Till et al., 2004a). FAE426 with unlabeled primer was usedto amplify products from genomic DNA of M2 plants whichhad yielded novel cleaved bands at 700 and 800 nm in theTILLING gel. The PCR products were electrophoresed onagarose gel so as to recover the 426 bp bands and then these426 bp PCR products were sequenced.
Mutation sequence analysis
Sequence derived from mutant and wild-type (WT) plantswas analyzed to determine the likelihood of changes affectingprotein function. The PARSESNP (Project Aligned RelatedSequences and Evaluate SNPs; http://www.proweb.org/parsesnp/) and SIFT (Sorting Intolerant from Tolerant; http://blocks.fhcrc.org/sift/SIFT) software packages were used topredict the severity of each mutation (Ng & Henikoff, 2003;Taylor & Greene, 2003). SIFT values < 0.05 and PSSMscores > 10 indicated that the nucleotide change was likely toaffect gene function.
The 426 bp sequences obtained following TILLINGscreening were used in BLAST comparison against the com-prehensive nucleotide database of available Brassica sequencesserved at BrassicaDB (http://brassica.bbsrc.ac.uk/BrassicaDB/).All related B. napus DNA sequence accessions that weredetected with an E-value < 10–15were batch-downloaded fromthe NCBI GenBank nucleotide database. The sequences werealigned using a local implementation of the NCBI standaloneBlast software (packageblast-2.2.18-ia32-win32.exe, http://www.ncbi.nlm.nih.gov/BLAST/download.shtml). The 426 bp
sequence was used as query and those downloaded sequencesthat appeared to contain a sequence error (a different basepresent in just one downloaded sequence) were deleted.Default parameters were used in Blast, except for the outputformat (its format was ‘m 4’ so that SNPs can be easily visual-ized). SNPs were assigned where different bases at a givennucleotide position appeared in two or more sequences.
Phenotypic and genotypic analysis
The erucic acid content of seeds harvested from WT Ningyou7and M2 plants which contained FAE1 mutations was measuredby gas chromatography (GC) using standard methods (Kaushik& Agnihotri, 2000) with multiple seeds tested from eachplant. Wild-type Ningyou7 plants were grown in the samefield and seeds were harvested at the same time as the mutantpopulation. Single seed of the M3 generation of the twomutants L080-1 and N004-1 was used to establish the erucicacid content, using a half-seed GC analysis method (Conteet al., 1989).
To detect the location of mutations in fae1 paralogues inthe A8 or C3 chromosomes, M2 DNA from mutants L080-1and N004-1 was used to amplify products using the genelocus-specific primer pairs S-FAE1-A8 and S-FAE1-C3. PCRreactions were carried out with proof-reading pfu taqpolymerase (Tiangen Biotech, Inc., Beijing, China), and thepurified PCR products sequenced.
Genetic analysis of the two mutants L080-1 and N004-1involved ANOVA and multi-comparision analysis of pheno-typic and genotypic data, using SAS 8.2 software.
Results
Mutant population development
We first established an optimal concentration of EMS fortreatment of B. napus seeds required to generate a mutantpopulation. Three hundred self-pollinated seeds from aNingyou7 DH line were treated with EMS at each of sevendifferent concentrations, from 0.0 to 1.2% (w/v), at 0.2%
Fig. 1 Regions of the FAE1 BAC clones covered by primer pairs on the two groups (the names of the primer pairs are marked above their corresponding amplicons). Ten BAC clones in group 1 correspond to BnC3.FAE1 and three BAC clones in group 2 correspond to BnA8.FAE1. Lines represent 5′ and 3′ genomic sequence of FAE1 (c. 1 kb for 5′ and 3′ of BnA8.FAE1, c. 3.5 kb for 5′ of BnC3.FAE1 and c. 1 kb for 3′ sequence); rectangles represent coding region (1521 bp). Lines with triangles at the end indicate specific primers of BnA8.FAE1; lines with circles at the end indicate that primer pair can amplify both BnA8.FAE1 and BnC3.FAE1; lines with diamonds at the end indicate specific primers of BnC3.FAE1. Fae1primer1 and Faeprimer5 were used in the PCR assay in Fig. 4.

www.newphytologist.org © National Key Laboratory of Crop Genetic Improvement (2008). Journal compilation © New Phytologist (2008)
Research6
intervals. The M1 germination rate, germination time andself-pollinated percentage seed set were recorded (Table 1). AtEMS concentrations of 0.8% or above, the germination ratewas < 85%, and germination time was prolonged. Almost allthe surviving M1 plants were unable to set seed throughself-pollination, with M2 seed set < 10%. At 0.6% EMS,25% of M1 plants had sufficient self-pollinated seeds, with agermination rate of c. 85%. An EMS concentration of 0.6%was therefore selected as an optimal treatment for Ningyou7seeds in developing the mutant population. To determinewhether a lower EMS concentration, generating a higher rate
of M1 self-pollinating seed set, would be suitable for TILLING,a 0.3% EMS concentration was also selected to develop asecondary mutant population. Between one and four M2 plantswere generated by random selection from each M1 plant. Intotal, 3926 lines were developed from the 0.6% EMS-treatedpopulation with 7110 M2 plants, and a further 933 lines fromthe 0.3% EMS-treated population with 2604 M2 plants(Table 4). DNA was extracted from all M2 plants and dilutedto the same concentration suitable for PCR reactions. Self-pollinated seeds were also harvested from the individual M2plants and stored in a seed bank.
Forward genetic screening of mutants in the M2 population
To evaluate and compare the effect of mutagenisis in the twopopulations through forward genetics, all M2 plants werescrutinized for visible variant phenotypes. These included keydevelopmental characters throughout the growing season,such as plant architecture, leaf, floral and reproductivemorpholology (summarized in Table 2). As expected, thepopulation treated with 0.6% EMS yielded a higherpercentage of mutant phenotypes, with examples of visiblephenotypic variants shown in Fig. 2. In order to assessvariation in total seed oil content, 652 M3 seeds from the
Table 4 Summary characteristics of the two Brassica napus cv. Ningyou7 ethylmethanesulfonate (EMS) populations
0.3% EMS 0.6% EMS
M1 generationNumber of plants ~ 1080 ~ 13 000M2 generationNumber of lines 933 3926Number of plants 2604 7110Mutations detected 4 15from x M2 plants 614 730Mutation load within plant 9174 28 941Mutation density per plant 130.8 kb 41.5 kb
Fig. 2 Examples of phenotypic mutants observed in the ethylmethanesulfonate (EMS)-treated M2 populations of Brassica napus. (a) Mutant plant with stocky (reduced stature) architecture; (b) curly leaf phenotype; (c–f) floral mutants: anatropous inflorescence (c); white flowers (d); absent and distorted stamens (e); aborted buds (f). Both (e) and (f) were also recorded as infertile mutants.

© National Key Laboratory of Crop Genetic Improvement (2008). www.newphytologist.orgJournal compilation © New Phytologist (2008)
Research 7
0.6% EMS population and 516 from the 0.3% EMS populationwere compared with untreated seed (WT). ANOVA of thesethree groups indicated no significant difference in oil contentbetween the two EMS populations, although a significantdifference (P < 0.01) was observed between the 0.6% EMSpopulation and WT (n = 34). A significant difference (P < 0.01)was also detected between the 0.3% EMS populations andWT. The frequency distribution of oil content amongst a totalof 1168 M3 seeds (Fig. 3) shows a maximum value of 47.8%,considerably higher than WT (38.36 ± 1.10%).
FAE1 homologous in B. napus cv. Tapidor and Ningyou7
To estimate the copy number of paralogous FAE1 genes in theB. napus AC genome, and to identify sequence differencesamongst these copies, a 426 bp probe generated from Tapidorgenomic DNA was used to screen the JBnB BAC library,which was developed from the doubled haploid B. napus cv.Tapidor (Rana et al., 2004). 13 BAC clones (JBnB060D12,JBnB015C15, JBnB060D12, JBnB154K14, JBnB170L17,JBnB160P09, JBnB079L09, JBnB009C03, JBnB065M23,JBnB149N05, JBnB032N18, JBnB178F05, and JBnB108J15),
identified here as BAC1 to BAC13, were identified withpositive hybridization signals. Five primer pairs were designedto amplify each of these BAC clones (Fae1primer1 toFae1primer5, see Table 3, Fig. 1). Fae1primer5 allowedclassification of the BAC clones into two groups, with BAC4,BAC7 and BAC10 in group 2 generating single amplifiedbands of the same size when visualized on agarose gels, andno products obtained from the remaining BACs of group 1(Fig. 4b). PCR with Fae1primer1 resulted in products ofpredicted length from all BAC clones apart from BAC11(Fig. 4a). PCR-walking was then used to obtain the 5′ and 3′sequences of the FAE1 gene in each of three clones (BAC1,BAC4, BAC11) representing the different classes. The end ofthe BAC11 insert was located near the FAE1 promoter region,which explained why the Fae1primer1 was unable to amplifya product from this BAC, and suggested that this clone mayin fact belong to the same locus-class as BAC1. We thenobtained sequences flanking the FAE1 gene from BAC1,including c. 3.5 kb from 5′ and 1 kb from 3′ regions, togetherwith c. 1 kb each of 5′ and 3′ sequence from BAC4. Usingthese sequences, six primer pairs were designed (Fae1p1-1,Fae1p1-2, Fae1p1-3, Fae1p2-1 amplifying the 5′ end region,Fae1E1, and Fae1E2 amplifying the 3′ end region) (Table 3,
Fig. 3 Distribution of Brassica napus seed oil content within 1168 M3 plants (652 samples were from the 0.6% ethylmethanesulfonate (EMS)-treated population, and 516 were from the 0.3% EMS population). ANOVA did not detect any significant difference in the oil content between the two populations. However, the transgressive distribution appeared greater in the 0.6% EMS population, which contained both the maximum (30.62%) and minimum (47.93%) oil contents. The oil content of wild-type (WT) Ningyou7 was 38.36 ± 1.10% (n = 34). The maximum oil content of WT was 40.89% and the minimum was 36.36%. The values recorded were from M3 seed samples scored on an individual plant basis, and thus may represent sibling aggregates.
Fig. 4 PCR assay to analyze Brassica napus cv. Tapidor BAC clones. Thirteen BAC clones were amplified with Fae1primer1 (a) and Fae1primer5 (b). Lane numbers are indicated on the figures, with M representing the DNA ladder DL2000 (Promega. Inc). (a) Fae1primer1 was not able to amplify a product from BAC11. (b) Fae1primer5 was able to classify the 13 BAC clones into two groups. Group 2 included BAC4, BAC7 and BAC10, with the remainder in group 1. Subsequent investigation revealed BAC11 to be in group 1.

www.newphytologist.org © National Key Laboratory of Crop Genetic Improvement (2008). Journal compilation © New Phytologist (2008)
Research8
Fig. 1). In combination, these primers were able to be used inPCR reactions to generate products that enabled classificationof the 13 BAC clones into two groups, corresponding to twodistinct loci. The results were consistent with those obtainedwith Fae1primer5 (data not shown).
To further characterize the paralogues within the B. napusAC genomes, the FAE1 gene and its flanking sequence wereobtained from each of the 13 BAC clones using the six specificprimer pairs. The 10 BAC clones in group 1 were identicalthroughout c. 6kb of sequence (3.5 kb was 5′ of the FAE1 startcodon, 1 kb was 3′ of the FAE1 stop codon, with a codingregion of 1521 bp) (Fig. 1). The three BAC clones in group 2also showed no sequence difference within the c. 3.5 kb region(with 1 kb 5′ end of the FAE1 start codon, and 1 kb 3′ end ofthe FAE1 stop codon) (Fig. 1).
Two markers, FAE1-A8 and FAE1-C3, corresponding toeach group of BAC clones, were found to be polymorphicbetween the parents of the TNDH mapping population.These enabled us to locate the existing FAE1 BAC clones inthe context of the TNDH genetic linkage map, on chromo-somes A8 and C3. Both markers co-located with the peaks ofthe QTLs for seed erucic acid content (Fig. 5), indicating thatthese corresponded to the two paralogous copies of FAE1 inthe B. napus genome. The two genes were designated asBnaA.FAE1.a and BnaC.FAE1.a, according to the standardnomenclature of Ostergaard & King (2008). However, tosimplify subsequent reference within this paper, BnA8.FAE1and BnC3.FAE1 are used to represent paralogues in the A8
and C3 chromosomes of B. napus, respectively. Two genelocus-specific primer pairs, S-FAE1-A8 and S-FAE1-C3,corresponding to BnA8.FAE1and BnC3.FAE1, respectively,were designed from the sequence flanking FAE1. These enabledus to obtain complete genomic sequences for both paraloguesfrom the WT Ningyou7 DH parent of the EMS mutant popu-lations that included 5′ and 3′ flanking regions. Alignment ofthese sequences (GenBank accessions: EU543282 andEU543283) with cDNA sequences present in the GenBanknucleotide database confirmed the lack of introns within thisgene, as reported elsewhere (Wu et al., 2007b). The codingregion of both paralogues was 1521 bp in Ningyou7, with asequence similarity of 98.6%. Twenty-one SNPs were identi-fied between the two paralogues. There was also very little(c. 6%) variation in the c. 400 bp upstream region of the startcodon.
Screening for FAE1 mutations in the EMS mutant populations
To screen for mutations in EMS-treated populations usingTILLING, it is essential to utilize gene-specific primer pairs(Colbert et al., 2001). The maximum length of fragment thatcan be screened using the Li-Cor 4300 polyacryamide gelsystem is just over 1 kb. Although other authors have reporteddetection of mutants by TILLING in PCR products in therange 300 bp–1.6 kb (Slade et al., 2005), our experience wasthat we observed very diffuse bands with PCR fragments of
Fig. 5 Mapping of the two FAE1 paralogues in the context of the reference TNDH linkage groups, and detection of QTLs for seed erucic acid content. The two linkage groups were constructed based on data presented in Qiu et al. (2006) and Long et al. (2007). BnA8.FAE1 was located on Brassica napus chromosome A8, and BnC3.FAE1 was located on chromosome C3. Two hundred and two TNDH lines were grown in four environments, two in the south of China (Wuhan, at 30°35′N 108°54′E) and two in the north (Dali, at 34°52′N 109°56′E). Linkage map construction and QTL detection followed the methods outlined by Qiu et al. (2006), with the length of the vertical lines representing 95% confidence intervals of these QTLs. All QTLs shown were significant at P < 0.01.

© National Key Laboratory of Crop Genetic Improvement (2008). www.newphytologist.orgJournal compilation © New Phytologist (2008)
Research 9
> 1 kb on the Li-Cor 4300 gels. Moreover, although we wereable to use gene-specific primer pairs for each of the paralogouscopies of FAE1, the forward and reverse primers matchedpositions remote from the start and stop codons. As a result,it was not possible to obtain gene-specific primers thatcorresponded to the coding region suitable for TILLING ofmutations within each of the two highly similar paralogues ofFAE1. We therefore designed the primer pair FAE426, so thatit simultaneously amplified 426 bp from both paralogues, forwhich five SNPs already existed to distinguish the WT alleles,and used this in TILLING for novel mutations in our EMSpopulations.
Co-amplification of two similar genes in a pooled samplecan lead to an increased error (Cooper et al., 2008). We thereforecarried out direct screening for novel mutations from DNAisolated from individual M2 plants, using the standard TILL-ING protocol (Till et al., 2006). TILLING gels were scannedusing a Li-Cor 4300. Putative mutant lines and location ofnucleotide changes were validated by sequencing of the PCRproduct generated from unlabeled FAE426 primers. Doublepeaks within the sequence trace not associated with the fiveknown paralogous SNPs positions indicated an inducednucleotide change, which also corresponded with the cleavedband position in the Li-Cor TILLING gel. Fig. 6 shows one
Fig. 6 Mutation within the FAE1 gene fragment from L209-1 identified by TILLING. 700 nm and 800 nm Li-Cor 4300 scanning gel photos are shown in (a) and (b). Two novel bands were found in the same lane, respectively, in both the 700 and 800 nm images, and these are magnified in (e) and (f). (c, d) Partial sequence trace corresponding region in L209-1 (c) and in wild type (d). The primer pair FAE426 was designed to amplify the two FAE1 paralogues simultaneously – this is demonstrated at position 480 where double peaks are observed in the sequence trace (which indicates an induced nucleotide change G to A in one of the two paralogous copies at this position), whilst a single peak is observed in the wild type at the same position (indicates both of the two paralogous copies FAE1 in this position are G).

www.newphytologist.org © National Key Laboratory of Crop Genetic Improvement (2008). Journal compilation © New Phytologist (2008)
Research10
example of a mutation detected within M2 plant L209-1 (M2plant field accession NO). From the Li-Cor gel system,700 and 800 nm images are obtained (Fig. 6a,b). The cleavedbands corresponding to the induced mutation were located atc. 230 bp in the 700 nm image, and at c. 190 bp in the800 nm image, thus totaling 426 bp. The sequence tracesindicate the mutated region of L209-1 (Fig. 6c) and thecorresponding region of nontreated WT Ningyou7 (Fig. 6d).In total, 19 mutations were discovered amongst 1344 M2plants screened (one plant from each M2 line) (Table 5).
Relationship between EMS concentration and mutation frequency
Of the 19 mutations detected, 15 arose from the 0.6% EMSmutangenized population, following screening of 730 M2plants, and four from the 0.3% population following screeningof 614 M2 plants (Table 5). Given that FAE426 was designedto amplify two FAE1 paralogous copies simultaneously, thiscorresponds to a single screen of 852 bp within the B. napusgenome. Within the 0.6% EMS population, the mutationfrequency was calculated at one mutation per 41.5 kb ineach plant ((0.426 kb × 2 × 730 plants)/15 mutations = onemutation every 41.5 kb) and 28 941 mutations per plant
(1 200 000 kb per plant/one mutation every 41.5 kb = 28 941mutations per plant), and within the 0.3% EMS populationat one mutation per 130.8 kb ((0.426 kb × 2 × 614 plants)/four mutations = one mutation every 130.8 kb) and 9174mutations per plant (1 200 000 kb per plant/one mutationevery 130.8 kb = 9174 mutations per plant) (Table 4).
Of the 19 FAE1 mutations, 18 represented G/C to A/Ttransitions and one represented an A to C transversion(Table 5), which is a close fit to previous reports that EMSmutagenesis primarily induces G/C to A/T transitions.
A comparative analysis of natural FAE1 SNPs in rapeseed cultivars and in the mutant population
Ecotilling is a new approach for detecting SNPs in naturalpopulations (Comai et al., 2004). To determine whether the19 induced mutations were present within existing linesrepresenting selected varieties, breeding or experimentalmaterial, an in silico Ecotilling analysis was carried out. A totalof 112 B. napus FAE1 sequences that corresponded to the426 bp region screened in our TILLING experiments werealigned. This included 101 ESTs (note that this gene isintronless) and 11 genomic sequences. Once sequence errorswere deleted (i.e. a different base present in just one downloaded
Table 5 FAE1 mutations identified by TILLING
M2 plant Nucleotide change Amino acid change PSSM differencec SIFT scored Seed erucic acid content (%)
L324-1 C266Ta P89Lb 47.77L457-1 C347T T116M 50.27N050-1 G384A K128= 48.77N057-1 G391A E131K 11.2 0.22 43.56N004-1 G400A G134S 21.3 0.01 38.33K026-1e C403T L135= 49.34L297-1 G412A E138K 10.8 0.05 33.19N128-1 C420T H140= 52.53L518-1 C446T P149L 48.77N142-1 C449T P150L 49.34N184-1 C450T P150= 45.58K024-1e G453A R151= 48.59L421-1 G478A E160K 50.08L209-1e G480A E160= 51.26L496-1 G508A E170K 50.78L495-1 A542C K181T 11.9 0.17 38.26L080-1e C599T S200F 19.4 0.00 19.46N377-1 C627T L209= 48.56L286-1 G629A R210Q 19.9 0.01 no seed
aThe code for nucleotide change refers to mutations at specific positions in the genomic sequence of the FAE1 gene, referenced from the from the first base (A) of the start codon. Thus, C266T indicates that the 266th nucleotide had a transition from C to T.bThe consequence of the nucleotide mutation in the FAE1 protein chain is referred to by a code whereby the initial and resulting amino acid is shown, referenced to the amino acid position of the start codon. Thus, P89L indicates that the 89th amino acid is predicted to be modified from P to L. =, indicates no change (synonymous mutation).c, dSIFT scores < 0.05 and PSSM value > 10 are predicted to be deleterious to gene function.ePlants indicated arose from the 0.3% EMS treated population, with the remainder from the 0.6% ethylmethanesulfonate (EMS)-treated population. Bold type indicates where SIFT scores or PSSM value were greater than the threshold for likelihood of causing a deleterious effect on protein function.

© National Key Laboratory of Crop Genetic Improvement (2008). www.newphytologist.orgJournal compilation © New Phytologist (2008)
Research 11
sequence), nucleotide polymorphisms were detected at 18positions, each of which was distinct from the 19 inducedpoint mutations (Table 6).
Functional characterization of fae1 mutants with reduced seed erucic acid content
In total, seven (37%) synonymous mutations and 12 (63%)mis-sense mutations were identified from TILLING screeningof 1344 M2 plants. Both SIFT score and PSSM values wereused to predict whether the base change for individualmutations would be deleterious to FAE1 gene function (Ng &Henikoff, 2003; Taylor & Greene, 2003). Four of the 19mutations were predicted to affect the FAE1 protein functionsince both the SIFT score and PSSM values for these eventswere at least at the threshold of severity (Table 5). Seed erucicacid content was determined by GC for M3 seeds of 18available plants (multiple seeds tested from each plant). TheM3 seed erucic acid content of plants N057-1, N004-1,L297-1 and L080-1 was lower than that of the wild-type. Thiscorresponded well with the predicted probabilities of alteredgene function derived from the four mutations (Table 5). Two
individual M2 plants, L080-1 and N004-1, were selected toidentify the mutated locus within the genome using gene-specific primer pairs S-FAE1-A8 and S-FAE1-C3 (Table 3),which amplified BnA8.FAE1 and BnC3.FAE1, respectively.The M2 mutant plant L080-1 was recessive homozygotebna8.fae1at position 599bp (assigned mutant a8fae1-599),while the M2 plant N004-1 was heterozygous BnC3.FAE1/bnc3.fae1 at 400 bp (assigned mutant c3fae1-400) (Fig. 7).Alignment of these sequences to the corresponding paralogouscopies in WT Ningyou7 showed that BnC3.FAE1 in L080-1corresponded to WT BnC3.FAE1, and that BnA8.FAE1 inN004-1 corresponded to WT BnA8.FAE1. We thereforededuced that in each mutant line the paralogous copycontained no other induced mutations.
Thirty-one M3 seeds were harvested from the M2 mutantplant N004-1, and the seed erucic acid content was deter-mined using half of each seed. This involved dissection andanalysis of one cotyledon. The remaining half seed includedthe viable shoot apical meristem and radicle, which wasgerminated and grown to yield M3 plants, allowing subse-quent genetic analysis. The genotypic segregation in 31 M3plants displayed Mendelian inheritance with 9 C3FAE1-400/C3FAE1-400 : 16 C3FAE1-400/c3fae1-400 : 6 c3fae1-400/c3fae1-400, corresponding to a 1 : 2 : 1 ratio supported by achi-squared test (χ2 = 0.6130). The erucic acid content in the31 seeds was significantly (P < 0.01) associated with theirgenotypes tested by LSD (least significant difference) all-pairwise comparison test multiple comparison (Table 7). Weconclude that the point mutation in c3fae1-400 appears to becausal in reducing the seed erucic acid of N004-1. Moreover,no significant difference was observed between the seed erucicacid content (19.21 ± 0.53%) among 29 M3 seeds of L080-1with ANOVA analysis, consistent with a recessive homozy-gote genotype at bna8.fae1.
Discussion
We have successfully constructed two rapeseed mutantpopulations suitable for both forward and reverse geneticdetection methods. In the forward genetic screening of mutants,a large number of novel mutated phenotypes were identified,and many of these represent a valuable genetic resource affecting
Table 6 In silico Ecotilling with Brassica napus FAE1
Positions 264a 284 311 312 363 369SNPs G/Ab G/C A/T C/T G/C C/TPositions 393 417 462 531 591 606SNPs G/A C/T T/G T/C A/T A/T/GPositions 623 635 648 657 666 667SNPs A/Dc A/D T/D G/T/A G/T G/T/Dd
aPosition from the FAE1 start codon ATG, to the 264th nucleotide.bIndicates that two alternative nucleotides were detected at this position, with G/A denoting that G was prevalent in some accessions, and A in others.cIndicates the presence of an indel – with A/D denoting that A was present in some accession, whereas a deletion was present at the corresponding position in others.dIndicates the presence of either two alternative nucleotides (G/T) or a deletion at this position. Comparison of the 18 SNPs to the 19 ethylmethanesulfonate (EMS)-induced mutations (Table 5) indicates that there was no overlap in the distribution of nucleotide changes.
Table 7 Genetic analysis of the Brassica napus M3 generation from the heterozygous mutant c3fae1-400 Plant number
Seed erucic acid content (%)
LSDa all-pairwise comparisons test
C3FAE1-400/C3FAE1-400 9 52.01 ± 1.14 Ab
C3FAE1-400/c3fae1-400 16 45.71 ± 0.85 Bc3fae1-400/c3fae1-400 6 31.83 ± 1.39 C
a Least significant difference multiple comparisons.bSignificance at P < 0.01.

www.newphytologist.org © National Key Laboratory of Crop Genetic Improvement (2008). Journal compilation © New Phytologist (2008)
Research12
crop traits such as male sterility, reduced stature and plantswith increased oil content. In the reverse genetic TILLING ofmutants, we screened 1344 M2 plants representing 1344distinct lines (i.e. siblings were not screened), and detected atotal of 19 FAE1 mutations, three of which had a change offunction. In addition, in silico Ecotilling analysis demonstrateda clear distinction between sites of natural and induced SNPs.This is very encouraging for the application of TILLINGwithin rapeseed crop genetic improvement as a highly efficientmethod for generating new genetic resources for breeding. Weare also able to calculate that if a 1kb gene fragment were tobe screened within the 0.6% EMS population, with a singleplant selected from each line, then c. 100 mutations would bedetected following a complete screening of the 0.6% EMSpopulation (a total of 3926 lines). This suggests that thepopulation carries a high mutation load, and is a valuableresource for breeding and research. However, for practicalapplication of induced mutation within crop improvement, itis necessary to adopt a process that reduces the backgroundcaused by the mutations at unlinked loci. Such a schemashould involve backcrossing to the WT or target elite cultivar,
using molecular marker and phenotypic tracking for recurrentselection of the mutant locus. It is also important to eliminateepistatic effects and carry out controlled self-pollination of thecandidate mutant plant before segregation analysis of themutation identified and modified phenotype. Such informationcan be substantiated by analysis of transcript profile and invitro protein expression for the target gene (Heckmann et al.,2006). We conclude that the populations generated areefficient for exploring novel sources of variation using bothforward and reverse genetics approaches to screening mutants.
Although we were able to demonstrate development of anefficient new research platform through discovery of threenovel induced functional low erucic acid mutant alleles, it isimportant to determine the optimal mutagen dosage forB. napus. The EMS concentration is a key factor in developingsuch populations, with higher concentrations leading to highermutation frequencies. However, any higher mutation loadachieved is offset by the effect of EMS on reducing seed set,viability and germination (Greene et al., 2003; Kim et al.,2006). For B. napus there have been no prior reports of anoptimal mutagen dosage to guide development of a forward
Fig. 7 Location of FAE1 mutations in lines L080-1 and N004-1. DNA from single M2 plants (L080-01 and N004-1) was amplified with the primer pair FAE426. (a, d) The amplified PCR products were sequenced and partial sequence traces are shown with double peaks at positions of nucleotide transition. Two gene-specific primer pairs, S-FAE1-A8 and S-FAE1-C3, amplified DNA from M2 plant of the two mutants L080-1 and N004-1, and the PCR products were sequenced. (b) The partial FAE1 sequence trace of L080-1 from chromosome A8. (c) Corresponding sequence from the C3 gene copy. (e) Partial FAE1 sequence trace from N004-1 in A8 chromosome. (f) Sequence from N004-1 corresponding to the chromosome C3 paralogue. From these four trace files, it was possible to deduce that a C to T transition mutation had occurred in the L080-1 FAE1 genomic sequence corresponding to the gene copy located on chromosome A8. Similarly, it was easy to deduce that a G to A transition mutation within the N004-1 FAE1 genomic sequence corresponded to the paralogue located on chromosome C3. Moreover, it was possible to predict that the FAE1 mutation within the L080-1 M2 plant was homozygous, whilst the FAE1 mutation within the N004-1 M2 plant was heterozygous.

© National Key Laboratory of Crop Genetic Improvement (2008). www.newphytologist.orgJournal compilation © New Phytologist (2008)
Research 13
genetics or reverse genetics TILLING population. Here, wefound that at EMS concentration of 0.6% yielded a calculatedmutation density of one per 41.5 kb in each plant, comparedwith almost a third of that in the population treated at 0.3%EMS. These estimates may not accurately reflect the truemutation density of the two EMS populations, as it was notpossible to screen the first 50 bp in a TILLING gel. However,the mutation frequencies within our two B. napus mutantswere within the range of those reported elsewhere for monocotand dicot species, with one mutation per 24 kb reported inhexaploid wheat, one per 40 kb in tetraploid wheat (Sladeet al., 2005), 300 kb in rice (Till et al., 2007), 100 kb in barley(Hordeum vulgare L.) (Caldwell et al., 2004), and 170 kb inArabidopsis (Greene et al., 2003). In the forward geneticinvestigation, 23.25% M2 plants displayed observablemutant phenotypes in the 0.6% EMS population, comparedwith 12.98% in the 0.3% EMS population. These estimatesmay be low and not reflect the true mutant load, as someplants may carry more than one mutant phenotype. Moreover,when M2 plants were grown in field conditions, we foundthat the performance within the 0.3% EMS population wasstronger than the 0.6% population. At concentrations ofEMS above 0.6% we found that M1-treated Ningyou7 plantsset almost no seed. Therefore, taking into account the muta-tion frequency and the performance of mutagenized plants inthe field, we consider an EMS concentration between 0.3 and0.6% to be optimal for construction of mutant populations inB. napus and probably also in other amphidploids of theBrassica triangle of U, for example B. juncea (2n = 36; ABgenomes) and B. carinata (2n = 34; BC genomes).
Since the original report of TILLING in 2000, the tech-nique has successfully been applied to many crops, notably inrice and wheat (Slade et al., 2005; Till et al., 2007). However,we are not aware of other reports to date of its applicationwithin any Brassica species. The main challenges arise fromthe complex genome of B. napus in which most of genes aremulti-paralogous. This reduces the ease with which genelocus-specific primers can be designed, and also limits theability to locate the mutations unequivocally to specific par-alogous copies. Here we have successfully demonstrated thatTILLING technology can also be applied in polyploid cropssuch as B. napus that comprise multiple closely related com-plex segmentally duplicated genomes. We have been able toallocate target genes within the B. napus genome into twoclasses. The first class comprises those genes which occur asmulti-paralogous copies distinguished by clear sequence dif-ferences; and the second class includes multi-paralogous genesthat possess only minor sequence differences between differentcopies. It is a relatively trivial exercise to design gene-specificprimers for the first class. However, for the second class wehave developed a novel strategy that is based on using a primerpair that is designed to amplify all paralogous copies of thegene simultaneously, albeit from individual rather thanpooled DNA samples. The procedure is based on single plant
TILLING, to identify mutations in situations where two ormore very similar paralogous gene copies exist in a genome.We made use of existing SNPs as a positive control, anddemonstrated the ability to distinguish novel mutations,based on use of primer pairs designed to amplify both FAE1paralogues simultaneously. Slade et al. (2005) reported thatusing a primer pair that could amplify at least two gene copieswould be less efficient. However, in our experiments we foundthat these types of primers provide a powerful approach tomutant detection. The precondition for successful screeningof mutations using this approach is that the target fragmentshould be highly conserved amongst the different paralogues.In the case of FAE1, we found just five SNPs between the twoparalogues in the 426 bp target region. These five SNPs werealso detected as background signals in the Li-Cor gel images,but did not detract from our ability to detect novel inducedmutations (Fig. 5). Within the TILLING gel, the cleavedbands that were present in all lanes with positions differingbetween 700 and 800 nm are predicted to arise from the SNPsthat exist between the two FAE1 paralogues. However, thecleaved bands that were detected in only one lane within the700 nm image, together with the corresponding cleaved bandin the 800 nm image, indicated discovery of a novel mutation.Therefore, we can conclude that with a modified TILLINGprimer design we are able to screen for mutations in any genein the EMS population of B. napus, even though this consistsof very complex duplicated genomes. This modified methodmay improve and widen the application of TILLING tech-nology for crop genomic research and improvement.
For rapeseed, the ability to achieve zero or low seed erucicacid (LEA) content has long been a major breeding objective,since erucic acid has been regarded as an antinutritionalcomponent in seed oil (Vles et al., 1978). In the 1960s, thefirst variant with LEA content was found in the animal feedrape cultivar ‘Liho’, with the first LEA rapeseed ‘Oro’ beingderived following introduction of the LEA variation from‘Liho’ (Downey & Craig, 1964). Subsequently, almost allLEA rapeseed cultivars have carried the LEA gene source from‘Liho’ or ‘Oro’, and so this single genetic resource has probablycontributed considerably to an inbreeding effect and associ-ated genetic erosion through linkage drag in rapeseed breedingprogrammes (Sharpe & Lydiate, 2003). Although breedershave successfully developed many LEA rapeseed cultivars,new sources of LEA are still required to modulate the relevantpathways within the seed oil fatty acid synthesis and modifi-cation pathways (Barker et al., 2007). Wu et al. (2008)reported discovery of a four base deletion in the FAE1 genethat resulted in LEA content within six Chinese rapeseedcultivars. However, this new source of LEA may still contain‘Liho’ or ‘Oro’ genetic background, as so many LEA rapeseedcultivars have derived from material including the parent‘Liho’ or ‘Oro’.
In the work reported here, the WT genotype of our EMSmutant population was Ningyou7, which is a high erucic acid

www.newphytologist.org © National Key Laboratory of Crop Genetic Improvement (2008). Journal compilation © New Phytologist (2008)
Research14
(HEA) content cultivar in China, distinct from many othermodern rapeseed cultivars (Meng et al., 1996). This cultivarhas little or no allelic genetic background in common with‘Liho’ or ‘Oro’, and so the three novel LEA content rapeseedalleles induced by TILLING in this research represent a uniquegenetic resource. The gene locus-specific primer analysisconfirmed that the mutant a8fae1-599 and c3fae1-400 wereseparately associated with bna8.fae1and bnC3.fae1, respec-tively. Seed erucic acid content in rapeseed has been shown tobe primarily controlled by these two genes (Barret et al., 1998;Qiu et al., 2006; Wu, Y et al., 2007; Wu et al., 2008). Thus across between these two mutants would be expected to generatea new LEA cultivar within what is otherwise a HEA back-ground. In conclusion, the three new LEA mutants, L080-1,N004-1 and L297-1, that were discovered by TILLINGcould be used as a new genetic resource for LEA rapeseedbreeding without collateral inbreeding effect and geneticerosion.
In conclusion, we have reported the application of TILL-ING to the generation and identification of a novel LEA geneticresource for rapeseed improvement. Although TILLING wasreported initially as a reverse genetic approach for Arabidopsisgenomic research (McCallum et al., 2000), it will increasinglybe very powerful to combine these two approaches to cropfunctional genomics and genetic improvement. Alongsidethis work focused on TILLING, QTL for rapeseed seed oiland erucic acid content have been detected in the TNDHgenetic mapping population, followed by development ofnear-isogenic lines (NILs) to resolve these two regions (F. Tian& J. Meng, unpublished). Fine mapping of the two QTLs hasresulted in FAE1 and several other genes being proposed asmajor candidates contributing to seed oil content (unpub-lished data). To validate gene function for these candidates,TILLING will now be the method of choice in B. napus,rather than conventional transgene knock-down approaches.Knockout of candidate gene function via TILLING overcomescomplications associated with RNAi or anti-sense in a multi-paralogous system, and has the advantage of greatly reducingthe time required to carry out such research. Taken together,we propose that the combination of QTL resolution makinguse of comparative genomic information and TILLING ofcandidates provides a powerful new approach to functionalcrop genomics, with the advantages of both forward andreverse genetics, and that this will accelerate genetic cropimprovement.
Acknowledgements
The authors thank to Dr Andy Phillips, Dr Hai-Chun Jingand Mr Carlos Bayon (Rothamsted Research, Harpenden,Herts AL5 2JQ, UK) for their support in TILLING techniquetraining to NW. The authors thank Dr Ian Bancroft (Depart-ment of Crop Genetics John Innes Centre, Norwich ResearchPark Colney Lane, Norwich NR4 7UH, UK) for his con-
structive suggestion to this work. The authors thank MrDianrong Li (Hybrid Rapeseed Centre of Shaanxi, Dali715105, China) for his contribution to the field work andNW thanks graduate students within his laboratory for theircontribution to the work of mutant population DNAextraction. Financial support for this work was provided bythe National Basic Research and Development Program(2006CB101600), the Key Project of Chinese Ministry ofEducation (103175), and the National Nature ScienceFoundation of China (30600373).
References
Barker GC, Larson TR, Graham IA, Lynn JR, King GJ. 2007. Novel insights into seed fatty acid synthesis and modification pathways from genetic diversity and quantitative trait loci analysis of the Brassica C genome. Plant Physiology 144: 1827–1842.
Barret P, Delourme R, Renard M, Domergue F, Lessire R, Delseny M, Roscoe TJ. 1998. A rapeseed FAE1 gene is linked to the E1 locus associated with variation in the content of erucic acid. Theoretical and Applied Genetics 96: 177–186.
Bendahmane A. 1999. Zero-background plasmid vector for BAC library construction. Biotechniques 26: 228–230, 232.
Caldwell DG, McCallum N, Shaw P, Muehlbauer GJ, Marshall DF, Waugh R. 2004. A structured mutant population for forward and reverse genetics in Barley (Hordeum vulgare L.). Plant Journal 40: 143–150.
Colbert T, Till BJ, Tompa R, Reynolds S, Steine MN, Yeung AT, McCallum CM, Comai L, Henikoff S. 2001. High-throughput screening for induced point mutations. Plant Physiology 126: 480–484.
Comai L, Young K, Till BJ, Reynolds SH, Greene EA, Codomo CA, Enns LC, Johnson JE, Burtner C, Odden AR et al. 2004. Efficient discovery of DNA polymorphisms in natural populations by Ecotilling. Plant Journal 37: 778–786.
Conte LS, Leoni O, Palmieri S, Capella P, Lercker G. 1989. Half-seed analysis: rapid chromatographic determination of the main fatty acids of sunflower seed. Plant Breeding 102: 158.
Cooper JL, Till BJ, Laport RG, Darlow MC, Kleffner JM, Jamai A, El-Mellouki T, Liu S, Ritchie R, Nielsen N et al. 2008. TILLING to detect induced mutations in soybean. BMC Plant Biology 8: 9.
Downey RK, Craig BM. 1964. Genetic control of fatty acid biosynthesis in rapeseed (Brassica napus L.). Journal of the American Oil Chemists’ Society 41: 475–478.
Gibbons IR, Asai DJ, Ching NS, Dolecki GJ, Mocz G, Phillipson CA, Ren H, Tang WJ, Gibbons BH. 1991. A PCR procedure to determine the sequence of large polypeptides by rapid walking through a cDNA library. Proceedings of the National Academy of Sciences, USA 88: 8563–8567.
Greene EA, Codomo CA, Taylor NE, Henikoff JG, Till BJ, Reynolds SH, Enns LC, Burtner C, Johnson JE, Odden AR et al. 2003. Spectrum of chemically induced mutations from a large-scale reverse-genetic screen in Arabidopsis. Genetics 164: 731–740.
Heckmann AB, Lombardo F, Miwa H, Perry JA, Bunnewell S, Parniske M, Wang TL, Downie JA. 2006. Lotus japonicus nodulation requires two GRAS domain regulators, one of which is functionally conserved in a nonlegume. Plant Physiology 142: 1739–1750.
Henikoff S, Till BJ, Comai L. 2004. TILLING. Traditional mutagenesis meets functional genomics. Plant Physiology 135: 630–636.
James DW Jr, Lim E, Keller J, Plooy I, Ralston E, Dooner HK. 1995. Directed tagging of the Arabidopsis FATTY ACID ELONGATION1 (FAE1) gene with the maize transposon activator. Plant Cell 7: 309–319.
Kaushik N, Agnihotri A. 2000. GLC analysis of Indian rapeseed-mustard to study the variability of fatty acid composition. Biochemical Society Transactions 28: 581–583.

© National Key Laboratory of Crop Genetic Improvement (2008). www.newphytologist.orgJournal compilation © New Phytologist (2008)
Research 15
Kim Y, Schumaker KS, Zhu JK. 2006. EMS mutagenesis of Arabidopsis. Methods in Molecular Biology 323: 101–103.
Konzak CF, Nilan RA, Kleinhofs A. 1976. Artificial mutagenesis as an aid in overcoming genetic vulnerability of crop plants. Basic Life Sciences 8: 163–177.
Lassner MW, Lardizabal K, Metz JG. 1996. A jojoba beta-Ketoacyl-COA synthase cDNA complements the canola fatty acid elongation mutation in transgenic plants. Plant Cell 8: 281–292.
Li M, Zhang C, Liu L, Yu L. 2005. Development of relationship between A, B and C genomes in Brassica genera. Hereditas (Beijing) 27: 671–676.
Long D, Coupland G. 1998. Transposon tagging with Ac/Ds in Arabidopsis. Methods in Molecular Biology 82: 315–328.
Long Y, Shi J, Qiu D, Li R, Zhang C, Wang J, Hou J, Zhao J, Shi L, Park B-S et al. 2007. Flowering time quantitative trait loci analysis of oilseed Brassica in multiple environments and genomewide alignment with Arabidopsis. Genetics 177: 2433–2444.
Lysak MA, Koch MA, Pecinka A, Schubert I. 2005. Chromosome triplication found across the tribe Brassiceae. Genome Research 15: 516–525.
Mayer K, Murphy G, Tarchini R, Wambutt R, Volckaert G, Pohl T, Dusterhoft A, Stiekema W, Entian K-D, Terryn N et al. 2001. Conservation of microstructure between a sequenced region of the genome of rice and multiple segments of the genome of Arabidopsis thaliana. Genome Research 11: 1167–1174.
McCallum CM, Comai L, Greene EA, Henikoff S. 2000. Targeted screening for induced mutations. Nature Biotechnology 18: 455–457.
Meng J, Tian Z, Fu T, Qian X. 1996. Analysis genetics diversty of Brassica napus L. with RFLP markers. Acta Genetica Sinica 23: 293–306.
Metzger JO, Bornscheuer U. 2006. Lipids as renewable resources: current state of chemical and biotechnological conversion and diversification. Applied Microbiology and Biotechnology 71: 13–22.
Mika V, Tillmann P, Koprna R, Nerusil P, Kucera V. 2003. Fast prediction of quality parameters in whole seeds of oilseed rape (Brassica napus L.). Plant, Soil and Environment 49: 141–145.
Ng PC, Henikoff S. 2003. SIFT: predicting amino acid changes that affect protein function. Nucleic Acids Research 31: 3812–3814.
Oleykowski CA, Bronson Mullins CR, Godwin AK, Yeung AT. 1998. Mutation detection using a novel plant endonuclease. Nucleic Acids Research 26: 4597–4602.
Ostergaard L, King GJ. 2008. Standardized gene nomenclature for the Brassica genus. Plant Methods 4: 10.
Park JY, Koo DH, Hong CP, Lee SJ, Jeon JW, Lee SH, Yun PY, Park BS, Kim HR, Bang JW et al. 2005. Physical mapping and microsynteny of Brassica rapa ssp. Pekinensis genome corresponding to a 222 kbp gene-rich region of Arabidopsis chromosome 4 and partially duplicated on chromosome 5. Molecular Genetics and Genomics 274: 579–588.
Qiu D, Morgan C, Shi J, Long Y, Liu J, Li R, Zhuang X, Wang Y, Tan X, Dietrich E et al. 2006. A comparative linkage map of oilseed rape and its use for QTL analysis of seed oil and erucic acid content. Theoretical and Applied Genetics 114: 67–80.
Rana D, van den Boogaart T, O’Neill CM, Hynes L, Bent E, Macpherson
L, Park JY, Lim YP, Bancroft I. 2004. Conservation of the microstructure of genome segments in Brassica napus and its diploid relatives. Plant Journal 40: 725–733.
Roscoe TJ, Lessire R, Puyaubert J, Renard M, Delseny M. 2001. Mutations in the fatty acid elongation 1 gene are associated with a loss of beta-ketoacyl-COA synthase activity in low erucic acid rapeseed. FEBS Letters 492: 107–111.
Sharpe AG, Lydiate DJ. 2003. Mapping the mosaic of ancestral genotypes in a cultivar of oilseed rape (Brassica napus) selected via pedigree breeding. Genome 46: 461–468.
Slade AJ, Fuerstenberg SI, Loeffler D, Steine MN, Facciotti D. 2005. A reverse genetic, nontransgenic approach to wheat crop improvement by TILLING. Nature Biotechnology 23: 75–81.
Taylor NE, Greene EA. 2003. PARSESNP: a tool for the analysis of nucleotide polymorphisms. Nucleic Acids Research 31: 3808–3811.
Till BJ, Burtner C, Comai L, Henikoff S. 2004a. Mismatch cleavage by single-strand specific nucleases. Nucleic Acids Research 32: 2632–2641.
Till BJ, Cooper J, Tai TH, Colowit P, Greene EA, Henikoff S, Comai L. 2007. Discovery of chemically induced mutations in rice by TILLING. BMC Plant Biology 7: 19.
Till BJ, Reynolds SH, Weil C, Springer N, Burtner C, Young K, Bowers E, Codomo CA, Enns LC, Odden AR et al. 2004b. Discovery of induced point mutations in maize genes by TILLING. BMC Plant Biology 4: 12.
Till BJ, Zerr T, Comai L, Henikoff S. 2006. A protocol forTILLING and Ecotilling in plants and animals. Nature Protocols 1: 2465–2477.
Town CD, Cheung F, Maiti R, Crabtree J, Haas BJ, Wortman JR, Hine EE, Althoff R, Arbogast TS, Tallon LJ et al. 2006. Comparative genomics of Brassica oleracea and Arabidopsis thaliana reveal gene loss, fragmentation, and dispersal after polyploidy. Plant Cell 18: 1348–1359.
U N. 1935. Genome-analysis in Bassica with special reference to the experimental formation of B. napus and its peculiar mode of fertilization. Japanese Journal of Botany 7: 389–452.
Vles RO, Bijster GM, Timmer WG. 1978. Nutritional evaluation of low-erucic-acid rapeseed oils. Archives of Toxicology Suppl 1: 23–32.
Waterhouse PM, Graham MW, Wang MB. 1998. Virus resistance and gene silencing in plants can be induced by simultaneous expression of sense and antisense RNA. Proceedings of the National Academy of Sciences, USA 95: 13959–13964.
Wu G, Wu Y, Xiao L, Li X, Lu C. 2008. Zero erucic acid trait of rapeseed (Brassica napus L.) results from a deletion of four base pairs in the fatty acid elongase 1 gene. Theoretical and Applied Genetics 116: 491–499.
Wu GZ, Shi QM, Niu Y, Xing MQ, Xue HW. 2007a. Shanghai RAPESEED Database: a resource for functional genomics studies of seed development and fatty acid metabolism of Brassica. Nucleic Acids Research 36: 1044–1047.
Wu Y, Xiao L, Wu G, Lu C. 2007b. Cloning of fatty acid elongase1 gene and molecular identification of A and C genome in Brassica species. Science in China. Series C, Life Sciences 50: 343–349.
Yang T-J, Kim JS, Kwon S-J, Lim K-B, Choi B-S, Kim J-A, Jin M, Park JY, Lim M-H, Kim H-I et al. 2006. Sequence-level analysis of the diploidization process in the triplicated flowering locus C region of Brassica rapa. Plant Cell 18: 1339–1347.


![Increased [CO 2] does not compensate for negative effects on yield caused by higher temperature and [O 3] in Brassica napus L](https://static.fdokumen.com/doc/165x107/631794e7831644824d038e8a/increased-co-2-does-not-compensate-for-negative-effects-on-yield-caused-by-higher.jpg)