EMS PRICE - ERIC
179
ED 083 677 AUTHOR TITLE INSTITUTION BUREAU NO PUB DATE NOTE AVAILABLE FROM DOCUMENT RESUME EA 005 513 Simon, Kenneth A.; Grant, W. Vance Digest of Educational Statistics, 1972 Edition. National Center for Educational Statistics (DHEW/OE), Washington, D.C. DHEW-OE-73-11103 73 178p.; A related document is ED Superintendent of Documents, U. Office, Washington, DC 20402 (S 1780-01139, $2.35 or $2.00 GPO 066 833 S. Government Printing tock Number Bookstore) EMS PRICE PIP -$0.65 HC-$6.58 DESCRIPTORS Academic Achievement; Degrees (Titles); DropOut Rate; Educational Facilities; *Elementary Education; Employment Statistics; Enrollment; Expenditures; Graduates; *Higher Education; Income; Libraries; Public Television; School Districts; School Holding Pow r; *Secondary Education; *Statistical Data; Teachers ABSTRACT The 11th in a series of annual publications, this document provides an abstract of statistical information covering American education from kindergarten through graduate school. Subjects on which statistics are provided include the number of schools and colleges; and information on enrollments, teachers, graduates, educational attainment, finances, federal funds for education, libraries, international education, and research and development. The digest is divided according to (1) all levels of education, (2) elementary and secondary education, (3) higher education, (4) federal programs for education and related activities, and (5) selected statistics related to education in the United States. Innovations include statistics on enrollment and educational attainment from the 1970 Census of Population; trend data on enrollment in high school subjects; teaching and research staff in institutions of higher education, by academic field; expanded coverage of gifts and grants to colleges and universities; employment of recent college graduates; public television stations by type of programing and license; and summary data from the National Assessment of Educational Progress in writing, citizenship, science, reading, and literature. (Author)
-
Upload
khangminh22 -
Category
Documents
-
view
0 -
download
0
Transcript of EMS PRICE - ERIC
ED 083 677
AUTHORTITLEINSTITUTION
BUREAU NOPUB DATENOTEAVAILABLE FROM
DOCUMENT RESUME
EA 005 513
Simon, Kenneth A.; Grant, W. VanceDigest of Educational Statistics, 1972 Edition.National Center for Educational Statistics (DHEW/OE),Washington, D.C.DHEW-OE-73-1110373178p.; A related document is EDSuperintendent of Documents, U.Office, Washington, DC 20402 (S1780-01139, $2.35 or $2.00 GPO
066 833S. Government Printingtock NumberBookstore)
EMS PRICE PIP -$0.65 HC-$6.58DESCRIPTORS Academic Achievement; Degrees (Titles); DropOut Rate;
Educational Facilities; *Elementary Education;Employment Statistics; Enrollment; Expenditures;Graduates; *Higher Education; Income; Libraries;Public Television; School Districts; School HoldingPow r; *Secondary Education; *Statistical Data;Teachers
ABSTRACTThe 11th in a series of annual publications, this
document provides an abstract of statistical information coveringAmerican education from kindergarten through graduate school.Subjects on which statistics are provided include the number ofschools and colleges; and information on enrollments, teachers,graduates, educational attainment, finances, federal funds foreducation, libraries, international education, and research anddevelopment. The digest is divided according to (1) all levels ofeducation, (2) elementary and secondary education, (3) highereducation, (4) federal programs for education and related activities,and (5) selected statistics related to education in the UnitedStates. Innovations include statistics on enrollment and educationalattainment from the 1970 Census of Population; trend data onenrollment in high school subjects; teaching and research staff ininstitutions of higher education, by academic field; expandedcoverage of gifts and grants to colleges and universities; employmentof recent college graduates; public television stations by type ofprograming and license; and summary data from the National Assessmentof Educational Progress in writing, citizenship, science, reading,and literature. (Author)
VD
DHEW Publication No. (OE) 73-11103
U.S. [ tpARTNIENT OF HEALTH.EDUCATION &WELFARENATIONAL INSTITUTE OF
EDUCATIONTHIS DOCUMENT HAS BEEN REPROD UCE° EXACTLY AS RECEIVED FROMTHE PERSON OR ORGANIZATIONORioiN*TING IT POINTS OF VIEW OR OPINIONSSTATED OD NOT NECESSARILY REPRESENT OFF ICIAL NATIONAL INSTITUTE OFE DUCATION POSITION OR POLICY
Digestof EducationalStatistics1972 Edition
By KENNETH A. SIMONChief, Reference, Estimates, and Projections BranchandW. VANCE GRANTSpecialist, Educational Statistics
U.S. DEPARTMENT OF HEALTH, EDUCATION, AND WELFARECASPAR W. WEINBERGER, Secretary
S. P. MARIANO, JR., Assistant SecretaryEducation Division
Irmi Office of Education14 JOHN R. OTTINA, Acting Commissioner
Lr3 National Center for Educational StatisticsCZ DOROTHY M. GILFORD, Assistant Commissioner for Educational Statistics
C.)
t
FILMED FROM BEST AVAILABLE COPY

U.S. GOVERNMENT PRINTING OFFICEWASHINGTON: 1973 a.
For sale by the Superintendent of Documents, U.S. Government Printing Office,Washington. D.C. 20402Price: $2.35 domestic postpaid. or $2 GPO Bookstore
Stock Number 1780-01139
a
ForewordThe 1972 edition of the Digest of Educational Statistics is the 11th in a series ofannual publications initiated by the Office of Education in 1962. its primary purposeis to provide an abstract of statistical information covering the broad field of American
. education from kindergarten through the graduate school. In order to perform thisfunction, it utilizes materials from numerous sources, including the statistical surveysand estimates of the Office of Education and other appropriate agencies, bothgovernmental and nongovernmental. The publication contains information on avariety of subjects within the field of educational statistics, including the number ofschools and colleges, enrollments, teachers, graduates, educational attainment.finances, Federal funds for education, libraries, international education, and researchand development.
The Digest is divided into five chapters: All Levels of Education, Elementaryand Secondary Education, Highier Education, Federal Programs for Education andRelated Activities, and Selected Statistics Related to Education in the United States.To qualify for inclusion in this publication, material must be nationwide in scopeand of current interest and value. Series of data extending as far back as 1870 havebeen employed in many instances in order to give some historical perspective. Theintroduction supplements the tabular materials in chapters 1 through V by providinga brief description and analysis of current trends in American education.
In addition to updating many of the statistics which appeared in previousyears, this edition of the Digest contains a number of innovations. These includestatistics on enrollment and educational attainment from the 1970 Census of PopulaLion; trend data on enrollment in high school subjects; teaching and research staffin institutions of higher education, by academic field; expanded coverage of giftsand grants to colleges and universities; employment of recent college graduates;public television stations, by type of programing and licensee; and summary datafrom the National Assessment of Educational Progress in writing, citizenship, science,reading, and literature.
In the past the Digest of Educational Statistics has proved useful to personsinterested in the nature and scope of education in the United States and in par.quiff to those individuals concerned with the formulation and conduct of educationalpolicy. We trust that the readers of the 11th edition will find it even more valuablethan its predecessors.
DOROTHY M. GILFORDAssistant Commissioner for
Educational Statistics
ill

ContentsPage
Foreword ill
Introduction 1
Chapter I. All Levels of Education 5
Chapter H. Elementary and Secondary Education 29
Chapter III. Higher Education 67
Chapter IV. Federal Programs for Education and Related Activities 121
Chapter V. Selected Statistics Related to Education in the United *States 139
Index 165
FIGURES
1. The structure of education in the United States 42. Estimated retention rates, fifth grade through college graduation: United States. 1961 to ir
1973 133. Percent of illiteracy in the population, by race: United States, 1870 to 1969 174. Total expenditures for education as a percentage of the gross national product: United States,
1929.30 to 1971.72 245. Expenditures of State and local governments, 1969.70 266. Selected characteristics of public elementary and secondary school teachers: United States,
1970.71 477. Number of public school districts: United States, 1949.50 to 1969.70 538. Number of high school graduates for each 100 persons 17 years of age: United States, 1869-
70 to 1969.70 569. Selected characteristics of first-time college students: United States, fall 1971 77
10. Selected characteristics of college faculty members: United States, spring 1969 8811. Number of institutions of higher education, for men, for women, and coeducational: United
States and outlying areas, 1960.61 to 1970-71 9412. Percentage distribution of foreign students enrolled in American institutions of higher educa-
tion. by area of origin: 1969-70 147
TABLES
All Levels of Education
Enrollment1. Estimated enrollment in educational institutions, by level of instruction and by type of control:
United States, fall 1971 and fall 1972 62. Enrollment in educational institutions, by level If instruction and by type of control: United
States, fall 1969 63. Enrollment in educational institutions, by level of instruction and by type of school: United
States, 1899-1900 to fall 1969 74. Percent of the population 3 to 34 years old enrolled in school, by race, sex, and age: United
States, October 1971 85. Percent of the population 5 to 34 years old enrolled in school, by age: United States, October
1947 to October 1971 86. Percent of the population 3 to 34 years old enrolled in school, by age and by State: Spring
1970 97. Participants in adult education, by sex, race, age, and source of instruction: United States,
May 1969 10
PageTeachers and Other Instructional Staff
8. Number of teachers in elementary and secondary schools, and instructional staff membersin institutions of higher education: United States, 1929-30 to 1965.66 10
9. Estimated number of classroom teachers in elementary and secondary schools, and total instructional staff for resident courses in institutions of higher education: United States,fall 1971 and fall 1972 11
Schools and School Districts10. Number of local basic administrative units (school districts), and number of schools by level
and control, by State: 1970-71 12
Retention Rates and Educational Attainment11. Estimated retention rates, fifth grade through college entrance, in public and nonpublic
schools: United States, 1924-32 to 1962.70 1412. Level of school completed by persons 25 years old and over and 25 to 29 years old, by
color: United States. 1910 to 1972 1413. Median school years completed by persons 25 years old and over, by sex, race, and State:
1970 1514. Years of school completed by persons 25 years old and over, by State: 1970 1615. illiteracy of the population, by State: 1900, 1930, and 1960 1816. Percent of draftees who failed to meet the mental requirements for induction into the armed
services, by State: 1970 1817. Occupation of employed persons 18 years old and over, by sex, color, and years of school
completed: United States, March 071 19
Income18. Total annual money income of persons 25 years old and over, by years of school completed,
sex. and age: United States. 1970 . 2019. Annual income of men, by lee and years of school completed: United States, 1956 to 1968 2120. Lifetime income of rr.en. ! years of school completed: United States, 1956 to 1968 2121. Receipts of educational .titutions, by level of insiuction, type of control, and source:
United Stater, 1969 . 21
Expenditures22. Estimated expenditures or education, by level of instruction and by type of control: United
States, 1971-72 and 1972-73 2223. Estimated expenditures of educational institutions, by source of funds: United States, 1967-
68 to 1972-73 2224. Expenditures for education, including capital outlay, by level of instruction and by type of
control: United States, 1967.68 2525. Gross national product related to total expenditures for education: United States, 1929-30
to 1971.72 2526. Direct expenditures of State and local governments for all functions and for education, by
per capita amount and percent of per capita income: 1969-70 27
Elementary and Secondary Education
Enrollment27. Enrollment in full-time public elementary and secondary day schools, by level and by State:
Fail 1971 and fall 1972 3028. Enrollment by grade in full-time public elementary and secondary day schools: United States,
1960-61 to 1971.72 3129. Enrollment, attendance, and length of school term in public elementary and secondary day
schools, by State: 1969.70 .3230. Age ranges for compulsory and permissive school attendance, by State: 1965 3331. Enrollment in grades 9-12 in public and nonpublic schools compared with population 14.17
years of age: United States, 1889.90 to fall 1971 3332. Historical seminary of public elementary and secondary school statistics: United States,
1869.70 to 1967.68 3433. Selected statistics of local public school systems, by enrollment size: United States, fall
1969 3634. Enrollment in special education programs for exceptional children: United States, February
1963 and 1970-71 3635. Selected statistics on public elementary and secondary schools in large cities: 1970.72 3736. Number and percent of public school pupils transported at public expense, and current ex-
penditures for transportation: United States, 1929-30 to 1969.70 3737. Enrollment in elementary and secondary schools, by control and by State: Spring 1970 38
vi
Page38. Percentage distribution of enrollment in elementary and secondary schools, by control, and
by State: Spring 1970 3939. Nonpublic elementary and secondary schools. pupils, and teachers, by level and by church
affiliation of .chool: United States, 1970.71 4040. Summary statistics on Catholic elementary and secondary schools: United States, 1919-20
to 1971.72 4041. Enrollment of 3-, 4-, and 5-year-old chlldre n in preprimary programs, by age and by type
of program: United States, October 1971 4042. Estimated enrollment in nonpublic elementary and secondary schools. by State: Fall 1972 4143. Enrolled in science and mathematics courses in public high schools, by sex: United States.
1964-65 4144. Enrollment in science and mathematics courses in public high schools compared with total
enrollment in grades 9-12 and population aged 14.17: United States, 1948.49 to 1962-63 4145. Enrollment in foreign languages in public and nonpublic secondary schools: United States,
fall 1964 4246. Number of students enrolled in various subject areas compared with total enrollment in
grades 7 to 12 of public secondary schools: United States, 1948-49, 1960-61, and 1970-71 4247. Enrollment in federally .aided vocational education classes, by type of program and by level
of instruction: United States and outlying areas, fiscal years 1966 to 1971 4348. Enrollment in federally aided vocational classes, by type of program: United States and out-
lying areas, 1920 to 1971 44
Teachers and Other Instructional Staff49. Teachers of federally aided vocational education classes, by type of program: United States
and outlying areas. fiscal years 1966 to 1971 4450. Estimated number of classroom teachers in nonpublic secondary schools, by teaching field:
United States, fall 1972 4451. Number Of full-time and part-time classroom teachers in public and nonpublic elementary
and secondary day schools, by State: Fall 1971 and fail 1972 4552. Instructional staff in public elementary and secondary day schools, by type of position
and by State: 1969.70 4653. Selected characteristics of public school teachers, by level and by sex: United States, 1970-71 4854. Public secondary school teachers, by teaching field and by sex: United States, 1970.71 4855. Average annual salary of Instructional staff in public elementary and secondary day schools,
and average annual earnings of full-time employees in all industries, in unadjusted dol-lars: United States, 1929-30 to 1971-72 48
56. Estimated average annual salary of classroom teachers in public elementary and secondaryschools: United 'States, 1955-56 to 1971-72 49
57. Percentage distribution of estimated annual salaries paid classroom teachers in public ele-mentary and secondary schools: United States, 1952.53 to 1971.72 49
58. Average annual salary of instructional staff in full-time public elementary and secondary dayschools, by State: 1929-30 to 1971-72 50
Instructional Rooms and Other Facilities59. Selected statistics on schoolhousing in full-time public elementary and secondary day schools,
by State: 1970.71 and fall 1971 5160. Selected characteristics of in4tructional rooms in public school plants, by State: 1964.65 52
Schools and School Districts61. Number of local basic administrative units (school districts), by State: Fall 1971 5462. Number of public school systems and number of pupils enrolled, by size of system: United
States, 1966-67 5463. Number of local basic administrative units (school districts), and number of public and non-
public elementary and secondary schools: United States, 1929.30 to 1970.71 5464. Number and percent of public secondary schools, by type of school: United States, 1919-
20 to 1965.66 55
High School Graduates and Dropouts65, Number of high school graduates compared with population 17 years of age: United States,
1869.70 to 1970-71 5566. Percent ,of high school dropouts among persons 14 to 19 years old, by race and sex: United
States, 1970 and 1971 5567. Number of public and nonpublic high school graduates, by sex and by State: 1970-71 ... 57
Income68. Estimated revenue and nonrevenue receipts of public elementary and secondary schools, by
source and by State: 1971.72 5869. Revenue receipts of public elementary and secondary schools from Federal, State, focal, and
other sources, by State: 1969.70 59
vii
Page70. Pak elementary and secondary school revenue receipts from Federal, State, and local
sources: United States, 1919.20 to 196970 60-71. Results of public school bond elections: United States, 1957.58 to 197172 60
Expenditures72. Estimated expennitures for public elementary and secondary education, by purpose and by
State: 1971.72 6173. Summary of expenditures for public elementary and secondary education, by purpose and
by State: 196970 62i4. Summary of expenditures for public elementary and secondary education, by purpose: United
States, 1919.20 to 1969-70 6375. Personal income, 1971, related to public school expenditures, by State: 1971.72 6476. Estimated expenditure per pupil in average lay attendance in public elementary and second-
ary day schools, by State: 197172 6577. Total and current expenditure per pupil in average daily attendance in public elementary and
secondary schools: United States, 1929.30 to 1971.72 6578. Expenditures of Federal, State, and local funds for vocational education: United States cnd
outlying areas, 1920 to 1971 6679. Expenditures of Federal, State, and local funds for vocational education, by State: Fiscal year
1971. 66
Higher Education
Enrollment80. Total enrollment in institutions of higher education, by attendance status and sex of student,
control of institution, and State: Fall 1.971 6881. Total and first-time degree.credit enrollment in institutions of higher education, by State:
Fall 1971 and fall 1972 6982. Total enrollment in institutions of higher education, by type and level of enrollment and by
State: Fall 1971 7083. Selected statistics for the 60 institutions of higher education enrolling the largest number
of students: United States, fall 1971 7184. Total enrollment in institutions of higher education, by control of institution and by State:
Fall 1970 7285. Enrollment in institutions of higher education, by sex and by type and control of institution:
United States and outlying areas, fall 1960 and fall 1965 7386. Enrollment in institutions of higher education compared with population aged 18-24: United
States, fall 1950 to fall 1971 7487. Enrollment in institutions of higher education, by sex and by control of institution: United
States, fall 1946 to fall 1971 7488. Resident degree-credit enrollment in institutions of higher education related to total popula-
tion arid to age groups 18.21 and 18-24: United States, 1869-70 to fall 1970 7589. Enrollment in institutions of higher education, by sex, type of enrollment, and control of
institution: United States, fall 1970 7690. First-time enrolln.c.nt in institutions of higher education, by sex and by control of institution:
United States, fall 1946 to fall 1972 7691. Selected characteristics of first-time students in institutions of higher education: United
States, fall 1971 7892. Residence and migration of college students taking work creditable toward a bachelor's or
higher degree, by State: Fall 1968 7993. Enrollment for advanced degrees, by level of enrollment, sex of student, attendance status,
and field of study: United States and outlying areas, fall 1970 8094. Enrollment for master's any doctor's degrees, by field of study: United Stites and outlying
areas, fall 1960 to fall 1970 8195. Selected characteristics of college students 16 to 34 years of age: United States, October
1971 8196. Selected characteristics of graduate students: United States, spring 1965 8297. Socioeconomic background of graduate students, by sex; United States, spring 1965 83.98. Stipend status of graduate students: United States, sprint 1965 8399. Number of 2-year institutions of higher education and enrollment, by control of institution
and by sex: United States, fall 1947 to fall 1970 84100. Engineering enrollment in institutions of higher education, by level: United States and outly-
ing areas, fall 1949 to fall 1971 84101, Faculty, students, and degrees conferred in institutions attended predominantly' by Negro
students: United States, 1963.64 85102. Historical summary of faculty, students, degrees, and finances in institutions of higher edu-
cation: United States, 1869-70 to 1968-69 86
viii
Page
Faculty and Other Professional Staff103. Estimated full-time and parttime resident instructional staff in institutions of higher educa-
tion.. by academic rank: United States. tall 1960 to 1972 87104. Full-time and part-time teaching and research staff in institutions of higher education, by
academic rank and field: United States and outlying areas. fall 1968 87105. Demographic and background characteristics of college faculty members, by type of insti
tution and by sex: United States. spring 1969 ..... .... . - ..... .. 89106. Professional background and academic activity of college faculty members. by type of insti-
tution and by sex: United States, spring 1969 90107. Average salaries of faculty members in institutions of higher education, by type of institu-
tion, length of contract, and academic rank: United States, 1966-67 and 196768. 92108. Median salaries of instructional staff in institutions of higher education, by academic rank,
type of institution, and size of enrollment: United States, 1969.70 and 1971-72 92109. Median annual salaries of instructional staff and administrative officers in 4-year colleges and
universities: United States, 1959.60 to 1971.72 93
Institutions110. Number of institutions of higher education, by type, control. and size of enrollment: United
States, fall 1971 93111. Number of institutions of higher education, by type, control, and State: Fall 1971 95112. Number of institutions of higher education, by control of institution and by State: Fall 1971 96
Degrees113. Earned degrees conferred by institutions of higher education, by level of degree and by State:
1970-71 and 1971.72 97114. Bachelor's, master's, and doctor's degrees conferred by institute ms of higher education, by
sex of student and by field of study: United States, 1970-71 98115. Earned degrees conferred by institutions of higher education: United States, 1869-70 to
1970-71 103116. Engineering degrees conferred by institutions of higher education, by level of degree: United
States and outlying areas, 194849 to 1970-71 103117. Number of first-professional degrees conferred in dentistry, medicine, and law, by sex: United
States, 1949.50 to 1970.71 103118. First-professional degrees conferred by institutv,ns of higher education, by sex of student.
control of institution. and field of study: United States, 1970.71 104119. Male college graduates in the population, by field of highest degree: United States, March
1967 104120. Doctor's degrees conferred by 60 large institutions of higher education: 196162 to 1970-71 105121. Formal awards based on organized occupational curriculums at the technical or semiprofes.
sional level in institutions of higher education, by length and type of curriculum and bysex of recipient: United States and outlying areas. 196970 106
122. Associate degrees conferred by institutions of higher education, by sex of student and by typeof degree: United States. 1965-66 to 1969-70 107
Income123. Current-fund revenue of institutions of higher education, by control of institution and by
source of revenue: United States, 1969.70 108124. Current-fund revenue of institutions of higher education from State and local governments re-
lated to total current.fund revenue, by control of institution and by State: 1968-69 109125. Current-fund revenue of institutions of higher education, by control of institution and by State:
1967.68 and 196869 110126. Income of institutions of higher education: United States, 1919-20 to 196970 111127. Private gifts and grants to institutions of higher education, by control of institution: United
States, 1959-60 to 1969.70 112128. Estimated tuition and fees. and room and board rates, in institutions of higher edueation,
by type and control of institution: United States, 1963-64 to 1973.74 113129. Basic student charges by institutions of higher education for tuition and fees, room and board,
by control and type of institution: United States and outlying areas, 196869 113
Expenditures130. Current-fund expenditures of institutions of higher education. by control and by purpose:
United States, 1969.70 114131. Current-fund expenditures of institutions of higher education, by control and by State: 1967-
68 and 1968-69 115132. Personal income, 1968, related to educational and general expenditures for higher educa-
tion and to educational and general funds received from State and local governments,by State: 1968.69 116
133. Expenditures of institutions of higher education: United States, 1929-30 to 1969-70 .... ... 117
ix
PageProperty
134. Physical plant value per student in institutions of higher education, by control and by level:United States, 1967.68 and 1969.70 118
135. Endowment funds per student in instiutions of higher education, by control and by level!United States, 1966.67 and 1969-70 118
136. Property of institutions of higher education: United States. 1919-20 to 1969.70 118137. Student financial aid funds disbursed by institutions of higher education, by type of pro-
gram, control of institution, type of aid, and academic level of recipient: United States andoutlying areas, 1966.67 119
138. Selected data for land-grant institutions on students and finances: United States and outly-ing areas, 1960.61 and 1970.71 120
Federal Programs for Education and Related Activities
139. Federal funds for education and related activities: Obligations for fiscal years 1962 to 1967and outlay for fiscal years 1968 to 1973 126
140. Federal funds for education and related activities, by agency: Estimated outlay, fiscal years1971 to 1973 128
141. Summary of Federal funds for research, `development. and R. & D. plant: Fiscal years 1969,1970, and 1971 129
142. Fellowship, traineeship, and training grant programs of Federal agencies: Expenditures andnumber of participants, fiscal year 1970 130
143. Office of Education expenditures, by legislative program: Fiscal years 1960 to 1973 131144. Federal grants to State and local governments for elementary and secondary schools, by
agency and by State: Fiscal year 1969 134145. Federal obligations to universities and colleges, by agency and by State: Fiscal year 1970 135146. Federal grants to State and local governments administered by the Office of Education, by
program and by State: Fiscal year 1970 136147. Office of Education funds obligated for instructional materials and equipment, by program:
Fiscal year 1970 137
Selected Statistics Related to Education in the United States
Employment Status and Job Opportunities148. College enrollment and labor force status of 1971 high school graduates, by sew, color, and
marital status of women: United States, October 1971 140149. Employment status of 1971 high school graduates not enrolled in college and of 1970.71
school dropouts, by sex, color, and marital status of women: United States, October 1971 141150. Major occupation groups of employed high school graduates not enrolled in college, by year
of high school graduation, and of school dropouts, by year last attended school, by sex:United States, October 1971 142
151. Relationship of work of degree recipients to major field of study, and reason for working ina job not directly related to field: United States, October 1971 143
152. Occupation group of employed degree recipients, by sex: United States, October 1971 143153. Average monthly salary offers to male candidates for the bachelor's degree, by field of study:
United States, 1966.67 to 1971-72 144154, Average monthly salary offers to male candidates for master's and dodor's degrees, by field
of study: United States, 1969-70 to 1971-72 144
International Education155. United States College faculty abroad, by country and by field of interest: 1970.71 145156. United States college students abroad, by country and by field of study: 1969.70 145157. Enrollment of foreign students in institutions of higher education, by level and by State:
Fall 1968 146158. Number of toreign students enrolled in American institutions of higher education, by area
of origin: 1954.55 to 1970.71 148159. Number of foreign students enrolled in American institutions of higher education, by area of
origin, major field of interest, and academic status: 1970.71 149160. Estimated total population and enrollment, by level, in selected countries of the world: 1967 150161. Estimated population and enrollment, by level, in major areas of the world: 1967 151
Libraries and Public Television162. Broadcast hours of public television stations, by type of programing and by type of licensee,
geographic region, and budget size: United States and outlying areas, fiscal year 1971 , . 151163. General statistics of public libraries serving areas of 25,000 or more population: United States
and outlying areas, fiscal year 1968 152
x
Page164. Rank order of public libraries with 1 million or more volumes in their collections: United
States, 1968 152165. Selected statistics on the collections, staff, and operating expenditures of 30 large university
libraries: 1970.71 153166. General statistics of College and university libraries: United States and outlying areas, 1959-
60, 1963.64, and 1968-69 154167. index of prices for hardcover books, by category: United States, 1967.69 and 1971 .154168. Average price and price index for books, periodicals, and serial services: United States, 1957-
59 and 1965 to 1971 155
Research and Development169. Number and median annual salaries of scientists, by type of employer and by field: United
States, 1970 155170. Financial support for educational research and development, by sponsoring agency: United
States, fiscal year 1968 156171. Research and development funds related to the gross national product: United States, 1953
to 1971 156172. Sources of funds used for research and development: United States, 1953 to 1971 156173. Sources of funds used for basic research: United States, 1953 to 1971 156174. Funds used in the performance of basic research, applied research, and development: United
States, 1971 157
Equal Educational Opportunity175. Estimated percentages of white and Negro attendance in elementary and secondary schools,
by age of main building: United States, fall 1965 157176. :'umber and percent of Negroes attending public elementary and secondary schools, by geo-
graphic area and by level of isolation: Fall 1968 and fall 1970 ...... .... ..... 157177. Number and percent of minority students attending public elementary and secondary schools,
by geographic area and by level of isolation: Fall 1968 and fall 1970 158178. Estimated median achievement test scores for 1st- and 12th-grade pupils, by racial and eth-
nic group: United States, fall 1965 158
National Assessment of Educational Progress179. National Assessment of Educational Progress in writing, by age and by selected cilaracteris-
tics of participants: United States, 1969 159180. National Assessment of Educational Progress in citizenship, by age and by selected char-
acteristics of participants: United States, 1969 160181. National Assessment of Educational Progress in science, by age and by selected character-
istics of participants: United States, 1969 161182. National Assessment of Educational Progress in reading, by age and selected cl-aracteristics
of participants: United States, 1970.71 162183. National Assessment of Educational Progress in literature, by age and by selected character-
istics of participants: United States, 1970-71 163
xi
)
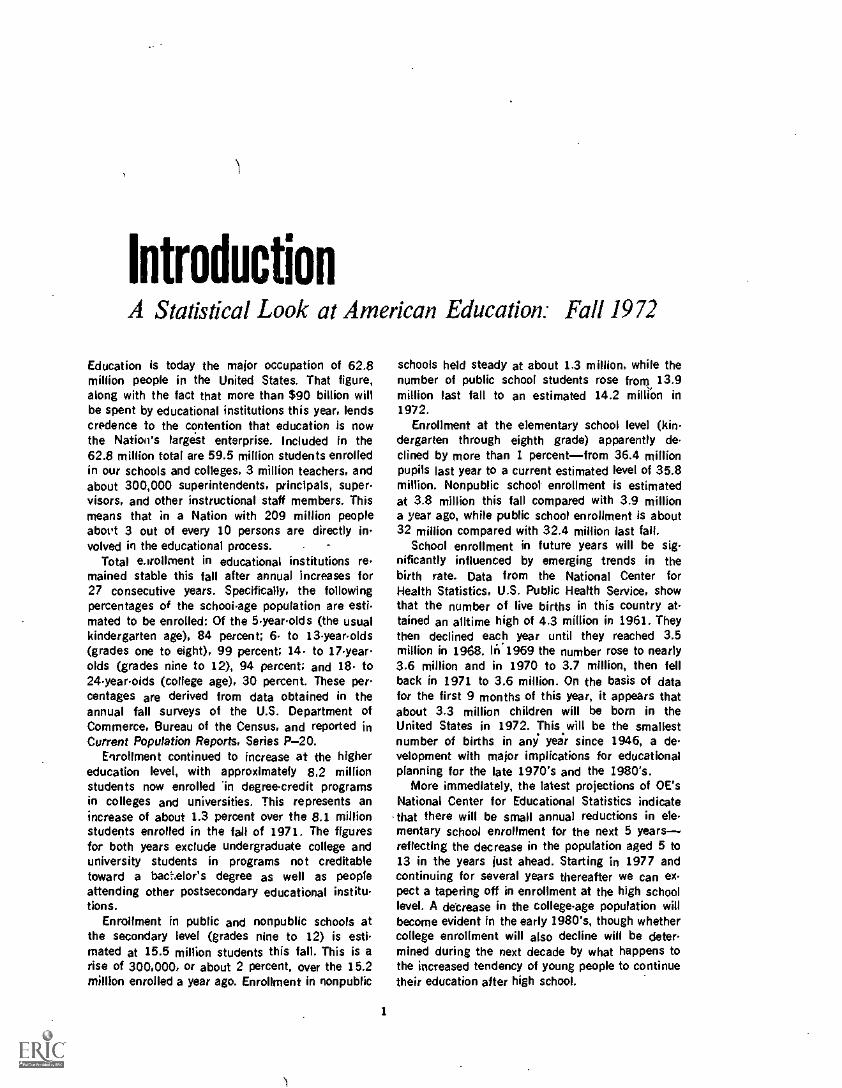
IntroductionA Statistical Look at American Education: Fall 1972
Education is today the major occupation of 62.8million people in the United States. That figure,along with the fact that more than $90 billion willbe spent by educational institutions this year, lendscredence to the contention that education is nowthe Nation's largest enterprise. Included in the62.8 million total are 59.5 million students enrolledin our schools and colleges, 3 million teachers, andabout 300,000 superintendents, principals, supervisors, and other instructional staff members. Thismeans that in a Nation with 209 million peopleabout 3 out of every 10 persons are directly in.volved in the educational process. .
Total emollment in educational institutions remained stable this fall after annual increases for27 consecutive years. Specifically, the followingpercentages of the schoolage population are esti.mated to be enrolled: Of the 5yearolds (the usualkindergarten age). 84 percent; 6. to 13yearolds(grades one to eight), 99 percent; 14. to 17.yearolds (grades nine to 12), 94 percent; and 18. to24yearolds (college age), 30 percent. These percentages are derived from data obtained in theannual fall surveys of the U.S. Department ofCommerce. Bureau of the Census. and reported inCurrent Population Reports, Series P-20.
Enrollment continued to increase at the highereducation level, with approximately 8.2 millionstudents now enrolled in degreecredit programsin colleges and universities. This represents anincrease of about 1.3 percent over the 8.1 millionstudents enrolled in the fall of 1971. The figuresfor both years exclude undergraduate college anduniversity students in programs not creditabletoward a bachelor's degree as well as peopleattending other postsecondary educational institutions.
Enrollment in public and nonpublic schools atthe secondary level (grades nine to 12) is estimated at 15.5 million students this fall. This is arise of 300.000, or about 2 percent, over the 15.2million enrolled a year ago. Enrollment in nonpublic
1
schools held steady at about 1.3 million, while thenumber of public school students rose from 13.9million last fall to an estimated 14.2 million in1972.
Enrollment at the elementary school level (kin.dergarten through eighth grade) apparently de.clined by more than I percent-from 36.4 millionpupils last year to a current estimated level of 35.8million. Nonpublic school enrollment is estimatedat 3.8 million this fall compared with 3.9 milliona year ago, while public school enrollment is about32 million compared with 32.4 million last fall.
School enrollment in future years will be sig.nificantly influenced by emerging trends in thebirth rate. Data from the National Center forHealth Statistics, U.S. Public Health Service, showthat the number of live births in this country attained an alltime high of 4.3 million in 1961. Theythen declined each year until they reached 3.5million in 1968. In 1969 the number rose to nearly3.6 million and in 1970 to 3.7 million, then fellback in 1971 to 3.6 million. On the basis of datafor the first 9 months of this year, it appears thatabout 3.3 million children will be born in theUnited States in 1972. This will be the smallestnumber of births in any yeir since 1946, a development with major implications for educationalplanning for the late 1970's and the 1980's.
More immediately, the latest projections of OE'sNational Center for Educational Statistics indicate
.that there will be small annual reductions in elementary school enrollment for the next 5 years-reflecting the decrease in the population aged 5 to13 in the years just ahead. Starting in 1977 andcontinuing for several years thereafter we can expect a tapering off in enrollment at the high schoollevel. A detrease in the collegeage population willbecome evident in the early 1980's, though whethercollege enrollment will also decline will be determined during the next decade by what happens tothe increased tendency of young people to continuetheir education after high school.
Currently about 2,320,000 persons are em'pioyed as classroom teachers in public and non-public elementary and secondary schoolsanincrease of about 1 percent over the 2.3 millionteachers employed a year ago. All of the increaseapparently occurred at the secondary school level.In fact, preliminary data suggest that at the ele-mentary school level there may have been a smallreduction. In any case, about 2.1 million personsare teaching in public schools this fall, and anestimated 220,000 are in nonpublic schools. Ap-proximately 1,290,000 are teaching in elementaryschools and 1,030,000 in secondary schools.
Overall, the number of public school teachersis growing at a somewhat faster rate than thenumber of pupils. The result is a continuing im-provement in thz pupil-teacher ratio. This fall thereare approximately 22 pupils per teacher, as com-pared with 25.7 pupils for each teacher 10 yearsago. _Moreover, a recent study by the NationalEducation Association indicates that public schoolteachers today' are better prepared academicallythan were their predecessors. Only 3 percent ofthe teachers in 1971 did not have a bachelor'sdegree, as compared with 15 percent in 1961. In1971 more than 27 percent of the teachers helda master's degree, compared with 23 percent 10years earlier. .
The average annual salary of instructional staffmembers in public elementary and secondaryschools rose more than 5 percent last year overthe preceding year, and a similar increase is antici-pated in 1972-73. Salaries averaged about$10,100 in 1971-72 and are expected to approach$10,650 in 1972-73. The average salary of class-room teachers is somewhat smaller: The estimatesfor 1971-72 and 1972-73 are $9,615 and$10,140, respectively.
The number of instructional staff members incolleges and universities has risen by about 20,000in the past year, bringing the current total to about620,000. Faculties have expanded at a rapid rateduring the past decade in an attempt to keep pacewith the growing numbers of young people whoare seeking a college education. Even so, the trendin recent years has been toward larger classes andgreater utilization of graduate assistants in theclassroom.
The National Education Association has re-
ported that the typical full-time' faculty member indegree-granting institutions earned $12,932 inthe academic year 1971-72. This may be com-pared with a salary of $11,745 2 years earlier.With salaries rising at a rate of about 5 percenta year, the average salary of instructional staff in
2
colleges and universities is expected to approach$1.S.600 in 1972-73.
More than 3 million persons graduated fromhigh school in 1972. The class of 1973 is ex-pected to exceed 3.1 million, which would make itthe largest graduating class in history. The sizeof these graduating classes reflects the high birthrate in toe 1950's and also the increasing tendencyof young Americans to remain in school at leastuntil high school graduation. About 76 percent ofthe young people today finish high school, andabout 47 percent of them (or some 60 percentof the high school graduates) can be expected toenter a degree-credit program in a college or uni-versity. if present trends continue, about 24 per-cent of the persons in their late teens today canbe expected to earn a bachelor's degree, 8 percenta master's degree, and 1.5 percent a doctorate.
In its most recent survey of the educationalattainment of the population, conducted in March1972, the Bureau of the Census found that themedian number of school years completed byyoung people 20 and 21 years of age was 12.8years. Persons 45 to 54 had completed a medianof 12.3 years; persons 75 and over, 8.6 years.
During the school year 1971-72 the number ofearned degrees conferred by colleges and univer-sities is estimated as follows: Bachelor's and first-professional degrees, 903,000; master's degree,238,000; and doctorates, 35,000. In 1972-73 thecomparable figures are expected to be 958,000,256,000, and 38,000, respectively. In each case theestimates for 1972-73 represent ailtime highs.In the past decade the number of bachelor's de-grees conferred annually has more than doubled.The number of master's degrees has increased.nearly threefold, and the number of doctor's de-grees awarded has tripled over the past 10 years.
Expenditures for public and private educationfrom kindergarten through the graduate school areestimated at $83.8 billion for the 1971-72 schoolyear, and preliminary estimates place the 1972-73figure at $90.2 billion. The breakdown for 1971-72came to $53.9 billion for elementary and secondaryschools ($48.8 billion for public and $5.1 billionfor nonpublic) and $29.9 billion for higher educa-tion ($19.9 billion for public institutions and $10.0billion for private institutions).
Viewed in another context, the total expendituresfor education during 1971 amounted to 8.0 percentof the gross national product (GNP). The per-centage of GNP spent for education has been ina rising trend for more than a quarter of a century.The low point in modern times was reached in1943-44, in the midst of World War II, when edu-
cational expenditures dropped to 1.8 percent ofthe GNP.
The current expenditure per pupil in averagedaily attendance in public elementary and sec-ondary schools has more than doubled in the pastdecade, rising from $419 in 1961-62 to an esti-mated $934 in 1971-72. The largest item in theschool budget is teachers' salaries, and expenditureincreases in recent years reflect the efforts of localschool systems to provide more adequate compel,.sation for their instructional staff members. Therise in expenditures would be much smaller, ofcourse, if allowance were made for changes in thepurchasing power of the dollar.
The role of the Federal Government In providingsupport to education at all levels continues togrow. Whereas Federal grants amounted to $2.1billion in 1963, in 1973 they are expected to reach$12.8 billion. Grants to higher education havequadrupled during the past decade, and aid toelementary and secondary education increased
1
1r
3
more than sevenfold. The largest percentage in-crease, however, is in grants for vocationaltechnicaland continuing education, which is 21 times asgreat in 1973 as in 1963. This support reflectsthe widdly held view that more students I beprepared for useful employment before : .tingtheir formal education.
Summing up, a number of recent developmentsin American education give rise to an optimisticview of the future. Young people today spend moreyears in school than their parents and grandparentsdid. Most of them graduate from high school, andmany go on to some form of higher education.There is an increased emphasis on education fora cal -aer. There are fewer pupils per teacher in pub-lic schools than in earlier years, and the teacherstend to be better paid than their predecessors.Efforts to support education (both in terms of ac-tual el:tilers and as a percentage of the grossnational product) are greater than ever before. Allin all, we are clearly making progress.
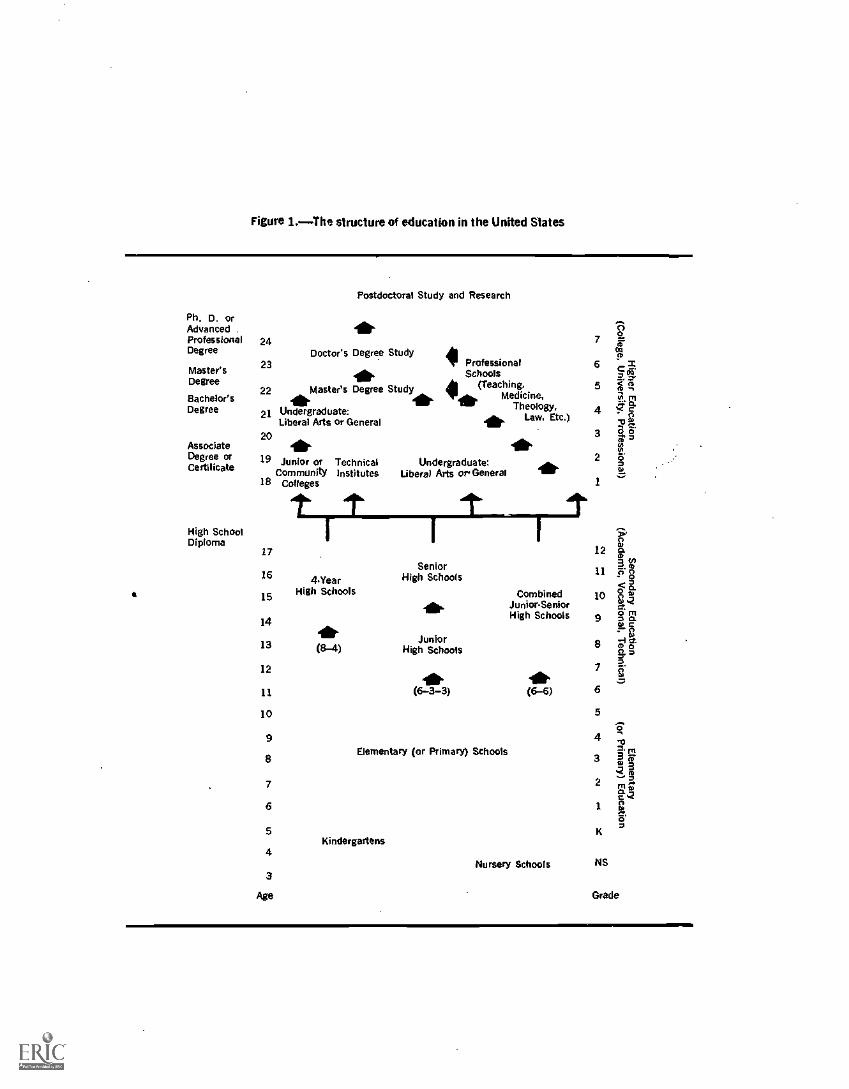
Figure 1.The structure of education in the United States
Ph. D. orAdvancedProfessionalDegree
Master'sDegree
Bachelor'sDegree
AssociateDegree orCertificate
High SchoolDiploma
Postdoctoral Study and Research
24Doctor's Degree Study
23 4 Professional
22 Master's Degree
21 Undergraduate:Liberal Arts or General
20
19 Junior or TechnicalCommunity Institutes
18 Colleges
17
16
15
14
13
12
11
10
9
8
7
6
5
4
3
Age
Schools
Study (Teaching,411,1i, Medicine,
Theology,Law. Etc.)
Undergraduate:Liberal Arts or Generalt
4YearHigh Schools
(8-4)
SeniorHigh Schools
JuniorHigh Schools
***(6-3-3)
Elementary (or Primary) Schools
Kindergartens
CombinedJunior-SeniorHigh Schools
(6-6)
Nursery Schools
7
6
5
4
3
2
1
12
11
10
9
8
7
6
5
4
3
2
1
K
NS
Grade
Chapter 1All Levels of Education
The purpose of this chapter is to provide a broadoverview of education in the United States fromkindergarten through the graduate school. It bringstogether materials from elementary, secondary, andhigher education to present a composite pictureof the American educational system. It containstables which show the total number of personsenrolled in school, the number of teachers, thenumber of schools, and total receipts and expendi-tures for education at all levels. Statistics oneducational attainment, on illiteracy and schoolretention rates, and on annual and lifetime incomeby years of school completed are also included.
Figure 1 provides a graphic presentation of thestructure of education in the United States. At theright side of the chart, the three levels of education(elementary, secondary, and higher) are indicated,and the approximate age of persons at each level isgiven on the left. As the chart indicates, pupilsordinarily spend from 6 to 8 years in the elemen-tary grades, and this is followed by 4 to 6 yearsof high school. The entire 12year program is
normally completed at the age of 17 or 18 years.High school graduates may enter a junior col-
lege, a technical institution, a 4year college oruniversity, or a professional school. A junior col-lege normally offers the first 2 years of a standard4year college program and a broad selection ofterminalvocational courses. Academic courses com-pleted at a junior college are transferable forcredit to 4year colleges and universities. A tech-
5
nical institute offers postsecondary technical train-ing not leading to bachelor's or higher degrees.
An associate degree requires at least 2 years ofcollegelevel work, and a bachelor's degree normallycan be earned in 4 years. At least 1 year beyondthe bachelor's is necessary for a master's degree,while a doctor's degree usually requires 3 or 4years beyond the baccalaureate.
Professional schools differ widely in their re-quirements for admission and the length of theirprograms. 'dicel students, for example, mustcomplete at least 3 years of premedical studies ata college or university before they can enter the4year program at a medical school. Engineeringstudents, on the other hand, can enter an engineer-ing school immediately upon completion of a
secondary school program.Many of the statistics in this chapter are derived
from the annual and biennial surveys of the Officeof Education. When necessary, these survey datahave been supplemented by estimates preparedespecially for this volume in order to make thetables as useful as possible. In addition, substan-tial contributions have been made by statisticsreceived from other agencies, both governmentaland nongovernmental, as indicated in the sourcenote at the end of the appropriate tables, The dataobtained from the Bureau of the Census surveysof educational attainment, governmental finances,and school enrollment by age. race, and sex areworthy of special mention for the valuable informa-tion they provide.

Table 1.-Estimated enrollment in educational institutions,by level of instruction and by type of control: United
States, tall 1971 and fall 1972'
jtn Thousands)
Level of instruction and type of control Fall 1971 fall 1972
1 2 3
Total elementary, secondary, and highereducation 59,707 59,530
Public 52,335 52,260
Nonpublic 7,372 7,270
Kindergarten-grade 12 (regular and other schools)' 51,591 51,310
Regular public schools 46.081 45,900Regular nonpublic schools 5,200 5,100
Olher public schools 240 240Other nonpublic schools 70 70
Kindergarten -grade 8 (regular and other schools)' 36.365 35,800
Regular public schools 32,165 31.600Regular nonpublic schools 3.900 3,000Other public schools 170 170
Other nonpublic schools 30 30
Grades 9-12 (regular and other schools)' 15226 15,510
Regular public schools , 13,8)5 14,100
Regular nonpublic schools 1,300 1,300Other public schools 70 70Other nonpublic schools 40
- ..... - .40, ..-.
Nigher education (tolal degree-credit enrollment in uni-versities, colleges. professional schools, leacherscolleges, and junior colleges?' 8,116 8,220
Public 6.014 6.120
Nonpublic 2.102 2,100
Undergraduate' 7.208 7,290
Graduate 908 930
' The 1971 figures for regular nonpublic and other elementary and secondaryschools, and all 1972 figures, are preliminary. Surveys of nonpublic elementaryand secondary schools have been umducted at less freousnl intervals than thoseof public schools and of inslitutions of higher education. Consequently. the esti-males for nonpublic schools are less reliable than those for other types of insti-tutions. The estimates 101 1932 are derived from changes in the schoolagepopulation combined with the longrange trend in school enrollment rates ofthe imputation.
' "Regular" schools include schools which are e part of Stale and local schoolsystems and also most eon-prolil-making nonpublic elementary and secondaryschools, both church affiliated and nonsectarian. "other schools include sub-collegiate departments of institutions of higher education, residential schoolsfor exceptional children, Federal schools for Indians. and Federal schools onmilitary posts and other Federal installations.
'Excludes undergraduate students in occupational programs which are not or-dinarily creditable toward a bachelor's degree. There were approximately 833,000of these non-degree-credit students in fall 1971.
4 Includes students working toward firstprofessional degrees, such u 14.D.. D.D.S.,LL.B., and B.0. Approximately 193.000 students were in this calegory in /all1971.
NOTE.-Fall enrollment is usually smaller Than school-year enrollment, since thelatter is a cumulative figure which includes students who enroll at any time duringthe year.
SOURCE: U.S. Department of Health, Education, and Welfare, Office of Education,"fell 1971 Statistics of Public Schools"; "Fall Enrollment in Higher Education,1971 " ; and estimates of the National Center for Educational Statistics, ORica alEducation.
6
Table 2.-Enrollment in educational institutions,by level of instruction and by type of control:
United States, fall 1969
Level of instruction,by type of school All schools
Publiclycontrolledschools
Privatelycontrolled
schools
i 2 3 4
All levels (elementary,secondary, hillier) 58,765,766 001.900.528 .7.3$5,2311
Elementary and secondary 51,62001 45.066,691 5,761.000
Kindergarten-grade 8 37,111,390 32,784,390 4.327,000Grades 9-12 and postgraduate 14,518.3W 13,084.301 ,-. 1,434,000
Higher education 7.136,075 5.111.837 7,024.238
Kindergarten 2.821,213 2,619,213, 202,000
Regular' 2,801,212 2,301,242 2 200,000Subcoliegiate departments of institu-
tions of higher education 2 6,000 5J000 1.000Residential schools for exceptional
children 2 7,000 6.000 1.000federal schools for Indians'federal schools on Federal installa-
tions I. . . ,
4,871
2,100
4,871
2,100
0
0
Trades 1.6, inclusive - 34.290,177 30,165.177 4,125,000
Regular' 34,095.626 29,995,626 24,100,000Subcoltegiate departments of inslitu-
lions of higher education 2 41,000 33.000 8,000Residential schools for exceptional
children 2 87,000 70,000 17.000Federal schools for Indians' 33.851 33,851 0Federal schools on Federal installs-
Hoes' 32,700 32,700 0
Trades 9.12 and postgraduate 14,510,301 13.084,301 1.434,000
Regular* 14,421,710 13,021,710 01,400.000Subcollegiate departments of in stilt'
lions of higher education' 44.000 19,000 25,000Residential schools for exceptional
children' 37,000 28,000 5.000federal schools for Indians'. 12,191 12,191 0Federal schools on federal Installa-
tions=
ligher education :
3,400. 3.400
Resident degreocre .11 enrollment 7,136.075 ,t I1,837 2,024230
Undergraduate and lirst-profes-sional 5991,152 4,357,531 1,633,621
Graduate 828,046 548 .025 260.021Unclassified 316,877 206,2111 110,596
a Includes ertrottmeats in local public school systems and in nonpublic schools(churchaffiliated and nonsectarian), Excludes subcollegiste departments of in.;Mations of higher education, residential schools for exceptional children, andFederal schools.
'Estimated.1 Includes pupils enrolled at any time during*. school year 1969-70.
SOURCES: U.S. Department al Health, Education, and Welfare, Office of Educe-bon. "Fall 1969 Statistics of Public schools"; "Opening Fall Enrollment in HigherEducation, 1960"; and unpublished data. U.S. Department of the Interior. Bureauof Indian Affairs, "Statistics Concerning Indian Education," fiscal year 1970.
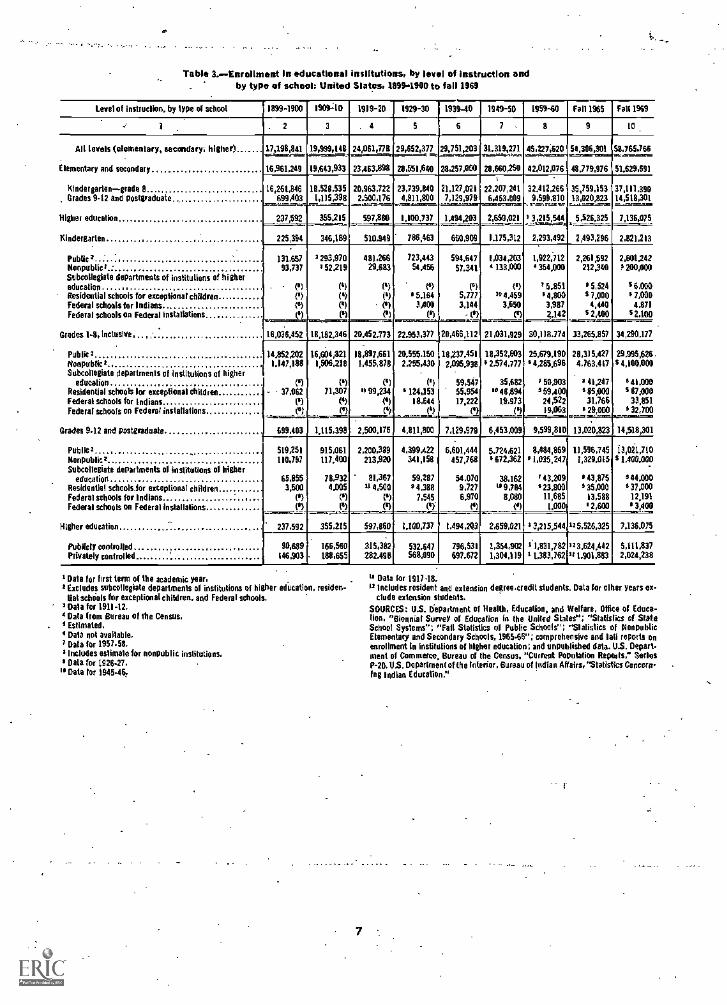
Table 3r- Enrollment In educational institutions, by level of instruction andby type of school: United States, 1899.19410 to fall 1969
Level of instruction, by type of school 1899-1900 1909 -10 1919-20 1929 -30 1939-40 1949-50 1959 -60 Fall 1965 Fall 1969
1 . 2 3 . 4 5 6 7 , 8 9 t0,
All levels (elementary, secondary; higher) 17,198 841 19,199,1411 24 061,779 29,652.377 29,751,203 31.319,271 45,227'620 54,306.301 58,765,766
Elementary and secoodary 16,961,249 19,643,933 23,463.898 28.551,640 23.257,000 20,660250 42,012,076 48,779,976 51,629.691l
Kindergarten-grade 8 16,261.846 18,528,535 20,963,722 23,739.840 21.127,021 21,107,241 32.412,266 35,759.153 37.111,390Grades 9-12 and postgraduate 699,403 1,115,398 2.500,176 4,811,800 7,129,979 6,453.009 9.599,810 13,020,823 14,518,301
Higher education 237,592 355,215 597,880 1,100.731 2,689,021 1 3,215,544 7,136,075
Kindergarten 225,394 346,189 510.949 786,463
.1494,203
660,909 1.175,312
...5,526,325
2,293.492 2493,296 2.821,213
Public=_ 131.657 3293,970 481.266 723,443 594,647 1,034,203' 1,922,712 2,261,592 2,601242Nonpublic: 93,737 3 52,219 29.683 54.456 57.341 4 133.000 ' 354,000 212,340 P 200.000
Slibc011egiate departments of institutions of highereducation et (I) (I) (*) ( *) e) , 5,851 3 5,524 9 6,000Residential schools foe ezeoptionat children (3) (') (6) 9 5,164 5.777 30 4,459 34.800 9 7,000 5 7,000Fedeeal schcals for Indians (4) (9 ('0 3400 3,144 3,650 3,987 4,440 4,871Federal schools on Federal installations (0) (*) ei (9) -s) e) 2.142 9 2.400 92,100
Grades 1-8, inclusive 16,036,452 18,182,346 20,452.773 22.953,377 20,466,112 21,031.929 30,118.774 33,265,857 34,290,177
Public' 14.852,202 16,604;121 18,897,661 20.555.150 18,237.451 18,352,603 25.679.190 20,315.427 29,995,626Nonpublic I 1,147,188 1,506,218 1,455,878 2,255,430 2,095.938 *2.574,777 *4,285,696 4,163,417 *4,100,000Subcollegiate departments of institutions of higher
education (3) (3) (41 (3) 59,547 35,982 150,903 3 41,247 *41,000Residential schools lot exceptional children 37,062 71,307 a 99,234 * 124,153 55,954 3* 48,694 659,400 1115P00 9 87,000Federal schools for Indians (3) (") 441 18,644 17,222 19,973 24,522 31,766 33,851
Federal schools on Federal installations, (111 (3) 11) (1)4 (4) (0) 19,463 0 29,000 6 32,700
Grades 9.12 and postgraduate 699,403 1,115,398 2,500,175 4,811,800 7,129,979 6,453,009 9,599,810 13,020,823 14,518,301
Public' 519,251 915,061 2,200,339 4,399.422 6,601,444 5.724.621 8,484,869 11,596,745 13,021,710Nonpublic' 110,797 117.4001 213 ,920 341,158 457,768 9672,362 51.035,247 1,329,015 91,400.000Subcbllegiate departments of institutions of higher
education 65,855 78932 81,367 59,287 54,070 38,162 / 43.209 9 43,875 6 44,000Residential schools.for exceptional children 3,500 4.005 u 4,500 *4,388 9,721 09,764 *23,800 6 350000 *37.000Federal schools foe Indians (3) (0) I') 7,545 6,970 8,080 11,685 13,588 12,191
Federal schools on Federal insbilations (3) (") (I) (') (41 V) 1,000 3 2,600 6 3400.........._. _.-...,_-_,,..... ___, -._ _ . _Higher education 237,592 355,215 597,860 1.100,737 1,494,293 2.659,021 13,215,544 125.526,325 7.136.075
Publicly controlled 90.689 166,560 315,382 532.647 796,531 1,354,902 1 1,831,782 123.624,442 5,111,837Privately controlled 146,903 188,655 282,498 568,090 697.672 1,304,119 11,383,762 331.901,883 2,024,238
1 Data for first teem of the academic year.I Excludes sUlcollegiate departments 01 institutions of higher education, residen-
tial sehlois for exceptional children, and Federal schools.3 Bala for 191142.4 Data from Bureau of the Census.1 Estimated.4 Data not available./ Data for 1957.58.1 includes estimate for nonpublic institutions.9 Data for 1926-27.
13 Data for 194546.
13 Data for 1917.18.le includes resident and extension degreecredit students. Data for °liter years ex.
dude extension students.
SOURCES: U.S. Department of Health, Education, and Welfare, Office of Educa-tion. "Biennial Survey of Education in the United States"; "Statistics of StaleSchool Systems"; "Fall Statistics of Public Schools"; "Statistics of NonpublicElementary and Secondary Schools, 1965.66"; comprehensive and !all reports Onenrollment in institutions of higher education; and unpublished data. U.S. Depart.ment of Commerce, Bureau of the Census, "Current Population Reports," SeriesP-20. U.S. Department of the Interior, Bureau of Indian Affairs, "Statistics Garment.fog Indian Education."
7
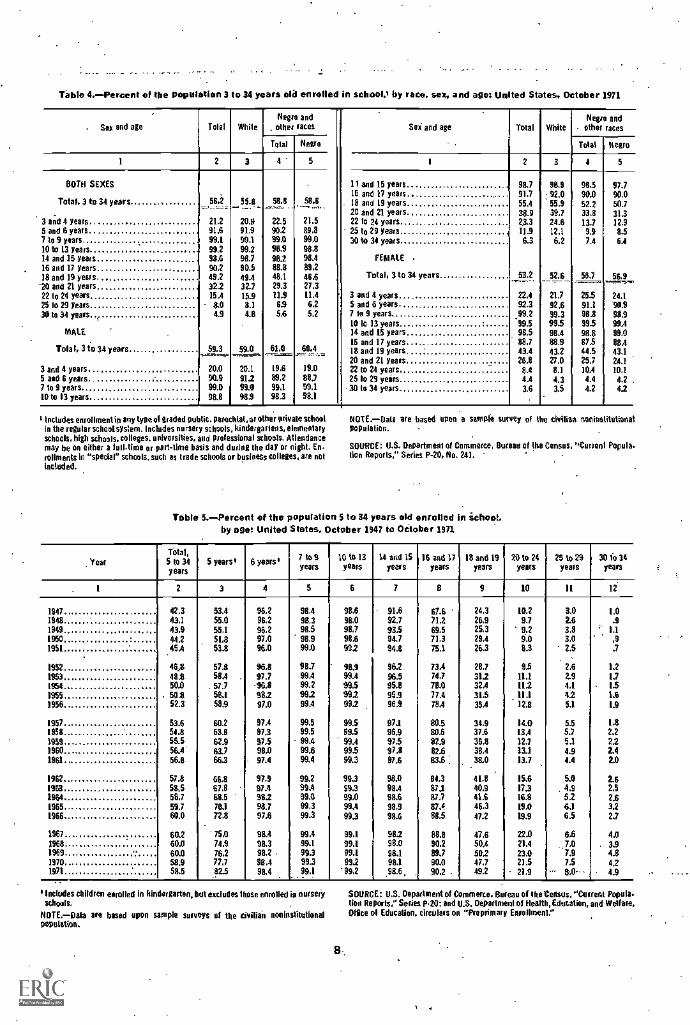
Table 4.-Percent of the population 3 to 34 years ea enrolled in school.' by race, sex, and age: tinned States, October 1971
. Sex and age Iola' WhiteNegro and
Other races Sei and age Total WhiteNegro and
- other races
Total Nero Total hem
1 2 3 4- 5 I 2 3 4 5
BOTH SEXES - 11 and 15 years 98.7 919 98.5 97.716 and 17 years 91.7 92.0 90.0 90.0
Total. 3 to 34 years 56.2 551 58.8 _58.6 . 18 and 19 years 55.4 55.9 52.2 50.720 and 21 years 38.9 39.7 33.8 31.3
3 and 4 years 21.2 20.9 22.5 21.5 22 to 24 years 213 24.6 13.7 12.95 and 6 years 91.6 91.9 90.2 89.8 25 to 29 years d
11.9 12.1 9.9 8.5/ to 9 years 99.1 99.1 ' 99.0 99.0 30 to 34 years 6.3 6.2 7.4 6.410 to 13 years 99.2 99,2 96.9 98.814 and 15 years 98.6 98.2 982 98.4 FEMALE
16 and 17 years 902 915 88.8 89.218 and 19 years,20 and 21 years
49.2322
49.432.2
48.129.3
46.6273
Total, 3 to 34 years 53.2-... 52.6 562 519-
22 to 24 years 15A 15.9 11.9 11.4 3 and 4 years 22.4 21.7 25.5 24.1
ZS to 29 years 8.0 8.1 6.9 6.2 S and 6 years 92.3 92.6 91.1 101id to 34 years 4.9 4_11 546 5.2 710 9 years 99.2 99.3 98.8 983
. 10 lo 13 years '99.5 99.5 99.5 99AMALE 14 and 15 years
-98.5 NA 98.8 910
Total, 3 to 34 earsy 59.3---- 59.0 _ 81.0,-= 60.44., :.=16 and 17 years18 and 19 years.
88.743.4
88.943.2
87.544.5
88/43,1
20 and 21 years 26.8 27.0 25.7 24.11 and 4 years 20.0 20.1 19.6 19.0 22 to 24 years 81 8.1 10.4 10.1i and 6 years 90.9 912 892 SU 25 lo 29 years 4.4 4.3 4.4 4.2 -
P so 9 years 99.0 99.0 99.1 99.1 -30 to 34 years 3.6 3.5 4.2 42IOU 13 years 98.0 98.9 98.3 911
Includes engollmentin any type.' graded public, puocbtat, or other private schoolin the regular school system. Includes nursery schools, kindergartens, elementaryschools, high schools. colleges. universities, and professional schooh. Allendancemay be on either a lull-time or part-time basis and during the day or night. En-rollments In "special" schools. such as trade schools or business colleges, are notincluded.
NOTE.-Data are based upon a sample survey of the civilian noninstitotionalpopulation.
SOURCE: U.S. Department of Commerce, Bureau of the Census, "Curren' Popula-tion Reports," Series P-20, No. 241.
Table 5.-.Percent of the population 5 to 34 years old enrolled in school.by eget United Stoles. October 1947 to OCtober 1971
Yearlintel,5 to 34years
5 years' 6 years' 7 WSyears
10 to 13years
14 sad 15years
36 and 17years
18 and 19years
29 to 24years
25 to 29years
3010 34years
1 2 3 4 5 6 7 B 9 10 11 12
1947 42.3 53.4 96.2 98,4 98,6 91.6 61.6 24.3 10.2 3.0 1.01948 43.1 55.0 96,2 98.3 98.0 92.7 71.2 26.9 9.7 2.6 .91949 43,9 55.1 96.2 98.5 98.7 93.5 69.5 25.3 9,2 33 ' 1.11950 . 442 61,8 97.0 9B,9 98,6 94.7 71.3 29.4 6.0 3.0 A1951 45/ 53.8 96.0 99.0 99.2 94.8 75.1 26.3 8.3 2.5 .7
1952 48,8 57.8 96.8 917 919 96.2 73.4 28.7 15 2.6 1.21953 48.8 58-4 . 97.7 99A 99.4 96.5 74.7 332 13.1 2.9 171954 50.0 57.7 -918 99.2 99.5 95.8 78.0 32A 112 4.1 1.53955 50.8 58.1 982 99.2 992 95.9 771 35.5 31.1 42 1.61956 52.3 583 97.0 99A 992 96.9 78A 35A 12,8 5.3 1.9
1957 53.6 60.2 87.4 99.5 99.5 97.1 80.5 34.9 141 5.5 1.81958 54.8 63.8 97.3 99.5 69.5 96.9 80.6 37.6 13.4 5.7 2.21959 55.5 62.9 97,5 99.4 99.4 973 82.9 36.8 12.7 5.1 2.21960 56.4. 63.7 98.0 99.6 99.5 973 82.6 39,1 13.1 4.9 2.41961 56.8 66.3 - 97.4 99.4 99.3 97.6 63.6: 38.0 13.7 4.4 20
1962 57.8 66.8 97.9 99.2 913 98.0 84.3 41.8 15.6 5.0 2.61993 515 673 97.4 99.4 99.3 98,4 87.1 40.9 17.3 4.9 2.51964 58.7 68.5 982 99.0 49.0 916 87.7 41.6 16.8 5.2 2.61965 59.7 703 98.7 99.3 99,4 98.9 871 46.3 19.0 6.3 3.21966 60.0 72.8 97.6 99.3 99,3 98.6 88.5 47,2 19.9 6.5 23
1167 60.2 75.0 98.4 99.4 99.1 98.2 88.8 47.6 22.0 6.6 4.01968 60.0 74.9 98.3 99.1 99.1 58.0 90.2 50.4 23.4 7.0 . 333969 II, 60.0 76.2 98.2 99.3 99.1 98.1 89.7 502 23.0 7.9 4.81970 58.9 77.7 98.4 99.3 99.2 98.3 90.0 47.7 21.5 7.5 421973 58.5 825 98.4 69.1 "99.2 98.6 . 90.2 . 49.2 21.9 *- 10-.. 19
Includes children enrolled in kindergarten, but excludes those enrolled in nurseryschools.
NOTE.-Dab are based upon sample surveys of the civilian noninstitutionalpopulation.
SOURCE: U.S. Department of Commerce. Bureau of the teasus, "Cu rent Papule.lion Reports." Series P20: and U.S, Department of Health, Education, and Welfare.°Moe 44 Education, circulars on "Preprimary Enrollment."
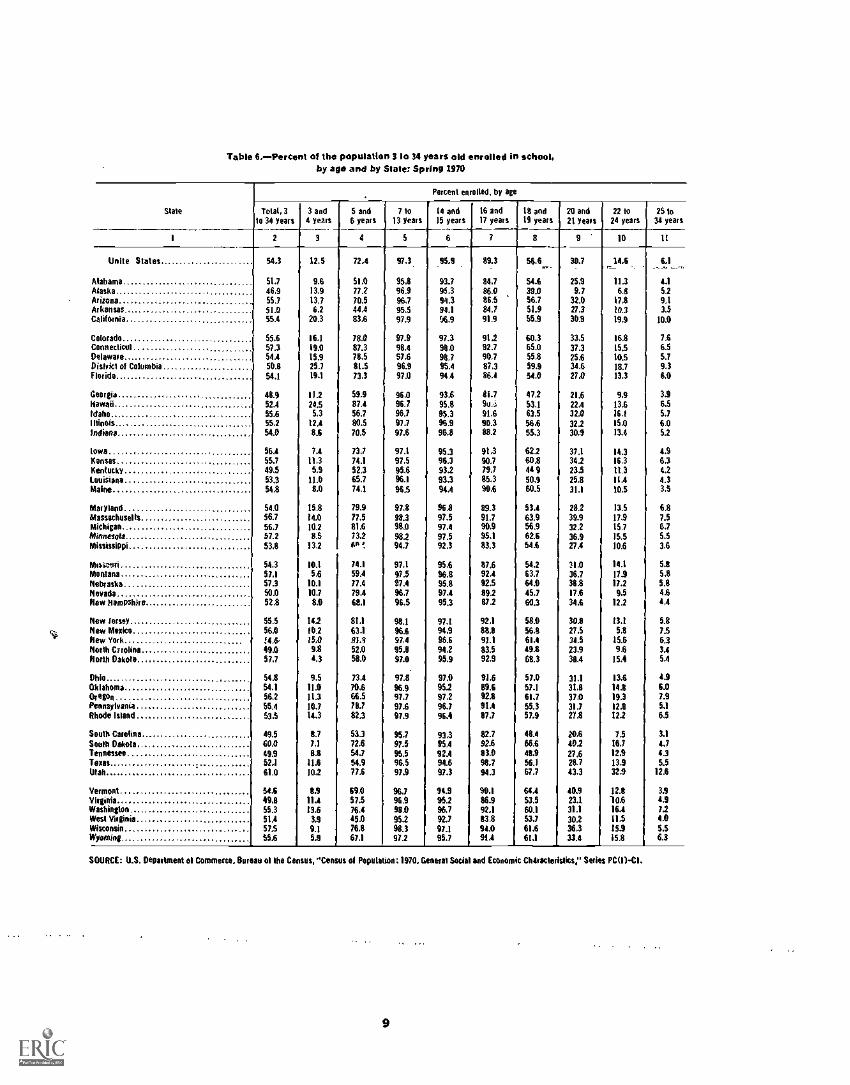
Table G.-Percent of the population 3 to 34 years old enrolled in school,by age and by State: Spring 2970
Stale
Percent enrolled, by age
Total, 3to 34 years
3 and4 years
5 and6 years
7 to13 years
14 and15 years
16 and17 years
.1
18 and19 years
20 and21 yearn
22 to24 years
25 to34 years
1 2 3 4 5 6 7 8 9 10 11
Unite States 54.3 1.2.5 72.4 97,3 95.9 89.3 56.6. 30.7 14.6 6.1..--... __.,
Alabama 517 9.6 51.0 95.8 93.7 84.7 54.6 25.9 11.3 42Alaska 46,9 13.9 772 96.9 95.3 861 39.0 9.7 6.8 5.2Arizona 55.7 13.7 70.5 96,7 941 86.5 56.7 32.0 17.8 9.1Arkansas. 51.0 6.2 44.4 95,5 94.1 84.7 51.9 27.3 10.3 3.5California, 5E4 20.3 83.6 97.9 96.9 91.9 55.9 30.9 191 10.0
Colorado 55.6 16.1 78.0 97.9 97.3 91.2 60,3 33.5 16.8 7.6Connecticut 57.3 19.0 87.3 98,4 9E0 92.7 65.0 37.3 15.5 6.5Delaware 54.4 15.9 78.5 9E6 98.7 90.7 55.8 25.6 10.5 5.7District of Columbia .......... ............. 50.8 25.7 81.5 96.9 9E4 87.3 59.9 34,6 18.7 9.3Florida 54.1 19.1 73.3 97.0 94.4 86.4 54.0 27.0 13.3 6.0
Georgia 48.9 11.2 59.9 96,0 93.6 61.7 472 21.6 9.9 31Hawaii 52.4 24.5 87.4 96.7 95.8 9u.:. 5E1 22,4 13.6 6.5Idaho 55.6 5.3 56.7 96.7 95.3 91.6 63.5 32.0 16.1 5.7Illinois 55.2 124 80.5 97.7 96.9 90.3 566 32.2 15.0 6.0Indiana 54.0 8/ 70.5 97.6 96.8 88.2 55.3 30.9 13.4 5.2
lows 56.4 7.4 73.7 97.1 95.3 91.3 622 37.1 14.3 4.9Kansas 55.7 11.3 74.1 97.5 96.3 90.7 60.8 34.2 16.3 6.3Kentucky 491 5.9 52.3 95.6 932 79.7 44 9 23.5 11.3 4.2Louisiana 53.3 11.0 65.7 96.1 93.3 85.3 501 25.8 11.4 4.3Maine 54.8 8.0 74,1 96.5 94.4 90.6 60.5 31.1 10.5 3.5
Maryland 54.0 15.8 79.9 97.8 96,8 89.3 53.4 282 13.5 6.8Massachusetts 56.7 14.0 77.5 111.3 97.5 91.7 63.9 39.9 17,9 7.5Mithigaa 56.7 10.2 81.6 98.0 97,4 90.9 56.9 32.2 15.7 6.7Minnesota 57.2 8.5 73.2 98.2 97.5 953 62.6 36.9 15.5 5.5Mississippi 53,8 13.2 41, t 94.7 92.3 8E3 54.6 27.4 10.6 3.6
Msasetiri 54.3 10.1 74.1 97.1 95.6 87.6 54,2 3E0 14.1 5.8Montana 57.1 51 59.4 97.5 96.8 92.4 63.7 36.7 17.9 5.8Nebraska 57.3 10.1 77.4 97.4 95.8 92.5 64.0 38.8 17.2 5.8Nevada 50.0 10.7 79.4 96.7 97.4 89.2 45.7 17.6 9.5 4.6New Hampshire 52.8 8.0 68.1 96.5 95.3 87.2 60.3 341 12.2 4.4
New Jersey 55.5 14.2 81.1 98.1 97.1 921 58.0 301 132 5.8New Mexico 56.0 10.2 63.1 96.6 94.9 88.11 569 27.5 5.8 7.5New York 74.6 15.0 81.9 97,4 96.6 9/.1 61,4 3E5 15.6 6.3North Viol laa 49.0 9.8 52.0 95.8 942 83.5 491 23.9 9.6 3.4North Dakota 57.7 Es 58.0 97.0 95.9 92.9 68.3 MA 15.4 5.4
Ohio. 54.8 9.5 73.4 97.8 97.0 914 57.0 31.1 13.6 41Oklahoma 54,1 11.0 70,6 96.9 95.2 89.6 57.1 31.1 14.11 6.0Oregon. 5E2 11.3 66.5 97.7 972 921 617 37.0 19.3 7.9Poway irania 5E4 10.7 7E7 97.6 96.7 91.4 55.3 31.7 12.1 5.1Rhode Island 53.5 143 82.3 97.9 96.4 87.7 57.9 27.8 122 63
South candela 49.5 8.7 53.3 95.7 93.3 82.7 48.4 20.6 7.5 3.1South Dakota 60.0 7,1 72.6 97.5 95.4 92.6 66.6 40.2 16,7 4.7Tennessee 49.9 81 54.7 95.5 92.4 83.0 481 27.6 12.9 4.3Texas 52.1 11.6 54.9 96.5 94.6 86.7 5E1 28.7 131 5.5Utah 61.0 10,2 77.6 971 97.3 94.3 67.7 43.3 32.9 12.6
Vermont 54.6 8.9 69.0 96.7 94.9 9E1 64.4 40.9 12.8 3.9Virginia 49.11 114 57.5 96.9 95.2 86.9 53.5 23.1 10.6 41Washington 55.3 13.6 76.4 98.0 96.7 9E1 60.1 31.1 16.4 7.2West Virginia 51.4 3,9 45.0 952 92.7 83.8 53.7 30.2 11.5 4.0Wisconsin 57.5 9.1 76.8 98.3 973 94.0 61.6 36.3 151 5.5Wyoming 55.6 5.9 67.1 97.2 95.7 914
___rMI 33.4 15.8 6.3
SOURCE: U.S. Deparlateet 01 Commerce, Bureau of the Census, "Ceases al Population; 1970, Gement Soria and Economic Charade istics," Series PC(1)-C1.
9
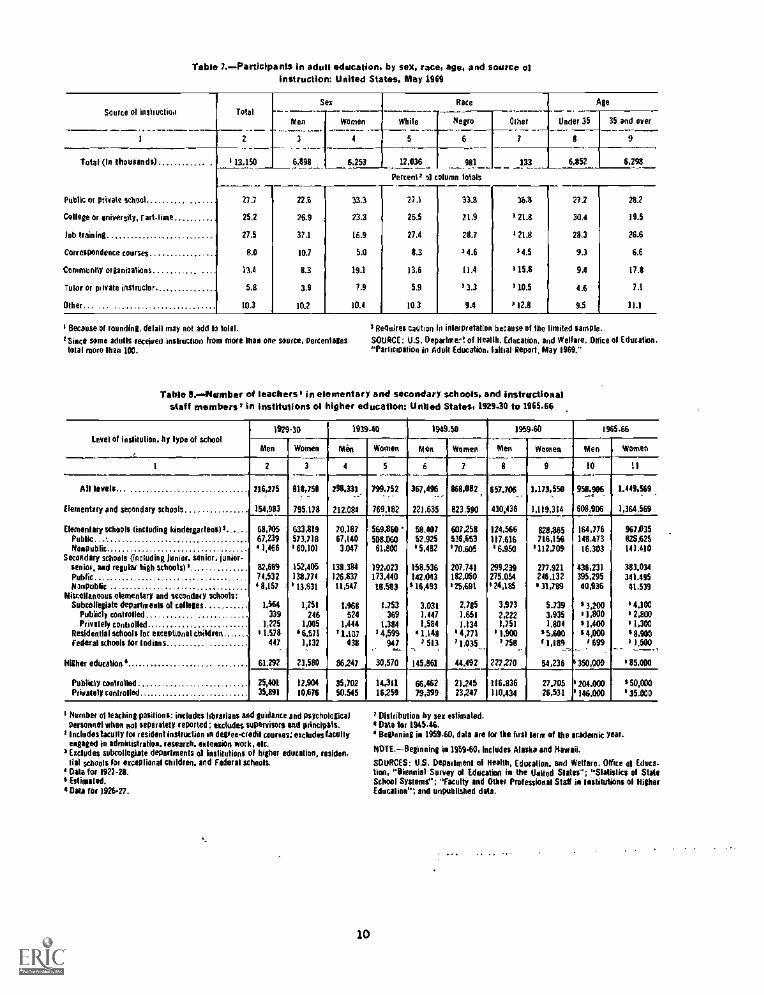
Table 1.- Participants in adult education, by sex, race, age, and source ofinstruction: United States, May 1969
Source of instruction TotalSex Race Age
Under 35Men Women While Negro Other I 35 and over
1 2 3 4 5 6 7 8
-- ---I 9
Total (In thousands) / 13.150 6,898 6.251 12,036 981 133 6,352 I 6,298
Percent/ of column totals
Public or private school... ....... ... 271 22.6 33.3 27.1 33.8 36.3 27.2 28.2
College or university, rart-lime 25.2 26.9 23.3 25.5 21.9 / 214 30.4 19.5
fob training 27.5 37.1 16.9 27.4 28.7 / 21.8 28.3 26.6
Correspondence courses 8.0 10.7 5.0 8.3 14.6 14.5 9.3 6.6
Community OtileindiOne 13.4 3.3 19.1 13.6 11.4 / 156 9.4 17.8
Tutor or private instructor 5.8 19 7.9 5.9 / 3.3 / 10.5 4.4 7.1
Other 10.3 10.2 10.4 10.3 9.4 / 12.8 9.5 11.1
/ Because of rounding, delail may not add lo Iola
1Siace some adults received instruction from more Mao one source, percentagestotal more than 100.
3 Requires caution n interpretation because of the limited sample.
SOURCE: U.S. Oepartmer! of Health. Education, and Welfare. Office of Education."Participation in Adult Education, initial Report, May 1969."
Table Or...Number of teachers' in elementary and secondary schools, and instructionalstaff members' in institutions of higher education: United States, 1929-30 to 1965.66
Level of inslitulion, by lype of school1929-30 191940 1949-50 1959-60 t965.66
Men Women Min Women---.Men Women Men
T-Women Men Women
1___
2 3 4 5 6 7 8 9 10 11
MI levels.. 216,275 818,158 298,331 149,152 367,496._.-
868,082 657.106 1.113,550 958.906 1.449,569_ -
Elementary end secondary schools 154,983 795,118 212.084 769,182 221.635 823,590 430,436 1,119,314 608,906 1,364,569
Elernenlaiy schools (including kindergarteas13 69.109 633,919 10,187 969.360 69.407 607253 124,566 828.365 164,776 961p35Public.. 67,239 513,718 67,140 538.060 52,925 536,653 117,616 716,156 148.413 325.525Noapublic 1,466 660,101 3.047 61,800 5,482 170.605 $6,950 112,109 16.303 141,410
Secondary schools (including junior. senior, junior-senior. aad regular high u11001510 82,699 152,405 138.384 192,023 158.536 207.741 299239 277,921 436,231 383.034Public 74,532 138,774 126,837 173,440 142.043 182,050 275,054 246,132 395,295 341.495Nonpublic 6 8,151 6 13,631 11,547 18.5113 16493 $25,691 24,1M 5 31.180 40,936 41.539
Miscellaneous elementary and secondary schools:Subcolleglate deparlmeals of colleges 1,564 1,251 1,968 1.153 3.031 2.185 3,913 5.739 3200 54.100
Publicly controlled 339 246 524 369 1.447 1.661 2,222 3,935 1,800 2,800Privately conbolled 1,225 1,005 1,444 1.384 1.584 1,134 1,251 1,804 $1,400 1,300
Residential schools for exceptional childiers 1.578 6671 11.107 3 4,599 1.148 '4,171 $ 1.900 $5,600 $4,000 $8,900Federal schools Mr Ionians 447 1,132 438 947 / 513 11.035
. -_,1153
.../ 1,184
__, ._/ 699 / 1,M0
- -_ .____.,
Nigher education. 61,292 23,580 86241 30,570 145,861 44.492 227270 58,238 I 350,000 585,000
Publicly cannoned 25,401 12,904 35,102 14,311 66,462 21.245 116.836 27,705 204.00) 50600Privately controlled 35.891 10,676 50.545 16259 79,399 23247 110.434 26,531 $146.030 35.000
/ Number of teaching positions: includes librarians and guidance and psychologicalPersonnel when nal separately reported : excludes supervisors and principals.
/ Includes bully for resident instruction 0 degree-credil courses: excludes facultyengaged in administratioa. research. 'Romano work, etc.
3 Excludes subcollegiate departments of institutions 01 higher education, residen-tial schools for exceptional children. and Federal schools,
' Oda for 1922 -28./Estimated.
Oat* for 1926-27.
10
3 Distribution by sex estimated.Date ler 1945-46.
6 Beginning is 1959-60, data are for the first lerm of Me academic year.
NOTE,--Beginning M 1959-60, Includes Alaska and Hawaii.
SOURCES: U.S. Depadmenl 01 Health, Education. and Welfare. Office of Educe-bon, "Biennial Survey of Education in the United Slates"; "Slatistics of StaleSchool Systems"; "Faculty and Other Professional gal is lastilulions of NigherEducatioa"; and unpublished data.

Table C.alienated number of classroom teachers in elementary and secondary schools, and total instructional staff forresident courses in institutions of higher education: United States, fall 1971 and fall 19721
iFuil-timo and part-time teachers and stall
Level of instruction and type ol control Fall 1911 Fall 1972 Linn' of instruction and type of control Fall 1971 Fall 1972
1 2 3 1 2 3
Total elementarykse cautery, and higher Public 1.151.000 1.146,000, education 2,899,000 2,938,000 Nonpu lic 143.000 142.000
POP^ 2,478,000 2,517,000 Secondary classroom tea:hers in regular andNonpublic 421.000 421,000 other schools 3. 1,003.000 1,030,000
Elementary and secondary classroom teachers in Public.. 929,000 950,000regutor and other schools 2 2.296,000 2,318,000 Nonpublic 74,000 74,000
Public 2,079,000 2,102.000 Higher education instructional staff for residentNonpublic 217,000 216,000 courses thrst term)1 603.013 620,000
Elementary classroom teachers in regular andother schools 1, .. '. 1,293,003 1.288.000
'ethic -..,Nonpublic.
399003204,030
415,000205,000
' The 1971 figures for nonpublic and other elementary and secondary schools andfor institutions of higher education, and all 1972 figures, are estimates, Data fornonpublic elementary and secondary schools are not as complete as those forpublic schools; consequently. the estimates los nonpublic schools are not asreliable as those for public schee's or for higher education. The estimates for1972 are d Rived from erpected enrollment changes combined with the long-termtrend in pupilteacher ratios.
2 The figures include elementary and secondary classroom leachers in regular publicand nonpublic schools and other schools, such as Federal schools for Indians,
11
federally operated schools on posts, Subcollegia a departments 01 colleges, andresidential s:hools for exceptional children. for 1971. the numbers of such teach-ers are estimated as 12,000 in public and 2,000 in nonpublic elementary schools,4,000 in public and 3,000 is nonpublic secondary schools.
'Includes tulllime and part-time staff with rank of insiturear or above, and Juniorstall. such as graduate assistants, ter instruction in resident courses.
SOURCE: Surveys and estimates of the National Center for Educational Statistics,Office of Education, U.S. Department of Health, Education, and Weller*.
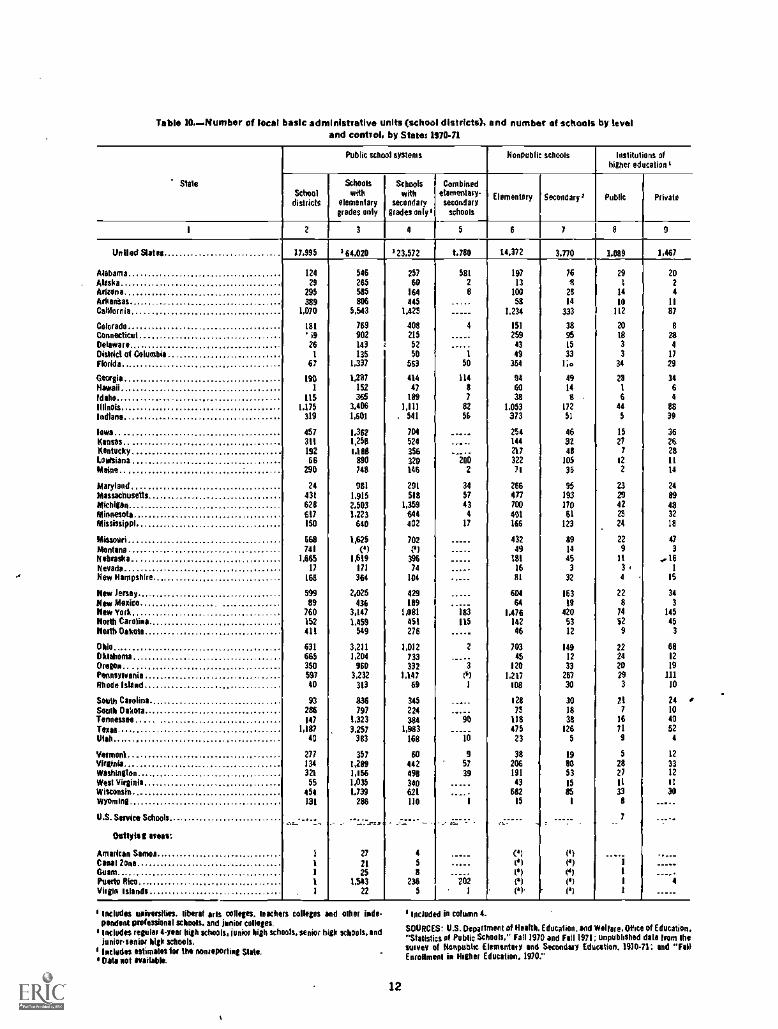
Table 10, Number of local basic administrative units (school districts), and number of schools by leveland control, by States 197041
Stale
Public school systems Nonpublic schools Institull ns ofhigher education s
Schooldistricts
Schoolswith
elementarygrades only
Schoolswith
secondarygrades only'
Combined
elsisfloOlsY"secondary
schools
Elementary Secondary' Public Private
1 2 3 4 5 6 ? 4 9
United States 17,995 164.020 s 23.572 1.730 14.372 3.770 1.089 1,467
Alobama 124 546 257 581 197 76 29 20Alaska 29 265 60 2 13 ft 1 2Arizona 295 535 164 8 100 28 14 4Wefts& 389 806 445 53 14 10 11Caltornia 1,070 5,543 1,425 1.234 333 112 87
Colorado 181 769 408 4 151 38 20 8Connecticut i9 902 215 ...... 259 95 18 28Delaware 26 143 r 52 - 43 15 3 4
Diskitt of Columbia 1 135 I 50 1 49 33 3 17
Florida 67 1,337 563 50 354 1".. 34 29
Staid* 190 1,287 414 114 94 49 23 34livoriii 1 152 47 $ 60 14 1 6Idaho 115 365 189 7 38 8 6 4
Illinois 1.175 3.406 1,111 82 1,053 172 44 88Indiana 319 1,601 . 541 56 373 51 5 39
Iowa 457 1.362 704 ...... 254 46 15 35Houses 311 1,251 524 .... -. 144 32 27 26Kentucky 192 1.118 356 ....-.. 217 48 7 28Loolsiana 66 890 320 200 322 105 12 11
Maine 290 748 146 2 71 36 2 14
Maryland 24 981 291 34 266 95 23 24Massachusetts 431 1.915 518 57 477 193 a 89Michigan 628 2.503 1,359 43 700 170 42 43Minnesota 617 1,223 644 6 401 61 25 32Mississippi 150 640 402 17 166 123 24 18
Missouri 668 1.625 702 432 89 22 47Montana 741 ('1 ('1 49 14 9 3
Nebraska 1,665 1,619 396 181 45 11 ,16Nevada 17 I71 74 .... 16 3 3 1
New Hampshire 168 364 104 ..... 81 32 4 15
New Jersey 599 2,025 429 604 163 22 34New Mexico as 436 119 ---- 64 14 8 3
New York 760 3,147 1,081 183 1.476 420 74 145
Nor* Carolina 152 1.459 431 115 142 53 32 45North Ooketa 411 549 276 46 12 9 3
Ohio. 631 3,211 1,012 2 703 149 22 61Oklahoma 665 1,204 733 45 12 24 12
Oregon 350 960 332 3 120 33 20 19Pennsylvania 597 3,232 1,147 ts1 1,217 267 29 111Rhode Island 40 313 69 1 108 30 3 10
South Carolina 93 831 345 128 30 20 24 ,
Sarah Dakota 286 797 224 ..... 75 18 7 10
Tennessee 147 1,323 384 90 118 38 16 40Tinos 1,187 3.257 1,983 475 126 71 52Utah 40 383 168 10 23 5 9 4
Vermont 277 357 60 9 38 19 5 12Virginia 134 1,289 442 57 206 30 28 33Washington 321 1,156 498 39 191 53 27 12
West Virginia 55 1,035 340 43 15 11 11
Wisconsin 454 1.739 621 682 85 33 30Wyoming 131 286 110 1 15 I 8
U.S. Swim Schools
Ostlyisg amiss:
American Samoa 1 27 4 ....-- (9 (s) ...-Caoal Zone 1 21 5 19 (1) 1
Guam 1 25 a (0) (4) 1 .....Pomba Rico 1 1,543 236 202 ts) (9 1 4Virgin Woods 3 22 5 1 (9 r (9 1
Includes universities. liberal arts colleges, leaders colleges and alba inde-pendent profesSional schools, and junior colleges.includes regular 4-year high schools, ionise high schools, senior high schools, andjuniorsenior high schools.laclodes estimates tor UM nonreporting SUM,Oats not mailable
12
Included in column 4.
SOURCES U.S. Department of Health. Education, and Welfare, Office of Education,"Statistics of Public Schools," fall 1970 and Fall 1971; unpublished dale from thesurvey of Nonpublic Eletnontary and Secondary tdocstion. 1970-71: and "FallEnrolment in Higher Educstion, 19707
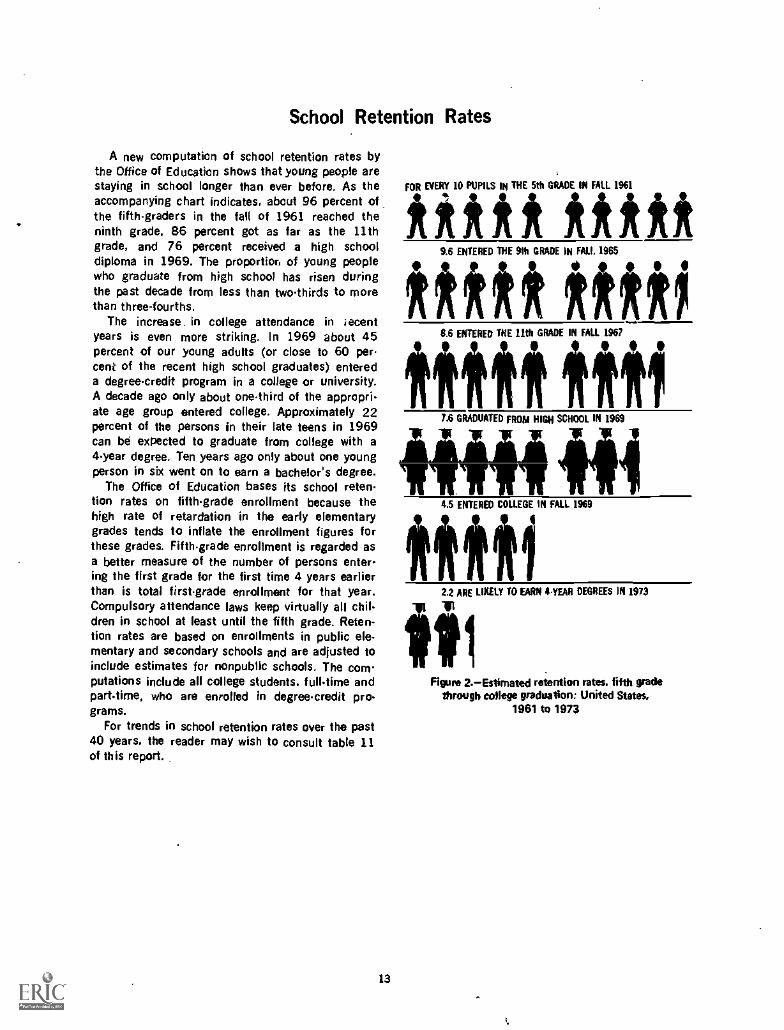
School Retention Rates
A new computation of school retention rates bythe Office of Education shows that young people arestaying in school longer than ever before. As theaccompanying chart indicates, about 96 percent ofthe fifth-graders in the fall of 1961 reached theninth grade, 86 percent got as far as the 11thgrade, and 76 percent received a high schooldiploma in 1969. The proportion of young peoplewho graduate from high school has risen duringthe past decade from less than two-thirds to morethan three-fourths.
The increase. in college attendance in recentyears is even more striking. In 1969 about 45percent of our young adults (or close to 60 per-cent of the recent high school graduates) entereda degreecredit program in a college or university.A decade ago only about one-third of the appropri-ate age group entered college. Approximately 22percent of the persons in their late teens in 1969can be expected to graduate from college with a4year degree. Ten years ago only about one youngperson in six went on to earn a bachelor's degree.
The Office of Education bases its school reten-tion rates on fifthgrade enrollment because thehigh rate of retardation in the early elementarygrades tends to inflate the enrollment figures forthese grades. Fifthgrade enrollment is regarded asa better measure of the number of persons enter-ing the first grade for the first time 4 years earlierthan is total firstgrade enrollment for that year.Compulsory attendance laws keep virtually all chil-dren in school at least until the fifth grade. Reten-tion rates are based on enrollments in public ele-mentary and secondary schools and are adjusted toinclude estimates for nonpublic schools. The computations include all college students, full-time andpart-time, who are enrolled in degree credit pro-grams.
For trends in school retention rates over the past40 years, the reader may wish to consult table 11of this report..
13
FOR EVERY 10 PUPILS IN THE 5th GRADE IN FALL 1961
***** *****9.6 ENTERED THE 91h GRADE IN MU. 1965
Altet Alftfl8.6 ENTERED THE 11th GRADE IN FALL 1967
7.6 GRADUATED FROM HIGH SCHOOL IN 1969
4444.5 ENTERED COLLEGE IN FALL 1969
2.2 ARE LIKELY TO EARN 4YEAR DEGREES IN 1973
11 1Figure 2. Estimated retention rates, fifth grade
through college graduation: United States,1961 to 1973

Table 11.-.Estimated retention rates.' 5th grade through college entrance,in public and nonpublic schools: United States, 1924-32 to 1962-.70
School year pupilsentered 5th grade
Retention per 1,000 pupils who roamed 5th grade High school graduation Firsttime;
collegestudents
51h
grade61h
grade71h
grade8th
, grade9Ih
gradeHIM
gradeIlth
grade12th
gradeNumber Year of
graduation
1 2 3 4 5 6 7 8 9_1
10 31 12-
1924.25 1,000 911 798 741 612 470 384 344 302 1932 1181926.27 1,006 919 824 754 677 552 453 .400 333 1934 1291928.29 1,000 939 847 805 736 624 498 432 37g 1936 137
1930.31 1,000 943 872 824 770 652 525 463 417 1930 3481932.33 1.009 935 889 631 786 664 570 510 455 1940 160
1934.35 1,000 953 092 842 803 711 610 512 467 1942 1291936-37 1,000- 954 895 849 839 704 554 425 393 1944 1211938.39 1,000 955 901 853 796 655 532 444 419 1946 e)1940-41 1,000 968 910 836 781 697 566 507 481 1948 (/)1942-43. 1/100 954 999 847 en 713 604 539 505 1950 205
194445 1,000 952 929 858 848 - 748 650 549 522 1952 234194647 1,000 954 945 919 872 775 641 583 553 1954 2113
1948-49 1,000 964 956 929 863 795 706 619 581 1956 3011158-51 1,000 981 968 921 886 809 709 632 582 1958 3081952-53 1,000 974 965 936 '904 335 746 667 621 1960 328
1954-55... 1,000 980 979 948 915 855 759 664 642 1962 3431956-57 1,000 986 984 940 - 930 871 790 728 676 1964 362Fall 1958 1,000 983 979 961 946 908 842 761 732 1966 384Fall 1960 1,000 980 973 967 952 913 858 787 749 1968 452Fall 1962 1,000 990 983 976 963 931 663 793 1752 1970 1465
'Riles for the 5th grade through high shoo graduation a e based on enrollmentsIn successive grades in successive years n public elementary and secondaryschools and ate adjusted to include estimates for nonpublic schools. Bales forfist-lime college enaoltrnent include fult.time and part-time students enrolled intwegames creditable toward a bachelor's degree.
I Data not available.Subject to revision when final data became available.
NOTE.---Beginning with the class in the 5th grade in 1958, data ace based on tallenrollment and exclude ungraded pupils. The net effect of these changes is toIncrease high school graduations and college entrance rates slightly.
SOURCE: U.S. Department of Wealth, Education, and Welfare. Office of Educe-Don, "Biennial Survey of Education In the United States," chapters on "StatisticalSummary 01 Educatio: and unpublished data available In the Office of Educative.
Table 120-levet of school completed by persons 25 years old and over and 25 to 29 years old,by color. United States, 1910 to 1972
Color, age, and date
Peasant. by level 01 1school compleled Median
schoolyearstom.pteted
[
Color, age, and date
Percent, by level ofschool completed Median
schoolyearscorn.plated
Less than5 years of'lemon-
lacy school
4 yearsof highschool
or mare
4 or moreyears ofcollege
Less than5 seats ofdenten
toy school
4 yearsof highschool
of more
4 or moreyears cicollege
1 2 3 4 5 I 2 3 4 5
WHITE AND NONWHITE
25 years old and aver: 25 to 29 yeas old:1910' 23.8 13.5 2.7 8.1 .1920' 12..9 22.0 4.5 8.519201 22.0 16.4 3.3 8.2 April 1940.. 3.4 412 6.4 10.71930' 17.5 19.1 3.9 SA April1950 3.2 55.2 8.1 122April 1940 13.5 24.1 4.6 8.6 April 1960 2.2 633 114 12.3April1950 10.8 33.4 6.0 9.3 March 1964 '1A 72.1 13.6 12.5April 1969Mitch 1964
8.37.1
41.148.0
7.79.1
10.511.7
March 1970Mardi 1972
.9.8
77.881.5
17.3199
12.612.7
Much 1970 5.3 552 11.0 12.2March 1972 . 4.6 - 58.2 12.0 12.2 NONWHITE
25 la 29 years old: 25 years old and over:April 1940 5.9 37.8 5.8 10.4 April 1940 41.8 7.7 1.3 5.7April 1950 4.6 51.7 7.7 12.1 April 1950 31.4 13.4 2.2 6.9April 1960 22 60.7 11.I 12.3 April 1960 235 213 3.5 82March 1964 2.1 69.2 12.8 12.4 March1964 18,6 27.5 4.7 8.9March 1970Match.1972
1.1.8
75.470.8
14.419.0
12.6122
March 1970March 1972
114.712.8
36.139.1
6.16.9
10.110.5
WHITE 25 to 29 years old:1920' 44.6 6:3 1.2 5.4
25 years old and ones: April 1940 26.7 12,1 14 7.1April ow 10.9 26.1 4.9 8.7 April1950 15.4 23.4 2.8 87Apia 1950 8.7 35.5 6.4 9,7 April 1960 72 33.6 5.4 104April 1964 6.7 43.2 8.1 10.8 March-1964 5.3 48.0 7.0 11.8March 1964 54 50.3 9.6 12,0 . March 1970, 2.2 58.4 10.0 -12.2March 1970 42 57.4 11.6 12.2 %larch 1912 1.2 66.6 11.6 12.4March 1972 3.7 60:4 12.6 - 12.3
I Estimate based in retrojection of 1940 census data on education by age.
NOTE. -Prior to 1950, data exclude Alaska and Hawaii.
- 14
SOURCE: U.S. Department of Commerce, Bureau of Die Census, "1960 Census 01Population." Vol. 1, Part 1; "Current Population Reports: Series P-20. tios. 138,158.207, and 243: Series P.O. No, 4; and 1960 Census Monograph, "Education ofthe American Population." by John K. Fetzer and Charles B. Nam.
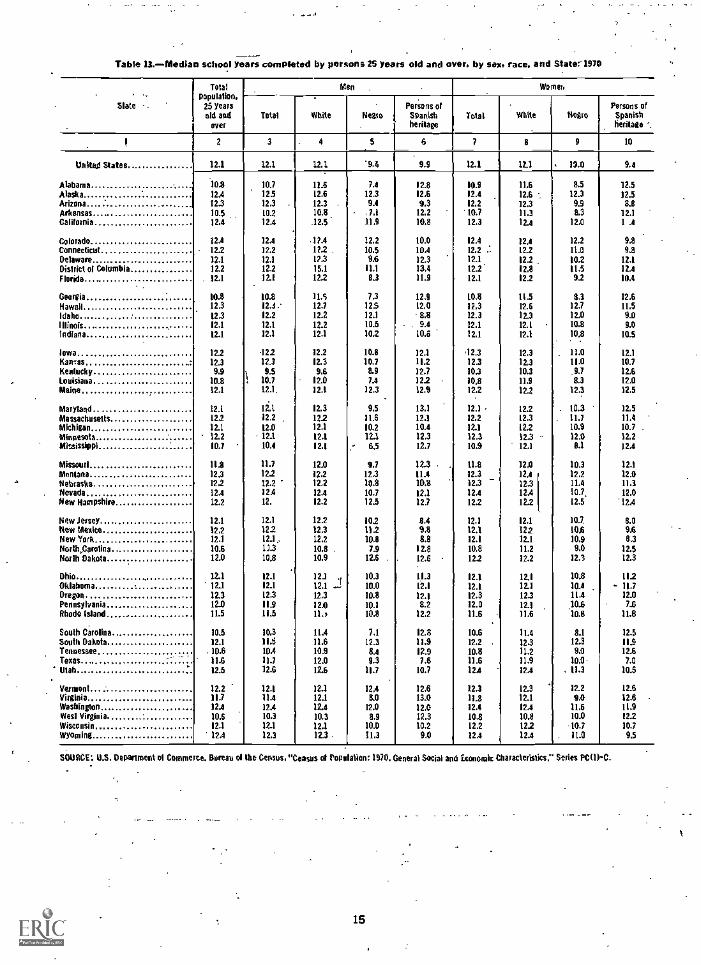
Table 13.-dedlan school years completed by persons 25 years cad and over, by sex. race, and State:1970
Slate --
Totalpopulalion,25 Yearsall and
over
Men Warner.
Total
.
White Negro.
Persons ofSpanishherilage
Total white NegroPersons ofSpanishheritage 4
1 2 3 4 5 6 7 8 9 10
United States 12.1 12.1 12.1 9.4 9.9 12.1 12.1 13.0 9.4
Alabama . 10.8 10.7 11.6 7.1 12.8 10.9 11.6 8.5 12.5Alaska 12.4 12.5 12.6 12.3 12.6 12.4 12.6 1 12.3 12.5Arizona 12.3 12.3 . 12.3 . 9A 9,3 12.2 12.3 9.9 8.8Arkansas 10.5 10.2 10.8 .7.1 12.2 *10.7 11.3 8.3 12.1California. 12.4 12.4 .12.5 11.9 10.8 12.3 12.4 12.0 1 .1
Colorado 12.1 12.4 17.4 12.2 10.0 12.4 12.1 12.2 9.8Connecticut ............... ........ 12.2 12.2 122 10,5 10.4 12.2 .' 122 11.0 LaDelaware 12.1 12.1 17.3 9k 12.3 12.1 12.2 10.2 12.1Dislrict of Columbia 12.2 12,2 15.1 11.1 13.4 12.2 12,8 11.5 12.1Florida 12.1 12.1 12.2 8.3 11.9 12.1 12.2 9.2 10.4
Georgia 10.8 10,8 11.5 7.3 12,9 L0.8 11.5 LI 12.6Hawaii 12.3 12.J.* 12.7 12.5 12.0 12,3 12.6 12.7 11,5Idaho 12.3 12.2 12.2 12.1 8.8 12.3 12.3 12.0 9.0Illinois 12.1 12,1 12.2 10.5 - . 9.4 12.1 12.1 10.8 9,0Indiana 12.1 12.1 12.1 10.2 10.6 12,1 121 10.8 10.5
Iowa 12.2 -12.2 12.2 10.8 12.1 .12.3 12.3 11.0 12.1
Hams 12.3 12.3 12.3 10.7 119 12.3 12,3 11.0 10.7Kentucky 9.9 i 9.5 9,6 8.9 12.7 10,3 10.3 .9.7 12.6Louisiana 10.8 1 10.7 12.0 7.4 12.2 10,8 11,9 8.3 12.0Maine 12.1 12.1. 12.1 12.3 12.9 12,2 12.2 12.3 12.5
Maryland 12.1 lit 12.3 9.5 13.1 12.1 12.2 . 10.3 12.5Massachusetts 12.2 12.2 122 11.6 12.1 12.2 12.3 . 11.1 11,4
Michigan 12.1 12.0 12.1 10,2 10.4 12.1 129 10.9 10.7 .
Minnesota 12.2 12.1 12.1 12.1 12.3 12.3 12.3 - 12.0 12.2Mississippi 10.7 10.4 12,1 ,- 6.5 12.7 10.9 12.1 8.1 12.4
Missouri 11.8 11.7 12.0 9,7 12.3 118 12.0 10.3 12.1
Montana 12.3 12.2 12.2 12,3 11.4 12.3 12.1 12.2 12.0Nebraska 12.2 12.2 ' 12.2 10.8 10.8 52.3 12.3 11.4 11.3Nevada 12.4 12.4 12.4 10.7 12.1 12.4 12.4 10.7, 12,0New Hampshire 12.2 12. 12.2 12.5 12.7 12.2 12.2 12.5 *12.4
New Jersey 12.1 12.1 12.2 10.2 8.4 12.1 12.1 10.7, 8,0New Maxim 12.2 122 12.3 11.2 9.8 12,1 122 10A 9kNew York 12.1 12.1. 12.2 10.8 8.8 12.1 12.1 10.9 8.3NorthCarolina 10.6 11.3 10,8 7.9 12.8 10.8 11.2 9.0 12,5North Dakota 12.0 10.8 10.9 12.6 . 12,6 12,2 12.2 12.3 12.3
OhioOklahoma
. 12312.1
12.1
12.1
12.1
12.1.,
...i10.310.0
11.312.1
12.112.1
12.1
12110.810-1
11.211.7
Oregon 12.3 12.3 12.3 10,8 12.1 12.3 12.3 11.4 12.0Pennsylvania 12.0 11.9 12.0 10.1 8.2 12.0 123 10.6 7.6Rhode Island 11.5 11.5 11.r 10.8 12.2 11.6 11.6 10.8 11.8
South Carolina 10.5 10.3 11.4 7.1 12.8 10.6 11,4 8.1 12.5South Dakota 12.1 11.8 11,6 12.3 11.9 12.2 . 12.3 12.3 11.9Tennessee . 10.6 10.4 10.9 8.1 12.9 10,8 11.2 9.0 12.6Texas 11.6 11.7 12.0 9.3 7.6 11.6 11.9 10.0 7,0Utah 12.5 12.6 12.6 11.7 10.7 12.4 12.4 . 11.3 10.5
Vermont...: 12.2 12.1 12.1 12.4 12.6 12.3 12.3 12.2 12.6Virginia 11.7 11.4 12.1 8.0 13.0 11.8 12.1 9,0 12.6 -
Washington 12.1 12.4 12.4 12.0 12.0 12.4 12.4 11,6 11.9West Virginia 10.6 10.3 10.3 8.9 12.3 10.8 10.3 10.0 12.2Wisconsin 12.1 12.1 12.1 10.0 10.2 12.2 12.2 -10.7 10.7Wyoming 12.4 12.3 12.3 11.3 9.0 12.4 12.4 . 11.0 9,5
SOURCE U.S. Department of Commerce, Bureau of lire Census,"Coasus at Population: 1970, General Social and Economic Characteristics; Series PC(1)-C.
15
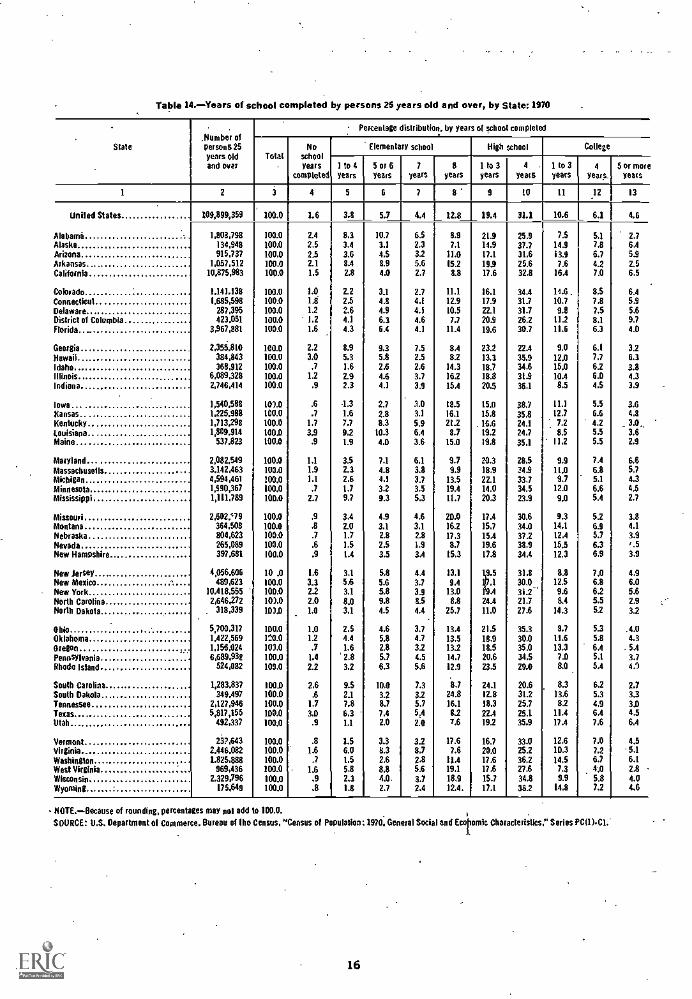
Table 14.-Years of school completed by persons 25 years old and over, by State: 1970
Stale,Number ofpersons 25years oldand over
Percentage distribution, by years of school completed
TotalNo
schoolyears
completed
Elementary school High school College
1 to 4years
5 or 6years
7
years8
years1 N 3years
4 .
years1 to 3years
4
years.5 or more
years
1 2 4 5 6 7 s 9 10 11 12 13
United States 109,899,359 100.0 1.6 3.8 5.7 4.4 12.8 19.4 31.1 10.6 6.1 4.6
Alabama 1,803,798 100.0 2.4 8.3 10.7 6.5 8.9 21.9 25.9 7.5 5.1 2.7Alaska 134,948 100.0 2.5 3.4 3.1 2.3 7.1 14.9 37.7 14.9 7.8 6.4Arizona 915,737 100.0 2.5 3.6 4.5 3.2 11.0 17.1 31.6 13.9 6.7 5.9Arkansas 1,057,512 100.0 2.1 8.4 8.9 5.6 15.2 19.9 25.6 7.6 4.2 2.5California 10,875.983 100.0 1.5 2.8 4.0 2.7 8.8 17.6 32.8 16.4 7.0 6.5
Colorado 1,141.138 100.0 1.0 2.2 3.1 2.7 11.1 16.1 34.4 14.6 8.5 6.4Connecticut 1.685,598 100.0 1.8 2.5 4.8 4.1 12.9 17.9 31.7 10.7 7.8 5.9Delaware 287,395 100.0 1.2 2.6 4.9 4.1 10.5 22.1 31.7 9.8 7.5 5.6District of Columbia 423.051 100.0 1.2 4.1 6.3 4.6 7.7 20.9 26.2 11.2 8.1 9.7Florida 3,967,881 100.0 1.6 4.3 6.4 4.1 11.4 19.6 30.7 11.6 6.3 4.0
Georgia 2,355.810 100.0 2.2 8.9 9.3 7.5 8,4 23.2 22.4 9.0 6.1 3.2Hawaii 384,843 100.0 3.0 5.3 5.8 2.5 8.2 13.3 35.9 12.0 7.7 6.3Idaho 368,912 100.0 .7 1.6 2.6 2.6 14.3 18.7 34.6 15.0 6.2 3.8Illinois 6.089,328 100,0 1.2 2.9 4.6 3.7 16.2 18.8 31.9 10.4 6.0 4.3Indiana 2,746,414 100.0 .9 2.3 4.1 3.9 15.4 20.5 36.1 8.5 4.5 3.9
Iowa 1,540,588 10).0 .6 -1.3 2.7 3.0 18.5 15.0 38.7 11.1 5.5 3.6Kansas 1,225.988 100.0 a 1.6 2.8 3.1 16.1 15.8 35.8 12.7 6.6 4.8Kentucky 1,713,298 100.0 7.7 8.3 5.9 212 . 16.6 24.1 7.2 4.2 3.0.,Louisiana 1,809.914 100.0 3.9 9.2 10.3 6.4 8.7 19.2 24.7 8.5 5.5 3.6Maine 537,823 100.0 1.9 4.0 3.6 15.0 19.8 35.1 11.2 5.5 2.9
Maryland 2,082,549 100.0 1.1 3.5 7.1 6.1 9.7 20.3 28.5 9.9 7.4 6.6Massachusells 3.142,463 100.0 1.9 2.3 4.8 3.8 9.9 18.9 74.9 11.0 6.8 5.7Michigan 4,594,461 100.0 1.1 2.6 4.1 3.7 13.5 22.1 33,7 9.7 5.1 4.3Minnesota 1,490,367 100.0 .7 1.7 3.2 3.5 19.4 14.0 34.5 12.0 6.6 4.5Mississippi 1,111,789 100.0 2.7 9.7 9.3 5.3 11.7 20.3 23.9 9.0 5.4 2.7
MISSOUriMontana
2,602.479364,508
100.0100.0
.9
.83.42.0
4.93.1
4.63.1
20.016.2
17.415.7
30.634.0
9.314.1
5.26.9
3.84.1
Nebraska 804,623 100.0 .7 1.7 2.8 2.8 17.3 15.4 37.2 12.4 5.7 3.9Nevada 265,089 100,0 .6 1.5 2.5 1.9 8.7 19.6 38.9 15.5 6.3 .5
New Hampshire 397.681 100.0 .9 1.4 3.5 3.4 15.3 17.8 34.4 12.3 6.9 3.9
New Jersey 4,056.606 10 .0 3.1 5.8 4,4 13.1 31.8 8.8 7.0 4.9New Mexico 489,623 100.0 3.3 5.6 5.6 3.7 9.4 .1 30.0 12.5 6.8 6.0New York 10.418,555 100.0 2.2 3.1 5.8 3.9 13.0 .4 9.6 6.2 5.6North Carolina 2,646,272 10).0 2.0 8.0 9.8 85 8.8 24.4 21.7 8.4 5.5 2.9North Dakota 318,339 103.0 1.11 3.1 4.5 4.4 25.7 11.0 27.6 14.3 5.2 3.2
Ohio 5,700,317 100.0 1.0 2.5 4.6 3.7 13.4 21.5 35.3 8.7 5.3 .4.0Oklahoma 1.422,569 120.0 1.2 4.4 5.8 4.7 13.5 18.9 30.0 11.6 5.8 4.3Oregon 1,156,024 103.0 .7 1.6 2.8 3.2 13.2 18.5 35.0 13.3 6.4 5.4Pennsylvania 6,689,938 100.0 1.4 2.8 5.7 4.5 14.7 20.6 34.5 7.0 5.1 3.7
Rhode Island 524,082 103.0 2.2 3.2 6.3 5.6 12.9 23.5 29.0 8.0 5.4
South Carolina 1,283.837 100.0 2.6 9.5 10.0 7.3 8,7 24.1 20.6 8.3 6.2 2.7South Dakola 349.497 100.0 .6 2.1 3.2 3.2 24.8 12.8 31.2 13.6 5.3 3.3
Tennessee 2,127,946 100.0 1.7 7.8 8.7 5,7 16.1 18.3 25.7 8.2 4.9 3.0
Texas 5,817,155 100.0 3.0 6.3 7.4 5.4 4,2 22.4 25.1 114 6.4 4.5Utah 492,337 100.0 .9 1.1 2.0 2.0 7,8 19.2 35.9 17.4 7.6 6.4
Vermont 232,643 100.0 .8 1.5 3.3 3.2 17.6 16.7 33.0 12.6 7.0 4.5Virginia 2.446.082 100.0 1, 6.0 5.3 8.7 7.6 20.0 25.2 10.3 7.2 5.1Washington 1.825,888 100.0 .7 1.5 2,6 2.8 11.4 17.6 36.2 14.5 6.7 6.1
West Virginia 969,436 100.0 1.6 5.8 8.8 5.6 19.1 17.6 27.6 7.3 4;0 2.8
WisconsinWyoming
2.329,796175,649
100.0100.0
.9
.82.31.8
4.0.2.7
3.72.4
18.912.4.
15.717.1
34.836.2
9.914.8
5.87.2
4.04.6
NOTE.-Because of rounding, percentages may not add to 100.0.
SOURCE: U.S. Department of Commerce. Bureau of lho Census, "Census of Population:1970, General Social and Ecormic Characteristics," Series Pcmc1.-
16
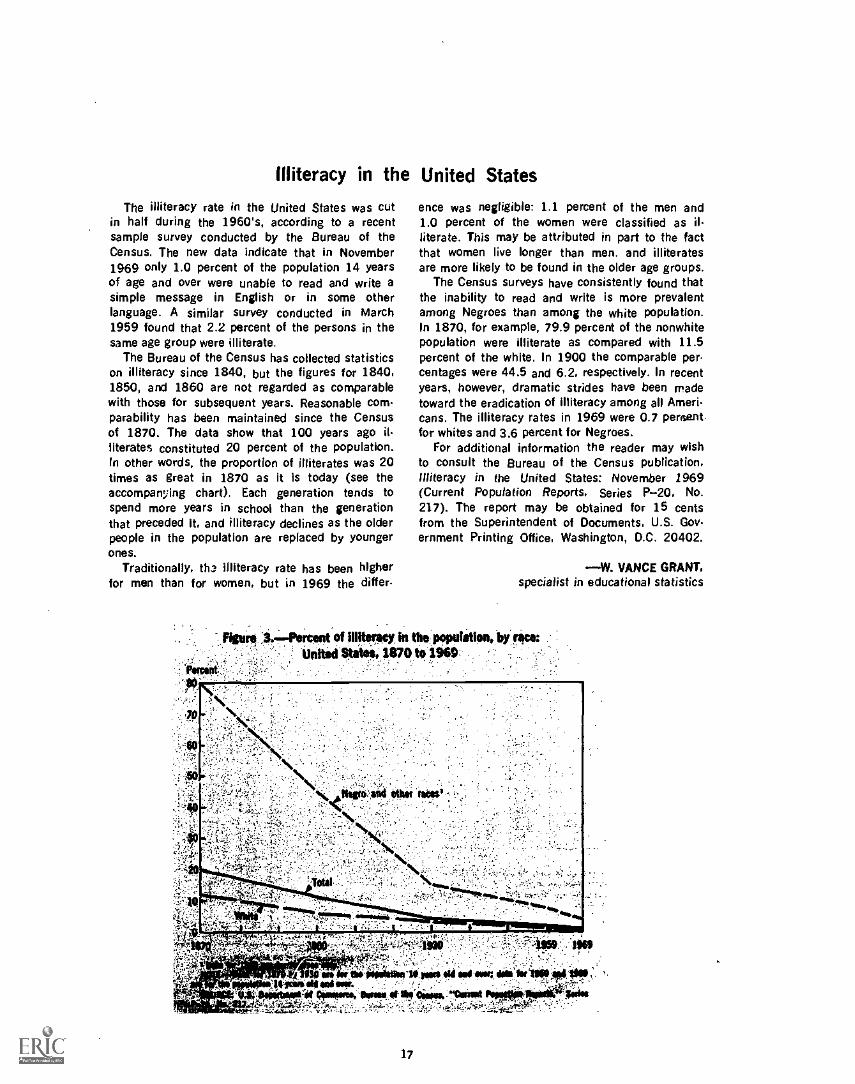
Illiteracy in the United States
The illiteracy rate in the United States was cutin half during the 1960's, according to a recentsample survey conducted by the Bureau of theCensus. The new data indicate that in November1969 only 1.0 percent of the population 14 yearsof age and over were unable to read and write asimple message in English or in some otherlanguage. A similar survey conducted in March1959 found that 2.2 percent of the persons in thesame age group were illiterate.
The Bureau of the Census has collected statisticson illiteracy since 1840, but the figures for 1840,1850, and 1860 are not regarded as comparablewith those for subsequent years. Reasonable com-parability has been maintained since the Censusof 1870. The data show that 100 years ago il-literates constituted 20 percent of the population.In other words, the proportion of illiterates was 20times as great in 1870 as it is today (see theaccompanying chart). Each generation tends tospend more years in school than the generationthat preceded it, and illiteracy declines as the olderpeople in the population are replaced by youngerones.
Traditionally, the illiteracy rate has been higherfor men than for women, but in 1969 the differ.
ence was negligible: 1.1 percent of the men and1.0 percent of the women were classified as il-literate. This may be attributed in part to the factthat women live longer than men. and illiteratesare more likely to be found in the older age groups.
The Census surveys have consistently found thatthe inability to read and write is more prevalentamong Negroes than among the white population.In 1870, for example, 79.9 percent of the nonwhitepopulation were illiterate as compared with 11.5percent of the white. In 1900 the comparable per-centages were 44.5 and 6.2. respectively. In recentyears, however, dramatic strides have been madetoward the eradication of illiteracy among all Ameri-cans. The illiteracy rates in 1969 were 0.7 percentfor whites and 3.6 percent for Negroes.
For additional information the reader may wishto consult the Bureau of the Census publication.Illiteracy in the United States: November 1969(Current Population Reports, Series P-20, No.217). The report may be obtained for 15 centsfrom the Superintendent of Documents, U.S. Gov-ernment Printing Office, Washington, D.C. 20402.
W. VANCE GRANT,specialist in educational statistics
17
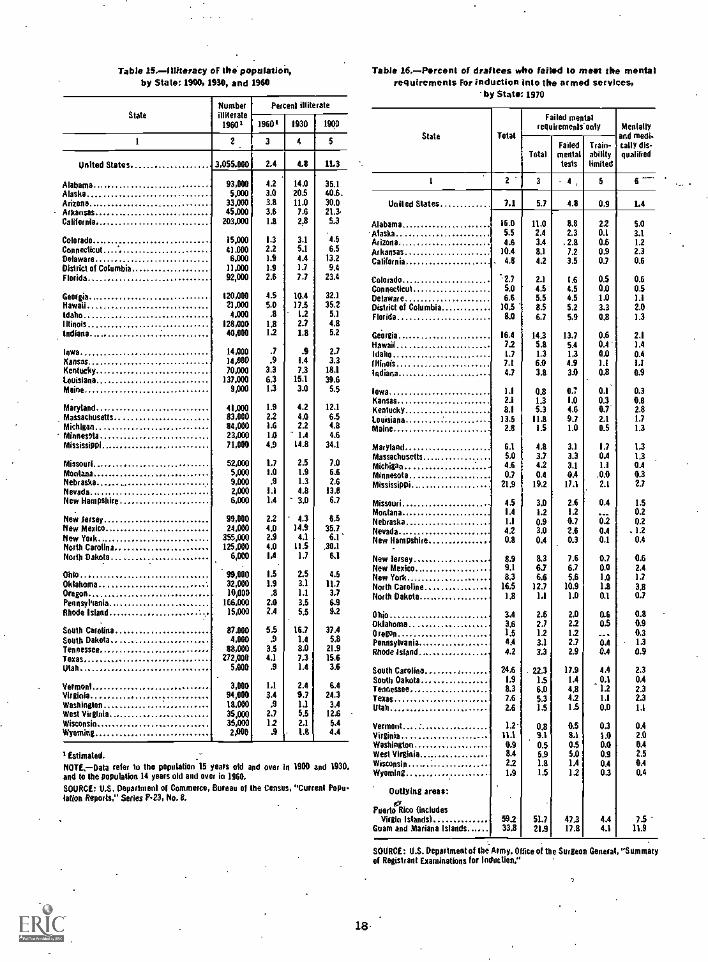
Table 15.- Illiteracy of the population,by State: 1900, 1930, and 1960
StateNumberilliterate19601
Percent illite rate
19601 1930 1900
1 3 4 5
United States. 3,055.000 2.4 4.8 11.3
Alabama 93,000 4.2 14.0 35.1Alaska 5.000 3.0 20.5 40.6.Arizona 33,000 3.8 11.0 30.0Arkansas 45.000 3.6 7.6 21.3.California 203,000 1.8 2.8 5.3
Colorado 15,000 1.3 3.1 4.5Connecticut 41.000 2.2 5.1 6.5Delaware 6.000 1.9 4.4 13.2
District of Columbia 11.000 1.9 1.7 9.4Florida 92,000 2.6 7.7 23.4
Georgia 120,000 4.5 10.4 32.1
Hawaii 21.000 5.0 17.5 35.2Idaho 4,000 .8 1.2 5.1
Illinois 128,000 1.8 2.7 4.8Indiana 40,000 1.2 1.8 5.2
Iowa 14,000 .7 .9 2.7Kansas 14,000 .9 1.4 3.3Kentucky 70,000 3,3 7.3 18.lLouisiana 137,000 6.3 15.1 39.6Maine 9,000 1.3 3.0 5.5
Maryland 41,000 1.9 4.2 12.1
Massachusetts 83,000 2.2 4.0 6.5Michigan 84,000 16 2.2 4.8Minnesota 23,000 1.0 1.4 4.6Mississippi 71,000 4.9 14.8 34.1
Missouri 52.000 2,7 2.5 7.0Montana 5,000 1.0 L9 6.6Nebraska 9.000 .9 1.3 2.6
Nevada 2,000 1.1 4.8 13.8
New Hampshire 6,000 1.4 3.0 6.7
New Jersey 99,000 2.2 4.3 6.5New Mexico) 24.000 4.0 141 35.7New York 355.000 2.9 4.1 6.1North Carolina 125.000 4.0 11.5 .30,1
North Dakota 6,000 1A 1.7 6.l
Ohio 99,900 1.5 2.5 4.5Oklahoma 32,000 1.9 3.1 21.7Oregon 10,000 .8 1.1 3.7
Pennsytiania 166.000 2.0 3.5 6.9Rhode Island 15,000 2.4 5.5 9.2
South Carl1line 87.000 5.5 16.7 37.4
South Dakota 4,000 .9 1.4 5.8Tennessee 88,000 3.5 8.0 21.9
Texas 272,000 4.1 7.3 15.6Utah 5,000 .9 1.4 3.6
Vermonl 3,000 1.1 2.4 6.4Virginia 94,000 3.4 9.7 24.3Washington 18,000 .9 1.1 3.4West Virginia 35,000 2.7 5.5 12.6
Wisconsin 35.000 1.2 2,1 5.4
Wyoming 2,000 .9 2.8 4.4
I Estimated.NOTE, -Data refer to the population 25 years old and over in 1900 and 1930.and to the population 14 years old and over io 1960,
SOURCE: U.S. Department of Commerce, Bureau of the Census, "Current Popu-lation Reports," Series P23, No.8.
18
Tabia 16.- Percent of draftees who failed to meet the mentalrequirements For induction into the armed services,
by State 1970
State Total
Failed mentalrequirements only Mentally
and meth-tally dis-qualifiedTotal
Failedmentaltests
Train-abilitylimited
1 2 3 . 4 , 5 6`"'
United States 7.1 5.7 4.8 0,9 1.4
Alabama 16.0 11.0 8.8 2.2 5.0Alaska 5.5 2.4 2.3 0.1 3.1
Arizona 4.6 3.4 .2.8 0.6 1.2Arkansas 10.4 8.1 7.2 0.9 2.3California 4,8 4.2 3.5 0.7 0.6
Colorado 2,7 2.1 1.6 0.5 0.6Connecticut 5.0 4.5 4.5 0,0 0.5Delaware 6,6 5.5 4.5 1.0 1.1
District of Columbia 10.5 8.5 5.2 3.3 2.0Florida 8.0 6.7 5.9 0,8 1.3
Georgia 16.4 14.3 13.7 0.6 2,1
Hawaii 7,2 5.8 5.4 0.4 1.4Idaho 1,7 1.3 1.3 0.0 0.4Illinois 7.1 6.0 4.9 11 LIIndiana 4.7 3.8 3.0 0.8 0.9
Iowa 1,1 0.8 0.7 0.1 0.3Kansas 2.1 1.3 1.0 0.3 0.8Kentucky 8.1 5.3 4.6 0.7' 2.8Louisiana 13,5 11,8 9.7 2.1 1.7
Maine 2.8 1.5 1.0 0.5 1.3
Maryland 6.1 4.8 3.1 1.7 1.3Massachusetts 5.0 3.7 3.3 0.4 1.3Michigan 4.6 4.2 3.1 1.1 0.4
Minnesota 0.7 0.4 0.4 .0.0 0.3Mississippi 21.9 19.2 17.1 2.1 2.7
Missouri 4.5 3.0 2.6 0.4 1.5Montana 1.4 1.2 1.2 . _ 0.2Nebraska 1.1 0.9 0.7 0.2 0.2Nevada 4.2 3.0 2.6 0.4 . 1.2New Hampshire 0.8 0.4 0.3 0.1 0.4
New Jersey 8.9 8.3 7.6 0.7 0.6New Mexico 9.1 6.7 6.7 0.0 2,4New York 8,3 6.6 5,6 1.0 1.7
North Caroline 165 12.7 10.9 1.8 3.8North Dakota 1,8 1.1 1.0 0.1 0.7
Ohio 3.4 2.6 2.0 0.6 0.8Oklahoma 3.6 2,7 2.2 0.5 0.9Oregon 1.5 1.2 1.2 ... 0.3Pennsylvania 4.4 3.1 2.7 0.4 1.3
Rhode island 4.2 3,3 2.9 0.4 0.9
South Carolina 24.6 . 22.3 17.9 4.4 2.3South Oakota 1,9 1.5 1.4 0.1 0,4Tennessee 8.3 6.0 4.8 1.2 2.3Texas 7.6 5.3 4.2 1.1 2.3Utah 2.6 1.5 1,5 0.0 1.1
Vermont 1.2- 0.8 0.5 0.3 0.4Virginia 11.1 9.1 8.1 1.0 2.0Washington 0,9 0.5 0.5 0.0 0.4West Virginia 8.4 5.9 5.0 0.9 2.5Wisconsin 2,2 1.8 1.4 0.4 0.4Wyoming 1.9 1.5 1.2 0.3 0.4
Outlying areas:
Puertoer
Rico (includesVirgin Islands) 59.2 51.7 47.3 4.4 7.5
Guam and Mariana Islands 33,8 21,9 17.8 4.1 11.9
SOURCE: U.S. Department of the Army. Office of the Surgeon Genera , "Summaryof Registrant Examinations for Induction."
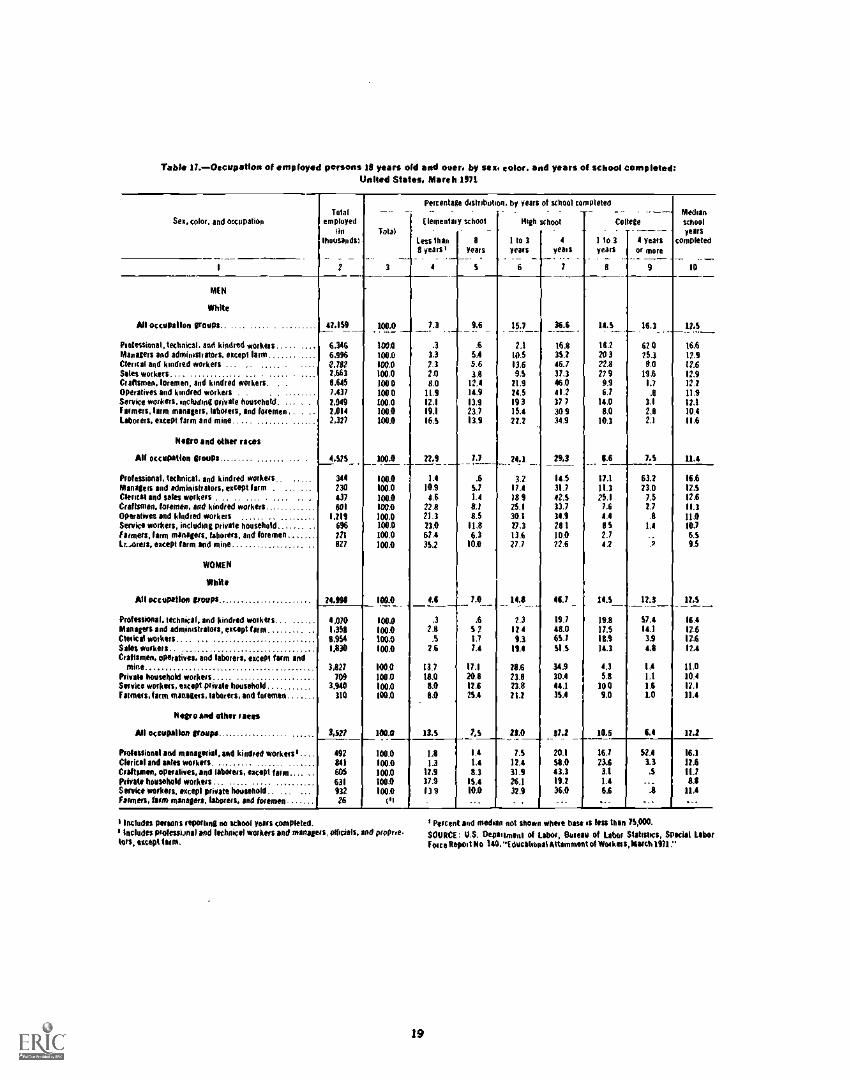
Table 17--OeCupstiors of employed persons 11 years old and oiler, by ses, color, and years of school completed:United States. March 1971
Percentage drstribution, by years of school completedTotal -- 7 - - Median
See, color, and occupation employed I lementaiy school High school College schoollie Total .
thousands) less than 8 1 to 3 4 1 to 3 I years completed8 years' years years years years Or more
i 7 3 4 S 6 7 8 9 10
MEN
White
All occupation groups, 47,139 100.0 7.3 9.6 15.7 36.6 14.3 16.3 U.S_ .. ._ ...-Professional, technical, and kindred workers ..... 6.346 100.0 .3 .6 2.1 16.8 112 62 0 161Managers and administrators, escept lam ....... 6.996 100.0 13 5.4 10.5 35.7 203 25.3 11.9Clerical and kindred workers 2.782 100.0 7.3 5.6 13.6 45.7 22.0 0.0 17.6Isles workers.... ... . .. . .. . . . ..... . 7,663 100.0 2.0 3.8 9.S 37.3 27 9 19.6 12.9Craftsmen, linemen, and amired workers- . 0,645 1000 8.0 12.4 71.9 46.0 9.9 1.7 12.7[Operatives and kindred workers . 7.437 100 0 11.9 14.9 74.5 41.2 6.7 .8 11.4; e n t i c e workers. secluding private household. ... , 7,549 100.0 12.1 13.9 19 3 37 7 14.0 3.1 12.1Farmers. larm managers. laborers, and Weiner) , . . 7,014 100.0 19.1 23.7 15.4 309 8.0 2.0 10.4laborers, *scent farm and mine 2,317 100.0 163 13.9 77.7 34.9 10.3 2.1 11.6
Negro and other races
All occupation droops 4.373 100.0 77.9 7.7 74.1 29,3 0.6 7.S 11.4__.Professional, technical. and kindred workers.. 344 100.0 1.4 .6 3.2 14.5 17.1 63.7 161Managers and administrators, 'scent farm , 230 100.0 10.9 SI 17.4 31.7 11.3 73.0 123Dkrics1 and sales workers . . . . .. . ... 437 100.0 4.6 1.4 /8 9 42.S 25.1 7.5 12.6Craftsmen, foremen, and kindred workers 601 100.0 221 Si 211 33.7 7.6 7.7 11.3Donative, end kindred workers 1.219 100.0 21-3 15 30.1 31.9 LI I 11.0;woke workers, including private household 696 100.0 73.0 11.8 77.3 281 8 S 1.4 30.7Formers, fine managers. laborers, and foremen 721 100.0 67.4 6.3 13.6 10.0 2.7 .. 6.SLK:Arras, except farm and mine 027 100.0 3S.2 10.0 273 22.6 4.7 .2 9.5
WOMEN
White
All occupation troupe 74.9111 100.0 4.1 7.0 141 10.7 11.3 17.3 17.3-Protean:mil. techacol. and kindred workers... . 4.070 100.0 .3 .6 2.3 19.7 14.8 37.4 16.4Managers and administrators, 'scent form 1,358 100.0 21 3 1 17 4 48.0 17.5 14.1 12-6:logical workers 8.954 100.0 .5 13 9.3 63.7 181 3.9 12.6isles workers 1,830 100.0 2.6 7.4 191 S1.3 14.3 4,8 12.4:rallsmen, operatives, and laborers, 'marl farm and
mine. 3,827 1001 13.7 17.1 781 34.9 4.3 1.4 11.0Private household workers 709 100,0 18.0 218 231 301 5.8 1.1 114;write workers, secant private household 3,940 100.0 8.0 116 73.8 44.1 100 1.6 12.1
r ottaus, (arm monsters, laborers, sod foremen 310 300.0 0.0 23.4 71.7 331 9.0 1.0 11.4
Hypo and other races
All occupallon grasps 3,527 AMC 13.5 7.5 21.0 37.2 10.5 0.4 17.2_Pretessissol sad miaimill, sad kindred workers I 492 100.0 1.8 1.4 7.S 20.1 16.7 RA 16.1
Clerical and antes woikerS. al 100.0 1.3 1.4 17.4 58.0 23.6 13 171:ratmeen, operalives, and laborers, except farm.... 605 100.0 17.9 8.3 31.9 43.3 3.1 .S 117Private household workers 631 100.0 371 13.4 26.1 19.7 1.4 .. - 11.4
>mice workers, omen' private household- - ..- 932 100.0 13 9 10.0 37.9 36.0 6.6 .11 11.4farmers, farm managers, Myers, and foremen 26 NI - ... - - --- -. - - - - ---
i Includes poisons repining ao school years completed.I includes professbnal and 'ethnics) workers and managers, *facials, and progrreton, siceplIsem.
19
f Percent and median not shown where base is less then 73,000.
SOURCE: U.S. Department of Labor, Boman of Labor Mohacs, Special LaborForce Nepal No 140, "Educabonal Aitamment of Mier lons,ilaish 1411."
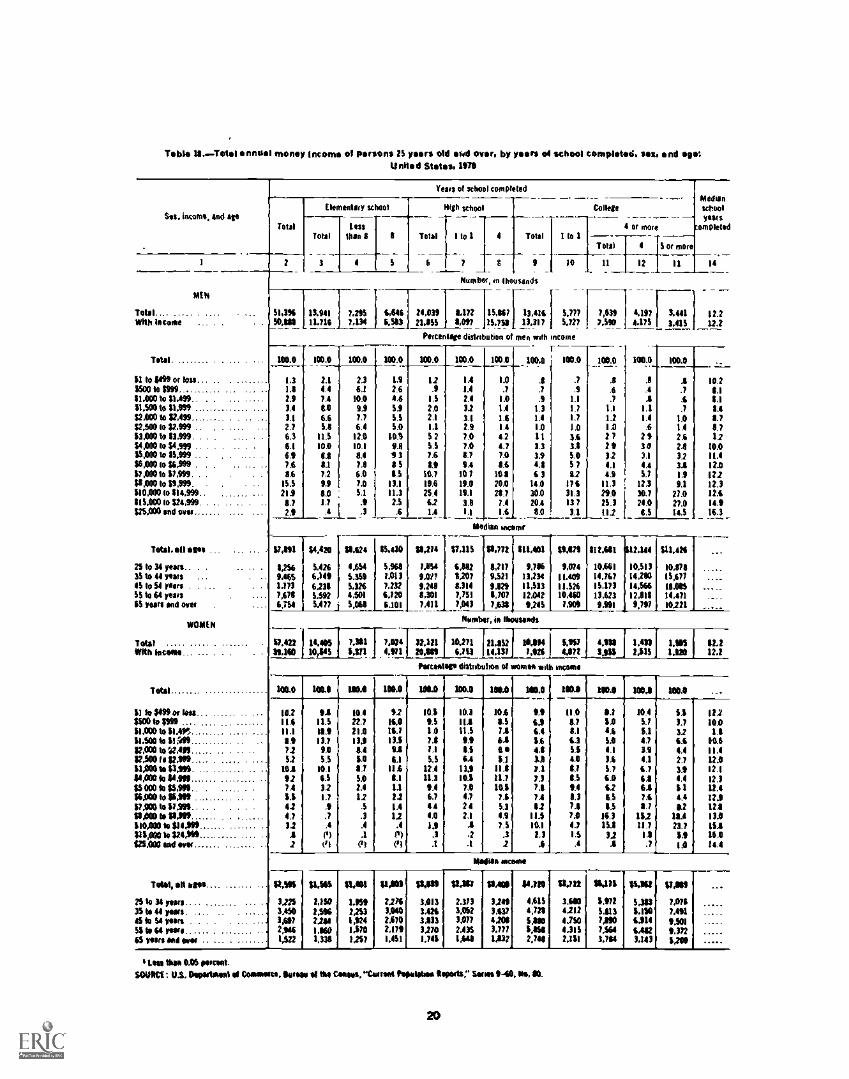
Table 11..-Totat assemset money Income of persons 25 years old sod over, by yeses of school complotemi, tee, and age:United 51.1.1, 1970
Ms. inters*, and ego
1
MEN
Total.... ..... .
With %cone
Total. ........ .
SI lo $69 of loss...1500 to 19998160 to 11.69.. . .
41.400 to 11.19942,000 ta ti,ols ......... .
42200 to $2,999 ..43400 to 83.999. . .
VAN to 44,999 .. .
15400 to 85299 .. .
$6,000 to 46,999. .
17,00010 67,999.. .
PAM to 49299. -
410100 lo 814.999815,000 to $24,999. . .
42460 sad mu
Total. ell egos ...
23 to 34 yews.. .
35 to 44 mats45 10 54 mere . .
56 to 64 macs65 guts mil ores
Total
161164
With femme... .
Total
SI to 694 olds_ ...... ..$500 to $9011 .... .... ... .......WACO to :I"11.50010 4169VAN to WNW ...... .
42.100 le WAN .....11200 to $3,16. ... ........ ..PAO% saps41 000 lo 6191.. .
6.100 lo 16,917.970 to PAN.. .. .
060 to SOW610.000 lo 41469saps as 121,994 ... . . .
MON sad sow
Yeats of school completed
Total
Elementary school Nigh school
Total
College
4 or more_-
5 of moreTotal
losethan 4 I Total I to S 3 1 . 11
Total 4
2 3 4 5 6_...___
/ 8 9 10 II 12 IS
Number, m thousands
51,396 1.13.941 17.295 6,646 I 24,039 8.17250.181 11.716 7,134 6.583 21.455 8,09?
100.0
1.31.82.9SI3.1
2.76.36.16.97.611.6
15.52116.72.9
11,691
8.2169.4641,1737,6746,751
15,86715.731
Meilenschoolyeses
*molded
14
- - - -- - - _ - -
13,317 5,727 7,36 4.175 3.415 12.26,416 5,777 7139 4.197 [ 3.441 12.2
percentage dislmbution of men With ncome
IWO 100.0 100.0 60.0 1001 100.0 16.9T"
1011.0
2.1 2.3 1.9 12 1.1 1.0 .1 ./4.4 6.1 2.6 .9 1.4 .7 .7 .17.4 10.0 41 1.5 2.4 1.0 .9 1.1
8.0 91 5.9 2.0 32 1.4 1.1 126.6 7.7 5.5 2.1 3.1 1.6 1.4 1.7CS 6.4 5.0 1.1 2.9 1.4 14 1.0
11.5 120 10.9 52 7.0 42 1I 3.6100 10.1 91 5.5 7.0 4,7 3.3 3.8IA 8.4 9 3 7.6 t? 7.0 3.9 5.00.1 7.8 8 5 8.9 9.4 8.6 4.6 5 77.2 6.0 8.5 111./ 107 101 61 112
91 7.0 13.1 19.6 190 200 14.0 17 64.0 5.1 11.3 25.4 19.1 6.7 304 31.37.7 .9 2.5 62 31 7.4 20.4 13 71.1 A 1.4 II 1.6 8. 0 3.1
Melia moms
6,420 41164 01,410 $1,27
5,426 4,64 5,969 726,149 5.359 7.013 9.016.238 5.126 7,232 9.5,192 4,501 6.720 820SA?? 1 5164 6.101 7,41
100.0_.. _.8.6.7II
1.21.02729324.14.9
113240253112
- -
IWO_ 100.0
1_4
.61.11.4.6
29303.1
4.45.7
12.330.72404.6
A.7.6.7
1.01.421213.23.4IA4.1
27.02/114.5 I
=_-
10.24.18.18.48./0.712
10.011.412.012212312.614.9ICS
,I $7211 18,772 611,401 49,070 $12,4111 2,144 61,424
I 6,002 $217 9,706 9,074 10,661 10,513 10,8711,207 9,431 13234 11.409 14,767 14,63 11,677 ....8,314 9.69 11,533 11.526 15.171 14,566 18.016 .... _7,76 11,707 12.042 10,400 13.623 12,818 14,411
1 7,043 7,630 9.145 7,909 9,401 9,797 10,221
Minder, in Wooded'
60 10 5
67.422 11420519
16.0
161 4.971 2061 LIU 14.137 7.93 462 161till .1 764F2,121 10,271 .1.852-1 14.404t S.W 4.918
1e114* age libbibutos of semis with incomes -t--100.0 MA 180.0 68.0 100.0 10A USA
10.211.6ILI8.97.252
WA927.41.14.24.73.2.62
9.411214.913.7
CO5.5
1014.5321./
A3.4
(II(II
10.422.721113.9IASA115.02.412.5
.3
.4
.1
01
9216.06.713.69.4CIII 48.11.12.21.41.2.4
1019.51.0?I7.1
5.512.411.39.46.74.44.0
1.9
.1
10.1
11.411.59.91.46.4
13.910.1/142212.1
.6
.2.1
104SA7.16.1IAST
11.411.71017.65.34.97.5.32
9.96.96,4SA41LI2.17.3?A7,48.2
11.510.1
2.1.6
110.11 INA
1.462,515
LOS 12.21,920 12.2
NU 16.0
ILOV11.1
6.3514.04.74.59.40.1?A?A4.7LS.4
42SA4A5.44.1SA5./61626.58.5
14.315.8
3.2.6
10.45.76.1423.94.14./4.86.47.6SI
16.211.7
11./
SIS./32414.42.73.94.4114,442
18.6233SAIA
12210111
10.611.412.412.112.312.412,912.1ISAISA16.014.4
Idol, ell item.- .......6 to 34 yam.. ... ...... . ..14 30 41 macs. ,
6 lo S4 mess . . . . . ... ...SS 664 mese . .. ...... .. .
6.111
3,2243,45036?2,916
tAn
Medics Raceme
41241
2,2402,5963.2801.8641,331
6401
1.0492253
17070
1.257
41,881
2.2741,01020702.1791,451
$IAN
34133.4263270433
3
1,141
11.141
2.3733.46SAW2.43$1.648
OM3.2493.63742083,7771,37
WO4,6154,71s5.$001.682,744
411,711
3,6104,2124,604,3152,111
*011,9725,6137,8110
/643,744
41.111
5.3131606,9146.463.143
PAH
7,0767,49191019.1721,26
6 Lop 311. 0.16 wad.4017161: 1,11. Depasteind of Commone. Ionise od tho Cobs*, "Corset twolotes %mils," Sum 9-40, M. 40.
20

Table 111.Astnual latente of moo, by pp unit pus ofschool completed: t/mitod Stoteo, 1966 to Mt
!In current do lars1
Age. and years of school complete:1
I
1956
7
1951
3
1961
4
1964
5
1968
6
(110 74 years old
Elementary:Less then $ years $1,569 11,4611 11,596 $ 1,931 12,892I years 2.135 1,970 7.239 2,553 3,764
High school:1 to 3 years . 7,701 7.008 7.204 2291 2.6004 yterS.... ... 7,666 7.655 7.768 LOSS 3,674
College:1 13$ yams ... . . 1.924 1,961 2,030 2,737 7,7004 years or more ,l1 7.9lti 3,310 3.570 4,273a yfifS - 01) 0) 3.381 3.736 4.3066 years or mom. . . ... . (7) I') ii) 41) 4,186
25 yews old and ore
Elementary:Less that 0 yews 2.574 7,630 2.996 3291 3.9818 yeas .. - ... . 3,631 3.677 4,206 4,520 5.467
High school:I to 3 yens . 4,367 4,462 6,161 5.653 6.7614 goals. .... 5.113 6257 6.946 4.734 8,146
CollepI to 1 years , . ,
4 years or More -
6.9977,877
6,7726.643
7.3489.817
1,90710.7174
9.39712,638
0 yams. . . ,.. (II 7.665 1.312 1.757 12,418S years O MOM. 1°1 9,178 9.967 11,004 13.555
Data not mailable.7101E.-7hose arithmetic means are estimaledtrom so' phi surveys of householdsThey are subtact to sampling variability as sell as to errors el response andporeporting,SOURCE U S. Department of Commerce. Rom of Ills Can**. "Correll Pop.Ishoo Reports," Series P40, No. 74
Tabl. 20.-1.11othimi income Of MOO. by Y1061* of schoolcompleted: United State., 3056 to 19611
I in current dollars)
Years of srhoolromp/Med
1
1956 1958 1963 1964
5
1968
63
Income I-1-
4
Elementary:
OM set 18 to iftaLl
Less Man 8 years 1131.432 1128.161 1151.081 1170.145 $713.505years - 178.749 178.010 205,237 273.946 276.755
Hugh school:1 to 3 yews 201.825 203,901 735,165 755.701 308,3054 years 264.158 42.480 773,611 311.462 371,094
College.I to 3 years 779.727 287,306 335,100 365.749 424,2804 year. or more 372.644 401,819 454.732 478,696 607,9214 years ill 363,986 432,617 459,492 584.062S yews or more 0) 440.404 475,116 500.641 636,114
tom gni oryLess than years 8107337
income
4106,709
from ago 25
unpa4
lo 64
8138.777 174,70years . . - 146,059 146,034 168,96? 181.702 226,708
RIO school.1 Pi 3 y ars 166.217 164.534 193,266 711,342 268,4664 yews 109,463 201.750 724,626 257,447 306.786
College:I 10 3 Years 732,317 744,166 273,309 267,543 356,2974 yews a more $14,597 3311,e011 360,951 392.006 SO4,604 ssa0S. . ,1 I 303.570 350,649 377,767 416.643S years or more ,01 377,635 379.906 416,077 525,597
Dela nol available.14011 - These ItiMMIthe means ore estim tied Iron sample surveys of households.They are slated to sampling variaboirls as wen as to Mrilif of resoonst and/*mewlingSOURCE: US, Oeparfmen1 of Commarce. Sergio of to Census, "Current Pop..Mhos Reports," Stows P40, lit 74.
UM, 21.41000011te of ostmcatiomel iseadtulloos, by Pool of lostroctloo, typo of *PIMAnd soodf.d: Usitod Stte.. 116.70
1ln tboussnds of dollars)
Control of insblutson sodsource of fends
All levelstippler, and secondary
Impseft/Meet
101.1'
Itiptso
Edocaloonslsod general
educaboo
AhrINryonlorprises
SlodentM
TMaio Shot
Ni,Men.
(0010100
2 S 6 7
$16.406,177
10,9331926,091.1321,6911716,614146
714,3661.734117
262,446144 171
6,632.816t,1S3363
910.962103.11560,036
210414173111/0174,005
82.10110
1,727,52607()0)(47
0)(4o
1,727.576
1372,114
)
1)1,112.864
10
TOO
Mkt, controlledGamernmeol
f Psi*State . , . .
Local (includingoonnto).SludIml fids . . . -
Pp* eh sod FootsAllotties wpm
10014lycentrotledGoveromeot
federalState.Leal Oncludossamoty)
SPdenl fell . . -
PPP/ gilts sod putsMINN' mods_ . .
Sn1101S1
99,9A114782.161,706
61066.66622106.11223.916.021,913,121
464.6464.666.366
1"$10,116116
43,606,7%42109,736
3.4111.88716.062.77123,127.403
6103,32$
113.6102
$44106,922
40.466.91710,420,9023.419167
1604.771111,936.5611
101,32$
116.$9k_
114,108000
.....4.64*
$3.199,014
3.1191343.101134
. .
it?
MAVIS
11.336.01110273,9732169,1316,746.406
151,4211173,707468.646
3310,674
9.4961077.066.6301146132
34819111,447
1,712.64$11111.6133131335
0101.016
349,011276,132207,972
64,1613,049
i1S3,26120,700
$1.4/0.40
751,412321,046321,04$
0)
010)
437.364
131061072,0951301146132
144.39161,447
2.712140101039131136
64,111111
4.$111
3011.912196.407134,64220,946
310Ili
14.12377,791
712248447.450
r)rl0)0)0)
266.797
lochmles estrmalod memo ler "oleo" sleek, such as tardentel scliools forar-00060814liMmln, fidmal schools ter Inds.. end f ogee schools on federalms1411stoms. SutiosIMpels Opartmeies et insIstottons el Maher Pilotage arsmeloded oadar hl lter Poulos.locludss soliteRsgmte dsamlmenb at rostdolions at lughot Woodson. Uchidashook of amps ant AWN with pimps sod oftiversettet.WIPP Pima* of snoop tor &et Mimeos sod PolesPadMil funds.EimPlas *deltoid !rashers.0419 all availalde.
21
o romp and iranspettahon less Mom patronsEsumatml oft to bps of esponditrue pm Niches on pubic elementary andodooddir WoolslowldNd m column 4.
81081 POMO, at mosdred. Plad may Pt 444 Is totals.SOURCES- U.S Dopartmool of Penh, teocalion, arid WNW'. Wks d tilucbon, "Statistics at Wm Saud Spiess. 1969-70." and liorinciol Statistics oflaptops Mope/ telocatem. 196110". V.S. Dopartmeotot the i Manor, 80,010iif WWI Mars , and unpoeliseml dab ovidaele Motel Placebo..
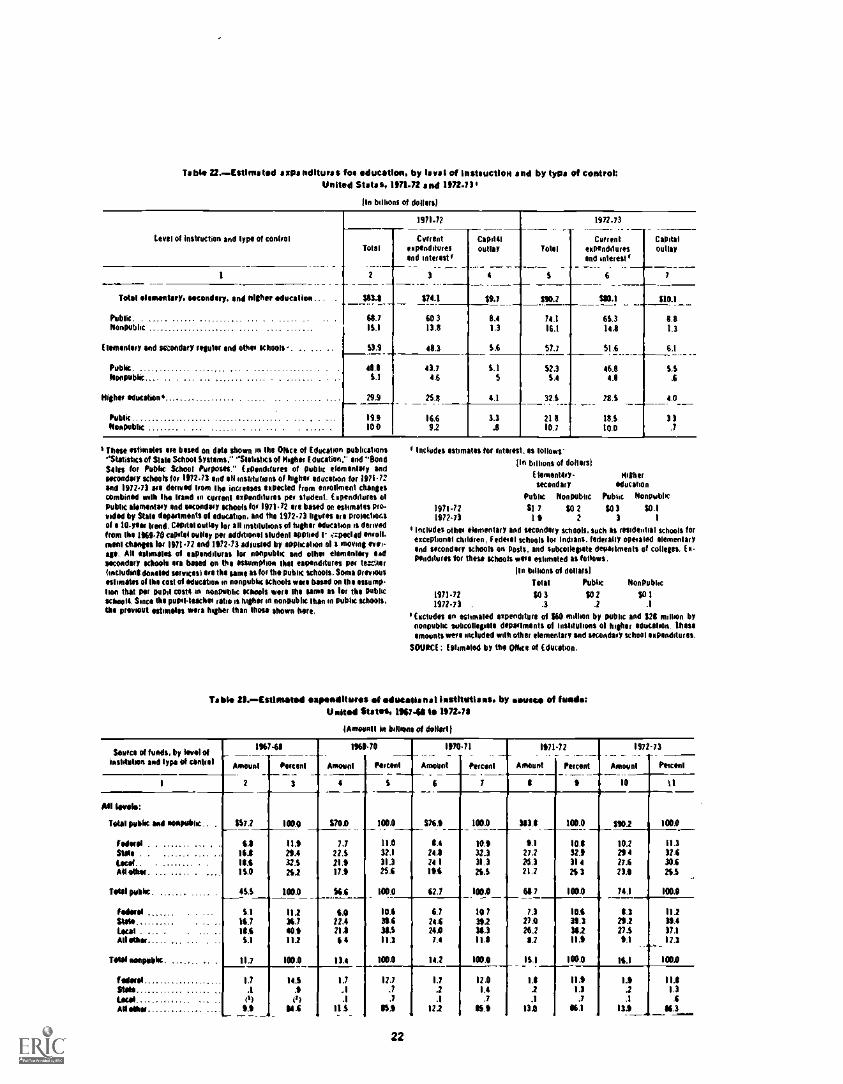
Table 12.-wEStimated ipandlturaS foe mitigation, by level of instolactleil and by type of Control:United States, 07142 and 97243
fin billions of dollars)
Level of instsuction and type of control
191142
TOM
S
1972.73
Currentmienclituresend interest t
6
Total
2
Coorentespendituresend intermit
com111outlay
4
Capitaloutlay
73
Total slunontory, smondory. sod Meter *dumbest - -. 153.0 $74.3 $9.7 $10.2 $80.1-,- U0.1
603
-.BAPublic . 65.7 Mt 65.3 8.8
Nonpublic .... ....... 15.1 13.8 1.3 16.1 10.8 1.3
Elementary and mondani fesulsi snit ethos schools . . 1I 1 411.3 5.6 51.7 51.6 6.1I-Public. 48.1 43,7 5.1 52.3 46.5 05Nonpoblic.... .. . ... ............ ....... . S.1 IS S 5.4 41 .6
Nisbet oducation . ....... . 29.9 251 4.1 32.S 28.6 to
Public 19.9 16.6 3.3 21$ 18.3 33Nonpublic 100 92 .8 10.7 10.0 .?
I These *stand's ate bond on dots shown in Ole Once of Educolion public/bons"Statistics of Stan School Systoms,'"Ilstishcs of Nisbet Education." sod "BondSillu hit Public School Purposes." Caminito:Rs of public tenons(' andsecondary schools In 1912.73 owl MI institutions of haply oducsbon for 1971.72and 1972.73 acs dewed own the lacrosse' misled from entailment choosestombind win to nand in cergeni inpenditurin pet student. (trienniums olpublic Memnon ond wooden schools for 1971.72 are bawd on oslimMes Pioaided by Stalo departments el Mention. and no 1912.73 loses ors prosecutor.'01 0 10-Mili bend. Capitol outlay for an mstdubons of tenor education 0 defendfrom Ms 116070 capitol many per additensi siudenl @opted I* i:pectad 501011 -meal changes for 191142 sod 1912.13 odiusled by soplicoloon of a moons rem-*. All blondes of sapondautos lot nonpublic and ones demonism sadSetiedaty SC0001s sic based on Ms 'nominee Mil eaponditures per te:._,,,torlincludtail downed servos) in the Ume as foe the public schools. Some memosostonota dais cost of education in nonpublic schools won based on Ms ossum0bon that per pupil costs in nonpublic schools wets Ins soma as let the publicschools. Since no pupil-teaches ratio is lusher In nonpublic Nun in public schools.tbs proveut estimides *era Miner Man non shown bete.
t Includes intimates lop intent. os 'piens'110 billions of donors)
Elementsty- Nisbetsecondary
uistPublic Nonpublic PubledicNelionpublic
1971:772192 3SI 7
1 9SO 2
2$0 3
3
$0.11
includes mhos elementary and secondary schools, such as resideatial schools forexceptions' Milano, Fedwol schools lot Indians. federally opened elementaryend seconds., schools on posts. and subcooepote uesbilmarlis sf colleges. Et.penchturos for these schools wets *summed as follows.
110 biLlasnIs of dollars)
Public Nonpublic
19/1.72 SO 3 SO 2 3011972.73 . .3 .2 .1
4 scludos on eslinialed inpenchture rii $60 minion by public and 6211 moon bynonpublic subcollesisis depommonts el insidutions 01 Maher seicabon. thinssmovnts wets included With ether elementary and secondary school osponditures,
SOURCE: Estimated by Me Oflice of tduntion.
Table 111.Estlinsetilid endemalitures e5 edeeatianol instItedens, by sang of funds:United States, 116741 to 1072.78
)Animate lit billions of Millorsi
funds, by level ofSons d ndItisMehnt and ties 01 MOO
106148_ ___Amount
__ _ _Percent
106110.
Amount Penni
107011
Amount ferment
1$71-72
Amount ninon
1972-73
Amami Porten!
I 2 3 4 S 6 1 8 0 10 II
101 keels:
Total public end Mileinhc.. $372 1000 $701 100.0 $761 100/ 153.5 1001 $102 100.0
f Mend 4.0 111 1.1 11.0 to 10.0 0.1 10.5 10.2 11.3
USN . , ....... ..,twat-- . .... ...
16,510.4
29.432.3
22.321.0
32.1
31.3241241
32.3311
272?$.3
32.0314
29127.6
3213016
AO otbot . ... ..... 100 232 171 23.6 19.4 26.3 212 2S3 231 23.3
Tall public. 4S.S 100.0 36.6 1000 12.1 10051 .- 611 7 100.0 4 74.1 1001__. -foetid 3.1 112 4.0 10.6 6.1 10 1 7.3 10.4 51 11251* M.? 361 22,4 36.6 24.6 392 27A 313 292 W4
10.4 401 211 AS 24.0 383 262 382 27.3 371Allen* ..... ... 3.1 112 6 4 11.3 7.4 111 02 111 0.1 12.3
Tmol ampoble. 11,7 100.0 13.4 103.0 142 IWO 1St 100.0 14.1 100.0
fades,' 1.1 141 1.7 12.7 1.7 12.0 1.5 111 11 U.SSlow .. .1 1 .1 .? .2 1.4 2 1.3 .2 1.3lot,' (I) (It .1 ,7 .1 .7 .1 .7 .1 .6
Anon* . 01 NA 11.5 1111 122 65.9 13.0 56.1.. 131_ -.-.. 863- -
22
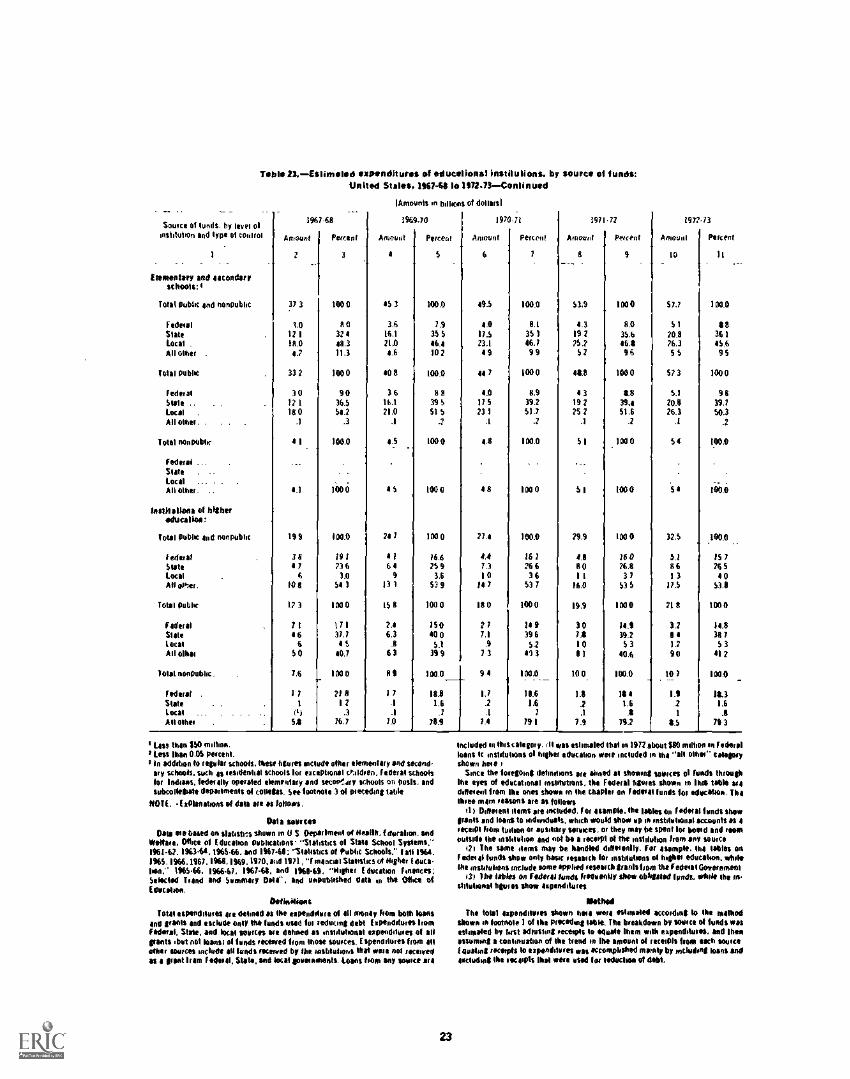
Teel& 23,-Estimoted expenditures of educational institutions. by source of funds:United States, 196744 to 1972.73-Continued
'Amounts .n billions of &IWO
Source of hinds, by level 01instdulmn and lype of conirol
1
Elementary and letandaf Vschools:
1967-68
Amount Pecan(
3
1969.70
Aniewit
4
Percent
5
1970-71
Amount
6
Peron!
7
197142
Amount
8
Percent
4
197?
Amount
10
73
Percent
11
Total public and nonpublic 37 3 1000 45 3 100.0 49.5 100.0 53.9 1000 57.7 100.0
Federal 1,0 AO 3.6 7.9 40 8.1 4.3 84 $ 1 88Slate 12 1 32 4 16.1 35 $ 17.5 35 1 19 2 35.6 20 -8 36 1Local - 18.0 48.3 21.0 46.4 23.1 46.7 752 461 76.3 45.6All other 4.7 11.3 4.6 102 49 99 52 96 55 95
Total public 33 2 100 0 40 8 100.0 44 7 100 0 48.8 100 0 57 3 100 0
federal 30 90 36 88 4.0 8.9 43 81 5.1 96Slate 12 1 36.5 16.1 39 5 11 5 39.2 19 2 39.4 20.1 39.7
Local 18 0 $4.2 21.0 515 231 51.7 75 2 51.6 26.3 50.3All Mho, .1 .3 .1 .2 .1 .2 .1 .2 .1 .2
Total nonpublic
federal ,
4 1 100.0 4.5 100 0 4.11 100.0 $ 1 100 0 54 100.0
SlateLocal - --All other.
lesthatlima of blibeeducation:
IA 100 0 45 1006 48 100 0 S1 1000 54 100.0
Total public and nonpublic 191 100.0 24 1 100 0 21.4 100.0 79.9 100 0 32.5 1000
federal 38 IS 7 4 i 16.6 4.4 167 4.8 760 SA 757Slate 47 736 64 259 7.3 266 80 761 86 265Local 5 3.0 9 3.6 10 36 1l 37 13 40AN ofter, 108 543 131 539 117 537 16.0 535 17.5 53.8
Total public 17 3 100 0 15 8 100 0 180 1000 19.9 1000 2111 1000
federel 71 171 7.4 150 27 U9 30 14.9 3.2 14.8Slats 46 37.7 6.3 40 0 7.1 39 6 7.8 39.2 8 4 36 7
local 6 4t. .8 5.1 .9 $2 10 $ 3 1.2 $ 3All odd. 50 40.7 63 399 73 493 11 40.6 90 412
Told nonpublic. 7,6 100 0 119 100.0 9 4 100.0 10 0 100.0 10 7 100.0
f *deist 1 7 778 1 7 18.8 7.7 10.6 1.1 184 1.9 18.3Slate 1 1 2 .1 1.6 .2 1.6 .2 1.6 2 1.6local (i) .3 .1 .1 .1 1 A .8 1 .8All elheg 5.8 16.7 1.0 70.9 7.4 191 7.4 11.2 8.5 19 3
I Less then 110 million,/ Lest than 0.06 peecentt In addition to regular schools, these figures include other elementiry and wendary schools, such is resoleoltol schools for esceptional rrddiln, federal yowlsfor Indians, led/11, °Petaled segmentary and secootdry schools on posts, andsobcollegiete daparlmenls al colleges. See tootedile 3 ol Pmts.:ling talk
NOTE. - t ePlanations at data are as follows.
Data sourcesData we based on statistics shown in U S Otesitmenl of Health, Education. and
MONO. 011ica of I &Kilian publications- "Stalistics of Stale School Sydems,'196142. 196368,1965.66, and 196748: "Statistics of Public Schools," f all 1964.1965. 1966.1167. 1968,1969.1170, and 1971, manual Stalostcy of Milker (daceIon:* 196546. 196647. 116748, and 1968-611, **Nigher education finances;Selected hand and Weimar, Dale. and ageputilahmi data in No OtIce(ducal....
Definitionstots espondileges ore deltoid as We eiptadMire el all money Nolo bolts loans
and grants and escluae only tbil lends used tot reducing debt E wow:Mures Ironflidwal, Stine, and local swan age debase as onsulolional eepeaddwes of allgrants but nol loans; el funds reamed from those owes. Espenollurey from auother ounces include all fonds received by the sisbletions Met WM not medicoas a NOM tram f Werol. State. and total governments. Loans Nom any ;some an
23
Included in Miscalegory, (II was atheists./ NW in 1972 about $10 million in f sepalloans lc insIdehoos el higher education were included in the "all Ohm- castor,shown bare )
Since the looping deboolions are aimed al showing *owes of foods throughthe eyes of educational onsliNtions, the Federal homes shown in this table ago&Wiwi from the ones Wimp in the cliaple on federal funds lot education. Thedim mein lessons are as follows
Ill Dieegeol item; ers included. for 'sample. the Pekoes f edetal hods showgiants end loons to odunduals, which would show up in nisbliolionel accounts as eaced' Own toilion or weliary winces. or they may be spent Mr booed and roomoutside the onsklulma and not be a receipl it the institution from any source
121 The same dem; may be handled chfleiontly. Is swmple, the bibles OnI Wm.{ hinds show only basic memo% tor lostilebons of highei education, wholethe institutions include some applied research granis Isom tilt IsdeelGoyeinineolstovi3iisi blabselesmonshowfmisiezoostidsitatestr shoo obleatimt lands, weds OM on.
The toll ospendilmes shown hem were eslimaled accoodsog lo the Waalslow... tootnele 1 of the Preceding lab*. The breakdown by select it funds waseshroated by first Wresting oomph lo equate them with expondituies, and thenassuming a continuation of Ike trend in the awned of receipts Item each WICef waling incepts Is espendihires oes accomplished mainly by include*, loans andmicludiag Me 'receipts that wets sited log 1404cho* of debt,
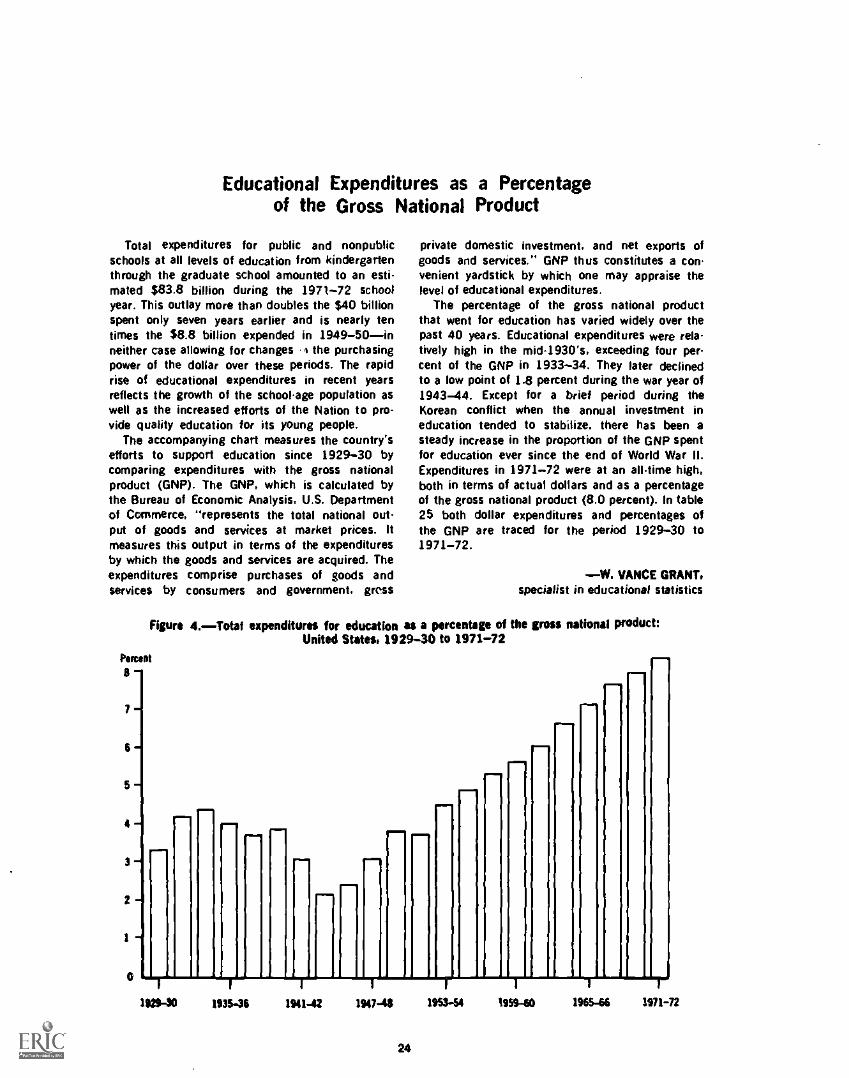
Educational Expenditures as a Percentageof the Gross National Product
Total expenditures for public and nonpublicschools at all levels of education from kindergartenthrough the graduate school amounted to an esti-mated $83.8 billion during the 1971-72 schoolyear. This outlay more than doubles the $40 billionspent only seven years earlier and is nearly tentimes the $8.8 billion expended in 1949-50inneither case allowing for changes .4 the purchasingpower of the dollar over these periods. The rapidrise of educational expenditures in recent yearsreflects the growth of the schoolage population aswell as the increased efforts of the Nation to pro-vide quality education for its young people.
The accompanying chart measures the country'sefforts to support education since 1929-30 bycomparing expenditures with the gross nationalproduct (GNP). The GNP, which is calculated bythe Bureau of Economic Analysis, U.S. Departmentof Commerce, "represents the total national out-put of goods and services at market prices. itmeasures this output in terms of the expendituresby which the goods and services are acquired. Theexpenditures comprise purchases of goods andservices by consumers and government, gross
private domestic investment, and net exports ofgoods and services." GNP thus constitutes a con-venient yardstick by which one may appraise thelevel of educational expenditures.
The percentage of the gross national productthat went for education has varied widely over thepast 40 years. Educational expenditures were rela-tively high in the mid-1930's, exceeding four per-cent of the GNP in 1933-34. They later declinedto a low point of 1.$ percent during the war year of1943-44. Except for a brief period during theKorean conflict when the annual investment ineducation tended to stabilize. there has been asteady increase in the proportion of the GNP spentfor education ever since the end of World War II.Expenditures in 1971-72 were at an all-time high,both in terms of actual dollars and as a percentageof the gross national product (8.0 percent). In table25 both dollar expenditures and percentages ofthe GNP are traced for the period 1929-30 to1971-72.
W. VANCE GRANT,specialist in educational statistics
Figure 4,Totat expenditures for education as a percentage of the gross national product:United States, 1929-30 to 1971-72
Percent
8
7-
6-
5
4
3
2-1
3 -
0
1129-30 193546 1941-42 1947-48
24
1953-54
1
1959-60
11965-66 1971-72

Table 24.-Eopendituves for education, including caplial°allay, by level of iln4111C440411 and by 4pps of coigne,:
Untied S481,06,1,6748
tin thousands of dollars]
Npendolutes, by levelof misfit:noon
Total
2
Publiclycontrolled
I
Purnellcontrolled
4
All levels (elementary,secondary, higher)7 157,213.374 $45.454.599_$11.751.775
Cultent nape nd dor es (Including interest) 48.931.527 38.103.821 10,027.706Capitaloullay or plan! expansion 8.281.847 6.550,778 1,731,069
Elementary and secondary schools'. . 37,007.731 32,983224 4,LC4,015
Current espendderes (includinginvent , 32,232,74! 28,727,933 3,504,108
Capital outlay. 4,771.918 a.nd,791 7519.207
Kindergarten through grade Is 23,411,762 70.866.098 2.545.664Grades 9-12 and posigooduate , 13.595,976 12,117,626 1.471,350
Oilier elementary and secondaryschool's 300.000 200.000 1410,000
Nights education (excluding sub.collegiate deputmentsla . 19,905,635 12,270,875, 3634,760
Current expenditures . 16298.786 9,975 ,088 6,422.898!ducal/anal and general 13,108.420 8.137.659 4.970.761
Ausohaly enterprises . 2,577.941 1.511.314 1,066.627audent-aid ism:Wises 712,425 326,915 385.510
Espenditures nom plaid lends, 3.506,849 2294,987 1.211,862
Includes an estimate for "other elementary and secondary schools such esresdenlial schools for ocepbonal children., *doll schools for Indians, Wombepesalep elementary and secondary schools on pests, and subcollegiate depart.minis 01 institutions of higher education. Data have been revised since originallypublished.Eicludes eopendderos far lie "Aber *dunk described le 'PON* 1(sheeted on the bans ol espeoditore pet teacher in public elementary endsecondary schools,Includes coolie outlay of $169,146,1611 by Stale and local schoolhousingauthorities.
s Dislotionmn between padereeps diindargarien-grade 8, erodes 9.12 and post-patent) estimetod on Ike assumption that the col per pupil on grades 9-12 is50 percent higher than in grades 14.
o Intones schools el nursing not albhated with colleges and universdieS.(*dodo an estomated $668 million *upended for plod eopension dually fromcurrent lends (6437 mullion by publicly controlled and 1231 million by pronelycontrolled uniolutions of higher education),
SOURCES: U.S. Depailmenl of Health. Education, and dielfaie. Oboe of Edina-lipu,411Mosius of Slate School Systems, 196741"; "Financial Stetislus ol Inns-kolpirs of Nigher [dualism, 196768": unpublished dots available rn the Oboe ofEducation: rod U.S. Depotonent of the Intent , Sumo el tonna Aeon.
25
Table 25.-Gross national produce related to Iolaexpendioures7 for education: United Stales,
1929a0 to 1971.72
GrossEspenditures for education-
national School As aCalendar year product year Tafel lig% (*nom ol
in molliono thousandsi cressnotionalprated
1 2 3 4 5
1929 $103,095 1929-30 $3.233.601 3.11931 .. . 75.820 1931.32 2.966.464 3 91933 . 55.601 1933 -34 2294,896 411935. . 72.247 1935 36 2.649,914 3.7
1937 90.445 1937.38 3,011.074 3.3
1939 90.494 193940 3.199,593 3.51941 124,540 194142 3203.548 7.61943 191,592 1943.44 3,522.007 1.81945 212,010 1945-46 4.167.597 2.01947 231,323 1947-48 6,574,379 2.8
1949 . 256,484 194950 8.715,635 3.41951 . 328,404 1951.52 11.312.446 3.41953 364,593 1953.54 13,949,876 3.81955 397.960 1455-56 16,811.651 4.21957 441,134 195745 21,119,565 4.8
1959 . 483,650 1959-60 24,722.464 5 1
1961 . 520.t09 1968.62 29.366.305 5.61963, 510,503 1963.64 36,010210 611965 614,884 196546 45,397,713 Ca196) . 793,927 1967.61 57,283,374 7.2
1969... 9302114 1969-70 '70,000,000 7 51971. 1,050,356 1971.72 ' 83.800,000 80
*Includes espeeditu es of public and nonpublic schools o1 ell levels 04 educationielemantary, secondary, and higher educaiionl,fibmilt*O.
riDTE. Beginning with 1951.60 school year, includes Alaska and Hanoi.
SOURCES. U.S Department ol Health, Education, and dello,. Once ol (dueslion, Biennial Survey of Education in the United States". "Statistics el SlateSchool Systems': "(manual Statistics of loslotulions of Pother [doubloon"; andnnlinblislted data. U S. Depoilment of Commerce, Buren of Economic Analysis."Survey 01 Centel Business," August 1965. July 1971, and Jody 1972.
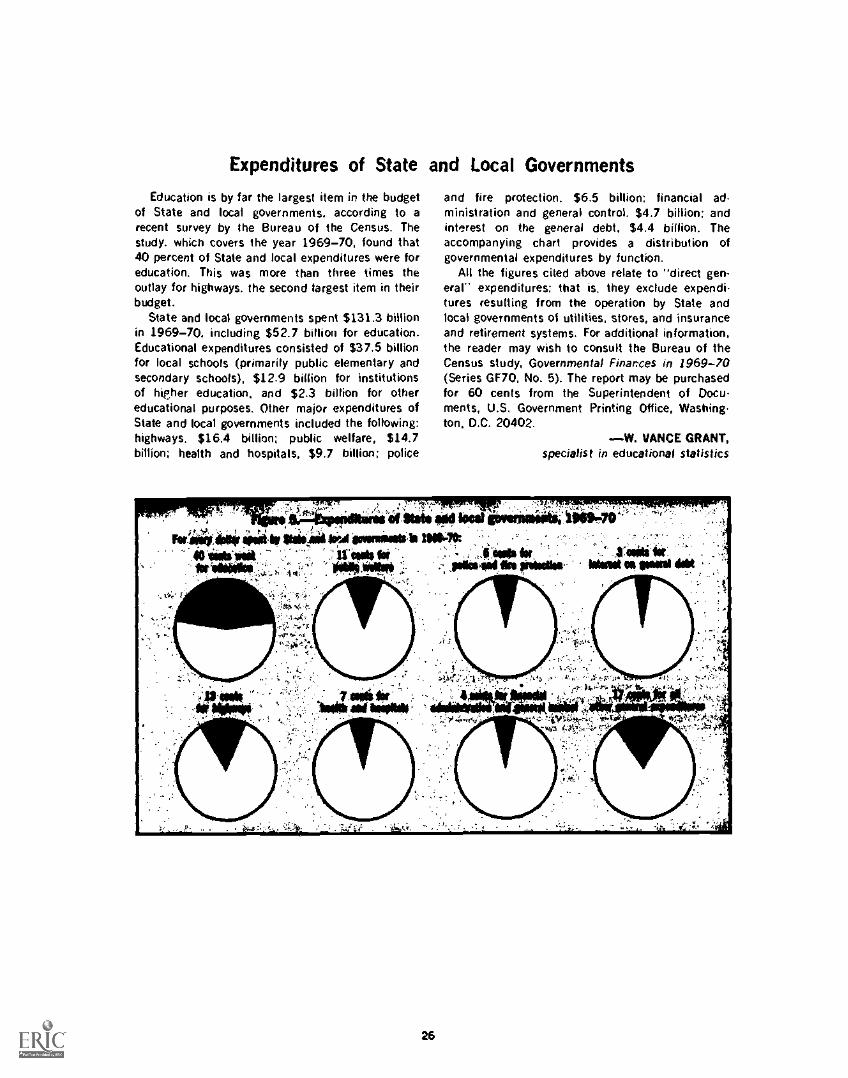
Expenditures of State and Local Governments
Education is by far the largest item in the budgetof State and local governments, according to arecent survey by the Bureau of the Census. Thestudy. which covers the year 1969-70, found that40 percent of Stale and local expenditures were foreducation. This was more than three times theoutlay for highways. the second largest item in theirbudget.
State and local governments spent $131.3 billionin 1969-70, including $52.7 billion for education.Educational expenditures consisted of $37.5 billionfor local schools (primarily public elementary andsecondary schools), $12.9 billion for institutionsof higher education, and $2.3 billion for othereducational purposes. Other major expenditures ofState and local governments included the following:highways, $16.4 billion; public welfare, $14.7billion; health and hospitals, $9.7 billion; police
and fire protection. $6.5 billion: financial ad.ministration and general control, $4.7 billion: andinterest on the general debt, $4.4 billion. Theaccompanying chart provides a distribution ofgovernmental expenditures by function.
All the figures cited above relate to "direct gen-eral" expenditures: that is, they exclude expendi-tures resulting from the operation by State andlocal governments of utilities, stores, and insuranceand retirement systems. For additional information,the reader may wish to consult the Bureau of theCensus study, Governmental Finites in 1969-70(Series GF70, No. 5). The report may be purchasedfor 60 cents from the Superintendent of Docu-ments, U.S. Government Printing Office, Washing-ton, D.C. 20402.
W. VANCE GRANT,specialist in educational statistics
26
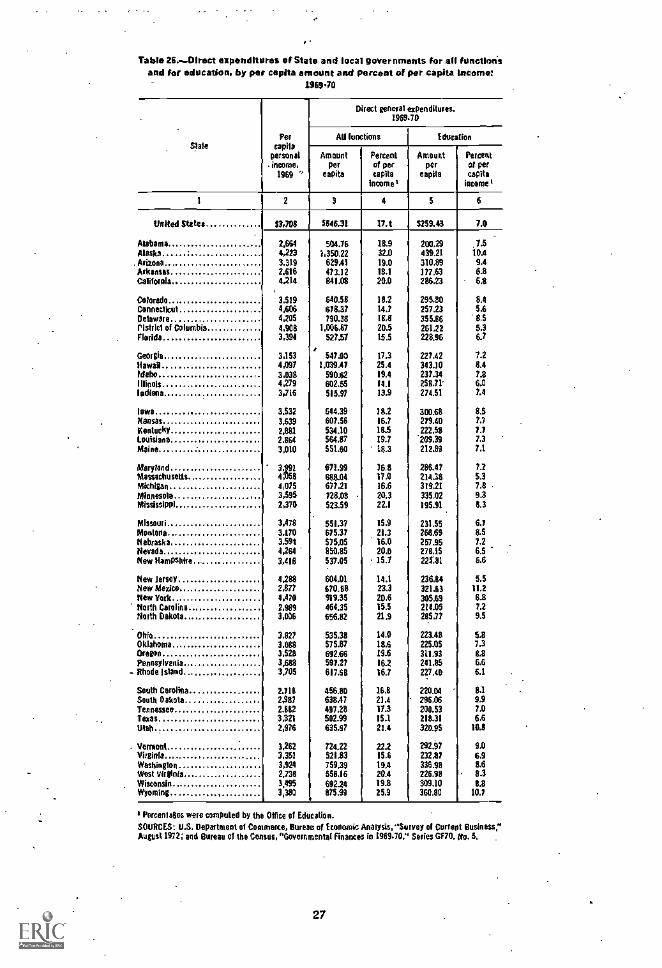
Table 26.--Diroct expenditures of State and local never nmants for all function'sand for education, by per capita amount and percent of per capita intorno:
1969.70
SlatePee
voilapersonal
. income,1969 '
1 2
United States $3,708
Alabama 2,664Alaska 4,223
. Arizona 3.319Arkansas 2,116California 4,214
Colorado 3,519Connecticut 4,606Delaware 4,205ristrkl of Columbia 4,908Florida 3,394
Georgia 3,153Hawaii 4,097Idaho 3,038Illinois 4,279lodiona 3,716
Iowa 3.532Kansas 3.639Kentucky 2,681Louisiana 2.064Maine 3,010
Maryland 3,991Massachusetts 0158Michigan 4,075Minnesota 3,595Mississippi 2,370
Missouri 3,478Montana 3.170Nebraska 3,59tNevada 4,264New Hampshire 3,418
New Jersey 4,288New gado 2,877New York 4,470North Carolina 2,989North Dakota 3,006
Ohio 3.82/Oklahoma 3.688Oregon 3,528Pennsylvania 3,688
- Rhode Island 3.705
South Carolina 2.716South Dakota 2,987Tennessee 2,682Texas 3,321IRO 2,976
. Vermont 3,62Virginia 3,2351
Washinglon 3,924West Virginia 2.738Wisconsin 3.495Wyoming 3,380
Direct general expenditures.1989 79
All functions Education
Amountper
capita
Percentof percapita
Income t
Amountper
capita
PercentOf percapita
income t
3 4 S 6
$546.31 173 $259.43 7.0
504.16 18.9 200.29 7.51,350.22 32.0 439.21 10.4
629.41 19.0 310.89 9.4473.12 18.1 177.63 6.8841.08 20.0 286.23 6.8
540.58 182 295.80 8.4678.37 14.7 257.23 5.6790.38 118 355.66 'IS
1,006.87 20.5 261.22 5.3527.57
I15.5 228.96 6.7
547.00 17.3 227.42 7.21,039A7 25.4 343.10 8.4
590.62 19.4 237.34 7.8602.55 14.1 258.71' 6.0515.97 13.9 274.51 7.4
644.39 18.2 300.68 8.S607.56 16.7 279.40 7.7534.10 18.5 222.58 7.7564.87 MI '209.39 7.3551.60 18.3 212.89 7.1
671.99 16.8 286.47 7.2668.04 17.0 214.18 6.3677.21 16.6 314.21 7.8728.08 20.3 335.02 9.3523.59 22.1 195.91 8.3
551.37 15.9 231.55 6.7675.37 21.3 268.69 8.5575.05 16.0 257.95 7.2850.85 20.0 278.15 6.5537.05 15.7 22L81 5.6
604.01 14.1 236.84 5.5670.18 23.3 321.63 11.2919.35 20.6 305.69 6.8464.35 15.5 214.05 7.2656.82 21.9 285.77 9.5
535.38 14.0 223.48 5.8575.87 18.6 225.05 7.3692.66 19.6 311.93 8.8597.27 16.2 241.85 6.6617.63 16.7 227.40 6.1
456.80 161 220.04 8.1638.47 21.4 296.06 9.9497.23 17.3 200.53 7.0502.99 15.1 218.31 6.6635.67 21.4 320.95 118
724.22 22.2 292.97 9.0521.83 15.6 232.87 6.9759.39 19A 336.98 8.6558.16 20.4 226.98 8.3692.24 19.8 309.10 11.8
875.99 25.9 360.80 10.7
I Percentages were computed by the Onite of Education.SOURCES: U.S. Department of Commerce, Bureau of Economic Analysis, "Survey or Current Business,"August 1972; and Bureau of the Census, "Governmental Finances in 1969.70." Series G670, (to. 5.
27
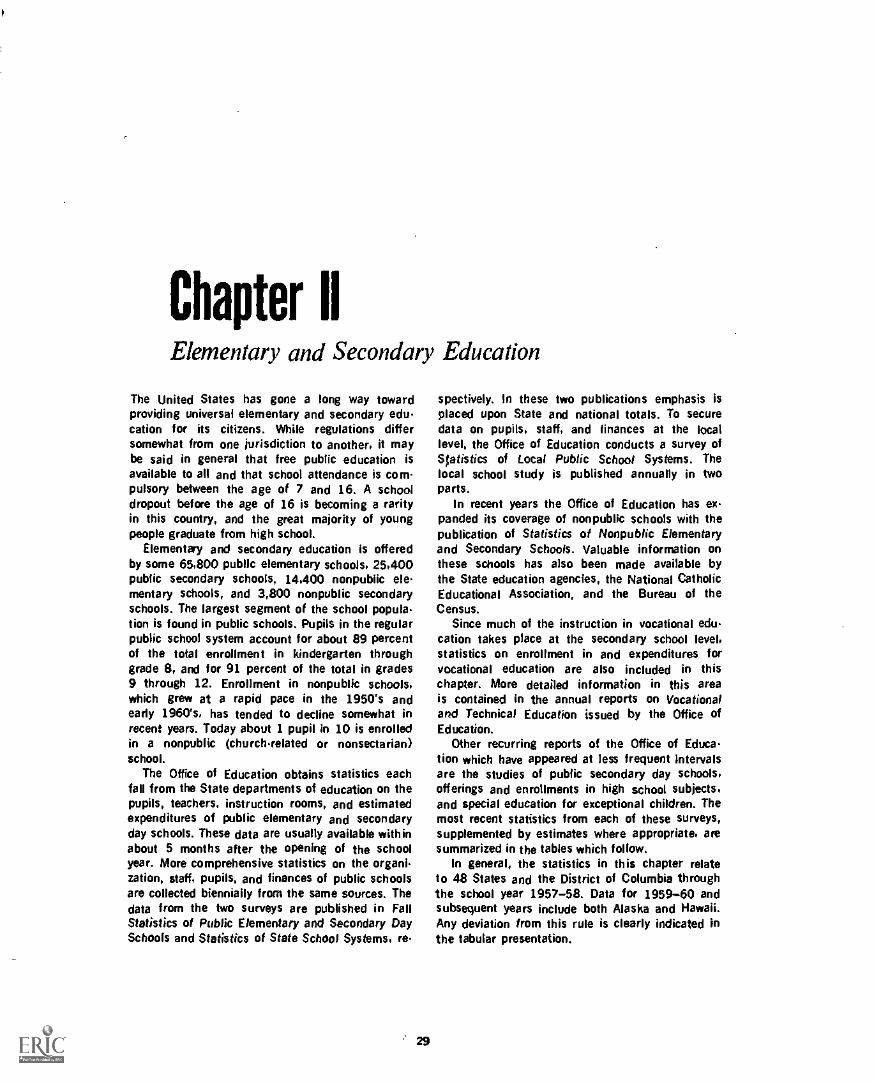
Chapter HElementary and Secondary Education
The United States has gone a long way towardproviding universal elementary and secondary education for its citizens. While regulations differsomewhat from one jurisdiction to another, it maybe said in general that free public education isavailable to all and that school attendance is com-pulsory between the age of 7 and 16. A schooldropout before the age of 16 is becoming a rarityin this country, and the great majority of youngpeople graduate from high school.
Elementary and secondary education is offeredby some 65,800 public elementary schools, 25,400public secondary schools, 14,400 nonpublic ele-mentary schools, and 3,800 nonpublic secondaryschools. The largest segment of the school popula-tion is found in public schools. Pupils in the regularpublic school system account for about 89 percentof the total enrollment in kindergarten throughgrade 8, and for 91 percent of the total in grades9 through 12. Enrollment in nonpublic schools,which grew at a rapid pace in the 1950's andearly 1960's, has tended to decline somewhat inrecent years. Today about 1 pupil in 10 is enrolledin a nonpublic (churchrelated or nonsectarian)school.
The Office of Education obtains statistics eachfall from the State departments of education on thepupils, teachers, instruction rooms, and estimatedexpenditures of public elementary and secondaryday schools. These data are usually available withinabout 5 months after the opening of the schoolyear. More comprehensive statistics on the organi-zation, staff, pupils, and finances of public schoolsare collected biennially from the same sources. Thedata from the two surveys are published in FallStatistics of Public Elementary and Secondary DaySchools and Statistics of State School Systems, re-
spectively. In these two publications emphasis isplaced upon State and national totals. To securedata on pupils, staff, and finances at the locallevel, the Office of Education conducts a survey ofStatistics of Local Public School Systems. Thelocal school study is published annually in twoparts.
In recent years the Office of Education has ex-panded its coverage of nonpublic schools with thepublication of Statistics of Nonpublic Elementaryand Secondary Schools. Valuable information onthese schools has also been made available bythe State education agencies, the National CatholicEducational Association, and the Bureau of theCensus.
Since much of the instruction in vocational edu-cation takes place at the secondary school level,statistics on enrollment in and expenditures forvocational education are also included in thischapter. More detailed information in this areais contained in the annual reports on Vocationaland Technical Education issued by the Office ofEducation.
Other recurring reports of the Office of Educa-tion which have appeared at less frequent Intervalsare the studies of public secondary day schools,offerings and enrollments in high school subjects,and special education for exceptional children. Themost recent statistics from each of these surveys,supplemented by estimates where appropriate, aresummarized in the tables which follow.
In general, the statistics in this chapter relateto 48 States and the District of Columbia throughthe school year 1957-58. Data for 1959-60 andsubsequent years include both Alaska and Hawaii.Any deviation from this rule is clearly indicated inthe tabular presentation,
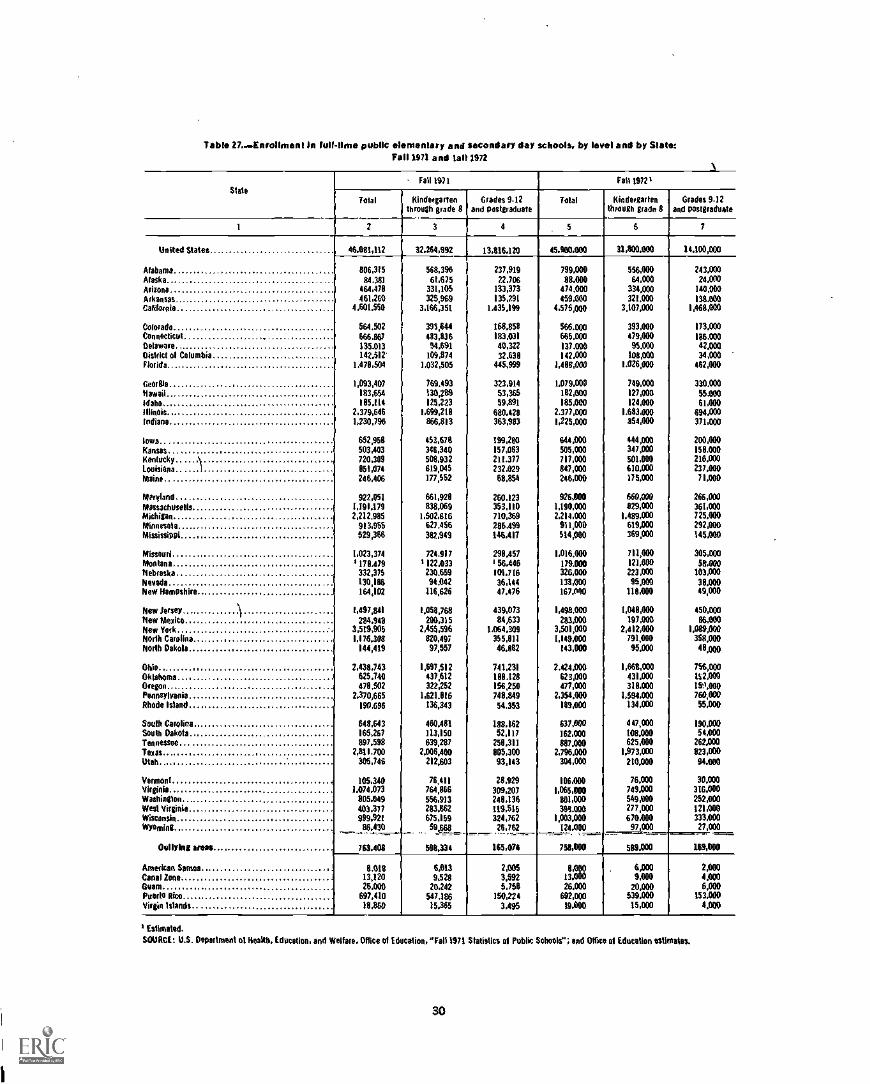
Table 27.--Enrollment In full-time public elementary and secondary day schools, by level and by State:Tali 1971 and fah 1972
SlateFall 1971 ran 19721
Tata! Kindergartenthrough grade 8
Grades 9-12and postgraduate
Total Kindergartenthrough grade 8
Grades 9-12and postgraduate
1 2 3 4 5 6 7
United States 46.081,112 32.264,992 13.816.120 45.900,000 11.000,000 14.100,000
Alabama 806,315 568,3% 237.919 799.000 556,000 243,000Alaska 84.381 61,675 22,706 88.000 64,000 24,000Arizona 464.470 331,105 133,373 474,000 334,000 140,000Arkansas 461,260 325,969 135,291 459,000 321,000 130.000California 4,601,550 3,166,351 1,435,199 4.575,000 3,107,000 1,468,000
Colorado 564,502 395,444 168.858 566.000 393,000 173,000
Connecticut 666,867 483,836 183,031 665,000 479,000 186.000Delaware 135.013 94.691 40,322 137.000 95.000 42,000District 00 Columbia 142.512 109,874 32.630 142,000 108,000 34,000Florida 1.479,504 1.032,505 445,999 1,408,000 1.026,000 462,000
Camilla 1,093,407 769,493 323,914 1.079.000 749,000 330,000Hawaii 103,654 130,209 53,365 1E2,000 127.000 55,000Idaho 195.114 125.223 59,891 185,000 124,000 61.000Illinois 2,379,646 1.699,219 680,428 2,377,000 1.683.000 494.000Indiana 1,230,796 866,813 363,983 1,225,000 054.400 371,000
owa 652,940 451,670 199.284 644,000 444,000 200,000Kansas 503,403 346,340 157,063 505.000 347,000 159.000Kentucky 720,309 508,932 211.377 717,000 501.000 216,000Louisiana 1 951,074 619,045 232,029 847,000 610,000 237,000Maine 246,406 177,552 68,854 246.000 175.000 11.000
Maryland... 922.051 661.920 260,123 926,000 660,000 266,000hfassachusalls,. 1,191.179 038,069 353,110 1,190,000 029,000 361,000Michigan 2,212,985 1,502.616 710,369 2.214.000 1,489,000 725,000
hlinnrsola 913.955 627,456 286.499 911,000 619,000 292,000Mississippi 529,366 382,949 146.417 514,000 369,000 145,000
Missouri 1.023,374 724.917 290.457 1.016,000 711,000 305.000Montana 1 179.479 1122,033 1 56,446 179.000 121,009 58,000Nebraska 332,375 230,659 109.716 326.000 223.000 103,000Nevada 130,186 94042 36,144 133,000 95,000 30,000New Hampshire 164,102 116,626 47,476 167,000 118.000 49,000
New Jersey \ 1,497,841 1.058,768 439.073 1,498.000 1.049.400 450,000New Weak, 284,948 200,315 84,633 283.000 197,000 86,000New York 3,519,905 2,455,596 1.064,309 3,501,000 2,412,000 1.089,000North Carolina 1,176.308 820,497 355.911 1,149.000 701,000 358,000North Dakola 144,419 97,557 46,862 143.000 95,000 49000
Milo 2.4311.743 1.997,512 741.231 2.424,000 1,660,000 756,000Dklithoma .1 625,740 431.612 199.128 623,000 431,000 112000Dragon 470,502 322252 156,250 477,000 310,000 191,000Pennsylvania 2.370,665 1.621,016 748,849 2,354,400 1,594.000 760,000Rhode Island 190.696 136,343 54.353 189,000 134.000 55.000
baulk Carolina 648.643 460.481 188.162 637,000 447,000 190.000South Dakota 165,257 113,150 52.117 162.000 108,000 54,000Tennessee 897.598 639.287 259,311 887.000 625,000 262,000Texas 2.811.700 2.006,400 805,300 2.796,000 1,973,000 823.000Jtah 305,746 212,603 93,143 304,000 210.000 94,000
Vermont A 105,340 76,411 28,929 106.000 76.000 30.000Virginia 1.074,073 764,866 309,207 1,065,000 749,000 316,000Nashinglen 805,049 556,913 240.136 801,000 549,000 252,000Ned Virginia 403.377 283.862 119.515 393.000 277,000 121.000Nisconsin 999,92! 615,159 321,762 1,003.000 670.400 333.000Wyoming 110.0 ...5z6e8 26,762 124,000 97,000 27,000
Outlying arms 763,4011 590.334 145,074 758,000 51111.000 101,000-I
American Santos 0.018 6,013 2,005 11,000 COW 2.000anal lone 1 13,120 9,528 3,592 13,000 9,000 1,000
hum 26.000 20,242 5,7511 26.000 20.000 6,000Puerta Rico 697.410 547,106 150,224 692,000 539,000 153,000Virgin Islands 10,860 14,365 3,495 99,000 15,000 4.000
I
1
1
i
I
1 Estimated.
S011RCE: U.S. Department of Health. Education, and Welfare, Office of Education,"Fall 1971 Statistics of Public Salmis"; and Office of Education estimates.
30
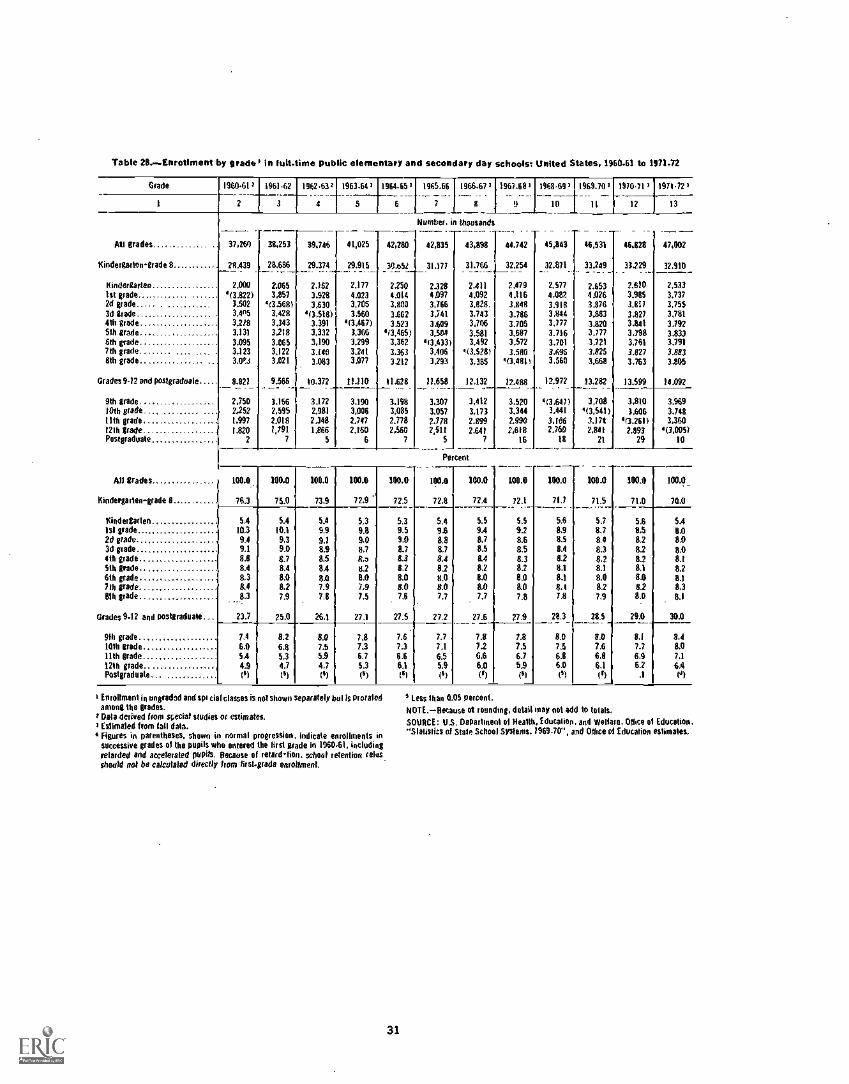
Table 28.--Enrellment by grads 0 in full-time public elementary and secondary day schools: United States, 1960.61 to 19711.n
Grade 1960.61r 1961-62 l%2.63 r 1963.641 1964.651 1965.66_ __.7
1966.671.__ ._
8
1967.681_ ..._.
9I 2 3 4 5
__ ___6
Number, in thousands
All grades 37,260 38,253 39,746[ 41,025 42,280 42,835 43,898
----- . _
44,742
Kindergarten grade 8 28.439 28,686 29.374 29,915 30,o51 31,177 31.766 32,254
Kindergarten 2.000 2.055 2.152 2,177 2.250 2.328 2,411 2.4791st grade 4(3.822) 3,857 3.928 4.023 4.014 4,097 4,092 4.1162d grade 3.502 4(3.5681 3.630 3,705 3.800 3.766 3,828. 3.8483d grade 3,4115 3.428 4(3,518) 3.560 3,662 3.741 3,743 3,7864111 grade 3,2/8 3.343 3,391 '(3.467) 3.523 3.609 3,706 3.70551h grade 3,131 3,218 3,332 3.366 4(3,465) 3,504 3.581 3,6876th grade 3.095 3,065 3,190 3,299 LW '(3,433) 3.492 3.5727th grade.. ...... .... 3.123 3,122 3.1413 3,241 3.363 3,406 (3,52& 3.5808th grade 3,09s 3.021 3.083 3,077 3.212 3.293 3,385 4(3,481i
Grades 9.12 and postgraduale 8,821 9,566 10,372 11.110 11.628 11,658 12,132 12.488
9th grade ... 2,750 3,156 3.372 3.190 3.198 3,307 3,412 3.52010th grade... ........ 2,252 2,595 2,981 3,006 3,085 3,057 3,173 3,34411th grade 1.997 2,018 2)48 2,747 2,778 2,778 2,849 2,99012111 grade 1.820 1,791 1,866 2,160 2,560 2)11 2.641 2,618Postgraduate 2 7 5 6 7 5 7 16
Pe cent
All grades 100.0 100.0 100.0 100.0 100.0 100.0 100.0 100.0
Kindergarten-grade 8 76.3 75.0 73.9 72.9 72.5 72,8 72.4 72.1
Kindergarten 5.4 5.4 5.4 5.3 5.3 5.4 5.5 5.51st grade 10.3 10.1 9.9 9.8 9.5 9.6 9.4 9.22d grade 9.4 9,3 9.1 9,0 9.0 8.8 8.7 8.63d grade 9.1 9.0 8.9 8,7 8.7 8.7 8.5 8.54th grade 8.8 8.7 8.5 8,0 8.3 8.4 8.4 8.35th grade 8.4 8.4 8,4 8.2 81 8.2 82 826th grade 8.3 8.0 8.0 8.0 8.0 8.0 8.0 8.071h grade 8.4 8.2 7.9 7.9 to to 8.0 8.08111 grade 8.3 7.9 7.8 7.5 7.6 7.7 7.7 7.8
Grades 9.12 and postgraduate 23.7 25,0 26.1 271 27.5 27.2 27.6 27.9
918 grade 7.4 8.2 8.0 7.8 7.5 7.7 7.8 7.810111 grade 6.9 6.8 7,5 7.3 7.3 7.1 7.2 7.511th grade 5,4 5.3 5.9 6.7 6.6 6.5 6.6 6.712th grade 4.9 4.7 4,7 5.3 6.1 5.9 6.0 5,9Postgraduate (4) 01 (3) (3) 19 (3) (1) (4
k Enrollment in unstatIld and spi ciatciasses is not shown separately bul Is proratedamong the grades.
I Data derived from special studies or estimates.1 Eslimaled from tall data.
Figures in parentheses, shown in normal progression. indicate enrollments insuccessive grades of the pupils who entered the first grade in 1960-61, includingretarded and accelerated pupils. Because of retardtion, school retention ales.should eel be calculated directly from first-grade enrollment.
31
1968.691 1969.701 1970.711 1971.721___ _ ___ _ -""1210 11 12 13
- -- - - - .- -- - - -
45,843 45,531 46,628
32.871 33,249 33.229. ._
2,577 2,653 2,6104,082 4.026 3,9853.918 3.876 3,8173,844 3,883 3.8273,777 3.820 3.8413.716 3,777 3)983.701 3,721 3.7613,696 3,825 3.8273,560 3,668 3.763
12,972 13,282 13,599
4(3.647) 3.708 3,8103,441 (3,541) 3,6063,106 3,171 '(3.261)2.760 2,841 2.893
18 21 29
47,002
32.910,
2,5333,7373,75$3,7813.7923.83.33,7913.8833,805
14.092
3,9693,7483,360
9,005/10
100.0 100.0 100.9 100.0_
71.7 71.5 71.0 70.0
5.6 5.7 5.6 5.481 8.7 OA ILO
8.5 8.4 82 8.08.4 8.3 8.2 8.08.2 8.2 8.2 8.38.1 8.1 8.1 828.1 8.0 8.0 8.18.1 82 8.2 8,37.8 7.9 8.0 8.1
28.3 28.5 29.0 30.0
8.0 8.0 11 8.17.5 7.6 7.7 8.06.8 61 6,9 7.16.0 6.1 62 6.4(3) (') .1 el
Less than 0 05 percent.
NOM-Because of rounding, detail may not add to totals,
SOURCE: U.S. Departinen1 01 Health, Education, and Welfare. Office 01 Education."Slaistics of Stale School Systems, 1969-70", and Office of Education estimates.
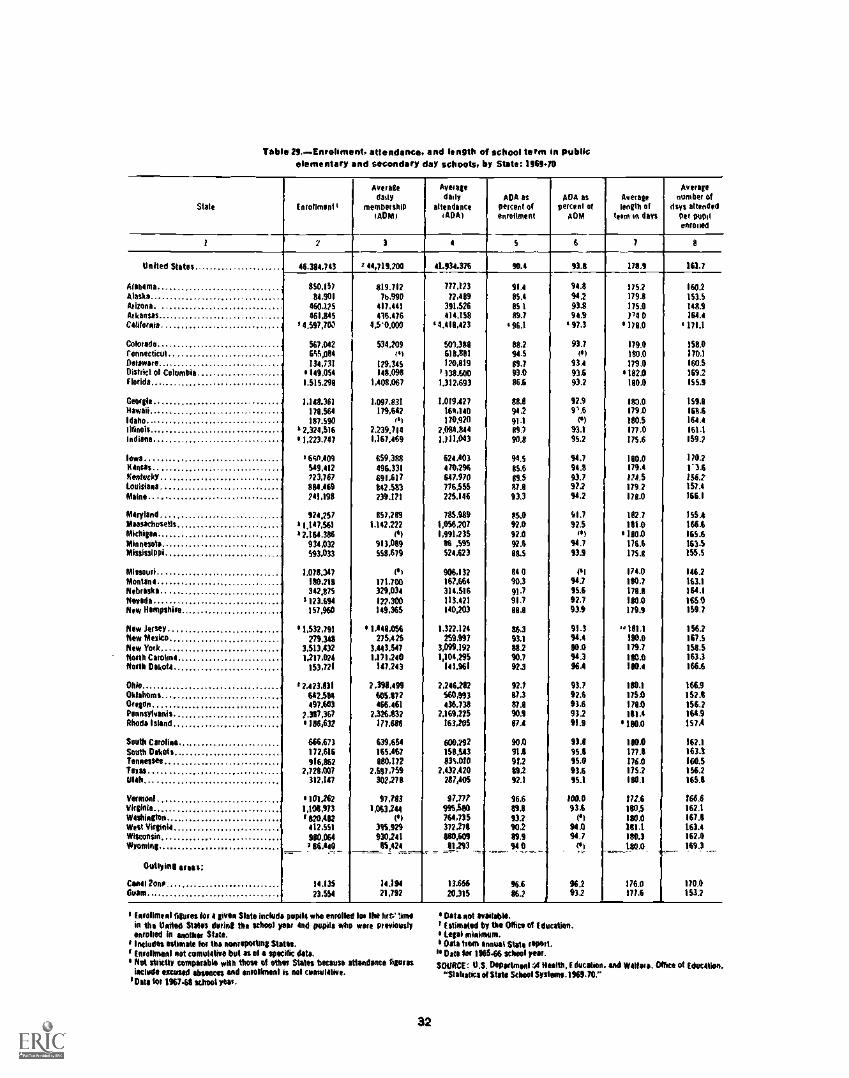
Table 29.x- Enrollment. attendance. and length of school term in publicelementary and secondary day schoots, by State: 196940
Slate Enrollment t
Averagedusty
membershipori0M1
Averagedaily
attendance((LOA)
ADA aspercent ofenrollment
-.
ADA aspercent of
ADP
Averagelength of
term in days
Averagenumber of
days attendedpet pupilmow
1 2 3 a S 6 7 8
United States 46.316.743 44,719.200 41434.376 90.4 931 178,9 161.7
Alobama 850,157 119.717 777.123 911 94.4 175.2 160.2Alaska
1
84.901 7b.990 72,181 85.4 942 175.8 153.581i70na. 460.125 417.441 391,524 851 934 175.0 /48.9Arkansas 461.845 416.476 414298 89.7 911 )4 0 164.6
California 0 4.547,70) 4.5'0.000 *4111,423 '96.1 ' 97.3 1701 ' 171.1
:doted° 567,042 534209 501,388 88.2 93.7 179.0 158.0ronnecticut 655,084 rat 618,881 94.5 1 180.0 170.1
Rolawate 136,131 129.345 124,819 89.7 931 179.0 160.5Ristrict of Columbia ' 169,054 168,098 0 138.600 13.0 93.6 '1821 169.2Florida 1.515298 1,408,067 1)12,693 86.6 93.2 100.0 155,9
Coups 1,148461 1,097.831 1.019,427 88.8 92.9 1113.0 159.1
Hawaii 178.564 174,612 160,160 942 9'.6 179.0 168.6Idaho 187.590 eg1 170,920 91.1 0) 180.5 1661Illinois s 2.324,516 2.239.714 2.084.846 89.7 93.1 177.0 161.1Indiana ° 1,223.747 1,167169 1.711,043 90.8 95.2 175.6 159.2
Iowa 0650109 659.388 626.403 91.5 94.7 180.0 170.2Kansas 549112 496.331 670,296 051 94.8 179.4 1'3.6Kentucky 773,167 691,617 647.970 89.5 93.7 114.5 156.2Louisiana 884.469 842,513 776.556 A7.8 972 179.2 157.4Mains 741,198 231.171 225.146 93.3 44.2 178.0 166-1
Maryland 926,257 857,289 785.981 05.0 91.7 182.7 155.4Massachusells 41.147,56I 1.142,222 1,456207 420 92.5 181.0 1661Michigan 42,/64,386 1o) 1,991,235 92.0 4) 180.0 165.6Minnesota 934,032 913,089 116 ,595 92.6 44.7 176.6 163.5Mississippi 593.033 558.679 526,423 88.5 93.9 175.8 156.5
Missouri 1178.347 ist 906,132 840 4so 174,0 146.2Montana 180,211 171.700 167.664 90.3 44.7 180.7 163.1Nebraska 342,875 329.036 314.516 91.7 95.6 1781 161.1Itmoda s 123,691 122,300 113.421 91.7 82.7 180.0 165.0New Homoshire
1
157,960 149,365 160,203 88.8 934 179.9 159.7
lee Jersey 1,532,791 1148,054 1.322.124 86.3 91.3 r 181.1 156.2Now Mexico 279.348 215,425 259.947 93.1 44.4 190.0 167.5lee Yotk 3,513,432 3143,547 3,099.192 88.2 10.0 174.7 158.5North Catolona 1,217,024 1371,260 1,104,295 90.7 44-3 180.0 163.3North Dakota 153,721 147,263 161.961 92.3 961 110.4 166.6
DAM 2.623,131 2.391,694 2246282 922 93.7 180.1 166.9Ilklahents 642,584 605.072 560,993 17.3 421 175.0 1621Oregon 697103 666,461 436.736 111.8 43.6 178.0 156.2Pennsylvania 2.30,30 2.326,832 2.169,225 90.9 93.2 1111.4 164.9Rhode Island 186,637 177.6111 163,205 171 91.9 180.0 1571
South Carolina 666,673 639,654 600,292 90.0 9341 1101 162.1South Dakota 172116 165.467 1511143 91.8 95.0 177.0 163.3Tennessee 916.862 880,172 835.010 912 95.0 176.0 160.5rums 2,728,007 2.591,759 2,432120 89.2 43.6 1752 156.2lilah 312,147 302,278 287,405 92.1 95.1 180.1 165.11
Vermont 101262 97,783 97)77 95.6 100.0 17/.6 166.6Virginia 1,108423 1,063244 995,580 1191 93.6 180.5 162.1Washington 120.412 (I 764,735 932 el 180.0 167.1West Virginia 612.551 395,924 372278 102 84.0 1111.1 163.4WisconsM 900164 930.261 880101 89.9 44.7 1841 162.0Uvalde' 84160 15,426 81,293 440 t1 1.80.0 169.3
Ob11111118 mess: I
Canal 2one . 16.13$ 16,184 13.656 96.6 96.2 176.0 170.0Guam 23,554 21,792 20.315
i I86.2 432 171.6 153.2
Enrollmenl figures for 4 given Slate include pepil4 who enrolled lot Ilse tote lintoin the United Stales doting the school you end pupils who were previouslyenrolled in another State.Naiades estimate for the tooemporting States.Enrollmonl not comulativo but as of a specific dote.Not strictly teromble with those of other States because attendance *gores*ludo siaind absences and rentolinionl is nol cumulative.
00am tot 196741 school sm.
32
Data not mailable.Estimated by let OThat of Education.110 minimum.gata hem mutual State repot.
s Date for 196346 school year.SOURCE: U.S. boositmonl 41 Wealth, Education. and Waller/. Olke of Education.
"Statistics of Stabs School Syslems.1969-70."
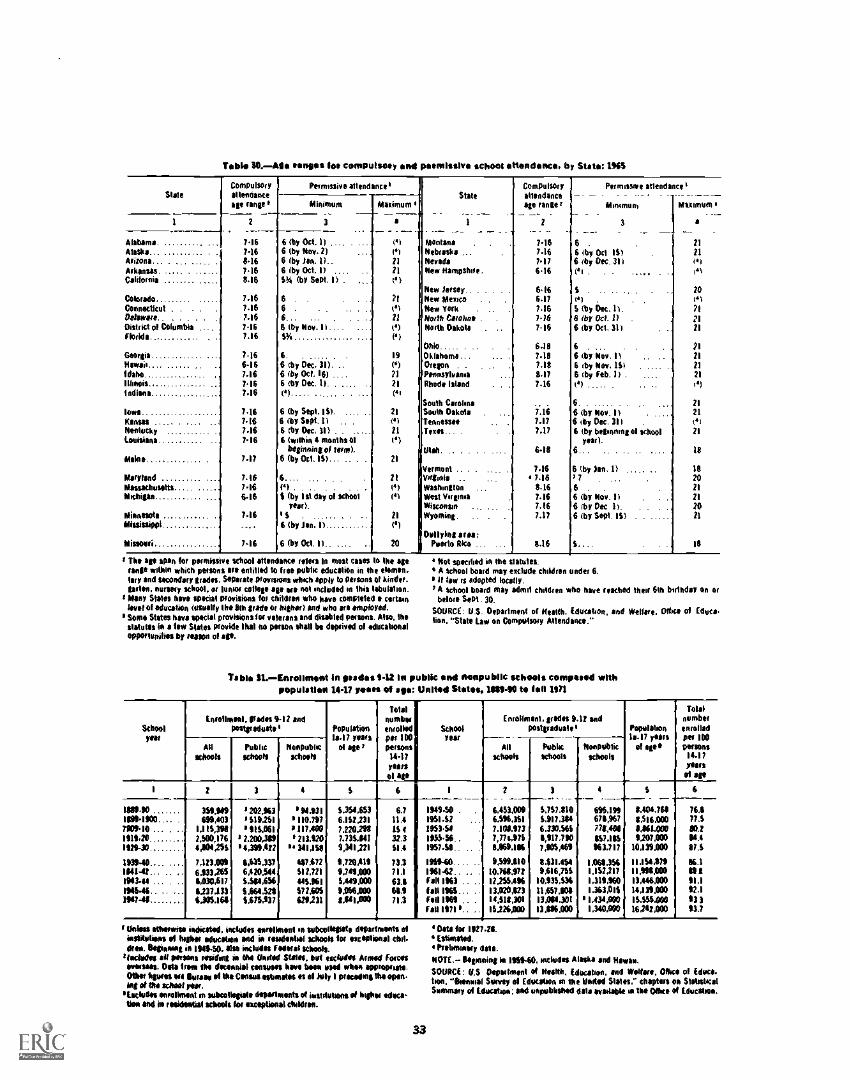
Toblo 30.-Ago romps foe compulsory pled pormIssivo school attoodonco, by Stator 1%3
SlateCompulsoryattendanceage ranter
Permissive attendance IState
1
Compulsory
age ranger
2
Permissive attends
Mmemurn
3
cos
oftsimuen 4
a
Minimum Maximum'
a1 2 3
Alabama, 7.16 6 (by Oct.)) .... . 0) Montsna 7.16 6 21Masks 746 6 (by Nov. 2) .... 14) Nebraska ... 7.16 6 (by Oct 15) 21Mama._ .614113161.
8467.16
6 (by Jan. 1)..6 (by Oct. I) ...
21
21haidaNew itimpshoe.
MT6.16
6 My Oec. 31101 .
441
01California 846 531 (by Sept. 1) . 0)
Now Jersey -. - 6.16 S . .. .. .. . 20Colorado 746 6 . 21 Now Mexico . . 6-1? 0) . 14$
Connecticut . . . 746 6 . 0) New York . 7.16 5 (by Dec.11. 21Mfaware. 746 6.. ... , 21 Not* totem* . 746 6 (by Oct. 2) . 71District of Columbia , 7.16 6 (by Nov. 1) .. .. id) North Dakota . 7.16 6 (by Oct, 31) 21
Fonda 7.16 1% 0)Ohio..... . . 6.18 6 , , . 21
Georgia 7.16 6. . 19 Oklahoma ... 7.18 6 My Nov, 11 21ramie_ . 6-16 6 (by Dec. 31). .. (') Oregon . . 7.18 6 My Nov, 15) 21Idaho 7.16 6 (by Oct. 16) .... 21 Pennsylvania 847 6 iby Feb. 1) . 21Morns 7-16 6 (by Dm. 1). . . 21 Rhode Island 746 0) ..... . i4iIndiana 7.16 (4) ..... ...... . 161
South Carolina*7111
6. ... . 21AIM 7.16 6 (by Sepl. 11). 21 South Dakota , 6 (by Nov. 11 . 21Camas ..... . 746 6 My Sept, I) .. . 0) Tennessee 7.17 6 (by Dec. 311 . . 01Iteolucky 7.16 6 tby Dec. 31) . ...... 21 Imo_ . 7.17 6 (by monomial school 21Alibiing' 7.16 6 (within 4 months al 0) yew).
b e g i m g a s of firm), Utah. . 6-18 6, , , 18Melee 747 6 (by WAS)... .. . . 21
Vermont , . , . 746 6 tby Mc 1) 18Maryland 21 Mimes .. ' 7.16 P 7 . ... 20Ossachusotts 746 01 . . . . . - . 0) Washington 8.16 6 . . 21Michigao 6-16 $ (by 1st day of sae° 1 01 West ihrtimi 7.16 6 (by Nov -1) 21
yew). Wisconsin 7-16 6 My Dec 1). 20Minnesota 7.16 6 6 . - .... 21 Wyoming. .. . 7-17 6 (by Sept. 151 . 21
dissi$10111 6 (Mimi) (4)Outlyhig arm:
Missouri 746 6 (by Oct. 11.. 20 Puerto Rico ... 5-16 5 , . 16
Too age spar, for permissive school attendance rotors in most cases lo the ageimp *Mon which poisons We Willed to tree public education in the dome,-tory sad secondary grain. Saporito provisions which apply to persons at kinder-odes, nursery school... i11410. COMO age ore eel socketed in Ibis mm11011611.1118ny Stales hove special provisions for children who hove completed ratanWet of education (usually Om 816 guide or mow) and who ors employed.Some States heva special provisions for indicant and disabled persons. Also, theambits: io a hew Slates provide thol ea Potion shall he deprived of Mucabooalopportunities by reason of sp.
Not speedier) in the statutes.A school board may exclude children under 6.II law is adopted locally.A school board may sdmil children who have reached their 6111 birthday on orbelore Sept. 30.
SOURCE: U.S- Department of Health. Educoboo, and Welfare. 011ice of Educa-tion. "State Law on Compulsory Attendants
Tab% 11Earrillsnesst lie eptados 4.12 lo public used soopublic schools compared withpopulatlso 14-17 voiles of ago: United Motes, to fall 1471
SchoolProt
Emellmeol. grain 9-12 andpostmadostel PepulatiOn
la 17 yearsel age,
totalnumberenrolledper IN)persons1447yeastol age
Schoolyear
Enrollment, groan 942 andpostgraduates Population
la-17 yearsof ogee
701.1numberenrolledper 100poisons
14-17mils
01 age
ARocbosts
,PublicschOoN
NonpublicscicoN
-- - -All
schoolsPublicschools
Nonpublicschools
1 2 3 4 S 6 1 2 3--- - -i---4.----r--S - 6---
110-90 119.90 4 202.963 6 NM 5.334,653 6.7 1949.50 . 6,451,008 5,757.810 695.191 8.404.761 76.61180. 1900.... . 690,103 4 519.251 6110,797 6,152131 11.4 195142 6.596,311 5.117.384 676,967 8,516.0110 77.5
790140 ... . . 1.1H5,391 6 115.061 4 117,400 7220.291 15 4 1411-50 7,108,173 6.330.561 771,400 8,861,003 80.21119.211 2,160,176 4 2.20089 4 213,120 7,715,841 32.3 195346.. 7,775,971 6,117,790 1197.111$ 1.202.000 51.81121-30 4,804,255 64,399,472 66 341,159 9,341,221 53.4 1957.59.. . 11.161.186 7,105,40 963.717 10,111900 87.5
193940.... 7,121.001 6,635.337 487$72 1.7211911 73.3 1969-80...... 9,589.110 8.631.454 1.061.116 11.194,1179 81.11841-42... 6.931265 6.420,544 $12.721 9.741N00 71.1 116142.. . 10.718.972 9416,765 1.152217 1091900 In1963-44 6,600,617 5,184,616 445,961 5,449,400 63.6 fall 1961 . 12216.496 10,135,536 1,311,160 11,446900 91.11911.46.... 6.237,133 1964.520 172,608 9.056900 MI fall 1161... 13.020123 11,457,10$ 1.363,011 14,139900 17,11147-48 6.6311,168 $975,137 629,231 8,641,000 71.3 RA 1961 .. 11,818,301 13904.301 61,130,000 15.555.010 13 I
Fall 19716.... 11226,000 13.06900 1.340,000 16242900 93.7I A
Unkso stbennise indicated, ;,eludes aorollotent ea orketirdiete departments slhiddellom .4 higher %Edo* and is tombola' 'dodo lot **tuitional cad.drop. Ilositiout in 191440, also includes fedmal schools.
4Inchidos all perms rersithog is CM Mutat Stale, but occludes Armed formsoverseas. Ocla from So demonist genuses have Mao used when appropmete.Other Mimes we Swam of the Comm estimates Net July 1 prommiong the open-log et Ow schwa mac
'fidgets enrollment m sukellegiele deparlromb of iostetulsons et higher educe-tam and 16 modestial school; be oximptionalcheldree.
33
4 Dots Per 1927-28.s Estio1M04,6 helimmery dme.NOTE,- llogoining m 191140. includes Alaska and learrio,
SOURCE: U.S Department of NeaRb, Limeys. and Welfare. 011ecil of Lima,hon. "flonmal Survey ol Education in the boded SION." chapters an SIMesticalSommary of Edocatioo; Sod unpublished data WIWI* m Of Olke of Utica's.
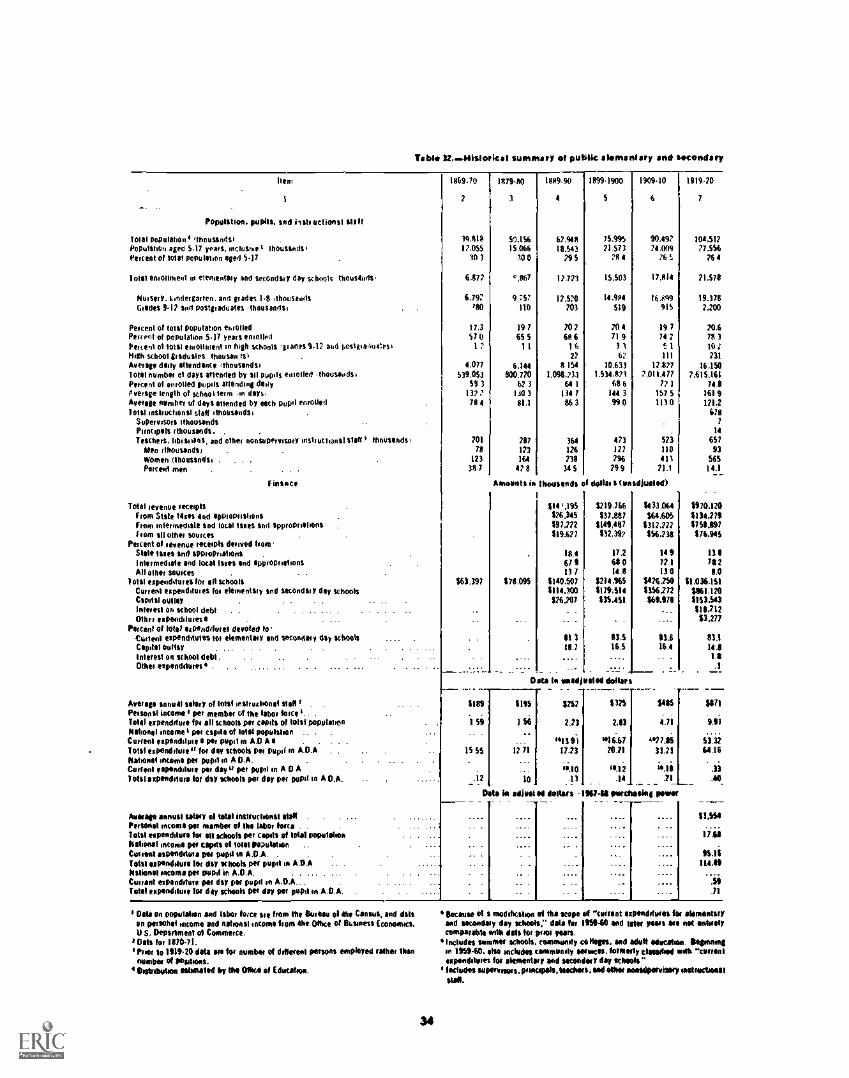
Table 32.44isterical summary of public elementary and secondary
Item
1
Population. pupils. and PM/lichen.' stall
Total population' (thousands 1Population aged 5.17 years, inclusive t thousands.Percent of lolat population aged 5.17
1081 enrollment m elementary and secondary day schools thousands'
Nuisery, kindergarten, and grades 14 .thousandsGrades 9.12 and postgraduates 'thousands'
Percent of toot population enrolledPercent of population 5.17 years enrolledPercent ol total enrollment in high schools 'vanes 9.17 and posigitniuctesiHigh school graduates !boson tstAverage daily atlendance (thousands'Total number ol days attended by all pupils 'moiled thousondsiPercent ol enrolled pupils attending dailyAverage length Of Xfiaa i term in days.Average number tit days attended by each pupil enrolledsoul insteuch000l staff ilhousondsi
Supervisors ithouondsPuncrnals ;thousands( . .
Teachers. hamper's, and other ithosupervisory Nish rntional slob t thousands.Aeon sthousondsi .
Women (thousands' .
Percent men .
f Waste
Total ievenue receiptsFrom State tails and appthipothhonsfrom mierniediale and Meal lanes and appropriationsf morn all other sources .
Percent ol revenue receipts derived hamStale lanes and appropriationsInlermernate and local laces and approprialionsAll other sources
Iola' expenditures for all schoolsCurrent expenditures lot elementary and seconds' y day schoolsCools! outlayInterest on school debtOther expendolures 0
Portent of IMO ocpenditures devoted kCurtail expenclituttm fot elementary sod secondary cloy schoolsComte) Outlay . ... . . . .
Mimes' on school debt.Other expenddurts .
Averop annual salary of total mstruclionol slob t . -
Personal income' per member of the labor force t.. .
Telill expenditure fee all schools per capita of total poputauenWolional ethernet per cam's of tolot population - - . -
Carte.' eependiture per pupil on A.0 A .
Total expenditure" tor dy schools per pupil in A.O.ANaomi IIICOMO pee pupil rn A O.A. -
Current esponaillue per day') per pogni rn Al) AI Mal dupoodolum tot day schools per day per pupil in A 0.A.
Average I salary ol total inslructional HoffPetthool income per member of the labor theca . .
Total eapeodoluto for all schools per capita of IMO populationNoliorial mimeo per capita of 10181 population ..Centel eSponditure pm pupil so A.O.A. .
1041 Meondithre lot day Wheals per pupil in ATEANotions' income pee pupil in A.D.A. . . ... . ...Commit expenditure par day psi pupil on ATEA-Total eeponditute lei day schools pee day per pupil on A.O.A.
1869.70
2
1879-80
3
1889.90
4
1199.1900
S
1909.10
6
1919-20
7
30.418 50.156 62,948 75.9% 90.497 104.51217,055 15.066 18.541 21.573 74,009 77.556
30 3 10 0 295 71 4 76 1. 764
6.877 0,867 12,723 15.503 17,814 21.578
6.79; 9.7S7 12.570 144114 NAM 19.378/go 110 703 119 915 7.700
17,3 197 702 704 19 7 20.657 0 65 5 68 6 71 9 la 7 74 3l7 11 16 31 T. 1 101
22 67 111 7314,077 6.144 8 154 10.633 17,877 16.150
539.053 800.720 1.098.733 1,534,871 7,011.477 7.615.16159 3 623 641 611 6 771 741
137 7 101 134 7 144 3 157 5 161 978 4 81.1 863 990 113 0 121.2
6717
14
701 287 364 473 521 65778 121 126 177 118 93
123 164 238 296 111 S6534 7 478 145 299 21.1 14.1
Amounts in thousands of dollars (smadtioled)
614 1,195
626.)45697.222619.627
6219.766637,887
6149,4117
632,397
6433,064664.605
8312,222856,738
1170.17061)4,2796751.697676.945
18.4 17.2 144 111679 680 72.1 784
163.397 118,095137
114040714.8
8214,465130
64262501.0
11.036.141111000 6179.614 6156272 $161,170$26.297 635,461 669,11711 115)44)
_ . .._ 111,21243,271
In 1 134 11.6 1110.7 WS 16.4 141
11.1
Oita in inadjoiled dollars1
6161 1193 1217 sus PO 1871
i Si 196 2.23 2.1) S.71 ail.
"1191 "I6.67 517/1 14.3215 SS 01 11.23 70-21 31.71 64.16
- . ..ii,lo soli "38 .1)
.12 10 .13_ . .14 /1 .40
Dote le adntod dothas 967411 purchaseng poorer _ -
44.71
1 Data on population sod labor roue are from the Sworn ol the Census, and dataon persohol income and national income from the 011the of Business t00110INCS.I/ S. Deportment of Commerce.Oslo for 1810-11.
*Net to 141)40 data NO lard number of dodoraol parlous employed rather thannumbed 04 Poldions,OmInbutios Woofed by the Mho of Educates.
34
because el a modstotalsoe of the scope of "norm spooidotires for elementaryand sernedny day schoolo7 data ter 194040 sad Inn years ate not entirelycomearettle *rah data tor prat years.iectodos summit schools, commonoty cellists. and ado* odershea. Seamanson 1944-10. else terlodes samommoly wenn, tenant, clouded mitt "cometospeenhotes It elementary sod smeary day Wants"
0 Wades knoreners, pourepds.toschsts. sod Phot matenetvisery oestrerbons IPad.
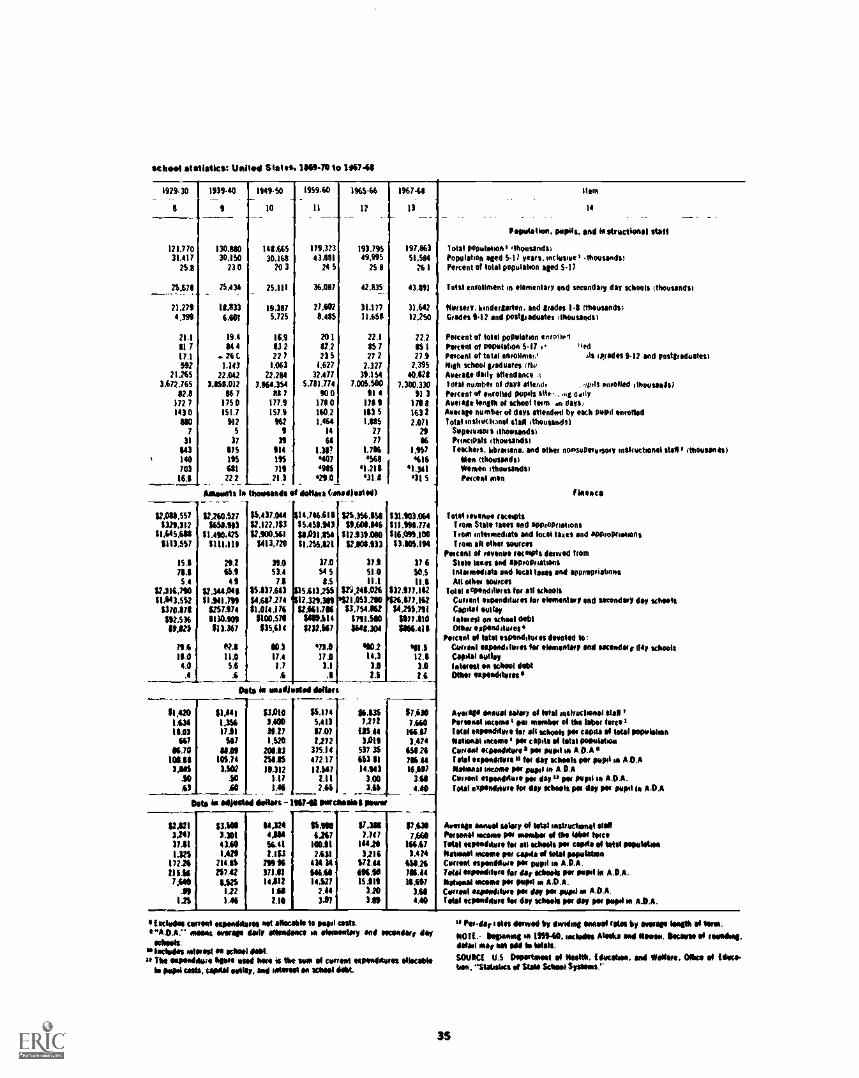
st1es4 sistiseks: United Stilt et.. 1/69-10 to 14674$
1929.30
a
1139.40._ .
$
11050
10
195940
11
196546
12
196744
13
121,710 130.880 148.645 1/910 193.795 191,86331,417 30,150 30.10 43,181 0,995 51,504
25.8 23 0 20 3 24 5 25 6 261
25.676__....... .. 25.434 25.111 36,087 42,835 43,01
21.27$ 18,833 19.367 27102 31177 31,6424.390 6,601 5,125 "ass 11,655 12,250
11.1 191 16.1 201 22.1 22.2017 "4 132 82.2 851 OS 1
11.1 .261. 221 215 272 271542 1,142 1,063 1,627 2.121 2,395
21,265 22.042 22.264 31111 0.134 40,4283172,765 3158.012 3.1164.334 5,70,774 7,004,5e0 7.300.330
82.1 161 812 000 $18 911172 7 175 0 177.9 1110 1111, 1701141 0 151.7 157.9 560.2 163 5 161 200 912 962 1164 110 2.011
1 5 S 14 21 2$31 37 39 64 72 66
643 625 914 1.30 1.716 I,10/140 195 593 " 4616403 611 719 tors 01:2111 1,341
16.6 22.2 21.1 0130- 011 '315
Aissonis la ammo& 0 14104e. (woodjuted)1
$1,088.551 $12.740.527 0.611.orr 14.706.610 $23.356.658 511,103.0643325,112 108.913 0,122,763 55,414.141 0,606,846 511.990,774
52,645.490 51.010125 0100,361 0.03104 $12135080 $16,01,100$1135.47 3111,119 1413,720 S105121 $2.08133 53.105,194
151 26.2 39.0 371 3/1 3/ 676.6 fel 51.4 $15 510 50.5SA 41 10 8.5 11.1 111
$1.116,190 $12.314.040 55 13703 5.613256 $20,24 11,026 632.911,102$1,643,552 51.941.01 14,687,274 12.329.301 621,053,210 111.111
070,071$12.536
8071746130101
$1,014,176110170
22161.710546.514
53,735162$711 me
14 251,71110/7150
0.03 113.367 5351/4 3112,367 018.304 036.410
711 10.11 0.3 0/31 002 01110.0 11.0 17.4 171 14,3 12.00.0 5.6 1.1 3.1 30 31
.a .6 3 .0 2.3 24
Data is iseadiadod Utters
11,4201134100160
0.70WM3,MS
100--_,
51.4411,36611.01
501880
105.143,502
.600
05103100.271,320
2013258.1516.312
1.111.0-
33.105,61367022212
32514472.012.667
111244--
010p.mWu300
537 35463 6114.943
300301
171307160156173,424
654.24/16.4416197
3404.40-
Dab hisallswiad NNW. 1>1074$ passitssiss privetv-.--- 1, __,
11.121 SON 61.E SUN $7,36 11.411324/ 3.301 4,644 6,261 1,181 116031.111 43.00 56.41 10001 100 $66171.30 110 2.163 2131 3216 3,424
17126 114.0 1096 414 14 572.44 40.26213.36 1$7.42 371/1 5460 496.50 /86.44
71411 41.12$ 14112 1412/ 15015 1607.10 122 1.61 2.44 320 3.10
us1
116 1.10 317 30 400
Item
14. _
Peladatioa. 01408. sod iostructioul slate
total Polrelehoo/ r IhamandsiPosolaboo seed 5-11 years, archaise / .thousands*Percent of total y000tsbon agar 5.11
1061 constraint lo momentary and secondary day schools tatousaads)
Nursery, kodersorten, and stades 1.8 ettousaads)Grades 5.12 and postgiodoeles 'harmed%)
Pasant of total population 10011,1Percent of otwaistwo 5.17 ,Pace& et total emonina1flith school graduates Oa.Average daily attendance .1setae numbsr al days Oen& . qyils enrolled rtsesuals)Percent at *molted popes she... ...g a.nlyAverage looser of wane tarn no days,Average umber 0 days attended by each crud enroasdtotal instrecoonal elan 4t1101/0491
Soperwroas rewound%)Noma I thootamisoleachers, librarians. sod other noaseparsory wilrectooal stall 0 rtharsen4s)
Mee rthoussods)10110 WhoosautOsiUncoil owe
tiedAlt 111,redes 9.12 sod postyradeates)
Masco
Total serous teCiettIMP Stile ta.as sae approurehons1 NO intsonedrate sod local 1601% and appeopiretronsfrom all *that 116141$
1011,C0111 of morons tempts domed tromState woof sod 800000088014imearroduata sod local tails and apprapeistroasSiloam faeces
Isial euendeores lot Ill almaCaroni esuodaries for gamester, mod asoonday lop users%capitol utlayInmost on wheel riablOiller eltilend dully
Percent of total essiondewas 60410 So:tarnul upandrlittos la eleowoUtp and ucenday day who*Caudal oddlyWan* ea *rhos! debtOS* 00001110140
Avows maul Way at total restrechoo0 Slall /Porsoul mum' per mutter of the labor force /Total etwoodeare ref all adiarls 10 400 0 108 110001406Naas* mum/ pot 400 of total usalabonCortue 040400twe 6 Peg !Weal m A.0,A 8tatol 441)00eato 01 let day Waal% 001 foal w A.O.AItabesal sweet pot paps or 4.0.ACement *somata* us day 0* per 001 to 14.0.4.Iseal essendriote lot 40 Who% ha 40 Pt Mope is AA.*
Sump unirel Wary of WW1 mairechonol 00Persuel luau per Gumbo at We labst WmTaaal upoodenie Iv alt abaft sot capita of Mal 011014twoilabsaat raceme an culla 0 WM ppolaboaCurets *sway% ow wad lo 8.011.15111 arporatote Om tar Wats w owl 18 A.O.A.Material acme pot foal 0 AAA.Cereal 4001041we Pot ear Peg pupil m A.O.A.Teal scpsaditere la by labook Pa Oaf 10 pupil m A.O.A.
0 tachtille aiti0te enosademos oot arrecable to Noel rods4/11.0.11- roller! amass 401, Meadow* ta Oteenttny 10 essooday day
eclook.mistiness ratorest 0 school OK$* Pao sapsollese foie wed Sae is ilie SIM of gonad 41001htstes Minable
So pose usta, weal soiloy, rhad sateree1 Ile 10041 MU
3S
"pia -far rates dame by ihenduag snausl Wall swap Wager SI ISM.may.. tbonnyng no 11040, manias Alselw Ind 111111N11. MUM 0 040140.Mae parr nel 00 to latols.SOURCt U.S Department 0 0400, flushoo, sad Megan, 0110 0 tam*boa. Ilabstas 0 SUS/ 141101 50Iams."
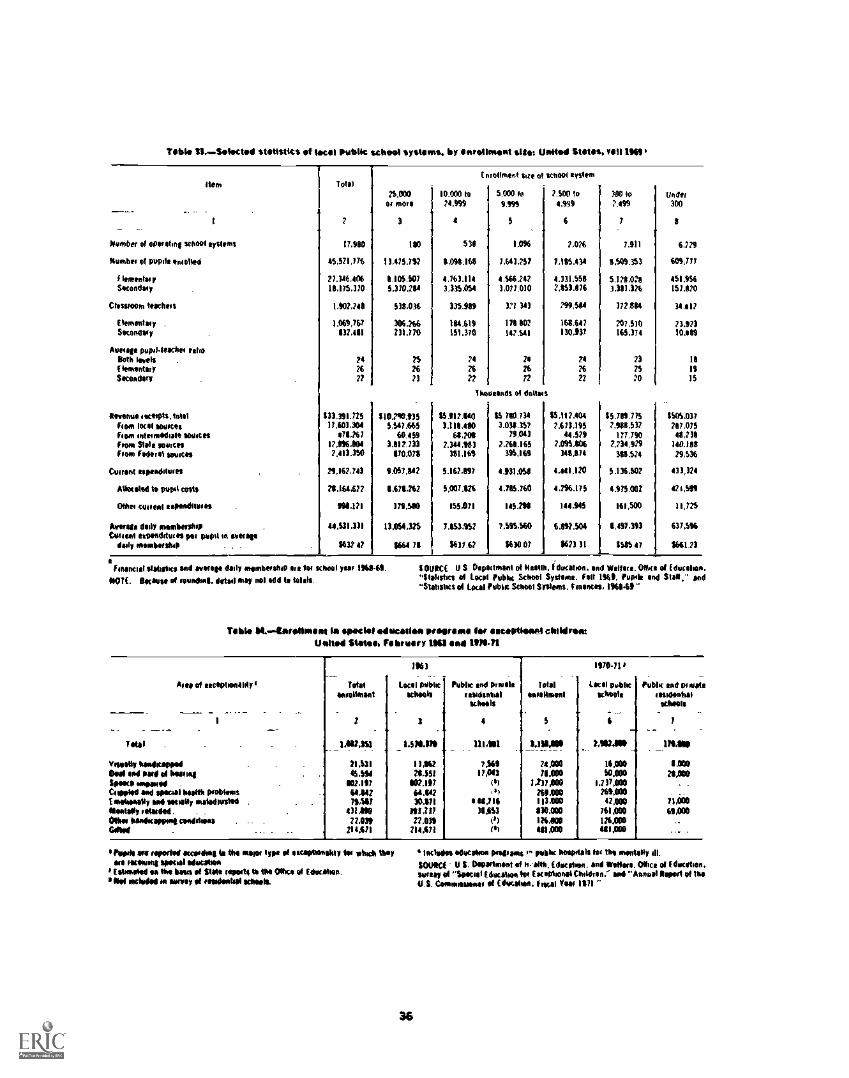
Tablo 11.Solothad stetistitS of Wel public seises, systoles% by onto/room 614*a Waked 10.01$. "10
item
Member of somahog school systems
tenets of peels *molted
anteaterSocendasy
Ctesstoorn leaches
lemmas',Secondey
floosie papateache retroBoth levelsfiettaMorYSecondary
Rooms tweets, tolehem local 101001Rom otemodele motsI soon Sale wastesteen Federal ooveas
Cocoa eopeadesees
Metaled lo met cob
Oats cooed eopeseleas
Avenge deer ontsobeshoCone et000ddecospe Foam overate
delis ~Moho . . .
erorlmter tote of wheel syslereTotal
21.000 10.000 to 5.000 It 2.500 to 300 so UnderOf more 74.999 9.993 4.919 2.499 300
7 3 1 5 6 7 8
17.980 110 531 1.096 2,026 1.911 6,229
15,51076 13,475.112 8,098.1E41 7,643,75? 7,115.434 1,501.353 604,777
27.346,406 8.101.607 4.763.114 4166,247 4.331.556 5.178,018 451,95616.115,370 5,370284 3135,054 3,077.010 2,153.876 3.381,376 157.810
1,402,741 538,036 335,919 371 34) 299,564 372.8114 34.017
1.069,767 306.266 184.619 178 802 168,647 701.510 73.973831,441 731,170 151,310 147,141 130,937 165,374 10,019
rs2?
03,391.77517,603,304
474.24717,116,4012.413.350
21,162,143
7136072
91111.171
44.131,1)1
563? 4?
76
610.740.935514/.665
60.4593.81?.733
110,018
9.017,142
8.618262
371,510
13064,325
1661 14
24
2672
Is26
IlsoossrOs M dollen
85117.1403.118,480
61.2111
2.344,983311,163
5.162,891
5,007.126
155.011
1.1153715?
$637.6?
15 190.1343.031.357
19,0432,768,165
311,161
4.931.011
4.715.160
145.216
7,199360
MN 07
742?
$5,112.4047.673,195
44,5797.095,806
341,114
4,01.120
4,796.115
144.945
6.197.504
1623 )1
237520
15,789.7/57,0118,537
117.790?,234,979
345.526
5.136.507
4175.007
161,500
8,417.393
1985
191915
1505,01120/.015
41,2311
140,10829,536
43),324
421,111
11,129
637,116
1661.23
I oMinclet statollco and *soap dolly someone* ere ter*036. Ike/WO of toenOsag, demi may nel odd le %lee
school me 1111-61. SOURCE US Dopecteanl d Neale, ideation, and Welfare. Ofke of Edecaloo,"Slatisho of Local Ptak School Systems. Felt 1169, Fowls and Stall,- and"Stomas of local Roble School Symms, Cosmos, 116$49 "
Table 811.--ter4lloiant Et1 stool *decease proarassa ter amotsplieetti chestnut:Welted Steles, February IOU seer 1134.71
Rota of 'sophism*
ialal
Voto111 toaditheMDeaf bed Pod of ImmoSome sawedCooped sod specie loath emblemteetotally end welly maladtesedWee* eluded.Olhos leonecsasona meatlessCAW
totaltotoenant
2
14112.111_ . . .
11,33145.194
102.11164.14211,911/
01180?LIM
214.171
S
1943
Local psalmschools
3
3.9623.15/
107.19164.64230371
811,21122.039
714,111
Psalm end Prmeistesidgolol
wheels
111,181_ . .
7.16111/143
41)1635,653
(I)()
Totaleaelhoonl
LAMS
21,000/00
1,73174
itao269.000113.0008106110124.41011
111,000
1170-11
Local 9obloschools
1,112,1110
1640190,000
1.732,000763,00042,00e
761,0001/4.00M1,000
Roble end emoteloodentol
Seireelg
110.698
COO2$1100
71*61.000
Peyes am reportut scasshog d Cho mow too of oscaseasokty col huh Soowe 'Komi spinet seaohoototsweled so she hose of St* mods to ea ORme et legates.
r Not *Woe on Neel of tostesobsl schools.
36
4 UMW* *MOM' Self 011i P. public Maputo roc the onentoly al.SOURCE U S. lepolment of h. aloe, (esteem and salleto. Otte al tdoceton,mesa, of "Metal Eduction tot taceplonalCeldfon.' eel "Rano& Reed Of teeU.S. 411110011160141 of (shealon, f oral VW
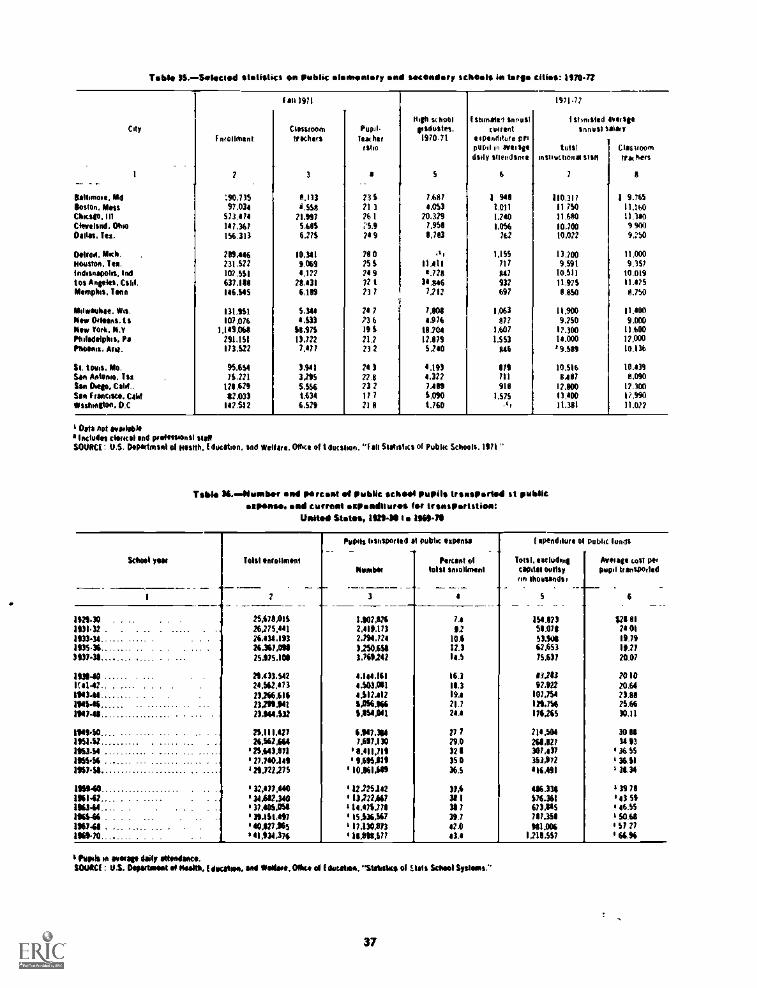
Table 0.-Soloctod statistics tut public olootoottoy and cocoonssr schools 4. WWI cities: 1970-72
Cap
1- _ --
f niollnient
7
18111971
Clamors'fetchers
3
Pupil.tem herrife
a
HO same!graduates.1970.11
5
1 strinalef annualcurrent
es pendulum pt.pupa on botto ledilly Stitlidiont
6
1971.7:
I ttlivolitdinnu51 salaly
tuIllintliwchonal 2101
7
Oortelet
ClistroomOa tins
8
Baltimore, MO 190,735 0.133 73$ 7,687 $ 948 $10,311 $ 9.765Boston, Moss 91.034 4,53$ /1 3 4,053 1.011 11 750 11.160Chmano, 111 573.414 21.997 /6 1 10,3/9 1240 11.680 11.310Cleveland. Ohm 147.367 5.61$ 25.9 7.950 1.056 10)00 9 NMOaks. Its. 156.313 627$ 74 9 11,753 76/ 10.022 9,150
04 Nod. Mmh. 2119,446 10.141 700 i*, 1,155 13)00 11,000Houston, Tel. 23112/ 9.069 25 $ 11.411 717 9.591 1.15/indranapols, Ind 101.531 4,177 749 n.7/8 HQ 10.511 10.011tot Angetes. Calif. 637.101 78,431 72t 34.846 93/ 11.97$ 11.415Memphis, Tenn 146.545 6.119 737 7,712 697 4.850 0.760
Mdwaohoe. Wit.Nfe, Orleans. t a
131.951107,076
5,1444,533
24 7)3 6
71084.176
1.063
87?111009250
11.400tow
Now bort. N.Y 1.149,068 68.97$ 19$ 18,704 1,607 17.300 11.650Philodolphia. Pa 291,151 13,722 212 17.079 1.553 14.000 17100/Items. Ma. 173,522 7,477 232 5,740 649 *9.5$9 10.136
St. toms. Mo. 95.654 3141 743 4.193 979 10,516 10.439Sin Anton*, Its 73,221 3,295 22.5 4,32/ 711 8.407 11,090
San Omsk Calif 121,629 3,356 732 71119 919 1/.500 17.300San Francisco, Cold 02.03) t134 177 3,090 1.575 13.400 11.990Washroglon. 0.0 14/112 6,5/9 211 t.760 .1, 11,381 11,027
l Oats sot OeNtablea Incledirs clerical and plohnional staffSOURCE-. U.S. Departmanl of Noatth. Eduction, and *Wore. Mime of t Oucabon. "Fall Statistics of Publm Schools. 1971 "
Tibia 96.Nitsoltor end pa tycoon of public sent* pupils tonspotod at public'sponse, and current ompondlturoo for troospotstion:
Ustito Stet's, 1929-I1 to 111641-79
School so& Total onvollment
Nods transported of
Member
3
oink *sum
Percent oltolot smiliotot
II
1 noenditure of
Total, eacludromegotist mothsfun Ihilviliwilt
. .-5
public howls
Averone Lost perpupa transported
61 7
1421-X,
...-
25.67111$ 1.902126 7.4 551.123 $21111931.32 - 26,275,441 2119.173 9.2 51.0711 24 01
191344 Z6.414.193 2.794,724 10.6 53,906 19.79
1935.36 26.367.0$1 3250156 12.3 62153 19.7,3937-11 25,975.101 3,70242 14.5 75137 20.07
113140 26133.542 4,144.161 16.1 13203 7010Ofill-12 24.562.473 4103.0111 113 9/.922 20.64191341- 23.266,616 4112112 19.4 107.754 23.011
191546 232911111 1.066.966 21.7 121.754 25.66'PIUS 2316032 541,011 al 176.265 30.11
101940... . .... t$,111.427 6.017.1111 27 7 714,504 305$1953.52 26,562,664 7,697,593 29.0 26112/ 14 933163-54 ........... . ..... ... ..... 23143.1171 1,911,719 321 107,437 36 55
1955.56 ..... ... ....... ..... . . I 27.760.149 905,619 35 0 151,972 * 36.61
19614$. 124,722275 ' 10116100 36.5 416191 131.34
IMO 32.477.440 12/25,142 374 406.334 * 39 711
196142. 3402.340 132721667 311 576.361 *43541116344- 3709156 S 14,479.776 317 673,445 46.55
116566 - 39.161,497 15,$36,567 39.7 717.151 l $0.6640127865 ' 17.190.173 42.0 981.006 57 27
196940 *41134,376 0 11411.577 113.11 1211.537 66.96
tPopis on *nap doll *Nodose&SOIMCE : U.S. ININdmOot of Mills. (Osicatioe. MO thollavli. Mk* of (Notate*, "Malmo 41 tibia School Systems."
37
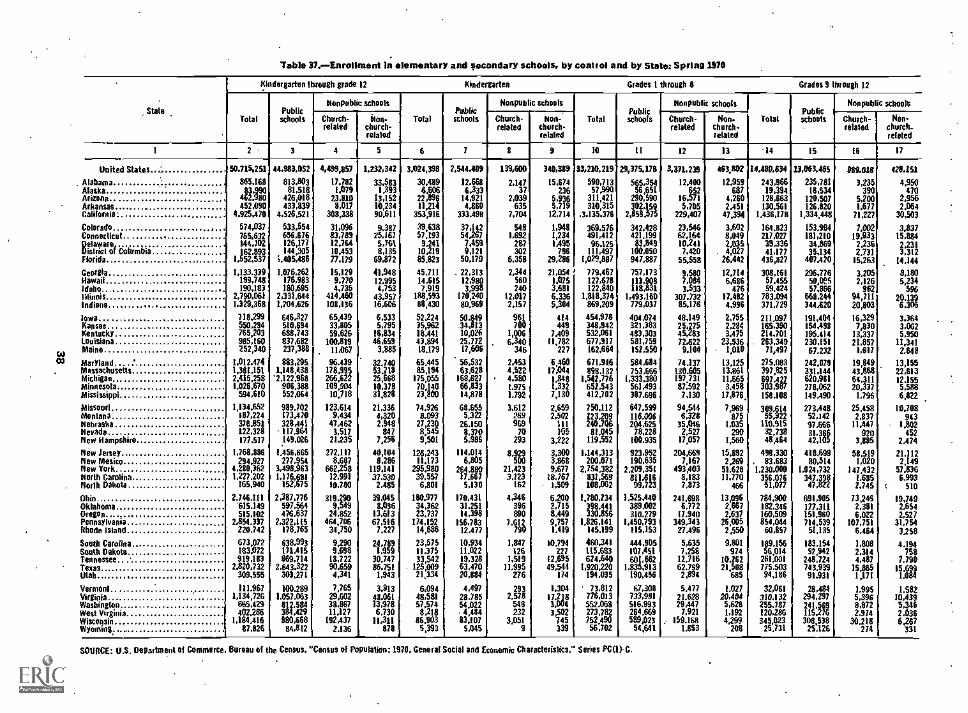
Table 370-Enrollment in elementary and secondary schools, by control and by Mato; Spring 1970
State
Kindergarten through grade 12 Kindergarten Grades 1 hrough 8 Grades 9 lump 12
TotalPublic
schools
Nonpublic schools
Church- kon-related church-
related
TotalPublicschools
Nonpublic schools
Church- Non-related church-
Waled
TotalPublic
schools
Nonpublic schools
Church- Non.related church-
related
TotalPublicschools
3 4 5 6 7 8 9 10 11 12 13 '14 15
United States
. AlabamaAlaskaArizonaArkansasCalifornia
ColoradoConnecticutDelawareDistrict of ColumbiaFlorida
GeorgiaHawaiiIdahoMinisIndiana
IowaKansasKentuckyLouisianaMaine
03 MarylandMassachusettsMichiganMinnesotaMississippi
MissouriMontanaNebraskaNevadaNew Hampshire
New JerseyNew MesicoNew YorkNorth CarolinaNorth Dakota
OhioOklahomaOregonPennsylvaniaRhode Island
South CarolinaSouth DakotaTennesseeTexasUtah
VermontVirginiaWashingtonwest VirginiaWisconsinWyoming
50.715,251
865,1683.998 0
462.980452,090
4.925,470
574,037765,632144,102162.893
1.552,537
1,133,339199,748190,183
2,790,0611,329,368
718.299550,294765,203985,t60752,340
1,012.4741.381,1512,415,2581.026.670
594,610
1,134.652187,224378.651122,328177.517
1,768,886294.927
4,280,3621,227,202
165.940
2,746311'615,149515.102
2,854,337220,742
673,072183,072919,183
2,820,732309,555
111.9671234,726
865,429402286
1,184,41687,826
44.983,052
813,80381,518
426,018433,839
4.526,521
533.554656,676126,177144,305
i.405.486
1,076,262176,983180,695
2,331.6441,204,626
646.327510,694688,743837,682237,388
883,295.1,148,438
'2,122,968906.388552,064
989,302173,470
117,964328,441
149,026
1;456,665277,954
3,4986.9631,11681
151,,675
2,387,776597.564476,637
2.322,115178,765
638.993171,415869,714
2,643.322303,271
100.2891.057.063812.584384,429980,66884,812
4,499,857
17,7821.079
23,8108,17
308,0338
31,0%83,78912,76410,45377.179
15,1299.7704735
414,,460108,136
65,43933,80559,626
100,81911,067
96.,41789935 9
266,622109,90410,718
123,6149,434
47,4623,517
21,235
272,1178,687
662,25812,99119.780
319.249 09,54
24,852464,70634,750
9,2909.698
18,72290.6594,341
7,765
3829,602,86711,127
192,4372,136
A
1,232,341
33.5831,393
13,15210,23490,611
9.38725,1615,7518,135
69,872
41.94812.9954,753
43.95716,606
6,5335,795
16,83446,659
3.885
32.74053,71825,66810,37831,828
21,203364,32,948
7,25/
6
40,1048,286
119,14137,5392.485
39,0458.036
13,61367,516
7,227
24.7891,959
30.74786.751
1,943
3.91348.06113,9786,730
11 ,311878
3,024,398
30,4896.606
22,89611,214
353,916
39,63857,193
9,24110,21985,823
45,71114,6157.919
188,59388,430
52,22435,96218.44143.89418,179
65,44585194
175,05570,14023,800
74,9268.093
27,2308,5459,501
126,24311,173
295,98039.557
6,801
180,97734,36223.737
174,15214,686
23,5/511.37533,542
. 125,00921,334
6.09448,58157,5748.218
86.9035,393
2,544.409
12.6686,333
14,9214.860
333,498
37,142547,2659 7
,49,121
50,179
22,31312,9803.94098
170,280.969
50,849.34,81310,02625,77217,606
56.53263.628
168,62766,83314,878
68,6555,322
26.1508.3705,986
1146,,014805
264.88017,6675,130
179,43131,25114,398
156,78312.477
10,93411,02219,32863.47020,884
4,49728,78554.022
4,48483,107
5,045
139,600
2.14737
2,039635
7,704
5481,692
287302
6,358
2,344056
212,017
40
2,157
961700
1,006
346,340
6
2,44.525324,580t.9751,792
3,612269969
70293
8129500
21,4233,223
162
4,396 643890
7.612790
61, 18472
1,51911195
276
293227
548232
3,0511
340,389
15,674236
5,9365,719
12,714
1,9481,2141,4%
79629,286
21,0541,0753,6816,3365.304
414449
7,40911,782
227
14,,4460474
1.918t,3327,130
2.6592.2,502
111145
3.222
3,3003,8689,677
18.767. 1,509
6,2002,7158.4499,7571.419
10,794227
12.69549,544
741
1,3042137,1,004 8
3339339
33,210,219
590,71357,990
311,421310,315
.3.135,376
369.576491,41296.125
111,4971,029,887
779,467127,678122,840
1,818,374869,209
454,978348,942532,061677,917162,664
671,946898.132
1.652,542,776
543412.702
750,112123,204240,70681.4
119.05525
1,144,313200,071
2 834,25,3821.564
108,062
1,780,234398.441330,856
1,826,141145.199
460.311115,683624,640
1,920,220194.035
73.812776,013552,061273,782752,49056.702
29,375,178
565,35456,651
290,5903,159
2,80258275
342.42848321,199
249100,050947,887
757,173113,908118,831
1,493,160779,037
404,074321,383483,303581,759152,550
584,684753.666
1,333,380561,493387.696
647,599116.006204.52578,228
100.935
923,952190,635
2209,351811,61699,723
1,525,440389,002310.279
1,450,793115.153
444,905107,451601.662
1.835,913190,456
67,308733,981516.993
624.669589,02354,641
3,371,238
12,40065
162712
5,705229,407
23,546
10,24162,164
7,42055.558
9,5807,0843.533
307.73285,176
48,1492545,275
,28372,6229,104
74.137130.605197,73187,5927,130
%,5446,328
35,0%2,527
17,057
204,6697,167
493,4038,1837,873
241,6986,772
17.940349,343
27.496
5,6357,258
12,71662.7992,894
5.47721.62829,447
7,921159.168
1.853
463,802
12,6687
4,260,451
427,394
3,602
0357.8,049
. 4,02726.442
12,7146,676 68476
17,4824,996
2,7552,2843,475
23,5361,010
13,12513,86111,6653.458
17,876,
7,969875
1,035290
1,560
15,6922,269
51.62811,770
466
13,0962,6672,637
26,4052,550
9,80110,274
6221,50
688 5
1.02720,484
5,4281,192
994,2208
14.480.834
243,96619,394
128,663130,561
1.436,170
164,823217,02739,33641,177
436,827
308,16157,45559.424
783,094371,729
211.097165,390214,701
. 263,34971,497
275.083397,825697.427303,987158.108
309.6155,922
4
910,91532.73848,464
498,330. 83,6831,230,000356.01651,077
784,900182.346160,509854,044
60,857
189.15656,014
261,001775.50394,186
32.061310,132255,187/20,28634525,07.3
.731
13,063,465
235,78118,534
120,507126,820
1,334,448
153.98418134,210
26935,134
407,420
296,77650,09557,866
668,244344,620
191,404154,498195.414230,15167.232
242,079331,144620,961278,062149.490
273,44852,14297.66431,36642,105
418,69980,514
1,024,732347.39847,822
691,905177.311151.960714,539
51,135
183.15452,942
248,724743,93991,931
28 ,484294,297
115216241.569
308,53825,126
Nonpublic schools
Church- l Non-relaled church-
related
16 17
90.0111 428.151
3,2355,290
001,677
71,227
7,19.33
2,90022362,73115,263
3.2052,126
96244,71120,803
167,830
13,,3337
29
21.8571,417
1984943,,36864,31120,337
1,796
25.4582,837
920285
58,5191,020
147,4321.6852,745
73,2462,3816
107,,751022
6.464
1,8082,3144,487
11,
1.9955,3%8,8722,974
30.218274
4,950470
2.9562,064
30,503
323115,88422313,312
14.144
8,1805,234
59620.16,30396
3,3643,0625,950
11,3412.648
13,15522,81312.1565,5886,822
10,70893
1.8402452
2.474
21.1122,149
57,8366.493
510
SOURCE: U.S. Department Of Commerce Bureau of the Centres, Census of Population: 1970, General Social and Economic Characteristics," Series PC(1)-C.
19,7492,6542,521
31,7543.258
4.194
7,79015,699
1,084
1,58210,4395,346
0386,2.267
331
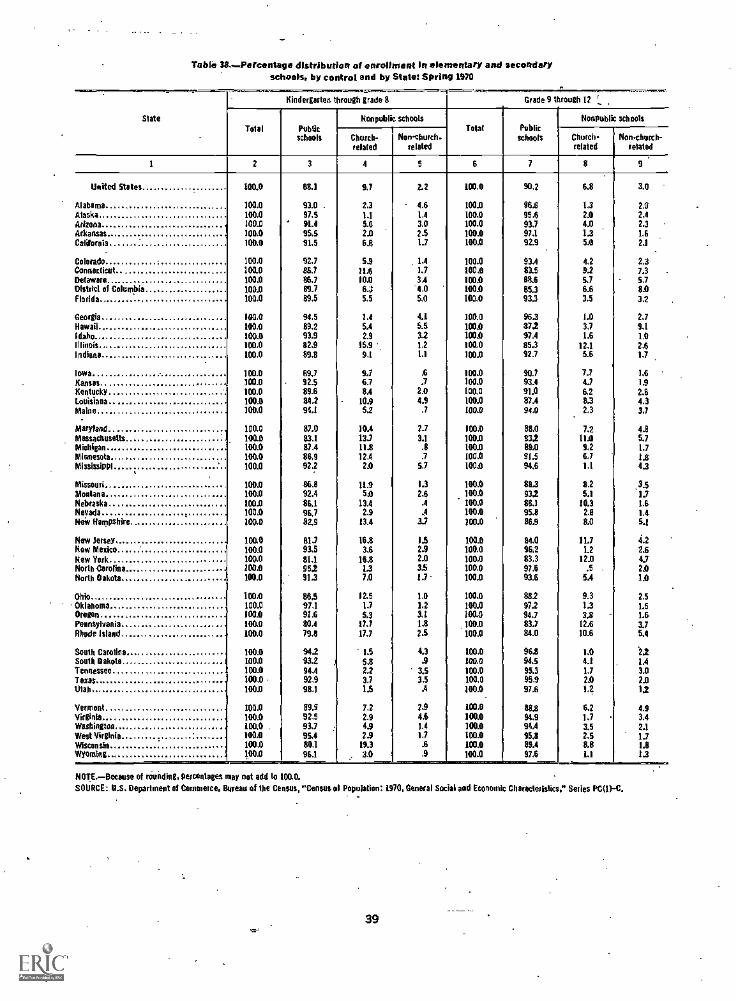
Table 38.--Percentage distribution of enrollment in elementary and secondaryschools. by control and by State: Spring 1970
vsers.
Slate
Kindergarten through grade 8 Grade 9 through 12 r
Total Publicschools
Nonpublic schoolsTotal Public
schools
Nonpublic schools
Church-related
Norchurch-related
Church-related
Non-church-related
1 2 3 4 5 6 7 8 9
United States 100.0 88.1 9.7 2.2 100.0 90.2 6.8 3.0
Alabama 100.0 93.0 . 2.3 4.6 100.0 96.6 1.3 2.0Alaska 100.0 97.5 1.1 1.4 100.0 95.6 2.0 2.4Arizona 100.0 ' 91.4 5.6 3.0 100.0 93.7 4.0 2.3Arkansas 100.0 95.5 2.0 2.5 100.0 97.1 1.3 1.6California 100.0 915 6.8 1.7 100.0 92.9 5.0 2.1
Colorado 100.0 92.7 53 . 1.4 100.0 93,4 4,2 2.3Connecticut 100.0 86.7 11.5 1.7 100.0 83.5 9.2 7.3Delaware 100.0 86.7 10.0 3.4 100.0 88.6 5.7 5.7District of Columbia 100.0 89.7 6.3 "4.0 100.0 85.3 6.6 8.0Florida 100.0 89.5 5.5 5.0 100.0 93.3 3.5 3.2
Georgia 100.0 94.5 1.4 4.1 100.0 96.3 1.0 2.7Hawaii 100.0 89.2 5,4 5.5 100.0 872 3.7 9.1Idaho 100.0 93.9 2.9 32 100.0 97.4 1.6 1.0Illinois 100.0 82.9 15.9 1.2 100.0 85.3 12.1 2.6Indiana 100.0 13.8 9.1 1.1 100.0 92.7 5.6 1.7
Iowa 100.0 89.7 9.7 .6 100.0 90.7 7.7 1.6Kansas 100.0 92.5 6.7 .7 100.0 93.4 4.7 13Kentucky 100.0 89.6 8.4 2.0 100.0 91.0 6.2 2.8Louisiana 100.0 34.2 10.9 49 100.0 87.4 8.3 4.3Maine 100.0 944 52 .7 100.0 94.0 2.3 3,7
Maryland 100.0 87.0 10.4 2.7 100.0 88.0 7.2 4.8Massachusetts 100.0 83.1 117 3.1 100.0 832 11.0 5.7Michigan 100.0 87.4 11.8 .8 100.0 89.0 9.2 1.7Minnesota 100.0 86.9 12.4 .7 100.0 91.5 6.7 1.8htississippl 100.0 92.2 2.0 5.7 100.0 916 1.1 4.3
Missouri 100.0 86.8 11.9 1.3 100.0 88.3 8.2Madan. 100.0 92.4 5.0 2.6 100.0 932 5.1
.331.7
Nebraska 100.0 86.1 13.4 .4 100.0 88.1 10.3 1.6Nevada : 100.0 96.7 2.9 .4 100.0 95.8 2.8 1,4Neiv tiampshire 100.0 82.9 13.4 3.7 100.0 86.9 8.0 5.1
New Jersey, 100.0 81.7 16.8 1.5 100.0 84.0 11.7 4.2New Mexico 100.0 93.5 3.6 2.9 100.0 96.2 1.2 2.6New YorkNorth Carolina
100.0100.0
81.1552
16.81.3
2.03.s
100,0100.0
83.397.6
12.0.5
4.72.0
North Mots 100.0 91.3 7.0 17 100.0 93.6 5.4 1.0
Ohio 100.0 865 12.5 1.0 100.0 88.2 9.3 2.5Oklahoma 100.0 97.1 1.7 1,2 100.0 97.2 1.3 1.5Oregon 100.0 916 5.3 3.1 100.0 94.7 3.8 1.6Pennsylvania 100.0 80.4 17.7 1.8 83.7 12.6 3.7Rhode Island 100.0 79.8 17.7 2.5
.100.0100.0 84.0 10.6 5.4
South Carolina 100.0 942 15 4.3 100.0 96.8 10 2,2South Dakota 100.0 932 5.8 .9 100.0 94.5 4.1 14Tennessee 100.0 94,4 2.2 '3.5 100.0 95.3 1.7 3.0Texas 100.0 92.9 3.7 3.5 100.0 95.9 2.0 2.0Utah 100.0 98.1 15 .4 100.0 97.6 14 1,2
Vermont 100.0 89.9 7.2 2.9 KOS 88.8 6.2 4,9Virginia 100.0 92.5 2.9 4.6 100.0 94.9 1.7 3.4Wukingtoa 100.0 . 93.7 4.9 1.4 100.0 94.4 3.5 2.1West VirginiaWisconsinWyoming
100.0100,0100.0
95.480.196.1
2.919.33.0
1.7.6.9
100.01033100.0
95.889.497.6
2.58.81.1
1.7It1.3
NOT.E=Becaute of rMriklill, percentages may not add to 00.0.
SOURCE: U.S. Department 41 Commerce. Bureau of the Census, "Census 41 Population: 1970, General Socialand Economic Characteristics," Series PC01-C..
39
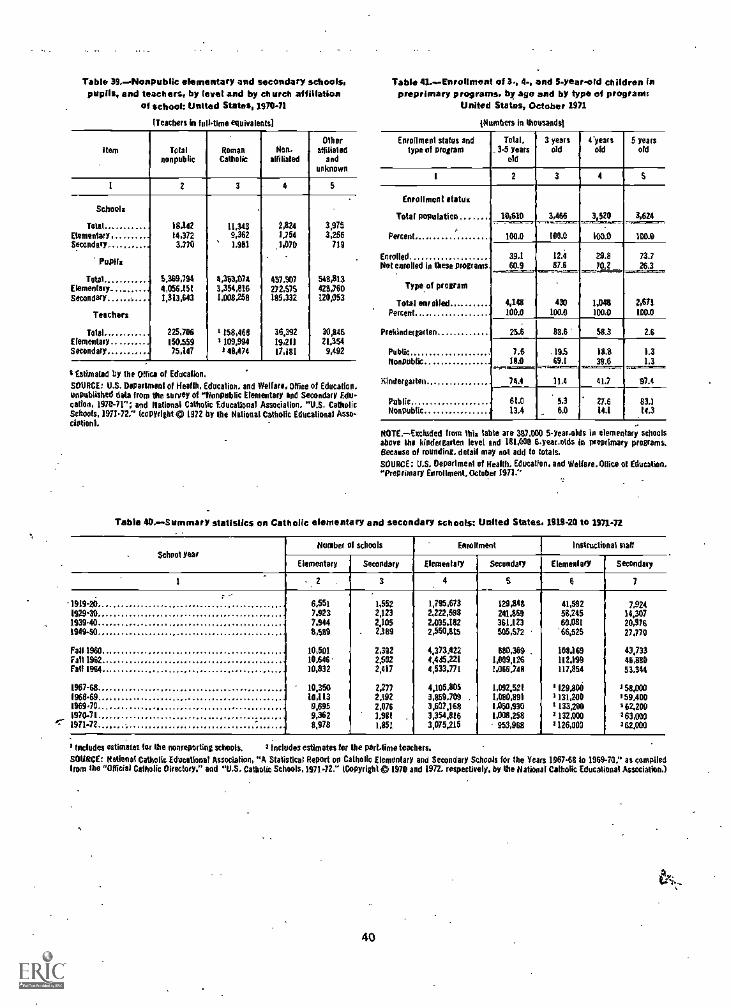
Table 39.- Nonpublic elementary and secondary schools,pupils, and teachers, by (oval and by church affiliation
of school: United States, 1970-71
(Teachers in full -time equivalents]
Item Totalnonpublic
RomanCatholic
Nenaffiliated
Otheraffiliated
andunknown
I 2 3 4 5
Schools . -
Total 18.112 11.343 2,824 3,975Elementary t4,372 9,362 1.754 3,256Secondary 3.730 ' 1.9BI )1,070 719
Pupils
Total 5,369,794 4.393,071 451.907 548,813Elementary 4,056.151 3,354,816 272.676 428,760Secondary . 1,313.643 1,008.258 185.332 120,063
Teachers
Total 225,786 3158,460 36,392 10,1146
Elementary 150.559 1109,994 19,211 21.354Secondary 75,147 148,474 17,18I 9,492
t Estimated by the Office of Education.
SOURCE: U.S. Dspartmsnt of Health, Education. and Welfare, Office of Education.unpublished data from the survey of "Nonpublic Elementary and Secondary Edu-cation, 1970-71 "; and National Catholic Educational Association. 'U.S. CatholicSchools, 1971-727 (copyright ®1972 by the National Catholic Educational Asso-ciation),
Table 41..- Enrollment of 3, 4-, and 5-year-old children inpreprimary programs, by age and by type of program:
United States, October 1971
plumbers in thousands'
Enrollment status andtype of program
Total,_ 3-5 years
old
3 yearsold
eyearsold
5 yearsold
1 2 3 4 S
Enrollment status
Total population , 10,510 3,466 3,520 3,624
Percent 100.0 100.0 10.0 100.0
Enrolled 39.1 12.0 29.8 73.7Not enrolled in these programs, 87.6 70.2 26.3
...60.9...:-..-.-r ... _ ot se,..../1.0. m.........-,,
Type of program
Total ear oiled... . 4,148 430 1,048 2,671Percent 100,0 100.0 100.0 100.0
Preldndergarten 23.6 88.6 58.3 2.6
Public 7.6 .195 38.8 1.3Nonpublic 18.0.--,=..., 69.1.-,,,,..., 39.6.................=-....1.3
Kindergarten 74.4 11.4 41.7 97.4
Public 61.0 5.3 27.6 83,1Nonpublic 13.4 6.0 14.1 14.3
NOTE.-Excluded from this table are 387.000 5-yeaolds In elementary schoolsabove the kindergarten level and 181,000 6 -year -olds in preprimary programs.Because of rounding, detail may not add to totals.
SOURCE: U.S. Department of Health. Education, and Welfare. Office of Education."Preprimary Enrollment. October 1971:'
Table 45.«summary statistics on Catholic elementary and secondary schools: United States, 1919-20 to 1971-72
School yearNumber el schools Enrollment Instructional wall
Elementary Secondary Elementary Secondary ElemenlarY Secondary
1 . 2 3 4 5 6 7
1919 -20 6,551 1,552 1,795,673 129,8411 41,592 7.9241929-39 7,923 2,123 2,222,598 241,869 58,245 14,307193940 7,944 2,105 2,035,182 361.123 60,081 20,976194940 8,589 2,189 2,560,815 505,572 '66,525 27,770
Fall 1960 10,501 2,392 4,373.422 680,369 108,169 43,733Fall 1962 10.646 2,502 4,445.221 1.009,126 112,199 49,880Fall 1964 10,832 2,417 4,533,771 1,066.748 117,854 53,344
1967-68 10,350 2,277 4,105,805 1,092,521 1 129,800 3 58,0001968-69 10,113 2.192 3,859.709 . 1,080,891 3131,200 3 59,40019E9-70 . 0,695 2,076 3,667,168 1,050,930 i 133.200 '62.2001970-711971.72..,,
9,3628,978
1,901 .
1,8513,354,8163,075,215
1,008,258953,968
3132,0003126,000
363,000362,000
Includes estimates for the nonreporting schools. 3 includes estimates for the pad-lime teachers,
SOURCE: National Catholic Educational Association, "A Statistical Report on Catholic Elementary and Secondary Schools for the Years 196748 to 1969-70." as compiledfrom the "Official Catholic Directory," sod "U.S. Catholic schools, 1471-72." (Copyright* 1970 and [972. respectively, by the National Catholic Educational Association.)
40
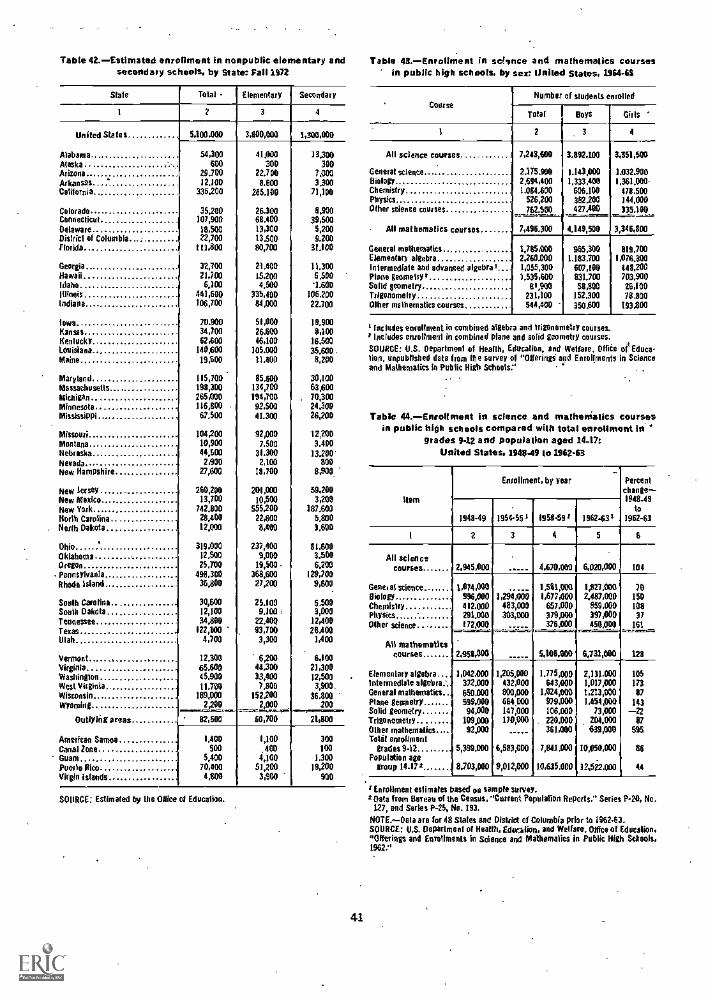
Table Q.-Estimated enrollment in nonpublic elementary and Table 43.-Enroliment in science and mathematics coursessecondary schools, by state: Fall 1972
Stale Total - Elementary Secondary
1 2 3 4
United Ste le s 5,100.000 3,800,001 1,300,009
Alabama 54,300 41.000 13,300Alaska 600 300 300Arizona 29,700 22.700 7.003Arkansas 12.100 8.000 3,300California 335,200 245.100 71,100
Colorado 35.200 26.300 8.900Connecticut 107,900 68,400 39,500Delaware 18,500 13,300 5,200District of Columbia 22,700 13,500 9.200Florida 111,800 80,700 31200
Georgia 32,700 21,400 11,300Hawaii 21,700 15,200 6,500Idaho 6,100 4.500 1.600Illinois 441,600 335,400 106,200
Indiana 106,700 84,000 22.700
Iowa 70.900 51,000 19.900Kansas 34,700 26,600 8,100Kenlucky 62,600 46,100 16,500Louisiana 140,600 105.000 35.600.Maine 19,500 11.400 8,200
Maryland 115,700 85,600 30,100Massachusetts 193,300 134,700 63,600Michigan 265,000 194,700 . 70,300Minnesota 116,800 92,500 24,300Mississippi 67.500 41.300 26,200
Missouri 104,200 92,000 12,200Montana 10,900 7.500 3,400Nebraska 44,500 31.300 13.200Nevada 2,900 2,100 800New Hampshire 27,600 18,700 8,909
New lerSeY 260,200 201,000 59,200New Mexico 13,700 10,500 3,200New York 742.800 555,200 187,600Nor% Carolina 28,400 22,600 5.800derth Dakota 12,000 8,400 3,600
Ohio . 319,000 237,400 81,600Oklahoma 12.500 9,000 3,500Oregon 25,100 19,500 6.200Pennsylvania 498,300 368,600 129,700Rhode Island 36,800 27,200 9,600
Soolh Carolina 30,600 25.100 5.500Sou* Dakota 12,100 9.100: 3,000reonessee 34,800 22,100 12,400texas r 122,100 93,700 28.400Illah 4,700 3,300 1,400
Vermont 12.300 6,200 6,100Virginia 65.600 44.300 21,300Washington 45,900 33,400 12,500West Virginia," , 11,700 7.800 3,900-Wisconsin 189,000 152,200 36,800Wyoming 2.200 2.030 200
Outlying areas .-,-es-....ree.-
60,700---ommagaz
21,100
=s.c.isLmIr-82,500
American Samoa 1,400 1,100 300Canal Zone SOO .400 100Guam 5,400 4,100 1,300Puerto Rico 1 70,400 51,200 19,200Virgin Islands 4,80e 3,900 900
SOURCE: Estimated by the Office of Educelion.
41
in public high schools, by sex: United States, 1964-65
CourseNumber of students enrolled
Total Boys Girls
1 2 4
All science courses ,,,,, 7,243,600 3.592,100 3,351,500
General science 2.175.900 2.143,000 1.032.900Biology 2,614,400 1,333,400 1,361.000Chemistry, 1.084.600 606.100 478.500Physics 526,200 382,200 144,000Other science courses 762.500 427,400 335.100
All mathematics courses 7,496.300 4.149,500 3,346,800
General mathematics 1,785,000 965.300 819,700Ekmentan algebra 2,260.000 1,183,700 1,076.300Intermediate and advanced algebra', 1,055,300 607,100 448,200Plane geometry? 1.535,600 831.700 703,900Solid geometry 81,900 58,800 25,000Trigonometry 231,100 152,300 78.800Other maihernatics courses 544,400 350.600 193,300
1 Includes enrollment in combined algeb a and trigonometry courses.2 Includes enrollment in combined plane and solid geometry courses.
SOURCE: U.S. Oepartmen1 of Health, Educatioa, and Welfare. Mee d Educa.unpublished data from the survey of "Offerings and Enrollments in Science
and Mathematics In Public High SchoeSs."
Table 44.-Enrollment in science and matheriatics coursesin public high schools compared with total enrollment in'
grades 942 and population aged 14471United States, 1948-49 to 1962.63
Stem
Enrollment, by year Percentchange-1948-49
to1962-631948-49 1954.551 1958-591 1962431
2 3 4 5 6
All sciencecourses 2,945,000 4,670,000 6,020.000 104
Gantlet science-- . 1,074,000 1.581;003 027.000 70Biology 996,000 1,294.600 1.677,000 2.487,000 150Chemistry 412,000 483,000 657.000 859,000 108Physics 291.000 303,000 379,000 397,000 37Other science.. 172000 376.000 450,000 161
.7r-rans
ASS mathematicscourses 2,958,000 5,101,000 6,731,000 128
Elemen tor y algebra . 1,042,000 1,205,000 1.775,000 2,131,000 105Intermediate algebra:. 372.000 432,0E0 643,000 1,017,000 173General mathematics.. 650,000 800,000 1,024,000 1,213,000 87Plane geometry 519,000 664,000 979,000 1,454,000 143Solid geometry 94,000 147,000 106.000 73,000 -22Trigonometry 109,000 170,000 220,000 , 204,000 87Other mathematics._ 92,000 361,000 639,000 595Toler enrollment
grades 9-12... ,,,,, 5,399.000 6,583,000 7,841.000 10,050,000 86Population age
group 14.172 8,703,000 9,012,000 10,635,000 12,522.000 44
1 Enrollment eslimales based ea sample survey.2 Oita from Bureau of the Census, "Current Population Reports," Series P28, No.
127, and Series P-25, No. 193.
NOTE. -Gala are for 48 Slates end District of Columbia prior to 196243.SOURCE: U.S. Department of Health, Education. and Welfare. Office of Education,"Offerings and Enrollments in Science and Mathemalies in Public High Schools.1962."
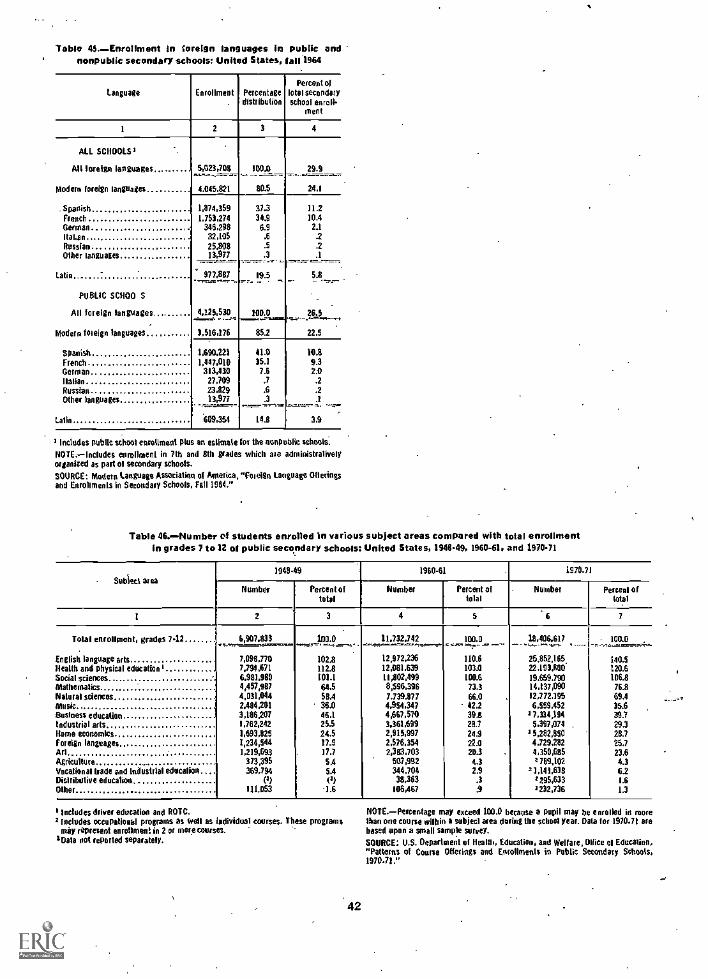
/able 45.- Enrollment in foreign languages In public andnonpublic secondary schools: United States, 1211.1964
Language Enrollment Percentagedistribution
Percent oflotal secondaryschool won.
Inert
1 2 3 4
ALL SCHOOLS 3
All foreign languages 5423,701 100.0 29.9
Modern foreign languages 4.045.821 80.5 24.1
. Spanish 1,874,359 32.3 112French 1.753,274 34.9 10.4German 346,298 6.9 2.1
Hakim 32,105 .6 2Russian 25,808 .5 2Other languages 13,977 .3 .1
.......,--..,-.'..t. ,,,...., L. .-......W..1.
Latin 477,867 19.5 5.8
PUBLIC SCHOO S
All foreign languages 4,125,530 200.0 26.5
Modern foreign languages 3,516,276 852 22.5
Spanish 1,690,221 41.0 90.8
French 1,447.010 35.1 9.3German 313,430 7.6 2.0Italian 27,709 .7 .2Russian 23,829 .6 .2Other languages 13,977 3 1
Latin 609,354 14.8 3,9
3 Includes public school enrollment plus an estimate los the nonpublic schools:
NOTE.-Includes enrollment in 7th and 8th grades which are administralivelyorganised as part of secondary schools.
SOURCE: Modem Language Association di America, " Foreign Language Offeringsand Enrollments in Secondary Schools, Fail 1964."
Table 46.-Number of students enrolled in various subject areas compared with total enrollmentin grades 7 to 12 oil public secondary schools: United States, 1948.49, 1960-61, and 1970.71
Settled area1948.49 196041 1970-71
Number Percent oftotal
Number Percent oftolal
Number Pesten' oftotal
I 2 3 4 5 6 7
Total enrollment, grades 7.12 6,907,833 100.0 11,732,742 100,0 100.0 .
English language arts
-,....reet =--:
102.8
-.-..4' . ,,-......et,z7..-12,972.236
2 1,1, ..., -110.6
.18,406,617-.- - ..-......2,,,,
25.852,165,
I..., -r.-.4...msr.....,s
140.5
:.,.._ ._.,=.........-._
7,098,770Health and physical education 1 7,794,671 112,8 12,081.639 103.0 22.191,100 120.6Social sciences 6,981,980 101.1 11,802,499 100.6 19.659290 106,8Mathemalics 4,457,987 64,5 8,596,396 73.3 14337,090 76.8Natural sciences 4,031,044 58,4 7.739.877 66.0 12,772.195 69.4Music 2,484,261 36.0 4,954,347 42.2 6,559,452 35.6Business education 3,184.207 46.1 4,667,570 39.1 27,314,194 SIindustrial arts 1,762,242 25.5 3,361,699 28.7 5,397,074 29.3Home economics 1,693,825 24.5 2,915,997 24.9 25,282,850 28.7Foreign languagesArl
1,234,5441,219,693
17.917.7
2,576,3542,383,703
22.020.3
4,729,2824,350,685
25.723.6
Agriculture 373,395 SA 507,992 4.3 s 769,102 4.3Vocational bade and Industrial education 369,794 5.4 344.704 2.9 =1,14 1,638 6.2Dislributive education (3) V) 38,363 .3 1295,633 1.6Other 111,053 1.6 106,467 .9 2232,736 1.3
Includes driver education and ROTC.2 includes occupational programs as well as iadividual courses. These programs
may represent enrollment in 2 or MOO courses.sOala not reported separately.
*42
NOTE.-Percentage may exceed 100.0 because a pupil may be enrolled in morethan one course milbin a MOM area during the school year. Data for 1920.71 arebased upon a small sample survey.
SOURCE: U.S. Department of Healiii, Education, and Welfare, Olfice of Education."Patterns of Course Offerings and Enrollments in Public Secondary Schools,1970-71."
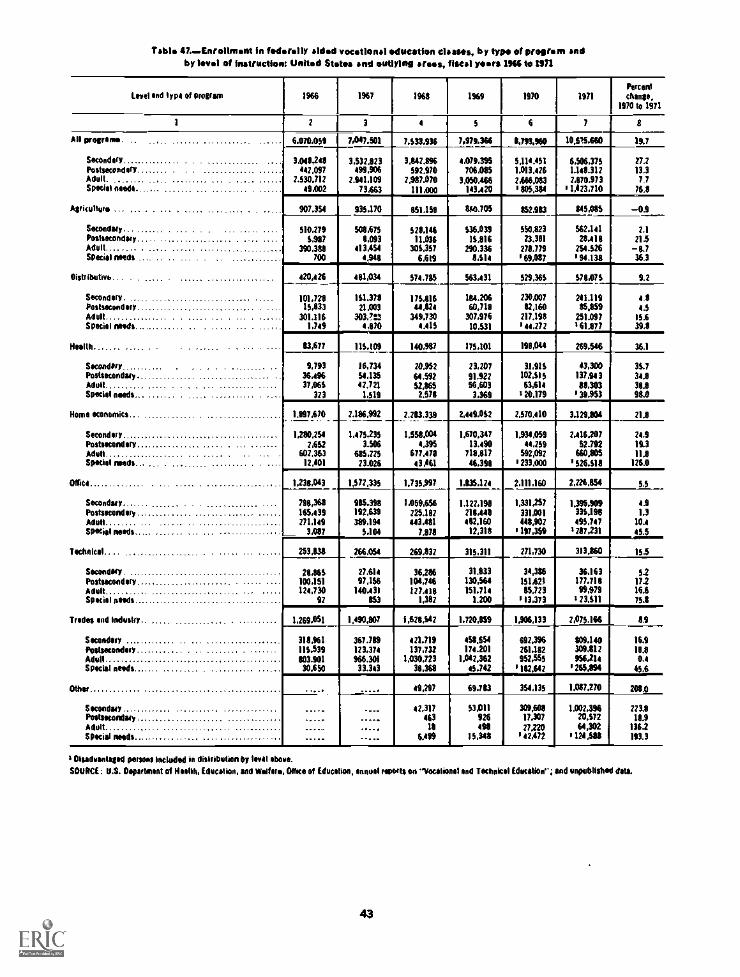
Table 47.- Enrollment in federally sided vocational education classes, by type of programs andby level of instruction: United States and outlying areas, fiscal years 1966 40 1171
level and typo of program
I
1966 1967
1
1961 1969 1970 1971
Percentchange.
1970 to 1971
1 2 3 a 5 6 7 8
All pr *gums. .. ... 6.076.059 7,047,501 7.533.936 7,979,366 MK* 102T5,660 19.7
Secondary 3.00,248 3.532.123 3,642,196 1.079.395 5,114.451 6.506,375 27.2Postsecondary 412,097 199,906 592,970 706.085 1.013,426 1.111.312 13.3Adult. .. 2.530.712 2.911.109 2,987.070 3.050.466 2.646.013 2,170.973 7.7Swint needs 19.002 23.463 111.000 143.420 1803,384 11,423.710 76.3
Agriculture , . . , .............. , . ..... 907.354 935.170 631.151 8,44.705 152.933 $45,055 -0.9
Secondary... . ... . . , . ..... . 510.279 506.675 528.116 536.039 550.823 562,111 2.1PosIsmondup ... ................ .. - . 5.987 1,093 11.036 15.416 23,381 %Al 5 215Adult 390.388 113.451 305,357 290.336 271.779 254.526 -1.7Special needs .... . 7110 4.941 CM 1,511 169.057 194.131 36.3
Distributivo.. . 120,426 411.034 574.20 563.431 529,365 578,075 9.2
Secondary, 101.728 151.378 175.116 164.206 230,007 211.114 4.1Postseceedery 15,433 21.003 44,324 60.711 32,160 15.050 4.5Adult 301.116 303,713 349.730 307,976 217,191 251.097 15.6Special mends 1,749 4,170 4,415 10.531 111.272 461,877 391
Reelth 13,677 115.109 140,147 175.101 191,041 269.516 36.1
Secondary 9.793 16,734 20,952 23,207 31,915 43.300 35.7Postsecondary 36,4% 51,135 64.592 91.922 102.515 137.913 31,11
Adult 37,065 42,721 52,865 56,603 63.614 11,303 31.8Specie, needs 323 1,519 2,571. 3.369 120,179 139.953 9115
Home economics 7,997,670. 2.186,992 2.213.339 2,119,052 2,570,410 3,129204 21.8
Secondary 1.280,251 1,475,235 1.654.004 1.670,347 1.934,059 2,416.01 21.9
Postsecondary 2,652 3.506 1,395 13.190 11,259 52.792 19.3Adult 602,363 685,225 677,178 718,117 592,092 660,805 114Specie, needs_ . .................. . 12,601 23.026 43.661 16,391 1233,000 1 526.518 126.0
010c1 1,236.043 1,572,335 1.735.997 1.036.124 2.111.160 2.226,854 5,5
Secondary.-. 791,368 965.391 1.058.656 1.122,198 1,331,267 1,395,909 4.9Postsecondary . ............ . .... .... ............. 165,139 192,639 225.182 216.441 331.001 335.198 1.3Adult 271.149 319.194 113,481 1112.160 115.902 495,747 10.4Susan, needs 3,017 5.104 7.476 12,318 1197.359 4267,231 45.5
technical. ... ...., .. ............ . . .. ...... 253,1138 266.054 249.832 315.311 271.730 313,860 15.3
Secondary. 21,865 27.614 36.286 31,833 34.3116 36,163 52Postsecondary 100,151 97,156 101.716 130,564 151,421 177,716 172Adult 121.730 140.431 127.411 151,711 65,723 99,979 16.6Spacial needs 92 353 1.312 1.200 113,373 123,511 752
trades and industry. 1.261,651 1,890,807 1.523,542 1,720,159 1,906,133 2,075.166 8.91
Secondary 318,961 367.719 421,719 101,551 692.396 109,110 16.9
Postsecondary 115.539 123,371 137.732 174.201 261,182 309.612 18.1*dull 103.901 966.301 1,030223 1,042,362 952,555 956214 0.1Special needs 30.650 33.343 31,368 15,742 11112.642 1265,694 45.6
Other 49,297 69.733 351.135 1.087.270 2015
Secondary ..... .... 12,317 53,011 309.3011 1.002,396 223.1Postsecondary. 163 926 17,307 20,572 11.9
Adult 18 498 27220 64.302 1362Special needs 6,499 15,343 112,412 1124,588 113.3
4 bisadvantaged persona included in distribution by lev61 'bore.
SOURCE: 11.3. Department of Hong, Education, and Welfare, Office of Education, annual reports on "Vesilione1 end Technics, Education"; and unpublished data.
43

Table U.-Enrollment in federally aided vocational classes, by type of program:United States and outlying areas, 1980 to 1971
Fiscal yearDistributiveoccupations
4
Type
Homeeconomics
5
of program
Trades andindustry
6
Healthoccupations
7
Technicaleducaticn
Officeoccupations
.
Otheiprograms
10
Total Agriculture
2 3
1920 265,058 31,301 48.438 184,819
. .
1930 981.882 188.311 1/4,96/ 618,604
1940 2.290,741 584.133 129,433 818.766 758.409
1942 2.624,786 605.099 215,949 954.041 850,5971944 2,001,153 469,959 131,509 806.605 543,080
1546 2.221.663 510.331 1/4,672 911.816 630,8441948 2,836,121 640,791 292,936 1,139.766 762,6282950.. 3,364.613 7611,975 364,6/0 1,430.366 104.6021952... 3,155,988 746,402 234,984 1,391,389 793,213
1954 3,164,851 737.502 220,619 1,380,14/ 826,583
1956 3,413,159 785,599 257,025 1,486,816 883.7191958 3,629,339 /75,842 282,558 1,559.822 483,644 27,4231960 3,768,149 796,237 303,784 1.588,109 938,490 40,250 101,2791962 4.072,677 822.664 321.065 1,725.650 1,005,363 48,985 148,9201964 4,566,390 860405 334,126 2.022.133 1,069.274 59,006 221,241
1966 6,070.069 907,354 420.426 1,897,670 1,264,051 83,677 253,838 1,238,0431968 7.533,936 851.158 574,785 2,283,3313 1,628,542 140,987 389.832 1,735,99/ 49,2971970 8.793,960 852,983 529,365 2,5/0,410 1,906,133 198,044 271,730 2.111,160 354,7351971,. 10.525.660 845,085 5/8,075 3.129.814 2.075,166 269,546 313,860 2,226.854 1.087,270
SOURCE: U.S. Department of Health, Education, and Welfare. OHice of Education, annual revolts on "Vocational and Technical Education"; and unpublished data.
Table 49.-Teachers of federally aided vocational educationclasses, by type of program: United States and
outlying areas, fiscal years 1966 to 1972
Table 50,--Estimated number of classroom teachers innonpublic secondary schools, by teaching Welch
United States, fall 1972
Type 01 program 1966 1970 1971 Classroom teachers
1
Teaching held2 3 4 Number I Percent
Total
AgricultureDistributiveHealthHome economiesOfficeTechnicalTrades and industryOlher or unclassified
Total
AgricultureOistributive .HealthHome economicsOfficeTechnicalTrades and industryOther or unclassified
Number of teachers 2 3
124,042 190,364 211,550 Ali fields 71,000 100,0
11,7657.6363452
23,94323,1118,399
38,7364,800
_
Perceulage
12,42010,45810.48334,22545.08114,24156,720
-6.736
distribution
12,910 \ English11.974 Social studies
12,613Religion
38,105 Mathematics
49,36314,750 Foreign languages
59.065Health and physical education
12,770Science
!Business education
Music
11.70010,1009,1008.100
7$07.5006.0004,000
3,5001,100
800
500400
16.514.322.811.4
11410.58.S5.7
5.51.51.1.7.5
100.0 100.0Art
100.0 Hole economics
9.56.22.9
20.918.66,11
31.23.4
6.5S.S
5.518.023.77.5
29.83.5
Industrial arts and vocational education6,1 All other5.76.0
18.0SOURCE: Estimated by the Office of Education.
23.37.0
27.96.0
SOURCE: U.S. Department el Health, Education, and Welfare, Office of Educe-lion. annual reports on "Vocalional and Technical Education": and unpublisheddata.
44
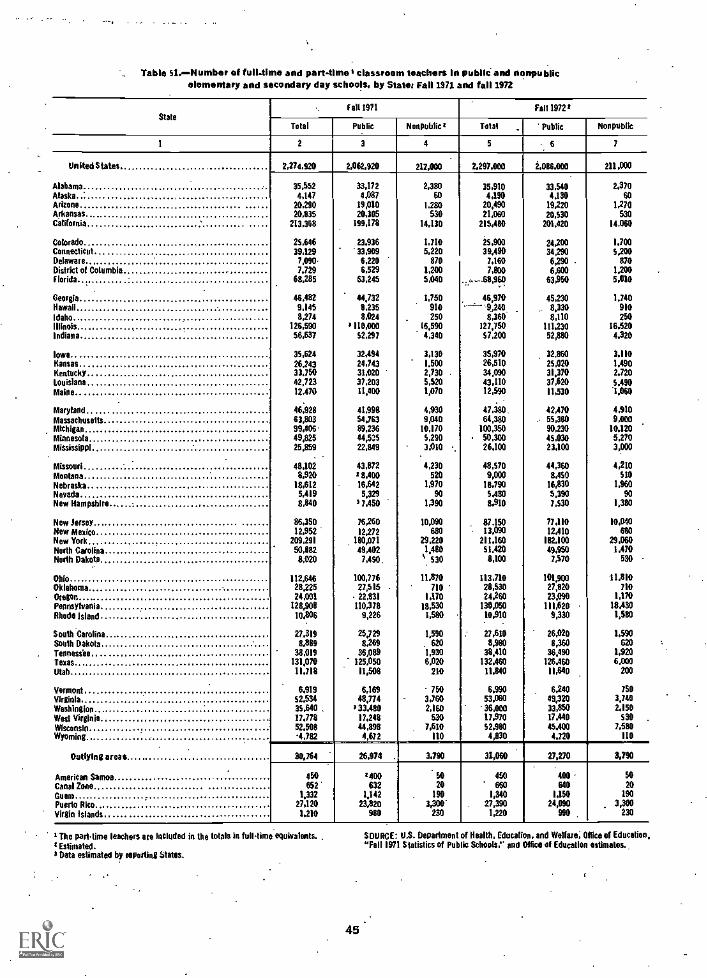
_
Table 51.- Number of full-time and part-tIme 1 classroom teachers In public end nonpublicelementary and secondary day schools. by State: Fall 1971 and fall 1972
StateFall 1971 Fall 19721
Total Public Nonpublic= Total Public Nonpublic
1 2 3 4 5 7
United States. 2,274,920 2,062,920 212.000 2,297,000 4088,000 211,000
Alabama 35,552 33,172 2,380 35,910 33,540 2,370Alaska 4,147 4,087 60 4,190 4,180 60Arizona 20,290 19,010 1.280 20,490 19,220 1,270Arkansas 20,135 20,305 530 21,060 20,530 530California 213,368 199,178 14,130 215,480 201,420 14,060
Colorado 25,646 23,936 1,710 25,900 24.200 1,700Connecticut 39,129 33,909 3,220 39,490 34,290 5,200Delaware 7,090 6,220 870 7,160 6,290 . 870District of ColumbiaFlorida
7,72968,25
6,52963,245
1,2005,040
7,800..,..:--60,960
6,60063,950
1,2005,010
Georgia 46,482 44,732 1,750 46,970 45,230 1,740Hawaii 9,145 8,235 910 --'---0,240 8,330 910Idaho 8,274 8,024 250 8,360' 8,110 250Illinois 126,590 3 110,000 16,590 127,750 111,230 16,520Indiana 56,637 52,297 4,340 57,200 52,880 4,320
Iowa 35,624 32,494 3,130 35,970 32.660 3,110Kansas 26243 24,743 1,500 26,510 25,020 1.490Kentucky 33,750 31,020 2,730 34,090 31,370 2,720Louisiana 42,723 37,203 5,520 43,110 37,620 5.490Maine 12.470 11,400 1,070 12,590 11,530 1.060
Maryland 46,928 41,998 4,930 47,380- 42,470 4,910Massachuselts 63,803 54,763 9,040 64,380 55,380 9,000Michigan 99,406 89,236 10,170 100,350 90,230 10,120Minnesota 49,825 44,535 5,290 50,300 45,030 5,270Mississippi 25,859 22,849 3,010 26,100 23,100 3,000
Missouri 48,102 43,872 4,230 48,570 44,360 4,210Montana 8,920 '8200 520 9,000 8,430 510Nebraska 18,612 16,642 1,970 18,790
15,3901,960
Nevada 5,419 5,329 90 5,480 90New Hampshire 8,840 3 7,450 1,390 8,910 7,530 1,380
New Jersey 86,350 76,260 10,090 07.150 77,110 10,040New Mexico 12,952 12,272 680 13,890 12,410 680New York 209,291 180,071 29,220 211,160 182,100 29,060North Carolina 50,881 49,402 1,480 51,420
47,3701,470
North Dakota 0,020 7,490 S30 8,100 530
Ohio 112.644 100,776 11.870 113,710 101,900 1,810Oklahoma 28,225 27,515 710 211,530 27,820 710Oregon 24,001 22,1131 1,170 24,260 23,090 1,170Pennsylvania 128,908 110,378 18.530 130,050 111,620 18,430Rhode island 10,806 9,226 1,580 10,910 9,330 1,580
South Carolina 27,319 25,729 1,500 27,610 26,020 1,590South Dakota 8.889 8,269 -620 8,980 8,360 620Tennessbe 38,019 36,089 1,930 38,410 36,490 1,920Texas 131,070 25,050 6,020 132,460 126,460 6,030Utah 11,718 11,508 210 11,840 11,640 200
Vermont 6,919 6,169 750 6,990 6,240 750Virginia 52,534 48,774 3,760 53,060 49,320 3,740Washington 35,640 . 133,480 2,160 36,000 33,850 2,150West VirginiaWisconsin
17,77852,508
17,24844,898 7,630
510 17,97052,980
17,44045,400
5307,580
Wyoming '4,782 4,672 110 4,030 4,720 110
Outlying areas ........ ...... 30.764 26,974 . 3,790 31,060 27,270 3,790
American SamoaCanal Zone
450652'
1400632
so20
450660
400640
5020
Guam. 1,332 1,142 190 1,340 1,150 190
Puerto Rico 27,120 23,820 3,300. . 27,390 24,990 3,300Virgin islands 1,210 980 230 1,220 990 230
I The parltime teachers are included in the totals in full4ime equivalents. .I Estimated.$ Data estimated by reporting States.
45
SOURCE: U.S. Deparlment of Health, Education, and Wellue; Mee of Education,"Fall 1971 Statistics of Public Schools," and Office of Education estimates..

Table S;- instructional staff in public elementary and secondary day schools, by type of position and by Italy: 1969-70
Iln full -time equivalents)
State
I
Totalinstructional
staff
Principalspreludingassisted
"Principals'
ConsultantsClassroom teachers and other 'monasticism personnel'
or supervisorsof instruclion Classroom
teachersLibrarians Guidance
personnel
.
Psychologicalpersonnel
Other non-supervisory
instructionalPersonnel
1 2 3 4 5 6 7 8 9
Uaked States 2,263,492 90,593 31,537 2,023,253 39,790 46,139 5,622 10,506. .
Alabama 35,299 1.278 293 33,728 1') 19 ( t) ---Alaska 3,738 130 39 3,366 61 79 7 6Arizona* 20,173 805 (') 13,518
"Zia---. 1350
Arkansas 21,163 015 72 19.646 56Calibrate* 207,138 3,910 4668 187,113 1,599 4,821 356 1,171
Colorado 26.805 1,341 375 23,622 454 724 48 241Connecticut 35,776 1,475 226 32,451- 388 802 156 278Delaware - 6,390 . 252 96 5,684 133 139 23 63District of Columbia 3,131 332 119 6,920 156 304 38 262Florida 69,563 2,437 814 60,867 2,057 1.770 852 716
Georgia 49,227 1,911 599 44,098 1,701 913 ...... ----.ilawail.. 3,186 371 52 7,332 213 218 ---- -.-Idaho. 9.193 420 233 8,065 137 199 5 84Illinois . 122,412 3,757 1,399 111.913 1,728 2,283 363 439Indiana 54,759 2,424 376 49,896 887 1,051 75 50
lows . 36,406 1,530 96 32,669 892 988 45 -186Kansas 28,961 1,339 320 25,704 771 564 56 157Kentucky 1 33.246 1,330 320 29,532 1.057 646 ---- 361Louishme 40,338 1,424 403 36.476 1,IB7 840 8 ---Wine. 12,473 527 109 11,444 147 237 9 ... _
Maryland 45.398 2,890 543 40,625 . 934 1,075 34 47Massachusetts 59,772 2,759 *3,346 51,002 714 1,776 175Michigan 99,773 . 1,293 1,160 89,049 1,862 2,317 264 273 .
Mianesota 47,799 1,793 593 - 43,286 1,131 996 (2) (9Mississippi 25,339 1,123 230 22,936 604 446 .--. ....Miesoid 41,956 2,102 874 42,799 . 845 1.175 (*) 161
Montane** 9,299 370 (5) . 8,452-ilia
..._ 1 477Nebraska ' 18,220 742 119 18,318 Ili 18 316Nevada 5,547 233 52 4,967 116 151 28 ....New.Nampshlrels 7.808 475 52 6,933 98 200 .... ___-
New Jersey* 80.098 2,635 823 73,018 ..._ .4.... 43,572New Mexico 12,944 579 264 II.564 240 329 7 11
New York** 207,948 6,309 6,213 191,919 3,538 5,370 1,113 2,906Narth.Corolins 54,165 1,964 653 49,017 1,776 750 5 ....North Dakota 3,837 316 91 8,042 173 III 2 102
Ohio 110,092 . 4,603 873 99,639 1,607 2,400 346 544Oklahoma 30,345 2.008 . 228 27,220 352 496 23 illOregon 25.810 1.23I 295 22,532 641 578 19 514Pennaylvonia 117,450 3,345 1,529 106,639 1,859 2,544 405 1,129Rhode Island 9,635 373 - 314 8,550 198 312 28 60
South Carolina 31,110 1,199 239 28,038 1,356 769 41 68South Dakota 9,090 314 48 8,305 153 In 7 115Teams-tea 30,984 . 1.125 ". 433 35,212 1,086 773 55 _... .Texas 128,013 6,059 702 118,844 1,195 1,413 --.Utah 13,219 568 - 146 11,535 333 334 , 34 269
Vermont 6,208 354 66 5,554 124 307 3t
--..Virginia 53,443 2,374 754 47,546 11,413 1,221 135 .....Washington 39,367 1,791 . 1,129 33,546 091 996 138 826West Virginia 18,692 1,324 294 16,652 239 262 . 3 8Wisconsin 55,305 1,999 490 50,079 1,176 1,235 98 223Wyoming 4,901 214 75 4,441 b? 104 (z) .....
Outlying areas: .
Canal 2eae - 621 22 16 554 6 19 4 ....Guam, I.120 55 46 948
.31 40 . ....
1 Dela in each of the categories of neasopersisery instructioae3 staff are shown forthose Stales reporting sech information, In some Stales, classroom teachers mayinclude ether nonsupervlsery personnel (librarians, guidance personnel, etc.)when such personnel hove not bean given separately.
i Data not available. . .
I included with classroom feedlots.1 Oahe pedielly estimated by the Office el Eduiation.g Included with principals.* Includes librarians; guidance, psychological, and audiovisual personnel; and
*UfeonsuPereisorr instructional std.
46
*Data :rem published annual State report.*Includes department heads,*Includes dots for,summer school and adult education programs.
" Data are for lull-time staff only,**Data are for number of fall-time and part-time positions.SOURCE: U.S. Department of Health, Education, and Welfare, Office Of Education.."Statistics of State School Systems, 1969.70"
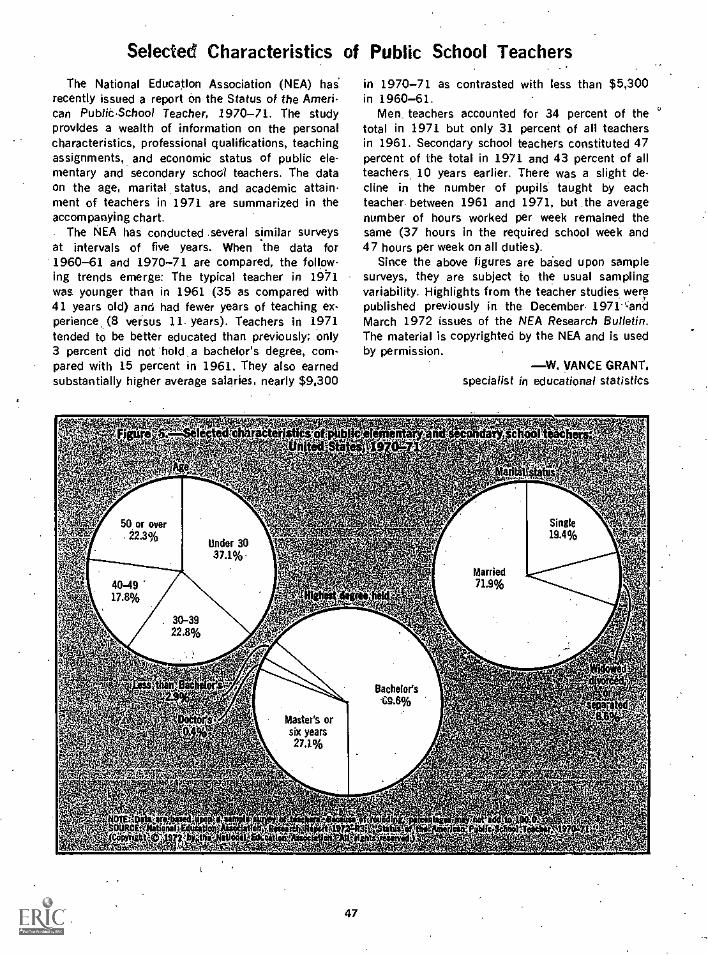
Selected Characteristics
The National Education Association (NEA) hairecently issued a report on the Status of the Ameri.can PubliC.Schoof Teacher, 1970-71. The studyprovides a wealth of information on the personalcharacteristics, professional qualifications, teachingassignments,. and economic status of public ele-mentary and secondary school teachers. The dataon the age, marital status, and academic attain.ment of teachers in 1971 are summarized in theaccompanying chart.
The NEA has conducted several similar surveysat intervals of five years. When the data for
-1960-61 and 1970-71 are compared, the follow-ing trends emerge: The typical teacher in 1971was younger than in 1961 (35 as compared with41 years old) and had fewer years of teaching ex-perience..(8 versus 11- years). Teachers in 1971tended to be better educated than previously; only3 percent did not 'hold.a bachelor's degree, com-pared with 15 percent in 1961. They also earnedsubstantially higher average salaries, nearly $9,300
of Public School Teachers
in 1970-71 as contrasted with less than $5,300in 1960-61.
Men_ teachers accounted for 34 percent of thetotal in 1971 but only 31 percent of all teachersin 1961. Secondary school teachers constituted 47percent of the total in 1971 and 43 percent of allteachers, 10 years earlier. There was a slight de.cline in the number of pupft taught by eachteacher- between 1961 and 1971, but ,the averagenumber of hours worked per week remained thesame (37 hours in the required school week and47 hours per week on all duties).
Since the above figures are based upon samplesurveys, they are subject to the usual samplingvariability. Highlights from the teacher studies werepublished previously in the December- 1971-'-andMarch 1972 issues of the NEA Research Bulletin.The material is copyrighted by the NEA and is usedby permission.
W. VANCE GRANT,specialist in educational statistics
47
:.

Table 53.- Selected characteristics of public school teachers, by level and by sew. United States, 1970-71
Item All teachers Elementary Secondary Men Wiimen
1 2 3 4 .5 6
Highest degree held:No 4.year degree percent 2.9 4.6 1.1 2.1 ' 3.4Bachelor's degree. do 69.6 74.5 64.2 54.8 77.4Master's degree or 6 years do 27.1 20.9 33.9 42.6 194Vector's degree do 0.4 ... 0.8 0.6 0.3
Median years 01 leaching experience 8 8 7 8 8
Length el required school week hours 36.5 36.3 36,8Average number of hours per week devoted to teaching duties 46.9 45.8 48.1 47.6 46,5
Average number el days of classroom teaching in school year 1970-71 18I 181 181 .._ _.-
average annual salary as classroom teacher dollars . S9,261 39.092 59,449 $9,854 P.953Average age years 33 39 36 36 39Sex percentMarital slatus:
100.0 .._ . -.- 342 65.7
Married do __. 27.9 44.0Single do --- 5.2 14.2Widowed, separated.divorced do . --- 1.1 7.5
NOTE.-Data are based on reports received from a sample of 1,533 leachers. Be-cause of rounding, percents may not add to 100 .0.
Table 54.- Public secondary school teachers, by teachingfield and by sex: United States, 197041
Teaching geld in which largestportion of Urn. was spent
Allteachers
Men Women
1 2 3 4
All fields:
NumberPercent
AgricultureArtBusiness educationEnglishForeign language
Health and physical educatioqHome economicsMalhematicsScienceSocial studies
MusicIndustrial arts and vocational educationSpecial educationOther beids
'
931,896100.0
504,217100.0
-
427,679100.0
0.63.75.9
20.44.8
8.35.1
14.410.614.0
3.86,21.11.0
123.13.6
1322.3
7.0
15216.519.6
4.910.90.81.8
,....4.48,8
29.17.3
10411313.43.47.2
2.51 0.6
1.6....
3 Vocational education only.
NOTE.--Percents are based on reports received from a sample of 707 teachers;because of rounding, they may not add to 1004.
SOURCE: NOM' Education Association, Research Division, Research Report1972-R3, "Status of the American Public-School Teacher. 1970-71"; and ResearchRodin 1971R13, "Estimates of School Statistics, 1971-72." (Copyright e) 1972and 1971, respectively, by the National Educatio4 Association. Att rights reserved.)
48
SOURCE: National Edocalion Association, Research Division. Research Report1972.83, "Status of the American Public-School Teac'er, 1970-71." (Copyright ei1972 by the National Education Association. AU rights reserved.)
Table 55.-Average annual salary of instructional staff in publicelementary and secondary day schools, and average
annual earnings of full-time employees in all industries,in unadjusted dollars and adjusted dollars:
United States, 1129-30 to 1971.72
School year
Unadjusted dollars Adjusted dollars (1971-72- purchasing power) 3
Salary permember of
inslroctionalstaff
Earnings perfull-lime ern-Ployee work-MI for wages
or salary r
Salary permember ofiostruclionar
staff
Earnings perfull-time em-ployee work-ing for wages
or salary:
2 3 4 5
1929-30. 31,420 31,386 $3.414 13,3321931-32.. .... 1.417 1,198 4,045 3,4201933.34........ 1,227 1,070 3,812 3,3241935-36 1,283 1,160 3,844 3,475193738.... . 1,3?4 1,244 3,951 3,577
193940 1,441 1,282 4.242 3,774194142 1,507 1,576 3,980 4,1631943.44 1.728 2,030 4,084 4,798194546 ..... 1,995 2,272 4,503 5,1281947.48 2,639 2,692 4,658 4,752
1949-50 . 3,010 2.931/ 5,230 5,0911951-52 3,450 3,322 5,399 5,1991953-54 3,825 . 3,623 5,850 5,5491955.56- 4,156 3,942 6,361 6,0331957.58 4,702 4,276 6,769 6,155
1959.60 5,174 4.632 7,246 64871961.62 5,700 4,928 7,800 6,7431963-64 6,240 5,373 3,320 7,1641965.66 6,935 5,838 8,936 7,5221967.68 7,885 6,444 9,537 7,794
3969.70 8,840 7,334 9,630 7,9901971.72r 10,100 8,300 10,100 8,300
A Based on the Consumer-Price In es, prePired by the Bureau 01 Labor Statistics,U.S. Department of Caber.
2 Calendar-year data from the U.S. Department of Commerce have been convenedto a school-year basis by averaging the 2 appropriate calendar years In each case.
3 Estimated.
SOURCES: U.S. Department of Health. Education, end Welfere, Office of Education,"Statistics of State School Systems"; and "Fall Statistics et Public Schools."U.S. Department of Commerce. Bureau of- Economic Analysis, 'Survey of CurrentBusiness," Ply issues; "US. Income and Owner: and "National income."1954 edition.
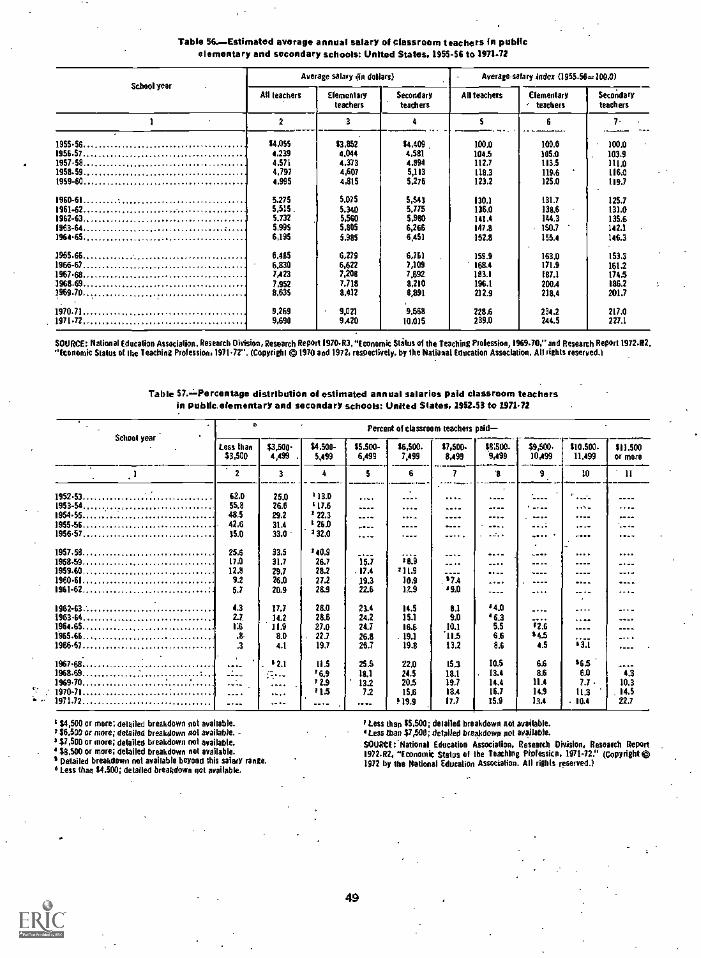
Table 56.-Estimated average annual salary of classroom teachers in publicelementary and secondary schools: United States, 1955-56 to 197142
School yearAve age salary (In dollars) Average-salary index (1955-56.100.0)
MI teachers Elementaryteachers
Secondaryteachers
All teachers Elementary.. teachers
Secondaryteachers
1 2 3 4 5 6 7
1955.56 54,055 53,852 54,409
__-...... .
100.0
. ____.100.0
.._100.0
....
1956.57 4,239 1,044 4,581 104.5 105.0 103.91957-58 4,571 4,373 4,894 112.7 113.5 111.01958.59 4,797 4,607 5,113 1183 119.6 196.01959-60 4,995 4,815 5,276 123.2 125.0 119.7
1960-61 5,275 5.075 5,543 130.1 131.7 125.71961-62 5,515- 5.340 5,775 136.0 138.6 131.01962-63 5.732 5,560 5,980 141.4 144.3 135.61963-64 5995 5,805 6,266 147.8 - 150.7 142.11964.65 6,195 5,985 6,451 152.8 155.4 146.3
1985-65 6,485 6,279 6,761 159.9 163.0 153,31966-67 6.830 6,622 7,109 168.4 171.9 161.21967.68 7,423 7,208 7,692 183.1 187.1 174.51968-69 7.952 7.718 8,210 196.1 200.4 136.27969.70 8,635 8,112 8,891 212.9 218.4 201.7
. .
1970-71 9,269 9.021 9,568 228.6 234.2 217.01971.72 9,690 9,420 10,015 239.0 244.5 227.1
SOURCE: National Educalioe Association, Research Division, Research Report 1970-R3."Economic Status of the Teaching Prolession, 196940," and Research Report 1972.82."Economic Status of the Teaching Profession, 1971-72". (Copyright CD 1970 and 1972, respectively. by the Natianal Education Association. All rights reserved.1
Table 57.-= Percentage distribution of estimated annual salaries paid classroom teachersin public.elementary and secondary schools: United States, 1952-53 to 1971.72
School yearPercent of classroo no teachers paid-
Less than43,500
$3,5004,499 .
$4,500-5,499
55,500-6,499
56,500-7,499
57,501)8,499
58;500-9,499 10,499
510,500-11,499
511,500Or more
,1 2 3 4 6 7 '8 9 10 11
1952.53 62.0 25.0 113.01953-54 55.8 26.6 17.61954.55 48.5 29.2 1 22,31955-56 42.6 31.4 126.01956-57 35.0 33.0 1 32.0
1957-58 25.6 33.5 140.91958-59 17.0 31.7 26.7 15.7 -1959-60 12.8 29.7 28.2 . 17.4 1 1 1.9
1960.61 9.2 26.0 27.2 19.3 10.91961-62 5./ 20.9 28.9 22.6 1?..9 890
1962-63 1.3 17.1 28.0 23.4 14.5 44.01963-64 2.7 11.2 28.6 24.2 15.1 9.0 16.31964.651965-66 .8-
11.98.0
27.0. 22.7
24.726,8
16.6. 19.1
10.111.5
5.566 54.5
1966.67 4.1 19.7 26.7 19.8 13.2 4.5
1967-63. 2.1 113 25.5 22.0 15.3 10.5 16.51968-69 /6.9 18.1 21.5 18.1 13.4 86 6.0 4.31%9-70 /2.9 13.2 20.5 19.7 14.4 11.4 7.7 10.31970-71 115 72 15.6 18.4 16.7 14.9 11.3 - 14.51971.72 19.9 17.7 15.9 13.4 . 10.4 22.7
154,500 or more; detailed breakdown not ova sable.r 66,500 or more; detailed breakdown not available. -1 47,500 or more; detailed breakdown not avaable.' 38,500 or more; detailed breakdown not ova !able.6 Detailed breakdown not available beyond th s salary'Less than 54,500; detailed breakdown net available.
49
Less than 55,500; dolailed breakdown not available.'Less than 37,500; detailed breakdown not available.SOURCE:National Education Association, Research Division, Research Report _
1972-R2, "Economic Status of the Teaching Prolessitn, 1971-72." (CoPyrigh$1972 by the National Education Association. All rights reserved.)
-
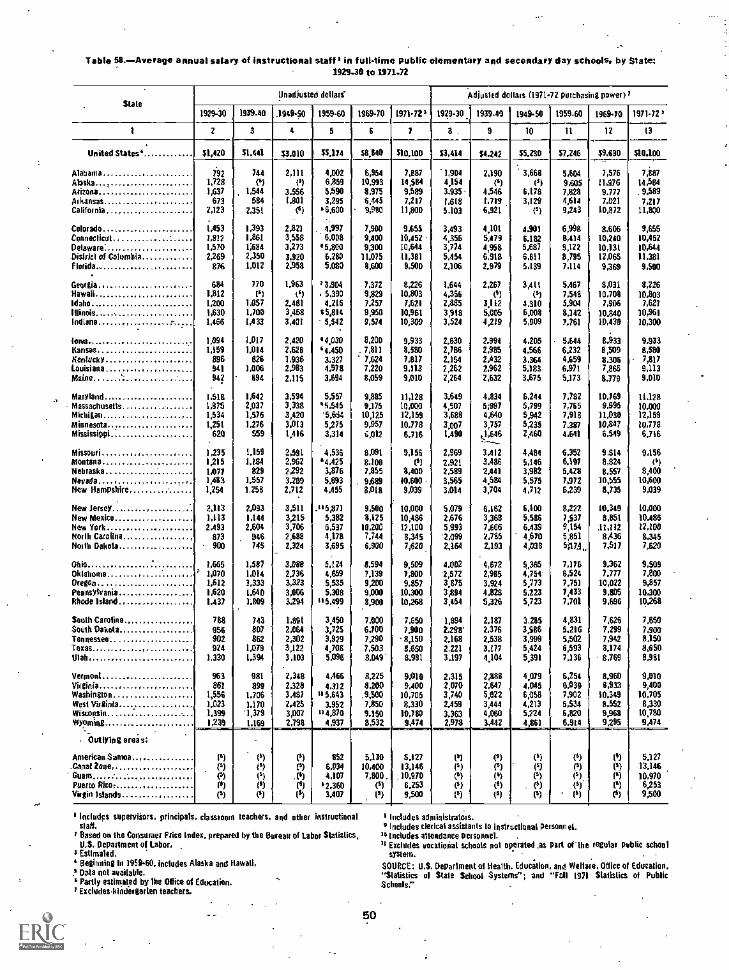
Table 511.-Avorage annual salary of instructional staff 1 in full-time public elementary and secondary day schools. by State:1929-30 to 197142
SlateUnadjusted dollars Adjusted dollars (1971.72 purchasing power)
1929-30 1939-40 .1949-50 1959-60 1969-70 1971.721 1929-30. 1939.45 1949.50 1959.60 1969.70 1971.72'
3 4 6 7 8. 9 10 11 12 13
United States' 51,470 51,441 43.010 41,174 53,840 00,100 13,414 54.242 55,230 57,246 59.630 510.100
Alabama 292 744 2,111 4,002 6,954 7,887 1,904 2,090 3,668 5.604 7,576 7,887Alaska 1,728 (I) 6,859 10.993 14,514 4,154 (I) 9.605 11,976 14,584Arizona 1,637 1044 3.556 5$90 3,975 9,589 3.935 4,546 6,178 7,823 9.777 . 9$89Arkansas 673 584 1,801 3,295 6,445 7,217 1.618 1,719 3,129 4,614 7,021 7.217California 2,123 2,351 (1) '6,600 9,980 11,800 5.103 6,921 (1) 9,243 10,872 11,800
Colorado 1,453 1,393 2,821 4,997 7.900 9.655 3,493 4,101 4.901 6,998 8,606 9.655Connecticut 1,812 1.361 3,558 6,008 9,400 10,452 4,356 5,479 6,182 8,414 10,240 10,452Delaware' 1,570 1;684 3,273 9,800 9,300 10.644 3,774 4,958 5,687 8,122 10,131 10.644Dislricl of Columbia 2,269 2,350 3.920 6,280 11,075 11,301 5,454 6,918 6,611 8,795 12,069 11,381Florida 876 1,012 2 ,058 5.080 8,600 9.500 2,106 2,979 5,139 7.114 9.369 9.500
Georgia 684 770 1,963 3.904 7,372 8,226 1,644 2,267 3,411 5,467 8,031 8,226Hawaii 1.812 I') (1) 5,390 9,829 10,803 4,356 (1) (a) 7,548 10,708 10.803Idaho 1,200 1,057 2,481 4,216 7,257 7,621 2.885 3,112 4.310 5.904 7,906 7,621Illinois 1,630 1,700 3,458 15,814 9,9511 10,961 3,918 5,006 6,008 8,142 10.840 10,961Indiana 1,466 IA33 3,401 5,542 9,574 10,300 3,524 4,219 5,909 7.761 10,430 10,300
Iowa 1,094 1.017 2,420 44,030 0.200 9,933 2,630 2,994 4,205 5,644 8.933 9,933KansasKentucky
1,159896
1,014626
2,6261,936
14.4503,327
. 7,8117,624
8,5907,817
2,7862,154
2,9852,432
4.5663.364
6.2324.659
0,5093,306
8,5807,817
Louisiana 941 1,006 2,983 4,978 7,220 9,113 2,262 2,962 5,183 6,971 7,865 9,113Maine 942 694 2.115 3,694 8,059 9,010 2,264 2,632 3,675 5,173 8,779 9,010
Maryland 1.5111 1,642 3,594 5,557 9,885 11,128 3.649 4,834 6,244 7,782 10,769 11.128Massachusetts 1,875 2,037 3,338 '5,545 9,175 10,000 4,507 5;997 5,799 7,765 9,995 10.000Michigan 1,534 1,576 3,420 .654 10,125 12.159 3.688 4,640 5,942 7,918 11,030 12,159Minnesota 1,251 1,276 3,013 5,275 9,957 10.778 3,007 3,757 5,235 7.387 WM? 10,778Mississippi 620 559 1,416 3,314 6,012 6,716 1,490 0,646 2,460 4,641 6,549 6,716
Missouri 1,235 1,159 2,591 4,536 8,091 9,156 2,969 3,412 4,484 6,352 9,814 9.156Montana 1,215 1.134 2,962 "4,425 8,100 (1) 2,921 3.486 5,146 6.197 8,824 (a)Nebraska 1,077 829 2,292 3,876 7,855 8,400 2.589 2,441 3,962 5.423 8,957 8,400Navada 1,483 1,557 3,209 5,693 .9.689 10,600 3,565 4,584 5,575 7,972 10$55 10,600New Hampshire 1,254 1,258 2,712 4.455 8,018 9,039 3.014 3,704 4,712 6,239 8,735 9,039
New Jersey 2,113 2,093 3,511 -u5$71 9.500 10 ,000 5,079 6,162 6,100 8.222 10.349 10,000New Mexico 1,113 1,144 3,215 5,382 8,125 10,486 2,676 3,368 5.586 7.537 8051 10.486New York 2,493 2.604 3,706 6,537 10,200 12,100 5,993 7,666 6,439 9,154 11,112 12,100Norlh Carolina 873 946 2,688 4,178 7.744 8,345 *2,099 2,785 4,670 5,851 8,436 8,345North Dakota 900 745 2,324 3,695 6,900 7,620. 2,164 2,193 4,038 51171 7,517 7,620
Ohio 1,665 1,587 3,088 5,124 8,594 9,509 4,002 4,672 5,365 7,176 9,362 9,509Oklahoma 1,070 1,014 2,736 4,659 7,139 7,800 2,572 2,985 4,75,- 6,524 7,777 7,800Oregon 1.612 1,333 3,323 5,535 9,200 9.857 3,875 3,924 5,773 7,751 10,022 9,857Pennsylvania 1,620 1.640 3,006 5,308 9,000 10,300 3,894 4,828 5,223 7,433 9,805 HUMRhode Island..... ............ 1.437 1;809 3,294 u 5,499 8,900 10,268 3,454 5,326 5,723 7.701 9,696 10.268
South Carolina 788 743 1,891 3,450 7,000 7,650 1,894 2,187 3,285 4,831 7.626 7,650South Dakota 956 807 2,064 3,725 6,700 7,900 2298' 2.376 3,506 5,216 7,299 7,900Tennessee 902 862 2,302 3,929 7,290 - 8,150 2.168 2.538 3.999 5,502 7,942 8,150Texas 924 1,079 3,122 4,708 7,503 8,650 2,221 3,177 5,424 6,593 8,174 8,650Utah 1,330 1,394 3,103 5,096 8,049 8,981 3.197 4,104 5,391 7,136 8,769 8,981
Vermont 963 981 2,348 4,466 8,225 9,010 2,315 2,888 4,079 6,254 8,960 9,010Virginia 861 399 2,328 4.312 8,200 9,400 2,070 2,647 4,045 6.039 8,933 9,400Washington 1,556 1.706 3,487 115,643 .9,500 10,705 3,740 5,022 6,058 7,902 10,349 10,705West Virginia 1,023 1.170 2,425 3.952 7.850 8,330 2.459 3,444 4,213 5,534 8,552 B.330Wisconsin 1,399 '1,379 3,007 u 4,870 9,150 10,780 3,363 4.060 5,224 6,820 9,963 10,780Wyoming 1,239 1.169 2,798 4,937 8,532 9.174 2,978 3,442 4 61 6.914 9,295 9.474
Outlying areas;
American Samoa.Canat Zone
I')(a) 1") (6)
8526,034
5.13010.400
5,12713,146
(61
(a)(5)(5) (3)
(5)(5)
5,12713,146
GuamPuerto RICO.Virgin Islands
(1)
(1)
(a)(I) (6)
el
4,107$2.3603,407
7,800(1)I')
.10.9706,2539,500
(5)(1)(5)
(5)(6)(6)
(a)
(1)(1)
(a)'(I)
(5)
(6)
10,9706,2539$00
1 Includes supervisors, principals, classroom teacherstaff.Based on the Consumer Price Index. prepared by theU.S. Department of Labor.
1 Estimated.Beginning In 1959-60. includes Alaska and Hawaii,
1 Oats not available.Partly estimated by the Office of Education.ExcludekIndetgaden teachers.
s, and other instructional
Bureau of Wet Statistics,
50
Includes sulndnisicatiis.
I Includes clerical assistants to instructional personnel.Is includes attendance personnel.rr Excludes vocational schools not operated .as part of-the regulat public school
system.
SOURCE: U.S. Department al Health. Education, and Welfare, Office of Education."Statistics of State School Systems"; and 'Fall 1971 Statistics of PublicSchou:137
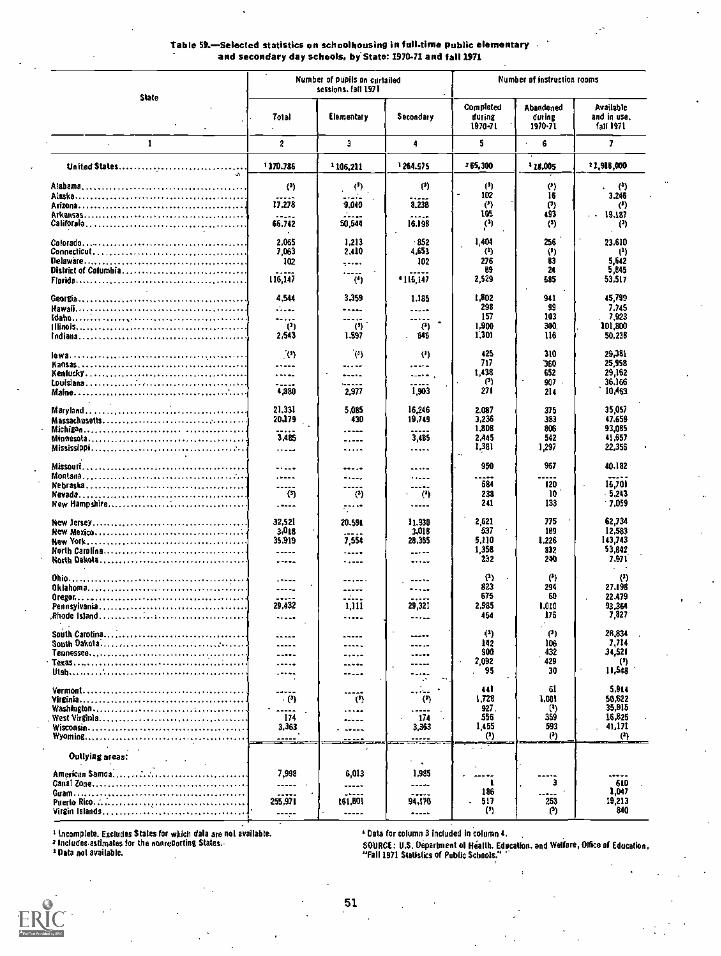
Table 50.-Selected statistics on schoolhOusing in full-time public elementaryand secondary day schools, by State: 1970.71 and fall 1921
Slate
Number of pupils on curtailedsessions. fall 1971
Number of instruction rooms
Total Elementary SecondaryCompleted
during1970-71
Abandonedduring
1970-71
Availableand in use,fall 1971
1 2 3 4 5 - 6 7
United States
Alabama
1370.736 1106.211 1264.575 2 65,300 '18.005 21,918,000
(a) (5) (3) ('I (1) (5)
AlaskaArizona 17,278 9,040 8,238
102(1)
16
(3)3.246
(")Arkansas 105 493 . . 19.187California 66.742 50,544 16.198 (a) (3)
Colorado 2,065 1,213 852 1,404 256 23.610Connecticut 7,063 2.410 4.651 (1) (') (1)
DelawareDistrict of Columbia
102 102 27689
83
245,6425,845
florida 116,147 (4) 111,147 2,529 585 53,517
Georgia 4.544 3,359 1.185 1,802 941 45799Hawaii 298 99 7.745Idaho 157 103 7,923
Illinois (3) 1,900 300, 101,800Indiana 2,543 1,897 645 1;301 116 50,238
Iowa :(9) *(4 (I) 425 310 29,381Kansas 717 '360 25,953
Nodosity ----- 1,438 652 29,162
Louisiana(3) 907 36.166
Maine 4,880 2.977 1,903 271 214 10,463
Maryland 21,331 5,085 16,246 2,087 375 35,057
Massachusetts 20,179 430 19,749 3,236 383 47.659
Michigan 1,808 806 93.085Minnesota 3,416 3,485 2,445 542 41,657
Mississippi 1.381 1,297 22,356
Missouri 950 967 10.182
MontanaNebraska 684 120 15,701
Nevada (a) (I) el 233 10 5,243New Hampshire 241 133 7,059
New Jersey 32,521 20.591 11.930 2,621 775 62,734
New Mexico 31018 3,018 537 189 12,583
Mew York 35.919 28,355 5,110 1,226 143,743North Carolina 1,358 832 53,842.North Dakota 232 240 7.971
Ohio (I) (I)Oklahoma 823 294 27.198
Orestes. 4 675 60 22.479
Pennsylvania 29,432 1,111 28,321 2,985 1.010 93,364,Rhode Island 454 176 7,827
South Carotins (5) (3) 20,834South Dakota- . 142 106 7,714Tennessee 900 432 34,521
Texas 2,092 429
Utah . 95 30 11,543
Vermont 441 61 5,914
Virginia (a) (') (,) 1,728 1,001 50.622Washington 927, (I) 35.915West Virginia 174 174 556 359 16,825
Wisconsin 3,363 3.363 1,455 593 41,171Wyoming (') (I) (5)
Outlying areas:
.=1 = r r..wm aU
American Samoa 7,998 6,013 1,985 --Cane Zone 1 3 610Guam..Puerto Rico 255,971 161.801 94,170
186517 253
1,04719,213
Virgin islands 840
tncomplete, Excludes States for which dala are not available.2 Includes.astimatos for the nonreporting States.-
Data not available.
51.
Data or column 3 included in column 4,SOURCE: U.S. Department of Health. Education. and Welfare, Olfice of Education,"Fall 1971 Statistics of Public Schools."

...
Table 60.--Selected characteristics of instructional rooms in public school plants, by State: 1964.65
IDala for rooms are rounded to nearest '1001
Stale
Total num-bet of
instructiona$rooms in pub-
Re schoolplants
instructional rooms' in permanent buildings bycompletion date and combustibility
Instructional rooms' in
Before 1920 andcombustible
After 1920 andcombustible
Before 1920 andnoncombustible
Alter 1920 andnoncombustible
Nonpermanentbuildings
Offsite Facilities.
Number Percent Number Percent Number Percent Number Percent Number Percent Number Percent
1 2 3 4 5 6 7 8 9 to 11 12 13. 14
United States 1,536,500 41,000 2.7 94,100 6.1 174,100 11.3 1,184,500 77.1 31,000 2.0 11,700 0.8
Alabama 28,000 600 2.3 4.700 16.9 800 2.8 21,200 755 500 1.9 100 .5Alaska 1,900 (t) .6 500 29.5 0 0 1200 66,7 (t) 2.1 Pi 11Arizona 13,700 100 .8 300 2.2 1.200 8.8 11.700 85.0 400 2.9 (7) .3Arkansas 15,000 100 .6 1,800 11.8 900 5.8 11,800 78.9 300 2.1 100 .7California 130,700 1,400 1.1 32,300 24.7 3.100 2.3 80.600 61,7 12.600 9.6 800 .6
- .
Colorado 18,100 600 3.5 500 2.9.
2,000 10.9 14,600 80.5 300 1.9 100 .3Connecticut 21.000 500 2.4, 300 1.3 3,200' 15.1 16,800 80.1 100 .5 100 .6Delaware 4,100 100 1.8 ('1 1.1 it) .3 3,900 95.9 it) .1 (_) .8Distrkt of Colombia 4,900 0 0 0 0 900 19,4 3,900 79.8 (t) .7 (t) 0Florida 39,300 600 1.5 1,400 3.5 1,800 4.5 32,800 83,4 2.500 6.4 300 .7
Georgia 37,200 500 1.3 2500 6.7 1,600 4.4 32,000 86.0 300 .7 300 .8Hawaii 5,800 300 4.5 1.700 29.8 100 2.1. 3,400 59.1 200 4.1 (t) .3Idaho, 6,900 400 5.9 400 5,3 - 1.100 16.0 4,800 70.4 (I) .5 100 1.8Illinois 76,000 2,900 3.8 300 .4 13,700 18.0 58,200 76.6 300 .4 600 .8
Indiana 40,400 _ ..800 2.0 200 .5 8,100 20.1 30,800 76.4 300 .8 100 .3
Iowa 28,500 1.900 6.5, 500 1.9 6,600 23.2 19,000 66.8 100 .3 400 1.2Kansas 25,200 400 1.7 500 1.9 3,100 12.5 20,500 81.4 500 1.8 200 .8Kentucky 23,400 500 2.1 1,000 4.5 2,200 9.5 18,900 80.8 600 2.6 100 .6Louisiana 32,000 500 1.5 2,500 7.8 1,600 5.0 25,800 80.7 1.200 3.9 400 1.2Maine 8,300 1,200 14.8 1,900 22.5 800 10.2 4,200 51.0 (7) (') 100 _ 1.5 _
Maryland... 25,700 1,000 3.9 800 3.1 1,700 6.7 21,500 83,9 400 . 1,5 200 .9Massachusetts 36,400 2.000 5.4 , 900 2.6 8,700 24.0 24,300 66.7 200 .4 . 300 .9Michigan 64.500 1,900 . 2.9 700 1.1 6,100 9.5 55,300 85.7 200 .3 400 ,. .6Minnesota 33,000 2,300 7,1 . 800 2.5 4,400 13.3 25,000 75.8 100 .3 300 .9
Mississippi 20.900 (I) .1 1.100 5.3 500 2.4 18,800 90.0. 300 12 200 1.0
Missouri 34,100 700 2.0 1,000 . 2.9 4,900 14.5 26,800 78.7 200 ,6 400 1.3Montana 8,600 500 6.0 800 8,8 1.300 15.3 5.800 61.4 100 .7 200 1.8Nebraska '17.300 1,400, 8.1 800 4.8 3,700 21.4 11.200 64.4 100 ,7 100 .5
Nevada 3,500 100 2.7 100 3.5 200 6.1 , 3,000 85.3 100 2.2 (t) .1
New Hampshire 5,200 500 10.0 200 3.3 '800 14,8 3,700 71.1 (7) .1 (t) .8
New Jersey 46,000 1,400 3.0 300 .6 8,900 19.4 35,200 76.5 (I) .1 200 .5New Mexico 10.200 100 .7 300 2.7, 500 4.5 9,000 88.4 400 3.5 (t) .2New York 118,100 2.100 1,8 500 .4 17,600 14.9 96,100 81.3 500 .4 1,400 1.2North Carolina 45.100 600 1.4 3,900 8.8 2,200 4.8 37,500 83.2 800 1.8 100 .21100 Dakota 7.400 500 7.4 400 5,7 1,200 16.8 5,000 67.9 (I) .6 100 1.7
Ohio 83,200 800 1.0 ', 100 .1 14,800 17.8 66,300 79.7 200 .3 1,000 1.2
Oklahoma 25,800 300 '1.3' -1,000 4.0 . 2,300 9.0 21.000 81.4 800 3.0 300 1.3Oregon 18,900 600 3.1 5,400 28.5 1,200 6.6 11,400 60.4 200 1.1 (7) .3Pennsylvania...., 79,500 2,100 2.6 800 1.0 16,100 20.2 59,700 75.1 400 .6 400 .5Rhode Island 5,900 600 , 9.5 200 3.9 1,000 16.2 4,200 70.3 0 0 ('1 .2
South Carolina 23,200 300 1.2 1,700 7,2 1,200 5.3 19,700 84.7 300 1,4 ft) .2
South Dakole 8,600 1,100 13.0 900 10.6 1,400 .16.5 4,900 56.6 100 1.7 100 1,3Tennessee' 31,400 600 2.0 4,500 14.3 15 00 5.7
.24,000 76.4 400 1.4 (9 .2
Texas 92,000 400 .4 4,300 4.7 5,200 5.7 78,400 85.2 2,900 3.1 800 .9Utah 10,100 400 3.6 300 3.0 1,700 16.4 7,700 76.5 (t) .3 (') .2
, .
Vermont 3.700 700 15.3 300 7.9 500 14.7 2,100 56.5 It) (z) t00 1,9
Virginia 24.500 1.000 2.9 2,000 5.8 2,000 5,8 28,700 83.4 600 1.8 100 .4Washington 29.200 700 2.3 3,900 13.5 2,100 7.3 21,300 73.0 1,000 3.5 100 .5West Virginia 17,100 1,100 6.7 1,900 10.9 2.200 12.7 11,600 67.9 100 .8 200 1.0Wisconsin 32,600 1,800 5.6 500 1.5 4,500 13.8 25,300 77.8 100 .3 400 1.2Wyoming 4,500 100 1.9 . 200 5.5 400 8.6 3,700 82.8 ft) .7 ('3 .5
Outlying areas 14,000 200 1,4 2,200 15.7 NO 5 . 7 9,400 6 7 . 1 S O O 5 7 600 4,3
American Samoa 200 0 0 (t) .5 0 0 100 54.8 100 42.4 It) 2.3Canal Zone 500 0 0 100 15.3 100 10.5 400 71.6 .(t) .8 , (,) 1.8Guam 400 0 0 (9 9.6 0 0 300 80.2 (t) 104, 0 0Puerto Rico 12,900 200 1.4 2,000 15.8 800 6.0 8,600 66.5 700 5.4 600 4.9
1 Includes improvised or makeshift rooms used for instructional purposes.t Less than 50.
NOTE,-Because of rounding and of varying inflation factors applied to individualschool plants, detail may not add to totals.
52
SOURCE: U.S. Department of Health, Education, and Welfare, Office of Education, .
"Condition of Public School Plants, 1564.65."
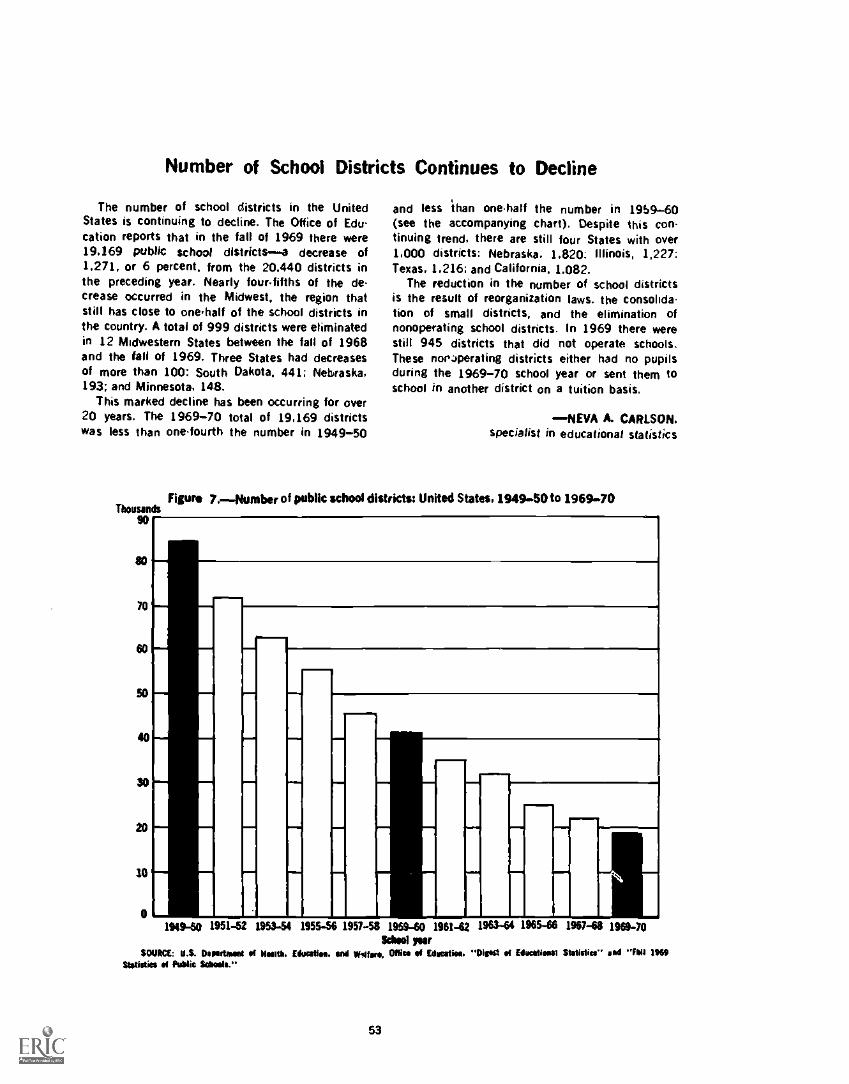
Number of School Districts Continues to Decline
The number of school districts in the UnitedStates is continuing to decline. The Office of Edu-cation reports that in the fall of 1969 there were19.169 public school districtsa decrease of1.271, or 6 percent, from the 20,440 districts inthe preceding year. Nearly four-fifths of the de-crease occurred in the Midwest, the region thatstill has close to one -half of the school districts inthe country. A total of 999 districts were eliminatedin 12 Midwestern States between the fall of 1968and the fall of 1969. Three States had decreasesof more than 100: South Dakota, 441; Nebraska,193; and Minnesota, 148.
This marked decline has been occurring for over20 years. The 1969-70 total of 19.169 districtswas less than one-fourth the number in 1949-50
and less than one-half the number in 19b9-60(see the accompanying chart). Despite this con-tinuing trend, there are still four States with over1,000 districts: Nebraska. 1.820: Illinois, 1,227;Texas. 1.216; and California, 1,02.
The reduction in the number of school districtsis the result of reorganization laws. the consolida-tion of small districts, and the elimination ofnonoperating school districts. In 1969 there werestilt 945 districts that did not operate schools.These nor 4perating districts either had no pupilsduring the 1969-70 school year or sent them toschool in another district on a tuition basis.
NEVA A. CARLSON.specialist in educational statistics
Figure 7.Number of public school districts: United States. 1949-50 to 1969-70Thoesanols
00
10
,===
1949-60 1951-52 1953-54 1955-56 1957-59 1959-60 1961-62 1963 -64 1965-66 196748 1969-70Wool year
SOURCE: U.S. Doprtront of Nona. Idoedios. end UMW*. 011k. Of 941outioo. "01.5! 54 nocotionO1 Stdio1154 44 "NI 1969Wishes of Public Sobools."
53
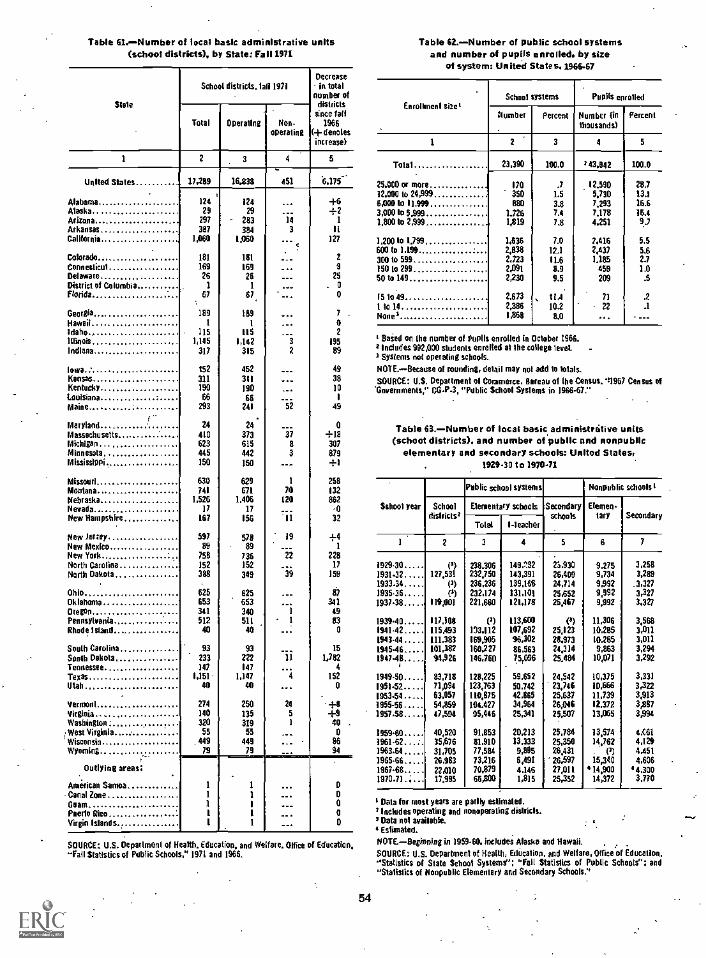
Table 61.-Number of local basic administrative units(school districts), by State:Fall 1971
Stale
School districts, loll 1971Decreasein total
number ofdistricts
since fall1966
(+ denotesincrease)
Total Operating Non-operating
1 2 3 5
United States 17,289 16,238 451 6,175-
Alabama 124 124 +6Alaska 29 29
Arizona 297 - 283 14 1
Arkansas 387 384 3
California 11160 1.060 127
Colorado 181 181 2
Connecticut 169 169 9
Delaware 26 26 25District of Columbia 1 1 . 0
Florida 67 67, 0
Georgia 189 189 7
Hawaii 1 1 0Idaho 115 115 2
Illinois 1,145 1,142 3 195
Indiana 317 315 2 89
Iowa t52 452 49Kansas 311 311 38Kentucky 190 190 10
Louisiana 66 66Maine 293 241 52 49
Maryland 24 24 0Massachusetts 410 373 37 +18Michigan 623 615 8 307Minnesota 445 442 3 879Mississippi 150 150 +1
Missouri 630 629 1 258Montana 741 671 70 132Nebraska 1,526 1,406 120 862Nevada 17 17New Hampshire 167 855 32
New Amy 597 578 19 +4New MEXICO 89 89 1
New York 759 735 228North Carolina 152 152 17
North Dakota 388 349 39 159
Ohio 625 625 87Oklahoma 653 653 341Oregon 311 340 49Pennsylvania 512 511 - 1 83Rhode Island.. 40 40 0
South Carolina 93 93 15
South Dakota 233 222 11 1,782Tennessee 147 147 4
Texas 1,151 1,147 152
Utah 10 10 0
Vermont 274 250 24
Virginia 140 135 5 +9Washington 320 319 40West Virginia 55 55 0
Wisconsin 449 449 asWyoming 79 79 94
Outlying areas;
American Samoa 1 0
Canal Zone 1 0
Giant 1 0Paerlo Rico 0
Virgin Islands 1 0
SOURCE; U.S. Department of Health. Education, and Welfare. Office of Education,"Fall Statistics of Public Schools," 1971 and 1966.
54
Table 62.-Number of public school systemsand number of pupils enrolled, by size
of system: United States, 1966-67
Enrollment size'
1
Total
25,000 or more12,000 to 24,999LOOM 11.9943,00010 5.9991,80010 2,999
1,200 10 1.799600 to 1,199300 to 594150 to 29950 to 149
15 10491 lo 14None'
.1
School systems Pupils enrolled
Number Percent Number (Inthousands)
Percent
3 4 5
23,390 100.0 '43,842 100.0
170 .7 12.590 28.7350 1.5 5,730 13.1880 3.8 7,243 16.6
1.726 7.4 7.178 16.41,819 7.8 4,251 9.,
1,636 7.0 7,416 5.52,838 12.1 2,437 5.62,723 11.6 1,185 2.72,091 8.9 459 1.02,230 9.5 209 .5
2,673 [1.4 71 .22.326 10.2 22 .1
1,868 8.0
Elaiad on the number of pupils enrolled in October 1966.I Includes 992,000 students enrolled al the college level. -I Systems not operating schools.
NOTE.-Because of rounding, detail may not add to Iola's.
SOURCE: U.S. Department of Commerce, Roseau of the Census. '1957 Census of'Governments," CG-P-3, "Public School Syslems in 196667."
Table 63.-Number of local basic administritive units(school districts), and number of public and nonpublic
elementary and secondary schools: United States,1929-30 to 1970-71
School year
Public school systems Nonpublic schools'
Schooldiskictsl
Elementary schools Secondaryschools
Etemen-tary Secondary
Total I-leacher
2 3 4 5 6 7
. .
1929-30 (,) 238.306 149,232 23,930 9,275 3,258193132 127,531 232,750 143,391 26,409 9,734 3.2891933.34 (I) 236,236 139352 24,714 9,992 .3,3271935-36 (1) 232,174 131,101 25,652 9,992 3,3271937-38 114,001 221,660 121,178 25,467 9,992 3,327
1939.40 117,108 (3) 113,600 (a) 11,306 3,5681941.42 115,493 113,112 107,692 25,123 10,285 3,011
1943-44 111,383 169,905 96.302 28,973 10,265 3,011194546 101.382 160.227 86,563 24,314 9,863 3,2941967-48 94,926 146,760 75,096 25.484 10,071 3.292
1949-50 83,718 128,225 59,652 24,542 10,375 3,3311951-52 71,094 123,763 50,742 23,716 10,666 3,372195354 63.057 110,875 42,865 25,637 11,739 3,9131955-56 54,859 104.427 34,964 26,046 12,372 3,8871957.58 47,594 95,445 25,341 25.507 13,065 3,994
1959.60 40,520 91,853 20,213 25,784 13,574 4,(611961.62 35,676 81,910 13,333 25,350 14,762 4,1241963.64 31.705 77.594 9.895 26,431 . (3) 4,4511965-66 26,983 73.216 6,491 26,597 15,340 4,6061967.68 22,010 70,879 4,146 27,011 414,900 4,3001970.71.; 17.995 66,800 1,815 25,352 14,372 3,770
I Data for most years are party estimated.Includes operating and nonoperat ng districls.Data nol available.
4 Eslimated.
NOTE-Beginning in 1959-60, includes Alaska and Hawaii.
SOURCE: U.S. Department of Health, Education, and Welfare, Office of Education,'Statistics of State School Systems": "Fall Statistics of Public Schools"; and"Stalistks of Nonpublic Elementary and Secondary Schools."
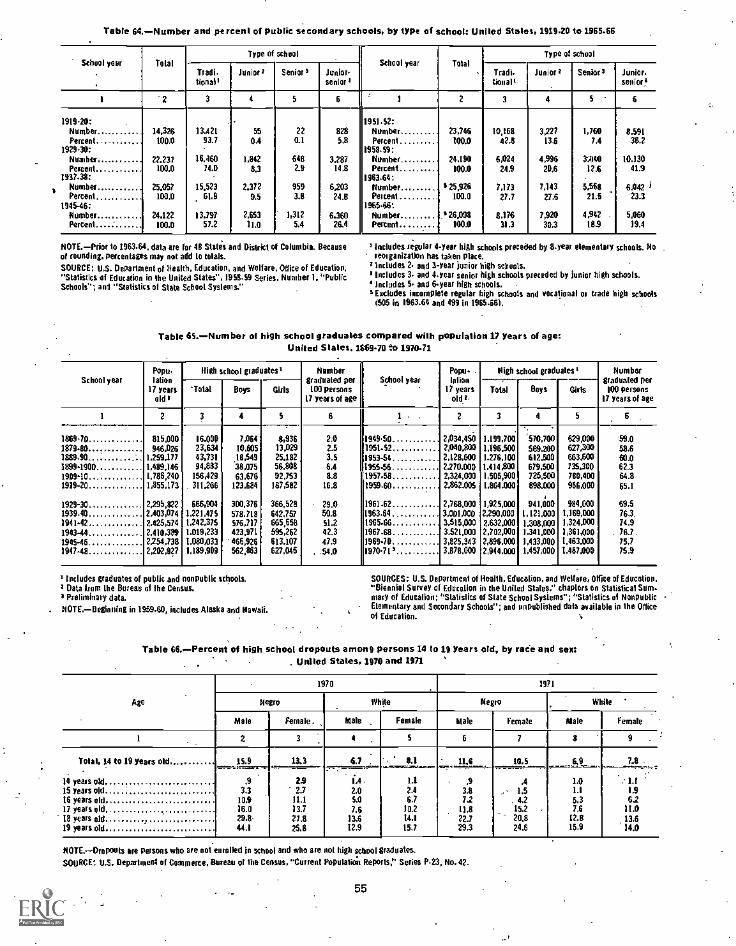
Table 64.-N umber and percent of public secondary schools, by type of school: United States, 1919.20 to 1965.66
School year TotalType of school
School year TotalType of school
Tradi-tional/
Junior/ Senior' Junior-senior 3
Tratlitionall
Junior r Seniors Junior.senior!
1 "2 3 4 5 6 3 2 3 4 S 6
1919-20: - 1951-52:Number 14,326 13.421 55 22 828 Number 23,746 10,168 3,227 1,760 8.591Percent. "._ 100.0 93.7 0,4 0.1 5.8 Percent 400.0 42.8 13.6 7.4 36.2
1929.30: 1958-59:Number 22.237 16.460 1,842 648 3,287 Number 24.190 6,024 4,996 3'840 10.130Percent 100.0 74.0 8.3 2.9 14.8 Percent 100.0 24.9 20.6 12.6 41.9
1937.38: 1963-64:Number 25.057 15.523 2,372 959 6,203 Number 1 25,926 7,173 7.143 5.5611 61342 /Percent 100,0 61.9 9.5 3.3 24.6 Percent 100.0 27.7 27.6 21.5 23.3
194546; 1965.66:Number 24.122 13.797 2,653 1,312 6.360 Number '26.098 8.176 7,920 4,942 . 5,060Percent 100,0 57.2 11.0 5.4 26.4 Percent 100.0 31.3 30.3 18.9 19.4
NOTE.-Prior to 1963.64, data are for 48 States and District of Columbia. Because01 /10014i011. percentages may not add to totals.
SOURCE: U.S. Department of Health, Education, and Welfare, Office of Education."Statistics of Education in the United States", 1958.59 series. Number 1. "PublicSchools"; and "Statistics 01 State School Syslems."
/ Includes regular 4 year high schools preceded by 8-year elementary schools. Nofeminization has taken place.
/ Includes 2 and 3-year junior high schools./ Includes 3- and 4-year senior high schools preceded by junior high schools.
includes S. and 6-year high schools./ Excludes incomplete regular high schools and vocational or trade high schools
(505 in 1963-64 and 499 in 1965-661.
Table 45.-Number of high school graduates compared with population 17 years of age:United States, 1669.70 to 1970-71
School yearPopo-!alien
17 yearsolds
High school graduates' Numbergraduated per
100 persons17 years of age
School yearPope .lalion
17 yearsold/
High school graduates / Numbergraduated per100 persons
17 years of age'Total Boys Girls
.
Total Boys Girls
1 2 3 4 S 6 2 3 4 5 6.
..
1869-70 815,000 16.000 7,064 8,936 2.0 1949 -50_ 2,034,450 1.199,700 '570,700 629,000 59.01879-80 946,926 23.634 10.605 13,029 2.5 1951-52 2010.800 1,196.500 569.200 627,300 58.61889-90 1259.177 43,731 25,182 3.5 1953-54 2,128,600 1.276,100 612,500 663,500 60.01899.1900 1,489.146 94.883
1854938,075 56,808 6.4 1955,56 ".." 2,270.030 1.414,800 679,500 735.300 62.3
1909.10 1.786,240 156.429 63,676 92,753 3.8 195748 2,324.000 1,505,900 725,500 780,400 64.81919-20 1,855,173 . 311266 123,684 187,582 16.8 1959-60 2,862.005 1,864.000 898.000 966,000 65.1
1929-30 2,295,822 666,904 300.376 366.528 29.0 1961-62 2,768.000 1,925,000 941,0110 984.000 69.51939-40 2.403,074 1.221,475 578.718 642.757 50.8 1963-64 3,001,000 2,290,000 1,121.000 1,169,000 76.3,1941-42 2.425,574 1,242,375 576,717 665,658 51.2 1965.66 3,515,000 2,632.000 1,308,000 1,324,000 74.91943-44 2.410,384 1.019,233 423,971 595,262 42.3 1967.68 3.521,000 2,702,000 1.341,000 1,361,000 . 76.7.1945 -46. 2,254,738 1,080,033 466,926 613.107 47.9 1969-70, 3,825,343 2,896,000 1,433,000 1,463.000 75.71947-48 2,202,927 1.189,909 562,863 627.046 , .54.0 1970-71/ 3,678.000 2944,000 1,457,000 1,487.000 75.9
r Includes graduates of public and nonpublic schools.Data tram the Bureau at the Census.Preliminary data.
. NOTE.- Beginning in 1959-60, includes Alaska and Hawaii.
SOURCES: U.S. Department of Health, Education, and Welfare, Office of Education."Biennial Survey of Education in the United States.' chapters on Statistical Sum-mary of Educalion; 'Slashes of State School Systems"; "Statistics of NonpublicElementary and Secondary Schools"; and unpublished dale available in the Office01 Education.
Table M.-Percent of high school dropouts among persons 14 to 19 years old, by race and sex:United States, 1970 and 1971 '
Age
1970 1971
Negro White Negro While
Male Female. Male Female Male Female Male female
1 2 3 6 7 9
Total, 14 to 19 years old 15.9 13.3 6.7 . 8.1 11.6 10.5 6.9 7.3_ .
14 years old .9 2.9 1.4 1.1 .9 .4 1.015 years old 3.3 2.7 2.0 2.4 3.8 1.5 1.1 1.9
16 years old 101 11.1 5.0 6.7 7.2 4.2 5.3 6217 years old.. 16.0 13.7 7.6 10.2 11.8 15.2 7,6 11.018 years old 29,8- 27.8 13.6 14.1 22.7 20.8 12.3 13.619 years out 44.1 25.8 12.9 15,7 29.3 24.6 15.9 14.0
NOTE.--Oropouts are persons who are not enrolled in school and who are not high school graduates.
SOURCE: L.S. Department of Commerce, Bureau 01 the Ceases, "Current Populatioir Reports," Series P-23, No.42.
55
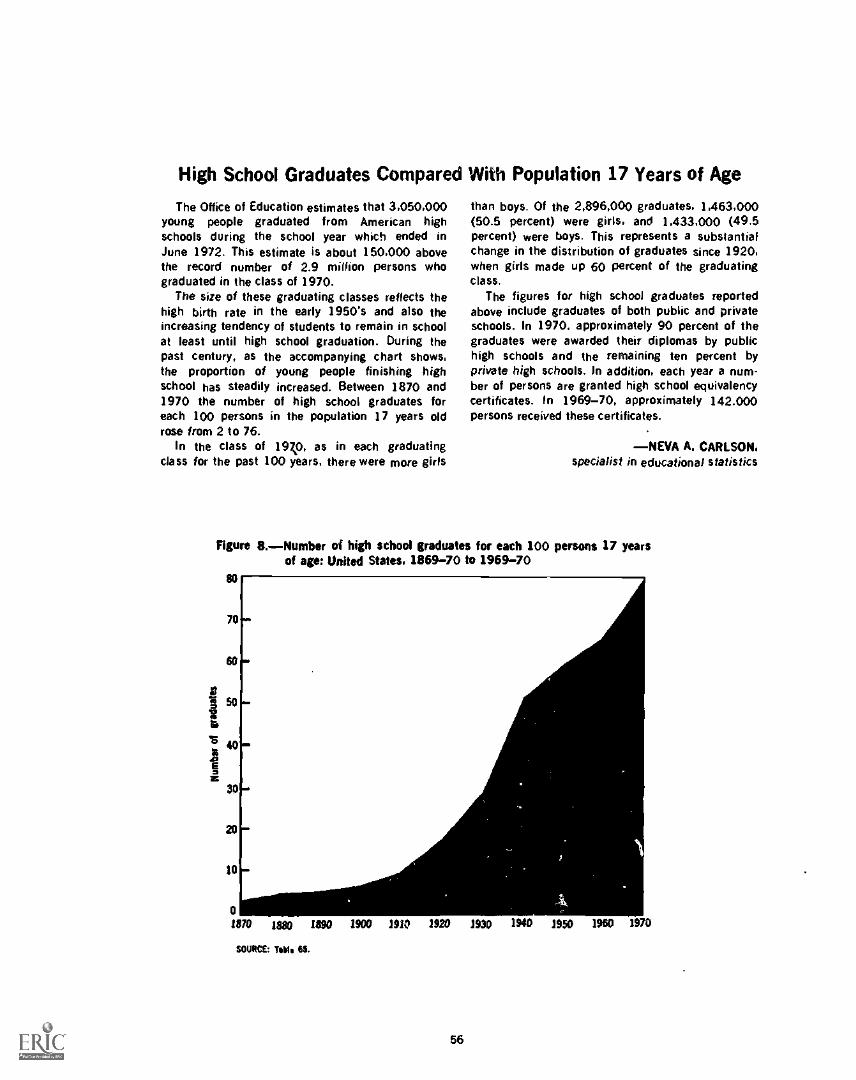
High School Graduates Compared With Population 17 Years of Age
The Office of Education estimates that 3.050.000young people graduated from American highschools during the school year which ended inJune 1972. This estimate is about 150.000 abovethe record number of 2.9 million persons whograduated in the class of 1970.
The size of these graduating classes reflects thehigh birth rate in the early 1950's and also theincreasing tendency of students to remain in schoolat least until high school graduation. During thepast century, as the accompanying chart shows,the proportion of young people finishing highschool has steadily increased. Between 1870 and1970 the number of high school graduates foreach 100 persons in the population 17 years oldrose from 2 to 76.
In the class of 19740, as in each graduatingclass for the past 100 years, there were more girls
than boys. Of the 2,896,000 graduates. 1.463,000(50.5 percent) were girls, and 1.433,000 (49.5percent) were boys. This represents a substantialchange in the distribution of graduates since 1920,when girls made up 60 percent of the graduatingclass.
The figures for high school graduates reportedabove include graduates of both public and privateschools. In 1970, approximately 90 percent of thegraduates were awarded their diplomas by publichigh schools and the remaining ten percent byprivate high schools. In addition, each year a num-ber of persons are granted high school equivalencycertificates. In 1969-70, approximately 142.000persons received these certificates.
NEVA A. CARLSON.specialist in educational statistics
Figure 8.Number of high school graduates for each 100 persons 17 yearsof age: United States. 1869-70 to 1969-70
80
70
60
i so=
I'S40I§z
30
20
10
011170 1880 1990 1900 1910 1920 1930 1940 1950 1960 1970
SOURCE: Table 65.
56
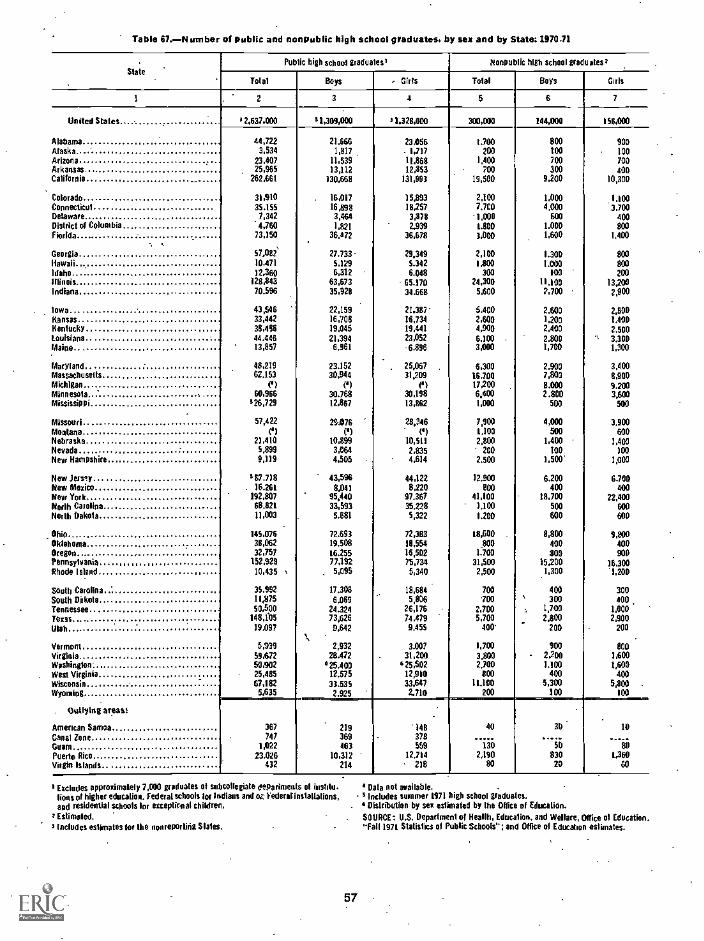
Table 67.-N umber of public and nonpublic high school graduates, by sex and by State: 1970.71
SlatePublic high school graduates' Nonpublic high school graduates'
Total Boys Girls Total Boys Girls
2 3 4 5 6 7
United States 2,637,000 1,309,000 1.329.000 300,000 144,000 156,000
Alabama 44,722 21.666 23.056 1.700 800 900Alaska 3,534 1,817 - 1,717 200 100 100Arizona 23.407 11,539 11,868 1,400 700 700Arkansas 25,965 13,112 12,853 700 300 400California 262,661 130.668 131,993 19,500 9.200 10,300
Colorado 31,910 16,017 15,893 2,100 1.000 1.100Connecticul 35.155 16,898 18,257 7,7C0 4,000 3.700Delaware 7,342 3,464 3,878 1.030 600 400District of Columbia 4,760 1,821 2.939 1.800 1.000 800Florida 73,150 36.472 36,678 3,000 1,600 1,400
Georgia 57,082 27,733 29,349 2,100 1.309 800Hawaii 10.471 5.129 5.342 1,800 1.000 800Idaho 12.360 6,312 6.048 300 100 200Illinois 128,843 63,673 65.170 24,300 11.100 13,200Indiana 70,596 35,928 34.668 5,600 2,700 2,900
Iowa 43,546 22,159 21,387' 5.400 2.600 2.800Kansas 33,442 16,708 16,734 2,600 1,200 1.400Ken lucky 38,446 19,045 19,441 4.900 2,400 2.500Louisiana 44.446 21,394 23,052 6.100 2.800 3.300Maine 13,857 6,961 -6.896 3,000 1,700 1,300
Maryland 48,219 23,152 25.067 6,300 2.900 3.400Massachusetts 62.153 30,944 31.209 16.700 7.800 8,200Michigan (1) (11 0) 17,200 8.000 9,200Minnesola .... 60.966 30.768 30,198 6,400 2.800 3,600Mississippi 526,729 12,867 13,862 1,000 500 500
Missouri 57,422 29,076 28,346 7,900 4,000 3,900Montana 01 (1) 1,100 500 600Nebraska 21,400 00,899 10,511 2,800 1,400 1,400Nevada 5.899 3,064 2.835 200 100 100New Hampshire 9,119 4,505 4,614 2.500 1,500' 1,000
New Jerry 587.718 43,596 44,122 12,900 6.200 6.700New Mexico 16.261 8.041 8,220 400 400New York 192,807 95,440 97,367 41,100 18,700 22,400North Carolina 68.821 33,593 35,228 1,100 500 600North Dakota. 11,033 5,680 5,322 1.200 600 600
Ohio 145,076 72,693 72,363 18,600 8,800 9,800Oklahoma 38,062 19,508 10,554 400 400Oregon 32,757 16.255 16,502
_8001.700 800 900
Pennsylvania 152,928 77,192 75,734 31,500 15.200 16,300Rhode !shod 10,435 , 5,095 5,340 2,500 1,300 '1,200
South Carolina 35.992 17,308 18,694 700 400 300South Dakota 11,875 6.069 5,806 '700 300 400Tennessee 50.500 24.324 26,176 2,700 1,700 1,000TOX3$ 148,f05 73,626 74.479 5,700 2.800 2,900Utah 19.097 9.642 9,455 400' 200 200
Vermont 5,939 2,932 3.007 1,700 900 800Virginia 59,672 28.472 31,200 3.800 - 2.200 1,600Washinglon- 50,902 425.400 25,502 2,700 1.100 1,600West Virginia 25,485 12,575 12,910 800 400 400Wisconsin 67,182 33.535 33,647 11,100 5,300 5,800Wyoming 5,635 2.925 2.710 200 100 100
Outlying *roast
American Samoa 367 219 '14B 40 30 10
Canal Zone 747 369 378
Guam. 1,022 463 559 130 50 80Puerto Rico 23.026 10,312 12,714 2,190 830 1,360Virgin Islands 432 214 218 80 20 60
' Excludes approximaleiy 7,000 graduates of subcoltegiato departmen s 01 home- i Data not available. .house higher education, Federal schools Ion Indians and oz. Vederalinslailations, - s Includes summer 1971 high school graduates.and residential schools for exceptienal children. . Distribution by sex estimated by the Office of Eduealion.
' Estimaled. . SOURCE: H.S. Departmenl of Health, Education. and Wallace, Office ol Education,3 Includes estimates tor the nonreporhrig Stales. "Fall 1971 Statistics of Public Schools": and Office of Education estimates.
57

Table 68.-Estimated revenue and nenrevenue receipts of public elementary and secondary schools.by source and by Slate: 1911-72
[Amounts in thousands of dollars)
SlateTotal
revenue andnonsevenue
receipts ,
Revenue receipts
NonrevenuereceiptsTroll
Federal' Sta e Local and other=
Amount percentof total
Amount Percentof lotal
Amount Percentof total
3 4 5 6 7 8 9 10
United States.. $50,127,357 546,644,623 13,305,707 7.1 819,062,836 40.9 824.276,080 52.0 13,482,734
It lahoma 491,819 481,819 88,447 18,3 3 298.772 62.0 95,0110 19.7 10,000Masks 164,201 137,214 23.880 17,4 97,186 70.8 16.148 11,8 26,987Arizona 451,556 420,620 35,196 8.4 181,002 434 204,422 489 30.926Arkansas 302.403 278.343 48.100 17.3 128.243 46.1 102.000 36.6 24.060Californias 4,776,291 4,376,291 267,118 6.1 1,522,835 34.8 2,586.338 59.1 400,000
Colorado 626,495 566,495 48,274 8.5 160,222 28.3 358,000 63.2 60,000Connecticut 921,729 911,729 28.004 3.1 210.679 23.1 673,046 73.8 10,000Delaware 203,933 167,033 11.833 7.1 116,000 69.4 39,200 23.5 36.900District of Columbia 219,458 219.458 130.845 14.1 188913 35.9Florida 1.380,407 1,305,407 026,915 9.7 708,663 54.3 469,829 36.0 75,000
Georgia 778,058 728,058 78,862 10.8 383.337 52.7 265.839 36.5 50,000Hawaii 219,573 .219,573 111,487 8.4 194,167 882 6,319 2.9 0Idaho 146,937 146,437 17,932 122 58,239 39.8 70,266 48.0 500Illinois 3,027,819 2,911.434 143,200 4.9 1,059.765 36.3 1.714.469 58.8 110,385Indiana 1.193.000 1,165200 63,000 5.1 382.000 32.8 720,000 61.8 28.000
Iowa 780,800 750,800 18,800 2.5 180,000 24,0 552,000 73.5 30,000Kansas 541,279 490.279 33.371 6.8 146,705 29.9 310,203 63.3 51.000Kentecky 566.359 516,359 85.000 16,5 276,359 532 155,000 30.0 50,000Louisiana 818,000 738,000 92,1300 12.5 423,000 57.0 225,000 30.5 80,000Maine 222,746 202,746 *14.804 7.3 65,139 32.1 122,803 60.6 20,000
Maryland . 1,218,324 1.165,682 83,713 7.1 512,964 43.3 f 535.005 49.7 32,642Massachusells 4 1.485,000 1,385.000 65.000 4.7 300,000 21.7 1.020.000 73.6 100,030Michigan 2,722.328 2.393.328 90,000 3.8 1,065,428 44.5 1.237.900 51.7 329.030Minnesota 1,135.000 '1,010,000 45,000 4.5 550,000 54.5 415.000 41.1 125.000Mississippi 384,564 369,564 96,000 26.0 184,218 49.8 89,346 24.2 15.000
Missouri 931,781 883.781 60 .000 6,8 317.000 35.9 504,781 57,2 50,000Montana 164,853 159,853 13,538 8.5 38,169 23.9 108.146 67.7 5.000Nebraska.. -, 257750 242.250 15,5110 6.4 42,000 17.3 184,750 70,3 15,500Nevada 146,200 126,200 7,500 5.9 53,003 42.0 65.700 52,1 20.000New Hampshire' 151,534 142,034 7.000 5.0 7,534 5.3 121,400 89.7 9,500
Hew Jersey 2.062.000 1,942.000' 84,000 4,3 488.000 25.1 1.370.000 70.5 120,000New Mexico 238,931 234,519 43.486 18.5 146.079 62.3 44.954 19.2 4,412New York" 5,821911 5,346,071 286.483 . 5,4 2234,564 47.4 2.525.024 47.2 475,080North Carolina 917,553 884,372 103,398 11,7 607,973 68.7 173,000 19.6 33,182North Dakota 122,800 120,300 12,000 10.0 34,600 28.8 73,700 61.3 2.500
Ohio 2.435,000 2365,000 .135,000 6.2 660,000 30.5. 1,370,000 63.3 770,000Oklahoma 442.311 414.311 48,200 11.6 168,481 40.1 197,630 47.7 28,000Oregon $14,738 514,738 .23979 4.5 102,385 19.9 389,274 75.6 60,000Pennsylvania 2,910,107 2,805,107 131,200 4.9 1,366,307 48.7 *1,301200 46.4 105,000Rhode Island 198,351 182,258 14.216 7,8 67,863 37.2 . 100,239' 55.0 16,093
South Carolina 505,756 487,756 80,381 16.5 280,000 57.4 127,375 26.1 18,030South Dakota 138,053 134,553 03,500 10.0 20.843 15.5 100,210 74.5 3,500Tennessee 687,626 637,626 84,500 13.3 289.477 45.4 263,649 41.3 50,000Texas 2.596,563 2,396.617 203,384 8.5 1,153,183 48.1 1,040.050 43.4 199,946Utah 246.333 241,642 19,010 7.9 128,579 532 94,063 38.9 4,691
Vermont- 243,800 134,800 8,200 6.1 44.500 33.0 - 82.100 60.9 9,090Virginia 1,174,500 1,039.500 110,500 10.6 356.000 34.2 573,000 55.1 135,000Washington 928,489 838,489 64,159 7.7 428,000 51.0 346.330 41.3 90.000Wes' Virginia 304,000 298.000 36,970 12.4 148.745 49.9 112,285 37.7 6,000Wisconsin 1,165,561 1,770,561 34.786 3.1 350,962 31.6 724,813 : 652 55,000Wyoming 1 83,617 81.617 6.226 7.6 25.030 30.8 50,261 61.6 2.0*
1 Federal revenue receipts Include Federal grant programs to State and iota schoolsystems, including funds under the Elementary and Secondary Education Act,Economic Opporlunity Act, aid to federally impacted -areas, National DefenseEducation Act. Manpower Oem-lopment and Training, vocational education, etc.Funds receivecklrom the School Limb and Milk Program are included, but report-ing on Alm money value of commodities received is incomplete. ESEA revenueshave generally been estimated on a cash expenditure basis.
° Local and other revenue receipts include revenr'e receipts from local and le ter-mediate sources, gifts, and tuition and fees from patrons.
1 Includes social security and teacher retirement for ail educational agencies andinstitutions.
58
Estimated by Nalional Education Association Research Division.Includes Federal appropriations for capital oullay, civil defense. Capitol PageSchool, and other federally funded programs.Excludes State's share of teacher retirement and social security. ,
NOTE.- Because of rounding, percents may not- add to 100.0.SOURCE: Mahone' Education Assoc; Ition, Research Division, Research Report19714113, "Estimates of School Statistics, 1971-727 (Copyright ei 1971 by theNalional Education Association. All rights reserved.)
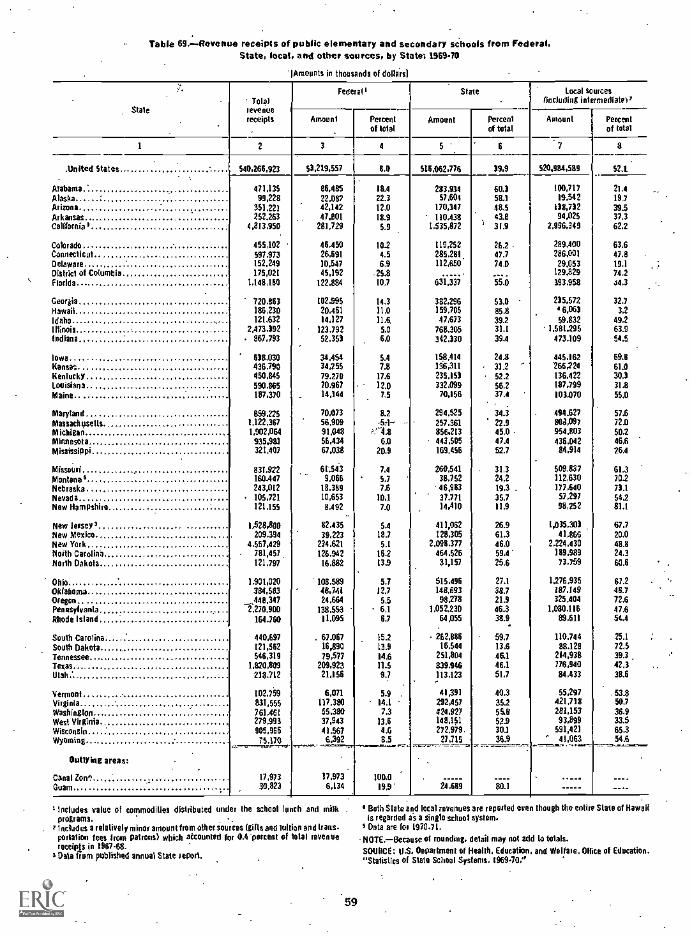
Table 69.--Revenue receipts of public elementary and secondary schools from Federal.State, local, and other sources, by State: 1369-70
'!Amounts in thousands of dollaisi
StateToial
revenuereceipts
.
Federal' State Local sourcesfincluding int ermediatef ;
Amount
.Percentof lotal
Amount Percentof total
Amount Percentof total
1 2 3 4 5 6 7 8
,United States $40,266,923 53,219,557 8.0 516,062.776 39.9 0,984,589 52.8
Alabama 471,135 86,485 184 283,934 50.3 100,717 21.4
Alaska 99,228 22.08? 22.3 57,604 58.1 19,542 19 -7
Arizona 351,221 42,142 12.0 170,347 48.5 138,732 39.5Arkansas 252.263 47,801 18.9 110.438 43.8 94,025 37.3California 3 4,813,950 281,729 5.9 1,535,872 ' 31.9 2,996,349 62.2
Colorado 1155,102 46,450 10.2 119,252 26.2 - 289.400 63.6Connecticut 597,973 26,691 4.5 285.281, 47.7 286,001 47,8Delaware 152.249 10.547 6.9 112,650 74,0 29,053 19)District of Columbia 175,021 45,192 .25.8 . 129,829 74.2Florida 1,148,180 122,884 10.7 631237 55.0 393,958 44,3
Georgia 720,863 102.995 14,3 382,296 53.0 235,572 32)Hawaii 186,230 20.461 11.0 159,705 85.8
"633.2
Idaho 121,632 14,127 11.6 47,673 39.2 59.832 49,2
Illinois . 2,473,392 123.792 5,0 768.305 31.1 1.581,295 63.9
Indiana 867,793 52.353 6.0 342.330 39.4 473.109 54.5
Iowa 638.030 34.454 5.4 158,414 24,8 445.162 69.8
Kansas 436,790 34,255 7.8 136,311 31.2 ' 266,224 61.0Kenlucky 450,845 79.270 17.6 235,153 52.2 136.422 30.3
Louisiana 590,865 70.967 12.0 332.099 56.2 187,799 31.8
Maine 187,370 14,144 15 70,156 37.4 103,070 55.0
Maryland 859,225 70,073 8.2 294.525 34.3 494.627 57.6Massachusetts 1.122,367 56.909 +1- -. 257.361 22.9 808,097 72.0
Michigan 1,902,064 91.048 ?-'4.11 856.213 45.0 - 954,803 502Minnesota 935,981 56,434 6.0 443,505 47.4 436.042 46,6
Mississippi 321.407 67,038 20.9 169.456 52.7 84,914 26.4
Missouri 831,922 61-.543 7.4 260,541 31.3 509,837 61.3Montana; 160.447 9,066 - 6.7 38,752 24.2 112,630 70.2
Nebraska 243,012 18.389 7.6 . 46,983 19.3 . 177,640 73.1
Nevada - 105,721 10,653 10.1 37.771 35.7 57,297 54.2New Hampshire 121,155 8,492 7.0 14,410 11.9 98,252 81.1
New Jersey; 1,528,800 82,435 5.4 411,062 26.9 1,035,303 67.7
New Mexico 209.394 39.223 18.7 128,305 61.3 41,866 20.0
New York 4,557,429 234,621 5.1 2,098,377 46.0 2,224.430 48.8North Carolina - 781,457 126,942 16.2 464.526 59.4' 189,989 24,3
North Dakota 121,797 16,882 13.9 31,157 25.6 73,759 60.6
Ohio 1,901,020 1013,589 5.7 515.496 27.1 1,276.935 67.2
Oklahoma 384.583 ' 48.741 i2.7 148.693 38.7 187.149 48.7Oregon _,448.347 24,664 5.5 98,278 21.9 325,404 72.6
Pennsylvania 2,270.900 138.553 - 6.1 1,052.230 46.3 1,080,116 47.6
Rhode Island 164.760 11,095 6.7 64,055 38.9 89,611 54.4
South Carolina 440,697 . 67.067 15.2 262,886 . 59.7 110.744 25.1
South Dakota 121,562 16,890 13.9 16,544 13.6 88.128 72.5
Tennessee 546,319 79,577 144 251,804 46.1 214,938 39.3
Texas 1,820,809 209.923 11.5 839,946 46.1 776,940 42.3
Utak; 218.712 21,156 9.7 113,123 51.7 84,433 38.6
VermontVirginia
102.759831,555
6,071137,380
5.914.1
. 41,391
292,45740.335.2
55,297421.718
.53.856.7
Washington 761,461 55,380 7.3 424,927 55,11 281,163 36.9West Virginia .. 279,993 37,943 13.6 148,151 52.9 93,899 33.5
Wisconsin 905,916 41,567 4.6 272,979. 591,421 65.3
Wyoming 75,170 6.392 8.5 21,715 36.30.1 " 41,063 54.6
Outlying areas:
Canal Ion. 17,973 17,973 100.0 ..... ____
Guam 30,823 6,134 19,9' 24,689 80.1 ____
; Includes value of commodities distributed under the school lunch and milkprograms. .
Includes a relatively minor amount from other sources (gifts and tuition and trans-portation fees from patrons) which accounted for 0.4 -percent of total revenuereceipts in 1967-68.
; Data gym published annual State report.
59
Both State and local revenues are reported even though the entire State of Hawaiiis regarded as a single school system.
; Data are for 1970-71.NOTE.-Because of rounding, detail may not add to totals.
SOURCE: US. Department of Health, Education, and Welfare, ONice of Education."Statistics of State School Systems, 1969-70:"

Table 70.-Publie elernentary.and secondary school revenue receipts from Federal,State, and local sources: United States. 1919-20 to 1969-70
School year Total Federal StaleLocal
(includinginter-
mediate)*
School year Total Federal StateLocal
'includinginter-
*tuediale1'
1 2 3 4 5 1 2 3 4 5
AMOUNT IN THOUSANDS OF DOLLARS PERCENTAGE DISTRIBUTION
1919.20 ".5978,120 52.475 5160.085 5807,561 1919-20 100.0 0.3 16.5 832192930 2.088,557 7,334 353,670 1.727.553 1929.30 100.0 .4 16.9 82.71939.40 2,260,527 39,810 584.354 1,536,363 1939.40 100.0 1,8 30.3 68.01941.42 2,416,580 34,305 759,993 1322,281 194142 100.0 1.4 31.5 67.11943-44 2,604,322 35,886 859,183 1,709,253 1943-44
-.......100.0 1.4 33.0 65.6
1945-46 3,059,845 41,378 1.062,057 1,956,409--
196-45 100.0 1.4 34.7 63.81947-48 4,311,534 120,270 1,676,362 2,514,902 1947.48 100.0 -, 2.8 38.9 58.31944-50 5,437,044 155,848 2365,689_ 3,115,507 1949.50 , 100.0 2.8 39.8 . 57.31951-52- 6,42.3,816 227.71) /2;478,596 -3717,507 3951.52 100.0 3.5 38.6 57.81953-54 7.1166.852 355,237 / 2,944,103 4,567N2 1993-94 100,0 4.5 37.4 58.1
1955.56 9.686,677 441,442 3,828,886 5,416.330 1955.56 100,0 4.6 39.5 .55.91957.58 12,181313 486,484 4,800,368 6,894,66) 1957-58 100.0 4.0 39.4 5611959-601961-62
14,746,61817,521,707
651,639760,975
5,768,0475.789,190
8,326,9329.977,542
_195940196142 "--
*00.0100,0
4.4 ;4.3
39.138/
56.5.56.9
196344 20,544.182 896,956 8,078,014 - 11,569213 1963.64 100.0 4.4 39.3 56.3
196546., 25,356.858 1.996,954 9.920,219 13,439,686 -1965.66, 100.0 7.9 39.1 53.01967.68 31.903,064 2,806,469 12,275,536 16,821,063 1967.68 100.0 8.8 38.5 52.71969-70 40266,923 3,219,557 - 16,062,776 20.984,589___.- 1969-70
,..._100.0 8.0 39.9 52.1
Includes a relatively rhino amount from othei sources Igilts.and to thelaoultranspoitaUatileesfrom pat op0.ythich accounted foi0.4 peicent 01 total revenuereceipls in 1967-68.
NOTE.-Beginning in 195940, includes Alaska and Hawaii, Because Of rounding,detail may not add lo totals.
SOURCE: U.S. Department of Health, Education, and Welfare. Office of Education,"Statistics of State School Systems:*
Table 71.-Results of public school bond elections: United States, 1957-58 to 197142
Fiscal yearNumber of
--.,---Total---7
2
elections ./'
-,,,Ttirconl -based oil
- :.number
Par value of issues voted on(in millions)
Percent'approvedbased on
dollar value.-Aprilbed.
3
Total Approved
1 4 5, 6 7
195758 (1) (1) () 51.542 51,123 72.81958-59 ti) (1) (5)- 1,801 1,433 79.6195960 (') (') P1- 2,672 - 1,792 67.11960.61 (9 ( +) (u) 1605 1,218 75.9196142 1,432 1,034 72.2 1,849 1,273 68.9
196263 2,148 1,482 72.4 2,659 1,851 69.6196344 2,071 1,501 . 72.5 2,672 1.909 71.1196445 2.041 1,525 74.7 3,129 2.485 79.4196546 1,745 1,265 72 5 3,560 2.652 74.5 .
196647 1,625 1,082 66.6 3.063 2.119 69.2
196748 1,750 1.183 67.6 3,740 2,338 62.51968-69 1,341 . 762 56.8 3,913 1,707 43.61969-70 1,216 647 53.2 3.285 1,627 49.51970-71 1,086 507 46.7 3,337 1,381 41.41971.72 1,153 542 47.0 3,102 1,365 44.0
Data not available. ,
SOURCE: U.S. Elepachnent of Health, Education, and Welfare, Office of Education, "Bend Sales for Public School Purposes, 1971.72."
'60
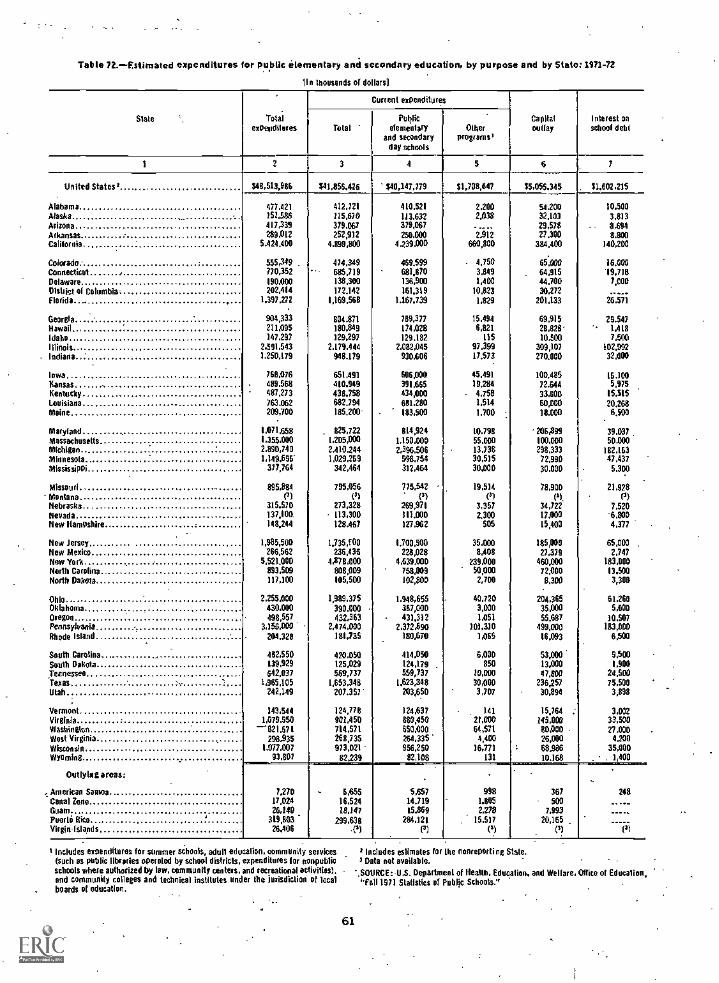
Table 72.-Estimated expenditures for public elementary and secondary education, by purpose and by State: 1971-72
1 n thousands of dollars]
Slate Totalexpendileres
Current expenditures
Capitaloutlay
Interest onschool debtTotal
Publicetemenlary
and secondaryday schools
Otherprograms*
1 2 3 4 5 6
United States' $48,513,446 $41,856,426 340,147,779 $1,708,647 $5,055,345 $1,602,215
Alabama 477.421 412,121 410,521 2.200 54,200 10,500Alaska 151,586 115,670 113.632 21138 32,103 3.813ArizonaArkansas
417,339289 .012
379.067252,912
379,067250,000
...--.21112
29,57827,300
. - 8.69413.800
California 5.424,400 4.899,800 4,239.000 660,800 384.400 140,200
Colorado. 555,349 474,349 469,599 . 4.750 65.000 16,000Connecticut ., 770,352 685.719 681,470 3,849 64,915 '19,716Delaware 190.000 138,300 136,900 1,400 44.700 7,000Distlict of Columbia- 202,414 172,142 161,319 10,823 30,272
Florida 1,397,272 1,169.568 1.167,739 1,829 201.133 26.571
Georgia 904,333 804.871 789,377 15.494 69,915 29.547Hawaii 211,095 180.849 174.028 6,821 28,828' 1,418Idaho 147.297 129,297 129.182 115 10.500 7,500Illinois 2,391,543 2.179.444 2,082,045 97,399 309,107 102,992Indiana 1.250,179 948,179 930.606 17,573 270,000 32.000
Iowa 768,076 651.491 606,000 45.491 100,485 16.100Kansas 489.568 410,949 391,665 19,284 72,644 5.975Kentucky 487.273 438,758 434,000 4.758 33,00D 15,515Louisiana 763.062 682,794 661.280 1,514 60,000 20.268Maine 209,100 185,200- 183,500 1.700 18.000 6,500
Maryland 1.071.658 . 825.722 414,924 10.798 '206,899 39.037MassachusettsMichigan
1,355,0002.890,740
1,205,0002.410.244
1.150.0002.396.506
55.00013,738
100,000298.333
50,000182.163
Minnesota 1,149,696' 1,029,269 998,754 30,515 72,990 47.437Mississippi 377,764 342,464 312,464 30,000 30.000 5.300
Missouri 895.884 795,056 775,542 ' 19,514 78,900 21.928Montana (3) () (1) e) 0), e)Nebraska 315,570 273,328 269,971 3.357 34,722 7.520Nevada 137,1021. 113,300 MAO 2,300 17,000 -6.800New Hampshire 148,244 128,467 127,962 505 15,400
.4,377
New Jersey 1,985.509 1,735,f 00 1.700,500 35,000 135,000 65,000New Mexico 266,562 236,436 228,028 8,408 27,379 2,747New York . 5,521,000 4.878.000 4,631,000 239.000 460,000 183,000North Carolina. 893,509 808,009 753,009 50,000 72.000 13,500North Dakota 117,100 105,500 102,800 2,700 8,300 3,3011
Ohio 2.255,000 1,989,375 1,948,655 40,720 204,365 61.260Oklahoma 430,000 390,000 387,000 3,000 35,000 5,000Oregon 498,557 432.363 431,312 1.051 55,687 10.907Pennsylvania_ 3.156,000 2,474,000 2,372,590 101,310 499,000 153,809Rhode Island 204.328 181,735 180,670 1,065 16.093 6,500
South Carolina 482,550 420.050 414,050 6,000 53,000 9,500South Dakota 139929 125.029 124,179 850 13.000 1,900Tennessee 642,037 569,737 559,737 10,000 47,800 24,500Texas ... 1,965,105 1,653,348 1,623,348 30,000 236,257 75,500Utah 242,149 207,357' 203,650 3,707 30,894 3,898
Vermont 143,544 124,778 124,637 141 15,764 ; 3,002
Virginia 1,079,950 901,450 860,450 21,000 145,000 33,500Washington -821,571 714,571 650,000 64,571 80,000 27,000West Virginia , 298.935 268,735 264,335 4,400 26,000 4,200Wisconsin 1077,007 973,021- 956,250 16,771 68,986 35,000Wyoming 93,807 82.239 82,108 131 10.168 . 1,400
Outlying sous: . ..
American Samoa 7,270 6,655 5,657 998 367 248Canal Zone 17.024 16,524 14,719 1,805 500Guam 26,140 08,047 15,869 2,218 7,993Puerto Rico 319,803 299,638 284,121 15,517 20,165 _
Virgin-Islands 26,406 (3) (3) (3) (*) (31
* Includes expenditures for summer schools, adult education, community services estimates for the nonreporting State.(such as public libraries operated by school districts, expenditures for nonpublic Data not available.schools where authorized by law, community centers, and recreational activities). ',SOURCE:-U.S. Department of Heal*, Education, and Welfare, Office of Education,and community colleges and technical institutes under the jurisdiction of local 'Fall 1971 Statistics of Public Schools.boards of education.
61

bible 73.w-Sunwory of me sditsres for public elemeMory sod secoodsry ed scatters by purpose sled by Stat.: 1961470
{In thousands of dollars)
State
. _
14.1emend,-lutes. allschools
2
Current
lolal
3
mend
Admimstration
4
lures for full-time
Instruction
5
elementary
Operationof plant
6
and secondary
taandtname
0t plant
7
day schools
filedcharges
8
Otherschool
services
9
Otherprograms
10
Croftaoutlay r
11
Interesto4
schooldebt
12
Hutted Motel 603113 .82$ 834.717,771 51.6178448 821.770.1311 '11.517.757 )6174.141 51.266,970 $7.561.156 1635,102 51.659.072 S2.170,7112
Alabama. 467665 .27.730 13,495 277,777 11.111 8.626 47.342 57.183 2.171 37,261 5,103Alaska 101.436 11,374 6.939 51,005 9,261 3,811 4.400 5.959 276 18.018 3,779
Anions 337)14 711.941 11.695 207.255 21,802 9236 11.901 18,058 411.404 /A70Arkansas 269,691 735,013 16,562 116.378 31,853 4,871 71.117 32,260 27.760 7,3411
Cablotnia e . 4.343,510 3.131195 743.439 7,114,761 210.71s 174.611 313.131 156,131 87.369 373,809 107,806
Colorado . . 413103 369.711 17277 754.805 78.569 10.344 77,9711 25.250 4.367 48,418 11,803
Connecticut 659,331 588.710 27,725 415.506 $ 56.626 .4, 51,761 36.087 3,130 45.802 21.690Delaware 161,260 108.747 6,777 77111 9.117 7.393 8.468 9,333 1,437 44,329 6,757District of Columbia 173,317 141,130 4.787 100.076 17.987 5,430 7.933 9,900Florida . .. 1.112.851 %1273 36.822 711,715 61/211 30.976 67.787 52.943 1a/..279751 1;1719417 20.611
George , . 789,583 519.371 76.840 415,194 36.673 15.583 47,701 57.878 19,167 113,516 17,533
tlaWilli 175.007 141,324 8.1111 96,073 4.826 6,974 17.587 17.103 1.589 30,499 1,589Idaho . 17304 303,307 5,386 61.697 8.751 2.479 9.906 8,387 116 15,823 7,528Moms . 7.233.557 0196,067 101.046 1.786,368 175.290 52.020 168,491 117.851 37,99a 245,771 54280Indiana 3/91,271 809,105 75,116 560.110 72,907 77,091 64218 64.625 14.131 749.714 20jai
Iowa . . - 643,820 577,0116 36.960 154.516 56,136 rOl 37,972 6%901 34.361 69,371 13.050Kansas 402.975 367,511 15,117 755.717 79.678 10,734 23.420 74,031 539 14,107 5.836Kentucky 389,078 353,265 13,180 218117 73211 8,218 ?1.12a 31,927 1.326 22,791 11.618Louisiana 581.918 503.717 20.761 131.729 27,51* 14.11111 41,163 67.701 1,596 55,037 20,068Maine 119.119 155,907 7.133 101,013 17,337 1,379 9.899 15.177 1.736 17.360 4.616
Maryland 917,117 721.734 73,703 501.121 57.71$ 77.176 61,117 51,891 6.155 151.537 32.636Massachusetts 1,051.256 907.341 30,663 660.258 73,104 30,916 11,647 69.988 9,219 107,077 77.619Michigan .. 7,201,337 1,799.945 67,011 1,206.891 163.561 48.177 201261 97.1168 41.747 284,656 75,481
Minnesota. 977,943 781243 12280 510.144 68.068 14,791 611227 67,736 9,611 110,761 36,287Mississippi . 318.471 267.760 11,826 176,217 13.761 8,435 18,141 34.307 25,467 26,313 1.943
Minoan 771.690 642,030 76,731 445.951 48239 21,518 46.136 53.451 47,452 70.183 18.626Montana . 181,517 127.1/6 s 1,764 03768 '10,202 4,702 10.198 e 11,/a3 . .. 013.000 ' 1,336Nebraska 779,605 731.617 14,349 151,561 10.021 7,325 15,850 16,506 7,417 38,667 6.874Nevada.... . 101,971 87.773 3.521 63,101 7,77) 2,836 5.01$ 5.005 1.'136 11.109 5.503Nim Nampshotto 125663 101.370 a/71 71.011 7.681 7.185 6.916 9.606 447 19,820 4,025
New Jersey. 1.600.813 1,343,564 ' 41.135 196.876 101,4$, 19,857 168.561 100,047 14174 192,201 30,574Now Mexico 209.466 183,736 7,173 174,042 41,744 5,346 1 -,150 47,477 1.346 22,155 7,224New Vora 4.656.111 8,111,139 118,523 2.175.703 $ 349217 re) 620.701 377,610 67.709 374,127 112.436North Carolina .. 767.912 676,193 26245 491.916 31.411 19,978 66.561 62.006 1.141 14/23 11,0111
Nadi Dakota.. . 110.115 97,191 5,472 62,928 9.216 1.673 5.149 11,858 7.101 7,606 7,840
Ohio .. . 1161,251 1.639.005 80.697 1.088,610 149.834 40,336 193.776 87.687 3.911 705,870 47,671
Oklahoma . . 316.799 339.106 15.944 111.091 25,729 6.662 30.458 29221 2203 39,162 5,628Otegon . 462,980 .03,64. 73,145 272,260 29.931 13A78 35,176 77,550 2,131 48.364 8196Pennsylvsni* 7134.175 1,912.641 91.719 1.266.087 '706.085 (la 195.487 151.790 60.701 414,994 145,130Moods Island.. . 164,511 145,441 5.975 *0E1 11,236 3,471 13,197 11,163 1.201 13,611 6.816
South Carolina... . 433,895 367,619 20,836 7311,401 11.507 4,470 45,170 35,351 10.437 40 834 6.934Smith OaltotA 125,601 109,375 1.503 72,927 8.712 2,054 7,193 10,736 508 13126 1.901
Tennessee ..... 563.338 471.726 71,959 323,07. 30,161 10,933 81.111 85283 9.719 5',721 11.177Tomas . .... - 1,977,817 1,518.181 79,073 1.080135 101.513 83.515 109.053 94.192 13,199 771,848 74,629Utah 208,181 179,911 6,421 121,930 13.477 6.177 17,990 11,291 5.041 111,148 4.712
VIttinant 109,193 78/21 4,762 51,132 6,111 7.046 5,673 6.914 118 78.188 7,765Vittinia . . 841,073 704,677 77,078 499,399 45,359 25,397 58,477 51,971 18 ,015 107.317 23,064Washington. . - 156 033 694.984 77,461 160.119 54,155 7701 66.639 63,842 1,746 111,140 73,662West Skein's 262,183 249,404 10.157 168.454 16,516 1.086 17,68* 28.301 .,501 25,233 3.045Clatanlin. 930.917 777.209 30,751 524.719 61,994 22.497 74,162 61.167 10.188 121138 21,164Wyoming . 73,614 691514 4.383 46.140 5.179 1,966 5.547 6,070 203 7,360 1467
Ontlyttig asses
Canal Zone., ... 17,973 13.528 539 OM 1.110 690 1227 778 1,890 2,565Guam_..... 20,556 16,713 2,068 10.704 975 491 369 2,044 102 3.101
4
1 laciudes *avoidance, for Minimisation at 41 Noels.tneloOes gmendames by school building authowlies.
a Includes estimates to the 4 Slates dial mete viable to differentiate between es.penolurea tot epetabon and lot maintanance of plant.
a Oats Dom published roped or reports.$ Eapeadoures toe maintenance of plant are included wall operation of plante Estimated by Me 016co of Edocalion.
62
Oats me for the 1910.71 whom yam.Does not masses espenditutos to adminisbation by tire State Department ofEducation,
NOTE. docauso 4 founding, detail miry not add to blots.
SQURCE : U.S. Department of Health, Education, and Welfare, Office of Education,"Statistics of Stets School SyslMn*. 1989-70:'

Table 74.- .Summary of expenditures for public elementary and secondary education, by purposesUnited States, L919-20 to 1969-70
Ratline of expenditureSihosi year
1919.20 1929.30
2 3
1939-40 1949-50" 1959-60 1961.62 1963-64 1965-66 1967.68 1969.70
4 5 6 7 8 9 10 11
Total expenditures, allschools 31,936,151 32,316,790 $2,344,049
Current expenditures, all schools
Public elementary andsecondary schools
AdministrationInstructionPlant operationPlant maintenanceFixed chargesOther school services'...
Summer schoolsAdult educationCommunity collegesCommunity services
864,397 1,853,377 1,955.166
861,120 1,843,552 1,941 799
36.752 78,680 91,571632,556 1317,727 1.403,285115.707 216,072 194.36530,132 78,810 73,3219,286 50,270 50,116
36.187 101.993 129,141
(a)3.277 9,825
(1)13,367
(11
(11
AMOUNTS IN THOUSANDS OF DOLLARS
35,137,043
4,722,288
$15,613,255 18,373,339
12,461.955 14,923.361
4,687,271 i2.329,389 14.729,270
220.050 528,108 641,3723.112440 8,350,7311 10,016,280
127.581 1685,036 1283,085214,164 422686 477.34626109 909,323 1,077,279451.663 1A33,2S7 1,226,909
12)
35.614(2)
)(1
13,263266583469257.953
321,324.993
17.218,416 21.063,teo
21,32629,53671,25271,979
Capital outlays 153,543Interest 18,212
Total eXpenditnres, allschools
Current expenditures, all schools
Public elementary andsecondary schools
AdministrationInstructionPlant operationPlant maintenance
. Fixed charges011ter school services1...
370,87892,536
257.974 1,014,176
130,909 100,5782,661.786
189,5142,862,153
517,523
26,99474,872
245.43378,229
2,977,976101,041
PERCENTAGE DISTRIBUTION
70,310120,874301,545155,575
3,754.862791,580
27.743.581
26,877,162
1,249,02818,375,7622,074638
789,7602,388,2061,999689
105,894151,864390,069218,592
0.683,428 -
34,853,578
34 217,773
1,6D6.64623,270,158
2,537,257971,941
3.266,9202,561,856
106,481121,778138,813261,731
+1255,791977,810
4.659.0721.170,782
100.0 100.0 100.0 100.0 190.0 100.0 100.0 100.0 100.0 100.0
83.4 80.0 83.4 80.9 79.8 81.2 82.7 82.7 84.1 95.7
83.1 79.6 82.8 80.3 79.0 80.2 80.7 80.2 815 84.1
3.561.011.22.9
3.456.99.33A2.2
3.5 1.4
3.9 3.8 3.4 3.5 3.5 3.8 3.9'59.9 53.3 53.5 54.5 55.1 55.0 55.7 57.28.3 7.3 6.9 7.0 6.8 6.7 6.3 6.23.1 3.7 2.7 2.6 2.5 2.4 2.4 2.42,1 4.5 5.8 5.9 6.3 6.5 7.2 8.05.5 7.7 6.6 4.8 6.5 6.0 6,1 6.3
Summer schools (3)Adult education .3 .6 ACommunity colleges (1) (1) (2)Community services 1') (1) (1) (1)
Capital outlays. 146 16.0 t I AInterval 1.8 4.0 56
17A1.7
.1
.2
.4
'.4
1.2
15.6 14.03.2 3.3
.3 .3
.5 .31.2 .3
.7
12.9 11.53.0 2.9
1 Prior to 1959.6D, Hems included under "other school services" were listed under"auxiliary services, a more comprehensive classification which also Includedcommunity services.Prior to 1959-60, data shown for adult education represent combined expendi-
, lures for adult education, summer schools. and community colleges.Prior to 1965.66, excludes capital outlay by State and local schOolhousingauthorities.
NOTE. - Beginning In 1959-60, includes Alaska and Hawaii. Because of rounding,detail may not add to totals.
SOURCE: U.S. Department of Health, Education, and Welfare, Office of Education,"Statistics of Slate School Systems."

Table 75.-Personal income, 1971, related to public school expenditures, by State: 1971-72
Stale
Personal income'Total expenditures tonpublic elementary andsecondary education
Current expenditures forpublic elementary andsecondary day schools
TotalOn millions) Per capita
Amount(in thousands),
As a percentof personal
income
Amount(in thousands) I
As a percentof personal
income
1 2 3 4 6 7
United States $857,085 $4,156 1 948,513,986 5.66 3 940,147,779 4.68'
Alabama 10,765 3,087 477,421 4.43 410,521 3.81Alaska 1,525 4,875 151,586 9.94 113,632 7.45Arizona 7,287 3,913 417,339 5.73 379967 5.20Arkansas 6,005 3978 289,012 4.81 250900 4.16Calilomia 94,118 4,640 5,424,400 5.76 4,239900 4.50
Colorado 9,457 4.153 555.349 5.87 469,599 4.96Connecticut 15,322 4,995 770,352 5,03 681,870 4,45Delaware 2.610 4.673 190,000 7.27 136,900 5.25District of ColumbiaFlorida
4.418 .
27,611-5,8703,930
202,4141,397,272
4,585.06
161,3191,167,739
3.654.23
, .
Georgia '16,786 3,599 904,313 5.39 789,377 4.70Hawaii 3,694 4,738 211,095 5.71 174,028 4.71Idaho 2,511 3,409 147,297 5.87 129,182 5.14Illinois 53,400 4,775 2,591,543 4.85 2,082,045 3.90Indiana 21,120 4,027 1,250,179. 5.92 930,606 4.41
Iowa 11.088 3,877 768,076 6.93 606,000 5.47Kansas 9,460 4,112 489,568 5.18 391,665 4.14Kentucky 10,830 3,306 487,273 4.50 434,000 4.01Louisiana 12,010 3.252 763,062 6.35 681.280 5.67Maine 3,416 3,375 209,700 6.14 163.500 5.37
Maryland 18,119 4,522 3971,658 5.91 814,924 4.50Massecbusetls 26.285 4,562 1,355,000 5.16 1.150.000 4.38Michigan 39,850 4,430 2,890,740 725 2,396,506 6.01Minnesota 15,564 4,032 1.149,696 7.39 998,754 6,42Mississippi 6,273 2,788 377,764 622 312.464 4.98
Missouri 18,587 3,940 895,884 4.82 775,542 e.37Montana 2,575 3,629 Pl (a) (3) V/Nebraska 6,077 4,030 315,570 5.19 269,971 4.44Nevada 2,460 4,1122 137,100 5,57 111,000 4.51New Hampshire 2,877 3,796 148,244 5.15 127,962 4.45
New Jersey 35,146 4,811 1,9814500 5.65 1.700,500 424New_Mexice 3,448 3,298 266,562 7.73 228928 621New York 91.742 5,000 5,521,000 6.02 4.039,000 5;06North Carolina 17,661 3,424 893,509 5.06 758,009 429North Dakota I. 2,222 3,538 117,100 5,27 102,800 4.63
Ohio 44,833 4,175 2,255900 5.03 1,948,655 4.35Oklahoma 9,140 3,515 430.000 4.70 387,000 4.23Oregon 8,470 3,959 498,557 - 5.89 431.312 5.09Pennsylvania 49,349 4,147 3,156.000 6.40 2,372,690 421Rhode Island 3.957 4,126 204.328 5.16 . 180,670 4.57
"South Carolina 8,274 3,142 482,550 5.83 414,050 5;00"South Dakota 2,321 3,441 139,929 - 6.03 2 124.179 5.35Tennessee 13.183 3.300 642,037 4.67 559,737 425Texas 42,582 3,726 1,965,005 4.61 1,623,348 3.81Utah 3,768 3,442 242,149 6.43 203,650 520
Vermont 1,660 3,638 143,544 8.70 124,637 7.55Virginia 18,400 3,899 1,079,950 5.87 880,450 4.79Washington 14,221 4.132 823,571 5.78 650,000 4.57West Virginia 5,789 3,275 298,935 5.16 264.335 4:57Wisconsin 17,496 . 3.912 1,077.007 6.16 956,250 547Wyoming 1,331 ' 3,929 93.807 7.05 82.108 6.17
I Includes current expenditures, capital outlay, and interest,- . 3Includes estimates for *imputing State.
3 Data eel available. .
NOTE.-Because of rounding, detail may not add to totals,
SOURCES: U.S. Department of Health. Education, and Welfare, Di5ce of Education,"Fail 1971 Statistics ol Public Schools"; U.S. Department of Commerce, Bureau ofEconomic Analysis. "Survey of Current Business," August 1972.

Table N.-Estimated expenditure per pupil in average dailyattendance in public elementary and secondary
day schools, by State: 197142
State
Expenditure per pupil
Total Current Capitaloutlay
Inierestonschool debt
2 3 4 5
United States $1,091 $934 $119 S38
Alabama 629 543 72 14Alaska 1,696 /.441 407 48MUMS 1,003 911 71 21Arkansas 689 601' 66 21California 1,049 932 86 31
Colorado 1,061 905 125 31Connecticut 4249 1,110 106 32Delaware 1,511 1,097 358 56District of Columbia 1,294 1.063 231
Florida 1,029 861 148 20
Georgia 887 788 70 29Hawaii 1.197 1.020 169 8Mahn 835 732 60 43Illinois 1,181 986 146 49Indiana 1,1D8 837 242 29
Iowa 11.157 970' 161 26Kansas, 1,025 854 158 13Kentucky 722 650 49 23
Louisiana 969 867 76 26Maine 899 793 78 28
Maryland 1,252 962 244 46Massachusetts 1,153 1.020 as 44Michigan 1,410 1,175 146 89Minnesota 1,271 1,134 83 54Mississippi 706 634 61 111
Missouri 955 845 86 24
Montana ir) (11
Nebraska 990 B56 110 24
Nevada 1,113 917 140 56New Hampshire 978 847 102 29
New Jersey 1,399 i.229 133 47New Meek° 961 80 102 10
New York 1.659 1,466 145 58North Carolina 773 695 66 12
North Dakota 824 740 60 24
01110 989 871 91 27Oklahoma, 757 686 62 9Oregon 1,10 979 125 24
Pennsylvania 1,382 1,073 226 83Rhode Island 1,151 1,023 91 37
South Carolina 886 700 90 15
South Dante 891 796 83 12
Tennessee 744 659 56 29
Texas 775 650 95 30Utah B28 -707 107 14
Vermont 1,418 1,232 156 30Virginia 1.052 875 144 33
Washington 1.009. 866 107 36
West Virginia 794 713 70 - 11Wisconsin 1,185 1.069 77 39
Wydming 1,142 1,0111 124 17
Outlying areas:
American Samoa 818 738 48 32Canal Zone 1,201 1,162 39
Guam 964 641
Puerto Rico 477 445 32
I Data net available.
SOURCE': U.S. Department al Health, Education, and Welfare, Nice of Education,"Statislics of Public Elementary and Secondary Day Schools, Fall 1971"; and un-published data,
65
Table 77....Total and currant expenditure per pupil in averagedaily attendance in public,plensentary and secondary
. schools: United Statik992940 to 1971-72
School yearUnadjusted dollars
Adjusted dollars(1971-72 purchasing
potter) I
Total' Current Total= Current
1 2 3 4 5
1929-30 5108 $87 $260 $2091931-32 97 81 277 231193334 . 76 67 236 208
1935.36 $6 74 264 2221937.38 100 84 288 242
193940 106 88 312 2591941-42 110 98 291 2591943-44 125 117 295 2771945-46 '145 136 327 307
1947-48 203 179 358 316
1949-50 ;59 209 450 3631951.52 313 244 490 3821953-54 351 - 265 537 4051955-56 386 294 594 4501957-58 449 3411 646 491
.....,1959-60 472 375 661 5251961.62 530 419 725 5731963-64 559 460 745 6331965-66 654 537 843 6921967-69 ......... ...... 786 658 951 796
1969-70 970 116 1,057 ' 8891971-723 1,091 934 1,093 934.
Based on the Consumer P ice Index, prepared by The ,Bureau el Labor Statistics,U.S. Daparlmeni of Labor
2 Yncludes current txpendit Ire, capital outlay, and interest on school debt.3 Estimated,
SOURCE: U.S. Deparlmenl el Health, Education, and Welfare, Office of Educalion,"Slatistics of State School Systems"; and "Fall Statistics al Public Schools:'
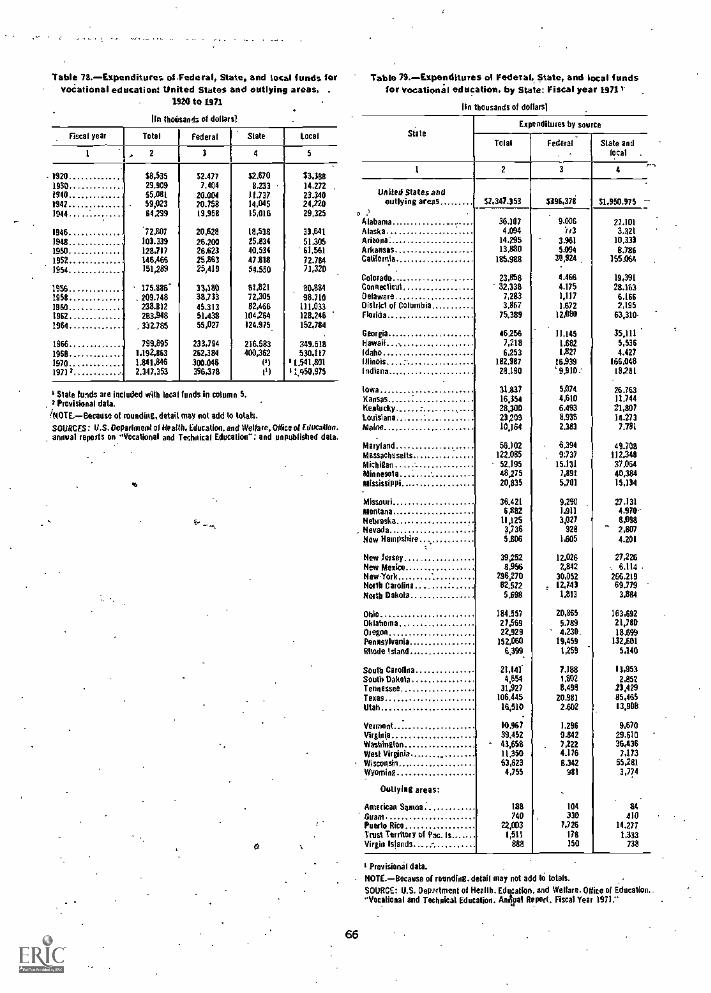
'table 78.-Exgenditures ol.Federal, state, and local funds forvocational education: United States and outlying areas, .
1920 to 1971
lie thousands of dollars)
Fiscal year Total Federal Slate local
1 , 2 3 4 5
1920 $8,535 $2,477 52.670 33,3801930 29,909 7,404 8,233 14,2721940 55,081 20,004 11.737 23.3401942 . 59,023 20.758 14,045 24,2201944 64,299 19,958 15,016 29,325
1946 72,807 20,628 18,538 33,6411948 103,339 26.200 25,834 51,3051950 128,717 26,623 40,534 61,5611952 146,466 25,863 47,818 72,7841954 ... 151,289 25,419 54,550 71,320
1956 175,886" 33,180 61.821 80,8341958 . 209,748 38,731 72,305 98,7101960 238,812 45,313 82,466 111.0331962 283.948 51,438 104264 128,2461964 332,785 55,027 124,975 152,784
1966 799,895 233,794 216,583 349,51819611 1,192,863 262,384 400.362 530,1171970 1,811,846 300,046 01 91,541,8011971= 2,347,353 396,378 14 '1,060,975
Slate folds are included with local funds in column 5,, 2 Provisional data.
INOTE.-Because 01 rounding, detail may not add to totals.
SOURCES: U.S. Oeparfment of Health, Education, and Welfare, Office of Education.annual reports on "Vocational and Technical Education : and unpublished data,
0
66
Table 79.-Exgenditures of Federal,. State, and local fundsfor vocational education, by State: Fiscal year 1971 t
In thousands of dollars]
StateExpenditures by sou CO
Tolal Federal State andlocal
1 2 3 4
United States andoutlying areas $2,347.353 $396,378 $1,950.975
Alabama 36,107 9,006 27.101Alaska 4,094 7,3 3.321Marna" 14,295 3,961 10,333Arkansas 13,380 5.094 8.786Caking& 185,988 30,924 155,064
Colorado 23,858 4,466 19,391Connecticut 32,338 4,175 28,161Delaware 7,213 1,117 6,166District of Columbia 3,867 1,672 2,195Florida 75,389 12,080 63,310-
Georgia 46.256 11,145 35,111Hawaii 7,218 1,682 5,536Idaho 6,253 1,827 4,427Illinois 182,107 16,939 166,048Indiana 28,190 ' 9,910: 18231
Iowa 31,837 5,974 26,763Xansas 16,354 4,610 11,744Kentucky 28,300 6,493 21,307Louisiana 23,209 8,935 14,273Maine 10,164 2,383 7,781
Maryland 56,102 6,394 49,708Massachusetts, 122,085 9137 112,348Michigan 52,195 15,131 37,064Minnesota 48,275 7,091 40,384Mississippi 20,835 5,701 15,134
Missouri 36,421 9.290 27,131Montana 6,882 1.911 4,970--Nebraska 11,125 3,027 B.698Nevada 3,736 928 2,807New Hampshire 5,808 1,605 4,201
New Jersey 39,252 12.026 27,226
New Mexico 8,956 2,842 , 6.114 .
New -York 296,270 30,052 266,219Noe* Carolina 82,522 12,743 69,729North Dakota 5,698 1,813 3.884
Ohio 184,557 20,865 163,692Oklahoma 27,569 5,789 21,780Oregon 22,929 4,230. 18,699
Pennsylvania 152,060 19,459 132,601Rhode I stand 6,399. 1,259 5,140
South Carolina 21,141. 7,188 13,953South Dakola 4,654 1,802 2,852
Tennessee 31,927 8,498 23,429Texas 106,445 20.981 85,465Utah 16,510 2,602 13,908
Vermont 10,967 1,296 9,670Virginia 39,452 9,842 29,610Washington 43,658 7.222 36,436West Virginia 11,350 4,176 7,173
Wisconsin 63,623 B.342 65,281
Wyoming 4,755 981 3,7/4
Outlying areas:
American Samoa 188 104 84Guam 740 330 410Puerto Rico 22,003 7,726 14,277Trust Territory of Pas. Is 1,911 178 1,333Virgin Islands ^ 888 150 738
t Provisional data.
NOTE.-Because of rounding, detail may not add to totals.
SOURCE: U.S. Deprtment of Health, Education, and Welfare, Olfice of Education,."Vocational and Technical Education, Antral Report. Fiscal Year 197i."
Chapter IIIHigher Education
Universities and colleges exist in every State in theUnion and in all of the larger and more populousoutlying areas. More than two-fifths of the entiregroup of more than 2,600 institutions are underthe control of State governments or of cities.counties, or other subdivisions of States. Sevenservice schools are controlled by the Federal Gov-ernment. The remaining 56 percent of the institu-tions are controlled by religious denominations,professional organizations, or self.perpetuatinggroups of public-spirited persons. The publicly con-trolled colleges and universities tend to be muchlarger than their privately controlled counterparts.Approximately three-fourths of all college studentsattend public institutions.
A salient characteristic of higher education inthis country is its diversity. American colleges anduniversities offer a wide range and great variety ofprograms. For example, a junior college usuallyoffers only the first 2 years of training at thecollege level, but a university normally offers a fullundergraduate course in the liberal arts, graduatework leading to the doctorate, and courses pre-paring for entrance into at least two or three ofthe learned professions. Between these two ex-tremes are numerous colleges whicn reflect localneeds and purposes.
Higher education is becoming increasingly acces-sible to all segments of the population. The growthof public junior colleges and other low-cost publicinstitutions means that the oxpenses of the students attending these institutions can be held to aminimum. The Student Loan Program and t-;:hilrGovernment programs have also attricidid many
67
students who otherwise would have found it diffi-cult to finance a college education.
The Office of Education conducts an annualsurvey of opening fall enrollment in which it ob.tains statistics directly from the colleges anduniversities on total and first-time students. Thesedata are usually available within 3 or 4 monthsafter the opening of the fall term. The opening failenrollment survey has been supplemented fromtime to time by a comprehensive survey in whichmore detailed information is requested. In the cornprehensive survey. students are classified not onlyby control of institution and by sex but also bystatus as resident or extension students and byfull-time or part-time attendance.
Other studies of institutions of higher educationwhich have been conducted periodically by theOffice of Education include surveys of faculty andother professional staff; faculty salaries: earneddegrees conferred; enrollment for advanced de-grees; engineering enrollments and degrees: re-ceipts, expenditures, and property: basic studentcharges, including tuition and fees and room andboard rates; and land-grant institutions. The mostrecent data from each of these studies are sum-marized in the pages which follow.
Some of the tables in this chapter provide totalsfor the 50 States and the District of Columbia.Others also include those outlying areasAmericar,Samoa, the Canal Zone, Guam, Puerto Rico, theTrust Territory of the Pacific Islands, and theVirgin Islandswhich have within their borders oneor more institutions of higher education. The coy.erage of each tattle is specified in its title or in thetable stub.
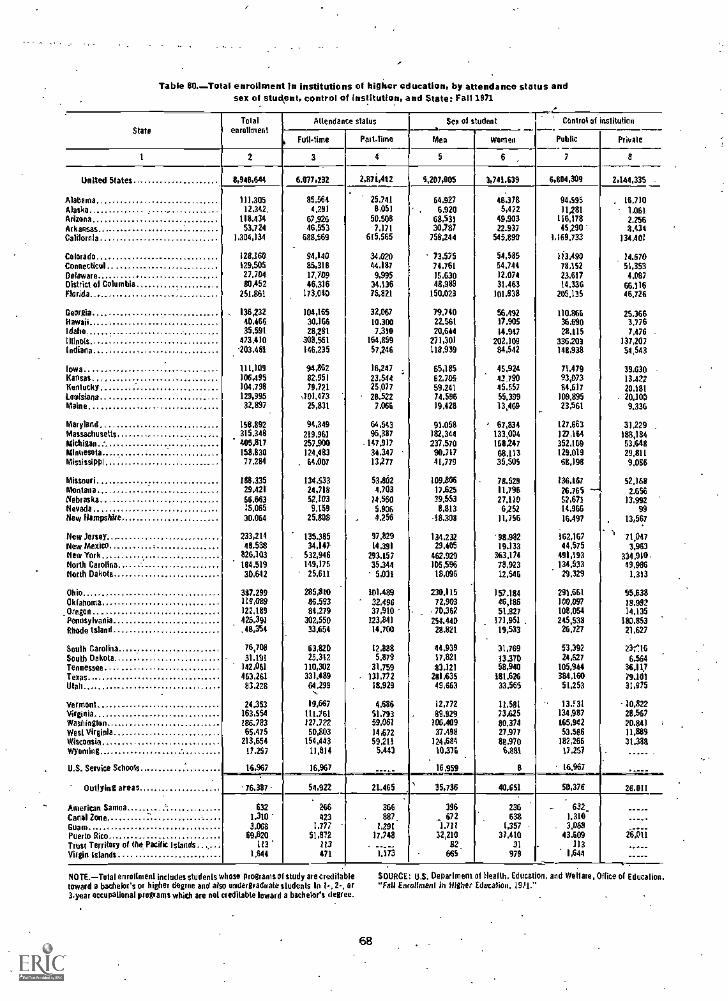
Table 80.-Total enrollment In institutions of higher education, by attendance status andsex of student, control of institution, and State: Fall 1971
StateTotal
enrollmentAttendance status Sea of student Control of inslitutian
Full-time Pait-lime Men Women Public Privale
1 2 3 4 5 6 7 8
United States 8,948,644 6.077,232 2,871,442 5,207,005 3,741.639 6,804,309 2,144,335 -
Alabama 111,305 85,564 25.741 64.927 46,378 94,595 . 15,710Alaska 12,342, 4,291 8,051 6,920 5,422 11,281 1,061Arizona 113,434 67.926 50.508 68.531 49.903 116.178 2,256Arkansas 53.724 46.553 7.171 30,787 22.937 45,290 8.434California 1,304,134 688,569 615,565 758,244 545,890 1,169,733 134,401
Colorado 128,160 94,140 34,020 73,575 54,585 113,490 14.670Connecticut 129,505 85,318 44.187 74,761 64,744 78,152 51.353Delaware 27.704 17,709 9,995 15.630 12.074 23.617 4.087District of Columbia 80,452 46.316 34,136 48,989 31,463 14,336 66.116Florida... 251,861 173,040 76,821 150,023 101,838 205,135 46.721
Georgia 136,232 104,165 32.067 79,740 56.492 110.866 25.366Hawaii 40.466 30.166 10,300 22.561 17,905 36.690 3.776Idaho- 35.591 28,281 7 ,310 20,644 14.947 28,115 7,476 -
Illinois 473,410 308.551 164,859 271,301 202,109 336,203 137,207Indiana 03.481 146,235 57,246 118,939 84,542 148,938 54,543
Iowa 111,109 94,862 16,247 , 65,185 45,924 71.479 39,630 -
Kansas 106,495 82,951 23.544 62.705 43.790 93,073 13,422Kentucky 101,798 79.721 25,077 59,241 45.657 84,617 20,181Lasisiana 129,995 401,473 28.522 74.596 55,399 109,895 - 20,100Maine 32.897 25,831 7.066 19,428 13,469 23,561 9.336
Maryland 158,892 94,349 64,543 91,058 ' 67,834 127.663 31,229 -
Massachusetts 315,348 219,961 95,387 182,344 133,004 122,154 188,184Michigan 405,817 257,900 - 147.917 237.570 168,247 352.169 63,548Minnesota 158,830 124,483 34.347 98,717 68,113 124.019 29.811Mississippi 77,284 , 64,007 13,277 41,779 35.505 66,198 9,086
Missouri 188.335 134,533 53,842 109,806 78.529 136,167 52,168Montana 29,421 24,718 4,703 17.625 11,796 26.765 2.656Nebraska.. 66.663 52,103 14,560 39.553 27,110 52,671 13.992Nevada :5,065 9,159 5.906 8,813 6,252 14,966 99New Hampshire 30,064 25.808 _ 4,256 -18,308 11,756 16.497 13,567
New Jersey 233,214 135.385 97.829 134,232 98,982 .162,167 l' 71,047New Mexico . 48.538 34,147 14,391 29,405 19.133 44,575 3,963New York 826.103 532,946 293.157 462.929 363.174 491,193 334,910.North Carolina 114,519 149,175 35,344 105.596 78,923 134.533 49.986North Dakota 30,642 25,611 5,031 18,096 12,546 29,329 1,313
Ohio 387.299 285,810 101.489 230.115 157.184 291.661 95.638Oklahoma 119,089 86,593 32,496 72,903 46,t86 100,097 18.992Oregon 122,189 84,279 37,910 70.362 51,827 108.054 14,135Pennsylvania 426.391 302,550 123,841 254.440 171,951 . 245,538 180,853Rhode Island .48,354 33.654 14.700 28,821 19,533 26,727 21.627
South Carolina 76,708 63,820 12.888 44.939 31,769 53,392 23:16South Dakota 31.191 25,312 5,879 17,821 13,370 24,627 6.564Tennessee 142.061 110,302 31,759 83.121 58,940 105,944 36,11,7Texas 463,261 331.489 . 131,772 281.635 181,626 384,160 79.101Utah 83.228 64,299
...18,929 49,663 33,565 51,253 30,975
Vermont 24.353 19,667 4,686 12,772 11,581 13,F31 10,822Virginia 163,594 111.761 51,793 89.929 73,625 134.987 28,567Washington.. 186.783 127.722 59,061 106,409 80,374 165,942 20,841 ;
West Virginia 65,475 50,803 14,672 37,498 27,977 53,566 11,889Wisconsin 213,654 154,443 59,211 124,684 88.970 182,266 31.388Wyoming 17.257 11,814 5,443 10,376 6,881 17.257
.
U.S. Service Schools 16.967 16,967 16.999 8 16.967 ..=-........Outlying areas 76,387 54,922 21.465 35,736 40,651 50,376 26,011
.
Americas Samoa.
Canal Zone .
6321.310
266423
366887,
396672
236638
- 632
31°-1,6GuamPuerto Rico
3.06869,620
1,77751,872
1,29117,748
1.711
32,2101,357
37.410 34309063 26.011Trust Territory of the Pacific Islands 113 113 82. 31 113
Virgin islands 1,644 471 1.173 465 979 1,644 -----
NOTE.-Total enrollment includes students whose programs o study are creditabletoward a bachelor's or higher degree and also undergraduate students in 1-, 2-, or3.year occupational programs which are not creditable toward a bachelor's degree.
68
SOURCE: U.S. Deparlment of Health, Education, and Welfare, Office 01 Educalion,"Fail Enroll/nen! in Higher Motion, 19F1.'
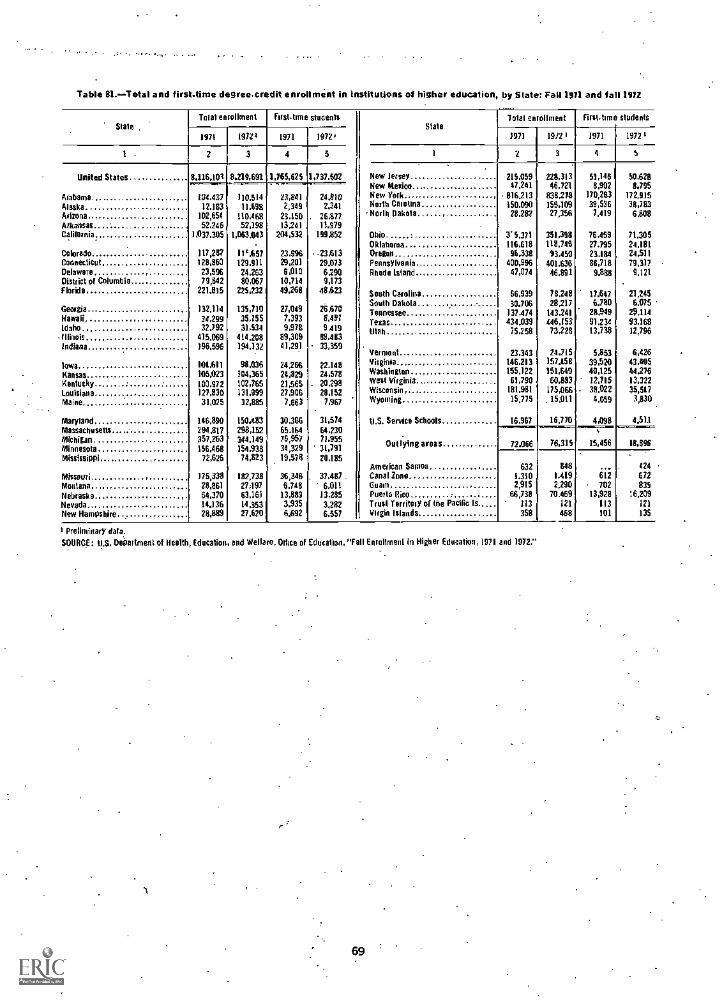
Table 81.Total and first-time degree credit enrollment in Institutions of higher education, by State: Fall 1971 and fall 1972
StaleTo lal enrollment Fast-time students
StaleTotal enrollment First-time students
1971 19721 1971 1972, 1971 19 /2r 1971 1972 1
1 _ 2 3 4 5 1 2 3 4 5
United States 8,116,101 axon 1,765.625 1,737,602 New Jersey 215.059 228,313 51,146 50.620New Mexico 47.241 46,721 8,902 3,795
__ .. - ________Alabama. 104.437 110.514 23,841 24,810 New York 016203 838278 170,283 172,915
Alaska 12,183 11.699 2,349 2.341 North Carolina 150,090 155.109 39,536 38,783
Arizona 102,654 110.468 23.150 26.877 '110101 pooh 28.282 27,356 7,419 6,808
Arkansas 52.246 57,398 13241 11.979Calilornia 11037,305 1.063043 204,532 099)352 Ohio 3'5.371 351,398 76.459 71,305
Oklahoma 116.618 118.746 27,795 24,181Colorado 107,237 11'657 23,9% .23.613 Oregon ... 96,338 93.450 23.184 24,811Connecticut 128.860 129.911 29,201 29.073 Pennsylvania 400,996 401.636 86,718 79,317Delaware 23,596 24.263 6,000 6,290 Rhode Island 47,074 46,891 9.889 9,120District of Columbia 79,842 80,067 00,714 9,173Florida 221,815 225,232 49,268 48,623 South Carolina 66,939 78248 17.647 21,245
South Dakota 30.706 28217 6.780 6.075Georgia .. 132,114 135,710 27,049 26,670 Tennessee 137.474 143241 28,949 29,114Hawaii 34.299 35,155 7,393 9,491IdahoIllinois
34,299
415.069
31,534414.208
9,97889,309
9,40989,483
TexasUtah
434,03975.258
446,15373, 228
91.23413,738
93.16812,796
Indiana 196,596 194,132 41,291 33,359 .
Vermont 23.343 24.715 5.853 6,426
lows 101.611 98.036 24,266 22,148 Virginia_ 146,213 157.158 39,520 43.405
Kansas 105,023 104,365 24,829 24,578 Washington 155,122 151.649 40,125 44,276
Kentucky 100.972 102,765 21,565 20,298 West Virginia 61,790 60,883 12,715 13,322
Louisiana 127,830 131.999 27,906 28,152 Wisconsin 181,981 175,066 38,022 35.517
Maine 31,025 32,885 7,663 7.967 Wyoming 15,775 15.011 4,059 3,830
MarylandMassachusetts
146.890294.817
150.483298,152
30.36665.164
31.57464.230
U.S. Service Schools 16.967 16.770 4,099 4,513
Michigan 357.263 344.149 76,957 71,955Minnesota 156,468 154,938 34,329 31,791 Outlyine areas 72,066 76.315 15,456 18.396
Mississippi 72,626 74,823 19,578 20,185American Samoa 632 848 . 424
Missouri 175,338 132,733 36,346 37,487 Canal lone 1.310 1.419 iii 612
Montana 28.861 27;197 6.748 6,011 Guam 2,915 2,290 702 835
Nebraska 64,370 63,16i 13,889 13,285 Puerto Rico 66,738 70.469 13,928 :6,209Nevada 14,136 14.353 3.935 3,282 Trusl Territory of the Pacific Is..... 113 121 113 121
New Hampshire 28.889 27.620 6.692 6,557 virgin Islands 358 468 101 135
1 Preliminary data.
SOURCE: U.S. Department of Health, Education, and Wellare, Oltice of Education. "Fall Enrollment in Higher Education, 1971 and 1972."
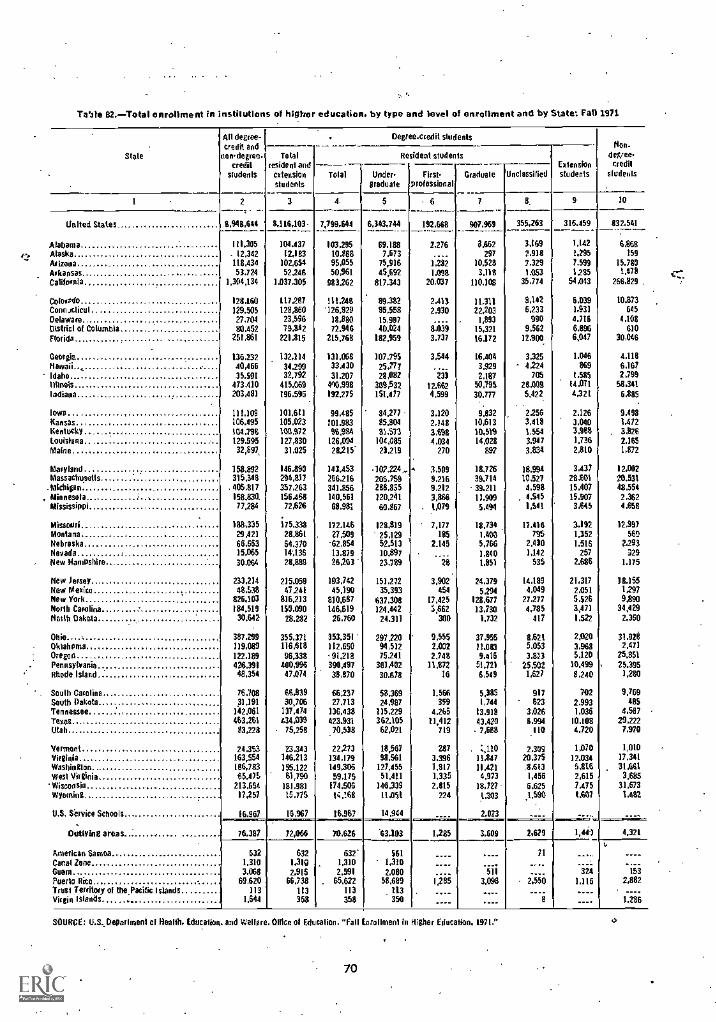
Tat,. U.Total enrollnient in instilutlons of higher education, by type and level of enrollment and by State: Fall 1.971
Stale
All degree-credil and
nondegree-credit
studenls
Totalresident and
extensionstudents
Degree-credit studentsNon -
degreecredil
sludeulsIola]
Resident
Under-graduate
students
GradualeExtensionstudentsFirst-
professional
r---Unclassified
2 3 1. 5 6 7 8, 9 10
United States 8,348,614 8.116,103- 6,343,744 192,668 307,959_ 355,263 316.159 832,541
Alabama 111,305 101,137
.7,799,641
103,295 69.188 2,276 9,662 3,169 1,142 6,868
Alaska . 12,342 12,183 10.888 7.673 297 2.918 1,295 159
Arizona 118,434 102.654 95,055 75,916 1,282 10.528 7,329 7,599 15.780
Arkansas 53324 52,246 50,961 45,632 1.098 3,118 1.053 1285 1,178
California 1.304.134 1,037,305 983262 817.343 20,037 110.108 35,774 54,043 266,829
Colorado 128,160 117,287 111,248 89,382 2,413 11,311 8,142 5.039 10.873
Conn Alicia 129.505 128,860 '126.929 95,558 2,930 22,203 6,233 1,931 615
Delaware 27.704 23.596 18,880 15,997 1,893 990 4.716 1.108WWI of Columbia 80.452 79,812 72.946 40.024 8.039 15,321 9,562 6,896 610
Florida 251,861 221,815 215.766 182.954 3.737 16,172 12,900 6,047 30,046
Georgia 136,232 132,114 131.968 107,295 3,544 16,404 3,325 1.046 4.116
40,466 34.299 33,130 25,777 3,929 4,224 869 6,167Idaho 35.591 32.792 31.207 28,082 233 2,187 705 1.585 2,799Illinois 473.410 415,069 430298 309,532 12.662 50.795 25.009 14,071 58,341
Indiana 203,481 196.595 192,275 151.177 4,599 30.777 5,422 4,321 6,885
lows 111,109 101,611 99,485 84,277 3.120 9,832 2,256 2.126 9.198
Kansas 106.495 105.023 101.983 85,801 2,148 10,613 3,118 3.040 1.412
Kentucky 104,799 100,972 96.984 81.573 3,698 10,519 1,554 3,968 3,826
Louisiana 129,995 127,830 126,094 104,085 4.034 14.028 3.917 1,736 2,165
Maine 32,897 31,025 28,215 23,219 270 897 3.834 2,810 1,872
Maryland 158.892 146.890 143.453 3,509 18,726 18.994 3.437 12.002
Massachusetts 315,318 294,8)7 256,216 206,759 9,216 39.714 10,527 28,601 20.531-Michigan 405,817 357,263 311,856 288,875 9,212 39.211 1,598 15.407 48.554
, Minnesota 158.830. 156.468 110.561 120.241 3,866 11.909 4,545 15.907 2,362Mississippi 77,284 72,626 68,981 60,867 1,079 5,144 1,511 3,545 1,658
Missouri 188,335 i75,33$ 172.146 128,819 7,177 18.734 17.416 3.192 12,997
Montana 29,421 28,861 27,509 25.129 185 1.030 795 1.352 560
Nebraska 66.663 64.310 -62,854 52.513 2,145 5,766 2,430 1.516 2,293
Nevada 15,065 14,136 13.879 10,897 1,840 1,142 257 729
New Hampshire,, 30.064 28,889 26,203 23.789 28 1.851 535 2.686 1,175
New Jersey 233,214 215.059 193,742 151,272 3,902 24.379 14,189 21,317 18.156New Mexico 48.538 47 241 45,190 35.393 454 5,294 4,049 2,051 1297New York 826,103 816.213 810,687 637,308 17,425 128,677 27.277 5,526 9.890North Carolina 181.519 150.090 146.619 124.442 3,862 13.730 1,785 3,471 34,129North Dakota 30.642 28.282 26,760 24.311 300 1,732 417 1,522 2,360
Ohio 387.299 355.371 353.351 297220 9.555 37.955 8,621 2020 31,92$Oklahoma 119,089 116,618 112,650 94,512 2,002 11.083 5,053 3.968 2,471
Oregon 122,189 96,338 .91218 75,211 2,248 9,416 3.813 5,120 25.851Pennsylvania 426.391 400,996 390,197 361,402 11,872 51.721 25,592 10.499 25.395Rhode Island 48,354 42,071 38,870 30.678 16 5,549 1,627 8,240 1280
South Carolina 76,708 66.939 66237 58.369 1,566 5,385 917 702 9.769South Dakota 31,191 30,706 27,713 24.987 359 1,714 623 2,993 465Tennessee 142,061 137,174 136,438 115,229 4,265 13,918 3,026 1.036 4,527Texas 453,261 434,039 423.931 362.105 11,412 13.420 6,994 10.108 29,222Utah 83,228 75,258 70,538 62 ,021 719 7,6138 .110 4,720 7,970
Vermont 24.353 23,343 22,273 18,567 287 2,309 1,070 1,010
Virginia 163,554 146.213 134,179 98,561 3.996 11,817 20.375 12.034 17,341
Washington 186,783 155.122 149,306 127,455 1,817 11,421 .8,613 5,816 31,661Weal Virginia 65.475 61,790 59,175 51,411 1,335 4.973 1,456 2,615 3,685Wisconsin 213,654 181,981 174.506 146,339 2,815 18,727 6.625 1,475 31,673
Wyoming 17,257 15.775 11.051 224 1.303 .1,590 8,037 1.482
U.S. Service Schools 16,961 15,961 16,967 14,944 2.023
Outlying areas 76.387 72,066 70,626 '63.103 1,285 3.609 2,629 1,11) 4,321
American Samoa 532 632 632' 561 11Canal 2oneGuam
1.3103.068
1.3192.915
1,3102,591
1.3102,080 511
...324
Puerto Nice 69,620 66,738 65.622 58,589 1,285 3,098 1.116 2,882'Trust Territory of theacific Islands 113 113 113 213Virgin Islands 1,644 358 358 350 1.286
SOURCE: U.S.,Deparlmen1 of Health, Education and Welfare, Office of Eclucalien, "Fall Enrollment in Higher Education, 1971."
70
0
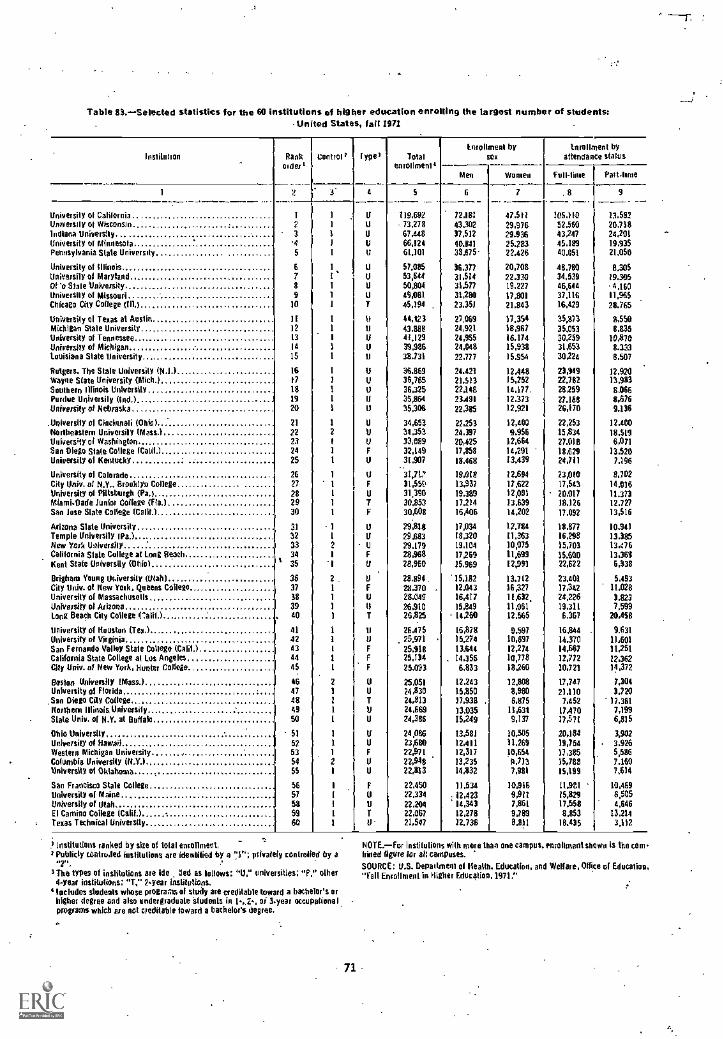
Table 83.Selected statistics for the 60 institutions of higher education enrolling the largest number of students:United States, fall 1971
histilinion Rankindex,
Control, type) Totalenrollment,
trirollmont bysex
tnrollment byattendance status
Men Women fulllime Part-lime
1 2 1 4 5 6 7 ,8 9
Universily of California 1 1 U 119.692 72.181 47,511 106.210 13.582Universily of Wisconsin . 2 1 U - 73,278 43,302 29,976 52.560 20.718Indiana UniversityUniversity of Minnesota
34
1
I
U
U
67.44866,121
37.51240.841
29.93625.283
4324745.189
24,20119,935
Pennsylvania State University 5 1 U 61.101 38.975* 22.426 40.051 21,050
University of Illinois 6 1 U 57.085 36,377 20,708 48,780 8.305UniversIly of Maryland 7 1 U 53,644 31,514 22,330 34,539 19.305Dt 'i) Stale University 8 1 U 50,804 31.577 19,227 46,644 . 4,160University of Missouri 9 1 U 44,081 31,280 17.801 37.116 11,965Chicago City College (III) 10 1 T 45,194 23.351 21,843 16,429 28.765
University al Texas at Austin 11 1 ti 44,123 27,069 17.354 35,873 8.550Michigan Stale University 12 1 U 43,898 24,921 18,967 35.053 8.835University of Tennessee 13 1 1.1 41.129 24,955 16.174 30,259 10,870University of Michigan 14 I U 39,986 24,048 15,938 31,653 8.133Louisiana State University 15 1 U 38,731 22.777 15.954 30,224 8.507
Rutgers. The Stale University (11.1.) 16 1 U 36.869 24.421 12.448 23,949 12.920Wayne State University (Mich.) 17 I U 39,765 21.513 15,252 22.782 13,983Southern Illinois University 18 1 U 36,325 22,148 14,177. 28,259 8.066Purdue Universily (Ind.) 19 1 U 35,864 23.491 12.173 21.188 8,676University of Nebraska 20 1 U 35,306 22,385 12.921 26,170 9.136
University at Cincinnali (Ohio) 21 1 U 34,653 22,253 12,400 22,253 12.400Northeastern University (Mass.) 22 2 U 31.353 24.397 9.956 15,834 18,519University of Washington 23 1 U 37,089 20,425 12,664 27.019 6,071San Diego Slate College (Calil.) 24 1 F 32,149 17,858 14,291 18.629 13.520University of Kentucky 25 l U 31,907 18.468 13.439 24,711 7,196
University of Colorado 26 1 U 31,71.° 19,018 12,694 23,010 8,702City Univ. of N.Y.. Brooklyn College 27 1 F 31,55t, 13 .937 17,622 17,543 14.016University 0 Pittsburgh (Pa.) 28 1 U 31,390 19.389 12,001 20.017 11.373Miami-Dade Junior College (Fla.) 29 1 7 30.853 17.214 13,639 18,126 12,727San lose Slate College (Calif.) 30 1 F 30,608 16,406 14,202 17.092 13,516
Arizona Slate University 31 1 U 29618 )7,034 12.784 18,877 10,941Temple Universily IP8.) 32 1 U 29.683 18,320 11,363 16,298 13.385New Yaik thriversily 33 2 U 29.179 19.104 )0,075 15,703 13,476California Slate College at Long Beach 34 1 F 28,968 17269 11,699 95.600 13,368Kent State Masi-say (Rio) 4 4 35 '1 tt 28,9E0 15,969 12,991 22,622 6,338
Brigham Young University (Utah) 36 2 . 11 28.894. 15,182 13.712 23,401 5,493City Univ. ol New York. Queens College 37 1 F 211.370 . 12.043 16,327 17.342 11#28University of Massechusells 38 1 U 28.049 16,417 11,632 24,226 3.923University a A/I2041 39 1 11 26,910 15,849 11,061 19.311 7,599Long Beach City College ("am.) 40 1 T 26,825 14,260 12.565 6.367 20,458
University of Houston (Tex.) 41 1 U 26.4.75 16,878 9.597 16.844 . 9.631University of Virginia 42 1 1) 25.971 15.274 10,697 14.370 11,601San Fernando Valley Stale College (Calif.) 43 1 F 25.918 13.644 12,274 14,667 11,251California State College at Los Angeles 44 1 F 25,134 . 14,356 10,778 12,772 12,362City Univ. of New York, Hunter College 45 1 F 25,093 6,833 18.260 10,721 14,372
Bohm Universily Mass.} 46 2 U 25.051 12.243 12,808 17,747 7,304University of Florida 47 1 U 24,830 15,850 8,980 21.110 3,720San Diego City College, 48 1 T 24,813 17,938 , 6,875 7,452 17,361Northem Illinois Universify 49 1 U 24,669 13.035 11,63t 17.470 7,199Slate Univ. of N.Y. at Buffalo 50 1 U 24,386 15.249 9,137 17,571 6,815
Ohio University 51 1 U 24,086 13,581 10,505 20,184 3,902University of Hawaii 52 1 U 23,680 12,411 11.264 19,754 3.926Western Michigan University 53 1 F 22,971 12,317 10,654 11,385 5,586Columbia University (N.Y.) 54 2 U 22,948 13,235 9.7)3 15,788 7.160University of Oklahoma 55 I U 22,813 14,832 7,981 15,199 7.614
San Francisco Stale College 56 1 F 22.430 11,534 10,916 11,901 10,469University of Maine 57 1 U 22,334 .12,423 9,911 15,829 6,505University of Utah 58 1 U 22.204 14,343 7,861 17,558 4.646El Camino College (Calif.) 59 I 7 22,067 12,278 9,789 8,853 13,214Texas Technical University 60 1 0 21,547 12.738 8,811 18.435 3.112
Institutions ranked by size of total enrollment./ publicly contruJed institutions are identified by a "1"; privately controlled by a
"2",;The types of inslitutions are ide :led as billows: "U," universities: "F." other4-year institutions: "T," 2year institutions.
'Includes students whose programs of study are creditable toward a bachelor's orhigher degree and also undergraduate students in 1.,,2, of 3year occupationalprograms which we not creditable toward a bachelor's degree.
NOTE. For institutions with more than one campus enrollment shown is the combilled figure for all campuses.
SOURCE: U.S. Department of Health. Education, and Welfare, Office of Education,"11 all Enrollment in Higher Education, 1971."
7 1

Table K.-Total enrollment in institutions of higher education, by control of institution and by States Fall MD.
Stale
Public ± Private
Stale' LocalStateandlocal
Independentof church
Denominalional
Protestant
2 6 7
RomanCatholic
8
Other
United States..
AlabamaAlaskaArizona..ArkansasCalifornia
ColoradoConnecticutDelawareDistrict of ColumbiaFlorida
GeorgiaHawaiiIdaho,flinchindium
IowaKansasKentuckyLouisianaMaine
MarylandMassachusettsMichiganMinnesotaMississippi
MissouriMontanaNebraskaNevadaNew Hampshire
New ferseyNew MexicoNow YorkNinth CarolinaNorth Dakota
OhioOklahoma.OregonPennsylvaniaRhode Island
ioullt CarolinaSouth DakotaTennesseeTexas'Utah
VermontVirginiaWashingtonWest.ViminiaWisconsinWyoming
U.S. Service Schools
Outlying areas
Canal ZoneGuamPuerto RicoVirgin Islands
8,498,117 4,450,096 1,465,635 455,277 1,213,073 478,604 392,912 42,520
102,70710,017
110,10651,639
1.255,732
121,606124,931
23,85075,920
234,176
126,19136,51034.700
453,573191,156
108,312101,29796,944
120,72032,180
148,557303,038394,095159,07673,128
183,57029,69966.37512.960
. 29,046
210,37243,733
776,608171,577,30,484
371,412109,542114,279410,47945,087
70.23030,731
135,499438,54879.144
22,114149,217180,39763,230
201,55415,028
17,036
06.6388,770
65,04941,333
437,965
99,94072,93019,904
86,952
96,46832,96923,837
184,841135,003
53,47365,07675,73496.81723,110
75,952110,398215,466128,95650.095
93,62420,92747,34112.87515,786
104,42239,383
147,93598,88027,263
215,26489,70663,296
191,30525,061
43,90723,85739,206
256,50149,630
12,514120,910142,03351,452
139,3018.800
17,036
39,8262,070
625,454
.6,641.....
10,51199,609
5,357
3,44293,646
8,30220,460
287
36,3123,624
98,143
9,372
31,3761.9943,646
19,4001,090
123.1825,1641,936
22,3941.162
36,45233,491
1.802
77,241
15,018
21,9524J,24
3,000
61,550
4,688
1,380757
90,598
400 3,34446,2722,828
33,8811,152 35,097
, 8,067651tis
36,584 79,86612,401
6.189 15,3461,480 235
5.0164,055 8.3%
7,719
5,812 20,734162,842
28,442 23,6823,ga
4,149 1,557
7,175 23,848
17,032
165,80518,897
39.586604
1,0137,958
2,253
28,848
3,059
8,536. 1,698
4,65285
10,485
45,5784:9
294,14110,932
33,7289.160
10,501104,065
15.479
8,6291,496
14,04516,473
1,231
7,716S332,6227,381
11.089
9.6441,247
8517,479
15,398
9,68070
1,11615,6575.864
16,299103
2.23725,51226,601
16,1329,3949,7123.365
2,8501.826
12.90219,8907,355
11,335560
5.091
4,457
6.42536,675
645
31.6758,4082,928
23,028
13.6394,605
20,77948,023
835
18,00613,7913,4534,060
1,757
-
24,421
1.601
5,659
15,8713,702
1.480
17.151
1,5754,652
6,4877.8011,351
6,63424,19615,4609,816
16,1182,2194.645
2.775
18,861
2,82134,668
1.029040
2t,4050289
50,6264,547
773
1.46911,462
-- -.-1,884
663
3.869744
16,616
346
1,3075,019
302
1.195
263152
62,2
4,452
1.314
68,216 47,555 12,724 7,937
1,2442.349
63.1771,446
1,2442,349
42,5161,446
12.724 7,937
3 I nclodes institutions ender Federal-Control (U.S. Service Schools and Canal loneCollate).includes Jewish, Letter Day Saints, Greek Orthodox, Russian Orthodox, andUnilarian.
NOTE,- includes studenti whose prevails of study are creditable toward abachelor's or higher degree and also simians la 1, 2-, or 3-year undergraduale
72
programs which are not creditable inward a bachelors degree, but which aredesigned to prepare for immediate employment or to provide general education.
SOURCE: U.S. Department of Health, Education, and Welfare. Office of Educailon,"Advance Report on Opening Fall Enrollment in Higher Ede:Arlon, 1970: Instilu-'tonal Data": "Education Directory, 1970-71:Higher Education"; and unpublisheddata.
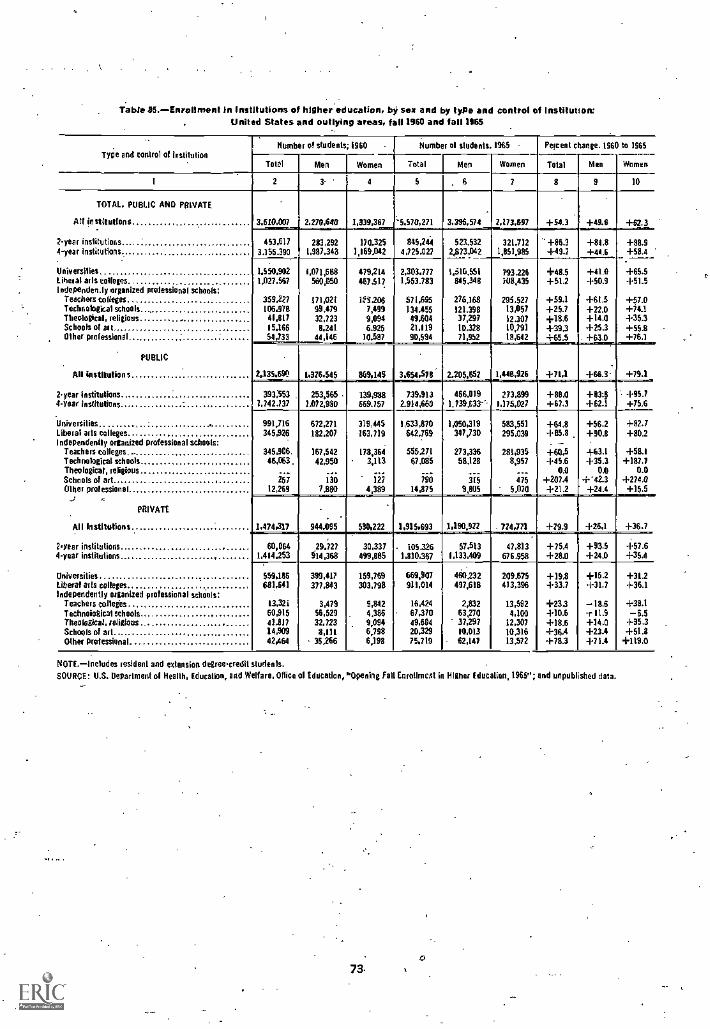
fable 35.-Enroilment In institutions of higher education, by sex and by type and control of Institution:United States and outlying areas, fall 1960 and fall 1965
Type and control of institutionNumber of students; 1960 - Number ol students 1965 - Percent change. 1960 to 1965
Total Men Women Total Men Women Total Men Women
I 2 3- 1 5 . 6 7 8 9 10
TOTAL, PUBLIC MD PRIVATE
Ail institutions 3,610,007 2,270,640 1,339,367 '5,570,271 3,396,574 2373,697 +54.3 +49.6 +62.3
t-year institutions 453,617 283,292 170,325 845.244 523,532 321,712 +86.3 +84.8 +88.9I-year institutions 3.156.390 1,987,343 1,169,042 4,725.021 2,873,042 1,851,985 +49.7 +44.6 +58.4
Universities 1.550.902 1,071,608 479,214 2,303.777 1.516,551 793.226 +48.5 +41.0 +65.5Liberal Ms toilers 1,027.567 560,050 467.517 1.553.783 845,348 308,435 +51.2 +50.9 +51.51ndependen.iy organized professional schools:
Teachers colleges 359,227 171,021 121.206 571,695 276,168 295.527 +59.1 +61.5 +57.0Technological schools 106.978 99.479 7,499 134.455 121.398 13,057 +25.7 +22.0 +74.1Theological, religious 41.817 32,723 9,094 49,604 37,297 12.307 +18.6 +14.0 +35.3Schools of art 15.166 8,241 6,925 21,119 16.328 10,791 +39,3 +25.3 +55.8Other professions' 54,733 44,146 10,587 90,594 71,952 18,642 +65.5 . +63.0 +76.1
PUBLIC
All institutions 2.135.550 1,326,545 869,145 3,154578 2.205,652 1,448,926 +71,1 +66.3- +79.1
!cor institulions 393;553 253,566 139,938 731,913 466.019 273,899 +88.0 +618 ' +95.7I-year institutions 1,742.137 1.072,990 869,157 2,914,660 1,739.533- 1,175,027 +67,3 +62.1 +75.6
1niversities 991,716 672,271 319,445 1,633,870 1,050,319 583,551 +64.8 +56.2 +82-7.iberal arts colleges 345,926 182,207 163,719 642,769 347,730 295,039 +05,8 +90.8 +80.2ndependently organized professional schools: . -Teachers colleges 345,906. 167,542 178,364 555.271 273,336 281,935 +60,5 +63.1 +58.1Technological schools_ 46,063. 42,950 3,113 67,065 58.128 8,957 4.45.6 +35.3 +187,7Theological, reloluus 0.0 0.0 0.0Schools of act 257 lir iii WO 315 iii +207.4 4'42,3 +274.0Outer professional 12,269 7.880 4,389 14,875 9,805 5,070 +21.2 +24.4 +15.5
...; ,.PRIVATE -
All Institutions 1,474,317 944,095 590,222 1,915,693 1,190,922 - 724,771 +29.9 +26,1 +36.7.
!vor institutions 60,064 29,727 30,337 105.326 57,513 47,813 +75.4 +93.5 +57.6I-year institutions 1,414,253 914,368 499,085 1,810,367 1,133,409 676.958 +28,0 +24.0 4-35-5
Universities 559,186 399,417 159,769 669,907 460.232 209.675 +19,8 +15.2 +31.2.Liberal ads colleges 681,641 377,843 303,798 911,014 497,618 413,396 +33.7 +31,7 +36.1Independently organized professional schOols:
Teachers colleges..,. 13,321 3,479 9,842 16,424 2,832 13,592 +23.3 -18,6 +38.1Technological schools , 60,915 56,529 . 4,386 67,370 63,270 4,100 +10.6 +11.5 -6.5Theological, religious . 41.817 32,723 9,094 49,604 37,297 12,307 +18.6 +14.0 +35,3Schools of art 14,909 8,111 6,798 20,329 10,013 10.316 +36.4 +23.4 +50.8Other professional 42,464 36,266 6,198 75,719 - 62,147 13,572 +78.3 +71.4 +119.0
NOTE.-Includes resident and extension degreecredit students.SOURCE: U.S. Department ol Health, Education, and Welfare, Office 01 Education, "Opening fall Enrollmest in Higher Education, 1965"; and unpublished data,
73.
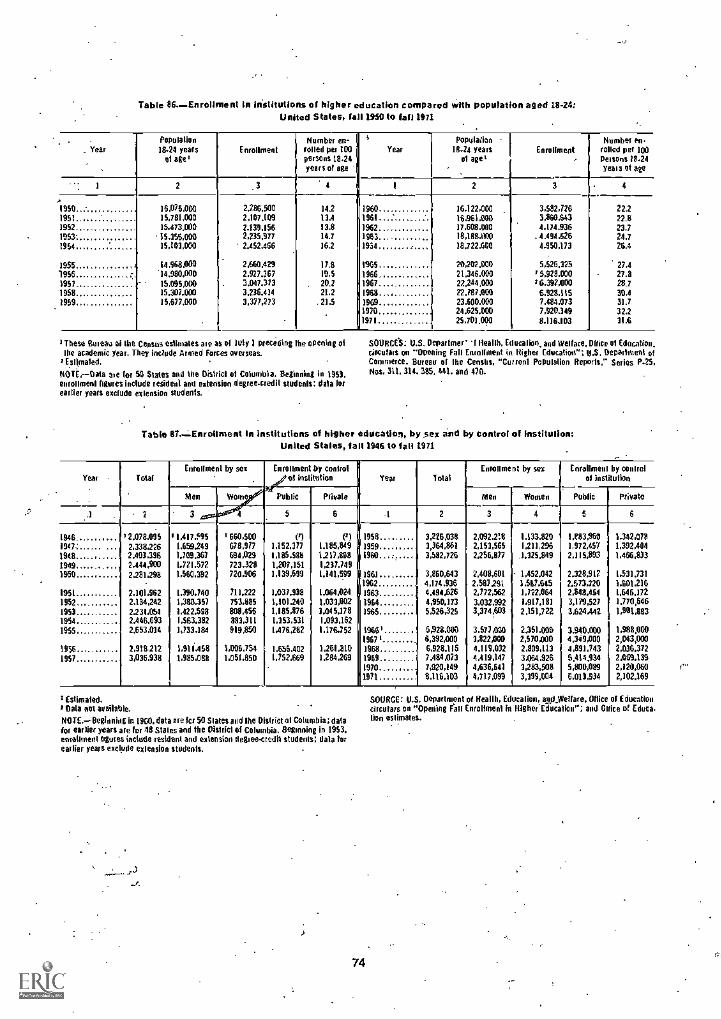
Table 86.-Enrollment in institutions of higher education compared with population aged 18-24:United States, fall 1950 to tall 1971
. .
_ YearPopulation18.24 years
ol age IEnrollment
Number en-rolled per 100persons 18.24years of age
YearPopulation
18.24 yearsol age%
Enrollment-
Number en-tolled per 100Peisons /8-24Seals el age
1 2 .3 4 I 2 3 4
1950195119521953'1954
1955.1956195719581959
,
161075.00015,781,00015.473.000
*15.156,00015,101200
14,968200'14,980,000
- 15,095,00015.307,00015,677,000
2286.5002,107,1092.139.1562,235.9772,452,466
2,660.4292,927,3673247,3733236,4143,377,273
14211A13.814.716.2
17.819.520.221.2
.21.5
19601961196219531934
19651966 .............1967
19681969 .............19701971
16,122.000 .16.961.00017.608.00018,188.1100
18,722800
20,202,00021,346.00022,244,00022,78720023.600.00024,62520025,701.000
3,582,7263,860.6434,174.936
.4.494.8264,950,173
5,526,125' 5,928.000I 6.392,0006.929.1157,484.0737,920.1498.116,103
22/22.823.724.726.4
27.427.828.730,431.732.211.6
1 These Duman of the Census estimates ale as of luly 1 preceding he opening ofthe academic year. They include Armed Forces overseas
,Eilitnaled.ROTE. --Oats ale for 50 States and the District of Columbia. Beginning in 1953,enrollment figures include resident and extension degree-credit studenls: data losearlier years exclude exlension students.
SOURCE'S; U.S, Departmer" I Health, Education, and Welfare, Office of Education,circulars on "Opening Fall Carolinian! in Higher Education"; H.S. Department ofCommerce. Bureau of the Census, "Cutien1 Population Reporls," Series P-25,Nos, 311, 314, 385, 441, and 470.
Table 81.--Enrollment in institutions of higher education, by sex and by control of Institution:United States, fall 1946 to tall 1971
Year TotalEnrollment by see Enrollment by control
of Institution i Year TotalEnrollment by sex Enrollment by conirel
of institution
Men Wane Public Private Men Women Public Private
3 4 5 6 2 3 4 5 6r1946 12.078,095 11,417,5 1 660,500 (1) (21 t, 1958.. , ..... 3,226,038 2,092.2.8 1.131.820 1,883260 1.342,0781947* 2,338,226 1859249 678,977 1,152,377 1,185,849 1 1959 1,364,861 2,151,565 1,211,296 1,972,457 1,392,4041948 2.403.396 1.109.367 699.029 1,185.528 120.10 )1960 3,582,726 2,256,877 .1,125,849 2,115,893 1,466,1333
1449 2.444200 1.721.572 723.326 1207,151 1,237.749 f3930 2.281,298 1,560,392 720,906 1,139,699 1,141,599 1961 . .. 3,860,643 2,408,601 1,452,042 2,328,917 1.531,731
1962 4,174.936 2.587291 1,5117.645 2,573.120 3.601.2161951 2.101,962 1,390.740 711,222 1,037,938 1,064224 1963... 4.494,626 2,772,562 1,722,064 2,848,454 1,646.172
1952 2,134,242 1,380.357 753.885 4101.240 1,031,002 1964 4,950,173 3,032.992 1.917,181 3.179,527 1.770,6461953 2.231.054 1.422.598 800.456 1.185,876 1.045.178 1965 5,526,325 3,374,603 2,151,722 3,624,442 1,901,883
1954 2,446,693 1,563,382 881,311 1,153.531 1,093,1621955 2,653.034 1,733.184 919,850 1.476282 1.176.752 19661 5,928.000 3.577,000 2.351.000 3.940.000 1,988,000
1967 t 6,392,000 1,822,000 2,570,000 4,349,000 2,043,0001956..,....,, 2,938,212 1,911.458 1206.754 1.656.402 3,261,810 1968 ..... ... 6.928,115 4,119,002 2.009,113 4,891,743 2,036,3721957 3236.938 1.985,088 1,051,850 1,752,669 1,284,269 1969 7,484,073 4.419,147 3,064,926 5814,934 2,039,139
1970.- 7,920,149 4,636,64) 1,283,508 5,800,089 2,1241,060
1971 8,116,303 4,717,099 3,199,004 6.013,934 2,102.169
2 Estimated.I Oats net available.
NOTE.--8eginniag in 1980, data vela 50 Slates and the District of Columbia: datafor earlier years are fur 48 Stales and the Oistrkl of Columbia, Beginning in 1953,mailmenl flutes include resident and extension levee-credit students; dela forearlier years exclude exlension students.
1,--. l-r.
74
SOURCE: U.S. Oepattment of Health, Education, andlielfare, Office of Educationcirculars on "Opening rail Enrollment In Higher 'Educallon"; and Oldie of Educa-tion estimates.
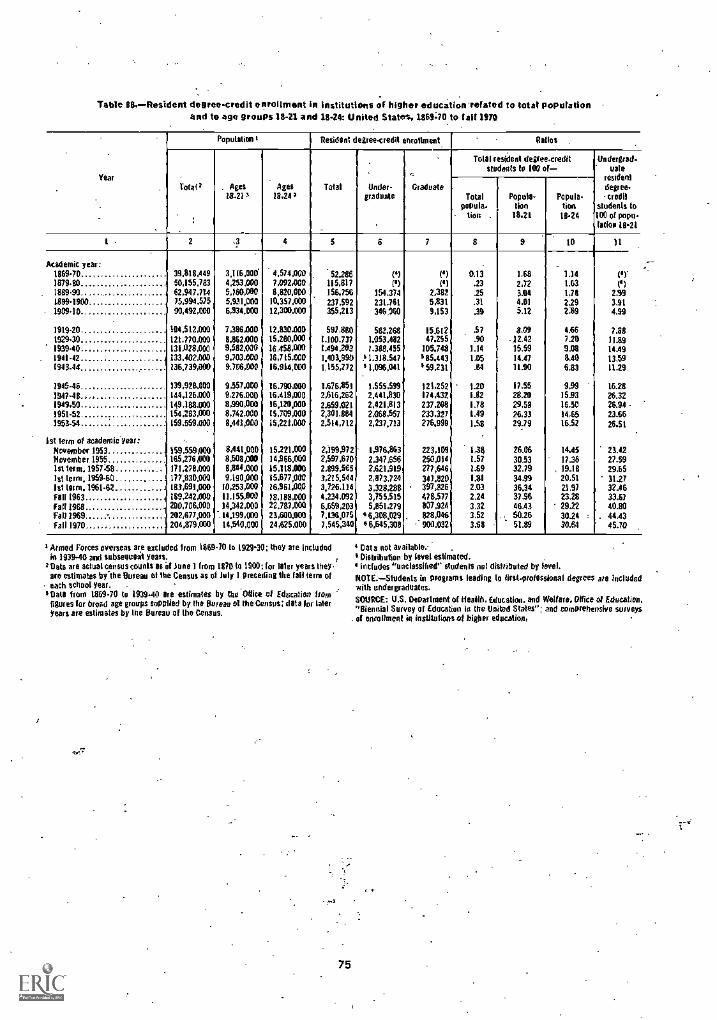
Table 88.-Resident degree-credit enrollment in institutions of higher educationletated to total populationand to age groups 18 -U and 18-241 United States, MOO to fall ISM
Year
Population ' Resident degree-credit enrollment Ratios
.
Totat1 . Ages18.211
.
Ages13.241
Total Under-graduate
..:
Graduate
Total resident degree.creditstudents to 100 of-
Under/rad-unto
residentdegree-credit
students to100 of poet'.lacier 18.21
Totalpapule.
lion .
haute-lion
18.21
Papilla-tion
18.24
1 . 2 4 5 6 7 8 9 10 11
Academic year: . - -0869.70 39.818,449 3316,000 4,574.000 52286 (1) (5) 0.13 1.68 1.14 (1).1879.80 50,155.783 4,253,000 7,092,000 115,817 {5) ('1 .23 2,72 1.63 (1)1889.90 62,947.714 5,160,000 8,820,000 156,756 154,374 2,382 .25 3.04 1.78 2391899.1900 75,994,535 5,931,000 10.357,000 237.592 231.761 5,831 .31 4.01 2.29 3,411909.10. 99,442,000 6334,000 12,300.000 355,213 346 360 9,153 .30 5.12 239 4.99
1919-20 104.512,000 7,386,000 12.830.001) 597,880 582,268 15.612 .57 8,09 4.66 7.381929.30 121.770.000 8.862.000 15,260,000 1100.777 1,053,482 47,255 .90 -12.42 7.20 11.891939.40 131,028,003 9,582300 16,458.000 1.494,203 1.388,455 105,748 1.14 15.59 9.08 14.491941.42 .1 133.402,000 9,703.000 18,715.000 1,403,990 .11.318.547 585.443 1,05 14.47 8.40 13.59(043.44 136,739,000 9.706,000 16,914,000 1,155,272 1 1.096,041 '59231 .84 11.90 6.83 11.29
1945-45 139,928.000 9357,000 16.790.000 1376,851 1.555.599 121,252 11.20 17.55 9.99 16.281947.48 144,126.000 9,276.000 16.419,000 2,616,262 2.441.830 174,432 1.82 28.20 15.93 26.321949.50 149.188.000 8,990,000 16.120.000 2.659.021 2,421,813 237208 1.78 29,58 16.50 26.94 -1950.52. 154,283000 8,742.000 (5,709,000 2,301,884 2.068.557 233,327 1.49 26.33 14,65 23.661953-54 159.559.000 8,441,000 15,221,000 2,514,712 2,237,713 276,999 1.58 29.79 16.52 26.51
1st term of ar,ademic.year: ..
November 1953 . 159,559000 8,441.000 15221,000 2,1991172 1,976,863 223,109 1.3$ 26.06 14.45 23.42November 1955 165,276000 8,508,000 14,966,000 2,597.670 2,347.656 250,014 157 30.53 17.36 27.59let term, 1957;58 171,278,000 8,844,000 15,118.000 2.899,505 2.621,919 277,646 169 32.79 , 19.18 29,651st term, 1959-60 . 177.830.000 9,190.000 15.677,000 3,235.544 2,873.724 341.820 1.81 34.99 20.51 31.271st tom, 1961-62 183,691,000 10,253,000 16361000 3.726.114 3328,286 397,826 2.03 36.34 21.97 32.46fall 1963 .1 189,242,000 11.155000 18.188.000 4,234.092 3,755515 478,577 2.24 31.96 23.28 33.61fail 1968 200,706300 14,342,000 22.787,000 6.659,203 5,651,279 807,924 3.32 46,43 29.22 40.80fall 1969 - 202,677,000 -.14,199,000 23,600.000 7.136.075 16,308,029 828,046 3.52 .. 50.26 30.24 : . 44.43fall 1970 204,879000 14,540,000 24,625.000 7,545,340 6,645,308 : 900.032 3.68 5129 30.64 45,70
1 Armed forces overseas are excluded from 1869-70 to 1929.30; they ate includedin 1939-40 and subsequent years.
'Oats are actual census counts as id June 1 from 1870 to 1900; (or later years they.We estimates by the ellteall at the Ceases as of July 1 preceding the fail term ofeach school year. .
Data from 1869.70 to 193940 are estimates by the Office of Education hornfigures far broad age groups supplied by the Bureau 01 the Census; data for lateryears are estimates by the Dureau of the Census.
Oats not available: .
*Distribution by level estimated.Includes "unclassified" students not distributed by level.
NOTE. - Students in programs leading to fitstprolessional degrees are includedwith undergradqates.SOURCE: U.S. Department of Heft, Education, and Welfare, Office of Education,"Biennial Survey of Education in the United States"; and comprehensive surveys
. of enrollment in tostittdions of higher education,
75

Table 39.- Enrollment in institutions of higher education, by sex. type of enrollment,and control of institution: United States, fall 1970
Type at enrollment and,centrol of instnution '
.
Number of students Type of enrollment andcordrot of inn:bitten
e
.. Number
Total
at students
Men WomenTotal Men Women
1 2 3 4 1 2 3 . 1
AR inslituttonsiAll resident and extension sibilants
Degree-credit studentsResident students
Undergraduate and it slloolessionalstudents
Undergraduate studentsFull-limePartAime
First- professional studentsGraduate students.Unclassified students
Extension students
Nowdegree-credit studentsResident studentsExtension students
-Publicly controlled institutions:
All resident and extension students
Degree- credit studentsResident students
Undergraduate and lirstprafessionaistudents
Undergraduate studentsFull-time
8.580.887 5.043242 3.537.245Part -time
First - professional students .....Graduate studentsUnclassified students
Extension students
Non-degree-credil students.Resident students.Extension students
.
Privately controlled institutions:All resident and extension students
onvevmedit studentsResident students
Undergraduate and first-professionalstudents....
Undergraduate students,Full -ItmePart-time
First-professlonal students. ..... .Graduate studentsUnciassilied students
Extension students
.Non - degree- creditegree-credit studeniS
Resident studentsExtension sludents........
1,014,35275257
605,925233271322229
628.045600.868
27.177---- 7,-...laii.-2.152.753
5432(668.9%
.368,677124,475156.646
390.734373,062
17,672Il
1.310,757
411,0368,591
237,248109,396196,283
237,311227.906
9,505----841,996
7,920,1497,545,340
4.288.8836,1152724.907,2273.208.245
173.411900,032356,425374,809
660,73863226028,378
4,636.6414.451,559
3190.1783,531.5292.867.098
664231158,619569,042192,339185,082
407,001388.247
18,154
3.283.5083,093,781
2,5982052.583,9432,040,129
54321414,762
330.99016.4'16189,727
253,737243,513
10,224
2,120,0602.068.180
1,651,5191.553,5651,359,672
193,89397,954
294,107122,55451,880
32,69331,492
1,201
1,294.4901,266,054
997.825908.132787.017121.11589,693
200.36567,86428.436
16,26715,785
482
825,570802.126
653,694645.433572,655
72,7788,261
93.74254.69023,444
16,42615,707
719
6,428.134 3232,885 2295,249
5100.0895.477.160
4.637,364
4,561,9073,547,555
3.342,1513.185,505
2292,3532,623,3972,080,081
2,457,938,2,291,655
1,9451011.038.5101267,474
SOURCE: U.S. Department of Health, Education, anclVel ate, Office of Education, "Opening Fall Enrollment in Higher Education, 1170, Supplementary Information.'
Table 90.- First -tine enrollment in institutions of higher education, by sex andby control of institution: United States, fall 1946 to fall 1972
.
Yea(
..-
Total,-
Enrollment, by see Enrollment, by tOrlif01of institution Year Telel
Enrollmeni, by sex Eno:Meat, by coolie!of institution
MOM Women Public Private Men Women Pblic Private
1 2 3 4 5 '6 1 2 . 3 4 5 6
1946 ' 696,419 I 499,532 3 196,887, (3) (7) 1959 818,280 486,057 332.223 498,652 319,628
1947 592246 399272 192.874 298,508 294.338 1960 923,069 539,512 383,557 577,744 345,3251948 567.191 368.940 198,251 295,135 272.0561141 554,508 355,319 199,289 298,515 256.093 1961 1,018,361 591,913 426,44f 648,236 370.125
1950 512,427 317.163 195,264 281911 230.516 1962 1,030,554 598,099 ' 432,455 669.728 360.8261963.. . .. 1.046.417 604,282 442,135 686.861 359.556
1951 467,999 278,092 189,907 259,560 208.439 1964 ' 1,224,840 701,524 523.316 814,664 410,1761952 532,310 321,310 211,000 304,518 227.792 1965 1,441,822 829,215 612,607 990,021 451,801
1953 566,969 341,761 224,208 331.656 234,3131954 624,910 382,852- 212,058 371,706 253,204 1966' 1,378,000 787,000 591,000 947,000 431.0001955 668,064 414.571 253,493 398,423 _289,641 1967' 1,439,000 814,000 625.000 1224.000 415,000
1968 . 1229,751 924,580 705,171 1200.784 428,9671956, .. ....... 714,966 441.525 273,441 427211 287,355 1969 1,748,655 985,719 762,936 1.309,359 439,2961957. 721,547 440.613 280,934 431,858 289,689 ,1970 1;780,119 983.794 706,325 1,337.896 442.2231958., 772,292 463,865 308,427 471,712 300.580 1971 1,765,625 967,859 797,766 1239,177 426,448
19723 1,738.000 947.000 791.000 1,321,000 417.000
Estimated.;Oda not available.
Preliminary data.
NOTE.-Beginning in 1960, data are for 50 States and the Oistilat of Columbia;-for earlier years. lot 48 Slates aid the District o( Columbia. Beginning In 1963,
.1>
70
enrollment figures include resident and envision degree - credit students; forearlier yeas, they exclude extension students.
SOURCE: U.S, Department at Health. Education, and Weliare, Office of Education,citculais on "Fall Eandlment ,in Higher Education"; and (Alice of Educationestimates. -
r

Selected Characteristics of First-Time College Students
A recent report from the American Council onEducation provides a wealth of information on thepersonal characteristics, family bac;:ground. attitudes. and aspirations of first-time college stu-dents. The study is based upon a sample survey offulltime students who enrolled in college for thefirst time in the fi-.;; of 1971. Some 01 the morenoteworthy statistics from the report are summar-ized in the discussion that follows and in the ac-companying chart.
niez,.ly threefourths or the tirsttime studentswere 18 years of age (as of December 31, 1971),and a full 90 percent were either 18 or 19 yearsold. The men tended to be slightly older than thewomen. Five percent of the men had had previousmilitary service, as compared with only 0.2 percentof the women. Ninety-three percent of the womenand 89 percent of the men graduated from highschool in 1971. Fourfifths of the women and twothirds of the men ranked in the upper half of theirhigh sch001 class. Only 15 percentof the men and19 percent of the women expected to leave schoolbefore obtaining a bachelor's degree.
Many of the 1971 college freshmen had a family
background characterized by relative affluence.Only 34 percent. for example, estimated their par.ents* income in 1970 as less than $10,000. Fortyfive percent of their fathers and 36 percent of theirmothers had also attended college. A majority ofthe fathers were either businessmen or professionalPeople. About 55 percent of the students listed par-ents! or family assistance as a major source oftheir financial support while attending college.
One-half of the first-time students were enrolledin a college that was 50 miles or less from theirhome. Six percent of the students were Negroes,and four percent belonged 0 other minority groups.Ninety-seven percent of the men and the womenreported that they were unmarried at the time ofthe survey.
For additional information the reader may wishto consult Research Report Vol. 6. No. 6, TheAmerican Freshman: National Norms for Fall 1971.The report may be purchased for $3.00 a copyfrom the American Council on Education, OneDupont Circle, N.W., Washington. D.C. 20036.
W. VANCE GRANT,specialist in educational statistics
77

Table 91.-Selected characteristics of otrsttime students in institution_sof higher education: United States, fall 1971
'Percentage diskibutionl
ItemFirst-lime slodenls
MtnFirs -time St Ild011tS
Total Men Women Total Men Women
1 2 3 4 1 2 3 4
To 111 100.0 100.0 100.0 Religious Preference:. Protestant 416, 38.7 44.8
Age by Docembet 11,1971: . Roman Catholic* 29.5 30.1 28.716 or manger .1 .1 .1 Jewish ,. - 211 211 2.9
17 3.4 2.6 4,3 Other 11.7 12.0 11.4
18 74.1 70.5, 78.4 bone, 14,4 36.3 12.2
19 16.0 18.6 12.8 Current porillcal preference:
20 . 2.1 2.6 1,4 Far left 2.8 3:5 1.9
21, .7 .9 1 .5 liberal 35.3 36.1 33.6
22-25 2.3 3.6 .9 Middle-of-Ike-road 46.9 " 43.6 50.6
26 or older 1.4 1.2 1.6 Conservative 14.5 15.3 13.6
Racial background:3 Fat right .7 .9 .4
White, Caucasian 91.4 923 90.6 Year finished secondary school:Black, Negro, Alto-American 6.3 5.5 7.2 Graduated in 1971 90.4 88.6 92.6American Indian .9 1.0 .9 Did not graduate in 1971. . 9.6 11.4 7.4 .
Otiental .5 .5 .4 Rank in high school class:Mexican-American, Chicano 1.1 1.1 1.1 Top quarter 41.8 35.1 49.7Puerto Rican-American .2 .2 .2 Second quarter 31.3 32.0 NMOther 1.2 1.2 1.1 Third quarter 23.0 27.5 17.5
Father's education: . Fourth quarter. 4.0 ; 5.3 2.4
Grammar school or less 8.8 BA 6.8 Dislaace from home to college:Some high school 15.8 16.7 14.9 5 miles of less 11,4 11.2 116HMO school graduate 30.9 31.9 '29.7 6 la 10 miles.. 11.8 12.3 11.2Some college - 16.9 16.4 17.4 11 lo 50 mites 26.8 26.1 26.9College degree 18.4 17.6 19,4 .51 to NO miles 14.6 14.1 15.3
Poslgradualr Jegree 9.3 . 8.7 10.0 101 to 500 miles 27.7 27.1 28.4Estimated parental income: More than 500 miles 7.7 8.6 6.7
Less than $4,000 5.3 4.9 5.9 Highest degree planned:$4,000 to 35,999 6.7 6.4 7.2. None 6.5 6.5 6.656,003 to 57,999 9.8 9.8 9.6 Associate for equivalent) 10.2 8.3 126$8,000 to 59.999 126 12.9 124 Bachelor's (B,A.. B.S.) k 37.5 33.8 41.8$10,000 to 312,499 16.1 19.5 111 Master's (M.A.. M.S I 25A 25.4 26.6
$12,50010 $14,999 14.2 14.6 136 Ph.D. or Ed.11 7.6 9.7 5,2515,000 to 219,999 14.3 146 13.9 M.D.. 0.0., D.O.S., or ON M 4.9 6.9 2.6220600.10 124.999 8.1 7.9 8.4 LLB or 1.0. (law) 3.6 . 5.6 ' `.2525,000 to $29,999 3.8 3.7 4,0 B.O. (divinity) .3 .5
530.000 to $34,999 2.4 2.2 2.7 Other 3.5 3.5 S
335,000 to 539,999 1.3 1,2 1.5 Malor sources of financial supped for college:3 -
$40,000 or more 3.4 3.4 - 3.3 Part-lime or summer work 29.0 342 22.8Marital status: Savings from fall -lime emptoymenl ' ' 9.4 11.5 6.9
Presently married 2.8 3.0 2.6 Parental or family aid or gifts 54.5 48.9 ellNot married 97.2 97.0 97.4 Parent's military strvice 1.9 1.9 1,8
Veteran status: Personal military service 2.5 4.5 .2
No 97.2 95.0 99.8 Scholarships and grants 19.3 18.4 20.5
Yes, served in southeast Asia 1.5 23 .0 Loans 1111£A, Wats% Mused. or college)._ .. 14.7 13.5 159Yes, did not serve in southeast Asia 1.4 2.3 2 Other,repayable loans 6.2 5.6 7.0
3 Because some students gave multiple responses to thiilem,pucentages add tomore than 100.0.
NOTE-Data are based upon a sample survey of full -lime freshmen enrolled incollege for the int time. Because 01 rounding, Putenteges may not add to 109.0.
.
78
SOURCE: American Council on Edecition, Research Report Vol- 6, No. 6. "TheAmerican Freshman: National Norms for Fall 1971." December 1971.
. -
_ .
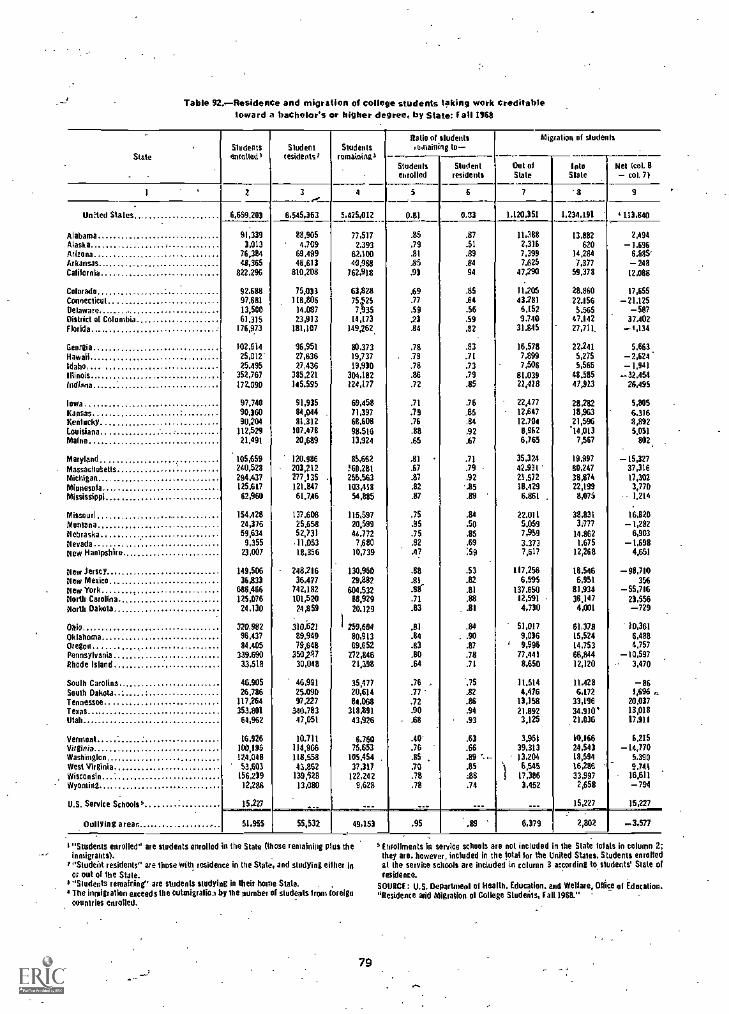
Table 92,-Residence and migration of college students taking work creditabletoward a bachelor's or higher degree, by State: Fall 19611
State
..
enrolled'Students Student
I eside nts aStudents
a
Ratio of 'Indentsemaining to-
Migration of students
r emainine
-
Studentsenrolled
Studentresidents
Out atSlate
IntoSlate
Net (col. B- col. 7)
1 . 3 r 4 5.
5 7 "8 9
Unhed Stales,," 6.659.203 6,545,353 5,425,012 OM 0,33 1.120,351 1,234,191 a 113,840
Alabama 91,339 88.905 77,517 .85 .87 11,388 13.882 2,494Alaska , , 3,013 4,709 2.393 .79 .51 2,316 620 -1.696Arizona 76,384 69,499 62,100 .81 .89 7,399 14,284 6.685'Arkansas 48,365 48,613 40,988 .85 .84 7.625 7,377 -248Californh4 822.296 810,208 762,918 .93 94 47,290 59.378 12.088
Colorado 92.688 75.033 63,828 .69 .85 11,205 28.860 17,555Connecticut 97.681 118.805 75,t25 .77 .64 43281 22.156 -21.125Delaware 13,500 14.087 7,935 .59 .56 6,152 5.565 -587District ot Columbia 61.315 23,913 14,173 .23 ,59 9.740 47.142 37.402Florida 176,973 181,107 149,262 .84 .82 31,845 27,711. - +,134
Georgia 102,514 96,951 80.373 .78 .83 16,578 22,241 5,663Hawaii 25,012" 27,636 19,737 .79 .71 7,899 5,275 - 2,624'Idaho 25.495 27,436 19,930 .78 .73 7,506 5,565 -1,941Illinois 352,767 385,221 304,182 .86 .79 81.039 48.585 -32.454Wilma 172.090 145.595 124,177 .72 .85 21,978 47,913 26,495
Iowa. 97.740 91,935 69,458 .71 .76 22,477 28282 5,865Kansas 90.360 84,044 11,397 .79 .85 12,547 18,963 6.316Kentucky 90,204 81,312 66,608 .76 .84 12.704 21,596 8,892Louisiana 112,529 107,416 98,516 .88 .92 BAR '14,013 5.051Maine 21.491 20,689 13,924 .65 .67 6,165 7,567 802.
Maryland 105,659 120.986 85,662 ,81 .71 35,324 19.997 -15,327Massachutetts 240,528 203,212 160,281 .67 .79 - 42.931 80,247 37,310
Michigan 294,437 277,135 . 256.563 .83 .92 21,572 38,874 17,302
Minnesota 125.617 121.847 103,418 .82 .85 16.429 22,194 3,770Mississippi 62,960 61.796 54,885 .87 .89 6.861 8,075 -. 1.214
Missouri 154.428 137.608 115,597 .75 .84 22.011 38,831 16,120Montana 24,376 25,658 20,599 .85 .50 5,059 3277 -1,282Nebraska 59,634 52,731 44.172 .75 ,85 7,959 14,862 6,903
Nevada 9.355 11,053 7,680 .82 .69 3.373 1,675 -1,698New Hampshire 23,007 18,356 10,739 .47 :59 7,517 12,268 4,651
New feisty 149,506 248216 130.950 .88 .53 117.256 18.546 -98,710New Mexico 36,833 36.477 29,882 .81 .82 6,595 6.951 356
New York 686,466 142,182 604.532 .8( .81 137.650 81,934 -55,716North Carolina 125,076 101,520 88,929 .71 .88 12,591 36,147 23,556North Dakota 24.130 24,859 20.129 .83 .81 4,730 9,001 -729
-
Ohio 320,982 310.621 259,600 .81 .89 51,017 61.378 10,361Oklahoma 96,437 89.949 80,913 .84 . .90 9,036 15,524 6,488Oregon 84,405 79,648 69.652 .83 .87 1 9.996 14,753 4,757
Pennsylvania 339.690 350,257 772,846 .80 .78 77.441 66,844 -10,597Rhode Island 33,518 30,048 21,398 .64 .71 8,650 12,120 3,470
Soulh Carolina 46.905 46.991 35,477 .76 ",75 11.514 11.428 -86South Dakota 26,786 25.090 20,614 .77 .82 4,476 6,172 1,696 ,-,Tennessee 117,264 97227 84,068 .72 .86 13,358 33,190 20,037
Texas 353,801 340,783 318,891 .90 .94 21.892 34.910' 13,018Utah 64,962 47,051 43,926 .68 .93 3,125 .21,036 17,911
Vermont..- 16,926 10.711 6.760 .40' .63 3,951 10.166 6.215Virginia 100,196 114,966 75.653 .76 .66 39,313 29,543 -14,170Washington 124.046 118,658 105,454 . .85 . .89 -. -. 13,204 18,594 5,390West Virginia 63,603 43.862 37,317 .70 .85 6,545 16,286 9.741Wisconsin 156.239 139,528 122,242 .78 :88 17,386 33,997 16,611Wyoming 12,286 13,080 9,628 .78 .74 3,452 2,658 -794
U.S. Service Schools a 15,227 .... --- -- --- --- 15,227 15,227
Oullying area,' 51,955 55,532 49,153 .95 .89 6,379 2,802 -3,577
"Students enrolled" are students enrolled in the State (those remaining plus theinnsigrants).
a"Stucicist residents" are those with residence in the State, and studying ei her inor out of the State.
a "Students remaining" are students studying in their home State. ,The inrolgrauen exceeds the outmigraliaa by the number of students from foreigncountries enrolled.
79
$E uollments in service schools a e not included 'n the State totals in column 2;they are, however, included in the total for the United Slates, Students enrolleda the service schools are included in column 3 according to students' Stale ofresidence.
SOURCE: U.S. Departmen1 of Health. Education, and Welfare, Office of Education."Residence add Migration of College Students, Fall 1968."

Table 8. Enrollment for advanced degrees, by level ofenrollinent, sex of sttpennt, attendance status, and Held of study:United States and outlying areas, fall 1970
. 1Field 01 study All .
sturfenls
Firsl-year students' Students beyond the led year '
TotalMen Women
TotalMen Women
Fu 11-
limePad-time
Full-time
Part-time
Full-time
Pad-time
Full-time
Part-lime
1 2 . 3 4 5 6 7 8 9 10 11 12
Enrollment for master's and doctor's degrees , 116,207 527,834 136,680 178,977 72,488 139,689 266,373 123.886 86.658 HON 37.811
Agriculture 1.166 3.473 :276 877 214 106 3.693 2.360 1.107 153 73Arthilectuce 2,240 1,261 969 126 - 147 19 979 721 136 101 21Biological sciences 36,491 17245 7,467 4.555 2,982 2,241 19,254 11,316 3,232 3,488 1,218Business and commerce 87.487 61,545 21,870 36,656 1,144 1,875 25.942 10,1111 14.163 486 412City planning 3.193 2.061 1,214 389 326 132 1,132 690 233 153 56
Computer science and systems analysis 7,936 5.026 1.961 2.506 251 309 2.910 1,373 1.264 122 151
Education 254,473 191.7411 18,417 59.230 21.000 90.093 62,725 12,944 21.690 8,704 19,387Engineering 64,788 35.477 15,393 19.424 307 353 29,31! 15,592 13,272 264 183English and igurnation 35,953 22.929 4.914 4,355 5.320 8.340 13.028 4,173 2.533 3,326 2.996Fine and applied ails 28.748 18,696 6.120 3,415 5,249 3,912 10.952 3,960 1,953 2,521 1,611
Folbtote 187 111 . 34 2 63 12 76 32 5 31 8Foreign languages and literature 20.451 . 10.609 2,332 1.644 3,335 3,298 9.842 3,121 1,683 3,147 1,691
Forestry.. 1,485 732 532 159 34 7 753 524 210 19 ....Geography -3,334 1,995 - 959 694 176 166 1,339 CO 376 103 60Health professions 14.242 8,270 3,145 811 3,293 1,021 5.972 3,345 682 1,505 440
Home economics 4,611 3.253 126 104 1233 1,685 1,355 134 50 ' 612 562Law 2,533 2.183 638 1,434 39 72 350 , 86 253 2 9Library science 12,416 9,161 879 732 3,344 4,201 3,255 360 366 910 1,619Mathematical sciences 22.672 13.614 4.302 5.145 1.562 2.595 9.068 4.687 2.731 920 730,Philosophy 4.051 2.276 1.213 559 335 169 2.575 1.530 .596 317 132
Physical sciences 40,113 17,356 9,1171 5,692 1.391 1,202 22)57 15.775 4.903 1,570 509Psydrology . 25,312 14,262 4.926 3,873 2,663 2,800 11.080 5.210 2.082 2.555 1233Religion 12,227 5.568 2,183 1.419 666 600 6,659 4,180 1654 495 330Social sciences 97,185 58.063 20,830 18,005 11,261 7,967 39.122 18.409 9.741 7.891 3.081Mead general curriculums and miscellaneous fields 26.071 20,930 ,4,209 7.159 3,053 6.509 5.141 1253 1)43 602 1.037..... ...e. ..-,,e.,
Enrollment lor ftrst-profess1onal degrees 170.144 63.265 52,182 5,971 4.153 656 106.879 91.978 7.932 6.360 i 601
Chiropody or podialry (D.S.C. or Pod.D ) 1.148 353 ,344 ,.._ 9 ... 795 788 .. 7 ....Dentistry (0.D.S.,er 0.11.0.1 16510 4,639 4;534 2 A03 .. 11.871 11.695 5 170 IMedicine (M.D.) 40,170 11,394 10,141 12 1.240 i 28.776 26,103 41 2,630 2
Dplomelry (0.D.) 2.594 852 815 4 33 1,742 1.703 6 32 1
Dsteripatily (0.0.) 2,135 603 584 3 16 ... 1,532 1.480 81
,44 ...
Veterinary medicine (D.V.M.). 4.716 1.439 1,280 1 157 1 3.277 2.487 4 286Law (LL.B. or 1.04 80.694 36,136 27,352 5.611 2,575 598 44,558 34,297 6,965 2,754 546
Theology MD.. Rabbi. or other tintprolessMnaM 20.954 1,449 0,247 335 2)6 51 13,505 12.324 893 235 53
Other 1,223 400 225 6 104 5 823 601 10 206 6
Students with tees than I full year of requited study for an advanced degree or itsighivaleot in part-lime study.
'Students with 1 or more years of required study for all advanced degree.
80
SOURCE: U.S, Depa 'rant of Health, Education, and Welfare, Nice of Education`Students Enrolled for Advanced Degrees. Fail 1970."
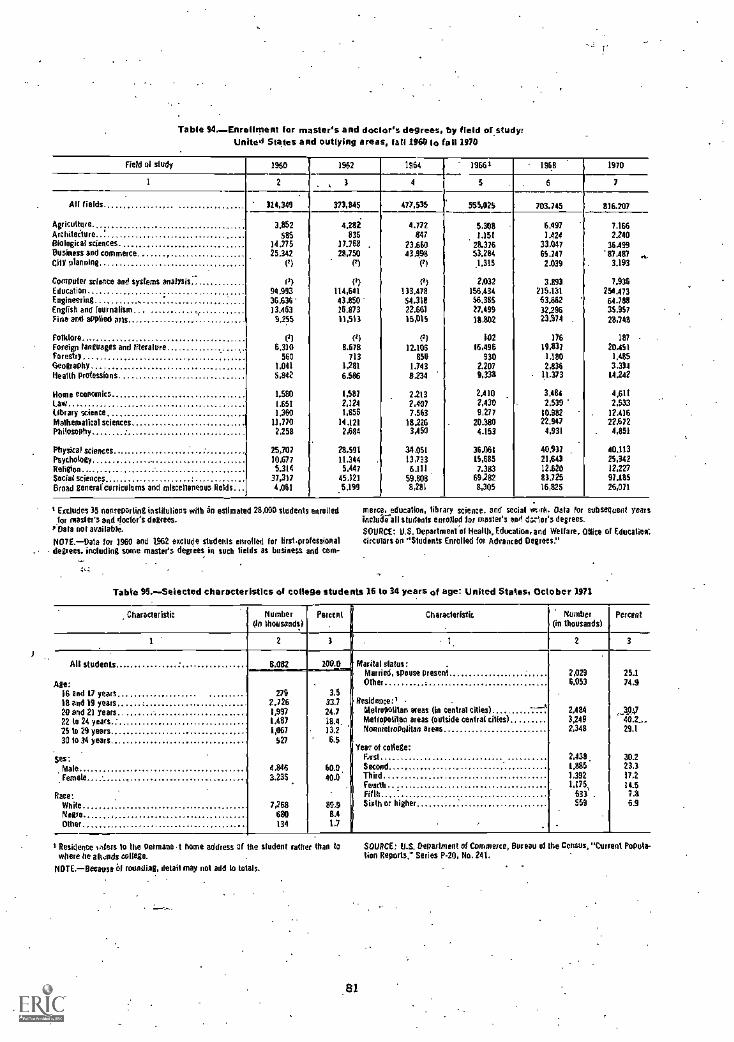
Table 94,-Enrollment for master's and doctor's degrees, by field ofstudyrUnited States and outlying areas, fall 1960 to fall 1970
Field of sludy 1960 1962 1964 19661 1961 1970
1 2 , 3 4 5 . 6 7
All fields 314,349 373,845 477,535 555,025 5703 74. 816,207
Agriculture 3,852 4.282 4.772 5.308 - 6,497 7,166Architecture ' 585 835 847 1.151 1.424 2,240Biological sciences 14.775 172 68 , 23.660
.
28.316 33,047 36,499Business and commerce 25,342 28,750 43,998 53.284 65.147 87,487 .,,City planning (2) (71 (P) 1.315 2.039 3,193
Computer science and systems analysis f') fq 2,032 3,893 7,936Education 90,993 114,641 133,478 156,434 215,131 254,473Engineering , ' 36,636' 43,850- 54,318 56.385 63,652 64.738English and journalism, 13,463 16,873 22,661 27,499 32195 35,957Fine and applied ails 9,255 13,513 15,015 38,802 23,974 - 23,748
Folklore (1) fli (11 102 176 187 -
Foreign languages and titeralere 6.310 8.578 12.105 16,496 19,831 20.451forestry 560 713 850 930 1,180 1,485
Geography 1.041 1,281 1.743 2.207 2,836 3.331Health professions. 5,842 6,586 8,234 9,338 - 11,373 14.242
Home economics 1,580 1,581 2.213 2.410 3,484 4,611
Law 1,651 2,124 2,407 2,430 2,539 2,533Library science 1,360 1,856 7,563 9,217 10,982 . 12.416Mathematical sciences 11,170 14.121 18.226 20.380 22,947 22,612Philosophy 2258 2,684 3,450 4.153 4,931 . 4,851
Physical sciences 25,701 28.591 34.051 36,061 40,937 40,113
Psychology 10,677 11.344 13,733 15,585 21,643 25,342
ReligionSocial sciences .
5,31437,317
3,442
45,1216,111 .
591087.383
69,28212,62083,725
12,22791,185
Broad general*currisulums and miscellaneous gelds 4,061 5.199 8291 8,305 16125 26,011
I Excludes 35 nenreporting institulions with in estimated 28,000 students enrolledfor master's and doctor's degrees.
P Data not available.
NO7E.-Data for 1980 and 1962 exclude students enrolled for lirst-prolessional- degrees, including some master's degries in such fields as business and core-
merce, education, library science, and social wok. Data for subsequent yearsinclude all students enrolled for master's nor! dr,z1or's degrees.
SOURCE: U.S. Department of Health, Education, and Welfare, °Oise of Education'circulars on "Students Enrolled for Advanced Degrees."
Table 95,- Selected characteristics of college students 15 to 34 years of age: United States, October 1971
Characteristic Number(In thousands)
Percent Characteristic Number(in thousands)
Percent
2 2 3
All students
Age:16 and 17 years18 and 19 years20 and 21 years22 to 24 years25 to 29 years3010 34 years..
. .
ges :MaleFemale *
Race:WhiteNegroOther
8.082 100.0 Marital status:Married, spouse presentOther
ResIdeoce:I -
Metropolitan areas (in central cities)Metropolitan areas (outside Mahal cities)Noonretropolitaa areas
Year of college:forstSecondThirdfourthFalbSixth or higher
2,0296,053
2,4843,2492,348
2 433,
1,8851,3921,175,
633 .
559
25.174.9
..313:740.2.-29.1
30.223,317,2
11.5716.9
2792,1261,99?1,4871,167
527
4,8463,235
'
7,2686841
134
3.533.724,7iike.13.26.5
60.040.0*
89,98.41.7
I Residence ,viers to the °omens .1 home address of be student rather than towhere he atiaids college. .
NDTE.-Because of rounding, detail may not add to totals..
. ._-_...
81
SOURCE: U.S. Department of Commerce, Betteu of the Census, "Current Popula-tion Reports," Series P-20, No, 241,
. -
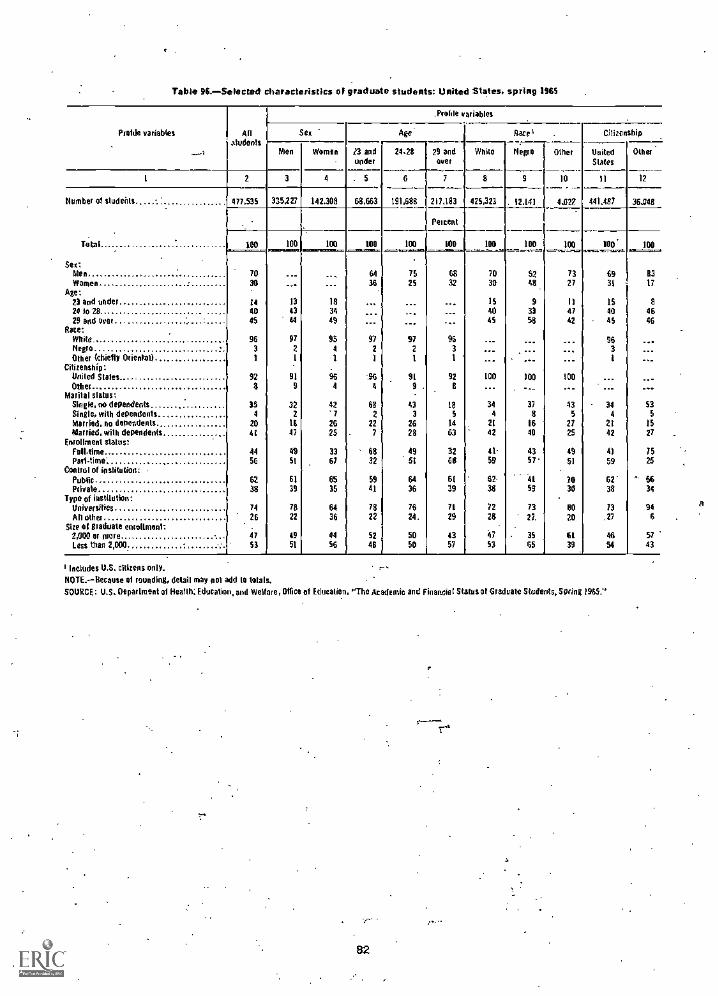
Table 96.Setected characteristics of graduate students: United States, spring 1965
Profile variables Allatudents
.Profile variables
Sex Age" Rates Citizenship
Men Women 23 andunder
24.28 29 andover
White Nemo Other UnitedStates
Other
1 2 3 . 5 6 7 8 9 10 11 12
Number of studebts 477,535 335227 142,309 68,663 191,688 217,193 475,323 12.141 4.022 441,487 36.048
Peucent
Total 100 100 100 100 100 , UM 100 100 100 100. 100
Set:
11=Vira=111
Men 70 75 70 52 73 69 03Women 30 25 30 48 27 31 17
Age:23 and under 14 13 18 15 9 11 15 a24 Jo 28 AO 43 34 40 33 47 40 4629 and over 45 49 45 58 42 45 46
Race:White 96 97 9S 97 97 96 96Negro 3 2 4 2 2 3 3Other (chiefly Oriental} 1 1 1 1 1
Citizenship:United States 92 91 96 91 92 100 100 100Other a 9 4 4 9 B
Marital slates:Single, no dependents 35 32 42 68 43 18 34 37 43 34 53Single, with dependents 4 2 '7 2 3 5 4 8 5 4 5
Married, no dependents 20 16 26 22 26 14 21 16 27 21 15Married, with dependents 41 47 25 7 28 63 42 40 25 42 27
Enrollment status:Fu 11.time 44 49 33 68 49 32 41- 43 49 41 15Part-time' 54 51 67 32 51 68 59 57 51 59 25
Control of institution:Public 62 61 65 59 64 61 62- 41 70 62" 66Private 38 39 35 41 36 39 38 59 30 38 34
Type of institution:Universities 74 78 64 78 76 71 22 73 BO 13 94All other 26 22 36 22 24. 29 28 27. 20 .27 6
Size of graduate enrollment;2,000 or more 47 49 44 52 50 43 47 35 61 46 57Less than 2,000. 53 51 56 AB 50 57 65 39 54 43
Includes U.S. citizens only. ,-NOTE. Because at rounding, detail may not add to totals.SOURCE: U.S. impartment at Health; Education, and Welfare, Office of Education, "The Academic and Finaenis I Status at Graduate Students, Swing /965,"
82
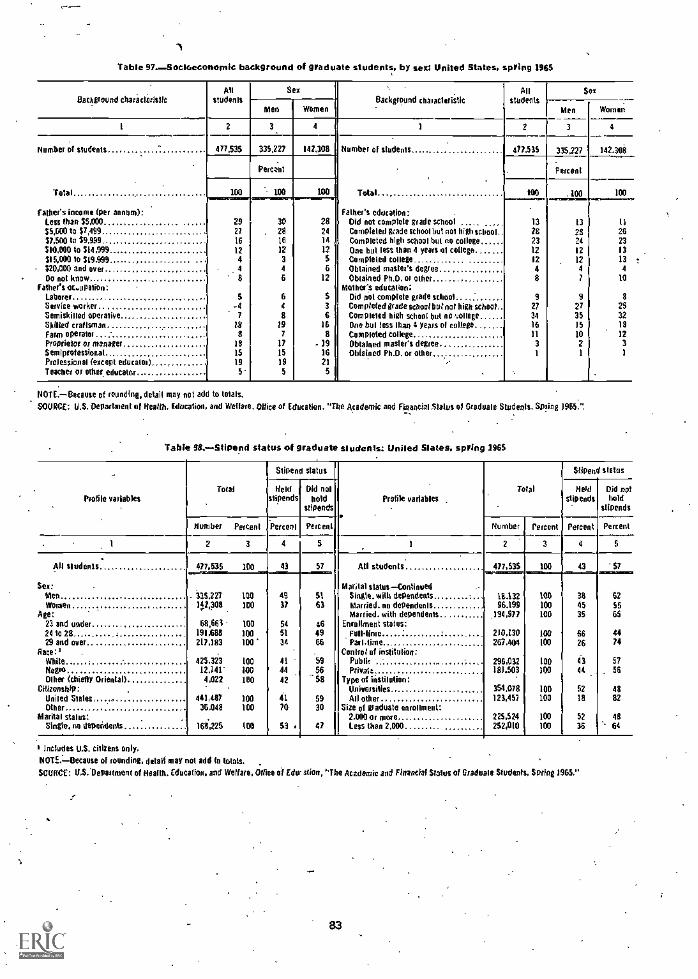
Table 97.Socieeconemic background of graduate students. by sex: United States. spring 1965
Background characteristicAll
studentsSex
Background chaiacleristicAll
studentsSe:
Men Women Men Women
1 2 3 4 1 2 3 1
Number of students 477,535 335,227 142,308 Number of students 417,515 335,227 142.308. .
Permit Percent
Total
father's income (per mown):
100.......:1....Oft100 Total
father's education:
HO 100 100
Less than $5,000 29 30 28 Did not complete grade school ..... .... 13 13 It$5,000 to $7,499 21 . 28 24 Completed grade school but not high school.. 28 28 2697,500 to 59,999 16 16 14 Completed high school but no college 23 24 23$10,000 to $14,999.. 12 12 12 One but less than 4 years of college ..... 12 12 13SI MOO to $19.999 . 4 3 5 Completed college 12 12 13$20,000 and over 4 4 6 Obtained master's degree 4 4 4
Do not know,.father's oc.upation:
8 6 12 Obtained Ph.D. or otherMother's education:
8 7 10
Laborer s 6 5 Did not complete grade school 9 9 aService worker -4 4 3 Completed amdeschoul buf nal high school,. 27 27 2S
Semiskilled operative 7 8 6 completed high school but no ,.:ollege 34 35 32soiled craftsman 1$ 19 IS One bul less than 4 years of collage... 16 15 18
Farm operator 8 7 8 Completed 4404114 11 10 12Proprietor or manager 18 17 - )9 Obtained master's degree 3 2 3
Semiprofessional 15 15 16 Obtained Ph.D. or other 1 1 1
Prolessional (except educatoe)... ....... 19 19 21 ,..
Teacher or other educator 5 5 5 .1
NOTE. Because of rounding, detail may not add to totals.
SOURCE: U.S. Department of lielith, Education, and Welfare, Difice of Education. "The Academic and Financial 513105 01 Oraduale Students. Spring 1965.".
Table 98.Stipend status of graduate students: United States, spring 1965
_
Profile variablesTotal
Stipend status
Total
Stipend status
Fieldstipends
___Did not
holdstipends
1
I Profile variablesHeld
stipendsDid nalhold
stipends
Number Percent Peron! Percent Number Percent Percent Percent
2 3 4 5 1 2 3 a s
. .
All sludents.. 477,535 100 43 57 AtI students 477,535......,,,.. 100...--......_43 57..........Sex: Marital statusContinued
Men 335,227 100 48 51 Single, wilts dependents 11.132 106 38 62Women 1,12,p8 100 37 63 Married, on dependents 96,199 100 45 55
Age: married, with dependents 194,977 100 35 6523 and under 68,663' 100 54 46 Enrollment status:24 to 28 . 191,688 100 51 49 Full.lime 210,130 100 66 4429 and over 217,183 100 34 66 Patl-time 267,404 100 26 74
Race:, . . Control of institution:White . 425,323 100 41 59 Public 296,032 100 43 57Negro 12,141' 100 44 56 Privets , 181.503 100 44 56Oilier (chiefly Oriental) 4,022 100 42 -58 Type of institution:
Citizenship: Universities 354.078 100 52 48United Stales 441,487 100 41 59 All other 123,457 100 18 82Other 36,048 100 70 30 Size of graduate enrollment:
Marital status: 2.000 or more 225,524 100 52 48Single, no dependents 168,225 (00 53 . 47 Less than 2.000 252,010 100 36 " 64
Includes U.S. citizens only.
NOTS.Because of rounding, detait may not add to louts.
SOURCE: U.S.'Department of Health. Education, and Welfare, Offiee of Eder stion, "The Academic and Financial Status of Graduate Students, Spring 1965,"
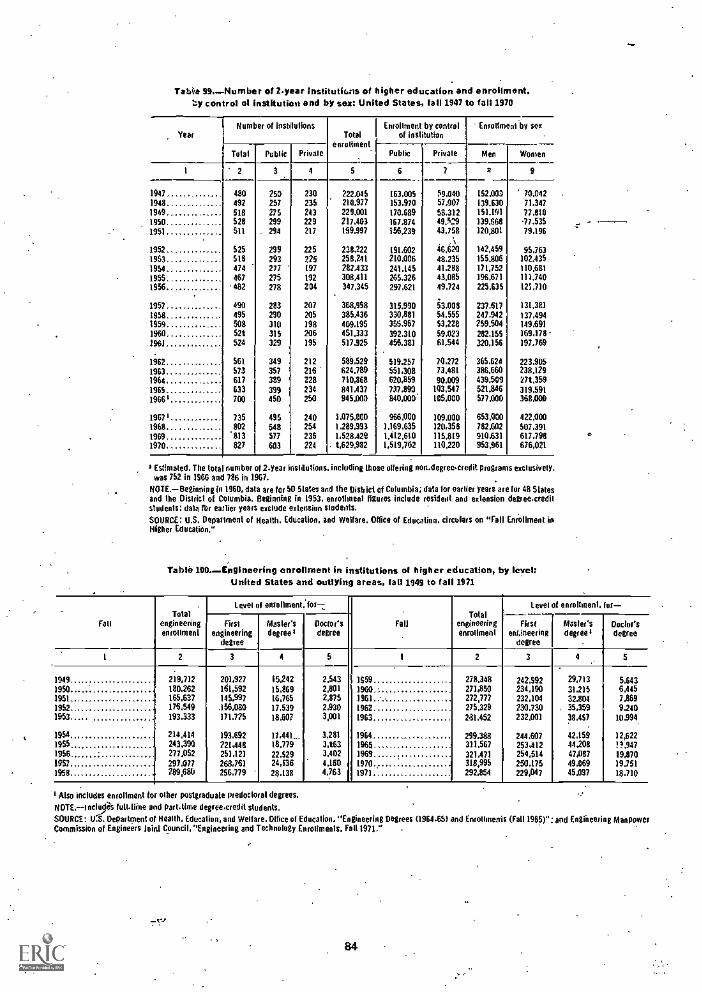
Table 99. Number of 2.year institutiuns of higher education and enrollment.by control of institution and by sex: United States, fall 1947 to fall 1970
YearHumber of institutions
Totalenroitment
Enrollment by controlof institution
Enrollment by sex
Total Public Prima le Public Prima le Men Women
1 2 3 4 5 6 7 0 9
1947 480 250 230 222.045 163.005 59.040 152,003 70,0421948 492 257 235 210,977 153.970 57,007 139,630 71,3471949 518 275 243 229,001 170.689 58.312 151301 77.8101950 528 299 229 217.403 167.874 49.529 139,668 77.5351951 511 . 294 217 199.997 156,239 43.758 120,801 79,196
,i1952 525 299 225 238,222 191.602 46.620 142.459 95,7631953 518 293 225 258,241 210,006 48,235 155,806 102.4351954 474 277 197 282.433 241.145 41,288 171,752 110,681
1955 467 275 192 308,411 265.326 43,085 196,671 111.7401956 '482 278 204 347,345 297.621 49,724 225.635 121,710
1957 490 243 207 368,998 315.990 53.008 237.617 131,341
1958.....,, , 495 290 205 385,436 330,881 54.555 247,942 137.494
1950 508 310 198 409.195 355.967 53,228 259,504 149.691
1960 521 315 206 451,333 192.310 59.023 282.155 169,178 -2961 524 329 195 517,925 456.381 61,544 320,156 197,769
1962 561 349 212 589.529 514.257 70.272 365,624 223,9051963 573 357 216 624.789 551,308 73.481 386.660 238,129
1964 617 389 228 710,868 620,859 90.009 439,509 271,3591965 633 399 234 841.437 737.890 103.547 521.846 319.59119661 700 450 250 945,000 840,000 105,000 577,000 368,000
19671 735 495 240 1,075.000 966,000 109.000 653,000 422,0001968 402 548 254 1,289,993 1,169,635 120.358 782,602 507,3911969 813 577 236 1,528.429 1,412,610 115.819 910,631 617,7981970 827 603 224 . 1,629.982 1.519,762 110,220 953.961 676,021
Estimated. The Iota number ot 2-year Inslitutions, including those offering non - degree - credit programs exclusively.was 752 in 1966 and 746 in 1967.
NOTE.Beginning in 1960, data are for 50 Slates and the District of Columbia; data for earlier years are for 48 Slatesand the Dislricl of Columbia. Beginning in 1953, enrollment figures include resident and extension degree-credilstudents: dale nu earlier years exclude extension 'Indents.
SOURCE: U.S. Department of Health, Education, and Welfare. Office of Education, circulars on "Fall Enrollment inHigher Education."
Table 100. Engineering enrollment in institutions of higher education, by loyal:United States and outlying areas, fall 1949 to fall 1971
FallTotal
engineeringenrollment
Level of enrollment..for:
FallTotal
engineeringenrollment
Level of enrollment, or
Firstengineering
degree
Master'sdegree 3
Doctor'sdegree
FirstenLineeries
degree
Mister'sdegree'
-
Dodoesdegree
1 2 3 4 5 I 2 3 4 5
1949 219,712 201,927 15,242 2,543 1659 278.348 242.992 29,713 5,6431950 180.262 161,592 15,469 2,801 1960 271,850 234,190 31,215 6,4451951 165,637 145.997 16,765 2,876 1961 272,777 232,104 32.804 7,8591952,- 176,549 .156,080 17.539 2,930 1962 275,329 230,730 . 35,359 9,2401953 193.333 171,725 18,607 3,001 1963 241.452 232,001 38,457 10,994.
1954 214,414 193.692 17.441,,_ 3.281 1964 . 299,388 244.607 42,159 12,6221955 243,390 221,448 18,779 3,163 1965 311,567 253,412 44.208 1,,471956- 277.052 251,121 22,529 3,402 1969 321,471 254,514 47,087 19,8701957 297,077 268,761 24,136 4,180 , 1970 r 318,995 250,175 49.069 19,7511958 289,680 256,779 28,138 4.763 1971 292,854 229,047 45,097 18,710
'Also includes enrollment for olher postgraduate predocto al degrees,
full-liine and part-time degreecredit students.
SOURCE: U.S. Department of Health, Education, and Welfare. Office of Education. "Engineering Degrees (1964.65) and Enrollments (Fall 1965)"; and Engineering ManpowerCommission of Engineers Joint Council, "Engineering and Technology Enrollments. Fall 1971." .
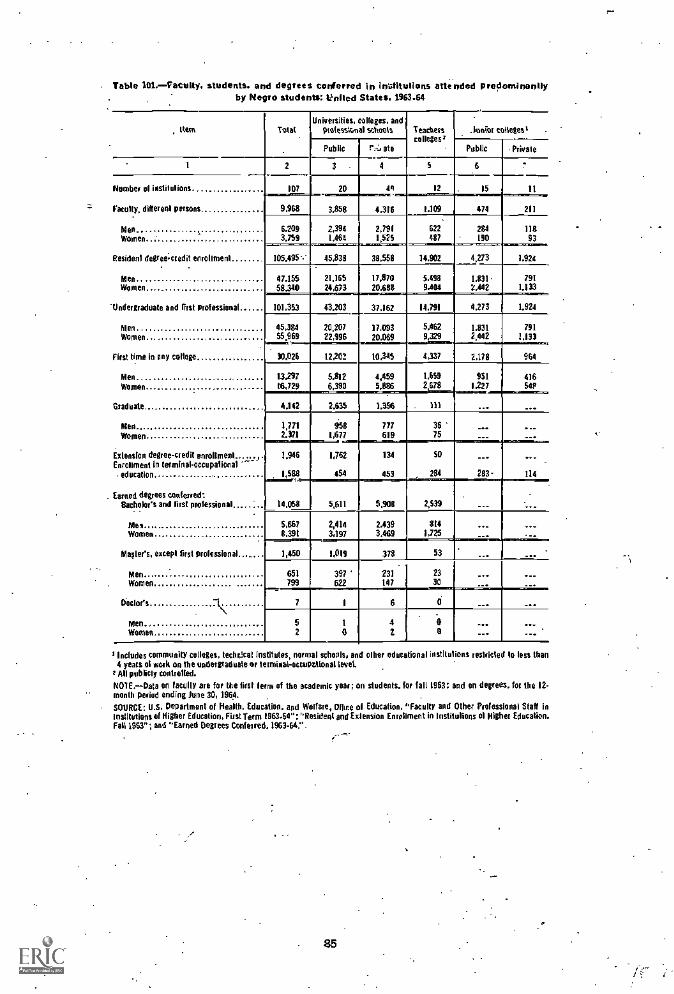
Table M.Fatuity, students, and degrees conferred in inatitutions attended predominantlyby Negro students: United States, 1963-64
Item TotalUniversities, colleges, and
preess%nal schools 'Emberscolleges,
Junior coke& -
Public t*:, ate Public Private
1 2 3 - 4 5 6
Member of institutions 107 . 20 44 12 15 it,
Faculty, different persons 9,968 3.858 4.316 1.109 474 211
Men 6,209 2,394 2,791 622 284 118Women 3,759 1.464 1,525 487 . 190 93
Resident degrekredit enrollment 105,495-- 45,838 38,558 14,902 4,273 1,924
Men 47.155 21.165 17,870 5,498 1.831. 791
Women 58,340 24,613 20.688 9.404 2.442 1.133
Undergraduate and first professional.. 101.353 43,203 37.162 14.791 4,273 1.924
Men 45,384 20,207 17,093 5.462 1.831 791Women 55 969a 22 99622,996 20.069 9,329 2,442 1,133
First time in nny college 30,026 12,20!
.10,345 4,337 2,178 964
Men 13,297 5.812 4,459 1.659 951 416Women t6,729 6,390 5.886 2,678 1,227 54P
. ,
Graduate 4.142 2.635 1.396 . ill ...
Men 1,771 958 777 36 ...Women 2.371 1,677 619 75 ___ ...
Extension degree-credit enrollment ,. 1,946 1,762 134 50 ... ...Enrollment In terminal-occupational
education
tamed degrees conferred-.
1 , 588 454 453.
284 283- 114
Bachelor's and first professional 14.058 5,611 5.908 2,539 ___
Morn 5,667 2,414 2.439 814
Women 8,391 3,197 3,469 1,725 -
Master's, except first polessional 1,450 1,019 378 53 ... ...
Men 651 397 ' 231 23Women 799 622 147 30
Doctor's 7 I 6 0 --. -..
Men . 5 1 4 0Women 2 0 2 0 ...
3 Includes community colleges, technicsl institutes, normal schools, and other educational institutions restricted to less than4 years of mak on the undergraduate or terminal - occupational level.All pubfirly controlled.
710TE.Data on faculty are for the first term of the academic year; on students, for fall 1363: and on degrees, for the 12-month period ending June 30, 1964.
- SOURCE: U.S, Department of Health, Education. and Welfare, Oflice of Education, "Faculty and Other Professional Staff inInstitutions of Higher Education, First Term 1963-64"; "Resident and Extension Enregment in Institutions of Higher Education,Fall 1953"; and "Earned Degrees Confeued, 1963-6V-
85

Table 102...-111sIctical sununaty of faculty, students, degrees, and finances Ininstitutions of higher education: United States, 116540 to 1968.69
Vern 1869-70 187940 I 1889.90
1 /..." 2 3 1. 4
Total
Total
MenWomen
Total
MenWomen
Bachelor's and first.professional:
Total
MenWomen
Second level (master's ex-cept first-professional):
Total
MenWomen
Doctor's:Total
MenWomen
Total current incomeEducational and general
incomeTotolcurrentexpendituresEducational and general
expendituresValue of physica I property_Endowment and oilier
nonsupendable funds._
563 1 811 1
15,553 I 11.522
04,887 17.3287666 '4,194
/52,286
/41,160711.126
77,972137,845
9.371 12,696
7.9931,378
0
10,4112,485,
879
0 868
1 54
1 51
0 3
1899.1900 1909-10 1919-20 1929-30 1939.40 1949-50 1969-60 1963-64 1968-69
S 6 7 8 9 10 II 12 13
In dilution B
9981 977 I 951 1,041 1 1,409 1.7051 1,851
Faculty1
/15,809 23,868 36.4801 411615 82,385 146,929 246.722
012.70473.105
19,1514,717'
29,132.7,348
35.90712,8011
60,01722,369
106,32810,601
186,11960,533
Resident degree credit enrollment'
156.756 237,5921 597.880 1.100,737 ,431,2031 2.659,021
/100,453/56.303
152,25485,338
314,938282,942
619,939480,802
893,250600,953
1853,0681415.953
Earneddenoes conferred
15.539 27,410 37,199 48,622 122,484 186.500 432.051
12.8572.682
22,1735,237
28.7628.437
31.98016.642
73.61548,869
109.54676,954
328,841103,217
1,015 1583 2.113 4.279 14,961 26,731 58,183
121194
1.230303
1.555558
2,9851.294
0 .9256,044
16,50810,223,
41,22016.913
149 382 443 615 2,299 3.290 6,42.0
1472
35923,
52293
1.945353
2.861429
5,804616
Flaantes (in thousands of dollars)
1 2108 2,132 2.483
380.554 494,514
0296,773I 83.781
385,405*109,109
1758900
591.3000167.40Z
73,215.544 14,234.092 06,928.115
12,079,78801,135,756
'2,622.7871 1.1.11,305
41119,002*2.804.113
392,440 498,654 764,185
254,063138,377
238,046200,608
444.380319,805
74,435 101,050
50,89823,537
68,96932.081
9,829 14,490
193.756
121,53172,225
8.1011,028
12,9551,535
26,188
22,7523,436
(13
(1)
('3
(,)
('7
(1)(1)
(0)
(0)
(1) (1) 176,883 $199,922 $554,511 1715,211 $2,374.645 $5,785,537 59,543,514
$21,454 $35,084 67,917 172.529 433,065 571,288 1.833,845 4,688.352 7.788,446(') (') (') (I) 507,142 674,688 2,245,661 5,601,376 9,177.677
(I) (1) (1) 377,903 521.990 1,706,444 $.51320. 7,43,66395,426 253,599 460,532 741,333 23)653350 02,753,780 4,799,964 13,448,548 21,279,346
74,711 194,998 323,661 569,031 1,512,023 1,764,604 2,144,323 5,571.121 7.295,312
'Total number of different individuals not reduced la full.time equivalent).Estimalod.
1 Data for Oral term of the ecedemle year.*Unless otherwise indicated, includes students enrolled et any time daring the
academic year.'Data for fall 1163.
Opecing lad enrollment Includes redden' cad extension degree-credit students.'Dab not available.Includes uonmead4r1 plant funds.
86
618.874.601
14,329.92918,4111583
13.134,919(1)
NOTE,-Beginning in 1959-60, includes Als.lta and Hawaii.
SOURCE: U.S. Department of Health. Edecatioo, and Welfare. Office of Education,*Biennial Survey of Education in the United States"; "Faculty and Other Profes-sional Staff in Institutions of Higher tducation"; 'llomprehonsive Report on Enroll-meld in Higher Education"; "Opening Fall Enrollment in Higher Education, 1968";"Earned Degrees Cenferted; end "financial Statistics of tmlittions of ,HigherEducation."
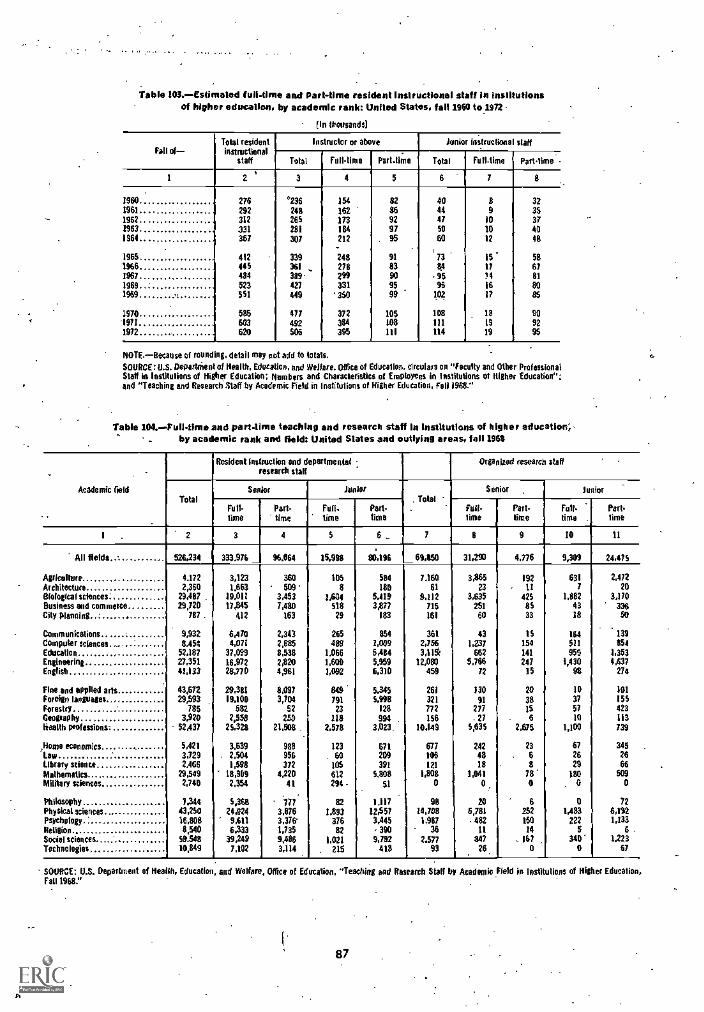
Table 103.-Estimated full-time and part-Ume resident instructional staff in institutionsof higher education, by academic rank: United States, fall 1960 to 1972
(In thousands)
Fall of-Total residentinstructional
staff
Instructor or above Junior instructional staff
Total Fell-time.
Part-time Total Full-time.
Part-lime
1 2' 3 4 5 6 7 8
1960 276 '236 154 82 40 8 321961 292 248 162 86 44 9 351962 312 26$ 173 92 47 10 371963 331 281 184 97 $0 10 401964 367 307 212 95 60 12 48
1965 412 339 248 911
73 15 581966 44$ 361 , 278 83 14 17 671967 484 389- 299 90 .95 14 811968 523 427 331 95 96 16 801969 0 551 449 350 99 102 17 8$
1978 585 477 372 105 108 18 991971 603 492 384 108 111 19 921972 - 620 506 395 111 114 19 95
NOTE-Because of rounding, detail may not add to totals.SOURCE: U.S. Wearied of Health, Education, and Welfare. Office of Education. circulars on "Faculty and Other ProfessionalStaff in Institutions of Higher Education; Numbers and Characteristics of Employees in lastitutions of Higher Education":and "Teaching and Research Staff by Academic Field in Institutions of Nigher Education, Fall 1968."
Table 104.-.4Full-time and pan-time teaching and research staff in institutions of higher education",,_ by academic rank and field: United Slates and outlying areas, fall 196$
Academic field
Resident Instruction and departmentalresearch stall
Organized research staff
TotalSenior Junior Senior . Junior
Fall-time
Part-time
Full-time
Part-time
. TotalFull-lime
Part-lime
Full-time .
Part-lime
I . 2 3 4 5 6_ 7
_J
8 9 10 11
All Raids 526,234 333,976 96.064 15,998 88.196 69.150 31,293 4,776 9,309 24,475
Apicalhire 4.172 3,123 360 105 584 7,160 3,865 192 631 2,472Architecture 2,360 1,663 509 8 180 61 23 11 7 20Biological sciences' 29,487 . 19,011 3,453 11604 5,419 9,112 3,635 425 1,882 3,170Business and commerce 29,720 17,845 7,480 $18 3,877 715 251 8$ 43 336City planning 787. 412 163 29 183 161 60 33 18 50
. .Communications 9,932 6,470 2,343 265 854 361 43 1S 164 139Computer sciences 8,454 4,071 2,685 489 1,009 2,756 1,237 154 511 854Education 52,187 37,099 8,538 1,066 5,484 3,115r 662 141 959 1,353Engineering 27.351 16.972 2,820 1,600 5,959 12,080 5,766 247 1,430 4,637English 41,133 28,770 4,961 1,092 6,310 459 72 15 98 274
Fine and applied arts 43,672 29.381 8,097 849 5.345 261 130 20 10 101
Foreign languagesForestry
29,593785
19,100582
3,704S2
791
23
5,998128
321772
91277
3815
3757
15$423
Geography 3,920 2,538 250 119 994 156 -27 - 6 10 113Health professions- 52,437 25.328 21,508 . 2,578 3,013. 10,149 5,635 2,675 1,109 739
Home economics , 5,421 3,639 988 123 671 677 242 23 67 345Law 3,729 . 2,504 956 . 60 209 106 48 . 6 26 26Library science 2,466 1,198 372 105 391 121 18 8 29 66Mathematics 29,549 18,909 4,220 612 5,808 1,808 1,041 78 180 509Military sciences........ ........ 2,740 2,354 41 294 - 51 0 0 0 . 0 0
. .
Philosophy 1,344 5,368 - 117 82 1.117 98 20 6 0 72Physical sciences 43,250 24,924 3,676 1.893 12,657 14,708 5,781 232 1,483 6,192Psychology 16,808 9,611 3,376 376 3,445 1,917 482 150 222 1,133Religion 8,540 6,333 1,735 82 -390 36 11 14 5 6 .Social sciences $9,548 39,249 9,486 1,021 9,792 2.677 847 - 167 340 1,223Technologies 10,849 7,192 3,114 215, 418 93
.26 0 0 67
.
SOURCE: U.S. Department of Health, Education, and Welfare, Office of Education. *leeching and Research Stall by Academic Field in Institutions of Higher Education,Fall 1968."
87
h
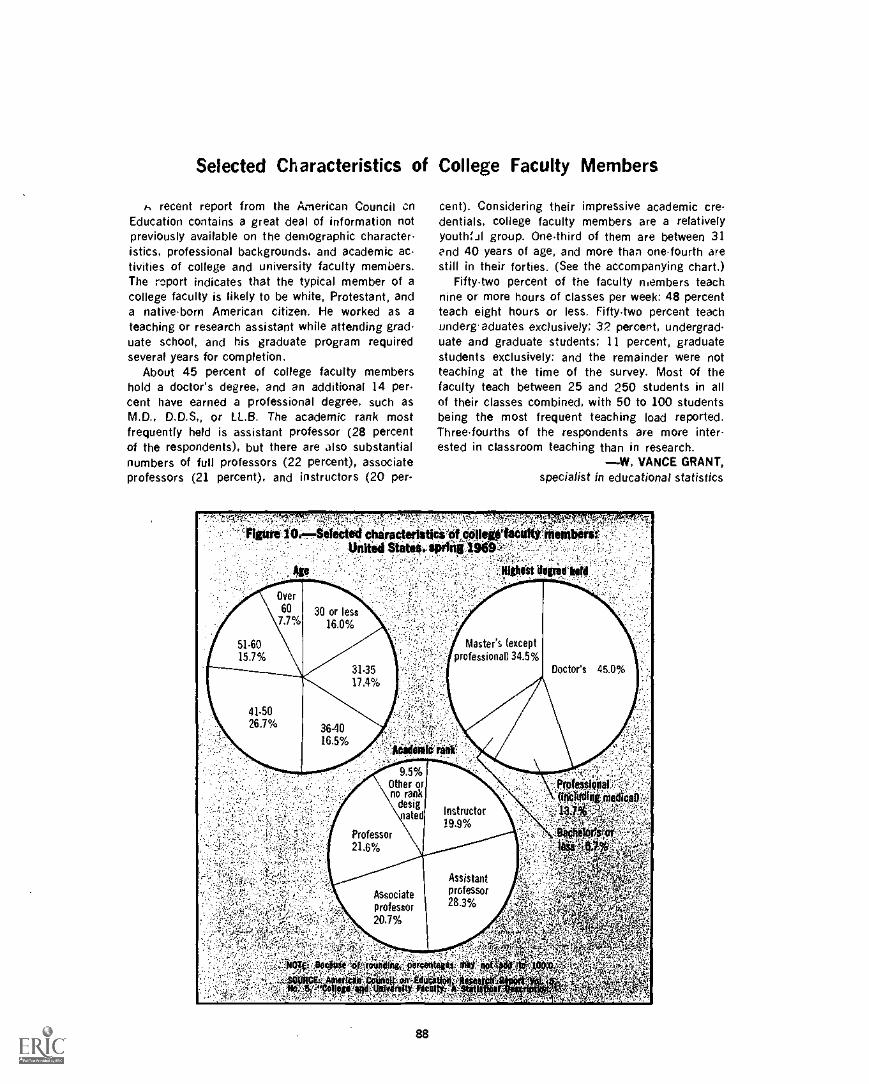
Selected Characteristics of
recent report from the American Council cnEducation contains a great deal of information notpreviously available on the demographic character.istics, professional backgrounds, and academic ac-tivities of college and university faculty members.The report indicates that the typical member of acollege faculty is likely to be white, Protestant, anda native.born American citizen. He worked as ateaching or research assistant while attending grad.uate school, and his graduate program requiredseveral years for completion.
About 45 percent of college faculty membershold a doctor's degree, and an additional 14 per-cent have earned a professional degree, such asM.D., D.D.S or LL.B. The academic rank mostfrequently held is assistant professor (28 percentof the respondents), but there are also substantialnumbers of full professors (22 percent), associateprofessors (21 percent), and instructors (20 per-
College Faculty Members
cent). Considering their impressive academic cre-dentials, college faculty members are a relativelyyouth:JI group. One-third of them are between 31and 40 years of age, and more than one-fourth arestill in their forties. (See the accompanying chart.)
Fifty-two percent of the faculty members teachnine or more hours of classes per week: 48 percentteach eight hours or less. Fifty-two percent teachundertaduates exclusively; 32 percent, undergrad.uate and graduate students; 11 percent, graduatestudents exclusively: and the remainder were notteaching at the time of the survey. Most of thefaculty teach between 25 and 250 students in allof their classes combined, with 50 to 100 studentsbeing the most frequent teaching load reported.Three-fourths of the respondents are more inter-ested in classroom teaching than in research.
W, VANCE GRANT,specialist in educational statistics
Master's (exceptprofessional) 34.5%
88
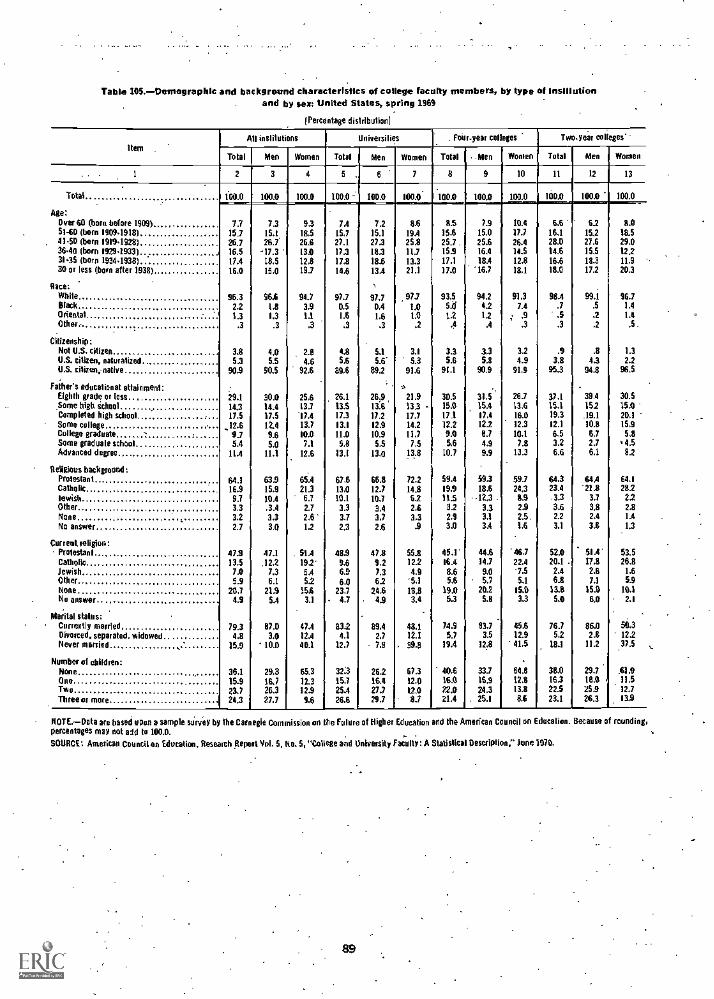
Table 105.-Demographic and background characteristics of college faculty members, by type of institutionand by sex: United States, spring 1969
(Percentage distribulion]
ItemAll inslitutions Universilies
.. Foir-year colleges
. -
Tim-your colleges*
Total Men Women TotalP
Men Women Total.
. Men Women Total Men Women
1 2 3 4 5 , 6 7 a1
9 10 It 12 13
Total 100.0 100.0 100.0 Io :i
100.0 100.0.
too.0 tom 100.0 100.0 too* 100.0
Age:Over 60 (born before 1909) 7.7 7.3 9.3 7.4 7.2 8.6 8.5 7.9 10.4 6.6 6.2 8.05140 (born 1909-1918) 15-7 15.t 18,5 15,7 15.1 19.4 15.6 15.0 37.7 16.1 15.2 18.541.50 (born 1919.1928) 26.7 26.7' 26.6 27.1 27.3 25.8 25.7 . 25.6 26.4 28.0 27.6 29.036-40 (born 1929.1933) 16.5 -17.3 13.0 17.3 18.3 11.7 15.9 16.4 14.5 14.6 15.5 1223135 (born 1934.1938) 17.4 18.5 12.8 17,8 18.6 13.3 17.1 18.4 12.8 16.6 18,3 11.930 or less (born after 1938) 16.0 15,0 19.7 14.6 13.4 21.1 17.0 '16.7 18.1 18.0 17.2 20.3
Race: 1
White 96.3 96.6 94.7 97.7 97.7 97.7 93.5 94.2 91.3 98.4 99.1 96.7Black 2.2 1.8 3.9 0.5 0.4 1.0 5A 4.2 7.4 .7 .5 1.4Oriental 1.3 1.3 1.1 1.6 1.6 1.0 1.2 12 ; .9 .5 .2 1.4Other, .3 .3 .3 .3 .3 .2 .4 .4 .3 .3 .2 .5 .
Citizenship:.
Not U.S. citizen 3.8 4.0 2.0 4.8 5.1 3.1 3.3 3,3 3.2 .9 .8 1.3U.S. citizen, naturalized 5.3 5.5 4.6 5.6 5.6' 5.3 5.6 5.8 4.9 3.8 4.3 2.2US. citizeknative 90.9 90.5 92.6 89.6 89.2 91.6 91.1 90.9 91,9 95.3 94.8 96.5
Father's educalionat attainment a ..Eighth made or less .29.1 30.0 25.6 26.1 26.9 21.9 30.5 31.5 26.7 37.1 39.4 30.5Some high school 14.3 14.4 133 13.5 13.6 13.3 - 15.0 15.4 13.6 15.1 152 15.0Completed high school 11.5 17.5 '17.4 17.3 172 17.7 17-1 17.4 16.0 19.3 .19.1 20,1Some college 12.4 13.7 13.1 12.9 142 12.2 12.2 12.3 12.1 10.8 15,9College graduate - .
_1219.7 9.6 10.0 11.0 10.9 11,7 9.0 8.7 10.1 6.5 6,7 5,8
Some graduate school 5.4 5.0 7.1 5.8 5.5 7,5 5.6 4.9 7.8 3.2 2.7 .4.5Advanced degree 11.4 11.1 12.6 13.1 13,0 13.8 10.7 9.9 13.3 6.6 6.1 8.2
Religious background:Protestant 64.1 63.9 65.4 67.6 66.8 72.2 59.4 59.3 59.7 64.3 64A 64,1Catholic 16.9 15.9 21.3 13,0 12.7 14.8 19.9 18.6 24.3 23.4 -21.8 282Jewish 9.7 10.4 6.7 10.1 103 6.2 11.5 -12.3 - 83 -3.3 3.7 22Other 3.3 .3.4 2.7 3.3 3.4 2.6 3.2 3.3 2.9 3.6 3.8 2,8None 3.2 3.3 2.6' 3.7 3.7 33 2.9 3.1 2.5. 22 2.4 1.4No answer 2.7 3.0 1.2 2.3 2.6 .9 3.0 3.4 1.6 3.1 3.8 1.3
Current religion:Prolestanl 47.9 47.1 . 51.4 489 47.8 55.8 45.1' 44.6 '46,7 52.0 51.4' 53.5Catholic 13.5 32.2 192' 4.6 9.2 12.2 16.4 14.7 22.4 20.1. 17.8 26.8Jewish 7.0 7.3 5.4 6.9 7.3 4.9 8.6 9.0 1.5 2.4 2.6 1.6Other 5.9 6.1 5.2 6.0 6.2 '5.1 5.6 5.7 5.1 6.8 7.1 5.9None 20,7 21.9 15.6 23,7 24,6 18.8 19.0 20.2 15.0 131 15.0 10.1
No answer 4.9 5.4 3.1 4.7 4.9 3.4 5.3 5.8 3.3 5.0 60 22
Marital status:Currently married 79.3 87.0 47.4 832 89.4 48.1 74.9 83,7 45.6 76.7 86.0 50.3Divorced, separated, widowed 4.8 3.0 12.4 4.1 2.7 12.1 5.7 3.5 12.9 5.2 2.8 122Never married . 15.9 10.0 40.1 12.7 7.9 . 39.8 19.4 12.8 41.5 18.1 112 37.5
Number of children: .
None 36.1 29.3 65.3 32.3 26.2 67.3 40.6 33.7 64.8 38.0 29.7 .61.9
One 15.9 16.7 12.3 15.7 16.4 12.0 16.0 16.9 I2,8 16.3 IBS . 11.5Two 23.7 26.3 12.9 25.4 272 12.0 22.0 24.3 13.8 22.5 25.9 12.7Three or MOO 24.3 27.7 9.6 26.6 29.7 8.7 21.4 . 25.1 8.6 23.1 26.3 13.9
NOTE. -Data are based upon a sample survey by The Carnegie Commission on the Plum of Higher Education and the American Council on Education. Because of rounding,percentages may not add to 100.0.
SOURCE: American Councilor, Education. Research Report Vol. 5. No. 5, "Col ego and University Faculty: A Statistical Description," June 1970.
89
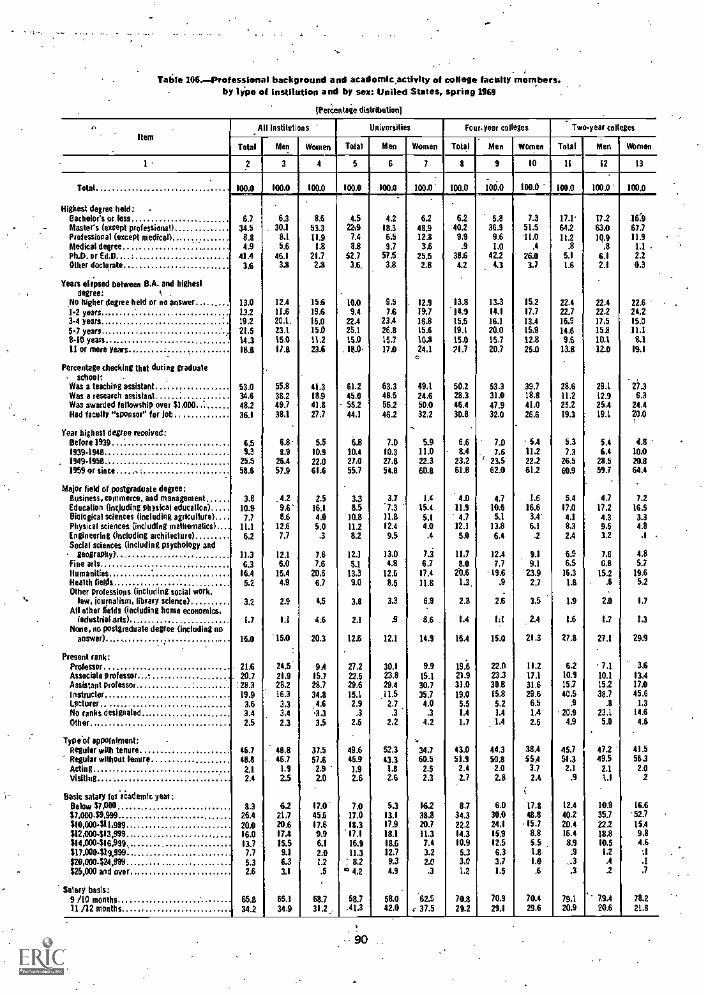
Table 106.-Professienal background and acadornicactivity of college (acuity members,. .
by type of institution and by sex: United States, spring 1969
IPer;*Antage distribution)
,.Item
. All Institutions Universilies Four.year colleges Two-year colleges
Total Men Women Total Men Women Total Men Women Total Men Women
3 4 5 6 7 8 9 10 11 12 13
Total.. 100.0 100.0 100.0 100.0 100.0 moll- imo 100.0 two 100.0 1000 100.0
.Highest degree held: -
Bachelor's or less 6.7 6.3 8.6 4.5 4.2 6.2 6.2 5.8 7.3 17.1' 17.2 16.9Master's (except professional) 34.5 . 30.1 53.3 229 18.3 48.9 40.2 36.9 51.5 64.2 63.0 67.7Professional (except medical) 8.8 8.1 18.9 7.4 6.5 12.8 9.9 9.6 11.0 11.2 10.9 11.9Medical degree....... 4.9 5.6 IA 8.8 9.7 3.6 .9 LO .4 .8 '.8 1.1 .
Ph.D. or Ed.D.. * 4IA 46.1 21.7 52.7 RS 25.5 38.6 42.2 26,0 5.1 6.1 2.2Other doctorate
.
3.6 3.8 2.8 3.6, 3.8 2.8 4.2,
4.3 31 1.6 2.1 0.3
Years elapsed between B.A. and highestdegree: .
No higher degree held or no answer 13.0 12.4 15.6 10,0 9.5 . 12.9 13.8 13.3 15.2 22.4 22.4 2261.2 years 13.2 11.6 19.6 9.4 7.6 19.7 14.9 14.1 17.7 22.7 22.2 24.23-4 years 19.2 20.1- 15.0 22.4 23.4 16.8 15,5 16.1 13.4 16.9 17.5 15.0
5.7 years 21,5 23.1 15.0 25.1 26.8 15.6 19.1 20.0 15.9 14.6 15.8 11.I8-10 years 14.3 15.0 11.2 15.0 15.7 10.8 15.0 15.7 12.8 9.6 10.1 8.1II or more years 98.8 11.8 23.6 . 15.0- 17.0 24,1 71.7 20.7 25.0 13.8 12.0 19.1
. . 4Percentage checking that during graduate
school: .
.
.
Was a teaching assistant 53.0 55.8 41.3 61.2 63.3 49.1 50,2 53.3 39.7 28.6 29.1 27.3Was a research assistant 34.6 38.2 18.9 45,0 45.5 24,6 28.3 31.0 18.8 11,2 12.9 6.3Was awarded fellowship over $1,000 48.2 49.7 41.8 55.2 56.2 50.0 46.4 47.9 41.0 25.2 25.4 24,4Had faculty "sponsor for job 36.1 38.1 27.7 44.1 46.2 32.2 30.8 32.0 26.6 19.3 19.1 20.0
Year highest degree received:Before 1939 6,5 1.8- 5.5 4.8 7.D 5,9 6,5 7.0 5.4 5.3 5.4 4.81939.1948 9.3 8.9 10.9 30.4 10.3 11.0 8.4 7.6 112 7.3 6.4 10,0
194949511.- 25.5 26.4 22.0 27.0 27.0 22.3 23.2 : 23.5 222 26,5 28.5 20.8
1959 or since 58.6 57.9 61.6 55.7 51.8 60.0 61.8 62.0 61.2 60.9 59.7 64.4-
Major field of postgraduate degree:.
Business, commerce, and management ... - . 3.8 4.2 2.5 3,3 3.7 1.4.
4.0 4.7 1.6 5.4 4.7 7.2Education (including physical education) 10.9 0.6' 16.1 8.5 '7.3 15.4 11.9 10.6 16,6 17.0 17.2 16.5
Biological sciences (including agricullure).. - 7.7 8.6 4.0 10.8 11.8 5.1 4.7 5.1 3.4' 4.1 4.3 3.3Physical sciences (including mathematics}, 11.1 12.6 5.0 11.2 12.4 4.0 12.1 13.8 6,1 8.3 9.5 4.8Engineering (including architeclure) 6.2 7.7 .3 8.2 9,5 .4 5,0 6.1 .2 2.4 3.2 .1
Social sciences (including psychology andgeography).. 11.3 12.1 7.6 124 13.0 7.3 111 12.4 4.1 6.9 7,6 4.8
fine arts 6.3 6.0 7.6 5.1 1.8 63 8.0 7,7 9.1 6.5 6.8 5.7Humanities 16.4 15.4 20.6 13.3 12.5 17.4 20.6 *19.6 23.9 15.3 15.2 19.6Health lields 5.2 4.9 6.7 9.0 8.5 11.8 L3 .9 2.7 1.8 . .6 5.2Other professions (including social work. -
law, journalism, library science) 3.2 2.9 4.5 3.8 3.3 6.9 2.8 2.6 3.5 1.9 2,0 1.7All other fields (including home economics,
imiustriaituts) 1.7 LI 4.6 2.1 .9 8.6 - IA 1:1 2.4 116 1.7 13None, no postgraduate degree (including no
answer).. 15,0 -15,0 203 12.6 12,1 14.9 15.4 150 21.3 27.8 27.1 29.9
Present rank:Professor 21.6 24,5 9A 27.2 30.1 9.9 19.6 22.0 11.2 62 ' 7.1 3.6Associate professor 20.7 21.9 15.7 22.5 23.8 15.1 21.9 23.3 17.1 101 10.1 13.4
Assistant professor :28.3 28,2 28.7 29.6 29,4 30,7 31.0 30.8 31.6 153 15.2 17,0
Instructor 19.9 16.3 34.8 15,1 35.7 19,0 15,8 29.6 40.5 38.7 45.6
Lecturer.. ., 3,6 3.3 4.6 2.9,11.5
2,7 4,0 5.5 5,2 6.5 .9 .8 1.3
No ranks designated 3.4 3.4 '3,3 .3 .3 .3 1.4 IA 1.4' 20.9 23,1 14.6
Other 2,5 2.3 3.5 2,5 2.2 4,2 1.7 1,4 2.5 4.9 5.0 4.6
Typo( appointment: ,Regular with tenure 46.7 48,8 37.5 49.6 52.3 34.7 43.0 44.3 38.4 45.7 472 41.5Regular without tenure 48.8 46.7 57.6 45.9 43.3 60.5 519 $0.8 554 51.3 49.5 563Acting. 21 1.1 2.9 1.9 1.8 2.5 2.1 2.0 3.7 2.1 2.1 2.0Visiting 2.4 2.5 2.0 2.6 26 2.3 2.7 2.8 2.4 .9 LI 2
Basic salary for liademis year:i
Below $1.000 8.3 6.2 17.0' 7.0 5.3 16.2 8.7 6.0 17.8 12.4 10.9 16.6
$7.000.99.999 26.4 21,7 45.5 17.0 13.1 38.8 34.3 30.0 48.8 40,2 35.7 '52.7810.000411,999 20,0 20.6 17,6 183 17.9 20.1 22.2 24.1 , 15.7 20.1 22.2 15.4
812.000413.999 16.0 87.4 9.9 87.8 18.1 11.3 14.3 15.9 8.8 16.4 18.8 9,8
884.000486.999.,. 13.7 15.5 6.1 16.9 18.6 7.4 10.9 12.5 5,5 8.9 10.5 4.6
817.600411.599 7.7 9.1 2.0 11.3 12.7 3.2 5.3 6.3 1.8 .9 12 '.1
$20.000.824,999 5.3 6.3 12 :8.2 9.3 2.0 3.0 31 1.0 ..3 .4 .1
825,000 and over 2.6 3.1 .5 0 4.2 4.9 .3 1.2 1.5 .6 ,3 .2 .7
Salary basis:9 /10 months 65.8 65.1 68.7 58.7 58.0 62.5 70.8 70.9 70.4 79.1 79.4 78.211 /12 months 34.2 34,9 31.2,, .40 42.0 , 37.5 29.2 29.1 29.6 20.9 20.6 21.8
- go
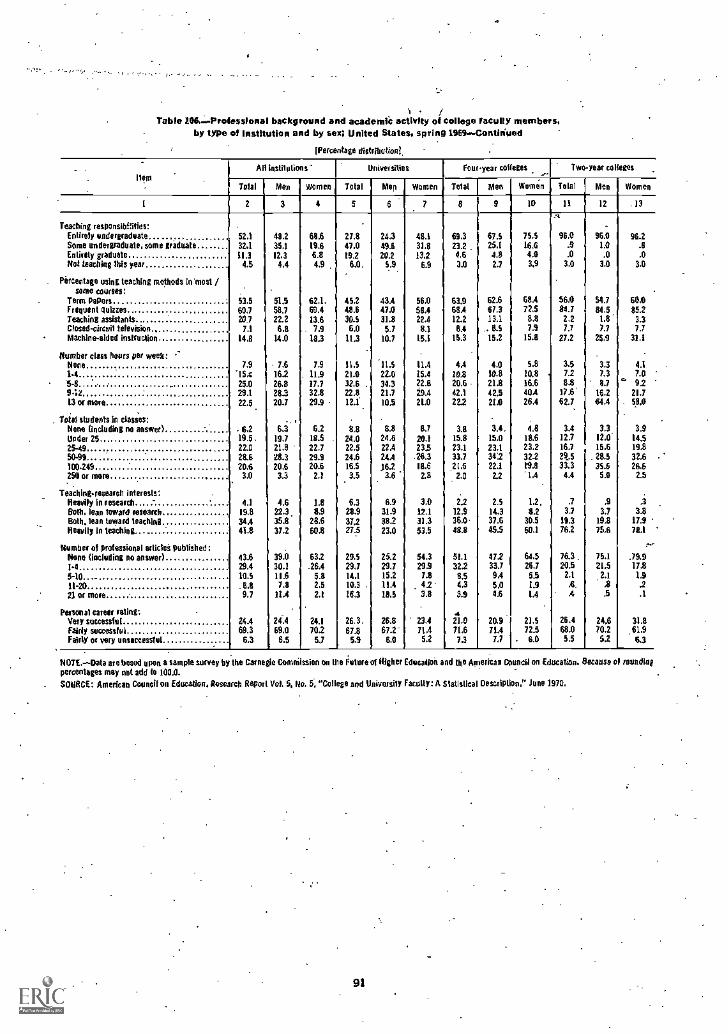
ti -Table 2060.-Professional background and academii activity of college faculty members,
by type of institution and by sex; United States, spring 1969-Continued
'Percentage distribution?.
ItemAll institutions' Universities Feu -year col egos
- ...--Two-year colieges
Total Men Women Total Men Women Total Men Women Total Men Women
1 2 3 4 5 6 7 8 9 10 11 12 -13
Teaching responsIbRities: . _
Entirely undergraduate 52.1 48.2 68.6 27.8 24.3 48.1 69.3 67.5 75.5 96,0 96.0 95.2Some undergraduate, some graduate 32.1 35.1 19.6 47.0 493 31.8 23.2 25.1 16.6 .9 1.0 .8Entirety graduate 11.3 12,3 6.8 192 20.2 13.2 4.6 4.8 4.0 .0 .0 .0Not Inciting This year 4.5 4.4 4.9 6.0. 5.9 6.9 3.0 2.7 3.9 3.0 3.0 3.0
Percentage using teaching methods inmost /some 0041111:
Term papers 53.5 51.5 62.1. 45.2 43.4 560 63.9 62.6 68A 56.0 54.7 60.0Frequent quizzes 60.7 58.7 69.4 48.6 47.0 68.4 68.4 67.3 72.5 84.7 84,5 85.2Teaching assistants 20_7 22.2 13.6 30.5 31.8 22.4 12.2 13.1 8.8 2.2 1,8 3.3Closed-circuit television 7.1 6.8 . 7.9 60 5.7 8.1 8.4 .. 8.5 7.9 7.7 7.7 72Machineaided instruction 14.8 14.0 18.3 11.3 10.7 15.1 15.3 152 15.8 27.2 25,9 31,1
Number class hoots pet week: -- -
Nene 7.9 7.6 7.9 11.5 '11.5 11.4 4.4 4.0 5.8 3.5 3.3 4.114 '15.1 16.2 11.9 21.0 22.0 15.4 10.8 10.8 10.8 7.2 7.3 7.0
54 25.0 26.8 17.1 32.6 . 34.3 22.8 20.6 21.8 16.6 8.8 8.7 ° 92942 29.1 28.3 32.8 22.8 21.7 29.4 42.1 42.5 40.4 17.6' 16.2 21.7
13 or more 22.5 20.7 29.9 12.1 10,5 21.0 22,2 21.0 26.4 62.7 44.4 - 58A
Total students in classes: ...Nene (including no answer) - 6.2 6.3 6.2 8.8 8.8 8.7 3.8 3.4. 4.8 3.4 3.3 3.9
Under 25 195 . 19.7 18.5 . 24.0 24.6 20.1 15.8 15.0 18.6 123 123. 14.5
25-49 22.0 21.8 22.7 22.5 22A 23.5 23.1 23.1 23.2 16.7 15.6 19.8
50-99 28.6 28.3 29.9 24.6 24.4 26.3 33.7 342 32.2 29,5 .28.5 32.6
100-249 20.6 20.6 20.6 16.5 16.2 18.6 22.1 19.8 33.3 35.5 26.5250 or more
,33 3.3 2.1 3.5 3.6 2.8
.21.52.0 22 1.4 4.4 5.0 2.5
Teachingresearch Interests: .
Heavily In research 4.1 4.6 1.8 6.3 6.9 3.0 2.2 2.5 1.2, .7 .9 .3
Both, lean toward research.- . 19.8 22.3, 8.9 28.9 31.9 12.1 12.9 14.3 8.2 33 3.1 3.8Both, lean toward leaching 34.4 35.8 28.6 37.2 382 31.3 36,0 37.6 30.5 19.3 193 17.9
Heavily in leaching 41.8 37.2 60.8 27.5 23.0 53.5 48.8 45.5 60,1 76.2 75,6 78.1
Number of professional articlei published : ,--
None (including no answer) 43.6 39.0 63.2 29.5 25.2 54.3 51.1 472 64.5 76.3 75.1 .79.91.4 29.4 30.1 -26.4 29.7 29,7 293 32.2 33.7 26.7 20.5 21.5 17.85-10 10.5 11.6 5.8 14.1 15.2 7.8 8,5 9.4 5.5 2.1 2.1 1.9
11 -20 .6.8 1.8 2.5 10.3 . 114 42 4.3 5.0 1.9 A. .3 .221 or more . 9.7 11.4 22 163 18,5 3.8 3,9 4.6 1.4 .4 .5 .1
Personal career rating: 4Very successful 24.4 24.4 24.1 26.3. 26.8 23.4 21.0 20.9 21.5 26.4 24.6 31.8
Fairly successful 69.3 69.0 702 67.8 67.2 71.4 71.6 714 12.5 68.0 70.2 61.9
Fairly or very unsuccessful 6.3 6.5 5.7 5.9 6.0 52 7.3 7.7 . 6.0 5.5 52 6.3
NOTE.Data are based upon a sample survey by the Carnegie Comm scion on the Future of Higher (decagon and the ATMs an Council on Education. Because of tauadiaypercentages may net add to 100,0.
_ SOURCE: American Councilors Education, Research Report Vol. 5, No. 5, "College and University Faculty: A Statistical Description," June 1970.
91
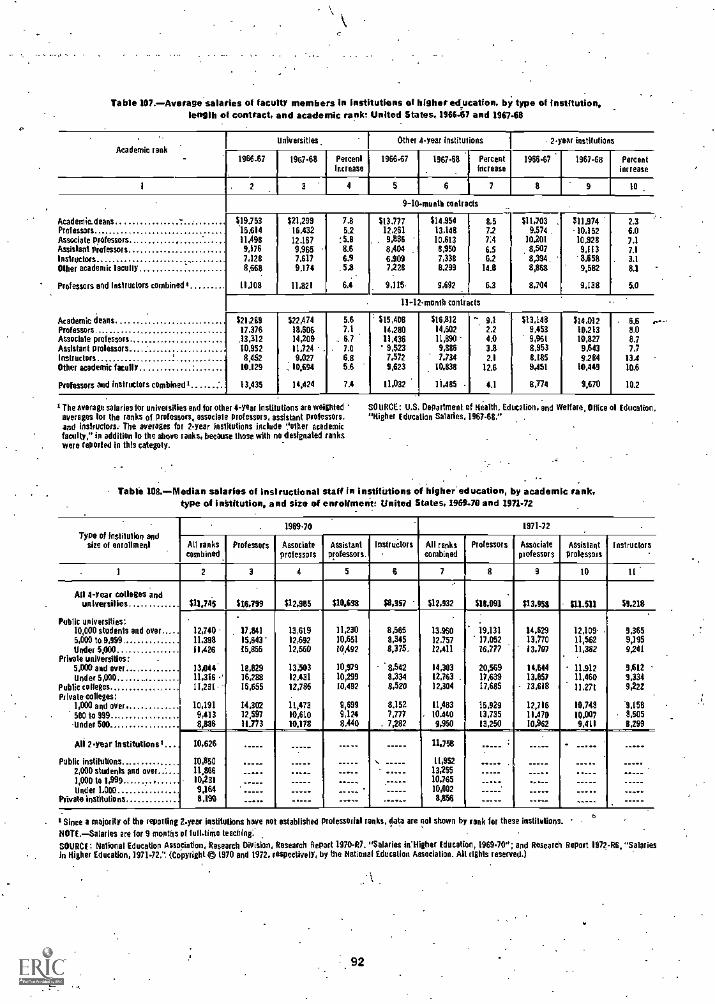
Table 107.-Average salaries of faculty members in institutions of higher education, by type of institution,length of contract, and academic rank: United States, 196647 and 196748
. . -
Academic rackUniversities, Other 4-year institutions
1966.67 1967.68 PercentIncrease
1966-67 1967.68 Percentincrease
1 2 3 4 5 6 7
9-10month contracts
Academicdeans $19.753 $21,299 7.9 $13.777 $14.954 8.5Professors 5,614 16,432 5,2 12,261 13,148 7.2Associate professors 11,498 12.167 :5.11 9,886 10,613 7:4Assislant professors 9,176 9,965 8.6 8,404 8,950 6.5Instructors 7,128 7,617 6.9 6,909 7,338 6.2Other academic 'acuity 8,668 9,174 .5.8. 7,228 8,299 14.0
Professors and instructors combined' ...... 11,108 11,821 6.4 9,115- 9,692 6.3
11-1 2-monlb contracts
Academic deans $21,2119 $22,474 5.6 1 $15,408 $16,812 -, 9,1
Professors 17,376 18,606 7.1 14,280 14,602 2.2Associate professors. .13,312 14,209 6.7 11,436 11,690 4.0Assistant professors 10,952 11,724 . . 7.0 " 9,523 4,886 3.8Instructors 8,452 9,027 6.8 7,572 7,734 2.1
Other academic faculty t0.129 . 10,894 5.6 9,623 10,838 12.6
Professors and instructors combined* 13,435 14,424 7.4 11,032 11,485 4.1
1 The average salaries for universities end for other 4-year institutions are weightedaverages for the ranks of professors, associate professors, assistant professors.and Inslruclors.. The averages for 2-year institutions include "other academicfaculty," in addition lo the above ranks, because those with no designated rankswere reported In this category.
2.year institutions
1966.67 1967-68 Percentincrease
8 9 10
1
$11,7039.574
10,2018,5078,394.8,868
8,704
$11,974-10,15210,9289,1138,9589,582
9,138
2.36.07.17.1
3.18.1
5,0
$13,1489,4539,9618,9538,1859,451
8,774
514,01210,21310,8279,6439.284
10,449
9,670
. 6.6 .---.8.08.77.7
13.410.6
10.2
SOURCE: U.S Department of Health, Education, and Welfare, °nice of Education,"Nigher Education Salaries, 1967-68,"
Table 108.81edian salaries of instructional staff in institutions of higher' education, by academic rank,type of inistitution, and size of enrollment: United States, 1969-78 and 1971-72
_ -
Type of institution andsize of enrollment
1969.70 1971-72
All rankscombined
Professors Associateprofessors
Assistantprofessors.
Instructors All rankscombined
Professors Associateprofessors
Assistantprofessors
Instructors
1 2 3 4 5 6 7 8 9 10 11
All 4-year collagen anduniversities 811,785 $16,799 $12,985 $10,638 $11,357 $12,932 $10,091 113,958 $11.511 $9,210
Public universities:10,000 students and over 12,740 17,841 13,619 11,230 8,565 13,960 19,131 14,629 12,109 9,3655,000 to 9,999 11,398 15,643' 12,692 10,651 8,345 12,757 17,052 13,770 11,562 9,195Under 5,000 11,426 15,855 12,560 10,492 8,375. 12,411 26,777 13,707 11,382 9,241
Private universities:5,000 aed over 13,044 18,829 13;503 10,979 '8.542 14,303 20,569 14,644 11.912 9,612Under 5,000 11,316 .. 16,288 12,431 10,299 8,334 12,763 - 17,639 13,857 11,460 9,334
Public colleges 11,231 15,655 12,786 10,492 8.520 12,304 17,685 - 13,918 11,271 9,222Private colleges:
1,000 and over,500 to 999
10,1919,413
14,30212,597
11,47310,610
9,6999,124
8,1527,777
11,483. 10.440
15,92913,735
12,71611470
10,74810.007
'9,1588,505
-Under 500 8,886 11,773 10,178 8,440 . 7,282 9,950 13,250 10,962 9,411 6,299
All 1-year lostitutionsl , 10,626 11,716
Public institutions 10,850 11,952
2,000 studenls and over ..: 11,866 13,255
1,000 0 1,999 10,231 10,765Under 1,000 9,164 10,002 .....
Private institutions 8,196 8656
'Since a majority of the reporting 2-year institutions have not established professorial ranks, data are not shown by rank for these institutions.
NOTE.-Salaries are for 9 months of full-time teaching:SOURCE: National Education Association, Research Division, Research Report 1970-117. "Salaries in'Higher Education, 1969-70"; and Research Report 1972-116, "Salariesin Higher Education, 197142." (Copyright tf;) 1970 and 1972, respectively, by the National Vitiation Association. Alt tights reserved.)
k
: 92
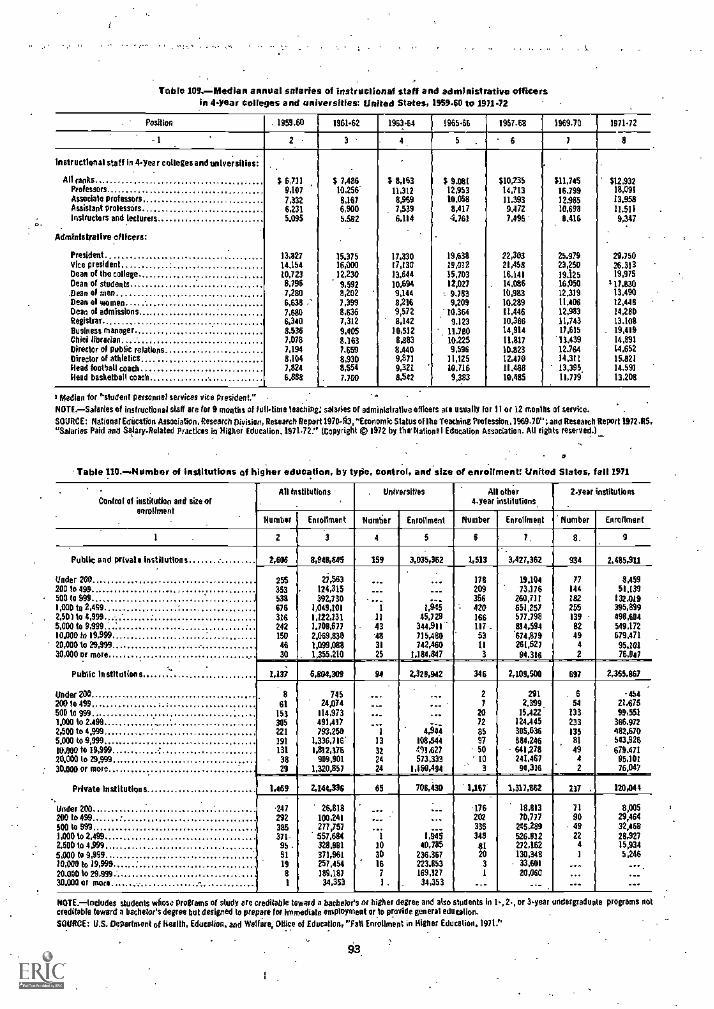
Table 109.-Median annual salaries of instructional staff and administrative officersin 4-year colleges and universities: United States, 1959-60 to 1971.72
Position 1959-60 1961.62 1963-64 1965.66 1967-68 1969-70 1971.72
- 1.
3 4 5 . 6 7 8
. .
instructional staff In 4year colleges and universities:
All ranksProfessorsAssociate professorsAssistant prolessirs
S 6,7119,1077,332
6,231
$ 7,48610,256'
8,1676%0
S 8,16311,3128.9597,539
S 9.08112,95310.0588,417
$10,23514,71311.3939.472
.
$11,74516.79912.98510,698
$12,93218.09113.95811.511
instructors and lecturers 5.095 5.582 6,114 .161 7,496 8.416 9,347
Administrative officers: 1
..
President 13,127 15.375 17.330 19,638 22,303 25.979 29,750Vice president 14,154 16,000 17,130 19,012 21,458 23,250 26.313Dean of the college 10,723 12,230 13.644 15,703 16.141 19,125 19,975Dean of students 8,7% 9,592 10.694 12,027 . 14,086 16050 317.630,Dealt of men 7,280 8,202 9,144 .. 9.783 10,983 12,319 13,490Dean al women 6,638 7,399 8,216 9,209 10.289 11.406 12,448Dean of admissions 7,680 8,636 9,572 "10.364 11,446 12,933 14,280Registrar I 6.340 7,312 8,142 9.123 10,366 11,743 13.108Business manager 8.536 9.405 10,512 -*, 11,790 14,914 17,615 - 19,419Chief librarian 7,078 8,163 8,883 10,225 11,817 '13.439 14,891Director of public relations 7,194 7.659 8.440 9,596 10.823 12.764 14.652Director of athletics 8,104 8,930 9,871 11,125 12,410 14,311 15.821Head %dhoti coach 7,824 8,554 9,321 10.716 11.498 13,395 14,591Head basketball coach . 6,888 7.700 8,542 9,383 10,485 11,719 13.208
3 Median for "student personnel services vice president,".
NOTE.-Salaries of instructional staff are for 9 months of full-time leaching: salaries of administrative officers ace usually For 11 or 12 months of service. -
SOURCE: National Education Association, Research Division, Research Report 1970-03, "Economic Stoke of the Teaching Prof ession,1969-70" ; and Research Report 1972-115."Salaries Paid and Salary-Related Practices in Nigher Education. 1971-72." (Copyright C) 1972 by the*Nationa I Education Association. Ml rights reserved.)._
Table 110. - Number of institutions of higher education, by type, central, and size of enrollment United States, fall 1971
Control of institution and site ofenrollment
-
TAli institutions . Universities Al other
4-year mstilutions.2-year institutions
Number Enrollment Number Enrollment Number Enrollment Number Enrollment
1 2 3 4 5 6 7, 8. 9
Public and private institutions 2,606 8,941,645 159 3,035,362 1,513 3,427,362 934 2.485,9U
Under 200 255 27,563 .._ __. 178 19,104 77 8,45920010 499. 353 124,315 ___ ___ 209 73,176 144 51,139500 to 999 538 392,730 .... 356 260,711 182 132.0191,000 to 2,469 676 1,049,101 1 1,7945 ; 420 551,257 255 395,8992,501 to 4,999 316 1,122,131 11 45.729 166 577.798 139 498,6945,000 to 9,999 242 1.708,617 - 43 344,911- 117 _ 814,594 62 549.17210.000 to 19,999 150 2,069,830 '48 715,480 53 674,819 49 679,47120,000 to 29,999 . 46 1,099,088 31 742,460 11 261,527 4 95.10130,000 or more 30 . 1,355,210 25 1,184,847 3 94.316 2 76,047
Public institutions 1,137 8,804,309 94 2,328,942 346 2,109,500 697 2,365,667
Under 200 8 745 ... .... 2 291 . 6 -454200 lo 499 61 24,074 ___ ... 7 2%9 54 21.675500 to 9991.000 to 2.499
153305
114,973491,417
...
..._.. 20
7215,422
124.445133233
99,551366.972
2,500 to 4,999 221 793,256 1 4,4-t 85 305,636 135 482.6705,000 to 9,999 191 1.336,716' 13 108,544 97 684,246 81 543.92610,000 to 19,999 131 1,812,376 32 411,627 50 641,278 49 679.47120.000 to 19,1199 38 91)9,901 24 573,333 10 241,467 4 95,10130.000 or more
N.29 1,32057 24 1,150,494 3 94,316 2 76,047
Private institutions
Under 200
1,469 2,144,336 65 706,430 1,187- 1,317,162 237 , 120,044
1 47 26,818 ..... .. -176 18,813 71 8,005
200 16499 292 100,241 .... ... 202 70,777 90 29,464500 to 999 385 277,757 ... 336 245,289 49 32,4581,00010 2,499 371- 557,684 1 1,945 348 526.832 22 28,9272,500 to 4,999 95 328,981 10 40,785 III 272,162 4 15,9345,000 to 9,999 51 371,961 30 236,367 20 130,348 1 5,24620,000 to 19,999 19 257,454 16 223.853 3 33%1 ... ....20.090 to 29,999 8 189,187 7 169,127 1 20,060 ... ___
30,000 or more - - 1 34,353 1 . 34,353 ___ ___ ... ...
NOTE. - includes students whose programs of study are creditable toward a bachelor's or higher degree and also students In 1, 2, or 3-year undergraduate programs notcreditable toward a bachelor's degree but designed to prepare for immediate employment or to provide general education.
SOURCE: U.S. Department of Health, Education, and Wallace, Office of Education, "fall Enrollment in Nigher Education, 1971."
03
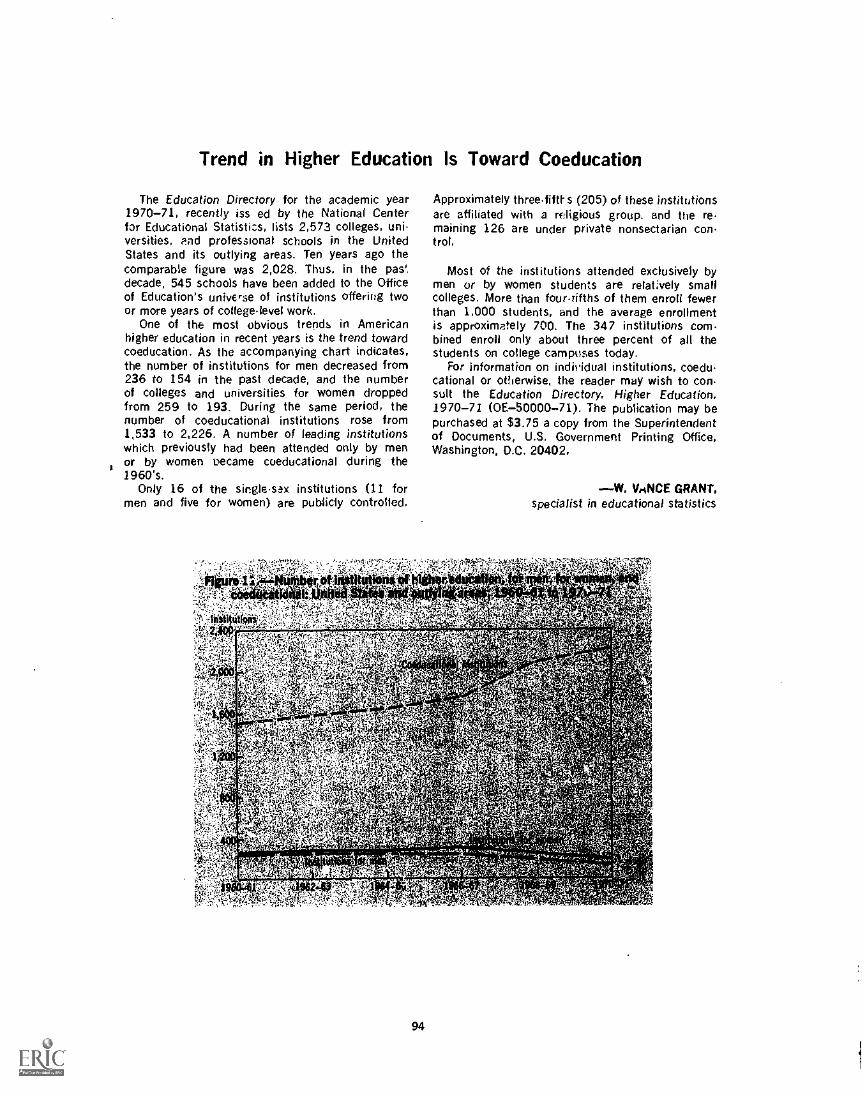
Trend in Higher Education is Toward Coeducation
The Education Directory for the academic year1970-71, recently iss ed by the National Centerfor Educational Statistic.s, lists 2,573 colleges, uni.versities, and professional schools in the UnitedStates and its outlying areas. Ten years ago thecomparable figure was 2,028. Thus, in the pas'.decade, 545 schools have been added to the Officeof Education's universe of institutions offering twoor more years of college.level work.
One of the most obvious trends in Americanhigher education in recent years is the trend towardcoeducation. As the accompanying chart indicates,the number of institutions for men decreased from236 to 154 in the past decade, and the numberof colleges and universities for women droppedfrom 259 to 193. During the same period, thenumber of coeducational institutions rose from1,533 to 2,226. A number of leading institutionswhich previously had been attended only by menor by women became coeducational during the1960's.
Only 16 of the single sax institutions (11 formen and five for women) are publicly controlled.
Approximately three-fifff s (205) of these institutionsare affiliated with a religious group. and the re-maining 126 are under private nonsectarian con.trot.
Most of the institutions attended exclusively bymen or by women students are relatively smallcolleges. More than four-rifths of them enroll fewerthan 1,000 students, and the average enrollmentis approximately 700. The 347 institutions com-bined enroll Only about three percent of all thestudents on college campuses today.
For information on individual institutions, coedu.cational or otherwise, the reader may wish to con.suit the Education Directory, Higher Education,1970-71 (OE-50000-71). The publication may bepurchased at $3.75 a copy from the Superintendentof Documents, U.S. Government Printing Office,Washington, D.C. 20402.
W. VANCE GRANT,specialist in educational statistics
94
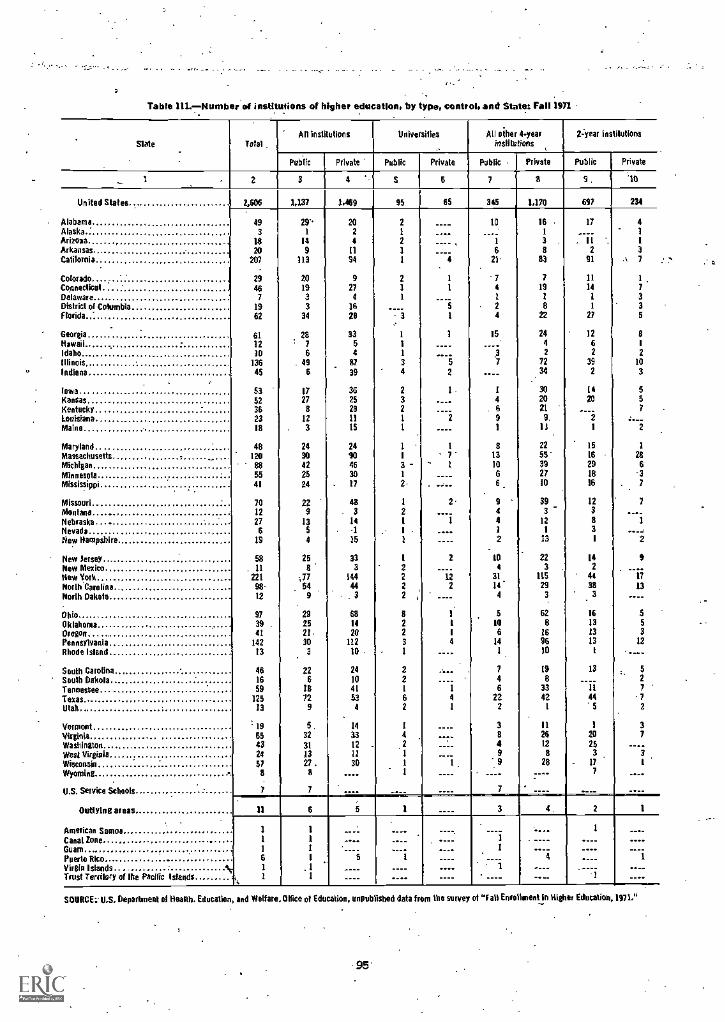
3
Table 111.Number of institutions of higher education, by type, control, and State: Fell 1971
Slate Total-en institutions Universilies All pipe 4.year
institutions2:year institutions
Politic Private Public Private Public Private Public Private
... I 2 3 4 S 6 7 8 9 'III
United States
AlabamaAlaskaArizonaArkansasCaldwell.
ColoradoConneclicalDelawareDistrict of ColumbiaFlorida
GeorgiaHawaiiIdahoIllinois..Indiana
IowaKansasKentuckyLouisianaMaine
MarylandMassachusetts _
MichiganMlnnesolaMississippi .
MissouriMontana.Nebraska.NevadaNew Hampshire
New JerseyNew MexicoNew YorkNorth- CarolinaNorth Dakota,
OhioOklahomaOregonPennsylvaniaRhode Island
South CarolinaSouth DakotaTennesseeTexasUtah
VermontVisginis.. .......... .... ...... ............WashingtonWest VirginiaWisconsinWyoming
U.S. Service Schools
Outlying areas
American SamoaCanal IoneGuamPuerto Rico
.
Virgin Islands...-
Trust Territory of the Pacific Islands
-
N.
2,606 1,137 1,469 95 65 345 1,170 697 234
493
0820
207
29467
1962
611210
13645
5352362318
48120
es5541
7012276
19
5811
22198-
12
9739 -
4114213
4616
59125
13
-1965432457
8
7
29'.1
149
113
201933
34
28: 7
6. 49
6
17278
12. 3
2490422524
229
135
4
258
;7754
9.
29
252130
3
226
18n9
532311327 .
8
7
2024
11
94
927
4
1628
3354
8739
36252811
IS
24904630
_ 17
48. 3
14
-2
16
333
14444- 3
681420
11219
24
104153
4
14
331211
30....
""
.
2
1
2
1
1
21
1
...., 3
1
i1
3
4
2
32
1
1
1
1
3 -1
1
2t
1
1
22
22 :
822
3
1
221
62
1
42
1
1
1
____
_____...
____
____
____
....
___.____
____
'____
----
____
---
____
----
....
--
____
----
----____
4
1
1
5
1
1
52
1-
2
1
7
1
2 '
1
2
122
.
1
1
I4
.
1
4
1
.-
1
10
....1
623
740
24
15...."
37
..--
1
4. 6
9
1
813106
6.
9441
2
104
31
144
5
106
141
7
46
222
38499
----7
161
3 .
883
719t
822
2442
7234
3020219.
11
2255392710
393-
121
13
223 .
11529
3
628
169610
198
3342
1
11
2612
828
.____
17.
11
2
11
1114
1
1
27
1262
392
1420
----21
15162918
16
123831
142
44383
16131313
1
13
____11
445
1
20253
- 177
.-__
_
A
,
41
1
37
1
7
335
8
210
3
55?
2
t
286
-32
7.-1
2
9--..
17
13--5
5
312
----
52
7-7
2
37
--..31
-.-._
11 6 5 1 ____ 3 2 t
1
I
1
6I0
0
t
It
1
1
____
.....
---.5
. _ _ _
____
....
.....
---.1
_ _ _ _
....
___,
---.
....____
_
____
I
I: _
1____
....
- ----
..--4
. _ _ _
-.._
1
.___
-....-__
---....-.
1--....
SOURCE:-ILS. Deportment of Health. Education and Welfare Olfue of Education, vapi) shed data from the survey of "Fall Enrollment in Higher Education, 1471."
-95'
.* c
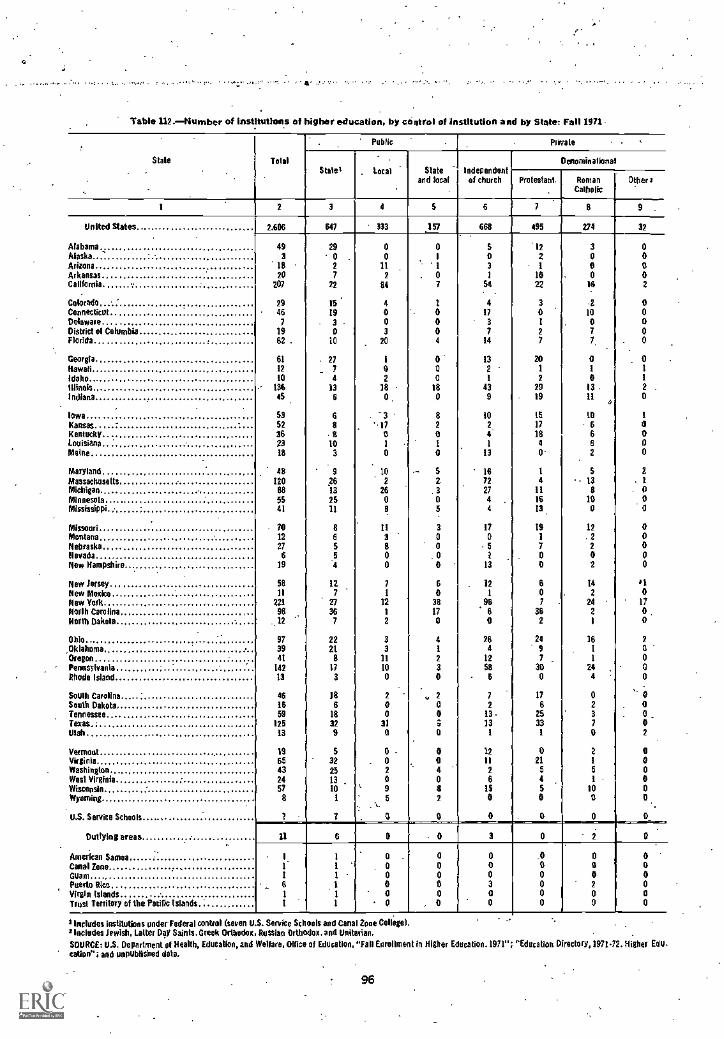
Table 112.Number of Institutions of higher education, by control of institution a ad by State: Fall 1971 -
Stale Told
Public Private ,
Stale% Local Stateand local
Independentof church
Denorninalional
Protestant. RomanCatholic
Other:
1 2 3 4 S 6 7 8 9 .
United States
AlabamaAlaskaArizonaArkansasCalifornia
ColoradoConnecticutDelawareDistrict of ColumbiaFlorida
GeorgiaHawaiiIdahoIllinoisIndiana .
IowaKansasKentuckyLouisianaMaine
MarylandMassachusettsMichiganMinnesotaMississippi
MissouriMontanaNebraskaNevadaNew Hampshire
New Jersey.New MexicoNew YakNorth CarolinaNorth Dakota
OhioOklahomaOregonPennsylvaniaRhode Island
South CarolinaSouth DakotaTennesseeTexas . .blab
VermontVirginiaWashingtonWest VirginiaWisconsinWyoming
US. Service Schools
Outlying areas
American SamoaCausal ZoneGuamPuerto RiosVirgin Islands .
Trust Tenittey of the Puffin Islands
2.606 647 333 157 668 495 274 32
493
1820
207
2946
71962.
6112
10- 136
4S
S3
S2
362318
AB
120085S41
- 7012216
19
5611
222se
. 12
973941
14213
461659
12513
19654324578
7
290 .
2
722
2519
. 3-0
10
. 27_ 7
413
6
686
103
9_26
132S11
e6
s5
'4
227
27367
2221
8173
186
18329
s32251310
1
7
.
.
00
112
84
4003
20
I02
180,
17a1
0
10
2260
B
II3
800
71
121
2
33
It100
2
00
310
o.02
095
0
01
1
. 07
I0a04
000
180
82
01
a
s2305
3
00
. oa
60
38170
41
2
3a
,, 2
0a;0
004082
0
.
s03
1
56
417
3
714
1321
439
to2
4'1
13
167221I4
1705
1
13
121
9660
264
1258s
72
1313
1
22Ii
2
6t50
0
'1222
to22
3
0I27
201
22919
1517
184
o-
I4
111613
IS1
700
601 -
362
2497_
300
176
2533
1
021
5
4sa
0
3000
26
21007
7
a1
013
11
10666
2
s- 13
8100
12.2
2
a2
14
224
2I
16I1
244
023
70
2t5
t10o
0
_
e;
.
.
'-
00002
00000
0t1
2 -
0
I0000
22
00a
00000
a2a
170 ,
0
2
0000
00a02
a00000 ..
0
31 6 0 0 3 0 0
I1.I61
I _
1
1
I2
1
1
o .
00000
00000
. 0
0003a0
_a00000
0002
00
a0a000
'Includes institutions underfederal control (seven U S. Service Schools and Canal Zone College)1 Incledes Jewish, Latter Day Saints. Greek Orthodox, Russian Orthodox. and Unitarian. . .
SOURCE: U.S. Department of Health, Education, and Welfare, Office of Education, "Fall Enrollment in Higher Education. 1911"; "Education Directory, 1972.12. Higher Edu-cation"; and unpublished data.
96
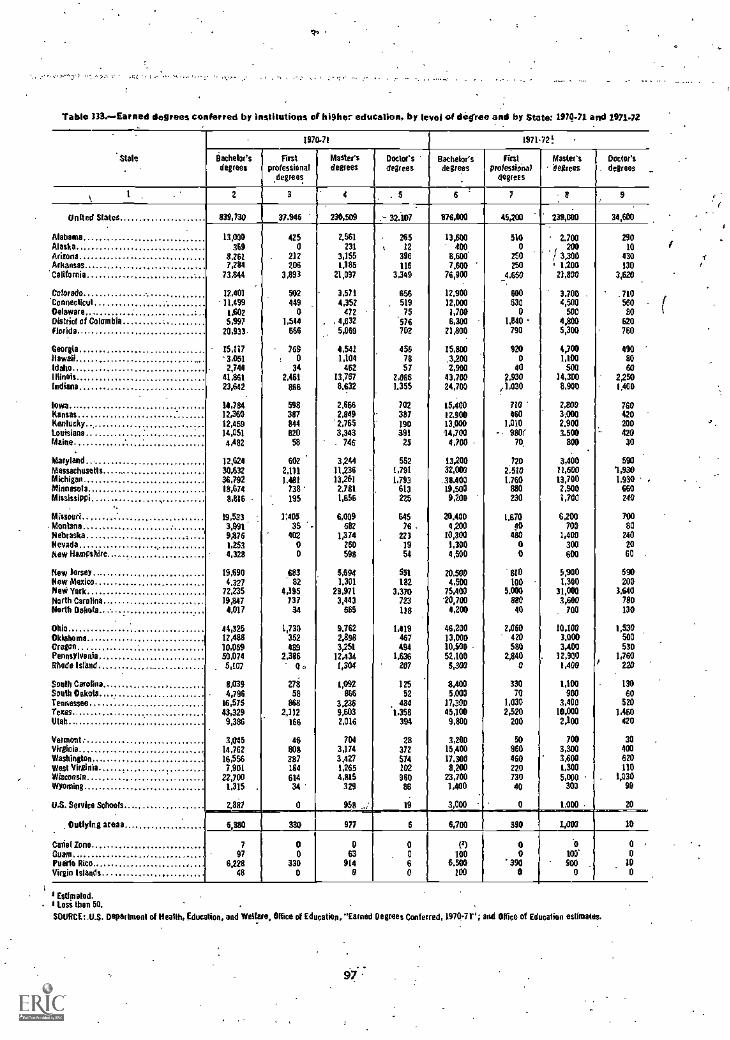
L
1-.
Table 333. --Earned degrees conferred by institutions of higher education, by level of degree and by State: 1970-71 and 1971-72
'State
1970.71 1971-72!
Bachelor'sdegrees
Firstprofessional
degrees.
Master'sdegrees
Decklesdegrees
Bachelor'sdegrees
Firstprofessional
degrees
Mastersdegrees
Doctor's. degrees
11 2 3 4 5 7 9
UnRed States 839,730 37.945 230,509 32..107 176,000 45,200 239,010 30,600
AlabamaAlaska
13,000369
4250
2.561231 %
26512
13,600400
5100
2.700200
29010
Arizona 8.251 . 212 3,155 396 8.600* 250 1 3,300 430Arkansas 7,284 206 1.185 116 7.600 250 ' 1,205 130
*California 73,844 3,893 21,097 3,349 76,900 4.650 21,800 3,683
Colorado 12,401 502 3,571 656 12.900 600 3.700 -710"ConnecticutDelaware
-11,4991,602
4490
4,352472
51975
12,0001,700
5300
4,500500
56080
District of Colombia 5,997 1,540 . 4,632 '576 6,300 1,840 4,800 620Florida 20,933. 666 5,069 702 21,800 790 5,300 760
GeorgiaHawaiiIdaho
15,0173,0512,740
7690
34
1,5421,104462
4557857
15,800,3.2002,900
9200
40
4,7001,100
500
0908060
Illinois 41,861 2,461 13,767 2,085 43,700 2,900 /4,300 2,250Indiana 23,642 886 8.632 1.355 24,700 ,.1,030 8,900 1,460
Iowa 14,784 598 2.666 702 15,400 710 2,800 760Kansas 12,360 387 2,849 387 12.900 060 3,000 420Kentucky 12,459 844 2,765 190 13.000 1.010 2.900 200LouisianaMaisie
14,0514,482
620
583,343. 746
39125
14,7004,700
- 980f70
3.500BOO
42030
Maryland 12,620 602 3,244 552 13,200 720 3,400 590Massachusetts 30,632 2,111 11,236 1,791 32,000 2.,500 11,600 '1,930Michigan - 36,792 1.481 13,261 1,793 .38.000 1.760 13,700 1.930 ,.
Minnesota 18,674 738 2.781 613 19,500 880 2,900 660Mississippi
N 8,816 195 1,656 225 9,200 230 1,700 240
Missouri 19,533 1;405 6,009 645 20.400 1.670 6,200 700Montana 3.991 35 - 682 76 . 4,200 40 709 80NebraskaNevadaNew Hampshire...
9,8761,2534,328
402O
0
1,374260598
2231954
10,3001,3004,500
48000
1,400300600
2402060
New Jersey 19,690 683 5,694 551 20.500 810 5,900 590Now Mexico 4.327 82 1.301 182 4,500 100 1,390 200New 'fork 72235 4,195 29,971 3,370 75,400 5.000 31,000 3.640North Carolina 19,847 737 3,443 723 10,700 880 3,600 700North Dakota. 4,017 34 665 118 0,200 40 700 130
Ohio 44,325 1,730 9,62 1,019 46,200 2,060 10,100 1,530Oklahoma 12,488 352 2,898 467 13,000 420 3.000 500Oregon 10,059 089 3,251 494 10,500 580 3,400 530Pennsylvania 50,074 2,386 12,434 1,636 52,100 2,840 12,900 1,760Rhode Island 5,107 9, 1,304 207 5,300 12 0,400 1 220
South Carolina 8,039 278 1,092 125 8,400 330 1,100 130Smith Dakota 4,796 58 866 52 5,000 70 900 60Tennessee 16.575 868 3236 484 /7,300 1,030 3,400 520Texas 43,329 2,112 9,603 1,358 45,100 2,520 10,000 1,460Utah 9,386 166 2,016 394 9,800 200 2,100 420
Vermont 3,045 46 704 28 3,200 50 700 39Virginia 14,762 808 3,174 372 15,400 960 3,300 400Washington 16,556 387 3,427 574 17.300 460 3,600 620West Virginia 7,901 184 1,265 202 8,200 220 1,300 110WisconsinWyoming
22,7001,315
61434
4,815329
96088
23,7001,400
73040
5,000300
1,03090
U.S. Service Schools 2.887 0 958 .....4. 19 3,000 0 1,000 20
. Outlying areas 6,380 977 6 6,700 390 1,000 10
Canal ZoneGuam
797
o0
o63
00
(1)100
0O 100'
00
Puerto RicoVirgin Islands
6,22848
330o
914a
60
6.910200 0
9000
100
1 Waisted.1 Less than 50.
SOURCE:.U.S. Department of Health, Education, end Welfare. Office of Education. "Earned Degrees Conferred, 1970-71"; and Office of Education estimates,
..
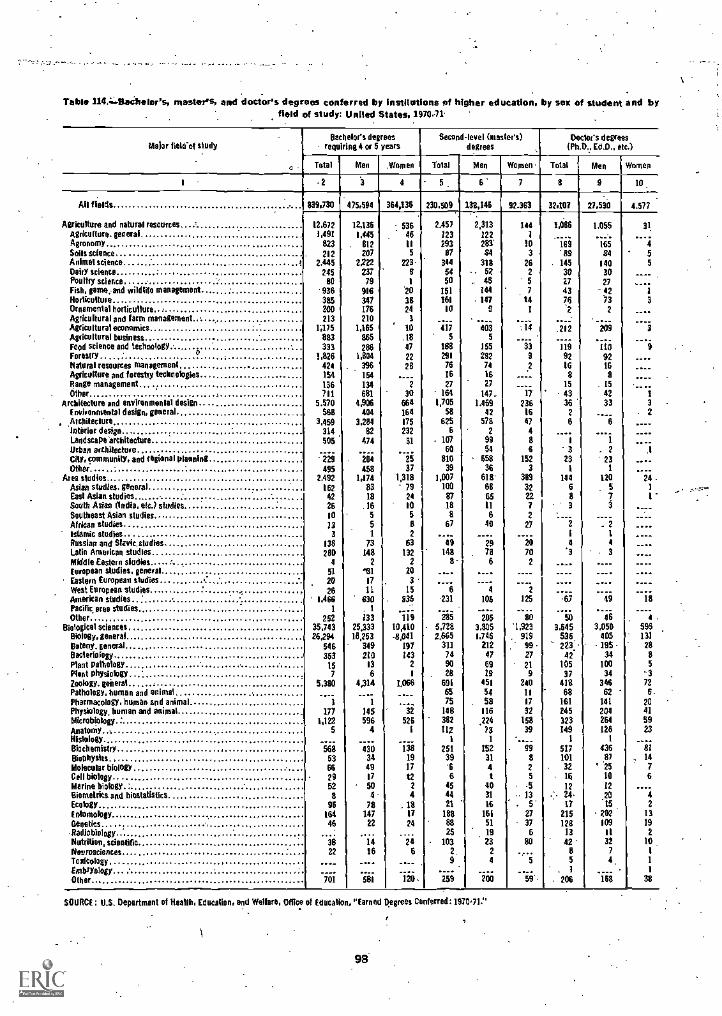
Table 11944aChelor's, master's, and doctor's degrees conferred by institutions of higher education, by sex of student and byfield of study: United States, 197041
Major fieleol study
4 -
Bachelors degreesrequiring 4 or 5 years
Second-level (masters)degrees
Doc lors degrees(Ph.D., Ed.O., Mt)
rTotal Men Women Total Men Women. Total Men Women
1 -2 3 4 - 6' 7 8 9 10
All fields
Agriculture and natural resources *
Agriculture, general.
Soils scienceAldine' science.Dairy science .
Poulhy science .
Fish, game.-and wildlife managementNorlicultureOrnamental horticultureAgricultural and farm managementAgricultural economicsAviculture! businessFood science and technology.forestry o -
Natural resources managementAviculture and forestry technologiesRange managementOther .
Architecture and environmental designEnvironmental design, general
,ArchiteclureInterior designLandscape erchlteclureureari architectureCity, community, and regional pieeeingOther
Area studiesAsian studies. generalEast Asian studiesSouth Asian (India, etc.) studiesSoutheast Asian studiesAkita,' studiesIslamic studiesRussian and SlavicstediesLatin American studiesMiddle Eastern studiesEuropean studies, generalEastern European studies 'West European studiesAmerican studiesPacific. erea studies,Other
Biological sciences54:44ey. generalDateny, generalBacteriologyPlant pathologyPlot physiologyZoology, gelletalPathology, human and animalPharmacology, human and animalPhysblogy.lauman and animaMicrobiologyAnatomy..,HistologyBiochemistryBiotohysiesMolecular biologyCell biologyMarine biologyBilMelfkit and biestatisticsEcologyEntomologyGenetics
RadiobielogyNutrition, scientificbiourosciencesToxicology
.EmbryologyOther
.
'
,
.
839,730.
475,594 384,136 230,509 136,145 92.363 32,107 27,530.
4.577
12.6721,491
823212
2.445245
80*936385200213
1;175883333
1.826421154136711
5.57056B
3,459314595
229495
2,492
16242261013
3
136
2894
51
2026
1,4461
25235.74326.294
546353
157
5,330
1
1771,122
5
5685366
. 2952g
9616446
3822
701
12,1361,445
. 812207
2,22223779
916341176210
1,165865
2861,804
- 396154134681
4,906404
3,28482
474
- 204458
1,1748318
.16551
73148
2.81
1711
630
133
25.33318,253
349210
13
64,314
1
145596
4
430344917
504
78147
22
1416
581
5364611
5
223-81
'20
38243
10.1847
22
28.___
2
30664164
175232
31
25.
371,318
7921105B
263
1322
15838
11910,410-8,041
197143
21
1,066
. --._
92526i--
13819
1712
24
.1317
24
246
120-
2.45712329387
3445450
151161
10...417
5188291161627
1641,705
58625
6. 107
60810
391,007
100
87188
67
09148
8-
6-231
2855,7282.665
3117490
- 24691a75
148382112
1
25139'66
4544
211888825
10329
.....259
2,313122283'84
318- 52. 45
144147
9. .....
4035
155282
711627
147.1.469
42578
29954
65836
618'686511
619
29786
4105
265
3,8051,746
212476919
451
5458
116
224
73
1523141
4031
1616151
1923
24-.
200
114
103
2625
714I
....:14
---33339
2___----
17
2361647
86
152
3389322272
27
..Z070
125
80'1,923. 919
9927219
210
11
1732
15839
- ii825
-513
. 5'2737
680
9
....59*-
1,186
-16989
. 145302743762
....
.212
11992168
154336
2
6
i3
231
144683
1
4
'67..
-.503,645
535223* ,42
10537
41868
161245323149
151710132le12
-'. 2417
215128
1342 '85
. 206
1,055
Agronomy. 165
8414030274273
.....209
1W9216
- 154233
i. 2
231
120- 5
7
----
49.---
463,056
405195-34
10034
34662
141204264
1261
43687
° 25101220t5
202109
1132
7
4,
59
31
455
____....
1
3
. ..3
-- -9
....
........
13
- 2
-"...1
...-._
24 .
1
1
--
18---.
4 .
595131
2885
-3726.
20415923
/ii., 14
76.42
13192
19 .1
1
1
38
SOURCE: Department of Health, Education, and Welfare, Office of Education, "Earned Degrees Conferred: 1970.71."
98
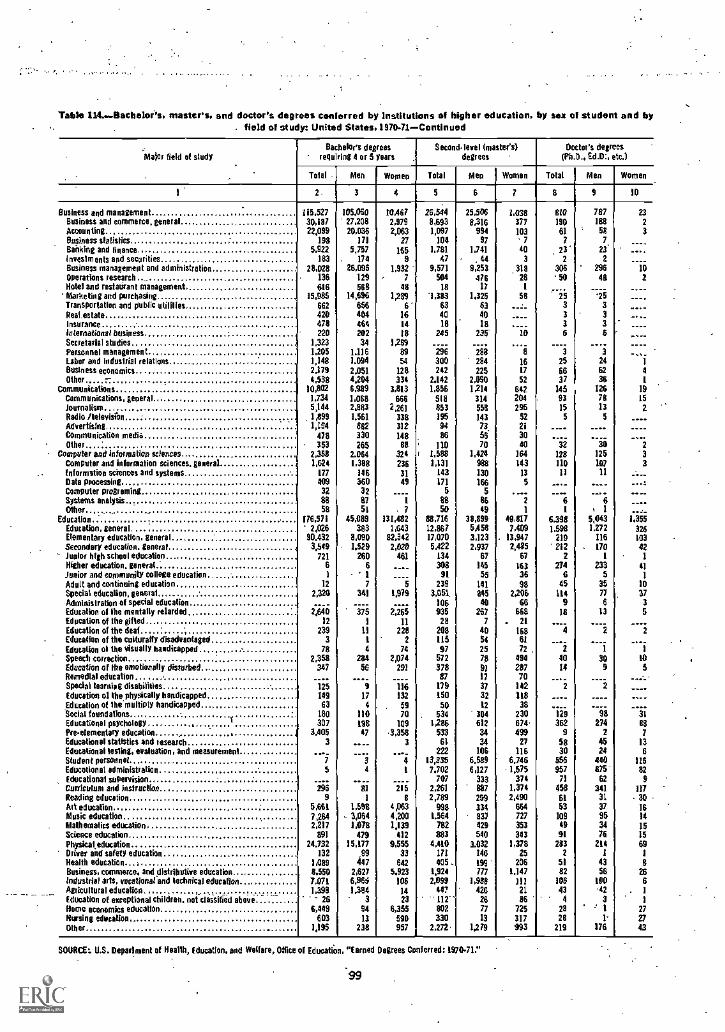
Table 114..-Bachelor.'s, master's, and doctor's degrees conferred by Institutions of higher education, by sex of student and by. field of study: United States, 1870-71-Continued
Major field ol studyBachelors degrees
requ ring 4 or 5 yearsSecondlevel (master's)
degrees .
Doctor's degrees(Ph.D., Ed.D:, etc,)
Total - Men Women Total Men Women Total Men Women
1 2" 3 4 5 6 7 8 9 10
Business and management 115,527 105,060 10,467 26,544 25,506 2,038 BM 787 23Business and commerce, general 30,187 27,208 2,979 8,693 8,316 377 190 188 2
Accounting 22,099 20,036 2,063 1,097 994 103 61 ' 58 3Business statisticsBanking and finance
1985,922
171
5,75727
165
1041,781
97
1.741
7
407
23'
7
23'_.. ..
investments and securities 183 . 174 9 47 , 44 3 2 2Business management and administration 28,028 26,096 1,932 9,571 9,253 318 306 296 10Operations research 136 129 7 504 476 28 51) 40 2Hotel and restaurant Management 616 566 48 18 17 1 _--- ...__Marketing and purchasing 15,985 14,6% 1,289 '1,383 1,325 58 *2; '25 ___.Transportation and public utallies 662 656 6' 63 63 ... 3Restestate 420 404 16 40 40 .... 3
Insurance 478 464 14 18 18 .-10
3 3 ____International business 220 202 18 245 235' 6Secretarial studies 1.323 34 1,289Personnel management..,, 1,205 1.116 89 296 288 8 3 3
Labor and industrial relations 1,148 1.094 54 300 284 16 25 24 1
Business economics 2,279 2.051 128 242 225 17 66 62 4Other - 4,538 4,204 334 2,142 2,090 52 37 36 1
Communications 10,342 6,989 3.813 1,856 1,214 642 145 126 19
Communications, general 1,734 1,068 666 518 314 204 93 78 15Journalism 5,144 2,883 2 261 853 558 296 15 13 2Radio /television 1,899 1.561 338 195 143 52 5
Advertising 1,194 862 312 94 73Communication media 478 330 148 86 56Other 353 265 88 110 70 40 32 30 2
Computer and information sciences 2,388 2.064 324 r 1,588 1,424 164 128 125 3
Computer and information sciences. general 1,624 1,388 236 1,131 988 143 110 107 3Information sciences and systems 177 146 31 143 130 13 11 11 ....Data processing 409 360 49 171 166Computer programing 32 32 ____ 5 5 .... .... .... --Systems analysis 88 87 1 28 86 2 6 6 .....Other . 58 51 7 50 49 1 1 1 ..,_
Education .. 176,571 45,089 131,482 88,716 38,899 49,817 6.398 5,043 1,355Education, general 2,026 383 1,643 12,867 5.458 7,409 1.598 1,272 326Elementary education, general 90.432 8,090 82,142 17,070 3,123 . 13,947 219 116 103Secondary educafion. general 3,549 1,529 2.820 5,422 2,937 2,435 212 . 170 42Junior high school education 721 260 461 134 67 67 2 1 1
Higher education. general 6 308 145 163 274 233 41
Junior and community college education 91 55 36 6 s 1
Adult and continuing education 12 7 i 239 141 98 45 35 10
Special education, general . 2,320 341 1,979 3.051. 845 2,2% 114 77 37Administration of special education
-iii.... 106 40 66 9 6 3
Education of the mentally relarded 2,640 2,265 935 267 668 18 13 5Education of the gifted 12 1 11 28 7 . 21 .... .... ....Education of the deaf ", 239 11 228 208 40 168 4 2 2
Education of the culturally disadvantaged 3 1 2 115 54 61 .... .... _...Education 01 the visually handicapped . 78 4 74 97 25 72 2 1 1
Speech correction 2.358 234 2,074 572 78 494 40 30 10Education of the emotionally disturbed 347 56 291 378 91 287 14 9 5Remedial education . 87 17 70 ..... ____ ..,....Special learning disabilities 125 9 116 179 37 142 2 2 ___.Education ol limphysically handicapped 149 17 132 150 32Education ol the multiply handicapped 63 4 59 50 12
"Social foundations 180 110 70 534 304 230 129 98 31Educational psychology I 307 198 109 1,286 612 674 362 274 88Preelementary education , 3.405 47 3,358 533 34 499 9 2 7Educational statistics and research 3 ..__ 3 61 34 27 58 45 13Educational Waling, evaluation, and measurement 222 106 116 30 24 6Student personnel 7 3 4 13,335 6.589 6.746 556 440 116
Educational administration s 4 1 7,702 6,127 1.575 957 875' 82Educational supervision .... 707 333 374 71 62 9Curriculum and induration 296 81 215 2,261 887 1,374 458 341 117Reading education 9 1 8 2,789 299 2,490 61 31 30Art education 5,661 1,598 4,063 998 334 664 53 37 16Music education 7,264 - 3,064 4,200 1.564 837 727 109 9S 14Mathematics education 2,217 1,078 1,139 762 429 353 49 34 15Science education 891 479 412 883 540 343 91 76 15Physical 24.732 15,177 9,555 4,410 3.032 1,378 283 214 69Driver and solely education 132 ,99 33 171 146 25 2 1 1
Health education - 1.089 447 642 405. 199 206 51 43 sBusiness, commerce, and distributive education 8,550 2,627 5,923 1,924 777 1.147 82 56 26industrial arts, Mcationalind technical education 7,071 6,965 106 2.099 1,925 111 106 100 6Agricultural education 1,398 1,384 14 447 426 21 43 42 . 1
Education 01 exceptional childreo, not classified above 26 3 23 112" 26 86 4 3 1
Home economics education 6,449 94 6,355 802 77 725 28 ' 1 27Hissing education.. 603 13 590 330 13 317 28 1- 27Other 1,195 238 957 L 2,272 1,279 993 219 176 43
SOURCE: U.S. Department of Health, Education, and Welfare, Orme ol Education, "Earned Degrees Conferred: 1970.71."
'99

Table 1141.13achelor's, master's, and doctor's degrees conferred by Institut ons of higher education, by sex of student and byfield of study: United-States, 1970-71-Continued
Maior held of studyBachelor's deg ees
regal ing 4 or 5 years.secondlevel (master's)
degreesDoctor's degrees
(P11.0., Ed.D., Mc.)
I-Total Men Women Total Men Women Total Men Women
1 2 3 4 5 -6 7 a 9' 10
EngineeringEngineering, generalAerospace, aeronautical, astronautical engineeringAgricultural engineeringArchitectural engineeringBioengineering and biomedical engineeringChemical engineeringPetroleum engineeringCivil, construction, and transportation engineering..,Eiectricat, electronics, communications engineeringMechanical engineeringGeological engineering'Geophysical engineeringIndustrial and management engineeringMetallurgical engineeringMateriats engineeringCeramic engineeringTextile engineeringMining and mineral engineeringEngineering physicsNuclear engineeringEngineering mechanicsEnvironmental and sanitary engineering
_
Naval architecture and marine engineeringOcean engineeringEngineering technologiesOther
Fine and applied artsFine arts, generalArtArt history and appreciationMusic (rrerlorriling, composition, theory)Music (liberal arts program)Music history and appreciationDramatic artsDanceApplied designCinematographyPhotographyOther
Foreign languagesForeign languages, generalFrenchGermanItalianSpanishRussianChineseJapaneseLatinGreek, classicalHebrewArabicIndian (Asiatic)Scandinavian languagesSlavic languages (other than Russian)African languages (nonSemitic)Other
Health professionsHealth professions, generalHospital and health care administrationNursingDental specialtiesMedical specialtiesoccupational therapyOptometryPharmacyPhysical therapyDental hygienePublic healthmedical record Rtizarlanship'Podiatry or podiatric medicineBiomedical communicationVeterinary medicine specialtiesSpeech pathology and audiologyChiropracticClinical social workMedical laboratory lechnologiesDenial technologiesRadiologic technologiesOther
.
i
50,0462.864
. 2,44350427268
3.579292
6.52612.198
8,858123
263,171
62376
11821215837325026054
41664
5,1481,310
30.3943,595
10,6881 709,
3,318,2,648
' 963,675
2972,0411
70477
1,11319,945
6077,3062,60I
2017,068
71589
77
463104203
151
62
110
2
32125,226
23060
.12,1995
11663351
4,5491,252
531127148
21,427
2
363,097
6248
426
49,6462.8292,426
50326867
3.516291
6,47412,122
8,81712226
3,15261773
17421115736824625852
41564
'5,1061,292
12,2561,2723,920
3331.5591,124
431,661
2391658
401
9465,075
2191,140
96255
1,8072774326
16665
1294
. 1655
....Int
5,78814056
2535
11
26339
3,636257
2
917
2116
24386
6229
284
4003517
1
41
631
527641
1
__._1963
41
1
54
22
t____
4218
18,1382.3236,7681,3761,7591,524
532,014
2741,132
12
76821
14,870388
6,1661,639
1465,261
4384651
297. 39
74II
4655
2
211
19,438904
11,946____
- _
iii
1291399552936
141
.
1,251
12
2,711____
19142
16.443813717135
31
731,100
1002,4254,282,2,237
397
1,921273124
39326665
32926423871
52
134
8766.675
5561,690
2631,713
62399
1,03978
1202657
4114,755
4441,437
690':87
1,4561102219
13221196
26083
192
5,74946
4961,530
450129
51
121947324
1,244___
6
5
89823
-jai
45
....32
1%
16,258804711
134
2972
3,07499
2,3974,2522,232
7
1,89827211839316663
327262224
71
52134851
3,510-26896092
87835247
54910822450
1981,642
111
331286
2852951103
491017
537
2
- 892.567
26436
31428106
6III
15419
52____
83152
iii13
__._23
131
185- 9
6
1
' 2
1
; 261
2830
5
----23
1
6...._
1
2
22
14
____
-...__ _
253.165
288730171
83527152
490. 68
38
' 2133,113
2731.106
39459
9275912
168311
2
1651
1
1033,182
2060
1,499222345
2
40
24472
____
6
. 671
128
32.____
965
3,63821921155 .
3
29406
17
446879438
9
1
1391481825
1
4326
1201484913I1
127
621
286
46200
8640
1221
2
90
781
122
192144
10168
14
a. 1
5
18443
1
321
sa
46612
147
IA43
-i
94
ii
.___
4670
14
.___10
58
3,615-216
: 214. 55
40417.
443876438
136147
17.25
4325
120147
13
- 1
125483
21-324
1647336
I00.___
1
61
48467
,103955
9814
...i
II
3
24__
43389
11
14
1
14
_
2
93
ii
____
4548
53
-...'1048
233
3____
2
33
___
3j1
__ ._
1
---i
___ _
---2
13813
2236
.134
221
1
29
297558949s -
70.__-
1
..._.7
I
81
3171I
6
ii....___,
1
ii
_ -.-
1
22
21
.---_-10
SOURCE: U.S. Department of Health, Education, and Welfare, Office of Education "Earned Degrees Conferred: 1970-71."
100
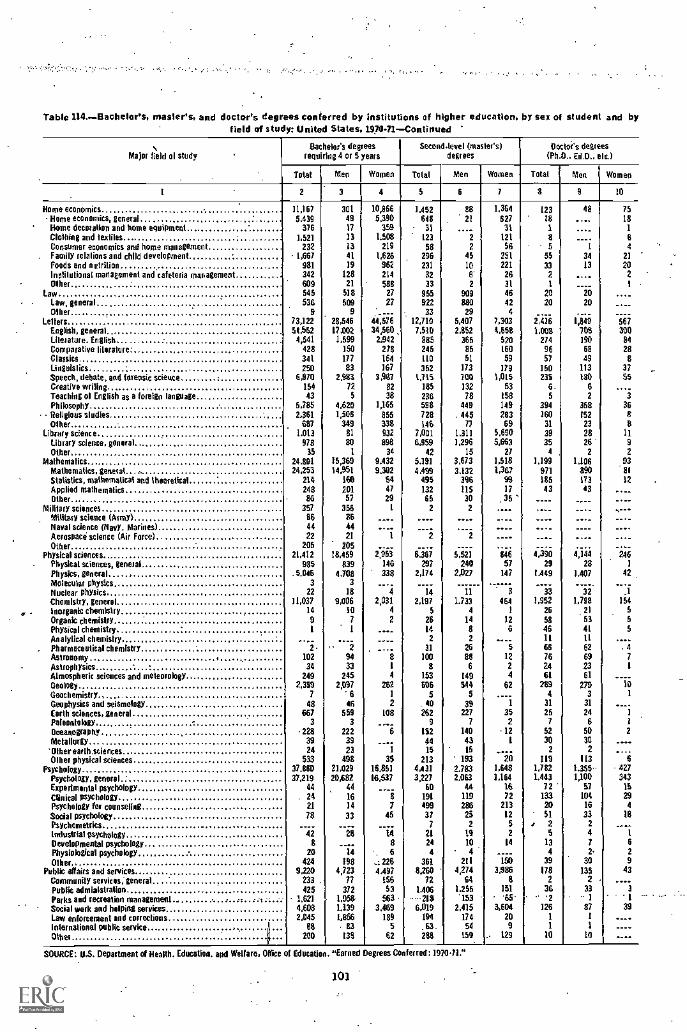
-
Table 114.«-Bachelor's, master's, and doctor's degrees conferred by institutions of higher education, by sex of student and byHeld of study: United States, 197041-Continued
Major field of studyOa helos's degrees
mooring 4 or 5 yearsSecond-level (master's)
degreesOoctot's degrees
(PILO.. Ed.0.. Mc.)
Total Men Women Total Men Women Total Men Women
I 2 3 4 5 6 7 8 9 10
Nome economics .
Nome economics, generalHome decothlion and home egnipmentClothing and lexlilesConsumer economics and home managementFamily mialions and child development ,
Foods and nutritioninstilutional management and 'cafeteria managementOther
LawLaw, generalOther.
LeitersEnglish, generalLiterature. EnglishComparative literslureClassicsLingoislicsSpeech, debate, and foressic scienceCreative writingTeaching of English as a foreign languagePhilosophyReligious sludiesOther
Library scienceLibrary science, generalOther
MathematicsMathematics, general ..
Statistics, mathematical and theoreticalApplied mathematicsOther
Mailer>, sciencesMinim science (Army)Naval science (Navy. Marines)Aerospace science (Air Force)Other
Physical sciencesPhysical sciences, generalPhysics, generalMolecule( physicsNuclear physicsChemistry, generalInorganic chemistry
Organic chemistryPhysical chemistryAnalytical chemistryPharmaceutical chemistryAstronomy ,AstrophysicsAtmospheric sciences and meteorologyGeologyGeochemistryGeophysics and seismologyEarth sciences, generalPaleontology .OceanographyMetallurgyOtherearth.sciencesOlher physical sciences
PsychologyPsychology, generalExperimental psychologyMica' psychologyPsychology for counselingSocial psychologyPsychometricsIndustrial psychologyDevelopmental psychology,,.Physiological psychology .
OlherPublic affairs and services
Community services:general .
Public admialstrationParks and recreation management.Social work and helping servicesLaw enforcement and correctionsInternational public serviceOther
,.... .....
--
i
11,1675,439
3761,521
232, 1,667
981342609545536
973,12251,552
4,541428341250
6,97015443
5,7852,361
6871.013
97835
24,80124,253
214248
. 86357864422
20521,412
985.5,046
322
11,037
149
2
10234
2492,359
7
48667
3228
3924
53337.1180
37,219442421
78
428
20424
9,220233 .425
1,621
4,6082,045
88200
3014917
13134119
12821
518509
928,54617,002
1,59915017783
2,981725
4,6201,506
34981
801
15,36914,951
160201
5735686
21205
18,459839
4.7083
189,006
107
9433
2452,097
646
5593
2223923
49221,02920,622
44161433
28
1984,723
77312
1,0581,1391,856
83138
10,8665,390
3591,508
2191,628
962214586
27
27...
44,57634,560
2,942278164167
3 9878238
1,165855338932
89834
9,4329.302
544729
1
_-.-
1
2:66i146338
42,031
4
2
____
81
4
2621
2108
-
6....
1
3516.85116,537
___8
r45
....14
8.. 6_:2264,497
15653
5633,469
1895
62
1.452648
31
123
58296231
3233
95592233
12,7107,510
985245110
3521,715
185236598728146
7,0016,959
425.1914,499
49513265
2
....
6,36i297
2,174
ii2,197
5
2614
2
31
1008
153506
5. 40262
9
1524415
2134,4313,227
60191
49937
721244
3618,260
721.406
-2186,019
194.63.288
8821
__.-2
245106'2
90988029
5,4072,852
3658551
17310013278
449. 445
77
1,3111,296
153.6733,132
39611530
...._
5,521240
2,027
11
1.7334
14
8
2688
6
149344
539
2277
1404315
1932.7832,063
4411928625
219104
2114,274
641.255'153
2,415174
54159
1.36462731
12156
251221263146424
7,3034,655
52016059
1791,015
5315814928369
5.6905,663
271,5181,367
9917
35
...-.._____
84657
147
3
4641
126
i12
2
462
..-:1
352
121
...ZO
1,6481,164
1672
2131252
14
_
1503,986
8151
5-3,604
209
. 129
12318
55533
1
2020
2,4161.058
2749657
150235
6.5
394160
31
3935
4
1,19997118543
....---.-___
____4,390
291.449.._33
1,95226584611
66762461
2894
3125
7
5230
2
1191,7821.443
72133205125
134
39178
2
362
1261
1
10
48....
I3413
__
2020
....1,849
7081906849
113
UM62
358152
232826
2
1,106890173
43.......-___
.___4,144
281.407.....
321,798
21
5341
11
62692361
2793
31246
50
2113
1.355-1,100
571041633
2
472
30135
331
871
1
10
7518
1
84
21
202
I--. -________567300
84288
3755
...73
3688
11
9
2
9381
12
--------_-__-246
1
42....
_1
1545
5
5_. .:4
71
--16
1
.--.1
1
2
...6
427343
1529
4
18-1
6
2
943
31
39....--....
SOURCE: U.S. Department of Health. Education, and Welfare, Office of Education. "Earned Degrees Conferred: 197041"
101

Table Wt.-Bachelor's, master's, and doctor's degrees conferred by institutions of higher education, by sex of student and byfield of study: United States, MOM-Continued
'Major field of studyBachelor's degrees
requiring 4 or 5 yearsSecondlevel (ma lees)
degrees -
Co lor's degreeseh D., 60.0., etc.)
Total Men Women Total Men Women Total Men Women -
A
2 3 4 5 6 7 8 9 10
Social sciences. 155,326 '98,145 57,181 16.501 31,738 4,703 3,659 3,152 507
Social sciences, general 21,543 11.753 9,790 2,330 1.522 808 50 38 /2Anthropology 4,384 1,952 2,432 766 429 '337 241 178 63Archaeology 72 34 38 29 11 18 8 4 4Economics 15,758 13,890 1.868 1,995 1.733 262 721 668 53History 44.663 29.055 15.608 5,157 3.470 1.687 991 871 120
Geography 4.155 - 3,291 864 . 649 528 121 164 147 17
Political science and government 27.482 21.966 5,516 2,318 1,839 '479 700 615 85Sociology 33263 13,610 19.653 1,808 1,131 677 574 455 119
Criminology . 659 508 151 .136 116 20 15 12 3International relations 1,212 850 362 783 660 123 66 58 8Afro-American (Black culture) studies 80 47 33 17 13
American lndien cultural studies . 2 I 1 1 ___ _
&lexiconAmericen cultural studies 8 7 i 7 i 1 ..... .... ___.Urban studies 371 207 164 . 236 161 _ --Demography s 5 3 2 a 4 2 8 5 3
Other 0 1,669 971 698 263 175 88 121 . 101 20Theology 3,744 2,727 1,417 2,710 2.049 661 312 306 6
Theological professions. general 1,891 1,644 247 1,342 1,204 138 249 246 3
Religious music 116 64 52 106 76 30Biblical languages 24 23 1 18 14Religious education 1,365 722 643 937 551 . 386 - 34 31 . 3Other 348 274 74 307 208 99 23 23
Interdisciplinary studiosli 13.767 9,824 3.943 1,706 1 106 600 ; 91 77 iiGeneral liberal arts and sciences 6.461 3,880 1,531 549 30e 243 i 11 8 3Biological and physical sciences 3,897 3,193 704 524 407 117 ' 15 14 IHumanities and social sciences 2,020 1,091 - 929 336 184 152 21 14 7
Engineering and ether disciplines 178 174 4 24 22 2 17 17 ....Other 2.211 1,486 725 273 187 . 86 27 24 3
SOURCE: U.S. Department of Health. Education, and Welfare, °Rice of Education. "Earned Degrees Conferred: 1970-71."
r.
102
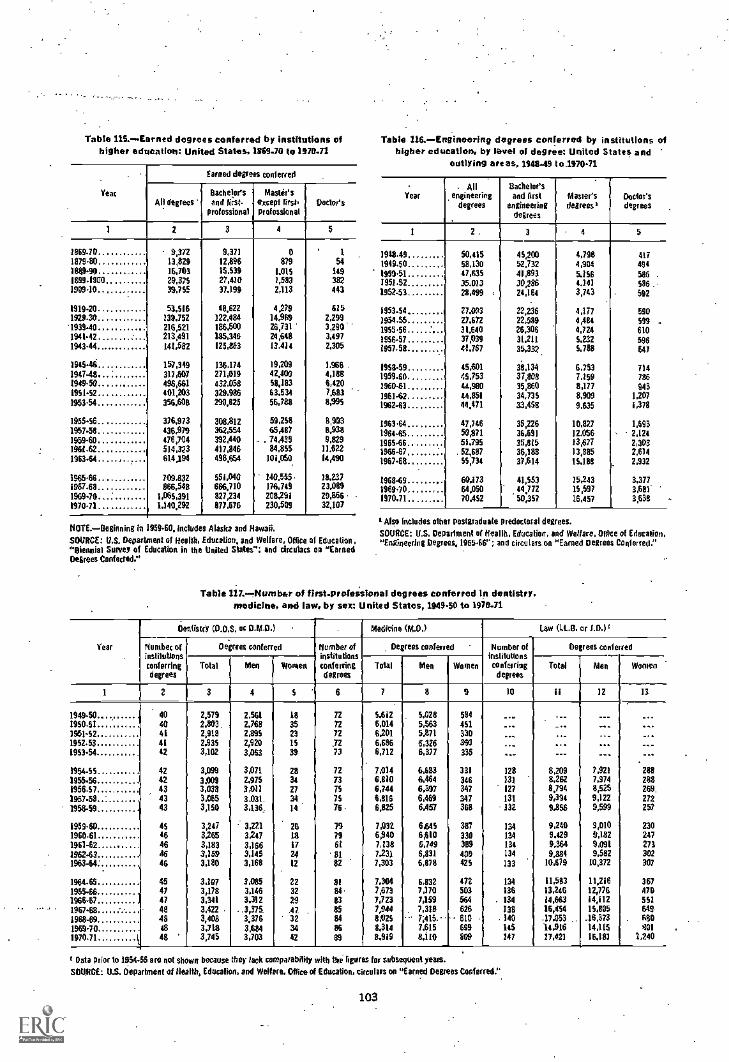
Table 115.-Aarned degrees conferred by institutions ofhigher education: United States, 1869-70 to 1970-72
Year
Earned degrees conferred
All degrees'Bachelor'send !hit-
professional
Meleesexcept first.professional
Doctor's
1 2 3 4 5
1869-701879401849-901894-19001909-10
1919-201929-301939401941.42.1943-44
1945461947481949-501951-52..1953-54
1955.561957481959-601961.62196344
1965-661967431969.701970-71
9,37213,82916,70329,37539,755
53,516139,752216,521213,491141,582
157,349317,607496,661401,203356,604
376,973436,979476,704514,323614,194
709.832866,548
3,065,3911,140,292
9,37112,89615,53927,41037.199
48,622122,484186,500135,346125.863
136.174271,019432,058329,986290,825
308,812362,554392,440417,846498,654
551,040666,710827,234877,876
0879
1.0151,5832,113
4,27414 ,96926,73124,64813.414
19.20942,40058,18363,53456,788
59,25866,48774,43584,855
101,050.
140,555176,749208,291230,509
154
149382443
6152,2993,2993,4972,305
1.966 -4,1866,4207,6838,995
8,9038,9384,829
11,62214,490
18,23723,08929,86632,107
NOTE.-Beginning hi 1959-60, includes Alaska and Hawaii,
SOURCE: U.S. Department of Health, Education, and Welfere, Office of Education ,"Biennial Survey of Education in the United Slates"; and circulars on "EarnedDegrees Conferred."
Table 116.-Engineoring degrees conferred by institutions ofhigher education, by level of degree: United States and
outlying areas, 1948-49 to- 1970-71
Year. All
engineeringdegrees
Bachelor'sand first
engineeringdegrees
Master'sdegree,
Doctor'sdegrees
I 2. 3 4 5
1948-49 50,415 45,200 4,798 4171949-50 58,130 52.732 4.904 494195941 47,635 41.893 5.156 586 -
1951.52 35.013 30,286 4,141 586 ..3952-53 28,499 , 24,164 3,743 $92
1953.54. 27.003 22,236 4,177 5903954-55_ 27,672 22,589 4,484 599 -1955.56 311640 26,306 4,724 6101956-57 37,039 31.211 5,232 5961957-58 41,767 35,332 5,788 647
1958-59 45,601 38,134 6.753 714195940 45,753 37,808 7.159 7861960-61 44,980 35,860 8,177 943196142 44,851 34,735 8,909 1,207196243 44,471 33,458 9.635 1,378
1963-64 47,746 35,226 10,827 1,693196445 50,871 36,691 12.056 2.124196546 51,795 35,815 13,677 2,303196647 . 52,687 36,188 13,885 2,6141967.68 55,734 37,614 15,188 2,932
196849 60,173 41,553 15,243 3.377.1964-70 64,050 44,772 15,597 3,6811970-71 70,452 50,357 16,457 3,638
Also includes other postgraduate predate/al deg ees.
SOURCE: U.S. Department of Hearn', Education, and Welfare, Office of Education."Engineering Degrees. 196546"; and circulars on 'Earned Omen Conferred."
Table 117.---Number of first-profeisional degrees conferred ln dentistry,medicine, and law, by sex: United States, 1949-50 to 1970-71
Year
Dentistry 09.06. or C.W.O.) Medicine (Mb.) Law 0.1.0. or Llio.i'-,,
Number ofinstitutionsconferringdegrees
Degree conferred Number of Degree conferred Number ofinstitutionsconferringdegrees
Degrees conte ed
Total Men Womeninstitutionsconferringdegree
Total Men Women Total Men Wooten
1 2 3 4 5 6 7 8 9 10 [1 12 13
1949.50 40 2,579 2.561 18 72 5,612 5,028 584 ___ ___
1950.51 40 2,803, 2.768 35 72 6,014 5,563 451 __. _...1951-52 ....... .... 41 2,918 2,895 23 72 6,201 5,871 330 .... ___ ___ ...1952-53 41 2,935 2,920 15 72 6,686 6,326 360 ___ ... ... _-195344 42 3,102 3.063 39 73 6.712 6,377 335 .._ ___ --. ...
1954-55 42 3,099 3,071 28 72 7,014 6,683 331 128 8209 7,921 2881955.56 42 3.009 2,975 34 73 6,810 6,444 346 131 8.262 7,974 2881956-57 43 3,038 3.011 27 75 6,744 6,397 347 127 8,794 8,525 269,1957-58. . : ... , 43 3,065 3.031. 34 75 8,816 6,469 347 131 9,394 9.122 272
1958-59 43 3,150 3336, 14 75 - 6,825 6,457 368 332 9.856 9,599 257
. ,
1959-60 45 3,247 3,221 26 79 7.032 6,645 387 134 9.240 9,010 230
1960-61 46 3,266 3,247 18 79 6,940 6,610 330 134 9,429 9,182 247
1961-62 46 3,183 3.166 17 61 7,138 6,749 349 134 9.364 9,091 273196243 46 3.159 3,145 24 81 7,231 6,831 400 134 9.884 9,532 302196344' 46 3,180 3,168 12 82 7,303 6,878 425 133 10,479 10,372 307
1964-65 45 3,107 3,085 22 81 7,304 6,832 472 134 11683 11,216 367196446 47 3,178 3,146 32 84 7,673 7,170 503 136 13,246 12,776 4701966-67 47 3.341 3,312 29 83 7,723 7,159 564 . 134 14,663 14,112 5511967.68 48 3.422 . ..3,175. 47 85 1,944 . 7,318 626 138 16,454 15,805 6491968-69 48 3,408 3,376 32 84 8925 7;416... 610 140 .17.053 . -16673 . 6801969-70 48 3,718 3.684 34 86 8,314 7,615 699 145 14,916 14,115 801
1970-71.... 48 3,745 3,703 42 89 8,9[9 8,110 809 247 17,421 16,181 1,240
Oata prior to 1954.55 are not shown because they lack comparability with lire figures for subsequent years.
SOURCE: US. Department of Health, Educalion, and Welfare, alined Education, circulars on "Earned Degrees Conferred."
103
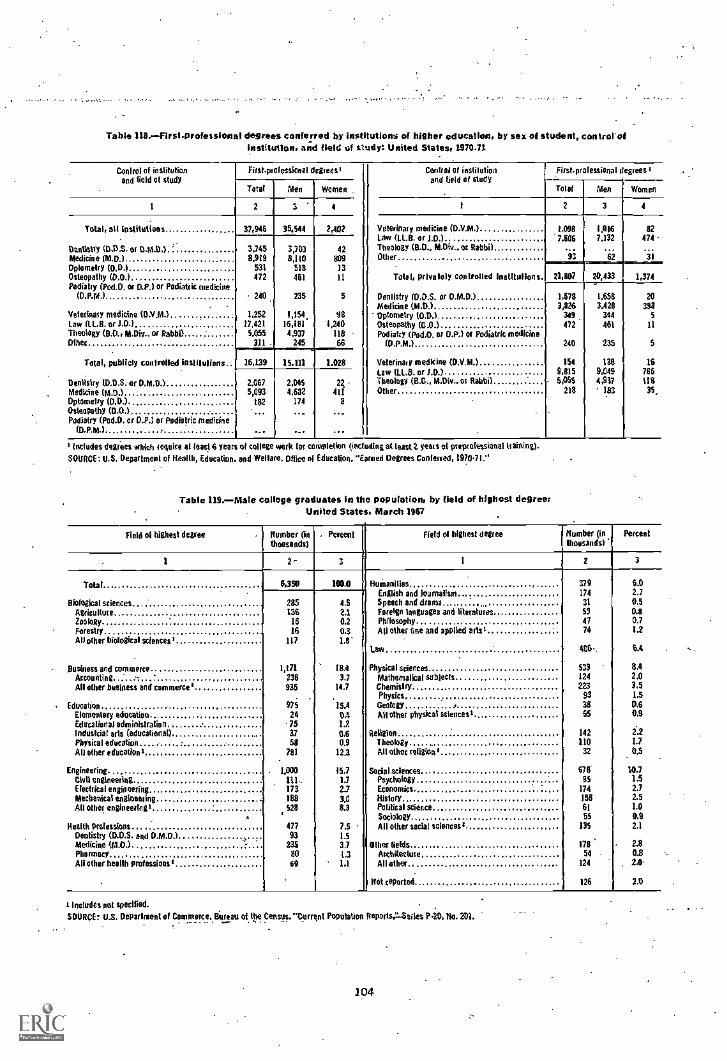
Table MS.-First professional degrees conferred by institutions of higher education, by sex of student, control ofinstitution, and field st study: United States, 1970-71
Conlrol 01 institutionand field of study
FintpreeSSiOnal degrees' Control of institutionand field of study
First- professional degrees I
Total Men Women . Told Men Women
1 2 3 4 2 3 4
Total, all Institutions 37,946 35.544 2,402 Veterinary medicine (D.V.A1,) 1098 1,016 82Law (LLB, or 1,13.) 7,606 7,132 474
Dentistry (D.D.S. or 0.141.0.) 3,745 3,703 42 Theology (B.O., M.Div_. or Rabbi)-62Medicine (M.D 8,919 8,110 809 Other 93 31
Oplemelry (04.1 531 518 13Osteopathy (D.0,) 472 461 11 Total, privately controlled institutions. 21,807 20,433 1,374Podiatry (Pod.O. or D.P.) or Pediatric medicine
(0.P.M.).. 240 235 5 Denlistry (D.D.S. or O.M D ) 1,678 1,658 20Medicine (M.D.) 3,826 3.428 398
Veterinary medicine (11.V.M.) 1,252 1,154, 18 Optometry 03.03 349 344 5Law (.1..B. or 1.13) 17.421 16,181 1,240 Osteopathy (0.0.) 472 161 11Theology (0.0., M.Div.. or Rabbi) 5,055 4,937 118 Mier), (Pod.O. on O.P.) Of Pediatric medicineOther 311 - 245 66 (0.P.M.) 240 235 S
Total, publicly controlled institutions.. 16,139 15.111 1.028 Veterinary medicine (O.V.M.) 154 138 16taw (LL.B. or 1.0.) 9,815 9,049 766
Dentistry (D.D.S. or 0.111.13.) 2.067 2,045 22 Theology (8.0., Itt,Div..os Rabbi) - 5/355 4,937 118
Medicine (M.D.) 5,093 4,632 III Other 218 183 35..
Optometry (0.0.) 182 174 a
Osteopathy (D.0.)Podiatry (Pod.O. or O.P.) or Podietric medicine
(D.P.M.)
Includes degrees which {nuke at feast 6 years of college work for completion (Inc riding at least 2 years preprefessional training).
SOURCE: U.S. Department of Health, Education, end Welfare, Office of Education. "Earned Degrees Conferred, 1970-71."
Table 119.-Male college graduates in the population, by field of highest degree;United States, March 1967
Field of highest degree Number Onthousands)
. Perceat Field Of highest degree Humber (inthousands)
Percent
1 2- 3 I 2 3
Tote 6,350 100.0 Humanities : 379 6.0English and journalism 174 2.7
Biological sciences 285 4.5 Speech and drama.
31 0.5Agriculture In 2.1 Foreign languages and literatures 53 0.8
Zoology 16 0.2 Philosophy 47 0.7Forestry 16 0.3 All other hoe and applied arts' 74 12All other biological sclencess 117 1.11'
Law 496-, 6.4
Business and commerce 1,171 18.4 Physical sciences 533 8.4Accounting - 236 '3.7 Mathematical subjects 124 2.0All other business and commerce' 935 14.7 Chemistry 223 3.5
Physics 93 1.5
Education 976 15.4 Geology . 38 0.6Elementary aducatioo. 24 0.4 AB other physical science's 55 0.9Educational administration . 75 1.2Induslrial arts (educational) 37 0.6 . Religion 142 22Physical education - 58 0.9 Theology 110 1.7
All Other educations 781 12.3 All other n000111 32 0.5
Engineering 1,000 15.7 Social sciences 678 10.7
Mei engineering Ill.. 13 Psychology 95 1.5Electrical engineering 173 2.7 Economics 174 2.7Mechanical engineering 188 3.0 History 158 2.5
All other engineerlogs 528 8.3 Political science 61 1.0Sociology 55 0.9
Health Molessions 477 7.5 All other social sciences° 135 2.1
Dentistry (D.D.S. and D.M.0Medicine MO.)
93235
1.53.7 Other fields 178 - 2.8
Pharmacy 80 1.3 Architecture 54 0.8All other heallh professions' 49 1.1 All other 124 2.0
. Not reported 126 2.0
I Includes not specified.
SOURCE: US. Depannient of Commerce, Bureau of the Ceines."Curre,nt Population Repoits;ISsiles P20, lie. 201.
104
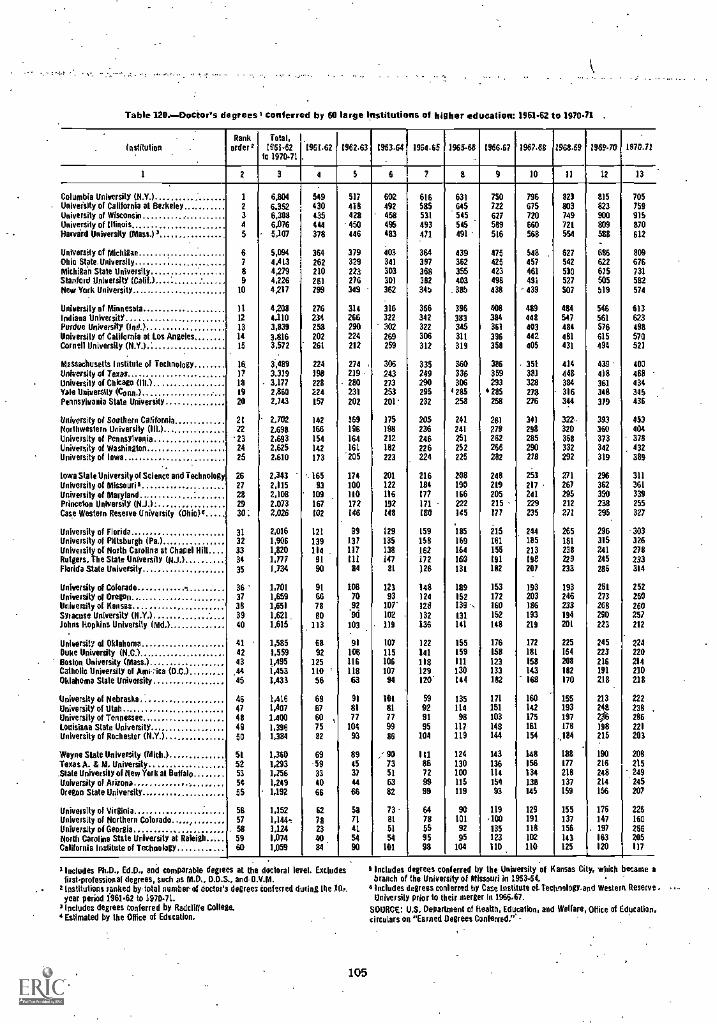
Table 120r-Docker's degrees s conferred by 60 large institutions of higher education: 1961-62 to 1970.71 .
institulionRank
ordersTotal,
1961-62lo 1970-71
.
1961.62.
1962-63 1963-64 1464.65 1965-66 1966-67 1967-68 1968-69 1969-70 1970-71
1 2 3 a 5 6 1 8 9 10 11 12 13
Columbia University (N.Y.) 1 6,804 549 517 602 616 631 750 796 823 815 705Urtiveisity of California at Berkeley 2 6.352 430 418 492 585 645 722 675 803 823 759University of Wisconsin 3 6,308 435 428 458 531 545 627 720 749 900 915Universily of Illinois 4 6,076 444 450 495 493 545 539 660 721 809 870Harvard University (Mass.) 2 5 - 5,107 378 446 483 471 491 516 568 554 588 612
University of Michigan 6 5,094 364 379 403 364 439 475 548 627 686 809Ohio State-University 7 41413 262 329 341 397 362 425 457 542 622 676Michigan State University 8 4,279 210 223 303 368 356 423 461 530 615 731Stanford University (Calif.) 9 4,226 . 261 276 301 382 403 498 491 527 505 582New York University 10 4,212 299 349 362 345 . 385 438 ' 439 507 519 574
University of Minnesota 11 4208 276 314 316 366 396 408 489 484 546 613Indiana UnlversitY 12 4.110 234 266 322 342 383 384 448 547 561 623Purdue University (lad.) 13 3,839 258 290 302 322 345 361 403 484 S76 498University of California at Los Angeles 14 3,816 202 224 269 306 311 396 442 481 615 570
Cornell University (N.Y.) 15.
3,572 261 212 299 312 319 358 405 431 494 521
Massachusetts Institute of Technology 16 3,489 224 274 . 306 335 360 386 351 414 439 400University of 7e.ras. . 17 3.319 198 219 243 249 336 359 38) 448 418 468University of Chicago (Ill,) 18 3,177 228 - 280 273 290 306 293 328 384 361 434Yale University (Conn.) 19 2,860 224 231 253 295 2 285 4 285 278 316 348 345Pennsylvania State University 20 2,143 157 202 201. 232 258 258 276 344 379 436
University of Southern Celifornia 21 2,702 142 169 175 205 241 261 341 322 393 453
florlhweslern University (011.) 22 2,693 166 196 198 236 241 279 298 320 360 404University of Pennsylvania 23 2,693 154 164 212 246 251 282 285 368 373 378University of Washington 24 2,625 142 161 182 226 252 266 290 332 342 432University of lows 25 2,610 173 -205 223 224 225 282 278 292 319 389
. -lima Slate University of Science and Technology 26 2,343 '165 174 201 216 208 248 253 271 296 311
University of Missouri s........ 27 2,115 93 100 122 184 190 219 217 267 362 361
University of Maryland 28 2,108 109 110 116 177 166 205 241 295 350 339
Princelon University (N.J.)* 29 2.073 167 172 192 171 222 215 229 212 238 255
Case Western Reserve University (Ohio)' 30: 2,026 102 146 148 180 145 277 235 271 295 327
University of Florida 31 2,016 121 99 129 159 185 215 244 265 296 -303University of Pittsburgh (Pa.) 32 1,906 139 137 135 158 169 161 185 151 315 326
Universily of North Carolina at Chapel Hill. 33 1,820 114 117 138 162 164 155 213 238 241 278Rutgers, The state University (4.1.) 34 1,777 91 111 147 172 160 191 198 229 245 233Florida State University 35 1,734 90 84 81 )26 131 182 207 233 286 314
University of Colorado - 36 1,701 91 108 123 148 189 153 193 193 251 252
University of Oregon 37 1,659 66 70 93 124 152 172 703 246 273 260University of Kansas 38 1,651 78 .92 107' 128 139 -, 160 186 233 268 260
Syracuse University (N.Y.) 39 1.621- 80 90 102 132 131 152 193 194 290 257Johns Hopkins University (Md.) 40 1,615 113 103 119 136 141 148 219 201 223 212
University of Oklahoma 41 1,585 ES 91 107 122 155 176 172 225 245 224
Duke University (N.C.) 42 1,559 92 106 115 141 159 158 181 164 223 220
Boston University (mass.) 43 1,495 125 116 106 118 111 123 158 208 216 214
Catholic University of Ami-lca (D.C.) .44 1,453 110 ' 118 107 129 130 133 143 182 191 230
Oklahoma State University 45 1,433 56 63 94 120. 144 132 168 170 218 218
University of Nebraska 46 1,416 69 91 101 59 135 171 160 155 213 222University of Utah 47 1,407 67 81 81 92 114 151 142 193 248 238 .University of Tennessee 48 1,400 60 t 77 77 91 98 103 175 197 2,06 286
Louisiana State University 49 1,396 75 104 99 95 117 148 161 178 198 221
University of Rochester (N.Y.) 50 1,384 82 93 86 104 119 144 154 ,184 215 203
Wayne Slate University (Mich.) 51 1,360 69 89 ,' 90 I11 124 143 148 188 190 208
Texas A. & M. University 52 1,293 -59 45 73 86 130 136 156 177 216 215
Slate UniversilY of New York al Buffalo 53 1,256 33 37 51 72 100 114 134 218 248 249
University of Arizona - 54 1,249 40 44 63 99 115 154 138 137 214 245
Oregon State University. 55 1,192 66 66 82 99 119 93 145 159 156 207
University of Virginia 56 1,152 62 58 73 - 64 90 119 129 155 176 226
University of Northern Colorado 57 1,144- 78 71 81 78 101 -100 191 137 147 160
University of Georgia 58 1,124 23 41 51 55 92 135 118 156 . 197 256
North Caroline State University at Raleigh 59 1 ,074 40 54 54 95 95 123 102 143 163 205
California Institute of Technology 60 1,059 84 90 101 98 104 110 110 125 120 117
Includes Ph.D., Ed.O., and comparable degrees at the doctoral level. Excludesfustprofessional degrees, such as M.D 0.0.s., and- 0.V.M.
z Institulions ranked by-total number of doctor's degrees Conferred during theyear period 1961-62 to 1970-71.
2 Includes degrees conferred by Radcliffe College.4 Estimated by the Office of Education.
105
5 Includes degrees conferred by the University of Kansas Ci y, which became abranch of the University of Missouri in 1963-64.Includes degrees conferred by Case institute cf. Technologyand Western ReserveUniversity prior to their merger In 1966.67.
SOURCE: U.S. Department of Heatth, Education, and Welfare, Office of Education,circulars on "Earned Degrees Coateried."*

Table 321-Formal awards based on 'organized occupational curriculums at the technical or semiprofessional level in institutionsof higher education, by length and type of curriculum and by sex of recipient: United States and outlying areas, 1969-70
- CurriculumAll awards
Awards based on organized occupalitinalcurriculums ot-
Al least 2 yea sbu less than 4 years
At least 1 yearbut less than 2 years
Total Men Women Total Men Women Total Men women
2 3 4 5 6 7 8 9 10
All curriculums 124,327 65,766 58,561 102,119 58.425 43,694 . 22.2011 7,341 14,867
Science. and engineering-related curriculums 61,271 34,994 26.277 47,531 29,963 17,568 13,7411 5,031 1,109
Engineering-related curriculums.. 28,959 28.648 311 24.413 24.126 26.1 4,546 4,522 24
Aeronautical toehnblogY. 1.612 1,652 20 1.137 1,117 20 535 535Architectural or building technology 2.656 2,603 53 2,446 2,399 41 210 204 6Chemical technology 555 484 72 553 481 72 3 3Civil technology 1.537 1,530 7. 1.514 1,507 7 23 23 ....Electrical or Mechanics technology 6.784 8,756 28 7,866 7.1158 28 898 898 ---Industrial technology 1,755 1,133 22 1,386 1,365 21, 369 368 1
InstrUmenlalion technology 227 '226 1 179 178 48 -48 . . _..Mechanical technology 9,391 9,322 69 7,377 7,321 56 2,014 2,001 - 13Metallurgical technology 316 314 2 293 291 2 . 23 23 -Nuclear technology 38 35 3 38 35 3AU other engineeringrelate4 curriculums. 2,027 1,993 34 1,604 1.574 30 423 419 4
Science-related curriculums 3,907 3.622 285 3.683 A 3,414 269 224 208 4
Agriculture 2.596 2,359 237 2,497 2,276 221 99 83 16Forestry 727 726 1 642 641 1 85 85 - --All other science-related curriculums.- 584 537 47 544 497 47 40 40
Health service curricubims 26.778 1,622 25,156 17,922 1.413 16,509 8,856 209 8.647
Dental assislant 1.663 4 1,659 508 2 506 1,155 2 1,153Dental hygiene a
Dental laboratory assistant2.229
36212
1272,217 -
2352,211
22012
1262.199
94
IS142
18141
SO edicat or biological laboratory technician 970 860 880 750 152 598 220 212Medical X-ray lechnkian 647 155 492 599 144 455 48 II 37
Nursing, practicalhorsing, associate degree or diploma
program
6.102
11.730
90
462
6,012
11,268
126
1)05
2
459
124
11.146
5.916
125
88
3
-5,888
122
Occupational Iherapy assistant 166 - 22 144 136 21 115 30 1 29Surgical technician 133 21 112 37 16 21 96 91 'All other health service curriculums 2,776 569 2,267 1,730 479 1,251 1,046 90 956
Scientific data processing curriculums..- 1,627 1.102 525 1.513 1,010 503 114 92 22
Non- science and ponlogineerintrelatedcurriculum 63,056 30,772 32,284 52,588 28.462 26.126 8.4611 2.310 - 6.158
Busineds and commerce-related curriculums. 46.431 22.045 24,386 38.028 20,773 19,255 6.403 1,272 5,131
General business. business administration 14,666 11.194 3,472 12,240 10.949 3.291 426 245 181
Accounting 4,824 3,436 1,388 4,290 3,155 1,135 534 281 253
Business data processing 4,860 3,227 1.633 4,199 2,894 1,305 661 333 328
Marketing. distributive education 4041 2.560 1,488 3.765 2,406 1,359 283 154 123
Secretarial studies 15,388 131 15,257 11,510 93 11,417 3,878 38 3,840
All other business. and commerce-relatedcurriculums 2,645 1,497 1,148' 2024, 1,276 148 621 221 400
All other noscionce. and nontengineeiingrelaled curriculums 161625 8.727 7,898 14,560 7,689 6.871 2,065 1,038 1,027
Bible study. religious work 642 375 267 618 360 sa 24 15 9Education 3,218 602 2,616 2.916 583 2,333 302 19 283
Fine, applied, or graphic arts 4,249 2,121 2,128 4,061 1,974 2,093 182 147 35
Nome economics 841 95 746 783 89 694 58 6 52
Library assistant or technical aide 313 15' 298 224 14 210 as 1 88
Police technology, law enforcement 4,084 3,844 240 3,551 3,331 220 533 513 20
Other 3,278 1,675 1,603 2,401 1,338 1.063 877 337 540
SOURCE: U.S. Department of Heallh, Education, and Welfare, btfice of Education, "Associate Degrees and Other Fe mat Awards Below the Baccalaureate. 1969.70."
106
.
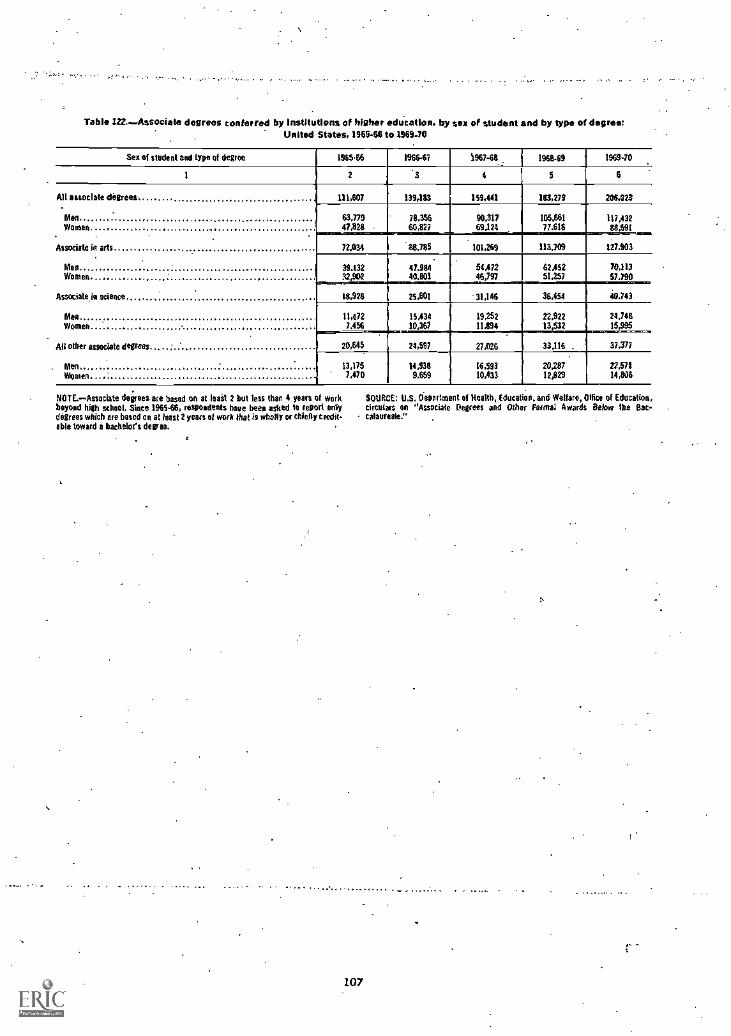
Table 122..Associate degrees conferred by Institutions of higher education, by sex of student and by type of degree:United States, 1969-66 to 1969-70
Sex of seeded and type of degree 196546 1966-67 1967.68 196849 1969-70
1 2 3 4 5 6
Alt associate degrees.N_
111,607 139,183 159,441 183,279 206,023
Men 63,779 78.356 90,317 105,661 117,432Women. 47,826 60,827 69,124 77.618 88.591
. .
Associate in arts 72.034 18.785 101,269 113.709 127.903
Men 39.132 47.984 54,472 62,452 70.113Women 32,902 40.801 46)97 51,257 57.790
Associate in science 18.928 25.801 31,146 36.454 40.743
Men 11,472 15,434 19,252 22,922 24.746Women 7,456 10.367 11.894 13,532 15.995
0Ali other associate degrees 20,645 24,597 27.026 33,116. 37,377
Men 13,175 14,938 16,513 20,287 22,571Women 7,470 9,659 10,433 12,829 14,606
NOTE. Associate degrees are based on at lead 2 but less than 4 years of work SOURCE: U.S. Oepertment of Health, Educat on, and Welfare, Office of Education,beyond high school. Since 196546, respopdents have beep asked to report only circulars on "Associate Degrees and Other FINM8i Awards Below the Bat-digress which are based on at least 2 years of work that is wholly or chiefly credit- calaureate."able toward a bachelor's degree.
.
107
:,
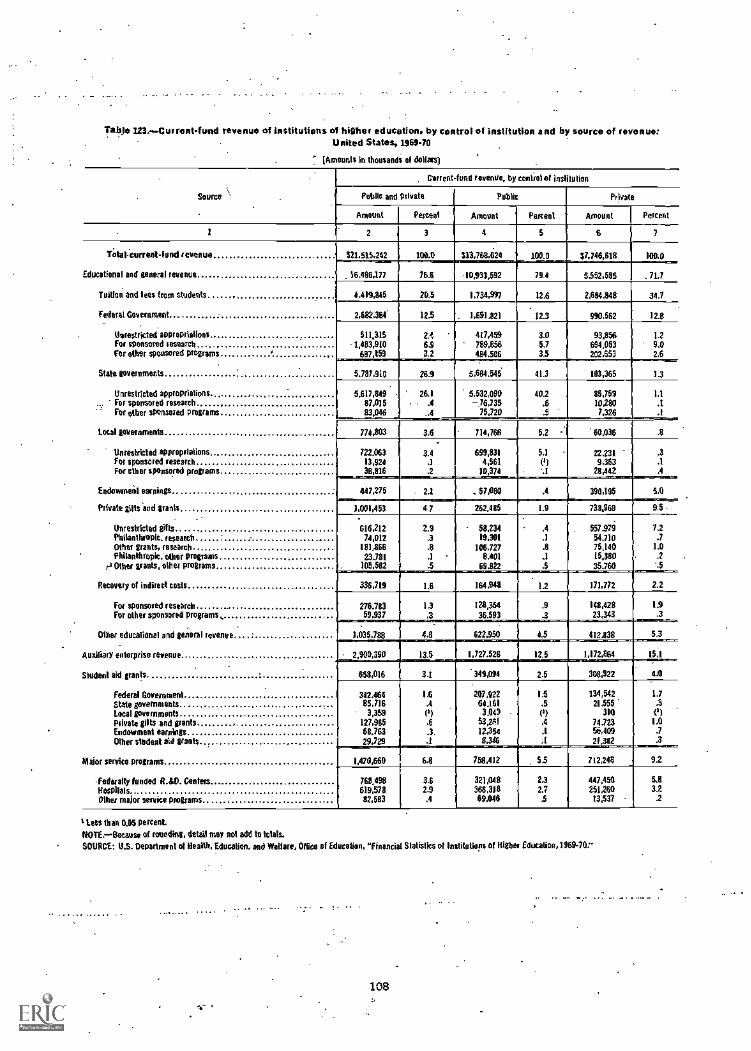
Table 123.- Current -fund revenue of institutions of higher education, by control of institution and by source of revenue:United States, 1969-70
[Amounts in thousands of dollars)
Source
Current-fund revenue, by control of institution
Public and private Public Private
Amount Percent Amount Percent Amount Percent
1 2 3 4 S s 1
TOW-Current-fund revenue 521,515,242 100.0 313,768,424 100.0 37,746,618 100.0
Educational and general revenue 36.486,177 76.6 10,933,592 79.4 5,552,585 .71.7
Tuition and fees from students 4.419,845 20.5 1,734.997 12.6 2,684,848 34.7
Federal Government 2582,344 12.5 _ 1,691.821 22.3 990.562 12.0. .
Unrestricted appreprialions 511,315 2.4 417,499 3.0 93.856 1.2For sponsored research -1,483,910 6.9 789,856 5.7 694.053 9.0ter other sponsored programs 687,159 3.2 424.506 3.5 202,653 2.6
State governments 5.787,910 26.9 5,694,545 41.3 103,365 1.3
Unrestricted appropriations 5517,849 261 5.532,090 40.2 85,759 1.1For sponsored research 87,015 , .4 76,735 .6 10,280 .1For other sponsored programs 83.046 ..4 75,720 .5 7,326 .1
Local governments 774,803 3.6 714,766 52 60,036 .8
Unrestricted appropriations 722,063 3.4 699,831 5.1 22,231 .3For sponsored researchFor other sponsored programs
13,92438,816
.1
.24,561
10,374el*I
9,36328,442
.1
.4
Endowment earnings 447275 - 2.1 .57,080 .4 390,195 5.0
Private gifts and grants 1,001,453 4.7 262.485 1.9 738.969 9.5
Unrestricted gifts 616,212 2.9 58,234 .4 557,974 7.2Philanthropic, research 74,012 .3 19,301 .1 54,710 .7Other grants, research 181,866 .8 106,727 .8 75,140 1.0Philanthropic. ether programs 23.781 .1 11.401 .1 15,380 .2
rl Other grants, other programs 105,582 .5 69.822 .5 35.760 '.5
Recovery of indirect costs 336,719 1.6 164,948 1.2 171,772 2.2
276.783 1.3 123,354 .9 148,428
I-
1,9For sponsored researchFor other sponsored programs 59,937 .3 36.593 .3 23,343 .3
Other educational and general revenve 1,035,788 4.8 622,950 4.5 412.838 53
Auxiliary enterprise revenue
1M
. 2,900,390 13.5 1,727.526 12.5 1,172,864 15.1
Student aid grants 658,016 3.1 34904 2.5 308.922 4/1
Federal Government 342.464 15 207,922 1.5 134,542 L7State governments 85,716 .4 64,161 .5 21.555 .3Local governments 3,359 () 3,44) (I) 310 (I)Private gilts and grants 127,965 .6 5301 .4 74.723 1.0Endowment earnings 68.763 .3 12,354 .1 56,409 .7
Other stedesit aid grants 29.729 .1 8,346 .1 21.382 .3
Major service programs 1,470,640 6.8 754,412 5.5 712248 92
-Federally handed R.10. Centers 748.498 3.6 321,048 2.3 447,454 5,8Hospitals 619,578 2.9 368,318 2.7 251,260 3.2Other major service programs 82,583 .4 69,046 .5 13,537 .2
t Less than 0.115 percent.
110110-Because of rounding, detail may not add to totals.
SOURCE: U.S. Department et Health. Education, and Welfare. Mee of Education, "Financial Statistics of Institutions of Higher Education, 1969-70r
o"
108
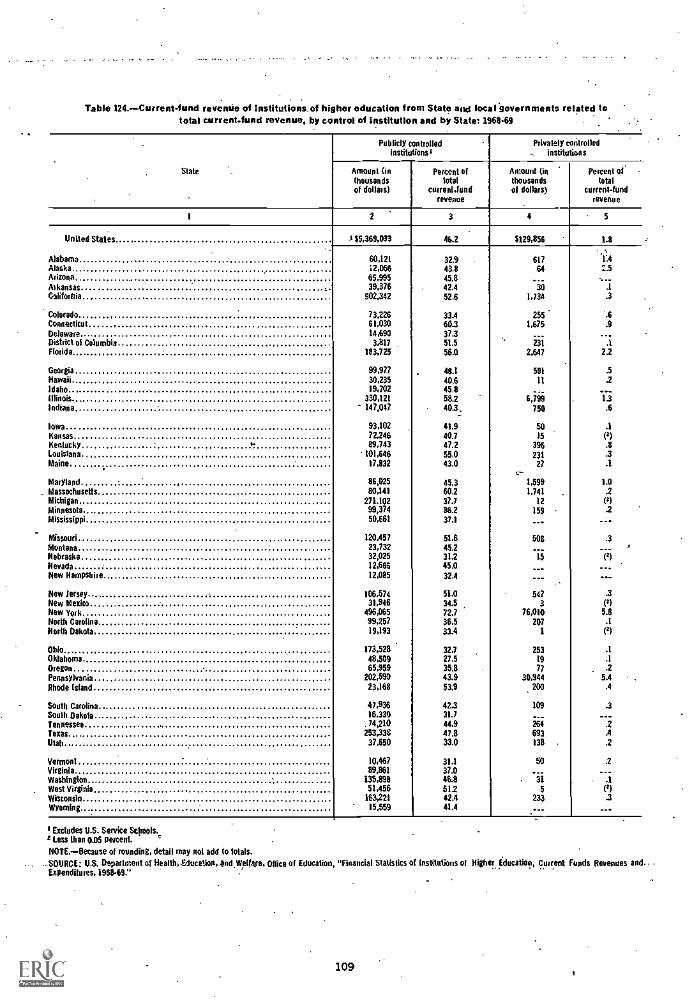
Table 124.-Current-fund revenue of institutions. of higher education from State and local governments related tototal current-fund revenue, by control 01 Institution and by State: 196849
State
Publicly controlledinstitutions+
Privately controlled, institutions
Amount (inthousandsof dollars)
Percent oftotal
current fundrevenue
Amount Onthousandsof dollars)
Percent oftotal
current-fundrevenue
2 3 4 5
United States. I 55,369,033 46.2 5129,856 1.8
Alabama 60,121 32.9 617 1:4Alaska 12,056 43.8 64 Z.5Arizona 65.995 45.8Arkansas 39.376 42.4 30 1
California... 902.342 52.6 1,134 .3
Colorado 73,226 33.4 255Connecticut 61,030 60.3 1,675Delaware 14,690 37.3District 01 Columbia 3,817 51.5 231 .1Florida 183,725 56.0 2,647 2.2
Georgia 99,977 48.1 501 .5
Hawaii 30,235 40.6 It .2Idaho 19,702 45.8Illinois 330,121 58.2 6,199 1.3Indiana 147,017 40.3, 750 .6
Iowa 93,102 41.9 50Kansas 72,246 40.7 15 (I)Kentucky 89,743 47.2 396 .8Louisiana 101,646 55.0 231 .3Maine 17,832 43.0 27 .1
c-Maryland 86,025 45.3 1,599 1.0Massachusetts 80,141 60.2 1,741 .2Michigan 271.102 37.7 12Minnesota 99,374 36.2 159 .2Mississippi 50,661 37.1
Missouri 120,457 51.6 502 .3Montana 23,732 45.2Nebraska 32,025 31.2Nevada 12,681 45.0New Hampshire 12,085 32.4
New Jersey 106.574 51.0 547 .3New Mexico 31,916 34.5 3 (5)New York 496,065 72.7 76,010 5.8North Carolina 99,257 36.5 207 .1
North Dakota 19,193 33.4
Ohio 173,528 32.7 253 .tOklahoma 48,509 27.5 19Oregon 65,959 35.8 77 .2Pennsylvania 202,590 43.9 30,944 5.4Rhode Island 23,168 53.9 200 .4
South Carolina 47,936 42.3 109 .3South Dakota 16,339 31.7
Tennessee .74,210 44.9 264 .2Texas 253,338 47.8 693 AUtah 37,650 33.0 138 .2
Vermont 10,467 31.1 50 .2
Virginia 89,861 37.0Washington 135,898 46.8West Virginia 51,456 512 5 (8)Wisconsin 183,221 42.4 233 .3Wyoming 15,559 41.4
Excludes U.S. Service Schools.1 Less than 0.05 percent.
NOTE.- Because of rounding, detail may not add to totals.-.SOURCE: U.S. Department of Health$Slocation,.andWelfare, Office of Education, "Financial Statistics of Institutions of Higher Education, Current Funds Revenues and..
Expenditures, 1968-69."
109
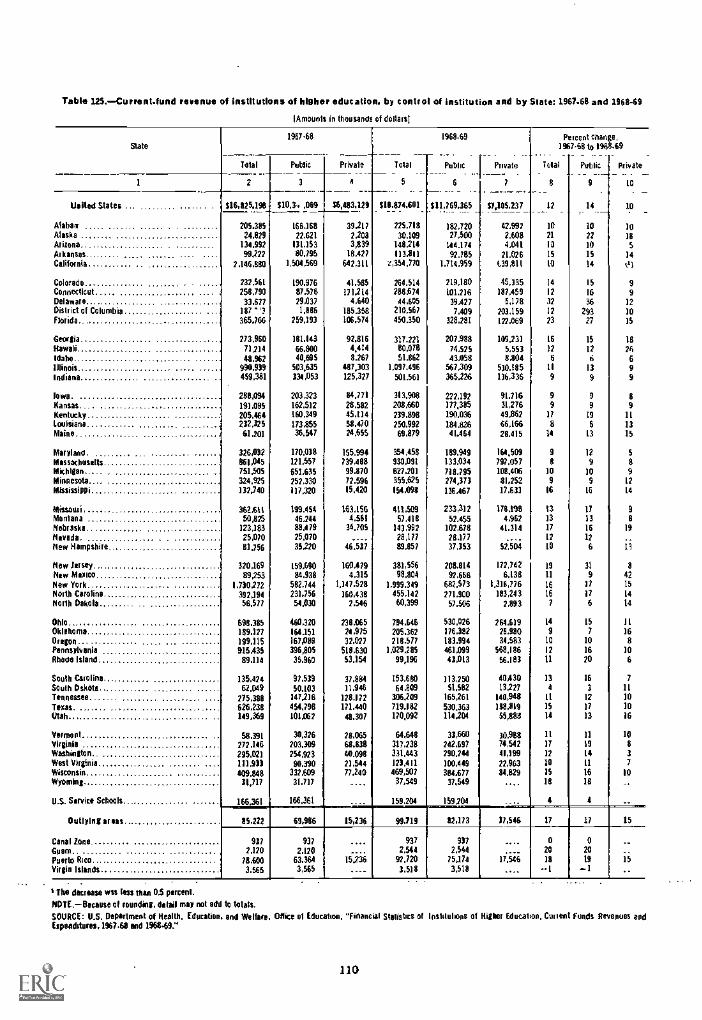
Table in.Current-fund revenue of institutions of higher education, by control of institution and by State: 1967-68 and 1968-69
'Amounts in thousands of dollars)
State
lotal
1967.68
Public Private
A
fatal_5
196E469
Public___ . _.
6
Private._ .7
Percent1967-68
Taal
8
clan;to 196
Public
9
e,-69
Private- -- - - -
101 2 3
United States 316,825.198 310,3. ,069 36,4133,129 316L8/4 601 311,769,365 $7,105.237 12 14
. _10
Alabas 205.385 166.168 39,217 225,718 182,720 42,997 10
_1
10 10Alaska ...... 24.629 22,621 2.208 30.109 27,500 2.608 21 22 18Arizona 134,992 131,153 3,839 148214 144.174 4,041 19 10 SArkansas 99,222 80.795 18,427 113,111 92.785 21.026 15 15 14
California 2,116,880 1,504,569 642,311 -4354.770 1.714.959 639,811 10 14 c'S
Colorado 232,561 190.976 41,585 264.514 219,180 45,335 14 15 9ConnecticutDelaware
258,79033,677
87,57629,037
171,2144,640
28867444,605
101,21639.427
187,4595,178
12
3216
as9
12District of Columbia 187 "3 1,886 185.358 210,567 7.409 203,159 12 293 10Florida 365,766 259,193 106,574 450,350 328.281 122.069 23 27 15
Georgia 273,960 181.143 92,816 317.221 207.988 109.231 16 15 18Hawaii 71214 66.800 4,414 80.078 74.525 5.553 )2 12 26Idaho 48.962 40,685 8,267 51,862 43,058 8,804 6 6 6Illinois 990.939 503,635 487,303 1,097.496 567,309 530.185 11 13 9Indiana 459.381 331,053 125,327 501.561 365.226 136,336 9 9 9
Iowa. 288,094 203,323 84)71 313.908 222.192 91.716 9 9 8Kansas 191.095 162.512 28,582 208,660 177,385 31,276 9 9 9Kentucky -, 205.464 160,349 45.114 239.898 190,036 49,862 17 19 11
Louisiana 232,325 173,855 58.470 250.992 184426 66,166 8 6 13Maine , 61,201 36.547 24,655 69.879 41,464 28.415 11 13 15
Maryland. 3264032 170.038 155.994 354,458 189.949 161,509 9 12 5Massachusetts 861,045 121,557 739,488 930,091 133.034 797,057 8 9 8Michigan 751.505 651.635 99.870 827.201 713.795 108.406 10 10 9Minnesota 324,925 252,330 72.596 355,625 274,373 81,252 9 9 12
Mississippi 132,740 117,320 15.420 154.093 136.467 17.631 16 16 14
Missouri,Montana
362.611
50.825199.454
46.204163.156
4.561411,509
57,418233,312
52.455178,198
4,9621313
17
139
8
Nebraska 123,183 88.179 34,705 143,992 102,678 41.314 17 16 19Nevada.New Hampshire.
25,07081,756
25,07035,220 46,537
28,17789,857
28,17737,353 52,504
12
10
12
6 iiNew Jersey 320,169 159.690 160,479 381,556 208,814 172,742 19 31 a
New Mexico 89,253 84.938 4,315 98,804 92,666 6,138 11 9 42New York 1,730272 582,744 1,117,528 1,999.349 682.573 1,316,776 16 17 15
North Carolina 392,194 231,756 160.438 455,142 271.900 183,24 3 16 17 14
North Dakota 56,577 54,030 2,546 60.399 57.506 2,893 7 6 14
Ohio 698,385 460,320 238.065 794.646 530.026 264.619 14 15 11
Oklahoma 189.127 164.151 24,975 205.362 176.382 21.980 9 7 16Oregon 199,115 167,089 32.027 218,577 183.994 34,583 10 10 8Pennsylvania 915,435 396,805 518,630 1,029,285 461,099 568.186 12 16 10Rhode Island 89,111 35,960 53,154 99,196 43,013 56,183 11 20 6
South CarolinaSouth Dike'
135.42462,049
97,53950,103
37,88411,946
153,68064,809
11325051.582
10,43013,227
134
16
3
7
11
Tennessee 275.388 147,216 128.172 306,209 165,261 140,948 11 12 10Texas. 626238 454,798 171,440 719,182 530,363 188.819 15 17 10Utah ......... ...... 149,369 101,062 48.307 170,092 111,201 35,888 lit 13 16
Vermont 58,391 *326 28.065 64,648 33,660 30,988 11 11 10Virginia 272,116 203,309 68,838 317.238 242.697 74,542 17 S9 8
Washington.West Virginia
295.021111,933
254.92390.390
40.09821.544
3311.443
123,411290,244100.449
41,19922.963
12
1014
11
37
Wisconsin 409.848 332,609 77,240 469,507 384.677 84,829 15 116 10Wyoming 31,717 311,717 ..... 37,549 37,549 .... Hi 18
U.S. Service Schools 166.361 166,361 159,201 159,204 4 it.0=1
Outlyingareas 85,222 69,986 15,236 99,719 82,173 17,546 17 17 15
Canal Zone 937 937 937 937 0 0GuamPuerto RicoVirgin Islands
2,12078,6003.565
2.12063.3643,565
lliiii2,544
92,7203,518
2,54475,1743,518
Iiiii,2018
--I
20191 15
r The decrease was less than 0.5 percent.
NOTE. Because of rounding, detail may not add to totals.
SOURCE: U.S. Department of Health, Education, and Welfare, ElKice of Education, "Financial Stalistics of Institulons of Higher Education, Cunard Funds Revenues and11900044)192,1967-68 end 196818:'
110
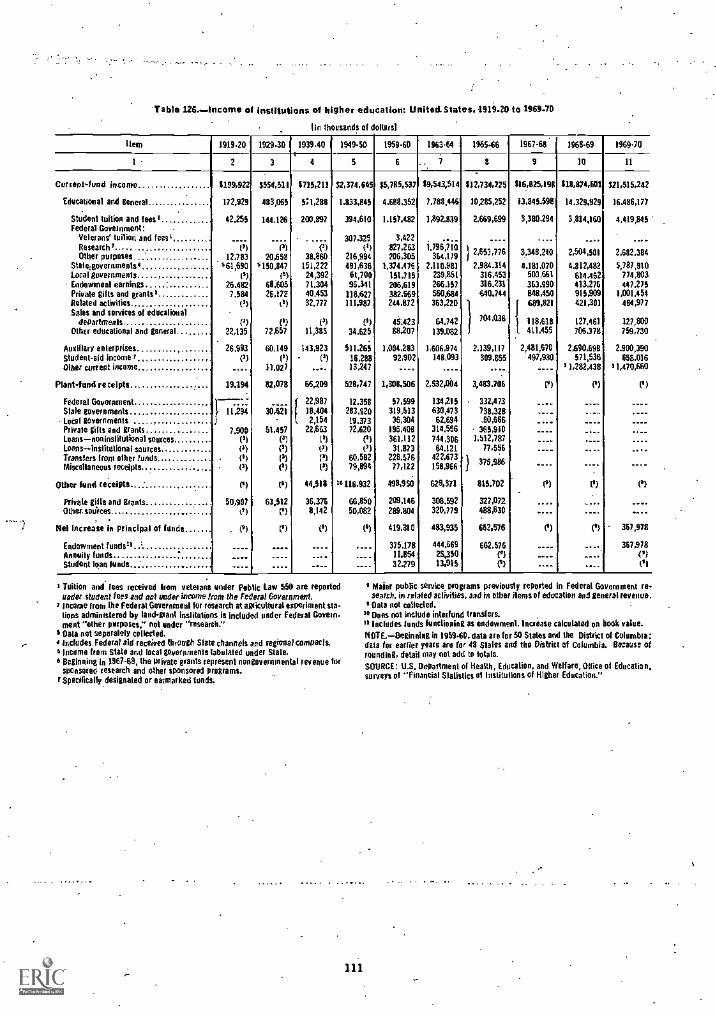
-Table 126e-income of institutions of higher education: United.States,1419-20 to 1969-70
(In thousands of dollars)
llem 1919.20 1929.30 1939.40 1949-50 1959.60 1963.64 196566 1967.64 1968.69 196970
1- 2 3 n 4 5 6 7 8 9 10 11
Current-fund income 3199,922 3554,511 3715,211 $2,374,645 35,785,537 39,543,514 312,734,225 316,825,198 318,874,601 $21,515,242
Educational and general 172,929 483,065 5:1,288 1.833,845 4.684,352 7.788,446 10285.252 13,845,598 14.329,924 16.486,177
Student tuition and fees' 42.255 144.126 200.897 394,610 1.157,482 1,892.839 2.669,699 3,380,294 3,814,160 4,419,845Federal Government:
Veterans' trillion and fees' 307,325 3,422 ... _... .... ... ,
.....Research; PI P1 (') (1) 827,263 1,795,710 1
Other purposes 12.783 20,658 38,660 216,994 206,306 364.179 i 2.653,776 3344.240 2.504,501 2,682,3B4
Stalkgovernments4 s61,690 x150.847 151,222 491,636 1,374.476 2.110.981 2,981.314 4.181.070 4,812,482 5,787,910Local governments rry tv) 24,392 61,700 151.715 239,851 316,453 503,661 614.462 774,803Endowment earnings.. 26,482 68,605 71,304 96,341 206.619 266,157 316.231 363.990 413,276 447,275Private gifts and grants 7,584 26,172 40,453 118/47 382.569 550.684 640,744 848,450 915,909 1.001.454Related activities- (') t') 32.777 111,987 244.872 363,220 689,821 421,301 484,977Sales and services of educalional .
departments ('7 ('7 (;) (s) 45:423 64,742 704.036 118,618 127,461 127,800Other educational and general 22,135 72,657 11,383 34.625 88.207 139.082 411,455 706,378 759,730
Auxiliary enterprises 26,993 60,149 143,923 511.265 1,004,283 1,606.974 2.139,117 2,481,670 2,690.698 2.900,390Student-aid income; (3) (1) (3) 16.288 92,902 148,093 309.855 497,930 571,536 658.016Mu current incense 11.027 .... 13,247 ... - ____ .... ____ g 1,282,438 11,470,660
Plant-fund receipts 19,294 82,078 66,209 528,747 1,308,506 2,532,044 3,483.706 (1) (1) I')
Federal Government-- .
22,987 12,358 57,599 134,215 332,473 ... ___ ____Slale governments 11 294 30,621 18,404 283.920 319,513 630,473 738,328 __._ -. _.- .---Local governments } t 2,154 19,373 36,304 62,694 .80,666 .... ____ ____Private gifts end grants 7.900 51.457 22,663 72,620 196.408 314.556 365,910 ____ -__ - -.Loans-noninslitulional sources P) P) PI f') 361,112 744,306 1,512,787 _ ---- ----Loans-inslitulional sourcesTransfers from other fundsMiscellaneous receipts
(3)(5)P1
(1)
(0)(5)
()V/(')
(')60,58279,894
31.873228,57677,122
64.121422,573158,966
77.556
375,986
. _
----
-__ "
Other fund receipts P1 re) 44,518 16116.932 498,950 629,371 815,702 P1 P) ('7
Private gills and grants 50,907 63,512 36,376 66,850 209.146 308,592 327,072 - .. --.. -..Other. sources (+) (1) 8,142 50,082 289,804 320,779 488,630 ..... ____ ....
.
Nei Increase in principal of funds (p) (') (°) (4) 419,310 483,936 662,576 (0) (11 367,978
Endowment fundsli ' --. 375.178 444,669 662,676 ---- ---. 367,978Annuity funds __ . _ 11,854 25,350 (*) - -__. ('1
Student Man funds .... ____ 32,279 13,915 ('7 ____ --. P1
Tuition and fees received hem veterans under Public Law 550 are reportedunder strident fees and not under income trom the Federal Government.income from the Federal Government for research at agricultural experiment sta-tions administered by land -grant inslitutions is included ceder Federal Govern.meet "other purposes," not under "research."
I Oals not separately collected.Includes Federal aid received through State channels and regional compacts.
6 Income from State and local governments tabulated under Stale.Beginning in 1967-68, the private grants represent nongovernmental revenue forsponsored research and other sponsored programs.
;Specifically designated or earmarked tends.
111
0 Maier pub9c service. programs previously reported 'n Federal Government re-search, in related activities, and In other items of edo alien and general revenue.Oats not collected. -
'0 Dom not include interfund transfers,11 Includes funds functioning as endowmenl. Increase calculated on book value.
NOTE--Beginning in 195940. data are for 50 States and the District of Columbia;data for earlier years aro for 48 Stales and the District of Columbia. Be arse ofrounding, detail may not add to totals.
SOURCE: U.S, Department of Health, Education, and Welfare, Olfice of Education,surveys of 'Financial Slalistics of Institutions of Higher Education."
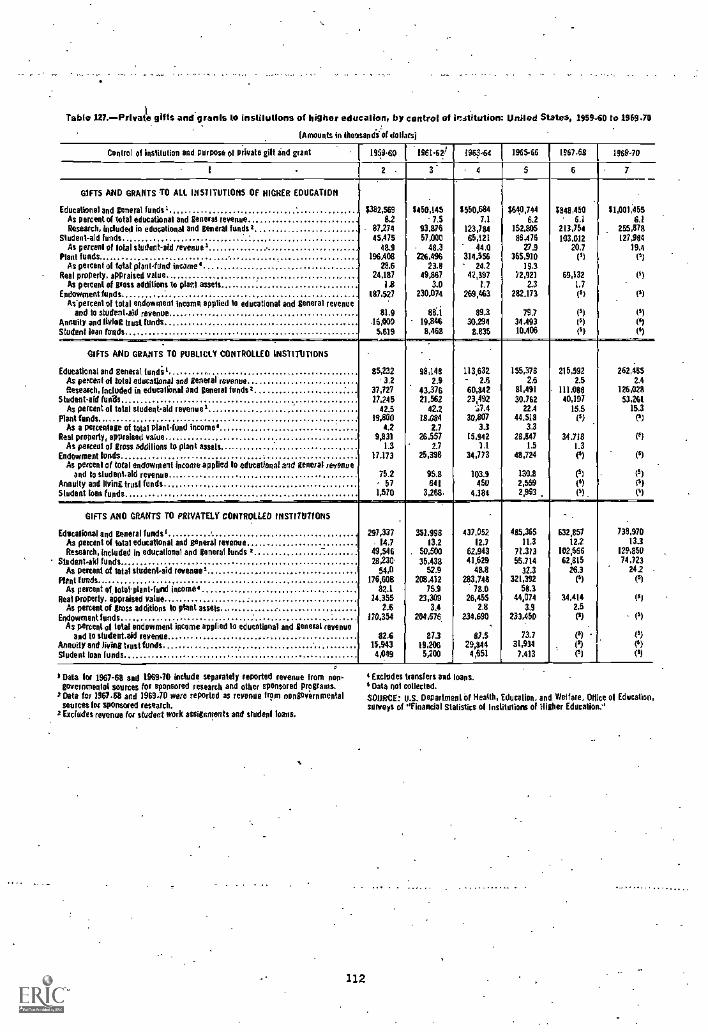
Table M.-Private gifts emigrants to Institutions of higher education, by control of institution: United States, 1959-60 to 1969.70
(Amounts in thousands of dollars)
Control of institution and purpose of private gift and grant 1959.60.
(961-621 1963.64 1965.66 1467.68 1969.70
1 2 . 3 4 5 6 7
GIFTS AND GRANTS To ALL INSTITUTIONS Of HIGHER EDUCATION
Educational and general funds a $382,569
.
$459,145 5550.684 $640,744
.
$848,450
-
$1,001,455As percent of total educational and general revenue 8.2 73 7,1 6.2 6.1 61Research, Included in educational and general funds= - 87274 93.876 123,784 152,805 213,754 255,878
Sludent-aid funds 45,475 57,000 65,121 86,476 103.012 127,984As percent of total student -ald revenuer 48.9 48.3 44.0 V.9 20,7 19.4
Plant funds . 196,408 226,496 314.556 385,910 (1) I')As percent of total ptantfund interne' 28.6 23.8 24,2 19,3
Real property, appraised value 24,187 49,867 42,397 72,921 69,132 PIAll percent of Mess additions to piaci assets 1,8 3.0 1.7 2.3 1.7
Endowment funds 187,527 230,074 269,463 282,173 (0) PIAs-percent of total endowment income applied le educational and general revenue
and to student-akl revenue 811 sel 89.3 79.7 (6) 161
Annuity and living trust funds .16,900 19,846 30.294 34.493 14) (')Student lean fonds 5,619 8,468 8.835 10,406 I') (4)
.GIFTS AND GRANTS TO PUBLICLY CONTROLLER INSTITUTIONS
.
Educational and general fund; a 85,232 98,148 113,632 156,378 215,592 262,485As percent .0 total educational and general revenue 3.2 2.4 - 2.6 2.6 2.5 2.4Research, Included in educational and general funds= 37,727 43,376 60,842 81,491 - 111,088 126,028
Studentaid (mils 27,245 21,562 23,492 30.762 40,197 53,261
As percent of total student-aid revenuer 42.5 42.2 ;17,4 22.4 15.5 15.3
Plant funds 19,800 18.084 30,807 44,518 (0) (')As a percentage of total plantfund income' 1.2 2.7 3.3 3.3
Real property, appraised value 9,831 26,557 15,442 28,847 34.718 (*)As paced of tress addilions to plant assets 1.3 2.7 1.1 1.5 1.3
Endowment lends 17.173 25,398 34,773 48,724 46/ (6)As percent of total eno.ownient income applied to educational and general revenue
and to studenlaid revenue. 75.2 95.8 103.9 130.8 (4) (s)Annuity and living trust funds 57 641 450 2,559 4') (0)
Student loan funds 1.570 3,268. 4.184 2,993 (a) (0)
GIFTS ANO GRANTS TO PRIVATELY CONTROLLED INSTITUTIONS - .
Edecalional and general funds' 297,337 352.998 437,052 485.365 632,857 738,970As percent of total educational and general revenue 14.7 13.2 12.7 11.3 122 13.3
Research, included in educational and general hinds i 49,546 . 50,500 62,943 71.313 102,666 129,850
Student-aid funds 28,230 35,438 41,629 56.714 62,815 74,723
As percent of total student-aid revenge* 54.0 52.9 48.8 32.3 26.3 242 -
Rent funds 176,608 208.412 283,7411 321,392 (6) (4)
As percent of lotal plant-fund income 82.1 75.9 78.0 58.3Real property, appraised value 24,355 23,309 26,455 44,074 34,414 ('1
As percent of gross additions M plant assets 2.6 3.4 2.8 3.9 2.5Endowment funds . 204,676, 234,690 233,450 (0) . (6)
As percent of total endowment income applied to educational and general revenue .
and to student-aid revenue 82.6 87.3 87.5 73.7 (0) (6)
Annuity and living trust funds 15,943 19,206 29,844 31,934 (6) I (a)
Student loan lands 4,049 5,200 4,651 7.413 (0) i ( *)
Data to 1967-68 and 1969-70 Include separately reported revenue from non-governmental sources for sponsored research and other sponsored programs.Data for 1957-68 and 1969.70 were reported as revenue from nongovernmentalsources tor sponsored research.Excludes revenue for student work assignments and student loans.
112
4 Excludes transfers and loans.Data not collected.
SOURCE: U.S. Department Of Health, Education, and Welfare, Mice of Education,surveys of "finandal Statistics of institutions of Higher Education.
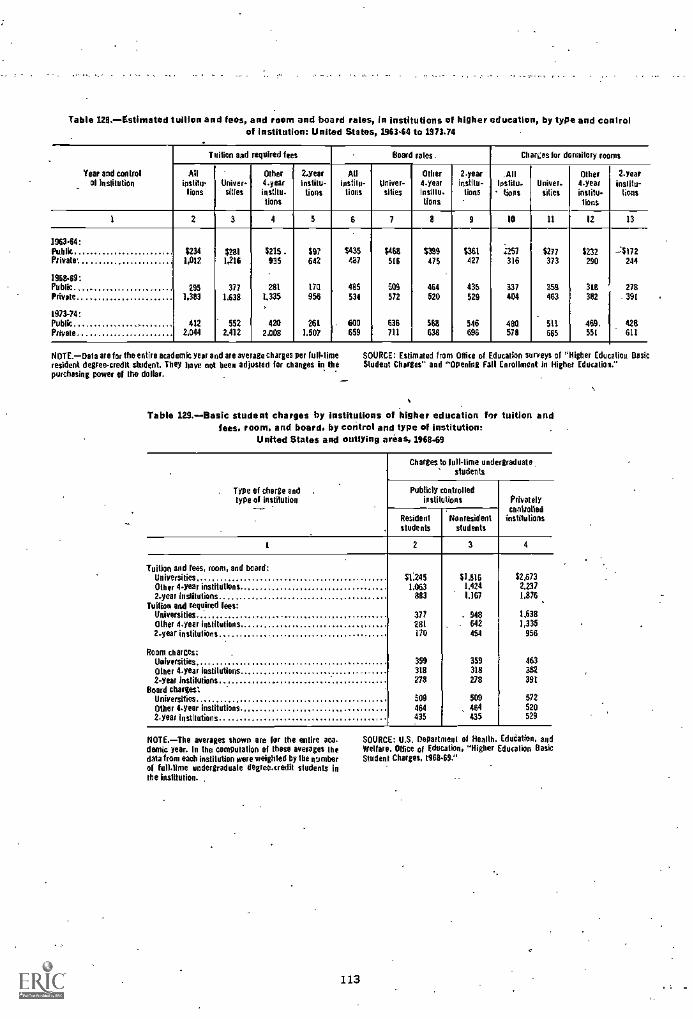
Table 128.Estimated tuition and fees, and room and beard rates, in Institutions of higher education, by type and controlof institution: United States, 196344 to 1973.14
Year and controloI institution
Tuition and required fees Board rates . Charces for dormitory rooms
Allinstills-lions
Universities
Other4-yearinstitu-tions
2.yearinstitu-tions
Allinstilu-tines
Univer-silies
Other4-yearinstilu-lions
2-yearinstilu-
lions
.811
loslitulions
Universilica
Other4-yearinslitu.lions
2-yearinsiitu-
lions
1 2 3 4 5 6 7 a 9 10 11 12 13
1963-64:Public $234 $281 $215. $97 $435 1 6468 $399 $361 .i257 $277 $232 1172Private. 1,012 1,216 935 642 417 516 475 427 316 373 290 244
1968-69:Public 295 377 281 170 485 509 464 435 337 358 318 278Private 1,383 1,638 1,335 956 534 572 520 529 404 463 362 . 391
1973-74: _
Public 412 552 403 261 600 636 568 546 480 511 469, 426Private 2,044 2,412 2,008 1,507 659 711 638 606 578 665 551 611
NOTE.Dala orator the entire academic year and are ave age charges per full-lime SOURCE: Esrmated from Office of Education surveys of "Higher Education Basicresident degree-credit student, They have not beep adjusted for changes in the Student Charges" and "Opening Fall Enrollment in Higher Education."purchasing power of the dolbr.
Table 129..Basic student charges by institutions of higher education for tuition andfees, room, and board, by control and type of institution:
United States and outlying arias, 196849
. Type of charge andtype of institution
ChergeS to lull-time uncle graduate-students
Publicly controlledinstitutions Privately
controlledinstitutionsResident
studentsNonresident
students
1 2 3 4
Tuition and fees, room, and board:Universities ;1.,245 61,816 $2,673Other 4-year institutions 1,063 1,424 2,2372-year Institutions 883 1,167 1,876
Tuition and required lees:Universities 377 . 948 1.638Other 4-year Institutions 281 . 642 1,3352-year institutions 170 454 956
Room charges:Universities 359 359 463
Other 4-year Institutions 318 318 382
2-year institutions 278 278 391
Board charges:Universities 509 509 572
Other 4-year institutions 464 464 520
2 -year Institutions 435 435 529
NOTE.The averages shown are for the entire aca- SOURCE: U.S. Department of Health, Edudation, anddemic year. In the computation of these averages the Welfare, Nice of Education, "Higher Education Basicdata from each institution were weighted by the numberof full-lime undergraduate degree-credit students inthe institution.
Student Charges, t96819."
113

Table 130.-Current-fund expenditures of Institutions of higher education, by control and by purpose: United States, 1969-70
(Amounts in thousands of dollars(
Purpose
Current-lund expenditures, by control of institution
Public end private Public Piiva e
Amount Percent Amount Percent Amount Percent
2 4 5 6 7
_
Total currentiund expenditures 321,043,113 100.0 $13.249,545 100.0 $7.793,567 1.00.01..
Educational end general expenditures 15.788,699 75.0 10,374.191 78.3 5.414,507 69.5
General administration and general expense , ' 2,627,993 12.5 1,536.243 11.6 1,091.750 14.0Instruction and departmental research 6,883,844 32.7 4,731,644 35.7 2,152,201 27.6Extension and public services 621,148 2.5. 476.079 3.6 45,069 0.6Libraries 652.596 3.1 414,975 3.1 237.621 3.0Plant operation and maintenance 1,541.698 7.3 1,000,095 7,5 541.603 6.9Sponsored activities other than research 769.253 3.7 510,091 4D 234,162 3.1Sponsored research 1,842,417 8,8 999,135 7.5 843282 10.8Other separately budgeted research 301,659 1.4 272,000 2.1 29.659 0.4Related organised activities 648.089 3.1 413,929 3.1 234,160 3.0
Auxiliary enterprises 2,769,276 13.2 1,624298 12.3 1,144,878 14.7
Student-aid grants 984.594 4.7 456,977 3,4 527.617 6.8Major public service programs 1,500.544 7.1 793,900 6D 706.564 9.1
Federally funded R./1). centers' 757,388 3.6 320,351 2.4 437,037 5.6Hospitals: 671,236 . 3.2 415,082 3.1 256.154 3.3Other major public service programs: 71.919 0.3 58,547 0.4 13,372 0.2
: Before 1968-69. these data were included with sponsored research under educa-tional and general expenditures.
: Before 1968-69,these data were Included with educational and general items,
114
NOTE.-Because of rounding, detail may not add o totals.
SOURCE: U.S. Department of Health. Education,. and Welfare, Office of Education,"financial Statistics of Institutions of Higher Education, 1969.70."
i
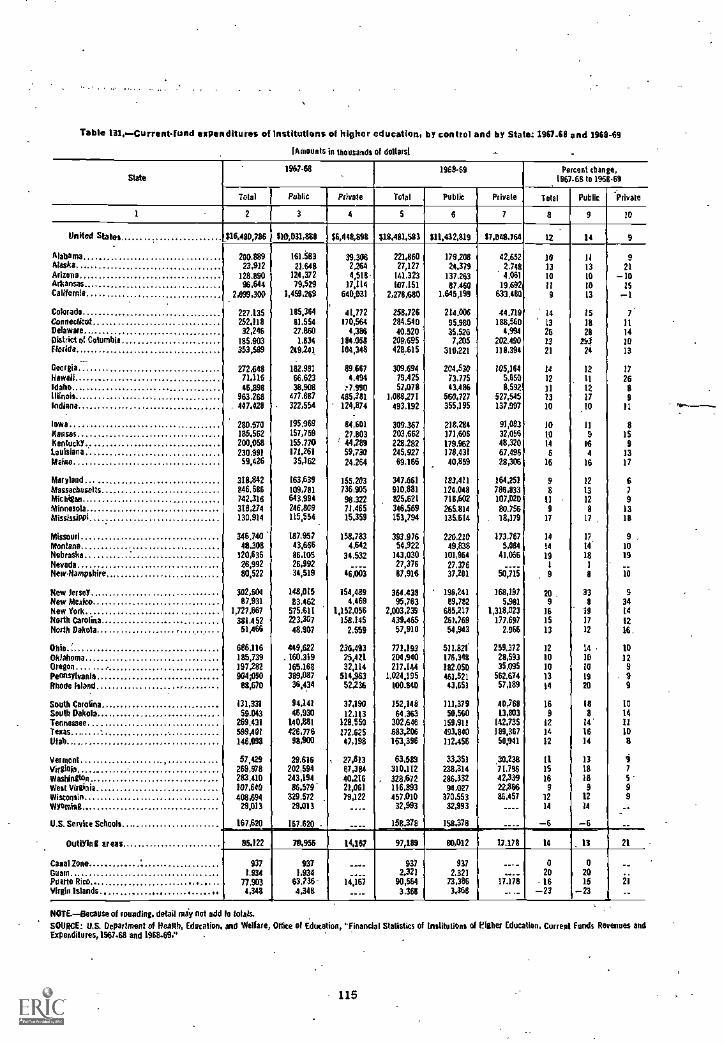
Table 1310-Current-fund expenditures of institutions of higher education, by control and by State: 1967-68 and 1968-69
[Amounts in thousands of dollars!
State1967-68 1968-69 Percent ckange,
1967-68 to 1968.69
Iota) Public Nivel, Total Pubik Private Total Public Private
1 2 3 4 5 6 7 a 9 10
Wilted States $16,430986 $10,031,889 16,448,899 832,481.583 $11,432,819 57,048,764 12 14 9
Alabama 200,889 161,563 39.306 221.660 179,208 42452 II 11 9Alaska 23,912 21,648 2,264 27,127 24,370 2,748 13 13 21Arizona 128.890 124,372 4,511- 141.323 137,263 4,061 10 10 -10Arkansas 96,644 79,529 17.114 107,151 87.460 19,692 tt 10 35California 2,099,300 1,43,269 660,031 2,278,680 1,645,199 633,490 9 13 -1Colorado 227,135 185.364 41,772 258.726 214,006 44,719 14 15 7.Connecticut 252.118 91.554 170,564 284,540 95.980 188,560 13 18 11Delaware... 32,246 27,860 4,386 40,520 35.526 4,994 26 28 14District ot Columbia 185.903 1,834 184,068 209,695 7,205 202,490 33 283 30Florida 353,699 249101 104,348 428,615 310,221 118,394 21 24 13
Georgia 272,648 182.981 89,667 309,694 204,530 105,164 14 12 17Hawaii 71,116 66,623 4,494 79,425 73,775 5.650 12 11 26Idaho 46.898 38.908 :7,990 52.078 43,486 8,592 11 12 8Illinois 963.268 477,687 485,381 1988,271 560,727 527,515 33 17 9Indiana . 447.428 - 322,554 . 124,874 493,192 355,195 137,997 10 10 11
Iowa 280.570 195,969 84,601 309,367 218,264 91,083 10 11 8Kansas 185,562 157,759 27,803 203,662 171606 32,056 10 9 15Kentucky 200958 155,770 ' 44.289 228,282 179.962 48,320 14 16 9Louisiana 230,991 171.261 59,730 245,927 178,431 67,496 $ 4 13Mese 59.426 35,162 24,264 69,166 40,859 28,306 16 16 17
Maryland 318,842 163,630 155,203 347,661 183.431 164,251 9 12 6Massachusetts 846,686 109,781 736,905 910,881 124,048 786,833 8 13 7
Michigan 742,316 643.994 98,322 825,621 718,602 107,020 11 12 9Minnesota 318,274 246,809 71,465 346,569 265,814 80.756 9 8 13Mississippi 130,914 115,554 15,359 153,794 135,614 . 18,179 17 17 19
Missouri 346.740 187,957 158,783 393.976 220,230 173,767 14 17 9 ,
Montano 48,308 43.666 4,642 54,922 49,838 5,084 14 14 10Nebraska 120,636 86,105 34,532 143,030 101,964 41,066 19 18 19Nevada 26,992 26,992 27,376 27.376 1 1
NewNampshire 80,522 34,519 46963 87,916 37,201 50,715 9 8 10
New Jersey 302,504 148,015 154,489 364.438 195,241 168,197 20 . 33 9New Mexico 87,931 83,462 4,469 95,763 99,782 5,981 9 a 34New York 1,727.667 575.611 1.152,056 2,003,238 695,217 1,318,023 16 19 14
north Carolina 381,452 223.307 158,145 439,465 251,769 177.697 15 17 12North Dakota
Dhio '
51,466
686.116
48,907
449,622
2,559
236,493
57,910
771,193
54,943
511.821
2,966
259.372
13
12
12
14
16.
IDDirfahoma 185,739 . 160,319 25.421 204,940 176,349 28,593 10 ID 12Dragon 197,282 165,168 32.114 217,144 182,050 35.095 10 10 9Pennsylvania 904950 399,087 514,963 1,024,195 461.521 562,674 13 19 - 9Rhode Island 88,670 36.434 52.236 1100.840 43,651 57,189 14 20 9
South Carolina 131,331 94,143 37,190 152,148 111,379 40,768 16 18 10South 065015 59,043 46,930 12.113 64,363 50,560 13,933 9 8 14Tennessee 269,431 140,881 128,550 302,646 159,911 142,735 12 t4' 13
revs 599,401 426,776 372,625 583,206 493,840 189,367 14 16 IDflab 146,098 98,900 47,198 163,396 112.456 50,941 12 14 8
ferment , 57,429 29,616 . 27,813 63,539 33,351 111 13 iVirginia. 269,978 202,594 67,384 310,112 238,314
3023871,796 15 18 7
Washington 283,410 243,194 40,216 , 328.672 286.332 42,339 16 18 5alert Virginia 107.640 86,579 21,061 116,893 94,027 22,866 9 9 9Wisconsin 408,694 329,572 . 79,122 457.010 370,553 86,457 12 12 9Wyoming. 29,013 29,013 ____ 32993 32,993 ____ 14 34 ..U.S. Seryke Schools 167,620 167.620 . ____ 158.378 158,378 ---- .. -6 -6 --
Outlying areas 85,122 70,956 14,167 97,189 60,012 17.179 14 13 21
Caaal Zone.
937 937 ____ 930 937 0 _-Guam 1,934 1934 2,321 2,321 _ 20 20Puerto Rico 77,903 63,736' liiii 90,564 73,386 17578 16 15 itVirgin Islands 4,348 1,341 ____ 3,366 3,366 ..._ -23 -23 __
NOTE-Because of rounding, detail nay not add to totals.SOURCE: O.S. Department of Ifeafth, Education, and Welfare, Office of Education, "Financial Statistics of Institutions of either Education, Current Funds Revenues andExpenditures,1967.68 and 1968.69 :'
115
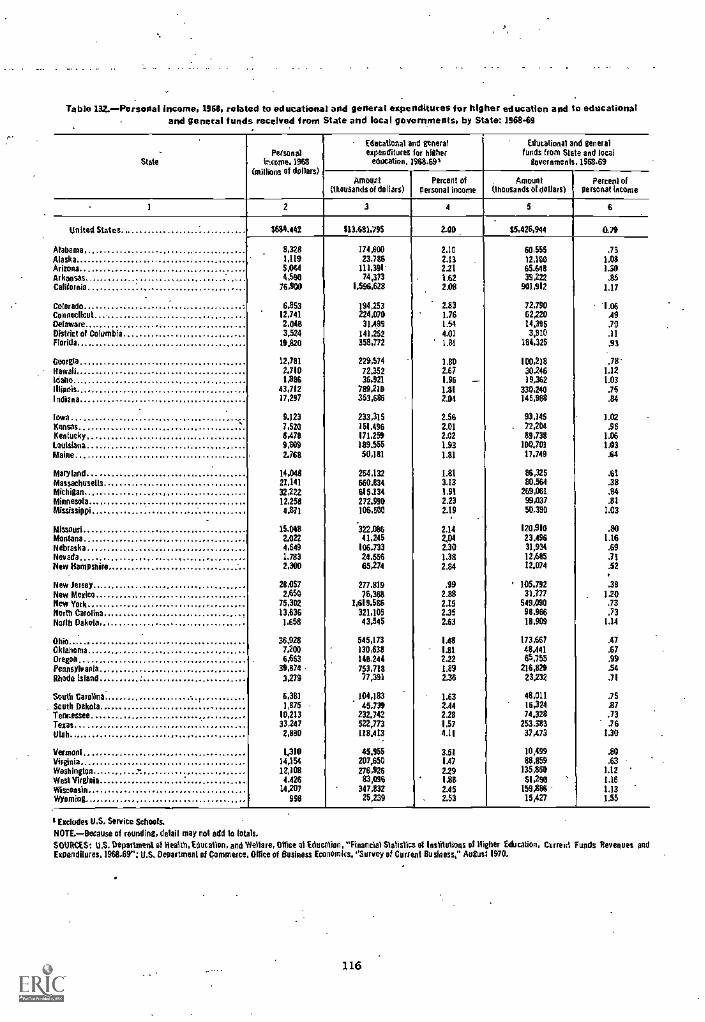
Table 132.-Personal income, 1968, related to educational and general expenditures for higher education and to educationaland general funds received from State and local governments, by State: 196849
StatePersonal
income. 1968(millions of dollars)
Edocational and generalexpenditures for higher
education. 1968291
Educational and generalfunds from State and local
governments. 1968.69
Amount(thousands of dollars)
Percent ofpersonal income
. Amount(thousands of dollars)
Percent ofpersonal income
1 2 3 4 5 6
United States. 1634.442 513.681,795 2.00 55,426,944 0.74
Alabama 8,328 174,600 2.10 60,555 .73Alaska 1,119 23,786 2.13 12,124 1.08Arizona 5,044 111,391- 221 65.648 1.50Arkansas . 4,590 74,373 1.62 39,222 .85California 76,900 1,596,628 2.08 901,912 1.17
Colorado 6.853 194,253 2.83 72,790 '1.06Connecilcut 12,741 224,070 1.76 62,220 .49Delaware 2,048 31,4,99 124 11,395 .70District of Columbia 3,524 141,252 4.01 3,910 .11Florida 19.820 358,772 1.81 184,325 .93
Georgia 12,781 229,574 1.81) 100.218 .78'Hawaii 2.710 72.352 2.67 30,246 132Idaho 1,386 36,921 1.96 - 19,362 1.03Illisois 43,712 789,210 121 330,240 .76Indiana 17,297 353,686 2.04 145,988 .84
IowaKansas
..9.1237,520
233,315151.496
2.562.01
93345. 72,204
1.02.96
Kentucky 8,478 171,254 2.02 89,738 1.06Louisiana 9,809 189.555 1.93 100,703 123Maine 2.768 50,181 1.81 17,749 .64
Maryland 14,048 254.132 1.81 86,325 StMassachusetts 21,141 660.834 3.13 80564 .38Michigan ,.., 32222 615.134 1.91 269,081 .84Minnesota 12,258 272.990 2.23 99,037 .81Mississippi 4,871 106,500 2.19 50,390 1.03
Missousi 15.048 322286 2.14 120,910 .80Montana 2.022 41,245 221 23,496 1.16Nebraska 4,649 106.733 2.30 31,934 .69Nevada 1.783 24,556 1,38 12,685 .71New Hampshire 2,300 65,274 2.84 12.074 .52
New Jersey 28,057 277.819 .99 ' 105.792 .38New Mexico 2,650 76.368 2.88 31)77 1.20New York 75,302 1,619.526 235 549,090 .73North Carolina 13,636 321,105 2.35 98,966 .73North Dakota 1,658 43,345 2.63 18,909 1.14
Ohio 36,928 545,173 1.48 173,667 .47
Oklahoma 7,200 130,638 121 48.441 .67Oregon 6,663 148,244 2.22 66,755 .99Pennories014 39,874 753,718 1.89 216,829 .54Rhode Inland 3.279 77,393 2.36 23,232 .71
South Carolina 6,381 104,183 123 48,011 .75South Dakota 1,875 45.739 2.44 16,324 27Tennessee 10,213 232.742 2.28 74.328 .73Texas 33247 522,773 1.57 253,383 .76Utah , 2,880 118.413 4.11 37,473 1.30
Vermont 1,310 45.955 3.51 10,499 .80Virginia 14,154 207,650 1.47 88,859 .63WashingtonWest Virginia
.. 12,1084,426
276,92683,096
2.29186
135,86051290
1.121.16
VAscoasin 14.207 347,832 2.45 159.386 1.13Wyoming 998 25,239 2.53 15,427 1.55
'Excludes U.S. Service Schools.
NOTE.-Because of rounding, detail may nol add to totals.SOURCES: U.S. Department of Health, Education, and Welfare, Office of Education, "Financial Statistics of inslitutioas of Higher f.dmation, Current Funds Revenues andExpenditures, 1968.69"; U.S. Department of Commerce, OfOce of Business Economics. "Survey of Current Business," August 1970.
116
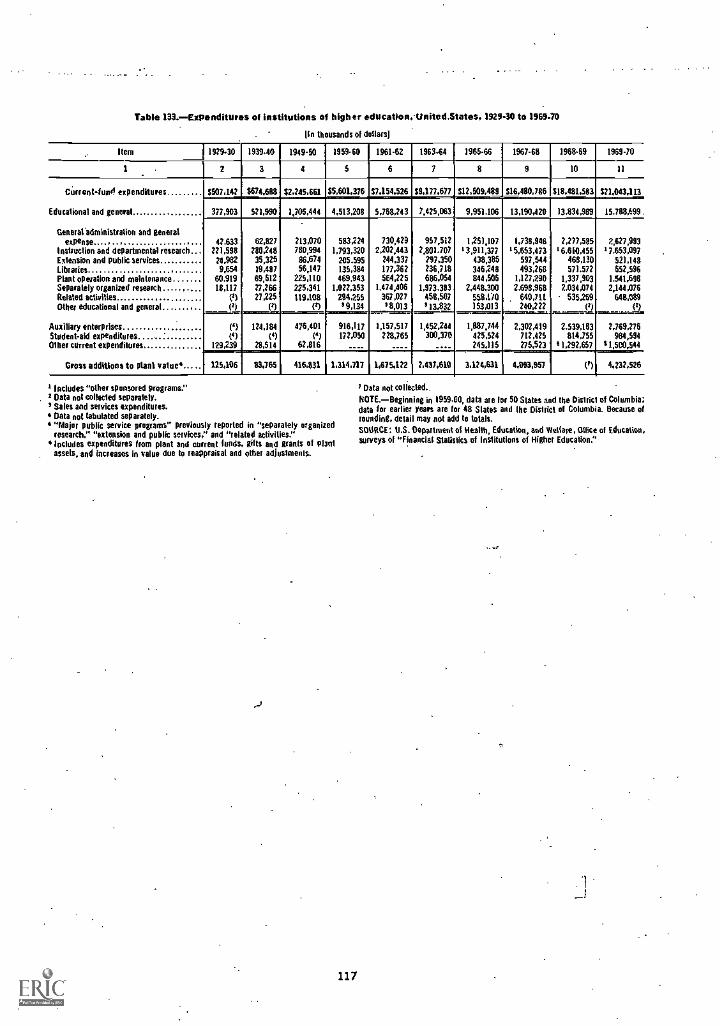
Table 133. Expenditures of institutions of higher education , -Unitell-States, 1929-30 to 1969.70
(in thousands of dollars]
Item 192930 1939.40 1949-50 1959-60 1 1961.62 196344 1965-66 1967-68 196869 1969.70
1 2 3 4 5 6 7 8 9 10 11
CUrrent4unel expenditures 8507,142 5674,688 62,215,661 $5,601,376 $7,154,526 89,177,677 $12,509,489 $16,480,786 518,481,503 121,043,113
Educalional and general 377,903 521.999 1,706,444 4,513.208 5,768,243 7,425,063 9.951.106 13,190,420 13.834,989 15.788,499.
Generaledministration and generalexpense 47.633 62,827 713,070 583,224 730.429 957,512 1,251,107 1,738,946 2,277,585 2.627.993
lastrodion and departmental research... 221,598 280,248 780,994 1,793,320 2,202,443 2,801.707 13.911,377 15,653,473 16,610.455 17,653,097Eslension and public services 24.982 35,325 86,674 205.595 244,337 297,350 438,385 597,544 468,130 521,148Libraries 9,654 19,487 56,147 135.384 177,362 236,718 346,248 493,266 571.572 652,596Plant operation and maintenance 60.919 69,612 225,110 469,943 564,225 686,054 844,586 1,127,290 1,337.903 1.541,638Separately organized research 18,117 27,266 225,341 1,022,353 1.474,406 1,973.383 2,448,300 2.698,968 2,034,074 2,144,076Related activities (2) 27,225 119,108 294,255 367,027 458,507 558,120 640,711 535.269 648,089Other educational and general (1) (1) (1) ' 9,134.,......... ' 8.013 ' 13.832 153,013 240.222 (1) ('7-__-_ _
Auxiliary enterprises (4) 124,184 476,401 916,117 1,157,517 1,452,244 1,887,744 2,302,419 2,539,183 2,769,226Student-aid expenditures (4) (9 (1) 177 ,050 728,765 300,370 425,524 712,425 814,755 984,594Other current expenditures 129,239 28.514 62,816 ____ ____ .... 245,115 275,523 11.292,657 51,500,544
Gross additions to plant Value 125,106 83,765 416,831 1,314,717 1,675,122 2,437,610 3,124,631 4,095,957 V/ 4,232,526
1 Includes "other sponsored programs."2 Data not collecled separately.' Sales and services expenditures.
Data not tabulated separately."Major public service Ingram" previously reported in "separately organizedresearch," "extension and public services;' and "related activities:'Includes expenditures from plant and current funds, gifts and grants of OMassets, and increases in value due to reappraisal and other adjustments.
117
Data not collected..
NOTE.-Beginning in 1959.60, data are for 50 States and the Dislricl of Columbia;data for earlier years are for 48 Slates and the District of Columbia. Because ofrounding, detail may not add to totals.
SOURCE: U.S. Department of Health. Education, and Metier', Office of Education,surveys of "Financial Slatislics of Institutions of Higher Educalion!'
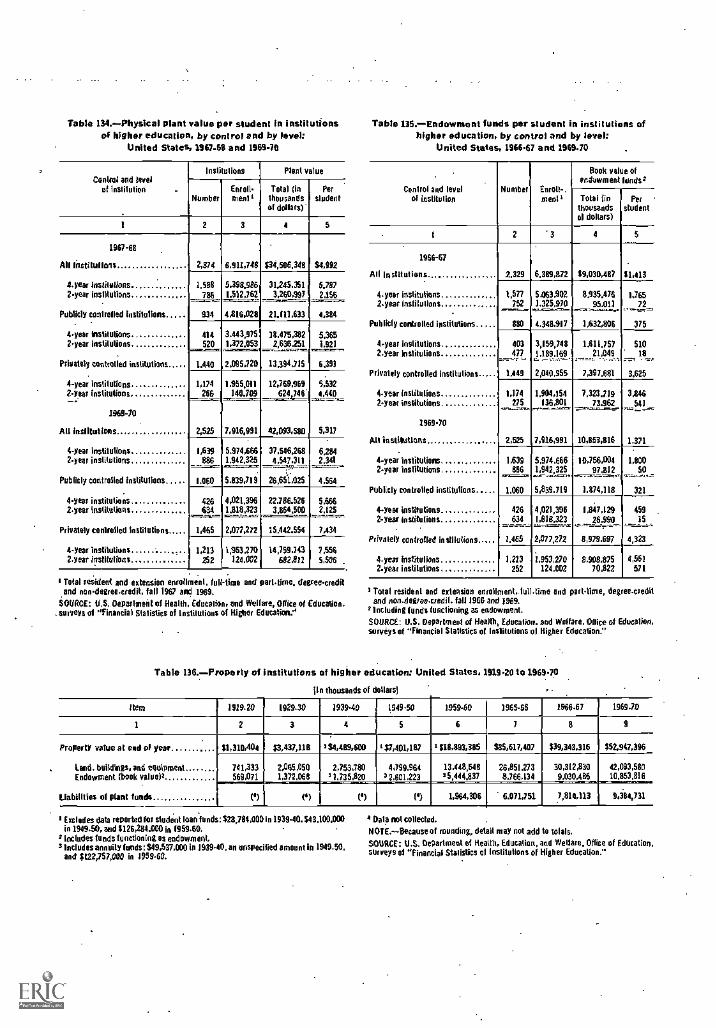
Table 134. Physical plant value per student in institutionsof higher education, by control and by level:
United States. 1967-68 and 1969-70
Central and levelof Institution
InstitutiOns Plant value
NumberEnroll-meal'
Total (inthousandsof dollars).
Perstudent
1 2 3 5
1967-68
All lestiful(ons 2,374 6,911,748 $34,586,348 34,992
1 -year instilnlions 1,588 5.393.986 31245.351 5.7872-year institutions 786 I.512,762 3,260,997 2.156
Publicly controlled institutions 934 4,816,028 21.111,633 4,384
4-year institutions 414 3.443,975 18.415,382 5.3652-year institutions 520 2,636,251 1,921
Privately controlled institutions 1.440
.1.372.053
2.095,720 13394.115 6,393
4-year institutions 1,174 1155,011 12,769,969 5,5322-year institutions 266 140.749 624 746' 1,440
1969-70
All institutions 2,525 7,916,991 42,093,580 6,317
4-year institutions 1.639 5.974,666 37,546268 62842-year institutions 886 1,942.325 4,547,311 2,341_
Publicly controlled institutions 1.060 5,839,719 26,651,025 4.564
4-year institutions 426 4,021,396 22,786.526 5.6662-year institutions 634 1.818,323 3.864,500 2425
Privately controlled institutions 1,465 2,077,272 15,442.554 1,434
4-year institutions 1,213 1,953.270 14,759,343 7,5592-year institutions 252 124,002 602,812 5,506
I Total resident and extension enrollment, ful -dine and part-time, degree-creditand non-degree-credit, fall 1967 and 1969.
SOURCE: U.S. Department of Health, Education, and Welfare, Office of Education..surveys of "financial Statistics of Institutions of Higher Education."
Table 135.Endowntent funds per student in institutions ofhigher education, by control and by level:
United States, 1966.67 and 1969-70
.
Control and levelof institution
Number Enron-.meal
Book value ofeeduroment lends 2
Total {inthousandsof dollars)
Perstudent
t 2 '3 4 5
1966-67
All institutions 2,329 6,319,872 $9,030,487 11,413
4 -year institutions 0,577 5$163.902 8935.476 1.7652-year institutions 752 3.325,970 95.011 72
Publicly controlled institutions 880 4.348.917 1632,806 375
4-year institutions 403 3,159,743 1.411,751 5102-year Institutions 477 1,189.169 21,045 18
Privately controlled institutions 1,149 2,040,955 7,397,681 3,625
4-year institutions 1,174 1.904,154 7.323.719 3.8462-year institutions 275 136,801 73.962
. .". U...7 I ITY, -,=1.=urme. 7...,x7z.in..1., 7.1541.....",
1969.10
Ail institutions 2,525 7,916,991 10,853,816 1.371
4-year institutions 1,639 5,974.666 10,756.004 1,8002-year institutions. 836 1,942,325 97.812 50
PUblicly controlled institutions 1.060 5,839,719 1,874,118 321
4-year institutions 426 4,021,396 1,847,129 4592-year institutions 634.,:._..-. 1,818.323...._........... 26.990--.....-aar.,,-. 15. -__,..
Privately controlled instilutions 7,4E5 2,077,272 8,979.697 4,323
4-year Institutions 1,273 1,953,270 8,908,875 4,5612-year institutions 252 124,002 70,822 571
3 Total resident and extension enrollment, tall -time and part-time, degree-creditand eon-degree-credil. fall 1966 and 1969.
r Including funds functioning as endowment.
SOURCE: U.S. Department of Health, Education, and Welfare, 011ice of Education,surveys of "Financial Statistics of Institutions of Higher Edocation."
Table 136.Property of institutions of higher education: United States, 1919-20 to 1969.70
lin thousands of dollars)
Item 1979-20 1929.30 1939-40 1949.50 1959-60 1965-66 1966.67 1969.70
1 2 3 4 5 6 7 8 9
Property value at end of year
land, buildings, and equipmentEndowment (book value)l
liabilities of plant funds
31,310,401 13,437,116 134,489,600 ' $7,401,137 , 318.893,385 335,617,407 339,343,316 ;52,947,396
741,333569,071
2,065,0501,372,068
2,753,780' 1,735,820
4,199,96432.601,223
13.448,54835,444,837
26.851.2738,766,134
30,312,8309,030,486_,
42,093,58010,853,816
(') 4') (') ('7 1,964,306 6.011,751 1,810,113 9,381,131
1 Excludes data reported for student loan funds: $28,784,000 in 1939-40.343, 00,000in 1949-50, and 1126,284.000 in 1959-60.
r Includes funds functioning as endowment.3 Includes annuity funds : 349,537.000 in 1939-40, an unspecified amount in 1949-50,
and U22,757,000 in 1959-60.
Data not collected.
NOTE. Because of rounding, detail may not add to tolals.
SOURCE: U.S. Department of Health, Education, and Welfare. Of of Education,surveys of "Financial Statistics of Institutions of Higher Education. "
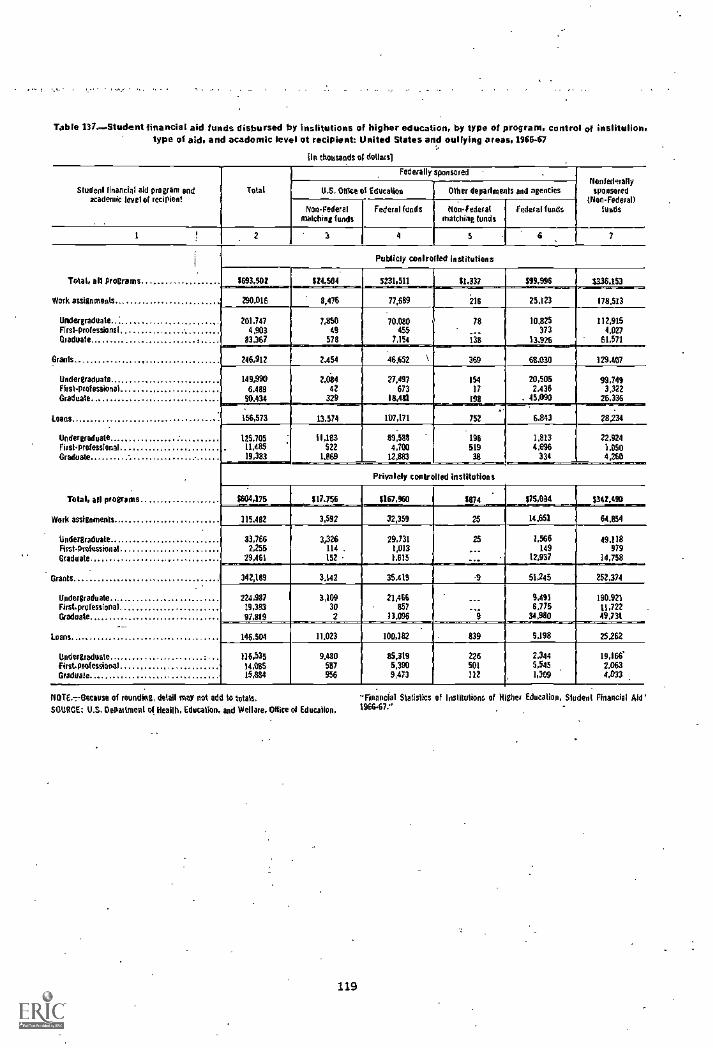
Table 137.--Student financial aid funds disbursed by institutions of higher education, by type of program, control of institution,type of aid, and academic level of recipient: United States and outlying areas, 1966-67
{la thousands of dollarsl
Student financial aid program andacademic level of recipient
Total
Federally sponsoredNoniedmallysponsored
(Non-Federal)!yids
1.1.S. Ohio of Education Other deparlmento and agencies
Non-Federalmatching funds
Federal fends Non - Federate
matching tundsFederal funds
1 2 I 4 5
Publicly controlled institutions
Total, all programs $693,502 $24,504 5231,511 $1,337 559,996 5336,153
Work assignments 290,016 8,476 77,689 216 25,123 178,513
Undergraduate. 201,747 7,850 70,030 78 10,825 112,915First-professional 4,903 49 455 373 4,027Graduate 83,367 578 7,154 138 13,926 61,571
Graph 246.912 2.454 46,652 369 68.030 129.407
Undergraduate 149,990 2,084 27,497 154 20,505 99,749First-professional 6.489 42 673 17 2,436 3,322Graduate 90.434 329 18,481 198 45,099 26.336
Loans 156,573 13.574 167,171 752 6,843 28,234
Undergraduate 125.705 11,183 89,588 196 1,813 22,924First-professional 11.485 522 4,700 519 4,996 1.050Graduate 19,383 1.869 12,883 38 334 4,260
Privately controlled institutions
Total, all programs 5604475 $17.756 $167,160 $874 $15,034 $342,490
Work assignments 115.482 3,592 32,359 25 14,651 64.854
Undergraduate 33,766 3.326 29,731 25 1,566 49.118First- professional 2,255 114 . 1,013 149 979Graduate 29,461 152 1.615 12,937 14,758
Grants 342,159 3.142 35.419 51,245 252,374
Undergraduate. 224,987 3,109 21,466 9,491 190.921Firstprofessional 19,383 30 851 6.775 11,722Graduate 97,819 2 13.096 34,980 49,731
Loans 146,504 11.023 100.182 839 9,198 25262
Undergraduate 116,535 9.480 85,319 226 2,344 19,166*First-professional 14,955 587 5,390 501 5,545 2.063Graduate 15,884 956 9,473 122 1,309 4,033
NOTE.7-13ecayse of rounding, detail may not add to totals.
SOURCE: U.S. Department of Health, Education, and Wellare, OlOce of Education,
119
Financial Statiolics of Inslitutions of Higher Education, Sludent Financial Aid196647."

Table M Selected data for landerant institutions onstudents and finances: United States and outlying areas,
196041 and 1970-71,
Item 196041 1970-71
1 2 3
Opening Hall) enrollment:Total enrollment '745,698 I 1,461,217First-time enrollment 1139.106 258.451
Regular Federal appropriations 592,653,030 9214,003,234
Funds for instruction and lacilities (Morrill-nelson and8ankheadJones Funds) 5,451400 12,680,030
Fonds for research (experiment stations} 30,653,094 63,481,117
Hatch funds, as amended 30,165,023 57,711,590Reseals% under Agricultural filarkthng Act 451.071 5365.527
Funds for cooperative extension 56,748,436 137,842.117
Smith-Lever funds (AM of 1914, es amended) 56,265,982 135,052,547Extension under Agricultural Marketing Act 1.482.454 2.789,570
Endowment Income under land-grant funds 4313,303 8,709,623
From 1862 land-grant tondo 2,747,103 6,354,663From other Federal land-grant funds 1,365,500 3.344.960
Resident and extension, degree-creditenrollment.Resident and extension, degree-credit and non-degree-medlt, opening fallenrollment.
A Resident, degree-credit, first -term enrollment.
SOURCE: U.S. Department of Health. Education, and Welfare, Office of Education."Statistics of Landrant Colleges and Universities, Year Ended lone 30. MU";"fall Enrollment in Higher Education.1970"; and "Statistics on Condition of Land.Grant Funds, 1971 Report."
and non-degree-croft, lint-term
120

Chapter IVFederal Programs for Education and Related Activities*
Federal land grants provided under the North.west Ordinance of 1787 represent the first instanceof U.S. Government financial assistance for educaLion. With this enactment, the National Governmentembarked upon a program of educational supportunique among national governments in its commitment to Stale and local autonomy and in the re-sponsiiblity it assumed for a public function ofnational interest.
A variety of programs and procedures are usedby the Federal Government to support numerouseducational activities. Procedures include grants ofland, financial grants and loans, allocation of sur-plus commodities and federally owned property.operation of special programs and institutions, andthe cost of services or contracts. This highly com-plex Federal educational involvement affects, di-rectly or indirectly, every person in this countryand many persons from other countries. Programsmay be for the purchase of research and trainingservices in educational institutions; for support ofindividuals for whom there is a special Federalresponsibility; for support of schools in areas whereFederal activities would result in undue burdenson school services without such support; for sup-port of vocational education, foreign languagestudy, and similar special areas: or for numerousother purposes.
A capsule view of the history of Federal educa-tional activities is provided in the following list ofselected Federal educational legislation:
Year Program1787 Northwest Ordinanceauthorized land grants
for the establishment of educational insti-tutions.
1862 First M,rrill Actauthorized public land grantsto the States for the establishment andmaintenance of agricultural and mechanicalcolleges.
Albert R. hkunSe of the Reference, EaturnateS, and PropectuonsBranch, Natponal Center for Educatuonal Stabstms, had themajor responstbdity for the development of data for thuschapter.
121
1867 Department of Education Actauthorized theestablishment of the Office of Education.
1874 Aid to State nautical schoolsprovided fundsfor State nautical schools.
1890 Second Morrill Actprovided for money grantsfor support of instruction in the agricul-tural and mechanical colleges.
1917 StinthHughes Actprovided for grants toStates for support of vocational education.
1918 Vocational Rehabilitation Actauthorized fundsfor rehabilitation of World War I veterans.
1919 Federal surplus property -- authorized use ofFederal surplus property by educational in-stitutions.
1920 Smith-13ankhead Actauthorized grants toStates for vocational rehabilitation pro.grains.
1933 School lunch programsprovided assistance inschool lunch programs. The use of surplusfarm commodities in school lunch programsbegan in 1936 and the National SchoolLunch Act of 1946 continued and expandedthis assistance.
1935 BankheadJones Actmade grants to Statesfor agricultural experiment stations.
1937 National Cancer Institute ActestablishedPublic Health Service Fellowship program.Subsequently, fellowships were authorizedin legislation concerning other agencies.
1940 School Milk Programprovided funds for costof milk served to school children.
1941 Amendment to Lanham Act of 1940authorized Federal aid for construction, maintenance, and operation of schools .n federallyimpacted areas. Such assistance was continued under Public Laws 815 and 874,81st Congress, in 1950.
1943 Vocational Rehabilitation Actprovided assist,ante to disabled veterans.
School Lunch Indemnity Planprovided fundsfor local school lunch food purchases.
1944 Servicemen's Readjustment Actprovided as-sistance for education of veterans.
Surplus Property Actauthorized transfer ofsurplus property to educational institutions.
1946 George Barden Actexpanded Federal supportof vocational education.
1948 United States Information and Educational Ex.change Actprovided for the interchangeof persons, knowledge. and skills betweenthe United States and other countries.
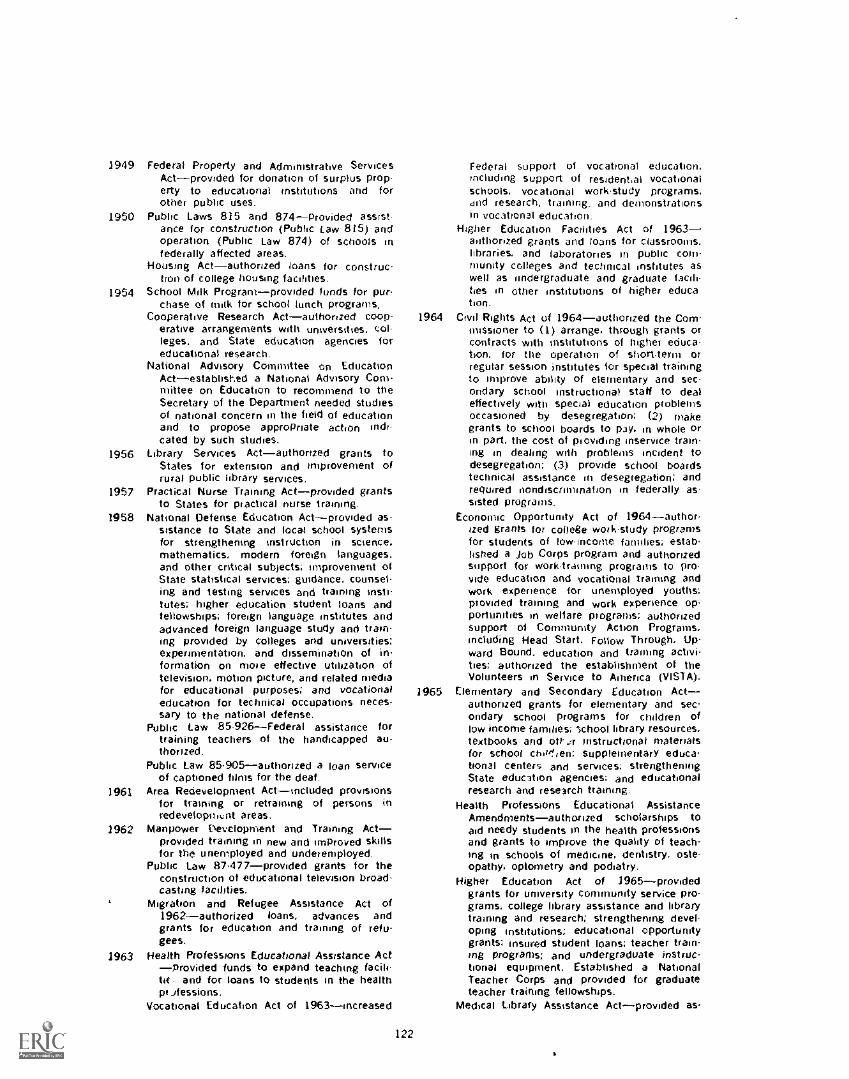
3949 Federal Property and Administrative ServicesActprovided for donation of surplus prop-erty to educational institutions and forother public uses.
1950 Public Laws 815 and 874provided assist-ance for construction (Public Law 815) andoperation (Public Law 874) of schools infederally affected areas.
Housing Act authorized loans for construc.ton of college housing facilities.
1954 School Milk Programprovided funds for pur-chase of milk for school lunch programs.
Cooperative Research Actauthorized coop-erative arrangements with universities, col-leges, and State education agencies foreducational research.
National Advisory Committee on EducationActestablished a National Advisory Com-mittee on Education to recommend to theSecretary of the Department needed studiesof national concern in the field of educationand to propose appropriate action indi-cated by such studies.
1956 Library Services Act authorized grants toStates for extension and improvement ofrural public library services.
1957 Practical Nurse Training Actprovided grantsto States for practical nurse training.
1958 National Defense Education Actprovided as-sistance to State and local school systemsfor strengthening instruction in science.mathematics, modern foreign languages,and other critical subjects; improvement ofState statistical services; guidance, counseling and testing services and training instilutes; higher education student loans andfellowships; foreign language institutes andadvanced foreign language study and training provided by colleges and universities:experimentation, and dissemination of in.formation on more effective utilization oftelevision, motion picture, and related mediafor educational purposes: and vocationaleducation for technical occupations neces-sary to the national defense.
Public Law 85-926--Federal assistance fortraining teachers of the handicapped au-thorized.
Public Law 85.905authorized a loan serviceof captioned films for the deaf.
1961 Area Redevelopment Actincluded provisionsfor training or retraining of persons inredevelopm,nt areas.
1962 Manpower evelopment and Training Actprovided training in new and improved skillsfor the unemployed and underemployed.
Public Law 87.477provided grants for theconstruction of educational television broadcasting facilities.
Migration and Refugee Assistance Act of1962authorized loans, advances andgrants for education and training of refu-gees.
1963 Health Professions Educational Assistance Actprovided funds to expand teaching facili-tit. and for loans to students in the healthpi Jfessions.
Vocational Education Act of 1963increased
122
Federal support of vocational education,including support of residential vocationalschools, vocational work-study programs.and research, training, and demonstrationsin vocational education.
Higher Education Facilities Act of 1963authorized grants and loans for classrooms.libraries, and laboratories in public COPtltriunity colleges and technical institutes aswell as undergraduate and graduate facili-ties in other institutions of higher educahon.
1964 Civil Rights Act of 1964authorized the Cornmissioner to (1) arrange, through grants orcontracts with institutions of higher eciuca.bon. for the operation of short-term orregular session institutes for special trainingto improve ability of elementary and sec.ondary school instructional staff to dealeffectively with special education problemsoccasioned by desegregation; (2) makegrants to school boards to pay. in whole orin part, the cost of providing inservice train-ing in dealing with problems incident todesegregation; (3) provide school boardstechnical assistance in desegregation; andrequired nondiscrimination in federally as-sisted programs.
Economic Opportunity Act of 1964author-ized grants for college work-study programsfor students of low-income families; estab,lisped a Job Corps program and authorizedsupport for worktratning programs to pro-vide education and vocational training andwork experience for unemployed youths:provided training and work experience opportundies in welfare programs; authorizedsupport of Community Action Programs,including Head Start, Follow Through, Up.ward Bound, education and training activities: authorized the establishment of theVolunteers in Service to America (VISTA).
1965 Elementary and Secondary Education Actauthorized grants for elementary and secondary school programs for children oflow income families: school library resources,textbooks and off Jr instructional materialsfor school charfien; supplementary educatronal centers and services; strengtheningState education agencies: and educationalresearch and research training.
Health Professions Educational AssistanceAmendmentsauthorized scholarships toaid needy students in the health professionsand grants to improve the quality of teachmg in schools of medicine, dentistry, oste-opathy, optometry and podiatry.
Higher Education Act of 1965providedgrants for university community service programs, college library assistance and librarytraining and research: strengthening devel,opmg institutions; educational opportunitygrants; insured student loans; teacher training programs: and undergraduate instructional equipment. Established a NationalTeacher Corps and provided for graduateteacher training fellowships.
Medical Library Assistance Actprovided as.
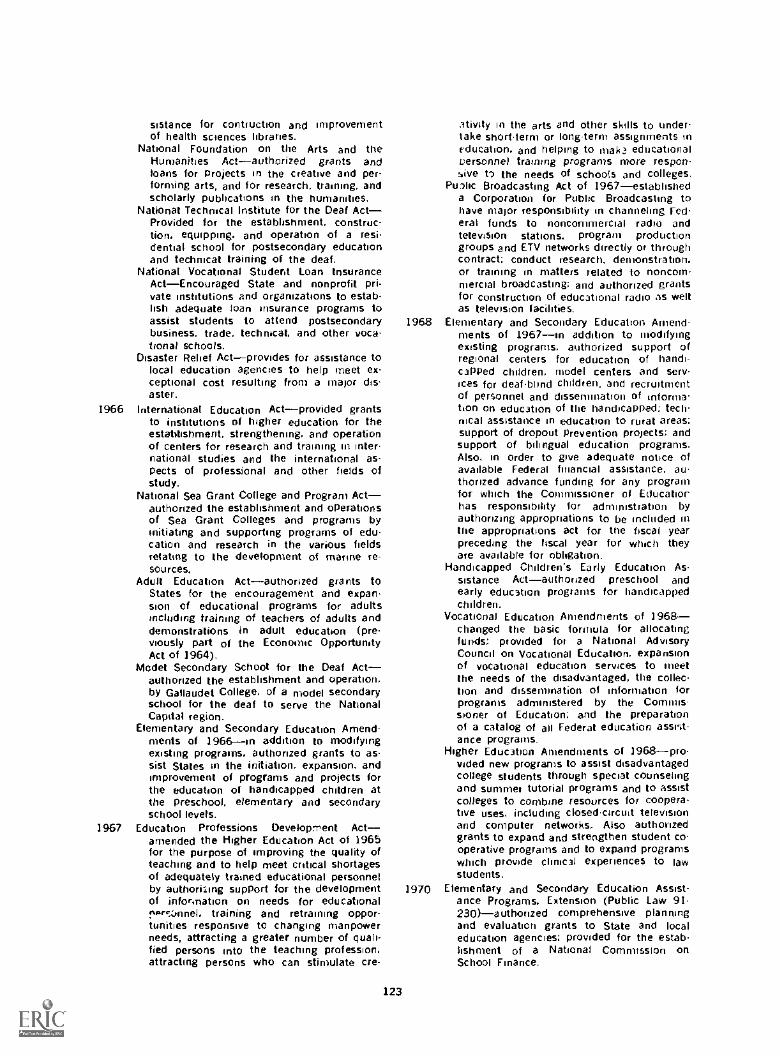
sistance for contraction and improvementof health sciences libraries.
National Foundation on the Arts and theHumanities Actauthorized grants andloans for projects in the creative and per-forming arts, and for research, training, andscholarly publications in the humanities.
National Technical Institute for the Deaf ActProvided for the establishment, construc-tion. equipping. and operation of a residential school for postsecondary educationand technical training of the deaf,
National Vocational Student Loan InsuranceActEncouraged State and nonprofit pri-vate institutions and organizations to estab-lish adequate loan insurance programs toassist students to attend postsecondarybusiness, trade, technical, and other voca-tional schools.
Disaster Relief Actprovides for assistance tolocal education agencies to help meet ex-ceptional cost resulting from a major disaster.
1966 International Education Actprovided grantsto institutions of higher education for theestablishment, strengthening, and operationof centers for research and training in inter,national studies and the international as-pects of professional and other fields ofstudy.
National Sea Grant College and Program Actauthorized the establishment and operationsof Sea Grant Colleges and programs byinitiating and supporting programs of education and research in the various fieldsrelating to the development of marine re-sources.
Adult Education Actauthorized grants toStates for the encouragement and expansion of educational programs for adultsincluding training of teachers of adults anddemonstrations in adult education (pre.viously part of the Economsc OpportunityAct of 1964).
Model Secondary School for the Deaf Actauthorized the establishment and operation,by Gallaudet College, of a model secondaryschool for the deaf to serve the NationalCapital region.
Elementary and Secondary Education Amendments of 1966in addition to modifyingexisting programs. authorized grants to assist States in the initiation, expansion, andimprovement of programs and projects forthe education of handicapped children atthe preschool, elementary and secondaryschool levels.
1967 Education Professions Develocerent Actamended the Higher Education Act of 1965for the purpose of improving the quality ofteaching and to help meet erotical shortagesof adequately trained educational personnelby authorizing support for the developmentof information on needs for educationaloerr.:.innel. training and retraining oppor-tunities responsive to changing manpowerneeds, attracting a greater number of quali-fied persons into the teaching profession.attracting persons who can stimulate cre-
123
ativity in the arts and other skills to under-take shOrt-term or long-term assignments ineducation. and helping to mak.! educationaloersonne/ training programs more responsive to the needs of schools and colleges.
Piro lic Broadcasting Act of 1967establisheda Corporation for Public Broadcasting tohave major responsibility in channeling rederal funds to noncommercial radio andtelevision stations. program productiongroups and ETV networks directly or throughcontract; conduct research, demonstration.or training in matters related to noncom-mercial broadcasting; and authorized grantsfor construction of educational radio as wellas television facilities.
1968 Elementary and Secondary Education Amendments of 1967in addition to modifyingexisting programs, authorized support ofregional centers for education of handl-caPped children. model centers and services for deafbiond children, and recruitmentof personnel and dissemination of informaLion on education of the handicapped; technical assistance in education to rural areas;support of dropout Prevention projects; andsupport of bilingual education programs.Also, in order to give adequate notice ofavailable Federal financial assistance. authorized advance funding for any programfor which the Commissioner of Educatiorhas responsibility for administration byauthorizing appropriations to be included intne appropriations act for the fiscal yearpreceding the fiscal year for which theyare available for obligation.
Handicapped Children's Early Education Assistance Actauthorized preschool andearly education programs for handicappedchildren.
Vocational Education Amendments of 1968changed the basic formula for allocatingfunds; provided for a National AdvisoryCouncil on Vocational Education, expansionof vocational education services to meetthe needs of the disadvantaged, the collecLion and dissemination of information forprograms administered by the Commis-sioner of Education; and the preparationof a catalog of all Federal education assed-ante programs.
Higher Education Amendments of 1968provided new programs to assist disadvantagedcollege students through special counselingand summer tutorial programs and to assistcolleges to combine resources for coopera-tive uses, including closed-circuit televisionand computer networks. Also authorizedgrants to expand and strengthen student cooperative programs and to expand programswhich provide clinical experiences to lawstudents,
1970 Elementary and Secondary Education Assist-ance Programs. Extension (Public Law 91.230) authorized comprehensive planningand evaluation grants to State and localeducation agencies; provided for the establishrnent of a National Commission onSchool Finance.
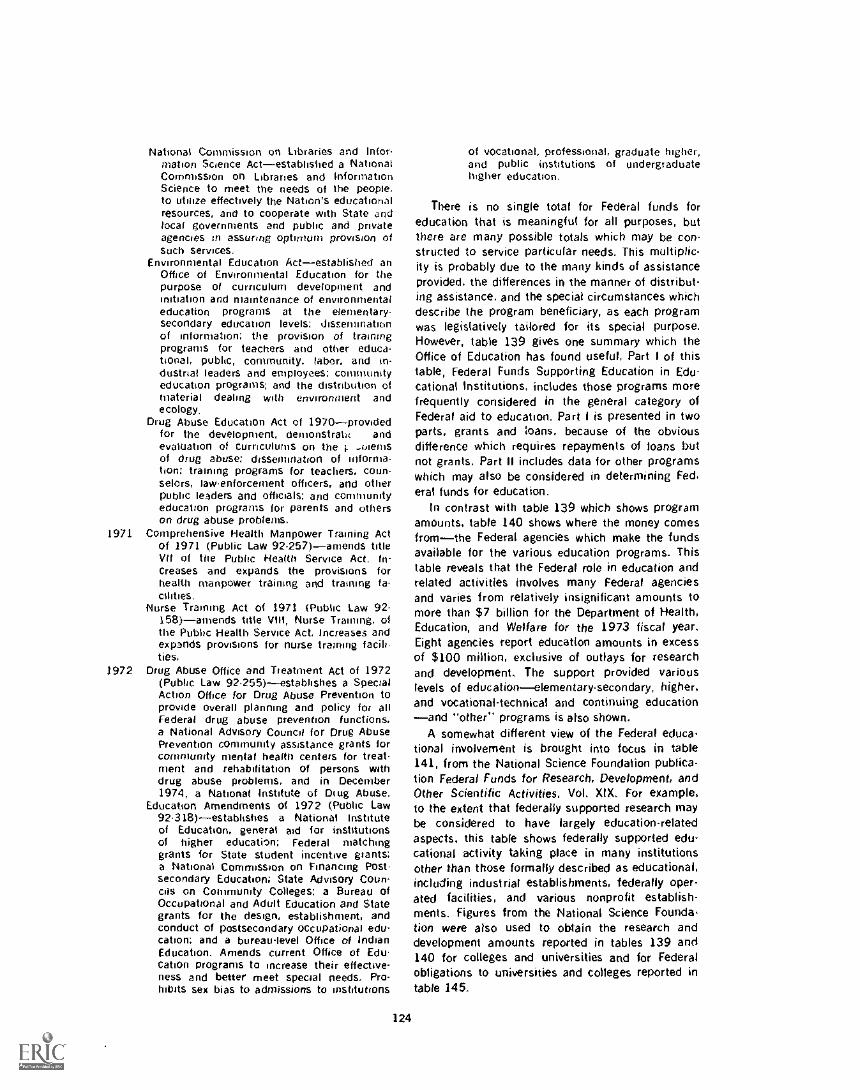
National Commission on Libraries and Infos';nation Science Actestablished a NationalCommission on Libraries and InformationScience to meet the needs of the people,to utilize effectively the Nation's educationalresources, and to cooperate with State andlocal governments and public and privateagencies in assuring optimum provision ofsuch services.
Environmental Education Actestablished anOffice of Environmental Education for thepurpose of curriculum development andinitiation and maintenance of environmentaleducation programs at the elementary-secondary education levels; disseminationof information; the provision of trainingprograms for teachers and other educational, public, community, labor, and in-dustrial leaders and employees: communityeducation programs; and the distribution ofmaterial dealing with environment andecology,
Drug Abuse Education Act of 1970providedfor the development, demonstratu andevaluation of curriculums on the i. -oienisof drug abuse; dissemination of itiformation: training programs for teachers, coun-selors, law enforcement officers, and otherpublic leaders and officials; and communityeducation programs for parents and otherson drug abuse problems.
1971 Comprehensive Health Manpower Training Actof 1971 (Public Law 92. 257)amends titleVit of the Public Health Service Act. In-Creases and expands the provisions forhealth manpower training and training fa-cilities.
Nurse Training Act of 1971 (Public Law 92-158) amends title VIII, Nurse Training, ofthe Public Health Service Act, increases andexpands provisions for nurse training Wilt.ties.
1972 Drug Abuse Office and Treatment Act of 1972(Public Law 92.255)establishes a SpecialAction Office for Drug Abuse Prevention toprovide overall planning and policy for allFederal drug abuse prevention functions,a National Advisory Council for Drug AbusePrevention community assistance grants forcommunity mental health centers for treatment and rehabilitation of persons withdrug abuse problems, and in December1974, a National Institute of Drug Abuse.
Education Amendments of 1972 (Public Law92.318)establishes a National Instituteof Education, general aid for institutionsof higher education; Federal matchinggrants for State student incentive grants;a National Commission on Financing Postsecondary Education; State Advisory Coun-cils on Community Colleges; a Bureau ofOccupational and Adult Education and Stategrants for the design, establishment, andconduct of postsecondary oCcupational edu-cation; and a bureau-level Office of IndianEducation. Amends current Office of Edu.cation programs to increase their effective-ness and better meet special needs. Pro-hibits sex bias to admissions to institutions
124
of vocational, professional, graduate higher,and public institutions of undergraduatehigher education,
There is no single total for Federal funds foreducation that is meaningful for all purposes, butthere are many possible totals which may be con-structed to service particular needs. This multiplic-ity is probably due to the many kinds of assistanceprovided, the differences in the manner of distribut-ing assistance, and the special circumstances whichdescribe the program beneficiary, as each programwas legislatively tailored for its special purpose.However, table 139 gives one summary which theOffice of Education has found useful, Part I of thistable, Federal Funds Supporting Education in Edu-cational Institutions, includes those programs morefrequently considered in the general category ofFederal aid to education. Part I is presented in twoparts, grants and loans, because of the obviousdifference which requires repayments of loans butnot grants. Part II includes data for other programswhich may also be considered in determining Fed.era! funds for education.
In contrast with table 139 which shows programamounts, table 140 shows where the money comesfromthe Federal agencies which make the fundsavailable for the various education programs. Thistable reveals that the Federal role in education andrelated activities involves many Federal agenciesand varies from relatively insignificant amounts tomore than $7 billion for the Department of Health,Education, and Welfare for the 197.3 fiscal year.Eight agencies report education amounts in excessof $100 million, exclusive of outlays for researchand development. The support provided variouslevels of educationelementary-secondary, higher,and vocational-technical and continuing educationand "other" programs is also shown.
A somewhat different view of the Federal educa-tional involvement is brought into focus in table141, from the National Science Foundation publica-tion Federal Funds for Research, Development, andOther Scientific Activities, Vol. XIX. For example,to the extent that federally supported research maybe considered to have largely education-relatedaspects, this table shows federally supported edu-cational activity taking place in many institutionsother than those formally described as educational,including industrial establishments, federally oper-ated facilities, and various nonprofit establish-ments. Figures from the National Science FoundaLion were also used to obtain the research anddevelopment amounts reported in tables 139 and140 for colleges and universities and for Federalobligations to universities and colleges reported intable 145.
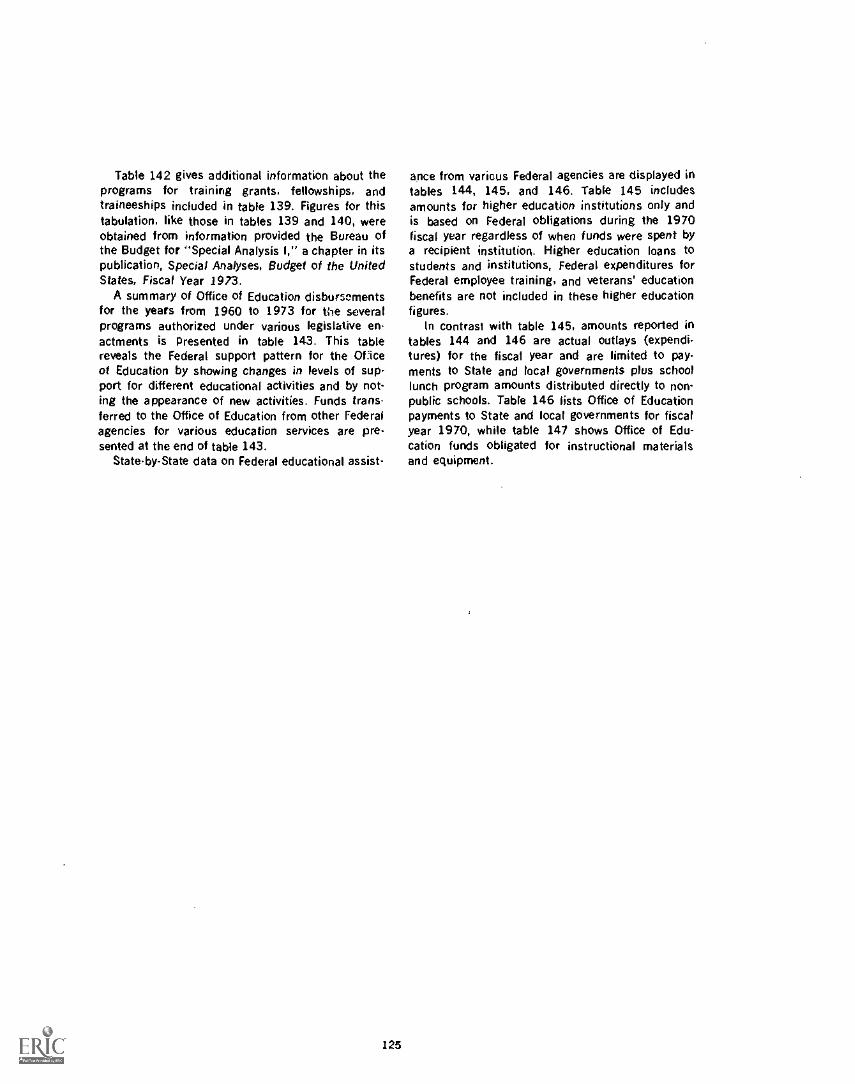
Table 142 gives additional information about theprograms for training grants, fellowships, andtraineeships included in table 139. Figures for thistabulation, like those in tables 139 and 140, wereobtained from information provided the Bureau ofthe Budget for "Special Analysis I," a chapter in itspublication, Special Analyses, Budget of the UnitedStates, Fiscal Year 1973.
A summary of Office of Education disbursementsfor the years from 1960 to 1973 for the severalprograms authorized under various legislative en.actments is Presented in table 143. This tablereveals the Federal support pattern for the Of:iceof Education by showing changes in levels of sup-port for different educational activities and by not-ing the appearance of new activities. Funds trans.ferred to the Office of Education from other Federalagencies for various education services are pre-sented at the end of table 143.
State.by-State data on Federal educational assist-
125
ante from various Federal agencies are displayed intables 144, 145, and 146. Table 145 includesamounts for higher education institutions only andis based on Federal obligations during the 1970fiscal year regardless of when funds were spent bya recipient institution. Higher education loans tostudents and institutions, Federal expenditures forFederal employee training, and veterans' educationbenefits are not included in these higher educationfigures.
In contrast with table 145, amounts reported intables 144 and 146 are actual outlays (expendi-tures) for the fiscal year and are limited to pay-ments to State and local governments plus schoollunch program amounts distributed directly to non-public schools. Table 146 lists Office of Educationpayments to State and local governments for fiscalyear 1970, while table 147 shows Office of Edu-cation funds obligated for instructional materialsand equipment.
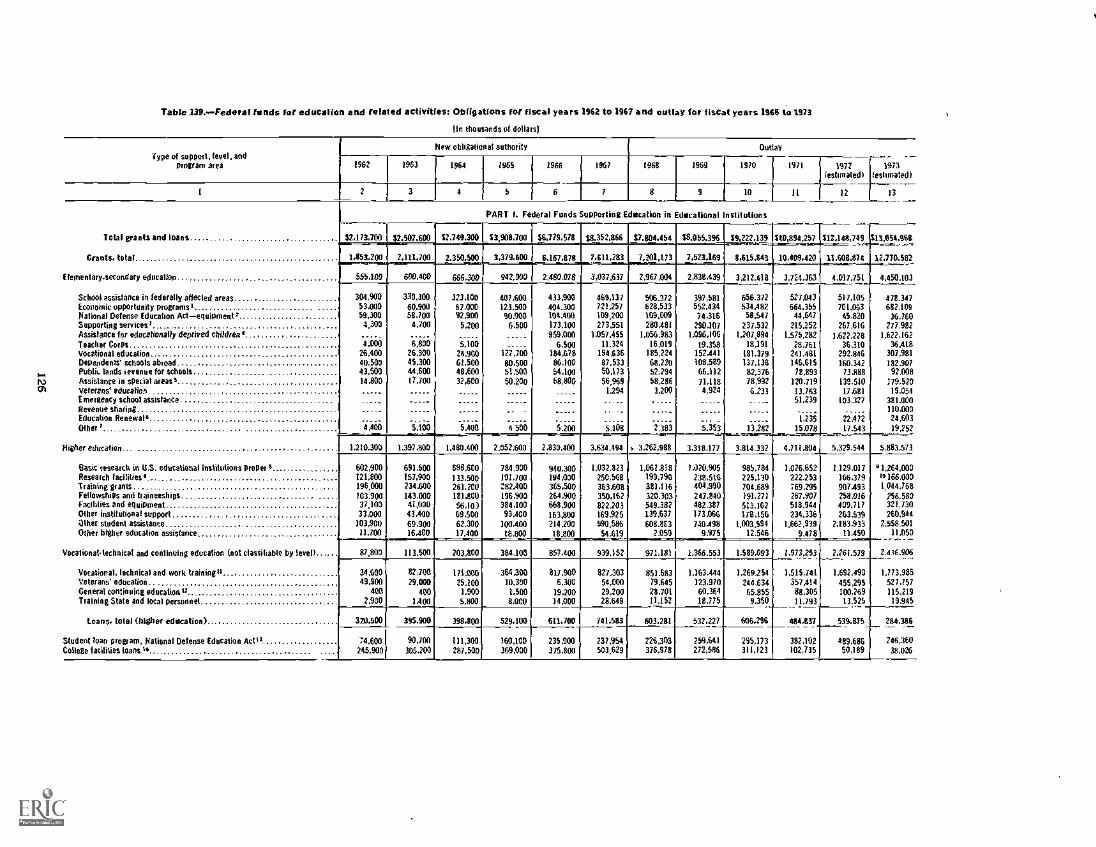
Table 139..Federal funds for education and related activities: Obligations For Fiscal years 1962 to 1967 and outlay for fiscal years 19613 to 1473
(In thousands of dollars)
Type of support, tevel, andprogram area
1
Total grants and loans
Grants, total
Elementary-secondary education
School assistance in federally allecled areasEconomic opportunity programs'National Defense Education Actequipment 2Supporting services 3
Assistance for educationally deprived childrea'Teacher CorpsVocational educationDependents' schools abroadPublic lands revenue for schoolsAssistance in special areas'Veterans' educationEmergency school assistanceRevenue sharingEducation Renewal'Olher
Nigher education
Basic research in U.S. educational institutions proper 4Research facilities 4
Training grantsFellowships and traineeshipsFaciklies and equipmentOlher institutional supportallter student assistanceOther higher education assistance
Vocalionat-technicl and continuing education (not classihable by level)
Vocational. lechnical and work training"Veterans educationGeneral continuing education 32
Training State and local personnel
Loans, total (higher education)
Student loan program. National Defense Education Act"College facilities Warps 14
1962 1963
New obligationat authority
1964 1966 1967 t968
Out ay
1970 1971
2 3 4 5 6 8 9 10 11
92,173,700 92.507.600
1,853.200
555,180
2,111,700
304,90053.00059,3004,300
4.00026.40040.50043,50014,800
330.30060.90058,7004,700
6,80026.30045.30044.60017,700
92,749,300
2350.500
666,300
323.10067,00092.900
5,200
5.10024.90061.50048,60032,600
PART 1. Federal Funds Supporting Education in Educational nstitutions
93,908,700
3,379,600
942.900
407,600123.50090.900
6,500
127,70080.50051,50050,200
56,779,578 98.352,866
6,167,878
2,480.078
433,900404.300104,400173.100959,000
6,500184,67886,10054,10068,800
5,41101__.. 4500 5.200
1.210.300 1.397,800 1.480.400 2.052,600 2,830,400
602,900121,800196.000103.90037,10033.000
103,90011,700
691,600157,900234,600143,00041,00043,40069.90016,400
1,611,283
3,037.637
97.804,454
7,201,173
2.967 004
28.055.396
7,522,169
59,222.139
8,615,843
V171 1973(estimated) (estimated)
12 13
St0,894,257 511,148,749
10,409,42L.21,08,374
2338,439 3,212,418 3.724.363 4.017.751
469,137 506.372 397,581721,257 628,533 552.434109,200 109.009 74.316273,551 280,481 290.107
1,057.455 1,056,983 1,096,10611,324 16,019 19,358
194,636 185,224 152,44187,533 68.220 108,58950,173 52,294 66.11256.969 58,286 71.118
1,294 3,20Q 4,924
5.108
913,12.968
2.770.582
4.450.103
656.372 527,043 517,105 478.347534,482 664,355 701,063 682.10958.547 44,647 45,820 36,760
237,532 215,252 267.616 277.9821.207,894 1,575282 1,622,228 1,622,162
18,191 28.761 36.310 36.468181,379 241.481 292,846 307,981137.138 146.615 160,342 182.90782.376 18.893 73388 92,00878,992 120.719 139,510 179,5206.233 13.763 17,681 19.054
51,239 103.327 381.000110,000
1,235 22.472 243032.383 5,353 13282 15,078 17.543 19,252
698,600133,500261,200181.80056,10)69,50062.30017.400
784,900191,700282,400196,900384.10093,400
100,40018.800
940.300194.000365,500264,900668.900163,800214,20018300
3.634,494 3.262.988 3.318,177 3,814,332 4,711,804 , 5,329.544 5.883,573
1.032.823250,568363,608350,162822,203169.925990.58654.619
1361.818199.790381,116320.303549.382139,6376083E3
2.059
1.020.906238,516404,990247,840482.387173,066740.498
9.975
985,784225.130704.689)91,271513,162178.156
1.003,59412.546
1,026,652 1,129.017222,253 166,379169,295 907.493267,907 258.016518,944 409.717234.336 263.539
1,662,939 2.183,9339.478 11,450
1,264.000"166.0001,044,768256.580321,730260,944
2,558.50111,050
87,800 113.500 203.800 384.100 857.400 939,152 971.181
34.60049.900
4002,900
82,70029.000
4001,400
171.00025.100
1.9005.800
364,30010,3001,5008,000
817,9006,300
19,20014,000
827,30354,0002920028,649
851.68379.64528,70111.152
1.366.553 1,589,093 1,973253 2261.579 2.436.906
1.163,444123,97060,36418.775
320,500 395,900 398,800 529,100 611,700 741,533 603.281
1,269,254 1,515,741 1,692.490244.634 357,414 455,29565.855 88.305 100,269
9.350 11.793 13:525
1,773.985527,757115.21919.945
532,227 606,296 454,831 539,875 284,386
:4.600 90,700245.900 305,200
111,300287.500
160,100369,000
235,900 237.954375.800 503.629
226.303376,978
259,641 295,173 382,102 489,686 246,360272.586 311.123 102,735 50,189 38.026
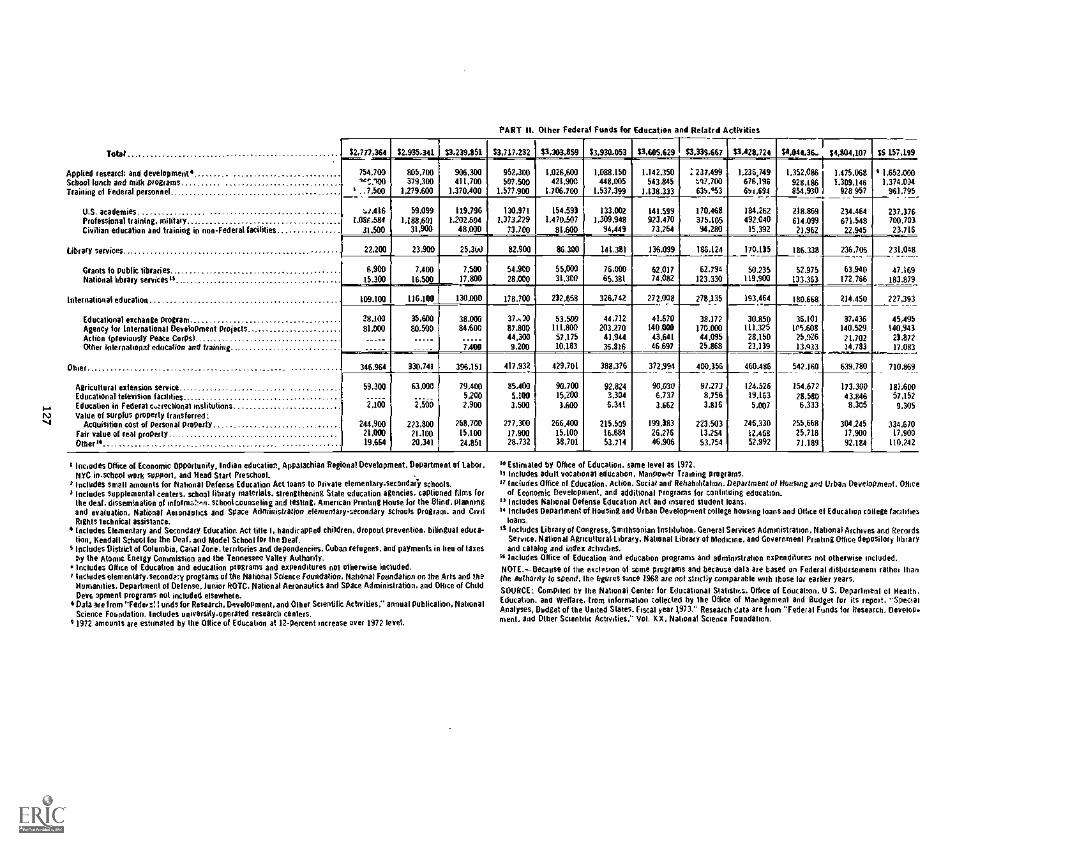
Total
Applied resew': and development'School lunch and milk programsTraining 01 Federal personnel
U.S. academiesProfessional training, militaryCivilian education and training in non-Federal facilities
Library services
Grants lo public librariesNational library services is
International education
Educational exchange programAgency for International Development projectsAction (previously Peace Corps)Other international education and training
Oluer
Agricultural extension serviceEducational television facilities
1--. Education in Federal carectional institutionsVValue of surplus property transferred:...1 Acquisition cost of personal property
Fair value of teal propertyOthers'
PART II. Other federal funds for Education and Relatid Activities
1
[51,777,364 52.935,341 53,239,851 53,717,232 53,303.859 53,930,053 53,605,629 13,334,667 53,428,724 54,044,36. 54,804,107 55 157,199
754.700 805,700 906,300 952,300 1,026,600 1.088.150 1.142,350 : 237,499 1,236,749 1,352,086 1,475,068 9 1.652,000'42:100 379,300 411.700 507,500 421.900 448.005 543,845 i,17,700 676,196 928.186 1.309.146 1,374.034
2 ..7,500 1,279.600 1,370,400 1.577,900 1,706,700 1.537.399 1.138,333 635:153 6a1,694 854,930 928 957 961,795
u:/,416 59,049 119.796 130,971 154,593 133,002 141.599 170,468 184,262 218,869 234.464 237.3761.08E.584 1.188.601 1.202,604 1.373,229 1,470,507 1,309,948 923,470 375,105 492.040 614,099 671.548 700,703
31.500 31,900 48,000 73.700 81,600 94,449 73,264 94,280 15,392 21,962 22,945 23,716
22,200 23,900 25,3W 82.900 86.300 141,381 136.099 186,124 170.135_, 186.338 236,706 231,048
6,900 7,400 7,500 54.900 55,000 76,000 62.017 62,794 50.235 52.975 63,940 47.16915.300 16.500 17,800 28.000 31,300 66.381 74,082 123.330 119,900 133,363 172,766 183,879.
109.100 116,100 130,000 178.700 232,658 326,742 272,008 278,135 193,464 180.668 214,450 227,393
28,100 35,600 38.000 37,-40 53,500 44,712 41.670 38.172 30.850 36.101 37,436 45,49581.000 80.500 84.600 87.800 111,800 203.270 140,000 170.000 111,325 105.608 140.529 140,943
44,300 57,175 41,944 43,641 44,095 28,150 25,926 21.702 23,8727,400 9.200 10,183 36.816 46,697 25,868 23,139 13,433 14,783 17.083_ _-__,....=.
346,964 330,741 396.151 417,932 429,701 388,376 372.994 400,356 460.486 542,160 639.780 710,869
59.300 63,000 79,400 85,400 90.700 92.824 90,030 97,273 124.526 154,672 173.300 181.6005,200 5.100 15,200 3,304 6,737 8,756 19.163 28.580 43.846 57.152
2,100 2,500 2,900 3,500 3,600 6.341 3.662 3.816 5.007 6,333 8,305 9.305
244,900 223.800 258,700 277,300 266,400 215,509 199,383 223,503 246,330 255,668 304,245 334.67021,000 21.100 15,100 17,900 15.100 16,684 26,276 13.254 12.468 25,718 17,900 17.900
19,664 20,341 24.851 28.732 38,701 53.714 46,906 63.754 52.912 71.189 92.184 110,242
I Incoides Office of Economic Opportunity, Indian education, Appalachian Regional Development. Department of tabor,NYC in school work support, and Head Start Preschool.
2 Includes small amounts for National Defense Education Act loans to private elementary - secondary schools.1 Includes supplemental centers, school library materials, strengthening State education agencies, captioned films for
the deaf. dissemination of informa::en. school counseling and testing. American Printing House for the Blind, planningand evaluation, National Aeronaulics and Space Administration elementary-secondary schools program, and CivilRights technical assistance.
4 Includes Elementary and Secondary Education Act title I, handicapped children, dropout prevention, bilingual educa-tion, Kendall School for the Deaf, and Model School for the Deal.
5 Includes District of Columbia. Canal Zone. territories and dependencies. Cuban refugees, and payments in lieu of taxesby the Atomic Energy Commission and the Tennessee Valley Authority.Includes Office of Education and education programs and expenditures not otherwise included.
2 Includes elementaty.secondyy progsams of the National Science Foundation, National Foundation on the Arts and theHumanities. Department of Defense, Junior ROTC. National Aeronautics and Space Administration. and Nice of ChildDevi 3pment programs not included elsewhete.
I Dala are horn "Fedeit:Iunds for Research, Development, and Other Scientific Activities," annual publicalion, NationalScience Foundation. Includes university-operated research centers.
9 1972 amounts are estimated by the Office of Education at 12-percent increase over 1972 levet.
10 Estimated by Office a Education, same level as 1972.it Includes adult vocational education, Manpower naming programs.11 Includes Office of Education. Action. Social and Rehabilitation. Department of Rousing and Urban Development. Office
of Economic Development, and additional programs for continuing education.D Includes National Defense Education Act and insured student loans.14 Includes Department of Housing and When Development college housing loans and Lidice of Educalion college (Whiles
loans.11 Includes Library of Congress. Smithsonian Inslitution, General Services Administration, National Archives and Records
Service. National Agricultural Library, National Library of Medicine, and Government Printing Office deposilary libraryand catalog and index activities.
*0 Includes (Nice of Education and education programs and administration expenditures n6t otherwise included.
NOTE.--Because of the minion of some programs and because dela are based on Federal disbursemeni rathei Iharithe authority to spend, the egures since 1968 are not strictly comparable will those for earlier years.
SOURCE: Compiled by the National Center for Educational Statistics. Office of Education, U S. Department of Health,Education, and Welfare, from inlormation collected by the Office of Management and Budget fur its report. "SpecialAnalyses, Budget of the United States, Fiscal year 1,973." Research 4ata are loom "Federal Funds for Research. Develop.ment, and Either Scientific Activities," Vol. XX, National Science Foundation.
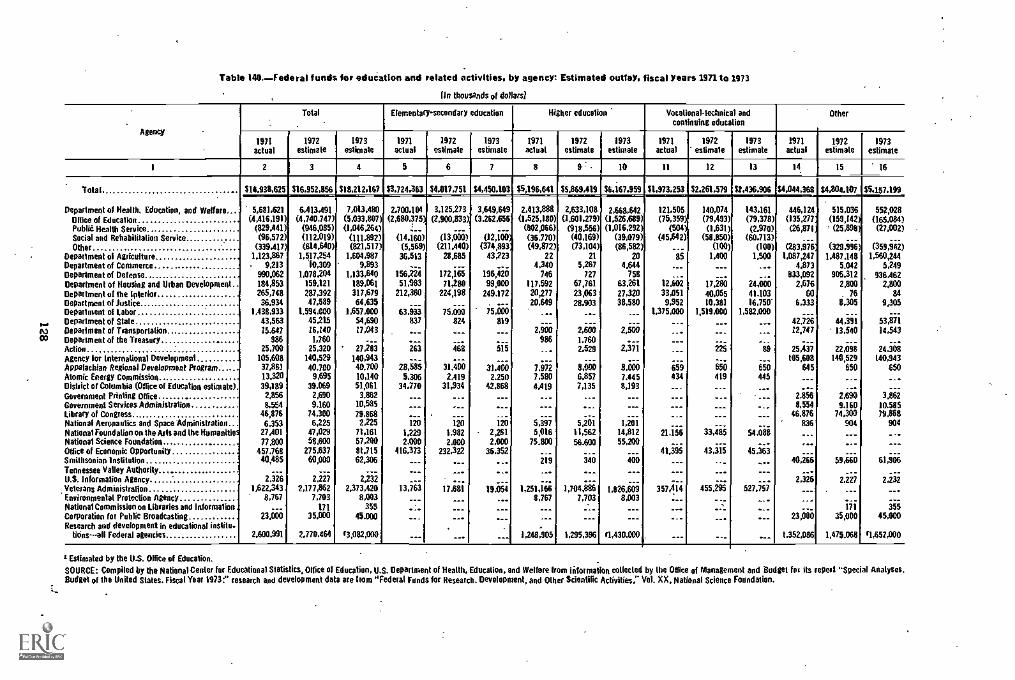
Table 140. - Federal funds for edueatton and related activities, by agency: Estimated outlay, fiscal years 1971%1973
(In thousands of dollars)
Agency
Total Elementary-secondary education Higher education Vocational-technical andcontinuing education
Other
0
1971actual
1972estimate
,
1973eslimate
1971actual
1972eslimale
1973estimate
1971actual
1972estimate
1973estimate
1971actual
1972estimate
1973estimate
1971actual
1972estimate
1973estimate
1 2 3 4 5 6 7 8 10 it 12 13 14 15 16
Total
Department of Health, Education, and Welfare_Office of EducationPublid Health ServiceSocial and Rehabilitation ServiceOther
Department of AgricultureDepartment of CommerceDepartment of DefenseDepartment of Housing and Urban DevelopmentDepartment of Die InteriorDepartment of JusticeDepartment of LaborDepartment of StateDepartment of TransportationDepartment of the TreasuryActionAgency for international DevelopmentAppalachian Regional Development ProgramAtomic Energy CommissionDistrict of Columbia (Office of Education estimate).Government Printing OfficeGovernment Services AdministrationLibrary of CongressNational Aeronautics and Space Administration_National Foundation on the Ails and the HumanitiesNational Science Foundation016ce of Economic OpportunitySmithsonian InstitutionTennessee Valley Authority,.,.U.S. lnformalion AgencyVeterans AdministrationEnvironmental Protection AgencyNational Commission on Libraries and Information .Corporation for Public BroadcastingResearch and development in educational inane-
tiOns-all Federal agencies
914.938,625 916.952,856 918,212.167 53.724.363 94.017.751 94,450.103 55,196,641 55,869.419 56,167,959 91,973.253 52,261.579 52,436.906 94,044468 14.804.107 559157.199.
552,028(165,084)
(27,002)
(359,942)1,560,244
5,249936.462
2,80084
9,305___
53,87114,543
24.306140,943
650...
3.86210.58579.868
904...___
61,606
2,232__.
35545,000
P1,652,000
5.681.621(4,416,191)
(829.441)(96,572)
(339.417)1,123,867
9,213990,062184,853265,74836,934
1.4311,933
43,56325.647
98625,700
105,60837.36113,32039,1892,8568.564
46,8766.353
27,401nsoo
457.76840,485
2,5561,622,343
8,767___
23,000
2.600,991
6,413.491(4,740.747)
(946,085)(112.019)(614,640)
1,517,25410,309
1,078.204159,121287,39247.589
1.594.00045,21516,140
1,76025,320
140,52940.7009,695
39.0692,6909.160
74,3006,225
47,02958.600
275,63760,000
2.5552,177,862
7,703171
35,000
2,770.464
7,013.480(5,033,807)(1,046,264)
(111.892)(821,517)
1,604.9879,893
1,133.640189.061317,67964.635
1,657,00054.69017,043
27,263140,94340,70010,14051,061
3,86210,58579,8682,225
71,16157,20081.71562.306
---2,232
2,373,4208,003
35545.000
/3,082,000
2.700.104(2,680,375)
(14.160)(5,569)
36.513
156.22451,483
212,360
63.933837.__
565
20.5855,306
34.770______
lie1.2292.000
416,373___
------
13,763___.;.__.
___
3.125,273(2,900,833)
(13,000)(211,440)
28,685
172,166
71,280224,198
75.000824___
46,6
31.462.419
31,934____120
1.9822.000
232.322___
--....
17.681___
-°__.
__.
3,649,649(3.262,656
___(12,10)
(374,893'43,223
196,42099,000
249.172
55,065819___
616
31.4002.250
42,868___
___
iii2,2612,000
36.352...-
19966...______
___
2,413,888(1.525,180)
(802,066)(36.770)(49,872)
224,340
746117,59220,27720,649
...2,900
986__
7.9727,5804A19
______
5,3955,016
75,800
516
---
1,251,1668,767
-°___
1,248,905
2,633,108(1.601.279)
(918,556)(40,169)(73,104)
21
5,217727
67,76123,06328.903
.._
2,6001.7602.529
8,6666,8577,135...___
5,20111,56256.600
iii---_
1,704,8867,703
______
1,295,396
2,668,642(1.526,689)(1,016,292)
(39,079)(86,582)
204,644
75863.26127,32038,580
______
2.500
2,551
8,0007.4458,193
______
1,20114,81255,200
:tit---
1.826.6098,003
______
01,430.000
121.505(75,359)
(504)(45,642)
85___
12,66533,0519,952
1,375,000......______
666434____________
21.166__
41,395___
---.
357,414_____....___
140,074(79,493)(1.631)
(58.850)(100)
1,400___...
17.28040,05510,381
1,519,000...__.
225
iio419...._________
33,616
43,315...-
455.566___
.......
143.161(79,378)(2.970)
(60.713)(100)
1,500...
24,66641.10316,750"
1,582,000__._.89
660445.-.___..,______
54.088__.
45.363-..---
527.753.....-..----
446,124(135,277;
(26,871
(283,976'1.087,247
4,873833,092
2,67660
6,333
42,72612,747
25,437105,608
645___
2,8568,554
46,876836...,..
40,266...
2,326___-
23,000
1.352.086
515,036(159,142)' (25,898)
(329,996)1.487,148
5,042905,312
2,800. 76
8,305
44,39113,540
22,098140,529
650_2,6909.160
74.300904___...
59.660
2.-255
___
171
35,000
1,475.068
Estimated by the U.S. Office at Education.
SOURCE: Compiled by the National Center for Educational StatiStics, Office 01 Education, U.S. Department of Health. Education, and Welfare from information collected by the Office of Management and Budget for its report "Special Analyses.Budget of the United States. Fiscal Year 1973:" research and development data are from "Federal Funds for Research. Development, and Other Scientific Activities," Vol. XX, National Science Foundation.
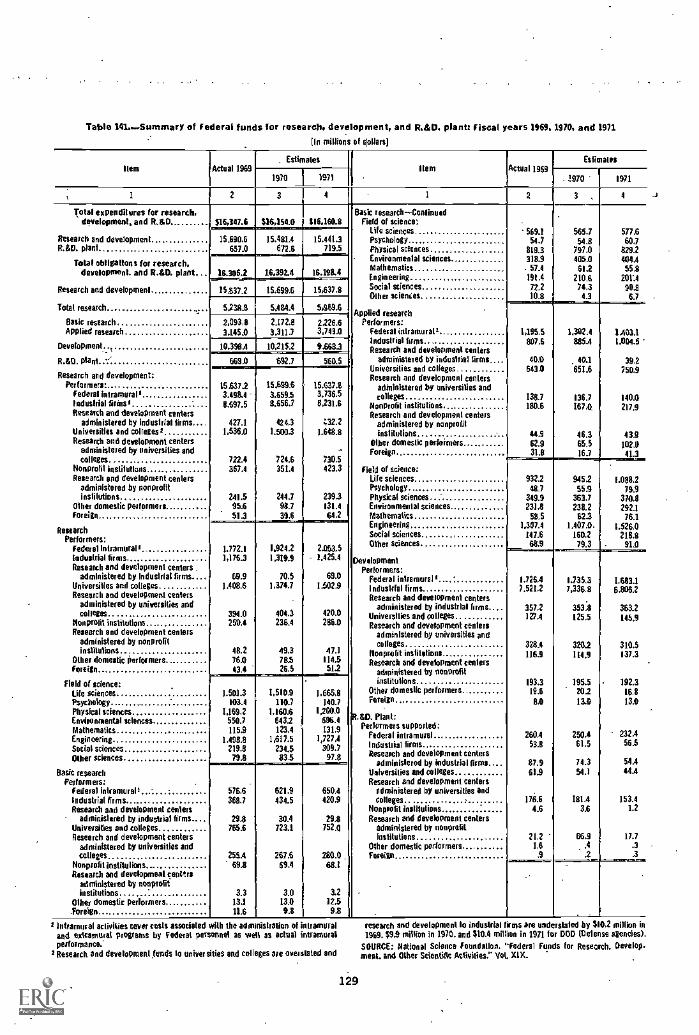
Table 1410...Summary of federal funds for research, development, and R.&D, plants fiscal years 1969. 1970, and 1971
(In millions of Oilers/-.
Item
.
Actual 1969. Estimates
Item Actual 1969Estimates
1970 1971 . 3970 1971
1 2 3 4 1 2 3 , 4
Total expenditures for research,development, and R,8.0
Research and developmentFLUX plant
Total obligations for research,development, and RAD. plant
Research and development
Total research
Basic researchApplied research
Development--
R. &0. plant "
Research and development:Performers*
Federal intramural'Industrial finals'Research and development canters
administered by industrial firms,-Universities and colleges'Research and development centers
administered by universities andcolleges
Nonprofit institutionsResearch and development centers
administered by nonprofitinstilutions
Other domestic performersForeign
Researcharch
Federal intramural IIndustrial firmsResearch and development centers -
administered by industrial firmsUniversities and collegesResearch and deseleement centers
administered by universities andcolleges
Nonprofit institutionsResearch and development centers
administered by nonprofitinsMulions
Other domestic performersForeign
Field of science:Life sciencesPsychologyPhysical sciencesEnvironmental sciencesMathematicsEngineeringSocial sciencesOther sciences
Basic researchPerformers:
Federal Intramural'Industrial firmsResearch and development centers
administered by industrial firmsUniversities and collegesAeseerch and development centers
administered by universities andcolleges
Nonprofit institulionsResearch and development centers
administered by nonprofitinstitutions
Other domestic performers-Foreign
516,347.6 516,154.0 616,160.8Bask research-Conlinued
Field of science:Life sciencesPsychology .
Physical sciencesEnvironmental sciencesMathematicsEngineeringSocial sciencesOther sciences
Applied researchPerformers:
Federal intramural,
569.154.7
819.3318.9
- 57.4191.4
72.210.8
565.754.8
797.0405.0
61.2210.674.34.3
577.660.7
8292404.455.8
201:490,8
6.7
15,690,6657.0
15,481.8672.6
15,441.3
719.5 ,
16,306.2
-16,392.4 16.1911.4
15,637.815637.2
11:.:..15,6995
5,238.8 5.484.4 5,969.6
1,195.5807.6
40.0643.0
138.7180.6
44.962.931.8
1,302.4885.4
40.1651.6
136.71673
46.365.5163
1,403.11,0049
39.2750,9
140.02173
43.91021
41.3
2,09323145.0
2,172,83.311.7
2.226.63.7430
10.3914 10,2152 9.668.3Industrial firmsResearch and development centers
administered by industrial firms.. ,Universities and collegesResearch and developmenl centers
administered by universities andcolleges
Nonprofit institutionsResearch and development centers
administered by nonprofitinstitutions
Other domestic performersForeign
field of science:Ufe sciencesPsychologyPhysical sciencesEnvironmental sciencesMathematicsEngineeringSocial sciencesOther sciences
Development
Performers:Federal intramural IIndustrial firmsResearch and development centers
administered by industrial hues.-Universities and collegesResearch and development centers
administered by universities andcolleges
Nonprofit institutionsResearch and development centers
administered by nonprofitinstitutions
Other domestic performersForeign
pt.&0. Plant:Performers supported:
Federal intramuralIndustrial firmsResearch and development centers
administered by industrial firms. ...Universities and collegesResearch and development centers
administered by universities andcolleges .
Nonprofit institutionsResearch and development centers
administered by nonprofitinstitutions
Other domestic performers .... ,
Foreign
669.0 692.7
_560.5
16.63723,498.48,697.5
427.11,536.0
722.1367.4
241.595.651.3
15,699.63.659.58956.7
424,3
1,500.3
724.6351.4
244.798.739,6
15,637.63.736.58,231.6
432.21,648.8
..
730,5423.3
239.3131.4642
932.248.7
349.9231.8
58.51.307.4
/47.668 .9
945.2559
363.7238.262.3
1,407.0.160279.3
1988.279.9
370.8292.1
76.11.5260
218.8. 91.0
1.772.11,176.3
69.91,408,6
394.0259,4
48.276.043.4
1,92421219.9
70.51,374.7
.
404.3236.4
49.378926.5
2.053.51.425.4
69.011.602.9
420.0286.0
47.1114.5
51.2
1,726.47,5212
3572127A
3284116.9
193.319.6
8.0
260.453.B
87.961.9
176.64.6
21.21.6.9
.-,--.....-..
1.735.37,336.8
353:8125.5
3202114.9
195.520213.0
250.461.5
74.354.1
181.43.6
66.9.4
2
1,683.16,8062
363.21453
310.5137.3
192.316.8
13.0
232.456.5
54.444.4
153.41.2
17.7.33il-----.-..
1,501.3103.4
1,169.2550.7115.9
1.498.8219.879.8
1,510.9110.7
1,16036432123.4
1,617.5234.533.5
1,665.8140.7
1,200.0696.4
131.91,7274
309.797.8
.
576.6368.7
29.8765.6
255A692
3.313311.6
621.9434.5
30.4723.1
267.669.4
3.013.09.8
650.4420.9
29.8752.0
280.068.1
3212.59.8
I Intramural activities cover costs associated with the adm"nistration of "ntramuraland eximmural programs by Federal personnel as well as actual intramuralperformance.
P Research and development tends to universities and colleges are osculated and
129
research and development lo industrial firms are understated by $ 02 million in1999,599 million in 1970, and $10.4 million in 1971 for DOD (Defense agencies).
SOURCE: National Science Foundation, ' Federal Nods for Research. Develop.meet. and Other Scientific Activities," Vot. XIX.

Table 102.-FellowsWip, traineesbip, and training grant programs of Federal agencies:Expenditures and number of participants, fiscal year 1970
{Amounts in thousands of *Natal
Agency and programAmount
expendedNumber
of participants
Agency and programAmount
expendedNumber
of partici-pants
1 2 3 1 2 3
Department of Health, Education, and Welfare Atomic Energy Commission
Office of Education: Faculty institutes lor college teachers $ 485 $ 293Adult education training $ 1,019 1,727 Faculty institutes for high school teachers 35 40Civit rights education training 8,832 55.366 Graduate fellowships and traineeships 6.278 2.771&liege, personnel training program 528 ___ Postdoctoral fellowships 214 22College teacher fellowships 9,756 8.603Early childhood training 1,500 Environmental Prdection AgencyHandicapped children tender education and recruitment 31,219 18.022Handicapped Stale-grant training . 3,107 31,000
Manpower development training 6,829 2.087
improving education for low.income children 21.500 8.000 National Aeronautics and SpaceImproving preparalion of education personnel 13.026 6.288 AdministrationLanguage training and area studies 16,313 ...Librarian training . 7,006 1,737 Graduate training grants 9,192 481Meeting special needs of educalion personnel 7,075 1,748 International fellowships 252 50National Odense Education Act fellowships and Summer faculty fellowships 1,807 360
institutes 57,309 ___ Undergraduate fellowshipS c 156 37
Recruitment and training of education personae! 49.276 45,632Research and development training 6,736 2,617 National Foundation on the Arts and theStrengthening developing institutions 27,731 ___ HumanitiesTeacher inslitutes and guidance 9,719 - Elementary-secondary educational personnel training 19 50
National institutes of Health:.....,. Punier college faculty fellowships 47
Graduate lellowshipsFogarty Center postdoctoral fellowships
5,737740
],u pP142
Postdoctoral fellowshrfn.
.. 711 216
Fogarty Center scholarship 46 8 National Science FoundationKeil% manpower support 307,145 90.000Postdoctoral fellowships 44,409 2,466 Advance science edapplion 2,189 3.000
Training grants 831,289 12,500 Cooperative cotlegeschool sciences 4.785 6,000
Health Services and Mental Health Administration: Graduate lellowships and traineeships 34,381 8,000Health manpower t34,597 4,856 Institutional and research participation 4.035 3,000
Social and Rehabilitation Service: Peildoctoral fellowships 1,631 90.Social and Rehabilitation Service training 33,809 15,000 Precollege institutes 30.153 46.000
Science faculty fellowships 3,014 210
Department of Housing and Urban Development Smithsonian Institution
Urban studies fellowships 509 101 Woodrow Wilson Center fellowships 90 ___
SOURCE: Compiled by the National Center for Educational Statistics. Office of Eder lion, U.S. Department of Health, Education, and Welfare, from information obtainedfaun the Dike 01 Management and Budget for "Special Analyses, Budget of the United States, Fiscal Year 1972
130
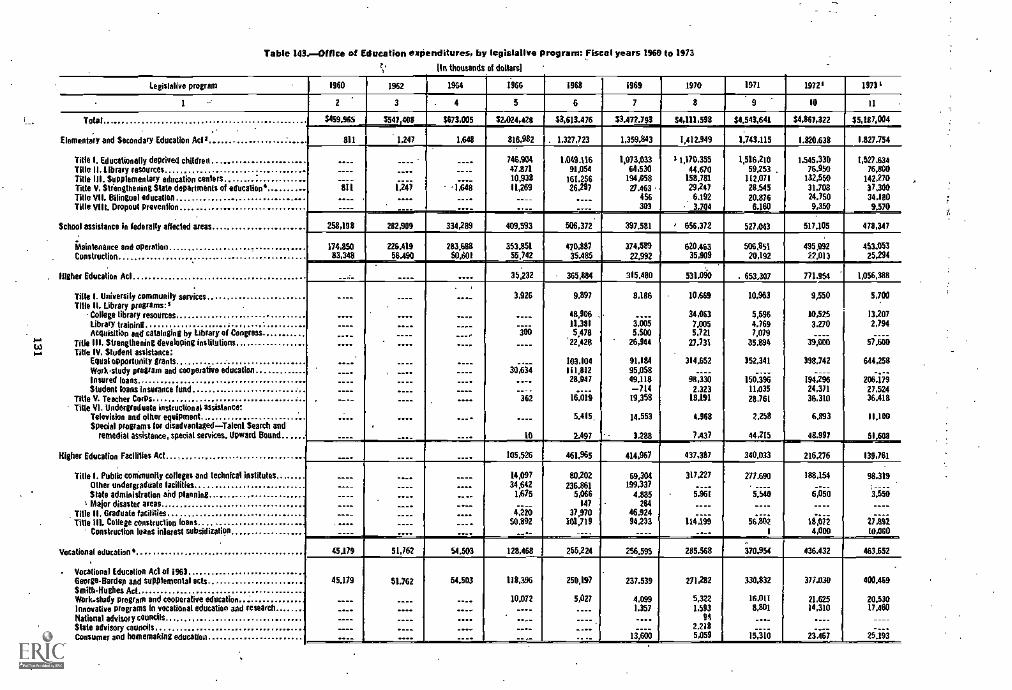
Table 143. Office of Education expenditures, by legislative program: Fiscal years 1960 to 1973
[In thousands of dollars]
Legislative program 1960 1962 1964 1566 1968 1969 1970 1971 19721 1973 1
1 ' 2 3 . 4 5 6 7 8 9 10 11
Total.
$459,965 3547, _408 8673.003 32.024,428 33.613.476 33. 472,793 34,111,598 54.543.641 34.867,322 35,187,004,.
Elementary and Secondary Education Acts. 811 1,247 1,648 816.982 . 1.327,723 1,359,843 1,412.949 1,743.115 1.820.638 1.827.754
Tille I, Educationally deprived children... ............ ..__ ____ ---- 746,904 1,049.116 1,073,033 11,170,355 1,516.210 1.545,330 1,527.634Title 11. Library resources ---- --.. ____ 47,871 91,054 64;530 44.670 59253 . 76.950 76,800Title 111. Supplementary education centers
_
-8510,938 161.256 194,058 158.781 112,071 132,550 142,270
Titte V. Strengthening State departments of education'.. 1-5i -1,608 11,269 26.297 V.463 29.247 28,545 31,708 37.300Title VII. Bilingual education ..-- . .... .... ---- .--- 456 6,192 20.876 24.750 34.180Title VIII. Dropout prevention ---- ____ ...- --- ---- 303 .. 3.704 6 160 9,350 r< 9.570
School assistance in federally dated areas 258,198 282,909 334,289 409,593 506,372 397,581 , 656,372 527.043 517.105 478,347
Maintenance and operation . 174,850 226,419 283,688 353,851 470,887 374,589 620.463 506,851 495,092 453.053Construction 83,348 56.490 50.601 55,742 35 485 22.992 35,909 20,192 12.013 25,294
. .
Higher Education AM ---- .... 35,232 365,884 315.480 531.090 . 653,307 771.154 1,056,388
Title I. University commuidly services ---- ____ ..._ 3,926 9,897 8,186 10,669 10.963 9,550 5,700Title II. Library programs:2
College tibrary resources .... .... .___ ___ 48,906 . 34,063 5,596 10,525 13.207Library training ---- .... - ---
-5011,381 3:Oii 7.005 4.769 3.270 2,794
Acquisition and cataloging by Library of Congress -_._ ____ 5,478 5,500 5,721 7,079Title III. SUengthening developing inslitutions .... .... .... ____ '22,426 26,944 27,731 35,894 39.000 57,6613
Title IV. Student assistance:Equal opportunity grants
...-. ---- .--- 103.104 91,184 314.652 352,341 398.742 044,258Work-study program and cooperative education ___. --.. ---- 30,634 111,812 95,058Insured loans ____ ---- --- ..-. 28,947 49.118 98,330 150,56 194.296 205,59Student loans insurance fund ---- .___ ---- ---- -714 2.323 11,035 24,371 27.524
Title V. Teacher Corps ---- .... 362 16.019 19,358 18,191 28.761 36.310 36.418Title VI. Undergraduate instructional assistance:
Television and other equipment .... ---- ---- ---- 5.415 14,553 4.968 2.258 6,893 11.100Special programs Inc disadvantagedTalent Search and .
remedial Mistime*. special services, Upward Bound ---- .... 10 2.497 3.288 7.437 44215 48.997 51.608
Higher Education Facilities Act ___. ---- .... 105,526
,
461,965 414.967 437,387 340,033 216.276 139,761. -
Title I. Public community colleges and technical institutes ---- --. ---- 14,097 80,202 69.304 317,227 277.690 188,154 98.319Other undergraduate facilities ---_ ____ .... 34,642 236.861 199.337 .
State administration aid planning ____ .... .... 1,675 5,066 4.885 iiii 5,50 6,050 3,550' Major disaster areas ____ ---. ---- 147 264 ____ ____ ____ ----
Title II. Graduate facilities ---_ ____ .... 4,220 37,970 46,924Title Ill. College construction Mans ..... ____ ___. 50.892 101,719 94,233 114-i9; 56,962 liAii 21i92
Construction loans interest subsidization ____ .... ..-. --- ---- .... I 4,000 10,000.
_. .-
Vocational education 4 45,179 51,762 54,503 128,468 255.224 256.595 285.568 370,954 436.432 463,652
. Vocational Education Act 011963GeOrile-flardep and supplemental acts 45,179 51.762 54,503 118,396 250,197 237.539 271,282 330.832 377.030 400.459Smith-Hughes Act...Work-study program and cooperative education ---- ____ --- 10.072 5,027 4,099 5,322 16,011 21.615 20.530Innovative programs In vocational education and research.. -.-. .... .. -... ___ 1.357 1,593 8,801 14,310 17.460National advisory ceuncils ---- ---- .... ...- ____ .. 94 ___ .... ____
State advisory councils ---- ___ ..... __._ .. 2218Consumer and homemaking education ---- .... ___. _...- . 13 600 5,059 liiiii 23.467 25,193
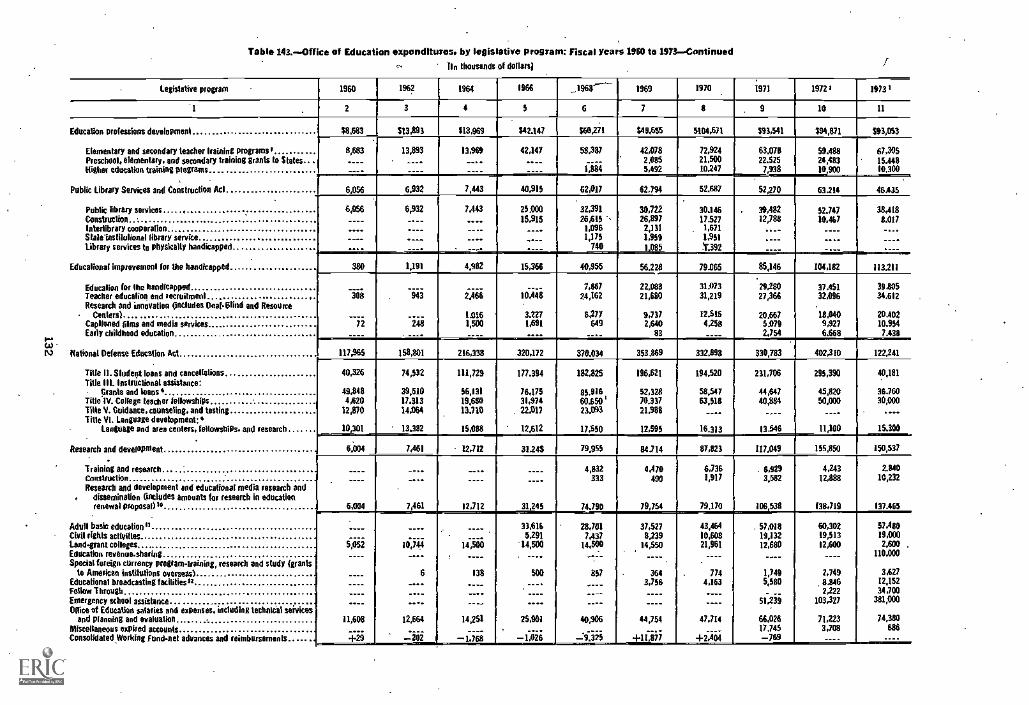
Table 143.-.0ffice of Education expenditures, by legislative program, Fiscal years 1960 to 1973-Continued)In thousands of dollars)
Legislative program 1960 1962 1964 1966 _19617.- 1969 1970 1971 1972 I 1473 3
'1 2 3 4 5 6 7 8 9 10 11
Education professions development $8,683 St3.893 313,969 342.147 $60,271 $48,655 5104,671 393,541 394,871 $43,053
Elementary and secondary teacher 'raining programs, 8,683 13,893 13,964 42,147 58,387 42,078 72,924 63,0711 59,488 67,305Preschool, elementary, and secondary training grants to States .___ _. __.. ..__ _.-- 2.085 21,500 22,525 24,483 15,448MOW education training pregrams ---. ---- --- - - --- 1.884 5,492 10.247 7,938 10,900 10,300
Public Library Services and Construction Act 6.056 6.932 7,443 40.915 62,017 62,794 52,687 52,270 63.214 46.435
Public library services , 6,056 6,932 7,443 25,000 32,391 30,722 30,146 34,482 52.747 38,418Construction ____ _.__ .... 15,915 26,615 -- 26,897 17.527 12,788 10,467 8,017Interlibrary cooperation .... . - -- ____ _ -_. 1,096 2,131 1,671 ...- ---- ....Staleinstilutional library service --- .--- .... ..-- 1,175 1,959 1.951 --- .... ---.Library services to physically handicapped ---. . _. ..._ 740 1.085 Y.392
Educational improvement for the handicapped 380 1,191 4,982 15,366 40,955 56.228 79.065 85,146 104,182 113.211
Education for the handicapped-iii
7,667 22,088 31.073 29,280 37.451 39.805Teacher educalina end recruitment iiii 2-diii 10,448 24,162 21,680 31,219 27,366 32,096 34,612Research and innovation (includes DeafSlind and Resource
Centers)-248
1,016 3,227 8,271 9,737 12,516 20.667 18.040 20,402Captioned Slane and media services 72 1,500 1,691 649 2,640 4,258 5.079 9,927 10.954Early chitdhood education ____ . ---- ____ .... .... 83 ____ 2,754 6.668 7.438
Rational Defense Education Act , 117,965 158,801 216,338 320,172 370.034 353.869 332,898 330,783 402,310 122,241
Title 11. Student loans and cancellations 40,326 74,532 111,729 177.394 182,825 196,621 194,520 231,706 295,390 40,1111
Title Ill. Instructional assistance:Grants and loans 4 49,1011 39,610 56,131 76,175 85,816 52,328 58.547 44,647 45,820 36.760
Title IV. College teacher fellowships 4,620 17,313 19,680 31,974 60,650 ' 70,337 63,518 40,884 50,000 30,000Title V. Guidance, counseling, and testing 12,870 14,064 13,710 . 22,017 23,993 21,988 __.. _,__ ___. ....Title VI. Language development:6
Language and area centers, fellowshiPs, and research 10,301 13,382 15,088 12,612 17.550 12,595 16,313 13,546 11,100 15.300
Research and development 6,004 7,461 12,712 31.245 79,955 84.714 87,823 117,049 155,850 150,537
Training and researchConstruction
____ - .._...
__..____
____....
4,612333
4,470490
6,7361,917
. 6,9293,582
4,24312,883
2,84010,232
Research and development and educational media research and. dissemination (includes amounts far research in education
renewal proposal) 3. 6,004 7,461 12,712 31,245 74.790 79,754 79,170 106,538 138,719 837.465-
Adult basic education 01..___ __.. ____ 33,616 28,701 37,527 43,464 . 57,018 60,302 57,480
Civil rights activities 5,291 7,437 8,239 10,608 19,132 19,513 19,000Landwantcolleges 5.,052 10544 14-,500 "14,500 14,500 14,550 21,961 12,680 12,600 2,600 .
Education revenuesharing ____ .... ' ____ ____ ____ ____ 110,000Special foreign currency program - training, research and study (grants
to American institutions overseas) ____ 6 838 500 857 364 774 1,749 2,749 3,627Educational broadcasting facilities sz ____ _... .___ .... __ 3,756 4,163 5,580 12,152Fellow Thilugh ---- ...- __.. ____ -- ____ .___
,8,8462,222 34,700
Emergency school assistance ..__ .... __ .... ____ ____ ____ 51,2i4 103,327 381,000011ice of Education salaries and expenses, including technical services
and planning and evaluation . 11,608 12,664 14,251 25,901 40,906 44,754 47,714 66,026 71,223 74,380Miscellaneous expired accountsConsolidated Working fund net advances and reimbursements 7.1:ii -:i02
___--1,101 -1,026 9-,3i'i 11 -iii
____+2,404
17.745-769
3,708----
686- -
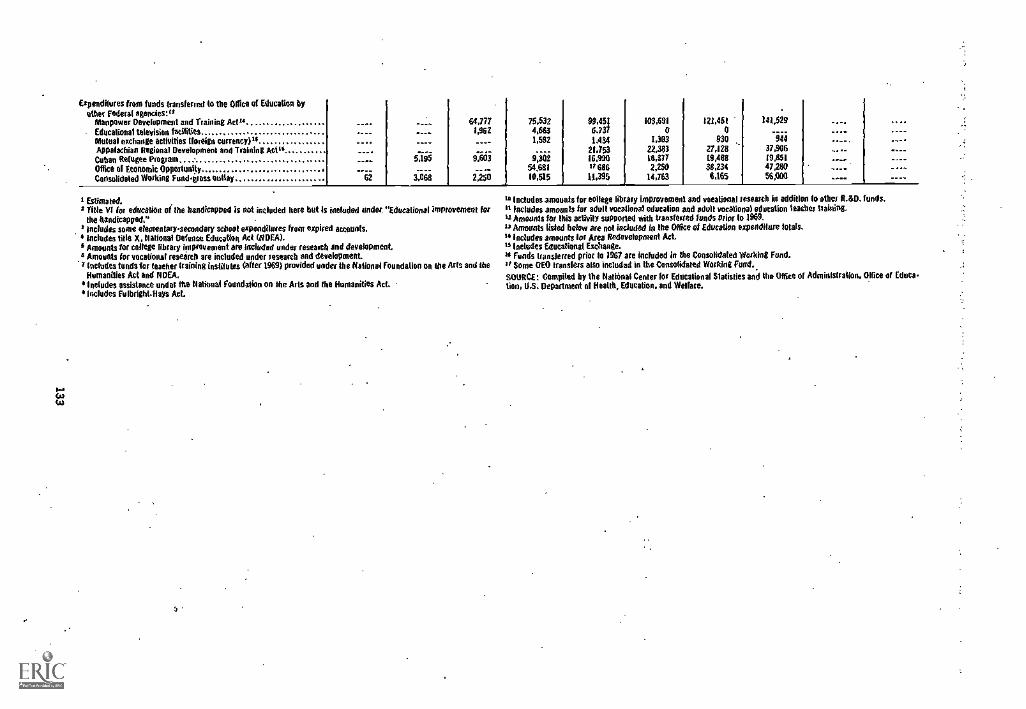
Expenditures from funds transferred to the Office of Education byother Federal enemies:I*
Manpower Development and training Actl°- Educational television facilities
Mutual exchange activities tforeign currency)"Appalachian Regional Development and Training Asti°Cuban Refugee ProgramOffice of Economic OpprolunXyConsolidated Working Fund-moss virility 62
5,195
64,7771:962
9 603
2,250
° Estimated.2 Title VI for educatioe of the handicapped is not included here but Is facluded ender "Educational improvement for
the handicapped."*Includes some elementary-secondery school expenditures from expired accounts.
Includes title X. National Definite Education Act (NDEA).5 Amounts for college library improvement are included under research and development.
Amounts for vocational research are included under research end development.Includes tuedstor teacher training institutes (after 1969) provided under the National Foundation on tile Arts and theHumanities Act and NDEA.Includes assistance ender the National Foundation on the Ails and the Humanities Act.Includes Fulbright -Hays Act.
75,5324,6631.592
956i54.68110.515
99,451
2611417345337
16.990Ir 68611 .395
103,6910
1,30322.38311.3172,250
14,763
121.4510
93027,128ti3,4118
38,2348,165
141,529
137.906
47,28056,000
° Includes amounts for college lib ary improvement and vocational *search in addition lo ether R.&D. rinds.Includes amounts for adult vocational education and adult vocational education teaches training.
m Amounts for this activity supported with transferred funds prior 10 1969.12 Amounts listed below are not included In the Office of Education expenditure totals.
includes amounts for Area Redevelopment Act.15 Includes Educational Exchange.w Funds transferred prior to 1967 are included in the Consolidated Working Fund.',Some 0E0 Uvulas also included in the Consolidated Working Food.SOURCE: Compiled by the National Center for Educational Statistics and the Office of Administration, Office of Educa-tion. OS- Department of Health, Education, and Welfare.
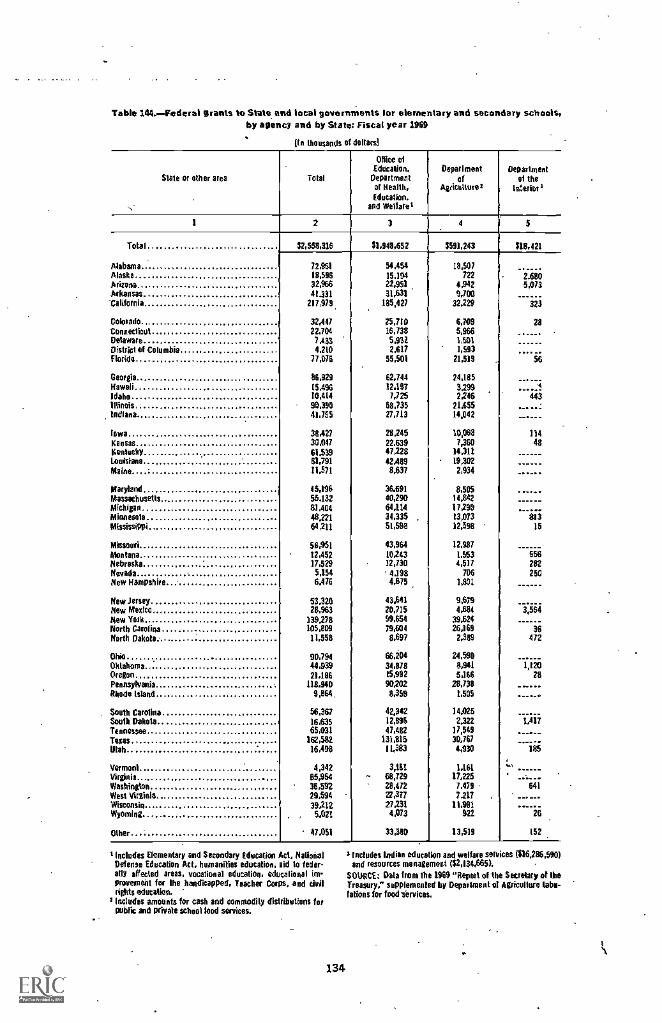
Table 104.-Federal grants to State and loos{ gOVISMCISMICIS for elementary and secondary schools,by agency and by State: Fiscal year 1969
thousands ot deltaral
Slate or other area Total
and
Office ofEducation.
Departmentof Health,Education.
Weller.'
Omar
Agriculture'
Wentof
Departmentof the
Interior 3
1 2 3 4 5
Total $2,558,336 $1,948,652 5591,243 518,421
Alabama 72,961 54,454 18,507Alaska 18,596 15.194 722 2,680Arizona" 32,966 22,951 4,942 5,073Arkansas 41,331 31,631 9,700California 217979 185,427 32,229 323
Colorado 32,447 25,710 6,709 28Connecticut 22,704 16,738 5,966Delaware 7.433 5,931 1,501 ......District of Columbia 4,210 2,617 1,593 ......Florida 77,076 55,501 21,519 56
Georgia 86,929 62,744 24,185HawaiiIdaho...
15.49610,414
12.1977,725
3.2912.246
.4
-44iIllinois 90,390 68,735 21,555Indiana 41,755 27,713 14,042
Iowa 38,427 28,245 10,061 114Kansas 30,047 22.639 7,360 48Kenlucky 61.539 47,228 14,311.Louisiana 61,791 42A89 19,302
Maine 11,571 8,637 2,934
MarylandMassachusetts
45,1%55,132
36.59140,290
8,50514,842
"-'-'Michigan 81.404 64,114 17,290Minnesola 48.221 34,335 , 13,073 113Mississippi 64,211 51,598 12,598 15
Missouri 56451 43,964 12,987
Montana 12,452 10243 1.553 556Nebraska 17,529 12,730 4,517 282
Nevada . 5,154 4.198 706 250New Hampshire 6.476 4,675 1,801
Hew Jersey. 53.320 43,641 9979New Mexico 26,963 20,715 4,684 3,564New York 339.278 99,654 39,624North Carolina 105,809 71,604 26,169 36North Dakota 11,558 8.697 2,989 472
Ohio 90,794 66,204 24,580Oklahoma 44,939 34,878 1,941 1,120Oregon 21,186 15,992 5,166 28Pennsylvania 118.940 90,202 28,738 - -...Rhode Island 1,844 8.359 1,505
South Carolina 56,367 42,342 14,025South Dakota 16,635 12,896 2,322 1,417Tennessee 65,031 47,482 17,549Tens 142,582 131,815 30,767
Utah 16,498 11,383 4,930 165
Vermonl 4,342 3,111 1,161'''
VirginiaWashington ,
65,95436,592
'- 58,72928,472
17,2257,479
' ......641
West Virginia 29,594 22.377 7,217 . -_._ --Wisconsin 39,212 27,231 11,981Wyoming 5421 4,073 922 26
Other 47.051 33,380 13,519 152
t Includes Elementary and Secondary Education Act, NationalDefense Education Act, humanities education, aid to leder-ally affected areas, vocational education, edIgalional im-provement for the handicapped, Teacher Corps, and dvilrights education.Includes amounts for cash and commodity distributions for*Hit and private school hod services.
134
I includes Indian educa ion and welfare services 416286990)and resources management ($2,134,665)
SOURCE: Data from the 1969 "Report of the Secretary of theTreasury," supplemented by Department et Agriculture tabu-lations for food services.
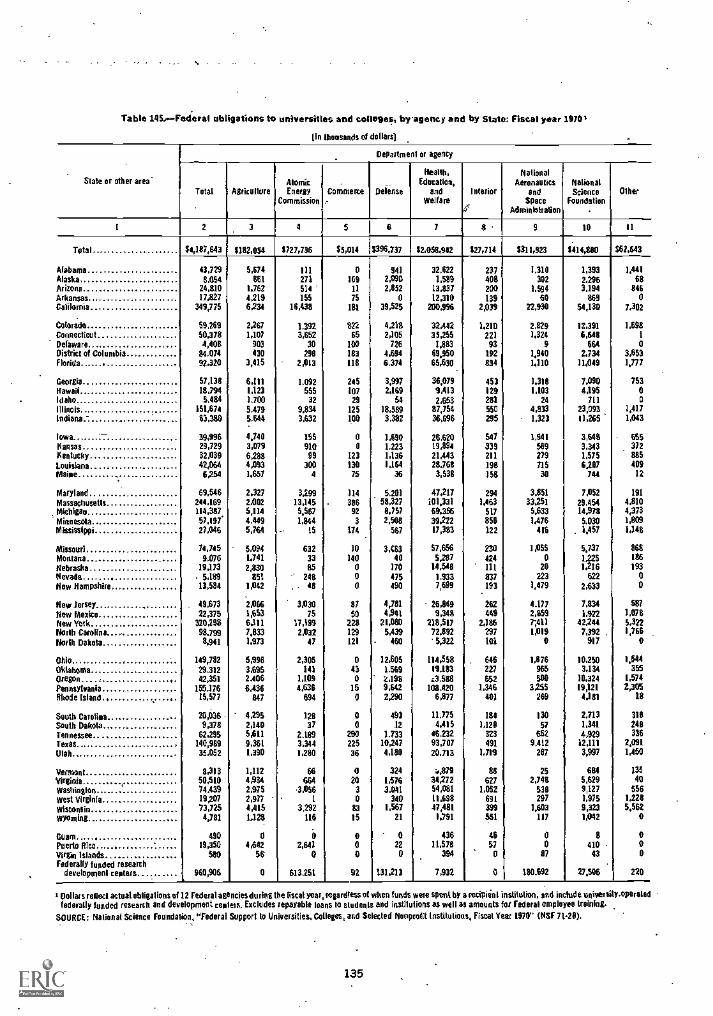
Table 145.-Federal obligations to universities and colleges, by-agency and by State: Fiscal year 19701
(In lbeasands of dollars)
State or other area.
Department or agency
Total AgricultureAlomicEnergy
CommissionCommerce Defense
Neale,Eclocatioa,
andWelfare
Interior
NationalAeronautics
andSpace
Administration
NationalScience
FoundationOther
2 3 4 6 3 9 10 11
Total $4,137,643 4182,054 $727,736 $5,014 1396,737 42,058,942 127,714 $311,923 siaoso $62.143
Alabama 43,729 5,674 111 0 941 32.622 237 1.310 1,393 1,441Alaska 8,454 661 271 169 2,090 1,589 408 302 2,296 68Arizona 24,810 1,762 514 11 2,852 13,837 200 1,594 3,194 346Arkansas 17,827 4219 155 75 0 12,310 139 60 869 0California 349,775 6234 16,438 181 39,525 200,996 2,039 22,930 54,130 7,302
Colorado 59,269 2,267 1.392 822 4,218 32,442 1,210 2.820 12,391 1,698Connecticut 50,378 1,107 3,652 65 2,105 35,255 22) 1,324 6,648Delaware 4,403 903 30 100 726 1283 93 9 664 0
District of Columbia 84.074 430 298 183 4,67494 69,950 192 1,940 2,734 3,653Florida , 92,320 3,415 2,013 118 6.3 65,630 834 1,110 11,049 1,777
GeorgiaHawaiiIdaho
57,13318,7945,484
6,1111,1231,700
1.092555
32
245107
29
3,9972,169
54
36,0791.4132,653
453129281
1,3181,103
24
7,0904,195
711
75300
Illinois 151,674 5,479 9,834 125 18,589 87,754 560 4,833 23,093 1,417Indiana 63,380 5.644 3,632 100 3,382 36,696 295 1,323 11,265 1,043
Iowa 39,996 4,740 155 0 1,690 26,620 547 1,941 3,648 655Hansas 29,729 3,079 910 0 1.223 19,894 339 569 3,343 372
Kentucky 32,039 6298 99 123 1,136 21,443 211 279 1,575 885Louisiana 42,064 4.093 300 130 1,164 28,768 193 715 6,207 409Maine 6254 1,657 4 75 36 3,538 153 30 744 12
Maryland 69,546 2,327 3.299 114 5.201 47,217 294 3,851 7,052 191
Massachusetts 244,169 2,002 13,145 386 58,327 101,331 1,463 33,251 29.454 4,810Michigan 114,337 5,114 5,567 92 8,757 69,3% 517 5,633 14,978 4,373
Minnesota 57,197' 4.449 1,844 a 2,50/1 39,222 856 1,476 5.030 1,809
Mississippi 27,046 5,764 15 567 17,383 122 416 . 1,457 11,148
Missouri 74,745 5,094 632 10 3,483 57,666 230 1455 5,737 868
Montana 9,076 1,741 33 140 40 5,257 424 0 1,225 186
Nebraska 19,173 2,330 85 0 170 14,548 111 20 1.216 193
Nevada. 5,189 851 248 0 475 1,933 837 223 622 0
New Hampshire 13,584 1,042 48 0 490 7,699 193 1,479 2,633 0
New jersey 49,673 '2466 3,830 81 4,781 25,849 262 4.177 7,834 587
New Mexico 22,375 1,653 75 50 4,941 9,348 449 2,859 1,922 1,078New York 320,238 6,111 17,199 223 21,080 218,517 2,186 7;411 42,244 5,322North Carolina 98,799 7,833 2,032 129 5,439 72,892 297 1419 7,392 1,766
North Dakota 8,941 1,973 47 121 460 5,322 101 0 917 0
Ohio 149,782 5,998 2,305 0 12,605 114,558 646 1,876 10,250 1,544
Oklahoma 29.312 3,695 141 43 1.539 11,163 227 965 3,134 355
Oregon 42,351 2.406 1,109 0 2,198 43.588 662 500 10,324 1,574
Pennsylvania 155.176 6,434 4,636 15 9,642 108.420 1,346 3255 19,121 2,305Rhode Island, 15,577 847 694 0 2,290 6,877 401 269 4,181 18
South Carolina 20,036 4,295 128 0 493 11.775 184 130 2,713 318
South Dakota 9,378 2,140 37 0 12 4.415 1,128 57 1,341 243Tennessee 62,295 5,611 2,189 290 1.733 46,232 323 652 4,929 336
Texas 140,989 9,361 3,344 225 10,247 93,707 491 9,412 12,111 2,091
Utah 35,052 1,390 1,260 36 4,180 20,713 1,719 287 3,997 1,450
VermontVirginiaWashington
8.31350,01074 439
1,1124,9342,975
66664
31056
O20
a
3241,5763,041
r 8T9
34,27254,081
88627
1,062
252,743
533
6845,6299,127
13540
556
West Virginia 19,207 2,977 340 11,698 691 297 1,975 1,228
Wisconsin 73,725 4,415 3,292 83 1,567 47,481 399 1,603 9,323 5,562Wyoming 4,731 1,128 116 15 21 1,791 561 117 1,042 0
Marp, 490 0 0 0 0 436 46 0 8 0Puerto Rico 19,350 4,642 2,641 0 22 11,573 57 0 410 0Virgin islands 580 56 0 0 0 394 0 87 43 0
Federally funded researchdevelopment centers.. 960,906 0 613251 92 131,213 7,932 180.692 27,506 220
Dollars relied actual obligations of 2 Federal age odes eludes the liscat year, regardless of when funds were spent by a recipitnit institution, and includeuniversityoperatedfederally funded research and development centers. Excludes repayable loans to students and institutions as well as amounts for Federal employee training.
SOURCE: National Science Foundation. "Federal Support to Universities, Colleges, and Selected Nonprofit InsUtutious, Fiscal Year 197F' (NSF 71-28).
135
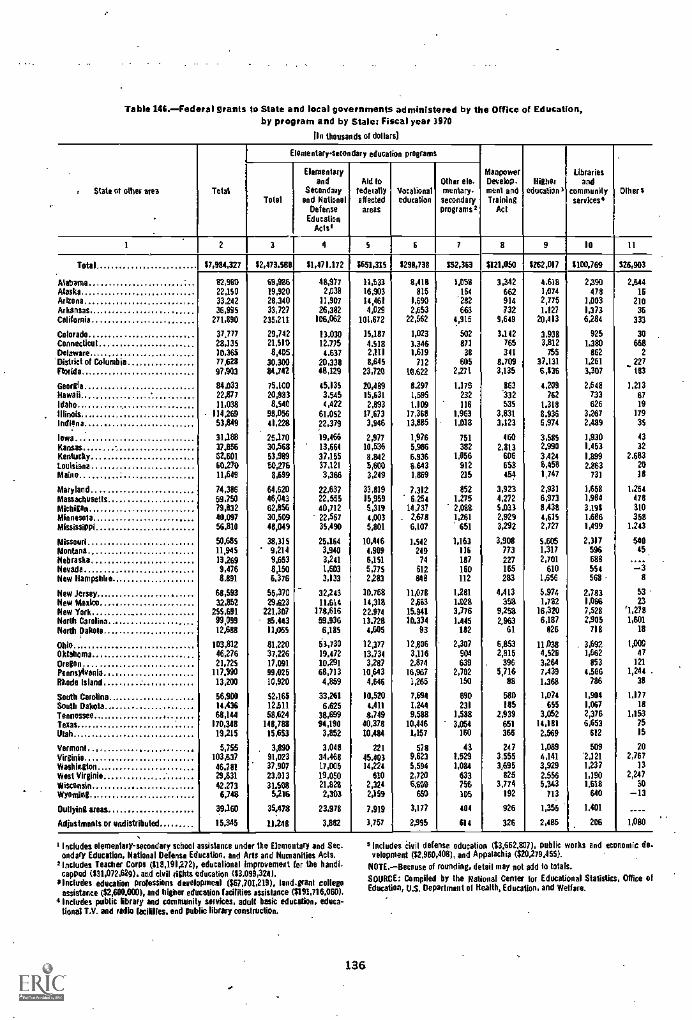
Table 146.-Federal grants to State and local governments administered by the Office of Education,by program and by Stater Fiscal year 1970
[In thousands of dollars)
, State of other area Total
Elementary-secondary educa ion programs
ManpowerDevelop-ment andTraining
Act
Highereducation 1
Librariesand
communityservkes4
011ier$Total
Elementaryand
Secondaryand National
DefenseEducationMs'
Aid lofederallyaffectedareas
Vocalionaleducation
Other ale-mentary-
secondaryprograms:
1 2 3 4 5 6 7 8 9 10 11
Total $7,984,327 82,073.586 81,071.172 2651,315 8298,738 852,363 $121.050 $162,017 3100,769 326,903
Alabama 82,980 69,926 48,977 11,533 8,418 LON 3,342 4.618 2,390 2,644Alaska 22,150 19,920 2,038 16,903 415 164 662 1,074 478 16Arizona 33242 28,340 11,907 14,461 1,690 282 914 2,775 1,003 210Arkansas 36,995 33,727 26,382 4,029 2,653 663 732 1.127 1,373 36California 271,890 235,211 106.062 101,672 22,562 4,915 9,649 20,413 6,284 333
Colorado 37,777 29,742 13.030 15.187 1,023 502 3.142 3.938 925 30Connecticut 28,135 21,510 12,775 4.518 3.346 871 765 3,812 1.380 666Delaware )0,365 8,405 4.637 2,111 1,619 38 341 755 862 2
District of Columbia 77,628 30.300 20,338 8,645 712 605 8.709 37,131 1,261 227
Florida 97,903 84.742 46,129 23,720 10.622 2,271 3,135 6,836 3,307 t03
Georgia 84,033 75,100 45,135 20,489 8,297 1,179 863 4,209 2,648 1,213Hawaii 22,877 20,983 3,545 15,631 1,595 232 '332 762 733 67Idaho 11,038 8.540 4,422 2,893 1.109 116 535 1.318 626 19
Illinois - 114,260 98,056 61,052 17,673 17,368 1,963 3,831 8.936 3,267 179
Indiana 53,849 41,228 22,379 3,946 13,855 1 ,018 3,123 6,974 2,489 35
Iowa 31.188 25,170 19,466 2,977 1,976 751 460 3,585 1,930 43
Kansas 37,856 30,568 13,664 10,536 5,936 382 2.813 2.990 1,453 32
Kentucky 62,501 53,989 37,155 8,842 6.936 1,856 606 3.424 1,899 2.663
Louisiana 60,270 50,276 37,121 5,600 6,643 912 653 6,458 2.863 20Maine 11,649 8,699 3,366 3,249 1,869 215 454 1,747 731 18
Maryland 74,386 64,620 22.637 33,819 7,312 852 3,923 2,931 1,658 1,254
Massachusetts 59,750 46,043 22,555 15,959 6,254 1,275 4,272 6,973 1,984 478Michigan 79,832 62,856 40,712 5,319 14,737 2,088 5,033 8,438 3.19$ 310
Minnesota 40.097 30,509 22,567 4,003 . 2,678 1,261 2,929 4,615 1,686 358Mississippi 56,810 48,049 35,490 5,801 6,107 651 3,292 2,727 1,499 1.243
Missouri 50,685 38,315 25.164 10,446 1.542 1,163 3,908 5.605 2,317 540
Montana,.. 11,945 9,214 3.940 4,909 249 116 773 1,317 596 45Nebraska 13.269 9,653 3,241 6,151 74 187 227 2,701 688 .....Nevada 9,476 8,150 1,603 5,775 612 160 165 610 554 -3New Hampshire 8,891 6,376 3,133 2,243 848 112 283 1,656 568 8
New Jersey 68,593 55,370 32,243 10.768 11,076 1.281 4,413 5.974 2,783 53
New Mexico 32.852 29,623 11.614 14,318 2,663 1.628 358 1,782 1,086 23
New York 255,691 221,307 178.616 22.974 15.941 3,776 9,258 16,320 7,528 '1,278North Carolina 99,099 85.443 59,936 13.726 10,334 1,445 2.963 6,187 2,905 1,601
Nor* Dakota 12.688 11,065 6,185 4,605 93 132 61 826 718 18
Ohio 103,812 81,220 53,730 12,377 12,806 2,307 6,653 11,638 3,692 1,800
Oklahoma 46,276 37,226 19,472 13,734 3,116 904 2,815 4,526 1,662 47
Oregon 21,725 17,091 10.291 3,287 2,874 639 . 396 3,264 453 121
Pannsylvania 117,990 99,925 66,713 10,643 16,967 2,702 5,716 7,439 4,566 1,244 .
Rhode Island 13,200 10,920 4,859 4,646 1,265 150 88 1.368 786 38
South Carolina 56,900 52,165 33,261 10,520 7,694 690 580 1,074 1,904 1,177
Sou* Dakota 14,436 12,511 6,625 4,411 1.244 231 185 655 1,067 18
Tennessee 68,144 58,624 36.699 8,749 9,588 1,588 2,939 3.052 2,376 1,153
Texas 170,348 148,788 94,190 40,378 10,446 3,054 651 14,181 6,653 75
Utah 19,215 15,653 3,852 10,484 1,157 160 366 2,569 512 15
Vermont 5,756 3,890 3,048 221 578 43 247 1,089 509 20
Virginia 103,637 91,023 34,468 45.403 9,623 1,529 3,555 4,141 '2,121 2,767
Washington 46.781 37.907 17,005 14,224 5,594 1,084 3,695 3,929 1,237 13
West Virginia 29.831 23,013 19,050 610 2,720 633 825 2.556 1,190 2,247
Wisconsin 42.273 31.508 21,828 2,324 6,609 756 3.774 5,343 1,618 30
Wyoming 6,748 5,216 2,303 2,159 650 105 192 713 640 -13
Outlying areas 39.160 35,478 23.978 7,919 3,177 404 926 1,355 1,401 ___
Adjustments or undistributed 15.345 11246 3,882 3,757 2,995 614 326 2,485 206 1,080
t Includes elementary-secondary school assistance under the Elementary and Sec-ondary Education, National Defense Education, and Arts and Humanities Acts.
:Includes Teacher Corps ($18,191,272), educational improvement for the handi-capped 331,072,629/, and civil rights education 33699,324
'Includes education professions develoPmeal (367,701,219), land-grant collegeassistance ($2,600,000), and higher education facilities assistance ($191,716660).
-.Includes public ibrary and community murices, adult basic education, educa-tional T.V. and radio facilities. and public library construction.
136
II includes Civil defense education 33,662,807), public works and economic de-velopment (22,960,408), and Appalachia ($20,279,455).
NOTE. - Because of rounding, detail may not add to totals.
SOURCE: Compiled by the National Center for Educational &Adios, Office 01Education, U.S. Department of Health, Education, and Welfare.
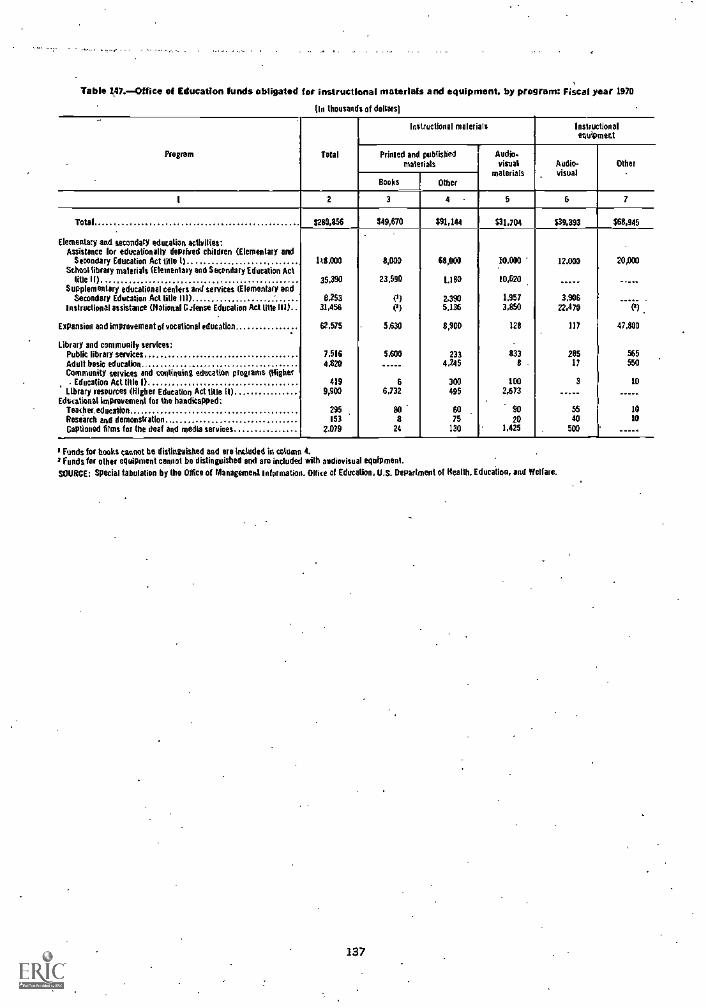
Table 107.-Office of Education funds obligated for instructional materials and equipment, by program: Fiscal year 1970
(In thousands of dollars)
Program Total
Instructional melerials Instructionalequipment-I
Printed and publishedmaterials
Audio.visual
materialsAudio-visual
Other
Books Other
1 2 3 4 5 6 7
Total 5280,856 549,670 591,144 531,704 539,393 $68,945
. .
Elementary and secondary education activities:Assistance for educationally deprived children (Elementary and
Secondary Education Act title 1) 148,000 8,000 68,000 10,000. 12.000 20,000School library materials (Elementary and Secondary Education Act
title It) 35,390 23,590 1,180 10,620 .....Supplementary educational centers and services (Elementary and
Secondary Education Act bile Ill) 8.253 (I) 2,390 1,957 3,906instructional assistance (National G.rfense Education Act Bute III) 31,456 (r) 5,136 3,850 22,470 (2)
Expansion and improvement of vocational education 62,575 5,630 8,900 128 117 47,800
Library and community services: .
Public library services 7,516 5,600 233 833 285 565Adult basic education 4.820 4,245 8 - 17 550
Community services and continuing education programs (Maher. Education Act title 1) 419 6 300 100 3 10
Library resources (Higher Education Act title II) 9,900 6,732 495 2,673Educational Improvement for the handicapped: .
Teacher. education 295 so 60 . 90 56 10Research and demonstration 153 3 75 20 40 10
Captioned Rims for the deaf and media services 2.079 24 130 1,425 500
/ Funds for books cannot be distinguished and ere included in column 4.Funds for ether equipment cannot be distinguished and are included with audiovisual equipment.
SOURCE: Special tabulation by the °Mae of Management Information. ORice of Education, U.S. Department of health. Education, and Welfare.
137
Chapter VSelected Statistics Related to Education in the United States
This chapter consists of a collection of miscellane-ous tables which do not fit readily into one of theother chapters. They were selected because theyare closely related to education in the United Statesand are of general interest. They are arranged insix major categories: (1) Employment status andjob opportunities of persons completing educationalprograms and of school dropouts, (2) internationaleducation, (3) library and public television statis-tics, (4) research and development, (5) equal edu-cational opportunity, and (6) National Assessmentof Educational Progress.
Included in the first group of tables are datafrom the Bureau of Labor Statistics on the employ-ment of recent high school and college graduatesand dropouts. Other tables provide informationfrom the College Placement Council on the salariesoffered candidates for bachelor's, master's, anddoctor's degrees-
The section on international education containsdata from the Instititute of International Educationon American college students and college facultyabroad and on foreign students enrolled in Amer-ican institutions of higher education. Also includedis a table showing Office of Education data on theenrollment of foreign students in each State in thefall of 1968. Two other tables provide statisticsfrom the United Nations Educational, Scientific andCultural Organization (UNESCO) on population andschool enrollment for the world, the continents, andselected countries. The figures in these latter tablesshow general magnitudes only, but they are suitablefor making rough comparisons among countries.The enrollment estimates were prepared in a varietyof ways and for different years, and the enrollment
139
groupings by level are not strictly comparable fromone country to another.
The third group of tables contains Office of Edu-cation statistics on public libraries and college anduniversity libraries. Also included are data fromPublisher's Weekly and the Library Journal ontrends in the prices of books and periodicals. Atable summarizing the activities of public televisionstations has been added to the section this year.
The fourth group of tables relates to the generalarea of research and development Included is atable showing the number and median salary ofscientists on the National Science Foundation'sNational Register of Scientific and Technical Per-sonnel by field and by type of employer. Anothertable contains Office of Education estimates ofexpenditures for educational research. Other tables,utilizing data obtained from the National ScienceFoundation. show the amounts and sources offunds used for research and development. Statisticson Federal funds for research and development arenot included in this section but may be found inchapter IV.
The next group of tables presents data from theCommissioner's report on Equality of EducationalOpportunity, released by the Office of Education in1966, and from a recent press release distributedby the Office of the Secretary of Health, Education,and Welfare.
The final group of tables was derived from theNational Assessment of Educational Progress.Summary data are presented on the performanceof persons in various age groups in the areas ofwriting. citizenship, science, reading, and literature.
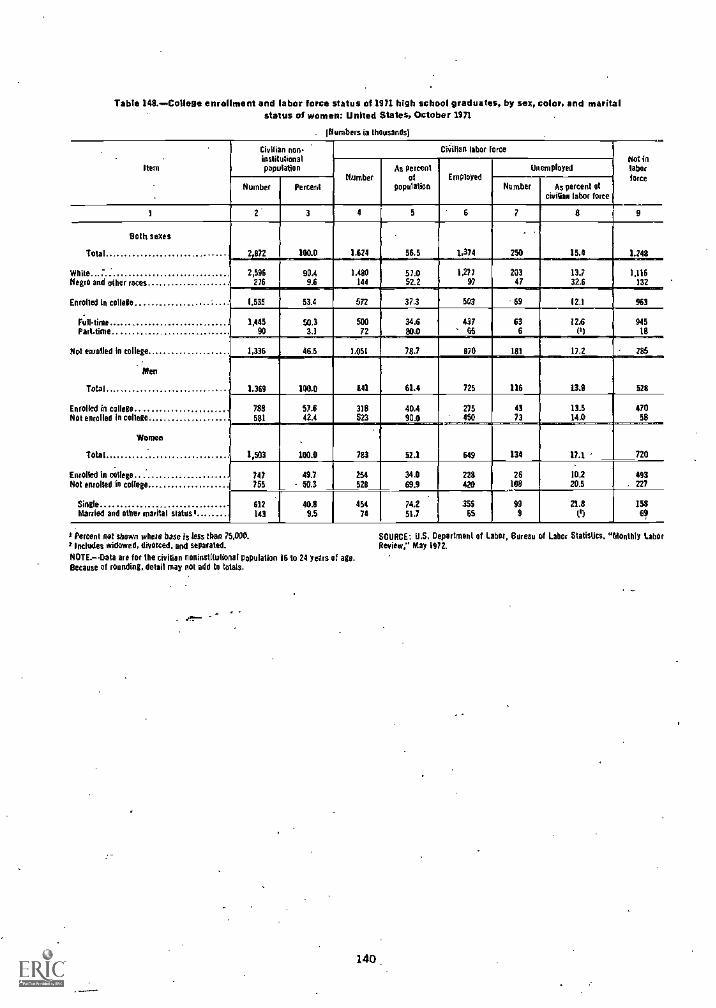
Table 148...College enrollment and labor force status of 1971 high school graduates, by sex, color, and maritalstatus of women: United States, October tan
'Numbers in thousands)
Item
Civilian non.institutionalpopulation
ci4ilian labor forceNot inlaborforceNumber
As percentof
PopulationEmployed
Unemployed
Number Percent Somber As percent ofciviGan labor force
1 2 3 4 5 6 7 8 9
Both sexes
Total i 2,872 100.0 1.624 56.5 1.374 250 15.4 1.248
White 2,596 90.4
...
1,480 57.0 1,277 203 13.7 1.116
Negro and other races 276 9.6 144 52.2 97 47 32.6 132
Enrolled in college 1,535 53.4 672 37.3 503 69 12.1 963
full-time... 1,445 50.3 500 34,6 437 63 12,6 945Part-time 90 3.1 72 80,0 ' 66 6 131 18
Not enrolled in college 1,336 46.5 1,051 78.7 870 181 17.2 285
Men
Total 1.369 100.0 141 61.4 725 116 13.0 528
Enrolled in college 788 57.6 318 40,4 275 43 13.5 470Not enrolled in college 581 42.4 S23 90.0 . 450 73 14.0 58
Women
..
Total 1,503 100.0 783 52.1 649 130 17.1 720
Enrolled in college 747 49.7 254 34.0 228 26 10.2 493Not enrolled In college 755 50.3 528 69.9 420 108 20.5 . 227, .
Single 612 40.8 454 742 355 99 21.8 158Married and other marital status= 143 9.5 74 51.7 65 9 II7 41
r Percent not shown where base is less than 75,000.k Includes widowed, divorced, and separated.
NOTE.-Data are for the civilian neninstdulional population 16 to 24 years of age.Because of rounding, detail may not add to totals.
SOURCE: U.S. Department of Labor, Bureau of Labor Statistics. "Monthly LaborReview," May 1972.
140
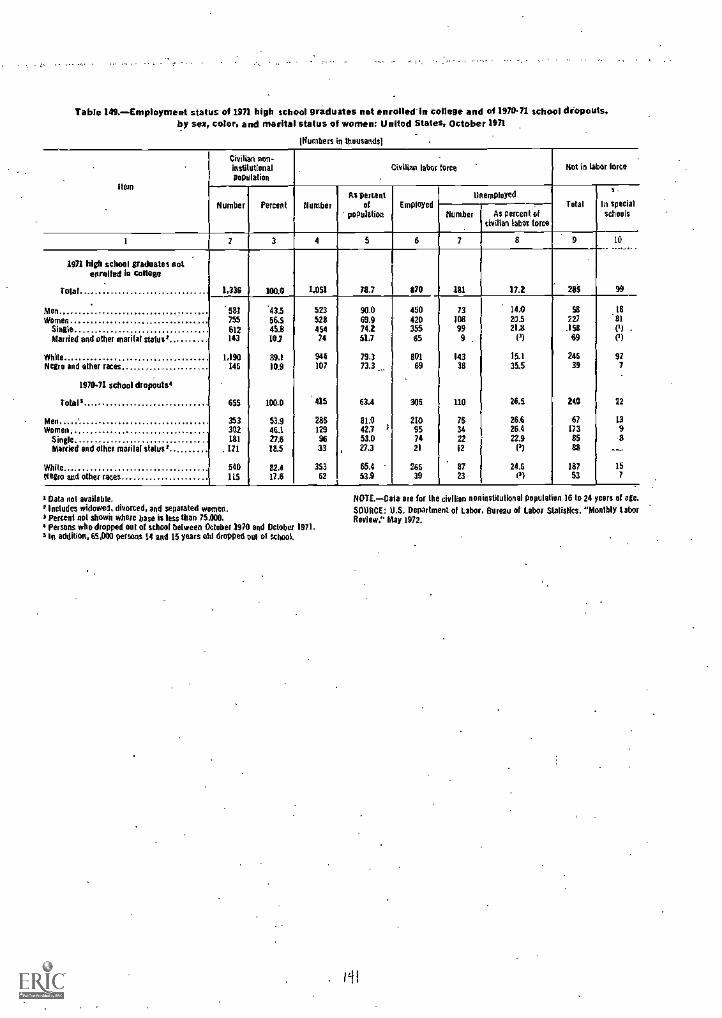
Table 149.-Employment status of 1971 high school graduates not enrolled-in college and of 1970.71 school dropouts,by sex, color, and marital status of women: United States, October 1471
'Numbers in thousands)
Item
Civilian non-insti odium'population
Civilian labor force Not in labor torte
Number Percent NumberAs percent
ofpopulation
EmployedUnemployed
Total
iIn specialschoolsNumber As percent of
civilian labor force
1 2 3 4 5 6 7 8 9 10
1971 high school graduates notenrolled lo college
Total 1,336 100.0 1.051 78.7 870 181 17.2 284 99
Men 581 43.5 523 90.0 450 73 14.0 58 18
Women 755 56.5 528 69.9 420 108 20.5 227 81
Slagle 612 45.8 454 74.2 355 99 21.8 .158 (I)Married and other marital stalest 143 00.7 74 513 65 9 . (3) 69 (9
White 1,190 89.1 944 79,3 801 143 15.1 246 92
Negro and other races
1970.71 school dropouts4
046 10.9 107 73.3 69 38 35.5 39 7
Totals 655 100,0 415 63.4 305 110 26.5 240 22
Men ' 353 53,9 286 81.0 200 76 26.6 67 03
Women 302 46.1 129 423 1 95 34 26.4 073 9Single Ill 27.6 96 53.0 74 22 22.9 SS -8Married and other menial stalest 021 18.5 33 , 27.3 21 12 (I 88 --
White 540 82.4 353 66.4 266 87 24.6 187 15
Negro and other races 1LS 17.6 62_i
53.9 39 23 (3) 53 7
'Data not available,5 Includes widowed, divorced, and separated women.5 Percent not shown where base is less than 75,000.4 Persons who dropped out of school between October 1970 and October 1971.5 in addition, 65,000 persons 14 and 15 years old dropped out of school.
NOTE. -Data are for the civilian noninsbtulional populat on 16 to 24 years of age.
SOURCE: U.S. Department of Labor, Bureau of Labor Statistics. "Monlbly LaborReview," May 1972.
i i I
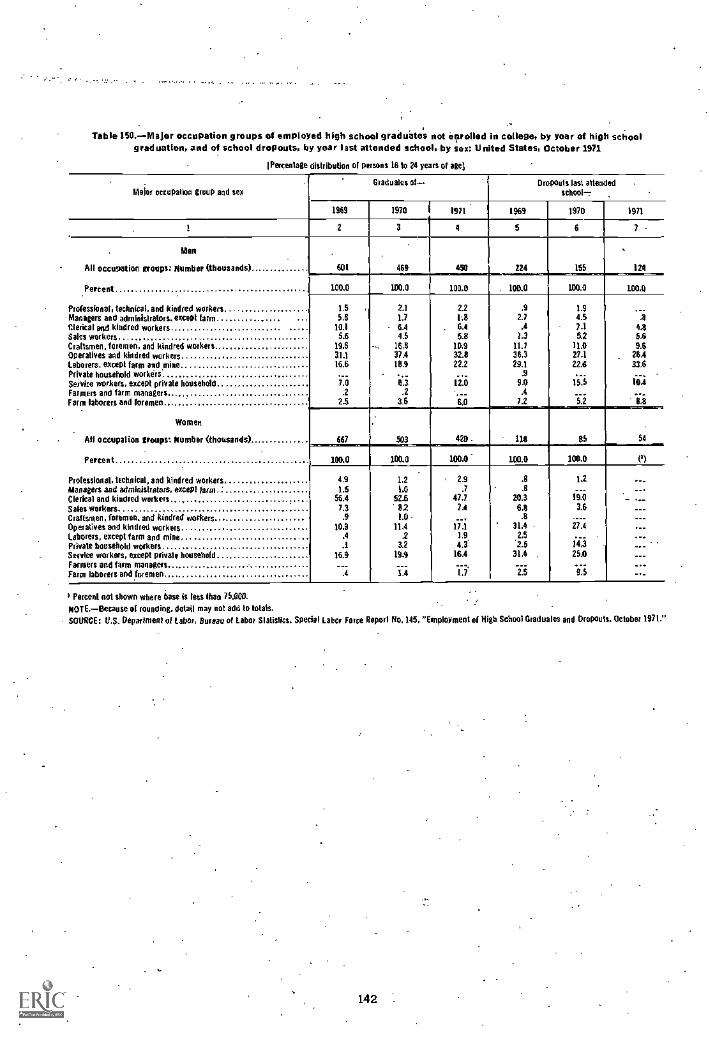
. .... .
Table 150.-Major occupation groups of employed high school graduates not enrolled in college, by year of high schoolgrad mutton, and of school dropouts, by year last attended school, by sex: United States. October 1971
'Percentage distribution of persons 16 to 24 years of ages
Maier occupation group and sexGraduates of- Dropouts last attended
school
1949 1970 I (911 1969 1970 1971
1 2 3 4 5 6 7
Men
All oCcuaetion groups: Number (thousands) 601 469 450 224 155 129
Percent 100.0 100.0 100.0 100.0 100.0 100.0
Professional, technical, and kindred workers 1.5 2.1 2.2 ,9 1.9-.8Managers and administrators. except farm 5.8 1.7 12 2.7 4.5
Clerical and kindred workers 10.1 6,4 . 6.4 .4 7.1 4.8Sales workers 5.6 4.5 5.8 /.3 5.2 5.6Craftsmen, foremen, and kindred workers 19.6 162 10.9 11.7 11.0 9.6Operatives and kindred workers 31.1 37.4 32.8 36.3 27.1 26.4
laborers, except farm and mice 16.6 10.9 22.2 29.1 22.6 33.6Private household workers.Service workers, except private household 7.0 Ili 82.0
39.0 15.5 10;1
Fanners and farm managersFarm laborers and foremen
.2
2.5.2
3.6 6,0.4
7.2 5.2 8.8
Women
All occupation groups'. Number (thousands) 667 503 420 - 118 85 54
Percent 100.0 100.0 100.0 100.0 300.0 (11
Professional, technical, and kindred workersManagers and administrators, except farm
4.91.5
1.21.0
2.9.7
.8
.812
Clerical and kindred workers 56.4 52.6 47.7 20.3 19.0
Sales workers 7.3 82 2.4 6.8 3.6Craftsmen, foremen, and kindred workers .9 1.0 - .8Operatives and kindred workers 10.9 11.4 1.7.1 31.4 27.4
Laborers, except farm and mine A 2 1.9 2.5
Private household workers .1 32 4.3* '2.5 14,3
Service workers, except private household 16.9 19.9 16.4 31.4 , 25.0
Farmers and farm managersFarm laborers and foremen .i 1i 13 2.5 "5
$ Percent not shown where base is less than 75.000.
14076.-Because of rounding, detail may not add to totals.SOURCE: U.S. Department of Labor, Bureau of Labor Slatislks. Special Labor Force Report fro, 145, "Employment of High School Graduates and Dropouts. October 1471."
142
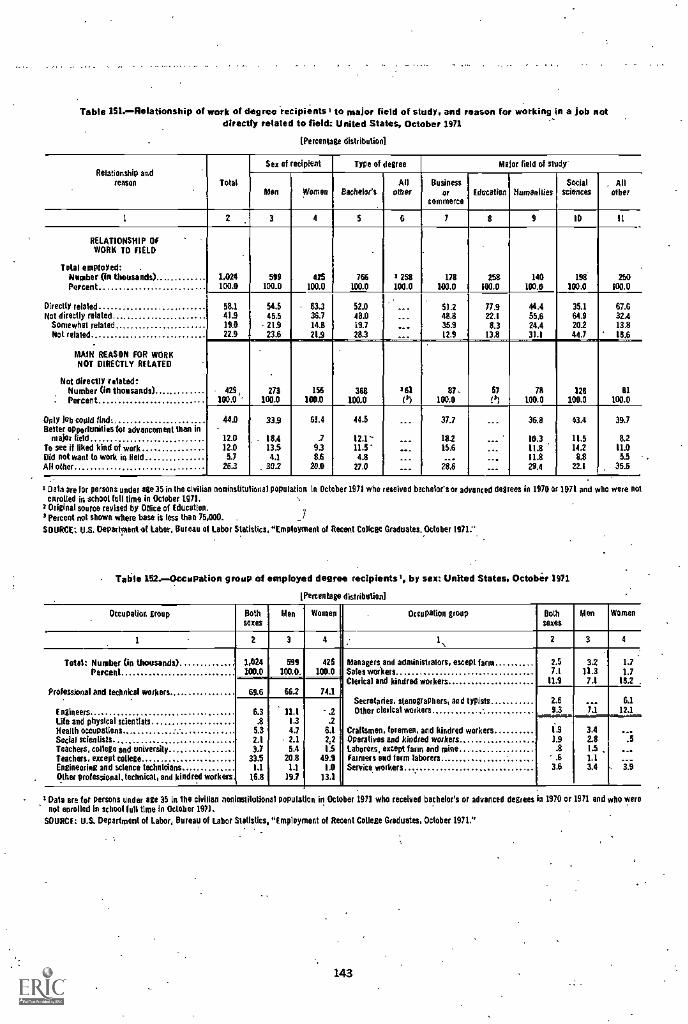
Table 151.-Relationship of work of degree recipients' to major field of study, and reason for working in a job notdirectly related to field: United States, October 1972
[Percentage distribution]
Relationship andseason Total
Sex of ecipient Type of degree Me or field of study-
Men Women Bachelor'sAll
other
,--Business
orcommerce
Education HumanitiesSocial
sciences. All
other
1 2 3 4 5 6 7 8 9 10 11
RELATIONSHIP OFWORK TO FIELD
Total employed:Member (In thousands) 1,024 599 425 766 3 258 178 258 140 199 250Percent 100.0 100.0 100.0 100.0 100.0 100.0 100.0 100.0 100.0 100,0
Directly related 58.1 54.5 63.3 52.0 ___ 51.2 77.9 44.4 35.1 67.6Not directly related 41.9 45.5 36.7 49.0 ___ 48.8 22.1 55.6 64.9 32.4
Somewhat related 19.0 21.9 143 19.7 ... 35.9 8.3 24.4 20.2 13.8Not related 22.9 23.6 1 21.9 28.3 ___ 12.9 13.8 31.1 44.7 ' 18.6
MAIN REASON FOR WORKNOT DIRECTLY RELATED
Not directly related:Number (In thousands) - 429 273 156 363 361 8?. 57 78 128 al
: Percent 100.0 ,. 100.0 100.0 100.0 0) 100.0 0) 100.0 100.0 100.0
Drily job could find 44.0 33.9 51.4 44.5 ___ 37.7 --- 36.8 43.4 39.7Better opportunities for advancement thm in
niaier field 12.0 . 18.4 .7 12.1" ___ 18.2 10.3 11.5 8.2To see if liked kind of work 12.0 13S 9.3 111 ' .._ 153 11.8 142 ILODid not want to work in Held 5.7 4.1 8.6 4.8 ___ ... 11.8 8.8 5.5MI other., 26.3 . 302 20.0 27,0 ___ iiii ___ 29.4 22.1 35.5
1 Data are for persons under age 35 in the civilian noninstitu lanai population In October 1971 who received b cltelor's or advanced deg ees in 1970 0 1971 and who were notenrolled in school full time in October 1971. ..
3 Original source revised by Office of Education.i Percent not shown where base is less than 75,000. .
SOURCE-. U.S. Department of Labor, Bureau of Labor Statistics, 'Employment of Recent College Graduates, October 1971.".
Table M.-Occupation group of employed degree recipients, by sex: United States, Octobir 1971
'Percentage distribetion]
Occupation group Bothsexes
Men Women Occupation group Bothsexes
Men Women
1 2 3 4 1,, 2 3 4
Total: Number (in thousands)Percent
Professional and technical workers
EngineersLife and physical scientistsHealth occupationsSocial scientistsTeachers, college and universityTeachers, except collegeEngineering and science techniciansOther professional, technical, and kindred workers.
1.024100.0
99100.0,
425100.0
Managers and administrators, ascent farmSales workersClerical and kindred workers ...
Secretaries, stenographers, and typistsOther clerical workers
Craftsmen, foremen, and kindred workersOperatives and kindred workersLaborers, except tam and mineFarmers and farm laborersService workers
2.57.1
11.9
.13.2
11.37.1
.
1.71.7182 .
69.6 662'
74.12.6993
. .7.1
6.112.16.3
.85.32.1
3333.5
1.116.8
ILI1.34.72.15.4
20.81.1
/9.7
I.2
6.12.2IS
4931.0
13.1
1.97.9.8.6
3.6
3.42.81.5 ,1.13.4
....5
...3.9
Data are for persons under age 35 in the civilian nosinstitutional population in October 1971 who received bachelor's or advanced degrees in 1970 or 1971 and who werenot enrolled in school lull time In October 197/.
SOURCE: U.S. Department of Labor, Bureau of Labor Statistics, "Employment of Recent College Graduates, October 1971."
143
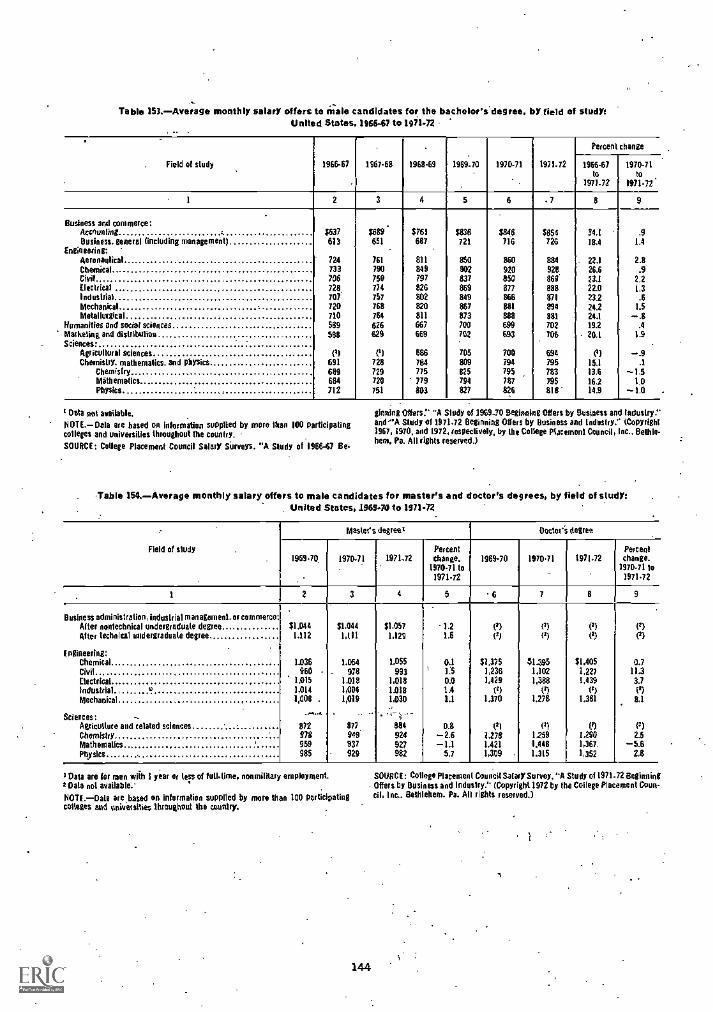
Table 153.-Average monthly salary offers to finale candidates for the bachelor's degree, by field of study:United States, 195647 to 1971-72
Field of study 1966-67
.
1967-68
.
1968-69 1969-70 1970-71 1971-72
Percent change
1966-67to
1971.72
1970-71to
1971-72
1 2 3 4 5 6 7 8 9
, .
Business and commerce:Accounting $637 $689 3761 $836 $846 $854 34.1 .9Business. general (including management) 613 651 687 721 716 726 184 1.4
Engineering:Aeronaulical 724 NI 811 850 860 884 . 22.1 2.8Chemical 733 790 849 902 920 928 26.6 .9Civil 706 750 797 837 850 869' 23.1 2.2Electrical 728. 774 826 869 877 888 22.0 1.3Industrial 707 757 802 849 866 071 23.2 .6Mechanical . 720 768 820 867 881 894 24.2 1.5Metallurgical 710 764 811 873 888 831 24.1 -.8
Humanities end social sciences 589 626 667 700 699 702 19.2 .4Marketing and distribution 538 629 669 702 693 706 - 20.1 1.9Sciences-
Agricultural sciences (1) (s) 686 705 700 694 (') -.9Chemistry, mathematics, and physics 691 728 784 809 794 795 15.1 .1
Chemistry 689 729 775 825 795 783 13.6 -1.5Mithematics 684 720 779 794 787 795 16.2 1.0Physics 712 751 803 827 826 818 14.9 -1.0
Data not available.
ROTE. -Gala are based on information supplied by more than 100 participatingcolleges and universities throughout the country.
SOURCE: College Placement Council Salary Surveys. "A Study of 196647 Be-
ginning Offers:' "A Study of 1969-70 Beginning Offers by Business and indlmllY."and-"A Study of 1971.72 Beginning Offers by Business and Industry." (Copyright1967, 1970, and 1972, respectively, by the College Placement Council, Inc., Bethle-hem, Pa. All rights reserved.)
Table 154.- Average monthly salary offers to male candidates for master's and doctor's degrees, by field of study:United States, .196940 to 1971-72
Field of study
Master's degrees °otter's degree
1969.70 1970-71 1971-72Percentchange.
1970-71 to1971.72
1969.70 1970.71 I 1971.72Percentchange,
1970-71 to1971.72
1 2 3 4 5 -6 7 9
Business administration, industrial management, or commerce:After nontechnical undergraduate degree $1,044 31,044 31,057 1.2 (a) (5) (a) (a)After technical undergraduate degree 1,112 1,01 1,129 1.6 (2) (a) (a)
Engineering:Chemical 1,036 1,054 1,055 0.1 31,375 31.395 $1,405 0.7Civil 960 978 993 1:5 1,236 1,102 1,227 11.3Electrical 1.015 1,018 1,018 0.0 1,429 1,388 1,439 3.7industrial 1,014 1,004 1.038 1.4 fa) ia)Mechanical 1,008 . 1,019 1,030 1.1 1,370 1,278 1,381 8.1
Sciences:Agriculture and related sciences 872 877 884 0.8 (al (a)
Chemistry 978 949* 924 -2.6 1,278 1.259 1,290 2.5Mathematics 959 937 927 -1.1 1,421 1,448 1,367 -5.6Physics 985 929 982 5.7 1,309 1.315 1,352 2.8
3 Data are for men with 3 year or less of full-lime, nonmilitary employment:Data not available:1107E. -Dale are based on information supplied by more than 100 participatingcollevrs and Universities throughout the country.
144
SOURCE: Col ego Placement Council Salary Survey, "A Study of 1971 72 BeginningOffers by Business and industry." (Copyright 1972 by the College Placement Coun-cil, Inc., Bethlehem, Pa, All rights reserved.)
3

Table 1550...United States college faculty abroad, -by country Table 156.-United States college students abroad, by countryand by field of interest:1970-71
Country and field of interestCollege facts Ity abroad
Number Percent
1 2 3
Total 6,291 100.0
Country:United Kingdom 955 15.2France 387 6.2Germany, Federal Republic of 371 5.9Italy 242 3.8India 239 3.3
Israel 164 2.6Spain, 155 2.5Switzerland 148 2.4Japan 140 2.2Mexico 134 2.1
Canada 95 1.5Brazil 90 1.4Aiistralia. 84 1.3Austria.. 84 1.3Nelbertands 81 1.3
Other countries 2.922 46.4
Field of interest:Humanities 1,969 30.3Social sciences .1,466 23.3Physical and life sciences 1,334 21.2Education 416 6.6Medical sciences 353 5.6
Agriculture 308 4.9Engineering 296 4.7
'Business administration 161 2.6Other or field unknown. 48 .8
NOTE. - Because of rounding, percentages may not add to 100.0.
SOURCE: institute of International Education, New York. "Open Doors 1971."
and by field of study: 1969.70
Country and field of studyCollege students abroad
Number Percent
2 3
Total 32,148 100.0
Country: .
France.. 6.219 19.3Canada 5.447 16.9Mexico 4,402 13.7Germany, Federal Republic of 2,182 6.8United Kingdom 2,093 6.5
Italy 1,662 5.2Israel 1,594 5.0Spain 1,442 4.5Japan 1.051 3.3Philippines 1.017 3.2
Belgium 762 2.4Switzerland 684 2.1Colombia 590 1.8Sweden 388 1.2Vatican City State 343 1.1
Oilier countries 2,272 7:1
Field of stody:Humanities 12,629 39.3Medical sciences 3.885 12.1Social sciences .. 3,826 11.9Physical and tile sciences 1,363 42Business administration 550 2.0
Education 546 .
Engineering 434 IAAgriculture 72 .2Other fields 8.743 272
145
N078.-8444844 of rounding, percentages may not add lo 100.0.
SOURCE: Institute of International Education, New York, "Open Doors 19717.
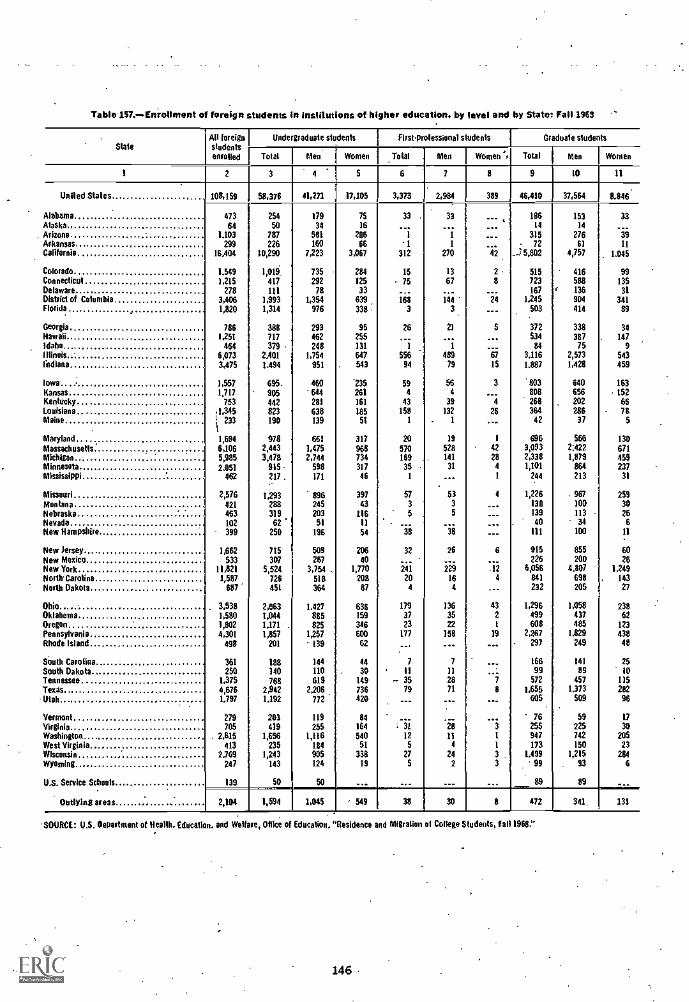
Table 157.-.Eitiolletent of foreign students in institutions of higher education, by level and by State: Fall 1963
StateAll foreignstudentsenrolled
Unde graduate students First-prolessional students Graduate students
Total Men Women Total Men,
Women , Total Men Women
1 2 3 5 6 7 8 9 10 it
Willed States 108,159 58,371 41,271 17,105 3,373 2,984 389 46,410 37,564 8.846
Alabama 473 254 179 75 33 . 33 186 153 33Maska 64 50 34 16 ._. _.. ... 14 14
Arizona 1,103 787 581 206 1 1 __ 315 276 39Arkansas 299 226 160 16 1 1 ... 72 61 11
California 16,404 10,290 7,223 3,067 312 270 42 _....: 5,802 4,757 1.045
Colorado 1,549 1,019. 735 284 15 13 2 515 416 99Connecticul 1,215 417 292 125 75 67 8 723 588 135Delaware 278 Ill 78 33 167 ' 136 31District of Columbia 3,406 1,993 1,354 639 168 144 24 1,245 904 341Florida , 1,820 1,314 976 338 : 3 3 __ 503 414 89
Georgia 786 388 293 95 26 21 5 372 338 34Hawaii 1.251 717 462 255 .. --- ... 534 387 . 147Idaho 464 379 248 131 1 1 --. 84 75 9Illinois 6,073 2,401 1,754 647 556 489 67 3,116 2,573 543ildiana 3,475 1.494 951 . 543 94 79 15 1.887 1,428 459
Iowa 1,567 695. 460 '235 59 56 3 '803 640 163
Kansas 1,717 905 '644 261 4 4 ... 808 156 152Kentucky 753 442 281 161 43 39 4 268 202 66
Louisiana .1,345 823 638 185 158 132 26 364 286 - 78Maine
.
z 2331
190 139 51 1 . 1 ... 42 37 5
Maryland 1,694 978 661 317 20 19 I 696 566 130Massachusetts 6,106 2,443 1,475 968 570 528 . 42 3,093 2;422 671Michigan 5,985 3,478 2,744 734 169 . 141 28 2,338 1,879 459Minnesota 2.051 915- 598 317 35 31 4 1,101 864 237Mississippi 462 217. 171 46 1 ... 1 244 213 31
Missouri 2,576 1.293 896 397 57 53 4 1,226 . 967 259Montana 421 288 245 43 3 3 ... 130 100 30Nebraska 463 319 203 116 5 5 ___ 139 113 26Nevada 102 62 51 11
-ii... 40 34 6
New Hampshire 399 250 196 54 38 ... ill 100 11
New Jersey 1,662 715 509 206 32 21 6 915 855 10New Mexico 533 307 267 40 226 200 26
New York 11,821 5,524 3,754 _ 1,770 241 229 li 6,056 4.807 1,249NorthCarolina 1,587 721 518 208 20 16 4 841 198 143North Dakota 687' 451 364 87 4 4 ... 232 205 27
Thin 3,538 2,063 1.427 636 179 136 43 1,296 1,058 238Oklahoma 1,580 1,044 885 159 37 35 2 499 437 62Dragon 1,802 1,171 . 825 346 23 22 1 608 485 123Pennsylvania 4,301 1,857 1,257 600 177 158 19 2,267 1,829 438Rhode Island 498 201 139 62 _. ... ... - 297 249 48
louth Carolina 361 188 144 44 7 7 166 141 25South Dakota 250 140 110 . 35 11 11 99 89 10
rennessee. 1.375 768 619 149 - 35 28 7 572 457 115Was 4,676 2,942 2,206 736 79 71 8 1.655 1.373 282Utah 1,797 1,192 772 420 ___ ... ... 605 509 96
Vermont 279 203 119 84"ii
... 76 59 17
Virginia 705 419 255 164 ;-ii 3 255 225 30Washington 2,615 1156 1,116 540 12 11 t 947 742 205Nest Virginia 413 235 184 51 5 4 1 173 150 23
Wisconsin 2,769 1,243 905 338 27 24 3 1,499 1,215 284Wyoming 247 143 124 19 5 2 3 99 . 93 6
U.S. Service Schools 139 50 50 --- ___ ... 89 89 ---. .
Outlying areas 2,104 1,594 1,045 - 549 38 30 B 472 341. 131
.SOURCE: U.S. Department of Health, Education, and Welfare, Office of Education, "Residence and Migration of College Students, fal11968:'
146 -
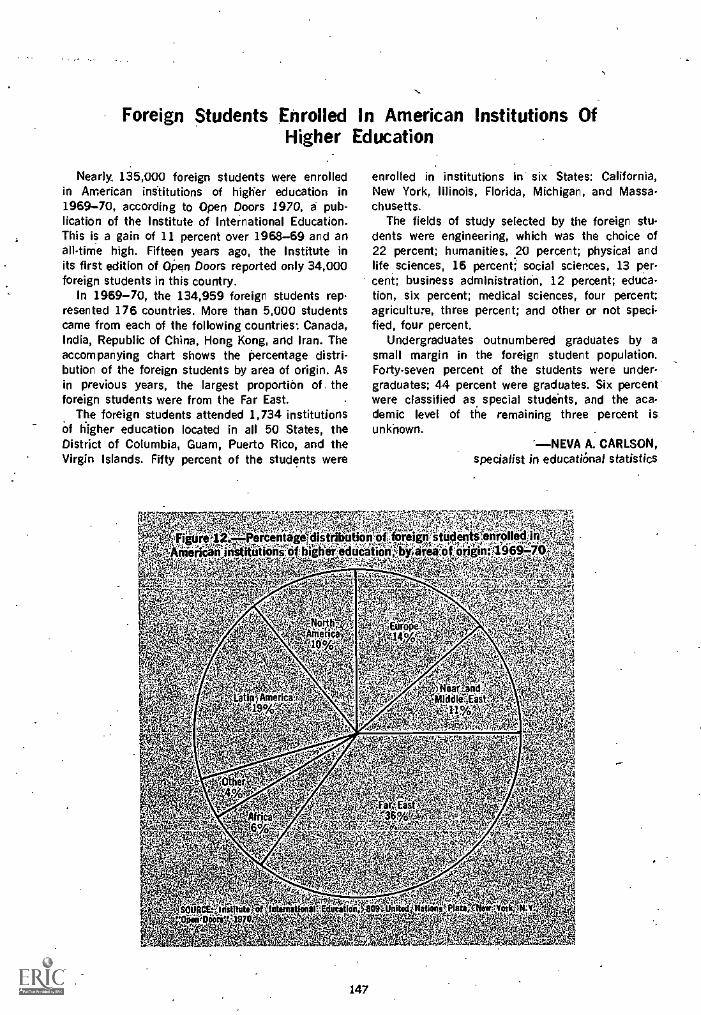
Foreign Students Enrolled In American Institutions OfHigher Education
Nearly., 135,000 foreign students were enrolledin American institutions of higher education in1969-70, according to Open Doors 1970, a pub-lication of the Institute of International Education.This is a gain of 11 percent over 1968-69 and anall-tinie high. Fifteen years ago, the Institute inits first edition of Open Doors reported only 34,000foreign students in this country.
In 1969-70, the 134,959 foreign students rep-resented 176 countries. More than 5,000 studentscame from each of the following countries: Canada,India, Republic of China, Hong Kong, and Iran. Theaccompanying chart shows the percentage distri-bution of the foreign students by area of origin. Asin previous years, the largest proportion of. theforeign students were from the Far East.
The foreign students attended 1,734 institutionsOf higher education located in all 50 States, theDistrict of Columbia, Guam, Puerto Rico, and theVirgin Islands. Fifty percent of the students were
enrolled in institutions in' six States: California,New York, Illinois, Florida, Michigan, and Massa-chusetts.
The fields of study selected by the foreign stu-dents were engineering, which was the choice of22 percent; humanities, 20 percent; physical andlife. sciences, 16 percent; social sciences, 13 per-cent; business administration, 12 percent; educa-tion, six percent; medical sciences, four percent;agriculture, three percent; and other or not speci-fied, four percent.
Undergraduates outnumbered graduates by asmall margin in the foreign student population.Forty-seven percent of the students were under-graduates; 44 percent were graduates. Six percent'were classified as special studehts, and the aca-demic level of the remaining three percent isunknown.
"NEVA A. CARLSON,specialist in educational statistics
147

Table 158.-11 mnber of foreign students enrolled in American institutions of higher education, by area of origin: 145445 to 1970.71
Academic year Total
Area of origin
far EastNear and
Middle East Europe*Latin
AmericaNorth
America* Africa OceaniaStateless
or countryunknown
1 2 3 1 6 7 10 11
. .
1954.55 34,232 9,838 4,416 5,196 8,446 4,714 1,234 337 -9 421955-56 36,494 11,202 4,662 5,502 8,474 5,042 1,231 353 2 261956.57 40.666 '12,949 5,243 5,996 9,110 5,444 1,424 424' 9 671957-58 43,391 14.206 5,695 6,816 9,212 5,354 1,515 495 21 771958.59 47,245 15,823 6,619 6,601 10,249 5,512 1.735 . 612 5 89
1959-60 48.486 17,175 7,110 6,382 9,428 5,761 1,959 568 30 931960.61 53,107 19,222 7,862 6,686 9,626 6,128 2,831 658 16 781961.62 511,086 21.568 8,277 6.833 9,915 6,639 3,930 796 37 91196243 64,705 23,768 8,847 7,888 11,021 7,089 4,996 948 35 113196344 74,814 26,531 10,131 9,298 12.882 8,548 6,144 1,080 50 150
a196445 82.045 29,400 11,217 10,073 . 13,657 9,338 6,855 1,265 35 205196546 82,709 29.049 11,217 10.186 13,998 9,851 6,896 1,325 40. 147
196647 100262 33,570 12,830 14,151 18.1e2 12,230 7,110 1,635 56 4381967-68 110,315 37,228 12.347 15,488 21,908 12,236 1,683 68 1,456
1968-69 121,362 42,632 13,918 16A18 23,438 12,948 6,979 1,869 35 3,125
1969-70 134,959 49.189 15,122 18 ,473 .24,991 13,415 7,607 2,077 51 4,034
1970-71 144,708 54,247 17,0;52 18,275 29,300 12.732 8,734 1,995 31 2,342
1 Excludes the U.S.S.R. (shown separately in column 10).*Excludes Mexico and Central America, which are included with Latin America.
NOTE, -- Beginning in 196647, Includes foreign students who intend to remain inthe United Slates.
'
148
SOURCE: Instituted international Education, New York, "Open boo s," 195445 to1971.
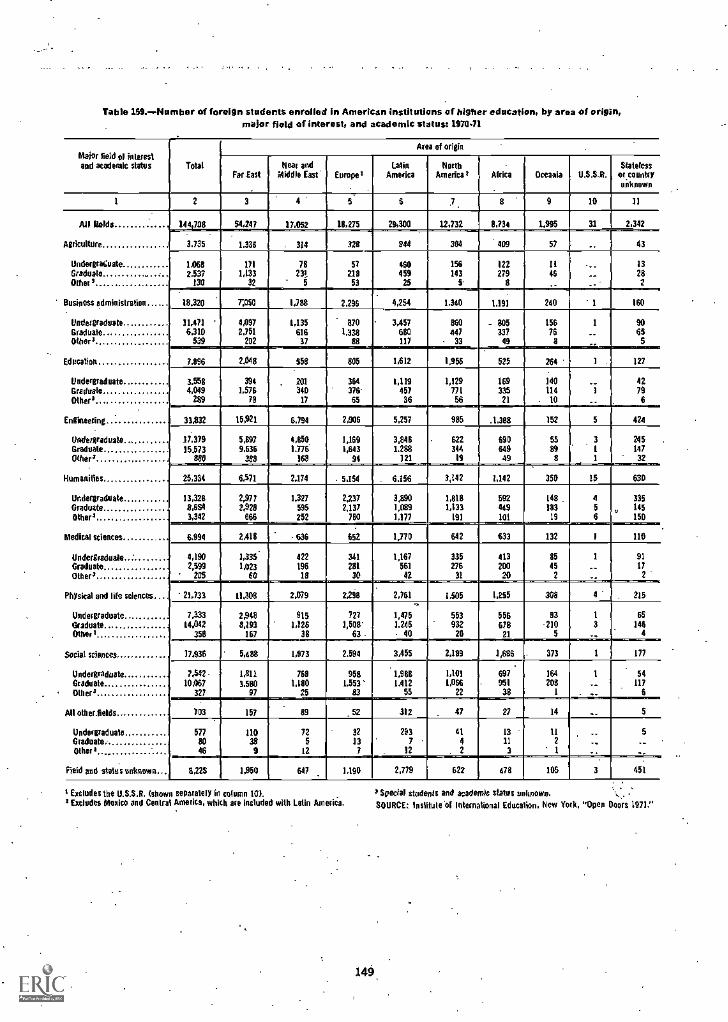
Table 169.-.Flumber of foreign students enrolled in American institutions of higher education, by area of origin,major field of interest, and academic status: 1970.71
Major field el interestand manna status Total
Area of origin
Far EastNear and
Middle East" Europe 3Lelia
AmericaMirth
America' Attica Oceania U.S.S.R.Stateless
or countryunknown
1 2 3 5- 8 9 10 11
All nerds 144,708 54,247 17,052 18,275 29,300 12,732 8,734 1,995 31 2,342
Agriculture 3,735 1.336 314 328 944 304 409 57 43
Undergraduate 1.068 171 78 57 450 156 122 11 13Graduate. 2,537 1,133 2111 459 143 279 46 28Other a 130 32 5 53 25 5 8 2
Business administration 18.320 7:050 1,788 2.296 4,254 1,340 1.191 240 1 160
Undergraduate 11,471 4,097 1,135 870 3,457 860 - 805 156 1 90Graduate 6,310 2,751 616 1,338 680 447 337 76 65Other' 539 202 37 88 117 33 49 8 5
Education 7,896 2,048 558 805 1,612 1,955 525 264 - 1 127
Undergraduate 3.558 394 . 201 364 1,119 1,129 169 140 42GraduateOther'
4,049289
3,57678
34017
376-65
45736
nl56
33521
114- 10
796
Engineering 33,832 15,21 6.794 2,906 5,257 985 .1.368 152 5 424
UodergradualeGraduate
17,37915,573
5,8979.636
4,8511
1.7761.1691,643
3,8481.288
622344
690649
5589
245147
Other' 880 388 168 94 121 19 49 8 32
Humanities 25,334 6.571 2,174 .5,I54 6.156 3,142 1,142 350 15 630
Undergraduate 13,328 2,977 1.327 2,237 3,890 1,818 592 148 . 4 335Graduate 8,564 2,928 595 2,137 1,089 1,133 449 183 5 145
Other' 3,342 666 252 730 1,177 191 101 19 6 150
Medical sciences 6.994 2,418 636 652 1,770 642 633 132 1 110
Undergraduate. 4,190 1,33s 422 341 1,167 335 413 85 1 91GraduateOther'
2,599205
1,023
6019618
28130
561
42276
31
20020
45
2
172"
Physical and lite sciences 21,733 11,308 2,079 2,298 2,761 1.505 1,255 308 4 215
Undergraduate 7.333 2,948 915 727 1,475 553 556 93 65Graduate 14,042 8,193 1,126 3,508' 1,246 932 678 -210 3 146Other 3 358 167 38 63 - - 40 20 21 4
Social sciences 17,936 5,418 1,973 2,594 3,455 2,189 1,685 373 1 177
Undergraduate 7,542 - 1,811 7611 958 1,9811 1,101 697 164 1 54Graduate 10,067 3.580 1,180 1,553' 1.412 1,066 951 208 117
Other' 327 97 25 83 55 22 38 1
All other.gelds ... 703 157 89 312 47 27 14 5
Undergraduate 577 110 72 32 293 41 13 11 5
Graduate 80 38 5 13 7 4 11 2
Other 46 9 12 7 12 2 3 1
field and status unknown 8225 1,950 647 1.190 2,779 622 478 105 3 451
I Excludes the U.S.S.R. (shown separately hi column 10).Excludes Mexico and Central America, which are included with Latin America.
) Special students and academic slates unknown.
SOURCE: Institute el International Education, New York, "Open Doors 1971."
140.
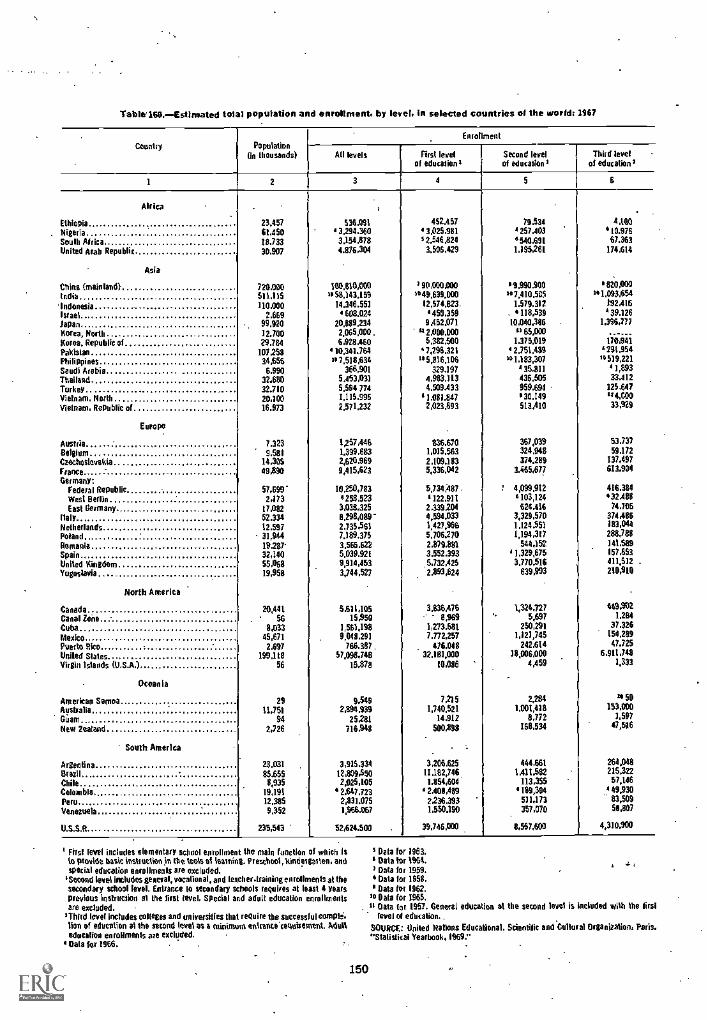
.
'fable 16C-estimated total population and enrollment, by level, in selected countries of the world:1967
Country Population(in thousands)
Enrollment
All levels First levelof educations
Second levelof educalion 2
Third levelof education'
1 2 3 I 5 6
Africa
Ethiopia 23.457 536.091 452,457 79.534 4,1x0
Nigeria 69,450 " 3,294.360 " 3,025,981 3 257,403 't0.976Sou lh Africa 18,733 3.154,878 12.546,824 "540.691 67.363
United Arab Republic 30.907 4.876,304 3.506,429 1,195261 174,614
Asia
Chins (mainland) 720,000 100,810,000 s 90,000,000 09,990.900 082000India 511,115 958.143.159 "49.639.000 97.410.565 91293254
'Indonesia 110.000 14,346.551 12,574,823- 1,579,312 192,416
luael. 2,669 " 608.024 ,450,359 . *118.539 3 39,126
Japan 99,920 20.889,234 9.452271 10.040,386 1,336,777
Korea, North 12.700 2265,000 . n2.000,000 It 65.000
Korea. Republic of 29.784 6,928.460 5.382,930 1,375,019 170,941
Pakistan 107,258 '10,341.764 '7,298,321 " 2,751.483 3 241,954
Philippines 34,656 97218234 105,916,106 )01,183,307 n519,221
Saudi Arabia 6.990 366,901 329.197 3 35.811 3 1,893
Thailand 32.680 5,453,031 4283.113 436,506 33.412
Turkey 32.710 5.594 774 4,509,433 959,694 125,647
Vietnam, North 20,100 1.115,996 '1,081.847 0 30,149 124,00
Vietnam, Republic or 16.973 2,571,232 2,023,893 513,410 33,929
Europe
Austria 7,323 1257,446 836,670 367,039 53,737
Belgium 9,531 1,399283 1,015,563 324,948 59,172
Czechoslovakia 14,305 2,620,969 2,109.183 374,289 137,497
France 49,890 9,415,623 5,336.042 3.465,677 613,904
Germany:Federal Republic 57,699' 10250,783 5,734;487 4,099.912 416,384
West Berlin 2,173 "258,523 0122.911 "103,124 *32,488
East Germany 17,082 3,0.38.325 2,339204 624,416 74,705
Italy 52,334 11,298,089" 4,594,033 3,329,570 374,486
Netherlands 12,597 2.735,561 1,427,966 1,124.551 183,1)44
Poland 31,944 7.189.375 5,706.270 1,194,317 288,788
Romania 19,287 3,565,622 2.879,881 544,152 141,589
Spain 32,140 5.039.921 3,552,393 0 1.329,675 157,853
United Kingdom 55,068 9,914,453 .5,732,425 3.770216 411,512 .
Yugoslavia 19,958 3,744,522 2293,624 639,993 210,910
North America
Canada 20,441 5.611,105 3,836,476 1,324,727 449,902
Canal Zone 56 15,950 - 8,969 5,697 1,2E4
Cuba 8,033 1,561,198 1,273,501 250,291 37,326
Marko 45,671 9248.291 7,772,257 1,121,745 154.289
Puerto Rico 2.697 766,387. 426.048 242,614 47,725
United Slates 199,118 57,098,748 32201,000 18,006,000 6,911,748
Virgin Islands (U.S.A.) 56 15.878 111,086 4,459 1,333
Oceania
American Samoa 29 9.549 7,215 2,284 so 50
Australia 11,751 2,894,939 1,740,521 1,001,418 153,000
Guam 94 25281 14,912 8,722 1,597
Nevi Zealand 2,726 716,948 500,893 1611,534 47,516
South America
Argentina 23,031 3,915,334 3,206,625 444,661 264,048
Brazil 85.655 12,809,650 1I,182,746- 1.411,592 215.3UChile 8,935 2,025,105 113,355 57,146
Colombia 19,191 s 2.641.723 ' 2.408,489 '189,394 3 49,930
Peru 12.385 2,831.075 2234,393 511,173 83,509
Venezuela 9,352 1,966.067 1250.110 357,070 58,807
U.S.S.R.. 235,543 52,624,500 39.14c= . 8,567,600 4,310,900
1 Firs! level includes elementary school enrollment the main (traction of which isto provide basic instruction in The toots at Wasting. Preschool, kindergarten, andspecial education engolimerds are excluded,
'Second level includes general, vocational, and leech ertraining e n rollmenfs at thesecondary school level. Enhance to secondary schools requires at least 4 yearsprevious instruction al the lint level. Special and adult education enrollmentsare excluded. -
'Third level includes colteges and universities that require the successful comPlelion of education al the second level as a minimum entiance*ceouirement. Adultedecallos enrolimenfs am excluded,
' Data far 1966. .
150
s Data for 1963.s Data for 1964.s Data for 1959.Data for 1958.9 Data for 1962.
so Oats (or 1965.u Oats for 1957. General education at the second level Is Included wish the ijfil
level of educalion..SOURCE: United Nations Educational, Scientific and Cullural Organization, Paris."Statistical Yearbook, 1969."
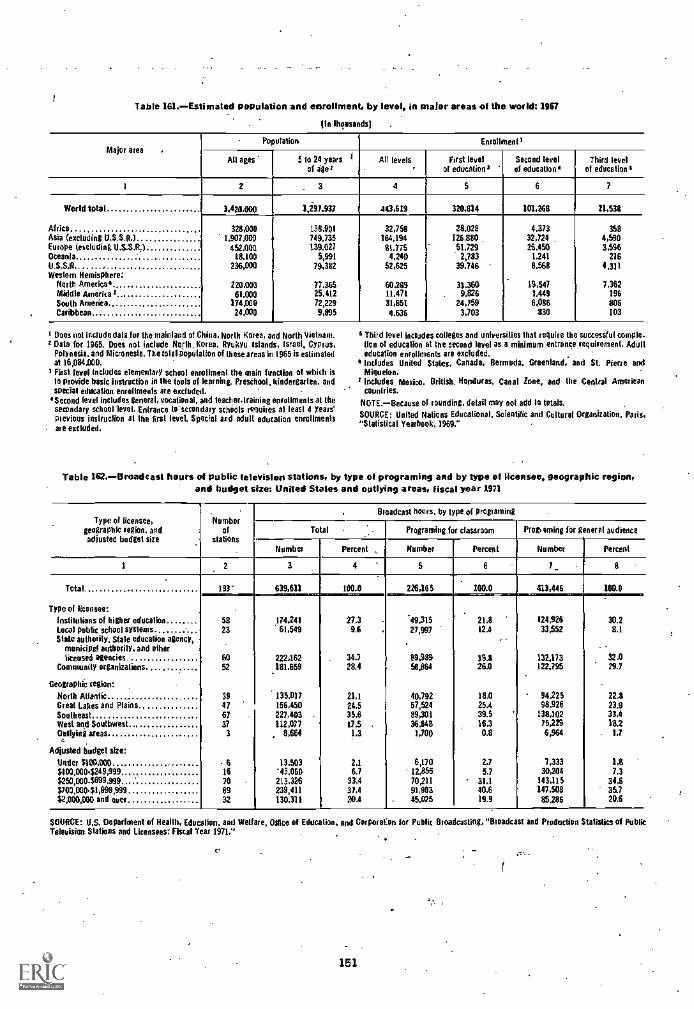
ITable 161,- Estimated population and enrollment, by level, in major areas of the world: 1967
110 Ihoasands) .
Major areaPopulation Enrollment 3
All ages 510 24 years Iof age/
All levels First levelof education'
Second Level T-of education'
Third levelof education 6
1 2 3 4 5 6 7
World total 3020,000 1,297,937 443,619 370,814 101,268 21,534
Africa 328,000 138,901 32,758 28.028 4,373 368Asia (excluding U.S.S.R.) 1.907,000 749.735 164,194 126,880 32,724 4,690Europe (excluding U.S.S.R) 452.003 139.027 81.776 61.729 25,450 3,596Oceania 18.100 5,991 4,240 2,783 1.241 216U.S.S.R 236,000 79,382 52,625 39.746 0.568 4,311Western Hemisphere:
North Americas 220.003 77.366 60269 33.361I 19,547 7,362Middle America' 61.000 25.412 11,471 . 9,826 1,449 196South Americo 174,000 72,229 31,651 24,759 6,086 806Caribbean 24,000 9,895 4.636 3,703 830 103
I Does not include dale for the mainland of China, North Korea, and North Vietnam.2 Data for 1965. Does not include North. Korea, Ryukyu Islands, Israel, Cyprus,
Polynesia, and Micronesia. The total population of these areas In 1965 is estimatedat 16,084000.
3 First level includes elementary school enrollment the main function of which isto provide basic instruction in the tools of learning. Preschool, kindergarten. andspecial education enrollments are excluded.
'Second level includes general, vocational, and leacher-training encollmenis at thesecondary school level. Entrance to'sccondary schools requires at least 4 years'previous instruction at the first level. Special and adult education enrollments
. are excluded.
Third level includes colleges and universities that require the successful comple-tion of education at the second level as a minimum entrance requirement, Adulteducation enrollments are excluded.
6 Includes United States, Canada, Bermuda, Greenland, and St. Pierre andMiquelon,
2 Includes Mexico, British. Honduras, Canal Ione, and the Central Americancountries.
NOTE.-Because of rounding, detail may not add to totals.
SOURCE: United Nations Educational, Scientific and Cultural Organization. Paris,"Statistical Yearbook, 1969:'
Table 162.-Broadcast hours of public television stations, by type of programing and by type of licensee, geographic region,and budget size: United Stales and outlying areas, fiscal year 1971
Type of licensee,geographic region, andadjusted budget size
Numberof
stations
Broadcast hours, by type of programing
Total Programing for classroom Programing for general audience
Number Percent Number Percent Number Percent
1 3 4 5 6 7 8
Total 193' 639,611 100.0 226,165 100.0 413.446 100.0
Type of licensee:
Institutions of higher education 58 174,241 27.3 49,315 210 124,926 30.2Local public school systems 23 61,549 9.6 27,997 124 33,552 8.1State authority, Stale education agency,
municipsi authority, and otherlicensed agencies 60 222,162 34.) 10,989 39.8 132.173 32.0
Community organizations 52 181.659 28.4 58,864 26.0 122,795 29.7
Geographic region:
North Atlantic 39 135,017 21.1 40,792 18.0 94,226 22.8Great Lakes and Plains 47 156,450 24.5 57,524 25.4 98,926 23.9Southeast 67 227,403 35.6 89,301 39.5 138,102 33.4West and Southwest 37 112,077 17.5 . 36.848 16.3 75,229 13.2Outlying areas 3 8,664 1,700 0.8 6,964 1.7
Adjusted budget size:
Under $100,000 -6 13,503 2,1 6,170 2.7 7,333 1.8s100,000$249,999 16 '43,050 6.7 12,855 5,7 30,204 7.3$250,000-$699,999 70 213,326 33.4 70,211 31.1 143,115 34.6$700,0001,999,999 69 239,411 37.4 91,903 40.6 147,508 35.7$2,000000 and over 32 130,311 20.4 45,025 19.9 85286 20.6
SOURCE: U.S. Department of Health, Education. and Welfare, Office of Education, and Corporal on for Public Broadcasting, "Broadcast and Production Statistics of PublicTelevision Stations and Licensees: Fiscal Year 1971.'
c-
151
f

Table 163.-General statistics of public libraries serving areas of 25,000 or more population:United States and outlying areas, fiscal year 1968
Hem
Population size group
Total,25,000
Or more
25,000-34,999
35,000-49.999
50.000-99.999
100,000499.999
500,000Or more
2 3 4 5 6 7
Number of libraries) 1.135 285 271 335 206 38Number of libraries reporting: 1,057 258 250 318 196 35Population served (thousands) 117,235 7,578 10.V1 21,986 38,157 39,194
Collections (thousands)
Number of volumes* held at end of year 191.079 14,995 18,617 34,276 61,282 61,910Number of volumes* added during year 16,648 1.317 1,359 3.020 5,803' 5.149Total circulation during year 560214 48.041 53,629 106.965 195,159 156.421
Staff (full-time equivalent)
Filled positions 46.88) 3,356 3,903 8.229 16.602 17,797
Library staff 45,635- 3,105 3,604 7,673 15,457 15.796Maintenance staff 4,252 251 299 556 1,145 2,001
Operating expenditures (thousands of dollars)
Total operating expenditures $421236 526,716 $31,170 $65,597 5137.881 $159,874
Wages and salaries 271,000 15,961 19,050 41,304 88,559 106.125
Library staff 251,043 14.868 17,757 38.662 83,098 96,657Maintenance staff 19,956 1,093 1.293 2.641 5,461 9.468
Purchase of library materials 72,491 5.417 6,199 12,135 24,202 24.537
Book stock 64,062 4,837 5,460 10,755 21,310 21,701Serials 4,820 328 418 761 1,553 1,760Other printed materialsAudiovisual materials
6632,945
58194
58263
98521
2591,081
189886
All other operating a/lea/dilutes 77,746 5,337 5,920 12,158 25,119 29,211
1 Problems of definitions and reporting did not permit the data. for one average -sized State to be included in the survey.2 The data shown below are for reporting libraries only.
includes volumes of book stock and bibliographic volumes ofserials only.
NOTE.-Because of rounding, detail may not add to totals.SOURCE: U.S. Department of Health, Education, and Welfare,Office of Education. 'Statistics 01 Public Libraries Serving Areaswith At Least 25,000 Inhabitants, 1968."
Table 164.-Ranh order of public libraries with I million or more volumes in their collections: United States, 1968
Library systenir
Rankorder
Number ofvolumes
(book stockand serials) ,
Library syslem Rankorder
Number ofvolumes
(book stockand serials)
1 2 3 1 2 3
New York Public Library 1 8,235,539 Milwaukee Public Library 14 1,976,510Chicago Public Library.. 2 . 4,067,027 Detroit Public Librrtry 15 1,903,768Los Angeles Public Library 3 3.538221Cleveland Public Library 4 3210,820 Public Library of Washington. D.0 16 1267,058 .Brooklyn Public Library t' 5 3,019,652 Public Library of Ft. Wayne and Allen County (Ind.). ... 17 1,376,446
Seattle Public Library 18 1,335.010Los Angeles County Public Library 6 2.952,855 St. Louis Public Library 19 1.266.644Free Library of Philadelphia 7 2.623.146 San Francisco Public Library 20 1,201,149CincinnaliHandllon County 8 2,533,155Boston Public Library 9 2,510.234 Kansas City (Missouri) Public Library 21 1,136.284Queens Borough Public Library (N.Y) 10 2,479,463' Dayton and Montgomery County Public Library (Ohio) 22 1.122,492
Denver Public Library 23 1,113,087Cosh Pratt Free Library (Baltimure) 11 , 2,120,310 Houston Public Library 24 1,081,014Carnegie Library of Pittsburgh 12 2.120.310 Minneapolis Public Library 25 1.078,656Buffalo and Erie Courtly Library System 13 :2,120,000 Cuyahoga County (Ohio) Public Library 26 1.047,826
I Oats are for 1965.
SOURCE: U.S, Department of Health, Education, and Welfare, Office of Education, "Statistics of Public Libraries Serving Areas with Al Least 25,000 Inhabitants, 1968:'
152

Table MS.Selected statistics on the collections, stall, and operating expenditures of 30 large university libraries: 1.070-71
Ins MellonRank
eider'.
Numberof
volumesat endof year
Grossnumber ofvolumesadded
during year
Number ofmicroformunits atend ofyear
Staff(100time-equivalen1),
tall 1971
Operating expenditures
TotalBooksand .,
binding
Salariesand
wagesOther
Total Professional
1 2 3 4 5 6 7 8 9. 10 II
Harvard University 1 8,451,1117 210274 810,439 694 245 8,639,776 2,104,997 5,555,983 978,796Yale University 2 5,829,035 200,793 816,523 501 171 4.980.819 1.999,331 3,855,987 1,125,501University of Illinois (all campuses) 3 5.243.450 260,257 624.769 542 216 8.080,685 3,109,036 4,549.323 422,326Columbia University (all campuses) 4 4.366.532 144.775 926.298 454 171 5,765,705 1.546,634 3.847,434 321.632Cornell University (all campuses) 5 4.347,334 196,335 995,970 421 147 6,466,084 1.732.433 4,24407 488.989
University of Michigan (all camouses)l. 6 4.312.093 176.953 261.474 461 163 6.467.345 1.749.565 4.232,434 485.356University of California at Berkeley 7 4,009.595 165.405 647.290 425 160 6.668.760 1.829.788 4.542,161 296,806University of Wisconsin (all campuses). B 3,603.571 279,836 1,687,890 427 211 '7.497,382 2.871,426 4,153,743 472.563Stanford University 9 3,584,123 173,721 705.484 408 148 6.270.117 1.740.198 3.864,249 645.570University of Minnesota (all campuses). 10 3,112,526 171,324 644685 309 151 4,982,236 1.564,857 3214,806 202,573
University of Chicago' 11 3,090,127 129.338 (4) 104 76 3,711.429 1,105,954 2,322,7114 237,691University,' California at Los Angeles 12 3,036.826 122,506 849,731 379 150 6.649,902 1,639,258, 009.392 201,252Indiana University (all campuses) 13 2,687,327 260.538 534,589 66 28 5,092.504 1.727,010 2.749,533 615,961Ohio Stale University (all campuses) 14 2539.716 158.256 756,493 179 98 4,530.421 1.479.566 2.794.561 256,294
University 01 Texas at Austin(all cam9uses) 15 2,444,112 162.823 583.515 156 115 6,240.765 3.786,211 2,249.690 204,864
University of Missouri (all campuses) 16 2,402.043 146.486 1.915.526 266 88 4,791,201 2,473.773 2.038.794 278.634Northwestern University 17 2,364.720 75.012 397,533 202 83 3,082.653 833,225 1,871855 377,573University of Pennsylvania 18 2,329.401 93,674 812,617 269 87 3,633,008 1,063.557 2,344.747 224.704Princeton University 19 2,314,323 121.358 411,764 276 80 3,363,494 1.327,873 1264,284 181.337
fluke University .. 20 2.231,519 104.442 179.182 224 150 2,956.099 1,133,638 1,656,731 165,730
New York University 21 2,211 ,070 101.198 815,183 375 77 3.975.251 1.000.500 2.811.745 163,006Johns Hopkins University 22 2.085.435 30.411 595,351 182 54 2.447,651 631,496 1,439,703 376,452Universityof Virginia (all campuses) , 23 2,019,680 119,312 954,413 252 79 3.556.424 1.437,302 1,864,674 254,448Southern Illinois University (alt
campuses) . 21 1,817,576 192.018 417,421 195 87 4,11,0,504 1,811,408 2.027,307 271,789University of Washington 25 1,876,900 88,702 847,803 294 120 4,273,625 1,290,018 2,780,431 203.170
Louisiana Male University (allcampuses)
.,26 1,830,409 115,531 597.789 227 163 3.401,131 1,216.756 1,954,633 229.743
University of North Carolina atChapel Hill 27 1,819,669 96.901 451.342 225 84 3,230,314 1.099,348 2,011.916 111,050.
Michigan Stale University 28 1,759,942 132.422 440,294 190 75 2.835,304 1036,577 1,465.821 162.906Syracuse University fall campuses). 29 1,633,261 107,100 1,507,134 39 13 2,52E027 891,038 1,417,513 211,576
Rutgers University (all campuses) 30 1.611,649 103,856 755,206 233 88 3.753.833 1,639,531 1.988,857 125,445
Institutions are ranked by the number of volumes at the end o tha year (column3). Although this is a convenient measure of size, the measures in columns 441warrant equal attention for snmparative purposes.
. Excludes the business administration library and the law library.Excludes the Industrial Relations Center Library and the Computer InstituteLibrary.
4 Oats net available.
153
-31
'Includes a oint library arrangement with the For Wayne campus of PurdueUniversity.
*Exclude; Graduate School of Biomedical Science, a member of Texas MedicalCenter Joint Library.
SOURCE: U.S. Department of Health, Education, and Welfare, Office of Education,"Library Statistics of Colleges and Universities, Part A, Fall 1971."
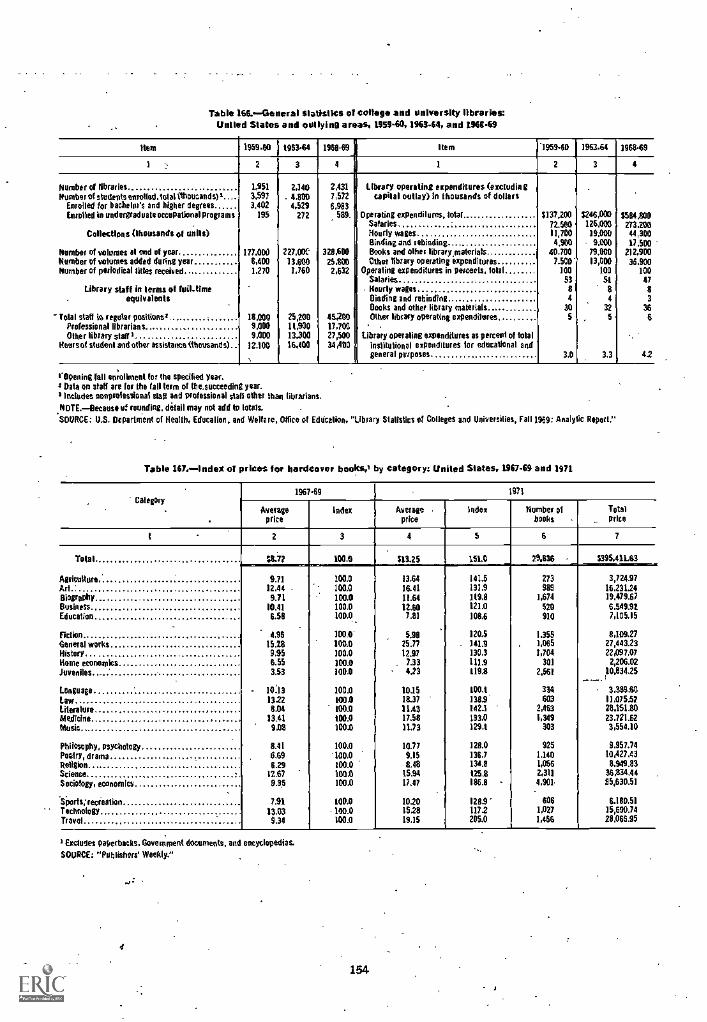
Table 1660-General statistics of college and university libraries:United States and outlying areas, 195940, 196344, and 196649
Item 195940 196344 1960491 Item 1959.60 1963.64 196849
1 2 3 4 1 2 3 4
Number of libraries 1,951 2,140 2,431 Library operating expenditures (entudiegNumber of students enrolled. lot al Ohomands)s.... 3,597 . 4.800 7,572 capital outlay) In thousands of dollars
Enrolled for bachelor's and higher degrees 3,402 4,529 6,983Enrolled in undergraduate occepatIonal programs 195 272 589. Operating expendilures, lotto $137,200 $246,000 3504,800
Salaries 72,500 126,000 273.200Collections (thousands of units) Hourly wages 11,700 14,000 44,300
Binding and rebinding 4,900 9.000 17,500Member of volumes el end of year 171.000 227.00e 328,600 Books and other library,materiats 40,700 79,000 212,900Number of volumes added doling year 1,400 13,800 25,800 Other library operating expenditures 7.500" 13,000 36.900Number of periodical littes received 1,270 1,760 2,632 Operating expenditures in percents, total 100 100 100
Salaries 53 51 47Library staf I in terms of foil-time Hourly wages 8 8 $
. equivalents Binding and rebinding 4 4 3Books and other library materials 30 32 36
Total staff in regular positions 18,000 25,200 45200 Other library operating expenditures, ... 5 , 5 6Professional librarians 9.000 11,900 17,700Other library staff I 9,000 13,300 27,500 Library operating expenditures as percent of total
Hoursof student and otber assistance (tttousands) 12.100 16,400 34,400 inslitulional expenditures tar educational andgeneral purposes 3,D 3,3 42
"Opening tall enrollment for the specified year.s Dale on staff are for the fall term of the.succeeding year.
lathldet omprolessional staff and professional stall other than librarians.
.NOTE.-Because of rounding, detail may not add to totals.
SOURCE: U.S. Department of Health, Educalion, and Welfare, Ode, of Edticalion, "Library Statistics of Colleges and Universities, Fall 1969: Analytic Report."
Table 167.1ndex of prices for hardcover books,' by category: United States, 196744 and 1971
Category196749 1971
Metes,price
Index Averageprice
Index Number ofbooks
Totalprice
2 3 4 5 6 7
Total :11:77 100.0 $13.25 151.0 29.1136 MA,$315,411.63
Agriculture 9.71 100.0 13.64 141.5 273 3,724.87Art 12.44 100.0 16.41 131.9 989 15.231.24
Biography 9.71 100.0 11.64 119.8 1,674 19,479.67Business 10.41 100,0 12,60 121.0 520 6,549.92
Education 6.58 100.0 7.81 108.6 910 7,105.15
Fiction 4.96 100.0' 5.90 120.5 1,355 8,109.27General works 15.28 100.0 25.77 141.9 1,065 27,443.23
History 9.95 100,0 12.97 130.3 1,704 22,097.07
Home economics 6.55 100.0 . 7.33 111.9 301 2,206.02
Juveniles 3.53 300.0 423 1192 2.561 10,834,25
Language 10:13 100.0 10,15 100,1 314 3,389.60Law 1322 100.0 18.37 138.9' 603 11,075.57
Literature 8.04 100.0 11.43 1423 2,453 28,151.80Medicine 13.41 100.0 17.58 133.0 1,349 23.721.62
Music 9.08 100.0 /1.73 129.1 303 3,554.10
Philosophy, psychology 8.41 100.0 10.77 128.0 925 9.957.74Peary, drama 6.69 *100.0 9.15 136.7 1.140 10,427.43
Religion 6.29 100.0 8.48 134.8 1,056 8,949.83
Science 12.67 1001) 15.94 1253 2,311 36/134.44
Sociology, economics 9.35 100.0 17.47 186.8 4,901 85,630.51
'Snorts: recreation 7.91 100.0 1020 128.9' 606 6.180.51
Technology 13.03 100.0 1528 1172 1,027 15,690.74
Travel 9.34 100.0 19,15 205.0 1,466 28,066.95
) Excludes paperbacks, Government documents, and encyclopedias.
SOURCE: "Publishers' Weekly,"
4
154
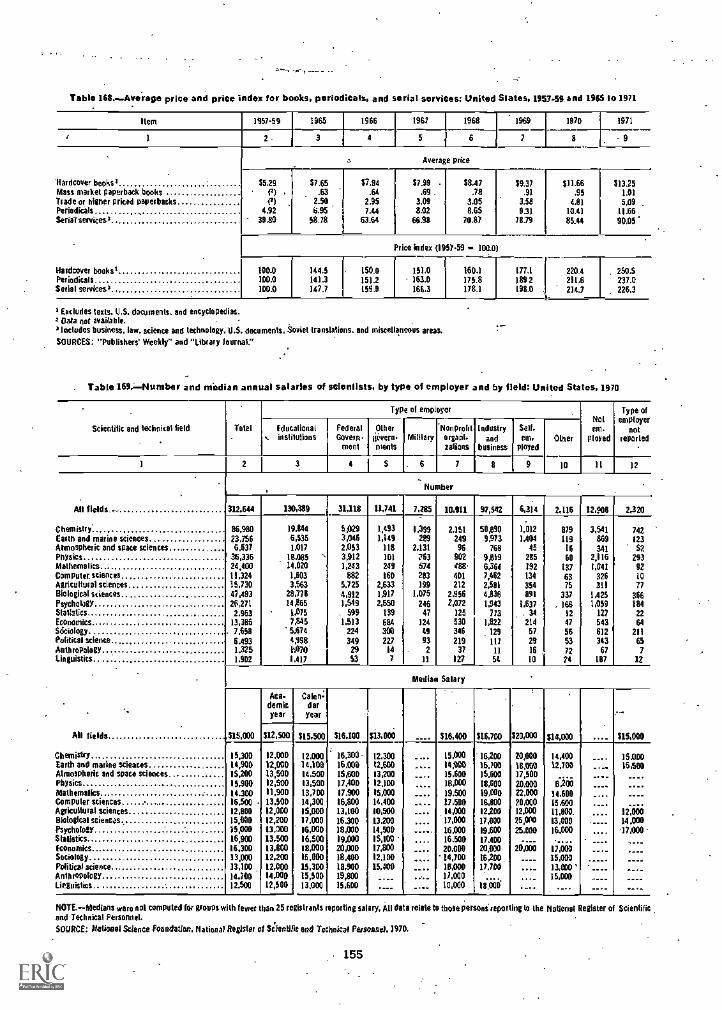
. --
Table 168. - Average price and price index for books. periodicals. and serial services: United States. 1957-59 and 1965 to 1971
Item 1957.59 1965 1966 1967 1968 1969 1970 1971
I' 1 2 3 4 5 6 7 8 -9
Average price
'Hardcover books' 55,29 $7.65 $7.94 $7.99 $8.47 $9.37 $11.66 $13.25Mass market paperback books P) .63 .64 .69 . .78 .91 .95 1.01Trade or higher priced paperbacks 01 2.56 2.95 3.00 3.05 3.58 4,81 5.09 -
Periodicals 4.92 5.95 7.44 832 8.6S 931 10.41 l156Serial services= 39.80 58.78 11334 6638 70.87 78.79 85_44 90.05'
Price index (1957.59 - 100.01
Hardcover books' 100.0 144.5 150.0 151,0 160.1 177.1 220.4 2503Periodicals 100.0 141.3 151.2 163.0 175.8 189 2 211,5 237.0Serial services' 100.0 147.7 159.9 166,3 178.1 198.0 . 214.7 226.3
2 Eacludes tests. U.S. documents, and encyclopedias.t Data not available., Includes business, law, science and technology, U.S. documents. Soviet translations, and miscellaneous areas.
SOURCES: "Publishers' Weekly" and "Library Journal."
Table 169,Number and median annual salaries of scientists, by type of employer and by field; United States. 1970
Scientific and technical field Tote!
Type of employerNotem-
ployed
Type ofemployer
notreported
Educational. inslitutions
FederalGovern-
ment
Other
&van.MOMS
MililaryNonprofitergo'.Mims
Industryand
business
Self-em.
ployedOther
1 2 4 S 7 8 9 10 11 12
Number
All fields., 312,644 130,389 31,118 11,741 7,285 10,011 97,542 6,314 2,116 12,4011 2,320
Chemistry' 86,980 19.1144 5,029 1,493 1.399 2.151 50,890 1,012 879 3,541 742Earth and marine sciences 23.756 6,535 3,046 1,149 289 249 9,973 1,404 119 869 123Atmospheric and space sciences 6.637 1.017 2.053 118 2,131 96 768 45 16 341 S2Pnysics 35,336 14.085 3,912 101 763 902 9,819 285 60 2,116 293Mathemalics 24,400 14,020 1,243 249 574 488 6,364 192 137 1,041 92Computer sciences 11,324 1,603 882 160 283 401 7,462 134 63 326 10Agricultural sciences 15,730 3,563 5,725 2,633 199 212 2,581 354 75 311 77Biological sciences 47,493 28,778 4,912 1,917 1,075 2.956 4,836 891 337 1,425 366Psychology 26271 14,865 1,549 2,550 246 2,072 1,943 1.637 . 166 1,059 184Statistics 2,953 1 .075 . 594 139 47 125 773 . 34 12 127 22Economics 13,386 7,845 1,513 684 124 530 1,822 214 47 543 64Sociology 7,658 5.674 224 300 49 346 - 129 57 56 612 211Political science 6.493 4998 349 227 43 219 117 20 53 343 65Anthropology 1.325 N370* 29 14 2 37 11 16 72 67 7Linguistics 1.902 1,417 53 7 11 127 54 10 ?4 107 12
Median Salary
Asa- Cab s-Oar
year year
All fields1-15
'000 $12,500 $15,500 $16,100 813,000 .... 516,400 516,700 $20,000 514.000 $15,000
Chemistry 15,300 12.000 12,000 16,300 12.300 15,000 -16,200 20,600 14,400 15,0®Earth and marine scieaces 14,900 12,000 14,100 16,000 12,600 14300 15,100 18300 12.700 15,500Atmospheric and space sciencesPhysics
15,20015,900
13,50012,500
14.50013,500
15,600171400
13,20012,100
15.60018,000
15.00018,000
17,50020.000 8,200
.... ----Mathemalics 14.300 11.900 13,700 17.900 15,030 19.500 19,000 22,000 14,600 - ---Computer sciences 16,500 13,500 14,300 16,800 14,400 17,500 16,8110 20,000 15,600Agricultural sciences 12,800 12,000 15,000 13,100 10,500 14,000 12,200 12p00 11,800- 12,riliBiological sciences 15,800 12,200 17.000 16,300 13.200 17,000 17,000 25,000 13,000 14300Psychology 15,000 13.000 16,000 18,000 14,500 16.000 19,600 25.000 16.000 17,000Statistics 16,900 13,500 16,500 19.000 15,100 16,500 17,400 .....Economics 16,300 13,800 18,000 20,000 17,800 20.000 20,000 20,000 17,66 .---Sociology 13,000 12,200 15.000 18,400 12,100 14,700 16,200 ___- 15,000Political science 13,100 12,000 15,300 18,900 15,400 18,000 17,700 ..._ 13,000 ____Anthropology 14,700 14,000 15,500 19,800 ____ 17,000 . .... 15,000Linguistics 12,500 12,500 13,000 15,600 .-__ 10,000 l8,00e ....
NOTE-Medians were not computed for groups with fewer than 25 registrants reporting salary, All data relate to those persons'reporting to the National Register of Scientificand Technical Personnel.
SOURCE: National Science Formdation, National Register of Siientiric and Technical Persoesel, 1970.
155
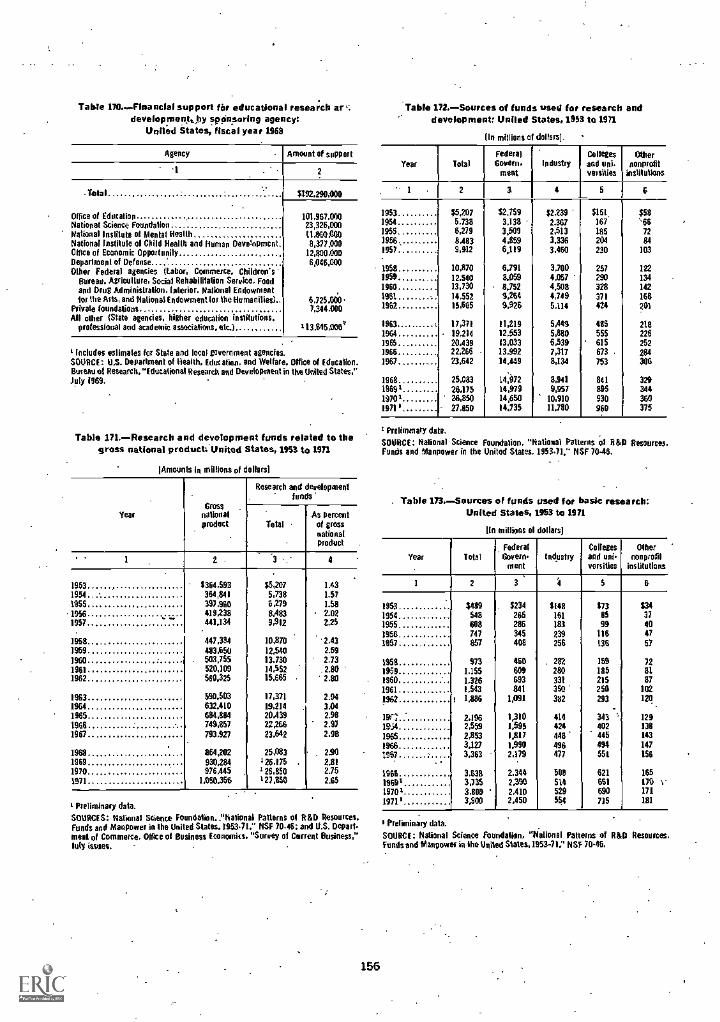
Table 170.Financial sup pen for educational research ar--.develop mentOly sponsoring agency:
United States, fiscal year 1968
Agency Amount of support
2
-Total
Office of EducationMillicent Science FoundationNational Institute of Mental HealthNational lnstilule of Child Health and Human DeaelopmcntOffice of Economic OpportunityDepartment of DefenseOther Federal agencies (Labor, Commerce. Children's'
Bureau. Agriculture, Social Rehabilitation Service, Foodand Drug Administration, Interior. !fallow', Endowmentfor the Arts, and National Endowment for the Hu ma n
Private foundationsAll other {Stele agencies, hither education institutions.
professional and academic associations. etc.)
6192.290,000
101,967.00023,326,00011,8600008,377,000
12,800,0006,046,000
6,725.000 -7,344,000
13,645,000*
Includes estimates lot State and local government agencies.SOURCE: U.S. Department of Health. Education, and Welfare. Office of Education.Romanist Research, "Educational Research and Development in the United States,"July 1969.
Table 171.-Research and development funds related to thegross national product: United States, 1953 to 1971
'Amounts in millions of dollars)
YearGross
nationalproduct
Research and developmentfunds'
TotalAs percent
of grossnationalproduct
1 2 4
1953 6364,593 $5,207 1.431954 364,841 5,738 1.571955 397,960 6,279 1.531956 419,238 8483 2.021957 441,134 9,912 2,25
1958 447,354 10,870 2.431959 483,650 12.540 2.591960 503,755 13.730 2331961 520,109 14,552 2.801962 560,325 15,665 2.80
1963 590.503 17,371 2.941964 632.410 19,214 3.041965 684,884 20.439 2.981966 749,897 22,266 2.9719 67 793,927 23.642 2.98
1968 864,202 25,083 2.901969 930.284 126,175 2,81
1970 976,445 126,850 2.751971 J_
1,050.366 t 27 A50 2.65
Preliminary data.SOURCES: National Science Foundation.."National Patterns ol R&D Resources.Funds and Manpower in the United Slates. 195341." NSF 70.46; and U.S. Depart.meal of Commerce, Office of Business Economics. "Survey of Current Business,"Slaty issues.
156
Table 172.-Sources of funds used for research anddevelopment: United States, 1953 to 1971
(In millions of dollars].
Year TotalFederalGovern.
meatIndustry
Collegesand uni-versifies
Omernonprofit
institutions
- 1 2 3 4 5 6
1953 $5,207 $2.759 $2,239 $151, $581954 5,738 3,138 2.367 167 '661955 6,279 3,509 2.513 185 721956 8.4113 4,859 3.336 204 841957 9,512 6.119 3.460 230 103
1958 10,870 6.791 3,700 257 1221959 12.540 8,059 4,057 290 1341960 13,730 8.752 4,508 328 1421961 - 14,552 9.264 4749 371 1681952 15,665 9,926 5,114 424 291
1963 17,371 11,219 5149 485 2181964 19,214 12,553 5,880 555 2261965 20.439 13,033 6,539 615 2521966 22,266 13,992 7,317 673 2841967 ,,, 23.642 14449 8,134 753 306
1968 25,083 14,972 8,941 841 32919691 26.175 14,979 9,957 895 34419701 26,850 14,650 10,910 930 3601010 27,850 14.135 11.780 960 375
Preliminary da a.
SOURCE: Rational Science Foundation. "National Patterns ol R&D Resources.Funds and Manpower in the United States, 1953-71." NSF 70-46.
Table 173.-Sources of funds used for bask research:United States, 1953 to 1971
Ile millions el dollars)
Year TotalFederalGovern.ment
IndustryCollegesand uni.versities
Oiliernonprofit
institutions
1 2 3 4 5 6
1953 $489 . $234 $148 $73 $341954 548 265 161 85 371955- ........... 608 286 183 99 401956 747 345 239 116 471957 857 408 256 136 57
1968 973 490 282 159 721959 1,155 609 280 185 811960 1,326 693 331 215 871961 1,543 841 350 258 1021962 i 1,986 1,091 382 293 120
19r; 2.196 1,310 414 343 ' 12919.4 2,559 1,595 424 402 138
1965 2,853 1.857 448 445 143
1966 3.127 1.990 496 494 147
1967 3.363 2,179 477 551 156
1951 3,638 2.344 508 621 16519691 3,735 2.390 514 661 176 :-19701 3,900 2,410 529 690 171
1971 0 3,900 2.450 554 715 181
Preliminary data.
SOME: National Science foundation, "National Patterns of R&D Resources,Fundsand Manpower in the United states,1953-71," NSF 70.45,
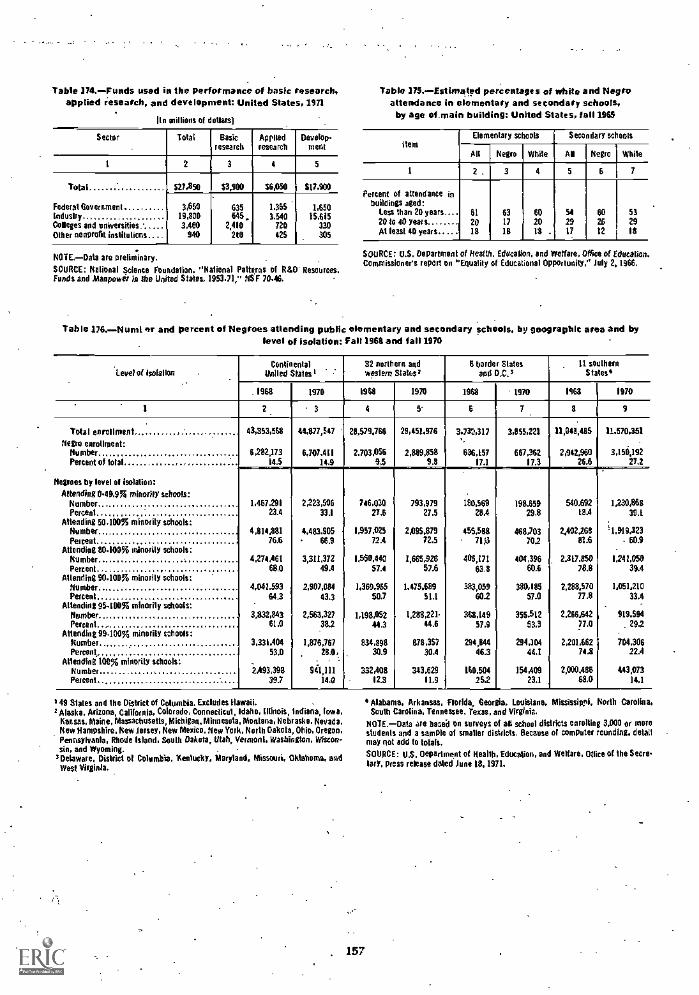
Table 374.-Funds used in the performance of bask research,applied research, and development: United States, 1971
iln millions of dollars)
Sector Total Basicresearch
Appliedresearch
Develop.meat
1 2 3 4 5
Total 327,350 $3,900 36,050 $17,900
Federal Government 3,659 635 1.365 1,650Industry 19,800 64S, 3,510 15,615Colleges and universities . 3,460 2,480 720 330Other nonprofit institutions 940 210 42S 305
NOTE.-Data are preliminary.
SOURCE: Notional Science Foundation. "National Patterns of R&D' Resources.Funds and Martha** is the United States, 1953,71;' NSF 70.46.
Table 375. - Estimated percentages of white and Negroattendance in elementary and secondary schools,by age of.main building: United States, fall 1969
HemElementary schools Secondary schools
All Negro White All Negro While
1 2. 3 4 5 6 7
Percent of attendance inbuildings aged:
Leos than 20 years__ 61 63 60 54 60 532010 10 years 20 17 20 29 26 29At least 40 years 18 1B 18 . 17 12 IS
SOURCE: U.S. Department of Health, Educaliorr, and Welfare, Office of Education.Commissioners report on "Equality of Educational Opportunity," July 2,1966.
Table 176.-Nung ftr and percent of Negroes attending public elementary and secondary schools, by geographic area and bylevel of isolation: Fall 1961 and fall 1976
Level of isolalionContinental
Veiled Stales i32 northern andwestern States;
6 border Slatesand D.C.I
11 southernStates
. 1968 1970 1968 1970 1968 1910 1163 1970
1 3I--
4 5 s 7 s 9
Total enrollment 43,353,568 44,877,547 28,579,766 29,451,976 3,710,317 3,855,221 11,043/115 11.570,351
Negro enrollment:Number 6,282,173 6,707.411 2,703,956 2,889,856 636,151 667,362 2,942.960 3,150,192Percent of total 14.5 14.9 91 9.8 17.1 17.3 26.6 27.2
Negroes by level of isolation:
Attending 049.956 minority schools:Number 1,467.291 2,223,506 746,030 793,979 100,569 196.659 540.692 1,230,863Percent 23.4 33.1 27.6 27.5 28.4 29.8 t8.4 391
Attending 50.100% Minority schools:Number 4,814.081 4,483.905 1.957,025 2,095,879 4551Bit 468,703 2,402,268
,-1.919,323
Percent 76.6 - 66.9 72.4 72.5 71:4 70.2 011 - 60.9Attending 80.100% minority schools:
Number 4,274/61 3,311,372 1100,440 1,665,926 406,171 401,396 2,30.850 1,241,060Percent 68.0 49.4 57.4 57.6 63.8 60.6 78.8 39.4
Attending 90.100% minority schools:Number 4,042.593 2,907,084 1,369,965 1.475,689 383,059 389,805 2,288,570 1,051,210
Percent 64.3 43.3 50.7 51.1 60.2 57.0 77.8 33.4Attending 95.100% minority schools:
Number 3,832,843 2,563.327 1,198,052 1,238,221 363,149 355.512 2.266,642 919,594Percent 61.0 384 44.3 44.6 57,9 53,3 77.0 29.2
Attending 99.100% minority schools:Number 3.331,401 1.876,767 634,898 678,357 294,644 294,104 2,201,662 704,306Percent 53.0 28.0, 30.9 30.4 46.3 44.1 741 22.4
Attending 100% minority schools:Number 2/93,393 94,111 332,408 343,629 160.504 154,409 2,000.486 443,073Percent 39.7 141 - 12.3 11.9 252 23.1 68.0 14.1
149 Slates and the District of Columbia. Excludes Hawaii.Alaska, Arizona, California, Colorado, Connecticut, Idaho, Illinois, Indiana, Iowa,Kansas, Maine, Massachusetts, Michigan, Minnesota, Montana, Nebraska, Nevada,New Hampshire, New Jersey, New Mexico, New York, North Dakota, Ohio, Oregon,Pennsylvania, Rhode Island, South Dakota, Utah, Vermont, Washington, Wiscon-sin, and Wyoming.
I Delaware, District ot Colombia. 'Kentucky, Maryland, Missouri, Oklahoma, andWest Virginia.
, 157
4 Alabama, Arkansas, Florida, Georgia, Louisiana, Mississippi, North Carolina,South Carolina, Tennessee, Texas, and Virginia.
NOTE.-Data are based on surveys of all school districts enrolling 3,000 or morestudents and a sample of smaller districts. Because of computer rounding, detailmay not add to totals.
SOURCE: U.S. Oepartment of Health, Education, and Welfare, °Nice of the Seers.tory, press release dated Junt 18, 1971.
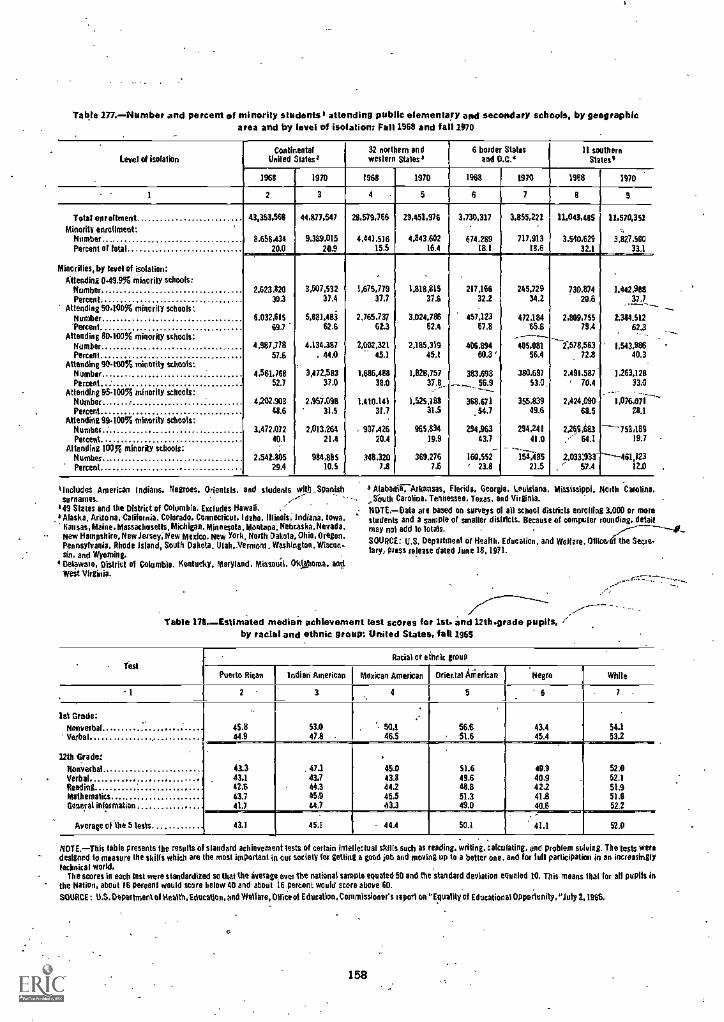
Table 177.-Number and percent of minority students' attending public elementary and secondary schools, by geographicarea and by level of isolations Fall 1968 and fall 2970
Level of isolationContinental
United Sta lesa32 noithem andwestern Stales')
6 borde Statesand 04.4
11 southernStetes4
1968,--
1970 1968 1970 1968 1970 1968.
1970
1 2 3 4 5 6 7 8 9
Total enroftment 43,353,588 44,877,547 28,579,766 29,451,976 3,730,317 3,855,221 11,043,465 11,570,351
Minority enrollment: ..:.
Number 8.656,434 9,389,015 4,441,516 4,843,602 674,289 717,913 3,540,629 3,827,500Percent of total 20.0 20.9 15.5 16.4 tat 18.6 32.1 33.1
Minorities, by level of isolation:I
Attending 049.9% minority schools:Number 2223.820 3,507,532 1.675.779 1218,815 217,166 245.729 730.874 1212,988Percent 30,3 37.4 37.7 37$ 32.2 34.2 20.6 37.7
Attending 50400% minority schools:Number 6.037,615 5.883.483 2,765,737 3,024.786 157,123 472,184 2,809,755 2,384,512'Percent 69.7 62.6 62.3 62.4 67.8 65.8 79.4 62,3
Attending 30400% minority schools:Number 4287,778 4.134.387 2202221 2,185,319 406.894
_-___-405.081
-.2278.563
. ..1.543.986
Percent 57.6 . 44.0 15.1 45.t 60.3' 56.4 72.8 40.3Attending 90-100% Integrity schools:
Number 4,561.768 3,172,583 2,686.488 1,828,757 363,693 380,693 2,491,587- 1,263,126Percent I 52.7 37.0 382 37.5_ .........,_ 56.9 53,0, , 70.4 33.0
Attending 95.100% minority schools: -Number 4,202,903 2,957.098 1,4t0,141 1,525.188 368,671 355.839 2,424,090 1,076,07rPercent 48.6 31.5 31.7 31.5 54,7 49.6 68.5 28.1
Attending 99-100% minority %herds:Number 3272.072 2,013,264 . 907.426 465.834 294,963 294,241 2.269,683 *--753389Percent 40.1 21,4 20.4 19.9 43,7 41.0 ," 64.1 19.7
Attending 100% minority schools:Number 2.542,895 984,865 348.320 369,276 160.552 154,485 2,03033 461,/23Percent 29.4 10.5 7.8 7.6 23.8 21.5 " 57.4 12.0
I Includes American Indians. Negroes. Orientals, and students with _Spanishsurnames.
249 States and the District of Columbia. Excludes Hawaii.Alaska, Arizona, California, Colorado. Connecticut Idaho. Illinois: Indiana, Iowa,Kansas, Maine. Massachoseits, Michigan, Minnesota, Montana, Nebraska, Nevada,New Hampshire. New Jersey; New Mexico. New York, North (Jakob. Ohio, Oregon,Pennsylvania, Rhode Island, South Dakota. Ulah..Vermont, Washington, WiStailsin, and Wyoming.
4 Delaware, District of Columbia, Kentucky, Maryland, Missouil, Oklahoma. andWest Virginia.
Alabatili7Arkansas, Florida. Georgia, Louisiana, Mississippi, North Carolina.South Carolina, Tennessee, Texas, and Virginia.
NOTE- Data are based on surveys al all school districts enrolling 3,000 or morestudents and a sample of smaller distacts. Because of computer rounding, detailmay not add lo totals.
SOURCE: U.S. Department of Health. Education, and Welfare. OIKce I the sectbry, press release dated June 13,1971.
Table 178.-Estimated median achievement test scores for let. and 12thgrade pupils, 1by rectal and ethnic group: United States, fall 1965
TeatRacial or ethnic group
Puerto Rios Indian American Mexican American Oriental kilerican Nepal White
1 2 3 4 5 6 7 -
lst Grade:Nonverbal 45.8 53.0 50.1 56.6 43.4 54.1Verbal 44.9 47.8 46.5 51.6 45.4 532
12th Grade:
Nonverbal 43.3 47.1 45.0 51.6 40.9 52.0Verbal 43.1 43.7 13.8 49.6 40.9 52.1Reading 42.6 44.3 44.2 48.8 422 51.9Mathematics 43.7 459 45,5 51.3 41.8 51.8General information 41.7 44.7 43.3 49.0 40.6 52.2
Average al She 5 tests 43.1 45.1 44.4 50.1 41.1 52.0
NOTE.-This bible presents the results* standard achievement tests of certain isle lectual Oils suds as ending, writing, calculating, and problem su sing. The tests weredesigned lo measure the skills which are he most important in cos society for getting a good job and moving up to a better one,and foe lull participation in an increasinglytechnical world.
The scores in each test were standardized so that the liverworts the national sample equated 50 and the standard deviation equaled 10, This means that for all pupils inthe Nation, about 16 percent would more below 40 and about 16 percent would score above 60.
SOURCE: ti.S.Department of Health, Education, and Well are, 09100 Education, Commissioner's report on "Equality of Educational Opporkinity, "July2, 1060.
158
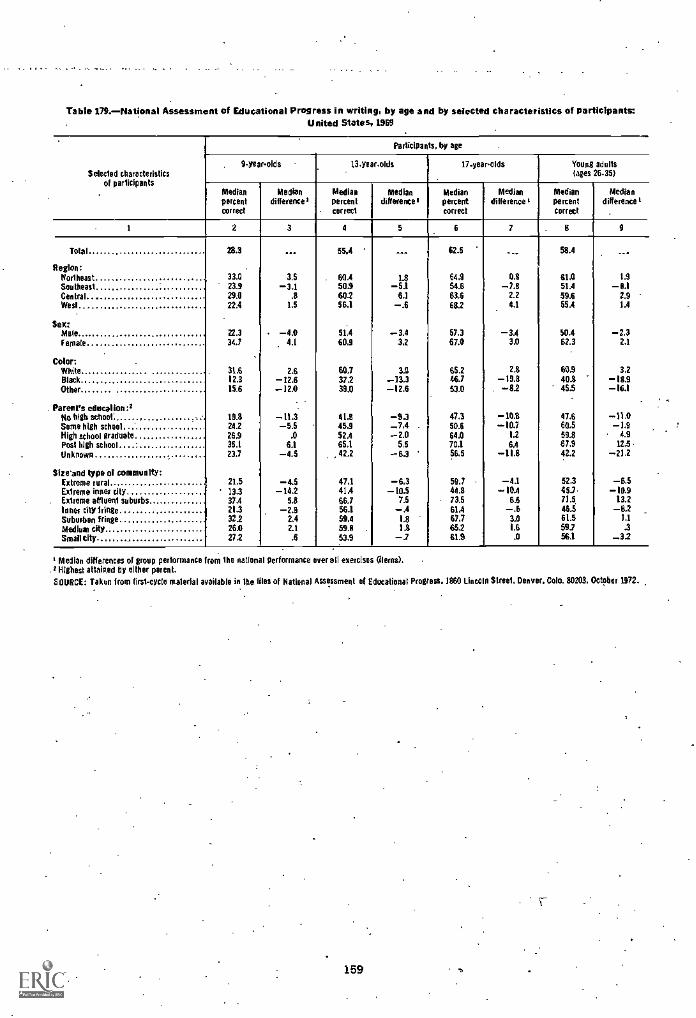
Table 179.-Plational Assessment of Educational Progress in writing, by age and by selected characteristics of participants:United States, 1969
Selected characteristicsof participants
Participants, by age
9-year-olds 13-year-olds 17yearolds Young adults(ages 26-35)
Percentcorrect
Median Mediandifference'
Medianpercentcorrect
Mediandifference'
Medianpercentcorrect
Mediandifference
Medianpercentcorrect
Mediandifference
1 2 3 4 5 6 7 B 9
Total 28.3 55.4 62.5 58.4
Region:Northeast 33.0 3.5 60A 1.8 64.1 0.8 613 1.9Southeast 23.9 -3.1 503 -51 54.6 -71 51.4 -8.1Central 291 .8 60.2 6.3 63.6 2.2 59.6 2.9Wed 22.4 1.5 56.1 -.6 68.2 4.1 554 1.4
Sex:Male 22.3 -4.9 51.4 -3.4 57.3 -3.4 50.4 -2.3Female 34.7 4.1 60.9 3.2 171 3.0 62.3 2.1
Color:White 31.6 2.6 617 3.0 652 2.8 603 3.2Black 12.3 -32.6 37.2 -33.3 46.7 -19.3 403 -133Other 13.6 -12.0 39.0 -12.6 53.0 -8.2 45.5 -16.1
Parcel's education:*to high school' 19.8 -11.3 41.8 -9,3 47.3 -10.8 47.6 -y1,9Some high school 24.2 -5.5 45.9 -7,4 50.6 -10.7 60.5 -1.9High school graduate 26,9 .0 52A -2.0 64.0 1,2 591 4.9
Post high school 35.1 6.1 65.1 5,5 70.1 6.4 67.9 12.5
Unknown 23.7 -4.5 42.2 -6,3 56.5 -11.8 42.2 -21.2
Sizemnd type of commonalty:Extreme rural 21.5 -4.5 47.1 -6.3 59.7 -4.1 52.3 -6.5Extreme irate; city 13.3 -14.2 41,4 -10,5 441 -10.4 45.7 -10.9Extreme affluent suburbs 37.4 5.8 66.7 7.5 73.5 6.6 71.5 13.2loner city f rinse 21.3 -2.9 56.1 -.4 61,4 -.6 46.5 -8.2Suburban fringe 32.2 2.4 594 12 67.7 3.0 61.5 1.1
Medium city 26.0 2.1 99.8 1.8 652 1.6 59.7 .3
Small city 27.2 53.9 -.7 61.9 .0 561 -32
Median differences of group performance from the national performance over all exercises Olems).2 Highest attained by either parent.
SOURCE: Taken from first -cycle material available in the files of National Assessment of Educational Progress. 1860 Lincoln Street, Denver, Colo. 80203. October 1472.
159
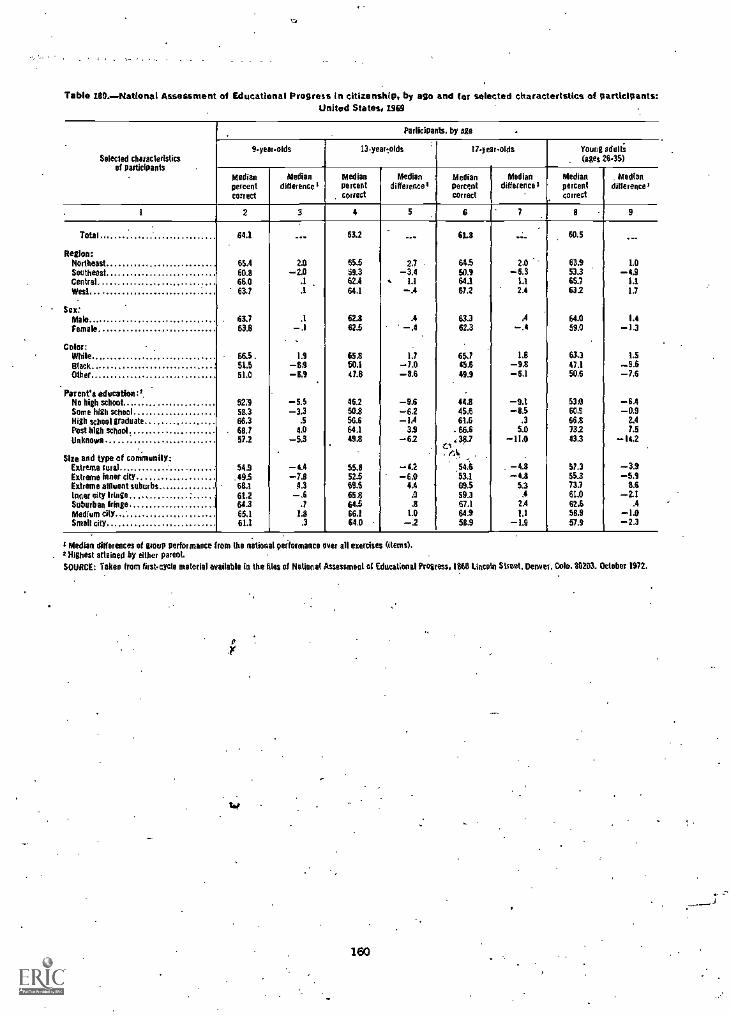
Table 180.-Nattonal Assessment of Educational Progress In citizenship, by ago and for selected characteristics of participants:United States, 1969
Selected characteristicsof participants
Parlicipanis, by age
9yearolds 13.yeartolds 17yearolds Young adult;(ages 26-35)
Mediaepercentcorrect
Mediandifference
Medianpercentcorrect
Mediandifferences
Medianpercentcorrect
Mediandifferences
Medianpercentcorrect
Mediandifference,
1 2 3 4 5 6 7 8 9
Total 64.1 63.2 61.8 60.5
Region:Northeast 65.4 2.0 65.5 2.7 - 64$ 2.0 63.9 1.0Southeast 60.8 -2.0 59.3 -3.4 50.9 -6.1 53.3 -6.9Central 66.0 .1 62A .t 1.1 641 11 65.7 11Wed 63.7 .1 64.1 -.4 67.2 2.6 632 1.7
Sex:MaleFemale
63.763.8
A-.1
62.862.5
.4-,4
63.362.3
A-.6
64.059.0
1.6-1.3
Color:While 66.5 . 19 65.8 1.7 65.7 1.8 63.3 1.5Black 51.5 -83 50.1 -72 6E6 -9.8 47.1 -92Other 51.0 -L9 47.8 -8.6 49.9 -6.1 50.6 -7.6
Par enVit education::,No high schoolSome high school
52:958.3
-5.5-3.3
46.250.8
-9.6-6.2
442452
-tt-8.5
53660.9
-6.4-0.9
High school graduate 66.3 .5 5E6 -1A 61.6 .3 66.8 2.4
Post high school 68.7 4.0 64.1 3.9 . 66.6 5.0 732 7.5
Unknown 57.2 -5.3 49.8 -62 :38.7 -11.0 43.3 -16.2
Sloe and type of community.:r^.A
Extrema rural 543 -4.4 5E8 -(2 542 51.3 -33Extreme inner city _49.5 -7.8 52.5 -6.0 53.1 -6.8 55.3 -5.9Extreme affluent suburbsinner city hinge
6L161.2
11.3- 69.565.8
4.4.a
69.559.3 5.4
73.761.0
82-2.1
Suburban fringe 641 .7 64.5 67.1 62.6 .4Medium city 65.1 1.8 66.1 1.0 64.9 1.1 58.9 -16Small city 61.1 .3 64.0 -.2 58.9 57.9 -2.3
s Median differences of group performance from the national performance over all exercises (items).2 Highest attained by either parent.
SOURCE: Taken from first-cycle material available In the Ms of National Assessment of Educational Progress, USD) Lincoln Street, Denver, tole. 84203. October 1972.
160
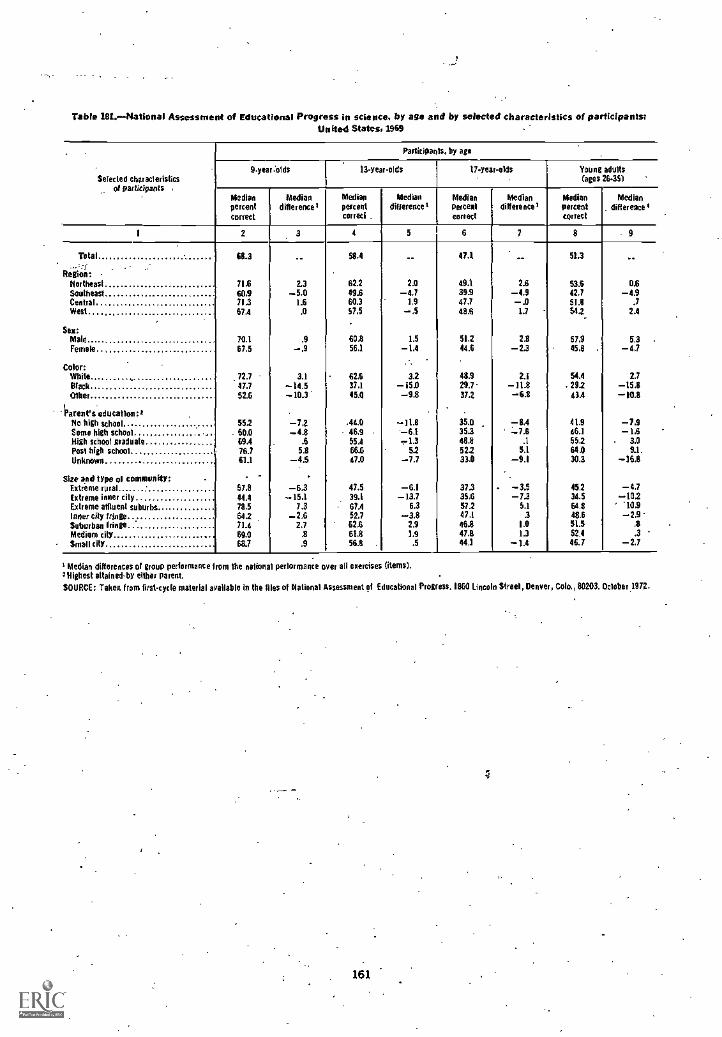
Table 1810--National Assessment of Educational Progress in offence, by age and by selected characteristics of participants:United States, 1969
Selected characteristicsof participants
Participants, by age
9.year:olds 13-year-olds 17.year-olds Young adults(ages 26.35)
Medianpercentconed
Mediandifference'
Medianpercentcorrect
Mediandifference'
Medianpercentcorrect
Mediandifference'
Medianpercentcorrect
Mediandiflereece
1 2 4 5 6 7 8 -9
Total 68.3 58.4 47.1 51.3
Region:Northeast 71.6 2.3 62.2 2.0 49.1 2.6 53.6 0.6Southeast 60.9 -5.0 49.6 -4,7 39.9 -4.9 42.7 -49Central 71.3 1.6 60.3 1.9 47.7 -.0 514 .7West 67.4 .0 57.5 -.5 48.6 1.7 - 542 2.4
Sex:Male 70,1 .9 60.8 1.5 51.2 2.8 57.9 5.3 .
Female 67.5 -1 56.1 -1.4 44.6 -2.3 45.8 . -4.7
Color:White 3.1 623 3.2 483 2.1 54.4 2.7Black
_72.747,7 -14.5 37.1 -15.0 29.7 -11.8 .292 -15.8
Other
r -
52.6 -10.3 45.0 -9.8 372 -64 434 -10.8
Parent's education: 2
No high school 55.2 -72 .44,0 -11.9 35.0 -8.4 41.9 -7.9Some high school 60.0 -4.8 - 46,9 . *-6,1 35.3 :4.6 46.1 -1.6High school graduate , 69.4 .6 55.4 -1.3 48.8 .1 55.2 3.0Post high school 76.7 5.8 66.6 5.2 52.2 5.1 64.0 9.1.
Unknown 61.1 -4$ 47.0 -7.7 33.0 -9.1 30.3 -16.8
Size and type of community:Extreme rural 57.8 -6.3 47.5 -6.1 37.3 -3.5 45.2 -4.7Extreme inner city 44.4 -15.1 39.1 -13.7 35.6 -7.3 34,5 -102Extreme affluent suburbs 783 7.3 67.4 6.3 57.2 5.1 64.8 "10,9Inner city fringeSuburban binge
64.271.4
-2.62.7
52.762.6
-3.82.9
47.146.8
.31.0
48,651.5
-2,9A
Medinm city 69.0 .2 61.8 1.9 473 1.3 52.4 .3Small city 68.7 .9 56.8 .5 44.1 -1.4 46.7 -2.7
' Median differences of group performance from the national performance over all exercises (items).=Highest attained, by either parent.
SOURCE: Taken from first-cycle material available in the files of National Assessment of Educational Progress.1860 Lincoln Street, Denver, Colo, 80203. Oclober1972.
,
161
ri
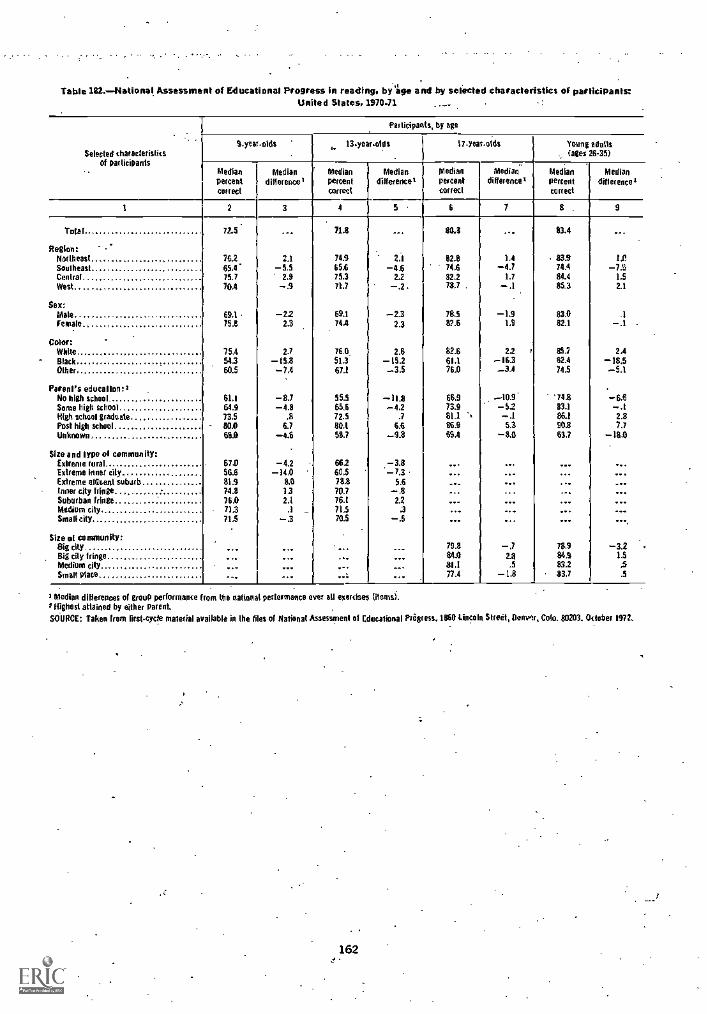
Table 182. - National Assessment of Educational Progress in reading, bylige and by selected characteristics of participants:United States, 1970-71 ..._
Selected characteristicsof participants
.
Participants, by age
3-yespolds 13yearolds 17-yearolffs Young adults., (ages 26.35)
Medianpercentcorrect
Mediandifference'
Medianpercentcorrect
Mediandifferencel
Medianpercentcorrect
Mediandifference 2
MedianPercentmeet
Mediandifference+
2 4 5 6 8
Total 72.5 71.8 80.3 83.4
Region:Northeast 762 2.1 74.9 2,1 82.8 1.4 333 EPSoutheast 65.4" -5.5 65.6 -4.6 74,6 -4.7 74.4 -7.9Central 73.7 2.9 75.3 22 82,2 1.7 84.4 1.5West 70.4 -.9 71.7 78.7 . -.1 85.3 2.1
Sex:MaleFemale
69.1751
-2.22.3
69.174.4
-2.32.3
78,582.6
-1.91.9
83.082.1
-1-.1 -
BolenWillie 75.4 2.7 76.0. 2.6 82.6 2.2 01 2.4Black 54.3 -15,8 51.3 -15.2 61.1 -16.3 62.4 -18.5Other 60.5 -7,4 67.1 -3.5 76.0 -3_4 74.5 -5.1
Parent's education:3No high school 61,1 -8.7 55.5 -1111 66.9 -40.9* '74.8 -6.6Some high school 64.9 -4.8 65.6 -4.2 73.9 -5.2 83.1 -.IHigh school graduate 73,5 .s 72.5 .7 81_1 86.1 2.8Post high school 80.0 6.7 801 6.6 86.9 5.3 90.8 7.7Unknown 68.0 -4.6 58.7 -9.8 69.4 -8.0 63.7 -18.0
Size and type ol community:',drew rural 67.0 -4.2 66.2 -3.8Extreme inner city 56.6 -14,0 60.5 -7,3Extreme affluent suburb 81.9 8.0 78.8 5.6Inner city fringe. 74.8 1.3 70.7 -.8Suburban fringe 76_0 2.1 76.1 2.2Medium city 71.3 .1 71.5 .3
Small city 71.5 -.3 70.5 -.5
Size et community:81g city 79.8 -1 78,9 -3.2 .Big city fringe 84.0 2.8 843 1.5
Medium city 81,1 .5 83.2 .5Small Mace ..: 77.4 -1.8 83.7 .5
3 Median differences of group performance min the national performance over all exercises Menai./Highest attained by either parent. .
SOURCE: Taken from first -cycte material available in the tiles of National Assessmenl of Educational Progress., 1860 Lincoln Street, Demi, Colo. 80203. October 1972.
162
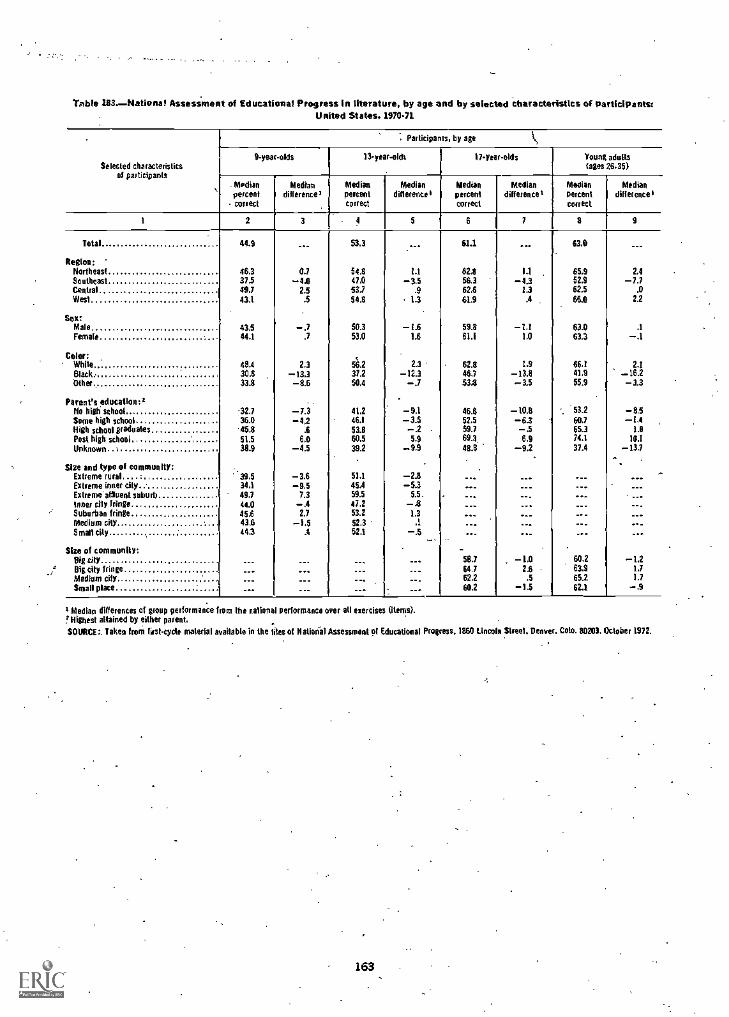
Table 183.-National Assessment of Educational Progress in literature, by age and by selected characteristics of participants:United States, 1970.71
Selected characteristics01 participants
Participants, by age
9-yea -olds 13year-oldt 17ye r-olds Young adults(ages 26-35)
Medianpercentcorrect
Mediandifferences
Medianpercentcorrect
Mediandifference
Medianpercentcorrect
Mediandifference I
Medianpercentcorrect
Mediandifferences
1 2 3 5 6 7 9
Total 44.9 53.3 61.1 63.0
Regina:Northeast 462 0.7 54.8 LI 62.8 El 65.9 2.4Southeast 37.5 -4.0 47.0 -3,5 56.3 -4.3 52.9 -7.7Central 49.7 2.5 53.7 .9 62.6 /.3 62.5 .0West 43.1 .5 54.8 1.3 61.9 66.0 2.2
Sex:Male 43.5 -.7 50.3 -1.6 59.8 -1.1 63A .1
Female 44.1 .7 53.0 1.6 6E1 1.0 63.3 -.1
Color:White 48.4 2.3 562 2.3 62.8 1.9 66,1 2.1Black 30.8 -13.3 37.2 -12.3 48.7 -13.8 41.9 -16.2Other 33.8 -8.6 50.4 -..7 53.8 -3.5 55.9 -3.3
Parent's education:INo high school 2.7 -7.3 41.2 -9.1 46.6 -10.8 53.2 -8.5Sonic high school 36.0 -42 46.1 -3.5 52.5 -6.3 60.7 -1.4High school graduates 45.8 .6 53.8 59.7 -.5 65.3 1.8
Post high school 51.5 6.0 60.5 5.9 69. 6.9 14.l 103Unknown 38.9 -4.5 39.2 -9,9 48.8 -9.2 37.4 -13.7
Sire and type of community:Extreme rural '395 -3.6 51.1 -2.8Extreme inner city 34.1 -9.5 45.4 -5.3Extreme affluent suburbloam ally fringe
49.744.0
7.3-.4
59.547.2
5.5--.5
Suburban fringe 45.6 2.7 53.2 1.3
Medium city 43.6 -E5 52.3 .1
S mall city 44.3 52.1 -.5
Size of community:Rig city 58.7 -1.0 60.2 -1.2Big city fringe 64.7 2.6 63.9 1.7
Medium city.. 62.2 .5 65.2 1.7
Small place 60.2 62.1 --.9
Median differences of group performance rem the national performance over all exercises (items).!Highest attained by either parent,
SOURCE:. Taken from first-cycle material available in the files ot National Assessment of Educational Progress. 1860 Lincoln Streel, Denver. Colo. 80203. October 1972.
163

Digest of Educational Statistics
INDEXA Business and management: ---- Continued
formal awards. organized occupationalcurriculums
Business education, degrees conferredAbandoned instruction roomsAccounting, degrees conferredAdditions to plant value, higher educationAdministrative units (school districts)Adult education:
expenditures, public schoolsparticipants in
Age:enrollment byranges for compulsory and permissive
attendanceAgriculture:
degrees conferredenrollment for advanced degreesenrollment, vocational educationformal awards, organized occupational
curriculumsAlgebra, enrollment, public secondary schoolsAll levels of educationAmerican college students abroadAnnual expenditure per pupil public elementary
and secondary schoolsAnnual salary. (See Salaries.)Annuity funds, higher educationApplied research funds 127,Architecture:
degrees conferred i%
enrollment for advanced degreesArea studies, degrees conferredArt, degrees conferredAssociate degreesAuxiliary enterprises, higher
educationAvailable instruction roomsAverage daily attendanceAverage daily membershipAverage length of school term
Page5199
117.12, 53.54 C
Page
10699
63 Capital outlay:10 all levels of education 22, 25
higher education. (See Additions to plant value.)8.9 public elementary and secondary
schools 61.63, 6533 Catho!:c schools:
elementary and secondary 4098 institutions of higher education 72, 96
80,81 Chemistry:43.44 degrees conferred 101
enrollment, public secondary schools 41106 Church affiliation:41 elementary and secondary schools 40
517 institutions of higher education 72. 96145 City school systems 37
Classrooms. (See Instruction rooms.)65 Classroom teachers:
nonpublic elementary and secondary111.112 schools129. 157 public elementary and secondary schools
secondary schools, by field .
.98 College faculty. (See Faculty. higher education.)sosa 1 College graduates, male, by field
98 College students, selected. 10C, characteristics of . 77.78, 81
. 107 Colleges and universities. (See Institutionsof higher education.)
Communications degrees conferredCommunity colleges, expendituresCommunity services expenditures .
Completed instruction roomsCompulsory attendance, age ranges forComputer and information sciences:
degrees conferred . 99enrollment for advanced degrees .80.81
Consultants, public elementary andsecondary schools . 46
Cuban refugee program funds 133Current expenditures:
all levels of education 22, 25higher education 114.117public elementary and secondary schools 61.65
Carrentfund income, higher education . . 108.111
a
Bachelor's degreesBacteriology, degrees conferredBasic administrative unitsBasic research fundsBiochemistry, degrees conferredBiological sciences:
degrees conferredenrollment for advanced degrees
Biology:degrees conferred .
enrollment, public secondary schoolsBoard rates .
Bond elections, results ofBook and periodical pricesBotany, degrees conferredBusiness and management:
degrees conferred .
enrollment for advanced degrees .
44.4545.4844, 48
104
111.114.11751.52
32,34.3532
.32, 34.35
97-10398
. 12, 53.54126. 129. 156.157
98
9880.81
9841
113. . 60
154.155. 98
99.80.81
165
996363
51.52.33
D
Daily attendance as a percent ofenrollment .
Degrees, earned:associate . . . . .
bachelor's, firstprofessional, master's,doctor's
by sexdentistry
32, 34.35
107
97.10598.104, 107
103.104
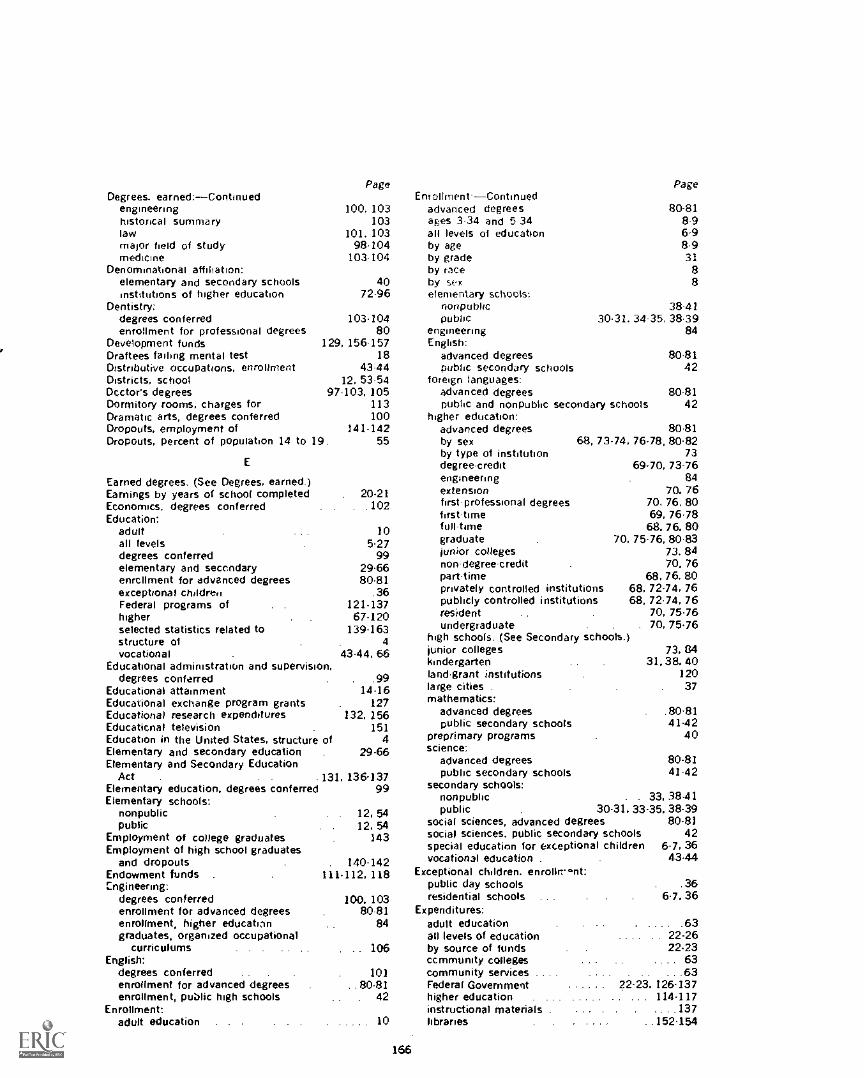
Degrees, earned:--Continuedengineeringhistorical summarylawmajor field of studymedicine
Denominational affiliation:elementary and secondary schoolsinstitutions of higher education
Dentistry:degrees conferredenrollment for professional degrees
Development fundsDraftees failing mental testDistributive occupations, enrollmentDistricts, schoolDcctor's degreesDormitory rooms, charges forDramatic arts, degrees conferredDropouts, employment ofDropouts, percent of population 14 to
E
Page PageEnrollmentContinued
100, 103 advanced degrees103 ages 3-34 and 5 34
101, 103 all levels of education98.104 by age
103-104 by gradeby race
40 by sex72-96 elementary schools:
nonpublicpublic
engineeringEnglish:
advanced degrees 80.81public secondary schools 42
foreign languages:advanced degrees 80-81public and nonpublic secondary schools 42
higher education:advanced degrees 80.81by sex 68, 73.74, 76.78, 80.82
73
103.10480
129, 156-15718
43-4412, 53-54
97-103. 105113100
141-14219. 55
Earned degrees. (See Degrees, earned.)Earnings by years of school completed 20.21Economics, degrees conferred . .102Education:
adult 10all levels 5.27degrees conferred 99elementary and secondary 29.66enrcllment for advanced degrees 80.81exceptional children .36Federal programs of 121.137higher 67.120selected statistics related to 139.163structure of . 4vocational . 43.44, 66
Educational administration and supervision,degrees conferred .99
Educational attainment 1416Educational exchange program grants - 127Educational research expenditures 132, 156Educational television . 151Education in the United States, structure of 4Elementary and secondary education . 29.66Elementary and Secondary Education
Act . . . .131, 136-137Elementary education, degrees conferred 99Elementary schools:
nonpublic 12, 54public 12, 54
Employment of college graduates 143Employment of high school graduates
and dropouts . 140.142Endowment funds - 111.112, 118Cngineering:
degrees conferred 100, 103enrollment for advanced degrees 80-81enrollment, higher education 84graduates, organized occupational
curriculums 106English:
degrees conferred . . 101enrollment for advanced degrees ..80.8Ienrollment, public high schools - 42
Enrollment:adult education 10
166
80-818-96.98.93188
38-4130-31. 34-35, 38.39
84
by type of institutiondegreecreditengineeringextensionfirst professional degreesfirst-timefull-timegraduatejunior collegesnon-degree-creditpart-timeprivately controlled institutionspublicly controlled institutionsresidentundergraduate
high schools. (See Secondary schools.)junior collegeskindergartenland-grant institutionslarge cities .
mathematics:advanced degreespublic secondary schools
preprimary programsscience:
advanced degreespublic secondary schools 41.42
secondary schools:nonpublic - . 33, .38-41public . 30-31. 33.35, 38-39
social sciences, advanced degrees 80-81social sciences, public secondary schools 42special education for exceptional children 6-7, 36vocational education - - 43.44
Exceptional children, enrollir ant:public day schools .36residential schools 6.7. 36
Expenditures:adult education .63all levels of education .. 22.26by source of funds 22.23ccmmunity colleges .... 63community services .. . . .63Federal Government 22-23., 126-137higher education .. . 114.117instructional materials . .. . .137libraries _152.154
69.70, 73-7684
70, 7670, 76. 8069, 76.7868, 76, 80
70, 75.76, 80.8373, 8470, 76
68, 76, 8068, 72.74, 7668, 72.74, 76
70, 75.7670, 75.76
73, 8431, 38, 40
12037
80-8141.42
40
80.81
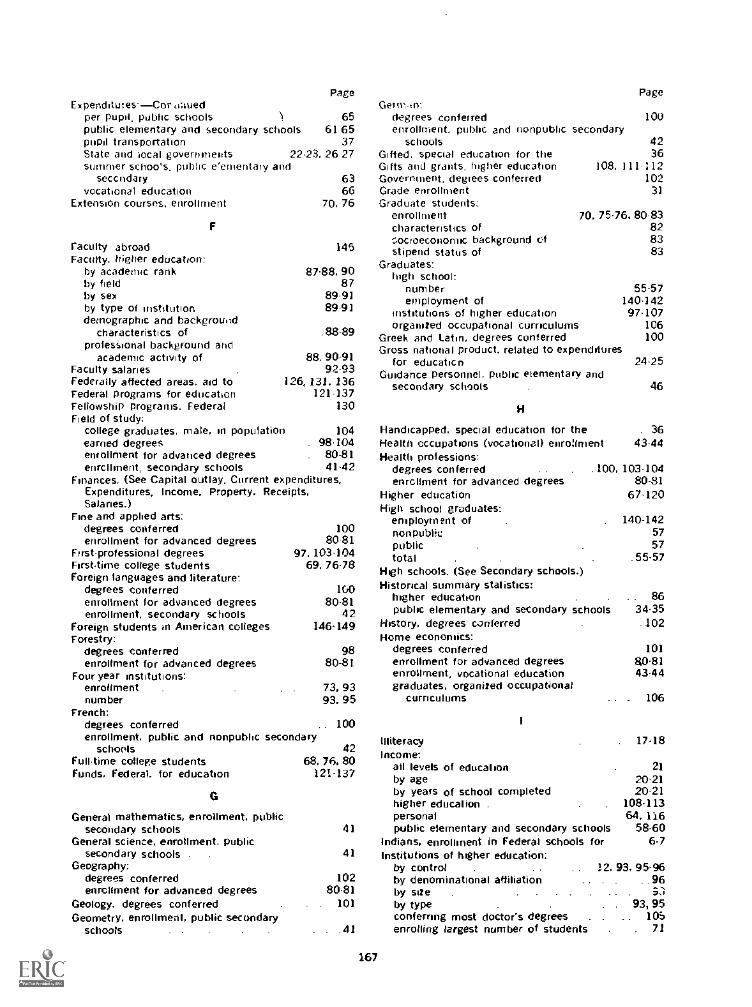
PageExpenditures--Cor sued
per pupil. public schools 65public elementary and secondary schools 61 65pupil transportation 37State and local governments 22.23, 26 27summer schoo's. public e'ementary and
seccridary 63vocational education 66
Extension courses, enrollment 70. 76
F
Faculty abroadFaculty. higher education:
by academic rankby fieldby sexby type of institutiondemographic and background
characteristics ofprofessional background and
academic activity ofFaculty salariesFederally affected areas, aid toFederal programs for educationFellowship programs. FederalField of study:
college graduates, male, in populationearned degreesenrollment for advanced degreesenrchment, secondary schools
Finances. (See Capital outlay. Current expenditures.Expenditures, Income. Property. Receipts,Salaries.)
Fine and applied arts:degrees conferred 100enrollment for advanced degrees 8081
First-professional degrees 97, 103,104Firsttime college students 69, 76.78Foreign languages and literature:
degrees conferred I GO
enrollment for advanced degrees 80.81enrollment, secondary schools 42
Foreign students in American colleges 146.149Forestry:
degrees conferred 98enrollment for advanced degrees 130431
Four year institutions:enrollmentnumber
French:degrees conferredenrollment, public and nonpublic
schonfsFulltime college studentsFunds. Federal. for education
145
87.88, 9087
89 9189 93
88.89
88, 90.9192.93
126, 131. 136121 -]37
130
10498.104
80-8141.42
G
73, 9393. 95
100secondary
General mathematics, enrollment, publicsecondary schools
General science, enrollment, publicsecondary schools . .
Geography;degrees conferredenrollment for advanced degrees
Geology. degrees conferredGeometry. enrollment, public secondary
schools
4268, 76, 80
121.137
41
41
10280.81
101
.41
167
Gerw.tn:degrees conferredenrollment, public and nonpublic secondary
schoolsGifted, special education for theGifts and grants, higher educationGovernment, degrees conferredGrade enrollmentGraduate students:
enrollment 70. 75.76. 80.83characteristics of 82.soctoeconornic background of 83stipend status of 83
Graduates:high school:
number 55-57employment of 140.142
institutions of higher education 97.107organized occupational curriculums 106
Greek and Latin, degrees conferred 100Gross national product, related to expenditures
for educaticn 24.25Guidance personnel, public elementary and
secondary schools 46
Page
100
4236
108. 111.1121023]
H
Handicapped, special education for the . 36Health occupations (vocational) enrollment 43.44Health professions:
degrees conferred .100, 103-104enrollment for advanced degrees 80-81
Higher education 67.120High school graduates:
employment of 140-142nonpublic 57public 57total .55.57
High schools. (See Secondary schools.)Historical summary statistics:
higher education .. 86public elementary and secondary schools 34.35
History, degrees conferred .102Home economics:
degrees conferred 101enrollment for advanced degrees 80.81enrollment, vocational education 43.44graduates, organized occupational
curriculums 106
IlliteracyIncome:
ail levels of educationby ageby years of school completedhigher education .
personalpublic elementary and secondary schools
Indians, enrollment in Federal schools forInstitutions of higher education:
by controlby denominational affiliationby sizeby typeconferring most doctor's degreesenrolling largest number o f students
17.18
2120.2120-21
108-11364, 116
58-606-7
12, 93, 95-96.. 96
93, 9510
71
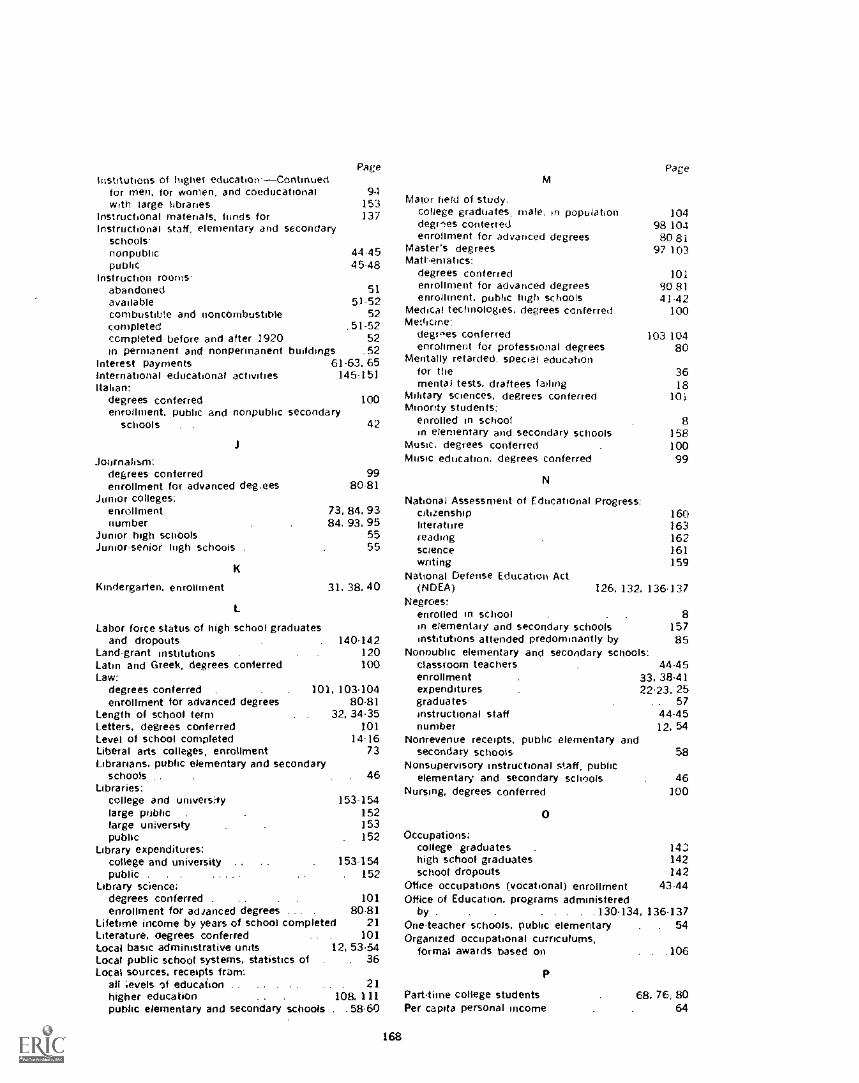
Institutions of higher education--Continuedfor men, for women, and coeducationalwith large libraries
Instructional materials, funds forInstructional staff, elementary and secondary
schools-nonpublicpubhc
Instruction roomsabandonedavailablecombustible and noncombustiblecompletedcompleted before and after 1920in permanent and nonpermanent
Interest paymentsInternational educational activitiesItalian:
degrees conferredenrollment. public and nonpublic secondary
schools .
Page PageM
94153137
44.4545-48
515)-52
52.51-52
52buildings .52
61-63. 65145-151
J
Journalivn:degrees conferredenrollment for advanced degrees
Junior colleges:enrollmentnumber
Junior high schoolsJunior-senior high schools .
Kindergarten. enrollment
K
ILabor force status of high school graduates
and dropoutsLand-grant institutions .
Latin and Greek, degrees conferredLaw:
degrees conferred . .
enrollment for advanced degreesLength of school termLetters, degrees conferredLevel of school completedLiberal arts colleges, enrollmentLibrarians, public elementary and secondary
schools .. 46Libraries:
college and university 153-154large public . 152large university 153public - 152
Library expenditures:college and university 153-154public . . . ... 152
Library science:degrees conferred - 101enrollment for advanced degrees ... . 80.81
Lifetime income by years of school completed 21Literature, degrees conferred .. . 101Local basic administrative units 12, 53.54Local public school systems, statistics of - 36Local sources, receipts from:
all revels of education .. . 21higher education .. 108. 111public elementary and secondary schools . .58-60
100
42
9980-81
73, 84, 9384, 93, 95
5555
31,38,40
140.142120100
101, 103.10480.81
32, 34.35101
14.1673
168
Major field of study.college graduates, male, in population 104degies conferred 98 104enrollment for advanced degrees 80 81
Master's degrees 97 103maaeniatics:
degrees conferred 101enrollment for advanced degrees 90 81enrollment, public high schools 41-42
Medical technologies, degrees conferred 100Me:time:
degr "es conferred 103 104enrollment for professional degrees 80
Mentally retarded, special educationfor the 36mental tests, draftees failing 18
Military sciences, degrees conferred 101Minority students:
enrolled in school 8in elementary and secondary schools 158
Music, degrees conferred - 100Music education, degrees conferred 99
N
National Assessment of Educational Progress:citizenship 160literature 163reading 162science 161writing 159
National Defense Education Act(NDEA) 126, 132. 136.137
Negroes:enrolled in school . - 8in elementary and secondary schools 157institutions attended predominantly by 85
Nonpublic elementary and secondary schools:classroom teachersenrollmentexpendituresgraduatesinstructional staffnumber
Nonrevenue receipts, public elementary andsecondary schools
Nonsupervisory instructional staff, publicelementary and secondary schools
Nursing, degrees conferred
0
Occupations;college graduateshigh school graduatesschool dropouts
Office occupations (vocational) enrollmentOffice of Education, programs administered
by - , 130.134, 136-137One-teacher schools, public elementary 54Organized occupational curriculums,
formal awards based on .106
44 -4533, 38.4122.23, 25
5744-4512, 54
58
46100
143142142
43-44
P
Parttime college students 68.76,80Per capita personal income 64
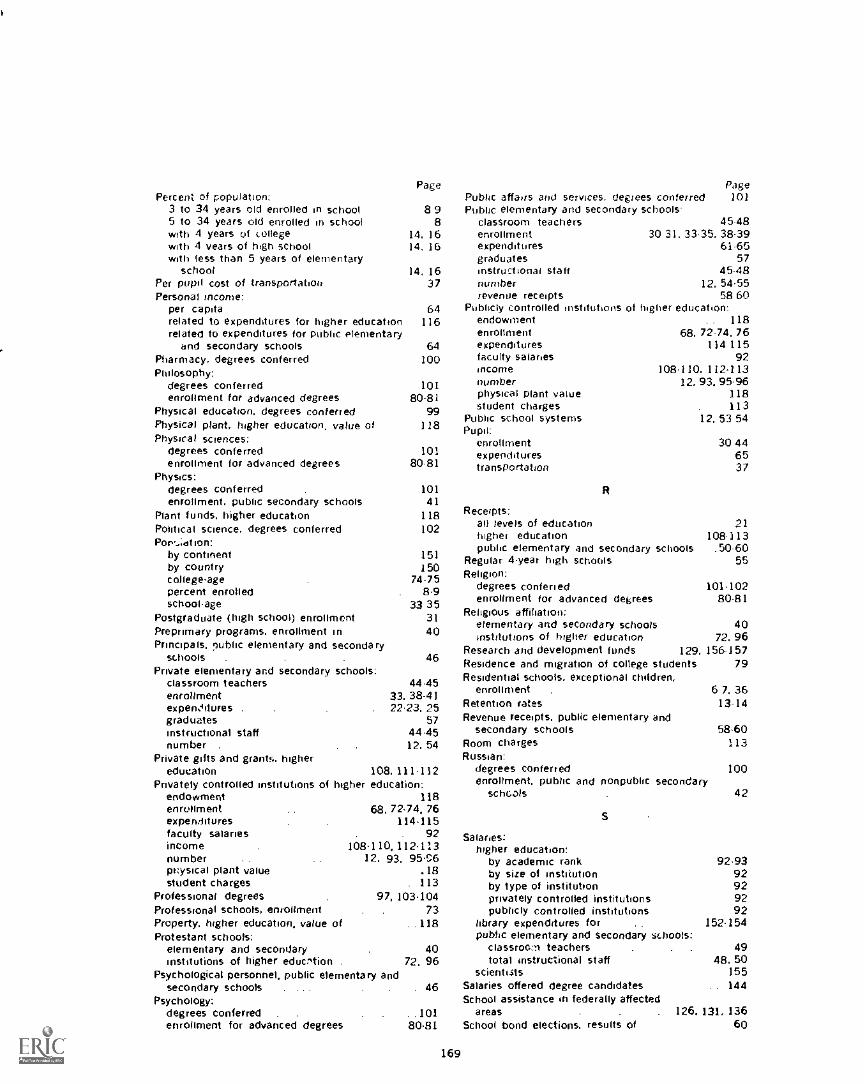
PagePercent of population:
3 to 34 years old enrolled in school 8 95 to 34 years old enrolled in school 8with 4 years of college 14. 16with 4 years of high school 14. 16with fess than 5 years of elementary
schoolPer pupil cost of transportationPersonal income:
per capitarelated to expenditures for higher educationrelated to expenditures for public elementary
and secondary schoolsPharmacy, degrees conferredPhilosophy:
degrees conferred 101enrollment for advanced degrees 80-81
Physical education, degrees conferred 99Physical plant, higher education. value of 118Physical sciences:
degrees conferred 101enrollment for advanced degrees 80-81
Physics:degrees conferred . 101enrollment, public secondary schools 41
Plant funds, higher education 118Political science, degrees conferred 102Por -;at ion:
by continent 151by country 150college-age 74-75percent enrolled 8.9school-age 33 35
Postgraduate (high school) enrollment 31Preprimary programs, enrollment in 40Principals, public elementary and secondary
schools . . .
Private elementary and secondary schools:classroom teachersenrollmentexpendituresgraduatesinstructional staffnumber
Private gifts and grants. highereducation
Privately controlled institutions of higherendowmentenrollmentexpenituresfaculty salariesincomenumberphysical plant valuestudent charges
Professional degreesProfessional schools, enrollmentProperty, higher education, value ofProtestant schools:
elementary and secondaryinstitutions of higher eduction .
Psychological personnel, public elementary andsecondary schools .
Psychology:degrees conferred .
enrollment for advanced degrees
Public affairs and services, degrees conferredPublic elementary and secondary schools-
classroom teachers 45-48enrollment 30 31. 33.35, 38.39expenditures 61-65graduates 57
14, 16 instructional staff 45-4837 number 12. 54.55
revenue receipts 58 6064 Publicly controlled institutions of higher education:
116 endowment .. 118enrollment 68, 72-74, 76
64 expenditures 114 115100 faculty salaries 92
income 108.110. 112.113number 12, 93, 95.96physical plant value 118student charges 113
Public school systems 12. 53 54Pupil:
enrollment 30 44expenditures 65transportation 37
Page101
46
44.4533. 38-4122.23, 25
5744.4512. 54
108.111-112education:
11868, 72-74, 76
114.11592
108.110, 112.11312, 93. 95.6
.,18. 113
97, 103.10473
_118
R
Receipts:all levels of education 21higher education 108.313public elementary and secondary schools .50-60
Regular 4-year high schools 55Religion:
conferred 101.102enrollment for advanced degrees 80-81
Religious affiliation:elementary and secondary schools 40institutions of higher education 72. 96
Research and development funds 129. 156-157Residence and migration of college students 79Residential schools, exceptional children,
enrollment . 6 7. 36Retention rates 13-14Revenue receipts, public elementary and
secondarycondlaarry schools 58-60Room 113Russian:
degrees conferredenrollment, public and nonpublic secondary
schools
S
Salaries:higher education:
by academic rankby size of institutionby type of institutionprivately controlled institutionspublicly controlled institutions
library expenditures forpublic elementary and secondary schools:
40 classroolt teachers - - -
72, 96 total instructional staffscientists
- 46 Salaries offered degree candidatesSchool assistance in federally affected
..101 areas . - - 126,80.81 School bond elections, results of
169
I00
42
92.9392929292
152.154
4948,50
155.. 144
131, 13660
School districts .. .. -
School lunch program funds .
School retention rates ..Schools:
elementary and secondary:nonpublicpublic
higher education:private .
publicSchool systems .
School year, lengthSchool years completed . . .
Science, enrollment, public high schoolsScientists:
by employerby fieldby salaries of .
Secondary education, degrees conferredSecondary schools:
nonpublicpublic:
junior high .
junior-senior highsenior hightotal .
traditionalSecondary school teachers:
nonpublic:.44.45
by field . .44all fields
public:all fields . . 45.48by field . ... ..48
Selected statistics related to education inthe U.S, . . . 139.163
Senior high schools . .55Size of enrollment:
higher education .93school districts 54
Social sciences:degrees conferred 102enrollment for advanced degrees 80.81enrollment, public high schools .42
Social work, degrees conferred .101Sociology, degrees conferred . .102Spanish:
degrees conferred . . . . . 100enrollment, public and nonpublic secondary
schools . . - .. - . . . .42Special education for exceptional children 6.7, 36Speech, degrees conferred . 101Staff. (See Faculty, Classroom teachers,
Instructional staff. Teachers.)State governments, receipts from:
all levels of education . . . - 21higher education .. . .. . - . 108, 111public elementary and secondary schools ...58.60
Statistics. degrees conferred . ... ... . _101Student fees, higher education 113Student loan funds .... - . - .111-112Student loan (Federal) programs .119, 126. 131-132Stuaents. (See Enrollmant.)Subcollegiate departments, higher education:
enrollment . . . .... 6-7instructional staff . , 10
Page12. 53.54
. 127. .13.14
.12,5412. 54.55
12, 93. 95.9612, 93, 95.96
12, 53.5432, 34.35
.14.1641.42
155.15515599
. 12, 54
. 55. 55
. .55.12,54.55
. . .55
170
Summer school expenditures, public elementaryand secondary schools
Supervisors, public elementary and secondaryschools
T
Teachers:all levels of education .
elementary and secondary schools:by fieldcharacteristics ofnonpublicpublic .
higher education:fcr resident instructionselected characteristics of
salaries:higher education ... . .
public elementary and s...ondary schoolsvocational education . .
Teachers and other instructional staff, publicelementary and secondary schools:numbersalaries . .
Teachers colleges, enrollment . .
Technical education (vocational) enrollmentTechnical and semiprofessional programs,
awards based on . . . .
Technological schools, enrollmentTelevision, public .
Tests, draftees failing . .
Theological, religious schools, enrollment .
Theology:degrees conferred 102, 104enrollment for professional degrees . ....4:10
Trades and industry (vocational) enrollment 43-44Traditional high schools 55Traineeship and training grant programs,
Federal . , . 130Transportation, pub": elementary and secondary
schools .37Trigonometry, enrollmer*, public secondary
schools . . .. .. . .... . .41Tuition and fees, higher educ..'on 113
Page
63
46
10,11
44, 4847.4844.45
,45.48
. . ..87.88.91
92.9348.50
.44
4648, 50
73.43.44
.106. 73
1511873
Two-year institutions:enrollment . .
number
U
73, 84. 93. 84, 93, 95
Undergraduate enrollment 70, 75.76U.S. college faculty abroad . 145U.S. college student'. abroad 145U.S. education, structure of 4
Universities:enrollment .73, 93number 93, 95
V
Value of physical plant, higher edunation 118Value of nonexpendable funds, higher
education . . . . 118Value of property, higher education 118Veterinary medicine:
degrees conferred .. ... .. .. 104enrollment for professional degrees 80
Vocational agriculture, enrollmentPage
4344 White and nonwhite persons:Page
Vocational education: . enrollment 8enrollment 43.44 test scores .158expenditures 66 years of school completed ..14.15Federal funds for 66, 126, 131, 136
. teachers 44 Y
Volumes: Years of school completed:college and university libraries 153.154 Persons 25 years old and over ,, .14.16'public libraries 152 ,Persons 25 to 29 years old ... ... .14
W Z
Wages or salary of full-time employees ..48 Zoology, degrees conferred . . ..98
ti VA. GOVERNMENT MNIWIttIC OfrICCJ 1173 0-495-136
171