IMT spectrum demand - Forum Europe EMS
55
The GSMA endorses the findings and conclusions of this report IMT spectrum demand Estimating the mid-bands spectrum needs in the 2025-2030 timeframe A report by Coleago Consulting Ltd 14 th of December 2020
-
Upload
khangminh22 -
Category
Documents
-
view
3 -
download
0
Transcript of IMT spectrum demand - Forum Europe EMS

The GSMA endorses the findings and conclusions of this report
IMT spectrum demand
Estimating the mid-bands spectrum needs in the 2025-2030 timeframe
A report by
Coleago Consulting Ltd
14th of December 2020

Content
1 Executive summary .............................................................................. 1
2 The requirements for 5G drive the need for IMT spectrum .................. 4
2.1 Spectrum to deliver the 5G vision ........................................................ 4 2.2 Low, mid, and high frequency bands .................................................... 5 2.3 Spectrum used for mobile in the European Union ................................ 5
3 Estimating spectrum requirements in the context of 5G ....................... 6
4 Spectrum for citywide speed coverage ................................................ 8
4.1 Mix of spectrum to deliver 5G .............................................................. 8 4.2 Spectrum demand model linked to the ITU-R IMT-2020 requirements 9 4.2.1 The 100 Mbit/s DL user experienced data rate requirement ................ 9 4.2.2 The area traffic demand side – key assumptions ............................... 10 4.2.3 The area traffic capacity supply side – key assumptions ................... 13 4.3 Spectrum supply model to meet the DL area traffic demand in cities . 16 4.3.1 Introduction ........................................................................................ 16 4.3.2 Paris, France ...................................................................................... 19 4.3.3 Amsterdam – The Hague region, Netherlands ................................... 20 4.4 The 50 Mbit/s uplink requirement and combined spectrum needs ..... 21 4.5 Key findings ....................................................................................... 22
5 Mid-band spectrum for 5G “fibre-like speed” FWA ............................. 23
5.1 Introduction ........................................................................................ 23 5.2 Wireless is the fastest growing fixed broadband access technology .. 23 5.3 5G FWA to close the urban-rural digital divide in Europe ................... 25 5.3.1 The European broadband 2025 target ............................................... 25 5.3.2 Subsidies to deliver the broadband target in rural areas .................... 26 5.3.3 Improving the FWA economics with additional mid-bands spectrum . 27 5.3.4 Relevance of FWA for speeds above 100 Mbit/s ............................... 28 5.3.5 Comparing the cost of FTHH and “fibre like speed” 5G FWA ............ 29 5.4 Simultaneous FWA and mobile use of mid-bands spectrum .............. 32
6 Mid-bands spectrum to deliver 100 Mbit/s along motorways .............. 33
7 The role of high bands ....................................................................... 35
7.1 High bands are required to achieve 10 Mbit/s/m2 ............................... 35 7.2 High bands for mobile capacity .......................................................... 35 7.3 High bands spectrum for rural FWA ................................................... 36
8 The need for a wide band assignment ............................................... 37
8.1 Introduction ........................................................................................ 37 8.2 Economic benefit of 100 MHz channel bandwidth.............................. 37 8.3 Per operator contiguous allocations in excess of 100 MHz ................ 38 8.4 Spectral efficiency benefit of a 100 MHz wide band allocation ........... 39 8.5 Wide band allocation vs. carrier aggregation ..................................... 39 8.6 Assessing Ofcom’s SUT model .......................................................... 40
Appendices ...................................................................................................... 42
Appendix A: High density areas in sample cities ......................................... 42 Appendix B: Spectrum needs depending on urban population density ....... 48

Appendix C: ITU-R definition of the user experienced data rate ................. 49 Appendix D: ITU-R definition of area traffic capacity ................................... 50 Appendix E: Selected use cases requiring citywide speed coverage .......... 50
Exhibits
Exhibit 1: IMT 2020 requirements .................................................................. 4 Exhibit 2: Typical spectrum used by mobile in Europe by 2023 ..................... 6 Exhibit 3: New use cases and applications drive 5G spectrum needs ........... 7 Exhibit 4: Mix of spectrum for 5G ................................................................... 8 Exhibit 5: Traffic demand and capacity supply model .................................. 10 Exhibit 6: Key 5G modelling assumptions for future urban environment ...... 15 Exhibit 7: Population and areas of sample cities .......................................... 16 Exhibit 8: DL area traffic demand and spectrum needs ................................ 17 Exhibit 9: Additional mid-bands spectrum need (MHz) to meet DL
requirement .................................................................................. 18 Exhibit 10: Paris: Population density and central region ................................ 19 Exhibit 11: Paris: DL traffic demand and capacity supply ............................... 20 Exhibit 12: Amsterdam: Population density and central regions..................... 20 Exhibit 13: Amsterdam: DL traffic demand and capacity supply..................... 21 Exhibit 14: Additional mid-bands spectrum needs (MHz) to meet UL
requirement .................................................................................. 22 Exhibit 15: Additional mid-bands spectrum needs (MHz) to meet DL and UL
requirement .................................................................................. 22 Exhibit 16: Growth of fixed broadband subscribers by technology in 2019 .... 24 Exhibit 17: FWA connections ......................................................................... 24 Exhibit 18: European broadband policy .......................................................... 25 Exhibit 19: BEREC Very High Capacity Networks Criterion 4 ........................ 25 Exhibit 20: Broadband coverage of homes in the EU 28 ................................ 26 Exhibit 21: FWA covered homes per site model ............................................. 28 Exhibit 22: FWA households supported depending on speed and spectrum . 29 Exhibit 23: Fibre cost per home passed ......................................................... 29 Exhibit 24: Fibre activation cost per home ..................................................... 30 Exhibit 25: Rural FWA cost assumptions ....................................................... 30 Exhibit 26: Cost per rural household connected using FTTH ......................... 31 Exhibit 27: Cost per rural household covered using FWA .............................. 31 Exhibit 28: FWA deployment cost saving vs. FTTH in rural areas.................. 31 Exhibit 29: Spectrum and area traffic capacity ............................................... 35 Exhibit 30: 3GPP FR-1 bands with 100 MHz wide channel ............................ 37 Exhibit 31: Cost per bit depending on channel bandwidth .............................. 38 Exhibit 32: Cost per bit with per operator allocation of over 100 MHz ............ 39 Exhibit 33: 5G NR utilisation of channel bandwidth ........................................ 39 Exhibit 34: Comparison 100 MHz contiguous vs two 50 MHz blocks ............. 40 Exhibit 35: Paris High Density Area ............................................................... 42 Exhibit 36: Lyon High Density Area ................................................................ 42 Exhibit 37: Marseille High Density Area ......................................................... 43 Exhibit 38: Rome High Density Area .............................................................. 43 Exhibit 39: Milan High Density Area ............................................................... 44 Exhibit 40: Madrid High Density Area ............................................................. 44 Exhibit 41: Barcelona High Density Area ....................................................... 45 Exhibit 42: Amsterdam – The Hague High Density Area ................................ 46 Exhibit 43: Berlin High Density Area .............................................................. 46

Exhibit 44: Munich High Density Areas .......................................................... 47 Exhibit 45: Hamburg High Density Area ......................................................... 47 Exhibit 46: Additional mid-bands spectrum needs (MHz) to meet DL
requirement .................................................................................. 48 Exhibit 47: Additional mid-bands spectrum needs (MHz) to meet DL & UL
requirement .................................................................................. 49 Exhibit 48: Speed requirement for video ........................................................ 51 Exhibit 49: Data rates for car automation sensors .......................................... 51
Contact
Stefan Zehle, MBA CEO, Coleago Consulting Ltd
Tel: +44 7974 356 258 [email protected]
David Tanner, MA (Hons), MSc, MIET, CEng Managing Consultant, Coleago Consulting Ltd
Tel: +44 7976 415250 [email protected]

IMT spectrum demand
© copyright Coleago 2020 1
1 Executive summary The big picture
5G will bring major benefits to end users over the coming years. Starting with the existing trends and anticipating further evolution in the longer term, this report elaborates on the importance of making more mid-bands spectrum available for IMT as an essential means to achieve the 5G vision.
The report provides an analysis of the future spectrum needs based on area traffic density demand for the 2025-2030 timeframe, accounting for the 5G target minimum performance requirements. This report considers the spectrum needed to fulfil the user experienced data rates of 100 Mbit/s on the downlink, and 50 Mbit/s on the uplink, defined by the ITU-R for IMT-2020.
Additional mid-bands spectrum for 5G would enable mobile operators to deliver the ITU-R IMT-2020 specifications, notably the user experienced data rates of 100 and 50 Mbit/s on the downlink and uplink in cities, in an economically feasible manner. This report provides an analysis for eleven cities with a population density of 9,000 people per km2 or more, namely Paris, Lyon, Marseille, Berlin, Munich, Hamburg, Madrid, Barcelona, Rome, Milan, and the Amsterdam – The Hague region. Our analysis concludes that in addition to building many more small cells, 1000 to 2000 MHz of additional mid-bands spectrum is required to deliver the 5G vision of downlink user experienced data rate of 100 Mbit/s across the city, i.e. citywide “speed coverage”, and also to satisfy the 50 Mbit/s uplink target. The selected cities have characteristics that also apply to a broad number of other larger cities.
In urban areas with a population density below 9,000 people per km2, mobile operators will also have to densify the network with small cells to deliver the 5G downlink and uplink user experienced data rates, but additional upper mid-band spectrum would reduce the need for cell site densification, thus delivering an environmental benefit.
Making available 1000 to 2000 MHz additional mid-bands spectrum for 5G-NR can also make a major contribution to achieving the European Union’s 2025 connectivity goal. The cost of reaching the European target of making 100 Mbit/s broadband available to 100% of households with FTTH amounts to €123 billion, with an estimated €53 billion of this in rural areas. If FWA using this additional 1000 to 2000 MHz of mid-bands spectrum is used in rural Europe instead of FTTH, this would result in a saving of €42 billion. Importantly, this additional spectrum would provide sufficient bandwidth to ensure that fibre-like speed FWA will also be able to address the needs for fixed connectivity as a long-term solution for rural areas.
The development of automated driving systems and connected vehicles is still in its infancy. The safety and environmental benefits that automated driving and connected vehicles will bring to society are significant but, to realise this vision, reliable high speed connectivity and capacity are required. Additional mid-band spectrum would materially reduce the cost of providing the required area traffic capacity along motorways.
Additional 1000 to 2000 MHz in the upper mid-bands would enable
mobile operators to deliver the ITU-R IMT-2020 requirements, notably the
user experienced data rate of 100 Mbit/s in DL and 50 Mbit/s in UL in
cities in an economically feasible manner.
Using additional mid-bands spectrum for 5G FWA would reduce the cost of
delivering the European 2025 broadband goal by €42 billion

IMT spectrum demand
© copyright Coleago 2020 2
Modelling additional spectrum needs
Our model focuses on the user experienced data rate of 100 Mbit/s on the downlink and 50 Mbit/s on the uplink in a city, i.e. ensuring citywide speed coverage. The relevant metrics are area traffic demand and area traffic capacity (supply) in terms of Gbit/s/km2. We examine the area traffic capacity requirement against the background of increased concurrent bandwidth demand from human users and other use cases.
Aiming at a realistic estimate for spectrum needs in the 2025-2030 timeframe, the report accounts for the following conservative assumptions in respect of area traffic capacity (supply):
Taking into account spectrum already used by mobile operators in the EU and assignments to take place during 2021-2023, by the end of 2023 mobile operators typically will have 190 MHz of low bands spectrum, 460 MHz of mid-bands spectrum, and 400 MHz of upper mid-bands spectrum with some variation between countries. In addition, high-bands (mmWave) spectrum will be available.
The report assumes that all the available spectrum is used for 5G-NR at all available sites by the mobile operators. This is a simplified and optimistic assumption and appropriate for the purposes here because it maximises the use of spectrum and is therefore a conservative assumption in the context of assessing the spectrum needs for 5G-NR.
Site densification in cities will make a significant contribution to reach the 100 Mbit/s downlink requirement. We assumed that in cities, upper mid-bands spectrum will additionally be deployed on three outdoor small cells for each macro site. We also assume that high-bands (mmWave) will be deployed.
On the demand side, we look at area traffic demand in cities in the 2025-2030 time frame:
We use population density in cities as a proxy for area traffic demand density. This is appropriate because traffic generated by connected vehicles, cameras and video based sensors occurs where people are, and is in addition to the traffic generated by human users. Hence tying traffic demand per capita to the 100 Mbit/s downlink and 50 Mbit/s uplink requirements generates a realistic estimate for future area traffic demand which takes account of all use cases.
We examine the area traffic capacity requirement against the background of increased concurrent bandwidth demand from human users and other use cases. This is presented in form of an activity factor ranging from 5% to 25%, the latter being representative for the 2025-2030 time frame.
The area traffic density demand is the net demand after deducting offloading traffic to high bands sites and indoor small cells.
Key findings
The analysis of future needs clearly shows the importance of additional mid-bands spectrum for 5G-NR and its evolution. The findings of our study point towards the following conclusions:
In areas with a population density greater than 9,000 per km2, using an additional 1000 to 2000 MHz of upper mid-bands spectrum would enable operators to deliver the required citywide “speed coverage” with a 100 Mbit/s user experienced downlink data rate and a 50 Mbit/s uplink data rate in an economically feasible manner.
Today’s mobile networks cannot deliver the 100 Mbit/s downlink and 50 Mbit/s uplink user experienced data rates. However, it is economically feasible to deliver these data rates if the additional upper mid-bands spectrum is made available to mobile operators and mobile operators also make substantial investments in MIMO upgrades, upper mid-bands small cells, and high bands.
IMT spectrum demand
© copyright Coleago 2020 3
In areas with a population density below 9,000 per km2, using the additional spectrum would still deliver benefits. The benefit would either be a lower site density or a higher experienced data rate. A lower site density translates into a lower cost per bit which in turn will translate into lower retail prices.
Using these 2000 MHz of additional mid-bands spectrum for 5G FWA would reduce the average cost of bringing 100 Mbit/s connectivity to the remaining unconnected rural households in Europe by 79% compared to FTTH. It would also ensure that fibre-like speed FWA is a long-term solution capable of supporting Very High Capacity Networks (VHCN) at speeds above 100 Mbit/s.
Substantial capacity is required on roads to serve the connected car and smart road use cases. Additional mid-bands spectrum would substantially reduce the number of sites that would otherwise be required to cover Europe’s extensive motorway network.

IMT spectrum demand
© copyright Coleago 2020 4
2 The requirements for 5G drive the need for IMT spectrum
2.1 Spectrum to deliver the 5G vision
One of the pillars in the vision for 5G is to provide ubiquitous high-speed wireless connectivity to mobile and fixed users. “IMT-2020 is expected to provide a user experience matching, as far as possible, that of fixed networks”1. The need for IMT spectrum is driven by the requirements for 5G as set out in the ITU-R requirements for IMT-20202.
Exhibit 1 shows the IMT-2020 (5G) requirements compared to LTE-A. The requirements for 5G compared to LTE-A are not just an incremental percentage improvement but a multiple improvement, i.e. a revolution rather than an evolution. In assessing the need for additional IMT spectrum we are focusing on two of these new 5G requirements:
The user experienced data rate jumps from 10Mbit/s to 100Mbit/s - a factor 10 increase (see Appendix C: for a more detailed description); and
Area traffic capacity moving from 0.1Mbit/s/m2 to 10Mbit/s/m2 – a 100 fold increase (see Appendix D: for a more detailed description).
Exhibit 1: IMT 2020 requirements
Source: Report ITU-R M.2441-0 (11/2018)
Radio frequencies are the key ingredient to deliver these requirements. Therefore the step change in the IMT requirements means there is also a step change in the need for IMT spectrum. Of course improved spectral efficiency associated with higher orders of MIMO, the 5G radio interface, and densification will enable mobile operators to squeeze more capacity out of existing spectrum resources, but this is not remotely sufficient to deliver the capacity requirements of 5G.
1 Report ITU-R M.2441-0 (11/2018), “Emerging usage of the terrestrial component of
International Mobile Telecommunication (IMT)” 2 Report ITU-R M.2441-0 (11/2018), “Emerging usage of the terrestrial component of
International Mobile Telecommunication (IMT)” and Report ITU-R M.2410, “Minimum requirements related to technical performance for IMT-2020 radio interface(s)”
5G requirements focus on area traffic capacity, near guaranteed data rates,
low latency, and reliability and this drives the need for spectrum.

IMT spectrum demand
© copyright Coleago 2020 5
2.2 Low, mid, and high frequency bands
Spectrum in the range of 450MHz to above 24GHz is used for IMT and band plans exist in many frequency ranges. Depending on the frequency range and the amount of spectrum in the range, different frequency bands serve different purposes. The large number of frequency bands can be categorised into four groups: sub-1GHz, lower mid-bands, upper mid-bands, and high bands.
Low bands (e.g. 600, 700, 800, 900, 1500 MHz) are effective at addressing very wide area coverage and deep indoor coverage given their good propagation characteristics. However, there is very little spectrum available and hence the channel bandwidth does not provide much capacity.
Lower mid-bands (e.g. AWS, 1800, 1900, 2100, 2300, 2600 MHz) are already used for IMT for 2G, 3G, 4G and 5G. The lower mid-bands are the capacity layer for 4G data traffic and in most countries the spectrum is used in FDD mode. China is an exception to this, with the world’s biggest 5G deployment in the 2600MHz band with a TDD band plan. The use of this band for 5G will certainly grow over time.
Upper mid-bands (e.g. 3.3-4.2, 4.5-4.99, 6 GHz) are newer to IMT and offer a much wider bandwidth. This is a key 5G capacity resource. As of mid-2020, upper mid-bands spectrum used in most countries is in 3.4-3.8GHz. This report looks at additional mid-bands spectrum up to 7GHz. Upper mid-bands offer a good combination of propagation and capacity for cities. Whilst lower mid-bands have better propagation characteristics, lower mid-bands have limitations in regard to available bandwidth. By contrast, the upper mid-bands have significant bandwidth and reasonable propagation characteristics. The larger amount of spectrum available in upper mid-bands corresponds to larger channel bandwidth supported by 3GPP standards, currently allowing for a 100 MHz wide channel and for maximum bandwidth of 400 MHz in carrier aggregation mode.
High bands (e.g. 26, 28, 40, 66 GHz, also referred to as mmWaves) are effective at addressing areas with very high traffic density and with extreme peak data rates. However, high bands are not suitable for contiguous wide area coverage given the large number of sites this would require
5G will be introduced in legacy bands, namely low bands and lower mid-bands. However, the introduction of 5G is inseparable from making large amounts of new spectrum available for mobile in upper mid-bands, as well as high bands. Exhibit 2 below shows the typical spectrum used by mobile networks in a European country in mid-2021. Upper mid-bands and high bands each serve distinct purposes and hence both are required:
Upper mid-bands are key to make available a citywide 100 Mbit/s user experienced downlink (DL) data rate and the 50 Mbit/s uplink (UL) data rate.
High bands are required to create the area traffic capacity of 10 Mbit/s/m2 at selected locations in urban, suburban, and rural areas where there is a very high traffic density.
2.3 Spectrum used for mobile in the European Union
Our spectrum demand model shall ascertain how much additional mid-bands spectrum will be required in the 2025-2030 time frame. Taking into account spectrum already used by mobile operators in the EU and assignments to take place during 2021-2023, by the end of 2023 mobile operators typically will have 190 MHz of low-bands spectrum, 460 MHz of lower mid-bands spectrum, and 400 MHz of upper mid-bands spectrum with some variation between countries. Exhibit 2 summarises the spectrum bands and bandwidths which we use as the baseline spectrum from which the need for additional spectrum is calculated.
Upper mid-bands (e.g. 3.3-4.2 GHz, 4.5-4.99 GHz, 6 GHz) are newer to
IMT and offer a much wider bandwidth. This is a key 5G capacity resource. The upper mid-bands offer
a good combination of propagation and capacity for cities.

IMT spectrum demand
© copyright Coleago 2020 6
In 10 years’ time, we can anticipate that the vast majority of the baseline spectrum will have been refarmed to 5G. Since we are considering spectrum needs over a 10 year time frame, for simplicity we have assumed that the totality of the spectrum is used for 5G at that point. This assumption maximises the capacity available from existing low and lower mid-bands.
Exhibit 2: Typical spectrum used by mobile in Europe by 2023
Source: Coleago Consulting
3 Estimating spectrum requirements in the context of 5G
The ITU-R methodology for calculating spectrum requirements is set out in the report “Recommendation ITU-R M.1768-1(04/2013), Methodology for calculation of spectrum requirements for the terrestrial component of International Mobile Telecommunications”. Input parameter values to be used in this methodology have been updated from those employed in Report ITU-R M.2078 in order to reflect the developments in mobile telecommunication markets. The ITU-R “Report ITU-R M.2290-0 (12/2013) Future spectrum requirements - estimate for terrestrial IMT” applies this methodology to arrive at a forecast for 2020. This methodology proved to be useful to forecast spectrum requirements in the medium term in the context of WRC-15 and WRC-19.
The methodology was driven by traffic volume which was a reasonable approach because LTE is essentially used for “best effort” smartphone connectivity. In contrast the 5G vision is for a ubiquitous high speed user experience and connectivity for a wide range of new uses coupled with new features. Therefore a key factor in driving the demand for capacity is the vision that 5G should provide the 100 Mbit/s user experienced data rate anytime, anywhere, while “on the move”. While fundamentally in a mobile network a particular speed cannot be guaranteed, there is a quasi-guarantee which translates into a high probability of experiencing this data rate. This means networks will be designed to deliver a data rate (Mbit/s) rather than data volume (Gbytes / month). As a result, as we transition to 5G, the need for capacity will grow faster than traffic volume.
5G enables the Internet of Things (IoT) with Massive Machine Type Communications (mMTC) and Ultra Reliable and Low Latency Communications (uRLLC). 5G end to end features such as making available a slice of the network for specific use cases bring a new dimension to how wireless communications can be used.
Upper mid-bands
3.5GHz 400 MHz
Low bands
700MHz 2x30 MHz800MHz 2x30 MHz900MHz 2x35 MHz
Total 190 MHz FDD
Lower mid-bands
1800MHz 2x75 MHz2100MHz 2x60 MHz2600MHz 2x70 MHz2600MHz 50MHz
Total 410 MHz FDD, 50 MHz TDD
High bands
26GHz 1000 to 3000 MHz TDD
Legacy bands New “5G” bands
Based on typical situation in Europe in 2021
Area traffic capacity of 10 Mbit/s/m2
User experienced data rate 100 Mbit/s
5G is not simply a continuation as we know it. The 5G vision is for a
ubiquitous fibre-like speed user experience and connectivity for a
wide range of new uses coupled with new features.

IMT spectrum demand
© copyright Coleago 2020 7
Exhibit 3 illustrates that 5G spectrum needs are driven by a vastly expanded set of applications and use cases, all enabled by the enhanced capabilities of 5G compared to 4G. With these capabilities 5G is an enabling platform for what has been described as the “4th industrial revolution”3. While appearing futuristic today, connected vehicles, smart deliveries with drones and robots and smart cities will generate traffic volumes far higher than todays’ smartphone driven data usage rates.
Exhibit 3: New use cases and applications drive 5G spectrum needs
Source: Coleago Consulting
Not only are there many new applications and use cases, but many future applications require higher speeds. These developments show that there is a need for “speed coverage”. The 100 Mbit/s requirement of 5G is a reflection of this. For applications and use cases which require a minimum speed, not having the required speed is the same as not having coverage at all.
Given the step change from 4G to 5G, forecasting spectrum needs based on the historic trend in traffic volume per smartphone needs to be adapted. The focus on traffic volume per smartphone is a 4G paradigm. With 5G the focus is on user experienced data rates and area traffic capacity as set out in the ITU-R’s IMT 2020 requirements. Driven by these requirements, we have based our analysis of the need for additional upper mid-bands spectrum in delivering near guaranteed user experienced data rates of 100 Mbit/s on the DL and 50 Mbit/s on the UL, anytime, anywhere in cities while “on the move”. Additionally, we also examine how the requirement to deliver the area traffic capacity of 10 Mbit/s/m2 can be delivered.
3 Klaus Schwab, The Fourth Industrial Revolution, Magazine of Foreign Affairs, 12 Dec 2015
Not only are there many new applications and use cases, but many
future applications require higher speeds.
With 5G the focus is on user experienced data rates and area
traffic capacity as set out in the ITU’s IMT 2020 requirements.

IMT spectrum demand
© copyright Coleago 2020 8
4 Spectrum for citywide speed coverage
4.1 Mix of spectrum to deliver 5G
As regards the user experienced data rate of 100 Mbit/s this needs to be delivered at least in all urban and sub-urban areas4. This is economically feasible, even in the high density cities we have analysed provided that, in addition to the available mid-band spectrum, a further 1,000 to 2,000 MHz of mid-bands spectrum is made available for IMT. Without this additional spectrum, a denser network would be required and thus the number of cell sites required in those cities to provide the “speed coverage” would increase network cost to a point where it may not be possible to offer a wireless broadband service at a price point that is economically feasible.
Secondly, 5G is designed to cater for extremely high traffic densities of 10 Mbit/s/m2. These occur in specific geographical areas, both outdoors and indoors. Legacy spectrum and new upper mid-bands are not sufficient to deliver this requirement. The 10 Mbit/s/m2 goal can only be reached if high bands are deployed. However, the propagation characteristics of the high bands are such that high bands alone cannot be a citywide contiguous coverage solution, because the number of cell sites required would be too high from an economic perspective. High bands are therefore not a substitute to upper mid-bands.
Exhibit 4: Mix of spectrum for 5G
Source: Coleago Consulting
Below we provide an analysis of these issues for several cities which all lead to a common conclusion:
Using 1,000 to 2,000 MHz of upper mid-bands spectrum in addition to the 400MHz in the 3.5GHz band would deliver the required citywide “speed coverage” with a 100 Mbit/s user experienced downlink data rate.
The 50 Mbit/s UL user experienced data rate may drive additional spectrum demand, depending on the adopted TDD configuration and on the specific use cases.
Today’s mobile networks cannot deliver the 100 Mbit/s user experienced data rate. However, it is economically feasible to deliver this 100 Mbit/s data rate if the additional upper mid-bands spectrum is made available to mobile operators and
4 “For wide area coverage cases (e.g. in urban and suburban areas), a user experienced data rate
of 100 Mbit/s is expected to be enabled. In hotspot cases, the user experienced data rate is expected to reach higher values (e.g. 1 Gbit/s indoor).” Source: Report ITU-R M.2441-0 (11/2018), Emerging usage of the terrestrial component of International Mobile Telecommunication (IMT), page 7.
The user experienced data rate of 100 Mbit/s needs to be delivered at
least in all urban and sub-urban areas. This is economically feasible, provided that 1,000 to 2,00 MHz of
additional mid-bands spectrum is made available for IMT.

IMT spectrum demand
© copyright Coleago 2020 9
mobile operators also make substantial investments in MIMO upgrades, upper mid-bands small cells, and high bands small cells.
High bands are necessary to deliver the 10 Mbit/s/m2 goal, however, these cannot substitute the mid-bands. This is discussed in detail in Chapter 7 below.
4.2 Spectrum demand model linked to the ITU-R IMT-2020 requirements
4.2.1 The 100 Mbit/s DL user experienced data rate requirement
The need for spectrum is driven by traffic density. Therefore to examine future spectrum needs for IMT, we need to analyse traffic demand in areas with high population densities, i.e. cities. With this in mind, we have developed a concise and easily verifiable model to examine the impact of mid-bands spectrum in a city to deliver the ITU-R requirement for IMT-2020 (or 5G) of a 100 Mbit/s user experienced data rate in the downlink.
“Traditional usage” models employ individual user consumption figures coupled with various factors to derive overall capacity needed. Instead our model examines the capacity needed over a wide area in a city consistent with the ITU-R IMT-2020 capacity focussed requirements, notably the requirement to deliver a user experienced DL data rate of 100 Mbit/s.
In the development of the ITU’s IMT-2020 requirements, the user experienced data rate relates to human users but this will account for only part of the traffic. Connected cars, cameras, and IoT devices will generate substantial amounts of traffic. Hence one of the requirements of 5G is to support 10 million devices per km2. The uncertainty over how much simultaneous capacity will be required for all of these use cases in a given area is very large and bottom up-models of future traffic are speculative. Our approach is to use population density in cities as a proxy for traffic density to estimate the minimum or floor capacity requirement. This is conservative, since traffic generated by connected vehicles and video based sensors could be a multiple of traffic generated by human users. Hence tying traffic demand per capita to the 100 Mbit/s requirement generates a conservative estimate for future spectrum needs.
The advantage of this approach is that the model is easy to validate because it relies on a small number of key assumptions around typical cell sizes and average spectral efficiencies that are representative of future 5G deployments.
The 100 Mbit/s date rate requirement is not the same as a guaranteed data rate. The economics of mobile networks are driven by the fact that radio access network resources are shared between users. This is the key reason why per Gbyte retail prices for mobile data services have declined substantially and, with the introduction of 5G, continue to decline at a fast rate. In a shared network, the user experienced data rate is dependent on the probability of simultaneous demand from multiple users in a given cell. Providing a guaranteed data rate for all users would not be feasible from an economic perspective. The area traffic capacity supply is derived from an average spectral efficiency which cannot guarantee that the user experienced data rate is delivered consistently at all times. Therefore it would be inappropriate to turn the ITU-R IMT 2020 requirement for a 100 Mbit/s user experienced rate into a regulatory obligation. One of the features of 5G is network slicing. This enables mobile operators to deliver a guaranteed data rate, but at a higher price
We have developed a concise and easily verifiable model to examine the
need for mid-bands spectrum in an urban environment to deliver the ITU-R requirement for IMT-2020 of a 100 Mbit/s user experienced data rate in
downlink.
The advantage of focusing on the 5G requirements for a minimum data rate
is that the model is easy to validate because it relies on a small number of
key assumptions.

IMT spectrum demand
© copyright Coleago 2020 10
Exhibit 5: Traffic demand and capacity supply model
Source: Coleago Consulting
4.2.2 The area traffic demand side – key assumptions
With regards to the demand for capacity in a city with a particular population density, the four drivers in our model are listed below and described in the following paragraphs:
the IMT-2020 requirement for a DL user experienced data rate of 100 Mbit/s and a 50 Mbit/s uplink data rate;
the population density;
an assumption of concurrent demand from human users and new use cases (the activity factor);
an assumption of how much of the traffic demand would be satisfied by high bands (24GHz and above) sites; and
an estimate of the percentage of traffic offloaded to indoor upper mid-bands small cells.
These assumptions are applied to population densities. The objective is to compare the traffic demanded in a city with the capacity delivered, depending on the amount of spectrum deployed.
100 Mbit/s user experienced data rate in the downlink
The ITU-R requirement is that IMT-2020 must deliver a DL user experienced data rate of 100 Mbit/s. This is the starting point for the demand analysis. This requirement was developed some time ago in 2013 and may therefore increase. 5G is an IMT-2020 technology and thus is expected to deliver such speed.
Capacity supply per km2 (Gbit/s/km2)
Population Density
Concurrent demand from human users
Concurrent demand from new use cases
Offload to indoor small cells and
mmWave sites (%)Activity factor (%)
Traffic demand per km2 (Gbit/s/km2)
ITU RequirementUser experienced
data rate 100 Mbit/s
Macro site inter-site distance meters
Number of outdoor small cells relative to
macro sites
Macro site sectorisation
Small cell sectorisation
MHz of spectrum on macro site
MHz of spectrum on outdoor small cell
Spectral efficiency bit/s/Hz macro site
Spectral efficiency bit/s/Hz small cell
The ITU-R requirement is that 5G must deliver a DL user experienced
data rate of 100 Mbit/s. This is the starting point for the demand
analysis.

IMT spectrum demand
© copyright Coleago 2020 11
The user experienced data rate of 100 Mbit/s needs to be delivered across an entire city, i.e. anytime anywhere high speed experience. Thus, mobile operators must cater for “speed coverage” across the entire city area. This implies that the traffic per square kilometre over an entire city area is a function of the population density in that city. This results in an average traffic demand per square kilometre (Mbit/s/km2).
Citing an average implicitly assumes that traffic demand is evenly distributed across the city area. In reality traffic is not evenly distributed across a city area, but for our approach to demand modelling, the simplified assumption that traffic which would be carried by low bands and lower / upper mid-bands can be treated as relatively evenly distributed is reasonable, considering the following:
As explained below, data usage and the duration of usage is increasing and hence high bandwidth demand extends over longer periods of time.
Today’s traffic distribution relates largely to traffic demand from smartphones. In a mid-term future traffic demand by new use cases and new applications will occur in locations within a city where previously there may not have been a need for much capacity, for example on urban transport routes. This tends towards a more even demand for capacity across a city area.
There are always areas with a very high area traffic capacity requirement. Our model takes account of this by assuming that high bands will provide capacity in those areas. This will effectively take care of localised peaks in area traffic demand thus leaving traffic demand in the remaining area more evenly distributed. In other words, localised traffic demand peaks are offloaded to high band sites.
Population density
Our approach is to use population density in cities as a proxy for traffic density to estimate the minimum or floor capacity requirement. This is very conservative, since traffic generated by connected vehicles and video based sensors could be a multiple of traffic generated by human users. Hence tying traffic demand per capita to the 100 Mbit/s requirement generates a conservative estimate for future spectrum needs.
From a network dimensioning perspective, administrative city boundaries are irrelevant and what matters are areas with a high population density. Population density should be looked at over a reasonably large urban area which may or may not be within the administrative boundaries of a city or encompass the whole city. Given that population density is an average over an area, one must define the level of analysis and it is appropriate to look at population density clusters rather than dividing a city’s population by the area within its administrative boundary. The area considered needs to be reasonably large, i.e. not just a 1 km2 hotspot, for the issue to be material. From a materiality perspective, Coleago considers that the minimum size is 25 km2 in a single area or several such areas within an urban area.
Demand for area traffic capacity is of course only a problem in areas with a high population density. In our analysis (based on publicly available data5) of specific cities we focus on areas within a city with a population density of at least 9,000 people per km2. In principle, the higher the density, the greater the demand per km2.
Concurrent demand for capacity - the activity factor
As stated above, the key driver to determine the traffic demand per km2 within a city area is population density. However, not all users would require 100 Mbit/s at the same time. We need an assumption with regards to the concurrent or simultaneous demand for capacity during the busy period. In our model this is captured in the form of an “activity factor” to represent concurrent use in a cell from human users with smartphones and other devices, and new use cases such as connected cars, sensors, and cameras.
5 https://sedac.ciesin.columbia.edu/data/set/grump-v1-urban-extents
Our approach is to use population density in cities as a proxy for traffic density to estimate the minimum or
floor capacity requirement.

IMT spectrum demand
© copyright Coleago 2020 12
It is reasonable to use population density as a proxy for demand from human users with smartphones and other devices as well as new use cases because many new use cases occur where people are. Traffic from new use cases occurs in addition to traffic generated by human users. In other words it adds to the human activity factor. As an illustration, let’s consider the case of 5G enabled cameras. Most cameras are where people are. The higher the population density, the higher the density of cameras is likely to be.
As regards the activity factor for human users in urban environments, this is likely to be in the range of 5 to 10% today. This estimate is based on Coleago’s work with mobile operators in the context of spectrum auctions world-wide. In other words, in the busy period for a particular cell up to 10% of the population present in a cell may be using their devices simultaneously in that cell and hence their demand for capacity is additive.
Today’s mobile network usage is dominated by smartphones and is increasing rapidly. In 2019, the average usage per smartphone was 7.0 Gbytes / month6. In Finland average usage is already nearly five times higher than this: “Mobile data usage grew to 34 gigabytes per Finn per month during the first half of 2019, which is 21 per cent more than the year before”7. Looking specifically at 5G users in South Korea, monthly data usage is three times8 higher compared to 4G users. This is driven by the fact that users opt for 5G plans which offer unlimited data usage and do not throttle speed above a certain limit. Increased use means people are using more data for longer periods. The higher the usage, the more concurrent use there will be. This is evident from FTTH, xDSL, and cable broadband which have a busy period lasting several hours rather than the peaky traffic pattern associated with today’s mobile use. The high concurrent usage for FTTH, xDSL and cable is in no small part due to the fact that unlimited use plans are common. Unlimited data plans are becoming common for 5G mobile. This translates into a higher activity factor for human users, i.e. more people use their devices at the same time in the same cell.
Not only is average usage per smartphone increasing rapidly, but traffic demand from non-human usage is just at the beginning of the growth curve. Therefore when assessing the activity factor, we need to take account of new use cases.
In the development of the ITU’s IMT 2020 requirements, the user experienced data rate relates to human users. However, as shown in Exhibit 3 above, 5G enables new use cases and has features not available in 4G, all of which increase the demand for capacity and this is discussed in Chapter 3 above. Connected cars, cameras, and a high density of IoT devices will generate substantial amounts of new data traffic.
There is considerable uncertainty over how much of the demand for the new use cases in a given area will be simultaneous. Our approach is to use population density in cities as a proxy for traffic density in order to estimate the minimum or floor capacity requirement. This approach is very conservative, since traffic generated by connected vehicles, cameras, and video based sensors could be a multiple of traffic generated by human users. For example, connected cars today generate hardly any traffic. However, over a 10 year time frame a connected car may generate about as much data as 3,000 people as explained in Chapter 6 of this report9, On this basis Coleago estimates that today’s average data usage per capita from smartphones, IoT, smart city, connected cars and other use cases is less than 5% of what we will see once 5G is mature.
6 Source: Ericsson Mobility Report, June 2020 7 Source: Traficom, Finish Transport and Communications Agency, 2.11.2019 8 Source: MITC, December 2019 traffic 9 Brian Krzanich, CEO, Intel, 2019
Not only is average usage per smartphone increasing rapidly, but
traffic demand from non-human usage is just at the beginning of the
growth curve.
IMT spectrum demand
© copyright Coleago 2020 13
It is with this in mind that we analyse the need for additional mid-bands spectrum for a range of activity factors. This range represents how the activity factor will grow over time. An activity factor of 5% to 10% is likely to be representative of the mobile bandwidth demand in 2020. We expect that the activity factor will reach 25% within the 2025-2030 time frame considered by this report. This takes account of both of human users as well as other uses such as connected vehicles, smart city, cameras, and network slices.
High bands offloading factor
As of December 2020, high bands are not yet deployed in Europe. However, it is expected that they will be by the time additional spectrum in mid-bands is made available.
High bands will not provide continuous coverage in a city but will be deployed to serve indoor and outdoor locations with an extremely high traffic density. While the number of high bands sites will vary substantially from city to city and thus coverage and traffic captured will differ. In the analysis below we use a high band offload of 10%, 20%, and 30% respectively.
The role of high bands discussed in more detail in Chapter 7.
Offloading to indoor small cells
In some locations upper mind-bands small cells are expected to be installed indoors to provide speed coverage. We assume that 10% traffic will be offloaded to upper mid-band indoor cells.
4.2.3 The area traffic capacity supply side – key assumptions
The variables in the city capacity supply per km2 availability model are:
the number of macro cell sites per km2, driven by the inter-site distance;
the role of mid-bands small cells;
base station design margin;
the site sectorisation;
the spectral efficiency; and
the amount of existing spectrum and additional spectrum required.
Number of macro cell sites
A key assumption is the number of macro base station sites per km2 across a city at which the spectrum is used. For this we have not made operator specific assumptions, but for the sake of simplicity we model this as if all operators share the same sites. Since not all physical sites are multi-tenant, the real number of physical sites would be higher but not all spectrum would be used at each site. The capacity calculation does not depend on this issue because total capacity is the number of sites multiplied by the amount of spectrum on each site. Our simplified approach is therefore representative.
In a typical city, sub-1 GHz and lower mid-bands are deployed mostly on macro sites, while upper mid-bands are deployed on macro sites and small cells. The typical inter-site distance for macro sites is ca. 400m.
In cities, the inter-site distance is driven by the need to provide capacity rather than range. We validated this assumption by comparing the number of macro sites predicted by the model with the number of actual sites.
The role of mid-bands small cells
We need to take account of future site build with 2025-2030 in mind. 5G will rely on small cell deployment to ensure speed coverage and hence the number of cell sites is expected to increase substantially.
A key assumption is the number of macro base station sites per km2
across a city at which the spectrum is used. For this we have not made
operator specific assumptions, but for the sake of simplicity we model this
as if all operators share the same sites.

IMT spectrum demand
© copyright Coleago 2020 14
Small cells would not provide contiguous coverage but would be deployed to fill in “speed coverage holes”. These speed coverage holes are locations where, for example due to blockage by buildings, upper mid-bands used at macro sites do not provide coverage. In other words, outdoor small cells provide consistency of area traffic capacity by in-filling any speed coverage holes at the macro layer.
The precise number of outdoor small cells required to fill in speed coverage holes depends on the topology of a particular city. Based on Coleago’s work with operators10, in a typical urban area in a 15 years’ time frame the number of outdoor small cells for upper mid-band deployment would be two to three times the number of marco sites. In our model, we conservatively assume that the number of upper mid-band outdoor small cells in cities would grow to be three times the number of macro sites.
For example, the macro site raster in Paris consists of 616 macro sites (assuming 100% co-location by all operators) and we assume that 1,848 (616 x 3) outdoor small cells will be added. This assumes 100% co-location by all operators but in practice there are likely to be many more small cells sites because not all sites will have 100% colocation. Whether small cells are colocated or not does not matter from the area traffic capacity modelling perspective.
In theory mobile operators could build many more small cells. However there are two constraints, economic and environmental. It is significantly more cost effective to add spectrum to an existing site because this reduces capital expenditure and operational expenditure. In a competitive market this translates into lower retail prices, i.e. a consumer surplus. Secondly, local authorities are keen to limit mobile sites to the number necessary to provide a good 5G service because a very large number of sites is not desirable from an environmental perspective.
Design margins
In practice in the busy period a base station site capacity cannot be fully utilised. In order to manage interference a design margin of at least 15% is required. In other words, in practice 15% of the nominal capacity cannot be used. The assessment of the spectrum needs in this report is based on the busy period when Base Stations are heavily loaded. This approach allows not to overestimate the need for additional spectrum. Overestimation may occur if a higher design margin is considered, which is equivalent to less loaded Base Stations.
Site sectorisation
A typical urban macro-cell deployment uses three sector sites which increase the capacity per site. However, small cells will have predominantly only one sector. Our model is consistent with these assumptions.
Spectral efficiency
We have used appropriate assumptions with regards to the downlink and uplink spectral efficiency for the different types of spectrum in an urban environment. While currently 2G, 3G and 4G are deployed in low bands and lower mid-bands, in time these will all be refarmed to 5G. Therefore we used the higher spectral efficiency for 5G with an appropriate MIMO configuration as shown in Exhibit 6.
The spectral efficiency values used are based on values typically used by many mobile operators for whom Coleago has carried out long-term network dimensioning work as well as simulations carried out by vendors. In some cases the values are lower than those published by the ITU-R.
10 Source: Coleago Consulting work with several operators in Europe and North America.

IMT spectrum demand
© copyright Coleago 2020 15
The ITU-R spectral efficiency values are achievable under ideal conditions in a dense urban environment, but here we are modelling a real world deployment and consider average spectral efficiency not only over a cell area but over an entire city. The high population density areas include both dense urban and urban environments. For example, the ITU-R target for dense urban eMBB is 7.8 bit/s/Hz and could be achieved by using 64-element MIMO at the base stations. However, across a city in upper mid-bands a mix of MIMO configurations will be used and hence we used a blended average spectral efficiency. For other environments we used vendor simulation results because M.2410 either does not cover these or does not cover these with the same assumptions as we used.
Spectrum used and additional spectrum requirement
We assume that all available low-bands, lower mid-bands, and upper mid-bands will be deployed on all macro sites. As regards small cells, we assume that upper mid-bands spectrum will be used on all small cells. In addition, we also assume that high bands (mmWaves) will be deployed in the city and thus part of the traffic will be absorbed by the mmWave sites (i.e. offload to high bands).
We have modelled how much spectrum would be required to deliver the experienced data rate of 100 Mbit/s in the downlink in an urban environment, where the variable which drives spectrum demand is the population density in the urban environment. We also similarly modelled the requirement to deliver a 50 Mbit/s uplink user experienced data rate.
The last column in Exhibit 6 below shows the baseline spectrum which we expect to be assigned and deployed in the near term, i.e. from 2021 to 2024. In the spectrum demand model, the baseline spectrum resources deliver the baseline area traffic capacity. When area traffic demand exceeds this baseline capacity, additional spectrum is required.
Exhibit 6: Key 5G modelling assumptions for future urban environment
Band Category Average inter-site distance
(m)
Number of sectors
Average DL/UL
spectral efficiency (bit/s/Hz)
Baseline spectrum available
700, 800, 900 MHz
Macro site;
Low bands
400 3 1.8 / 1.8 190 MHz
1800, 2100, 2600 MHz
Macro site;
Lower mid-bands
400 3 2.2 / 2.5 460 MHz
3.5 GHz Macro site;
Upper mid-bands
400 3 6.0 / 4.1 400 MHz
Additional mid-bands
Macro site;
Mid-bands
400 3 6.0 / 4.1 Spectrum demand
model output
3.5 GHz Small cell;
Upper mid-bands
n/a* 1 3.7 / 2.6 400 MHz
Additional mid-bands
Small cell;
Mid-bands
n/a* 1 3.7 / 2.6 Spectrum demand
model output
* For small cells this does not assume contiguous coverage because small cells are deployed to fill in speed coverage holes rather than providing contiguous coverage. Hence the inter-site distance is irrelevant.
Source: Coleago Consulting
We assume that all available low-bands, lower mid-bands, and upper
mid-bands will be deployed on all macro sites. As regards small cells,
we assume that upper mid-bands spectrum will be used on all small
cells.
IMT spectrum demand
© copyright Coleago 2020 16
4.3 Spectrum supply model to meet the DL area traffic demand in cities
4.3.1 Introduction
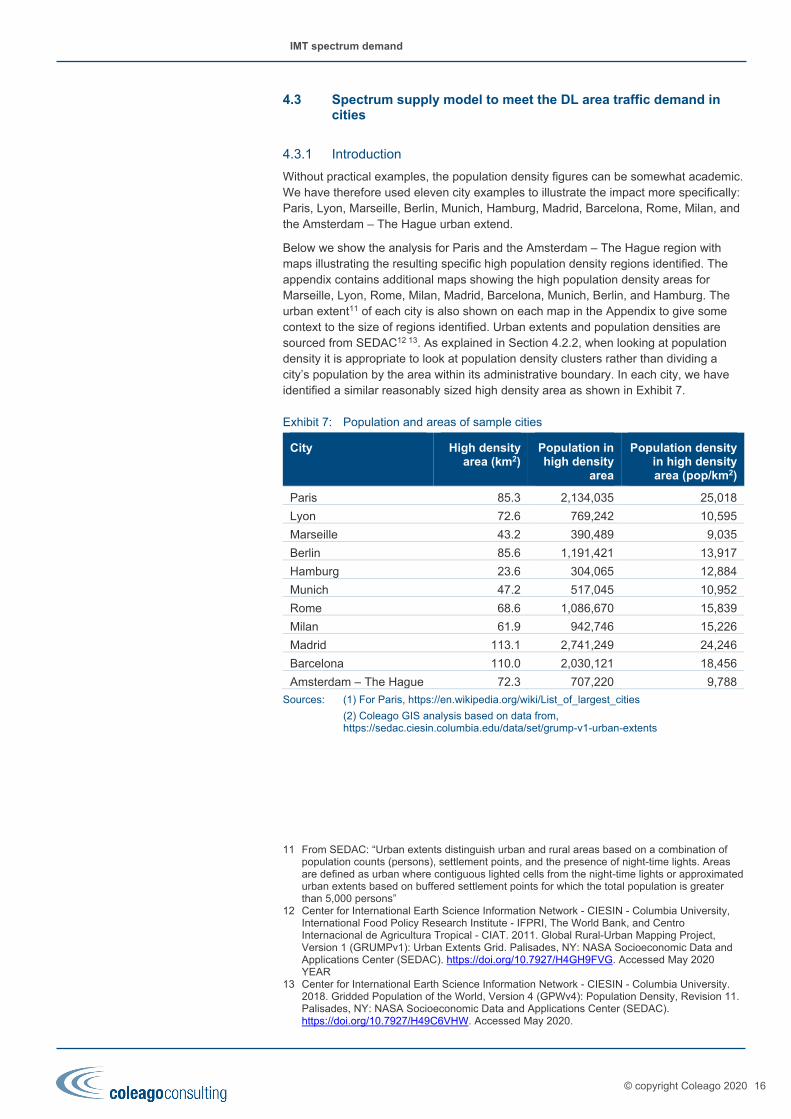
Without practical examples, the population density figures can be somewhat academic. We have therefore used eleven city examples to illustrate the impact more specifically: Paris, Lyon, Marseille, Berlin, Munich, Hamburg, Madrid, Barcelona, Rome, Milan, and the Amsterdam – The Hague urban extend.
Below we show the analysis for Paris and the Amsterdam – The Hague region with maps illustrating the resulting specific high population density regions identified. The appendix contains additional maps showing the high population density areas for Marseille, Lyon, Rome, Milan, Madrid, Barcelona, Munich, Berlin, and Hamburg. The urban extent11 of each city is also shown on each map in the Appendix to give some context to the size of regions identified. Urban extents and population densities are sourced from SEDAC12 13. As explained in Section 4.2.2, when looking at population density it is appropriate to look at population density clusters rather than dividing a city’s population by the area within its administrative boundary. In each city, we have identified a similar reasonably sized high density area as shown in Exhibit 7.
Exhibit 7: Population and areas of sample cities
City High density area (km2)
Population in high density
area
Population density in high density area (pop/km2)
Paris 85.3 2,134,035 25,018
Lyon 72.6 769,242 10,595
Marseille 43.2 390,489 9,035
Berlin 85.6 1,191,421 13,917
Hamburg 23.6 304,065 12,884
Munich 47.2 517,045 10,952
Rome 68.6 1,086,670 15,839
Milan 61.9 942,746 15,226
Madrid 113.1 2,741,249 24,246
Barcelona 110.0 2,030,121 18,456
Amsterdam – The Hague 72.3 707,220 9,788
Sources: (1) For Paris, https://en.wikipedia.org/wiki/List_of_largest_cities
(2) Coleago GIS analysis based on data from, https://sedac.ciesin.columbia.edu/data/set/grump-v1-urban-extents
11 From SEDAC: “Urban extents distinguish urban and rural areas based on a combination of population counts (persons), settlement points, and the presence of night-time lights. Areas are defined as urban where contiguous lighted cells from the night-time lights or approximated urban extents based on buffered settlement points for which the total population is greater than 5,000 persons”
12 Center for International Earth Science Information Network - CIESIN - Columbia University, International Food Policy Research Institute - IFPRI, The World Bank, and Centro Internacional de Agricultura Tropical - CIAT. 2011. Global Rural-Urban Mapping Project, Version 1 (GRUMPv1): Urban Extents Grid. Palisades, NY: NASA Socioeconomic Data and Applications Center (SEDAC). https://doi.org/10.7927/H4GH9FVG. Accessed May 2020 YEAR
13 Center for International Earth Science Information Network - CIESIN - Columbia University. 2018. Gridded Population of the World, Version 4 (GPWv4): Population Density, Revision 11. Palisades, NY: NASA Socioeconomic Data and Applications Center (SEDAC). https://doi.org/10.7927/H49C6VHW. Accessed May 2020.

IMT spectrum demand
© copyright Coleago 2020 17
We have summarised the downlink area traffic demand and area traffic capacity supply in a chart. Exhibit 8 below shows the following:
on the horizontal axis the population density of the central area of a city;
on the left hand vertical axis the area traffic demand and capacity supply;
three dotted horizontal lines which show the baseline capacity supply using the existing spectrum identified in Exhibit 2, the capacity supply in case of an additional 1 GHz of spectrum being available and the capacity supply if an additional 2 GHz of spectrum is available;
the coloured upward sloping lines show the area traffic demand depending on population density at five different activity factors. Area traffic demand increases proportionally to population density;
the 11 cities we analysed are located on population density axis as vertical dashed lines; and
we have assumed that 20% of traffic demand will be offloaded to high bands.
Exhibit 8: DL area traffic demand and spectrum needs
Source: Coleago Consulting
Looking at high density areas in the Amsterdam – The Hague region, which has the second lowest population density of the 11 cities, we can examine whether the upward sloping demand lines are below or above the base spectrum supply line. The chart shows that with an activity factor of 10%, demand can be met with the baseline spectrum, but for higher activity factors additional mid-bands spectrum is required. For example, for an activity factor of 25% circa 600 MHz of additional mid-bands spectrum is required.
Paris, which has the highest population density among the sample cities, requires additional spectrum if the activity factor is greater than 5%. For an activity factor of 20%, around 2 GHz of additional mid-bands spectrum is required.
Depending on the city, in areas with a population density greater than 9,000 per km2, additional mid-bands spectrum is required to deliver the IMT 2020 requirements in terms of the 5G user experience in downlink. The higher the population density the greater the need for additional mid-band spectrum.
No additionalmidband
1GHz additionalmidband
2GHz additionalmidband
Par
is (
85km
²)
Lyon
(72
km²)
Mar
seill
e (4
3km
²)
Ber
lin (
85km
²)
Ham
burg
(23
km²)
Mun
ich
(47k
m²)
Rom
e (6
8km
²)
Mila
n (6
1km
²)
Mad
rid (
113k
m²)
Bar
celo
na (
110k
m²)
Am
ster
dam
(72k
m²)
0
100
200
300
400
500
600
5000
6000
7000
8000
9000
1000
0
1100
0
1200
0
1300
0
1400
0
1500
0
1600
0
1700
0
1800
0
1900
0
2000
0
2100
0
2200
0
2300
0
2400
0
2500
0
2600
0
Cap
acity
/ T
raff
ic (
Gbi
t/s/
km2 )
Population Density (pop/km2)
Traffic demand 5% activity factor Traffic demand 10% activity factor Traffic demand 15% activity factor
Traffic demand 20% activity factor Traffic demand 25% activity factor
Depending on the city, in areas with a population density greater than 9,000
per km2, additional mid-bands spectrum is required to deliver the
IMT 2020 requirements.

IMT spectrum demand
© copyright Coleago 2020 18
In areas with a population density below 9,000 per km2, additional mid-bands spectrum would still deliver benefits. The benefit would either be a lower site density or a higher experienced data rate. A lower site density translates into a lower cost per bit which will in turn translate into lower retail prices.
Exhibit 9 shows the additional mid-bands spectrum needs in the 11 cities depending on the percentage of traffic offloaded to high bands and the activity factor. Our analysis leads to the following conclusions that the use of additional mid-bands spectrum would enable the 5G-NR experienced data rate of 100 Mbit/s to be delivered in an economically feasible manner in the cities we examined, anytime, anywhere, citywide.
Exhibit 9: Additional mid-bands spectrum need (MHz) to meet DL requirement
Source: Coleago Note: Figures are rounded down to the nearest 10 MHz.
We modelled area traffic demand and capacity supply in 13 cities. Below we present a detailed analysis of the Paris and the Amsterdam – The Hague region because they are very different.
Paris is the most densely populated city in the European Union and the dense area is a contiguous area within the Boulevard Périphérique which encompasses 85.3 km2 with an average population density of 25,018 people/km2. The high population density area consists of one contiguous area.
In contrast, the high density areas in the Amsterdam – The Hague region does not have a contiguous high density area. However, there are several high density areas, defined as having a population of over 9,000 per km2, which aggregate to an area of 72.3 km2 with an average population density of 9,788 people/km2 encompassing a population of 0.7 million.
Analysis for the other 9 cities is presented in the appendix.
High bands offload High bands offload High bands offload High bands offload
City 30% 20% 10% 30% 20% 10% 30% 20% 10% 30% 20% 10%
Paris 620 810 1000 1180 1460 1740 1740 2120 2490 2310 2770 3240
Lyon 0 50 130 210 330 450 450 610 770 690 890 1080
Marseille 0 0 40 110 210 310 310 440 580 510 680 850
Berlin 120 230 330 440 590 750 750 960 1160 1060 1320 1580
Hamburg 80 170 270 370 510 660 660 850 1040 940 1190 1430
Munich 0 70 150 240 360 480 480 650 810 730 930 1140
Rome 210 330 450 560 740 920 920 1160 1390 1280 1570 1870
Milan 180 300 410 520 690 870 870 1090 1320 1210 1490 1780
Madrid 590 770 950 1130 1400 1680 1680 2040 2400 2220 2670 3130
Barcelona 330 460 600 740 950 1160 1160 1430 1710 1570 1920 2260
Amsterdam 0 10 80 160 270 380 380 520 670 600 780 960
Spectrum need < 10 MHz 10 to 500 MHz 500 - 1000 MHz 1000-2000 MHz > 2000 MHz
Activity factor 10% Activity factor 15% Activity factor 20% Activity factor 25%
In areas with a population density below 9,000 per km2, additional mid-
bands spectrum would reduce site density.

IMT spectrum demand
© copyright Coleago 2020 19
4.3.2 Paris, France
In Paris, we have identified the high density area contained by the Boulevard Périphérique – as illustrated in Exhibit 10. The urban extent of Paris is also shown for reference using data sourced from SEDAC. This central region represents an area of 85.3 km2 with an average population density of 25,018 people/km2 with a population of 2.1 million within the Boulevard Périphérique.
Exhibit 10: Paris: Population density and central region
Source: Coleago Consulting
In our modelling, around 616 macro sites and 1,848 upper mid-bands outdoor small cells are used to provide speed coverage to the area inside the Boulevard Périphérique. Exhibit 11 shows the following:
On the horizontal axis the population density;
On the left hand vertical axis the traffic demand and capacity supply in Gbit/s/km2;
On the right hand vertical axis the total amount of spectrum required to produce the area traffic capacity;
The coloured upward sloping lines show the area traffic capacity demand using activity factors of 5%, 10%, 15%, 20%, and 25%.
We located Paris on the population density axis as a vertical line. The level at which the vertical line intersects with the coloured traffic demand lines shows the area traffic demand and the amount of spectrum required to serve that demand. The assumption for traffic density demand and supply are those stated above. Exhibit 11 shows that in Paris additional spectrum is required if the activity exceeds 5%. When the activity factor reaches 20%, around 2GHz of additional upper mid-bands spectrum is required.
The chart also illustrates that demand assuming a 5% activity factor could just about be met with exiting spectrum. However, the 5% activity factor could not be served by today’s network. To achieve this low threshold substantial investment is required in mid-band small cells, high bands small cells, and upgrading all existing sites with 5G capable active antenna systems, both in lower and upper mid-bands. This means the additional mid-bands spectrum is not a substitute to network investment but is required in addition to network investment.

IMT spectrum demand
© copyright Coleago 2020 20
Exhibit 11: Paris: DL traffic demand and capacity supply
Source: Coleago Consulting
4.3.3 Amsterdam – The Hague region, Netherlands
The urban extent surrounding Amsterdam – The Hague, as defined by data sourced from SEDAC, is illustrated in Exhibit 12 below. A contour of 7,500 people/km2 has been used to identify the high density areas of the Amsterdam – The Hague region based on European Environmental Agency population density data. This shows several distinct high population density areas. In the Amsterdam – The Hague region, these high density areas aggregate to an area of 72.3 km2 with an average population density of 9,788 people/km2, containing a population of circa 0.7 million.
Exhibit 12: Amsterdam: Population density and central regions
Source: Coleago Consulting
No additionalmidband
1GHz additionalmidband
2GHz additionalmidband
Par
is (
85km
²)
0
100
200
300
400
500
600
5000
6000
7000
8000
9000
1000
0
1100
0
1200
0
1300
0
1400
0
1500
0
1600
0
1700
0
1800
0
1900
0
2000
0
2100
0
2200
0
2300
0
2400
0
2500
0
2600
0
Cap
acity
/ T
raff
ic (
Gbi
t/s/
km2 )
Population Density (pop/km2)
Traffic demand 5% activity factor Traffic demand 10% activity factor Traffic demand 15% activity factor
Traffic demand 20% activity factor Traffic demand 25% activity factor Paris (85km²)

IMT spectrum demand
© copyright Coleago 2020 21
In the modelling that we have undertaken, the identified high density areas of Amsterdam – The Hague require around 521 macro sites and 1,563 upper mid-bands small cells for speed coverage. Exhibit 13 shows the 9,788 people/km2 average population density across the identified high density areas. The baseline spectrum is sufficient to meet 5G requirements for a traffic demand activity factor of up to 10%, assuming the investment in small cells is made and 100% of the spectrum is used for 5G. Beyond this, however, additional spectrum is needed
Exhibit 13: Amsterdam: DL traffic demand and capacity supply
Source: Coleago Consulting
4.4 The 50 Mbit/s uplink requirement and combined spectrum needs
We also examined the impact of fulfilling the 50 Mbit/s uplink requirement defined by the ITU-R using the same methodology as for the downlink. The growing uplink requirements, notably from applications other than smartphones, drives additional spectrum requirements as shown in the table below. The data has been generated assuming that 20% of the traffic is offloaded to high bands.
For each city, we took account of the spectrum needs identified for the downlink. The reason for this is that if, for example, an additional 1000 MHz of upper mid-bands spectrum is required by the DL, our assumption is that these same frequency resources will be shared in the time domain with the UL, on a 3:1 (DL:UL) basis, depending on the adopted TDD configuration. The figures shown in Exhibit 14 are the uplink driven spectrum requirements in addition to the spectrum needs shown in Exhibit 9. This is because the additional upper mid-bands spectrum identified in Exhibit 8 and Exhibit 9 is TDD spectrum which is used for the downlink as well as the uplink. The data shows that in the longer term the uplink may become the driver for additional spectrum needs.
There is some uncertainty over how the DL:UL ratio may change over time. For example, some applications such as cameras will be UL only. In the longer term the total DL and UL area traffic demand must be served using additional upper mid-band spectrum and adjusting the DL:UL split in synchronised TDD bands proportionate to relative demand. In Exhibit 15 below we also show the combined DL and UL spectrum requirement.
No additionalmidband
1GHz additionalmidband
2GHz additionalmidband
Am
ster
dam
(72k
m²)
0
100
200
300
400
500
600
5000
6000
7000
8000
9000
1000
0
1100
0
1200
0
1300
0
1400
0
1500
0
1600
0
1700
0
1800
0
1900
0
2000
0
2100
0
2200
0
2300
0
2400
0
2500
0
2600
0
Cap
acity
/ T
raff
ic (
Gbi
t/s/
km2 )
Population Density (pop/km2)
Traffic demand 5% activity factor Traffic demand 10% activity factor Traffic demand 15% activity factor
Traffic demand 20% activity factor Traffic demand 25% activity factor Amsterdam (72km²)

IMT spectrum demand
© copyright Coleago 2020 22
Exhibit 14: Additional mid-bands spectrum needs (MHz) to meet UL requirement
Source: Coleago
Exhibit 15: Additional mid-bands spectrum needs (MHz) to meet DL and UL requirement
Source: Coleago
4.5 Key findings
We have detailed our analysis examining how 5G requirements for citywide speed coverage and high traffic densities can be met using different spectrum scenarios. Several consistent conclusions all arise from this analysis:
The availability of additional upper mid-bands spectrum would enable mobile operators to deliver the required citywide “speed coverage” with a 100 Mbit/s DL user experienced data rate in the 2025 – 2030 timeframe, considering both human and non-human usage.
The 50 Mbit/s UL user experienced data rate may drive additional spectrum demand, depending on the adopted TDD configuration and on the specific use cases.
High bands offload High bands offload High bands offload High bands offloadCity 30% 20% 10% 30% 20% 10% 30% 20% 10% 30% 20% 10%
Paris 240 290 350 400 490 570 570 680 790 730 870 1000
Lyon 50 70 100 120 160 190 190 240 280 260 320 380
Marseille 10 40 70 90 120 150 150 190 230 210 260 310
Berlin 90 130 160 190 230 280 280 340 400 370 440 520
Hamburg 80 110 140 170 210 250 250 310 360 330 400 480
Munich 50 80 100 130 160 200 200 250 300 270 330 390
Rome 120 150 190 220 280 330 330 400 470 430 520 600
Milan 110 150 180 210 260 310 310 380 440 410 490 580
Madrid 230 280 340 390 470 550 550 650 760 710 840 970
Barcelona 150 190 230 280 340 400 400 480 560 520 620 720
Amsterdam 30 60 80 100 140 170 170 210 250 230 290 340
Spectrum need 10 to 500 MHz 500 - 1000 MHz 1000-2000 MHz< 10 MHz > 2000 MHz
Activity factor 10% Activity factor 25%Activity factor 15% Activity factor 20%
High bands offload High bands offload High bands offload High bands offloadCity 30% 20% 10% 30% 20% 10% 30% 20% 10% 30% 20% 10%
Paris 870 1110 1350 1590 1960 2320 2320 2800 3290 3040 3650 4250
Lyon 50 130 240 340 490 640 640 850 1050 950 1210 1460
Marseille 10 40 110 200 330 460 460 640 810 730 940 1160
Berlin 220 360 490 630 830 1030 1030 1300 1570 1430 1770 2110
Hamburg 160 290 410 540 720 910 910 1160 1410 1280 1600 1910
Munich 50 160 260 370 530 690 690 900 1110 1000 1270 1530
Rome 330 490 640 790 1020 1250 1250 1560 1870 1710 2100 2480
Milan 300 450 590 740 960 1180 1180 1480 1770 1620 1990 2360
Madrid 820 1060 1290 1530 1880 2230 2230 2700 3170 2930 3520 4100
Barcelona 490 660 840 1020 1290 1560 1560 1910 2270 2090 2540 2980
Amsterdam 30 80 170 270 410 550 550 740 930 840 1070 1310
Spectrum need > 2000 MHz< 10 MHz
Activity factor 10% Activity factor 15% Activity factor 20% Activity factor 25%
10 to 500 MHz 500 - 1000 MHz 1000-2000 MHz
The availability of additional upper mid-bands spectrum would enable
mobile operators to deliver the required citywide “speed coverage”
with a 100 Mbit/s DL user experienced data rate in the 2025 –
2030 timeframe, considering both human and non-human usage

IMT spectrum demand
© copyright Coleago 2020 23
5 Mid-band spectrum for 5G “fibre-like speed” FWA
5.1 Introduction
Fixed Wireless Access (FWA) is one of the 5G use cases and is an important solution to deliver fixed broadband connectivity objectives. Delivering the connectivity objectives in rural areas requires subsidies. In the following we show that making available additional upper mind-bands spectrum would make FWA a long-term solution for Very High Capacity Networks (VHCN) in rural areas at a much lower cost compared to Fibre to the Home (FTTH). Much of rural Europe still needs to be connected to broadband and FWA could reduce broadband connectivity subsides in Europe by up to € 42 billion.
In the following we provide an analysis of the benefit of additional mid-band spectrum to reach the European broadband connectivity target:
5G FWA is already a reality with FWA broadband connections growing at a faster rate than any other broadband technology.
We anchor our analysis in the context of the European Commission’s strategy on Connectivity for a European Gigabit Society to have 100 Mbit/s connectivity available to 100% of households. We also take account of the latest BEREC VHCN criterion for wireless broadband networks.
We quantify the rural connectivity gap in Europe which requires subsidies to close the gap.
We show how additional upper mid-bands spectrum improves the economics of FWA and ensures that FWA is long-term solution capable of delivering future higher data rates.
Comparing the cost of FTTH and “fibre like speed” 5G FWA shows that in rural areas FWA can reduce costs compared to FTTH. The investment required to deliver the European broadband connectivity target in rural areas with FTTH would amount to around €53 bn. An additional 2 GHz of spectrum can reduce this cost by 79% thus delivering an investment saving of €42 bn. Since we are focusing on rural areas, i.e. where public subsidies are required, essentially this means a saving of €42 bn in public subsidies.
5.2 Wireless is the fastest growing fixed broadband access technology
Fixed Wireless Access (FWA) is one of the 5G use cases. As a result of the performance improvement of LTE-A and now 5G-NR, FWA is experiencing rapid growth world-wide. GSA identified 401 operators in 164 countries selling FWA services based on LTE. In addition, of the 75 operators that have announced 5G launches worldwide, GSA counted 38 operators that have announced the launch of either home or business 5G broadband using routers. Of these 38, GSA identified 31 operators selling 5G-based FWA services.14
The figures from the GSA are corroborated by research from Point Topic. “Wireless (mostly FWA) and FTTH connections were the fastest growing categories, having increased by 22.7 per cent and 14.1 per cent respectively between Q4 2018 and Q4 2019.”15, see Exhibit 16.
14 Fixed Wireless Access, General Report, Global mobile Suppliers Association, 19 May 2020 15 Point Topic, World Fixed Broadband Statistics – Q4 2019
FWA is the fastest growing form of fixed broadband connectivity

IMT spectrum demand
© copyright Coleago 2020 24
While some countries, such as South Korea and UAE, have near universal fibre access, most countries do not. In many countries, notably in Africa, emerging Asia, Eastern Europe and Latin America copper or fibre network access is almost an irrelevance. 5G FWA is also relevant in developed markets’ rural areas where there is no fibre and the cost of building fibre in terms of cost per home passed is relatively high.
With 5G FWA, fixed wireless growth is likely to accelerate further to become the dominant form of fixed broadband connectivity in developing countries (see Exhibit 17): “we estimate there will be more than 60 million FWA connections by the end of 2020. This number is forecast to grow more than threefold through 2026, reaching over 180 million. Out of these, 5G FWA connections are expected to grow to more than 70 million by 2026, representing around 40 percent of total FWA connections.”16
Compared with 5G eMBB, 5G FWA devices, also known as Customer Premises Equipment (CPE) can exploit higher gain antennas, noting that outdoors CPE can benefit from higher antenna gains than indoors. Higher antenna gains result in a better spectral efficiency compared to eMBB and translate into a wider cell range and throughput thus improving the economics of bringing broadband connectivity to homes and business premises.
Exhibit 16: Growth of fixed broadband subscribers by technology in 2019
Source: World Fixed Broadband Statistics Q4 2019, Point Topic
Exhibit 17: FWA connections
Source: Ericsson Mobility Report, November 2020
16 Ericsson Mobility Report, November 2020
4%
-10%
14%
6%
9%
23%
-15%
-10%
-5%
0%
5%
10%
15%
20%
25%
Cable Copper FTTH FTTx Satelitte Wireless
Ann
ual G
row
th
With 5G FWA fixed wireless growth is likely to accelerate further to become
the dominant form of fixed broadband connectivity in developing countries

IMT spectrum demand
© copyright Coleago 2020 25
5.3 5G FWA to close the urban-rural digital divide in Europe
5.3.1 The European broadband 2025 target
European policy makers have set broadband connectivity targets for Europe, and both wired, notably fibre, and wireless technologies play a role in delivering the target.
Exhibit 18: European broadband policy
The Commission’s strategy on Connectivity for a European Gigabit Society, adopted in September 2016, sets a vision of Europe where availability and take-up of very high capacity networks enables the widespread use of products, services, and applications in the Digital Single Market.
This vision relies on three main strategic objectives for 2025:
Gigabit connectivity for all of the main socio-economic drivers,
uninterrupted 5G coverage for all urban areas and major terrestrial transport paths, and
access to connectivity offering at least 100 Mbit/s for all European households.
It confirms and builds upon the previous broadband objectives for 2020, to supply every European with access to at least 30 Mbit/s connectivity, and to provide half of European households with connectivity rates of 100 Mbit/s.
Source: https://ec.europa.eu/digital-single-market/en/broadband-europe
The European Commission’s strategy on Connectivity for a European Gigabit Society sets a target of 100 Mbit/s connectivity available to 100% of households (see Exhibit 18). Fibre is playing a major role in reaching this target and FWA is recognised as one of the solutions. The European Electronic Communications Code (EECC) lists FWA as a technology to deliver Very High Capacity Networks (VHCN), thus making FWA eligible for public subsidies.
The Body of European Regulators of Electronic Communications (BEREC) Guidelines on Very High Capacity Networks (1 October 2020) sets out criteria for wired and wireless networks with a downlink data rate of 150 Mbit/s and uplink data rate of 50 Mbit/s under peak time conditions (see Exhibit 19). This will be revised upwards in 2023, taking into account for a better understanding of 5G networks capabilities, as indicated in paragraph 24 of the Guidelines.
Exhibit 19: BEREC Very High Capacity Networks Criterion 4
Any network providing a wireless connection which is capable of delivering, under usual peak-time conditions, services to end-users with the following quality of service (performance thresholds 2).
a. Downlink data rate ≥ 150 Mbps
b. Uplink data rate ≥ 50 Mbps
c. IP packet error ratio (Y.1540) ≤ 0.01%
d. IP packet loss ratio (Y.1540) ≤ 0.005%
e. Round-trip IP packet delay (RFC 2681) ≤ 25 ms
f. IP packet delay variation (RFC 3393) ≤ 6 ms
g. IP service availability (Y.1540) ≥ 99.81% per year
Source: BEREC Guidelines on Very High Capacity Networks, 1 October 2020

IMT spectrum demand
© copyright Coleago 2020 26
5.3.2 Subsidies to deliver the broadband target in rural areas
As of 2019, the FTTH Council indicated that the number of homes in the EU 28 passed by fibre were 88.1 million, equivalent to a coverage rate of 39.4%17. To reach the objective of bringing 100 Mbit/s connectivity to 100% of homes by 2025, a further 135 million homes will need to be reached by fibre within the six years 2020 to end 2025. The investment required to achieve this is estimated at around €123 bn18, assuming that 100% of homes are covered and 50% actually connected. In mid-2019, rural FTTH coverage was only 18%.
The EU’s Digital Economy and Society Index (DESI) identifies fixed VHCN coverage (% of households) in mid-2019. This definition of VHCN includes technologies other than fibre with a minimum speed of 100 Mbit/s and hence the number and percentage of homes covered is slightly higher than the figures presented by the FTTH Council. By mid-2019, 44% of households were covered (EU28), equivalent to 98.8 million households. This leaves 56% or 124.9 million households uncovered. The DESI figures also show the lack of rural broadband coverage with only 20% of rural households covered. According to Eurostat, in 2018, 39.3% of the EU’s population lived in the cities, 31.6% lived in towns and suburbs, and 29.1% lived in rural areas and we can assume a similar percentage for households.
Exhibit 20: Broadband coverage of homes in the EU 28
Indicator FTTH coverage
VHCN coverage
Households million 224.5 224.5
Rural households million 65.3 65.3
Households covered million 88.1 98.8
% of households covered 39.4% 44.0%
Rural households covered million 11.8 13.1
% of rural households covered 18.0% 20.0%
Total households not covered million 136.4 125.7
Total of % of households not covered 60.6% 56.0%
Rural households not covered million 53.6 52.3
% of rural households not covered 82.0% 80.0%
Source: FTTH Council Europe, DESI, Eurostat
The lack of rural broadband access is due to the poor economics of connecting homes and business premises in areas with a low population density because the cost per home covered with fibre and connected is three to four times higher compared to the cost of bringing fibre connectivity to sub-urban and urban areas. Eurostat, the EU statistics agency, uses a definition for rural areas based on clusters of urban grid cells with a minimum population density of 300 inhabitants per km² and a minimum population of 5,000. All the cells outside these urban clusters are considered as rural. Assuming 2.4 people per household, rural areas are those with less than 125 households per km2.
Rural broadband connectivity subsidy schemes leave it up to the provider to build rural broadband access with either fibre or FWA, as evidenced by the following examples:
In the European Union, FWA is part of the solution to achieve the EU’s target of offering Internet connectivity of at least 100 Mbit/s to all European households by 2025. The time frame to reach the 2025 goal is short. From a logistical and funding
17 FTTH Council Panorama, 23 April 2020 18 The Cost of Meeting Europe’s Future Network Needs, FTTH Council Europe, March 2017 cite a
cost of €137 bn. Taking account of progress made to mid-2020, we estimate the remaining investment cost at €120 bn

IMT spectrum demand
© copyright Coleago 2020 27
perspective it is not possible to reach the goal without FWA19. While currently available upper mid-bands spectrum can be sufficient to address today’s FWA requirements, more mid-bands spectrum is required to ensure that FWA is a long term solution, i.e. in delivering speeds in excess of 100 Mbit/s.
The directives of the European Parliament and Council 2014/61/EU, May 2014, refer to fixed (wired) and wireless to lower the costs for deploying broadband. Several national broadband development plans explicitly acknowledge the role of FWA, for example Sweden: “Given the geographical aspects of Sweden, and the repartition of its population, a completely connected Sweden requires a combination of different technologies – fixed and wireless.”20
5.3.3 Improving the FWA economics with additional mid-bands spectrum
The FWA business case is highly dependent on the number of connections that can be supported per cell tower. In turn, this is a function of the data rate that must be delivered and, crucially, the amount of spectrum used at a cell tower.
The assumptions used for “fibre-like speed” 5G FWA are slightly different from those used for 5G eMBB.
Outdoor customer premises equipment (CPE) may be used which results in an uplift to spectral efficiency. However, in a rural environment with a low building height 16-element MIMO would be deployed for FWA compared to 64-element MIMO for eMBB in a dense urban environment, and furthermore the cell radius for rural FWA would be larger compared to a dense urban environment. Hence, we assume a lower spectral efficiency of 5 bit/s/Hz.
We assume a higher activity factor of 50% compared to 10-25% for mobile because fixed broadband monthly data usage is assumed to remain higher than mobile broadband usage:
– In Q3 2019, average monthly broadband usage per household was 264.4 Gbytes / month21. For subscribers with a 100 Mbit/s+ connection usage was 333 Gbytes/month in Europe and 398 Gbytes in the US.
– A further reference point is the service definition in the Connect America Fund Phase II Auction (Auction 903) rural broadband funding programme. The 100 Mbit/s broadband service must include a 2 Terabyte monthly usage allowance.
– Fixed broadband is used over longer continuous periods thus pushing up concurrent use.
The radio propagation in the range of 3.5 to 7GHz is not a limiting factor when assessing number of households which could be covered with a 100 Mbit/s service. Even with a cell radius of only 2 km, the area covered by a site would be 12.6 km2. Even if we assume a household density of only 50 per km2, the area covered by a single site would include 628 households which is consistent with the number of households that would be served by a single site as shown in Exhibit 22 below. However, the calculation demonstrates that FWA is effective even to cover isolated households such as farms.
19 According to the EC Digital Economy and Society Index Report (2019), ca. 30% of European
households were reached by Fibre to the Premises (FTTP) coverage in 2018 (ca. 15% in rural areas)
20 A Completely Connected Sweden by 2025, a Broadband Strategy, page 11. 21 Broadband Industry Report (OVBI) 3Q 2019, OpenVault
The directives of the European Parliament and Council 2014/61/EU, 15.05.2014, refer to fixed wired and
wireless to lower the costs for deploying broadband

IMT spectrum demand
© copyright Coleago 2020 28
Exhibit 21: FWA covered homes per site model
Source: Coleago Consulting
To examine the impact of additional mid-bands spectrum on the economics of rural FWA, we compared three scenarios examining 5G FWA delivering a household experienced DL data rate of 100 Mbit/s:
In scenario 1, only the baseline spectrum of 1,050 MHz (see Exhibit 2) is available but 650 MHz is required to cater for mobile bandwidth demand in rural areas so that only 400 MHz can serve FWA bandwidth needs.
In scenario 2, in addition to the baseline spectrum an additional 1,000 MHz of upper mid-bands spectrum is available.
In scenario 3, in addition to the baseline spectrum an additional 2,000 MHz of upper mid-bands spectrum is available.
The number of supported households per 5G FWA cell tower for each scenario is shown in Exhibit 22. These are based on a spectral efficiency of 5 bit/s/Hz, three sectors per cell tower, and a DL:UL TDD ratio of 3:1.
Scenario 1 can support 90 households per site in rural areas, scenario 2 can support 315 households, and scenario 3 can support 540 households. The more households can be served per site, the lower the cost per home served with a 100 Mbit/s speed. This therefore demonstrates that using more mid-bands spectrum for rural FWA would significantly improve the business case for operators and will reduce or may even eliminate the need for subsidies.
5.3.4 Relevance of FWA for speeds above 100 Mbit/s
The definition of broadband keeps changing. The European Commission target is 100 Mbit/s. BEREC Guidelines on Very High Capacity Networks aim at a requirement of 150 Mbit/s in the downlink and 50 Mbit/s in the uplink. 100 or 150 Mbit/s may be considered sufficient now, but we are moving to what is now defined as ultra-fast broadband. BEREC’s VHCN Criterion 4 will be reviewed in 2023. Ofcom, the telecoms regulator of the United Kingdom, defines ultrafast broadband as broadband with download speeds of greater than 300 Mbit/s22.
We examined the sustainability of FWA in upper mid-bands against a background of an increase in speed requirements for broadband. Using the same assumptions as above, we modelled the number of households that can be served assuming a 150 Mbit/s, 300 Mbit/s, and 1 Gbit/s downlink speed requirement.
With an additional 2,000 MHz of upper mid-bands spectrum, one site can provide a data rate of 100 Mbit/s for 540 households. If the speed requirement is increased to 300 Mbit/s this drops to 180 households and a 1 Gbit/s service could be provided to 54 households from a single site.
22 UK Home Broadband Performance, Technical Report, paragraph 5.10, page 20, Ofcom, 13
May 2020
Supported number of connections per cell
tower
Required data rate per FWA connection
Amount of spectrum deployed on cell tower
Concurrent use (activity factor)
100 Mbit/s150 Mbit/s300 Mbit/s
1 Gbit/s
Base line+ 1,000 MHz+ 2,000 MHz
50%
Adding several 100 MHz of upper mid-bands spectrum to the baseline
spectrum improves the economics of FWA and means that FWA can be a
long-term solution for rural broadband connectivity.

IMT spectrum demand
© copyright Coleago 2020 29
This demonstrates that using additional mid-bands spectrum for 5G FWA ensures that FWA is a long-term solution for rural broadband connectivity if 2,000 MHz of additional mid-bands spectrum become available. It is also important to note that the higher the capacity required, the more important it becomes to ensure that mmWave spectrum is available in addition to upper mid-bands spectrum.
Exhibit 22: FWA households supported depending on speed and spectrum
Households supported per 5G FWA cell tower
100 Mbit/s
150 Mbit/s
300 Mbit/s
1Gbit/s
Baseline (400 MHz) 90 60 30 9
Baseline + 1GHz additional 315 210 105 32
Baseline + 2GHz additional 540 360 180 54
Source: Coleago Consulting
Note: The baseline is only 400 MHz of upper mid-bands spectrum because we assume that low-bands and lower mid-bands are required for mobile capacity, i.e. not available for FWA.
5.3.5 Comparing the cost of FTHH and “fibre like speed” 5G FWA
The cost of bringing fibre to households varies considerably with household density. As stated above, areas with a population density below 300 per km2 equivalent to a household density of 125 per km2, are considered rural. The FTTH Council Europe cost study provides insight into the cost of bringing fibre to rural households:
In areas with a household density of 100 to 200 per km2, the cost per household passed is €1,000 to €1,500 based on modelling by the FTTH Council Europe (see Exhibit 23). The additional cost to activate the connection per household amounts to circa €800 (see Exhibit 24). On this basis the average cost of connecting a rural household with FTTH amounts to circa €2,000 (see Exhibit 26).
To examine the cost of connecting isolated homes, the FTTH Council Europe study breaks down the cost into areas where 95% of households are located and where the remaining 5% are. For the 5% of households in the least dense areas, the cost per connected household is estimated at €7,000.
Exhibit 23: Fibre cost per home passed
Source: The Cost of Meeting Europe’s Future Network Needs, FTTH Council Europe, 3/2017

IMT spectrum demand
© copyright Coleago 2020 30
Exhibit 24: Fibre activation cost per home
Source: The Cost of Meeting Europe’s Future Network Needs, FTTH Council Europe, 3/2017
We calculated the cost per household to bring 100 Mbit/s DL connectivity using 5G FWA using the following assumptions:
Where mobile coverage already exists, incremental investment is required for the 5G radio but not the mast. We estimate the cost of adding mid-band radios to existing sites in rural areas at around €25,000. The number of radios required will depend on the instantaneous bandwidth (IBW) accommodated by the radio (typ. 300-400 MHz) as well as the possibility to access contiguous spectrum. For example, in the event that 2,000 MHz of additional spectrum is made available (2400 MHz in total), and assuming an IBW of 300 MHz, then up to eight radios may be required on the cell tower.
Civil works may amount to €20,000 per site.
Depending on whether the site is already connected by fibre or whether fibre is required, this may add a further €10,000 to the cost. The figure of €7,000 is quoted in the FTTH Council Europe study as the cost per FTTH home connected in a remote location.
The cost per home connected using a self-installed CPE is in the order to of €250.
The number of households that can be supported at different speeds is a function of the amount of spectrum deployed on an FWA site.
Exhibit 25: Rural FWA cost assumptions
Baseline + 1 GHz +2 GHz
MHz of spectrum for FWA 400 1,400 2,400
Number of radios per site 2 5 8
MHz per radio 200 280 300
Radio cost per site - € 50,000 125,000 200,000
Fibre cost per site - € 10,000 10,000 10,000
Civil works cost - € 20,000 20,000 20,000
Total cost per site - € 80,000 155,000 230,000
Source: Coleago Consulting

IMT spectrum demand
© copyright Coleago 2020 31
Exhibit 27 below summarises the result of the FWA cost modelling. Using only the baseline spectrum, the investment cost per household to reach the 100 Mbit/s target is €889. However, if an additional 2 GHz of upper mid-bands spectrum is used, the cost per household decreases to €426, which is 79% lower compared to the €2,000 cost using FTTH as shown in Exhibit 28.
If, in the longer term, a speed of 1 Gbit/s is required, the cost per household passed using FWA in an additional 2 GHz of mid-band spectrum is higher than using fibre, and high bands become crucial.
Exhibit 26: Cost per rural household connected using FTTH
FTTH Connectivity
Cost per home passed
Cost per home connected
Total FTTH cost per home
Investment per home
€ 1,000 to 1,500 € 800 Circa € 2,000
Source: Coleago estimates based on The Cost of Meeting Europe’s Future Network Needs, FTTH Council Europe, 3/2017
Exhibit 27: Cost per rural household covered using FWA
Base Line
Plus 1 GHz
Plus 2 GHz
Households supported @ 100 Mbit/s 90 315 540
Households supported @ 150 Mbit/s 60 210 360
Households supported @ 300 Mbit/s 30 105 180
Households supported @ 1 Gbit/s 9 32 54
Cost per household covered @ 100 Mbit/s - € 889 492 426
Cost per household covered @ 150 Mbit/s - € 1,333 738 639
Cost per household covered @ 300 Mbit/s - € 2,667 1,476 1,278
Cost per household covered @ 1 Gbit/s - € 8,889 4,921 4,259
Source: Coleago Consulting
Exhibit 28: FWA deployment cost saving vs. FTTH in rural areas
Relative cost difference FWA vs FTTH Base Line
Plus 1 GHz
Plus 2 GHz
Cost per household covered @ 100 Mbit/s 56% 75% 79%
Cost per household covered @ 150 Mbit/s 33% 63% 68%
Cost per household covered @ 300 Mbit/s -33% 26% 36%
Cost per household covered @ 1 Gbit/s -344% -146% -113%
Source: Coleago Consulting
Based on the above data, we can calculate the reduction in the investment required to reach the European Commission’s target of covering 100% of households with a broadband speed of at least 100 Mbit/s. As indicated earlier, the total investment required to cover 100% of households in the EU with FTTH is estimated at €123 billion. An estimated €53 billion of this investment needs to be made in rural areas.
Exhibit 28 shows the investment cost savings if FWA instead of FTTH is used to bring 100 Mbit/s connectivity to rural households.
For an additional 2GHz of spectrum, an investment saving of 79% on €53 billion amounts to €42 billion. 5G IMT has a capital expenditure avoidance value of €42 billion, for FWA alone, i.e. not counting the capex avoidance value for mobile 5G.

IMT spectrum demand
© copyright Coleago 2020 32
If only 1 GHz of additional mid-bands spectrum is made available, the investment cost saving is 75% amounting to €40 billion.
Although providing rural coverage using FWA is much cheaper compared to FTTH, in most rural locations there will no business case to provide 100 Mbit/s or higher speeds. This means the €42 billion saving is a reduction in the subsidies and not an indication that 100 Mbit/s FWA might be turned into a spectrum licence obligation.
In assessing the cost savings of FWA in upper mid-bands vs. FTTH we have not added in any spectrum licence fees. The reason for this is our objective to calculate the difference in the network investments comparing FWA with the FTTH solution. This would translate into real savings in public subsidies regardless of whether there is any cost of spectrum.
5.4 Simultaneous FWA and mobile use of mid-bands spectrum
Best practice in spectrum licencing calls for service and technology neutral spectrum licences. Mobile operators would deploy additional upper mid-bands spectrum in their network to serve mobile and FWA where needed:
In cities, the additional mid-bands spectrum is essential to produce the 100 Mbit/s user experienced data rate across the city. In sub-urban areas the capacity provided could be used for eMBB and FWA for premises which do not have a wired broadband connection.
Secondly, even in rural areas there are locations with high mobile traffic density, such as a train station, a rural airport, or some other place where people congregate. In these locations the spectrum would be used to provide the 100 Mbit/s user experienced data rate to mobile users.
Lastly, additional mid-bands spectrum could be used to deliver network slices to serve demand from industrial or similar facilities located in rural areas.
Considering the above, it is clear that, nationwide service neutral licencing of additional mid-bands spectrum would produce the most efficient outcome, i.e. deliver the greatest socio-economic benefit.
As stated above, upper mid-bands spectrum would be deployed selectively in rural areas where there is a high traffic density, for example a village or rural small town. However, given the lesser propagation characteristics of upper mid-bands spectrum compared to low bands (sub-1 GHz) spectrum, it is not economically feasible to build wide geographic coverage with mid-bands spectrum. Wide area coverage in rural areas is provided with low bands. In this context, having additional low bands, for example 600MHz, would be of benefit to rural populations.

IMT spectrum demand
© copyright Coleago 2020 33
6 Mid-bands spectrum to deliver 100 Mbit/s along motorways
The vision of a user experienced data rate of 100 Mbit/s everywhere means that this also has to be assured on road and rail links.
Substantial capacity is required on roads to serve the connected car and smart road use cases. In January 2019, the 5G Automotive Association (5GAA) reported that “At present, more than 100 million vehicles connected to cellular networks (V2N) are on the roads. This V2N connection is used for a wide variety of services including telematics, connected infotainment, real time navigation and traffic optimization, as well as for safety services including automatic crash notification (ACN) such as eCall, the recognition of slow or stationary vehicle(s) and informational alerts for events including traffic jams, road works and other traffic infrastructure related information, inclement weather conditions and other hazardous conditions. Several OEMs share safety related warnings between their vehicles and have started to exchange this information across OEMs”.23
Moving beyond such services into the future of autonomous cars implies a significant step change in the data generated and transmitted per car. 5GAA notes that the 5G NR standards “offer the features which are paramount to highly and fully automated and cooperative driving such as the exchange of:
sensor data sharing for collective perception (e.g., video data);
control information for platoons from very close driving vehicles (only a few meters gap); and
vehicle trajectories to prevent collisions (cooperative decision making).”
As such, autonomous cars are expected to generate several Terabytes of data a day from the hundreds of on-vehicle sensors and large quantities of on-board processing which are essential to the functioning of the car:
according to industry estimates, cameras deployed in such cars alone will generate 20 to 40 Mbit/s of traffic. “Each autonomous car driving on the road will generate about as much data as about 3,000 people. And just a million autonomous cars will generate 3 billion people’s worth of data” (Brian Krzanich, CEO, Intel, 2019); and
Google stated that in their self-driving car trials, a car generates around 1 Tbyte of data in an 8 hour driving period (equivalent to a constant 35 Mbit/s, if transmitted in real-time).
By no means all data generated by autonomous vehicles will be transmitted while mobile, but autonomous vehicles will add to area traffic density and traffic demand on a scale which dwarfs today’s smartphone traffic.
In addition, smart road traffic management will add to area traffic capacity needs. The extensive deployment of smart devices and sensors along 5G-enabled roads will allow cars and physical road infrastructure to interact in real-time – as well as the real-time management of road networks.
A key for all these use cases is reliability and low latency, and thus having access to the required spectrum consistently is a prerequisite.
Many examples of densely occupied roads exist around the world. Here an example of a four lane motorway in each direction is used. At 120 km/h, safe following distances of typically 40 meters to 60 meters are recommended.
23 Timeline for deployment of C-V2X – Update, 5G Automotive Association, 22 January 2019,
Each autonomous car driving on the road will generate about as much
data as about 3,000 people

IMT spectrum demand
© copyright Coleago 2020 34
If macro sites dedicated to road coverage are spaced every 6 km using 3.5 GHz (i.e. a 3 km site radius) then, in peak hours, one dedicated road site could be serving 800 to 1,200 cars – or 400 to 600 cars per sector (assuming two linear sectors pointing up and down the road). To provision 100 Mbit/s ‘speed coverage’ to each car and its passengers (an under-estimate of the 5G requirements which, arguably, could require 100 Mbit/s provision for each passenger as well as for the car) assuming 15% concurrent use would require a site sector downlink throughput of up to 6 to 9 Gbit/s.
If a 5G spectral efficiency of 6 bit/s/Hz is assumed (as used earlier, in our city analysis) then between 1 and 1.5 GHz of spectrum will be needed to deliver this throughput. Whilst a smaller portion of the traffic could be carried in below 3GHz spectrum, it will not have a significant impact on this overall requirement.
With only 400 MHz available at 3.3-3.8 GHz, it is clear that additional mid-bands spectrum – or an alternative solution – is required.
Such an alternative solution could be the use of high bands (in conjunction with 3.5 GHz spectrum). However, with cars being relatively evenly distributed along the road and with high band cell radii typically being comparatively small, colocation at just 3.5 GHz sites would not be practical. Many high band cell sites would need to be deployed across the distance covered by one 3.5 GHz site. Given the length of the European motorway network, this is not likely to be economically feasible as it would require hundreds of high band sites in aggregate.
With only 400 MHz available at 3.4-3.8GHz, it is clear that additional mid-
bands spectrum – or an alternative solution – is required.

IMT spectrum demand
© copyright Coleago 2020 35
7 The role of high bands
7.1 High bands are required to achieve 10 Mbit/s/m2
The sections above examined how the 5G user experienced data rate of 100 Mbit/s could be delivered using additional upper mid-bands spectrum. However, there are locations within cities and also outside cities, where there is very high traffic density. The IMT 2020 requirement to provide an area traffic capacity of 10 Mbit/s/m2 addresses this situation. Exhibit 29 shows the area traffic capacity that can be delivered incrementally by low and mid-bands on a dense site network (100 metre site radius) and high bands on a pico-site network (20 metre cell radius). Upper mid-bands are not sufficient to deliver the 10 Mbit/s/m2 area traffic capacity requirement. Only with the addition of high bands is it possible to deliver the 5G area traffic capacity of 10 Mbit/s/m2.
Exhibit 29: Spectrum and area traffic capacity
Source: Coleago Consulting
7.2 High bands for mobile capacity
Due to the more challenging propagation characteristics of high bands, it is not economically feasible to build consistent speed coverage across a city to satisfy the IMT-2020 user experienced data rate requirements with high band spectrum instead of additional upper mid-band spectrum and thus, in the context of consistent citywide speed coverage, high bands are not a substitute for upper mid-bands.
At the same time, it is not technologically possible to achieve the IMT-2020 area traffic capacity without the high bands. This therefore also means the upper mid-bands are not a substitute for high bands. High bands sites will be deployed indoors and outdoors and will absorb some of the area traffic demand in cities. This has been considered when analysing area traffic capacity requirement in cities in the form of a percentage of traffic that is offloaded to high bands.
High density traffic locations exist in urban, sub-urban and rural areas. Examples include shopping centres, transport hubs, office parks, and industrial sites. Therefore, for mobile operators to provide a consistent user experience they will require high bands spectrum nationwide.
0.61.3
2.0
13.0
0
2
4
6
8
10
12
14
Baseline Plus 1 GHz ofupper mid-bands
Plus 2 GHz ofupper mid-bands
Plus 2 GHz ofupper mid-bandsplus 3GHz of 26
GHz
Are
a tr
affic
cpa
city
Mbi
t/s/
m2
High bands are required to deliver the required 5G area traffic capacity of 10
Mbit/s/m2 in very high traffic density areas
Due to the challenging propagation characteristics of high bands, it is not
economically feasible to build consistent speed coverage across a
city to satisfy the 5G requirement of a 100 Mbit/s user experienced data
rate, anytime, anywhere without mid-band spectrum

IMT spectrum demand
© copyright Coleago 2020 36
7.3 High bands spectrum for rural FWA
Our analysis shows that even with an additional 2 GHz of upper mid-bands spectrum the economics of serving rural households with FWA in upper mid-bands start to resemble those of FTTH if a DL speed of 1 Gbit/s is required. High bands will bring 1 Gbit/s connectivity to those rural premises that require it. The addition of high bands to existing macro sites in rural areas would be highly cost effective compared to an FTTH solution. This illustrates the long-term sustainability of FWA as a rural broadband connectivity solution.
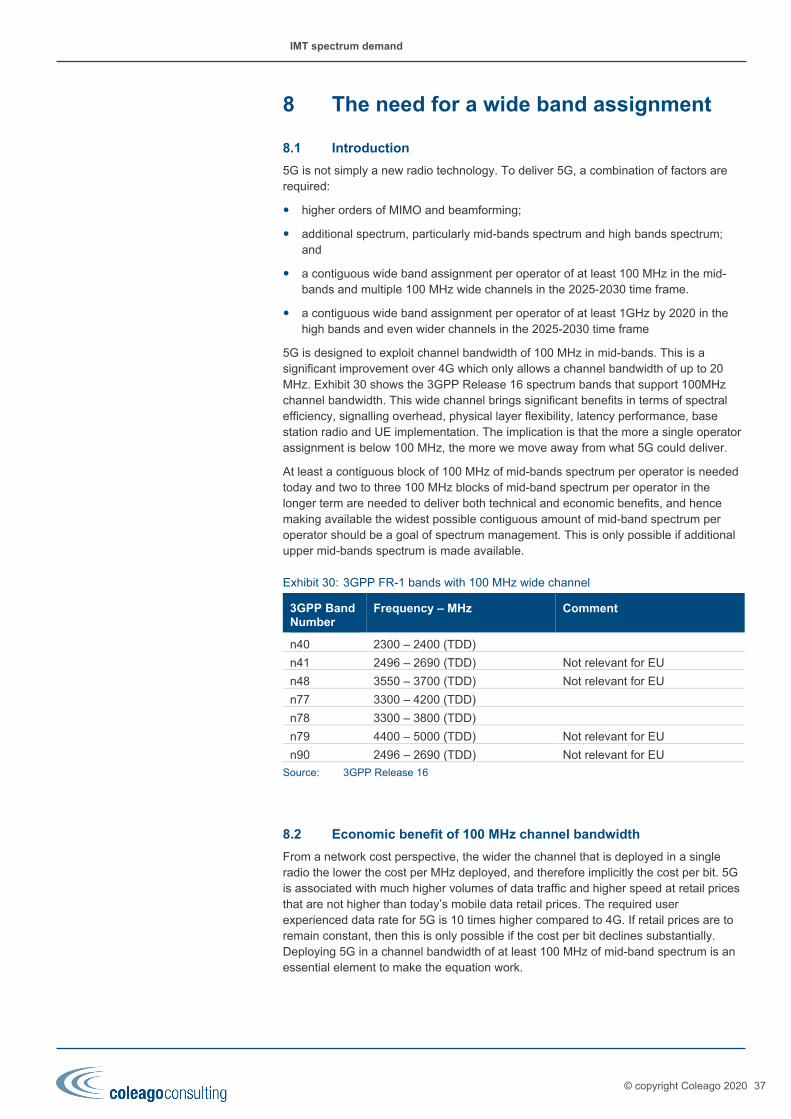
IMT spectrum demand
© copyright Coleago 2020 37
8 The need for a wide band assignment
8.1 Introduction
5G is not simply a new radio technology. To deliver 5G, a combination of factors are required:
higher orders of MIMO and beamforming;
additional spectrum, particularly mid-bands spectrum and high bands spectrum; and
a contiguous wide band assignment per operator of at least 100 MHz in the mid-bands and multiple 100 MHz wide channels in the 2025-2030 time frame.
a contiguous wide band assignment per operator of at least 1GHz by 2020 in the high bands and even wider channels in the 2025-2030 time frame
5G is designed to exploit channel bandwidth of 100 MHz in mid-bands. This is a significant improvement over 4G which only allows a channel bandwidth of up to 20 MHz. Exhibit 30 shows the 3GPP Release 16 spectrum bands that support 100MHz channel bandwidth. This wide channel brings significant benefits in terms of spectral efficiency, signalling overhead, physical layer flexibility, latency performance, base station radio and UE implementation. The implication is that the more a single operator assignment is below 100 MHz, the more we move away from what 5G could deliver.
At least a contiguous block of 100 MHz of mid-bands spectrum per operator is needed today and two to three 100 MHz blocks of mid-band spectrum per operator in the longer term are needed to deliver both technical and economic benefits, and hence making available the widest possible contiguous amount of mid-band spectrum per operator should be a goal of spectrum management. This is only possible if additional upper mid-bands spectrum is made available.
Exhibit 30: 3GPP FR-1 bands with 100 MHz wide channel
3GPP Band Number
Frequency – MHz Comment
n40 2300 – 2400 (TDD)
n41 2496 – 2690 (TDD) Not relevant for EU
n48 3550 – 3700 (TDD) Not relevant for EU
n77 3300 – 4200 (TDD)
n78 3300 – 3800 (TDD)
n79 4400 – 5000 (TDD) Not relevant for EU
n90 2496 – 2690 (TDD) Not relevant for EU
Source: 3GPP Release 16
8.2 Economic benefit of 100 MHz channel bandwidth
From a network cost perspective, the wider the channel that is deployed in a single radio the lower the cost per MHz deployed, and therefore implicitly the cost per bit. 5G is associated with much higher volumes of data traffic and higher speed at retail prices that are not higher than today’s mobile data retail prices. The required user experienced data rate for 5G is 10 times higher compared to 4G. If retail prices are to remain constant, then this is only possible if the cost per bit declines substantially. Deploying 5G in a channel bandwidth of at least 100 MHz of mid-band spectrum is an essential element to make the equation work.

IMT spectrum demand
© copyright Coleago 2020 38
Exhibit 31 below illustrates the cost per bit depending on the amount of spectrum deployed in a single radio. We have made the following assumptions with regards to the total cost of ownership (TCO) of deploying a 3.5 GHz radio on an existing cell site. If 100 MHz is deployed in a single radio, the cost per MHz deployed can be up to 70% lower compared to, for example, a typical deployment in a 20 MHz wide channel. Deploying upper mid-bands spectrum with massive MIMO in a 100 MHz wide channel maximises spectral efficiency which is a key objective for operators and regulators.
Exhibit 31: Cost per bit depending on channel bandwidth
Source: Coleago Consulting
8.3 Per operator contiguous allocations in excess of 100 MHz
Equipment suppliers efforts aim at allowing their 5G radios, including those implementing massive MIMO and beamforming, to operate with the widest possible channel bandwidth (“instantaneous bandwidth”) and to make that “tunable” in the widest possible frequency range (“operating bandwidth”).
5G radios that are now deployed in 3400-3800 MHz band are starting to operate at an “instantaneous bandwidth” of 100 MHz within a 400 MHz “operating bandwidth”.
The ongoing research (e.g. for filters and power amplifiers) will allow larger instantaneous and operating bandwidths by 2025-2030.This means that future radios will aim at larger instantaneous bandwidths (e.g. 200 to 400 MHz) 24 and at operating bandwidths that will be larger than 400MHz. Operators will therefore be able to operate significantly larger instantaneous channel bandwidths (contiguous or non-contiguous) within the same mid-bands.
If 300 MHz is deployed in a single radio, the cost per MHz deployed is 43% lower compared to a deployment in only 100MHz. Therefore the allocation of 200 to 300 MHz of contiguous spectrum per operator would result in significant economic benefits.
24 Note that at the moment 3GPP specifications only support 100MHz channel bandwidth. Multiple
100MHz carriers can be aggregated (5G carrier aggregation of up to four 100MHz carriers is possible today). If such carriers are contiguous, carrier aggregation can be performed within the same single radio, cost effectively.
0
20
40
60
80
100
120
0
10
20
30
40
50
60
70
80
90
100
20MHz
30MHz
40MHz
50MHz
60MHz
70MHz
80MHz
90MHz
100MHz
TC
O index
Cos
t per
bit
Inde
x 20
MH
z =
100
Cost Index Cost per bit

IMT spectrum demand
© copyright Coleago 2020 39
Exhibit 32: Cost per bit with per operator allocation of over 100 MHz
Source: Coleago Consulting
8.4 Spectral efficiency benefit of a 100 MHz wide band allocation
The wider the band in which 5G is deployed, the higher the spectral efficiency. Deploying 5G in a 100 MHz wide channel in upper mid-bands spectrum delivers a 7% higher spectral efficiency compared to deploying it in only 20MHz. Spectrum utilisation is less than 100% for all 5G NR channel bandwidth options because the resource blocks do not fully occupy the channel bandwidth. However, the utilisation decreases with the channel bandwidth as shown in the table below for 30 kHz sub-carrier spacing.
Exhibit 33: 5G NR utilisation of channel bandwidth
Channel BW Number of resource
blocks
Transmission BW (MHz)
Lost BW (MHz)
Utilisation
100 MHz 273 98.280 1.720 98.3%
80 MHz 217 78.120 1.880 97.7%
60 MHz 162 58.320 1.680 97.2%
50 MHz 133 47.880 2.120 95.8%
40 MHz 106 38.160 1.840 95.4%
20 MHz 51 18.360 1.640 91.8%
Source: ECC Report 287, Guidance on defragmentation of the frequency band 3400-3800 MHz, October 2018, page 41
8.5 Wide band allocation vs. carrier aggregation
While specifications allow for channels to be aggregated, there is a performance loss if two channels are aggregated, as summarised in Exhibit 34. The table presents a comparison between a 100 MHz wide channel using a contiguous 100 MHz block of spectrum vs. creating a 100 MHz wide channel by aggregating two non-contiguous 50 MHz blocks. This clearly shows that allocating at a minimum a contiguous 100 MHz per operator constitutes best practice in spectrum management.
0
20
40
60
80
100
120
140
160
180
0
10
20
30
40
50
60
70
80
90
100
100 MHz 200 MHz 300 MHz
Total cost of ow
nership index
Cos
t per
bit
Inde
x 20
MH
z =
100
Cost Index Cost per bit

IMT spectrum demand
© copyright Coleago 2020 40
Exhibit 34: Comparison 100 MHz contiguous vs two 50 MHz blocks
100 MHz 50 + 50 MHz
Complexity Single carrier Needs intra-band CA
Channel utilisation 98.3% 95.8%
Physical layer signalling 6.3% overhead Approx. 12% overhead
Physical layer configuration
A single 100 MHz carrier offers more flexibility than 2x50 MHz carriers to configure sub-bands within the carrier
Carrier activation / deactivation delay
2ms 10ms
BS implementation Requires one radio unit only
May need two radio units
Spectrum management Guard bands may be required if networks are unsynchronised
Two additional guard bands if networks are unsynchronised
UL support No CA required in the UL Uplink CA may not be supported by all UEs
UE consumption 30mA additional power consumption for the second CC (50-90% RF power increase over the non-CA case)
Source: ECC Report 287, Guidance on defragmentation of the frequency band 3400-3800 MHz, October 2018, page 44
8.6 Assessing Ofcom’s SUT model
In the document “Award of the 700 MHz and 3.6-3.8 GHz spectrum bands, Further consultation on modelling and technical matters”, 15 May 2020, Ofcom states: “Our assessment remains that the results of the SUT Model, as revised, support our view that it is likely to be technically feasible for MNOs to support a wide range of 5G services with channel bandwidths in their current holdings smaller than 80 MHz, including 40 MHz, ….”
Ofcom further writes: “Noting the uncertainty over what future 5G services are likely to be important for consumers, and what the technical requirements for those services might be, we had not seen clear evidence suggesting there are likely to be future 5G services which would be of significant commercial importance and which would require 80-100 MHz of contiguous spectrum.”
Our assessment of the technical and economic benefits of a contiguous 100 MHz wide channel allocation do not contradict the SUT model. Ofcom states that “it is likely to be technically feasible for MNOs to support a wide range of 5G services with channel bandwidths in their current holdings smaller than 80 MHz, including 40 MHz.” Ofcom’s statement merely relates to technical feasibility and does not say whether it would be advantageous from a spectral efficiency perspective and from an economic perspective to allocate a wide contiguous channel to MNOs.
SUT, stands for “single user throughput”: “Paragraph 1.15: The data throughput calculated by the SUT Model can be thought of as the maximum data throughput which a single user could experience at a location at which the assumed SINR applies, if all the data-carrying resources of the radio carrier were dedicated to that user, i.e. if there were no other users active on that carrier in the cell. Hence, we refer to the theoretical maximum data throughput calculated by the model as single user throughput (the “SUT”).”
Since the SUT model focuses on a single user, it does not address the impact of simultaneous demand for bandwidth from multiple users in the same cell. Hence Ofcom refers to the theoretical nature of the model.

IMT spectrum demand
© copyright Coleago 2020 41
Ofcom has also come to its conclusion in part because Ofcom “had not seen clear evidence suggesting there are likely to be future 5G services which would be of significant commercial importance and which would require 80-100 MHz of contiguous spectrum.” Of course this does not mean that in the 2025 to 2030 time frame such service requirements will not emerge. In that sense Ofcom is taking a very short term view whereas this report address the 2025 to 2030 time frame.

IMT spectrum demand
© copyright Coleago 2020 42
Appendices
Appendix A: High density areas in sample cities
Exhibit 35: Paris High Density Area
• Urban Extent Area: 5,791 km²
• High Density Area: 85.3 km²
• High Density Area Contour: Périphérique
• High Density Area Average Population Density: 25,018 people per km2
Source: Coleago
Exhibit 36: Lyon High Density Area
• Urban Extent Area: 3,379 km²
• High Density Area: 72.6 km²
• High Density Area Contour: 5k people per km2
• High Density Area Average population density: 10,595 people per km2
Source: Coleago

IMT spectrum demand
© copyright Coleago 2020 43
Exhibit 37: Marseille High Density Area
• Urban Extent Area: 5,456 km²
• High Density Area: 43.2 km²
• High Density Area Contour: 5k people per km2
• High Density Area Average population density: 9,035 people per km2
Source: Coleago
Exhibit 38: Rome High Density Area
• Urban Extent Area: 3,519 km²
• High Density Area: 68.6 km²
• High Density Area Contour: 10k people per km2
• High Density Area Average Population Density: 15,839 people per km2
Source: Coleago

IMT spectrum demand
© copyright Coleago 2020 44
Exhibit 39: Milan High Density Area
Source: Coleago
Exhibit 40: Madrid High Density Area
• Urban Extent Area: 4,690 km²
• High Density Area: 113.1 km²
• High Density Area Contour: 10k people per km2
• High Density Area Average Population Density: 24,246 people per km2
Source: Coleago

IMT spectrum demand
© copyright Coleago 2020 45
Exhibit 41: Barcelona High Density Area
• Urban Extent Area: 6,985 km²
• High Density Area: 110.0 km²
• High Density Area Contour: 15k people per km2
• High Density Area Average Population Density: 18,456 people per km2
Source: Coleago

IMT spectrum demand
© copyright Coleago 2020 46
Exhibit 42: Amsterdam – The Hague High Density Area
• Urban Extent Area: 5,141 km²
• High Density Area: 72 km²
• High Density Area Contour: 7.5k people per km2
• High Density Area Average Population Density: 9,788 people per km2
Source: Coleago
Exhibit 43: Berlin High Density Area
• Urban Extent Area: 2,730 km²
• High Density Area: 85.6 km²
• High Density Area Contour: 12 densest Ortsteile, Statistik Einwohner Berlin
• High Density Area Average Population Density: 13,917 people per km2
Source: Coleago
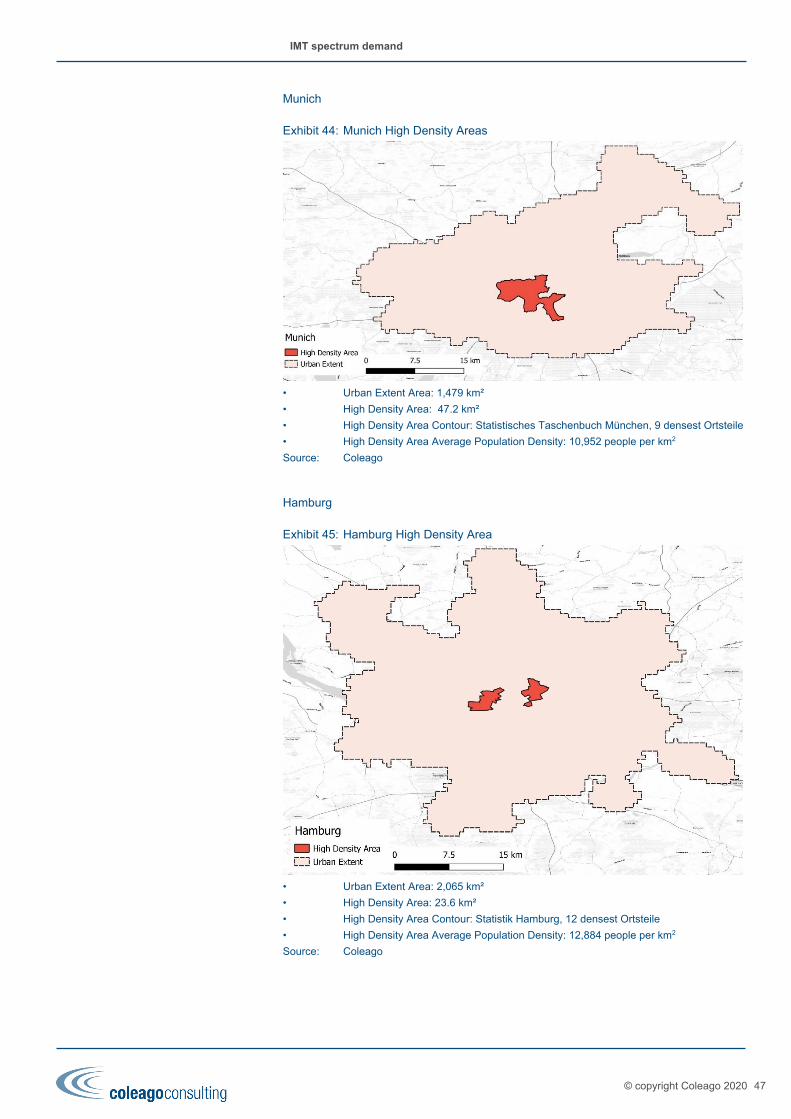
IMT spectrum demand
© copyright Coleago 2020 47
Munich
Exhibit 44: Munich High Density Areas
• Urban Extent Area: 1,479 km²
• High Density Area: 47.2 km²
• High Density Area Contour: Statistisches Taschenbuch München, 9 densest Ortsteile
• High Density Area Average Population Density: 10,952 people per km2
Source: Coleago
Hamburg
Exhibit 45: Hamburg High Density Area
• Urban Extent Area: 2,065 km²
• High Density Area: 23.6 km²
• High Density Area Contour: Statistik Hamburg, 12 densest Ortsteile
• High Density Area Average Population Density: 12,884 people per km2
Source: Coleago

IMT spectrum demand
© copyright Coleago 2020 48
Appendix B: Spectrum needs depending on urban population density
Exhibit 46: Additional mid-bands spectrum needs (MHz) to meet DL requirement
Source: Coleago
Population per High bands offload High bands offload High bands offload High bands offload
per km2 30% 20% 10% 30% 20% 10% 30% 20% 10% 30% 20% 10%
5000 0 0 0 0 0 0 0 20 100 60 150 250
6000 0 0 0 0 0 40 40 130 220 170 280 400
7000 0 0 0 0 50 130 130 230 340 280 410 550
8000 0 0 0 40 130 220 220 340 460 400 550 700
9000 0 0 40 100 210 310 310 440 580 510 680 850
10000 0 20 100 170 280 400 400 550 700 620 810 990
11000 0 70 160 240 360 490 490 650 820 730 940 1140
12000 40 130 220 310 440 580 580 760 940 850 1070 1290
13000 80 180 280 370 520 670 670 860 1050 960 1200 1440
14000 130 230 340 440 600 760 760 960 1170 1070 1330 1590
15000 170 280 400 510 680 850 850 1070 1290 1180 1460 1740
16000 220 340 460 580 760 940 940 1170 1410 1290 1590 1890
17000 260 390 520 640 830 1020 1020 1280 1530 1410 1720 2040
18000 310 440 580 710 910 1110 1110 1380 1650 1520 1860 2190
19000 350 490 640 780 990 1200 1200 1490 1770 1630 1990 2340
20000 400 550 700 850 1070 1290 1290 1590 1890 1740 2120 2490
21000 440 600 760 910 1150 1380 1380 1700 2010 1860 2250 2640
22000 490 650 820 980 1230 1470 1470 1800 2130 1970 2380 2790
23000 530 700 880 1050 1310 1560 1560 1910 2250 2080 2510 2940
24000 580 760 940 1110 1380 1650 1650 2010 2370 2190 2640 3090
25000 620 810 990 1180 1460 1740 1740 2120 2490 2300 2770 3240
26000 670 860 1050 1250 1540 1830 1830 2220 2610 2420 2900 3390
Spectrum need > 2000 MHz< 10 MHz 10 to 500 MHz 500 - 1000 MHz 1000-2000 MHz
Activity factor 10% Activity factor 15% Activity factor 20% Activity factor 25%

IMT spectrum demand
© copyright Coleago 2020 49
Exhibit 47: Additional mid-bands spectrum needs (MHz) to meet DL & UL requirement
Source: Coleago
Appendix C: ITU-R definition of the user experienced data rate
From Report ITU-R M.2410-0 – page 5
4.3 User experienced data rate
User experienced data rate is the 5% point of the cumulative distribution function (CDF) of the user throughput. User throughput (during active time) is defined as the number of correctly received bits, i.e. the number of bits contained in the service data units (SDUs) delivered to Layer 3, over a certain period of time.
In case of one frequency band and one layer of transmission reception points (TRxP), the user experienced data rate could be derived from the 5th percentile user spectral efficiency through equation (3). Let W denote the channel bandwidth and SEuser denote the 5th percentile user spectral efficiency. Then the user experienced data rate, Ruser is given by:
Ruser = W × SEuser (3)
In case bandwidth is aggregated across multiple bands (one or more TRxP layers), the user experienced data rate will be summed over the bands. This requirement is defined for the purpose of evaluation in the related eMBB test environment.
The target values for the user experienced data rate are as follows in the Dense Urban – eMBB test environment:
– Downlink user experienced data rate is 100 Mbit/s.
– Uplink user experienced data rate is 50 Mbit/s.
These values are defined assuming supportable bandwidth as described in Report ITU-R M.2412-0 for each test environment. However, the bandwidth assumption does
Population per High bands offload High bands offload High bands offload High bands offload
per km2 30% 20% 10% 30% 20% 10% 30% 20% 10% 30% 20% 10%
5000 0 0 0 0 0 30 30 90 190 140 260 380
6000 0 0 0 10 40 110 110 230 340 290 430 580
7000 0 0 20 40 130 230 230 360 500 430 600 770
8000 0 20 50 110 230 340 340 500 650 580 770 960
9000 10 40 110 200 330 460 460 630 810 720 940 1160
10000 30 90 190 290 430 580 580 770 960 870 1110 1350
11000 60 160 270 370 530 690 690 900 1120 1010 1280 1540
12000 110 230 340 460 630 810 810 1040 1270 1160 1450 1740
13000 170 300 420 550 740 920 920 1180 1430 1300 1610 1930
14000 230 360 500 630 840 1040 1040 1310 1580 1450 1780 2120
15000 290 430 580 720 940 1160 1160 1450 1740 1590 1950 2320
16000 340 500 650 810 1040 1270 1270 1580 1890 1740 2120 2510
17000 400 570 730 890 1140 1390 1390 1720 2050 1880 2290 2700
18000 460 630 810 980 1240 1500 1500 1850 2200 2030 2460 2900
19000 520 700 890 1070 1340 1620 1620 1990 2350 2170 2630 3090
20000 580 770 960 1160 1450 1740 1740 2120 2510 2320 2800 3280
21000 630 840 1040 1240 1550 1850 1850 2260 2660 2460 2970 3480
22000 690 900 1120 1330 1650 1970 1970 2390 2820 2610 3140 3670
23000 750 970 1190 1420 1750 2080 2080 2530 2970 2750 3310 3860
24000 810 1040 1270 1500 1850 2200 2200 2660 3130 2900 3480 4060
25000 870 1110 1350 1590 1950 2320 2320 2800 3280 3040 3650 4250
26000 920 1180 1430 1680 2050 2430 2430 2930 3440 3190 3810 4440
Spectrum need < 10 MHz 10 to 500 MHz 500 - 1000 MHz 1000-2000 MHz > 2000 MHz
Activity factor 10% Activity factor 15% Activity factor 20% Activity factor 25%

IMT spectrum demand
© copyright Coleago 2020 50
not form part of the requirement. The conditions for evaluation are described in Report ITU-R M.2412-0.
Appendix D: ITU-R definition of area traffic capacity
From Report ITU-R M.2410-0 – page 7
4.6 Area traffic capacity
Area traffic capacity is the total traffic throughput served per geographic area (in Mbit/s/m2). The throughput is the number of correctly received bits, i.e. the number of bits contained in the SDUs delivered to Layer 3, over a certain period of time. This can be derived for a particular use case (or deployment scenario) of one frequency band and one TRxP layer, based on the achievable average spectral efficiency, network deployment (e.g. TRxP (site) density) and bandwidth.
Let W denote the channel bandwidth and ρ the TRxP density (TRxP/m2). The area traffic capacity Carea is related to average spectral efficiency SEavg through equation (6).
Carea = ρ × W × SEavg (6)
In case bandwidth is aggregated across multiple bands, the area traffic capacity will be summed over the bands. This requirement is defined for the purpose of evaluation in the related eMBB test environment. The target value for Area traffic capacity in downlink is 10 Mbit/s/m2 in the Indoor Hotspot – eMBB test environment. The conditions for evaluation including supportable bandwidth are described in Report ITU-R M.2412-0 for the test environment.
Appendix E: Selected use cases requiring citywide speed coverage
We are considering the future evolution of 5G over the next ten years. Today not all applications or use cases that will be developed to make use of the capabilities of 5G are known. However, in the following section we provide illustrations of some of the use cases that drive the need for citywide speed coverage.
Video everywhere and “on the move”
Much of the increase in demand for area traffic capacity is driven by increased use of video and advanced forms of video. Exhibit 48 shows the speed requirement for different types of video which increase as video capabilities advance. Advanced video includes augmented reality (AR) and virtual reality (VR) with higher resolutions and frame rates. Large screen devices, where higher resolution video is more relevant, will also use 5G streaming.
Immersive gaming not only requires high resolution video but also low latency. The low latency of 5G networks allows offload of the heavy computational work from devices to data centres which allows simplification of end user devices and wearables. Gaming content can be streamed just like video streaming services for example Netflix or Amazon Prime. The new gaming platforms such as Microsoft (with Project xCloud) and Google (with Stadia) are developed with 5G in mind.
Advanced video over 5G is already a reality. For example, in December 2019 Korea Telecom launched Real 360 app, a platform for 360-degree live-streaming, video sharing and video chat. Real 360 app users can initiate a 4K 360-degree video chat from a smartphone. Because of the vast quantity of data involved in transmitting high-resolution 360-degree video in real time, 5G technology is essential for this new communication tool.

IMT spectrum demand
© copyright Coleago 2020 51
Exhibit 48: Speed requirement for video
VR level Nominal data rate
1080p 4 Mbit/s
2K 5 Mbit/s
4K 20 Mbit/s
8K 80 Mbit/s
VR 4K 2D 50 Mbit/s
VR 8K 2D 100 Mbit/s
VR 8K 3D 150 Mbit/s
VR 12K 3D 500 Mbit/s
Source: Coleago Consulting
FWA in cities in developing countries
In addition to 5G mobile connectivity, Fixed Wireless Access (FWA) is an important 5G use case. Traffic volumes on FWA are five times higher compared to mobile use and a video streaming to large screens creates a demand for high data rates of 300 Mbit/s.
While FWA provided with 4G is already experiencing some growth, the use of 5G means that particularly in developing countries with less developed wired (FTTH, xDSL, cable) broadband networks, 5G FWA is a major driver for an increase in mid-bands spectrum demand. Therefore in such countries, while demand for advanced 5G applications such as connected cars may take time to develop, demand from FWA is much higher compared to developed countries with good wired broadband infrastructure.
More information on the 5G FWA market and trends available in Section 5.
Connected cars in cities
In the long-term, substantial capacity is required on roads to serve the connected car and smart road use cases. Exhibit 49 shows the data rates for connected cars which in a ten year time frame will require substantial capacity. A study by the 5G Automotive Association published in June 202025 found that “At least 500 MHz of additional service-agnostic mid-band (1 to 7 GHz) spectrum would be required for mobile operators to provide high capacity city wide advanced automotive V2N services.”
Exhibit 49: Data rates for car automation sensors
Sensor type Quantity per vehicle Data rate per sensor
Radar 4 – 6 0.1 – 15 Mbit/s
LIDAR 1 – 5 20 – 100 Mbit/s
Camera 6 - 12 500 – 3500 Mbit/s
Ultrasonic 8 - 16 < 0.01 Mbit/s
Vehicle motion, GNSS, IMU - < 0.1 Mbit/s
Source: Flash Memory in the emerging age of autonomy Stephan Heinrich, Lucid Motors
255GAA TRS-200127 Working Group Standards and Spectrum Study of spectrum needs for safety
related intelligent transport systems, page 5.