
Fiorini_phdthesis.pdf - IMT E-Theses
238
IMT School for Advanced Studies, Lucca Lucca, Italy Essays on Labelling and Retail in the Food Market PhD Program in Economics, Markets, Institutions XXVII Cycle By Niccolò Fiorini 2017
-
Upload
khangminh22 -
Category
Documents
-
view
0 -
download
0
Transcript of Fiorini_phdthesis.pdf - IMT E-Theses

IMT School for Advanced Studies, Lucca
Lucca, Italy
Essays on Labelling and Retail in the Food
Market
PhD Program in Economics, Markets, Institutions
XXVII Cycle
By
Niccolò Fiorini
2017


The dissertation of Niccolò Fiorini is approved.
Program Coordinator:
Prof. Massimo Riccaboni, IMT School for Advanced Studies Lucca
Supervisor:
Prof. Massimo Riccaboni, IMT School for Advanced Studies Lucca
Supervisor:
Prof. Nicola Dimitri, University of Siena
The dissertation of Niccolò Fiorini has been reviewed by:
Prof. Roberto Ricciuti, University of Verona
Prof. Lorenzo Zanni, University of Siena
IMT School for Advanced Studies, Lucca
2017


To My Family

vii
CONTENTS
LIST OF FIGURES ..................................................................................XII
LIST OF TABLES .................................................................................. XIV
ACKNOWLEDGEMENTS ................................................................... XVII
VITA XIX
ABSTRACT ............................................................................................. XX
INTRODUCTION .......................................................................................1
1. AN ANALYSIS OF PRIVATE LABEL AND RETAIL .........................7
1.1 A COMMON THREAD ................................................................. 10
1.2 INCREASING RETAILER POWER AND UNDESIRABLE
OUTCOMES ............................................................................................ 11
1.2.1 MERGERS AND ACQUISITIONS ........................................................ 11
1.2.1.1 HORIZONTAL INTEGRATIONS ...................................................................... 12
1.2.1.2 VERTICAL INTEGRATIONS ............................................................................ 16
1.2.2 BUYING GROUPS ............................................................................. 19
1.2.3 MALPRACTICES ............................................................................... 20
1.2.3.1 TENTATIVE LIST OF COMMON MALPRACTICES ...................................... 21
1.2.3.2 AN EXAMPLE: PROBLEMS ARISING FOR FARMERS ................................ 23

viii
1.3 PRIVATE LABELS AND THEIR EFFECTS................................... 24
1.3.1 THE PRIVATE LABEL: ORIGIN AND DEFINITION ............................ 24
1.3.2 PRIVATE LABEL EXPLOITATION AND PHILOSOPHY ....................... 28
1.3.3 FOCUS: SUPERMARKETS AND PRIVATE LABELS IN ITALY .............. 30
1.4 BUYER POWER AND PL PROBLEMS ......................................... 31
1.4.1 PROBLEMS DERIVING FROM PRIVATE LABELS ............................... 31
1.4.2 THE COMPETITION AUTHORITIES’ APPROACH TO PL AND BUYER
POWER PROBLEMS ................................................................................... 32
1.4.3 AN EXAMPLE OF BUYER POWER DERIVING FROM PLS .................. 36
1.4.4 HELP COMING FROM RESEARCH STUDIES OF TRADE ASSOCIATIONS
.................................................................................................................. 40
1.5 PRIVATE LABEL OPPORTUNITIES AND STRATEGIES ......... 41
1.6 PL FINAL REMARKS ...................................................................... 42
2. PRIVATE LABEL PROMOTION: A NEW DEFENSIVE AND
SUPPORTING STRATEGY? ................................................................. 45
2.1 LITERATURE REVIEW AND THEORETICAL FRAMEWORK . 47
2.2 RESEARCH QUESTION .................................................................. 56
2.3 DATASET ......................................................................................... 57
2.4 METHODOLOGY AND MODEL .................................................... 60
2.4.1 DESCRIPTIVE ANALYSIS: RANDOM EFFECTS LOGIT ....................... 60
ix
2.4.2 CAUSAL EFFECTS OF PROMOTIONS: MATCHING ............................. 66
2.5 RESULTS .......................................................................................... 68
2.5.1 DESCRIPTIVE ANALYSIS .................................................................. 68
2.5.2 CAUSAL ANALYSIS ........................................................................... 78
2.6 CONCLUSION .................................................................................. 84
3. THE ROLE OF GEOGRAPHICAL INDICATIONS AND COUNTRIES’
“MADE-IN” POWER IN GLOBAL TRADE OF WILD EDIBLE
MUSHROOMS AND TRUFFLES .......................................................... 87
3.1 THEORETICAL FRAMEWORK ..................................................... 90
3.2 OBJECTIVES AND RATIONALE ................................................... 92
3.3 METHODOLOGY ............................................................................. 95
3.3.1 DATA SOURCE ................................................................................. 95
3.3.2 DATA ANALYSIS .............................................................................. 98
3.4 ANALYSIS....................................................................................... 101
3.4.1 NETWORKS ................................................................................... 102
3.4.2 BETWEENNESS CENTRALITY AND OUT DEGREE ........................... 109
3.4.3 AVERAGE PRICES .......................................................................... 115 3.4.3.1 FRESH/CHILLED (070959) AVERAGE PRICES ...................................116
3.4.3.2 DRIED/ POWDERED (071239) AVERAGE PRICES .............................119
3.4.4 INCENTIVES IN LABELLING ARBITRAGE ........................................ 122
3.4.4.1 FRESH/CHILLED (070959) .....................................................................123

x
3.4.4.2 DRIED/ POWDERED (071239) ...............................................................125
3.5 DISCUSSION .................................................................................. 127
3.6 GEOGRAPHICAL INDICATIONS AND “MADE-IN” POWER:
ITALY AND THE FUNGO DI BORGOTARO IGP CASE STUDY .... 134
3.6.1 FOCUS: ITALY ................................................................................ 135
3.6.1.1 THE FUNGO DI BORGOTARO IGP CASE STUDY ......................... 145
3.7 CONCLUSIONS .............................................................................. 148
APPENDIX A: TIME ............................................................................ 150
APPENDIX B: CATEGORIES .............................................................. 152
APPENDIX C: THE PASTA INDUSTRY ............................................ 157
APPENDIX D: NETWORKS FOR THE YEARS 2006, 2009 AND
2015 160
D.1 FRESH/CHILLED (070959) NETWORKS ....................................... 160
D.2 DRIED/POWDERED (071239) NETWORKS .................................. 163
APPENDIX E: EFFECT OF “AREAS NES (NOT ELSEWHERE
SPECIFIED)” AND "BUNKERS" ELIMINATION ............................. 166
E.1 FRESH/CHILLED (070959) ............................................................ 166 E.2 DRIED/POWDERED (071239)....................................................... 167

xi
APPENDIX F: BETWEENNESS CENTRALITY AND OUT DEGREE
TABLE 2015 ......................................................................................... 168
F.1 FRESH/CHILLED (070959) BC AND OD - 2015 ........................... 168
F.2 DRIED/POWDERED (071239) BC AND OD - 2015 ...................... 169
APPENDIX G: GRAPHS: BC / OD ...................................................... 171
G.1 FRESH/CHILLED (070959) GRAPHS: BC / OD ............................. 171
G.2 DRIED/POWDERED (071239) GRAPHS: BC / OD ........................ 175
APPENDIX H: GRAPHS BC / OD (LOG) .......................................... 179
H.1 FRESH/CHILLED (070959) GRAPHS: BC / OD (LOG) .................. 179
H.2 DRIED/POWDERED (071239) GRAPHS: BC / OD (LOG) ............. 183
APPENDIX I: ADJUSTMENTS OF AVERAGE PRICES ................... 187
I.1 FRESH/CHILLED (070959)............................................................. 187
I.2 DRIED/POWDERED (071239)........................................................ 189
APPENDIX J: COUNTRIES ISO CODE AND DIGIT ......................... 191
REFERENCES ....................................................................................... 200

xii
List of Figures
FIGURE 1 PL PROMOTION MARKET SHARE 2014. PL PROMOTION SHARE (IN %) IN
EUROPEAN COUNTRIES AND IN THE UNITED STATES............................................ 50 FIGURE 2 PL PROMOTION EVOLUTION, IN POINTS, 2014 VERSUS 2013. .................... 50 FIGURE 3 IRI FOOD SHOPPING BASKET. TOTAL NB VERSUS PL RELATIVE PRICE INDEX.
IN Q4 2014 AND Q4 2015, IN WESTERN COUNTRIES........................................ 52 FIGURE 4 MASS MARKET RETAILER TURNOVER (€ BILLIONS), PER PRODUCT
CATEGORY: FOOD OR NON-FOOD. .......................................................................... 59 FIGURE 5 EXAMPLE OF A CUT-VERTEX. ............................................................................ 99 FIGURE 6 GLOBAL NETWORK OF FRESH/CHILLED WILD MUSHROOM AND TRUFFLE
TRADE (070959) REFERRED TO 2003.............................................................. 103 FIGURE 7 GLOBAL NETWORK OF FRESH/CHILLED WILD MUSHROOM AND TRUFFLE
TRADE (070959) REFERRED TO 2012.............................................................. 104 FIGURE 8 GLOBAL NETWORK OF “DRIED, WHOLE/CUT/SLICED/BROKEN OR IN POWDER
[…]” MUSHROOM AND TRUFFLE TRADE (071239) REFERRED TO 2003........ 106 FIGURE 9 GLOBAL NETWORK OF “DRIED, WHOLE/CUT/SLICED/BROKEN OR IN POWDER
[…]” MUSHROOM AND TRUFFLE TRADE (071239) REFERRED TO 2012. ...... 107 FIGURE 10 BETWEENNESS CENTRALITY (BC) AND PRICE DIFFERENCES SCATTER PLOT
FOR THE YEAR 2009............................................................................................. 125 FIGURE 11 BETWEENNESS CENTRALITY (BC) AND PRICE DIFFERENCES SCATTER PLOT
FOR THE YEAR 2009............................................................................................. 127 FIGURE 12 ITALIAN MARKET: EXPORT, IMPORT AND PRODUCTION OF WILD MUSHROOMS
AND TRUFFLES: FRESH/CHILLED AND DRIED/POWDERED (071239 AND
070959)............................................................................................................... 138 FIGURE 13 ITALIAN PRODUCTION VS EXPORT OF WILD MUSHROOMS AND TRUFFLES:
FRESH/CHILLED AND DRIED/POWDERED (071239 AND 070959) FROM 2003
TO 2009. ............................................................................................................... 140 FIGURE 14 NUMBER OF PRODUCTS IN PROMO/NOT IN PROMO FOR EACH CATEGORY.
................................................................................................................................ 154 FIGURE 15 GLOBAL NETWORK OF FRESH/CHILLED WILD MUSHROOM AND TRUFFLE
TRADE (070959) REFERRED TO 2006.............................................................. 160 FIGURE 16 GLOBAL NETWORK OF FRESH/CHILLED WILD MUSHROOM AND TRUFFLE
TRADE (070959) REFERRED TO 2009.............................................................. 161 FIGURE 17 GLOBAL NETWORK OF FRESH/CHILLED WILD MUSHROOM AND TRUFFLE
TRADE (070959) REFERRED TO 2015.............................................................. 162

xiii
FIGURE 18 GLOBAL NETWORK OF “DRIED, WHOLE/CUT/SLICED/BROKEN OR IN
POWDER […]” MUSHROOM AND TRUFFLE TRADE (071239) REFERRED TO 2006.
................................................................................................................................ 163 FIGURE 19 GLOBAL NETWORK OF “DRIED, WHOLE/CUT/SLICED/BROKEN OR IN
POWDER […]” MUSHROOM AND TRUFFLE TRADE (071239) REFERRED TO 2009. ................................................................................................................................ 164
FIGURE 20 GLOBAL NETWORK OF “DRIED, WHOLE/CUT/SLICED/BROKEN OR IN
POWDER […]” MUSHROOM AND TRUFFLE TRADE (071239) REFERRED TO 2015. ................................................................................................................................ 165

xiv
List of Tables
TABLE 1 SUMMARY STATISTICS OF THE EXAMINED VARIABLES ..................................... 65 TABLE 2 CORRELATION MATRIX ....................................................................................... 65 TABLE 3 EMPIRICAL RESULTS. DEPENDENT VARIABLE: PRODUCT PROMOTION ......... 70 TABLE 4 ATE AND ATT ESTIMATIONS OF PROMOTION ON REVENUES ........................ 79 TABLE 5 ATE AND ATT ESTIMATIONS OF PROMOTION ON QUANTITY ........................ 79 TABLE 6 BETWEENNESS CENTRALITY (BC) AND OUT DEGREE (OD) RESULTS
REFERRED TO FRESH/CHILLED WILD MUSHROOMS AND TRUFFLES (070959).
................................................................................................................................ 111 TABLE 7 BETWEENNESS CENTRALITY (BC) AND OUT DEGREE (OD) RESULTS
REFERRED TO “DRIED, WHOLE/CUT/SLICED/BROKEN OR IN POWDER […]”)
(071239) WILD MUSHROOMS AND TRUFFLES................................................... 113 TABLE 8 AVERAGE PRICES OF FRESH/CHILLED WILD MUSHROOMS AND TRUFFLES IN US
$ PER KG. ............................................................................................................... 116 TABLE 9 MEDIAN PRICES OF FRESH/CHILLED WILD MUSHROOMS AND TRUFFLES IN US
$ PER KG. ............................................................................................................... 116 TABLE 10 AVERAGE PRICES OF DRIED/ POWDERED WILD MUSHROOMS AND TRUFFLES
(“WHOLE, CUT, SLICED, BROKEN OR IN POWDER, BUT NOT FURTHER PREPARED” -
071239) IN US $ PER KG. .................................................................................. 119 TABLE 11 MEDIAN PRICES OF DRIED/ POWDERED WILD MUSHROOMS AND TRUFFLES
(“WHOLE, CUT, SLICED, BROKEN OR IN POWDER, BUT NOT FURTHER PREPARED” -
071239) IN US $ PER KG. .................................................................................. 120 TABLE 12 BETWEENNESS CENTRALITY (BC) AND PRICE DIFFERENCES FOR MAJOR
COUNTRIES REFERRED TO FRESH/CHILLED WILD MUSHROOMS AND TRUFFLES
(070959) CATEGORY. YEARS: 2003, 2006, 2009 AND 2012. ..................... 123 TABLE 13 BETWEENNESS CENTRALITY (BC) AND PRICE DIFFERENCES FOR MAJOR
COUNTRIES REFERRED TO DRIED/ POWDERED WILD MUSHROOMS AND TRUFFLES
(“WHOLE, CUT, SLICED, BROKEN OR IN POWDER, BUT NOT FURTHER PREPARED” -
071239). YEARS: 2003, 2006, 2009 AND 2012. ......................................... 125 TABLE 14 ITALIAN EXPORT, IMPORT AND PRODUCTION OF WILD MUSHROOMS AND
TRUFFLES: FRESH/CHILLED AND DRIED/POWDERED (071239 AND 070959). ................................................................................................................................ 137
TABLE 15 ITALIAN PRODUCTION OF WILD MUSHROOMS AND TRUFFLES: FRESH/CHILLED
AND DRIED/POWDERED (071239 AND 070959) FROM 2003 TO 2009. .... 139 TABLE 16 FUNGO DI BORGOTARO PRODUCTION (IN KILOGRAMS). YEARS: 2005, 2009,
2010, 2011, 2012 AND 2013. ......................................................................... 147

xv
TABLE 17 SEASONS ........................................................................................................ 151 TABLE 18 CATEGORIES AND NUMBER OF PRODUCTS .................................................. 153 TABLE 19 PASTA INDUSTRY ACQUISITIONS 1983-1998. .......................................... 158 TABLE 20 LIST OF DELETED NON-SIGNIFICANT TRANSACTIONS FOR FRANCE (2012)
................................................................................................................................ 189 TABLE 21 COMTRADE COUNTRY CODE AND NAME. .................................................... 191

xvi

xvii
Acknowledgements
First of all, I would like to express my sincere gratitude to my supervisor, Nicola Dimitri, for the continuous support during my Ph.D. and related research, for his patience, motivation and immense knowledge. His guidance helped me throughout my research and the writing of this thesis. I could not have imagined having a better supervisor for my Ph.D. study. I also would like to deeply thank my advisor, Massimo Riccaboni, for his insightful comments and encouragement, but also for the suggestions which stimulated me to greatly improve my research from various perspectives.
I am extremely grateful to the two referees of this thesis, Roberto Ricciuti and Lorenzo Zanni, who provided many insightful and useful comments to improve the chapters.
I want to express my gratitude to Elena Casprini, Antonella D’Agostino, Tommaso Pucci and Paolo Zacchia for their general support and comments and their crucial contribution to the second chapter.
I am really grateful to Cambridge Judge Business School and Clare Hall College (University of Cambridge), that gave me the possibility to spend few months of my life in the beautiful university city of Cambridge and to experience the real academic life of this renowned University. My sincere thanks also go to Dominique Lauga who allowed this opportunity.
I deeply thank Nicola De Vivo and Tiziano Distefano for their precious help and support, for the stimulating discussions, for the sleepless nights we were working together before exams and deadlines, for the inside jokes, for all the fun and unforgettable moments we have had and, last but not least, for their friendship.
Many sincere thanks also to all other scholars, colleagues and friends who helped, supported, criticized and stimulated my work and my Ph.D. studies, among others: Gianni Betti, Giovanni Marin, Marco Modica, Elia Ambrosio, Luca Moraschini, Valentina Ciccolini, Matteo Vigni, Valeria Barra, Eugenio Carli, Paolo Brogi, Stefano Sebastio, Luca Trapin, Olga Chiappinelli, Daniele Cassese and my brother Filippo. Many thanks to Antonio Puggioni for his support and for sharing with me, as my roommate, the Ph.D. life experience.

xviii
I would like to thank my friends from Cambridge Judge Business School, Clare Hall College and all the friends I met in Cambridge for their friendship and the amazing moments and experience we shared during the beautiful time I spent there.
Many thanks to the IMT PhD office for their help and support and to all the IMT community for the good time I had in Lucca.
I am also thankful to “La Gita” and to all my friends for their support and for the extraordinary time I always have with them. Friendship makes life worth living.
Finally, the greatest thanks go to my family: to my parents and to my brother for unconditionally supporting me spiritually and practically throughout my Ph.D. and my life in general. Without them it would not have been possible to achieve this result.

xix
Vita
February 10, 1987 Born, Siena (SI), Italy 2009 Bachelor in Business Administration
(Laurea Triennale) Final mark: 110/110 cum laude University of Siena, Siena (Italy) 2010 Master of First Level
in “Gestione delle Istituzioni Finanziarie e Nuove Tecnologie dell’Informazione – GINTS” (Master Universitario di Primo Livello)
University of Siena, Siena (Italy) 2010 Visiting Student (September – December)
WHU-Otto Beisheim School of Management, Koblenz (Germany)
2011 MSc in Management and Governance
curriculum Accounting and Management (Laurea Magistrale)
Final Mark: 110/110 cum laude University of Siena, Siena (Italy) 2015 Visiting Research Scholar (January – June) Cambridge Judge Business School Clare Hall College
University of Cambridge, Cambridge (UK) Tutor: Professor Dominique Lauga

xx
Abstract The importance of labelling has been considerably increasing over recent years. This study analyses two main topics. The first one (chapters 1 and 2) regards Private Labels (PLs), while the second concerns Geographical Indications (GIs) and “Made-in” power (Chapter 3).
Private Labels make up a significant share of market and have a wide offering, both in terms of different segments and number of products within each segment. PLs represent a strategic tool in the power balance between manufacturers and retailers. The relations between mass retail chains and suppliers/manufacturers are quite complex and involve economic, managerial and competition based issues. Among several strategies, we identify promotion as a crucial one. Promotional strategies have been changing over the last decade. Our study highlights the existence of a new defensive and supporting strategy. It can be considered a defensive strategy as its main task is to maintain the market share of PLs against NBs, while it can also be regarded as supporting in nature because it supports the introduction and penetration of premium (or organic) PLs, since directly promoting premium PLs using an offensive promotion strategy would lead to undesirable effects in terms of product perception and consumer behaviour. To test our hypothesis and reach our conclusion we perform several empirical analyses on a unique dataset provided by a leading retailer with stores in central Italy. Geographical Indications and “Made-in” labels constitute a valuable resource for companies and, more in general, countries and industries that have distinctive features in terms of quality, knowledge, traditions and excellence. Developing a mixed-method approach, the third chapter analyses GIs and “Made-in” power, initially through quantitative analyses on global trade and the behaviour of major countries. Then it individuates, through a proposed replicable method, the anomalies and the existence of a possible kind of arbitrage from companies of countries with high “Made-in” power and a favourable Export-Import price differential. In the second part of our study, we focus our attention on an analysis of Italy (a major hub in worldwide trade, with a significant “Made-in” power) and on a specific case study (i.e. the Fungo di Borgotaro IGP). For their special characteristics, which fit perfectly with the aim of our research (i.e. perishability and absence of significant value added), we chose two types of edible wild mushrooms and truffles (i.e. fresh/frozen and fried/powdered) to perform our analyses and to examine a focus country and an example of a GI (i.e. Fungo di Borgotaro IGP).

1
Introduction
Labelling has been increasing in importance over the past few years in mass retail channels and food trade due to Private Label (PL) expansion and the rising support for establishment with respect to Geographical Indication (GI) (see, among others, Cuneo et al., 2015 and Belletti et al., 2015). However, it appears that an integrated approach in available studies on this matter is missing and is, therefore, much needed.
It should be noted that the depiction of such a complex and comprehensive analysis represents both the considerable value added of this work and its main issue.
After the collection and the discussion of the existing academic literature in chapter 1, we present our specific data analysis on retail (chapter 2) and we move towards issues regarding GI and country of origin (chapter 3). The selection of specific methodology has been made according to the needs and characteristics of each individual subject, first exploiting the more generalised approach and moving then towards more distinct ones. Labelling represents the common thread that unites the entire study.
The effort described above turns into a study on labelling in retail and global food trade that is able to stimulate further analysis and discussion on the proposed topics.
The study concerns two main matters. The first one is about Private Labels and their importance in the mass retail channel, whereas the second deals with Geographical Indications and the “Made-in” power of certain countries in global food trade.
We shed light on new PL strategies in the “rivalry” between suppliers and retailers. Although their role has changed over years, nowadays PL strategies aim to solve two main tasks: first, they defend existing PL market power and share, and, second, they seek to improve PL share and power in premium segments. Among others, PL promotional strategies represent a primary tool.
Furthermore, we show that labelling might represent an essential aspect towards guaranteeing, both for producers and consumers, product origin and quality through GIs and “Made-in” labels. “Made-in” labels are also a

2
proxy for the value perceived by consumers due to the assumed country of origin of a specific product.
Several major contributions result from this research, specifically from the empirical research carried out, distinctive datasets, novel approaches and focused case studies. The main contributions concern, at first, several empirical analyses of a unique and representative dataset on PL promotions. Moreover, an innovative economic depiction of wild mushroom and truffle trade, as well as a general method to detect “Made-in” power and possible kinds of arbitrages, is illustrated. Finally, we propose a connection between trade anomalies (i.e. exploitation of arbitrage) and GI and “Made-in” labels, which represent the solution to the first issue.
The first two chapters underline the central role of PLs in some crucial supermarket strategies.
Our work starts with a comprehensive analysis of the retail sector with the aim to understand the key factors that need to be emphasised through this research.
We analyse retail from four different points of view: economic, management, marketing and competition.
We point out that in the first papers to address these issues1 , scholars focused their attention on both the retail market as a whole and on the complex relationships of its players. Key issues result in supermarket buyer power and in those practices aimed to reinforce retailer buyer power.
This comprehensive study of retail market emphasises the role played by PLs in terms of: market share2, brand awareness and penetration in new markets and point out the strategies and the outcomes, both the desirable and the less desirable ones, linked with PLs. Moreover, it discloses the existence of a hidden agenda beyond the more proximate implications of retailer strategies.
Retailers might have multiple objectives3, which can even be in conflict with each other. Sometimes, strategies aim to increase buyer power in the
1 See, among others, Dobson et al. (2001), Dobson & Waterson (1999), Inderst & Wey (2007), Dobson & Inderst (2008) and Inderst & Valletti (2011). 2 Ailawadi & Harlam (2002). 3 Porter (1979), among others.

3
upstream market 4 more than to gain market share and raise brand awareness.
To offer the widest depiction of the retail industry, we discuss both undesirable and desirable outcomes. The former, mainly supported by antitrust authorities and some scholars interested in buyer power 5 , comprehensively consider short and long term consequences as well as competitor and consumer perspectives. The latter focus mainly on PLs and their effects.
Even though abuse of power deriving from PL strategies mostly generates undesirable outcomes6, we can identify several desirable consequences as well, such as producer/retailer collaboration and synergies7. The reaching of an equilibrium in combination level between PLs and National Brands (NBs), where both leaders and followers are present, might be profitable for the whole industry8.
Given the importance of PLs in the retail industry, we focus our attention on an analytic study of this issue.
Similarly to the retail industry as a whole, supermarket strategies have been profoundly transforming over recent years 9 . We can presently identify three predominant different PL programs (Geyskens et al., 2010), which can be defined as economy, standard and premium.
The stage of maturity reached by PLs has persuaded retailers to shift from a promotion based strategy to a quality oriented one10. A “good value for money” is the consistent logic of PLs 11 . Hence, premium PLs maintain comparatively low prices with respect to equivalent NBs. Given this new
4 Among others, see Wang (2006) and Doyle & Inderst (2007). 5 Among others: Monopolies and Mergers Commission (1981), OECD (1981), Office of Fair Trading (1985), OECD (1998), Dobson et al. (2001) and Stichele & Young (2009). 6 Dobson et al. (2001) and Waterson & Dobson (1998), among others. 7 Colla (2003) and Choi (2017), among others. 8 For a survey on consumer perception of supermarket assortments, please read Nielsen (2014). 9 For more literature insights see, among others, Mullick-Kanwar (2013) and Molinillo et al. (2014 and 2016). 10 Among others, Nielsen (2014), Bontemps et al. (2008). 11 Collins-Dodd & Lindley (2003) and Vahie & Paswan (2006).

4
phase, premium PLs represent the key for attracting consumers still loyal to NBs12.
According to this philosophy, retailers have begun to introduce premium products and to gain a significant market share in this segment 13 . To understand the causes of and the solutions for this new scenario, we start from a review of the last fifteen years and then conduct empirical analyses that are focused over specific three years. We implement both logistic, ATE and ATT estimations considering promotion as the dependent variable.
We demonstrate the shift from offensive to defensive and supporting strategies recently devised by retailers. The most relevant consequence of these changes is the new power relations between manufacturers and retailers.
Defensive PL promotions represent the instant and effective short-term response to counterbalance intense promotions of National Brands.
Promotion as a supporting strategy seeks, through discounts on standard PLs in the same category, to indirectly attract customers to buy premium PLs, which cannot be directly promoted for intrinsic reasons.
The new defensive and supporting tasks of promotions are relevant since they identify the new battlefield among retailers and NB manufacturers.
The third chapter of this study deals with two different type of labels, both related to quality and local excellence: the Geographical Indication (GI) and the “Made-in” label. Instead of being a brand positioned in the upper bound quality segment, the former distinctive sign operates as a (standardised) guarantee of quality and origin14. The latter, instead, is a less standardised - yet still powerful - tool, linked with the origin of a product.
To examine GIs and “Made-in” power, we study, from an economic angle, a peculiar, yet representative, market: the global trade of wild mushrooms and truffles, with an Italian focus, using a general-to-specific approach. The rationale behind this choice is the existence of only one certified PGI label (i.e. the Italian Fungo di Borgotaro) together with the importance that has recently arisen regarding the introduction of standard labels that protect both producers and consumers, as well as local economies (read the introductory section of chapter 3 for more details).
12 Ailawadi et al. (2008) and Geyskens et al. (2010), among others. 13 Nielsen (2014) and Lee et al. (2016). 14 Correa & Yusuf (2008).

5
We employ several different methods of analysis (e.g. networks and others) to depict the main characteristics and the anomalies of the worldwide trade of two wild products: fresh/chilled and dried/powdered wild mushrooms and truffles of certain edible species. The aim is to describe and comprehend the existing relationships among all the players first of all, and then to reveal irregularities and propose a possible solution based on a case study.
One of the most interesting results is the detection of the countries that operate as hubs. Some Asian countries (i.e. Hong Kong, Singapore and Japan) import considerable quantities of dried/powdered wild mushrooms and truffles and directly re-export them, even to faraway countries. Some Western countries (i.e. Germany, Italy, The Netherlands, France and the USA) play the same role. Moreover, in addition to dried/powdered wild mushrooms and truffles, the latter countries also import and then directly re-export fresh/chilled wild mushrooms and truffles to nearby countries, mainly originating in Eastern European countries (i.e. Romania and Bulgaria).
Anomalies in this trade exist because of the lack of transparency concerning the definition of the country of origin and quality standards. Moreover, differences in average price of identical, and not easily discernible, products between countries make the exploitation of a kind of arbitrage possible. Furthermore, someone might exploit the ambiguities deriving from some not clearly defined rules in terms of the products’ country of origin. We propose a method to identify the existence of a possible kind of arbitrage.
Hence, at the basis of these anomalies we can identify the benefits that come from what we call “Made-in” Power.
Neither value nor quality assurance is added to the re-exported product. Hence, the gap between import and export price comes entirely from the fraudulent change of country of origin information.
The quality usually attributed to the agribusiness sector of some Western countries is the only factor augmenting the price of re-exported products. That enhancement corresponds to the value of the “Made-in” logo: it represents a good proxy of “Made-In” power of that specific country.
When there is neither assurance nor traceability of product origin, the exporter (or re-exporter) labels can be confusing and can lead to frauds for the final consumers.

6
Since the designation of the country of origin, or at least the alleged one, enhances the value of a product, in particular when the country of origin is renowned worldwide for the quality of its products, this aspect is usually the most counterfeited element in those trades. We believe that the authenticity of the products and their correct labelling is something to safeguard to protect and develop local recognised quality production.
We want to assess whether GIs represent a solution to quality assurance and certification of origin for products. To achieve this task, we analyse the case of the Fungo di Borgotaro (species: Boletus edulis).
Due to the general-to-specific philosophy, we first analyse the Italian market and then we move towards the considered example.
From this case study, we understand that brand awareness of the Fungo di Borgotaro, together with its acknowledged traditions, allows producers to set prices that are higher than the average Italian Boletus edulis. At the same time, consumers are willing to pay more for having the guarantee of high quality and the observance of health standards.
From the analysis of the Fungo di Borgotaro case study we can suggest extending the utilisation of GIs to those areas where product quality and know-how is famous worldwide. This will not only guarantee for the consumer safe and quality food products, but it will also provide benefits to local areas both from social and economic point of views.

7
Chapter 1
1. An Analysis of Private Label and Retail
Supermarket chains have grown in importance in recent years in several ways. For example, they have grown in size15, their products have reached a considerable market share 16 and they have changed consumers’ behaviour17 . These issues have attracted increasing attention from two categories: academics and governments18. The former have started to study the whole phenomenon from a theoretical and empirical perspective in depth. The latter have focused their attention on policies implemented and power gained by supermarkets alongside both upstream and downstream market effects.
Much of the debate has focused on the relationship between all of the players involved in the retail market. A crucial perspective regards the buyer power exerted by supermarkets19. Buyer power has been studied for many years, its origins rooted in so-called “unfair” practices.
Many authors have emphasised the role of the new so-called “malpractices” of retail companies as a means of gaining buyer power. We can observe these malpractices from different angles, and by doing this we gain the opportunity to employ several academic notions; not only is this is our goal, but it is what caught our attention and our interest.
15 Messinger & Narasimhan (1997). 16 Ailawadi & Harlam (2002). 17 von Schlippenbach & Wey, 2011. 18 See the previous (and following) references for the academic category. For an example of government interest, see Dobson et al. (2001) and Davis & Reilly (2010), among others. 19 Dobson et al. (2001), Clarke (2002), Chen (2007) and Inderst & Mazzarotto (2008), among others.

8
Various aspects concerning supermarkets can be analysed, some of which have unquestionably increased their importance as of late. Private Label (PL) inter alia, have been playing an increasing role in terms of market share, strategic importance and consumer awareness, and they have caught scholars’ attention20.
According to an economic analysis, the Private Label has been considered an effective instrument to enhance buyer power21 because, through their introduction, retailers have become direct competitors with producers22. Hence, supermarkets simultaneously find themselves as both distributors of producers’ goods and as one of direct competitors with their PL goods. The present study extensively analyses this remarkable feature.
Despite the drafting of several papers and reports that contribute, with different approaches, to this debate, most of them only focus on individual aspects and do not offer a more comprehensive interpretation.
The review of the literature currently available on supermarkets and specifically about PLs, shows that the adoption of the PL is not a mere management strategy: it has important implications both in the management of big retail companies and in shaping the relationships between retailers, suppliers and manufacturers23. Thus, as new strategies have been adopted heretofore by supermarkets to expand their power over suppliers, additional perspectives must be taken into account.
Before analysing the strategies carried out by supermarkets, it is worth distinguishing between management matters and marketing strategies.
A relevant number of papers examine the supermarkets’ actions from a marketing perspective 24 . While more traditional approaches to the analyses consider product promotions or other traditional marketing
20 Steenkamp & Dekimpe (1997), Ailawadi & Harlam (2002), Steiner (2004), Hyman et al. (2010), Inderst et al. (2015), Villas-Boas & Chambolle (2015), among others. 21 Berges-Sennou (2006), Mills (1995), Inderst & Mazzarotto (2008), Villas-Boas & Chambolle (2015), among others. 22 Among others: Inderst (2013). 23 Among others, see: Mills (1995), Bontems et al. (1999), Mills (1999), Bergès-Sennou et al. (2004) and Tarzijan (2004). 24 To get a basic idea of the different marketing (focused) perspectives on the retail industry, see, among others: Greenley & Shipley (1992), Campbell et al. (2012), Whyatt & Koschek (2010).

9
mechanisms25 , more recent contributions examine the introduction and development of PLs. On the other hand, some other papers analyse the strategies carried out by the management to increase supermarkets’ power in terms of customer loyalty, brand awareness, market share and bargaining power26. Apparently, these topics are very similar, since all of them seem to focus on the same subject. Notwithstanding, from a deeper investigation of each aspect, we discover that some undertones help us to give a different interpretation of every action carried out, whether we consider it from the marketing or the managerial point of view. Due to their multifaceted meanings, defining the differences between marketing and management is no straightforward task. For the sake of simplicity, we are going to consider “marketing” to encompass all the aspects regarding those decisions concerning the relations with customers (e.g. brand awareness, shelf allocation, promotions, supermarket layout, etc.). Whereas we shall refer to “management” as the processes of administrating and implementing the policies aimed at giving the company an advantage over all the other players (business administration in a broad sense). A key concept, that needs to be promptly highlighted, regards the remarkable differences that can be attributed to viewing things from one perspective rather than from another. This could play an important role when trying to combine all the different perspectives.
Competition policies represent the fourth branch analysed by scholars to review retail trade. Many practices used by supermarkets could be considered unfair. For instance, unfair contracts proposed to suppliers, non-written conditions that are habitually imposed, the abuse of a dominant position and violations committed by supermarkets are just a few aspects that we consider. Starting from the final years of the 20th century, an increasing interest in trying to identify the effect of supermarkets’ policies on competition has been shown by scholars and authorities27. Some countries have been dealing with this matter for years, since the time it rose to prominence. A clear example is the United Kingdom, whose Competition Commission was among the first ones28, together with the European Authority’s studies29, to affront abuses of dominant positions.
25 Grandi (2011), Cuneo et al. (2012), Choi (2017), Lamey et al. (2012), among others. 26 Chambolle & Villas-Boas (2015), Berges-Sennou (2006), Miquel-Romero et al. (2014), Sarkar et al. (2015), among others. 27 Chen (2007), Dobson et al. (2001), Dobson (2003), among others. 28 Dobson (2005) and Davis & Reilly (2010). 29 Dobson (1999), Dobson et al. (2001), among others.

10
In contrast, other countries have not yet conducted any adequate investigation, merely supervising the evolution of this phenomenon as a whole, with no specific studies or interventions. These two different kinds of behaviour do not depend on a country’s particular line of reasoning or level of efficiency. Rather, this matter is directly correlated to the level importance garnered by those actions within a given market. From the analysis of the whole European market we can appreciate how different the development of the retail industry is30 across all countries. Therefore, if we could hypothetically take a picture of this phenomenon across the entirety of Europe, we could analyse its evolution from an early stage to maturity. With some exceptions due to differences between national markets, it is possible to identify a common path of retailing throughout the course of the last ten to twenty years31. This approach constitutes the basic concept of our study and maintained throughout the thesis, together with a combination and harmonisation of all the different views into an integrated depiction. Furthermore, we provide two different tools to interpret the whole phenomenon: the first (mainly supported by antitrust authorities and some scholars 32 ) concerns possible undesirable outcomes, both immediate and future, for competitors and consumers; the second (more favourable to supermarkets) emphasises the enhancements they fostered and the resulting desirable outcomes33. In the former case, we discuss the main aspects leading to undesirable outcomes in the most comprehensive way possible. In the latter, we consider the opposite view, mainly basing our analysis on PL products and their effects.
1.1 A Common Thread
Our hypothesis traces a common thread that underlies every aspect considered in this study and that further serves to identify a global connection. This thread may be a direct cause-and-effect relationship or a result of the market itself. The cause may also be a hidden wire (linking, for example, an apparently pure-marketing-strategy, e.g. loyalty cards, with the increasing of retailers’ buying power when targeting suppliers with
30 Dobson (2003). 31 Dobson (2003), among others. 32 Dobson (2005), Davis & Reilly (2010), Chen (2007), Dobson et al. (2001), Dobson (2003), among others. 33 See, among others, Steiner (2004).

11
temporary specific discounts). The following section provides an extensive review of this common thread and pertinent connections.
1.2 Increasing Retailer Power and Undesirable Outcomes
This part analyses the possible undesirable outcomes deriving from an increasing role played by supermarkets, consistently with the primary logic of an integrated analysis.
We first start considering mergers and acquisitions as a factor augmenting retailer power, together with buying groups. Then we present the most important and diffused malpractices, which connect all the different aspects involved and represent a significant problem to deal with. Finally, we provide an example of some problems arising for farmers as a consequence of the examined issues.
1.2.1 Mergers and Acquisitions
Managerial decisions, marketing strategies and malpractices in general have a big role in modelling the colourful retail environment. However, they operate together with other common forces that exist in any other kind of market. Efficiency, coupled with the ability to compete internationally while maintaining domestic dominance, is often the key to survival34. The most common way to achieve this feat comes by way of mergers with other firms.
From the findings presented in some papers (including for example Dobson & Waterson, 1997, Inderst & Shaffer, 2008, Normann, 2009, von Schlippenbach & Wey, 2011, and Normann, 2011, among others) we can notice that mergers and acquisitions, both “vertical” and “horizontal” ones, have affected the diffusion of buyer power. While it is intuitive that bigger firms have more power, we are interested in understanding how they reach that dominant position.
Both “vertical” and “horizontal” integration exist. Broad differences occur between these two types of mergers or acquisitions.
34 For the survival of small stores after the entry of bigger firms see Borraz, Dubra, Ferrés & Zipitría (2014); they used data on food retailing firms in Montevideo from 1998 to 2007.

12
The most common type of integration is horizontal: a company merges with or buys another one operating in the same field (e.g. a supermarket chain buys other supermarkets). As demonstrated almost two centuries ago by Cournot (1838), in doing so the new company is inevitably bigger and can count on economies of scale, a larger market share, more stores, geographic breadth, etc. These aspects all lead to having power to wield against competitors and the increased ability to exploit buyer power with respect to suppliers and producers, as analysed by Tarzijan (2004).
Vertical integrations are less traditional, hence more “innovative”. The retailer does not acquire another supermarket, but the resulting firm comes by way of the integration with a company from the upstream market that is already part of the supply chain. Usually a chain store buys (or merges with) a supplier or producer, or another firm that offers useful services for the retail process. This strategy gives a supermarket the ability to become a direct competitor of both suppliers and producers, instead of being only a customer (i.e. buyer). Despite appearing to be ordinary, simple activities, vertical integrations have many and not necessarily immediate consequences. When dealing with suppliers a vertically-integrated chain can rely on many resources, since it has the ability to find some products by relying directly on its own resources. Moreover, the vertically-integrated company can also acquire its knowledge through direct and comprehensive insight of the business aspects of the supplier. In essence the supermarket can leverage two gateways for providing goods to its store: the “classic” one (external suppliers) and the private, in-house one. Supplier integration represents indeed a favourable scenario for the wealth of the retail market.
Similar integrations, such as “buying groups”, empower retailers in their bargaining with suppliers. As will be clarified later, their frequency and importance are both increasing.
We presently propose a concise, yet non-exhaustive, scheme of the profile we have just presented. Later in the discussion we will go deeper into the analysis of some aspects listed below, given their connections with private label products.
1.2.1.1 Horizontal Integrations
From a brief economic analysis we can conclude that, as in any other market, it is imperative for chain stores to find a way to increase their efficiency and keep the pace with the current global competitive market. The easiest path towards this goal is to integrate their retail-focused

13
business with other companies. Historically, companies initially merged together or tried to extend their influence by acquiring smaller chains (horizontal integration). The main result was the creation of bigger companies and the launch of the supermarket as we know them today35. With bigger chains of stores, new opportunities arose for retailers:
• Exploitation of economies of scale (as written above): o reduction of administration and logistic costs (e.g.
creation of big warehouses) after the adoption of a more efficient managerial organization;
o possibility of centralising purchases and correlated benefits (for more details please see section 1.2.3 Malpractices).
• When bargaining with producers and suppliers the company can obtain better conditions thanks to its central role in reaching the final consumers36:
o perpetration of malpractices when a chain becomes big enough to have this possibility. An analysis made by the competition authority is strongly needed.
• Creation of big malls in the suburbs37 (this aspect plays a strong role in changing consumer habits. See next point for more details), helped by the diffusion (starting from the 50s and 60s) of consumer car ownership
o there is an evolution in the types of stores. Ellickson (2011) and Kaynak & Cavusgil (1982) describe the evolution of supermarkets: from small neighbourhood stores (first years of 20th century 38 ) to huge
35 According to Ellickson (2011), the Great Atlantic & Pacific Tea Company (A&P) changed (in the USA) the idea whereby “meat was purchased from a butcher, fish from a fishmonger, bread from a baker, and produce from a vegetable stand”: “the economy format was a standardised store, selling branded products produced in A&P factories and delivered through a vertically integrated supply chain of factories, warehouses, and trucks.” Together with A&P, other firms started to set this new type of markets: “Kroger, American Stores, and Safeway were all among the early adopters of this new business model”. 36 For exclusion originating from retail power see Rey & Whinston (2013). 37 Like the ones considered for the model in Wang, Rojas & Lavoie (2010). 38 Starting from the 1930s “the combination of the self-service and combination store into one retail unit resulted quite naturally in the supermarket”, as written in Kaynak & Cavusgil (1982).

14
supercentres39 that offer a vast range of items, from milk to do-it-yourself products, from gardening goods to books, from the last several decades. This strategy has a pure managerial purpose for capitalising on new kinds of stores while another one tended toward a change in customer perception of the supermarket and the idea of shopping in general.
• Change in consumer habits: o diffusion of the so-called “one-stop shopping trip”,
extensively studied by Messinger & Narasimhan (1997). Big chains have the possibility to obtain goods at lower prices and therefore to sell them at more favourable conditions with respect to small or medium stores. Furthermore, exploiting their power, they can ask producers to supply goods at discounted prices for a certain period (Clarke (2002) and Dobson et al. (2001)); if the management coordinates this request with other ones from different suppliers, consumers are presented then with a vast and diversified offering. The prospect of lower price shopping attracts many consumers to malls, but since it provides everything, and frequent trips to the mall might not necessarily be possible (which is also linked to new consumer behaviour: less time for making smaller but recurrent purchases, needing to economise, changing habits, i.e. free time spent in huge malls), customers end up buying everything there. The diffusion of the one-stop shopping trip forces producers to accept even the worst conditions. Otherwise they might have no other possibility to reach the final market (i.e. the consumers) and, hence, they are forced to leave it. With the new habit of the one-stop shopping trip (a similar result can be reached with loyalty programmes, as well) a customer usually goes, periodically, to the same supermarket. When the shopper does not find a product there, she/he automatically shifts her/his choice towards a competitor brand’s good. This reveals how fundamental
39 According to Singh, Hansen & Blattberg (2006) “a supercentre combines a full-line discount store with a full-line supermarket under one roof”.

15
it is for a brand to be available in the highest possible number of stores;
o consumers look for promotions. Whenever it is possible, they prefer waiting until goods are offered at lower prices in a supermarket. Otherwise they are also willing to exchange their usually purchased good with a discounted one from a different brand.
• Change in marketing strategies: o from the supermarket side (not an exhaustive list):
▪ fidelity cards40 ▪ promotions (whose intensive use is examined in
Volpe (2011)) ▪ creation of a “shopping experience” 41 (the
atmosphere of a mall is examined by Michon, Chebat & Turley (2005) to understand how it can influence shopping behaviour);
o from the supplier (or producer) side: ▪ pull strategy: a good is promoted via advertising
channels to make consumers aware of its presence and its qualities. This strategy leads consumers to search for that specific product therefore forcing supermarkets to have it in their offering. The better the campaign is set up, the bigger the result will be in forcing the chain. Hence, the supplier (or producer) will have more power when bargaining with the retailer. - The supplier (or producer) wants her/his
product to become essential in the offering of supermarkets. In other words, the product should be a prerequisite to induce customers to have a positive perception of a supermarket’s offering. If a supplier (or producer) manages to reach this status, then
40 For Mauri (2003) “the basic idea behind the introduction of loyalty cards is that a firm’s performance in terms of revenue and profit is related more to the loyalty of existing customers than to the mere number of customers”. Mauri (2003) also refers to the 1990s as the starting period in which “all the largest European grocery retailers introduced loyalty cards with the aim of acquiring consumer knowledge”. 41In Volpe & Lavoie (2008) additional services are illustrated and shops introduced in big malls to enlarge and accentuate the shopping experience.

16
the retailer would like to sell her/his goods and will grant better conditions to that supplier (or producer), maybe avoiding the use of (some) malpractices;
▪ push strategy: the supplier (or producer) tries to convince the chain store to have its products in the offering provided in the supermarkets. It can propose discounts on quantity, better conditions or other agreements that give the possibility to the supplier (or producer) to have its own products on the shelves of the chain’s stores. These agreements are risky for the supplier (or producer) since some malpractices involve practices similar to the proposed ones.
The bigger the new company is, the more power it can exert. Authorities monitoring competition are then forced to decide whether they can allow the integration or not. Simultaneously, they should evaluate all the possible consequences without, in case of any violation of antitrust principles, impairing the retailer.
1.2.1.2 Vertical Integrations
After describing in detail the horizontal integration, the one we have defined more “classical” since it is present with similar purposes in every kind of market, we will proceed by analysing the other type of possible integration introduced above.
When a chain store integrates with a producer more critical effects result42. As a direct advantage, the supermarket can produce goods autonomously and therefore the product does not need to go through an intermediary. Furthermore, the strategic knowledge that is gained through the merging with a producer is much more relevant than that which would be obtained from a supplier. Costs, materials, productive processes, added value are just a few examples of the relevant pieces of information obtained by retailers via vertical integration, otherwise difficult or impossible to gain because not shared. This gives the vertically-integrated chain a huge advantage when bargaining with producers of goods like ones made by the subsidiary. Nonetheless the chain becomes a direct competitor with other producers
42 See Cotterill (2006).

17
whose goods should be sold on the shelves of the chain’s stores. Considering all the consequences embedded in this issue, we can understand how a vertical integration might massively affect the retail market.
Even though the PL is a distinct phenomenon with respect to vertical integration, the combination of the two issues leads to a more critical scenario. Both PLs from subsidiaries and from partner firms contribute to enforce power originating from integrations. According to our research it is worth analysing them together to stress the importance of the relationship between retailers and PL producers. The study of vertical integration in connection with the diffusion of PLs gives us the opportunity to draw a multifaceted picture in which each of the four subjects presented in the introduction plays a role in muddling itself with all the others.
In the following passages we will take into consideration vertical integrations. Those involving former external producers are the most interesting ones, since the general logic is similar but they lead to further implications. The main and immediate effect reached with this action is that the company becomes a direct competitor of the producers. Previously the chain had the possibility to decide what, how and when to buy from different and independent producers; with the integration, it has the ability to decide whether or not to buy goods from an external producer (or, more often, decide the percentage of goods produced on its own and those bought “outside”). A synthetic (not exhaustive) list is provided with the purpose of harmonising different aspects. Consequences of vertical integration are:
• Access, for the retailer, to all the crucial information regarding production (we had a quick view of this above). This has a bigger impact than we might think at a first sight:
the knowledge of production processes gives a great advantage not only when buying National Brand (NB) goods but also when asking for the production of PLs from independent firms (we will discuss this point in more detail later on).
• Exploiting of all the possibilities that can be derived from private labels (see also Erzene (2012)):
o as we will explain in the next section, the introduction of PLs has many purposes. One of them is definitely the ability for supermarkets to become direct competitors with producers. If PL production is carried out by external

18
companies, chains can sell goods with their own brand even though they usually do not know everything about the production. When a PL is made by a firm owned by a chain, it means that the management knows essentially everything (or at least the crucial aspects) of the production and they can use this knowledge for wielding even more power when bargaining the purchase of goods similar to PLs. Then they could then even ask for bigger discounts if they know the margins coming from production or, in general, they might want to inflate their earnings from production to a maximum. Here PLs are used as a “weapon” to gain a significant advantage over producers; supermarket managers know that it is possible to use previous strategies as instruments for other purposes (in the next section we will consider the PL mainly as a marketing idea, but then we will see that it is used for many other incidental goals, sometimes even more effective than the first ones).
• With this new kind of integration, both the chain and the producer marketing strategies must be modified:
o chain stores can try to use the awareness of PLs for improving their own brand awareness, as studied by Vahie & Paswan (2006)43; while advertising PLs they can promote the store brand (and vice versa); discounts and promotions are set according to marketing strategies related to PLs and the erosion of producer earnings can lead to lower prices of NB (in the short run; thus, producers can go bankrupt or, in the long run, can be pushed out of the market. Consequently, retail chains might set oligopoly prices, unless antitrust commissions try to prevent this unpleasant situation);
o due to higher brand awareness and direct PL competition, producers of NB must enforce their marketing strategies while differentiating and instilling in the consumer mind a good perception of their brand (e.g. good value for money or different taste due to patented recipe, etc.).
43 See also Wu, Yeh & Hsiao (2011) for a sort of analysis from the opposite perspective.

19
Without the intervention of antitrust authorities, vertical integrations might lead to an increasing buyer power deriving both from direct competition as producers and from bypassing supplier help in collecting goods for selling. As in the previous case, it is not possible to prohibit vertical integration, which might also be harmful, but it is necessary to monitor and then forbid the abuse of power that may arise from these integrations. In cases of malpractice, what is taken from producers or suppliers is not transferred on to customers; except for a small percentage, the rest is collected by supermarkets. Therefore, contracts that transfer all the revenues from producers to retailers, to the detriment of the former and no savings for consumers, should not be permitted. We are cognizant that vertical integration can sometimes guarantee savings and eliminate the wastefulness of multiple steps, and we are also aware that horizontal mergers might help to exploit economies of scale with all the benefits deriving from them. Moreover, several studies, also carried out by the EU commission for competition 44 , have pointed out that without any intervention by public authorities it is not possible to prevent a worsening of producer and supplier conditions. Therefore, in the long run many small, medium and not-strong-enough firms (producers, suppliers but also less powerful chains) will not be able to operate anymore. In such a scenario, innovation might be carried out with less effort45 but brand diversification will be lower. Moreover, competition will consequently be less vigorous and many other disadvantages will emerge. It is redundant to say that the social welfare, both from the side of small and medium destroyed firms and the final consumers, will suffer greatly and, after a certain point, a diminishing number solutions will be effective. If we do not consider all the perspectives from the four subjects illustrated in the introduction of this proposal jointly we cannot fully understand the hazard we are facing now by underestimating this phenomenon.
1.2.2 Buying Groups
A phenomenon similar to that of the integration is represented by buying groups, as discovered by Dobson et al. (2001) while analysing practical case studies. Some European retailers decided to collaborate towards gaining a
44 Among others, Dobson et al. (2001). 45 As Inderst (2013) wrote, we should consider different cases from which diverse incentives and results might come out.

20
centralised purchase capability46. This option gives them similar benefits to those discussed in terms of horizontal integrations. Buying groups are an increasing phenomenon in the European Retail Market. Furthermore, deeper insight might come from the knowledge of the circumstances that lead some chains and not others to be part of a buying group.
1.2.3 Malpractices
We shall now define the problem of managerial “actions”/ “malpractices” used by supermarkets to gain an advantage called buyer power. Managerial “actions” attempt to increase supermarkets’ power against suppliers. From a certain point of view those actions might force suppliers and manufacturers to accept hard conditions to avoid delisting or other punishments by retailers, hence here we call them “malpractices”. The perspective from which this point is viewed might exert considerable influence on our final consideration. If we consider the viewpoint of a supermarket chain top manager, we can understand how crucial this behaviour is. First of all, it allows for the creation of big chains with huge power. Moreover, it enhances the possibility of survival in a European market with big firms and large buying groups that are able to propose an offering that remains competitive independent from location. Supermarket management must face two problems: being able to have best offerings at the lowest prices (alongside the other aspects that we consumers now expect from a good supermarket – e.g. large variety of products, promotions, different price-level goods, etc.47) and the ability to face the fierce competition of enormous supermarket chains that operate in Europe and sometimes worldwide. These two main tasks must be carried out by maximising the advantage and the highest profit for the supermarket itself. Therefore, the management must exploit all the power they have and, if possible, gain even more power over suppliers, producers and competitors (in terms of market share, brand awareness, geographic presence, etc.). The “exploiting all the power” philosophy brings about, however, a type of
46 In King (2013) a buying group is defined as “a subset of downstream firms that pool their demand for an upstream input to negotiate a better deal with suppliers”. About buying groups see also Chen & Li (2013). 47 In Matamalas & Santandreu Ramos (2009) and Baker (2003) the “marketing mix” (from whose idea we extrapolate our idea of a good supermarket) is “the only way to maximise customer’s satisfaction”. In McCarthy (1960) the 4-Ps are Product, Price, Promotion and Place, that according to Laterborn (1990) should meet the 4-Cs Customer solution, Customer cost, Communication and Convenience.
21
management that is drawn to devising strategies that are not always fully lawful. One might say that some firms act in an unlawful manner on purpose, others might argue that some are forced to follow this approach for the survival of their firms. We will now examine both views in the following sections.
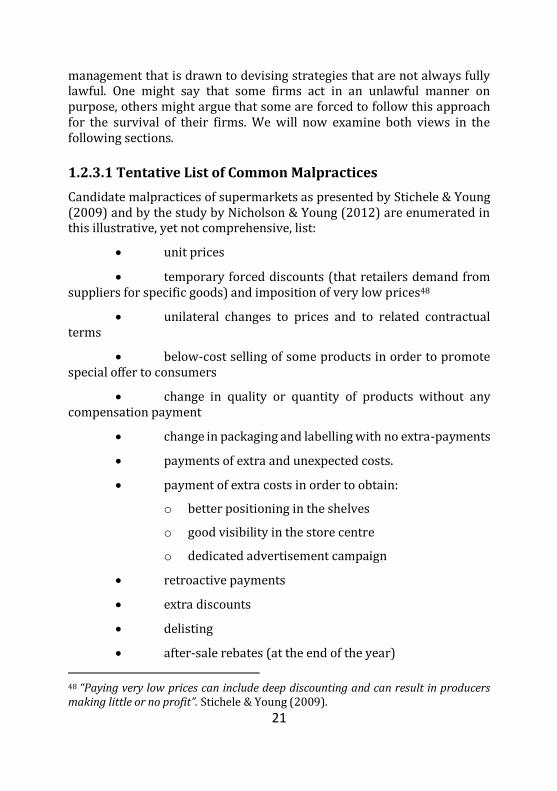
1.2.3.1 Tentative List of Common Malpractices
Candidate malpractices of supermarkets as presented by Stichele & Young (2009) and by the study by Nicholson & Young (2012) are enumerated in this illustrative, yet not comprehensive, list:
• unit prices
• temporary forced discounts (that retailers demand from suppliers for specific goods) and imposition of very low prices48
• unilateral changes to prices and to related contractual terms
• below-cost selling of some products in order to promote special offer to consumers
• change in quality or quantity of products without any compensation payment
• change in packaging and labelling with no extra-payments
• payments of extra and unexpected costs.
• payment of extra costs in order to obtain:
o better positioning in the shelves
o good visibility in the store centre
o dedicated advertisement campaign
• retroactive payments
• extra discounts
• delisting
• after-sale rebates (at the end of the year)
48 “Paying very low prices can include deep discounting and can result in producers making little or no profit”. Stichele & Young (2009).

22
• “minus margins” practices and exclusivity contracts, according to which suppliers of a supermarket are not authorised to sell their products to other retailers at a lower price
• listing fees
• delaying payments
For the sake of clarity and simplicity, we will only go into detail on the latter malpractices, since they have the most relevant, yet hidden, impacts. With delaying payments, supermarkets defer the money transfer long after customers have paid for their store purchases, as stated by Stichele & Young (2009). They may use that money to pay for other things, e.g. interests from the banks. Delayed payments provide extra earning to retailers by enabling them to have a sort of “free credit” for which they do not have to pay any interest. Delaying payments represent a big economic problem in many European countries.
According to Mills (2003), listing fees are paid by suppliers for products available on supermarket shelves. It could be the only way for suppliers to show their products in that supermarket. Without paying this unfair fee, the supplier might not have the possibility to sell its products in that area, because that supermarket is probably the only one with such a wide range of customers for one-stop shopping trips (this aspect will be treated later in this work). Listing fees are often requested at the beginning of the supplier-vendor relationship, and not in later transactions, allowing us to define the fee as a sort of “entry barrier”. Nevertheless, some supermarkets continue charging listing fees indefinitely. Small retailers usually do not receive such payments because they simply do not have the power. Listing fees represent a critical point in the world of retailing. They can determine if a good will be available on the shelves of a supermarket and it means, considering one-stop shopping trip and buying alliances, that a supplier must consider this point carefully before refusing to pay such a fee. Small suppliers are of course the most affected by this problem. However, this is only a brief and general representation of a problem that needs to be considered within a wider framework.

23
1.2.3.2 An Example: Problems Arising for Farmers
In this section, we provide a concrete example to show the consequences of malpractices and the abuse of buyer power by retailers. Among others, one case in the literature caught our attention: according to Davis & Reilly (2010)49, agri-food issues caused by retailers to farmers have, and will have in the future, a great impact in Europe (and in the United States as well50), particularly in those countries in which agriculture has a particularly important tradition. Hence it is of great interest to scrutinise, in synthesis, the problems arising for farmers51 as a result of supermarket buyer power.
Considering fruit and vegetable offerings in supermarkets, one of the problems related to retailer strategies is the lack of choice in terms of horizontal diversification. There are differences in type and quality (e.g. exotic, organic or biological), but there are only few brands for each type of product. Moreover, sometimes it is impossible to find a locally grown food or regional item. Thus, only few firms manage to reach the final consumers. Consequently, farmers are forced to sell their products only to those firms. The agriculture problems related to buyer power in retailing is not a purely European problem; the USA also has several unfair practices against farmers that have been demonstrated, Grimes (2005). Some scholars and experts from Antitrust Institutes and other associations have pointed out that nowadays it has become harder for small suppliers to gain room on big retailers’ shelves because they are unable to cope with a plethora of malpractices such as, for example, slotting allowances, the excessive quantity of goods demanded and other unfair requests. In Europe, many studies 52 have explained that farmers represent the group that is most affected by retailer malpractices. In many European countries, farmers
49 They have already written in 2009, for “the UK Competition Commission’s Groceries Market Investigation”, that “looking at four key UK farming sectors—dairy, red meat, pig meat and fresh fruit— found that a variety of factors have influenced returns for farmers in recent years” and that “if unchecked, the supply chain practices would ultimately cause harm to consumers.” 50 The Farm Foundation published in 2006 a report stating that “continued concentration of large-scale processing, food distribution and retailing [warehouses] may reduce consumer choice in markets. Large retailers will offer a variety of foods”. See also Timmons, Wang & Lass. (2008) for more details about US local capacity and consumption. 51 See Buccirossi, Marette & Schiavina (2002). 52 Among others, see Dobson (2003), Busch & Bain (2004); also, the European Commission in 1999 commissioned a report to Dobson Consulting in which effects of buyer power for farmers were considered alarming: Dobson et al. (2001).

24
have organised public protests on the low amount paid for their products by retailers. Thus, a deeper and comprehensive discernment of this issue is required. Moreover, a shared and fair solution to these relationships must be attained.
1.3 Private Labels and Their Effects
Some authors consider the development of supermarkets and the introduction of new strategies as considerable value added for the whole market. In this section, we focus our attention on the Private Label and, starting from them, we debate all of the relevant features that go in favour of supermarket chains.
First, we introduce the PL in general, moving from an analysis of the main aspects linked to their introduction and development to an emphasis on the key factors and main strategies. Second, we compile a succinct history of the PL. Then we briefly review the literature about Italian market and recent years. Finally, we show some opportunities.
1.3.1 The Private Label: Origin and Definition
There are plenty of papers dealing with PLs from a managerial and marketing point of view 53 . First of all, we want to stress an important concept: PLs embody a brilliant innovation. At the beginning of 20th century, market brands were not well known: shopping was done at neighbourhood grocery markets. Later, with changes in the retail sectors and with the birth of retail chains, some retail brands started to be noticed by customers: our idea is that they were the first kind of supermarkets54. At first, no-brand products, mainly sold unpackaged, started to be sold using the retailer’s name: they were the first private labels. However, this phenomenon did not reach true importance until the final years of 20th century55. During the 90s, PLs were mainly first price products, introduced to offer convenient goods among mass products. Customers did not consider them good quality commodities. Managers subsequently came to
53 Among others: Ailawadi et al. (2008), Matamalas & Santandreu Ramos (2009), Bridson, Evans, Mavondo & Minkiewicz (2013), Zippel, Wilkinson & Vogler (2013), Ter Braak, Deleersnyder, Geyskens & Dekimpe (2013). 54 A&P was, again, the firm who started the production of “many of their own products, specialising in what would later be known as store brands and private labels”; Ellickson (2011). 55 For a deeper analysis see Ceccacci (2013).

25
understand the potential of PLs and started to differentiate their positioning: first price PL goods and mass-market PL products. Chains wanted their products to be considered a good value for money and able to compete with the most well-known ones. The offering included mainly common goods, those that were most frequently found among goods sold at supermarkets. Also, advertising campaigns started to be more effective and oriented towards making the customer aware of quality and value of PLs. Nowadays supermarket, as a result of the systematic adoption of marketing skills, have introduced many different kinds of PLs (Kumar & Steenkamp, 2007, and Bontemps et al., 2008), including:
• First price • Mass market (standard) • Premium price • Bio • Vegetarian • Ready to eat • Kids products
and many others. Now PLs can easily compete with the NB both in terms of strategic positioning and brand awareness. Advertising has shifted from promoting discounts to presenting PLs and showing all of their characteristics.
Market researchers have demonstrated how well customers perceive PLs56; they are considered a good value for money, good quality products and moreover many chains try to promote the good values linked to their own brand. Quite often PLs are considered as good as NBs but at a lower price. Do customers think that the difference between a PL price and a NB price is only due to a mere increase as a result of being branded? It might be the case, since sometimes retailer advertising aims to communicate just this. This logic is enforced by the fact that often the goods are produced in exactly the same factory but then are sold both under the retailer’s brand and under the NB. Here the aim of the marketing is overtaken by managerial strategies: it is a great opportunity for supermarkets to exploit PLs for purposes that are less linked to marketing.
56 In the report of ACNielsen (2006) Private label is considered “a ‘good alternative’ to other brands” with “the same quality & value”. Other studies lead, more or less, to the same result: Symphony IRI Group (2011) and Symphony IRI Group (2012).

26
PL advertising is efficient in increasing brand awareness of the chain and in showing its worth in terms of quality, convenience and values, too. But at the same time, it is used to gain an advantage towards NBs and therefore towards producers. Special promotions are set to decrease the selling of NBs: by selling PLs retailers have higher margins, as also stated in Richardson, Jain & Dick (1996), and the market share of NBs could be diminished, together with their positive perception. There are dedicated campaigns for PLs for fidelity card owners57: these create a relationship between regular customers and PL goods, and after a while they might start to prefer PLs to NBs. Also, shelf positioning has become a vehicle that has to the advantage of PL sales to the detriment of NB products. Well-known NBs were usually positioned at eye level, so that consumers could easily see them. Although producers were occasionally asked to pay a fee for this service, it ensured that they were able to secure the best product placement inside the store. Nowadays, some shelves are entirely dedicated to PLs, especially eye-level shelves and particularly when there are dedicated promotions. It is hard to consider those campaigns as purely envisioned with marketing in mind. Naturally, they strongly contribute to enhancing PL sales. We think, however, that the driving factor behind advertising is to improve retailer bargaining power. This power is exerted over both independent producers and PL manufacturers. Sometimes these two kinds of firms coincide. Retailers might request specific changes to be made to a given PL’s characteristics; while all changes are costly for the manufacturer, the supermarket rarely agrees to pay a bigger amount than the one originally agreed upon. The producers are reluctant to make changes because if the retailer breaches the contract he cannot recoup the expenses later. There are several other practices (or malpractices) used by chains when dealing with manufacturers. However the factors just illustrated are truly the fundamental ones in terms of understanding how critical the situation is. In Italy, for example, many producers are small or medium firms and are therefore even less powerful; in some instances their entire production is sold to a retailer as a PL. The bargaining power of retail chains is enormous and there is no regulation preventing them from abusing it. The most common effect is the setting of incredibly low prices paid by retailers resulting in very low earnings for manufacturers, who then face the very stark risk of going bankrupt, virtually eliminating any chance of
57According to Baltas (1997) “a loyalty-card holder gets money-off coupons toward private label products”.

27
R&D investment58. It is no coincidence that Olson (2012) finds many PLs to be too similar to well-known NBs.
The resulting awareness might allow retailers to provide non-core services to customers, especially by means of fidelity programs. Fidelity programs create an illusion of proximity between the customer and the retailer, giving the latter the possibility to count on strong customer confidence59.
Before analysing other positive aspects more in detail, we now list some of the generally positive aspects of PL production:
• When manufacturers and retailers collaborate some synergies 60 can be exploited (as in the case of vertical integration). Each party can use its own knowhow for improving the knowledge of the other. Since retailers usually have higher power, it is advantageous for producers to keep something “secret” so that the retailer always needs their knowledge for reaching good quality PLs.
• When companies can direct their unused production potential towards making more goods to sell under the retailer’s brand (signing a specific contract for this), as suggested by Plotnikov, Ponosova & V'jyugova (2013). This can occur when the product is identical but marketed as both a PL and a NB. By doing this the manufacturer earnings indeed increase, but with this careful attention must be paid to potential hidden retailer strategies.
• PL production gives small firms the chance to reach many different markets that would not be achievable otherwise, especially if they are too small and their brand is unknown (Timmor, 2007).
Finally, it is helpful to emphasise another general feature: some important and well-known brands or products are considered so fundamental that must be part of a supermarket’s offering regardless. For instance, Nutella and Coca-Cola must be present in almost any European store (if we do not consider hard-discount stores or similar). With these brands retailers have less chance to exploit their power, but for a reason precisely contrary to the
58 Inderst (2013) proposes different scenarios about innovation related to PLs. 59 See marketing research carried out by “AC Nielsen” or “Symphony IRI Group”, e.g. ACNielsen (2006) or Symphony IRI Group (2011) and (2012). 60 An interesting study about cooperation is Zippel, Wilkinson & Vogler (2013).

28
previous one: the supermarket needs to have them, even if it means giving them better treatment.
1.3.2 Private Label Exploitation and Philosophy
Brazauskaitė et al. (2015) state that precisely identifying the key factor behind the success of a PL is very hard, considering that the PL’s success can be traced back to its inception as a “value for money” opportunity. As previously illustrated, PLs augment brand awareness, store loyalty and contribute heavily towards the increase of market share and profits, being profitable for consumers, too.
PLs provide, according to many scholars, bargaining power to retailers when negotiating the supply of NBs. This happens in several ways.
In Meza & Sudhir’s (2010) investigation, the authors focus their attention on PLs increase of retailer bargaining power. They state that analysing the literature regarding the factors facilitating PL success, it is possible to identify three sets of factors: demand characteristics, costs and benefits of PLs and competitive conditions of the category. The first deals with consumer demographics and preferences, the second concerns, among others, lower quality and lower prices in comparison to NBs (however, this is not true according to several other scholars, among others: Sachon & Martinez-de-Albeniz, 2009) and the third regards several components like number of competitors, level of advertising and others.
With respect to the first factor, it seems unclear, analysing the relevant literature, who the typical PL buyer is exactly. Some state that education influences the choice, claiming less educated people are more prone to buy PLs, while others claim exactly the opposite. Furthermore, looking to difference characteristics does not simplify the definition of this figure. The only aspect that seems to unite all PL purchasers is price sensitivity (Ailawadi & Harlam, 2002). According to Whelan and Davies (2006), ambition and sociability are determinant factors when choosing NBs, due to mechanisms linked to social affiliation.
If we consider costs and benefits of PLs it is important to consider, among others, margins, prices and value for money.
Supermarkets enjoy, obviously, higher margins for PLs with respect to NBs (Ailawadi & Harlam, 2002). In another study carried out in 2004, Ailawadi & Harlam also noticed that high PL share allows retailers to increase margins for NBs as well. This, according to Pauwels & Srinivasan (2004),

29
means that retailers gain bargaining power with respect to NB producers. On the other hand, consumers do not directly benefit from NB price decrease, but only from the lower prices of second-tier brand products. However, providing “value for money” PLs is no longer the main task for retailers, who are instead increasing investments in order to be able to offer consumers higher quality products in aesthetically pleasing packaging specifically designed for precise categories. Nevertheless, despite an increasing market share, NBs are still preferred, possibly due to their perceived higher quality (Ailawadi & Harlam, 2002). This might also be the reason why retailers occasionally adopt a copycat strategy (e.g. for packaging, Olson, 2012), trying to reach and exceed the share of NBs, which is considered to be a benchmark.
Nevertheless, PLs also allow retailers to offer niche products that fill a gap left by a NB (Sachon & Martinez-de-Albeniz, 2009).
Doyle & Murgatroyd (2011) emphasise this concept by stating, thanks to a UK Competition Commission inquiry, that retailers usually introduce PL in the categories where price competition, innovation and assortment have a lower degree.
According to Sachon & Martinez-de-Albeniz (2009), PLs have a lower cost structure. Furthermore, the role of PLs is also to help in augmenting store image and loyalty (Ailawadi & Harlam 2004).
Supermarkets might also use shelf positioning as an advertising lever: by placing PLs in the prime spots, it can be assured that their merchandising is adequate. By positioning PLs next to NBs, retailers implicitly invite the consumers to compare the two products. Furthermore, they give PLs more credibility, increasing the possibility that they will be purchased. It is no coincidence that the price difference between PLs and NBs, which might range from 15 to 40 percent, is mainly due to marketing expenses and R&D investments (Ailawadi & Harlam, 2002).
This last point is strictly connected to the third set of factors individuated by Meza & Sudhir (2010): competitive conditions of the category. Competition between PLs and NBs is very high, even though some authors, among them Kumar & Steenkamp (2007), debate that they have different tactics for branding, labelling, advertising, pricing and many other marketing mix strategies. Nevertheless, retailers often suggest comparing their products with branded ones (Olson, 2012). This should fill the NB marketing expenses gap and perhaps inspire a better perception of PLs as not just mere copies of the NB versions. On the other hand, a number of

30
scholars (Morton & Zettelmeyer, 2004, and Aribarg et al., 2014) suggest that some PLs heavily imitate NB products.
1.3.3 Focus: Supermarkets and Private Labels in Italy
The origins of Italian supermarkets may be found, as for many other countries, in the development of North American and British retail companies in the 20th century. A&P, Great Atlantic and Pacific Tea and Saynsbury’s were the first to introduce the “chain restore revolution”, while Michael Cullen opened, in August 1930, the first supermarket with all the typical characteristics still present today (Caprotti, 2014).
In Italy there were three important cornerstones that affected supermarket development (Caprotti, 2014):
• 1938: the so-called “one-price-warehouse” law. Supermarkets were only allowed to sell goods that were already packaged and priced
• 1971 (n° 426/1971): small deregulation of the previous one. No more pre-packaged and pre-priced products only. Larger warehouses, up to 1,500 square meters, with delicatessen and fruit and vegetables aisles.
• 1998 (“legge Bersani”: deregulation in size) and other recent minor laws: 1969, liberalisation of tobacco; 1975, liberalisation of perishable goods purchase; 1982, deregulation of opening hours and 2006, liberalisation of fresh bread selling.
Substantial differences can be noted between Italian regions (Eales, 2014). PL sales revenues are concentrated mostly, 60%, in northern Italy, where the main chains (e.g. Coop, Esselunga and Conad) operate. In southern Italy, on the other hand, there are plenty of small retailers and they can invest much less in their own brand awareness and PL development.
According to an IRI special report (Eales, 2014), after a good positive trend, PLs in Italy has faced a period of crisis in conjunction with the strong promotional activity carried out by the food industry. This comes alongside a generalised PL crisis throughout Europe. Although France was the first country to face this matter, as of 2014, Italy, Spain and the Netherlands are experiencing the same problems. Together with NB promotion, PL maturity and a focus on quality contributed to decreasing the PL share. Promotion of NBs is concentrated in those categories in which penetration of PLs is
31
higher (e.g. frozen and fresh and chilled food), underlining how NBs are trying to counterattack the increasing importance of PLs. On the contrary, supermarkets reply with an assault on the former hegemony of NBs with respect to premium and niche categories. Consequently, differences between NB and PL prices are decreasing, with prices of PL growing and NBs reducing, thanks to promotions. In Italy PL has the highest price index, but the lowest unit share among European Countries.
Eales (2014) states that recently, in Italy, consumers have become more sensitive towards money-for-value and promotions of private labels. Nevertheless, there was no significant change in private label value or unit share.
1.4 Buyer Power and PL Problems
Buyer power as a problem has been studied since the final years of the 20th century61. In the initial studies, in terms of cases in which there is a strong buyer and lots of suppliers, bargaining power was considered to be the problem.
It is now considered limiting to keep considering this issue as a phenomenon separately related only to economic, managerial or law fields.
According to Cuneo et al. (2012), the high retail concentration, limited number of brands and poor category depth, have all contributed to increasing PL power in Europe.
1.4.1 Problems Deriving from Private Labels
In the section in which vertical and horizontal mergers are examined, we shed the light on the double role played by retailers as both distributors and the direct competitors of producers. Bell et al. (1997) define the retailer as “a double agent”.
Retail chains have the power, among others, to act as a gatekeeper against supplier products (Grimes, 2005). Dobson & Chakraborty (2015) define the relationship between retailers and producers as a “mixed vertical-
61 Some of them were not exactly focused on the same themes as today, like Knox & White (1991) or Monopolies and Mergers Commission (1981); others approximately deal with the same topics, e.g. (from national or international commissions) OECD (1981) and Office of Fair Trading (1985).

32
horizontal” thanks to the presence of PLs and its implications in affecting competition. They state, as we also pointed out in previous sections, that the presence of PL goods allows retailers to be horizontal (direct) competitors of suppliers, while they can still compete in a vertical, more “classical”, sense.
Kim & Parker (1999) conducted a study on collusive conduct in PL markets. They discovered, through an analysis of some product categories, that retailer strategies might lead to collusive price settings both for NBs and PLs. However, retailers will always tend to adopt a strategy that will maximise their own profits (and then prices and quality), regardless of any other consideration (Dobson & Chakraborty, 2015) that might involve producer problems or societal benefits.
One undesirable outcome stemming from the introduction of PLs and the excessive use of power by retailers is the decrease in the incentives for R&D investments by manufacturers. This is the case, as described by Doyle & Murgatroyd (2011), of decreases in producer profits that lead to the reduction of costs and therefore to cutting those that do not provide a short-term recoup of investments. However, they underlined that such undesirable situation only occurs in some circumstances.
1.4.2 The Competition Authorities’ Approach to PL and Buyer Power Problems
Starting from the first antitrust law promulgated in the USA during the thirties, the Robinson-Patman Act62, a robust body of literature has been produced. Nevertheless, the existing rules are still not fully adequate. Some antitrust laws were introduced in Europe at the end of the 20th century63. There has been much debate on this theme at international, national and regional levels. Governments and international institutions are now more aware of the implications that a worsening of this situation could lead to. We can start from a simple reasoning: nowadays even the largest retailers face competition from other big or new companies. The negative effects of buyer power might emerge when the number of retailers and, subsequently, competition decreases.
62 Presented as a milestone in Gallagher (1936); discussed more in detail in Elman (1966). 63 As written by Dobson et al. (2001) the first remarkable debates are Vogel (1998) and Ratliff (1998) while “a comprehensive review” is in OECD (1998).

33
Some scholars believe that retailers are strategically reducing prices in order to lower competition in the long run. The underlying idea is that they will be able to set prices much higher than in a competitive market in the future.
With this premise, it seems that existing policies are still unable to find the right way to hinder increasing buyer power malpractices. Of course, it is not necessarily easy to grasp the importance and the essence of the problem with its implications in its entirety; extensive knowledge of buyer power and related issues is needed.
The UK Competition Commission was the first64 in Europe to study in depth the retail market since the major UK chains began exerting a considerable power over suppliers and producers, aiming to control both the upstream and the downstream markets. The first studies carried out by the UK Competition Commission started around the last two decades of the 20th century, and many others have followed focusing on specific issues that have arisen in the meanwhile. Indeed, the UK is one of the first countries in which supermarket buyer power has started to gain considerable importance, although it is not the only one; other European countries face a similar context, and in some of them the problem has already reached such a level of maturity65 that specific studies are needed. Unfortunately, only few of those countries have started to plan dedicated studies devoted to better understanding the present situation and to finding a solution to marginalise this power. Due to this deficiency of national authorities, the European Commission for Competition started to ask scholars to conduct research in this area in the final decades of the 20th century.
As written in the introduction of this thesis, it is not realistic to assign the same degree of maturity to all the European countries, and in fact it would be hard to identify even only two or three sets with common characteristics. This is primarily due the fact that each country has its own peculiarities, although the different market penetration of big firms certainly also plays a role.
Germany, France - and for some features also Belgium and The Netherlands - are among those countries that are facing serious problems that stem from oligopolies and supermarket buyer power. The first two countries are
64 Before we considered two pioneering works: Monopolies and Mergers Commission (1981) and Office of Fair Trading (1985). 65 In Stichele & Young (2009) were already presented some early discussions and problems in many different European Countries.

34
home to many big retailing companies that are leaders in Europe and even around the world (e.g. Carrefour66). For this reason, they can count on greater power thanks to their size, which is at times made even greater by malpractice. Other countries have not yet experienced the consequences of buyer power, perhaps due to peculiar characteristics of their domestic market or the absence of big companies. We think that those countries, especially the biggest ones, will have to deal with this phenomenon soon considering in particular the enlargement of national firms and the rising of other big foreign (yet still European) companies. Moreover, the growing importance of Buying Groups operating throughout Europe is accelerating this process. In terms of retail market maturation, Italy is among the least developed countries67. We would like to focus our attention on this specific and very peculiar market, in which the characteristics of Italian firms and the behaviour of consumers play a determinant role in defining the environment and the future of the market.
As discussed above, we suggest analysing the present varied situation as a picture of buyer power evolution in Europe over the last twenty years. After the brief summary of the (USA and) UK case(s), we then present an example of Buyer power in the Italian retail industry. USA and UK competition policies on buyer power are considered quite advanced, both in terms of the development of supermarket power and the antitrust studies carried out on this phenomenon. Whereas in Italy, on the other hand, the whole phenomenon is still at the first stage. The example of the Italian Competition Authority, even if different and delayed from the ones of UK commission, represents an opportunity to understand the effect of European and British studies and, at the same time, contributes to provide a view from a different country.
Moreover, the current UK situation might provide a preview, with the due differences, of what the Italian market could be in few years. Therefore, the different approach, and the different timing, will represent a significant opportunity to analyse the different results and effects.
The Italian Antitrust Authority (Autorità Garante della Concorrenza e del Mercato) has the great opportunity to learn from other countries’
66 See Hurt (2002) for a history of the firm and Colla & Dupuis (2002) for a (global) comparison with Walmart (the other huge and well-known retailing company worldwide). 67 This aspect can be inferred from the survey carried out by the Italian Competition Authority: Agcm-Autorità garante della concorrenza e del mercato (2013).

35
experiences (e.g. UK) to solve the negative effects that result from supermarket malpractices. The current Italian retail market is very peculiar when compared to other European ones. Like in other sectors of the economy, the Italian retail market historically consists of plenty of small and medium firms. Moreover, the biggest retailing companies have a preeminent presence only in some regions, while they do not exist in other parts of Italy. Finally, the biggest Italian supermarket chain is a cooperative company 68 and many other important players have the same type of business organization. Therefore, some differences with the UK’s market emerge even after just an approximate inquiry. However, we believe that the general procedures and solutions proposed by the UK competition commission can be taken as a primary guideline for an analysis of the Italian situation as well. Indeed, the most common malpractices seen in UK more than ten years ago are now also adopted by Italian supermarkets.
As stated in the previous sections, the use of PLs has become massive in UK supermarkets, as well as in other European and American markets. It is obviously also present in Italian stores, and its importance is continuously increasing69.
In the example found the following section, we illustrate all the problems linked with the exploitation of buyer power that derives from the use of PLs. The Italian Competition Authority mentions, in its statement, several malpractices and problems we discussed in the previous sections. This sheds light on the impacts of those problems in producer-retailer relationships and the possible consequences for the whole industry and, moreover, for final consumers.
We must always remember, however, that even if some circumstances have led to negative outcomes, the utilisation of PLs, as described further in this chapter, is not per se a negative practice; PLs have also brought about significant positive impacts both in the upstream and downstream market.
68 According to Deloitte (2014), a survey of Global Powers of Retailing, the leader retailing firm in Italy is “Coop Italia”, followed by “Conad” and “Esselunga”: the first two are cooperative companies. 69 See, among others: Nielsen (2005) and other reports by IRI and Nielsen through the years.

36
1.4.3 An Example of Buyer Power Deriving from PLs
On December 22, 2015, the Italian Competition Authority (Agcm - Autorità Garante della Concorrenza e del Mercato) stated that Coop Italia S.c.a.r.l. (Coop Italia) and Centrale Adriatica S.c.a.r.l. (Centrale Adriatica) were charged with the offence provided for in Art. 62 Paragraph 1 and Paragraph 2 letters a) and e) of Decree Law no. 1/201270 and Art. 2 Implementation Decree71. This represents the first case in which the Agcm took measures against the abuse of a dominant position72.
First of all, we must define the players and the facts. There are three players: two from supermarket side and one supplier. Coop Italia (with a turnover of 256€ billion in 2014) is a consortium that includes retail cooperatives, limited liability consortiums and companies; nine of them have relevant dimension and one, Coop Adriatica, is directly involved. Centrale Adriatica is a consortium of cooperatives itself with a turnover of about 2.6€ billion in 2014.
Coop Italia has the role of coordinating the main retail operations of the group:
• Find and select the main suppliers • Manage the supply of private label products • Centralised management of private label products (COOP)
sold in any associated cooperative
Coop Adriatica is the operation centre for sales and marketing on behalf of all the cooperatives of the consortium. Coop Adriatica buys substantial amounts of goods for all its associates, also managing warehouses, depots and laboratories.
70Art. 62, Decree Law 24 January 2012, n. 1, about “Disposizioni urgenti per la concorrenza, lo sviluppo delle infrastrutture e la competitività”, turned, with modification, into law 24 March 2012 n. 27. 71 Decree 19 October 2012, n. 199, by the Ministry of Agricultural, Food and Forestry Policies (Ministero delle Politiche Agricole Alimentari e Forestali): Implementing Regulation of Art. 62, Decree Law 24 January 2012, n. 1, about “Disposizioni urgenti per la concorrenza, lo sviluppo delle infrastrutture e la competitività”, turned, with modification, into law 24 March 2012 n. 27. 72 Bollettino N.49 del 18 Gennaio 2016. AL14 - COOP ITALIA-CENTRALE ADRIATICA/CONDIZIONI CONTRATTUALI CON FORNITORI. Provvedimento n. 25797 (Italian Competition Authority, Bulletin N49).

37
In order to become a supplier for Coop Italia, every firm must accept the regulatory agreement. This first step is compulsory if the vendor is also a private label producer; as previously mentioned, Coop Italia is the only one in charge of PL issues for any company within the Coop system. Therefore, Coop carries out a centralised bargaining, which does not end with the regulatory agreement, but rather many other contracts, both with Coop Italia and with its subsidiaries. Some of them are specific and serve to define particular issues, such as provisions and technical documents.
Business conditions are defined in annual contracts, called “Nostre furniture a Vostre associate” (that means: Our supplies to your partners). Those contracts are formally proposed by the supplier, but are defined by Coop Italia. In the agreement “Nostre furniture a Vostre associate” there is a very detailed list of discounts and payments required from the supplier in favour of Coop.
More importantly, the above contracts do not specify or guarantee any amount and do not indicate any price. Furthermore, nothing is written about the renewal, which is not mandatory. In other words, a supplier has no other choice than signing these agreements with Coop Italia to activate a relationship with the Coop system, but this does not imply that Coop partners will do business with him. If they do, then the agreed conditions will apply.
If a firm also provides private label products, there is a “capitolato di fornitura” (technical document of supply) which constitutes an integral part of the regulatory agreement. In this contract, everything about product characteristics, standards, specifications, management of production process and quality controls are defined, in addition to much more information concerning the whole supply chain. Fees apply if regulations, or secrecy, are violated.
On top of this, decentralised agreements might be added to the previous contracts. This would lead to additional discounts or benefits favourable to Coop partners.
According to the Italian Competition Authority’s bulletin N49, contractual clauses written in “Nostre furniture a Vostre associate”, were not subject to bargaining between Celox 73 and Coop. Moreover additional “extra-
73 Celox (Celox Trade S.r.l.) is a pear wholesaler operating in central Italy. Between the years of 1998 and 2014, Celox was the pear supplier for Coop Adriatica. Celox provided to Coop Adriatica, under NB and PL brands, both domestic and foreign

38
contractual” discounts were discussed by Coop Italia together with Coop Adriatica and then only communicated to Celox. Here are some examples of discounts and payments:
• Logistical discounts (e.g. less than 1% for orders between 5 and 20 pallets, 1-5% for orders over 20 pallets during the years 2012, 2013 and 2014. These are justified by the fact that supplier can amortise expenses selling higher amounts of goods)
• Other unconditional discounts shown in the invoice (5-10% for years 2012 and 2013)
• “end of period unconditional discounts” not in the invoice, but solicited with a credit note emitted at the end of the quarter (5-10% year 2012 and 1-5% year 2013)
• Fee for “co-marketing” expenses • “Compenso Centrale ortofrutta Coop Italia”, general three-
monthly payments for Coop Italia (less than 1%) • Fee for analysis expenses (0-2000€ per year) • Additional discounts (e.g. for members of the cooperative,
weekly “flyer discounts”) planned any three of four months74
In November 2012 pear suppliers, Celox included, asked Coop Italia to reduce discounts as the situation was no longer financially sustainable (“la situazione in cui stiamo operando non è sostenibile”)75.
Prices were established by Coop and then communicated to Celox using a sales catalogue, with frequent, weekly or even daily, updates.
There is one crucial aspect reported in the bulletin: neither Coop Italia nor Coop Adriatica committed to buy a definite quantity of products. This is
pears. Celox had a turnover of about 5 million euros in 2013 and 2 million euros in 2014. 74 Celox pointed out that during the years considered by Agcm, unwanted (by Celox) additional discounts reached 82,000€ with discounts between 10-15% and 20-25%. Overall, also considering the ones agreed at a national level with Coop Italia (which applied anyway), there were discounts of about 30-35% of the value written in the sales catalogue. (Attachment to the Italian Competition Authority’s bulletin N49: n86 document 1.1). 75 Attachment to the Italian Competition Authority’s bulletin N49: n13 document 1.36.

39
explicitly written in some attachments 76 regarding messages from Coop Italia to Celox in June and November 2014: Coop reminds that commitments to purchase certain quantities were never made (“ricorda innanzitutto che non sono mai stati presi impegni circa le quantità da ordinare”) and contractual clauses about prices did not state any obligation towards the quantities supplied (“la conclusione degli accordi contrattuali sui prezzi non prevedevano alcun impegno circa le quantità oggetto della fornitura”). With these messages Coop sought to underline, once more, that Celox’s complaints about the cease of orders were unfounded because of specific contractual clauses.
Even though the period taken into consideration by the Italian Competition Authority starts in October 2012, the partnership between Coop and Celox started in 1998 (23rd February 1998). Since then, yearly contracts had been always renewed until the decision at the heart of contention. Celox had to supply different qualities of pears, both with and without the Coop private label. Therefore, Celox had to stipulate many supply and sub-supply multi-year contracts. 72% of Celox turnover in 2012, 56% in 2013, can be attributed to Coop. Additionally, Coop was the only customer operating in the large-scale retail trade and the only one buying products processed in its factories. The percentage of PL pears sold in Coop supermarkets between 2008 and 2013 is unclear: Celox says it was between 48% and 55%, while Coop Italia and Centrale Adriatica assert it was about 20% of the total sales volume of pears at Coop77. While Celox was a significant pear supplier for Coop, on the other hand Coop was aware that Celox was extremely dependent on Coop Italia (Celox is expressly defined as “Coop-dependent” in a document found in Coop Adriatica headquarters78).
Since the beginning of 2014, orders from Coop to Celox drastically declined. This follows Celox’s refusal to endorse some changes in the supply contract (“lettera di ricognizione di contratto di fornitura”)79. Coop meditated one these contractual changes by trying to specifically circumvent Art. 62 Decree Law no. 1/2012. Celox refused to sign the contract presuming it was
76 Attachments to the Italian Competition Authority’s bulletin N49: n89, n90, n91 and n 94 document 1.1; n3 and n9 document 1.15. 77 Attachments to the Italian Competition Authority’s bulletin N49: documents 1.37, 2.50 and 2.51. 78 Attachments to the Italian Competition Authority’s bulletin N49: n88, n90 and n92 document 1.1; n2, n4, n5, n7 and n11 (filename 5) document 1.5; n6 (filename 31) document 1.7. 79 Italian Competition Authority’s bulletin N49.

40
a method for declaring the existing and previous provisions the result of a fair bargain. Coop did not send any notice or rationale and this, in accordance with the bulletin 80 , prevented Celox from reorganising its supply. Therefore, without any possibility to find a substitute in the short term, Celox terminated its pear business.
Coop appealed the Agcm’s decision because it considered the sentence passed by Antitrust Authority illegitimate. Coop’s dispute (according to them) mainly regarded severe imperfections in the pre-trial phase and the insufficient consideration by the defence of their openness and good faith during trade relationships 81 . These are the main reasons according to which Coop would like the judgment to be revisited, but there still has been no further news from the court or from either one of the parties. Many judgments might still be issued before a final sentence can be written.
This case represents a noteworthy precedent. It was the first time in Italy that a dispute arose between a supplier and a retailer for abuse of buyer power. This not only serves as a guide for upcoming cases, but also indicates a new procedure for delving into this issue.
1.4.4 Help Coming from Research Studies of Trade Associations
As seen when considering problems arising for farmers, crucial assistance might come from studies ordered by specific associations that want to illustrate, for the benefit of their members, the consequences of malpractices. Despite being focused on particular cases, general notions and basic concepts expressed in those studies enrich the research under some new aspects. Sometimes those studies are useful for better understanding the difference between management and marketing that we described in the introduction: they reveal the direct effects of managerial decisions on suppliers or producers. When saying, for example, that “temporary forced discounts” might push small firms out of the market, a connection between a strategic two-task-decision (providing goods to customers at lower prices for a certain period and having at the same time
80 Italian Competition Authority’s bulletin N49. 81 Source: https://www.e-coop.it/documents/10180/40034451/Coop+su+Provvedimento+Antitrust+-19+gennaio+2016/69c481b4-66ed-4da9-8848-56c18466ad2d

41
the side effect of weakening the power of the supplier) and its side effect is clearly demonstrated.
1.5 Private Label Opportunities and Strategies
According to Eales (2014), there are several opportunities to benefit from PL adoption and development.
First, manufacturers and retailers cooperate on a joint business plan. Together they will identify: prices, shelf positioning, promotions and assortment optimisation. This will tend to influence shopper decisions and growth of identified categories.
Second, for retailers a strong brand loyalty is crucial to create a link with consumers. Ailawadi & Harlam (2004), among others82, underline that PLs help in augmenting store image and increasing store loyalty.
Then, a valuable role is played by those Key Performance Indicators (KPIs) that measure price gaps and share trends. Consequently, if correlated with an analysis of shopper behaviour, manufacturers and retailers will have a clear idea of the category itself and its future trends.
Finally, data collection, also via fidelity programs, (e.g. on sales and promotions, in addition to holidays and weather) helps in forecasting stocks, avoiding goods scarcity or oversupply.
Consumers benefit from the presence of PLs through increased product assortment and more intense promotional activity, hence from consequent lower prices in two out of four categories (Pauwels & Srinivasan, 2004). Dobson & Chakraborty (2015) agree on the advantages for consumers deriving from the additional presence of products (i.e. introduction of PLs that do not replace existing brands) and the possible augmented producer competition. Moreover, they also state that PL introduction might enhance quality and lead to lower prices. Steiner (2004) affirms that social welfare is, generally, maximised by the competition between NBs and PLs. Inter-brand competition among competitor retailers can also increase non-price competition (Doyle & Murgatroyd, 2011), for example by boosting the contest over quality between PLs of the same category (i.e. competition on quality between products of the same category but with competitor Private Label brands).
82 Meza & Sudhir (2010), Sudhir & Talukdar (2004).

42
According to Dawar & Stornelli (2013), the main retailer strategy is to increase earnings using PLs, thanks to their higher margins and through a differentiation from other retail chains. The authors also provide some hints on how manufacturers and retailers should act to fulfil this goal. Producers should cooperate with retailers (e.g. scheduling promotions such that NBs and PLs do not compete during the same period) and assist them, without damaging their own core brands. A smart solution for producers is also to introduce PLs into a category where they (i.e. producers) have no products. However, when NBs and PLs that are both produced by the same manufacturer are present, they both can benefit from cobranding (Dawar & Stornelli, 2013). Mutual benefits might also come, according to the authors, from the sharing of information. For example, manufacturers can receive inside knowledge on categories.
The European Union itself sometimes recognises the positive outcomes of a PL presence in boosting innovation, like in the case of baby bottle warmers (Philips/Avent case) (Doyle & Murgatroyd, 2011). With the increased quality perception of PLs (Nielsen, 2014) and the introduction of premium PLs83 the maintenance of quality and innovation becomes crucial (Dawar & Stornelli, 2013).
Another strategy that helps retailers to increase PL market penetration and, at the same time, has a positive benefit for producers as well, is ingredient branding (Vaidyanathan & Aggarwal 2000). Moreover, consumer perception will be improved as a result of NB ingredients in the given PL, especially if the latter is an unfamiliar product (the PL package should therefore clearly point out the branded ingredient). Ingredient branding is especially valuable (and represents a key factor) when introducing niche products (i.e. ethnic, organic, fair or environmental friendly), as indicated by Dawar & Stornelli (2013).
1.6 PL Final Remarks
A comprehensive study of retailer strategies, in which we scrutinised both direct, indirect and “hidden” aspects, led us to the hypothesis that they have more complex implications than proximate ones. We hypothesise that retailers frame and employ strategies that have multiple objectives. Frequently, relaters formulate strategies intended to increase their buyer power when dealing with suppliers and producers (i.e. the “upstream
83 See, among others, Geyskens (2010).
43
market”), rather than with the “downstream market”. This is true also for those strategies apparently addressed to final consumers. We hypothesise that, many times, among the different goals of an individual strategy, some aim to influence consumer behaviour and brand awareness, while others target competitors, suppliers and manufacturers.
In conclusion, one question remains to be asked: should we gauge Private Labels as assets or liabilities for the whole market?
This is indeed a challenging question. It would be helpful and interesting to analyse the issue further, never losing a comprehensive vision. Any attempt to answer this question will undoubtedly result in heated debate. Our first conclusions however lead to a perspective-driven answer. Circumscribed studies conducted with diverse focuses generate distinct results.
From the consumer side, including a new label (i.e. PL) in a selection that already offers identical products, in terms of quality and characteristics, constitutes an immediate advantage. Particularly, when buying commodities, currently consumers certainly prefer the lowest price possible. Moreover, each consumer, being only an extremely small buyer, cannot affect the market with only her or his purchasing choices. As a single player, she/he has no power. Furthermore, a coordination between all consumers to influence the market is not achievable. This customer preference occurs and generates positive outcomes in the short term. Whereas in the long run, the abovementioned asset might turn into a negative issue. Consider a possible scenario in which the product offering is purposely reduced in order to create a price war. Henceforth, prices rise due to low competition and the label (i.e. PL) that formerly provided benefits becomes detrimental. In this hypothetical scenario, lack of innovation contributes to augment negative long-term outcomes of an extreme exploitation of retailer power coming from abuse of “malpractices” and PL strategies. A different behaviour or more forward-looking purchasing habits by consumers would not prevent this hypothesis from occurring. Whether market concentration becomes relevant, innovation declines, supply shrinks or other liabilities arise, it is certainly not a consequence of consumer behaviour. Therefore, any possible undesirable outcome of retailer strategies should be prevented or prohibited by public intervention. Nevertheless, many likely outcomes and opportunities arise from the introduction and development of PLs, and resulting collaboration with other players. Hence, the prohibition of a given PL or retailer strategies aimed at reinforcing their bargaining power, or their brand awareness and power, must not be determined a priori. Nonetheless, there

44
should be, in each category, a balanced combination of the retailers’ own labels84, major NB and other products under the Pareto efficiency criteria. Even if a wide variety of products increases competition between PLs and NBs, retailers would benefit from it through augmented sales and the attraction of more consumers. An excessive presence of PLs, in conjunction with an impaired NB supply, surely has a negative impact on customer behaviour and causes supermarkets to have inferior revenues. We would suggest a study on the possible equilibrium between PLs and NBs. An equilibrium would permit fair competition and ensure adequate product variety and quality, with benefits for producers, retailers and consumers. Hence, a study on this issue would be of undeniable interest for retailers, manufacturers and researchers alike.
84 Nielsen (2014) conducted a study on customer perception of retailer assortment. Many customers did not have a favourable opinion of supermarkets in which they perceived a disproportionate number of PL products in their assortment.

45
Chapter 2
2. Private Label Promotion: a new defensive and supporting strategy?
The present study proposes, through several empirical analyses, a new interpretation of promotional strategies of retail chains. To this end, we use an exclusive dataset. Although the original data, which came directly from a leading retail chain, was difficult to acquire and use, we were indeed successful in producing an original contribution. Moreover, these data are representative of the sales made by retailers in several regions of central Italy. Hence, the resulting interpretations can be considered in a more generalised context.
Supermarket strategies have changed over years. They have differentiated their own products through, for example, the introduction of more targeted (and higher priced) premium products. Among the three predominant Private Label (PL) classifications, which can be defined as economy, standard and premium (Geyskens, 2010), the last one is perceived by a wide number of experts as a tool for attracting those consumers who are still loyal to National Brands (NBs).
The PL reached a state of maturity that forced retailers to shift from a promotion-based strategy to a new one, more oriented towards quality and value while still preserving comparatively low prices.
In our research, we investigate the changes in retailer strategies, starting from the analysis of the promotional strategy of the past fifteen years.
Despite being initially perceived as the dominant and cardinal strategy, extensively studied by scholars, PL promotion has supposedly lost its predominance and effectiveness. Although this is mainly true, it is helpful to further analyse the significant implications.

46
In our study, we demonstrate how PL promotional activity has moved from a purely offensive to a more complex and effective (according to the new trends) strategy. We can identify two different, yet connected, branches of this strategy.
The first branch of this strategy aims to maintain the advantages, in terms of market share and brand power, gained in the last fifteen years. We define it as “defensive”. Not only does this transformation explain a number of changes in price strategies, but also it represents a sort of litmus test for new power relations between NB manufacturers and supermarkets.
The second branch of the strategy also concerns market share and brand awareness, but focuses instead its effort on premium PLs. We identify it as the “supporting” strategy. The recently introduced premium PLs cannot be promoted as frequently and massively as standard PLs. Nevertheless, they need to gain market share and must come to take part consumer habits. Hence, instead of directly promoting premium PLs (i.e. an offensive strategy like the one of standard PLs in the first years of this century), retailers promote standard PLs in the same product category. Some standard PL promotions are thus set up as supporting strategies for premium (and same category) PL market penetration.
In the first section of this chapter we present a descriptive analysis of the evolution of strategies and promotions over the last fifteen years. Trends and data from reports, as well as graphs and current academic knowledge, are adopted to underline the differences and the progression.
In the second section we present the research question, while in the third section we describe the dataset. More specifically, we describe the chain and the different types of stores from where the data are collected. Moreover, we include descriptions of the goods that make up the dataset and their repetition over time, as well as a chart that illustrates the predominance of the food category over the non-food one. All these descriptions underline the uniqueness and the representativeness of the dataset.
Then, in the fourth section, we illustrate the methodology we use to address the research question and we formally present the model. Descriptive tables are reported to provide statistical information on the data. We utilise different methodologies, hence we illustrate them in two different sections, with a descriptive analysis and a causal analysis.

47
The results are briefly shown in the fifth section which, as for the methodology, is divided in two subsections, according to the two types of analyses. Tables help in clearly showing the estimations.
The final section is the conclusion, with a synthesis of the outcomes of this research.
2.1 Literature Review and Theoretical Framework
During the first decade of this century, manufactures decided to rise NB prices to maintain profits despite reductions in sales volumes. This was an effective strategy, for a certain period, in those countries where consumer willingness to pay higher prices for NB instead of PL goods was significant. Marketing and manufacturing factors, consistently with a perceived quality gap, caused NBs to enjoy high consideration during the development state of PLs (Steenkamp, 2010). Eventually, PL evolution led to the achievement of brand equity. In 2012 retail concentration in Europe was quite significant and, together with limited offerings and assortment, it strengthened PL power (Cuneo et al., 2012). It also gave brand legitimacy to retailers’ own labels and consolidated the recognition of value in consumer opinion. At that point, the PL maturity could be considered fully obtained and the perceived quality gap between NBs and PLs became considerably lower. Therefore, after the first decade, it became impossible for NBs to profit from perceived quality gap against PLs. Thus, correlation between NBs and PLs was significantly reshaped. It is noteworthy to remind that, according to Mela et al. (1997), promotions make both loyal and non-loyal consumers more price sensitive in the long run, with a more relevant effect on the latter.
The awareness of quality regarding PL goods considerably contributed, approximately ten years ago, to a noteworthy transformation of the preceding trend. Furthermore, consumer perception identified quality PL products as effectively belonging to the premium segment. This represents a landmark in the relationship between PLs and NBs. Nenycz-Thiel (2009) asserts that perceived quality differential is essential towards determining consumer behaviour. Moreover, he proposes NB perception as the motive for the shift towards PL products: NBs were perceived too expensive in relation to the quality offered, contrary to PLs. This hypothesis seems fair when considering the previous increases in NB prices with no correlation

48
to quality. Moreover, only four types of products appeared within supermarket offerings: mainstream quality NBs, premium quality NBs, economy PLs and standard PLs (Geyskens, 2010). Therefore, if a shift from premium NBs goods occurred, it was necessarily towards premium PLs. In the subsequent years, customers stably recognised the quality of premium PLs, as remarked by Nielsen’s survey in 2014. Hence, the long-term retailer strategy, that began at the end of the first decade, eventually reached the desired goal. According to Nielsen (2014), in 2014 more than 70% of interviewees perceived an increase in PL quality over the previous years. Many customers are price-driven in their purchasing decisions, with a considerable proportion (69% of interviewees) assigning great importance to getting the best price. Moreover, a higher share (70%) expresses its preference of PLs to save money. Nevertheless, PLs were not only attractive due to price. PLs were also perceived as high quality products. Many interviewees (67%) chose PLs for their value for money, with a similar percentage (62%) perceiving themselves as smart shoppers for buying PL products (Nielsen, 2014). Nonetheless, there are other factors to ponder. One aspect in particular caught our attention, further compounded by the peculiar existing economic situation. The economic crisis of 2008 had two unfavourable outcomes: the rise of raw material prices and the desire of suppliers and retailers to recoup money lost due to the crisis (SymphonyIRI Group, 2012). Consequently, those products particularly affected by price increases had to be considerably discounted to maintain, let alone grow, volumes. Moreover, this was essential since the most affected products were basic necessities or popular goods. According to SymphonyIRI Group (2012), these products include: extra virgin oil, tomato sauce, olive oil, Italian wine, pasta and crescenza cheese. Under those circumstances, consumer shopping behaviour has been enduringly influenced and shaped (SymphonyIRI Group, 2012). Contrary to the strategy that set higher prices for better quality products, both retailers and manufacturers opted for a widespread use of promotions. As for popular items, promotions represent a successful technique for preserving volumes in any category. SymphonyIRI Group (2012) assesses at almost one third (29.8%) the share of goods that were discounted in 2012 across all categories. However, those deals register only mixed effects. Some scholars agree that some undesirable outcomes are derived from intense competition. Mela et al. (1997), among others, demonstrates how customers become more price and promotion sensitive as a result of powerful and persistent promotions. In the long run, promotions have negative effects (Jedidi et al., 1999): decreasing regular prices would be less viable yet discounts must be significant to obtain the same effect. Although in the preceding section we

49
considered PL promotions, the amount of NB promotions was more relevant than the former between the end of the first decade and the beginning of the second in the present century. In Italy in 2012 (specifically, February) NB promotions counted for more than a quarter (26.9%) of value sales, with an increase of 1.6% over the previous year. By contrast, PL promotions recorded a decrease of -4% with respect to 2011, with a share of 22.5% of value sales (SymphonyIRI Group, 2012). Decline in PL promotion levels was conspicuous from the end of third quarter of 2011, as noted by SymphonyIRI Group (2012). Moreover, price promotions not only create long term undesirable consequences, but also diminish consumer willingness to pay for a NB in comparison to a PL (Steenkamp, 2010). Nonetheless, Steenkamp (2010) declares that in 2010 there was a budget switch from advertising to price promotions, contrary to authors’ recommendation. Furthermore, while PL promotions dwindled, NB ones grew tremendously over years. Subsequently, as 2014 approached, thanks to these two antithetical tendencies, PL value share started relent, as indicated in that year’s IRI Special Report.
Therefore, conversely to the first years of 21st century, the price gap between NBs and PLs has been reducing significantly. Promotion sales volumes can be attributed in the measure of 80% to NBs while only 20% regards PLs (Eales, 2014a).
As shown in the figures below (Figure 1 and Figure 2), PL promotional pressure in Italy in 2014 was about 23%, counting for less than 20% (18.9%) of total promotion share, perfectly in line with the European average.

50
Figure 1 PL Promotion Market Share 2014. PL promotion share (in %) in European countries and in the United States. Notes: Source: IRI InfoScan (hypermarkets and supermarkets)
Figure 2 PL Promotion evolution, in points, 2014 versus 2013. Notes: Source: IRI InfoScan (hypermarkets and supermarkets)

51
Moreover, in terms of units, Italian PLs had the highest prices and the lowest market share among all European countries (Eales, 2014b): having set the average NB price at 1, PL prices had a value of 0.786, with an increase of 0.7 points with respect to 2013. Consequently, during the following year Italian supermarkets considered revising their price strategies to compete with NB promotions (Eales 2015, a).
Considering the two trends briefly above mentioned, we can identify two distinct scenarios prior to the phase we examine. During the first decade of 21st century, two tendencies influenced the balance between NBs and PLs. Increasing promotional pressure (Grandi, 2011) contributed to augmenting the existing price gap between manufacturers’ products and retailers’ goods. NBs exploited both this gap and their perceived increased quality by fixing higher prices (Steenkamp, 2010) to retain the same revenue level with lower volumes. Subsequently, a considerable discrepancy occurred, although this nonetheless did not represent a steady state. Differences made the exploitation of new opportunities possible, as for instance positioning, pricing and brand awareness. Increasing PL power (Cuneo et al., 2012) and quality obviously induced higher prices. These, together with diminished PLs and jointly augmented NB promotional pressure (Eales, 2014a), eroded the gap between PLs and NBs. It is noticeable how antithetical the two mentioned trends are. They have led to the existing status and the subsequent identification of new strategies.
A number of global and local reports provide evidence for the decrease of PLs and increase of NB promotion balance. A noteworthy comparison was made in IRI Topline Report for H2/Q4 2015. The report considers both an average basket of goods and a full PL basket. For the former was valued at €29.99 and €30.08 in the last quarter of 2014 and 2015 respectively, while the latter was valued at €23.82 and €24.15. Moreover, while prices for the average and the full PL baskets were slightly increasing, those for a full NB basket were slightly decreasing: from €31.69€ in 2014 to €31.59 in 2015. Figure 3 shows the relative increase of a full PL basket in comparison to a full NB basket: setting the latter at 100, there is an increase of almost 1 percentage point in the relative price index (from 74.7 to 75.6). Furthermore, Figure 3 also shows that a full PL basket is relatively more expensive in Italy than in all the other major European countries.

52
Figure 3 IRI Food Shopping Basket. Total NB Versus PL relative price index. In Q4 2014 and Q4 2015, in Western Countries. Notes: Source: IRI Topline Report.
The IRI report from October 2015 evidences how promotional levels offered in Italy until 2014 where unsustainable in a long-term perspective. Despite their successful application to boost short term sales, promotions could not be efficiently adopted as a long-term strategy. Price wars and additional promotions brought margins and revenues to a minimum, without a consequent increase in sales.
Also, from a manufacturers’ point of view, the game was a losing one: significantly decreasing prices over long term periods led to even greater decreases in margins and revenues. On the other hand, it was risky to raise prices. NB producers might have considered heavy promotions as the only feasible way to stop losing market share in favour of PLs. However, the IRI report shows a slightly bigger decrease in NB promotions in comparison to PL ones for 2015.
A change was nevertheless inevitable from different point of views. Even though, as from the discussion below, some research and reports have emphasised this change, a deeper empirical analysis was strongly needed. Hence, the aim of the present research is in fact to fill this gap.
The IRI Topline Report underlines how, in 2015 in Italy, a positive trend was not linked to promotional pressure. Promotions in 2015 were lower than 2014 for any month except for December, where they were relevant.
53
Overall promotional pressure in 2015 was 27.9% against 28.4% for the previous year. However, it is worth highlighting that, despite an increase in promotional activity between 2010 and 2014, in 2014 promotional activity was already becoming less relevant than before. Retailer strategy was more oriented towards consistently low prices rather than temporary deals, such as heavy NB promotions (Eales, 2014.b). Nevertheless, according to an IRI analysis (2016) on the Italian market, promotional activity is overused in every category, particularly in the Food and Beverage one. The abuse of the sales promotion has led to a downward spiral of its very effectiveness (Galasso, 2015).
New retailer policies, especially the “Every Day Low Price (EDLP)” strategy, has changed the concept of promotion into the long-term belief of convenience. This is a crucial aspect affecting not only promotions but also the overall retailer strategy and, consequently, the manufacturers’ one. The 2015 IRI report (Eales, 2015) already pointed out a trend that was significant from that and the previous year. Coop, the main retailer in Italy, and other a number of chains (e.g. Conad), formulated a strategy similar to the EDLP one, modifying however the concept and the aim of promotion from a short-term increase in sales to something envisioned to build strong consumer loyalty.
Promotional activity with the goal of boosting sales is less effective and less adopted than in the past. Coupons and flyers are common in Italian supermarkets (IRI 2015 and 2016), even though their effectiveness is uncertain.
As also said by Steve Matthesen, former President of Global Retail at Nielsen, a change in consumer expectation has been observed, namely that the majority consumers perceive that low prices should be the norm (Nielsen, June 2016) thanks to the strong promotional activity of PLs and NBs.
Nevertheless some consumers consider paying a higher price worth it for obtaining a better quality good. This gives retailers the possibility to transition from an aggressive promotional competition, which we considered no longer sustainable, towards an offering in which products have higher perceived benefits. Hence, building customer loyalty is possible, because consumers will be more satisfied and then more prone to come back again.
Nonetheless, we must keep in mind that no promotional strategy could be considered the winning one for any category present in supermarket

54
offerings. Well contemplated and planned promotions represent the key to success. It is better having less yet well designed and targeted promotions rather than bigger but non-focused ones.
What we have argued so far depicts the evolution of promotional pressure over the last few years and underlines a change in trends. It also gives some hints regarding promotional activity of NBs. However, no interpretation is given for either the hidden new PL promotional strategy nor for the previous rise in NB discounts. As new promotional PL strategy is a consequence, we shall start with analysing the rise in NB discounts.
First, we need to change perspectives and start by revaluating some key points from the previous sections.
During the last several years, PL products have gained market share thanks to a big boost of some effective promotional campaigns together with other marketing strategies. NB producers were then forced to stop this trend to bring their customers back. An immediate, effective and easy strategy might have been to diminish the gap between their products and PLs: promotions seems to have been the right tool for this purpose.
The appropriate counter strategy from supermarkets then was to reintroduce this gap by also offering their own products under promotion. This defensive strategy brings back, in the consumer’s mind, the perception of good quality at a lower price (i.e. a better value for money) in comparison to NBs. For PLs, the aforementioned consciousness represents a key component in the PL vs NB balance. Furthermore, as derived from the analysis of the Italian market, a defensive strategy is crucial since, until Q3 of 2016, consumer behaviour was the same as in the period of crisis: despite a slow recovery of national economy and an increase in sales volumes, customers still prefer cheap goods and are significantly sensitive to promotions (Nielsen, November 2016). Hence an abrupt interruption of promotional activity would not only be ineffective, it would also undoubtedly be dangerous for the whole supermarket offering. Since Consumer Packaged Goods (CPG) are more sensitive to price fluctuation (Cuneo et al., 2012), maintenance of promotions is essential to boost or at least maintain market share, and thus customer loyalty. At any rate this cannot be considered the sole strategy for the future of the PL. Further aims of promotion maintenance include the PL perception defence and the support of the development of premium PL goods in those lines with a high level of differentiation, where the construction of higher levels of brand equity is also possible (Cuneo et al., 2012).

55
Retailers are not the only ones reconsidering their strategies. Although not the primary scope of this research, we want to briefly investigate the possible scenarios for NBs and manufacturers. Since intensive promotional activity is no longer sustainable for NBs as well, proceeding with differentiation seems to be the winning strategy for manufacturers too. Therefore, they should set a more defensive strategy and strengthen their brand equity. A potential approach could be to use a defensive strategy themselves, but from the consumer awareness perspective (Choi, 2017). While N B might have a longer tradition of walking this terrain, retailers have already started to attack wholeheartedly. For this forthcoming battle, retailers must have adequate additional tools that go well beyond those that come from their own premium labels. This will be the battlefield in which the future of the NB vs PL balance will be decided, where a positive result is essential for both players. Nonetheless, Choi (2017) hypothesises that there will be cooperation between retailers and manufacturers thanks to the latter’s new proposed strategy. He believes there will be no price competition. By not fighting and leaving NBs to increase their sales, he expects retailers will have bigger total revenues anyway. According to Choi, this should compensate, and even enhance, losses due to fewer PL sales, making manufacturers and retailers bettered off.
We do not fully support Choi’s hypothesis. Even though we agree with him regarding the impossibility of keeping heavy promotions, and therefore with the proposed idea of defensive NB differentiation, we do not think there will be cooperation. Our view is that market shares and brand equity are much too strategically important for both players to let an opponent gain them without fighting. As demonstrated by the opposing strategies employed from 2000 until now, in the long run, cooperation may also represent a solution, especially if the fierce competition results in heavy losses for both. However, in the short term, a change in promotional activity aiming to neutralise the one of NBs leads us to think that NB strategy will be adjusted without resulting in cooperation. Furthermore, the only implication will be the implementation of a supporting promotional tool to operate a sort of simultaneous double attack.
We decided to conduct the present study to provide a more focused study based on unique data regarding the promotions of a leading retail chain in central Italy. The theoretical framework provides the basis from which we start our analyses. In the current literature there is, to the best of our knowledge, no study that investigates an exclusive dataset to show the new kind of promotional strategy employed by supermarkets.

56
2.2 Research Question
Once having gained a certain market share and brand awareness for their standard PL products, retailers have an additional task: attract consumers with different and more demanding preferences. It is, of course, a matter of increasing market share without losing the current one, but with a special focus on the “horizontal” perspective (i.e. same category, different product characteristics), rather than on the “vertical” one (i.e. products of other categories). This is drawn, as seen in the previous section, from the intention of captivating more quality-oriented consumers. Nowadays, a slightly higher expense for a more valuable product is preferred to a cheap but standard good, according to consumer behaviour analysis. Hence, the strategies exploited until now, which were effective for massively penetrating the market, no longer appear to be adequate. As reported, however, in the literature and written in the introduction to this chapter, intense, but non-focused, promotional activity is no longer the winning retailer strategy. This is why there has been a relevant change in PL promotional activity. However, apart from a recent reduction in number and depth of promotions, it still represents a critical aspect of supermarket plans. We believe that a more accurate study on the factors that influence promotion and the effectiveness of promotional strategies on market outcomes is still lacking. The aim of this study is to investigate, through a descriptive and a causal analysis, this issue.
The evolution of the concept of promotion started from the massive discount pull strategy made by retailers to achieve PL brand awareness and gain market share. Subsequently, as previously written, the obvious counteraction of NB producers was to offer their own goods at discount prices, too. Hence, we want to explain how, and why, promotions are currently adopted by retailers. In our study:
1. We aim to descriptively understand what factors correlate with promotion.
2. We perform a causal analysis of the effect of promotion on market outcomes (i.e. quantity and revenues). We also investigate and compare the effects for all products and (only) for promoted products on market outcomes.
From the descriptive analysis, we qualitatively discuss the two features of the new promotional strategy. The first aspect of the new strategy regards the use of promotion as a tool for managing the price gap between PLs and NBs. Considering the explained recent promotional trends, in a sort of

57
reverse counterstrategy, promotion is nowadays exploited by retailers as a short-term defensive strategy against massive, first-inverse, NB promotional attack. The second aspect concerns the event of promotion as a support for letting PLs penetrate premium segments. This is consistent with the main new task of supermarket chains to enhance the market share of their premium PLs. Since some consumers use price to infer product quality (Lichtenstein et al., 1993), direct price reductions are risky (Lybeck et al., 2006), especially for newly introduced premium products. The solution is represented by a promotional activity that is not directly set for premium PLs, but for standard PLs in the same product category. In this way retailers try to boost premium PL sales without having the undesirable outcome of a perceived decreased quality.
From the causal analysis, we inspect whether promotion is effective with respect to quantity and revenues.
We must point out that the new promotional strategy we investigate does not interfere with the recent “Every Day Low Price” (EDLP) approach regarding a sort of “long term promotional idea”. In fact, the strategy behind EDLP is completely different and they are able to utilize two distinct types of leverage: perception of constant convenience for PL goods meant for everyday usage versus support of premium products or defence against NB goods under promotion.
2.3 Dataset
Our research uses an exclusive dataset, with observations recorded directly by the retailer in from stores throughout the chain.
The dataset is composed of repeated multi-dimensional data (panel) observations on 121 different PL food products of a big Italian retailer chain operating in Italy. More specifically, our dataset comes from about 340 stores (supermarkets, hypermarkets and convenience stores) owned by the company in Centre Italy (the number of stores of two major competitors is, jointly, roughly 300). In western central Italy, the retailer has a market share that goes from about 16% until almost 25%, depending on the region we consider, and is the leader in some areas (while major competitors have shares going from roughly 20% up to 33%). It has around 10,000 employees, with a turnover of over 2 billion Euros. Furthermore, it counts approximately 1.5 million loyalty card members. The retailer belongs to a major European buying alliance and, in the domestic market, it is member

58
of a leading Italian association of retailers. Approximately one out of every three products sold by the retailer is a PL good.
The panel is composed by quarterly product observations from January 2013 up until September 2015. All products have full records for these periods. Both revenues and quantity sold during each quarter are available for all product we analyse, as well as the quantity sold and the revenues earned under promotion, if any, during a specific period. The dataset is strongly balanced and complete; every product has 11 time periods of data.
Since our research is more oriented towards understanding what influences promotions, the values of the products are less relevant for our study. This is why we aggregate the information regarding presence or absence of promotional activity in a given quarter into a dummy (dichotomic) variable (1 if present, 0 if absent).
The dataset is composed by all the PL goods (of the selected items) sold in any supermarket, hypermarket or convenience store owned by the company in central Italy, during the analysed period. Many of them belong to standard quality product lines, however there are also goods that belong to premium or organic segments. All goods belong to food categories. We believe that this does not limit the analysis, yet it helps in keeping our analysis coherent and significant. As shown in Figure 4, food is largely predominant among product categories, which are divided into food or non-food.

59
Figure 4 Mass Market Retailer Turnover (€ Billions), per Product Category: Food or Non-Food. Notes: Source: gdo report. dgm consulting 2016 (data from federdistribuzione).
As shown in Figure 4, food represents more than 80% of the turnover for the mass-market retailers making this the largely predominant one. Therefore, it is also the most strategic in terms of importance and market share acquisition. Hence, the restriction to food products only permits us to be more pertinent with respect to the Italian market and less dependent on data heterogeneity problems, with no loss in significance.
Time also plays an important role in our analysis. With 11 different fully defined periods, we decided to analyse not only the yearly trend, but also the behaviour in terms of seasons. Details about time variables are provided in appendix A.
The size of the database, the dimension of the area in which the retailer operates, the prominence of the retailer itself (both in terms of volumes and in terms of awareness), the different type of stores from which data are collected, the importance of the food sector, the number of periods, the differences in considered products and the information about promotions and premium/niche products make the studied dataset representative of Italian retail sales.

60
2.4 Methodology and Model
We employ different methodologies corresponding to our different research questions, as outlined in the previous section. We illustrate them in sequence. We first execute a descriptive analysis (i.e. random effect logit) and, second, a casual analysis of promotions (i.e. exact matching).
For the first part, we perform a logit regression with the aim of describing the new promotional strategies of supermarkets.
For the second part, we execute Average Treatment Effect (ATE) and Average Treatment Effect on the Treated (ATT) estimations of promotions on market outcomes.
For both analyses we include an increasing number of relevant variables. Among the set of factors we have identified, the most relevant to our analysis are: time, product categories, revenues, quantity, and several other elements which play a significant role in influencing promotions.
The following subsections present the analyses and then provide further details on the method employed.
The first subsection also includes the discussion on the considered variables and their characteristics (some descriptive statistics are shown in two tables, too). Since they are the same for both analyses, we present a more detailed discussion in the first subsection and we just mention it in the second one.
2.4.1 Descriptive Analysis: Random Effects Logit
We use a logit model to analyse the factors which influence the probability of a product to be under promotion.
The descriptive analysis of the interactions of the selected variables with the presence, or not, of promotional activity allows for the understanding of what we call the “underlying strategy”: how retailers face NB competition and how PL promotion helps in expanding premium PL market share and brand awareness (i.e. the effects of the new promotional strategy). To this end, an extended discussion on the importance of the considered variables is necessary. Moreover, the discussion of the results needs to debate all of the underlying marketing (and managerial) strategies. This also means comparing categories and the characteristics of their products, to discuss the differences between the two promotional strategies and their effects.

61
We present below our longitudinal logit model (Equation 1).
Equation 1 Longitudinal Logit Model
𝑦 = 𝑙𝑜𝑔𝑖𝑡 (𝑝𝑝𝑟𝑜𝑚𝑜) = log(𝑝𝑝𝑟𝑜𝑚𝑜
1−𝑝𝑝𝑟𝑜𝑚𝑜) = 𝛼𝑖 + 𝛽1 𝑦𝑒𝑎𝑟𝑖 + 𝛽2 𝑠𝑒𝑎𝑠𝑜𝑛𝑖 +
𝛽3 𝑐𝑎𝑡𝑒𝑔𝑜𝑟𝑦𝑖𝑡 + 𝛽4 𝑐𝑜𝑚𝑝𝑙𝑒𝑚𝑒𝑛𝑡𝑎𝑟𝑦𝑖𝑡 + 𝛽5 𝑠𝑢𝑏𝑠𝑡𝑖𝑡𝑢𝑡𝑖𝑣𝑒𝑖𝑡 +𝛽6 𝑎𝑠𝑠𝑜𝑟𝑡𝑚𝑒𝑛𝑡𝑖𝑡 + 𝛽7 𝑖𝑛𝑐𝑖𝑑𝑒𝑛𝑐𝑒𝑖𝑡 + 𝛽8 𝑙𝑒𝑠𝑠𝑐𝑜𝑛𝑣𝑒𝑛𝑖𝑒𝑛𝑡𝑖𝑡 + 𝛽9𝑣𝑎𝑙𝑢𝑒 + 𝜀𝑖𝑡
We exploit a varying set of explanatory variables, which are critical towards determining the presence or absence of promotion. We first discuss all the considered variables and then we show the model.
As reported in Equation 1, we have 121 products (𝑖 = 1, 2, … … , 121) with observations over 11 quarters (𝑡 = 1, 2, … … , 11, i.e. periods). The random variable 𝛼 represents a group-specific time invariant effect. It is assumed to be uncorrelated with observed group covariates, hence they are independent across groups. Moreover, the disturbance term, represented by 𝜀𝑖𝑡 , is assumed to be uncorrelated across individuals and uncorrelated over time for an individual. 𝛼 and 𝜀 might be thought as, respectively, a group level and an individual level error term. We assume that distribution of 𝛼 is normal - 𝑁 (0, 𝜎𝑖
2) - and 𝜀 is independent of 𝛼. We employ random effects to account for unobservable individuals.
We model as our dependent dummy variable the introduction/presence of promotion in a specific period for a certain product. The dependent variable assumes value 1 if there is introduction/presence of promotion in that period for the considered product, 0 otherwise. In Equation 1, the probability that promotion occurs is represented using the notation 𝑝𝑝𝑟𝑜𝑚𝑜 .
We can accordingly analyse how an increase of one unit in the independent variable revenues influences the probability that a specific product is under promotion; this probability is expressed through the value of the coefficient which provides a result in log-odds term. Analogous logic applies to all the independent variables. For example, if an independent dummy variable is 1 (hence if the condition is verified) and the P-value is statistically significant, the variable influences whether a promotion occurs or not. The probability is shown by the value of the coefficient, which is expressed in log-odds units, too. From these coefficients, we can compute the Odds Ratio (OR)85.
85 The OR is equal to 𝑒𝑏, where 𝑏 is the coefficient itself.

62
Now we describe the variables included in the model.
In our analyses, the promotional or non-promotional status of a PL good is related to time, category and dummy specifying variables. Time is expressed both in terms of year(s) and season(s). One limitation of using random effect is the lack of control for omitted variables. Nonetheless, in our model, due to the dataset we have, this is not a limitation.
Now we discuss more in detail each variable. The four main factors which influence promotion are:
• Categories to whom each product of the dataset belongs • Revenues • Some relevant information (that might influence promotion) • Time
From these factors, we have chosen our relevant independent variables.
As we are more interested in analysing changes in revenues, we consider the independent variable revenues in our models. Revenues provide useful information to our discussion. Even if someone might say that quantity is directly connected to the introduction of promotion (i.e. that an introduction of promotion for a certain product will lead to a significant increase in volumes of quantity), we cannot state the same, without any doubt, in case of revenues. According to Srinivasan et al. (2004), price promotion effects of retailer revenues are mixed. Moreover, many different kinds of price reductions can be identified (among others: new product introduction and the clearance of goods due to physical factors, seasonality and technical obsolescence or perishability)86 . Hence, it is important to investigate how revenues are related to the presence of promotion.
We decided to use year(s) and season(s) as time explanatory variables. Year and season are individual-invariant categories, thus they have a between variation equal to zero. Even though raw data are recorded by quarters, it is more efficient for our analysis to consider yearly evolution and seasonal behaviour. More details on time variables are written in Appendix A: Time.
The first independent variable written in our model is year. Our dataset has observations from three years: 2013, 2014 and 2015. Year independent variable helps in studying time trends.
86 Among others, see: Walters (1991), Bobinski et al. (1996), Smith & Achabal (1998), Voss & Seiders (2003), Levy et al. (2007), Wang & Webster (2009), Hemalatha & Sridevi (2013) and Choi et al. (2014).

63
As specified in the previous paragraph, we also built season(s) out of the information of the original dataset. Each season includes the corresponding trimester of every year. This variable allows for the understanding of whether there is a specific period during which the probability of promotions increases. It is helpful to understand retailer strategy. Are promotions more probable in peak or calm seasons?
The third independent variable is category. We have fifteen categories of products. Categories are useful to underline the different characteristics of products (i.e. differences between common elements of products in a category and common elements of goods in a distinct one) and thus the consequent different promotional behaviours. They significantly help in understanding the new kind of promotional strategy implemented by supermarkets and to identify the two branches. This study analyses singular products or entire categories, depending on what we want to stress. For the products of the relevant categories (Seasonings, Marinated Vegetables and Pickles - Condimenti, Sottoli e Sottaceti; Pasta and Rice - Pasta e Riso; Breakfast Products, Patisserie - Prima Colazione e Pasticceria; Chocolate - Cioccolato) and for some further descriptive statistics of categories, please refer to Appendix B: Categories.
We also have several dummy variables for studying additional features (both regarding specific dataset characteristics and general ones coming from Nielsen reports87). Dummy explanatory variables are built to answer specific questions and to understand crucial issues in our logic. We individuated the topic that might most influence promotions (for more details on this issue see the discussion on CIA in the following section), in order to understand whether their impact in augmenting the probability of a product of being under promotion is significant and to what extent. To have more coherent results, we specifically designed these dummy variables according to the characteristic of our dataset. These dummy variables are useful to consider crucial information in our discussion. Both these dummy variables and category are time-invariant variables, hence their within variation is zero. There are two rationales behind the construction of these explanatory dummy variables. The first type of variable relates to the presence of interdependent or similar products within the dataset. Hence, they are built accurately analysing our data and then it is decided if a product has a complementary or a substitutive inside the dataset:
87 http://www.nielsen.com/us/en/insights/reports.html

64
• Complementary indicates if in the dataset there is an interdependent product concerning the analysed one (1, yes, 0 no);
• Substitutive whether there is another product that might replace the selling of this one in the consumer’s mind (1, yes, 0 no);
For the second set of dummies, about product variety (assortment), incidence or convenience(lessconvenient), we consider whether the category (and therefore the products in that category) assigned to the specific product is among those indicated by Nielsen in 2013, 2014 and 2015 reports:
• Assortment if the product, according to the Nielsen analyses of years 2013,2014 and 2015, belongs to a category considered to have a comparatively high PL variety (1, yes, 0 no);
• Incidence once again considering the Nielsen analysis, is 1 if the product belongs, during the years we analyse, to a category with high incidence. 0 otherwise;
• LESSconvenient still considering Nielsen analyses, if it is in a category where PLs are less convenient (1, yes, 0 no).
The main statistics on all the variables included in our model are summarised in Table 1. Revenues and quantity (which is considered in the causal analysis) are expressed in thousands of unit/euros.
Moreover, Table 2 shows the correlation matrix of the variables. There are few relevant correlations, like the one between assortment and incidence and that between revenues and assortment.
Let us now move towards the second subsection about causal effects of promotions.

65
Table 1 Summary statistics of the examined variables
Variable Mean Standard Deviation
Min Max N obs.
introPROMO 0.753 0.432 0 1 1,331
Year 1.909 0.793 1 3 1,331
Season 2.364 1.068 1 4 1,331
Complementary 0.512 0.500 0 1 1,331
Substitutive 0.636 0.481 0 1 1,331
Assortment 0.248 0.432 0 1 1,331
Incidence 0.141 0.348 0 1 1,331
LESSconvenient 0.066 0.249 0 1 1,331
Revenues 179,507 25,6213.6 0 2,177,840 1,331
Table 2 Correlation matrix
Intro
Pro
mo
Ye
ar
Se
aso
n
Ca
tego
ry
Co
mp
leme
ntary
IntroPROMO 1.000
Year 0.132 1.000
Season 0.026 -0.176 1.000
Category 0.032 -0.000 0.000 1.000
Complementary 0.030 -0.000 -0.000 0.065 1.000
Substitutive 0.201 -0.000 -0.000 0.110 0.088
Assortment 0.131 0.000 -0.000 0.251 0.177
Incidence 0.192 0.000 -0.000 -0.193 0.204
LESSconvenient 0.097 -0.000 -0.000 -0.138 -0.140
Revenues 0.273 0.052 0.015 -0.110 -0.131

66
Su
bstitu
tive
Asso
rtme
nt
Incid
en
ce
LE
SS
con
ve
nien
t
Re
ve
nu
es
Substitutive 1.000
Assortment 0.156 1.000
Incidence 0.058 0.594 1.000
LESSconvenient -0.006 0.078 0.084 1.000
Revenues 0.173 0.318 0.090 0.294 1.000
2.4.2 Causal Effects of Promotions: Matching
We want to examine the effect of promotions on revenues and quantity. To this end, we estimate ATE (Average Treatment Effect) and ATT (Average Treatment Effect on the Treated) parameters by performing exact matching on the set of discrete categories and dummy variables that we can obtain in the data.
The variables on which we perform exact matching are the same discussed in the previous section:
• Category • Substitutive • LESSconvenient • Complementary • Incidence • Assortment • Season • Year
We use ATE and ATT because the former measures the promotion impact on the expected outcome (revenues/quantity), while the latter measures promotion impact on the expected outcome (revenues/quantity) of products under promotion. The different approach of ATE and ATT stimulate discussion of the different kind of effects. ATE helps in understanding whether, on average, a policy (i.e. promotional strategy) is beneficial for all products, while ATT is useful to discuss whether a policy (i.e. promotional strategy) is beneficial for actually promoted products.

67
Theoretical predictions on the effect of promotion on revenues are ambiguous. However, this is not the case of quantity that is expected to increase under promotion so long as the goods promoted are normal. The possibility to compare outcomes relative to both market outcomes (and also to compare ATE and ATT outcomes on both variables) provides a significant value added for our discussion of the strategies.
Parameter estimates of ATE and ATT based on exact matching on the mentioned list of variables are consistent estimates of the corresponding papulation parameters so long as the Conditional Independence Assumption (CIA) holds in this context. CIA assumes that the choice, whether an individual gets treated or not, is not correlated to possible outcomes.
We consider whether a product has interdependent goods, or if another product exists that can substitute the considered one. At the same time, we also consider variables that take into account the major factors and trends studied in Nielsen yearly reports.
Walters (1991) underlines the existence of an important link between substitution (i.e. substitutive), complementary and promotions. Whereas an empirical study conducted by Voss & Seiders (2003) demonstrates the existence of a link between assortment and price variation. Pauwels et al. (2002) observe a strict connection between promotion and some factors of brand sales they identify with: brand choice (that we name with assortment), and category incidence. The last one is also tied with promotions for Mela et al. (1998), too. Relative-benefits in terms of price and the consequent “smart shopper self-perception” (which is defined as an ego-related variable) represent the issues with a connection with promotion and consumer behaviour (Garretson et al., 2002; Liu & Wang, 2008; Nederkoorn, 2014). We identified these factors with the variable lessconvenient.
All of these considered, and according to the possible promotional strategies we presented in the literature review, we can conclude that all the relevant product characteristics that influence promotions are taken into account. Moreover, since we also consider different seasons and years and the main food categories, we include in our analysis all the relevant issues which influence promotions and their effects.
By exact matching we associate each unit under promotion with an observation that does not go under promotion and, symmetrically, we associate with each observation not in promotion a corresponding one that

68
does go under promotion. Observations for which exact matching cannot be identified are removed from estimation. We match with replacement.
By defining matched variables �̂�𝑖(𝐷) as follows:
�̂�𝑖(𝐷) {𝑦𝑖 𝑖𝑓 𝐷 = 𝐷𝑖
�̂�𝑖(𝐷) 𝑖𝑓 𝐷 = 1 − 𝐷𝑖
We estimate the ATE and ATT parameters as:
𝐴𝑇�̂� =1
Ν ∑ (�̂�𝑖(1) − �̂�𝑖(0))
𝑁
𝑖=1
𝐴𝑇�̂� =1
∑ 𝐷𝑖𝑖
∑ (�̂�𝑖(1) − �̂�𝑖(0))𝑁
𝑖=1𝐷𝑖
Where 𝐷 ∈ {0,1}.88
We calculate Abadie-Imbens standard errors (Abadie & Imbens, 2006; Abadie & Imbens, 2008).
Even though we focus our attention on revenues when performing the logistic regressions, for the estimations of ATE and ATT, we also consider the variable quantity.
2.5 Results
2.5.1 Descriptive Analysis
Table 3 shows the empirical results of all the descriptive analyses performed with product promotion as dependent variable. The first (1) is a pooled logit estimation, which ignores variation among products and treats all observations as independent. We report the following for the sake of completeness, however we do not believe it represents the best model for our purposes. From the second (2) until the last (5), we perform longitudinal logit models. However, we start by considering only the explanatory dummy variables (i.e. complementary, substitutive, assortment, incidence and lessconvenient) in (2), and then we add categories (3), year (4) and season (5).
88 If 𝐷 = 1 the product is under promotion, if 𝐷 = 0 the product is not under promotion.

69
We cannot observe, for models from (2) to (5), a significant difference in either magnitude of the coefficients or in significance
This is particularly true if we consider the models from (3) to (5). These regressions, including an increasing number of variables, allow a more complete and extensive discussion of strategical changes in promotional activity. This means that, even though each time we control for more variables, results are robust to alternative specification, and therefore stable. Most of the independent variables are significant in all the relevant models (from 2 to 5). Below we briefly mention them. However, a detailed discussion, which considers also the strategies involved, is provided in the next section.
If a product has a substitutive good in the dataset, then there is a significant probability that this will affect its promotional activity. Moreover, the belonging to a category where there is high incidence of PL augments the probability a product will be under promotion. Whereas high product variety (i.e. assortment) has a negative effect on the probability of being under promotion. Among the group category, we can identify some statistically significant (or highly statistically significant) categories, considering Basic Ingredients (Ingredienti di Base) as the base category:
• Seasonings, Marinated Vegetables and Pickles (Condimenti, Sottoli e Sottaceti)
• Pasta and Rice (Pasta e Riso) • Breakfast Products and Patisserie (Prima Colazione e
Pasticceria) • Chocolate (Cioccolato) • Spread Creams (Creme Spalmabili) • Ready meals (Preparati).
All of them have a relevant impact on increasing the probability for a product included in their own offering of being under promotion.

70
Table 3 Empirical Results. Dependent variable: Product Promotion
(1) (2) (3) (4) (5)
Complementary 0.290 0.930* 0.661 0.601 0.592 (0.151) (0.469) (0.555) (0.571) (0.576) Substitutive 0.834 † 1.192* 1.429** 1.492** 1.513** (0.163) (0.547) (0.511) (0.522) (0.529) Assortment -0.894** -1.311 -1.784* -1.755* -1.765* (0.286) (0.986) (0.889) (0.859) (0.852) Incidence 2.416 † 3.302* 2.549* 2.682* 2.722* (0.479) (1.441) (1.122) (1.112) (1.103) LESSconvenient 1.126** 1.453 1.419 1.362 1.345 (0.418) (1.053) (1.176) (1.158) (1.165) Revenues 0.0106 † 0.0208 † 0.0195 † 0.0189 † 0.0188 † (0.00161) (0.00569) (0.00483) (0.00448) (0.00446) Breakfast and Patisserie
3.542 † 3.581 † 3.601 † (0.960) (0.990) (0.997)
Cakes and Snacks
2.020 2.160 2.212 (1.235) (1.270) (1.286)
Chocolate 2.449* 2.489* 2.500* (0.975) (1.014) (1.021) Coffee and Infusions
2.156* 2.201* 2.211* (0.888) (0.929) (0.931)
Fish 1.241 1.256 1.286 (1.134) (1.174) (1.181) Legume and Side Dishes
-0.189 -0.280 -0.282 (1.026) (1.071) (1.076)
Oils and Vinegars
2.353 2.520 2.605 (1.404) (1.416) (1.420)
Other Ingredients
-0.133 -0.114 -0.0894 (1.260) (1.283) (1.288)
Pasta and Rice 3.528** 3.569** 3.600** (1.094) (1.134) (1.141) Purees and Sauces
1.922 1.900 1.897 (1.084) (1.115) (1.113)

71
Ready meals 2.154* 2.193* 2.201* (0.975) (1.026) (1.036) Salt Baked Products
1.732 1.844* 1.880* (0.904) (0.940) (0.950)
Seasonings, Marinated and Pickles
5.144 † 5.220 † 5.290 †
(1.143) (1.189) (1.205)
Spread Creams 2.177* 2.167* 2.174* (1.012) (1.046) (1.052) Year = 2014 0.378* 0.387* (0.182) (0.185) Year= 2015 1.326 † 1.363 † (0.271) (0.279) Season= Spring 0.524 (0.276) Season= Summer
0.620* (0.275)
Season= Autumn
0.438* (0.205)
Constant -0.635 † -1.564** -3.363** -3.799 † -4.210 † (0.156) (0.525) (1.059) (1.098) (1.127) ln (𝜎𝑢
2) Constant 1.340 † 0.694* 0.723* 0.731* (0.275) (0.300) (0.294) (0.293) Observations 1331 1331 1331 1331 1331 AIC 1181.9 1008.5 996.1 967.4 965.6 Log lik. -583.9 -496.3 -476.1 -459.7 -455.8 Chi-squared 146.1 49.11 76.43 102.2 107.2 𝜌 0.537 0.378 0.385 0.387 𝜎𝑢 1.955 1.414 1.436 1.441
Notes: Standard errors are reported in parentheses and are robust to heteroskedasticity. * p < 0.05, ** p < 0.01, † p < 0.001.
Within the same period, an increase in revenues augments the probability of the considered product to be under promotion. This is due to the immediate effect of the defensive promotional strategy. Promotions are not set to have a long-term effect (i.e. to boost sales in the subsequent period), but are an effective immediate counter strategy against NB price reduction attacks. Moreover, the modest effect underlined by the value in log-odds of
72
the coefficient underlines that the promotional strategy is not primary oriented in boosting incomes, even though this represents a positive effect indeed. This is coherent with a defensive/supporting approach.
A considerably significant explanatory dummy variable is incidence. Not only it is extremely significant in all the considered models, but it also has remarkable OR values: between 11 and 27 (approximately) for all the models. Considering the logic of the new promotional strategy it is coherent that products belonging to a category with high incidence significantly augment the probability of being under promotion. In fact, those are the crucial categories which determine the power balance between NBs and PLs and it is fundamental to defend, and expand where possible, the market share and the brand awareness through a defensive (or supporting in case of premium expansion) strategy.
If a product’s value for assortment independent dummy variable is 1, then the product belongs to a category that has (on average and according to Nielsen reports for 2013, 2014 and 2015) a comparative high variety of PL. This affects the probability of being under promotion in a negative way. This underlines that massive generical, i.e. non-specific, promotions are no more strategical for supermarkets. As such more focused strategies, like a defensive or supporting one, are nowadays preferred by retailers.
A strong confirmation for the supporting strategy comes from the significance of substitutive. When a product has a substitutive PL in the same supermarket offering, there is a higher probability that the former is under promotion. Hence, promotions on one PL can boost the selling of another PL product (which has similar characteristics to the former one) of the same category.
Setting basic ingredients as the base category makes it possible to compare the other categories with products considered by consumers to be extremely fundamental, essential and perceived as commodities.
In general, we expected a significant impact from Oils, especially olive oil. However, by analysing in detail our dataset, the non-significance of this category makes sense. Moreover, another surprising aspect to be noticed is that breakfast Products and patisserie have a noteworthy impact. However, with a deeper analysis, the results provide a remarkable cause for reflection.

73
Olive oil (as stated also by Unaprol89 using IRI-Infoscan studies) is usually subjected to intense promotion. However, this is true for standard olive oil and its overall effects might be mitigated by biological or premium products (here composed by Geographical Indications) and by other products in the same category, e.g. vinegar. In our dataset, the category oils and vinegars (olii ed aceti) is composed by olive oil, seed oil and two kinds of niche or premium PL oils. As in the report of Unaprol, but also in other reports and studies reviewed in the first part of this paper, there is a remarkable difference between promotional activity for standard goods and that for premium, bio or niche’s ones. Premium and bio olive oils are sold at a consistently higher price compared to the standard one and, most important, they do not follow their intense discount activity. Therefore, promotions are not the right tool for some products of this category, leading to a distortion in quality perception. Moreover, due to low presence of standard PL products in the analysed dataset, a supporting strategy cannot exist in this specific category.
An unexpectedly high influence is exerted by breakfast products and patisserie. It is unexpected mainly because, prior to the analysis, it was not classified by analysts (IRI and Nielsen, among others 90 ) among those categories awaiting promotions. Products in this category are: biscuits, cereals, zwiebacks and honey.
Considering the characteristics of the products in this category, both branches of the new promotional strategy (i.e. defensive and supporting) might apply.
As in Eales (2014, a), confectionery is one of those sectors where PL presence is low, in that it is a category with strong loyalty to NBs, and PL prices are increasing to confront NB presence.
According to our hypothesis, the explanation is that, despite the main strategy of offering higher quality products, supermarkets need to defend their products’ market share and try to expand premium PL awareness and market share. This is even more relevant in those categories where PL has an inferior position. The OR for this category are particularly high (in comparison with the other categories, apart from seasonings, marinated vegetables and pickles): roughly between 34 and 36.
89 Unione Nazionale tra le Associazioni di produttori di olive (National Union between Olive Producers Associations). 90 http://www.nielsen.com/us/en/insights/reports.html and https://www.iriworldwide.com/en-US/Results/Home.

74
To emphasise the differences between categories, we can compare two of them: breakfast products and patisserie and chocolate.
In his study, Afoakwa (2016) underlines the shift towards premium products in the Western chocolate market. Moreover, there has been an increasing demand for quality and taste (among others) as well as for sustainability, traceability, and ethical and other issues. Hence, prices are higher, even for PLs, and the category does not face intense promotional activity. Additionally, a considerable (40%) increase in the price of cocoa was registered by the World Bank between July 2013 and July 201491. Then, raw ingredients for a chocolate product are quite costly for manufacturers as well, therefore an economy price might not be set at any level. Both for manufacturers and retailers, it would be nonsense to offer at low price a product that, due to high cost of its ingredients, is costly by definition. Moreover, there is the need for retailers to build the idea in consumers’ mind that premium PL chocolate has an extremely good quality since it might be that consumers are more quality oriented when buying a bar of chocolate in comparison to food commodities like basic ingredients.
In the case of breakfast products and patisserie, we have both branches of the new promotional strategy: defensive and supporting. For the chocolate category, we cannot identify a defensive strategy because of the peculiar characteristic of its products. Even though several different types of chocolates (e.g. bars, praline, etc.) are sold in the category, it is not possible to identify a pure standard PL since all goods have their own peculiar characteristics, which thereby classify it as a non-standard product. Furthermore, it is not possible to recognise a pure supporting strategy, again due to a lack of standard products that can be massively promoted only for boosting premium PLs. The difference between breakfast products and patisserie and chocolate categories can be stressed from an analysis of the difference between products composing the two categories. In a nutshell, the former category has both standard PLs, which need to maintain their market share, and premium PLs, which must take care of the side effects of price reduction (i.e. quality downgrading in consumers’ mind). For standard PL market share maintenance a defensive strategy operates, while for increasing brand awareness and market share of premium PLs, a supporting strategy applies. In the case of chocolate category, because of all the aforementioned characteristics, it is not possible to exploit a defensive strategy in an effective way, and a supporting strategy would not lead to a positive result either.
91 http://www.borsaitaliana.it/notizie/food-finance/materie-prime/cacao.htm

75
Promotion is no longer a penetration strategy; it is transformed into a defensive and supporting strategy.
Having some key PL products under promotion faces, on one side, competition from manufacturers’ goods and, on the other side, helps premium (or bio, or other segments in the same category) PL goods in following the strategy which led them to be considered good quality products capable of meeting even the highest standard. In this way, premium (or bio, etc.) PL products are not forced to be under pressure yet consumers still maintain their link with the PL, while receiving the message that PLs can also be considered just as good as premium, or niche, NBs.
We compare two more categories which show significant results in our analysis: seasonings, marinated vegetables and pickles (condimenti, sottoli e sottaceti), spread creams (creme spalmabili) and ready meals (preparati).
From an analysis of the products present in those categories, it is possible to evidence an important difference (see Appendix B: Categories for more details): seasonings, marinated vegetables and pickles (condimenti, sottoli e sottaceti) and spread creams (creme spalmabili) present a good balance of standard and premium (or bio) products, while we find almost only standard products in ready meals (preparati). For the former we can identify a supporting strategy: standard PLs are promoted to boost sales of the corresponding premium product in the same category’s offering. It is easy to note how (apart from mayonnaise), every standard product has its own equivalent premium. If we compute the Odds Ratio, we obtain values from approximately 170 up to over 200. Hence, the probability for a product of this category to shift from 0 (non-promotion) to 1 (promotion), is extremely high. This is due to the existence of a supporting and defensive strategy, combined with the characteristics of the products in this category.
On the contrary, in the other category (ready meals - preparati) there is a large majority of standard PLs (with only two exceptions). Here the defensive branch of the strategy applies. Standard PLs are not promoted to boost premium PL expansion (we cannot see any connection between pastille and candies promotions and increase in premium olive sales), while the strategy is to preserve their own quota.
Now, we can analyse a category which is extremely relevant in representing Italian consumer habits: pasta and rice (pasta e riso). The OR of all the models for this category have a value of approximately 35 (which is quite relevant in comparison to other categories, apart from seasonings, marinated vegetables and pickles). This underlines the considerable

76
increase in probability of being under promotion if a product belongs to this category. As explained below, this is also caused by the importance and the characteristics of this category in Italy.
Pasta is considered one of the most important ingredients in Italian cuisine. Pasta consumption in Italy is very high and, also considering local producers, competition between brands is quite relevant (Cersosimo, 2011). A focus on PL pasta and rice offering, based on Nielsen data (Nielsen Trade*Mis –Iper + Super + Libero Servizio – about categories with an impact vs Grocery >0,1%), highlights a significant presence of PL goods in Pasta and Rice category. Pasta and rice assortment of PLs have been increasing over recent years. Assortment variation for pasta in 2013 and 2014 saw an increase of 1.2 and 0.6, respectively. Moreover, the average number of goods rose from 23.5 in 2013 to 24.3 in 2014. Rice had an average number of goods in 2013, 2014 and 2015 of 6.2, 6.5 and 6.6 respectively, with a weighted distribution of 95.9, 97.1 and 97.5 respectively. Cacchiarelli & Sorrentino (2016) state that competition is not relevant in their study about the main pasta competitors in the whole Italian retail market. However, they specify that in central Italy, where our data come from, there is higher competition. Most important for our analysis, they state that for NB promotional average impact goes from almost 17% to 30% and it is more evident in premium products. Furthermore, they underline how PL goods have a regular price lower than NBs, even if their dataset points out a low promotional impact. On this last point, we need to clarify that their dataset does not consider recent years and it just takes into consideration premium or niche (e.g. bio) PL products. Moreover, other studies about the same years, state that there is high promotion in the pasta category: over 48% of sales are under promotion (Ceri 2014). Consumers, due to high promotional competition, are more price sensitive and they continuously look for better quality/price deals (Troiani, 2010). As in Arkios report of 2013, in Italy there are many producers (94 in 2013), both small and big, even though acquisitions have led to a more concentrated market when considering relevant groups (See Appendix C: The Pasta for more details about Italian pasta producers history and trends). As seen before, the number of different goods in the offering of each brand, especially for PLs, is quite high. Differences in type of wheat, shape and other features lead a kind of pasta to be sold in standard, niche, premium, organic (or other) market segments.
From this analysis of pasta industry and consumer habits, the result of our analysis seems reasonable, if not expected. In this category, we have both a huge competition between PLs and NBs and the need to introduce further

77
PL products with different quality, types, aspects and several other characteristics. Thus, in pasta and rice category, we can observe both branches of the defending and supporting strategy operate at the same time. In our dataset, we have a good balance of standard and premium/bio PLs, reflecting the tendency of the whole industry. Promotions on standard PLs both aim to defend their own market share and brand awareness and, at the same time, to support the penetration (and market share expansion, etc.) of new premium (or organic or other niche one) PL products.
Most of the variables are robust to alternative specification. However, there is one explanatory dummy variable that is significant only for the first model. In this model we just consider the five dummy variables and revenues. Particularly, lessconvenient is significant for (1), but not for the regressions which include more variables. This is a dummy variable based on the Nielsen analyses (for the year 2013, 2014 and 2015), which generally consider a standard supermarket and the characteristics related to the general trends in the whole country (i.e. Italy). In our model, the variable lessconvenient assumes value 1 if the considered product’s category offers, from an analysis of the whole Italian retail industry, PLs which are less convenient than in other categories. Therefore, the characteristics linked with this variable are not intrinsic to the analysed dataset. It might be that, in our dataset, the category considered “less convenient” by Nielsen (from a general analysis of the Italian retail industry) does not have such characteristics in comparison to the other ones included in our data. Hence, when we include in our analysis the categories, this variable is not significant anymore. Furthermore, in the first model all the observations are treated as independent, while the connections with other goods is an essential aspect when considering, e.g., the product variety within a category.
In models (4) and (5) there is a growing trend over time, with the third year (2015) highly statistically significant, with an OR of approximately 4.
While the growing trend over time might merely signify a more vigorous promotion with time passing, it might also point to a different strategic approach regarding promotions starting from 2015. According to retail channel reports (among others, see: IRI Topline, 2015; IRI, July 2015; IRI, September 2016; Nielsen, 2014; Nielsen, June 2016; Nielsen, November 2016), a growing trend could be due to a new approach in PL promotional strategies. The defensive and supporting strategy we presented in the previous sections led to a linear increment in the probability of having promotions in the latest year of our dataset.

78
If we consider corresponding trimesters of each year (i.e. season), in model (5), relevant outcomes can be observed for “Season 3” (i.e. from July to September) and “Season 4” (i.e. from October to December). We can define the former period as summer, since it approximately reflects that period of the year (details in Appendix A: Time), while the latter can be defined as autumn. We discuss this result in the next section, since a related and more significant result comes out from causal analysis.
2.5.2 Causal Analysis
Table 4 shows the ATE (Average Treatment Effect) and the ATT (Average Treatment Effect on the Treated) estimations of promotions on revenues. Table 5 reports the ATE and ATT estimations of promotions on quantities.
ATE concerns the treatment effect for the overall target population in the study (i.e. treated and untreated together). ATE investigates therefore the effect of promotions if products were under promotion versus all the products.
ATT concerns the treatment effect only for the treated. ATT investigates, thus, the effect of promotion on the products under promotion. ATT differs from ATE because it is only for treated (i.e. under promotion, in our analysis) individuals.
We start considering only revenues (or quantity) and categories (1). Then, regressions from (2) to (5) include more variables that significantly influence promotions: substitutive and lessconvenient (2), complementary (3), incidence (4) and assortment (5). In (6) and (7), we also add season and year, to consider time variables, too. We can then accordingly understand the change in revenues/quantity when in promotion (in comparison to when not in Promo) and the impact of the considered variables.

79
Table 4 ATE and ATT estimations of Promotion on Revenues (1) (2) (3) (4) (5) (6) (7)
ATE (1 vs 0)
162.75† (16.21)
125.30† (13.14)
120.15† (13.93)
109.98† (14.46)
77.66† (8.52)
82.97† (9.20)
95.85† (10.18)
ATT (1 vs 0)
168.64† (18.94)
129.95† (15.07)
130.39† (15.97)
125.04† (16.89)
87.97† (10.32)
90.98† (11.14)
96.33† (11.84)
Category ✓ ✓ ✓ ✓ ✓ ✓ ✓
Substitutive & LESSconvenient
✓ ✓ ✓ ✓ ✓ ✓
Complementary ✓ ✓ ✓ ✓ ✓
Incidence ✓ ✓ ✓ ✓
Assortment ✓ ✓ ✓
Season ✓ ✓
Year ✓
Observations 1331 1155 1089 1045 1012 863 553 Notes: ATE and ATT are based on exact matching on the categorical variables listed for each model. Each observation is matched to one nearest neighbours with replacement. Observations for which exact matches are not available are removed from the sample. Abadie-Imbens standard errors are reported in parentheses. † p < 0.001.
Table 5 ATE and ATT estimations of Promotion on Quantity (1) (2) (3) (4) (5) (6) (7)
ATE (1 vs 0)
107.02† (11.04)
83.49† (9.13)
78.66† (9.63)
72.82† (9.94)
57.06† (8.40)
60.70† (9.19)
71.96† (11.34)
ATT (1 vs 0)
110.13† (12.80)
88.46† (10.30)
88.11† (10.97)
85.23† (11.53)
66.63† (9.87)
67.32† (10.69)
72.51† (12.84)
Category ✓ ✓ ✓ ✓ ✓ ✓ ✓
Substitutive & LESSconvenient
✓ ✓ ✓ ✓ ✓ ✓
Complementary ✓ ✓ ✓ ✓ ✓
Incidence ✓ ✓ ✓ ✓
Assortment ✓ ✓ ✓
Season ✓ ✓
Year ✓
Observations 1328 1155 1089 1045 1012 863 553 Notes: ATE and ATT are based on exact matching on the categorical variables listed for each model. Each observation is matched to one nearest neighbours with replacement. Observations for which exact matches are not available are removed from the sample. Abadie-Imbens standard errors are reported in parentheses. † p < 0.001.
80
Exact matching, as shown in the last lines of the tables, reduce the number of observations. Specifically, from 1331 to 553 for Table 4 (revenues), while from 1328 to 553 for Table 5 (quantity).
For all the estimations, the beneficial effect of promotion decreases when we add more variables to be matched, from (1) to (5). However, the effect slightly increases when adding time variables (i.e. season, 6, and year, 7).
Table 4 indicates that for revenues the effect is higher if we restrict the analysis of the impact of promotions only to products under promotions (i.e. ATT). Differences between ATE and ATT coefficients are rather stable. For ATE the coefficient goes from approximately 163 in (1) to roughly 78 in (5), while it is almost 90 adding time variables (6) and (7). For ATT the value of coefficient goes from nearly 169 (1) to about 88 (5), increasing again to about 94 adding time variables (6) and (7).
The same behaviour of coefficients is shown when studying the exact matching ATE and ATT estimations of promotion on quantity. ATE coefficient decreases from 107 (1) to 57 (5) and increases to approximately 66 adding time variables (season, 6, and year, 7). However, ATT coefficient values are about 110 (1) then diminishes to almost 67 (5) and is roughly 69 with time variables (6) and (7).
When we add more variables to be matched, the coefficients decrease. This is caused by the fact that we are controlling for factors which are related to promotional activity. From the literature examined in the methodology section of exact matching, it is stressed that the variables we consider are linked by promotion.
Having such results for ATE and ATT estimations of promotion on revenues and quantity, we can state that no considerable differences occur when analysing the beneficial increasing effects of promotional activity among revenues and quantity.
The reason why the coefficients slightly augment when including time variables is linked with the results on year and season of the descriptive analysis.
In the descriptive analysis, there is a relevant consideration affecting the significance of summer, as well as its positive influence in pushing a product under promotion. We expected that December, and therefore autumn in our dataset, could be the period during which there is the highest promotional pressure, due to Christmas and New Years’ Eve celebrations. However, in the light of a defensive strategy, it is reasonable to also have a positive
81
significant impact of summer as a season augmenting the probability of having promotions. Retailers want to avoid any possible slowdown in sales. A higher promotional activity represents, as previously seen, a basic strategy to avoid decreases. Hence, in this case promotions are set to maintain the market share in those periods where sales of non-seasonal products do not receive any boost92. This is supported by the fact that in both ATE and ATT estimations, the coefficients augment if we add season and year. Moreover, the retention of sales in “depressed” periods is perfectly coherent with the defensive aspect of the new retailer strategy.
We want to understand the impact of the new promotional strategy on quantity and revenues. This helps fill the current gap on understanding a new type of promotional strategy.
Even if these results are highly expected for quantity, this is not the same for revenues. In any case, since in our analysis we consider all the relevant categorical variables that can influence promotions, our results underline the existence of an increase in quantity and revenues in the presence of promotional activity. In the methodology section, we discussed the role and the importance of the considered variables in promotional activities of supermarkets.
Before interpreting the differences between ATE and ATT results, we study the impact of promotion on quantity and revenues accordingly to the underlying strategies, and we also interpret the connected results.
It is straightforward that the presence of promotion would provide a significant positive impact in augmenting quantity sold by supermarkets. If we decrease the price of a product, more people will be willing to buy it93. This positive relation (lower price-higher quantity sold) is independent from the underlying strategy of the promotion.
From the literature, we know of the existence of several types of promotions, (e.g. clearance promo or new product introduction, among others) and we discussed the new defensive or offensive strategy in the previous section. For any of those promotional strategies, it is extremely
92 For some seasonal trends see, among others: IRI, October 2016. 93 For a study on price elasticity on food categories see, among others, Andreyeva et al. (2010). For general effect of price reduction on demand see, among others, Varian (1992).

82
likely that quantity sold will rise94. On the other hand, this is not the case of revenues.
The effects of promotion on revenues significantly varies accordingly to the underlying strategy.
In case the underlying strategy is due to the clearance of seasonal products or to a below-cost selling for advertising purposes, very little, if any, effect is expected for revenues. However, if we analyse the results of ATE and ATT estimation of promotion on revenues, we can exclude the possibility that the background strategy tends to augment the quantity without any effect on revenues. Hence, we can state that the underlying strategy is not a clearance selling, or something with similar purposes.
If we interpret the value of the coefficients, we can affirm that they support our hypothesis that promotional strategy is no more offensive, but has rather become a defensive and supporting one. This is due to the fact that an offensive promotional strategy would significantly decrease the gap between PLs and NBs, with consequent notable contraction in revenues, as reported by the literature analysed in the previous sections. However, the coefficients of revenues do not illustrate such behaviour.
Furthermore, the results for ATE and ATT estimations are similar. This underlines the existence of two branches in the new promotional strategy. If there has been a bigger difference between ATE and ATT coefficients, this would have suggested the existence of only one, predominant, strategy. In case of higher ATE values, this would underline the presence of a strategy aimed to support the non-promoted products. Higher ATT values however would emphasise more significant benefits exclusively for promoted goods. Since this is not the case, the new promotional strategy is therefore composed by two branches.
First of all, as explained in the previous sections, offensive strategies are no more effective, hence the maintenance of an existing quota is possible only through a defensive strategy. The ATT coefficients reported in the tables support the relevant beneficial effect of promotions on products in promo. From a strategical point of view, in the short term, the only effective weapon retailers can count on is promotion. NBs try to exploit the
94 For the different kinds of price reductions (e.g. seasonal, physical or obsolescence perishability) see, among others: Walters (1991), Bobinski et al. (1996), Smith & Achabal (1998), Voss & Seiders (2003), Levy et al. (2007), Wang & Webster (2009), Hemalatha & Sridevi (2013) and Choi et al. (2014).
83
advantage derived from an increase in PL price which reduces the gap, further decreasing their price using promotion. As such the price difference between them is negligible and consumer preference will most likely go towards NB products. Against this attack, retailers must react as fast, and effective, as possible. Given the time and investments spent for gaining a relevant market share, it is worthy to adopt countermeasures which might slightly contrast with the current strategy. In the very short period, no strategies aimed at improving consumer behaviour or perception are effective: the only adequate response is to maintain a decent price gap using exactly the same tool.
Secondly, we can detect a supporting strategy for the premium PLs. Given high prices, consumers would be more sensitive to quality and to premium goods. Moreover, premium PLs usually avoid direct promotional activity. Therefore, in this category promotions will be set for standard PL products with the aim of boosting premium PL purchases.
Similar coefficients of both ATE and ATT estimations highlight that there are benefits both for treated (under promo) and non-treated (not in promo) products. This means that the new promotional strategy has two branches. It is both a defensive and a supporting promotional strategy.
The following question must therefore be asked: when is it good to fight, in terms of defensive promotion, to maintain PLs market share against NBs and when, instead, is it better to adopt another strategy where promotion plays a supporting role?
To answer this question, we analyse the results explaining the different rationale behind the two branches of the new promotional strategy.
It is true that consumer perception on quality is extremely important for moving forward in PL penetration in the market. This is fully acknowledged by scholars (among others, see: Lichtenstein et al., 1993; Lybeck et al., 2006) and retailers, too. Price reduction was an effective strategy during the first decade of this century, but now the only winning strategy is to differentiate the offering, both vertically and horizontally, with the latter being the preferred. This means higher quality products, namely premium PL goods, organic PLs and many other niche products in the same category.
In many cases, the introduction of premium goods, as written in IRI and Nielsen reports, results in higher quality products sold at higher prices for more demanding consumers. A higher price is the direct consequence of this logic. As illustrated in the previous paragraphs, higher prices further reduce the already low existing gap between PLs and NBs, making the latter

84
more attractive for consumers (since they are, on average, more likely to choose a NB). Also, in case of persistent and high promotional activity from NBs, the only effective and immediate reply is to offer PL goods under promotion, too. However, this is not the only logic retailers should define against NB promotional strategy. Supermarkets should support the introduction and the acquiring of market share of premium (or biological, or other niche private brands) PL products, too. Even if a defensive strategy is successful for the tasks of standard PLs, a strategy merely based on counter promotional activity is not effective for premium PL penetration. On the contrary, a smarter promotional activity is powerful. What might a “smarter promotional activity” consist in? It should be a strategy that not only defends PL from NB attacks, but that also supports the main task concerning premium segments, and “niche” ones (e.g. organic), too. Therefore, promotions must be adopted in those cases where they are useful as defensive and/or as supportive for another product of the same product category.
Summarizing, PL promotional activity has two purposes. On one hand, it combats NB promotion to keep the price gap constant, and to maintain market share and customer loyalty. On the other hand, it has the effect of a flywheel for non-promoted PLs in the same category. In both cases, promotional activity is set for standard PLs. However, with respect to the former, the aim is to generate positive outcomes for standard PLs themselves, while in the latter, premium (or bio, or other niche) PLs will benefit from the promotional activity. Our results also sustain this logic.
Moreover, beneficial effects of promotion on both quantity and revenues demonstrate that the retailer is able to reach several tasks. First of all, the retailer manages to maintain the existent market share. Then, he is able to not depress revenues. Finally, there is the possibility for premium PLs to penetrate in new segments and, at the same time, to receive benefits from both branches (i.e. defensive and supporting) of the new promotional strategy.
2.6 Conclusion
Promotional activity has been, for years, the most frequently adopted strategy for PL penetration. Intense promotion has then been a strategy of NBs, too. However, since margins have become extremely narrow, the price war was no longer sustainable and change in this trend was required. Recently, reports have pointed out several new behaviours that suggest big

85
changes in strategies. Hence, a study on real and unique data from a leading Italian retailer regarding new promotional strategies was strongly needed.
The task of this study is to analyse the promotional activity of PLs in order to explain the new promotional strategy, with respect to both its motivations and its effects. In doing so we study the effect of categories, the characteristics of relevant products and categories, revenues and time on promotions. We implement several estimations on logit and longitudinal logit models, refining the analysis and comparing, when present, the differences between the models to understand the background motivations. Moreover, we perform exact matching (on the considered categorical variables) ATE and ATT estimations of promotion on revenues and quantity.
The analyses we propose demonstrate the existence of a new promotional strategy which operates in two ways (that might be carried out together or singularly): defensive and supporting. Promotions are usually set for standard PLs in any case, but, in accordance with which between the two tasks retailers want to achieve, standard PLs themselves (defensive) or premium PLs (supporting) will benefit from them.
Promotions over standard PLs, are now adopted by retailers as a defensive strategy against NB discounts which in turn are set to reduce the price-gap. Therefore, defensive promotions represent a sort of reverse price-reduction. Contrary to the preceding years, promotions are now exploited, by standard PLs, as an instant and effective short-term response when intense promotion is set by NBs. In this way, retailers try to maintain the market share they have previously gained. Furthermore, promotions might lead to reductions in margins, hence to profit losses, which then represent a long-term investment in terms of market share maintenance. This new retailer behaviour is particularly clear studying the results of our analysis.
Furthermore, our research identifies another branch of new retailer promotional strategy. According to this, promotion is now also exploited as supporting strategy. Retailers have introduced, in the last 10 years, premium (and organic, vegetarian and several others) PL products to satisfy the need for quality, and sometimes niche, products as expressed by consumers. Premium PLs offer better quality at higher prices and consumer behaviour towards them is different with respect to that of standard PLs. Until few years ago, PLs were about standard goods sold at very convenient prices. Moreover, many times promotions made PLs even more convenient. With the change in consumer behaviour and the introduction of new PLs, retailers must give the idea to consumers that PLs can also include good

86
quality products in their offering. It is a demanding issue to penetrate a market where consumers care about quality, ingredients, package and many other aspects apart from price. Furthermore, competing in price (as it has been extensively done for standard PLs penetration) is in this case not only inefficient, but also counter-productive. Hence, retailers devised a method aimed at attracting consumers with indirect offerings: discounts were made over standard products in the same category as premium ones. Not able to directly promote premium PLs, the new supporting strategy sets promotions for standard PLs in the same category in order to boost the purchases for similar premium PLs. The results of the seasonings, marinated vegetables and pickles (condimenti, sottoli e sottaceti) category provide, among other significant results, a rationale of supporting strategy. There are also some categories, like for example pasta and rice (pasta e riso) in which both branches of the new strategy take action.
Through exact matching on categorical variables ATE and ATT estimations, we study the impact of promotion on quantity and revenues. These estimations support the existence of a strategy aimed at having beneficial effects, both in terms of quantity volumes and revenues, for promoted and non-promoted goods. The results supported our hypothesis of a new strategy with both defensive and supporting tasks.
The new defensive and supporting strategy of promotions is relevant since it identifies the new battlefield between retailers and NB manufacturers. This is valuable both from managerial and theoretical perspectives. Since both retail and manufacturer managers have to make decisions according to marketing strategies, it is crucial for all of them to understand the background motivations and mechanisms. Theoretically, it is valuable to have a study which, through a unique dataset, demonstrates the existence of the new defensive and supporting strategy and depicts a clear analysis of all the strategies and motivations involved.
Nevertheless, this research has some limits. The biggest one is the geographical limitation of the dataset. Although it is a unique dataset, it only reports data of western central Italy for 11 trimesters (over the years 2013, 2014 and 2015). Hence, we suggest replicating this analysis using a bigger geographical area and considering more years. It would also be of extreme value to have the possibility to conduct the study using two datasets from two different leading retailing chains from that enlarged geographical area.

87
Chapter 3
3. The role of Geographical Indications and Countries’ “Made-In” Power in Global Trade of Wild Edible Mushrooms and Truffles
This chapter analyses the Geographical Indications95 (GIs) as standardised labels to guarantee quality and origin. Moreover, we study the power of some countries’ “Made-in” labels (i.e. the worldwide recognised importance of some countries in terms of products and/or the ability to process them).
Quality labels represent a competitive advantage for firms that sell particularly excellent and high-quality products, especially when fruit of a firm’s specialised knowledge or long-standing tradition in producing the good with respect to other players in the market96. Despite representing a
95 Article 22 of TRIPS (Trade-Related Aspects of Intellectual Property Rights) Agreement defines GI as “… indications which identify a good as originating in the territory of a Member, or a region or locality in that territory, where a given quality, reputation or other characteristic of the good is essentially attributable to its geographical origin.” Source: WTO - World Trade Organization. https://www.wto.org/english/docs_e/legal_e/27-trips_04b_e.htm. 96 About firm resources and sustained competitive advantage see, among others: Barney (1991), Peng (2001), Lockett et al. (2009) and Kozlenkova et al. (2014). For competitive advantage of local quality products and GIs, see Fotopoulos & Krystallis (2003) and Presenza et al. (2010). About GIs and their link with quality, geographical areas and other aspects, see, among others: Evans (2010), Moschini et al. (2008), Becker & Staus (2009), Profeta et al. (2010), Menapace & Moschini (2012).

88
crucial resource for companies, their importance is still not fully recognised, hence a study on this aspect and other related issues is much needed.
Using a mixed-method approach (Molina-Azonir, 2012; Bam, 1992; Creswell & Clark, 2007; Harrison & Reilly, 2011), specifically the initiation design (Davis et al., 2011), we study GIs and “Made-in” power starting from a quantitative analysis and then moving towards a more specific analysis of Italy and the case study.
For achieving these tasks, we carefully chose the type of products with the best characteristics to emphasize the crucial aspects. This is possible through the analysis of a peculiar, yet representative, market: edible wild mushrooms and truffles (we examine two internationally recognised categories: fresh/chilled and dried/powdered, details are provided later in the chapter).
There are two principle characteristics that make wild mushrooms and truffles suitable for our research.
The first one is perishability. This is particularly true for the fresh/chilled category. It is not possible to store the analysed products for long time; a mushroom’s shelf life, stored at room temperature, is about two days (Boyer & McKinney, 2013). Moreover, they need to be preserved in a specific way. According to Singh et al. (2010), temperature and relative humidity must be carefully balanced to preserve mushroom quality. However, in the case of dried mushrooms too, there are specific techniques and preservation methods to be observed (Fernandes et al., 2014).
The second one is the absence of a specific added value. This is certainly true for fresh wild mushrooms and truffles. However, if we exclude the preservation processes (e.g. drying or chilling), no further significant value is added to the product during the postharvest chain.
Below we present the structure of this research, which, according to Molina-Azonir (2012) and Davis et al. (2011), is divided into two main parts.
In the first part of this study, we initially use networks to depict the global trade of wild mushrooms and truffles, thus illustrating its main characteristics. Then, we investigate the most important nodes of the networks, which represent the worldwide hubs for import/export flows of wild mushrooms and truffles. We highlight the distinction between the two categories, and consequently the differences in trade behaviours, as well as

89
the existence of anomalies. We also provide a method to detect the existence of a possible kind of arbitrage in the countries with significant “Made-in” power and favourable export/import price differences.
Then we move to the second part of the chapter.
To go deeper in the analysis and to proceed towards the study of GIs, we chose the Fungo di Borgotaro case study. After a general analysis of global trade, we narrow our focus to the Italian market. The Fungo di Borgotaro was the first, and only, wild product of the “Class 1.6. Fruit, vegetables and cereals fresh or processed”97 to receive a PGI label in 1996 and, in 2016, a quality certification from a certification and inspection company (CSQA)98. Therefore, the Borgotaro can be taken as an example of the introduction of a GI label into a market where the guarantee of quality and origin is strongly needed.
Since the Fungo di Borgotaro represents a noteworthy case study, following the mixed-method approach, we begin with a focus on Italy and then we present more in detail the specific example (i.e. the Fungo di Borgotaro PGI label). Here we propose a connection with the anomalies that emerge from an analysis of worldwide trade. A trustworthy explanation of them comes from seizures made by Italian law enforcement agencies. They prove the existence of a process of fraudulent labelling which exploits the “Made in Italy” power in the agri-food industry.
From the depiction of the Italian market and the proven frauds, the importance of guaranteeing the origin and quality of products adopting internationally recognised standards is evident. Therefore, as a conclusion of the refining process of this research, we propose the Fungo di Borgotaro as an example to replicate where similar circumstances occur.
It is noteworthy to highlight that also truffles, which belong to the same analysed categories of wild mushrooms, present identical issues emphasised in the Fungo di Borgotaro example. A recent article underlines the request of the town council of Alba (Cuneo) (an Italian town that is famous for its quality truffles) to defend the local truffle label 99 . This
97 Source: European Commission, Agriculture and Rural Development, DOOR. http://ec.europa.eu/agriculture/quality/door/registeredName.html?denominationId=320 98 Source: Qualivita Foundation. http://www.qualivita.it/news/il-fungo-di-borgotaro-igp-diventa-lunico-certificato-in-europa/ 99 Source: Ansa.

90
represents only one additional example of the increasing importance of protecting the quality and origin of products.
3.1 Theoretical Framework From the last decade of the 20th century, focus has shifted from quantity to quality in many sectors. Food is indeed one of them, and as such the introduction and protection of GIs, as well as other certifications or assurance schemes, has become crucial for the EU (Becker & Staus, 2009; Hooley, 1988; Evans, 2010; Profeta et al., 2010). Moschini et al. (2008) state that GIs can competitively guarantee quality with beneficial outcomes, in terms of welfare, mainly for consumers and, in some cases, also for producers. GI labels augment the effect of reputation in a process for assuring quality linked to specific characteristics of local territories (Menapace & Moschini, 2012; Evans, 2010). Quality labels, according to Fotopoulos & Krystallis (2003), give a company a competitive advantage. Moreover, these labels can reinvigorate local economies and can help in coping with trade liberalisation (Suh & MacPherson, 2007). These are the reasons why we want to provide a method to depict, analyse and then investigate the characteristics and the behaviour of GIs and “Made-in” labels and, more in general, quality-recognised products.
The kind of “resource” (Barney, 1991) we use to achieve our results is composed of wild edible mushrooms and truffles (both fresh/chilled and dried/powdered ones). Before proceeding to the next section, a biological framework is needed to better understand the kind of resource we are going to use in our analysis.
Wild edible mushrooms, including truffles, are an essential component of culture and traditional cuisine of many countries around the world, especially in Europe, North America and Eastern Asia where many edible species have long been harvested by rural populations for self-consumption and commercial activities (Boa, 2004; Arora, 2008; Sitta & Floriani, 2008; Feng et al. 2012; Sitta & Davoli, 2012). Wild edible mushrooms are economically considered one of the most important non-timber forest products. Nowadays more than 2000 fungal species that are classified as edible are harvested, consumed and sold in more than 85
http://www.ansa.it/canale_terraegusto/notizie/prodotti_tipici/2017/04/22/tartufo-albano-a-generiche-denominazioni-bianco-e-nero_4b242ff7-add6-4824-9358-7c0581953330.html

91
countries around the world (Boa, 2004; Ortega- Martínez & Martínez-Peña, 2008; Sitta & Davoli, 2012). Current estimations assign a global market value to edible mushrooms of at least 2 billion US dollars more than the market value timber (Boa, 2004; Cai et al. 2011; Ágreda et al. 2014).
Over the last decades, the globalization of trade, the expansion of markets for specialty products, the decreasing of wood prices and the restrictions placed on logging has made the economics of mushrooms more attractive for the forest sector (Cai et al. 2011). The interest in commercial harvesting of wild edible mushrooms has considerably increased in many regions in the world. So far, several mushrooms species are picked in more areas than ever before, especially in remote forested regions of developing countries (e.g. Africa, Nepal) where the opportunities to make money are quite scarce and the collection of wild edible mushrooms represents an important source of income (Arora, 2001, 2008; Christensen et al. 2008; Sitta & Davoli, 2012).
Several studies explicitly pointed out that the collection and consumption of wild edible mushrooms is a profitable task for both developed and developing countries. De Romàn & Boa (2006), Voces et al. (2012) and Diaz-Balterio et al. (2013) examined the marketing demand for wild edible mushrooms in North-Eastern Spain with a special focus on the Saffron milk cap (Lacatius deliciosus Fr.), a popular and greatly appreciated species in Spain. Using econometric methods, the authors have found that price increase had a negative effect on demand. Pettenella & Klhoehn (2007), Sitta & Floriani (2008), Sitta & Davoli (2012) analysed the Italian market trends with a special emphasis on Porcini (Boletus edulis Bull. and allied species) and Truffles (Tuber spp.). According to these studies, Italy has emerged as focal point of a global market for several mushrooms species, in particular Porcini. They also emphasized that the declining production of some prized mushrooms species is well documented in different countries around the world; new strategies to increase production and to preserve important natural growing areas are needed in the medium- and long-terms.
The commercial harvest of edible mushroom from forests of the pacific northwest United States has been extensively documented (Pilz et al. 1996; Pilz & Molina, 2001; Pilz et al. 2004; Arora & Dunham, 2008). A large commercial crop of Morels (Morchella species) and Chanterelles (Cantharellus spp.) are annually harvested from these mountainous areas. Schlosser (1995) and Watling (1997) estimated the worldwide income of Morel and Chanterelle production at 1.67 and 5.2 billion US $, respectively.
92
More recently, Feng et al. 2012 stated the export values of Porcini and Matsutake mushrooms (Tricholoma matsutake (S. Ito & S. Imai) Singer) from the Yunnan Province in southwestern China. They estimate that in 2010 10,572 tons of fresh boletes were exported from China to Europe for an equivalent of 71.83 million US $. This amount exceeded the 47.35 million US $ produced by the greatly appreciated Matsutake in Asia in terms of export (Feng et al. 2012).
On the contrary, very little information is available from other countries that have a role in the commercial exploitation of mushrooms. Cai et al. (2011) documented that only recently in some northern European countries (e.g. Finland) mushrooms harvesting has become a significant source of income for rural dwellers.
What emerges from the above-mentioned studies is that the quantitative estimates are often quite variable and country-specific. It is well known that the primary use of collected production is related to self-consumption and that intermediate links within the value chain are not regulated (Voces et al. 2012). The scarcity of data highlights that mushrooms are collected for free and mainly sold on local markets. It also shows that quantities and prices are unknown, especially in terms of truffle species (Pettenella & Klhoehn, 2007). Thus, making comparisons between the different countries is a hard task due to the lack of data. Available statistical data are often patchy, come from different data sources and do not account for collected volumes by privates (Cai et al. 2011; Turtiainen & Nuutinen, 2012).
Since non-timber forest products, and especially wild edible mushrooms, are potential complementary or alternative sources of revenue to timber, there is a pressing need to monitor the market volume and values at a global scale. Most of the available information is often related to a given country and/or a time period (e.g. a single year). Thus, the effective global socio-economic relevance of wild edible mushrooms is largely unexplored.
3.2 Objectives and Rationale
This study individuates the competitive advantage for local and quality-oriented firms in the exploiting of quality labels. More specifically, we analyse the use of GIs and, in certain cases (i.e. some specific products in certain specific countries) of “Made-in” label power.
In order to stress the importance of GIs and the “Made-in” concept we individuate a specific market: wild mushrooms and truffles. Using a mixed-
93
method approach100 we first conduct a quantitative descriptive analysis and then we analyse a more specific market and a case study, connecting the results in the first part with the discussion in the second one.
This research depicts the global trade of wild mushrooms and truffles with the aim of describing and understanding the current relationships between all the players. However, the main objective is to uncover the occurrence of irregularities and not and to propose a possible solution through the use of labelling.
Additional goals of this study include the depiction of a decennial evolution (2003-2012) of this trade and the detection of the countries which play a central role, either globally or locally. The identification of central countries in this trade is useful to infer the market power and the existence of a potential arbitrage. Do anomalies encourage these practices?
Furthermore, in the interest of complementing the above analysis, we further explore the role and the dynamics of major Western countries. In the first part of the chapter (i.e. in the quantitative descriptive analysis) we recognise the countries (i.e. nodes in the global network) that play a central role in worldwide trade. This investigation leads us to focus our attention on one of the major Western countries in particular, Italy, which we examine it in detail accordingly.
The last analysis carried out in the first part of this study investigates whether the individuation of countries with relevant “Made-in” power (using BC values) and their combined analysis with export and import prices allow for the unearthing or the suggestion of the existence of a potential arbitrage.
In the second part of this study, we analyse in detail the Italian market and the case study of the Fungo di Borgotaro IGP, using both the results of the first part and integrating some further descriptive analyses.
Given that GIs and “Made-in” labels are valuable resources that represent competitive advantages for firms, we also investigate whether it is possible or not to guarantee and protect the quality and origin of valuable (wild) products.
Could GIs be a solution for guaranteeing quality and local (rural) area development? Could the Fungo di Borgotaro represent a potentially replicable example?
100 Davis et al (2011) and Molina-Azonir (2012).

94
We synthetize the concepts above in two main research questions. Since we can use the approach and the methods of this study for several food products, we present our research questions in a more generalised way. However, for the sake of clarity, we then concentrate our analysis specifically on the products we consider. Nevertheless, the main resulting theories do not vary even if the product in question is changed.
1. How does the global trade of some valuable resources (i.e. products) behave with respect to: central nodes, opaque practices and trends?
2. Could GIs and “Made-in” labels not only give a competitive advantage, but also represent a solution to assure origin and/or quality? Would GIs support local development?
To answer the first question, we model the worldwide trade of wild mushrooms and truffles as networks. Our desire to study and understand both the general features and the hidden characteristics of mushroom and truffle global trade represents the rationale behind the choice of a network modelling
The first point to address within the framework of a deeper analysis is the identification of the countries involved. The available literature may list the countries where mushrooms and truffles grow, but we are interested in understanding where such countries export (including exports towards apparently less relevant markets).
Understanding which countries are the most influential constitutes the second point. The existing literature underlines some major countries in wild mushrooms and truffles trade, however this study provides a network-based explanation and, in addition, underlines the interconnections among countries.
To answer the first research question there is a third point to be addressed: the identification of the countries that act as “hubs”. Some countries, even those without a relevant production, or a production that is not as big as the volumes traded, might play the role of “hub”. Huge volumes of mushrooms and truffles, imported from producing countries, pass through the “hub” countries to then be traded once again to other countries (i.e. re-exports of the same products).
The fourth point examines the evolution of global trade. The analysis of several years allows for the examination of time evolution and circumvents yearly production problems biases. Furthermore, it provides information

95
about entrance, or exit, of new players in the market, but also about variations (increases or decreases) in the market share.
With respect to the fifth point, we pose the following question: does the importance of trade and a given country vary according to product characteristics? We analyse the same products, wild mushrooms and truffles, traded in two different ways: fresh or chilled and dried or in powder (whole, cut, sliced, broken or in powder). This gives an idea of trade behaviour in terms of different objective characteristics. We expect that fresh or chilled goods are less likely to be traded over long distances; it might be unprofitable to ship them to geographically distant locales. If fresh, they should be transported quickly, which is costly. If chilled, they must be shipped at low temperatures, which is also expensive. On the other hand, dried or powdered wild mushrooms and truffles do not need special care. Moreover, dried or powdered goods are lighter and occupy less volume, which also helps in saving shipping costs. These factors make dried wild mushrooms and truffles easier to ship worldwide.
Finally, do export/import price differences and concurrent “Made-in” power make the exploitation of some advantages possible? Are there anomalies or any kind of arbitrage?
We start by showing all the networks for the considered years, both in terms of 070959 (fresh/chilled) and 071239 (dried/powdered), and then, through the analysis of the points written above, we move towards the answer to the second research question.
3.3 Methodology
3.3.1 Data Source
All the datasets are acquired from the "United Nations Commodity Trade Statistics Database" (UN Comtrade) which collects the official statistics data on global trade. UN Comtrade is a repository of official international trade statistics and relevant analytical tables and offers a wide variety of commodity lists, derived from both countries and national statistic agencies. Using the same data-source it is possible to make comparisons between countries, in terms of the exported products volumes, and consider the interconnections they have.

96
Specifically, from the UN Comtrade database we have selected all the available datasets related to “mushrooms and allied” (e.g. vegetables) among which we have selected two categories (identified with an international code), as detailed below:
• 070959 "Edible vegetables and certain roots and tubers // Other vegetables, fresh or chilled. // - Mushrooms and truffles : // -- Other": including wild mushrooms (excepted Agaricus) and Truffles that might be both fresh or chilled;
• 071239 “Edible vegetables and certain roots and tubers // Dried vegetables, whole, cut, sliced, broken or in powder, but not further prepared. // - Mushrooms, wood ears (Auricularia spp.), jelly fungi (Tremella spp.) and truffles : // -- Other”: that comprise dried wild mushrooms (excepted Agaricus, Jelly fungi (Tremella spp.), Wood ears (Auricularia spp.)) and Truffles.
It is useful to underline that edible mushrooms can be classified into two different types: wild and cultivated. The former group comprises species that grow naturally and that can be picked in the natural ecosystems in which they grow, for instance forests. The latter, instead, refers to species that can be also yielded by cultivation. Cultivated mushrooms include species belonging the genera Agaricus (i.e. the famous “champignon”), Pleurotus and Lentinus.
Generally, the designation of “mushroom” distinguishes species which cannot be easily cultivated since most of them live as symbionts (Kirk et al. 2008), for instance by ectomycorrhizal symbiosis, with other organisms, such as plants. The growth of ectomycorrhizal fungi is strictly dependent on this natural, sometimes specific, association and for this reason it is difficult (e.g. Boletus edulis), sometimes impossible (e.g. Tuber magnatum) to produce any of these species by artificial means (e.g. by industry) (Mueller, 2004; Deacon, 2006).
Most of the mushrooms represent the major precious species in the world, such as: Porcini (Boletus edulis Bull. and allied species), Matsukate (Tricholoma matsukate (S. Ito & S. Imai), Canterelles (Cantharellus cibarius Fr.), Saffron milk caps (Lactarius deliciosus (L.) Gray), Caesar’s mushroom (Amanita caesarea (Scop.) Pers), Truffles (e.g. Tuber magnatum Pico, T. melanosporum Vittad., T. melanosporum Vittad., T. brumale Vittad., T. aestivum Vittad., and T. uncinatum Chatin) and many others with a lower
97
market value (Boa 2004; Arora 2001; Sitta & Davoli 2012). It should be noted that the aforementioned wild species are all ectomycorrhizal. An exception must be made for the Tuber melanosporum and the group of “Black Truffles”, because it is possible to cultivate these species (Zambonelli & Bonito, 2012).
Wild and cultivated mushrooms differ in terms of global distribution, consumption, commercial demand and market prices. In this study, we only considered wild edible mushrooms and truffles, both fresh/chilled and dried/powdered, selected from UN Comtrade repositories.
An analysis of wild mushrooms and truffles might present some data problems. As stated by ISPRA (2009) those products deal with activities that are not possible to be considered in official statistics: auto consumption, “informal” economic activities and extremely niche markets. However, data from ISTAT, UN Comtrade and ISPRA (the data we use in this analysis) can be considered accurate and trustworthy.
For each category described above (070959 and 071239), we use the volumes exported from any country in the world during the years 2003, 2006, 2009, 2012, and 2015. We start considering our observations from 2003 because that year yielded a particularly large crop (Sitta & Floriani, 2008), for which we consider it to be a sort of “year zero”. Then we take observations every three years, until 2015, to have a good proxy of trade evolution.
Even though we have both quantities in Kilograms and value in US dollars101, we use the latter information since it better quantifies the size and the kind of trade for each country. Moreover, dealing with a dataset where several kinds of mushrooms and truffles are both present, money value helps in trying to approximately understand which good is traded.
We also use the relation between quantities and values for the major countries.
The focus on Italian trade introduces the final part of our research, the one dealing with the Fungo di Borgotaro, GIs and “Made-in” power. In this part,
101 As declared in the UN Trade Statistics website: “All commodity values are converted from national currency into US dollars using exchange rates supplied by the reporter countries, or derived from monthly market rates and volume of trade. Quantities, when provided with the reporter country data and when possible, are converted into metric units” (http://unstats.un.org/unsd/tradekb/Knowledgebase/What-is-UN-COMTRADE).

98
we use UN Comtrade data, incorporating important data from ISTAT, the Italian National Institute of Statistics, and Italian regional datasets.
3.3.2 Data Analysis
A network represents the natural tool to display countries as nodes and their connections as paths, especially useful towards understanding dynamics and trends.
For the main analysis, all the data are processed using a simple python code. We are particularly interested in networks of worldwide exports and in specific plots concerning peculiar trade aspects.
Scatter plots (see Appendix G: Graphs: BC / OD and Appendix H: Graphs BC / OD (log) for details about BC/OD graphs) and tables provide useful insights for answering definite questions. More specifically we correlate Betweenness Centrality (BC) and Out-degree (OD).
A Network, or Graph, is a set of edges and nodes connected together by a set of lines or arrows.
It is defined as an ordered pair 𝐺 = (𝑉, 𝐸) , where 𝑉 is a set of vertices or nodes{𝑣1, 𝑣2, … , 𝑣𝑛} (it is the basic element) and 𝐸 is a set of edges (set of unordered pairs of elements of 𝑉. It is represented as a line connecting two nodes, called endpoints or end vertices) (Aldous & Wilson, 2003; Wasserman & Faust, 1994).
If {𝑣𝑖 , 𝑣𝑗} is in 𝐸 , then 𝑣𝑖 and 𝑣𝑗 are adjacent. Thus, (Biggs, 1993), the
adjacent matrix of 𝐺 is the 𝑛×𝑛 matrix 𝐴 = 𝐴(𝐺) whose entries 𝑎𝑖𝑗 are
given by
𝑎𝑖𝑗 = {1, if 𝑣𝑖 and 𝑣𝑗 are adjacent;
0, otherwise.
We draw a Directed Weighted Graph, connecting each exporter with the importer country. A directed graph is a graph where all the edges are directed from one vertex, the tail, to another, the endpoint called head. A directed graph is defined as an ordered pair of sets 𝐺 = (𝑉, 𝐴) , where 𝑉 is a set of nodes and 𝐴 is a set of ordered (directed) pairs (called edges or links) of 𝑉 (Nykamp). A weighted graph (edge-weighted graph) is a graph where edges have weights or values. Each edge 𝑒 of G has a numeric label 𝑤(𝑒), called weight, which can be an integer, a rational number or a real

99
number (Bondy, 1976; Gross & Yellen, 2005). A directed weighted graph merges all the characteristics of the networks described in the notes above.
We use weighted Betweenness Centrality (BC) instead of connectivity because the latter does not give the importance of a node in the network. BC allows us to explore the influence of each country in the market through its exports. By simply analysing connectivity, we miss information about the role of a node in a broader scenario: connectivity is a local quantity. As explained by Barthelemy (2004), the node v in Figure 5 seems irrelevant in terms of connectivity, having only two neighbours. However, its removal would be critical since it links two different parts of the network, making it a “cut-vertex”. BC measures the importance of a node in bridging relevant regions of the network and stresses the existence of paths between any two given nodes in the network.
Figure 5 Example of a cut-vertex.
Notes: Source: our elaboration from Barthelemy (2004).
BC counts the fraction of shortest paths that go through a given node. This is expressed by the formula:
𝐵𝐶(𝑣) = Σ𝑠≠𝑡≠𝑖
𝑆𝑣(𝑠, 𝑡)
𝑆(𝑠, 𝑡)
Where:
𝑆(𝑠, 𝑡) is the total number of shortest paths from 𝑠 to 𝑡
𝑆𝑣(𝑠, 𝑡) is the number of paths that pass through 𝑣.

100
𝑠 , 𝑡 and 𝑣 are nodes of the network: 𝑣 is the node considered (the one for whom we compute the BC), while 𝑠 and 𝑡 are two generic nodes connected to each other.
The Out-degree (OD) of a node, in a directed graph, is defined as the number of outward directed graph edges with that node as the source. Its denotation is: 𝑑𝑒𝑔+(𝑣) , where 𝑣 is the node of the network we are considering. For a directed graph, the degree sum formula is: ∑ 𝑑𝑒𝑔+(𝑣)𝑣∈𝑉 = ∑ 𝑑𝑒𝑔−(𝑣)𝑣∈𝑉 = |𝐴|.
We use it as a proxy to understand the role of a specific country in terms of trade exportation.
We consider all the countries resulting from the query in the UN Comtrade database on exportation of wild truffles and mushrooms (dried/powdered, 071239, or fresh/chilled, 070959) in the examined years. Data regards 150 countries, corresponding to those officially participating in the worldwide trade of this market. Not all of them are always present in yearly datasets, yet data for major countries are complete (all years, any category). Having constant information about the most influential countries is crucial for our analysis since this allows for the tracking of the evolution of their trade in time and for comparing it to dried/powdered (071239) and fresh/chilled (070959). On the other hand, the presence/absence of some countries depending on time or category gives an idea of market evolution and characteristics (due to differences between dried/powdered, 071239, and fresh/chilled ones, 070959). We do not consider exports towards aggregate entities and special categories:
• “World”, which collects all the export trades of each country (i.e. a redundant information, for our purpose);
• “Areas NES (not elsewhere specified)”, which may reference low value trade or unknown partner designation, or if an error was made in the partner assignment;
• "Free Zones", geographical and economic territory belonging to a country but not to its customs territory;
• "Bunkers", ship stores and aircraft supplies.
The last two are not useful for our analysis in that they do not provide any information on the global network. Since their only effect is to alter our final result without providing any additional helpful information, we have deleted them. However, to fully keep track of all the data cleaning activities (deletions in particular) we have registered the major fallouts and they are

101
described in Appendix E: Effect of “Areas NES (not elsewhere specified)” and "Bunkers" elimination.
Together with the network analysis, we compute the values of both BC and OD and we show the results of the top 22 countries in tables. Scatter plots are provided in specific appendices (Appendix G: Graphs: BC / OD and Appendix H: Graphs BC / OD (log)). All these outcomes are derived from the network analysis.
Networks and BC and OD values indicate the countries playing the most important roles in worldwide trade of wild mushrooms and truffles. For these countries, we compute average prices (expressed in US $ per Kg) of each considered year. To better compare them we show the results in tables (Table 8 and Table 10). We also highlight the existence of possible arbitrages when a country has high BC values (i.e. with high “Made-in” power) and positive import/export price differences.
Then, we analyse Italian trade considering import, export and production volumes. These data are shown using tables (Table 14 and Table 15) and figures (Figure 12 and Figure 13). This underlines some anomalies in the Italian trade of wild mushrooms and truffles. Therefore, we depict a review of the frauds and counterfeits from recent years considering official data from law enforcement agencies. This pushes the research to a further analysis of the Fungo di Borgotaro case study. We therefore propose (also considering the data shown in Table 16) this as an example of the correct use of GIs to solve quality and product origin issues.
3.4 Analysis
The first part of this section shows the networks, for both categories (dried/powdered, 071239 and fresh/chilled, 070959), of 2003 and 2012, the first and the latest significant year respectively. Moreover, the main results are illustrated.
The networks for the other years we have considered (2006, 2009 and 2015) are reported in Appendix D: Networks for the Years 2006, 2009 and 2015.
This section focuses on the most important, sometimes self-evident, outcomes, while details will be discussed in the next sections.
In the second part, the section shows the results of BC and OD computations. From these, it is possible to identify the major countries. The

102
third part of the section provides some tables (Table 8 and Table 10) on yearly average prices of wild mushrooms and truffles traded by the chosen major countries.
Even though we compute both networks, BC and OD for 2015, we do not consider them in the main discussion (and therefore we present 2012 as the latest significant year when showing the networks), instead they are reported in the appendices. The reason is that a lack of some records in the 2015 dataset is presumed. This might be due to some gaps in the time and ways of communication of official data for some countries. Analysing the whole dataset, both for 070959 (fresh/chilled) and 071239 (dried/powdered), there is an “anomalous” absence of records for counties that should have also been active in 2015. This is also evident from network analysis. To avoid jeopardising our analysis we do not consider BC and OD for the year 2015. However, as the analysis from 2003 to 2012 is still representative of the dynamics of worldwide trade of this specific market, this does not negatively affect our outcomes. Nevertheless, for the sake of completeness, BC and OD values of 2015 are shown in Appendix F: Betweenness Centrality and Out Degree Table 2015.
3.4.1 Networks
The results obtained by the python computation of networks, based on the total export values in US dollars, are displayed in figures below.
Networks highlight the existing interactions among all the countries in the world. Specifically, Figure 6 and Figure 7 show the global networks of fresh and/or chilled wild mushrooms and truffles (070959) for the years 2003 and 2012; while Figure 8 and Figure 9 display the global networks of dried and/or powdered wild mushrooms and truffles (071239) for the years 2003 and 2012.
Networks of both categories for the years 2003, 2006, 2009, 2012 and 2015 are shown in Appendix D: Networks for the Years 2006, 2009 and 2015.
By studying all the networks, it is possible to identify the major countries, which are represented by the nodes with the biggest size and highest number of edges. However, a more detailed discussion about this topic is presented in the following section using BC and OD.

103
Figure 6 Global network of fresh/chilled wild mushroom and truffle trade (070959) referred to 2003. Notes: each country is identified by the ISO 3166-1 alpha-3 codes (the full detailed list is shown in Appendix J: Countries ISO Code and Digit).

104
Figure 7 Global network of fresh/chilled wild mushroom and truffle trade (070959) referred to 2012. Notes: each country is identified by the ISO 3166-1 alpha-3 codes (the full detailed list is shown in Appendix J: Countries ISO Code and Digit).
105
From Figure 6 and Figure 7 it is possible to observe that some European countries, China and the United States of America represent the major stakeholders in global trade.
Among European countries, the outstanding ones are Italy, France and the Netherlands, followed by Germany. A significant, even though not globally impressive, role is played by Romania and Bulgaria. Their exportation of fresh/chilled (070959) wild mushrooms and truffles are mainly towards other European Countries, especially Western ones. Intra-Europe trade is a significant characteristic of the European market. The main difference among European major players is that, while the Western ones are important players worldwide, Bulgaria and Romania are limited to the EU.
If we consider China, the big edges directed to Japan and Korea and the link with the USA are evident.
There are no significant time differences (i.e. across years) when considering both the major players and the trade globally. The only remarkable difference to be underlined is the growing importance of Thailand starting from 2009 (please look at the appendix D.1 Fresh/Chilled (070959) Networks for more details).

106
Figure 8 Global network of “dried, whole/cut/sliced/broken or in powder […]” mushroom and truffle trade (071239) referred to 2003. Notes: each country is identified by the ISO 3166-1 alpha-3 codes (the full detailed list is shown in Appendix J: Countries ISO Code and Digit).

107
Figure 9 Global network of “dried, whole/cut/sliced/broken or in powder […]” mushroom and truffle trade (071239) referred to 2012. Notes: each country is identified by the ISO 3166-1 alpha-3 codes (the full detailed list is shown in Appendix J: Countries ISO Code and Digit).

108
Global trade of dried/powdered (071239) wild mushrooms and truffles (Figure 8 and Figure 9) has different peculiarities from the fresh/chilled (070959) one. We easily notice the growth in importance of far Asian countries, which here become the major exporters. China is still a crucial country, again with strong connections with Japan and Korea. What is unexpected, at a first sight, it is the values of exports towards small, and particular, countries: Hong Kong and Singapore. They cannot be considered “classical” countries (like, e.g., France, Germany, Japan, China, etc.) neither in terms of population nor in terms of local production. However, they are big importers from China and, at the same time, they also export significant volumes towards other countries worldwide.
A further analysis of Hong Kong’s and Singapore’s international trades is shown later in this work. Furthermore, they represent a key for understanding wild mushroom and truffle trade anomalies.
In this category, Thailand plays a significant role for all the considered years, showing many outbound edges.
Japan presents significant exportations of dried/powdered (071239) wild mushrooms and truffles, highlighting the transition from only being an importer to being an exporter as well.
Relevant countries in the dried/powdered (071239) networks are still important: the USA and some European countries continue to play a relevant role in worldwide trade. However, their importance decreases because of the growth in importance of Asian countries. Among European countries, France and Italy are still the major players with Germany and The Netherlands that switched their own roles. Eastern, “peripheral”, countries, such as Bulgaria and Romania lose their importance in the dried/powdered (071239) category. They probably play the same “role” as for the fresh/chilled (070959) category, but Asian competition is now stronger than before. Bulgaria is still among the top countries worldwide, while Romania seems to lose positions in terms of global importance. Please look at the appendix D.2 Dried/Powdered (071239) Networks for more details.

109
3.4.2 Betweenness Centrality and Out Degree
After a visual analysis of the networks, a more detailed and specific study of crucial aspect is needed. Therefore, we compute, from the previous networks outcomes, the values of OD and directed weighted BC of each country. In this section, we analyse the main results of this analysis. This is useful to understand the connections and the importance in terms of export for each country.
Table 6 and Table 7 show the outcomes of the most important countries: out of about 150 countries, we choose 22 of them, based on their relevance in terms of BC and OD. Of course, all those mentioned in the previous section are considered. Tables are ordered by a descending OD value.
It is also useful to consider the correlation between OD and BC: specific scatter plots are provided in Appendix G: Graphs: BC / OD in and Appendix H: Graphs BC / OD (log). This analysis emphasizes the “export value” and the centrality of major players. At the same time, we show which countries have the biggest role not only in terms of connections but also in terms of “hub importance” in the international trade of wild mushrooms and truffles. Moreover, it stresses the main differences between the two markets (fresh/chilled, 070959, and dried/powdered, 071239). Furthermore, this analysis points out some crucial aspects for further studies.
For fresh/chilled (070959) wild mushrooms and truffles (Table 6), major European countries (i.e. The Netherlands, Italy, France and Germany) show the highest number of partner countries (outbound links). Quite relevant it is also the role of some Asiatic countries (e.g. China) and the USA. As expected by the networks’ results, Bulgaria and Romania have a significant OD value. The same is true for Thailand. Even though OD is a good proxy for understanding connections of a country, we need to analyse another aspect to enlighten its importance in the worldwide trade: BC. In fact, BC outcomes point out whether a country is just a good exporter or plays a role as a “hub”. We can notice substantial differences between the considered European countries. While The Netherlands, Italy, Germany and particularly France have significant BC values, Bulgaria and Romania have low BC values yet still maintain considerable OD values between 11 and 19. These differences will help us in understanding some crucial aspects when trying to explain the worldwide trade. China has low BC values, if compared with top EU countries. Low BC values and quite high OD values make, for fresh/chilled (070959) market, China the player with many characteristics in common with Bulgaria and Romania. BC values of top EU countries goes
110
from about 0.03 up to approximately 0.2, with Italy having among the highest values (around 0.2). Only the United States have a BC value in line with top EU average. As resulting from the networks, there are some differences when dealing with dried/powdered (071239) wild mushrooms and truffles (Table 7). China is the leader of this market, having the highest OD values for all the years considered (between 68 and 86). European countries, preeminent players in fresh/chilled (070959) market, are still relevant even though they must face the raising importance of Asian ones. France, Italy and Germany maintain, approximately, the same number of outgoing links as in 070959 (fresh/chilled). However, some differences occur when considering BC values of Germany, which increases its BC values. On the other hand, The Netherlands are losing their importance especially in terms of OD.
Together with China, Far East countries gain importance in the global trade scenario. Hong Kong, Singapore, Japan and Thailand have significant OD values. Average outbound links are: China 77, Hong Kong 43, Singapore 23, Japan 20 and Thailand 32. Average outbound links of European countries are: Germany 47, France 57, Italy 50, The Netherlands 26. Finally, the USA have 20 average outbound links.
The momentous difference comes with BC. By examining the average values of main Western and Far East countries, we obtain these results: The Netherlands 0.1305; France 0.0734; Italy 0.0684; Germany 0.0674; China 0.0539; Singapore 0.0491; Hong Kong 0.0488; USA 0.0448 and Japan 0.0238. We can notice two main trends. Western countries have lower outgoing links, but higher (or at least same) BC values, making them important trade hubs. It is worthy to underline also the high values reached by Hong Kong and Singapore, especially considering their size. Italy, as well as other major Western countries, can be defined as an important funnel. It imports enormous quantities of wild mushrooms and truffles from several countries and it also exports large volumes worldwide. Conversely, there is an almost-close economy: the Democratic People's Republic of Korea. While Italy can be considered an archetype for describing the role of major European or Asian countries (and the USA, too), the Democratic People's Republic of Korea represents a particular case of exiguous trade with some selected foreign countries. Moreover, data from the Democratic People's Republic of Korea only concern imports, without any export for both categories during all the examined years.

111
Table 6 Betweenness Centrality (BC) and Out Degree (OD) results referred to fresh/chilled wild mushrooms and truffles (070959).
2003
Country Betweenneess
Centrality
Out
Degree
NLD 0.111270 35
ITA 0.086345 29
FRA 0.039177 29
CHN 0.027549 26
USA 0.103220 21
EST 0.025224 20
BEL 0.108825 19
DEU 0.035003 18
IND 0.038163 18
ESP 0.027549 17
BGR 0.001312 15
AUS 0.028861 13
RUS 0.014132 13
PRT 0.038879 13
HUN 0.020036 13
ZAF 0.006738 12
CAN 0.033274 12
KOR 0.050566 11
AUT 0.036613 11
ROU 0.010555 11
NZL 0.035242 10
SGP 0.028265 9
2006
Country Betweenneess
Centrality
Out
Degree
NLD 0.175583 41
ITA 0.114134 39
FRA 0.097062 36
CHN 0.014742 29
DEU 0.037335 24
POL 0.037842 23
BEL 0.085258 21
IND 0.037639 20
LTU 0.006231 20
TUR 0.003597 19
BGR 0.006130 19
ZAF 0.074316 18
ESP 0.046049 17
RUS 0.022290 16
KOR 0.004762 16
USA 0.075481 15
LVA 0.022087 15
AUT 0.059169 14
SGP 0.086373 13
ROU 0.009473 13
AUS 0.032979 12
HUN 0.003698 12

112
2009
Country Betweenness
Centrality
Out
Degree
ITA 0.208634 54
FRA 0.088407 52
THA 0.081183 44
NLD 0.027090 41
BEL 0.068240 31
USA 0.075851 30
DEU 0.037582 30
KOR 0.028552 29
CHN 0.110079 29
POL 0.048719 28
ZAF 0.075120 26
TUR 0.007955 20
LTU 0.013287 18
BGR 0.003139 17
AUS 0.019952 16
ESP 0.019178 16
SRB 0.068369 16
AUT 0.027434 15
LKA 0.003397 14
CAN 0.022575 13
ROU 0.037281 13
CAN 0.022575 13
2012
Country Betweenness
Centrality
Out
Degree
ITA 0.034080 61
NLD 0.148153 57
FRA 0.123860 55
DEU 0.092256 36
THA 0.177123 34
POL 0.019654 29
ESP 0.085613 28
KOR 0.009827 27
CHN 0.016942 27
ZAF 0.043986 23
USA 0.057075 21
AUS 0.056171 20
LTU 0.000354 20
BEL 0.009552 19
LKA 0.023270 18
TUR 0.005778 18
SGP 0.098349 17
ROU 0.048310 17
NZL 0.019654 15
IND 0.041274 14
BGR 0.016942 14
SRB 0.008766 14
Notes: the most important 22 countries are ordered by OD values. Colours help in recognizing countries within charts and among tables.

113
Table 7 Betweenness Centrality (BC) and Out Degree (OD) results referred to “dried, whole/cut/sliced/broken or in powder […]”) (071239) wild mushrooms and truffles.
2003
Country Betweenneess
Centrality
Out
Degree
CHN 0.069499 71
HKG 0.105283 52
ITA 0.089978 46
FRA 0.042974 44
DEU 0.077233 43
SGP 0.042320 23
JPN 0.024237 22
THA 0.009586 19
NLD 0.176634 18
USA 0.056155 17
KOR 0.034314 16
RUS 0.105501 15
CHL 0.007462 14
AUT 0.029684 13
BGR 0.009314 13
LTU 0.028813 12
ROU 0.000108 11
CHE 0.001035 10
AUS 0.103268 10
CAN 0.009804 9
BEL 0.025109 8
GBR 0.042157 8
2006
Country Betweenneess
Centrality
Out
Degree
CHN 0.035905 68
FRA 0.114124 53
ITA 0.091079 48
HKG 0.058654 43
DEU 0.037136 38
THA 0.126432 35
POL 0.048723 29
JPN 0.036499 24
NLD 0.118623 22
SGP 0.036075 21
GBR 0.120109 15
KOR 0.009931 15
USA 0.024489 14
CHL 0.007342 14
AUT 0.043714 14
SRB 0.041338 14
BEL 0.028563 13
VNM 0.029454 13
ZAF 0.036330 12
BGR 0.000297 12
RUS 0.010823 12
IND 0.049826 11

114
2009
Country Betweenneess
Centrality
Out
Degree
CHN 0.084331 85
FRA 0.051863 56
ITA 0.042951 54
DEU 0.095238 47
HKG 0.018589 37
THA 0.204694 35
POL 0.064935 28
NLD 0.033019 25
JPN 0.019947 23
USA 0.054537 22
SGP 0.021475 21
MYS 0.192344 15
AUT 0.067566 14
SRB 0.022112 14
LBN 0.020329 13
KOR 0.004244 13
ESP 0.114294 12
GBR 0.061328 12
IND 0.011289 12
CHL 0.000571 12
BGR 0.001216 11
BEL 0.051948 10
2012
Country Betweenneess
Centrality
Out
Degree
CHN 0.025874 86
FRA 0.084746 75
DEU 0.061380 59
ITA 0.049956 52
HKG 0.012937 40
NLD 0.194013 39
THA 0.019147 38
USA 0.044224 28
SGP 0.096768 28
POL 0.032919 24
ESP 0.041080 21
VNM 0.049877 20
DNK 0.069899 16
BGR 0.028182 16
CHL 0.006449 15
GBR 0.146485 14
KOR 0.002548 14
AUT 0.032601 13
SVN 0.088011 13
BIH 0.006250 13
JPN 0.014728 12
RUS 0.006687 12
Notes: the most important 22 countries are ordered by OD values. Colours help in
recognizing countries within charts and among tables.

115
3.4.3 Average Prices
This section analyses average prices of the products traded by major countries. We design two tables: one for 070959 (fresh/chilled) (Table 8) and one for 071239 (dried/powdered) (Table 10). They show the average prices, in US dollars, for each year for the major countries: China, Hong Kong, Japan, Singapore, France, Italy, The Netherlands, Germany, USA, Bulgaria and Romania. We do not consider Thailand since it is not relevant for our analysis, being a relevant exporter but not an important global trade hub. In the previous section, we underlined the relevance of the major exporters, through the analysis of their outbound export flow values. Here, using yearly average prices, we point out the differences between countries in terms of high or low product values.
We also show the median price (yearly values of the major countries: China,
Hong Kong, Japan, Singapore, France, Italy, The Netherlands, Germany, USA,
Bulgaria and Romania) in Table 9 and Table 11. This is a crucial help for understanding and then regulating some anomalies in the dataset.
Anomalies might concern suspiciously high average prices or “strange” one
(or two) kilo(s) purchases in an entire year.
From the analysis of both average and median prices, we can decide when
it is worthy to remove peculiar data that cause distortion. As such we can provide a clearer, therefore better, result. It could be said that excluding
some data could lead to an inferior, and less trustable, analysis. However,
we strongly believe that an accurate evaluation of the results shown in the tables below and then, if necessary, a thorough investigation of raw data,
provide a more precise idea of trade phenomena. In case of anomalies like
the ones explained before, the exclusion of specific records prevents a
biased analysis. Therefore from the dataset we remove adulterations from recording errors or niche products (i.e. very few transactions, 1 or 2, made
in one year from a specific country about extremely costly products). In fact,
we believe that there might be some recording errors due to the peculiarities of UN Comtrade system. Abnormal data are pointed out and
new results are provided. Moreover, although we care about expensive
truffles and mushrooms, we are more interested in the analysis of general
trends, without high price product distortion.

116
3.4.3.1 Fresh/Chilled (070959) Average Prices Table 8 Average Prices of fresh/chilled wild mushrooms and truffles in US $ per Kg.
Country Year (Average Price: US$ per
Kg)
Reporter Reporter
ISO 2003 2006 2009 2012
China CHN 3.17 2.45 8.30 10.46 China, Hong Kong SAR
HKG 2.66 2.33 275.93 13.94
Japan JPN 7.51 4.26 5.25 8.80 Singapore SGP 3.21 5.75 5.57 9.83 France FRA 15.30 14.56 36.69 137.14 Italy ITA 6.26 46.68 130.37 94.08 Netherlands NLD 6.23 7.98 7.54 14.27 Germany DEU 9.67 9.33 12.98 459.72 USA USA 23.59 16.78 13.57 19.58 Bulgaria BGR 10.21 8.49 12.55 16.81 Romania ROU 10.63 9.07 8.14 46.39
Notes: we consider only the major countries. In red, the values subjected to changes. Source: our elaboration from UN Comtrade dataset.
Table 9 Median Prices of fresh/chilled wild mushrooms and truffles in US $ per Kg.
Country Year (Median Price: US$ per
Kg)
Reporter Reporter
ISO 2003 2006 2009 2012
China CHN 1.60 2.14 3.99 3.99 China, Hong Kong SAR
HKG 0.81 2.59 10.91 5.88
Japan JPN 5.76 4.79 5.82 7.48 Singapore SGP 2.15 5.71 3.99 6.35 France FRA 8.98 9.68 14.47 43.70 Italy ITA 3.25 6.33 24.32 32.86 Netherlands NLD 3.50 5.41 7.54 7.51 Germany DEU 8.51 7.41 8.17 11.10 USA USA 12.78 9.60 11.84 15.44 Bulgaria BGR 10.92 8.51 11.56 15.91 Romania ROU 7.03 8.68 7.70 10.41
Notes: we consider only the major countries. Source: our elaboration from UN Comtrade dataset.

117
Average price (AP) of Japanese exports of fresh/chilled (070959) mushrooms is around 5 or 7 US dollars per Kg. A similar AP value is registered for Singapore.
China’s average prices have been growing from 2 or 3 US$/Kg up to more than 10 US dollars per kilo. However, the median for 2003 is 1.58 US$/Kg. This, together with a lower average price in 2006, lead us to compute a new average price without a, probable anomalous, maximum price of 30 US$/Kg. Therefore, the new average is 2.1 US$/Kg. Applying the same method to 2009 and 2012, where the medians are 3.94 US$/Kg and 3.72 US$/Kg and maxima of 47.25 US$/Kg and 99 US$/Kg, respectively, we obtain new average prices: 6.73 US$/Kg in 2009 and 7.05 US$/Kg in 2012. Then we can state that China’s average price growth from 2 to 7 US dollars per kilo from 2003 and 2012.
Hong Kong has an AP of about 2.5 US$/Kg in 2003 and 2006, which seems plausible both considering median prices, single records and expected results. However, outputs of 2009 and 2012 seem quite unusual and are probably vitiated by some anomalies. Median prices for 2009 and 2012 are, respectively: 8.20 US$/Kg and 3.76 US$/Kg. Maxima are: 1,608 US$/Kg in 2009 and 56.69 US$/Kg in 2012. By computing the new average without the maxima, we obtain the more reasonable values equal to 9.52 US$/Kg in 2009 and to 5.39 US$/Kg in 2012. We can consider Hong Kong’s average export prices to be about 2.5 US$/Kg in 2003 and 2006 and 9.5 US$/Kg in 2009 while about 5 US$/Kg in 2012.
Considering European countries, average prices go from about 6 US$/Kg for The Netherlands in 2003 to an anomalous 459.72 US$/Kg in Germany for 2012. First of all, as well as Asian countries or even more, there are some required adjustments to be done. The Netherlands have the lowest average prices (all expressed in US$/Kg): 6.23 (2003); 7.98 (2006); 7.54 (2009); 14.27 (2012). Since median price is 7.31 US$/Kg, with a maximum of 318 US$/Kg, can compute a new average price for 2012: 8.94 US dollars per Kilo. Therefore, The Netherlands have an export average price of about 8 US$/Kg.
France has an average price coherent with the other countries for 2003 and 2006 (15.30 US$/Kg and 14.56 US$ /Kg in 2003 and 2006, respectively), while it rises very much in 2009 and even more in 2012. From a price equal to 36.69 US dollars per kilo in 2009, then we register a significantly high average price in 2012: 137.14 US$/Kg. Median is 42.55 US$/Kg, but even if we take the maximum (1,215.9 US$/Kg) off from our analysis, we still have an average price of 117.52 US$/Kg.

118
Also in the case of Germany, there is a significant increase in average prices from around 10 US$/Kg to an anomalous 460 US$/Kg. There are two adjustments that can be made for Germany’s average prices. One for 2009: removing the maximum (100 US$/Kg) we obtain an AP equal to 9.98 US$/Kg, which is closer to the median of 8 US$/Kg. Considering 2012, for reaching a more reasonable average price we should cut off until the fourth from last highest price. Maximum prices are (all expressed in US$/Kg): 6,571; 5,226.67; 2,472.99; 835.5. Median goes from 11 US$/Kg to 10.7 US$/Kg. Consequently, we can obtain an average price of about 57.6 US dollars per kilo. Please note that when we refer to a price as anomalous, we also might allude to a value interfering with our general reasoning by adulterating too much the average price we are interested in. It might be that, as mentioned before, some transactions involve exquisite or rare products. However, this analysis concentrates on the most precise and focused average price possible, hence peaks and rarities are not considered.
As for the process made in the case of Germany, we can clear the data concerning Italian trade. A first computation of the average prices shows these results (all expressed in US$/Kg): 6.26; 46.68; 380.83; 445.11.
In 2003, average prices are similar for all the European countries. There are just few differences, i.e. the slightly higher AP of France and the quite low APs of Italy and The Netherlands. In the case of Italy, from 2006 to 2012, there are some anomalies due to costly transactions involving only one or two kilos a year. Even though we cannot state without doubt that those results as incorrectly registered, reasonably they do not represent a single(dual)-kilo transaction of exquisite wild mushrooms or truffles. As expressed above, our analysis does not take into consideration such cases, being more interested in a more general oriented result. Then, taking off those partner countries having only one or two kilos, we obtain different average prices. In 2006, if we do not consider Kazakhstan (one kilo, sold at 797 US$) and Nigeria (2 Kg with AP of 597 US$/Kg), we have a new AP of 11,53 US$/Kg, with a median of 6.22 US$/Kg (from 6.33). For 2009, we cut: Indonesia (2 kilos), AP 3,215.5 US$/Kg; China (1 Kg) AP 2,189 US$/Kg; Macao (1 Kg) AP 1,825 US$/Kg and Iceland (1 kilo) and few other trades, with a resulting AP of 130.37 US$/Kg. Some values are even higher that the considered one, but we did not want to lose more information that might provide insights on the truffle trade. The median in 2009 goes from 85.45 US$/Kg to 24.32 US$/Kg. In 2012, we cut, among others: Peru (2 kilos at very high price) AP 7,070 US$/Kg, Curacao (1 Kg) AP 4,814 US$/Kg and Macao (1 Kg) 2,928 US$/Kg. At the end of the whole process, we obtain a

119
new average price of 94.08 US$/Kg, with a median of 32.86 (from 68.95) US$/Kg.
With respect to the USA we have a revised average price in 2003 (not considering the maximum of 242.53 US$/Kg, having a new median of 8.45 US$/Kg, instead of 12.78 US$/Kg) of 12.64 US$/Kg. In 2006 and 2009 we do not adjust the first output. Hence, we have AP: 16.78 US$/Kg and 13.57 US$/Kg. For 2012, the new AP is 19.58 (instead of 39.68) US dollars per kilo (not considering the 441.61 US$/Kg maximum AP), with a median of 15.44 US$/Kg (15.46 US$/Kg being the original one).
Finally, we have the two Eastern European countries: Bulgaria and Romania. The former has the following average prices (all expressed in US$/Kg): 10.21 (2003); 8.49 (2006); 12.55 (2009); 16.81 (2012). The latter’s APs are: 10.63 US$/Kg (2003); 9.07 US$/Kg (2006); 8.14 US$/Kg (2009). For 2012, the original AP was 46.39 US$/Kg, but without the record of Finland (only one kilo sold at 630 US$) we obtain a new AP of 9.91 US$/Kg (median from 10.41 to 10.33 US$/Kg).
3.4.3.2 Dried/ Powdered (071239) Average Prices
Table 10 Average Prices of dried/ powdered wild mushrooms and truffles (“whole, cut, sliced, broken or in powder, but not further prepared” - 071239) in US $ per Kg.
Country Year (Average Price: US$ per
Kg)
Reporter Reporter
ISO 2003 2006 2009 2012
China CHN 5.76 10.28 13.29 15.90 China, Hong Kong SAR
HKG 11.09 14.58 10.60 17.17
Japan JPN 38.51 34.59 47.24 78.90 Singapore SGP 5.54 8.74 13.05 17.33 France FRA 30.62 34.21 43.87 68.90 Italy ITA 35.92 29.10 41.80 40.24 Netherlands NLD 27.15 18.67 27.97 26.44 Germany DEU 24.22 28.12 32.03 30.35 USA USA 30.07 20.45 15.31 14.10 Bulgaria BGR 22.73 25.41 42.84 28.53 Romania ROU 18.70 16.49 31.08 23.54
Notes: we consider only the major countries. In red, the values subjected to changes. Source: our elaboration from UN Comtrade dataset.

120
Table 11 Median Prices of dried/ powdered wild mushrooms and truffles (“whole, cut, sliced, broken or in powder, but not further prepared” - 071239) in US $ per Kg.
Country Year (Median Price: US$ per
Kg)
Reporter Reporter
ISO 2003 2006 2009 2012
China CHN 5.54 9.47 12.33 14.80 China, Hong Kong SAR
HKG 6.84 10.11 9.00 12.42
Japan JPN 34.98 26.82 40.32 54.14 Singapore SGP 4.60 8.61 7.92 10.14 France FRA 25.45 25.11 33.86 38.79 Italy ITA 26.04 28.17 39.73 35.54 Netherlands NLD 13.29 11.82 27.99 17.50 Germany DEU 22.31 24.89 29.00 25.68 USA USA 18.26 11.75 8.73 10.08 Bulgaria BGR 17.33 23.15 42.48 24.00 Romania ROU 16.80 15.97 30.92 24.56
Notes: we consider only the major countries. Source: our elaboration from UN Comtrade dataset.
Asian countries, Japan excluded, have Average Prices values from around 5,50 US$/Kg to about 17 US dollars per kilo. China’s, Hong Kong’s and Singapore’s APs slightly increase in value over time.
China goes from an AP value of 5.76 US$/Kg in 2003, to almost 16 US$/Kg in 2012. Hong Kong has AP values around 11 US$/Kg in 2003 and 2009, raising more than 17 US dollars per kilo in 2012.
Singapore’s export behaviour is similar to the one of China. There is a relatively low average price in 2003 (5.54 US$/Kg) and it rises to over 17 US dollars per kilo in 2012. With respect to Singapore, we should point out that in 2009, excluding the maximum value (72.7 US$/Kg) from our computation, we have an adjusted AP of 10.06 US$/Kg (median goes from 7.92 to 7.8 US$/Kg).
Japan has average prices (expressed in US$/Kg) higher that the other top Asian countries: 38.51 US$/Kg in 2003, 34.59 US$/Kg in 2006, 47.24 US$/Kg in 2009, 78.90 US$/Kg in 2012.
Major European countries have significantly higher average prices with respect to Asian ones. AP of The Netherlands in 2006 is the lowest one

121
among Western EU countries: 18.67 (revised to 14.83) US$/Kg. Italy goes from roughly 30 US$/Kg in the first years, up to 40 US dollars per kilo in the latest ones. Germany has a somewhat constant increasing average price, from about 24 US$/Kg in 2003 until more than 30 US dollars per kilo in 2012. The Netherlands do not have such a constant increasing rate. It starts with an AP of 27,15 US$/Kg in 2003, then decreases in 2006 to 14.83 US$/Kg (after the removal of the maximum AP equal to 99.18 US$/Kg; originally being an AP of 18.67 US$/Kg, with the median going from 11.82 US$/Kg to 11.52 US$/Kg). Later, in 2009, The Netherlands AP is nearly 28 US$/Kg, but then in 2012 it decreases again to 21.54 US$/Kg due to an adjustment (we cut off the two maxima of 118.51 US$/Kg and 115.67 US$/Kg. Median goes from 17.5 US$/Kg to 17 US$/Kg).
An adjustment in 2012 average price of France is needed. We thought an exclusion of non-significant values would provide a better result for our analysis. A comprehensive list of the values we think it is better to exclude (to have a more trustable analysis) is provided in Appendix I: Adjustments of Average Prices. More specifically, details about France are shown in Table 20. Hence, we obtain an average price of 40.34 US$/Kg, while the median becomes 34.28 US$/Kg instead the original one of 38.79 US$ per kilo. Therefore, also France, like Italy, goes from a value of about 30 US$/Kg in 2003 until an AP of about 40 US dollars per Kilo in 2012.
Unlike France, Italy and Germany, the United States of America faces a reduction of average prices. Even if APs are adjusted for the years 2003 and 2006, the trend is declining. We remove two maxima in 2003 (104.72 US$/Kg and 103.12 US$/Kg), obtaining a new AP of 20.22 US dollars per kilo and a new median of 14.7 US$/Kg, instead of the 18.26 US$/Kg original one. In 2006, the revised AP is equal to 14.53 US$/Kg (the original one is: 20.45 US$/Kg), cutting off the maximum, 97.39 US$/Kg, and having a new median extremely close to the original one: 11.74 US$/Kg instead of 11.75 US$/kg. The slightly increase in AP of 2009, 15.31 US$/Kg, is more an exception rather than a trend inversion, since in 2012 the average price is 14.10 US$/Kg.
As for the fresh/chilled (070959) category, we also consider Bulgaria and Romania. For the former, we adjust the value for 2003 and 2012. In 2003, excluding the maximum of 78 US$/Kg, we obtain, for Bulgaria, a new AP equal to 22.73 US$/Kg (median goes from 17.36 US$/Kg to 17.33 US$/Kg). For 2012, the original AP of 32.61 US$/Kg is changed into 28.53 US dollars per kilo, excluding the maximum 93.77 US$/Kg (median goes from 27.17 US$/Kg to 24 US$/Kg). However, the maximum average price belongs to

122
2009: 42.84 $US/Kg. 2009 is the year during which the maximum average price is registered for Romania: 31.08 US$/Kg. Average price for Romanian export of wild mushrooms and truffles in 2003 is 18.70 US$/Kg, while it is 16.49 US$/Kg in 2006. For 2012, we adjust the original Average Price (32.61 US$/Kg) since there are two anomalous exports: a trade of only 1 kilo at 1 US$ towards USA, and an export of 4 kilograms at 18 US$ to UK. Not considering these two trades, the new AP is equal to 23.54 US$/Kg (median goes from 24.03 US$/Kg to 24.56 US$/Kg).
3.4.4 Incentives in Labelling Arbitrage
In this section, we go over the causes of exploiting import/export price gaps due to differences in “Made-in” perceptions by consumers.
BC gives an idea of the “Made-in” power of each country. The higher the BC is, the biggest the recognised value of goods with that country’s “Made-in” label. Hence, BC represents a good proxy for “Made-in” power.
We compute the differences between export prices and import prices of the major countries. This underlines the existence, or not, of a possible arbitrage. A positive difference between export prices and import prices (i.e. Pexp-Pimp), ΔP, gives the possibility to exploit this kind of arbitrage.
Some traders of the countries with high BC values and positive ΔP, will likely import goods and then re-export them labelling, in an illicit way, the re-exported products with their own country’s “Made-in” label. This does not represent an imperfect imitation of a valuable resource which gives a competitive advantage. The traders that re-export these products, after labelling with an illegal “Made-in” label, understand, in a distort way, the competitive advantage that results from certain “Made-in” labels. However, it represents a fraudulent use of “Made-in” labels and therefore definitely not a fair (competitive) advantage.
The method we propose underlines the existence of possible frauds and points out the countries where these phenomena can take place. Moreover, we believe that it can be replicated to detect the likely existence of illicit labelling practices in industries beyond the examined one. Indeed, it represents a technique to emphasise the alleged presence of arbitrages for some products and to connect them with some specific countries.
By underlining these possible types of frauds, we want to illustrate the importance of a protection both for legal producers/traders and for
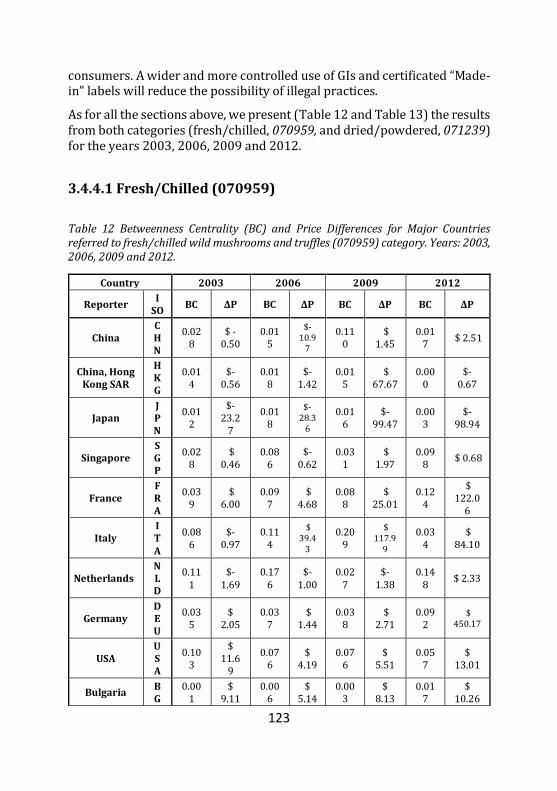
123
consumers. A wider and more controlled use of GIs and certificated “Made-in” labels will reduce the possibility of illegal practices.
As for all the sections above, we present (Table 12 and Table 13) the results from both categories (fresh/chilled, 070959, and dried/powdered, 071239) for the years 2003, 2006, 2009 and 2012.
3.4.4.1 Fresh/Chilled (070959)
Table 12 Betweenness Centrality (BC) and Price Differences for Major Countries referred to fresh/chilled wild mushrooms and truffles (070959) category. Years: 2003, 2006, 2009 and 2012.
Country 2003 2006 2009 2012
Reporter I
SO BC ΔP BC ΔP BC ΔP BC ΔP
China C H N
0.028
$ -0.50
0.015
$-10.9
7
0.110
$ 1.45
0.017
$ 2.51
China, Hong Kong SAR
H K G
0.014
$- 0.56
0.018
$- 1.42
0.015
$ 67.67
0.000
$- 0.67
Japan J P N
0.012
$- 23.2
7
0.018
$- 28.3
6
0.016
$- 99.47
0.003
$- 98.94
Singapore S G P
0.028
$ 0.46
0.086
$- 0.62
0.031
$ 1.97
0.098
$ 0.68
France F R A
0.039
$ 6.00
0.097
$ 4.68
0.088
$ 25.01
0.124
$ 122.0
6
Italy I T A
0.086
$- 0.97
0.114
$ 39.4
3
0.209
$ 117.9
9
0.034
$ 84.10
Netherlands N L D
0.111
$- 1.69
0.176
$- 1.00
0.027
$- 1.38
0.148
$ 2.33
Germany D E U
0.035
$ 2.05
0.037
$ 1.44
0.038
$ 2.71
0.092
$ 450.17
USA U S A
0.103
$ 11.6
9
0.076
$ 4.19
0.076
$ 5.51
0.057
$ 13.01
Bulgaria B G
0.001
$ 9.11
0.006
$ 5.14
0.003
$ 8.13
0.017
$ 10.26

124
R
Romania R OU
0.011
$ 9.66
0.010
$ 4.67
0.037
$ 3.28
0.048
$ 42.06
Notes: Source: our elaboration from UN Comtrade dataset.
For the fresh/chilled (070959) category European countries, as well as USA, show positive differences. However, not all of them report a significant BC value. This represents a considerable difference since only the countries that are appealing in terms of “Made-in” power might exploit the positive price gap.
Italy, France, USA and Germany have positive ΔP values and, at the same time, are significant in terms of trade centrality (with Germany having lower BC values among this group of countries). This enlightens the possibility for companies of these countries to act in an illicit way by labelling products imported from other countries with their own country’s “Made-in” label. Romania and Bulgaria have positive ΔP values, however their centrality importance is low. They might exploit a favourable price difference, however, oppositely to major Western countries, they have a minor “Made-in” power.
It is extremely significant that some countries, e.g. Italy, have significant values combined for BC and ΔP in the fresh/chilled (070959) category. This means that consumers worldwide are willing to pay higher prices for products coming from that specific country. Hence, this demonstrates the power of its “Made-in” label.
Figure 10 shows a scatter plot using the data of Table 12 for the year 2009 as an example of all the examined years. The ITA label in the upper-right corner suggests that Italian fresh/chilled wild mushrooms and truffles are attractive and therefore the “Made in Italy” label is powerful, for this category.

125
Figure 10 Betweenness Centrality (BC) and Price Differences scatter plot for the year 2009. Notes: Major Countries referred to fresh/chilled wild mushrooms and truffles (070959) category. Source: our elaboration from UN Comtrade dataset.
3.4.4.2 Dried/ Powdered (071239)
Table 13 Betweenness Centrality (BC) and Price Differences for Major Countries referred to dried/ powdered wild mushrooms and truffles (“whole, cut, sliced, broken or in powder, but not further prepared” - 071239). Years: 2003, 2006, 2009 and 2012.
Country 2003 2006 2009 2012
Reporter I SO
BC ΔP BC ΔP BC ΔP BC ΔP
China C H N
0.070
$-27.93
0.036
$- 5.40
0.084
$- 21.91
0.026
$- 67.3
7
China, Hong Kong SAR
H K G
0.105
$ 6.99
0.059
$ 9.63
0.019
$ 5.96
0.013
$ 11.2
1
Japan J P N
0.024
$ 4.24
0.037
$-13.79
0.020
$ 1.73
0.015
$ 30.0
2
Singapore S G P
0.042
$- 1.26
0.036
$-3.54
0.022
$- 1.68
0.097
$ 5.11
France F R A
0.043
$ 1.38
0.114
$- 11.9
2
0.052
$ 3.12
0.085
$ 11.1
7

126
Italy I T A
0.090
$ 19.1
5
0.091
$ 2.15
0.043
$ 10.1
1
0.050
$ 10.3
7
Netherlands N L D
0.177
$ 3.50
0.119
$- 0.37
0.033
$ 4.69
0.194
$ 6.53
Germany D E U
0.077
$ 0.32
0.037
$ 1.95
0.095
$ 0.75
0.061
$ 8.39
USA U S A
0.056
$ 6.16
0.025
$- 0.43
0.055
$- 6.14
0.044
$- 19.8
6
Bulgaria B G R
0.009
$ 11.1
9
0.000
$ 1.99
0.001
$ 20.4
6
0.028
$ 1.61
Romania R O U
0.000
$- 6.73
0.001
$ 1.88
0.001
$- 23.70
0.085
$- 1.22
Notes: Source: our elaboration from UN Comtrade dataset.
In this category (dried/powdered, 071239) we can emphasise the relevant change in behaviour of two countries: The Netherlands and Hong Kong. The latter is particularly interesting because deals with the different characteristics of the two categories. In fact, the role played by the dried/powdered (071239) wild mushroom and truffle trade by this Asian country, is linked with the different perishability in comparison to fresh/chilled (070959) one. However, the “Made-in” power of Hong Kong is not relevant and this might suggest a further flow through more relevant BC countries. One of them might be Germany as well as Italy or France (and the formerly mentioned NLD, too). They show quite relevant BC values, even if not extremely significant for any period. However, on average, their BC and ΔP values express an importance in terms of “Made-in” power and likely existence of arbitrage.
A scatter plot of the same year as for the fresh/chilled (070959) category, i.e. 2009, is shown in Figure 11. Among the countries with a positive price gap between export and import products, Western European ones present the better balances. In particular, France, The Netherlands and Italy have quite significant BC values (i.e. “Made-in” power) with joint positive ΔP, allowing arbitrages. The existence of labelling frauds is officially demonstrated, in the case of Italy, by law enforcement agencies (as discussed further in this chapter). Although Germany does not have a remarkable ΔP, its centrality in global trade of dried/powdered (071239) wild mushroom and truffle trade is very significant. Oppositely, Hong Kong

127
has a lower BC but a more favourable price gap. Bulgaria, as for the fresh/chilled (070959) category, might take advantage from price differences but cannot exploit any “Made-in” power. To exploit the “Made-in” power, a further transition through a high-BC country is possible. Hence, the same product originated with a low Pexp flows through several countries, where each of them tries to gain or from a favourable ΔP or from a powerful “Made-in” label (i.e. high BC).
Figure 11 Betweenness Centrality (BC) and Price Differences scatter plot for the year 2009. Notes: Major Countries referred to fresh/chilled wild mushroom and truffle (070959) category. Source: our elaboration from UN Comtrade dataset.
3.5 Discussion
Although the data available for wild mushroom and truffle global trade do not fully provide scientific proof, they still identify interesting trade anomalies. Nevertheless, reports on law enforcement agencies’ interventions establish a reliable connection between those anomalies and criminal behaviour. This is highlighted by several scholars (among others: Sitta & Floriani, 2008) that emphasise anomalous import and re-export of fungi and truffles.
Lack of a reliable scientific demonstration is due to many reasons.
For the sake of simplicity, we list the main ones: • data incompleteness

128
• combined data (i.e. many species are jointly reported both in national and international databases)
• non-traceability of a relevant amount of production (i.e. mushroom collection is often made by non-professional pickers, sometimes for personal consumption).
This study has three main tasks.
The first is to emphasise anomalies in both international and local trade of wild mushrooms and truffles.
The second is a direct consequence of the previous one. After a study of the main issues of global wild mushrooms and truffles trade, this study finds a reliable source to legally support the hypothesis of anomalous imports and re-exports. Moreover, we provide a method for the detection of likely labelling arbitrage.
Finally, this study proposes a solution through the description of a case study. This study suggests the replication of the analysed case study and the adoption of GIs to guarantee food product origin and quality as well as consumer safety.
From a first analysis of the results, few differences between networks of 071239 (dried/powdered) and 070959 (fresh/chilled) can be easily noticed. Differences arise because of the different intrinsic characteristics of the traded products.
In 071239, mushrooms and truffles are “dried, whole/cut/sliced/broken/in powder but not further prepared”. Therefore, it is easy and cheap to ship them far away from the place where they are collected. Products from the category 070959 are “fresh or chilled”, making it more difficult to transfer them worldwide in an easy, and especially cheap, way. Therefore, a deeper analysis of mushrooms and truffles preservation is required.
As stated by Boa (2004), the time before wild edible fungi rot or shrivel up is short. Boletus edulis, for example, is usually readily dried, since it enhances the flavour. Other mushrooms, i.e. Chanterelles and truffles have a longer durability and this allows a longer time for marketing them as fresh. Preserving mushrooms is therefore feasible, but costly. Drying is the preferred method from subsistence users, for example in Malawi dried fungi are stored in predisposed leaves of a native tree (Boa, 2004). Therefore, cheap shipment, which requires more time, is possible only for dried/powdered mushrooms (especially in the case of Boletus edulis). Fresh wild mushrooms shipments are feasible only for short distances, i.e. those

129
within one/two days by rail or road transports. This is the main reason why, both in terms of network graphs and of OD and BC values, we notice important differences between major European and Asian countries. This depends whether we consider fresh/chilled (070959) dried/powdered (071239) wild mushrooms and truffles.
Visually, networks of fresh/chilled (070959) wild mushrooms and truffles have less nodes and links than the one representing chilled/powdered (071239) ones. Exports have a shorter radius and local trade is preferred to long distances. This is mainly due to the quick deterioration of fresh mushrooms (Sitta, 2008).
For 070959 (fresh/chilled) wild mushrooms and truffles, China has strong paths towards Japan and Korea, while connections with Europe are less significant than for dried/powdered (071239) wild mushrooms and truffles. This lead us to consider that methods for preservation are crucial to determine the kind of export one country want to set up. Moreover, the species of fungi more suitable for some markets help in emphasising this issue.
Western European countries are generally more interested in importing Boletus edulis from China, while in Japan consumers like Tricholoma matsutake. This last species of mushroom has a different taste when it is preserved (Yun et al., 1997) making fresh products preferred, and consequently causing higher prices. It is not possible to benefit from price gap when shipping fresh Boletus edulis from China to Europe due to extremely high costs. Thus, no relevant import occurs for fresh wild mushrooms from far Asian countries to Western ones. Being a sort of “arbitrage” the only reason why Western countries import Boletus edulis from China, it is unproductive to import them when shipping costs are considerable. This also means that no particularly relevant qualities, fragrances or tastes are acknowledged in Asian wild mushrooms and truffles (more precisely in wild mushrooms and truffles usually traded in Western countries) that would justify high expenses both for consumers and retailers and or importers.
For fresh/ chilled (070959) products China, Romania, Bulgaria and all the countries which mainly export towards major European countries, have low BC values and somewhat significant OD amounts. However, in comparison to 071239 (dried/powdered), Romanian and Bulgarian fresh/chilled (070959) wild mushrooms and truffles show moderately higher values. Whereas, China has significantly higher values of BC and OD when considering the dried/powdered (071239) category. These results

130
are consistent with our hypothesis: major European countries exploit the arbitrage deriving from imported products at lower prices than the same domestic goods. Source countries for fresh/chilled (070959) products are Romania, Bulgaria and other Eastern European countries. On the other hand, cheap dried/powdered (071239) wild mushrooms and truffles come from Asian countries (e.g. China, Singapore, Hong Kong, etc.).
France, Italy and The Netherlands have high values of OD, when considering the fresh/chilled (070959) category, especially in comparison to Chinese exports that assume less relevance in terms of connections. Even greater importance is given to European trade (especially from France, The Netherlands and Italy) when considering BC. This reveals the huge role played by European countries in the international trade of wild mushrooms and truffles. Conversely, China plays the role more of a “pure” exporter than that of hub node. Top European countries (i.e. The Netherlands, France and Italy) have more than tripled, each year, the value of China’s BC.
The hypothesis strengthened discussing 070959 (fresh/chilled) trade of Asian and Eastern European countries, is reinforced when considering Western European countries. As also stated by other authors (Sitta & Floriani, 2008), major European countries import mushrooms and truffles from those places where average prices are lower, trying to gain money from the different value of their domestic product in comparison to the imported ones.
Differences among fresh/chilled (070959) and dried/powdered (071239) wild mushrooms and truffles are underlined also by the networks about the 071239 (dried/powdered) category.
In the latter category, Asian countries grow their importance, especially through higher exportation towards Europe, which becomes one of the preferred markets. This does not imply that previous paths do not exist anymore. On the contrary, it actually underlines the higher importance acquired by more distant partners (i.e. Far Eastern countries). The analysis of BC and OD values emphasise the role of South-Eastern Asia. Here China has the biggest OD values for all the years considered, significantly leading the global market. It is worthy to underline the importance raised, in the dried/powdered (071239) market, by three more Asian countries: Hong Kong, Singapore and Japan. This reflects the relevance of Asian exporters when considering food goods with preservation methods more suitable for long shipping.

131
European countries still maintain their importance, with some exception, but at the same time they also face the competition of countries not relevant in the fresh/chilled (070959) category. Their power is much less compared to the fresh/chilled (070959) market. However, France and Italy are top exporters also in this category, while Germany replaces The Netherlands among European top three players.
The analysis of BC values is still in favour of European countries. However, in the dried/powdered (071239) category, Asian countries start playing the role of central nodes of international trade. The gap in terms of BC values between China and the European top three is narrow, while Hong Kong, Singapore and Japan play an interesting role, at least locally to South-East Asia.
The United States are also a top player in this market, but their role is not as significant as European and Asian countries. They slightly gain importance when considering BC values. This seems to be quite expected as a direct consequence of the existing commercial relations between the USA and many Central and South American countries. Given this, our idea of focusing our attention much more to European countries and Asian ones appears not only more interesting for our purpose but also consistent with the actual network of these markets. Among other countries, Thailand is a good exporter. Starting from 2006, it plays a big role both in term of OD and BC.
Since the sold products do not significantly differ in terms of main characteristics (species are the same for both 070959 and 071239), it is the preservation method that, being the only different factor, heavily influences trade. In particular, transportation costs linked with the kind of product are the main criteria for choosing whether is worthy to import them or not.
Moreover, as shown by network graphs, there are some peculiarities in global connections which reinforce the idea of “opaque” trades. BC, OD and average price analysis efficiently delineate this concept.
Pursuing the logic expressed at the beginning of this section, it is interesting to underline how small countries with limited land can play a relevant role in worldwide trade. Southeast Asian countries, like Singapore, grow several species of fungi and have a long tradition both considering eating (Jones, 1990) and medical purpose (Chang, 1999). However, as written in the result section, volumes of import and exports and supposed production lead us to think about possible re-export phenomena. Hong Kong, as well as other Asian countries or special regions such as Singapore and Macau,
132
play an important role as a hub to re-export Chinese products (Feenstra, 2004). It is not possible, as for other goods, to prove that wild mushrooms and truffles are re-exported, because trustworthy information on product origin are extremely difficult to obtain. Nonetheless, BC and OD results corroborate the hub role that some Asian countries or regions (among others: Hong Kong, Singapore and Macau.) play in global trade. Their business in wild mushrooms and truffles industry is extremely particular and might affect their country of origin tracing. For sure, their behaviour affects other countries’ trade. The analysis of Romanian and Bulgarian flows and BC and OD values demonstrate the decline of importance in the dried/powdered (071239) wild mushrooms and truffles trade, if compared to the fresh/chilled (070959) one, because of Asian competition. Effects of Asian competition on European exports come from other countries too, for instance Japan and Thailand.
Hong Kong, Singapore, Japan, Germany, Italy, The Netherlands, France and USA can be defined as funnels.
China is both a funnel and a “pure” exporter: export volumes are extremely high and connections are relevant in both kinds of goods, making China a significant exporter. Nevertheless, its BC and OD values indicate its importance as a central node as well.
The analysis of average prices drive towards deeper conclusions. As in Table 8 and Table 10, China trades mainly cheap products, in comparison with France, Italy and other European countries, both for fresh/chilled (070959) and dried/powdered (071239) wild mushrooms and truffles. This means that China’s export deals more with huge quantities of low price goods rather than with quite moderate amounts of expensive mushrooms and truffles. Moderate but expansive export characterise, for some items, Italy and France: these two countries have a higher average price for exported goods than the other countries considered in this study. Moreover, they are involved in the export of extremely high valued goods. Costly products might refer to truffles: Italy and France, for example, are big producers and famous exporters of these expensive products. They are usually sold fresh, to preserve flavour and characteristics. Huge costs for small quantities perfectly fit with the commercial characteristics of exquisite truffles, too.
The differences among China and Italy or France are particularly relevant for this research because they might explain the existing differences between the fresh/chilled (070959) category and dried/powdered (071239) ones. Considering the considerable shipping costs for fresh

133
products and the risks linked with perishability, it is unfruitful for Chinese companies to trade those kinds of goods. Things change when mushrooms and truffles are dried or in powder or in any other way that is less bulky and less prone to deterioration. Hence, higher quantities can be relatively easily exported towards Europe and many other countries worldwide. Therefore, values, and quantities, for China are significantly higher in the 071239 (dried/powdered) category than in the 070959 (fresh/chilled). Our dataset does not allow us to state the last sentence with a strong theoretical and empirical structure, but not only we can assess it with reasonable certainty, we can also prove it through reports on law enforcement agency interventions. Following this logic, and considering non-top-players of the European market, we can state that fresh/chilled (070959) wild mushrooms and truffles are usually imported from Eastern countries, such as Bulgaria and Romania. Networks support this statement by showing that Romanian trade is mainly, if not only, focused on Europe. Furthermore, the values of average prices are similar to the most famous mushrooms usually picked in Romania and then sold in Western European countries (i.e. Boletus edulis has an average price per Kilo of around 10 US$, roughly the same showed in Table 8 for fresh/chilled - 070959). Similar logic can be applied to Bulgarian trade.
Together with China, other Asian countries raise importance in global trade when dealing with the 071239 (dried/powdered) category. China, Singapore and Hong Kong have similar average costs, with the first two closer to each other than the third one. Nevertheless, Hong Kong has a remarkable BC value. This is possible because Hong Kong plays a significant role in its local area as a hub to import (maybe from the big partner, i.e. China) and then to export the same goods. This could justify also the slightly higher prices. All these hypotheses are also supported by many other scholars (among others: Sitta & Floriani, 2008), even though nobody has provided a formal explanation to prove the phenomenon.
Differences in price engender arbitrage. Some companies in Western countries exploit the price gap instead of adding a real value to products.
In the next section, this study analyses in detail the Italian trade, in order to offer a practical and detailed case study supporting our theory. Moreover, studying arbitrage, the research discusses how weaknesses in the industry make this unfair practice possible. This also contributes to the debate on trustworthiness, quality and local development of rural areas.

134
3.6 Geographical Indications and “Made-in” Power: Italy and the Fungo di Borgotaro IGP Case Study
Following the mixed-method approach102 we move to the second part of our research. We will now look specifically to GIs and the “Made-in” power, connecting the outcome of the quantitative analysis of the first part with the specific characteristic of the Italian market (the one defined as a global leader in the first part) and with the case study of the Fungo di Borgotaro.
After the identification of the competitive advantage for quality food oriented firms, we focus our attention on the Italian case study. This is useful to understand the environment and the background where the analysed example (i.e. the Fungo di Borgotaro PGI) operates. Moreover, as stated in the introductory section of this chapter, in Italy there are evidences of the increasing need for quality labels.
Barney (1991) and other scholars (Peng, 2001; Lockett et al., 2009; and Kozlenkova et al., 2014) try to identify the resources that can give firms a competitive advantage. In order to be “competitive”, resources must be rare. Defining “rare” resources is not an easy task, however Barney (1991) identifies uniqueness as that which is able to generate at least a competitive advantage if not a sustained competitive advantage. Until the number of firms that possess a variable resource is lower than the one creating perfect competition, it is possible to establish a competitive advantage. Niche products, both in terms of limited production (either for geographical or intrinsic reasons) or related to quality excellence, are able to provide such competitive advantage. A more complete definition of valuable and rare resources made by the author deals with imperfect imitation. One of the three reasons that create an imperfectly imitable resource is linked with “unique historical conditions”. The definition of GI reports some of these concepts. It stresses the quality of a product and its connections with origin (i.e. specific link with a territory), reputation and unique characteristics103. Therefore, products awarded with the GI label have unique, imperfectly imitable characteristics. Hence, firms producing or trading a GI product
102 See Davis et al. (2011), Molina-Azonir (2012), Bam (1992), Creswell & Clark (2007), Harrison & Reilly (2011), among others. 103 Article 22 of TRIPS (Trade-Related Aspects of Intellectual Property Rights). Source: WTO - World Trade Organization. https://www.wto.org/english/docs_e/legal_e/27-trips_04b_e.htm.

135
possess a valuable resource, which gives them a competitive advantage. Following a similar reasoning, some authors individuate a competitive advantage in: quality labels (Fotopoulos & Krystallis, 2003), local resources, combination of tangible and intangible resources, renewed territories, mix of assets of the territory and competencies (Presenza et al., 2010). The factors creating a competitive advantage individuated by Presenza et al. (2010) are the same that contribute to creating the “Made-in” power. Therefore, we can state that both GIs and “Made-in” (i.e. the “Made-in” labels linked with certain products/countries which guarantee a certain power) give a competitive advantage to the firms. Several scholars (among others: Loureiro & McCluskey, 2000; Padilla et al., 2007; Loureiro & Umberger, 2003) find that consumers are willing to pay higher prices for GIs and country of origin labels.
GIs and certain “Made-in” labels represent a key factor for the firms owing them. Nevertheless, we noticed that their importance as valuable resources providing a competitive advantage (or even sustained competitive advantage) is not well recognised. In this second part of our study we therefore want to stress this aspect to heighten entrepreneur, scholarly and political consciousness and to propose their replication in similar markets.
3.6.1 Focus: Italy
As shown by the previous results, Italy is one of the major European players. It has numerous connections and it is significant in terms of node importance. In addition to the previous results, this section analyses data on import, export and annual domestic production. This helps in enriching the mixed-method approach we have been using until now. However, in this part the discussion is more focused on reaching the conclusion and highlighting the results of the quantitative analysis in the first part of this chapter.
We use official data from UN Comtrade, Coeweb-Istat and “Annuario dei dati ambientali – ISPRA”104 . Basic computations suggest whether production itself can cover export amount in terms of net weight expressed in kilos. Unfortunately, we cannot use consolidated production of mushrooms and truffles for all the years. These kinds of data are available only from 2004
104 Istituto Superiore per la Protezione e la Ricerca Ambientale: is an Italian public authority for environmental research under the supervision of the Minister of the Environment and Protection of Land and Sea.

136
to 2007, while for 2003 and 2009 we only have wild mushroom production. Therefore, in this analysis we also consider years 2004, 2005 and 2007. Data for both wild mushroom and truffle production data in Italy are not available for 2012.
Before introducing the additional dataset, a synthesis of theoretical knowledge of historic Italian import of the genus Boletus is useful for further discussion. Italy has always extensively imported mushrooms and truffles from many countries. In particular, Boletus edulis and related species have been imported from many years. According to Boa (2004), several countries export fungi (or truffles) to Italy. Among others, he indicates:
• Albania: export is not on regular basis, but it mainly concerns Boletus edulis;
• Belarus: small quantities of wild edible mushrooms; • Bulgaria: many exportations, mainly Boletus edulis; • Moldova: minor exports of Boletus edulis; • Romania: together with Bulgaria, it is the major exporter of fresh
Boletus edulis on a regular basis; • Slovenia: bland export of Boletus edulis; • France; its exports towards Italy are relevant mainly in the case of
truffles (Ainsworth, 1976); • Mozambique; its significant productions might reach Italy via
South Africa; • Former Yugoslavian countries were once relevant exporters.
Nowadays (from 2004-2005) China has surpassed all the combined exports from former Yugoslavian countries: Macedonia (The former Yugoslav Republic of Macedonia), Bosnia and Herzegovina, Croatia and Serbia and Montenegro (exports toward Italy began in 1970s and significantly increased in 1990s) (Sitta & Floriani, 2008);
• China; the main exporter of mushrooms and truffles towards Italy.

137
Table 14 Italian export, import and production of wild mushrooms and truffles: fresh/chilled and dried/powdered (071239 and 070959).
Italy Total (071239+070959)
Period Trade Flow Net Weight (kg) - trade
Production – Export (Kg)
(Production + Import) - Export
(Kg)
2003
Export 2,178,618
- 1,738,618 4,785,919
Import 6,524,537 Production (mushrooms only)
440,000
Production +Import
6,964,537
2004
Export 2,133,077
- 466,577 8,429,373
Import 8,895,950 Production (mushrooms + truffles)
1,666,500
Production +Import
10,562,450
2005
Export 2,587,653
1,012,847 9,293,941
Import 8,281,094 Production (mushrooms + truffles)
3,600,500
Production +Import
11,881,594
2006
Export 2,425,164
961,936 9,021,011
Import 8,059,075 Production (mushrooms + truffles)
3,387,100
Production +Import
11,446,175
2007
Export 2,492,918
- 910,618 7,220,025
Import 8,130,643 Production (mushrooms + truffles)
1,582,300
Production +Import
9,712,943
2009 Export 2,719,270
- 1,339,270 6,609,395 Import 7,948,665

138
Production (mushrooms only)
1,380,000
Production +Import
9,328,665
2012
Export 5,085,532
- 5,719,609105 Import 10,805,141 Production n.a. Production +Import
-
Notes: Annual values and simple computations. Quantities expressed in Kilograms. Source: our elaboration from UN Comtrade dataset, “Annuario dei dati ambientali” - ISPRA and Coeweb - Istat data (“Prodotti forestali non legnosi”)106.
Figure 12 Italian Market: export, import and production of wild mushrooms and truffles: fresh/chilled and dried/powdered (071239 and 070959). Notes: Source: our elaboration from UN Comtrade dataset, “Annuario dei dati ambientali” - ISPRA and Coeweb - Istat data (“Prodotti forestali non legnosi”)107. (Data about import and export have identical value both considering those of UN Comtrade and ISTAT).
105 Due to lack of production information, we only compute Import-Export. 106 Data about import and export have identical value both considering those of UN Comtrade and ISTAT. 107 Data about import and export have identical value both considering those of UN Comtrade and ISTAT

139
Table 15 Italian Production of wild mushrooms and truffles: fresh/chilled and dried/powdered (071239 and 070959) from 2003 to 2009.
Year Mushrooms
(Kg) Truffles (Kg)
Mushrooms + Truffles (Kg)
2003 440,000 n/a - 2004 1,600,000 66,500 1,666,500 2005 3,500,000 100,500 3,600,500 2006 3,300,000 87,100 3,387,100 2007 1,500,000 82,300 1,582,300 2009 1,380,000 n/a - σ2 (2004/2007) 1.14917 x 10¹² 196.98 x 10⁶ 1.17366 x 10¹²
Notes: Source: our elaboration from “Annuario dei dati ambientali” – ISPRA (http://annuario.isprambiente.it/ada/versioni) and ISTAT.
Mushroom picking has been facing a decrease that started in the 70s, when it was up to 7,700,000 kilos. This is due to social factors: urbanisation and loss of local traditions (ISPRA, 2009). According to some authors (among others: Boa, 2004), historically the picking of fungi was important for the sustenance of many people in northern Italy. Nowadays, the collection is consistently less relevant for economic purposes (mainly confined to a few pickers who sell their products), even if there is still a general interest for personal consumption.
As expected from the study of yearly reports, in 2003 there was a paucity of mushroom production, while in 2005 and 2006 an exceptional picking was registered. In 2004, 2007 and 2009 the yearly production was approximately 1,500 tons. Truffle production charted an identical inverted-U shape behaviour: after an increase in 2005, a slight period of decline begins in 2006. Professional associations say that drought is the cause of lower production. The amount of imports and exports were somewhat constant during the period between 2003 and 2009.

140
Figure 13 Italian Production Vs Export of wild mushrooms and truffles: fresh/chilled and dried/powdered (071239 and 070959) from 2003 to 2009. Notes: Source: our elaboration from UN Comtrade dataset, “Annuario dei dati ambientali” - ISPRA and Coeweb - Istat data (“Prodotti forestali non legnosi”)108.
108 Data on import and export have identical value both considering those of UN Comtrade and ISTAT.
141
Truffles represent, as shown by the dataset, less than 5% of Italian annual wild mushrooms and truffles production. Therefore, the analysis can consider both years with mushroom and truffle records and, without any loss in significance, those with only mushroom data. Four out of the six analysed years manifest a domestic production that is insufficient to fulfil export demand. Moreover, for 2003 and 2009, the difference is so significant that even an assumed truffle production would not be sufficient to eliminate this gap.
Only for the two years of exceptional wild mushrooms and truffle production does the domestic volume exceeds export demand.
Table 14 and Table 15 exhibit anomalies in production and exportation volumes. Table 14 also presents the differences between the sum of production and import and export values. Obviously, all the results are positive by a significant amount.
We can try to assume that all exports come from domestic production. This would assure that all the mushrooms and truffles (i.e. the species considered in 070959 and 071239) sold by Italy are 100% Italian. It might be true for 2005 and 2006. However, it is not feasible for 2003, 2004, 2007 and 2009. We do not consider domestic consumption of Italian mushrooms and truffles, since it is not relevant for our logic. Adding this complexity might invalidate the results of 2005 and 2006 (in case domestic consumption of Italian products exceeds the positive difference), although this does not change the outcome for the other years. Despite adding complexity, nevertheless, considering domestic consumption does not provide any further help. Thus, the main questions are: where do those products come from? Is there a way to exploit a type of arbitrage?
We start with a clarification of the data, which might be considered poorly representative, as well as data concerning picking and commerce of mushrooms (especially wild mushrooms) and truffles. This represents the main limitation for any research concerning non-timber forest products. Even if when due caution is necessary in using this kind of data, we cannot ascribe the disparities to collection errors. However, our data come from the most reliable Institute in Italy (i.e. ISTAT). Hence, there are evidences of some anomalies in mushroom and truffle trade. Nevertheless, those evidences do not validate the existence of a type of arbitrage or any other fraudulence. We can only infer that, at least, the amount of export demand that is unfulfilled by domestic production comes from import. But this per se does not represent an offence. It is worthy to analyse further.
142
The only reliable data able to connect those evidences to specific frauds come from law enforcement agencies. Seizures of wild mushrooms and truffles in Italy chiefly involve product origins violations. What does “origin” mean? European Commission (2016) defines “origin” in the Customs Code (Council Regulation (EEC) No 2913/92), specifically Articles 22, 23 and 24, and in the Code's implementing provisions (Commission Regulation (EEC) No 2454/93). There are two basic concepts to determine the origin of goods: the “wholly obtained” products and the “last substantial transformation” concepts. The former applies if the production takes place in only one country. This generally is true for products obtained in their natural state. The “last substantial transformation” occurs when two or more countries are involved in the production process. It is essential to determine which of them confers the origin to the final product. Hence, the “last substantial transformation” concept is applied. It is possible to express this concept in three ways. First, if we consider the rule that requires a change in the Harmonized Commodity Description and Coding System nomenclature109. The second way regards whether a list of manufacturing or processing operations confers to the goods the origin of the country where these operations happened. The third is based on the value-added rule, which considers the amount of ex-work price added in a specific country. If a product meets one of the explained requirements, it is possible to assign a country of origin. By contrast, if a country is not recognised as place of origin, but the product presents a label indicating that country, fraud can be considered.
Law enforce agencies have special departments that try to prevent and detect frauds. Italian authorities have uncovered several frauds over years. Among others, seizures of wild mushrooms and truffles during the last seven years contribute the additional information needed to prove anomalies to this research. Specifically, they state the existence of noteworthy fraudulent misuse of Country of Origin (CoO) labels. Hence, they reveal the presence of a link between insufficient domestic production and the utilization of imports, in order to satisfy both export and domestic demand. Moreover, the exploiting of arbitrage is emphasised. Some companies capitalise on the price differences between imported goods and
109 The Harmonized Commodity Description and Coding System is governed by "The International Convention on the Harmonized Commodity Description and Coding System", which was adopted in June 1983 and entered into force January 1988. International Convention on the Harmonized Commodity Description and Coding System (with annex), as amended by the Protocol of Amendment of 24 June 1986. Concluded at Brussels on 14 June 1983. 168 UNTS 1988.
143
“new” products exported with the “Made-in-Italy” logo. Sometimes the country of origin is indicated using the “Made-in” mark, even if the “Product-of” is also used. They have the same meaning, although the latter one is probably more frequently used for food products in American markets. However, from now on, we will use the term “Made-in” to define the mark for country of origin of a product.
There are several reports on mushroom and truffle seizures. We consider only the most recent and significant ones. They were conducted by the Corpo Forestale dello Stato110 and the Guardia di Finanza111. The latter also set the Sistema Informativo Anti-Contraffazione (S.I.A.C.) which provides support and technical assistance, both to consumers and to other law enforcement agencies, by disseminating information regarding counterfeiting.
The main seizures from 2009 to 2015 are (Corpo Forestale dello Stato, 2012 and 2015):
• 2010, Ascoli Piceno; 100 Kg of Tuber from Romania; • 2011, Operation “Por-Cina”; more than 6,000 packages and more
than 3 tons of dried Boletus edulis from China; • 2012, Potenza; dried Boletus edulis from Serbia and Romania with
counterfeit “Made in Italy” labels; • 2012, Salerno; dried Boletus edulis from China and Eastern Europe
with counterfeit “Made in Italy” labels; • 2012, Ravenna, Bologna, Potenza and Matera; more than 2,000
packages of Boletus edulis, with “Made in Italy” counterfeit labels, from Romania and Macedonia;
• 2014, Avellino; 30Kg of wild mushrooms and truffles; • 2015; 41,000€ worth of counterfeiting truffles.
Among others, two big operations revealed, in recent years, the counterfeiting of “Made in Italy” wild mushrooms and truffles: “Por-Cina”
110 The State Forestry Corps (Corpo Forestale dello Stato) was a national police agency in Italy. From 01/01/2017 the corps become part of Carabinieri. It is responsible for protecting: natural resources, the environment, countryside and ecosystems. It is also involved in criminale investigations and typical police operations. 111 Guardia di Finanza is an Italian law enforcement agency. Although it is a militarised police force, it operates under the Ministry of Economy and Finance (Ministero dell’Economia e delle Finanze). In addition to the traditional police operations, Guardia di Finanza is focused on financial crime and smuggling.
144
(in 2011) and “Por-Cina 2” (in 2013). The most relevant frauds concern attaching “made in Italy” label to products originating in other countries. The majority of them come from China and Eastern European countries. Relevant issues are preservation, expiry date (more than 12 months: the maximum period according to Italian law) and quality of ingredients (Corpo Forestale dello Stato, 2012).
Law enforce agencies and the Italian Ministry of Economic Development (Ministero dello Sviluppo Economico) use the expression Italian Sounding to describe this increasing and detrimental phenomenon (Ministero dello Sviluppo Economico, 2012). Frauds are set up by using misleading labels through words, motifs, acronyms, colours, slogans recalling the quality and the benefits of Italian products (Corpo Forestale dello Stato, 2012). Although a phenomenon which extensively affects Italian agroindustry, it has particular relevance for the Italian trade of Boletus edulis, since the majority of the volume has a foreign origin (Corpo Forestale dello Stato, 2011).
The “new” product has no intrinsic differences with the original imported one. The firm that previously imported it does not further process it. The company simply labels the product adding the “Made-in-Italy” merchandise mark. Hence, they exploit the benefit purely coming from what we call “Made-in” Power. Neither value nor assurance about quality is added to the product. Therefore, the gap between import and export price entirely comes from the fraudulent change on country of origin. The quality usually acknowledged to the Italian agribusiness sector is the only factor that augments the price of exported product. That enhancement corresponds to the value of “Made-in-Italy” merchandise mark. It represents a good proxy of “Made-In” Power of Italy.
According to a survey conducted by Nielsen (2016), brand origin is important to 75% of global customers. The survey also states that perceived specialisation of certain countries, with regards to specific products, is one of the factors enhancing the importance of country origin.
The designation of country of origin, or at least the alleged one, represents both the main issue to enhance product value and the most counterfeited element. Therefore, it is, at the same time, an instrument useful to guarantee quality and a valuable tool that needs protection itself.

145
3.6.1.1 The Fungo di Borgotaro IGP Case Study
One of the main research questions of this study explores whether GIs guarantee quality and contribute to local development. In consideration of the depicted global trade of wild mushrooms and truffles and the problems arising in terms of origin and quality assured to consumers, the Fungo di Borgotaro case represents a successful model for other local excellences.
It could be seen as a potential natural experiment, the only one concerning un-cultivable agricultural products in all of Europe. However, the lack of data right before and right after the introduction of the GI make the Fungo di Borgotaro only a potential natural experiment, or a valuable example to be studied.
The Fungo di Borgotaro is a trademark of four types of Boletus edulis, picked or processed in a specific area in Parma and Massa Carrara provinces.
In 1957 the first consortium, “Consorzio Comunalie Parmensi”, was constituted with the aim of gathering all of the “comunalie” of that area. Seven years later, a natural reserve for the safeguard and development of mushroom production was established in the “Comunalia di Boschetto”. Nevertheless, local trade of Boletus could be dated back to the 17th century and the name Fungo di Borgotaro has been used since 1934 to label local mushrooms (Pettenella, 2007).
The two cornerstones in the process of valorisation and protection of the whole area were the initiatives of 1995 and 1996, the latter was the hoped consequence of the former
In 1995, the “Consorzio di tutela” was instituted with the aim of guaranteeing, enhancing and promoting the main product through specific product regulations. The official recognition as Protected Geographical Indication (PGI) from the European Commission (EC), the first and only one about wild edible products, was finally obtained in 1996112. In 2016 the Fungo di Borgotaro was also the first one to receive a quality certification from a certification and inspection company (CSQA)113.
112 Source: European Commission, Agriculture and Rural Development, DOOR. http://ec.europa.eu/agriculture/quality/door/registeredName.html?denominationId=320 113 Source: Qualivita Foundation. http://www.qualivita.it/news/il-fungo-di-borgotaro-igp-diventa-lunico-certificato-in-europa/

146
The Consortium has the tasks to define rules and control their implementation and also to manage, promote and support the activities aimed to improve local mushrooms trade. Moreover, Consortium is in charge of selling a special pass that allows tourists to pick, under some rigorous rules, wild mushrooms in the reserved area. Niche tourism represents a relevant income in the Borgotaro area.
PGI is awarded to agricultural products and foodstuffs closely linked to that specific geographical area. Hence, at least one of the stages of production, processing or preparation must take place there. Goods under the Fungo di Borgotaro label must therefore be picked or at least processed in the indicated circumscribed area.
As documented by Pettenella (2007), fresh mushrooms mainly come from the area and sometimes are marked with the EC label. Much of processed (i.e. dried, in oil or frozen) mushrooms comes from outside. This is also the prevalent behaviour in the majority of Italian territory, as discussed in the previous section. However, the excellence of the Fungo di Borgotaro area is represented by the expertise, the ability and the inclination towards quality goods of the local firms. These factors represent, for consumers, a good reason for buying labelled goods. Those issues make the Fungo di Borgotaro widely recognised and trusted by consumers.
There are few firms operating in the mushroom business. A few of them are extremely small: two of them buy and trade only local harvested mushrooms. There are also two bigger companies, which employ from 8 to 20 workers and, mainly, import mushrooms. Then, they exploit their well-recognised expertise to process and then trade the imported porcini (Pettenella, 2007).
Local production is much lower than the demand (see Table 16 for production and variations over recent years). Pettenella (2007) states that it represents only 5% of the traded mushrooms. The largest amount comes from other areas in Italy or is imported from Eastern Europe and China.
While local mushroom price is around 15 or 25 €/Kg, from Table 8 and Table 10 we know that average prices go from a minimum of 3.21 US $/Kg to 15.90 US $/Kg. Therefore, prices of imported wild mushrooms are, on average, consistently less than the value of Boletus edulis treated and then sold by a firm in Borgotaro.

147
Table 16 Fungo di Borgotaro production (in Kilograms). Years: 2005, 2009, 2010, 2011, 2012 and 2013.
Fungo di Borgotaro
Year (production in Kg)
2005 21,448 2009 16,366.45 2010 7,198.79 2011 4,473 2012 2,442 2013 4,470
Variations and % of Variations
Var. 2010/2009 -9,167.66 Kg
% Var. -56.01%
Var. 2011/2010 -2,725.70 Kg
% Var. 37.86%
Var. 2012/2011 -2,031 Kg
% Var. -45.41%
Var. 2013/2012 2,028 Kg
% Var. 83.05%
Notes: Source: “Rapporto sulle Produzioni Dop E Igp in Emilia Romagna. 2009, 2010, 2012. In: Ittica, Attivita’ Faunistico-Venatorie. Servizio Percorsi Di Qualità, Relazioni Di Mercato e Integrazioni Di Filiera Regione Emilia Romagna”; www.qualigeo.eu.
Brand awareness of the Fungo di Borgotaro, together with its acknowledged traditions, represents the rationale of higher prices. The underlying logic is the same as for imported Boletus edulis sold at higher prices when labelled with the “Made in Italy” logo. However, there is a substantial difference: while in the case of the Fungo di Borgotaro there is the EC label guaranteeing quality and standards, counterfeiting “Made in Italy” labels do not provide any assurance. Furthermore, in many seizures, products were found in dreadful state of preservation. These relevant differences are detrimental to consumer health and safety.
The Italian mushroom industry demonstrates its persistent incapability to fulfil the demand with domestic production by requiring massive import. At the same time, the acknowledged Italian competencies and traditions in food quality make it possible to set higher prices, hence providing an arbitrage based on different consumer behaviour. Being impossible to either to stop importation nor to fulfil demand in other ways (i.e. domestic production), it is evident, based on the Fungo di Borgotaro case study, how the use of GIs represents a required solution to the phenomenon.

148
GIs provide assurances to consumers regarding the quality and safety of products. The higher price consumers pay for GI products are therefore justified by this assurance.
EC labels for geographical excellence have beneficial effects for the involved territory, too. The case of the Fungo di Borgotaro demonstrates that the PGI label has a positive impact on the whole area. Regni (2005) identifies that desirable consequences in the Borgotaro area come from:
• Sales of tourist pass • Trade of Boletus edulis • Satellite activities • Local area promotion • Investments • Other forest products sales
Therefore, we can easily notice a strong connection of the previous aspects (linked with the presence of a PGI label) with the important advantages coming from the increasing of commercialisation and the augmentation in touristic flows. This is just a simple suggestion which follows other studies on this topic. Much debate might arise from what we described above. However, we believe that the Fungo di Borgotaro represents a winning example that should be followed by other areas in Italy. This is true not only for Boletus edulis, but for many other wild mushrooms and truffles, whose production and commerce is relevant in some Italian regions (Marone, 2011).
3.7 Conclusions
This research leverages different methods to depict global trade and anomalies of wild mushroom and truffle industry.
Three different groups of countries can be identified in global trade: Asian Countries, Western countries and Eastern European countries. Within Asian countries, China represents a distinctive case.
We identify some Asian countries (i.e. Hong Kong, Singapore and Japan) and Western countries (i.e. Germany, Italy, The Netherlands, France and USA) as funnels. They import considerable quantities of fresh/chilled products (070959), in case of nearby trade, or dried/powdered (071239), if faraway, wild mushrooms and truffles and re-export them. Opacity of origin and

149
quality concerning many of those products is crucial for the existence of some anomalies.
Differences in average prices between countries make it possible for firms from certain countries (mainly Western ones) to profit from a kind of arbitrage. They exploit the existing ambiguities of product origin in the market.
The average prices analysis reveals how it is possible to gain advantage for operators in some specific countries (e.g. major European ones) by buying products from the places with lower APs and then sell them again (i.e. re-export) exploiting the price gap.
They profit from what we call “Made-in” power. It is not the intrinsic quality of a product to generate the price gap and to augment its value. The acknowledged competencies in the food industry recognised by the re-exporting country are the basis of the kind of arbitrage in wild mushroom and truffle industry.
Frauds are possible because origin is uncertain and exporters do not clearly specify the country in which the good has been actually produced or treated.
Quality assurance and certification of origin are the two most relevant issues that should be guaranteed for the health of consumers and trustworthiness of the market. The Fungo di Borgotaro represents a significant example of how the importance of extending GI labels to those areas in which their quality and know-how is famous worldwide. Local areas will also benefit from the introduction of GI labels, both socially and economically. We hope that this study contributes to the improved understanding of worldwide trade anomalies and possible solutions.
Many topics that we have addressed in this study open to further analysis and debates. We firmly believe that “Made-in” power is a key concept to understand and explore many of the features involved.

150
Appendix A: Time In this appendix, we report a descriptive analysis of time variables used in the empirical analyses of chapter 2. Private Label Promotion: a new defensive and supporting strategy?
We first list all the periods for which we have data. Although we do not consider period as explanatory variable in our model, since raw data are expressed in this way, a description seemed necessary. A list matches each period (as reported in raw data) with the corresponding months and year to which it refers.
Even if the dataset we received only indicates quarters, we built two other variables for studying seasonal strategies and yearly trends. As mentioned in the chapter, the two variables are: year and season.
For the sake of simplicity, we assume that seasons start at the end of (respectively) March, June, September and December.
Periods (quarters):
Period 1: January- March 2013
Period 2: April – June 2013
Period 3: July – September 2013
Period 4: October - December 2013
Period 5: January- March 2014
Period 6: April – June 2014
Period 7: July – September 2014
Period 8: October - December 2014
Period 9: January- March 2015
Period 10: April – June 2015
Period 11: July – September 2015

151
Years: Year 1: 2013
Year 2: 2014
Year 3: 2015
Seasons:
Season 1: “Winter” – January-March of years 2013, 2014 and 2015
Season 2: “Spring” – April-June of years 2013, 2014 and 2015
Season 3: “Summer” – July-September of years 2013, 2014 and 2015
Season 4: “Autumn” – October-December of years 2013 and 2014
Table 17 Seasons shows the frequency and the percentage of each season.
Table 17 Seasons
Season Freq. Percent Cumulative
Season 1: “Winter” 363 27.27 27.27
Season 2: “Spring” 363 27.27 54.55
Season 3: “Summer” 363 27.27 81.82
Season 4: “Autumn” 242 18.18 100.00

152
Appendix B: Categories In this appendix, we report a descriptive analysis of the variable category, which is used in the empirical analyses of chapter 2. Private Label Promotion: a new defensive and supporting strategy?
We built 15 categories, accordingly to our specific dataset and considering the categories in which products are divided by Nielsen’s major reports.
We first report the complete list of all the categories. In parentheses we specify the original Italian names.
Categories:
1. Other Ingredients (Altri ingredient) 2. Coffee and Infusions (Caffe' e Infusi) 3. Chocolate (Cioccolato) 4. Seasonings, Marinated Vegetables and Pickles (Condimenti, Sottoli
e Sottaceti) 5. Spread Creams (Creme Spalmabili) 6. Cakes and Snacks (Dolci e Snack) 7. Basic Ingredients (Ingredienti Base) 8. Legumes and Side Dishes (Legumi e Contorni) 9. Oils and Vinegars (Olii ed Aceti) 10. Bread and Similar (i.e. salted baked products) (Pane e Simili) 11. Purees and Sauces (Passate e Salse) 12. Pasta and Rice (Pasta e Riso) 13. Fish (Pesce) 14. Ready meals (Preparati) 15. Breakfast Products, Patisserie (Prima Colazione e Pasticceria)
Then, Table 18 shows the number of products per category, their frequency and, in the notes, the average number of products per category as well as the minimum and the maximum.
A bar graph showing the number of products in promo and not in promo for each category is reported in Figure 14. Finally, we list the products for each relevant category analysed in the discussion.

153
Table 18 Categories and Number of Products
Category Name Number
of products
Freq. Percent Cum.
Other Ingredients (Altri ingredienti)
6 66 4.96 4.96
Coffee and Infusions (Caffe' e Infusi)
9 99 7.44 12.40
Chocolate (Cioccolato)
5 55 4.13 16.53
Seasonings, Marinated Vegetables and Pickles (Condimenti, Sottoli e Sottaceti)
7 77 5.79 22.31
Spread Creams (Creme Spalmabili)
9 99 7.44 29.75
Cakes and Snacks (Dolci e Snack)
8 88 6.61 36.36
Basic Ingredients (Ingredienti Base)
8 88 6.61 42.98
Legume and Side Dishes (Legumi e Contorni)
6 66 4.96 47.93
Oils and Vinegars (Olii ed Aceti)
6 66 4.96 52.89
Bread and Similar (i.e. salted baked products) (Pane e Simili)
11 121 9.09 61.98
Purees and Sauces (Passate e Salse)
8 88 6.61 68.60
Pasta and Rice (Pasta e Riso)
11 121 9.09 77.69
Fish (Pesce)
9 99 7.44 85.12
Ready meals (Preparati)
7 77 5.79 90.91
Breakfast Products and Patisserie (Prima Colazione e Pasticceria)
11 121 9.09 100.00
Notes: Average products per category: 8.1. Minimum: 5. Maximum: 11.

154
Figure 14 Number of Products in Promo/not in Promo for each Category.

155
Products from the relevant categories examined in the discussion:
Pasta e Riso:
• Fusilli Integr.BIO G.500 • Fusilloni Napoletani G.500 PREMIUM • Pasta All'uovo • Pasta All'uovo PREMIUM • Pasta Di Semola BIO • Pasta Di Semola PREMIUM • Pasta Secca Ripiena • Riso Normale • Riso Normale BIO • Riso Parboiled • Spec.Fusilli Bucati G500
Prima Colazione e Pasticceria:
• Biscotti Classici • Biscotti Farciti/Ricoperti • Biscotti Farciti/Ricoperti PREMIUM • Cereali Per Prima Colazione • Colazioni Energetiche • Fette Biscottate • Fette Biscottate BIO • Miele e Affini • Miele e Affini PREMIUM • Miele e Affini BIO • Pasticceria Industriale
Condimenti, Sottoli e Sottaceti
• Condimenti Pronti • Condimenti Pronti PREMIUM • Maionese • Ortaggi Sott'aceto • Ortaggi Sott'aceto PREMIUM • Ortaggi Sott'olio • Ortaggi Sott'olio PREMIUM
Dolci e Snack

156
• Caramelle / Pastigliaggi • Frutta Sciroppata • Frutta Secca/Snack/Piccoli F. • Merendine • Olive • Olive PREMIUM • Patatine • Salatini
Cioccolato
• Cacao • Cacao BIO • Tavolette Cioccolato • Tavolette Cioccolato BIO • Wafers

157
Appendix C: The Pasta Industry Since a relevant part of the discussion on chapter 2. Private Label Promotion: a new defensive and supporting strategy? is about pasta and rice, in this appendix we propose a brief review of the evolution of the pasta industry in Italy. This helps in understanding the concentration of the industry and therefore lends idea of the main manufacturers and the most relevant NB producers.
As thoroughly explained by Magnatti (2007), the pasta sector in the 70s was characterized by small local manufacturers. Then, competition and the appearance of retail chains acutely changed the market. Lack of competitiveness and limited markets reduced the number of pasta factories from almost 240 in 1981 to 149 in 1997. Between 1983 and 1998 there were many takeovers that concentrated the market, introducing or creating some multinationals in the Italian market (Benfratello, 2002). Table 19 shows the biggest 24 acquisitions in the Italian pasta industry, from the 80s until the end of the last century.

158
Table 19 Pasta industry acquisitions 1983-1998.
.
AC
QU
IRE
R (
CO
UN
TR
Y)
AC
QU
IRE
R'S
IN
DU
STR
YA
CQ
UIR
ED
FIR
MS
ELLE
RD
ATE
LO
CA
TIO
N
1B
AR
ILLA
(IT
A)
PA
STA
VO
IELLO
Independent F
irm
1983
South
2B
AR
ILLA
(IT
A)
PA
STA
PA
STIF
ICI
ME
RIO
DIO
NA
LI
Independent F
irm
1983
South
3C
AS
ILLO
MIL
LIN
GP
AS
TIF
ICIO
BR
IBA
NO
Independent F
irm
1984
Nort
h
4B
AR
ILLA
(IT
A)
PA
STA
PA
STIF
ICI
VIR
GIL
IO C
OS
TA
Independent F
irm
1985
South
5B
AR
ILLA
(IT
A)
PA
STA
F.L
LI
QU
INTO
E M
AN
FR
ED
IIn
dependent F
irm
1985
South
6B
SN
-GE
RV
AIS
DA
NO
NE
(F
RA
)C
ON
GLO
ME
RA
TE
PO
NTE
S.
GIO
VA
NN
IIn
dependent F
irm
1985
Centr
e
7C
IR-D
E B
EN
ED
ET
TI (I
TA
)C
ON
GL
OM
ER
AT
EB
UIT
ON
IIn
dep
en
den
t F
irm
1985
Cen
tre
8B
AR
ILL
A (
ITA
)P
AS
TA
PA
ST
IFIC
IO B
RA
IBA
NT
IIn
dep
en
den
t F
irm
1986
Cen
tre
9G
AZZO
LA
(IT
A)
-A
RR
IGH
IIn
dep
en
den
t F
irm
1986
No
rth
10
BS
N-G
ER
VA
IS D
AN
ON
E (
FR
A)
CO
NG
LO
ME
RA
TE
PA
STIF
ICIO
CH
IGI
Independent F
irm
1987
Centr
e
11
BS
N-G
ER
VA
IS D
AN
ON
E (
FR
A)
CO
NG
LO
ME
RA
TE
PA
ST
IGIC
IO S
PIG
AIn
dep
en
den
t F
irm
1987
Cen
tre
12
BS
N-G
ER
VA
IS D
AN
ON
E (
FR
A)
CO
NG
LO
ME
RA
TE
PA
STIF
ICIO
MA
NTO
VA
NO
Independent F
irm
1987
Nort
h
13
BS
N-G
ER
VA
IS D
AN
ON
E (
FR
A)
CO
NG
LO
ME
RA
TE
PA
STIF
ICIO
TO
MA
DIN
IIn
dependent F
irm
1987
Nort
h
14
BO
RD
EN
(U
SA
)P
AS
TA
PA
ST
IFIC
IO A
LB
AD
OR
OIn
dep
en
den
t F
irm
1987
No
rth
15
NE
STLE
' (S
UI)
CO
NG
LO
ME
RA
TE
BU
ITO
NI
CIR
-DE
BE
NE
DE
TTI
1988
Centr
e
16
C.S
.M.
(NE
D)
CO
NF
EC
TIO
NE
RY
AU
DIS
IOIn
dep
en
den
t F
irm
1988
No
rth
17
NE
ST
LE
' (S
UI)
CO
NG
LO
ME
RA
TE
PE
ZZU
LL
OIn
dep
en
den
t F
irm
1989
So
uth
18
AL
IMC
O (
ITA
)M
ILL
ING
PA
ST
IFIC
IO P
AG
AN
IIn
dep
en
den
t F
irm
1990
No
rth
19
PA
LF
IN (
ITA
)F
INA
NC
IAL
CH
IRIC
OIn
dependent F
irm
1990
South
20
BS
N-G
ER
VA
IS D
AN
ON
E (
FR
A)
CO
NG
LO
ME
RA
TE
AG
NE
SI
Independent F
irm
1990
Nort
h
21
TA
MM
A (
ITA
)P
AS
TA
AN
D R
ICE
PA
ST
IFIC
IO D
EL
VE
RD
EIn
dep
en
den
t F
irm
1991
Cen
tre
22
P.A
.I.
(FR
A)
FIN
AN
CIA
LA
GN
ES
ID
AN
ON
E1997
Nort
h
23
EU
RIC
OM
(IT
A)
RIC
EC
OR
TIC
ELLA
Lega d
elle
Coopera
tive
1998
Centr
e
24
CO
LU
SS
I (I
TA
)C
ON
FE
CTIO
NE
RY
AU
DIS
IOC
.S.M
.1998
Nort
h
159
Notes of Benfratello (2012): in bold the 9 acquisitions for which the acquired firm is included in the sample. In the table, he considers to be Northern regions Valle D’Aosta, Piemonte, Liguria, Lombardia, Veneto, Trentino-Alto Adige and Friuli Venezia Giulia; Central regions Emilia-Romagna, Toscana, Marche Umbria, Abruzzo, Molise and Lazio; Southern regions Puglia, Campania, Basilicata, Calabria, Sicilia and Sardegna. Gazzola is a former owner of a firm in the pasta industry who, after selling his stakes in that firm, subsequently acquired Arrighi. Source: Benfratello (2012).
The period leading up to 2005 saw a new reduction in pasta producers (about 13%), even though production capacity rose by 18% (Magnatti, 2007). In recent years, about 70% of the pasta sold in Italy came from big companies, with only about 24% from medium and 6% from small enterprises (Federalimentare-ISMEA Centro Studi Confindustria, 2005).
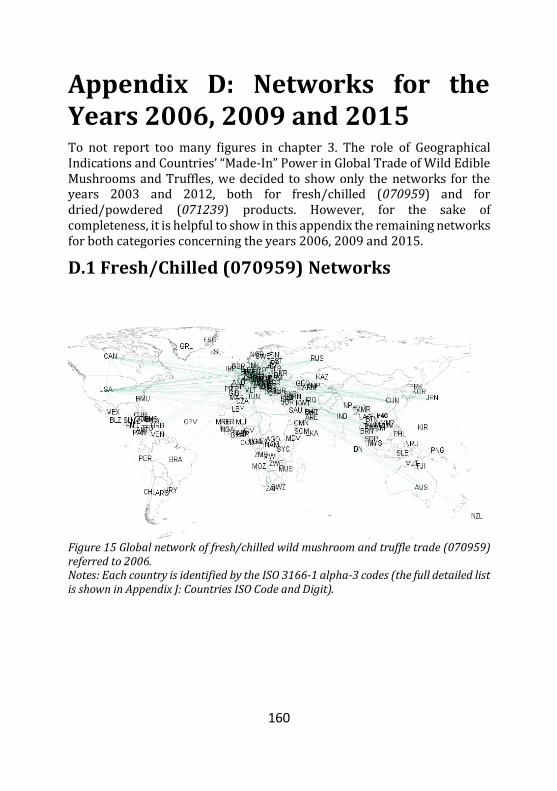
160
Appendix D: Networks for the Years 2006, 2009 and 2015 To not report too many figures in chapter 3. The role of Geographical Indications and Countries’ “Made-In” Power in Global Trade of Wild Edible Mushrooms and Truffles, we decided to show only the networks for the years 2003 and 2012, both for fresh/chilled (070959) and for dried/powdered (071239) products. However, for the sake of completeness, it is helpful to show in this appendix the remaining networks for both categories concerning the years 2006, 2009 and 2015.
D.1 Fresh/Chilled (070959) Networks
Figure 15 Global network of fresh/chilled wild mushroom and truffle trade (070959) referred to 2006. Notes: Each country is identified by the ISO 3166-1 alpha-3 codes (the full detailed list is shown in Appendix J: Countries ISO Code and Digit).

161
Figure 16 Global network of fresh/chilled wild mushroom and truffle trade (070959) referred to 2009. Notes: Each country is identified by the ISO 3166-1 alpha-3 codes (the full detailed list is shown in Appendix J: Countries ISO Code and Digit).

162
Figure 17 Global network of fresh/chilled wild mushroom and truffle trade (070959) referred to 2015. Notes: Each country is identified by the ISO 3166-1 alpha-3 codes (the full detailed list is shown in Appendix J: Countries ISO Code and Digit).

163
D.2 Dried/Powdered (071239) Networks
Figure 18 Global network of “dried, whole/cut/sliced/broken or in powder […]” mushroom and truffle trade (071239) referred to 2006. Notes: Each country is identified by the ISO 3166-1 alpha-3 codes (the full detailed list is shown in Appendix J: Countries ISO Code and Digit).

164
Figure 19 Global network of “dried, whole/cut/sliced/broken or in powder […]” mushroom and truffle trade (071239) referred to 2009. Notes: Each country is identified by the ISO 3166-1 alpha-3 codes (the full detailed list is shown in Appendix J: Countries ISO Code and Digit).

165
Figure 20 Global network of “dried, whole/cut/sliced/broken or in powder […]” mushroom and truffle trade (071239) referred to 2015. Notes: Each country is identified by the ISO 3166-1 alpha-3 codes (the full detailed list is shown in Appendix J: Countries ISO Code and Digit).

166
Appendix E: Effect of “Areas NES (not elsewhere specified)” and "Bunkers" elimination As data from the "United Nations Commodity Trade Statistics Database" (UN Comtrade), which are used in chapter 3. The role of Geographical Indications and Countries’ “Made-In” Power in Global Trade of Wild Edible Mushrooms and Truffles might report some trades that are not useful for our work, we decided to eliminate the records that might negatively impact the trustworthiness of our analysis. In the following two sections, we describe the deleted records and we provide, when needed, the motivation behind that choice.
E.1 Fresh/Chilled (070959)
In the case of fresh or chilled mushrooms and truffles, Japan is the country most affected by this elimination. Its exports towards “Asia, not elsewhere specified” reach roughly between 41 and 46 percent of the total exportation volume starting from 2006, 2003 being the only year to not affected by this anomaly. 2003 seems to be the only year with no significant impact of “World”, “Areas NES (not elsewhere specified)”, "Free Zones" and "Bunkers" elimination, with the USA being the only country affected by more than 0.25% of its total volume (0.26%). Then, from 2006 Japan has almost half of its exports to not specified Asian countries: 2,758,859 $ (out of a total of 6,029,959 $, 45%) in 2006, 1,181,836 $ (of 2,861,999 $, 41.2%) in 2009 and 1,831,353 $ (out of 3,936,701 $, 46.5%) in 2012. However, even if by far the most affected, Japan is not the only one influenced by these cuts. Other Asian countries export a significant amount to “Asia, not elsewhere specified”, among them the most involved are: Korea in 2006 (306,646 $ out of 10,475,294 $: 2.9%), Thailand in 2009 (414,181 $ of 5,512,311 $: 7.5%) and again Korea in 2012 (345,326 $ of 35,390,949 $: 0.97%). Not only “Asia, not elsewhere specified” is considered a partner country, but it might also be a reporter (i.e. a country from which an export flow origins). In 2006, 2009

167
and 2012, our dataset presents “Asia, not elsewhere specified” as report country 12, 11 and 15 times respectively. Those are not relevant values; export to Singapore in 2012 is the only relevant one (132,999 $ from “Asia, not elsewhere specified” to Singapore), but still we think is fairer to underline this.
E.2 Dried/Powdered (071239)
For “mushrooms and truffles, dried, whole/cut/sliced/broken/in powder but not furth. prepd.”, impact of elimination is much less important than for 070959. In 2003, the most affected country is Italy, with a total deleted amount of US dollars equal to approximately 0.7% of its total export (62,260 $ over 8,335,972 $). Then from 2006, China is the most impacted: 2,245,696 $ out of a total value of 200,077,170 $ (1.1%) in 2006, 0.6% in 2009 (2,175,661 $ of 346,299,082 $) and 3,941,980 $ deleted over a total export value of 601,974,565 $ for the year 2012 (0.6%).

168
Appendix F: Betweenness Centrality and Out Degree Table 2015 Due to the problems we highlighted in the discussion, we have not considered the year 2015 in the main argument of chapter 3. The role of Geographical Indications and Countries’ “Made-In” Power in Global Trade of Wild Edible Mushrooms and Truffles. However, in this appendix we report the Betweenness Centrality (BC) and the Out Degree (OD) for the top 22 countries (both for fresh/chilled, 070959, and dried/powdered, 071239) for the year 2015. As shown by the tables, the major countries that result from the analysis of this year are very different from those shown by the analyses of the years 2003, 2006, 2009 and 2012. This is due, in our opinion, to some problems in collecting data (e.g. delays, failed communication, etc.). As far as we know, data are communicated by national agencies and it might take time to have a complete database for this kind of products, which usually present problems for data collection.
F.1 Fresh/Chilled (070959) BC and OD - 2015
Betweenness Centrality and Out Degree (Ordered by OD) – Top 22 countries – 2015
2015
Country Betweenneess
Centrality Out
Degree
ITA 0.041286 62
ESP 0.115457 43
DEU 0.066420 34
USA 0.065913 24
BGR 0.004636 21

169
LTU 0.007098 20
AUS 0.023830 20
HUN 0.004563 17
SRB 0.002318 17
GBR 0.145951 16
SVN 0.007316 14
CAN 0.005070 14
BIH 0.007171 13
MKD 0.006736 13
DNK 0.054904 12
PRT 0.017239 12
HKG 0.009706 12
SWE 0.081631 12
MNE 0.000256 10
LVA 0.007026 9
EST 0.015428 8
CHE 0.020933 8
F.2 Dried/Powdered (071239) BC and OD - 2015
Betweenness Centrality and Out Degree (Ordered by OD) – Top 22 countries – 2015
2015
Country Betweenneess
Centrality Out
Degree
ITA 0.055997 60
DEU 0.071364 52
USA 0.049625 35

170
HKG 0.029610 33
ESP 0.060345 28
GBR 0.153223 22
BGR 0.005847 20
DNK 0.099025 17
SRB 0.023913 17
MNE 0.004648 15
MKD 0.004948 14
BIH 0.002474 14
CAN 0.009670 13
IND 0.004438 13
CZE 0.010045 11
CHL 0.004798 11
JPN 0.001537 11
PRT 0.009895 10
LTU 0.096252 9
CHE 0.003298 8
GRC 0.001649 7
NZL 0.047226 6

171
Appendix G: Graphs: BC / OD Even though in chapter 3. The role of Geographical Indications and Countries’ “Made-In” Power in Global Trade of Wild Edible Mushrooms and Truffles we report BC and OD using tables, in this appendix we want to show several graphs in which a scatter plot between BC and OD are reported. We provide graphs both for fresh/chilled (070959) and dried/powdered (071239) wild mushrooms and truffles for the years 2003, 2006, 2009 and 2012. Category and year are reported in the graph titles.
G.1 Fresh/Chilled (070959) Graphs: BC / OD

172

173

174
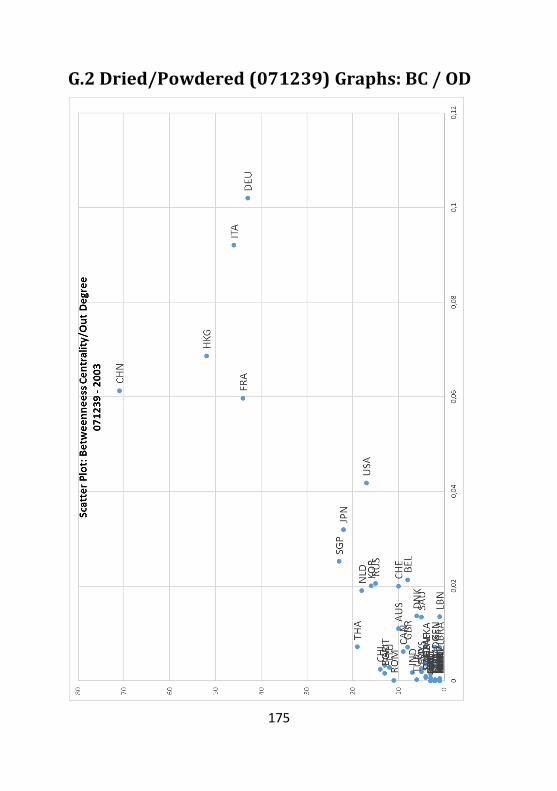
175
G.2 Dried/Powdered (071239) Graphs: BC / OD

176

177

178

179
Appendix H: Graphs BC / OD (log) As for Appendix H: Graphs BC / OD (log), in this appendix we report several graphs of BC and OD values (for both categories: fresh/chilled, 070959, and dried/powdered, 071239) for the years from 2003 to 2012. However, in these graphs, BC and OD are reported in logarithmic scale. This helps in understanding, from a different analysis, the major countries and their role in the worldwide trade.
H.1 Fresh/Chilled (070959) Graphs: BC / OD (log)

180

181

182

183
H.2 Dried/Powdered (071239) Graphs: BC / OD (log)

184

185

186

187
Appendix I: Adjustments of Average Prices For the analyses on prices of chapter 3. The role of Geographical Indications and Countries’ “Made-In” Power in Global Trade of Wild Edible Mushrooms and Truffles, a data cleaning was needed in order to avoid problems due to some anomalies in recording and reporting data. This is both due to the intrinsic problems of the analysed products and also, as far as we know, to the possible differences in recording systems of national agencies from which data was gathered. We report the records deleted, the motivation (when needed) and a few additional pieces information to aid in the comprehension of the impact of the deletions. There are two different sections, one for fresh/chilled (070959) and the other for dried/powdered (071239) wild mushrooms and truffles.
I.1 Fresh/Chilled (070959)
CHINA 2003 -> average without MAX (30): 2.098606883 - (median: 1.57884) CHINA 2009 -> average without MAX (47.25): 6.729045545 - (median: 3.94) CHINA 2012 -> average without MAX (99): 7.052054642 - (median: 3.718) HONG KONG 2009 -> average without MAX (1608): 9.519440428 - (median: 8.205) HONG KONG 2012 -> average without MAX (56,692): 5.394325017 - (median: 3.762) GERMANY 2009 -> average without MAX (100): 9.978085927 - (median: 8) GEMANY 2012 -> we delete the last except for one (6.571): median: 11 Average: 289.9578059 we delete the last except for two (5,226.66666666667): - (median: 10.9) Average:148.9089813 we delete the last except for three: (2,472.98863636364): - (median: 10.7954) Average: 80.5536973

188
we delete the last except for four (835.5): - (median: 10.7) Average: 57.67653661 NETHERLAND 2012 -> average without MAX (318): 8.937628163 - (median: 7.307) FRANCE 2012 -> average without MAX (1,215.9): 117.5217668 - (median: 42.5513) ITALY 2006 -> average without MAX (797) [i.e. only one transaction with Kazakhstan (one unit)]: 26.93926226 – (median: 6.2766) we delete the last except for one (597) [i.e. only two transactions with Nigeria (two units)]: - (median: 6.22) Average: 11.53221529 ITALY 2009 -> there are “anomalous” transactions with some countries [i.e.one or two unit transactions per year]. We delete those considered “anomalous”: we delete the last except for one (3,218.5) [i.e. only two transactions with Indonesia (two units)] – (median: 82.41) Average:327.2916361 we delete the last except for two (2,189) [i.e. only two transactions with China (one unit)]: – (median: 63.80455) Average: 291.4895522 we delete the last except for three [i.e. only two transactions with Macao (one unit)]: – (median: 45.2) Average: 261.4207199 we delete Iceland, because it has only one trade, even though it is not the last except for four. - (median: 40.68793) Average: 243.4891343 ITALY 2012 -> we delete only one/two transaction records, it perceived “anomalous” we delete the last except for one: [i.e. Peru, which has only two very high transactions (two units)]: - (median: 68.67) Average: 336.5013783 we delete the last except for two [i.e. only one transaction with Curacao (one unit)]: - (median: 62.22) Average: 261.8764013 we delete the last except for three [i.e. only two transactions with Macao (one unit)]: - (median: 55.77) Average: 216.6878657

189
USA 2003 -> average without MAX: 12.64508266 - (median: 8.45) USA 2012 -> average without MAX: 19.58131475 - (median: 15.4454) ROMANIA 2012 -> average without MAX: 9.91071519 - (median: 10.33) [i.e. only two transactions with Finland (one unit)].
I.2 Dried/Powdered (071239) Singapore 2009 - > average without MAX (72.7): 10.06508401 - (median: 7.796) France 2012 -> we delete non-significant transactions. Average: 40.34073523 - (median: 34.28479657) Table 20 List of Deleted Non-Significant Transactions for France (2012)
Reporter
Alt Qt.
Net weight (kg)
Trade Value (US$)
Rep. ISO
Partner Partner ISO
US$/Kg
France 1 1 27 FRA Benin BEN 27
France 1 1 265 FRA Curacao CUW 265
France 1 1 324 FRA Saint Pierre and Miquelon
SPM 324
France 1 1 450 FRA Venezuela VEN 450
France 2 2 1 FRA Chile CHL 0.5
France 2 2 185 FRA Haiti HTI 92.5
France 2 2 72 FRA Nigeria NGA 36
France 4 4 327 FRA Bulgaria BGR 81.75
France 4 4 1,741 FRA Gabon GAB 435.25
France 4 4 737 FRA Uganda UGA 184.25
France 5 5 400 FRA Cameroon CMR 80
France 5 5 391 FRA Equatorial Guinea GNQ 78.2
France 6 6 2,205 FRA French Polynesia PYF 367.5
France 7 7 1,114 FRA Wallis and Futuna Isds
WLF 159.14
France 9 9 1,186 FRA Côte d'Ivoire CIV 131.78
France 12 12 1,321 FRA Jordan JOR 110.08

190
The Netherlands 2006 -> average without MAX (99,18421053): 14.8316387 - (median: 11.5229) The Netherlands 2012 -> average without MAX and last except for one (118.5128205 and 115.6666667): 21.54182837 - (median: 17) USA 2003 -> average without MAX and last except for one (104.7173913 and 103.1159) 20.22076747 - (median: 14.6969) USA 2006 -> average without MAX (97.38709677): 14.5353494 - (median: 11.7356) BULGARIA 2003 -> average without MAX (78): 22.72613862 - (median: 17.33) BULGARIA 2012 -> average without MAX (93.77192982) 28.53316948 - (median: 23.997) ROMANIA 2012 - > we delete the peculiar and “anomalous” transaction with the USA [i.e. 1kg quantity and 1$ amount]: - (median: 24.2933) Average: 21.63953233 we delete the peculiar and “anomalous” transaction with GBR [i.e. 4Kgs at 18$]: - (median: 24.5566) Average: 23.5439

191
Appendix J: Countries ISO Code and Digit In the analyses of chapter 3. The role of Geographical Indications and Countries’ “Made-In” Power in Global Trade of Wild Edible Mushrooms and Truffles, we use the countries’ ISO code. This is reported both in figures and in tables throughout the whole chapter. For the sake of clarity, we show in Table 21 the code for each country, as well as its English name, the country abbreviation, the ISO 3 digit and the period of validity.
Table 21 Comtrade Country Code and Name.
Country
Code
Country Name English
Country Abbrevation
ISO3-digit
Alpha
Start Valid Year
End Valid Year
4 Afghanistan Afghanistan AFG 1962 2061
472 Africa CAMEU region, nes
Africa CAMEU region, nes
NULL 1962 2004
8 Albania Albania ALB 1962 2061
12 Algeria Algeria DZA 1962 2061
16 American Samoa American Samoa ASM 1962 2061
20 Andorra Andorra AND 1962 2061
24 Angola Angola AGO 1962 2061
660 Anguilla Anguilla AIA 1981 2061
10 Antarctica Antarctica ANT 1962 2061
28 Antigua and Barbuda
Antigua and Barbuda ATG 1962 2061
899 Areas, nes Areas, nes NULL 1962 2061
32 Argentina Argentina ARG 1962 2061
51 Armenia Armenia ARM 1992 2061
533 Aruba Aruba ARB 1988 2061
36 Australia Australia AUS 1962 2061
40 Austria Austria AUT 1962 2061
31 Azerbaijan Azerbaijan AZE 1992 2061
44 Bahamas Bahamas BHS 1962 2061

192
48 Bahrain Bahrain BHR 1962 2061
50 Bangladesh Bangladesh BGD 1972 2061
52 Barbados Barbados BRB 1962 2061
112 Belarus Belarus BLR 1992 2061
56 Belgium Belgium BEL 1999 2061
84 Belize Belize BLZ 1962 2061
204 Benin Benin BEN 1962 2061
60 Bermuda Bermuda BMU 1962 2061
64 Bhutan Bhutan BTN 1962 2061
68 Bolivia Bolivia BOL 1962 2061
70 Bosnia Herzegovina
Bosnia Herzegovina BIH 1992 2061
72 Botswana Botswana BWA 2000 2061
74 Bouvet Island Bouvet Island BVT 1962 2061
80 Br. Antarctic Terr. Br. Antarctic Terr. NULL 1962 2061
86 Br. Indian Ocean Terr.
Br. Indian Ocean Terr.
IOT 1962 2061
92 Br. Virgin Isds Br. Virgin Isds VGB 1962 2061
76 Brazil Brazil BRA 1962 2061
96 Brunei Darussalam
Brunei Darussalam BRN 1962 2061
100 Bulgaria Bulgaria BGR 1962 2061
837 Bunkers Bunkers NULL 1962 2061
854 Burkina Faso Burkina Faso BFA 1962 2061
108 Burundi Burundi BDI 1962 2061
471 CACM, nes CACM, nes NULL 1962 2004
116 Cambodia Cambodia KHM 1962 2061
120 Cameroon Cameroon CMR 1962 2061
124 Canada Canada CAN 1962 2061
132 Cape Verde Cape Verde CPV 1962 2061
129 Caribbean, nes Caribbean, nes NULL 1962 2004
136 Cayman Isds Cayman Isds CYM 1962 2061
140 Central African Rep.
Central African Rep. CAF 1962 2061
148 Chad Chad TCD 1962 2061
152 Chile Chile CHL 1962 2061

193
156 China China CHN 1962 2061
344 China, Hong Kong SAR
China, Hong Kong SAR
HKG 1962 2061
446 China, Macao SAR China, Macao SAR MAC 1962 2061
162 Christmas Isds Christmas Isds CXR 1962 2061
166 Cocos Isds Cocos Isds CCK 1962 2061
170 Colombia Colombia COL 1962 2061
174 Comoros Comoros COM 1962 2061
178 Congo Congo COG 1962 2061
184 Cook Isds Cook Isds COK 1962 2061
188 Costa Rica Costa Rica CRI 1962 2061
384 Côte d'Ivoire Côte d'Ivoire CIV 1962 2061
191 Croatia Croatia HRV 1992 2061
192 Cuba Cuba CUB 1962 2061
196 Cyprus Cyprus CYP 1962 2061
203 Czech Rep. Czech Rep. CZE 1993 2061
408 Dem. People's Rep. of Korea
Dem. People's Rep. of Korea
PRK 1962 2061
180 Dem. Rep. of the Congo
Dem. Rep. of the Congo
COD 1962 2061
208 Denmark Denmark DNK 1962 2061
262 Djibouti Djibouti DJI 1962 2061
212 Dominica Dominica DMA 1962 2061
214 Dominican Rep. Dominican Rep. DOM 1962 2061
221 Eastern Europe, nes
Eastern Europe, nes NULL 1962 2004
218 Ecuador Ecuador ECU 1962 2061
818 Egypt Egypt EGY 1962 2061
222 El Salvador El Salvador SLV 1962 2061
226 Equatorial Guinea Equatorial Guinea GNQ 1962 2061
232 Eritrea Eritrea ERI 1993 2061
233 Estonia Estonia EST 1992 2061
231 Ethiopia Ethiopia ETH 1993 2061
697 Europe EFTA, nes Europe EFTA, nes NULL 1962 2004
492 Europe EU, nes Europe EU, nes NULL NULL NULL
234 Faeroe Isds Faeroe Isds FRO 1962 2061

194
238 Falkland Isds (Malvinas)
Falkland Isds (Malvinas)
FLK 1962 2061
242 Fiji Fiji FJI 1962 2061
246 Finland Finland FIN 1962 2061
260 Fr. South Antarctic Terr.
Fr. South Antarctic Terr.
ATF 1962 2061
251 France France FRA 1962 2061
838 Free Zones Free Zones NULL 1962 2061
258 French Polynesia French Polynesia PYF 1962 2061
583 FS Micronesia Micronesia FSM 1992 2061
266 Gabon Gabon GAB 1962 2061
270 Gambia Gambia GMB 1962 2061
268 Georgia Georgia GEO 1992 2061
276 Germany Germany DEU 1991 2061
288 Ghana Ghana GHA 1962 2061
292 Gibraltar Gibraltar GIB 1962 2061
300 Greece Greece GRC 1962 2061
304 Greenland Greenland GRL 1962 2061
308 Grenada Grenada GRD 1962 2061
316 Guam Guam GUM 1962 2061
320 Guatemala Guatemala GTM 1962 2061
324 Guinea Guinea GIN 1962 2061
624 Guinea-Bissau Guinea-Bissau GNB 1962 2061
328 Guyana Guyana GUY 1962 2061
332 Haiti Haiti HTI 1962 2061
334 Heard Island and McDonald Islands
Heard Island and McDonald Islands
HMD 1962 2061
336 Holy See (Vatican City State)
Holy See (Vatican City State)
VAT 2000 2061
340 Honduras Honduras HND 1962 2061
348 Hungary Hungary HUN 1962 2061
352 Iceland Iceland ISL 1962 2061
699 India India IND 1975 2061
360 Indonesia Indonesia IDN 1962 2061
364 Iran Iran IRN 1962 2061
368 Iraq Iraq IRQ 1962 2061

195
372 Ireland Ireland IRL 1962 2061
376 Israel Israel ISR 1962 2061
381 Italy Italy ITA 1962 2061
388 Jamaica Jamaica JAM 1962 2061
392 Japan Japan JPN 1962 2061
400 Jordan Jordan JOR 1962 2061
398 Kazakhstan Kazakhstan KAZ 1992 2061
404 Kenya Kenya KEN 1962 2061
296 Kiribati Kiribati KIR 1962 2061
414 Kuwait Kuwait KWT 1962 2061
417 Kyrgyzstan Kyrgyzstan KGZ 1992 2061
473 LAIA, nes LAIA, nes NULL 1962 2061
418 Lao People's Dem. Rep.
Lao People's Dem. Rep.
LAO 1962 2061
428 Latvia Latvia LVA 1992 2061
422 Lebanon Lebanon LBN 1962 2061
426 Lesotho Lesotho LSO 2000 2061
430 Liberia Liberia LBR 1962 2061
434 Libya Libya LBY 1962 2061
440 Lithuania Lithuania LTU 1992 2061
442 Luxembourg Luxembourg LUX 1999 2061
450 Madagascar Madagascar MDG 1962 2061
454 Malawi Malawi MWI 1965 2061
458 Malaysia Malaysia MYS 1964 2061
462 Maldives Maldives MDV 1962 2061
466 Mali Mali MLI 1962 2061
470 Malta Malta MLT 1962 2061
584 Marshall Isds Marshall Isds MHL 1992 2061
478 Mauritania Mauritania MRT 1962 2061
480 Mauritius Mauritius MUS 1962 2061
175 Mayotte Mayotte MYT 1962 2061
484 Mexico Mexico MEX 1962 2061
496 Mongolia Mongolia MNG 1962 2061
499 Montenegro Montenegro MNE 2006 2061
500 Montserrat Montserrat MSR 1962 2061

196
504 Morocco Morocco MAR 1962 2061
508 Mozambique Mozambique MOZ 1962 2061
104 Myanmar Myanmar MMR 1962 2061
580 N. Mariana Isds N. Mariana Isds MNP 1992 2061
516 Namibia Namibia NAM 2000 2061
520 Nauru Nauru NRU 1962 2061
524 Nepal Nepal NPL 1962 2061
530 Neth. Antilles Neth. Antilles ANT 1988 2061
528 Netherlands Netherlands NLD 1962 2061
536 Neutral Zone Neutral Zone NULL 1962 2061
540 New Caledonia New Caledonia NCL 1962 2061
554 New Zealand New Zealand NZL 1962 2061
558 Nicaragua Nicaragua NIC 1962 2061
562 Niger Niger NER 1962 2061
566 Nigeria Nigeria NGA 1962 2061
570 Niue Niue NIU 1962 2061
574 Norfolk Isds Norfolk Isds NFK 1962 2061
637 North America and Central America, nes
North America, the Caribbean and Central America, nes
NULL 1962 2061
290 Northern Africa, nes
Northern Africa, nes NULL 1962 2004
579 Norway Norway NOR 1962 2061
275 Occ. Palestinian Terr.
Occ. Palestinian Terr. PSE 2000 2061
527 Oceania, nes Oceania, nes NULL 1962 2061
512 Oman Oman OMN 1962 2061
577 Other Africa, nes Other Africa, nes NULL 1962 2061
490 Other Asia, nes Other Asia, nes NULL 1962 2061
568 Other Europe, nes Other Europe, nes NULL 1962 2061
586 Pakistan Pakistan PAK 1972 2061
585 Palau Palau PLW 1992 2061
591 Panama Panama PAN 1978 2061
598 Papua New Guinea
Papua New Guinea PNG 1962 2061
600 Paraguay Paraguay PRY 1962 2061
604 Peru Peru PER 1962 2061

197
608 Philippines Philippines PHL 1962 2061
612 Pitcairn Pitcairn PCN 1962 2061
616 Poland Poland POL 1962 2061
620 Portugal Portugal PRT 1962 2061
634 Qatar Qatar QAT 1962 2061
410 Rep. of Korea Rep. of Korea KOR 1962 2061
498 Rep. of Moldova Rep. of Moldova MDA 1992 2061
636 Rest of America, nes
Rest of America, nes NULL 1962 2004
642 Romania Romania ROU 1962 2061
643 Russian Federation
Russian Federation RUS 1992 2061
646 Rwanda Rwanda RWA 1962 2061
654 Saint Helena Saint Helena SHN 1962 2061
659 Saint Kitts and Nevis
Saint Kitts and Nevis KNA 1981 2061
662 Saint Lucia Saint Lucia LCA 1962 2061
666 Saint Pierre and Miquelon
Saint Pierre and Miquelon
SPM 1962 2061
670 Saint Vincent and the Grenadines
Saint Vincent and the Grenadines
VCT 1962 2061
882 Samoa Samoa WSM 1962 2061
674 San Marino San Marino SMR 2000 2061
678 Sao Tome and Principe
Sao Tome and Principe
STP 1962 2061
682 Saudi Arabia Saudi Arabia SAU 1962 2061
686 Senegal Senegal SEN 1962 2061
688 Serbia Serbia SRB 2006 2061
891 Serbia and Montenegro
Serbia and Montenegro
SCG 1992 2005
690 Seychelles Seychelles SYC 1962 2061
694 Sierra Leone Sierra Leone SLE 1962 2061
702 Singapore Singapore SGP 1962 2061
703 Slovakia Slovakia SVK 1993 2061
705 Slovenia Slovenia SVN 1992 2061
90 Solomon Isds Solomon Isds SLB 1962 2061
706 Somalia Somalia SOM 1962 2061
710 South Africa South Africa ZAF 2000 2061

198
239 South Georgia and the South Sandwich Islands
South Georgia and the South Sandwich Islands
SGS 1962 2061
724 Spain Spain ESP 1962 2061
839 Special Categories Special Categories NULL 1962 2061
144 Sri Lanka Sri Lanka LKA 1962 2061
736 Sudan Sudan SDN 1962 2061
740 Suriname Suriname SUR 1962 2061
748 Swaziland Swaziland SWZ 2000 2061
752 Sweden Sweden SWE 1962 2061
757 Switzerland Switzerland CHE 1962 2061
760 Syria Syria SYR 1962 2061
762 Tajikistan Tajikistan TJK 1992 2061
807 TFYR of Macedonia
TFYR of Macedonia MKD 1993 2061
764 Thailand Thailand THA 1962 2061
626 Timor-Leste Timor-Leste TMP 1962 2061
768 Togo Togo TGO 1962 2061
772 Tokelau Tokelau TKL 1962 2061
776 Tonga Tonga TON 1962 2061
780 Trinidad and Tobago
Trinidad and Tobago TTO 1962 2061
788 Tunisia Tunisia TUN 1962 2061
792 Turkey Turkey TUR 1962 2061
795 Turkmenistan Turkmenistan TKM 1992 2061
796 Turks and Caicos Isds
Turks and Caicos Isds TCA 1962 2061
798 Tuvalu Tuvalu TUV 1962 2061
800 Uganda Uganda UGA 1962 2061
804 Ukraine Ukraine UKR 1992 2061
784 United Arab Emirates
United Arab Emirates ARE 1962 2061
826 United Kingdom United Kingdom GBR 1962 2061
834 United Rep. of Tanzania
United Rep. of Tanzania
TZA 1965 2061
581 United States Minor Outlying Islands
United States Minor Outlying Islands
UMI 1962 2061

199
858 Uruguay Uruguay URY 1962 2061
842 USA USA USA 1981 2061
860 Uzbekistan Uzbekistan UZB 1992 2061
548 Vanuatu Vanuatu VUT 1962 2061
862 Venezuela Venezuela VEN 1962 2061
704 Viet Nam Viet Nam VNM 1975 2061
876 Wallis and Futuna Isds
Wallis and Futuna Isds
WLF 1962 2061
879 Western Asia, nes Western Asia, nes NULL 1962 2004
732 Western Sahara Western Sahara ESH 1962 2061
0 World World WLD 1962 2061
887 Yemen Yemen YEM 1991 2061
894 Zambia Zambia ZMB 1965 2061
716 Zimbabwe Zimbabwe ZWE 1965 2061
Notes: Source:
https://unstats.un.org/unsd/tradekb/Knowledgebase/Comtrade-
Country-Code-and-Name

200
References
AAI - The Agribusiness Accountability Initiative. (n.d.). Power Buyers, Power Sellers: How Supermarkets Impact Farmers, Workers and Consumers – and How We Can Build a Fairer Food System. Issue Brief #3.
Abadie, A., & Imbens, G. W. (2006). Large sample properties of matching estimators for average treatment effects. Econometrica, 74(1), 235-267.
Abadie, A., & Imbens, G. W. (2008). On the failure of the bootstrap for matching estimators. Econometrica, 76(6), 1537-1557.
Abril, C., & Sanchez, J. (2016). Will they return? Getting Private Label consumers to come back: Price, promotion, and new product effects. Journal of Retailing and Consumer Services, 31, 109-116.
ACNielsen (2006). What's Hot Around the Globe: Insights on Growth in Food & Beverages. AC Nielsen.
Afoakwa, E. O. (2016). Chocolate science and technology. John Wiley & Sons.
AGCM (Autorità Garante della Concorrenza e del Mercato) (2013): Indagine conoscitiva sul settore della GDO. Autorità Garante della Concorrenza e del Mercato, Rome, 2013.
Ágreda, T., Cisneros, Ó., Águeda, B., & Fernández-Toirán, L. M. (2014). Age class influence on the yield of edible fungi in a managed Mediterranean forest. Mycorrhiza, 24(2), 143-152.
Ailawadi, K. L., & Harlam, B. A. (2002). The effect of store brand share on retail margins: an empirical analysis. Marketing Science Institute Working Paper, (02-109).
Ailawadi, K. L., & Harlam, B. (2004). An empirical analysis of the determinants of retail margins: the role of store-brand share. Journal of Marketing, 68(1), 147-165.
Ailawadi, K. L., Pauwels, K., & Steenkamp, J. B. E. (2008). Private-label use and store loyalty. Journal of Marketing, 72(6), 19-30.
Ainsworth, G. C. (1976). Introduction to the History of Mycology. Cambridge University Press.
Aribarg, A., Arora, N., Henderson, T., & Kim, Y. (2014). Private label imitation of a national brand: Implications for consumer choice and law. Journal of Marketing Research, 51(6), 657-675.

201
Aldous, J. M., & Wilson, R. J. (2003). Graphs and applications: an introductory approach (Vol. 1). Springer Science & Business Media.
Andreyeva, T., Long, M. W., & Brownell, K. D. (2010). The impact of food prices on consumption: a systematic review of research on the price elasticity of demand for food. American journal of public health, 100(2), 216-222.
Arora, D. (2001). Mushrooms and rural economies. Fungal conservation: issues and solutions. Cambridge, United Kingdom, 105-110.
Arora, D. (2008). California Porcini: Three New Taxa, Observations on Their Harvest, and the Tragedy of No Commons1. Economic Botany, 62(3), 356-375.
Arora, D., & Dunham, S. M. (2008). A new, commercially valuable chanterelle species, Cantharellus californicus sp. nov., associated with live oak in California, USA. Economic Botany, 62(3), 376.
Baker, M. J. (2003). The Marketing Book. Ed (pp. 287-313). Linacre House, Jordan Hill.
Baltas, G. (1997). Determinants of store brand choice: a behavioral analysis. Journal of product & brand management, 6(5), 315-324.
Bam, K. (1992). Research methods for business and management.
Barney, J. (1991). Firm resources and sustained competitive advantage. Journal of management, 17(1), 99-120.
Barthelemy, M. (2004). Betweenness centrality in large complex networks. The European Physical Journal B-Condensed Matter and Complex Systems, 38(2), 163-168.
Becker, T., & Staus, A. (2009). European food quality policy: The importance of geographical indications, organic certification and food quality assurance schemes in European countries. The Estey Centre Journal of International Law and Trade Policy, 10(1), 111-130.
Bell, R., Davies, R., & Howard, E. (1997). The changing structure of food retailing in Europe: the implications for strategy. Long Range Planning, 30(6), 853-861.
Belletti, G., Marescotti, A., & Touzard, J. M. (2015). Geographical indications, public goods, and sustainable development: The roles of actors’ strategies and public policies. World Development.
Benfratello, L. (2002). Beyond profitability: effects of acquisitions on technical efficiency in the Italian pasta industry. Managerial and decision Economics, 23(7), 399-415.

202
Bergès-Sennou, F., Bontems, P., & Réquillart, V. (2004). Economics of private labels: A survey of literature. Journal of Agricultural & Food Industrial Organization, 2(1), 3.
Berges-Sennou, F. (2006). Store loyalty, bargaining power and the private label production issue. European Review of Agricultural Economics, 33(3), 315-335.
Biggs, N. (1993). Algebraic graph theory. Cambridge university press.
Boa, E. R. (2004). Wild edible fungi: a global overview of their use and importance to people (No. 17). Food & Agriculture Org..
Bobinski, G., Cox, D., & Cox, A. (1996). Retail “sale” advertising, perceived retailer credibility, and price rationale. Journal of Retailing, 72(3), 291-306.
Boyer, R. R., & McKinney, J. M. (2013). Food storage guidelines for consumers.
Bondy, J. A., & Murty, U. S. R. (1976). Graph theory with applications (Vol. 290). London: Macmillan.
Bontems, P., Monier-Dilhan, S., & Réquillart, V. (1999). Strategic effects of private labels. European Review of Agricultural Economics, 26(2), 147-165.
Bontemps, C., Orozco, V., & Réquillart, V. (2008). Private labels, national brands and food prices. Review of Industrial Organization, 33(1), 1-22.
Borraz, F., Dubra, J., Ferrés, D., & Zipitría, L. (2014). Supermarket entry and the survival of small stores. Review of Industrial Organization, 44(1), 73-93.
Brazauskaitė, I., Auruškevičienė, V., & Gerbutavičienė, R. (2015). Private label management in retail: the concept, consumer profiling and competition with national brands. Systematic review of main findings. Management of Organizations: Systematic Research, (71), 53-65.
Bridson, K., Evans, J., Mavondo, F., & Minkiewicz, J. (2013). Retail brand orientation, positional advantage and organisational performance. The International Review of Retail, Distribution and Consumer Research, 23(3), 245-264.
Buccirossi, P., Marette, S., & Schiavina, A. (2002). Competition policy and the agribusiness sector in the European Union. European Review of Agricultural Economics, 29(3), 373-397.
Busch, L., & Bain, C. (2004). New! Improved? The transformation of the global agrifood system. Rural sociology, 69(3), 321-346.
Cacchiarelli, L., & Sorrentino, A. (2016). Price rigidity in food retail sector: the retailers' strategy for pasta. Rivista di Economia Agraria, 71(1), 50-55.
Cai, M., Pettenella, D., & Vidale, E. (2011). Income generation from mushrooms in marginal rural areas. Forest Policy and Economics, 13(3), 221-226.

203
Campbell, S., James, E. L., Stacey, F. G., Bowman, J., Chapman, K., & Kelly, B. (2012). A mixed-method examination of food marketing directed towards children in Australian supermarkets. Health promotion international, das060.
Caprotti, B. (2014). Nascita e sviluppo della Distribuzione Alimentare Moderna. I percorsi della Storia: dai prodotti agricoli primari ai consumatori. I Georgofili. Quaderni 2014, I.
Ceccacci, F. (2013). La private label nei percorsi di modernizzazione del trade. G Giappichelli Editore.
Cersosimo, D. (2011). I consumi alimentari: evoluzione strutturale, nuove tendenze, risposte alla crisi. Edizioni Tellus, Roma.
Chambolle, C., & Villas-Boas, S. B. (2015). Buyer power through the differentiation of suppliers. International Journal of Industrial Organization, 43, 56-65.
Chang, S. T. (1999). World production of cultivated edible and medicinal mushrooms in 1997 with emphasis on Lentinus edodes (Berk.) Sing, in China. International Journal of Medicinal Mushrooms, 1(4).
Chen, Z. (2007). Buyer power: economic theory and antitrust policy. In Research in Law and Economics (pp. 17-40). Emerald Group Publishing Limited.
Chen, Y., & Li, X. (2013). Group buying commitment and sellers’ competitive advantages. Journal of Economics & Management Strategy, 22(1), 164-183.
Choi, S., Friske, W., Lee, S., & Wilcox, J. (2014). The effects of price promotion depth on new and mature products. Journal of Brand Management, 21(3), 202-215.
Choi, S. C. (2017). Defensive strategy against a private label: Building brand premium for retailer cooperation. Journal of Retailing and Consumer Services, 34, 335-339.
Christensen, M., Bhattarai, S., Devkota, S., & Larsen, H. O. (2008). Collection and use of wild edible fungi in Nepal. Economic botany, 62(1), 12-23.
Clarke, R. (Ed.). (2002). Buyer power and competition in European food retailing (Vol. 10). Edward Elgar Publishing.
Colla, E. (2003). International expansion and strategies of discount grocery retailers: the winning models. International Journal of Retail & Distribution Management, 31(1), 55-66.
Colla, E., & Dupuis, M. (2002). Research and managerial issues on global retail competition: Carrefour/Wal-Mart. International Journal of retail & distribution management, 30(2), 103-111.

204
Collins-Dodd, C., & Lindley, T. (2003). Store brands and retail differentiation: the influence of store image and store brand attitude on store own brand perceptions. Journal of Retailing and Consumer Services, 10(6), 345-352.
Corpo Forestale dello Stato (2011). La Sicurezza Agroalimentare e Agro Ambientale. Rapporto 2011. Ministero delle Politiche Agricole Alimentari e Forestali. Retrieved from: https://www.google.it/url?sa=t&rct=j&q=&esrc=s&source=web&cd=2&cad=rja&uact=8&ved=0ahUKEwjfvunFmrjSAhXGMhoKHRFdAqMQFggjMAE&url=http%3A%2F%2Fwww.corpoforestale.it%2Fflex%2Fcm%2Fpages%2FServeAttachment.php%2FL%2FIT%2FD%2F6%25252F6%25252F2%25252FD.9aa523dffe4afc0f0a1b%2FP%2FBLOB%253AID%253D40%2FE%2Fpdf&usg=AFQjCNEvmod4t3Y1uHk4OwzqJ7N131cYew&sig2=eFS3rx3PAK6crfwFh3TtdA
Corpo Forestale dello Stato (2012). La Sicurezza Agroalimentare e Agro Ambientale. Rapporto 2012. Ministero delle Politiche Agricole Alimentari e Forestali.
Corpo Forestale dello Stato (2014). La Sicurezza Agroalimentare e Agro Ambientale. Rapporto 2014. Ministero delle Politiche Agricole Alimentari e Forestali. Retrieved from: http://www.corpoforestale.it/flex/cm/pages/ServeAttachment.php/L/IT/D/2%252F7%252F6%252FD.bbd84bfa6939bb5de82c/P/BLOB%3AID%3D40/E/pdf
Corpo Forestale dello Stato (2015). La Sicurezza Agroalimentare e Agro Ambientale. Rapporto 2015. Ministero delle Politiche Agricole Alimentari e Forestali. Retrieved from: https://www.google.it/url?sa=t&rct=j&q=&esrc=s&source=web&cd=2&cad=rja&uact=8&ved=0ahUKEwi6rrvyj7jSAhXI6xQKHZC3Ap8QFggiMAE&url=http%3A%2F%2Fwww.corpoforestale.it%2Fflex%2Fcm%2Fpages%2FServeAttachment.php%2FL%2FIT%2FD%2Fb%25252F8%25252Fe%25252FD.ec1254dadfa89337966b%2FP%2FBLOB%253AID%253D40%2FE%2Fpdf&usg=AFQjCNEOMvfBmK8zZQHUQRLJXyAxfA3u1Q&sig2=9RblIf4vuqjpyBSJcZtEUw
Correa, C. M., & Yusuf, A. (Eds.). (2008). Intellectual property and international trade: the TRIPs agreement. Kluwer Law International.
Cotterill, R. W. (2006). Antitrust analysis of supermarkets: global concerns playing out in local markets. Australian Journal of Agricultural and Resource Economics, 50(1), 17-32.
Cournot, A. (1838). Recherches sur les principes mathematiques de la theorie des richesses par Augustin Cournot. L. Hachette.
Creswell, J. W., & Clark, V. L. P. (2007). Designing and conducting mixed methods research.
205
Cuneo, A., Lopez, P., & Jesus Yagüe, M. (2012). Measuring private labels brand equity: a consumer perspective. European Journal of Marketing, 46(7/8), 952-964.
Cuneo, A., Milberg, S. J., Benavente, J. M., & Palacios-Fenech, J. (2015). The growth of private label brands: a worldwide phenomenon?. Journal of International Marketing, 23(1), 72-90.
Davis, P., & Reilly, A. (2009, August). The UK Competition Commission’s groceries market investigation: market power, market outcomes and remedies. In 27th International Association of Agricultural Economists Conference, Beijing, China August (pp. 16-22).
Davis, P., & Reilly, A. (2010). Market power, market outcomes, and remedies in the UK groceries market. Agricultural Economics, 41(s1), 93-108.
Davis, D. F., Golicic, S. L., & Boerstler, C. N. (2011). Benefits and challenges of conducting multiple methods research in marketing. Journal of the Academy of Marketing Science, 39(3), 467-479.
Dawar, N., & Stornelli, J. (2013). Rebuilding the relationship between manufacturers and retailers. MIT Sloan Management Review, 54(2), 83.
Deacon, J. W. (2013). Fungal biology. John Wiley & Sons. Pp 380
De Román, M., & Boa, E. (2006). The marketing of Lactarius deliciosus in northern Spain. Economic Botany, 60(3), 284-290.
Deloitte (2014). Global Powers of Retailing.
Diaz Balteiro, L., Alfranca Burriel, Ò., & Voces González, R. (2013). Mercado de Lactarius deliciosus. Modelización de la oferta en España. Información técnica económica agraria, 109(3), 370-389.
Dobson, P. W. (2003, February). Buyer power in food retailing: the European experience. In OECD Conference on Changing Dimensions of the Food Economy: Exploring the Policy Issues (pp. 6-7).
Dobson, P. W., & Inderst, R. (2008). The waterbed effect: Where buying and selling power come together. Wis. L. Rev., 331.
Dobson, P. W., & Waterson, M. (1997). Countervailing power and consumer prices. The Economic Journal, 107(441), 418-430.
Dobson, P. W., & Waterson, M. (1999). Retailer power: recent developments and policy implications. Economic Policy, 14(28), 134-164.
Dobson, P. W., Clarke, R., Davies, S., & Waterson, M. (2001). Buyer power and its impact on competition in the food retail distribution sector of the European Union. Journal of Industry, Competition and Trade, 1(3), 247-281.

206
Dobson, P., & Chakraborty, R. (2015). Assessing Brand and Private Label Competition. European Competition Law Review, 36(2), 76-81.
Doyle, C., & Inderst, R. (2007). Some economics on the treatment of buyer power in antitrust. European Competition Law Review, 28(3), 210.
Doyle, C., & Murgatroyd, R. (2011). The role of private labels in antitrust. Journal of Competition Law and Economics, 7(3), 631-650.
Eales, T. (2014). Private Label in Western Economies. Closing the price gap, losing share. Special Report, IRI, December 2014.
Eales, T. (2014a). Private Label in western economies: closing the price gap, losing share.
Eales, T. (2014b). La Marca del distributore nei paesi occidentali: si riduce il fattore convenienza e la quota non cresce più.
Eales, T. (2015). Price and Promotion in Western Europe: Encouraging signs of recovery.
Ellickson, P. B. (2011). The evolution of the supermarket industry: From A&P to Wal-Mart.
Elman, P. (1966). The Robinson-Patman Act and Antitrust Policy: A Time for Reappraisal. Wash. L. Rev., 42, 1.
Erzene, S. (2012). Buyer Power in the Context of Private Label in the EU: Accompanied with Special Reference to UK’s Approach. Global Antitrust Rev, 2012, 106-137.
European Commission (2016). Procurement and Grants for European Union external actions - A Practical Guide Applicable as of 15 January 2016. Retrieved from: (http://ec.europa.eu/europeaid/prag/?header_description=DEVCO+Prag+to+financial+and+contractual+procedures+applicable+to+external+actions+financed+from+the+general+budget+of+the+EU+and+from+the+11th+EDF&header_keywords=ePrag%2C+europa)
Evans, G. E. (2010). The comparative advantages of geographical indications and community trade marks for the marketing of agricultural products. Yearbook of European Law, 29(1), 224.
Farm Foundation (2006). The future of animal agriculture in North America.
Federalimentare-ISMEA Centro Studi Confindustria. (September 2005). 3° Rapporto Federalimentare-ISMEA 2005. Scenari 2015 della filiera agroalimentare. Retreived from http://www.federalimentare.it

207
Feenstra, R. C., & Hanson, G. H. (2004). Intermediaries in Entrepot Trade: Hong Kong Re‐Exports of Chinese Goods. Journal of Economics & Management Strategy, 13(1), 3-35.
Feng, B., Xu, J., Wu, G., Zeng, N. K., Li, Y. C., Tolgor, B., ... & Yang, Z. L. (2012). DNA sequence analyses reveal abundant diversity, endemism and evidence for Asian origin of the porcini mushrooms. PLoS One, 7(5), e37567.
Fernandes, Â., Barreira, J. C., Antonio, A. L., Oliveira, M. B. P., Martins, A., & Ferreira, I. C. (2014). Feasibility of electron-beam irradiation to preserve wild dried mushrooms: effects on chemical composition and antioxidant activity. Innovative Food Science & Emerging Technologies, 22, 158-166.
Fotopoulos, C., & Krystallis, A. (2003). Quality labels as a marketing advantage: The case of the “PDO Zagora” apples in the Greek market. European Journal of Marketing, 37(10), 1350-1374.
Fumagalli Ceri, F. Da dove passa il rilancio del mercato della pasta in Italia? Comunicazione, innovazione e riorganizzazione della filiera. Retrive from: http://blog.iriworldwide.eu/index.php/2014/10/01/da-dove-passa-il-rilancio-del-mercato-della-pasta-in-italia-comunicazione-innovazione-e-riorganizzazione-della-filiera/. Iri.
Gallagher, M. F. (1936). Robinson-Patman Act. J. Marshall LQ, 2, 464.
Garretson, J. A., Fisher, D., & Burton, S. (2002). Antecedents of private label attitude and national brand promotion attitude: similarities and differences. Journal of Retailing, 78(2), 91-99.
Garrido-Morgado, A., González-Benito, Ó., Campo, K., & Martos-Partal, M. (2015). Improving Sales of Private Labels in Store. In Advances in National Brand and Private Label Marketing (pp. 3-7). Springer International Publishing.
GDO Report 2015-2016. Evidenze e future tendenze nella Grande Distribuzione Organizzata RetaiLabIt Dicembre 2015. DGM Consulting.
Geyskens, I., Gielens, K., & Gijsbrechts, E. (2010). Proliferating private-label portfolios: How introducing economy and premium private labels influences brand choice. Journal of Marketing Research, 47(5), 791-807.
Grandi, S., & Fornari, E. (2011). The effectiveness of price promotion on store brands (empirical evidences from an Italian retailer). In International Marketing Trend Conference (pp. 1-21). International Marketing Trends Conference.
Greenley, G. E., & Shipley, D. (1992). A comparative study of operational marketing practices among British department stores and supermarkets. European Journal of Marketing, 26(5), 22-35.

208
Grimes, W. S. (2005). Buyer power and retail gatekeeper power: protecting competition and the atomistic seller. Antitrust Law Journal, 72(2), 563-588.
Gross, J. L., & Yellen, J. (2005). Graph theory and its applications. CRC press.
Hamilton, L. C. (2012). Statistics with Stata: version 12. Cengage Learning.
Harrison, R. L., & Reilly, T. M. (2011). Mixed methods designs in marketing research. Qualitative Market Research: An International Journal, 14(1), 7-26.
Hemalatha, M., & Sridevi, P. (2013). The Antecedents of Clearance Sales Store Satisfaction. Journal of Contemporary Research in Management, 5(4).
Hooley, G. J., Shipley, D., & Krieger, N. (1988). A method for modelling consumer perceptions of country of origin. International marketing review, 5(3), 67-7
Hyman, M. R., Kopf, D. A., & Lee, D. (2010). Review of literature–Future research suggestions: Private label brands: Benefits, success factors and future research. Journal of Brand Management, 17(5), 368-389.
Hurt, S. (2002). The Carrefour Group—the first 25 years. Retailing: critical concepts. 3, 1. Retail practices and operations, 1, 78.
Il Settore Alimentare in Italia tra Crisi e Processi Aggregativi - Report 2013 Arkios Italy
Inderst, R. (2013). Implications of Buyer Power and Private Labels on ‘Vertical Competition’and Innovation.
Inderst, R., & Mazzarotto, N. (2008). Buyer power in distribution. In ABA Antitrust Section Handbook, Issues in Competition Law and Policy (Vol. 3, pp. 1953-1978). ABA.
Inderst, R., & Shaffer G. (2008). Buyer Power in Merger Control. In Wayne D. Collins (ed), Antitrust Section Handbook, Issues in Competition Law and Policy (ABA).
Inderst, R., & Valletti, T. M. (2011). Buyer power and the ‘waterbed effect’. The Journal of Industrial Economics, 59(1), 1-20.
Inderst, R., & Wey, C. (2007). Buyer power and supplier incentives. European Economic Review, 51(3), 647-667.
Inderst, R., Jakubovic, Z., & Jovanovic, D. (2015). Buyer Power and Functional Competition for Innovation.
International Convention on the Harmonized Commodity Description and Coding System (with annex), as amended by the Protocol of Amendment of 24 June 1986. Concluded at Brussels on 14 June 1983. 168 UNTS 1988.

209
Retrieved from: https://treaties.un.org/doc/Publication/UNTS/Volume%201503/volume-1503-I-25910-English.pdf
IRI Topline Report for H2/Q4 2015.
IRI. Lo scenario dei consumi e del retail in Italia. Roberto Galasso Retail Solutions Director. IRI. July 2015.
IRI. L'efficacia delle promozioni nella GDO Un'analisi di profondità nei comparti di Alimentari e Bevande. IRI. September 2016.
IRI. Nel 2016 il Largo Consumo frena. Debole ripresa nel 2017. Le previsioni IRI sulla chiusura del 2016 e sull'andamento del 2017. IRI. October 2016.
ISPRA (Istituto Superiore per la Protezione e la Ricerca Ambientale) (2009). Annuario dei dati ambientali, ISPRA, Roma.
ISPRA (Istituto Superiore per la Protezione e la Ricerca Ambientale) (2016). Annuario dei dati ambientali, ISPRA, Roma. Retrieved from: http://annuario.isprambiente.it/ada/scheda/1686/7
Jedidi, K., Mela, C. F., & Gupta, S. (1999). Managing advertising and promotion for long-run profitability. Marketing science, 18(1), 1-22.
Jones, E. G., & Lim, G. (1990). Edible mushrooms in Singapore and other southeast Asian countries. Mycologist, 4(3), 119-124.
Kaynak, E., & Cavusgil, S. T. (1982). The evolution of food retailing systems: contrasting the experience of developed and developing countries. Journal of the Academy of Marketing Science, 10(3), 249-268.
Kim, N., & Parker, P. M. (1999). Collusive conduct in private label markets. International Journal of Research in Marketing, 16(2), 143-155.
King, S. P. (2013). Buyer Groups, Antitrust and Outsiders. Economic Record, 89(284), 1-18.
Knox, S. D., & White, H. F. (1991). Retail buyers and their fresh produce suppliers: a power or dependency scenario in the UK?. European Journal of Marketing, 25(1), 40-52.
Kozlenkova, I. V., Samaha, S. A., & Palmatier, R. W. (2014). Resource-based theory in marketing. Journal of the Academy of Marketing Science, 42(1), 1-21.
Kumar, N., & Steenkamp, J. B. E. (2007). Private label strategy: how to meet the store brand challenge. Harvard Business Press.
Lal, R. (1990). Price Promotions: Limiting Competitive Encroachment. Marketing Science, 9(3), 247-262.

210
Lamey, L., Deleersnyder, B., Steenkamp, J. B. E., & Dekimpe, M. G. (2012). The effect of business-cycle fluctuations on private-label share: what has marketing conduct got to do with it?. Journal of Marketing, 76(1), 1-19.
Lan, H., Lloyd, T., & Morgan, C. W. (2015). Supermarket Promotions and Food Prices: A Note. Journal of Agricultural Economics, 66(2), 555-562.
Lauterborn, R. (1990). New Marketing Litany: C-Words take Over, Advertising age.
Lee, C., Betram, J., Smith, B. & Filkin A. (2016). Private Label Growth Trends Drive Increased M&A Interest. William Blair December 2016. Retrieved from: https://www.williamblair.com/News-Items/2016/December/08/Private-Label-Growth-Trends-Drive-Increased-MA-Interest.aspx
Levy, M., Kopalle, P., Grewal, D., & Hess, J. (2007). Emerging trends in retail pricing practice: Implications for research. International Retail and Marketing Review, 3(1), 1-14.
Lichtenstein, D. R., Ridgway, N. M., & Netemeyer, R. G. (1993). Price perceptions and consumer shopping behavior: a field study. Journal of marketing research, 234-245.
Liu, T. C., & Wang, C. Y. (2008). Factors affecting attitudes toward private labels and promoted brands. Journal of Marketing Management, 24(3-4), 283-298.
Lockett, A., Thompson, S., & Morgenstern, U. (2009). The development of the resource‐based view of the firm: A critical appraisal. International Journal of Management Reviews, 11(1), 9-28.
Loureiro, M. L., & Umberger, W. J. (2003). Estimating consumer willingness to pay for country-of-origin labeling. Journal of Agricultural and Resource Economics, 287-301.
Loureiro, M. L., & McCluskey, J. J. (2000). Consumer preferences and willingness to pay for food labeling: A discussion of empirical studies. Journal of Food Distribution Research, 34(3), 95-102.
Lybeck, A., Holmlund-Rytkönen, M., & Sääksjärvi, M. (2006). Store brands vs. manufacturer brands: consumer perceptions and buying of chocolate bars in Finland. Int. Rev. of Retail, Distribution and Consumer Research, 16(4), 471-492.
Magnatti, P. (2007). Characteristics, Evolution and Perspectives of the Pasta Industry. L'industria, 28(1), 23-38.
MARK UP 102 - L'olio d'oliva punta sulla differenziazione - PRODOTTI E MERCATI
Marone, E. (Ed.). (2011). La filiera del tartufo e la sua valorizzazione in Toscana e in Abruzzo (Vol. 79). Firenze University Press.

211
Matamalas, R. L., & Santandreu Ramos, M. (2009). Marketing Strategy of The Supermarkets.
Mauri, C. (2003). Card loyalty. A new emerging issue in grocery retailing. Journal of Retailing and Consumer Services, 10(1), 13-25.
Mauri, C., Maira, E., & Turci, L. (2015). An empirical study of consumer behavior related to private labels and national brand promotions. The International Review of Retail, Distribution and Consumer Research, 25(4), 333-361.
McCarthy, E. Jerome (1971). Basic marketing: A managerial approach (4th ed.)
Mela, C. F., Gupta, S., & Lehmann, D. R. (1997). The long-term impact of promotion and advertising on consumer brand choice. Journal of Marketing research, 248-261.
Mela, C. F., Jedidi, K., & Bowman, D. (1998). The long-term impact of promotions on consumer stockpiling behavior. Journal of Marketing research, 250-262.
Menapace, L., & Moschini, G. (2012). Quality certification by geographical indications, trademarks and firm reputation. European Review of Agricultural Economics, 39(4), 539-566.
Messinger, P. R., & Narasimhan, C. (1997). A model of retail formats based on consumers' economizing on shopping time. Marketing science, 16(1), 1-23.
Meza, S., & Sudhir, K. (2010). Do private labels increase retailer bargaining power?. Quantitative Marketing and Economics, 8(3), 333-363.
Michon, R., Chebat, J. C., & Turley, L. W. (2005). Mall atmospherics: the interaction effects of the mall environment on shopping behavior. Journal of Business Research, 58(5), 576-583.
Miquel-Romero, M. J., Caplliure-Giner, E. M., & Adame-Sánchez, C. (2014). Relationship marketing management: Its importance in private label extension. Journal of Business Research, 67(5), 667-672.
Mills, D. E. (1995). Why retailers sell private labels. Journal of Economics & Management Strategy, 4(3), 509-528.
Mills, D. E. (1999). Private labels and manufacturer counterstrategies. European Review of Agricultural Economics, 26(2), 125-145.
Mills, G. (2003). Buyer Power of Supermarkets. Agenda: A Journal of Policy Analysis and Reform, 145-162.
Ministero dello Sviluppo Economico (2012). Io non voglio il falso - la contraffazione alimentare. Retrieved from: http://adiconsum.it/files/pdf/disp_alimentari.pdf
Molina-Azorin, J. F. (2012). Mixed methods research in strategic management: Impact and applications. Organizational Research Methods, 15(1), 33-56.

212
Molinillo, S., Ekinci, Y., Whyatt, G., & Occhiocupo, N. (2014). A trend analysis of private label research between 2000 and 2012. In National Brands and Private Labels in Retailing (pp. 171-178). Springer International Publishing.
Molinillo, S., Ekinci, Y., Whyatt, G., Occhiocupo, N., & Stone, M. (2016). Private Label Management: Insights and Research Directions. In Handbook of Research on Strategic Retailing of Private Label Products in a Recovering Economy (pp. 1-27). IGI Global.
Monopolies and Mergers Commission (1981), Discounts to Retailers, HMSO: London.
Morton, F. S., & Zettelmeyer, F. (2004). The strategic positioning of store brands in retailer–manufacturer negotiations. Review of Industrial Organization, 24(2), 161-194.
Moschini, G., Menapace, L., & Pick, D. (2008). Geographical indications and the competitive provision of quality in agricultural markets. American Journal of Agricultural Economics, 90(3), 794-812.
Mullick-Kanwar, M. (2013). The evolution of private label branding.
Nederkoorn, C. (2014). Effects of sales promotions, weight status, and impulsivity on purchases in a supermarket. Obesity, 22(5), E2-E5.
Nenycz-Thiel, M., & Romaniuk, J. (2009). Perceptual categorization of private labels and national brands. Journal of Product & Brand Management, 18(4), 251-261.
Nicholson, C., & Young, B. (2012). The relationship between supermarkets and suppliers: What are the implications for consumers. Summary of the main report, Consumers International and Europe Economics.
Nielsen (2005). The power of private label 2005: a review of growth trends around the world. Report, AC Nielsen. Retrieved from: http://users.ugent.be/~xgellync/Rob/PrivateLabel_RMS.pdf
Nielsen (2014), “The State of Private Label around the World: where it’s Growing, Where it’s Not and What the Future Holds”. Retrieved from: http://www.nielsen.com/content/dam/nielsenglobal/kr/docs/global-report/2014/Nielsen%20Global%20Private%20Label%20Report%20November%202014.pdf.
Nielsen (2016). Made In…Which Country? Perceptions About Brand Origin Shape Purchase Intentions Around the World. Nielsen April 2016
Nielsen. (June 2016). Think Smaller for Big Growth: How to Thrive in the New Retail Landscape. CZT/ACN. Trademarks, L.L.C.

213
Nielsen. (November 2016). European Grocery Market Growing at “Snail’s Pace”. Retrieved from: http://www.nielsen.com/
Normann, H. T. (2009). Vertical integration, raising rivals’ costs and upstream collusion. European Economic Review, 53(4), 461-480.
Normann, H. T. (2011). VERTICAL MERGERS, FORECLOSURE AND RAISING RIVALS'COSTS–EXPERIMENTAL EVIDENCE*. The Journal of Industrial Economics, 59(3), 506-527.
Nykamp DQ, “Directed graph definition.” From Math Insight. Retrieved from: http://mathinsight.org/definition/directed_graph
OECD (1981), Buying Power: The exercise of market power by dominant buyers, Report of the Committee of Experts on Restrictive Business Practices, OECD, Paris.
OECD (1998), "Buyer Power of Large Scale Multiproduct Retailers", Background paper by the Secretariat, RoundTable on Buying Power, OECD, Paris.
Office of Fair Trading (1985), Competition and Retailing, London.
Olson, E. L. (2012). Supplier inferences to enhance private label perceptions. Journal of Business Research, 65(1), 100-105.
Ortega-Martínez, P., & Martínez-Peña, F. (2008). A sampling method for estimating sporocarps production of wild edible mushrooms of social and economic interest. Forest Systems, 17(3), 228-237.
Padilla, C., Villalobos, P., Spiller, A., & Henry, G. (2007). Consumer preference and willingness to pay for an officially certified quality label: Implications for traditional food producers. Agricultura tecnica, 67(3), 300-308.
Pauwels, K., Hanssens, D. M., & Siddarth, S. (2002). The long-term effects of price promotions on category incidence, brand choice, and purchase quantity. Journal of marketing research, 39(4), 421-439.
Pauwels, K., & Srinivasan, S. (2004). Who benefits from store brand entry?. Marketing Science, 23(3), 364-390.
Peng, M. W. (2001). The resource-based view and international business. Journal of management, 27(6), 803-829.
Pettenella, D., & Kloehn, S. (2007). Mediterranean mushrooms: how to market them. Beyond Cork-a Wealth of Resources for People and Nature, pp52-68. WWF Mediterranean and IPADE, Madrid.
Pilz D., Molina R., Amaranthus M., Castellano M., Weber N.S.. (1996). Forest fungi and ecosystem management. In Pilz D., Molina R.. Managing forests ecosystems to conserve fungus diversity and sustain mushrooms harvest. USDA For. Serv. Gen. Tech. Rep. PNW – 374, 104 pp.

214
Pilz, D., & Molina, R. (2001). Commercial harvests of edible mushrooms from the forests. Forest Ecology and Management, 5593, 1-14.
Pilz, D., Weber, N. S., Carter, M. C., Parks, C. G., & Molina, R. (2004). Productivity and diversity of morel mushrooms in healthy, burned, and insect-damaged forests of northeastern Oregon. Forest Ecology and Management, 198(1), 367-386.
Plotnikov, A. V., Ponosova, E. V., & V'jyugova, E. L. (2013). Assortment policy of retail trade networks-private label creation. World Applied Sciences Journal, 27(10), 1248-1252.
Porter, M. E. (1979). How competitive forces shape strategy.
Presenza, A., Minguzzi, A., & Petrillo, C. (2010). Managing wine tourism in Italy. Journal of Tourism Consumption and Practice Volume, 2(1), 46-61.
Profeta, A., Balling, R., Schoene, V., & Wirsig, A. (2010). Protected geographical indications and designations of origin: an overview of the status quo and the development of the use of regulation (EC) 510/06 in Europe, with special consideration of the German situation. Journal of International Food & Agribusiness Marketing, 22(1-2), 179-198.
Ratliff, J. (1998), "Coming Themes in EC Vertical Restraints", presented to the IBC Conference on European Competition Law, London.
Regni, M. (2005) “L’esempio di valorizzazione del fungo di Borgotaro”. Alberi e Territorio N. 12 - 2005
Rey, P., & Whinston, M. D. (2013). Does retailer power lead to exclusion?. The RAND Journal of Economics, 44(1), 75-81.
Richardson, P., Jain, A. K., & Dick, A. (1996). The influence of store aesthetics on evaluation of private label brands. Journal of Product & Brand Management, 5(1), 19-28.
Sachon, M., & Martinez-de-Albeniz, V. (2009). Private label introduction: Does it benefit the supply chain?.
Sarkar, S., Sharma, D., & Kalro, A. D. (2015). The Effect of Naming Strategy and Packaging on Perceived Quality and Purchase Intention of Private Label Brands. In Advances in National Brand and Private Label Marketing (pp. 103-111). Springer International Publishing.
Schlosser, W. E. (1995). The wild edible mushroom industry of Washington, Oregon and Idaho: a 1992 survey. Journal of forestry (USA).
Sethuraman, R., & Raju, J. S. (2012). 19 Private Label strategies-myths and realities. Handbook of marketing strategy, 318.

215
Simeone, M., Marotta, G., & Rotondo, G. (2015). Competitive strategies in the Italian pasta industry. Agricultural Economics Review, 16(1), 73-87.
Singh, V. P., Hansen, K. T., & Blattberg, R. C. (2006). Market entry and consumer behavior: An investigation of a Wal-Mart supercenter. Marketing Science, 25(5), 457-476.
Singh, P., Langowski, H. C., Wani, A. A., & Saengerlaub, S. (2010). Recent advances in extending the shelf life of fresh Agaricus mushrooms: a review. Journal of the Science of Food and Agriculture, 90(9), 1393-1402.
Sitta, N., & Davoli, P. (2012). Edible ectomycorrhizal mushrooms: International markets and regulations. In Edible Ectomycorrhizal Mushrooms (pp. 355-380). Springer Berlin Heidelberg.
Sitta, N., & Floriani, M. (2008). Nationalization and globalization trends in the mushrooms commerce of Italy with emphasis on porcini (Boletus edulis and allied species). Economic Botany, 62(3), 307-322.
Smith, S. A., & Achabal, D. D. (1998). Clearance pricing and inventory policies for retail chains. Management Science, 44(3), 285-300.
Steenkamp, J. B. E., & Dekimpe, M. G. (1997). The increasing power of store brands: building loyalty and market share. Long range planning, 30(6), 917-930.
Steenkamp, J. B. E., Van Heerde, H. J., & Geyskens, I. (2010). What makes consumers willing to pay a price premium for national brands over private labels?. Journal of Marketing Research, 47(6), 1011-1024.
Steiner, R. L. (2004). The nature and benefits of national brand/private label competition. Review of Industrial Organization, 24(2), 105-127.
Stichele, M. V., & Young, B. (2009). The abuse of Supermarket Buyer Power in the EU Food Retail Sector. Amsterdam: SOMO.
Symphony IRI Group (2011). La marca commerciale in Europa special report. Special Report.
Symphony IRI Group (2012). La Private Label in Europa.
SymphonyIRI Group (2012). Pricing and Promotion in Europe. Adapting to the Tough Times That are Set to Last. Retrieved from: http://www.iriworldwide.eu
Srinivasan, S., Pauwels, K., Hanssens, D. M., & Dekimpe, M. G. (2004). Do promotions benefit manufacturers, retailers, or both?. Management Science, 50(5), 617-629.
Sudhir, K., & Talukdar, D. (2004). Does store brand patronage improve store patronage?. Review of Industrial organization, 24(2), 143-160.

216
Suh, J., & MacPherson, A. (2007). The impact of geographical indication on the revitalisation of a regional economy: a case study of ‘Boseong’green tea. Area, 39(4), 518-52
Tarzijan, J. (2004). Strategic effects of private labels and horizontal integration. The International Review of Retail, Distribution and Consumer Research, 14(3), 321-335.
Ter Braak, A., Deleersnyder, B., Geyskens, I., & Dekimpe, M. G. (2013). Does private-label production by national-brand manufacturers create discounter goodwill?. International Journal of Research in Marketing, 30(4), 343-357.
Timmons, D., Wang, Q., & Lass., D. (2008). Local Foods: Estimating Capacity. Journal Of Extension (JOE).
Timmor, Y. (2007). Manufacturing for overseas private labels: A win–win strategy for retailers and producers. International Review of Retail, Distribution and Consumer Research, 17(2), 121-138.
Troiani, C.A. (2010). Un'abitudine alimentare radicata che non si lascia scalfire dalle mode. MARK UP marzo_2010
Turtiainen, M., & Nuutinen, T. (2012). Evaluation of information on wild berry and mushroom markets in European countries. Small-scale Forestry, 11(1), 131-145.
Unaprol (2015). Consumi - Unaprol: nel 2014, olio per 634 mln € nella GDO; ma 66% venduto in promozione. Unaprol. February 2015http://www.unaprol.it/index.php/stampa/comunicati-stampa/1002-consumi-unaprol-nel-2014-olio-per-634-mln-nella-gdo-ma-66-venduto-in-promozione.html
Vahie, A., & Paswan, A. (2006). Private label brand image: its relationship with store image and national brand. International Journal of Retail & Distribution Management, 34(1), 67-84.
Vaidyanathan, R., & Aggarwal, P. (2000). Strategic brand alliances: implications of ingredient branding for national and private label brands. Journal of Product & Brand Management, 9(4), 214-228.
Varian, H. R. (1992). Microeconomic analysis. Norton & Company.
Villas-Boas, S. B., & Chambolle, C. (2015). Buyer Power Through Producer Differentiation. International Journal of Industrial Organization, 43.
Voces, R., Diaz-Balteiro, L., & Alfranca, Ó. (2012). Demand for wild edible mushrooms. The case of Lactarius deliciosus in Barcelona (Spain). Journal of forest economics, 18(1), 47-60.
Vogel, L. (1998), "Competition Law and Buying Power: The Case for a New Approach in Europe", European Competition Law Review, Issue 1, pp. 4-11.

217
Volpe, R. (2011). Evaluating the performance of US supermarkets: pricing strategies, competition from hypermarkets, and private labels. Journal of Agricultural and Resource Economics, 36(3), 488-503.
Volpe, R. J. (2013). Promotional competition between supermarket chains. Review of Industrial Organization, 42(1), 45-61.
Volpe, R. J., & Lavoie, N. (2008). The effect of Wal-Mart supercenters on grocery prices in New England. Applied Economic Perspectives and Policy, 30(1), 4-26.
von Schlippenbach, V., & Wey, C. (2011). One-stop shopping behavior, buyer power, and upstream merger incentives (No. 27). DICE discussion paper.
Voss, G. B., & Seiders, K. (2003). Exploring the effect of retail sector and firm characteristics on retail price promotion strategy. Journal of Retailing, 79(1), 37-52.
Walters, R. G. (1991). Assessing the impact of retail price promotions on product substitution, complementary purchase, and interstore sales displacement. The Journal of Marketing, 17-28.
Wang, H. (2006). Slotting allowances and retailer market power. Journal of Economic Studies, 33(1), 68-77.
Wang, C. X., & Webster, S. (2009). Markdown money contracts for perishable goods with clearance pricing. European Journal of Operational Research, 196(3), 1113-1122.
Wang, S. S., Rojas, C., & Lavoie, N. (2010). Buyer Market Power and Vertically Differentiated Retailers. Department of Resource Economics Working Papers, 2010.
Wasserman, S., & Faust, K. (1994). Social network analysis: Methods and applications (Vol. 8). Cambridge university press.
Watling, R. (1997). Mycology: The business of fructification. Nature, 385(6614), 299-300.
Waterson, M., & Dobson, P. (1998). The welfare consequences of the exercise of buyer power.
Whelan, S., & Davies, G. (2006). Profiling consumers of own brands and national brands using human personality. Journal of Retailing and Consumer Services, 13(6), 393-402.
Whyatt, G., & Koschek, R. (2010). Implementing relationship marketing: supermarkets' perspectives. Marketing Intelligence & Planning, 28(5), 582-599.

218
Wu, P., Yeh, G. Y. Y., & Hsiao, C. R. (2011). The effect of store image and service quality on brand image and purchase intention for private label brands. Australasian Marketing Journal (AMJ), 19(1), 30-39.
Yun, W., Hall, I. R., & Evans, L. A. (1997). Ectomycorrhizal fungi with edible fruiting bodies 1. Tricholoma matsutake and related fungi. Economic Botany, 51(3), 311-327.
Zambonelli, A., & Bonito, G. M. (Eds.). (2013). Edible ectomycorrhizal mushrooms: current knowledge and future prospects (Vol. 34). Springer Science & Business Media.
Zippel, C., Wilkinson, J., & Vogler, T. (2013). The influence of private labels on retailer cooperation. Australasian Marketing Journal (AMJ), 21(4), 271-277.