Durham E-Theses - Durham University
343
• • •
-
Upload
khangminh22 -
Category
Documents
-
view
1 -
download
0
Transcript of Durham E-Theses - Durham University

Durham E-Theses
Flandrian sea-level changes on the south coast of
England
Sutherland, Fiona Margaret Jean
How to cite:
Sutherland, Fiona Margaret Jean (1984) Flandrian sea-level changes on the south coast of England,Durham theses, Durham University. Available at Durham E-Theses Online: http://etheses.dur.ac.uk/7464/
Use policy
The full-text may be used and/or reproduced, and given to third parties in any format or medium, without prior permission orcharge, for personal research or study, educational, or not-for-pro�t purposes provided that:
• a full bibliographic reference is made to the original source
• a link is made to the metadata record in Durham E-Theses
• the full-text is not changed in any way
The full-text must not be sold in any format or medium without the formal permission of the copyright holders.
Please consult the full Durham E-Theses policy for further details.
Academic Support O�ce, Durham University, University O�ce, Old Elvet, Durham DH1 3HPe-mail: [email protected] Tel: +44 0191 334 6107
http://etheses.dur.ac.uk

J E D I C A T I 0 N
This thesis is dedicated to my
mother and father with love,
and to 1 PoT o 7 1 •

'FLANDRIAN SEA-LEVEL CHANGES
ON THE SOu~H COAST OF ENGLAND'
by
FIONA MARGARET JEAN SUTHERLAND
The copyright of this thesis rests with the author.
No quotation from it should be published without
his prior written consent and information derived
from it should be acknowledged.
Submitted for the degree of Master of
Science, University of Durham.
Department of Geography, September 1984.
- r: I; ;n · . ..., ") ( .J ... :.1 1 •. •)u

ii
ABSTRACT
~he South Coast of England is one of the few
rerr,aining areas in the British Isles Hhere there is
a relatively lioited knowledge of past sea levels.
Five sites were investigated in the present
study for evidence of past sea-level movements. These
were at The Moors in Dorset, Studland Heath in Dorset,
Broimdown in Hampshire, Ya:::-mouth on the Isle of Hight
and Pett Leve~- in East Sussex. Indications of sea-level
movement were gained frorr, the stratigraphic, poll en ac'1d
diatom analyses at the sites.
h series of phases of positive and negative sea-level
tendencies, over the last lC,OOO years, are pre"sented at
each ._,_ Sl v8. are correlated, within a regio~al
with ot!:.er sites fTom the South Coast of Englac'1d.
setting,

iii
D E C L A R A T I 0 ~
This thesis is the result of all my own
work. No part of this thesis has been
taken for publication prior to submission.
Where data have been taken from other
authors it has been acknowledged in the
customary manner.

iv
C 0 P Y R I G H T
The Copyright of this thesis rests with
the author. No quotations should be
taken from it for the purpose of
publishing without her prior written
consent. Any information derived from
this work should be acknowledged in the
customary manner.
F.M.J. SUTHERLAND
September, 1984.

v
A C K N 0 W L E D G E M E N T S
~his work was undertaken in the Department of
Jeography, Durham University and was funded by a
N.E.R.C. research studentship for i:h~_ch I am grateful.
I wish to express my thanks to the Heads of
Department and to :-ny supervisor J.l.J. Tooley for the
research and technical facilities rr,ade available to
me during this work. The staff of the photographic
unit printed the figures for me in record _.__. clme.
A.Haggart, H. Evans, I. Shennan, F .Bell and A.James
assisted me in the field ~nd W.Hodges in the Dept~
of Civil Engineering, Portsmouth Pol,Ytechnic made
the Erovmdown core 3.V ail able for lilY use.
It is with pleRsure that I acknowledge the
advice and suppo:::-t from r:;;' friends especially Miss
I .Hindmarsh, J .Innes, S.Ireland, D.Gogarty and
K.Gogarty and to my friends in St .Aidan's SCR. My
especial thanks goes to V. Innes for helping with
the typing and to Alfie for setting me a good example.
Finally I would lik8 to expr8ss my sincere
gratitude to my mother and father to \·:hom I cun
indebted for their su;:,port and care over the last few
years. i~i thout their love this thesis would not have
been possible.

------ -- ----------------------
vi
L I S T 0 F CONTENTS
Dedication
Abstract
Declaration
Copyright
Acknowledgements
List of Contents
List of Figures
List of Tc.bles
Chapter l INTRODUCTION
1:1 Objectives of the Thesis
1:2 A Short History of Sea-Level Studies
1:3 The Geological Background of Southern Britain
l :4 Pre-Flandrian Sea-Level Movements
1:5 Study Areas and Geological Backgrounds
Chapter 2
2:1
' ~ ' . / ~- . -.::':3
TECHNIQUES EMPLOYED
Introduction
Levelling
Sampling Methods
2:3:1 2:3:2 ;:: :3:3 2:3:4
The Go~ge Sampler The Russian-type Sampler The Percussion Corer Monoli t.n 'rins
2:4 Stratigraphic Analyses
2:5 Pollen Analyses
2:5:1 2:5:2 2:5:3 2:5:4 2:5:5 ?:5:6
Introduction Extraction of Pollen Pollen Counts Pollen Sums Pollen Diagrams Interpretation of Pollen Diagr~~s
PA~E
i
ii
iii
iv
v
vi
X
xii
l
l
10
10
14
19
20
20 c·l 22 23
24
28
28 30 30 31 32 33

2:6
2:7
Chapter 3
3:1
3:2
3:3
vii
Diatom Analyses
2:6:1 Introduction 2:6:2 Extraction of Diatoms 2:6:3 Diatom Counts 2:6:4 Diatom Sums 2:6:5 Interpretation of Diatom Di agrarns
Parti cl e-Si ze Analyses
BIOSTRATIGRAPHIC AND LITHOSTRATIGRAP~IC
ANALYSES OF SI'l'ES
The .Moors
3-= l :1 3:1:2 3: l: 3 3:1:4
Stratigraphy Particle-Size Analyses Pollen Analyses Diatom .'-illalyses
Studl and Heath
3:2:1 3:2:2
Stratigraphy Pollen Analyses
Yarmouth
3:3:1 3:3:2 3:3:3 3:3:4
Stratigraphy Particle-Size Analyses Pol::_en Analyses Diatom imalyses
~ :4 Pett Level
3:4:1 3:4:2
Stratigc:-aphy Pollen Analyses
3:5 Browndown
Chapter 4
4:1
4:2
3:5:1 3:5:2 3:5:3 3:5:4
Stc:-atigraphy Parti cl e-Szie Analyses Pollen Analyses Diatom Analyses
FLANDRIA."N" SEA-LEVEL CHANGES ON THE SOUTH COAST
Review of Literature
4:1:1 4:1:2
Review of Literature on Sea-Level Studies R~view of Literature on Pelle~ St~dies
Relative Chronology of South Coast Pollen Zones
t: 3 Analyses of Indicators of Sea-Level l•lovement from 3ites Studied
4:3:1 The Noors Site
PAGE
38
38 40 40 41 41
42
43
43 51 55 63
77
77 82
91
91 103 108 134
153
153 157
167
167 l70 l72 176
182
182 189
193
195
195

4:4
4:)
4:6
4:3:2 4:3:3 4:3:4 4:3:5
viii
The Studland Heath Site The Yarmouth Site The Pett Level Site The Browndown Site
Regional Synthesis of Evidence for Sea-Level Movements from Sites Studied
4:4:1 4:4;2 4:4:3
The Poole Harbour Region The Solent Region The Sussex Region
Discussion of Results
Future Research Needs
References
Appendix I Laboratory Schedule for Pollen Analysis
Appendix II Laboratory Schedule for Diatom Analysis
Appendix III Laboratory Schedule for Particle-Size Analysis
Appendix IV Pollen Counts
Appendix v Diatom Counts
PAGE
199 202 213 217
219
219 221 224 225
225
227.
xix
xxi
xxii
xxiv
xxxix

FIGURE
1
2
3
4
5 6
7 8
9 10
11
12
13
14a & 14b
15a & 15b
16
17a & 17b
18
19
20
21
22
23
24
25
26
27
28
29
30
31
32
33
ix
L I S T 0 F F I G U R E S
TITLE AFTER PAGE
South Coast Fieldwork Sites 14
Sites Mentioned in Text 14
The Geology Around Poole Harbour 14
The Geology of the Isle of Wight 15
The Geology of the South-East of England 17
Site Location of The Moors 43
The Moors Site Boreholes 43
The Moors Stratigraphy 44
Moors 7 Particle-Size 51
Moors 8 Particle-Size 52
Moors 9 Particle-Size 53
Moors 7 'fo Total Land Pollen 55
Moors 10 up Total Land Pollen 59
Moors 7 Diatoms 64
Moors 8 Diatoms 68
Moors 9 Diatoms 72
Moors 10 Diatoms 73
Studland Heath Site 71
Studland Heath Boreholes 77 Studland Heath Stratigraphy 78 Studland Heath 4b 'fo Total Land Pollen 82
Studland Heath 4h 'fo Total Land Pollen 87
Yarmouth Sits 91
Yarmouth Boreholes 91
Yarmouth Carpark Stratigraphy 92
Yarmouth Boatyard Stratigraphy 95
YBS 3 Particle-Size 10)
YBS 9 Particle-Size 104
YBS 10 Particle-Size 106
YBS 3 up Total Land Pollen 109
YBS 9 ~ Total Land Pollen 114
YBS 10 'fo Total Land Pollen 119
YBS 12 'jo Total Land Pollen 122

X
FIGURE TITLE AFTER PAGE
34 YBS 13 ~ Total Land Pollen 127
35 YBS 14 % Total Land Pollen 131
36a & 36b YBS 3 Diatoms 134
37a & 37b YBS 9 Diatoms 137
38a & 38b YBS 10 Diatoms 141
39a & 39b YBS 12 Diatoms 145
40a & 40b YBS 13 Diatoms 147
4la & 4lb YBS 14 Diatoms 150
42 Pett Level Site 153
43 Pett Level Boreholes 153,
44 Pett Level Stratigraphy 153
45 Pett Level 2 /o Total Land Pollen 157
46 Pett Level 3 % Total Land Pollen 159
47 Pett Level 4 ~ Total Land Pollen 162
48 The Browndown 13/14 53 Site 167
49 Brown down 13/14 53 Stratigraphy 167
50 Browndown 13/14 53 Particle-Size 170
51 Browndown 13/14 53 ~ Total Land Pollen 172
52 Brown down 13/14 53 Tube 36 Diatoms 176
53a & 53b Browndown 13/14 53 Tubes 26 & 28 Diatoms 178
54 Moors - Particle~Size 195
55 Yarmouth - Particle-Size 202

TABLE
1
2
3
4
5 6
7 8
9 10
11
12
13
14
15
16
17
18
19 20
21
xi
L I S T 0 F TABLES
TITLE
Subsidence Rates for the South Coast During the Flandrian
Component Parts of Troel-Smith Stratigraphic Classification
Physical Properties of Troel-Smith Stratigraphic C~assification
Pollen Producti vi.ty of .t>i.ain Tree Species
R-Ratio Values for l••ain Tree Species
Salinity Classification of Diatoms
Particle-Size Analysis of Moors 7
Particle-Size Analysis of Moors 8
Particle-Size Analysis of Moors 9
Dating of LPAZ at Moors 7
Dating of LPAZ at Studland Heath 4b
Particle-Size Analysis of YBS 3
Particle-Size Analysis of YBS 9 Particle-Size Analysis of YBS 10
Dating of LPAZ at YES 3
Dating of LPAZ at YES 12
Dating of LPAZ at Pett Level 2
Dating of LPAZ at Pett Level 3
Particle-Size Analysis of :3rowndo>m 13/14 53
Dating of LPAZ at :Browndown 13/14 53
Dated LPAZ Boundaries from the South Coast
PAGE
8
26
27
36
36
40
51
52
53
59 87
103
105
107
114
127
159 162
170
175 194

- l -
CHAPTER l
INTRODUCTION
1:1 OBJECTIVES OF THESIS
To date the South Coast of England lacks a detailed,
comprehensive study of sea-level fluctuations during the Flandrian
Age. Minor studies, at an undergraduate level, have been
performed but no information has been compiled for the whole of the
South Coast area. Radiocarbon dated samples of Flandrian material
are available for a number of sites and there are also a number of
pollen diagrams which have been drawn up for sites on the South
Coast, but these data are not directly linked with sea-level studies.
The objectives of this thesis are to attempt to draw together
the information derived from the specifically researched sites of
this study with the information already availE:~.ble from other authoru
in order to produce a relative chronology of sea-level events along
the South Coast during the Flandrian Age.
1:2 A SHORT HISTOHY OF SEA-LEVEL STUDIES
The study of oscillating sea levels can be traced for many
decades. This type of study involves many disciplines including;
astronomy, archaeology, biology, climatology, geology, geomorphology,
geophysics, hydrolo~y and oceanography. (Everard 1980). 'l'he
oscillation of sea level :results in two IIJb.jor procesoes; a marino
transgression causes the submergence and retreat of coastlines, except
in the case where cliffs flank the coast or where submergence is offset
by deposition, and marine regression leads to the emergence and

- 2 -
advance of coastlines, except again where the shore is bounded by
cliffs or where the emergence is counteracted by erosion (Bird &
Paskoff 1979).
!here are many features which indicate former sea levels
including high-level denudation surfaces, raised shore-platforms,
raised beaches and cliffs, submerged channels and terraces and also
submerged sediments and organic deposits. Unfortunately, the
methodology by which these features are investigated is not consistent
between all workers and thus correlations between different sites
which have been studied is difficult~ Godwin & Godwin (1933) were
one of the first to use stratigraphic, pollen and formaniferal
analyses while Iversen (1937) used stratigraphic, pollen and diatom
analyses for the same purposes. In 1974 an UNESCO - IGGP project was
set up in order to alleviate this problem of differing methodologies
in sea-level studies. The aim of this project was to standardize
the sea-level data and to establish a trend of sea level over the last
15,000 years and to predict future trends along the densely
populated sea-boards of the world.
A great many difficulties arise when one comes to analyse the
data available on sea levels. These include the following:-
1) Assessing the relationship of the deposit to the sea level at
the time.of deposition.
2) The time-lag variations within the depositional environment.
3) Variations in tidal range.
4) Assessing the fluctuations of eustatic sea level.
5) Assessing the fluctuations of isostatic sea level.
6) Dating the deposit.

- 3 -
l) Assessing the relationship of the deposit to the sea level at
the time of deposition.
This involves the nature of the deposit and its relationship
to sea level, problems of consolidation and compaction of sediments
and the effects of rare events such as storm surges.
The nature of the deposit which is to be used as an indicator
of past sea levels is all important. The commencement of peat
accumulation over a marine sediment is often used to indicate a
regression of sea level, but this layer can be formed anywhere between
mid-tide and high-tide levels. Some workers (Gilbertson 1967 and
Devoy 1972) have used the peat-clay boundary in order to date sea-level
positions, but these boundaries are determined by competing rates of
sediment accumulation and vegetation growth (Kidson & Heyworth 1979)•
Van de Plassche (1982) notes that fen-wood peat and Phragmites-Carex
peat are formed at about groundwater level but that Phragmites peat
can be formed in water depths of up to a few decimetres. Peat may
accumulate behind a physical barrier such as a spit or sea-wall and if
this barrier is overcome by an especially high tide or by erosion,
marine deposition will occur over the organic material. Thus a
transgressive episode may be simulated where no such event has occurred.
Generally one can tell when this type of deposition has happened as
there will be a sharp break in the lithological succession with no
gradual change from the terrestrial to marine facies. Heyworth (1978)
believes that Oak remains in coastal submerged forests are good
indicators of past sea levels because he believes that they were once
par~ of the natural coastal vegetation. The trees died not by
permanent inundation of sea-water but by rising freshwater tables and
the slow ingress of saline water. The best indications of past sea

- 4 -
1 evel s can be gained by poll en and diatom. analyses of inorganic and
organic beds, where evidence from these analyses points to the lowest
completely freshwater facies. It must be remembered when using
diatoms as indiactors of water conditions that the diatom flora can
be sorted by wind and water, especially if the assemblage lives as
a film on the surface of mud which can easily be dried out.
Consolidation and compaction of sediments can alter the
stratigraphic altitude of a stratum. Consolidation in a deposit
with a high sand fraction is low, but in a deposit with a high
fraction of organic material, compaction can be as great as 90% of the
volume (Jelgersma 1961). The deposits most likely to be affected are
those in contact with an overlying mineral horizon, as well as those
over deeper peats. If the organic stratum is in contact with a
mineral substratum, no change in stratigraphic position is likely to
occur. A peat deposit will decay naturally resulting in the loss of
volume. The rate of this decay is a function of the water content of
the deposit together with the oxygen content and the temperature and
rate of peat growth. MacFarlane (1965) says that peat consolidation
takes place in two stages; the primary sta.ge occurs very rapidly and
can account for up to 50r.. of the total cor..solidation. The secondary
stage is much slo•rer and has a viscous movement, but allows for
rebound if the overburden, causing the compaction, is lessened or
removed. Over-consoliuation of a peat deposit occurs when a large
overburden has been present at the site resulting in great compaction,
but this overburden has since been removed leaving the deposit highly
consolidated but with no evidence of the agent of consolidation.
The effects of rare events, such as storm surges or exceptionally
high tides have been considered by Kidson & Heyworth (op.cit.).

- 5 -
Events such as these can be useful indicators of sea levels and ivill
effect the stratigraphic sequence at a site. Smith~ al.(l983)
working in the River Ythan Valley in north-east Scotland record a
grey, micaceous, silty fine sand truncating a peat deposit, which is
thought to have been deposit~d as the result of a sudden marine
event, such as a storm surge. This deposit is similar to other finds
of grey, micaceous, silty fine sand l~ers in eastern Scotland and all
are thought to belong to a North Sea storm surge early in the
Flandrian Stage. Tooley (1979) however argues that after the storm
flooding of 1953 no evidence of this event was found, except at
Scolt Head Island where a thin veneer of clay and sand was deposited.
This deposit was considered to be associ,,_ted with a breach in the sand
dunes (Steers 1976; in Tooley ££• cit.).
2) Time-lag variations within the depositional environment.
The time-lag variations within a depositional environment are
sometimes experienced between the cessation of mineral sedimentation
and organic sedimentation or vice versa. Depending on the
sedi1nentary environment, a period may elapse between the two deposits
thus giving a false indication of past specific sea levels when the
boundary zone is dated.
3) Variations in tidal range.
The tidal range at a site plays an important part in the
determination of past sea levels. Variations in tidal range makes
the identificatimn of sea level most difficult between sites and
within a site over time (Kidson & Heyworth ££• cit.). A number of
factors go to make up the tidal range at a site; exposure to storm
and swell waves, wave refraction at the site, the distribution of
wave energy along a crenulated coastline and the fetch of the wave.

- 6 -
Differences in wave energy alone can produce differences in altitude
of greater than six metres within a storm-beach deposit (Kidson &
Heyworth 22• cit.). At Chesil Beach the north-west section is l9ss
than+ 1 m.O.D. but at the south-wect end of the beach it is+ 15 m.O.D.
This leads to a difference in altitude of features of the same age.
Also it must be remembered that waves can move sediments higher up
the coast than the height of the highest waves. Biological
communities are thought to be precise indicators of the nature ru1d
duration of tidal cover (:<.iclson & Heyworth ~· cit.) although
Jelgersma (1961) found that fen-wood peat will accumulate up to fifty
centimetres above or below the high-tide level. Jardine (1975) says
that where the tidal range at a site is great, one should use the
me~~ tide=level to equate the mean sea level.
4) Assessing the fluctuations of sea level due to eustatic effects.
Fluctuations of sea level due to eustatic effects are world wide
phenomena partly resulting from the amount of water stored in ice-caps.
during glaciations. If the 3reenland and Antarctica ice-caps were to
melt the world wide sea level would be raised by sixty-six metres.
Donn~ al.(l962; in Goudie 1977) estimate that sea level was
lowered by one hundred and five metres to - 123 m.O.D. in the last
glaciation. Mtlrner (1969) attempted to develop an eustatic curve of
sea level for southern Scandinavia, showing sea level to be - 42 m
ca. 10,950 to 10,000 years before present (yBP) and rising to ca.+ 0.4 m
between 3350 yBP and 3600 yBP. M~rner (1976) viewed the surface of
the ocean in a geoidal configuration. He followed this idea up by
stating that sea-level curves from data from different regions of the
world could not be compared if the changing geoidal shape of the
earth and ocean were not considered. Sea levels can intersect the

- 7 -
coasts of different continents at different altitudes with a
range in altitude of up to one hundred and eighty metres.
5) Assessing the fluctuations of sea level due to isostatic effects.
Isostasy is a local component of sea-level fluctuations whereby
ice masses and sea water are applied and removed causing deformation
of the earth's crust. When an area is glaciated, depression of the
land occurs under the weight of the ice-load, but after deglaciation
the area will begin to undergo rebound back to the position before
glaciation. In areas peripheral to the glaciated regions Newman~ al.
(1971; in Goudie 1977) have suggested there was a bulging up of the
land surface but these areas have since collapsed during the
deglacials resulting in the submergence of the land to a greater
degree than would normally have occurred. In view of this fact one
must remember that the South Coast of England did not undergo
glaciation during the last cold phase. In Britain, the north of the
country is being elevated while the south is sinking due to isostatic
rebound. Valentin (1953) has said that the strongest uplift in the
British Isles is happening in the Scotish Highlands, which was the last
area to be deglaciated. He considered that the present rnovemants can
be correlated with older events in the Tertiary such as rifting and
volca11ic actj_vi ty. Subsidence along the South Coast is given as
greater than 2 cmflOO years but no definite figure is stated.
Churchill (1965) takes mean sea level ca.6500 yBP to be 3.05 m below
present sea level, this figure being based on data from South Africa.
Using a number of data he calculated that the Bristol Channel is still
at the same- level as ~-6500 yBP. This idea conflicts with Valentin's
zero datum which runs through Dunbar and Holyhead. Churchill goes on
to say that to the north of the Bristol Channel uplift occurred at a
rate of 14 .:!: 4.7 em per 100 years, while to the east the land is

- 8 -
subsiding at a rate of 9.4 ± 4.7 em per 100 years. West (1972)
disagrees with the sea level given by Churchill and says that the
sea level ~-6500 yBP was - 9 m.O.D. Neither author states how the
sea-level figure lias computed. Various rates of subsidence for the
South Coast have been given by different authors and are shown in
Table 1.
Table 1 Subsidence Rates for the South Coast During the Flandrian.
Rate (cm/100 yrs.) Axe a Author
11.54 S.England Churchill (1965)
13 - 16 SE. England A..'<.eroyd (1972)
12.5 Isle of Wight Devoy (1972)
12.7 Thames Estuary D'Olier (1972)
10.99 Fawley Hodson & \.Jest (1972)
20 S. England 1-ing (1972)
In North-Hest Europe glacio-eustasy and glacio-isostasy act
together to produce fluctuations of sea level and it is difficult to
isolate the two factors.
5) Dating the deposit.
Dating deposits causes great problems. The most wides~read
method of dating is by radiocarbon assay. Shotton (1967) _;'Joints out
a nwnber of limitations of this method& Errors can be incurred [,y a
nwnber of different ways. It is tl1ought that warmer climatic
periods result in higher concentrations of 14c in the atmosphere.
This factor can cause problems in dating but variations in the 14c
concentration can be allowed for over the past 6000 years and before
that time the error is proportionally small and may not even be
present. If a plant can photo-synthesise under water it will have
a lower 14c content than would be normal and thus if a.n

- 9 -
organic mud is dated it will give an age that is too large. Such
errors are unlikely to exceed JOOO years but of course this is very
important if Flandrian deposits are to be dated. Overestimation of
age can occur when mollusc shells are dated due to istope replH.cenmont
which takes place within the material of the shell. Finally,
contamination can occur when the deposit to be dated is in contact
with old or modern carboniferous material such as root penetration.
It is generally accepted that sea levels have fluctuated over
long time spans such as glacial and interglacials but controverny
has arisen over wht;ther or not such fluctuations are marked over
shorter time spans. At present there are three schools of thought
over sea-level movements during the Flandrian Stage, the first
school believes that there has been a continuous rise of sea level
to the present d~, although the rate of this rise has lessened with
time (Shepard 1963). The second school thinks that sea level rose
to c.3600 yBP and then remained constant (Godwin £1 al. 1~58) and the
third school believes that there was an oscillating rise of sea level
to present which has been fluctuating above or below present sea level
(Fairbridge 1958 and Marner 197l)o
Thus one can see that a great many problems are involved in the
study of past sea levelso All the factors mentioned above must be
considered when interpreting material for sea-level studies although
it is very diffic~lt to isolate each cowponent in order to construct
reliable sea-level curves for different areas during the Flandrian
Ageo
la3 THE GEOLOGICAL BACKGROUND OF SOUTHERN BRITAIN
The rook platform under southern Britain consists of rocks
of Carboniferous through Devon-ian to Lower Palaeozoic age.
During the Hercynian earth movements, about 280 million years ago,
these older rocks underwent upheaval to create an upland area.
This upland was subsequently planed down to form the London
Platform, upon which Mesozoic sediments were deposited. During
the Jurassic subsidence occurred in the Weald area at a rate of
5.8 mm/ 100 years, with the deposition of 1.5 Km of shallow water
sediments. In Early Cretaceous times deposits of a freshwater
nature were laid down in an area that ~as subsiding at a rate of
1.4 mm/ 100 years. The Cenomanian Transgression occurred in Late
Cretaceous times covering great areas of Europe with shallow water
seas and the deposition of the chalk strata. Since the Late
Cretaceous there was rifting to the west of Britain and the
drifting apart of the American and Eurasian continental masses
began (Blaokett 9 Billard & Runcorn 1965J in Dunham 1972) o 'l'hia
was followed by a period of subsidence at a rate of 1.8 mm/ 100 years
during the Early Tertiary (Palaeogene) when the Reading and Woolwich
Beds and London Clays were deposited. Subsidence was renewed in
the Late Tertiary and Early Pleistocene (Neogene) when the
deposition of the Crag deposits were laid down. The ice-sheets of
the Pleistocene created a relative fall of sea level which exposed
the continental shelf to subaerial erosion and marine planation.
la4 PRE-=-FLAllDRIAN SEA-LEVEL MOVEMENTS
A number of sites in Southern Britain and The Netherlands
record pre~Flandrian sea levels. These two areas have been

---------
- ll -
investigated by West (1972) and Zagwijn (1979) and are correlated
below in chronological ordere
l) Ludhami an
This interglacial period correlates with the Middle Tiglian
of Europe and is dated to 2 million years ago (mya) by van Montfrans
(1971; in Zagwijn 1979). In East Anglia the deepest deposits of the
Crag Basin are of a Ludhamian to Thurnian age (West 1968, 1972) and
can be correlated with beds of a Middle and Upper Tiglian age in The
Netherlands.
2) Antian
During the Antian interglacial the sea was still covering
East Anglia with the deposition of the Coralline Crag beds which
outcrop at Orford in Suffolk at O.D. In The Netherlands however the
sea had retreated.
3) Baventian
This glacial period is thought to have started ca. 1.6 mya
(van Montfrans op. cit.). During this time the Red Crag deposits
were laid down in a shallow sea covering East Anglia. These deposits
are found below O.D. in east Suffolk and up to 183 m.O.D. at Netley
Heath in Surrey (Chatwin 19271 in West 1972). The eustatic change
of sea level resulted in a fall of 50 m during this time.
4) Pas toni an
The sea level rose to 8 m above present (ap) during this
interglacial (West op. cit.). The deposits of this age are
centred at O.D. in the Happisburgh area and a few metres above O.D.

~ 12 -
at Sheringham.
5) Beestonian
The Beestonian glacial shows a regressive phase of sea-level
movement with fluviatile sediments being laid down.
6) Cromerian
The Cromer Forest Beds of freshwater and marine sediments were
deposited during the Cromerian interglacial period. These beds are
found in east Norfolk and north Suffolk outcropping at O.D. on the
coast (West & Wilson 1966; in West op. cit.). In the northern
Netherlands marine beds are found at 50 to 60 m below present sea
level and can be correlated with the deposits of East Anglia. At
this time there was no connection between the North Sea and the
sea to the south of the Strait of Dover (Zagwijn op. cit.). The
rise of eustatic sea level was to 3 or 4 map (West op. cit.)
7) Anglian
This glacial period reveuls a regressive phase of sea level
with the advance of ice into East Anglia and The Netherlands.
8) Hoxnian
The eustatic rise of sea level during this phase was to more
than 23 m ap. Estuarine and marine cl83s have been found at Clacton
from 3 to 9 m.O.D. (Pike & Godwin 19539 in West op. cit.) and in the
Bar Valley from 5 to 20 m.O.D. (Stevens 1960; in West op. cit.).
The transgressive phase of sea level occurred at Clacten during the
pollen zone Ho Ill and in the Nar Valley during Zone Ho II with a
maximum sea level of 23 m.O.D. During this interglacial the sea

~ 13 -
penetrated the Strait of Dover and invaded parts of the northern
German lowlands. No deposits of this age are found in the western
Netherlands ..
9) Wolstonian
Sea-levels were low during the Wolstonian glaciation. Donn et al --(op. cit.) suggest a sea level of - 159 m below present.
10) Ipswichian
This last interglacial sees a rise of eustatic sea level to
7·5 m.ap (West op. cit.). At Selsey in Sussex estuarine deposits
show that a marine transgression attained levels of - 1.8 m.O.D. in
Zone Ip lib (West & Sparks 1960). These deposits are overlain by
raised beach deposits up to an altitude of 1 m.o.D. At Brighton
and Littlehampton raised beac~ deposits are also foUnd which indicate
a mean sea level of 7.5 m.ap in Zones Ip llb and Ip 111. In the
Fenlands Baden-Powell (1934J in West op. cit.) has identified the
March Gravel deposit up to an altitude of 10 to 12 m.O.D. which are
related to this sea-level movement.
11) Devensian
The last glaciation sees a regression of sea level to - 123 m
below present before the Flandrian Transgression took place ca.l4000
yBP as the great ice-sheets melted.
Thus we see some correlation between the glacial and
interglacial periods of the Pleistocene and the regressive and
transgressive phases of sea level in Southern Britain and 'I'he
Netherlands.

- 14 -
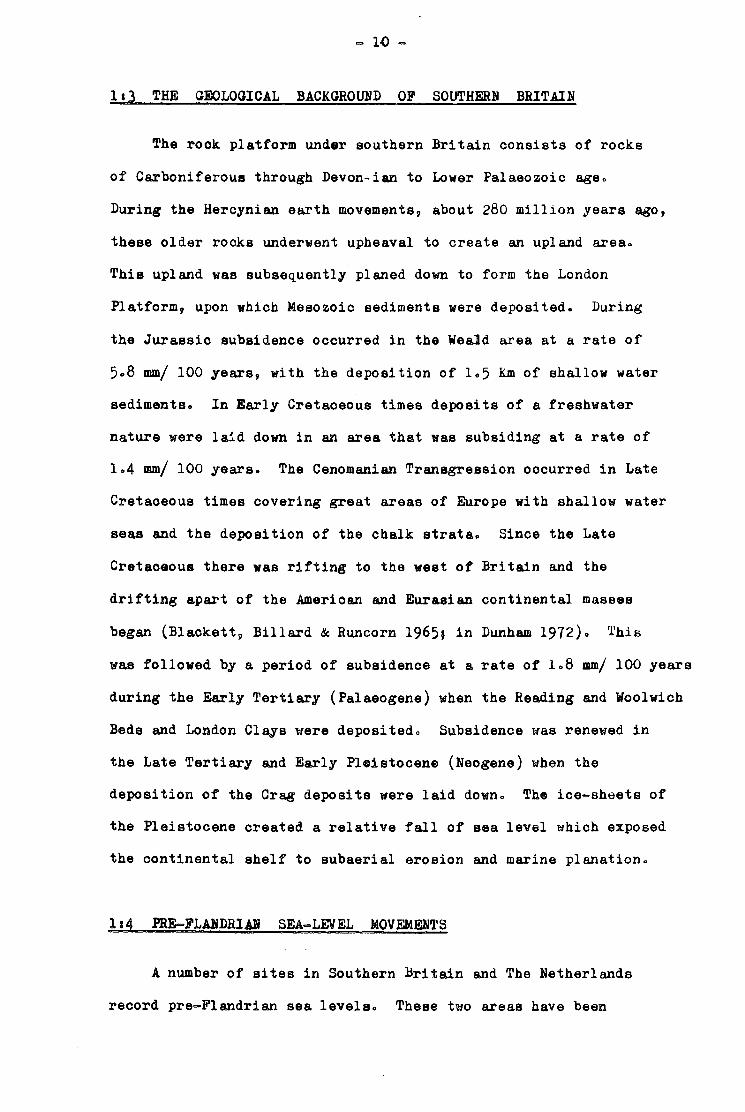
1:5 STUDY AREAS AND GEOLOGICAL BACKGROUNDS
In this work five sites, bordering the South Coast of
England are investigated and can be seen in Figure 1. These sites
are ~'he Moors in Dorf:>et, Studland Heath in Dorset, Bro,mdown in
Hampshire, Yarmouth on the Isle of Hight and Pett Level in East
Sussex.
1) The Moors (SY 94 86)
The location of The .Moors site is shown in Figures 1 and 6.
The site is found to the east of the mouth of the River Frome on the
southern shore of Poole Harbour. The site was discovered by Byrne
(1975) and proved to be suitable for detailed work to be carried out
which was initiated in the summer of 1980.
At Hareham the range of Spring Tides varies from 0.8 m.O .D. at
MHWS to - 0.7 m.O.D. at MLYIS, giving a tidal range of 1.5 m.
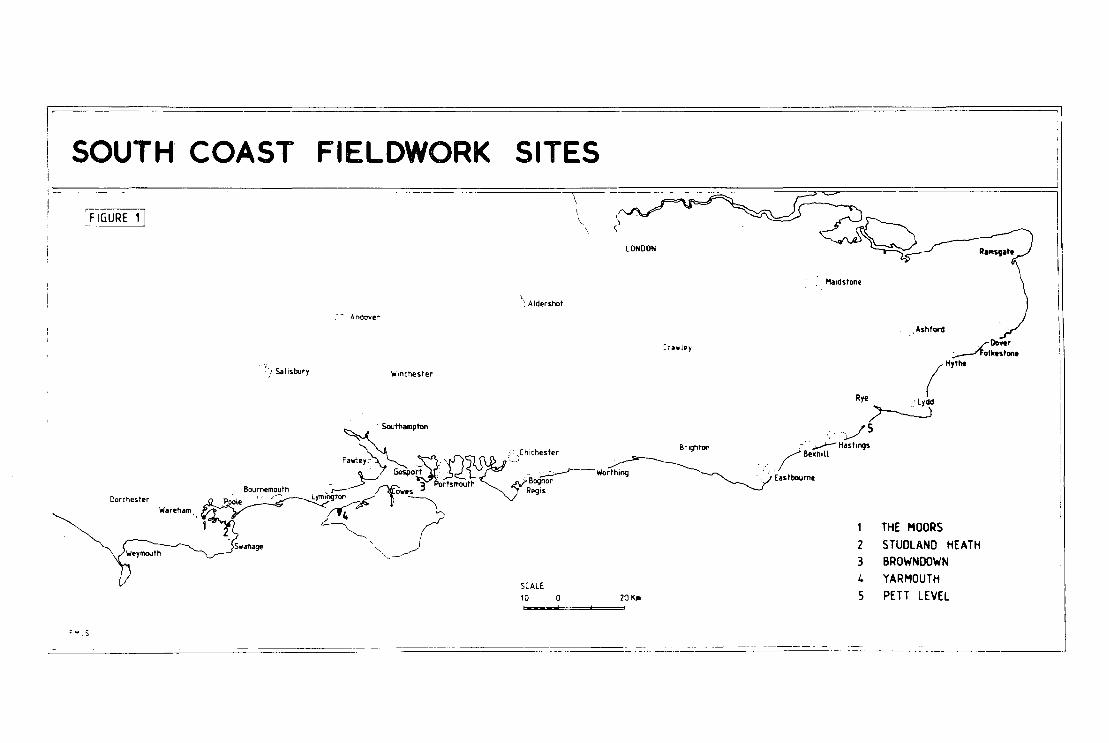
The solid rock geology of the region around the site !lccording
to Strahan (1898) can be Geen in Figure 3. 'l'he Moors site has a
bedrock of Eagshot Beds, which are clays and S3.nds frotn the Eocene
epoch. The site lie£. on the northern limb of the Isle of ?urbeck,
the general structure of which is simila.r to that of the Isle of
Wight. A series of folds and faults of post-Cretaceous age
traverse the Isle of Purbeck but only one of these affects the study
area. This is the main Isle of Purbeck fault and anticline which
stretches from West Luhmrth in the west to Ballard Point in the east.
The fault was formed mostly after the Mid-Oligocene, after the
deposition of the Hamstead Beds and is the same as the Brighstone
anticline of the Isle of Wight. This hogs-back of incised chalk
crosses the centre of the Isle of Purbeck in 9.l1 east-west direction,
I, I
I SOUTH. COAST !--
'I=IG-LJRE-1]
· ·,':t Sa l1sbury
Dorchester
: w. s
FIELDWORK SITES
-~)-' \ D LONOO!i
Maodstone
\ Aldershot
.-- An-O~er
Ashford
~ -~ ----~ ,;;;;;-''""''-
.. ~ .. "'-~ -- ·~ ( _ ~) Gospo~0 fi'~~P"""'" ...,__ '''~ ,~-;-----' ' ;!)[. _.!,<!._ . ~- . .. / ~ S
tot' /lf'owes 3 Portsmouth , ·· -~ . . . · yS
::-awley
Wonchester
·~·· . ' /'""'" ···~· D ? Bognor Worthing ' ........--- Ha ~ ,,.,,_m,
"-, _,/
SCALE
10 0 Z{)l(a
1
2 3 4
5
THE MOORS STUOLANO HEATH BROWNOOWN YARMOUTH PETT LEVEL
l I

--
r· ... SITES MENT~ONED TEXT IN
I
~-~r. l I
<> SNELSMORE
LEGEND
n 1 RIMSMOOR ~J
10 2 EAST STOKE • ELSTEAD
~~ 3 COLDHARBOUII
C) 4 WAREHAM
5 MORDEN A ~ WINCHESTER-[) 6 MORDEN B
7 KEYSWORTH F41!1'1
8 THE MOORS
9 SLEPE HEATH
~~"""~ 10 REHPS TONE •AHBERLEY 11 LUSCOMBE CHURCH e s&UTHAMPTON
•LEWES
12 GODLINGS TONE " 'J)WATER ;" ~-~ MOOR FAWLE~TSHOUTHZ M _g .. ~
13 LOWER HAMWORTHY CRANES • HARBOUR - ~~SHOREHAM-I'OlR
_}-STONE ~C::::: . ..b
" ~"~'" ..__,_ "" COO< HE
, • 3.::11" c>~ .------.s ~R~ ~ eGATCOHBE v
SCALE 10 0 20Km
FMJS
I . FIGURE 3 l
I
THE GEOLOGY AROUND POOLE HARBOUR
[] Bagshot Beds 1 London Cia)
l_
~ ~ &i n c...:..
'<ead,ng Beds
.•ppe' Chalk
"C~<e & Lower (hal>
~ ,?,_,
_: ... e,. ~reensana
""e~ :e-
--~~::;e· =-_-bee~
-..~ ac.e : ... '"beck
_:we~ ;>_~:Jec~
~ -·. a:--1.: s- :- e
=---· ;!-~ sa-:
• --,-e· J;e ::a.
f J
382
096
EOCENE
UPPER CRETACEOUS
St
LOWER CRETACEC~S
.iUR~SSIC
----- ·c33DJ
~o Krr.
.::=!=;:! -1 =*=-=~ ~
409
N
SOURCE GEOLOGICAL SURVE'r OF ENGLAND & WALES. 1952
Sheets 328. 329. 342 & 34 3
[] La.,. Water Mark
0 Blo'On Sand
• Peat
0 Alluv,um
n Calcareous Tufa ~-'
CJ Valley Gravel
~ Anqular F\1nt ~ravel
-- ~latP<1U Gr-1vPI
~: ay 'w 1f h r \1(ll

- 15 -
with the strata on the northern limb plunging more steeply than
those on the southern limb. The rocks of the Isle of Purbeck were
faulted asHell as folded in this upheaval whereas the rocks of the
Isle of Wight were only folded. The features of the Dorset coast
are due to subaerial denudation of the anticlinal region, similar to
the processes of the Wealden district, together with the destruction
of the surrounding synclinal region by sea invasions.
2) Studland Heath (SZ 02 84)
The location of the Studland Heath site is shown in Figures 1
and 18. This site is found on the southern shore of Poole Harbour
and is sheltered from the open sea by the South Haven Peninsula to
the east. This site had not previously been worked on and was
chosen due to its extensive stretches of tidal salt marshes.
Pieldv10rk at the site began in the summer of 1982.
At the entrance to Poole Harbour the range of Spring Tides varies
from 0.6 rn.O.D. at MHWS to- 1.1 m.C.D. at MLWS, giving a tidal range
of 1.7 m.
The bedrock at Studland Heath is Bagshot Beds as at The Moors
and the solid rock geolog;;r of the area can be seen in Figure 3. The
geological structure of the site is the same as at The Moors, and has
already been discussed above.
3) Yarmouth (SZ 35 89)
The location of the Yarmouth site can be seen in Figures 1 and 23.
The site bo~ders the Western River Yar on the Isle of Wight near the
town of Yarmouth. Although the site is known as Yarmouth it really
comprises two areas; to the west of the river is the location of the
Yarmouth Boatyard site (SZ 352 892) 1o~hile to the east of the river

[ FIGlJR[4]
THE GEOLOGY OF THE ISLE OF WIGHT
N
'
EJ ,,.,,,., •• ,. f D Bembridge Marls
OLIGOCENE SOURCE • GE OLOGIC AL SURVEY ~ Bembr idge Limestone
OF ENGLAND & WALES, 1962 [] Osborne & Headen Beds
Sheets 330, 331 . 344 & 345 ~ Bag shot Beds
l [3 London Clay EOCENE
[2] Low Water Mark [] Read1 ng Beds
Q Blown Sand. Shtngle II Upper Chalk
f
• Peat ~ Mtddle & Lower Chalk UPPER CRETACEOUS
0 Allu~tum ~ Uppe r Greensand
D Valley Bflckearth &I Gault
D Gravel Terraces =:J Car st one
l CJ Marme Gra~e l Sand rock Beds
~ Angular Flmt Gravel Fe rrug tnous Sands LOWER CRETACEOUS SCAL E 1 63,360
D Plateau Br tckearth S3 A•herft eld Cl ay
1 0 s 10 Kn" [i] Plateau Gra~el
§
F I~ J S wealden Beds
---- -

- 16 -
is Yarmouth Carpark site ( SZ J54 894). 'l'hese t\-;o sites are both
tidal salt marshes. The area around the Hi ver Yar was worked on
by Devoy (1972) and as the site proved potentially valuable for
sea-level studies this work was initiated in late 1980.
The range of Spring Tides as Yarmouth varies from 1.12 m.O.D. at
MHWS to - 1.38 m.O.D. at MLWS, giving a tidal range of 2.5 m.
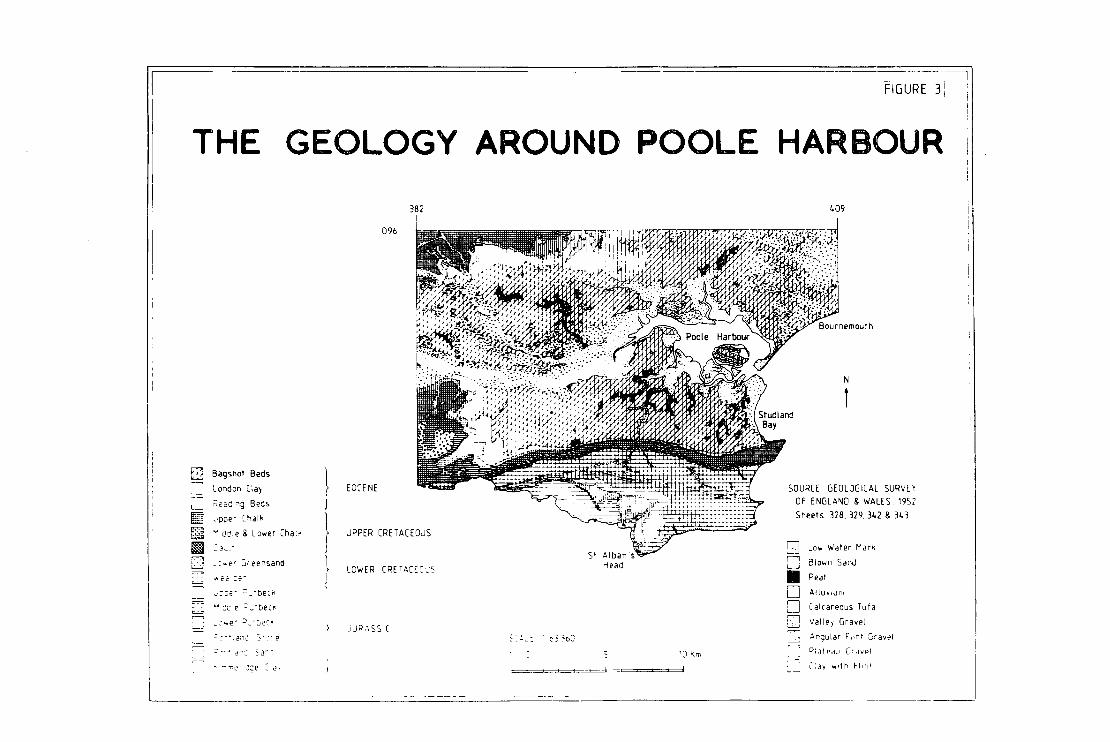
The solid roc.k geology of the Isle of \-light according to
Bristow (1889) is shown in Figure 4. ~t the Yarmouth site the bedrock
is of Headon Beds which are clays of freshwater, estuarine and marine
origins. A series of folds traverse the Isle of Wight, the main one
resulting in the anticlinal chalk ridge stretching from The Needles
in the west to Culver Cliff in the east. This is a continuation of
the Isle of Purbeck fault. The ridge produced by this divides the
island into two; to the north the rocks are of a Tertiary age and lie
in a broad syncline of heavy clays while to the south the rocks are
Cretaceous in age resulting in light and loamy soils. As in the
Isle of Purbeck the northern limb of the anticline is steeper than
the southern limb. The date of the disturbance which produced this
feature is probably after the deposition of the Hampstead Beds in
the Mid-Oligocene. There are a few faults on the Isle of '.-tight due
to the folding but the ones !)resent io not 3.lter the physical
features of the island.
4) Pett Level (TQ 89 13)
The Pett Level site is shown in Figures l and 42. It is found
to the east of Hastings on the foreshore south of Cliff End. The
existence of a submerged forest deposit on the foreshore has been
known for a long time but at the time of this study no work had teen

- 17-
carried out at the site and so the present investigation was
initi~ted in September 1982.
At Hastings the range of Spring Tides varies from 3.7 m.O.D. at
MHWS to - 3.1 m.O.D. at M.LWS, giving a tidal range of 6.8 m.
Tha solid rock geology of Pett Level io sho·,.,n in Figure 5
according to Edmunds (1935). The bedrock at the site is of Fairlight
Cl83s and Ashdown Sands of a Cretaceous age. These are lacustrine
and deltaic deposits of clays and sands. The site lies at the edge
of the Wealden area and thus the geological structure is bound by
the movements of the Weald. The general structure of the Wealden
area is a broad anticline, running east-south-east to west-north-west,
superimposed upon a synclinal area of deposition. The inception of
the movement resulting in this structure was in pre-Eocene times
reaching a maximum intensity in the Miocene Epoch. The topography
of the area can be described as deeply dissected high ground of
Hastings Beds which are surrounded by a broad low-lying zone of
Weald Clay, which in turn is surrounded by hills of Lower Greensand
encircled by Chalk downs. The study area is in a region which has
been effected by many folds and faults. The folds of the Upper
Jurassic and Lower Cretaceous rocks can be divided into three
anticlines along the coast; 'l'he Haddock's Anticline crosses the
coast close to Haddock's Cottages (TQ 844 124). The Fairlight
Anticline crosses south-east of Fairlight Church (TQ 860 119) and
Page's Anticline is found between Bexhill and Gooden Coastguard
station. These are all gentle features and cannot be traced far
inland. The Haddock's Anticline and Fairlight Anticline lie
'en echelon' and expose Fairlight Clays at Pett (TQ 87 14), Ore
(TQ 83 11) and Guestling (TQ 85 13). An overthrust fault can be

THE GEOLOGY OF SOUTH-EAST ENGLAND I FIGURE~
• """"""' Beds ll: ~;;s'"~ot Beds
} 0 .ol'\ller' Clay
C Re~~"<; s~ 11 c~.lf ) f3 ~' ~ceensano 1111 Ga..i'
[8 L""'e· G-eensand ) ~ Wea&C ~lay G ~as'"''JS Beds
C ~·,·::-e:• 3eds
LONG. 0'20'W
~! t.o·-ilrrllrrllrriirriiirrllmllmllnllrrllrr!lJ.IIT'.!rt:ff1~"";";Wl11"ttlm;r,nllnmnlrrllrrllrrlllmlta!l<mf fTTf fTTfiTTffTrifrrifrrli fmllmiiTIIITIIi,.,.li""R'""'"·""·'"r-r' ..,,~.,_
N
PLIOCENE
EOCENE
UPPER CRETACEOUS
LOWER CRETACEOUS SCALE • ~3--:
4 0 JURASSIC
?0 40Kms
SOURCE GEOLOGICAL SURVEY OF ENGLAND & WALES. 1909 Sheets 20 & 24
[2] Ht!JI Water Marl<
0 Blown Sand
tJa Alluvtum
I
r·-:J-_.
- 18 -
seen in section at the coast by the steps at Haddock's Rough
(TQ 884 124), to the south-west of Cliff End while at Cliff End
Point (T~ 888 132) a normal fault is exposed in the cliff of
Ashdown Sands (Edmunds 1935).
5) Browndown (SZ 585 985)
The Browndown site is shown in Figures 1 and 48. The site of
the boring by the Civil Engineering Department of Portsmouth Polytechnic
is south of Gosport in Stokes Bay. The core was taken from the
sea bed as part of an investigation by the department of the
structure of the sea bed in the Solent. Laboratory analyses were
carried out, at Durham, during 1980.
The range of Spring Tides at Lee-on-the-Solent varies from
1.56 m.O.D. at MHWS to - 2.04 m.O.D. at MLWS, giving a tidal range
of 3.6 m.
The geological background of the core at Browndown is not
discussed as it is the only underwater core in this study and the
precise details of the boring is not known.

- 19 -
CHAPTER 2
TECHNIQUES EMPLOYED
2sl INTRODUCTION
The sea-level studies in this work are carried out using
six traditional techniques; levelling, sampling, stratigraphic
analysis, pollen analysis, diatom analysis and particle-size
analysis. These methods are outlined below together with a
summary of their advantages and disadvantages in order to
assess/the reliability of results obtained and therefore, the
conclusions based upon the data.
2:2 LEVELLING
The boreholes used in this study were levelled to
Ordnance Datum (Newlyn), using a Kern Automatic Level, GKl-ACe
The sites were levelled to local benchm~rks with altitudes
obtained from the Survey Services Department of the Ordnance
Surveyo In some instances, temporary benchmarks were set up
where the distance to existing benchmarks was too great. These
temporary benchmarks were later levelled to Ordnance Survey
benchmarks"
The method of levelling employed in this study is prone to
errorso The readings are subjective and different readings can
be obtained from different operatorso Only one person took the
readings during this work and therefore this problem was overcome.
It is often difficult to see 9 and therefore to take accurate
readings from, the staff in windy and rainy weathero In most

- 20 -
cases these were the weather conditions prevalent during
levelling. Every site in this study had a very wet ground surface
which was not stable and therefore the accuracy of readings was
also impaired by the staff and level sinking into the ground. In
order to try and reduce this problem the driest ground was chosen
on which to rest the staff and level.
Closing errors were found at The Moors and Studland Heath sites.
These errors were equally redistributed over the change-points. At
The Moors, a closing error of 22 em was found over 44 change-points
which covered a distance of 5·5 km and an altitude range of 0.7 m.
The closing error at Studland Heath was calculated as 36 em from
90 change-points, with an altitude range of 10.9 m over 3.4 km. at
Yarmouth and Pett Level no closing errors were calculated as open
levelled transects were used. The borehole at Browndown was
levelled by the Civil Engineering Department of Portsmouth
Polytechnic.
? : 3 SAMPLING .MEI'HODS
The sediments investigated in this study are found in
chronologically, stratified seQuences, and so it is important to
preserve the sequence in situ v1hen sampling the material. To
achieve this, one of four methods of samplin;; can be used; 'I'he
Gouge sampler, the Russian-type sampler, the Percussion corer and
the Monolith tin, each of which is outlined below.
2:3:1 The Gouge Sampler
The Gouge sampler has the simplest design of all devices
used in this study. It is an open-chambered sampler, with a
- 21 ~
diameter of 2 em and a length of 1 m. Connecting rods of 1 m
length can be attached for deep samples.
The Go~ge sampler is p~shed into the ground man~allyo
When the req~ired depth is reached, the sampler is rotated
through 360° and lifted out vertically. The face of the material,
contained within the chamber is cleaned and the stratigraphy
can be recorded. This type of sampler is usually used for
preliminary investigations of the stratigraphy of sites, as the
material retained is too little for taking s~b-samples for
microfossil analyses.
There are a few diaadvantages to using a ao~ge sampler.
Contamination, from upper strata9 can occur as the s~mpling
chamber is not enclosed. This can result in misleading
positions of strata in the stratigraphy. This is demonstrated
at YBS 3, YBS 9 and St~dland Heath 4 {Figures 25, 26 and 20),
where adjacent boreholes were taken using the Gouge sampler
and the Perc~ssion corer.
The Gouge sampler was ~sed at Yarmouth, Studland Heath
and Pett Level. At St~dland Heath a~b-samples were taken from
the Go~ge sampler for microfossil analyses as no other sampling
devices were available.
2&3s2 The R~ssian-Type Sampler
The Russian-type sampler 9 first described by Jowsey (1966) 9
can be used either for stratigraphic investigations or for obtaining
material for laboratory analyses. The sampler is composed of a
movable sampling chamber, 50 em by 5 em, which can be rotated
through 180° against an anchored fin. Thus the Russian-type

- 22 -
sampler can only retrieve a semi-cylindrical core of sediment.
The sampler is pushed into the ground by hand. As soon as
the required depth is reached, the chamber is rotated against
the fin, thus enclosing the sediment. The sediment recovered can
be transferred to 50 em half-diameter plastic piping, which is
then sealed in polythene and stored in a cold-room until later
analyses.
Contamination of the samples is not so great a problem with
this device as the sampling chamber is closed until the right
depth is reached and the sample is enclosed during retrieval.
There is also less disturbance of the sediment in sampling. The
Russian-type sampler is best used for stratigraphy in the field,
or in the laborartory, as a large surface of material is exposed
on the fin. The one serious disadvantage of using this type of
sampler is that it is very difficult to use in stiff sediments
or when wood is encountered in the borehole.
This Russian-type sampler was used at The Moors and at
Yarmouth.
2;3s3 The Percussion Corer
The Percussion corer used in this work is a modified
Livingstone piston corer and percussion drill 9 as described by
Merkt & Streif (1970). The corer is used to recover large
samples for laboratory analyses 9 after a preliminary site
investigation has been carried out 9 either by the Gouge sampler
or the Russian-type sampler. The Percussion corer consists of
a movable piston in an open-ended sampling tube 9 1 m by 4.8 em
diameter. The sampling tube is pushed into the ground by the

- 23 -
vibratoro When the required depth for sampling is reached 9
the piston is held in place by a ~ire ~bile the sampling tube
is pushed on down until the piston reaches the top of the tubeo
The sample is held in place by auction. The whole sample tube
is removed from the ground by a jacko The ends of the tube are
sealed with polythene for transportation back to the laboratory.
The sample is removed from the sampling tube using an extractor,
which pushes the sediment out into a plastic tubing9 which is
then sealed and later stored in a cold-room.
Sampling with a Percussion corer ensures that no contamination
can take place as the sample is enclosed completely. The
vibrating action 9 as the tube is pushed into the ground, also
ensures that the material is not disturbed as it is sampled.
The material at the sides of the tube do suffer distortion 9 but
the material in the centre remains intacto It is difficult to
use this sampler in stiff sediments and it can not be used in
sandy sedimentso The piston can easily open too early and so
sample unwanted material and it can also open too late and so
miss the required material. The major disadvantage is that
compaction of the sediments can occur 9 either during sampling
or extractiono
The Percussion corer was used at The Moora 9 Y~rmouth
Studland Heath and Browndown.
2:3:4 Monolith Tins
The Monolith tin is composed of an aluminium alloy with
dimensions of 50 em by 10 em by 10 em. Monolith sampling can be
carried out either on a cleaned natural free-face or in a prepared

- 24 -
pit. In either case, the face has to be cleaned using a
spatula or trowel, before the sample can be taken. The Monolith
tin can either be pushed in by hand or hammered into the
sediment. The tin , once in place, can be dug out containing the
sampled material and sealed in polythene. When consecutive
samples are required, the tins are placed with an overlap of at
least 5 em, to ensure a true sequence of stratigraphyo
A large amount of material can be retained in a Monolith tin,
which can be useful for stratigraphic analyses and for
radio-carbon dating. It is very important to keep the Monolith
tin vertical when sampling.
Monolith tins were taken at Pett Level from pits dug in the
foreshore.
All the methods of sampling sediments described here have
their own advantages and disadvantages and it is good practice to
use at least two methods together at one site to ensure that a
true stratigraphic record is obtainede
2:4 STRATIGRAPHIC ANALYSES
A Percussion corer 9 a Russian-type sampler 9 a Gouge sampler
and Monolith tins were used in this etudy 9 as already described.
In most instances the stratigraphy was recorded in the field, in
order to determine the two-dimensional pattern of strata9 using
the notation proposed by Troels-Smith (1955). The borehole with
the deepest organic strata were then re-sampled for laboratory
analyses, using either the Russian-type sampler or the Percussion
corer. At most sites a grid pattern of boreholes was employed
- 25 -
although this was not always possible.
Each stratum of the core is labelled with depth, in centimetres,
from the top of the core and assigned a number from the base
upwards. The strata are dealt with separately and are described
using the three-part scheme of Troels-Smith (1955).
The first part of the description deals with the component
parts of the stratum; the nature of the material and the
proportions. Seventeen component parts are described within the
scheme, which are divided into five main classes. Table 2 shows
these divisions. Not all of the seventeen parts were employed in
this work. The Limus detrituosus (Ld) terminology was dispensed
with as it was found to be too difficult to distinguish from the
Substantia humosa (Sh) component, as a result the latter was used
throughout. The proportions of these component parts are defined
on a five-class scale; 0 denoting an absence of and 4 denoting a
maximum presence of each component part.
For example, at The Moors site stratum 6 of Moors l is
described as:-
Ag 1 9 As 39 Ga + 9 Lf +9 Db +o
This indicates that approximately 25~ of the stratum is composed
of silt particles 0.06 - 0.002 mm (Ag) and approximately 75~ are
ol83 particles <0.002 mm (As). Also present are traces of mineral
particles Oo6 - 0.2 mm (Ga) 9 particles of non-hardened rust <Ool mm
(Lf) together with fragments of herbaceous plants <2 mm (Dh)o
The second part of the description deals with the physical
properties of the stratum; the tone density, structure 9 elasticity 9
and degree of dryness 9 together with an indication of the

- 26 -
~able 2 Component Parts of Troels-Smitb Stratigraphic Classification
I Turfa
Sb Substantia bumosa
Tb0-4 !•bryophytica
Tl 0-4 !•lignosa
Tb0-4 !•herbacea
Humous substance, homogeneous microscopic structure.
Mosses +/- bumous substance.
Stumps, roots, intertwined rootlets of ligneous plants +/trunks, stems, branches.
Roots, intertwined rootlets, rhizomes of herbaceous plants +/- stems,leaves etc •
._---------------+-------------------·-·---II Detritus
Dl B_.ligncsus
Db ~.berbosus
Dg B_.granosus
III Limus
Ld0-4 ~.detrituosus
Fragments of ligneous plants >2mm.
Fragments of herbaceous plants '2mm.
Fragments of ligneous & herbaceous plants < 2mm > O.lmm.
Plants & animals(except diatoms, sponge needles, siliceous skeletons of organic origin). Particles< O.lmm +/- bumous substance.
Lao ~.siliceous organogenes Diatoms, sponge needles, siliceous skeletons of organic origin. Particles ~ O.lmm.
Lc ~.calcareus
Lf b_.ferrugineue
IV Argilla
As !• steatodes
Ag !•granosa
v Grana
Ga _2.arenosa
Gs G.saburralia
Gg(min) Q.glareosa minora
Gg(maj) G.glareosa majora
Marl, not hardened like calcareous tufa, lime etc. Particles< O .. lmm.
Rust, not hardened. Particles< O.lmm.
Particles of cla_y < 000v2mm.
Particles of silt 0&06 - 0.002mm.
Mineral particles 0.6 - 0.2mm.
Mineral particles ~.0 - o.6mm.
Mineral particles 6.0 - 2.0mm.
Mineral particles 20.0 - 6.0mm.
Sourcea Troels-Smitb 1955·
I

- 27 -
sharpness of the boundary between the stratum in question and
the one immediately above. These properties are again defined on
the five-class scale (0 - 4) and are outlined in Table 3.
Table 3 Physical Properties of Troe1s-Smith Stratigraphig Classification
I Ni£Or (Nig) degree of darkness
II Stratificatio (Strf) degree of stratification
III Elastici tas (Elas) degree of elasticity
IV Siocitas (Sicc) degree of dryness
v Limes su~erior (Lim(sup)) sharpness of upper boundary
Lim 0 boundary area > 1 em. Lim 1 boundary area< 1 em and .., 2 mm. Lim 2 boundary area < 2 mm !:Llld >1 mm. Lim 3 boundary area < 1 mm and '0·5 mm. Lim 4 boundar.v cu-ea -<0.5 mm.
Source: Troels-Smith 1955·
For example, at The Moors site stratum 6 of Moors 1 is described
as:- Nig 2-, Strf 0, Elas 0, Sicc 3, L(s) 0.
This indicates that it is a medium-toned stratum with no structure
or elasticity, which is found below the water-table, with no
definite upper boundary.
The third part of the description is a verbal account of
the stratum. Thus the complete description of stratum 6 of Moors 1
can be shown as:-
6) 26 - 65 cmo
Ag 1 9 As 39 Ga +9 Lf +9 Dh +o
Nig 2- 9 Strf 0 9 Elas 0 9 Sicc 39 L(s) Oo
Gre.v silty-cl~ with iron-staining, traces gf sand and herbaceous plant remains.
Once the strata of the core have been described, the
stratigraphy can be recorded graphicall.Y· In the present study 9

- 28 -
the method of graphic representation proposed by Troels-Smith is
not employed as it was found too difficult to stencil the symbols
clearly in a small area without them becoming confused. The
original symbols of Troels-Smith are used but in a simpler scheme
with four symbols to a line, representing the five-class scale.
The advantages of this system of classification of borehole
strata are numerous. A standardized system of description is
possible which will distinguish each stratum from another simply,
where-in the elements of the stratum are described separately and
also in combination. This system can be used either as a rough
guideline or as a more precise classification.
The main drawback to using the Troels-Smith classification
is the possibility of a lack of consistency. As all descriptions
are subjective and non-quantitative 9 variations can occur between
cores and operators. It is however, consistent within each core
for one operator. In general, the advantages of this classification
outweigh the disadvantages. All the stratigraphic analyses of this
study are compiled according to the system described here.
2&5 POLL~ ANALYSES
2:5:1 Introduction
Palynology is the study of the structure and formation of
pollen grains and spores 9 together ~ith an investigation of
their dispersion and preservation under different environmental
oondi tiona. Fossil pollen was first desori bed by Gop pert
(1836, in Faegri & lversen 9 1~64) in Pre-~uaternary depoaits 9
and by Geinitz (1887; in Faegri & Iversen 9 1964) in Post-Glacial

- 29 -
deposits. The first pollen percentage calculations were done
by Lagerheim (19051 in Faegri & Iversen, 1964) 9 although these
calculations cannot be regarded as accurate indicators of past
environmental conditions. The first modern pollen percentage
analyses were carried out by Von Post {1916; in Erdtman, 1943).
The science of pollen analysis has dominated investigations of
Late-Quaternary development of vegetation and climate since the
Mid-Twenties.
The pollen grains are formed in the anther of the flowering
plants, and are released in great numbere 9 by some anemopholous
taxa, during the flowering season. The pollen grain is made up
of three concentric l&¥ers; the inner cytoplasmic material, the
middle intine and the outer exine. If the pollen gr~in fails to
reaoh the stigma of another plant, both the cytoplasmic interior
and the intine will perish, leaving the durable exine to survive.
The exine is also made up of l&¥ere; the inner endexine and the
outer ektexine. Both these l~ers are composed of sporopollenin,
which is a very durable and slow to decompose material. The
endexine is an homogeneous, continuous membrane with few
morphological developments, except those which are connected with
apertures. The ektexine however, is composed of small radial
rod-like elements, which give the exine its morphological
variability; the structure of the exine. The sculpturing of the
exine consists of the external features 9 which are sometimes
independent of the structure. It is the combined structure and
sculpturing of pollen exines 9 together with their shape and the
type, and arrangement, of the germinal apertures that gives each
pollen grain distinct diagnostic features. Most pollen grains
possess germinal apertures in the exine, through one of which 9

- 30 -
the pollen tube will eventually grow. These apertures consist of
furrows (colpi) and pores (pori). The colpi are the primitive
stage before the pori developed. 'l'hese apertures can occur as
colpi~ pori or a combination of both.
2:5:2 Extraction of Pollen
Before the pollen in a deposit can be identified and counted,
it must first be concentrated and isolated. This is done by a
series of physical stages and chemical digestions, including
deflocculation, removal of extraneous material and finally,
embedding the prepared sample in a suitable medium to facilitate
counting. The chemical and physical stages are outlined in
Appendix I. It was thought best to embed the samples in silicone
fluid, as this has a low refractive index and does not change the
size of the pollen grains. It is also useful in that the grains
can be rotated under the coverslip, which aids identification.
There are problems encountered during pollen preparation. Pollen
can be lost by decanting supernatants too soon or by insufficient
centrifuging. Pollen can also be lost during the sieving stage of
preparation. One must always make sure that all the equipment used
is thoroughly cleaned or contamination, either by fossil or modern
pollen, can occur.
2:5:3 Pollen Counts
The pollen is counted using a microscope with a mechanical
stage, which enables traverses of the slide to be made at regular
intervals; in this case intervals of 1.5 fields of view were used
throughout the work. Identification and counting was carried out
at x400 on a Zeiss binocular microscope, but where gruinu naeded

- 31 -
closer attention, an oil immersion lens was used at xlOOO. The
pollen was identified with the aid of pollen keys of Faagri &
Iversen (1964) and Moore & Webb (1978) and also a comprehensive
reference collection. Once identified, species were recorded on
a count sheet until the required pollen sum was achieved.
2:5•4 Pollen Sums
Before choosing a pollen sum, the objectives of the study
must be defined; in this case to elucidate the local and regional
changes in vegetation associated with a rising, or falling, sea-level,
and also to assess the relative chronology of the deposits. The
usual method of expressing pollen data is the frequency of each
taxon, expressed as a proportion of a fixed sum. Von Post (1916)
initiated counting to a pollen sum of 150 trees. In most cases
this is thought sufficient, but it must be remembered that changes
in the frequency of one taxon causes changes in another. Thus if
a taxon is found to be local to the site, chunges recorded in it
may result in changes in the pollen frequency from the non-local
pollen. It is best, in such cases, to separate and eliminate the
local pollen taxa from the pollen sum, especially in studies of
regional vegetation change. Two basic methods of representing the
pollen data were employed during this study. Taxa were either
expressed as a percentage of the total arboreal pollen (rAP) plus
life form or taxonomic group ie. IAP + Shrubs, IAP + Herbs,
rAP + Aquatics and IAP + Spores or expressed as a percentage of
the total land pollen (TLP) plus group ie. TLP + Aquatics or
TLP + Spores. Confidence limits of 95~ were imposed upon the data
using a program written by Vr. I. Shennan (Department of Geography,
University of Durham); NEWPLOT. The confidence limits enable

- 32 -
one to see real changes in percentage fluctuations, which would
otherwise be unnoticed. Pollen sums for each site will be dealt
with in the relevant sections.
2:5:5 Pollen Diagrams
It is normal to represent the data of pollen counts in
diagrammatic form. Pollen frequencies are indicated on the
ordinates and the sampling level and depth below the surface on
the abscissi, together with an indication of the stratigraphic
column of the sampled core.
Pollen diagrams are usually divided into pollen zones, each
of which should be independent and have uniform characteristics.
The zone boundaries are subjective and are placed where there are
sudden changes in pollen frequencies. Godwin (1940) constructed a
system of zones which was considered representative of the whole
of Southern Britain. This system was based on fluctuations of
tree pollen, but became associated with climatic periods,
eg. Zone VIla was associated with the Atlantic Period, which was
warm and wet. The idea of synchroneity of pollen zone boundaries
was criticised by Smith & Pilcher (1973) and Moore & Webb (1978).
E.J.Cushing (1967) applied the term assemblage zone, a term used in
solid rock geology. These assemblage zones are delimited entirely
on the basis of internal characteristics of the site where the study
was first made. Local assemblage zones may be tentatively
correlated with the pollen zones of Godwin (1940) 9 subsequently
dated at Scaleby Moss (Godwin, Walker & Willis 9 1957), in order
to assess a relative chronology of the site.

- 33 -
2a5a6 Interpretation of POllen Diagrams
Before interpretil}g a pollen diagram, with regard to
local and regional vegetational changes 9 we must first consider
a number of factors.
viz. 1) Origins of fossil pollen
2) Dispersal of pollen
3) Productivity of pollen
4) How representative of environmental change
is the pollen?
1) Origins of fossil pollen
This concerns the initial origin of the pollen. Rempe
(1937J in Faegri & Iversen, 1964) showed that pollen is carried
upward in thermal winds during the day, but falls rapidly during
calm nights. Some of the lighter grains mBJ" remain in the lower
air currents to be carried upward again the next day. F a.gri
& Iversen (1964) state "Enormous quanti ties of pollen are
liberated, float in the air for shorter or longer periods, and
are eventually sifted out over the surroundings &.s the dense and
even pollen rain". This is a simplistic view and does not take
into account meteorological controls on pollen dispersal.
Tauber (1965) set about constructing a model to include such
factors as wind velocity and turbulence. He showed that pollen
deposition at sites is of a composite nature, In forested areas,
at least three components must be considered; pollen transport in
the trunk space 9 above the canopy and pollen brought down by the
rain. Pollen grains carried through the trunk space originates
within hundreds of metres, pollen above the ownopy reflects a
distance of several kilometres, while rain components reflect

- 34 -
more regional originso This model has since been revised by
Tauber (1971) to show that the trunk space component originates
within 200m, the canopy component within 1000 m and rainout 2-400 m.
Pollen is also susceptible to water transport either via
rivers or the sea (Pennington 1970)• It is best to carry out a
study of the contemporary pollen rain of a site, in order to
understand all the factors involved in the origins of pollen
rain.
2) Dispersal of pollen
The w~ in which pollen is transferred from the anther to
the stigma of plants is of great importance in the interpretation
of pollen data. There are basically four types of pollination:
The hyp-hydrogamous species of plants are pollinated underwater
eg. Zostera, but as the pollen grains have no exinea, no remains
m~ be found in deposits. The obligate-autogamous plants flower
after fertilization has taken place within the flower and so, no
pollen is liberated. Entomophilous plants have their pollen
transferred from anther to stigma by carriers such as animals,
birds or insects. Some of these species only release their
pollen for specific carriers and therefore are under-represented
in the pollen rain. These pollen grains usually have a heavily
sculptured exine. Some of the entomophilous plants can produce
large quantities of pollen eg. Tilia and Calluna. Thus the pollen
of entomophilous plants is likely to be more of a local type in
origin as the grains are not designed for long-distance transport.
The most important type of pollen grain in fossil pollen studies
is that of the anemophilous plants. These grains are dispersed
by wind action and can be carried for long distances. Erdtman

- 35 -
(1921) considered that pollen which has been carried long
distances could have originated 200 to 1500 km awQ¥ from the
site of deposition, whereas Rudolph & Firbas (1927J in Faegri
& Iversen 9 1964) considered the distance to be nearer to 20 km.
It follows that pollen from these types of plants will be carried
long distances and so will make up the regional component of the
pollen rain.
It must be remembered that pollen can also be of a secondary
nature, either reworked from erosion contacts or washed into the
site by rivers.
3) Productivity of pollen
Hyde (1950) did a study of pollen rain in Great Britain
including dQ¥ to day variation and place to place variation. The
productivity of pollen from different species of plants varies
enormously, as does the flowering time of the plant. Entomophilous
species usually produce less pollen eg. Acer produces ~.1000 grains
in an anther. Anemophilous species produce great numbers of
pollen grains as many are 'lost' eg. Betula produces ~.10,000
grains per anther. Hasselman (1919; in Faegri & lveraen 9 1964)
found that the Spruce forests of Southern and Middle Sweden
produced ~·75 9 000 tons of pollen per year. Hedera and Corylus
are found to produce pollen early in the year whereas Lonicera
produces late~ this can also affect pollen deposition. Table 4
shows pollen productivity of different species according to
three authors.
Differences of pollen productivity can lead to over
representation of species in the pollen rain. Davis &Deevey (1963)

- 36 -
Table 4 Pollen Productivity of Main Tree Species ( in
decreasing order of importance)o
Fsegri & Iversen (1950)
Pinus, Betula, Alnus
Pice a, Quercus, Fraxinus, Fagus
Tilia
Jonassen (1950)
Pinus, Betulaj Alnus, g.uercus
Fagus
Picea
Andersen (1976)
Pinus, Betula, Quercus, Alnus
Car!!inus
Ulmus, Pice a
Fagus, Abies
Tilia, Fraxinus ---------
Table 5 R-~atio Values for Main Tree Species.
Iversen (1947)
Pinus, Betula, Alnus 1 4
Pice a, guercusp Fraxinus, Fagus 1 X 1
Tilia 1 X 2
Jonassen (1950)
g,uerous 1 5 Betula, Alnus 1 . 4
F~us 1 X 1 ---
Andersen (1976) -------
Pinus, Betula, Quercusp Alnus 1 4
CarEinus 1 - 3 Ulmus, Pice a 1 . 2
F!!a:us, Abies 1 X 1
Tilia, Fraxinus 1 X 2

- 37 ~
proposed a method to allow for the differences between species,
with respect to their dispersal efficiency and productivity.
Her idea was to c&l.culate a correction value, called the R-ratio
where&=
R(a) • ~ pollen of species (a) % representation of species (a) in vegn.
Using R-ratio values, species can be represented realistically by
correcting the pollen percentage by the relevant R-ratio value.
A number of authors have calculated tables of R-ratio values and
some of these can be seen in Table 5 • Variations are seen
between these sets of calculations. It must be stressed that
these are calculated for specific sites and therefore must only be
used for these areas. If correction factors are to be employed,
they must be calculated with regard to the site under investigation.
Another factor which might influence the representation of
the pollen in a deposit is the differential destruction of some
pollen grains. Corrosion can occur in aerated peats at, or above,
the water-table. Obviously corrosion and destruction of grains
will alter the composition of the pollen spectrum. An additional
cause of misrepresentation of true pollen in a deposit is the
tendancy for pollen grains to be moved around within soil profiles.
This especially happens in podsola where grains ma3 be leached
downwards through the horizonso
4) How representative is pollen of environmental change?
In the interpretation of pollen diagrams 9 it is assumed that
the vegetation reflects the environmental conditions at the time
of deposition. It is known that each plant has optimum needs for
many different ecological variableso Therefore 9 the factor that
is in the shortest supply will affect the distribution of the planto

= 38 -
This is Liebig's Law of Limiting Factors. In the cool and moist
climate of North-West Europe, the moisture content of the
atmosphere is sufficient to allow free plant growth, but the
temperature is too low for optimum development of some species of
plants, and so vegetation will reflect temperature changes in
this environment. It must be remembered that plants respond very
slowly to temperature change. Iversen (1944) regarded Viscum,
Hedera and !lex as climatic indicators as they were particularly
susceptible to frost, but Troels-Smith (1960) has shown that
Viscum and Hedera were important fodder crops in Prehistoric
cultures and therefore, decreases in these taxa do not necessarily
mean that there vas a decrease in temperature.
When interpreting pollen diagrams all these factors must be
considered. Overall, one must be wary when drawing conclusions
from pollen diagrams. The information gathered must be combined
with other investigations, such as diatom analyses and macrofossil
studies.
2&6 DIATOM ANALYSES
2g6al Introduction
The term 'Diatomaoeen• was first used in 1786 by O.F.MUllero
Studies of diatoms were more common in Scandinavia in the Early
Nineteenth Century than in Britain. Diatoms were first mentioned,
in Sveden 9 by C.A.Agardh (1824) 9 and the first major work
there was by P.T.Cleve (1868), in which 189 species were
described. The subject was first noticed in Britain when W.M.Smith
published his 'Synopsis of British Diatomaceae' in 1853-1856.
These two volumes described 466 species. A major contribution to

- 39 -
the study of diatoms was made by A.Cleve-Euler who compiled
'Diatomeen von Schweden und Finnland', (1951-1955)· This work
comprised five volumes of data on taxonomy, ecology and
geographical distribution, with 1600 figures. Van dar Werff &
Hula (1958-1974), in Holland, and Hustedt, (1927-1962), in
Germany, also produced works of great importance to the study of
diatoms.
Diatoms are unicellular plants which can photosynthesize.
A rigid skeleton of hydrated silica, the frustule, surrounds the
cell. This frustule is made up of two halves, or valves. The
classification of diatoms is based on the shape and differences
in the structure of the frustule, which can be highly variable.
Apart from the taxonomic classification, diatoms can be
classified according to their biological distribution and salinity
requirements. Three main biological groupings are found;
benthonic forms (b) live in the bottom muds of the oceans, rivers
and lakes, epiphytic forms (e) live attached to a substrate such
as other algae, plants or mineral particles and planktonic forms
(p) live in the photic zones of water masses, where they move with
streams and currents 9 usually in colonies. There are other
sub-divisions of the biological distribution of diatoms. Forms
that can live on the bottom and in the plankton (bp) which are
counted as planktonic forms, diatoms which live as epiphytes and
are in the plankton (etpl) and forms which can live as epiphytes
or on the bottom (lble). The latter two are counted as epiphytes
and are more common than the (bp) forms. The salinity
classification of seven groups, by Van dar Werff & Hula (1958-1974),
was used in this work and is outlined in Table 6 •

= 40 -
Table 6 Salinity Classification of Diatoms
(after Van der Werff & Hula, 1958-1974)
Grouping Chloride ion concentration
J4 Marine >17,000 mg Cl-/
MB Marine/Brackish 10,000 = 17,000 II
BM Brackish/Marine 5,000 - 10,000 II
B Brackish 1,000 - 5,000 II
BF Brackish/Fresh 500 - 1,000 II
FB Fresh/Brackish 100 - 500 II
F Fresh < 100 II
2:6a2 Extraction of Diatoms
1
The samples for diatom analyses were treated with 30~
hydrogen-peroxide, to remove any organic material (see Appendix 11).
Two drops of sample were placed on a coverslip (22 by 40 mm) and
left to evaporate on a warm plateo A small amount of Microps 163
mountant was placed on a slide and heated until most of the
solvent, xylene, had evaporatedo The coverslip was then mounted
on the slide, any excess mountant being removedo
2!6:3 Diatom Counts
The diatom slide ~as counted using a Zeiss binocular
microscope at x400 for routine counting and at xlOOO, using an
oil immersion lens, where identification was difficulto The
slide was traversed using a mechanical micrometer stage, with
traverses lo5 fields of view apart 9 at x400o A count of 200
diatom valves was thought to be sufficient 9 but this was not
alv~s possible where levels were poor in diatom remainso As
frustules are rarely found complete 9 each single valve was counted
as one unit and therefore only represents half the number of

- 41 -
frustules present. Only relative counts were made as absolute
counts were deemed unnecessary in this work 9 because only an
indication of the water-type prevalent during deposition at the
site was needed. Identification of the species was aided by the
use of Cleve-Eu1er (1951-1955), Hendey (1964) 9 Miller (1964) and
Van der Werff & Hula (1958-1974). The nomenclature follows that
of Cleve-Euler (1951-1955)·
2a6a4 Diatom Sums
There are a number of w~s of expressing diatom data. The
frequency of species ~as expressed as a percentage of the total
valves counted for the main diatom diagram. The summary diagrams
were constructed using ratio calculations. The ratio of Marine:
Brackish a Fresh types were calculated for valves, benthonic
valves, species and benthonic species. More detailed calculations
were carried out for the valves and species using the seven salinity
groups M9 MB, BM, B9 BF, FB and Fo Two further calculations were
performed to express the valves and species as r~tios of b a e : p
forms. The diagrams were zoned with reference to floristic
changes in diatom assemblages.
2a6:5 Interpretation of Diatom Diagrams
When interpreting diatom diagrams it must be remembered
that the changes in the composition of the diatom flora are more
important than the changes in individual species. The changes of
diatom flora are closely connected with changes in the sedimentation
of the deposit and thus, indirectly reflect changes in water and
climatic conditions at the time of deposition. Each habitat type
~ill reflect a different diatom assemblage 9 but because of the
environment ie. water, the diatoms recovered from Sallipled
levels m83 be confused by inwash of other assemblages from
different environments. The diatoms of estuaries may well
fluctuate in composition, due to the influence of tides and
weather conditions together with changes in river discharge.
one must also remember that like pollen, diatom valves can be
reworked from older sediments. Thus great care must be taken
when interpreting diatom diagrams.
2z7 PARTICLE-SIZE ANALYSES
The particle-size analyses were carried out using the
dry-sieving and sedimentation processes of the British Standards
Institute Handbook 9 BS 1377sl967. Samples of approximately 30 g
were taken from the inorganic strata of the cores and were first
air-dried and then weighed. Analysis, using the test described in
Appendix III was then performed. The results of the test expressed
the original samples in proportions of gravel, coarse sand, medium
sand, fine sand, coarse silt, medium silt, fine silt and cla3. The
gravel and sands were determined by the dry-sieving, the medium
and fine silt together with the cl~ were determined by the
sedimentation and the coarse silt fraction by calculation. In this
w~, the coarse silt can easily be over-represented as aD3 loss
of material, during testing, will be encorporated into the coarse
silt fraction by calculation. Particle-size analyses were done
at Browndown 9 Yarmouth and The Moors.

- 43 -
CHAPTER 3
BIOSTRATIGRAPHIC AHD LITHOSTRATIGRAPHIC ANALYSES OF SITES
3:1 THE MOORS
3:1:1 Stratigraphy
The Moors is situated on the Arne Peninsula, to the east of
Wareham, in Dorset (Figure 6). It is bounded to the north by a two
metre high sea-wall, which protects the site from flooding at the
mouth of the River Frome. To the east the land rises to + 25 m.O.D.
at Arne Village. The site is drained by an extensive system of
dykes and ditches which probably date from Roman times. A large
east-~est dyke traverses the site. To the south of this dyke, the
land is wet and marshy but to the north it is well drained and
grazed by cattle.
Fourteen boreholes were investigated at The Moors (Figure 7)
in two transects. The first transect comprises of M 1 (SY 9493 8663)
to M 10 (SY 9491 8727). These boreholes were taken at 50 m intervals
up to M 6. M 7 to M 10 were taken at 100 m intervals. The second
transect was taken parallel to the first and consists of four
boreholes M 11 (SY 9510 8689) to M 14 (SY 9512 8666). These last
four boreholes could not be taken at regular intervals due to the
intervening ditches. The ground level at these fourteen boreholes
was calculated after redistributing the levelling closing error of
22 ern. It varies from + 0.37 m.O.D. to + 0.11 m.O.D. All boreholes
except M 7 to M 10, were taken using the Russian-type sampler as
described in Section 2:3:2 and the stratigraphy was recorded in the
field. The remaining boreholes were samfled with the Percussion corer
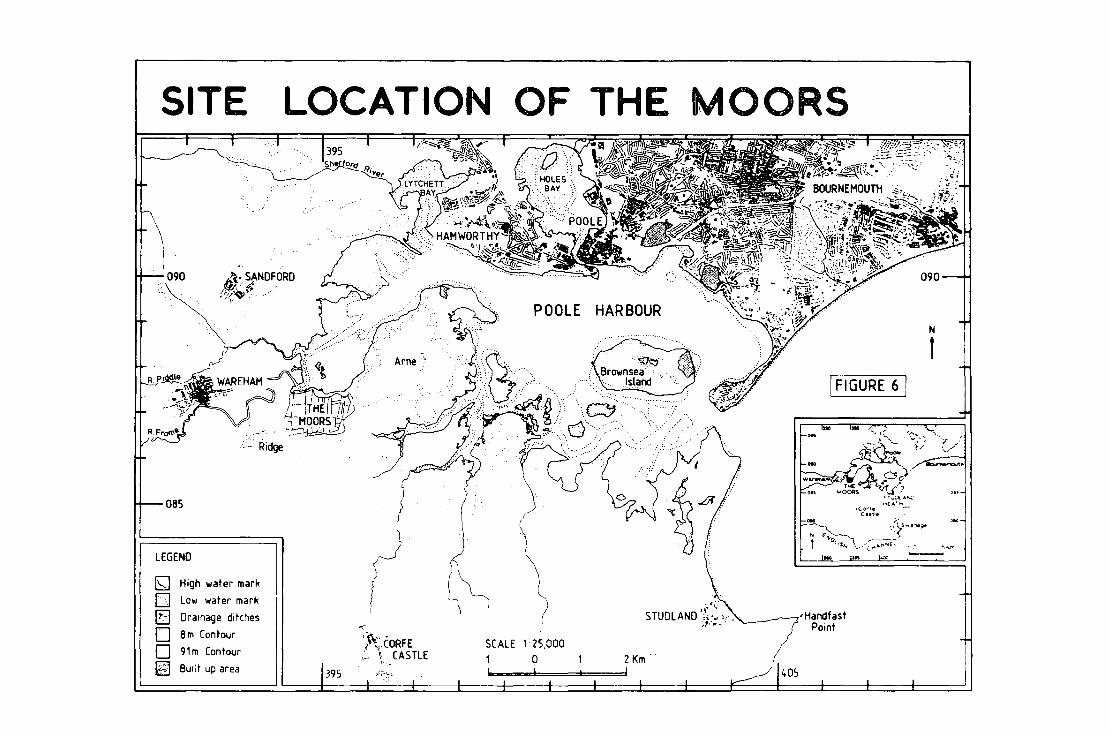
SITE LOCATION OF THE MOORS
LEGEND
,t~:-~NDFORD ;:?{<tt · .. __ ..
EJ High water mark
[] Low water mark
~ Dra1nage ditches
0 8m Contour
0 91m Contour
ill) Built up area
POOLE
<:
·~·· < ,.CORFE .. :... \ .. CASTLE
\~ ...
SCALE 1 25,000 0 1 2 Km ·
405
N
f [fiGURE 6J
r"'G<'s~v ...
Handfast Point
•Co.-t• Cuu ..
-/~s~ .... ~ _...·(..,...t>.f'INE• ~._,...

1 FIGURE 7) THE MOORS SITE (BOREHOLES)
FMJS ----LEGEND
(!) Borehole
Ill Borehole (microfossils examined)
0 Temporary benchmark
IS] High water mark
121 Protective dyke
5!] Drain
I:JPond
EJ Marsh
EJ Saltongs a Rough grassland
6J Furze It-~·
@ Scrub
@ Non-conoferous trees
0 ConoferO<Js trees II 1945
~~~00 D o0
\~~:y ~~"· eM9 ·
-~J· {
mud
0 -·-- 875
~:eMS l_l - -t M 7 \ I I i I --::/ 870)~ / THE - \ \. J o/ ••
~ . 0 0\
MOORS 11-h' I 7: -- .. ~;- 0 .. __ .. Q" ,4- 0 : - QQ •
i _~II ~ .• • . . ~ a a II -- f!:,.O • o • ~ oo oo
I I ~M12 •• f/ - ~., ; , It' - o 0
o : 0 ·O •M4 1 -_ r--t:---~-E . 0 c 0 0 o o ~-• ~ • .. • '0 0 0 • M 3 • M 13 =- •. --- o .,__ • , ~ 0 , . :- o ;
Q i.......__j.______ Q --ARNE 0 ' 'Q ' t • M 2 M 14 _.,_ _.,_ --n io o . ~ , o •• o-
M1 _ ~....,. -..__2 ...c~ -~ oO o __ --,..,_...-:1....... ~ - ~ / 0 0 ~-o•\- ~-.., __ , • 0
... ,·tb~~ ... a)!l ~ "'""!!!'- - ~"? ... - -==-:~:::..________~-=--- ·-_
. .. --- -:.:- ~r~e..,-~!I~CI . 0 SCALE 12500
100 0 100 Q
.,.,.
200M 950

- 44 =
(Section 2s3t3) and the samples obtained were taken back to
Durham for analyses.
In general, the stratigraphy of The Moors can be divided
into three predominant strata (Figure 8). A lower inorganic
stratum, present in nearly all boreholes, underlies an organic
stratum which in turn underlies an upper inorganic stratum. This
pattern can be seen in all boreholes.
The lower inorganic, or clastic, stratum reflects the
presence of the local bedrock, Bagshot Beds. It ranges in
composition from coarse gravels and sands at M 10, through sands
at M 9 and M 8, to finer sediments of clays and silts towards the
landward side of the site. It is difficult to assess the depth of
these deposits as it is not sampled completely in all boreholes,
but at M 9, 2.67 m was recovered. It does not appear in the
stratigraphy of M 4 and M 5 as it was reached but not sampled.
The organic stratum which overlies the basal inorganics wus
found in all boreholes. The composition of these beds does vary
but in general can be said to be an herbaceous peat changing to
Phragmites peat towards the sea. The altitude of the peat deposit
varies enormously from - 2.29 m.O.D. at M 12 to - 0.46 m. O.D. at
M 9· The depth of this ranges from 13 om at M 9 to 176 em at M 14.
This depth increases eastwards and southwards.
The upper inorganic deposits appear in all boreholes except
M 10. The altitude varies from- 1.02 m.O.D. at M 12 to - 0.04 m.O.D.
at M 14. These deposits consistp in the main, of two grain-size
fractions; a lower silt and clay Underlies an upper silty-clay.
The lower coarser stratum extends from M 1 to M 9 and from M 11

,-
THE
m.OO. •0 5
0-
-o s
·1·0-
-1.5
•0 s
0 -
-0 s
-1 o-
-1.5
-2 0-
-2 5
MOORS- STRATIGRAPHY
H1 M2 M3 M4 M 5 R R R R
SY 9493 8663 SY 9493 8668 SY 9493 8673 SY 9493 8678 SY 9493 8683
~~
//. .. .. .. .. .. .. :0.1'i
~ t.•t.•
~~ ; ; :
1---··
~';; ;i . : ; ~I -·-·1 -~: =~
M 14 R
SY 9512 8666
~
~ :-~ ...... , ...... l•r..•t. 1' ... I~~~~ I~~~~ ... 1 ....
1:::;
1
: : : ~
•&.•• ·-·-• ., ."f\"\:"rLI
H13
SY 9511 8672
?Ti r--~~-,
~ .•. L • . ..
JL•L•
I~~~.
.,.,
I. ~; ~
·-·
.
~ . ... .. .. ... . ...... .. .... , . ... .. ...... ...... ...... ...... . ~~~
. J
1
·- :1
-' ~
M 12 R
SY 9511 8680
~ f:({~ -~7~7: ...... . ..... ...... . ..... ...... ...... ...... . .. ... ...... ' ... ' ~ 1-:-~ ~ ~ ~~~~-
~·::
--..
M 6 R
SY 9492 8692
M 11 R
SY 9510 8689
ff0 ..
M 7 M 8 PO PO
SY 9491 8702 SY 9491 8707
.. . .. ..... ' ' ..! H ·r.m .... . ....
~~;.1 r·~?;l --· ·-•--< --- _,_.; ~ -- . - ' _, -·- _,_, ::: ~ <" .. -.;:':. .1-.. -::1 .... . -- ..... .
•••L;
LEGEND
[8] Th.
... •t.Lt.
Lt~~~-·-,_. L•!
[8] Th !Phra I
[] Sh [::} Dh
t.~ Dl [] Ag
~ As
~ Ga CJ Gg !min I
0 Gglma)l
!IiQUi!E:~J
M9 PO
SY 9492 8717
~0 R
I
I:: ~:I
',
M10 PO
SY 9491 8727
M . ' ' ~
Fl~ r,; ~ -'''
------
mOO •0 s
~ 0
-0 s
f-., 0
-1 s
f- -2 0
·2 s
'- ·3·0
I~ u [28 Str. conf
·~· L1m.112
StratigraphiC symbols aftor
Tree is -Smith, 1955
[O! Borehole exam1ned for m1crofoss1ls
R =Russian sampler, P =Percussion cortr
0 0 5m Vrrt1cat Suit
0 ____ 50m Homontal Scalo
FMJ':.

- 45 -
to M 14, attaining a maximum depth of 73 em in M 3 and 98 em in
M 12, it thins to 1 em in M 9· The finer silty-cle3 does not
appear in all boreholes. It can be seen in M 1 and M 4 to M 9
and M 12. Its maximum depth is 48 em in M 5· Again this thins
out towards the sea.
Although the general three-layered stratigraphy of lower and
upper inorganics with an intercalated peat holds true for the
two transects, there are exceptions at M 4 and M 10 9 where two
peat bands are found. At M 4 a lower organic stratum of 77 em
passes upward, through a transitional le3er, to a clayey-silt,
which is 17 em deep. An upper organic stratum of 13 em is found
above this clayey-silt. The altitude of the lower and upper peats
is - 1.88 m.O.D. and - 0.88 m.o.D. These strata are thought to be
true lithological strata and not the result of contamination, as
depths found suggest true strata and contamination was kept to a
minimum by use of the Russian-type sampler. Although no adjacent
boreholes show any indications of a second organic stratum, it is
interesting to note that the organic band in M 5 is mainly a
transitional silty-peat, with only 14 em of true herbaceous peat
found at the base. The stratigraphic configuration of M 10 will
be described in the next section.
Boreholes M 1, M 89 M 9 and M 10 tiere sampled with the
Percussion corer and taken back to Durham for analyses. These
were chosen as the organic strata were above sands and so the risk
of compaction of sediments tsas mi.nimum 9 •also the ground surface
was less wet and so sampling was easier. The stratigraphic
succession of these boreholes is given below.

- 46 -
The Stratigraphy of Moors 1·
Stratum Height Depth Description
m.O.D.
7) +0.24 to
-0 .. 05
6) -0.05 to
-0.40
5) -0.40 to
-0.54
4) -0.54 to
-0.69
3) -0.69 to
-1.15
2) -1.15 . to
-1.16
1) -1.16 to
-1.22
em
0 to 29
29 to 64
64 to 78
78 to 93
93 to 139
139 t~
140
140 to 146
Not sampled
Ag 1, As 3, Db + 9 Lf +· Nig 29 Strf 0, Elas 0, Sicc 3, L(s) 0. Light-grey silty-cl~.
Ag 2-, As 2+ 9 Db +9 Lf +. Nig 2, Strf o, Elas o, Sicc 3, L(s) 0. Grey silty-el&¥ with iron staining.
Ag 1, As 2, Sb 1, Db +, Gg(min) +• Nig 2+, Strf 0 9 Elas o, Sicc 3, L(s) 0. Dark-grey silty-cl83 with herbaceous remains.
Th3(Phrag) 1 9 Sh 3, Db +• Nig 39 Strf 0 9 Elas 1 9 Sicc 39 L(s) 1+. Dark-brown peat.
Sh 39 Ga 1, Ag +, Db +, Th3(Phrag) +• Nig 3+ 9 Strf 0, Elas +, Sicc 3, L(s) 0 • Dark peat with sand.
Sh 29 Ga 29 Db +, Ag +• Nig 39 Strf 0 9 Elas +9 Sioc 39 L(s) 1-. Dark sandy-peat.
Strata 1, 2 and 3 were sampled for pollen and strata 1, 2, 4, 5
and 6 for diatoms. Particle-size analysis samples were taken from
strata 49 5 and 6.
The Stratigraphy of Moors 8.
Stratum Height Depth Description
16) +0 .. 20 to
-0.,)0
15) -0.30 to
-0.34
14) -0 .. 34 to
-0.49
13) -0.49 to
-0.61
em
0 to 50
50 to 54
54 to 69
69 to 81
Not sampled
Topsoil/Ditchfill
Ag 2, As 2, Th +, Lf +o Nig 2, Strf 29 Elas o, Sicc 39 L(s) 1. Grey(mottled red) silty-cl83 ~ith roots.
Ag 3t As 1, Th +o Nig 2+ 9 Strf 2, Elas 0 9 Sicc 39 L(s) +. Grey ol~ey-silt with root remains.

- 47 ~
Stratum Height Depth Description
12)
11)
10)
9)
8)
7)
6)
5)
4)
3)
2)
l)
-0.61 to
=0.71
-0.71 to
-0.96
-0.96 to
-1.04
-1.04 to
-1.18
-1.18 to
-1.31
-1.31 to
-1.35
-1.35 to
-1.51
~1.51
to -lo52
-1.52 to
-1.60
-1.60 to
-1.90
-1.90 to
-2.10
-2.10 to
-2.26
81 Ag 2 9 Sh 2 9 Th +. to Nig 3- 9 Strf 1 9 Elas 1 9 Sicc 2+ 9 L(s) o. 91 Transitional silty-peat.
91 Th2(Phrag) 1, Th 1, Sh 2, Ag +• to Nig 3, Strf o, Elas 1, Sicc 2, L(s) o. 116 Black herbaceous peat.
116 Ga 3, Sh 1, As +9 Th2(Phrag) +• to Nig 3- 9 Strf 0 9 Elas 0, Sicc 3-, L(s) 1+. 124 Dark-grey transitional l~er with sand.
124 Ga 4, Th2(Phnag) +9 As +, Gg(min) +. to Nig 2+, Strf o, Elas o, Sicc 3-, L(s) o. 138 Grey-brown sand with Phragmites.
138 Ag 3- 9 As 1 9 Ga +, Th2(Phrag) +. to Nig 2+ 9 Strf 0 9 Elas 0 9 Sicc 39 L(s) o. 151 ClQ¥ey-silt with Phragmites.
151 As 39 Ag 1 9 Ga +9 Dh +. to Nig 2+, Strf 0, Elas 0, Sicc 39 L(s) 0. 155 Transitional 18¥er.
155 As 3- 9 Ag 1+, Ga +9 Th2 (Phrag) +9 Sh +. to Nig 29 Strf o, Elas o, Sicc 3, L(s) 0. 171 Grey silty-clay with organic remains.
171 Ga 1 9 As 29 Ag lo to Nig 2- 9 Strf O, Elas o, Sicc 3, L(e) 1. 172 Transitional layer.
172 Ga 3+, As 1-, Th2(Phrag) +. to Nig 2-, Strf o, Elas 0 9 Sicc 39 L(s) o. 180 Sandy layer with Phragmites.
180 Ga 4o to Nig 2-, Strf 0 9 Elas o, Sicc 39 L(e) o. 210 Light grey sand.
210 Ga 49 Gg(maj) +o to Nig 2- 9 Strf 0 9 Elas 0 9 Sicc 39 L(s) 0. 230 Sand with pebbles.
230 Ga 39 Gg(maj) 1. to Nig 2- 9 Strf 0 9 Elae 0 9 Sicc 39 L(s) 0. 246 Sand with pebbles.
Strata 1, 39 69 8 9 99 10 9 12 9 13 and 14 were sampled for diatoms
and strata 7 9 89 99 13 and 14 for particle-size analysis.

~ 48 -
The Stratigraphy of Moors 9·
Stratum Height uepth Description
21)
20)
19)
18)
17)
16)
15)
14)
13)
12)
11)
10)
9)
8)
moO .D. em
+0o34 to
-0.08
-0.08 to
~Oo)O
-0.30 to
~0.31
-0.31 to
-Oo33
-Oo33 to
-0.46
-0.46 to
-0.55
-0 .. 55 to
~o.66
-0.66
0 Not sampled to 42
42 As 3, Ag 1, Db +9 Lf +• to Nig 2, Strf o, Elas 0 9 Sicc 3, L(s) ?. 64 Grey cl83 with iron stains & organic parts.
64 Ag 2 9 As 2 9 Db +~ to Nig 2, Strf o, Elas o, Sicc 3, L(s) 2. 65 Grey silty-cl83 with some organic parts.
65 Ag 3+, Sh 1, Db +. to Nig 3-, Strf 0, Elas o, Sioc 3-, L(s) 2. 67 Dark brown-grey transitional layer.
67 Sh 3 9 Thl 1, Ga + 9 Ag +• to Nig 3+ 9 Strf + 9 Elas 1 7 Sicc ~, L(s) 2. 80 Dark brown-black peat with sand.
tiO Ga 3 9 Ag 1- 9 Db +. to Nig 3-, Strf o, Elas 0 9 Sicc 3, L(s) 2. 89 Transitional layer.
89 Ga 49 Th2 (Phrag) +• to Nig 1, Strf 0 9 Elas o, Sicc 3 9 L(s) o. 100 Light-grey sand with organic remains.
100 Not sampled. to to
-Oc71 105
-0.71 to
-0 .. 91 -0.91
to -lol2
-1.12
105 Ga 4, Th2(Phrag) +, Gg(min) +• to Nig 1, Strf o, Elas o, Sicc 3 9 L(s) 0. 125 Light-grey sandy l83er.
125 Ga 4 9 Th2(Phrag) +, Gg(min) +• to Nig 2~ 9 Strf 0 9 Elas 0 9 Sicc 3 9 L(s) 0. 146 Darker sandy l~er with Phragmites.
146 Not sampled. to to
-1.22 156
-1.22 to
-1.32
-1.32 to
-lo50
-1.50 to
-1.62
156 Ga 4 9 Th2(Phrag) +9 Gg(min) +. to Nig 2- 9 Strf 0, Elas 0 9 Sicc 39 L(s) o. 166 Darker sandy layer.
166 Ga 39 Ag 1 9 Gg(min) +, Lf +. to Nig 2 9 Strf 0 9 Elas 0 9 Sicc 39 L(s) 0. 184 Dark silty-sand with black stains.
184 Ga 2+, Ag 2- 9 Th2(Phrag) +, Lf + 9 Gg(min) +• to Nig 2- 9 Strf 0 9 Elas o, Sicc 3, L(s) 0. 196 Light silty-sand with Phragmites.

- 49 -
Stratum Height Depth Description
7)
6)
5)
4)
3)
2)
1)
m.O.D. om
-1.62 to
-2.12
-2.12 to
-2.15
-2.15 to
-2.22
-2.22 to
-2.39
-2.39 to
-2.47
-2.47 to
-2.62
-2.62 to
-3.12
196 to 246
246 to 249
249 to 256
256 to 273
273 to 281
281 to 296
296 to 346
Not sampled.
Ga 4, Lf +, Th2(Phrag) +• Nig 2+, Strf 0 9 Elas o, Sioo 3, L(s) 0. Light-brown sand.
Ga 4, Ag +, Gg(maj) +• Nig 2+, Strf 0 9 Elas o, Sioo 3 9 L(s) 0. Grey sand.
Ga 39 Gg(maj) 1 9 Gg(min) +9 Ag +. Nig 2+, Strf 0, Elas 0, Sioo 3, L(s) 0. Grey sand.
Ga 3, Gg(maj) 1, Gg(min) +, Ag +. Nig 29 Strf O, Elas 0~ ~icc 39 L(s) 0. Dark sand.
Gg(maj) 29 Ga 2, Ag +. Nig 2 9 Strf 0, Elas o, Sicc 3, L(s) 0. Orange-yellow sand.
Gg(maj) 39 Gg(min) 1 9 Ga +• Nig 2-, Strf o, Elas o, Sicc 39 L(s) o. Large-pebbled sand.
Strata 4 9 8 9 9, 10, 13, 15, 16, 17 and 20 were sampled for diatoms
and strata 13, 15, 19 and 20 were sampled for particle-size analysis.
The Stratigraphy of Moors 10.
Stratum Height Depth Description
m.O.D. em
20)
19)
18)
17)
16)
+0.37 to
-0.19
-0~19 to
-0.24
-0.24 to
~oo62
-0.62 to
-0.74
-0 .. 74 to
-0.80
0 Not sampled. to 56
56 Ag 39 Sh 1 9 Th2(Phrag) +, As +• to Nig 2+ 9 Strf 1 9 Elaa +9 Sico 2, L(s) o. 61 liark-grey ail ty la_yer with organic remains.
61 Ag 2, Th2(Phrag) 2, As +, Sh +. to Nig 3- 9 Strf 3- 9 Elas 1 9 Sicc 29 L(s) o. 99 Dark-grey silty-peat with Phragmites.
99 Ag 3, Sh 1 9 Th2 (Phrag) +, Lf + 9 As +• to Nig 2+ 9 Strf o, Elas 0 9 Sicc 2 9 L(a) 0. 111 Dark-grey silty layer with organic remains.
111 Ag 4 9 Sh +, Th2 (Phrag) +. to Nig 2+ 9 Strf 0 9 Elas 0 9 Sioc 2 9 L(s) 0. 117 Dark-grey silt with organic remains.

- 50 -
Stratum Height Depth Description
15)
14)
13)
12)
11)
10)
9)
8)
7)
6)
5)
4)
3)
2)
l)
m.O .D. em
-0.80 to
-0.82
-0.82 to
-0.95
-0.95 to
-1.07
-1.07 to
-1.09
-1.09 to
-1.48
-1.48 to
-1-50
-1.50 to
-1.60
-1.60 to
-1.91
-1.91 to
-1.99
-1.99 to
-2.09
-2.09 to
-2.27
-2.27 to
.,.2o3l
-2.31 to
-2o59
-2.59 to
-2.79
-2-79 to
-3 .. 11
117 Th2(Phrag) 39 Sh 1, Ag +. to Nig 3, Strf 1, Elas 1+, Sicc 29 L(s) 1. 119 Phragmites peat ball.
119 Ag 3, Th2(Phrag) 1, Sh +. to Nig 2+ 9 Strf 2 9 Elas +, Sicc 2, L(s) 1. 132 Grey silt with Phragmites.
132 Th2(Phrag) 29 Sh 2. to Nig 3+, Strf 1 9 Elas ~, Sicc 2-, L(s) 1+. 144 Dark grey-black peat with silt ball.
144 Th2(Phrag) 2, Sh 2, Ag +• to Nig 2, Strf 1, E1as 1, Sicc 2-, L(s) 2-. 146 Dark-grey Phragmites peat with silt.
146 Not sampled. to 185
185 Sh 39 Ag 1 9 Th~(Phrag) +. to Nig 3=, Strf 1. Elas 1, Sicc 29 L(s) ?. 187 Dark-grey sil~monocot. peat.
187 Sh 29 Th2(Phrag) 1 9 Ag 1. to Nig 3-, Strf 1+, Elas 1, Sicc 29 L(s) 1. 197 Dark-grey monocot. peat with Phragmites.
197 Th2(Phrag) 1, Sh 1, Th2 2, Dl +. to Nig 3, Strf o, Elas 3, Sicc 2-, L(s) 1. 228 Dark-brown-black herbaceous peat with wood.
228 Sh 2, Ag 1, Ga 1. to Nig 3-, Strf +, Elas +, Sicc 29 L(s) 0. 236 Transitional brown sandy-peat.
236 Ga 39 Ag 1, Th2(Phrag) +9 Gg(min) +• to Nig 2- 9 Strf o, Elas o, Sicc 2+, L(s) 0. 246 Light sandy layer with Phragmites.
246 Not sampled~ to 254
254 Ga 2 9 Gg(maj) 2 9 Th2(Phrag) +, Ag ~. to Nig 2, Strf 0 9 Elas o, Sicc 2+ 9 L(s) ?. 258 Light sandy layer ~ith large pebbles •
258 Ga 2, Gg(maj) 29 Th2(Phrag) +o to Nig 2~ Strf 0 9 Elas o, Sicc 29 L(s) 1-. 286 Light sandy layer with large flints & quartz.
286 Ga 3 9 Gg(maj) 1. to Nig 29 Strf 0 9 Elas 0 9 Sicc 29 L(s) 0. 306 Light sand with large pebbles.
306 Ga 29 Gg(maj) 2 9 Th2(Phrag) +• to Nig 29 Strf 0 9 Elas 0, Sicc 29 L(s) 1-. 338 Light sand with flint and quartz.
Strata 79 8, 9, 13 9 14 9 17 9 18 and 19 were·samp1ed for pollen and
strata 14, 17, 18 and 19 for diatoms.

- 51 -
:):1&2 Particle-size Analyses
Particle-size analyses were carried out on Moors 7, Moors 8
and Moors 9, using the procedure outlined in Section 2:7. The
samples tee ted were chosen in. order to try and show real
differences in the strata that had been identified using the
Troels-Smith notation.
1) Moors 1
At Moors 1, three strata were chosen from the upper inorganic
deposit for testing. The results of the analysis, together with
a summary of the Troels-Smith classification (shown in brackets),
can be seen in Table Y
Table 7 Particle-size Analysis of Moors 7.
Sample JJO Altitude (m.O.D.) 'fO Cl a..Y '1o Silt ;o Sand
6 -0.11 to -0.16 55-3 (75) 43.6 (25) 1.1 (-) 5 ~0.21 to -0.26 48-5 (75) 50.9 (25) 0.6 (-) 4 -0.36 to -0.41 46.9 (75) 52.8 (25) 0.) (-)
3 -0.41 to -0.46 44-3 (50) 54·5 (50) 1.) (-)
2 -0.46 to -0.51 45·5 (50) 53.2 (50) 1-3 (-) 1 -0.56 to -0.61 35·7 (50) 62.8 (25) 1.6 (-)
In general, the analysis shows that the strata become finer
towards the top of the core, aw&3 from the underlying organic
stratum. Samples 2 and 3 were taken from the same stratum, as
were samples 4 9 5 and 6o There is a very close correlation
between the results of the particle-size analysis of samples 2 and
3, as would be expected. The resemblance between samples 4, 5 and
6 is not so strong. Samples 4 and 5 closely correlate but 6 is
different, having a much finer and coarser character with more

.0" ~
] .... .... 00
.0" •.r
] """ ·'ro
" .0" ] •.r
'\ ·~ ---
r-
r-jL.J-
r--
LLJ N Vl
LLJ .....J L.J ~
<:> I-a:: ~ 1:"-
Vl a:: 0 0 L:
N
0
0 ..,
.., 0 I
!0 0 I
~~"~~~"~~~"~~~"~~~"'\~"~:~ ~"~~~"~~~"~~~"~"~"~'~"~·~· "~~~"~~~"~~~"~"~"~"'"~I~"' ~~~"~~~"~~~"~~~"~"~'~1~"~1
Ill .., :f ...
z ~ ~ .. N
~ .. N .... ~ ~s .... .,;
!

- 52 -
sand and cl~ present. This could be due to the proximity of
the top-soil to the sampled level. The results of the
stratigraphic analysis, according to Troels-Smi~h's methodology,
also shows an increase in finer sediments towards the top of the
core. No other resemblance between the two sets of data can be
discerned.
2) Moors 8
At Moors 8, five strata were tested for their particle-size
components. The results of this analysis, together with the
summarised version of the Troels-Smith description (shown in
brackets) are to be found in Table 8
Table 8 Particle-size Analysis of Moors 8
I Sample Al ti tude(m.O.D.) % Cl~ " Silt ., Sand 'fo Gravel
7 -0.36 to -0.41 38.6(50) 49·5(50) 11.9(-) 0.1(-)
6 -0.41 to -0.46 49·7(50) 49.2(50) 1.1(-) -5 -0.51 to -Oe56 41.2(25) 58.1(75) 0.7(-) -4 -1-06 to -1.11 0.6(+) 13·9(-) 85.2(100) 0-3(+)
3 -1.11 to -1.16 0.6(+) 18.4(-) 79·4(100) 1.5(+)
2 -1.21 to -1.26 10-3(25) 36.8(75) 52.8(+) 0.1(-)
1 -1.36 to -1.41 2.8(75) 22.9(25) 74-3(+) -
Samples 1, 2, 3 and 4 are from the lower inorganic deposit
which lies below the peato The results clearly show that this
inorganic deposit is predominantly sandy, becoming more so towards
the transition with the peat above. Samples 5~ 6 and 7 are from
the upper inorganic deposito Of these, samples 3 and 4 are from
the eame stratum as are samples 6 and 7. Again it can be inferred,
from the results, that samples 3 and 4 are from the same stratum,
but the resemblance between 6 and 7 is not so apparent 9 sample 7

LLJ N Vl
LLJ --' LJ
to:: < 0..
Vl 0:: 0 0 ~
--'------'~~·
~ .· ... ·.·. .·· ~···D. ...
.. ci "' 0
I
CD 0
=
[] =
Cl
.. ~" g ~ ~ 8 ~ ~ ~I I I I I I I I I L I 0
J fi .J Ji .J J ..1 .J ..1 ll.J I .J I - I • I - 1 ... I - I :- I • • • • • • • .J .J 1111 .J .J Ji J .J Ill Jj 'V ~ .J .I.J .l]J .J .J olJ.J t .J I .J I • t- I • I- I,. :1 • • • • • • • • .J ..!I.J .J .J .ll .J ,IJ.!) ..8
<co, ~ .JJj.JJj.J4 .JJj.J.J .JI.J 1.,..1-t•t-t.al :•• •I • • • • •.S.J.J.J.,.J,.!I.lJd-' "•.,.. ;'\ d.J,JJ.JJ)J.,lJ.J.J.J I.JI.J 1-t•t-l.at-••I••••••.J..J.J,...Jttf.S.D.J,P
".r e :f ~ D = a • • ,... ...
-# !?
. £ :; ;;; ~
'l ~i !!
l ~
!

~ 53 -
being much coarser than sample 6. This again could be due to
the proximity of the top-soil to the sampled level. The
correlation between the two sets of data is very poor. The
greatest discrepancy seems to be in sample 1 9 where the particle-
size analysis reveals a very high percentage of sand but the
Troels-Smith description shows a stratum with a high proportion
of clay and just a trace of sand.
3) Moors 9
At Moors 99 three strata were tested for their particle-sizes.
The results are shown below with a short SUIJJllary of the Troels-Smith
description.
Table ~ Particle-size Analysis of Moors 9·
-~--- ~·r· --~-- ·-----· ..
Sample Altitude(m.O.D.) " Clay 'fo Silt '1o Sand 'fD Gravel -- -- --~--- --
5 -0.15 to -0.20 41.7(75) 53e9(25) 4e4(-) -4 -0 .. 25 to -0.30 40.9(75) 55·9(25) 3.2(-) -3 -0 .. 30 to -0.31 40.2(50) 54o9(50) 4o9(-) -2 -0.55 to ~0.60 0.1(-) 10 .. 3(-) 89.4(100) 0.1(-) 1 =0 .. 75 to =0.80 0.1(-) 6.7(-) 92.9(100) 0.2(+)
Samples 1 and 2 were taken from the same stratum, below the
organic deposit and clearly shows a very coarse sandy deposit.
Samples 4 and 5 were also taken from the same stratum and show a
close correlation. No true separation can be seen between samples
4 and 59 and 3 but it must be noted that sample 3 was a very small
band of 1 em and thus accurate sampling ~as difficult. When one
compares the two sets of data one can see that samples 1 and 2 are
the only ones to show any correlation, and these are virually total
sand.. The apparent differences between samples 4 and 59 and 3 9
which is picked out in the Troels-Smith description 9 is not seen

_____ ]
N 0 I
... 0 I
•
"' 6 I
I]
CD 6 I
"' ~ ...

- 54 -
in the results of the particle-size analysis.
4) Discussion of the results of particle-size analyses of The
Moors site.
With regard to Moors 7, the upper inorganic deposit was
divided intc two separate strata, using the Troels-Smith
methodology; an upper fine stratum of silty-cl~ and a lower
coarser stratum of silt-cl~. When one looks at the results of
the particle-size investigation, this division can be tentatively
confirmed if one ignores the upper sample 6 as being contaminated by
its proximity to the top-soil. The main evidence for this di~ision
of strata is the sand fraction, which is more in evidence in the
lower stratum, and the increase in the clay fraction of the upper
stratum. In Moors 9 however, this division between lower coarser
and upper finer sediment is not in evidence, although one must
remember that the sample from the lower 'coarser' deposit was poor
in q_uality.
The particle-size analyses confirm a correlation between the
lower inorganic samples 3 and 4 in Moors 8 and 1 and 2 in Moors 9·
The correlations between samples 4, 5 and 6 in Moors 7 and sarr.pl es
4 and 5 in l·ioors 9 and between samples 2 and 3 in Moors 7, 6 and 7
in Moors 8 and sample 3 in Moors 9 that were found in the Troels-Smith
analyses are not obvious in the results of the particle-size tests.
The particle-size analyses are more reliable than the field analyses
and thus it must be assumed that these latter correlations are not
necessarily true.
This investigation of particle-size by dry-sieving and
sedimentation is very useful as it has shown the major discrepancies
that can arise using the Troels-Smith description alone. It is

- 55 =
important to realise that stratigraphic analysis in the field or
laboratory will only give a subjective view of the sediment and
that a quantitative assessment of the sediment is also needed
in order to assess real changes in the lithology of deposits.
However, it must be remembered that no indication of organic
proportions are given in particle-size analyses, as all organic
material is destroyed during preparation of the samples.
Jc 1 d Pollen Analyses
Samples for pollen analyses were taken from cores Moors 7
and Moors 10. Samples from the peat strata were taken,
including samples from the transitional strata bordering the
organic deposits. The pollen was prepared and counted as
described in Section 2t5 and all the results are tabulated in
Appendix IV.
1) Moors 7
At Moors 79 strata 1, 2 and 3 were sampled for pollen.
Samples from the dark Phragmites peat were taken at 10 em intervals,
while the transitional zone from the lower sandy-peat to the peat
of stratum 39 and also the top levels of the peat, were sampled
at 2 em intervals. In all 9 eight levels were taken; 1) -142 9
2) ~140, 3) ~130 9 4) =120 9 5) -110 9 6) -100 9 7) -95 and 8) -93 em.
A pollen sum of 150 tree pollen was counted in levels 1 to 5, but
in levels 6 to 8 a sum of 50 tree pollen ~as counted as the tree
pollen became too scarce for a faller count. For example in
level 8 a total of 348 Lycopodium spores were counted to reach a
sum of 50 tree pollen. The data from the pollen analyses has
been displa3ed as a percentage of the total land pollen (TLP)

.:>~ -&"
c,-5
0~ o0
,._-<:- ,...~· ,_Q ~
0 ~"
IL!!,-~90
4 !!,_Lf=:-:1. -I--·
--~----~I
L ---- ~- -t- 100 --~----~ ~---~----~---- ~ L-- -1- 110 -~----~-
~----~---~
~--- ~----~---- ~ ~---
2 -:--: • ... -·-· ·-·-
120
130
140
-07
-08
-09
-1-0
-11
j-~-
1 -.-. -12 . -. _,
Co-orCI s,o• 40' S6''N zoOS' 41''W
Gr•d r~t sv 949~ 8702
Fteldworlo 800622
sl
I
41
3~ ~
2-' ,_
0 ~
f3
• ~
TREES
SHRUBS
HERBS
AQUATICS
SPORES
MOORS 7 0/o Total
'
.. r , ..
I I I : .
r 1 ... ~ ... I
~ ... I ,..... ~ !~ i ~
LLJ ,,, ~ ~? <1-'? o<t. ~"" ~-:,
'v~ v., ".r ....,.("" ¥ (....r ...
I I FIGURe:. 12 i
....
"),~ ('0
~-i;..f'-.r 'J_~ ".r <l'
....
....
Land Pollen
• ...
.. ...
.. ....
.. ...
...
... ..
~~.;,;;\~:~~~ ~~~~ ~{~~,;/~~:~~~~~~~~~~ .. ·~ ~ "\. ~~~""""'Iii>&.,_ ~~~" "~~ ~~~~~~~~'? '~
""6~ ~ ~~, " "l'~ ~
~
'l~.f:"
<I ,.. !\.~ c ~·.j,
.._o "'-li "'tr
324 348
420 273
255 254
737 355
741 260
576 248
372 245 316 371
2b
2a
1
''+ •-..,.
FMJS

- 56 -
as a result of the paucity o~ tree pollen and can be seen in
Figure 12. Data on dry-land pollen is based on calculations of
~AP plus group and has been included for relative dating purposes.
A record of the pollen counts, expressed as a percentage of TLP,
are to be found in Appendix IV. Two local pollen assemblage
zones (LPAZ) have been recognised in this core and are outlined
below.
LPAZ M7:1 -142 em to ~--135 em
'J.'he characteristics of this zone are a dominance of tree
pollen with static frequencies of shrub and herb pollen. The
dominant tree pollen in this zone is Alnus which reaches a
maximum of 38.6~ TLP at -142 em. Other important taxa are
Corylus with 27.6~ TLP at -140 em and Gramineae, which reach
19.5~ TLP at the same level. The major dry-land tree pollen
comes from Betula with 16.7~ of trees at -142 em and Quercus
with 20.0~ of trees at -140 em. Frangula, Artemisia and
Rubiaceae pollen are only found in this first LPAZ. Overall
the concentration of pollen rises to the top of this zone in
most taxa, but it is interesting to note that although Alnus
concentrations rise, the percentage of Alnus pollen falls. The
upper boundary of this zone has been placed where there is a
marked fall in Alnus from 31.8~ TLP to 13.3~ TLP and where
Gramineae increase from 19·5~ TLP to 30.7~ TLP.
LPAZ M7:2
This second LPAZ has been divided into two sub-zones, a) and
b) on the basis of changes in the NAP (Non-Arboreal Poll en).

- 57 -
LPAZ lrl7: 2a ~--135 em to .2!!:_·-91· 5 em
The sub-zone is characterised by decreasing tree pollen
upwards through the levels and increasing shrubs and spores.
The most important tree pollen comes from Quercus with 14~ TLP
at -130 em and Alnus with 13.8% TLP at -100 em. Other prominent
taxa are Corylus with 44.2~ TLP at -110 em and Gramineae with
30.7~ TLP at -130 em. Sphagnum frequencies are consistently
high reaching 23·9~ TLP + Spores at -100 em. The major dry-land
taxa are Quercus with 40.7~ of trees at -120 em, Ulmus with 11.3~
AP at -110 em and Betula with 10.7~ AP at -130 em. Tilia and
Plantaginaceae first appear here at -130 em and -100 em. The
conceutration of Corylus pollen reaches a marked peak at -120 em
with 54 x 102 grains/cc., although the percentage curve shows no
indication of a marked rise at this level. Gramineae also show a
peak of 29.8 x 10² .3'rainsjcc. at the same level. The upper boundary
of this sub-zone is marked by Pinus and Tilia dying out and a
sharp increase in Ericaceae and Sphagnum frequencies together with
a decrease in Gramineae pollen.
LPAZ t•i7: 2b ~--97· 5 em to ..£.§:_·-9 3 em
This sub-zone is characterised by a renewed increase in AP
accompanied by a sharp increase in shrub and herb pollen and a
decrease of spores. The most numerous tree taxa here are Alnus
with 11.6~ TLP at -95 em and Quercus with 6.5~ TLP at -95 em.
Corylus totals are high with an increase to 34·4~ TLP at -93 em.
Ericaceae drop to lO.]jt 'l'LP _at -93 em from 22.8~ TLP at -95 em,
and Gr~nineae increase to l9·1fo TLP at -93 em. There is also a
marked decrease in Sphagnum to 21.4~ TLP + Spores at -93 em. The
major d.ry-le.nd tree pollen come from ~uercus vii th 30.0;o AP at -95 em

- 58 -
and Betula with 26f.l AP at -93 em. F!'a.xinus has 6jo AP at -95 em
while Fa;5us has 6~ AP at -93 em. Fagus first appears in this
sub-zone as does Viburnum, Caryophyllaceae, Chenopodiaceae,
Saxifragiaceae and Myrioph,Yllum. Tree pollen concentrations a.re
relatively low throughout this sub-zone.
These zones can tentatively be correlated with the
litho logical se•:;uence described for the core. LPAZ M7: l represents
the lower s~ndy-peat transitional strata 1 and 2, together with
the lower levels of the true peat. Tree pollen is shown to be
most numerous in the lower sandy-peat. LPAZ M7 :2a. repre::Hmts the
bulk of the Phragmites peat of stratum 3. Here we see that tree
pollen declines upwards and shrub pollen becomes predominant.
Spores also increase in the upper levels of this sub-zone.
LPAZ M7:2b can be said to represent the upper peat levels before
the stratigraphy changes to a clastic deposit. Here shrub pollen
are most numerous but spores are dominant in the last level of -95 em.
Moors 7 was chosen to represent this site due to the depth of
peat, which v•as over 45 em. Koors 10 had. t.i1e greatest depth of
peat but this borehole was not chosen due to its proximity to the
large sea-wall 3.nd the danger of disturbed samples. .~.s a result
the :S?AZ of :tvioors 7 hcwe been tentatively elated using pollen
evidence.
Dating of the LPAZ of Moors 7•
'I'he peat at l~oors 7 ranges in al ti ttlde from -0.69 m.O .D.
(93 em) to -1.15 m.O.D. (1:3~ em). T1'i'O l-F'AZ Here recognised, Hhich
are summarised belo·i; r~i th dominant AP and NAP.

= 59 -
Table 10 Dating of LPAZ at Moors 1·
-- ---------------
F1andrian Altitude Depth Dominant Dominant Dominant
Chronozone LPAZ (m.O.D .. ) (om) Lifegroup AP NAP
M7:2b -0 .. 70 to =93 to Spores & Q-A-B- Sph-Co--0.75 -97·5 Shrubs Fr-Fg Gr-Er
III -- -
M7:2a -0.75 to -97·5 Herbs & Q-A-U- Co-S ph--1.12 to -135 Shrubs 13-Fr Gr
---j II M7zl -1.12 to -135 to Trees/ A-B-~- Co-Gr-
-1.19 -142 Shrubs u Sph-Pt j ---- __ .,__ -----------------
Q • Quercus, A • Alnus, B = Betula, Fr = Fraxinus, Fg a Fagus,
U. = Ulmus,. Sph = Sphagnum, Co .. Corylus, Gr .. Gramineae,
Er • Erioaoeae.and Pta Pteridium.
These two LPAZ at Moors 79 have been divided into two
ohronozones on the basis of the dominant AP. LPAZ M7:1 is thought
to belong to an age of Flandrian Chronozone II (Godwin's ~one VIla)
where Alnus is the dominant tree pollen producer. LPAZ M7:2a and
LPAZ M7s2b are thought to belong to the early part of Flandrian
Chronozone Ill (Godwin's Zone Vllb) where Quercus becomes the
dominant tree pollen producer with an increase in Sphagnum,
Erioaoeae, Fraxinus and Fagus.
2) Moors 10
At Moors 10 9 strata 7 9 8 9 9 9 13, 14, 17 9 18 and 19.;were
sampled for pollen. A sampling interval of 10 om was used
throughout, except in stratum 139 the Phragmites peat where the
sampling interval ~as much closer in order to incorporate the
whole peat stratum. In all, fifteen levels were taken; 1) -230 9
2) -220, 3) -210, 4) -200, 5) -190, 6) -143, 7) =135, 8) -130,
9) -120 9 10) -110 9 11) -100 9 12) =90 9 13) =80 9 14) =70 and 15) -60 om.

~l' .. .s
d' R'. /~
MOORS 10 0/o Total Land Pollen .I'Jt,!: .. ~ .... ,<r II
,...~ ~ '\o "' ...,rr
ttl~-- 1.. ~-reo -0.2
.. L L '-; 1.. L L 1-
,. ,t ~ ~ ~80 -0.4 L L 1o L;
L L L ';
t=~~~100 -o.e
" I..L.-L L L L-..
11 -o.e 14
.. 140 -1.0
•• ' ~ '
n'
:~ ·wAirfr ~ : ::~ ~~ t~ :
~t u- : 11
tO·
•· _..&;: •·
•· ~r r 1 r. 1 ~ t ( 1 ":
170 4!17
172 2!10
1!11 302
,..., 140 318
180 308
.... I ..... 1•e n7 - .... 241 337
I .... ~1_,-._ 1 ...
I"' L!!!.
"' • ..i.!1..m.
;J44I Z02
~· 273
•: l~~:~:~,.' -1 e -·~~~tf--+f--.F:-+f:-.. -f++~,...,~+-H-f:--++-::-f--t-f-+-t-f-1-t-t-ti:-HH-t-H-!--tt-t-i--t-tt-t---::-'--;~~· 200 • .. L I- I ) I I I
o I~ ~ ~ ~ 220 -te ' "' • I I I • 1- I -.- 1.. .. Itt fj ....
7 le-o- -20 -~ ~L_,__,l_,__,[_,[_,[_,[_,L_,__,[_,L _ _,l_,__,L_,L_,L_,L,,I._,L_,L_._,I_,L_,L_,L_,L_,L_,L_,~L_,
~ ~ I., lo 403 322
I I I 11 n ~
--,, .. 383 10
I l I I. I I I 1 20!17 200
' ' ' ' ' 1o 12~ 200
!171 231
Co·Of'G. 50-41'04-. ,. .. , ..• 0 ~s ~- ~~"~ ~~."''\ liiSHift.IBS
"" <"~ Or1d ret SY 1411 11J1 12 HERBS
Fi•ldweri 800112 • AOUolTlCS
~ SPORES \FIGURE 13]
-"-"C "'•~o ... +~ .... ~
"-!' "'-<. ~ .... ~ ~+ ,."'-t. '<+ ·,~ • 't-' ~,,~~~~~~+~~~~~~ ~+,
-~6t> {~ ' ' '
"~ ~+ .,
""
5
4
3 2 1
F"MJS

- 60 -
At least 200 Lycopodium spores were counted at each level and the
record of these counts can be found in Appendix IV. The data have
been displa3ed graphically in Figure 13. Again due to variable
tree pollen counts, the data have been expressed as percentages of
TLP. Five LPAZ have been recognised and are outlined below.
LPAZ MlOsl -230 em to ~.-215 om
This zone is characterised by a large peak of AP, 58~ of total
pollen, at -220 em. Shrub and herb pollen decreases to -220 em and
then begins to increase above this level while spores increase to
-220 om and then decrease. The predominant AP comes from Alnus
and Betula. Alnus increases to 34·9~ TLP at -220 em and Betula
also increases to this level with 22.7~ TLP. Quercus pollen does
not contribute a high percentage in this zone and is decreasing.
Other dominant taxa are Gramineae with 38.2~ TLP at ~230 em and
Corylus with 24·5~ TLP at the same level. Ericaoeae have relatively
high counts with 7.8~ TLP at -230 em. Hedera is only found in this
zone. The concentrations show very large increases in the AP to
the top of this zone. Alnus pollen reaches a concentration of
109 x 102 grains/co at -220 em and Betula reaches 70.8 x 10²
grains/co. This is in part due to the large AP sum of 110 AP
counted at this level. The upper boundary of this first zone was
placed where large decreases in percentages of Betula and Alnus
pollen are found together with an increase in Tilia pollen. Also
at this boundary a large increase in Ericaceae pollen is noted.
LPAZ Ml0a2 ~.-215 em to ~·-195 om
This zone is distinguished by an evening out of AP percentages
to roughly 13~ of total pollen counted. Shrub pollen constitutes
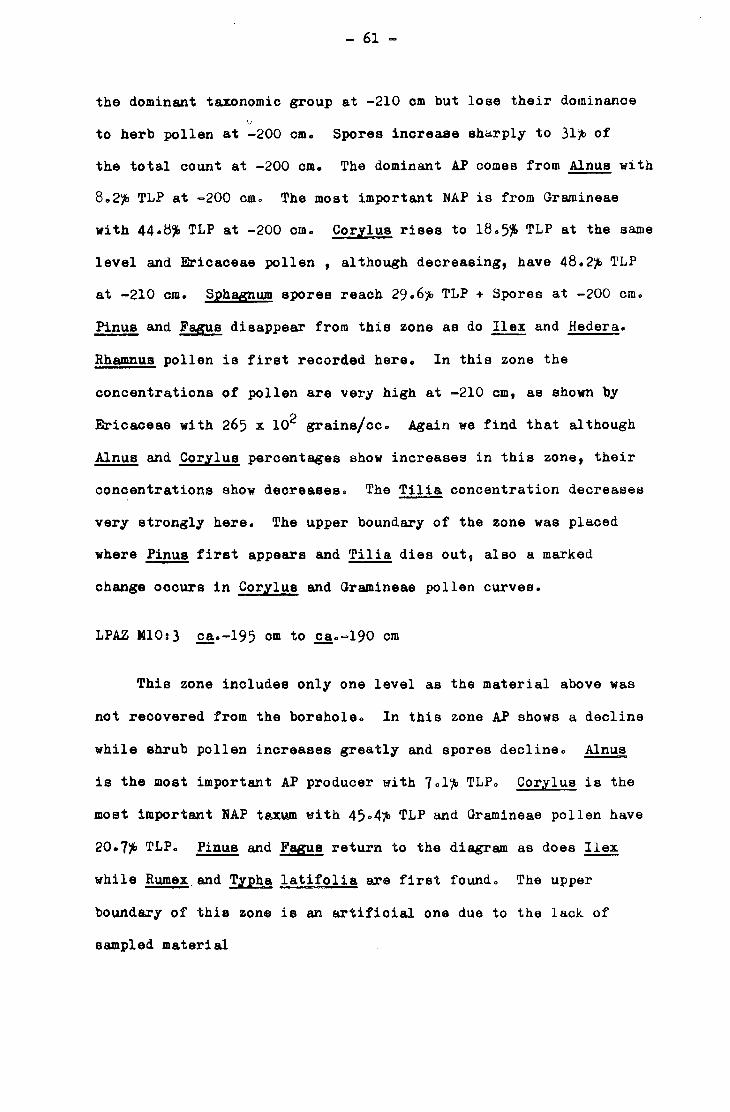
- 61 -
the dominant taxonomic group at ~210 om but lose their dominance
to herb pollen at -200 em. Spores increase sharply to 31~ of
the total count at -200 em. The dominant AP comes from Alnus with
8.2~ TLP at -200 em. The most important NAP is from Gramineae
with 44.8~ TLP at -200 em. Corylus rises to 18.5~ TLP at the same
level and Ericaceae pollen , although decreasing, have 48.2~ TLP
at -210 om. Sphagnum spores reach 29.6~ TLP + Spores at -200 em.
Pinus and Fagus disappear from this zone as do Ilex and Hedera.
Rhamnus pollen is first recorded here. In this zone the
concentrations of pollen are very high at -210 em, as shown by
Ericaceae with 265 x 102 grains/co. Again we find that although
Alnus and Corylus percentages show increases in this zone, their
concentrations show decreasesQ The Tilia concentration decreases
very strongly here. The upper boundary of the zone was placed
where Pinus first appears and Tilia dies out 9 also a marked
change ooours in Corylus and Gramineae pollen curves.
LPAZ Ml0:3 ~·-195 em to £Ao~l90 em
This zone includes only one level as the material above was
not recovered from the borehole. In this zone AP shows a decline
while shrub pollen increases greatly and spores decline. Alnus
is the most important AP producer with 7.1~ TLP. Corylus is the
most important NAP taxum with 45·4~ TLP and Gramineae pollen have
20.7~ TLP. Pinus and Fagus return to the diagram as does ~
while Rumex.and Typha latifolia are first found. The upper
boundary of this zone is an artificial one due to the lack of
sampled material

- 62 =
LPAZ Ml0:4 ~o=l43 om to ~-~132o5 om
The beginning of this zone is taken to be where the first
level was sampled after the break in stratigraphyo AP was very
soarce in this zone and shrub pollen dominates with over 50~ of
the total polleno Herbs, aquatics and spores all begin to
increase to the top of the zone. The most numerous tree pollen
comes from Quercus with 5o6~ TLP at -143 em. Corylus pollen
is dominant with 58·9~ TLP at -143 em. Gramineae are also high
with 24.6~ TLP at the same level. Ulex pollen is only found in
this zone. AP concentrations are uniformly low. Corylus shows
the highest concentrations with 56 x 102 grains/co at -143 em.
The upper boundary is marked by large changes in Corylua and
Chenopodiaceae 9 and where Compositae pollen curves reappear with
relatively high percentages.
LPAZ Ml0:5 ~o-132.5 em to -60 em
This last zone shows a slight increase in AP with a marked
decrease in shrub pollen and an increase in herb pollen. Overall,
herb pollen dominates this zoneo The predominant AP is from Alnus
which rises, through the zone 9 to 7o9~ TLP at -70 em. Betula and
9uercus pollen show small peaks at =110 em ~ith 8o5~ TLP and
6o8~ TLP. The most important NAP taxa are Gramineae with 47.q~ TLP
at -70 om 9 Corylus with 30.2~ TLP at =120 em and Ericaceae with
l5o4~ TLP at the same levelo The Compositae pollen reappears in
this zone as does Tilia9 Artemisia9 Caltha and Polygonumo Galium
and Nymphae& are only found in this last zoneo Concentrations of
pollen are generally low throughout this zone.
These five LPAZ can be correlated with the stratigraphic

- 63 -
column. LPAZ MlOal can be considered representative of the
lower transitional stratum 1 and the lower levels of the
Phragmites peat of stratum 8o This zone shows a dominance of
herb and shrub pollen in the transitional stratum, which changes
to a dominance of tree pollen in the lower peato LPAZ Ml0:2
represents the upper levels of this peat, showing a decline in
the AP and increasing herb and shrub pollen 9 together with a sharp
increase in spores just at the top of the zoneo LPAZ Ml0:3 can be
aaid to correlate with the silty-peat of stratum 99 where AP
continues to decline and shrub and herb pollen is dominant. LPAZ
Ml0a4 correlates with the Phragmites peat of strata 12 and 13,
where shrub pollen are dominant and aquatic pollen begins to
increaseo The last zone LPAZ Ml0c5 covers the whole of the upper
mixed silty-peat where herb pollen is dominant and aquatic pollen
is present throughouto
Conclusions Based on the Pollen Analyses at The Moors Siteo
The results of the pollen analyses at The Moors site show
that the three strata found at the siteJ stratum 3 of Moors 7,
stratum 8 of Moors 10 and strata 12 and 13 of Moors 10, are three
separate peat units which suggests that there could of been three
terrestrial periods 9 at The Moore 9 when peat growth took placea
These results will be discussed in full in Chapter 4.
3gls4 Diatom Analyses
Diatom samples were taken from Moors 79 Moors 89 Moors 9 and
Moors 10, in the upper ~d lower clastic depositso The results
of these analyses are outlined below and can be seen in tabulated
form in Appendix Vo

- 64 -
1) lo'toors 7
At Moors 7 the upper and lower clastic deposits were sampled
for their diatom content. These deposits consisted of five strata;
1, 2, 4, 5 and 6 as previously described in Section 3:1:1. Eight
levels were taken and of these, only the upper six, in strata 4, 5
and 6 yielded diatoms. These levels are 1) -93, 2) -90, 3) -83,
4) -65, 5) -50 and 6) -38 em. A count of 200 diatom valves per level
was made wherever possible. A full record of the results is
given in Appendix V. 'l'he data are expressed as percentages of the
total valves (TV) counted per level, or of the total number of
species (TS) per level. Eight summary diagrams are given, as
described in Section 2:6:4, together with a composite diagram of
the frequency of each species identified, showing 95~ confidence
limits. These diagrams are shown in Figures 14a and 14b. In the
following descriptions 'Freshwater' types of diatoms will be taken
to include both Fresh and Fresh-Brackish types, 'Brackish' types
will indicate Brackish-Fresh, Brackish and Brackish-Iv1arine diatoms
and '?>larine' types will include Marine-Brackish and Marine unless
otherwise stated.
At Moors 7, d4 species of diatoms were identified, the r~tio of
F : 13 ~ being 5 : 12 : 27. In total, 1194 valves were counted
throughout the six levels and the ratio of F : B : k was
16 : 640 : 538.
Overall there are two dominant species of diatoms at this
borehole; Nitzschia navicularis (B b) with 406 valves and Melosira
sulcata (M p) with 277 valves counted. When one looks at the
summary diagrams for valves and species (Figure 14a) it is obvious
that few significant changes in diatom flora oc2ur in this

& "~
~ c ~·
.:,.S 'I>" ,$'
if'~
J!, L J!,(6~ IJ!,J!, L J!, IJ!,J!,J!, L 40
s/"1!.1616 (6LJ!,i!. J!,(6LJ!, 1!.1!.1!. "~ 60 I" 1!. L 1!. 5 ,I!. L J!, L L J!, LJ!,r 80
'1!. Li!.-4 f_J!, LJ!,
~~.~
3 1: ~ ~=r-100
il!. L I!. I!.
~~~~f- 40 6 I L 1!.1!.16
fbLJ!,fb
~~~~l-60 LI!:.L[b
5 II!. L 1!. L
LI!:.L[b, 1!. Lfb-f-80
4 i-1!, Li!. .~~JaM-:
·6'-~e
-- 0·2
-0-4
-06
- o.8
- 0·2
-04
-0·6
l ]- .. --100 -0·8 -- ~-
I FIGURE 14a I
MOORS 7 DIATOMS
VALVES
F.FB:BF.B:BM:MB:M F·B:M oF·os OM
10•1,.
SPECIES
F:FB :BF:B:BM:MB:M F:B:M t>F t>B :OM
Salinity classes Ecological classes
.F ~ BF QB M D MB Bb 0P S FB ~B OM ~e
t>:e:p
o-tl' ~
...,d-
5 4
3
/t:::=::=: 2 ==
b:e:p
~ ~ 5 4 '~~
X)(~ 3 ,)( )( )( )< ~ /~ 2==
L J i ..J...._,J
Cc>ord. so• 40'51"N 2"05'41" w
Grid r•f SY 9481 8702
Fi•idwoA 800122 FMJS

5 "'
0> 0> 8
"' NO> Oa> N-
~' "., r~L-+-----r---------~~~1 ~~
0 '<t
"' 0
I
'<t 0 I
10 0
.J I I I I I I
Jj Jl J .D .D .D J .D JJ .D J .D .Doll J .D J .D J .!] J .dJ I .D J :I I .!!J .O.O.!IJ .D.D.DJ JJ,!J.IJJ d]J .11-' J)J Jll JjJ .11:1 ~ 'dd.J]J.J].J].J)JJ).J)JlJo!)JJ]J,!JJJliJ)JJ)I~•I
.g .!J.ll J ,0 .0 .11 J ,!1 Jl.ll J ,q.ll, ,Q J .11 J Jl I .ll J JJ I .IJ i I I
z
i u
w 0::' =:> ~ lL '--
~------------------------------------------------------------------

- 65 -
borehole. More Fresh valves are found in the lower levels,
together with more Brackish valves. Marine diatoms become more
important in the upper levels of the core. The Fresh species
also decrease upwards, but Marine species have taken over in
dominance from Brackish species. It ma3 be of interest to note
differences recorded in the summary diagrams between valves and
species. One might assume that an increase in a species of a
specific salinity grouping would register in the valve diagram of
that same salinity grouping, but this is not always the case. As
previously stated, the same fluctuations are seen in Fresh valves
and species, but there is a major difference in the Brackish and
Marine valves and species. Far less Brackish species are recorded
than Marine species but the number of valves of Brackish types is
higher than those of the Marine diatoms and this indicates a
Brackish dominance of the levels. It is the number of N.navicularis
valves counted that gives this impression. The summary diagrams of
lifestyle are also shown in Figure 14a. Again there is greQt
variation between the diagrams for valves and species. In
general there is a decrease in the number of benthonic valves
found upwards through the core. As the benthonic valves decrease,
the planktonic valves increase. This rise in planktonic valves is due
to the marked increase of M.sulcata valves at -50 em. The
epiphytic valves show constant presence throughout the levels.
When one looks at the species summary diagram again disparities
are found. Benthonic species stay fairly constant, as do the
epiphytic and planktonic species, but there are more benthonic species
than epiphytic and planktonic species.
Five tentative local diatom assemblage zones (LDAZ) have been
identified at Moors 7, where major changes in the diatom flora occur.

- 66 -
It must be added that al thoug~ Fresh diatoms yielded a small
proportion of the total counts, they are considered significant
in this work.
LDAZ M7:1 -93 em to ~.-91.5 em
The dominant species of this zone are N.navicularis with
39·7~ TV, Nitzschia granulata (M b) with 16.1~ TV, Nitzschia
punctata (BM b) with 11.1~ TV and ~.sulcata with 9·5~ TV. The
upper boundary is placed where !•granulata fall to 5~ TV at -90 em.
This zone is distinguished by increasing Fresh diatoms, constant
Brackish types and decreasing Marine diatoms. No Fresh-Brackish
diatoms are found in this zone. In general, Brackish diatoms
dominate this first zone. Benthonic valves and species decrease
sharply with a corresponding rise in epiphytic diatoms. Planktonic
valves remain constant, while there is a sharp decrease in planktonic
species. It is interesting to note that none of the Fresh valves
or species are benthonic in this zone.
LDAZ M7:2 ~.-91.5 em to ca.-86.5 em
The dominant species here are !·navicularis with 32.7~ TV,
M.sulcata with 9-4~ TV and !•Punctata with 8.4~ TV. The upper
boundary is marked by a sharp increase in Brackish diatoms together
with a corresponding decrease in Marine diatoms. Fresh-Brackish
diatoms first appear in this zone, although there is an overall
decrease in Fresh diatoms. Benthonic diatoms begin to increase in
these levels and epiphytic types also increase. Planktonic diatoms
remain constant. Again this zone shows no Fresh diatoms to be
benthonic.

- 67 -
LDAZ M7:3 ~.-86.5 ern to ~·~57·5 em
The dominant species in this third zone are !•navicularis
with 41~ TV at -65 em, !•sulcata with 29.5~ TV at the same level
and Caloneis formosa (B e) with 8.8~ TV at -83 em. !·punctata has
8~ TV at -65 em. The upper boundary is shown by a decrease in the
number of N.navicularis and the dominance of Brackish diatoms being
over-ridden by Itiarine diatoms. The increase in Marine diatoms is
due to the rise of ~.sulcata, which increase from a count of 19
valves at -83 em to 59 valves at -65 em. The Fresh diatoms remain
constant and low. Benthonic diatoms begin to decline while planktonic
diatoms increase. The first benthonic-Fresh diatoms appear here.
LDAZ M7:4 ~·-57·5 em to ca.-44 em
The dominant species here are ~.sulcata with 43·7~ TV,
!·navicularis with 27.1~ TV and !•Punctata with 10.1~ TV. The
upper boundary is placed where the Brackish diatoms begin to decrease
rapidly and Marine types increase. True Fresh (F) diatoms disappear
altogether from this zone. The increase in Marine types is again
due to the rise of M.sulcata valves, together with an increase of
the number of Marine species present. The decrease in Brackish
diatoms is largely due to the decrease of N.navicularis. Benthonic
valves continue to decrease but the species increase. Planktonic
valves reach a peak at -50 em. Epiphytic diatoms begin to increase
at the top of this zone.
LDAZ M7:5 ~·-44 em to -38 em
The dominant species in this last zone are M.sulcata with
36.8~ TV, !•navicularis with 24.4~ TV and !•punctata with 11.9~ TV.
This zone has increased Marine diatoms, mostly indicated by an

- 68 -
increase in Marine species present. The decrease in Brackish
diatoms continues and Fresh valves decrease markedly, although
the number of species is constant. Benthonic valves remain
constant here but the species decline in numbers. Epiphytic
valves and species continue to increase and planktonic diatoms
begin to fall.
These five LDAZ correlate closely with the lithological
divisions found in this core. LDAZ M7al and LDAZ M7:2 correspond
to the transition between the underlying biogenic deposit and the
upper clastic deposit. As would be expected, the Fresh diatoms are
most abundant here. LDAZ M7:3 can be regarded as representative
of the clay-silt deposit, stratum 5· The Fresh influence is
removed in this zone and it is replaced by Brackish dominance.
LDAZ M7:4 and LDAZ M7:5 represent the upper silty-clay stratum,
which shows an increase in Marine influence with a decrease of
Brackish diatoms. Thus the Fresh influence decreases away from the
peat deposit and is gradually replaced by a strong Brackish and
then Marine influence, upwards through the levels. It is
interesting to note that the results of the diatom analysis
confirm the division of the upper clastic deposit into a silt-clay
and an upper silty-clay; the silt-clay is dominated by Brackish
diatoms whereas the silty-clay is dominated by Marine types.
2) Moors 8
At Moors 8, the upper and lower clastic strata were sampled
for their diatom content. These deposits consisted of seven
strata; 1, 3, 8, 9, 12, 13 and 14. Twelve levels were taken but
only the top five, in strata 12, 13 and 14 yielded frustuleso
These levels are 1~ -90, 2) -80, 3) -10, 4) -60 and 5) -50 em.


VI -,
~~- :I () u. /. ...:t ,... N ..... "o ... ., >
'1/"' '1 /. 5 8 N 01 ~ 'o 0 ~ < N N N
~~ .;)~ w. .. ~
r _] ~~ ·~":1'0 "~"' ~
f ~ ~',.-s .. .;) .......
t ! ·,$..of •• ~--. e ).0~~~ <-$' ~w. ('f:' l ~6-i-" l" ~'1;~·"~·
r OL _] cP ·.PC$• ~· • w.., r ~~("''Sf(·~~ .. J q' ·~c.;R ,o .. ~
~.,~oc,'- f:' :Ir % 1 o e •-.; b' ·., • ~·
r " J 0~~·,., ~~·~o<
~w. ,o ~" r _...._ 1 0( "0 (' ~'1; .. cF b"" ($ .. ~ [ "
_] c; ~ .. ~..;:>.. ~w. .;) .. q" ~ .. ~,q c.;'\~ r e 1 +;._.,tf rft .y.;) tl'~.;) ~0 ..
L s * iii 1 +';I, ., . <• -s ,~-e r :1: _] Q~ ,or.;),o.,~.;)., g r e 1 ~ .... :\c.; .. (:'
'~"'~"oq",.,
H '" .& _] ..... ~.$' ~e ~ .;)~
1 c.;"~O ·r:-~6~ 'I" .. Q .,(:'".;)-.;
_] ~~ ,., <; i :,..cf'ee,., t iii ()'qr.P<:<
1 r " * _] c.Pc
In
f :I ~·
t '1> ~.;)Q'1> e"
<~ ,.-o;;\~~~ ~~· t/j .. o<'r,
"'- +·..,i,L ·,<o '> "-'1>
" 1 +"' ~e~e • ~'1> ~f:'-.; L"<'>
* ;( • _] Q~ '1> »~~e
Tr 1 (5'<:' Q6;'0 ., ..
Vl ...%. 'I" ~ .... ~0
~~ J "'JY ~ ~ * f t . "'""""' •..0
'" ~;_o<fi'" 0 r
e 1 q.:,cf' ,., I- "' e l c? 'li(
.;)"
<( ·G
f f e ~~
- f f:''li .... Cl .• b'"'
i5'' ~'11 ID "'""" o$''1>~o
1~ * +' ea;b~ ~"-• ..:>~ CX) J ( .S'> .. qt-_~'li (( ~..:> <'(.. t
""'-. e +·...i,c.; o$'-"p"~ .... Vl ;I; 1 +'li e'" q c..o "'li
a::: J o<:'e'"~., .._, t )I :-..' ·~
_;IC e Q~c.;,§' ~e ~· ~ • o~ 0 cf 0 0 ·,L .§ 15r 1 c; ~~" ~·of:' •
0 =rr ~ e' "~ .,"--] 00 :,..0<:' c.;ef:' ,'rf c..<o
~ ;r "' 1 ·~ e"• ~' Q ·,< <'
rr -" l ...1.:-._'li 'li
x· ~ <' "-[ " 1 x<~~?f l r '!?l ~,<:'
00 "' ~ .... ~ ~ <v
,/Y. 'it 10 ~
~ 0 0 ~..,) I I I I I .... z ~
~ Y.> i- .., 0 0 "' a; .0 0'_, 0 N
0 10 (I) ~ N l{) I I ...L ...l ...l
... "' ...
0 8 .- ~ dl -' dl -' d]J -' J dl -' I J I .J 1- 0 >-
"' <Jl .., w <v_, ~-' d]J dl-'.!1-' d]J-' J I-' I - I 0:: ,It> ~ c!J-' c!JJc!JJ dl-'-'-' I-' I-' 1-:::) ..... J' ~ ; J dl -' dl -' .!1, -' -' -' c!J OJ I J I - I "' (9 g - ~ ::! ::? ~ :: LL u
'--

~ 69 -
Only 18 valves were found at level 1, but a count of 200 diatom
valves was made at each of the other four levelso A full record
of these counts is given in Appendix IV. The data are presented
graphically in Figures 15a and 15bo
At Moors 8, 34 species of diatoms were identified; the ratio
of F : B : M being 5 : 9 : 20o In the five levels 820 valves were
counted and the ratio ofF a B : M was 16 : 407 : 397o Again we
see that although more Marine species were identified, more
Brackish valves were counted overallo
The two dominant species are Nitzschia navicularis (B b) with
284 valves and Melosira sulcata (M p) with 170 valves. A total of
107 valves of Navicula marina (MB b) were counted but 103 of these
occurred at =50 em. The summary diagrams (Figure l5a) show that
Fresh valves do not vary greatly throughout the core but the
Brackish and Marine valves do vary considerably. Brackish valves
decrease upwards, aw~ from the peat, whereas the Marine valves
increase upwardso This increase is not of a simple nature.
There is a sharp decrease in true Marine (M) valves at the top of
the core but this is accompanied by a very large increase in
Marine-Brackish (MB) valveso The combination of these two curves
gives the overall increase in Marine typeso The summary diagrams
for species reflect changes in the diatom flora 9 similar to those
changes in diatom valveso The Brackish species decline upwards
while the Marine species increase in the same direction 9 to a
peak just below the top=soilo
The summary diagrams for habitat 9 for both valves and
species show that benthonic diatoms dominate throughout the levelso
The species diagram is not so simpleo In the bottom levels the

benthonic species dominate but decrease upwards to -70 em and
then begin to increase. Epiphytic species increase to -70 em
and then decrease, but the number of epiphytic valves remains
constant throughout. Planktonic species remain constant but the
number of valves increases to -60 em and then decrease to the
top of the core. Four LDAZ have been identified at Moors 8
and are outlined below.
LDAZ M8:1 -90 em to £!·-85 em
The dominant species of the first zone are N.navicularis
with 50~ TV and M.sulcata with 16.7~ TV. The upper boundary
bas been put where the rise of Fresh diatoms begins and a sharp
decrease in Brackish species is accompanied by a sharp increase
in Marine species. The Brackish diatoms dominate this zone.
The lifestyle diagram shows that benthonic diatoms dominate, but
are decreasing with increasing planktonic diatoms.
LDAZ M8:2 ~·-85 em to ~--65 em
The dominant species of this zone are !•navicularis with
41·1~ TV at -80 em, ~.sulcata with 22.5~ TV at the same level and
Nitzschia punctata (BM b) with 8.9~ TV at -70 em. The upper
boundary is marked by the increase of M.sulcdta. The zone is
characterised by stable, but low, numbers of Fresh valves, although
Fresh species increase. Brackish diatoms decrease and Marine ones
increase. Brackish types are dominant in this zone. The benthonic
species reach a minimum here although the valves show a steady
decrease. Epiphytic and planktonic species reach a maximum. It is
of interest to note that no Fresh valves or species dre benthonic
here.

- 71 -
LDAZ M8s3 ca.-65 em to ca.-55 em -- -- .
The dominant species in this third zone are N.navicularis
with 39·5~ TV, !•sulcata with 34·5~ TV and !·punctata with 7·5~ TV.
The upper boundary is placed where !-sulc~ta and !-navicularis
begin to decrease sharply, while Diploneis interrupta (B b(e))
and Diploneis smithi (MB e) begin to increase. Fresh diatoms
disappear from this zone. Brackish valves decrease rapidly to be
replaced by rising numbers of Marine valves. The Marine species
(M) reach a peak at -60 em with 42~ of the total species
identified. Benthonic species and valves begin to incre~se
sharply in this zone while epiphytic species decline. A peak of
planktonic valves is seen at -60 em but this level also records a
minimum of planktonic species, this being due to the !arge count of
M.sulcata.
LDAZ M8:4 ~·-55 em to ~·-50 em
This zone is dominated by the species !-marina with 51.2~ TV,
~.interrupta with 10~ TV, D.smithi with 8.5~ TV, Navicula peregrina
(B b) with 8~ TV and M.sulcata with 7~ TV. There is a re-appearance
of Fresh diatoms, a sharp decrease in Brackish valves and an
increase in Marine valves, although Marine speciee decrease in
numbers. The sharp increase in Marine valves is caused by the
rise of MB valves from 6.5~ at -60 em to 62~ at -50 em. This is in
part due to a count of 103 !-marina valves at -50 em. This rise
in Marine valves also can be attributed to the decrease in
N.navicularis. Benthonic valves and species increase greatly in
this zone, while epiphytic species decrease but the number of valves
slightly increase. The opposite is true for planktonic diatoms where
species increase but the number of valves decreases to a minimum.

- 72 -
Once again these four LDAZ correlate reasonably well with
the lithological strata. LDAZ M8tl represents the transitional
organic-silt between the peat below and the cl~ey=silt above,
being dominated by Brackish diatoms. LDAZ M8z2 correlates with
the cl~ey-silt deposit where Fresh diatoms increase and Marine
ones begin to increase as the Brackish diatoms, although dominant,
decrease in numbers. LDAZ M8:3 represents the upper silt-cl~
with Marine diatoms taking over in dominance and the disappearance
of Fresh diatoms. LDAZ M8c4 can be said to represent the top-soil
of the borehole where Fresh diatoms reappear and Marine ones are
dominant. To conclude, Brackish diatoms dominate the bottom
levels of this core but gradually decline in importance upwards
where Marine types take over in dominance. This change-over of
dominance of valves takes place in LDAZ M8:3. Again the
distinction between the upper two clastic deposits is brought out -in the results of the diatom analyses. The lower cl~ey-silt is
dominated by Brackish diatoms whereas the upper silt-cl~ is
dominated by Marine types.
3) Moors 9
At Moors 9 the upper and lower clastic deposits were sampled
for their diatom content. These deposits consist of eight strata;
1, 2, 4 9 13 9 15 9 16 9 17 and 20. Twelve levels were taken but of
these only the upper two levels contained diatom frustuleso
These two levels are 1) -70o5 and 2) =60o5 cmo A full record of
the results are found in Appendix V and are displ~ed in Figure 16.
A total of 30 species of diatoms were identified at this
borehole and the ratio of F a B & M species was 3 : 6 a 21.
336 valves were counted and the ratio ofF 1 B : M was 5: 161 x 170.

FIGURE 16
i~ .... .._<:-
~· (; .....
OQ ~
.,..s <:!Q ~ ~"
20 1. -:-~~reo
17 ~-- 1-' ---1
ll!.l!.I!.L. 20 L.l!.I!.I!.L 60
I!.L.I!.I!.'
11 ~--I -l-70 ---1
- o.3
-04
-03
-0.4
MOORS VALVES
F·FB BF.B.BM:MB:M
SPECIES
F:FB:BF:B:BM:MB:M
10'1.
'lo TOTAL VALVES
9 DIATOMS
F:B:M bF bB:bM
I·
F.B M bF bB bM
IAI-FB~I-----8---i 1-BM--1 t--- MB-----1 M ~
20 L' "'"'"'f- 60
17 1-- I "1- 70 ---1
-03 :{[[LllLilllllllllllllllfllllLl. : -04
Co-ord. SQ•4r01" N 2"05'41"W
Grid r•l. S'f 9492 8717 Fi•ldwork 100622
~ (l, ~ ~ 1-v 1- ~ 0v ~ <>,1-v 1:' 0o(l,.O "~c- "1,_ (l, 0 ~· ~ "~c 0n G',. G' ~ ""o 0o C' "';. v~ ;o"~t\.. ~~ ,..,·.o .. <"<' "a.<"<' 00-'o ,.., 'o -,-,_ 'b ''"" 'l',.?, ">, <;._.'1!-A ~ '<-c ¥..,_% ~ ""o "" .,,, "o ~, ~~ C' "'"' .r: ""?. "c- ., ~ ~ o.... ...... ·\:'o r-~ "'- -r. ~:~ Q..-'.l l' 'o ~ 1>. " ;.r
• ..... ~ '.r ~ "..r <.-~ ~~ ... ~ l',..r ~ ... ~ (ft,._/"~ <"'{0,$-t-.... "..t ':oiJ...".a ~~ :~ "1-,~,1~<t-~~.,t-;p""'....,""'• o~o-<-, ~~ ,_ez; '? "'~., 'o .o "'¥~/v",. .. ..,.c-1~v~.,-~" " ~'c!:!'v "?;..."""" ".-'"" .. v.?~/~ ~-~ v,_, "'\,"~ -~ <:o ".-z-~" .. ":t.,,~ ... .,.."1:."4>~+~ ...... ~, .. ~._.. ""v
""...: 1;. <:o ... q.~ ""~... :r, '•... .,., ~$ "'~:. .-., .-.. .,, ~,: ... ~ .. ~~ ~"'c-,/."t.,:s:t.. ... ~,(' ,., " v v,_ <r v '? 0!," "q. "'"" ... ., """ .-, ... ~ ~ ~~% ~
".r .. "'"" ".r ... .-., "' '%
"" ..... t'"t,.
.. ~
'(, 'v/
l,..~ .... "' ....
b e.p
I~ . . -'--'---'
b·e p
I~
Salinity classes .F ~ FB
~ BF
~B
Ecological classes
tllb rg]e
D BM D MB
OM
0p
FMJS

- 73 -
Overall three dominant species were encountered at this
borehole; Melosira sulcata (M p) with 99 valves, Nitzschia
navicularis (B b) with 84 valves and Nitzschia punctata (BM b)
with 60 valves.
In the summary diagrams (Figure 16) Fresh valves and species
are seen to decrease upwards from the peat. Brackish valves
remain fairly constant although a great decrease in species is
found upwards. The opposite is true of the Marine diaton1s; the
valves increase upwurds but the species are found to decrease in
the same direction. No Fresh valves are found in the upper
silty-clay. The change-over in dominance of Brackish valves, at
the base, to Marine valves, at the top, is due to the decrease of
N.navicularis and the rise in M.sulcata. The lifestyle diagram
shows approximately the same pattern for both valves and species.
Benthonic types dominate the two levels, although valves decrease
as species increase. The epiphytic diatoms decrease upwards as
the planktonic diatoms increase. No zones have been applied to
these data. One can say however that the Marine influence is
strong in the upper silty-cla,y with 37'-fo •rv being ~.sulcata.
4) Moors 10
At Moors 10 eight strata were sampled for diatoms; 1, 2, 3,
14, 16, 17, 18 and 19. Fourteen levels were examined but of these
only the upper eight levels contained diatom frustules. These
were 1) -130, 2) -120 9 3) -110 9 4) -100 9 5) -90 9 6) -80, 7) -70
and 8) -60 em. A full record of these results is found in Appendix
V and can be seen in Figures 17a and 17b.
In total 72 speciea of diatoms were identified, the ralio

[FiGQifE1ia]
.. ~ ... 0
._~ ~0 MOORS 10 ., .. <
~ .. ..,. 6'" <:f ..f'
VALVES F FB BF B:BM:MB:M
111 lc- c cL 60 -02
-18 '" • c •1- 80 -04
-100 -0-6
17
1S fPH==!~120 -0-8
14 L L lo c c c
SPECIES
F:FB:BF:B:BM:MB:M
1& Ic-c "1- 60 -0-2 lo L lo 1..
c • c • c •
181"•"*-80 -04 ~ 1.. ~ L
L lo L •
.. L .. L
---+100 -06 17
1S ft'!=?:==!f,-120 -0-8
14 L. L lo
c - -
Salin1 ty classes
• F B BF
~ FB t?JJj B
DIATOMS
F:B:M bF :bB :bM
F:B:M bF:bB.bM
EcOlogical classes
[:] ' BM D MB !ll 0 tZI 0 M ~ e
b:e:p
b" b:e:p
Co-ords.
p Gnd r•L
Fi•tdwork
SG-41'04-N 2-05'41"W
SY 11411 87!7
8008ZZ
~,. .. .. l
5
4
F"MJS.

Vl :J: 0 t<(
0
0 ~
Vl a:: 0 0 X:
oo "'
N-
/"' N
>. " 6 ... _, I
... 6 I
"1 0 I
ID 6 I
~," "f .. " .. '":Jj:J~."-~'""'"~ I""~" ..... ,~"·)~ ..J I .J•..J .. .J•.J•.J•.J•.J•.J I ..I -'.Jf .J~ .. :.J .. .J .J.J
I .J .. .J "'"'.J .. .J .. .J •.J .. _, .. .J •.J .J ..J f.J .J .J:I; .. _, .J .J .a J .J .J .. .J,. .J .. _, • .J ... .J ,..J ,..J .J .J I .J J .J ....:•:...~.,.,""' .., .J ..
"' 1 ..

- 74 -
of these, according to salinity classes F : B : M was 21 : 14 : 37.
The eight levels yielded 1407 diatom valves and the F : B : M ratio
of these was 95 a 426 : 866. These data are presented in Figures
17a and 17b, and in Appendix V.
Overall there are six dominant species present throughout
these levels; Melosira sulcata {M p) with 370 valves, Nitzschia
punctata (BM b) with 171 valves, Nitzschia navicularis {B b) with
129 valves, Cocconeis scutellum (MB e) with 87 valves, Grammatophora
oceanica v.macilenta (M e) with 82 valves and Dimerogramma minor
v.nana (M b!e1) with 68 valves.
The summary diagrams (Figure 17a) show that Fresh, lirackish
and Marine diatoms fluctuate throughout the levels and no general
trend is apparent in the curves. Five zones are proposed for this
borehole and are outlined below.
LDAZ MlO:l -130 em to ~·-125 em
The dominant species in this first zone are M.sulcata with
26.5/\> TV and N.navicularis with 25.2~ TV. The upper bound!:I.I'y to
this zone is placed where M·aulcata decline. The zone is
characterised by increasing Fresh valves and species and
decreasing Marine and Brackish diatoms. The Marine influence is
strong here. Benthonic valves and species are declining. Epiphytic
valves increase, although the species remain constant. Planktonic
species increase while the valves decrease.
LDAZ Ml0:2 ·~.-125 em to ~.-115 em
The dominant species in this zone are !·navicularis with
16.6~ TV and !!_.sulcata with 16.l'fo TV. 'l'he upper boundary was

- 75 -
placed where !-sulcata begins to increase sharply and Diploneis
interrupta (B bra•) begin to increase. Fresh diatoms reach a
peak in this zone at -120 em before they begin to decline.
Brackish species reach a minimum at the same level although the
valves are constant. Marine valves and species also reach a
minimum in this zone befOre increasing. Benthonic diatoms
become constant ~hila epiphytic diatoms increase. Planktonic valves
decrease but species increase.
LDAZ Ml0:3 ~--115 em to ~--9? em
The dominant species in this zone are M.sulcata with 42.2~ TV
at -100 em, !•Punctata with 15.7~ TV at the same level,
N.navicularis with 11.3~ TV at •110 em and D.interrupta with 7~ TV
at the same level. The upper boundary is marked by a decline in
~.sulcata, an increase in Q.scutellum and where N.navicularis
decreases to a minimum. Fresh diatoms remain constant and low
here. Brackish species remain stable but the valve numbers drop.
Marine diatoms increase in this zone. Benthonic valves reach a
maximum while epiphytic diatoms are at a minimum. Planktonic
species remain constant, although the number of valves reaches a
peak at -100 em.
LDAZ Ml0:4 ~o-95 em to ~·-65 em
The dominant species in this zone are M.sulcata with 26~ TV
at -70 em, !·punctata with 19.2~ TV at -80 em, Q-oceanica v.~ilen~~
with 12.1~ TV at the same level, Q.seutel1Uf!!. with 10.6/c •rv ::J.t.
-90 em and ~.minor v.~ with 6.5~ TV at -70 em. The upper
boundary was placed where !•PUnctata begins to decrease rupidly
as does Q.oceanica v.macilenta and ~.navicularis increases again.
·!.

76 -
Decreasing Fresh diatoms are found in this zone together with
increasing Brackish and Marine diatoms. Marine diatoms dominate
this zone. The benthonic valves remain constant hare although
the species reach a minimum at -80 em. Epiphytic diatoms reach
a peak at this same level. Planktonic valves also reach a minimum
at -80 em.
LDAZ Ml0:5 ~·-65 em to -60 em
The dominant species in this last zone are M.sulcata with
46~ TV, !-navicularis with 10.5~ TV and Diploneis didyma (MB b)
with 8. 5~ TV. Fresh diatoms continue to decrease in this zone as
do Brackish valves, although Brackish species increase. There is
also an increase in Marine diatoms. Benthonic diatoms reach a
constant state ovei<ul, but epiphytic types decrease. 'l'here is a
sharp rise in plar~tonic diatoms caused by ~.sulcata.
Again a close correlation exists between the lithological
strata of the core and these LDAZ. LDAZ MlO:l represents the
peaty-silt at the base of the sampled l83ers. Here the main
water type appears to have been Marine although a relatively
large amount of Fresh water must have been close to the site at
the time of deposition. LDAZ Ml0:2 can be said to represent the
orge:mic stratum 15, with the large contribution of !<'rash diutODII:J.
Here a decrease of Murine diatoms is found but they are utill
dominant in numbers. LDAZ Ml0:3 correlates with strata 16 and 17,
the silt which is overlain by a peaty-silt. This zone is once
again Marine in nature but with an increase of Brackish diatoms.
LDAZ Ml0:4 represents the peat-silt of stratum 18. The Fresh
diatoms show a rise at the base of this zone but steadily decrease
throughout. The Marine influence is again strong with a peak at

- 77 -
-80 em, in the middle of the stratum. Epiphytic diatoms begin to
increase to the top of this zone. LDAZ Ml0s5 correlates with the
transitional. stratum 19. Fresh diatoms decrease and Marine ones
inc1·ease in numbers.
3:2 STUDLAND HEATH
3:2zl Stratigraphy
The site known as Studland Heath is located on the peninsula
to the north of Studland Heath (Figure 18). It is found to the
west of the main road from Studland to the ferry terminus on the
east of Brand's BS¥• The site is a saltmarsh adjacent to the
tidal flats of Brand's Bay. It is a wetland but does not get
totally inundated in the tidal regime of the bays
A total of eleven boreholes were taken at this site, in two
perpendicular gridlines, intersecting at SH 4 (Figure 19).
SH 1 to SH 8 (SZ 0231 8473 to SZ 0228 8490) were taken at intervals
of 25 m, while SH 4a to SH 4h {SZ 0228 8480 to SZ 0230 8480) were
taken at intervals of 5 m. This second transect, SH 4a to SH 4h,
was taken in order to ascertain the extent of the organic deposit
found in SH 4 9 which was the only borehole in the original
transect to produce a peat deposit. The ground level of these
boreholes varies from + ld81 m~O.D. at SH 1 to + 1.53 m.O.D. at
SH 5· All boreholes were taken using a Russian-type sampler 9 with
the exception of SH 4h which was sampled with a Percussion corer.
The stratigraphy of the boreholes was taken in the field and
samples for pollen and diatom analyses were taken from SH 4b at the
siteo The core SH 4h was taken back to Durham for further analy8es.

~:~~NDFORD /;..,;,~~~ . • I·~· -y'
- Ridge
LEGEND
~ H1gh water mark
0 Low water mark
tj Dra1nage ditches
0 8m Contour
0 91 m Contour
[) Built up area
STUDLAND HEATH SITE
~·
""'
(\ CORFE . 'r. .. CASTLE
395
POOLE
·-----.._
SCALE 1 25,000 0 1 2 Km
.~ .. ~.~ STUDLAND ;,·.'
:~.· ...
N
i I FIGURE 18[
"(/
')TUDLA~
•(g;~. H[A;; r '\-;;------., 3Swaf\a~
l-'s..., v~ ... NNE~ ,, ~~-
~-Handfast Po1nt

STUDLAND HEATH BOREHOLES
oo 0
oo
85
0
~L water ~·-
Po;"' \
r ST 'S · 'BRAND I
I
~
/\, .. NEWTON
G> •
-----
• f" • i GRHNLANO. •· /
N
t 0
._;
FMJS
~- -----------
~tbm
•
STUDL_ANO HEATH
) -,
02 ______ j_
03
LITTLE
SEA
"'""- 0 '·
--- --l- -
0
...
...
...
LEGEND
0 Borehole
0 Temporary bm
0 HWMMT
[2] LWMMT
El Marsh
El Sal tongs
El Rough grassland
0 B1
---I 'fiGURE 19 ! I __ _
-fl ~ ~
-..I
§ " ""
furz•
Scrub
as
SCALE
100 0 100m o.------~
~ Non-conoferous trtu
[!] Conoferous trees

- 78 -
The stratigraphy of thts site is very complex and can be
seen in Figure 20. As rrtentioned previously orga.nic material was
only found at SH 4, in the original transect while it was found in
all boreholes of the second east-west transect. It may be more simple
to describe the stratigraphy of these tvw transects separa. tely with
altitudes quoted indicating the upper contact of the deposit.
The main transect, SH l to SH 8, is found to be predomin;-.ntly
clastic with one organic band in SH 4. These boreholes reveal a
four-part stratigraphy, a basal sand overlain by a silty-clayey sand
which is topped by a sandy-silt and above all is a mixed band of
top-soil material. The basal sand increases in depth from ll em
in SH 8 to 54 em in SH 3. This sand deposit is composed of a lower
pure sand or gravelly-sand, as found in SH 7, 6, 5 and 4, and an upper
silty-sand which is found in all boreholes except SH 5· The altitude
of this deposit ranges from + 0.99 m.O.D. in SH 8 to + 0.62 m.O.D.
in SH 5 and back to + 0.94 ro.O.D. in SH 3, thus it forms a 'basin
shaped' formation. In SH 4 and SH 5 this basal sand deposit has been
interrupted by a thin band of sandy-cl~·ey-silt (Ga 1, As 1, Ag 2)
which is only 7 em deep at its thic~est in SH 4. This ranges in
altitu~a from + 0.58 m.O.D. in SH 4 to + 0.46 m.O.D. in SH 5· The
second stratigraphic<il unit is a sil t,y-clayey-sand (Ag l, As l, ,}a 2)
which is found in SH 4 to SH 6. 'l'his deposit varies in thi ::::lmess
f:::-om 16 em in SH 5 to 25 em in ::JH 6 and ranges in altitude from
+ 1.06 m.O.D. in SH 4 to + 0.78 m.O.D. in SH 5· Above this is found
a band of clayey-sandy-silt (As 1, Ga 1, Ag 2) which is found in all
boreholes e~cept SH 3. This upper clastic deposit rQnges in
altitude from+ 1.17 n.O.D. in SH 6 to+ 1.0.3 !n.O.D. in SH 8 and
varies in thickness from 8 em in SH 4 to 46 em in SH 7• This deposit is

STU OLAND STRATIGRAPHY
mOO
•1·5
•1·0-
•(} 5
0-
-o 5
-10-
-1 5
LEGE NO
SH 1 sz 0231 8473
R
r-:
SH 2 SH 3 sz 0230 8475 sz 0230 8478
R R
Limlsupl 1
Lomlsupl 2
SH 4 sz 0229 8480
R
. ..
b) Sh Undifferentiated organic matenal 0 G::J Th Roots of herbaceous plants EJ !:] Th IPhra.l Roots of Phragmotes ® Sampled for macrofossils
fll [;]
0 [;)
~
As (lay
Ag Silt Ga Sand
Gglminl Fine gravel
Gg!maJl Medium gravel
R = Russ1an sampler, P= Percussion corer
Homontal Scale
10 0 10 SOm
SH 5 sz om84&3
R
SH 4a sz 0228 841!0
R
~~ .._ .. ~I
~+~k ..... ..... ..... :~~
,_, .....
4~
! l
SH 6 sz 0228 8485
R
SH 4 sz 02Z98480
R
~ ...... ~.i].: . .. -·•
SH 7 sz 0228 8487
R
~
-· . --· -·. -· -·--· -_~·:··!.· _ ....
··-··'
SH 4b/4h sz 0230 8480
R® P
Fr ~tr '"-lo ~I '-·
®
__ , 1'7:
--
I FIGURE 20 I
SH 8 sz 0228 8490
~
m.OO
•15
r-•1·0
•0·5
r- 0
-0·5
FI·US

- 19 -
capped by a finer clayey-silt of 8 om in SH 5· This clayey-silt
also appears in SH 6, but in a basal position to the
olayey-san~-silt. The upper deposit found in all boreholes is
a mixed peaty-silt, which is probably associated with the
top-soil. This deposit ranges in thickness from 39 em in SH 5
to 71 em in SH 3.
The exceptions to this general stratigraphic description
are SH 1, SH 2 and SH 4. SH l was found to be composed only of
sand while SH 2 had 2 m of sand above a blue clay. SH 4 will be
dealt with in the next section on the stratigraphy of the second
transect.
The east-west transect includes boreholes SH 4a, SH 4, SH 4b
and SH 4h. Again a generalised stratigraphic scheme of four
deposits can be recognised; a lower sand, an org~ic deposit,
an upper clastic deposit and the top-soil. The lower deposit is
again a sand which ranges in altitude from + 0.02 m.o.D. in SH 4h
to - 0.72 m.O.D. in SH 4b and varies in thickness from 66 em in
SH 4h to 5 em in SH 4a. This deposit, in SH 4h, includes 32 em
of gravelly-sand. Above this sand deposit is the organic
material which is present in all boreholes. This is a mixed
herbaceous peat which ranges in altitude from + 0.31 m.O.D. in
SH 4b to + 0.11 m.O.D. in SH 4a and varies in thickness from
17 em in SH 4h to 103 em in SH 4b. At SH 4a the peat is overlain
by 58 em of transitional material with 2 em of intercalated
clayey-silt at + 0.40 m.O.D. This transitional material is also
found in SH 4b where 31 em of material is present. The upper
clastic depoei t found in all boreholes above the peat is not of
a uniform nature. A silty-sand is found immediately above the

- 80 ~
peat in SH 4h. In SH 4a, 3 em of this silty-sand is found at
+ Oa75 m.O.D. At SH 4 the peat is overlain by 26 em of
cl~ey-silt with 14 em of sand intercalated at + 0.43 meO.D.
before reaching the silty-sand found in SH 4h and SH 4b. The
silt-sand deposit, found in the first transect, is also found
here ranging in altitude from + 1.06 m.O.D. in SH 4 to + 0.80 m.O.D.
in SH 4a and varying in thickness from 9 em in SH 4a to 23 em in
SH 4b. Again a band of cl~ey-silt is found, as in the first
transect, at the top of the clastic material in SH 4a and SH 4.
This ranges in altitude from + 1.14 m.O.D. in SH 4 to + 0.96 m.o.D.
in SH 4a and varies in thickness from 16 em in SH 4a to 8 em in
SH 4. These deposits are not found in SH 4h but are replaced by
27 em of gravelly-sand with 5 em of transitional peaty-silt at
+ 0.44 m.u.D. Again all three boreholes SH 4a, SH 4 and SH 4b
are topped by a transitional deposit which is probably associated
with a top-soil.
Thus in the first transect we find a wedge-shaped deposit of
sand which increases in thickness southwards to SH 1. This is
capped with a silty-cla~ey-sand of uniform thickness extending
to SH 4. Above this is another wedge-shaped deposit of
cl~ey-sandy-silt which decreases in thickness southwards. The
sequence of strata is not so clear in the second transect. The
sand deposit, at the base of the cores 9 increases in thickness
inland, aw~ from the river 9 and is capped by a peat which attains
its maximum thickness and altitude in SH 4b. Above this peat the
strata can not be described in any clear pattern.
As mentioned earlier cores SH 4h and SH 4b were sampled for
microfossil analyses. The detailed stratigraphy of these cores is
given below.

- 81 ~
The stratigraphy of SH 4b.
Stratum Height Depth Description
9)
8)
7)
6)
5)
4)
3)
2)
1)
m.O.D. em.
+1.61 to
+1.16
+lol6 to
+0.98
+0.98 to
+0.75
+0.75 to
+0.62
+0.62 to
+0.56
+0.56 to
+0~36
+0.36 to
+0e3l
+0.31 to
-0.72
-0.72 to
-0.84
0 Ag 29 As 1, Th 1. to Nig 29 Strf o, Elas o, Sicc 3. 45 Light organic silt.
45 Ag 2, As 1 9 Th 1 9 Ga +• to Nig 2+, Strf 0, Elas o, Sicc 3-, L(s) +. 63 Light organic silt with sand.
63 aa 2 9 Ag 2, As +, Th +· to Nig 3-, Strf o, Elas o, Sicc 2, L(s) +. 86 Darker silt-sand with organic remains.
86 Ga 39 Ag 1 9 Th +. to Nig 2+, Strf 0 9 Elas 0 9 Sicc 2 9 L(s) 1. 99 Silty-sand with organic remains.
99 Sh 2 9 aa 1, Ag 1. to Nig 3-, Strf O, Elas +, Sicc 2 9 L(s) 1. 105 Dark peat with sand and silt partings.
105 Sh 2, Th(Phrag) 1, Ag 1. to Nig 29 Strf O, Elas 0 9 Sicc 29 L(s) 1. 125 Lighter silty-peat with Plragmites.
125 Sh 1 9 Th (Phrag) 1 9 Ga 1 9 Ag 1. to Nig 2+, Strf 0, Elas 0 9 Sicc 2, L(s) l. 130 Mixed transitional deposit.
130 Sh 39 Th 1, Th(Phrag) +• to Nig 2+ 9 Strf 0, Elas 1, Sicc 2, L(s) 1. 233 Light peat ~ith Phragmites.
233 Ga 4, Sh +. to Nig 2+ 9 Strf 0, Elas 0 9 Sicc 2, L(s) 2. 245 Sand with some organic remains.
At this borehole only stratum 2 was sampled for pollen.
The stratigraphy of SH 4h.
Stratum Height Depth Description
12)
11)
10)
m.o.D. om.
+0.57 to
+0o54
+0.54 to
+0.49
+0.49 to
+0.44
96 not sampled. to 99
99 Ga 39 Gg(min) 1 9 Ag +• to Nig 2+, Strf 0 9 Elas o, Sicc 3, L(s) 1. 104 Grey gravelly-sand.
104 Ga 39 Gg(min) 1, Th +. to Nig 3, Strf o, Elas 0 9 Sioc 3 9 L(s) +o 109 Darker gravelly-sand with organic remuino.

- 82 -
Stratum Height Depth Description
m.O.D. em.
9) +0.44 109 Ag 2, Ga 1, '::'h l. to to Nig 3+, Strf o, Elas o, Sicc 3, L(s) l.
+0.39 114 Dark sandy-silt with or._5anic remains.
8) +0.39 114 Ja 3, Gg(min) 1, Ag +. to to Nig 3, Strf 0, :!!.1 as o, Sicc 3, L(s) +.
+0.33 120 Dark gravelly-sand.
7) +0.33 120 Ga 2, Gg(min) 2, Ag +· to to l;ig 3m Strf o, Elas o, Sicc 3, L(s) +.
+0.22 131 Dark Jravel-sand.
6) +0.22 131 ·}a 3, Ag 1, Gg\min) +. to to Nig 3, Strf 0, Elas o, Sicc 3, L(s) +.
+0.19 134 Dark silty-sand.
5) +0•19 134 Sh 3, Th 1, Ag +· to to Nig 4, Strf 0, Elas 1' Sicc 3, L(s) 2.
+0.02 151 Very dark peat.
4) +0.02 151 Ga 4, Gg(min) +, Sh +· to to Nig 2+, Strf 0, Elas 0, Sicc 3, L(s) l.
-0.12 165 Light sand with organic remains.
3) -0.12 165 Ga 2, Gg(min) 2. to to 1fig 2m Strf o, Elas o, Sicc 3, L(s) 2.
-0.44 197 Light sand-gravel.
2) -0.44 197 Ga 4, Ag +, Gg(maj) +· to to Nig 2, Strf 0, Elas o, Sicc 2, L(s) +·
-0.52 205 Light sand with large pebbles.
1) -0.52 205 Ga 3, Ag 1, Jg(maj) +· to to Nig 2; Strf 0, Elas 0, c· ..;lCC 3, L(s) +.
-0.64 217 Light silty-sand with pebbles.
8trata 4, 5 and 6 were sampled for their pollen content.
3:2:2 PolJen Analyses
'l'wo boreholes at the Studland Heath site were swnpled for their
pollen content; these were SH 4b and SH 4h. These two boreholes ~ere
taken adjacent to each other but SH 4b was s:1mpled with a Russian-
type sampler, samples for pollen analyses being taken in the field.
This core provided the greatest depth of orgOl.nic material, with over
100 em be in~ recovered. Borehole SH 4h was tak:en with a Percussion
corer. It was hoped that a similar amount of organic material would
be recovered but only 17 em was found due to compaction of the sediments
during s~~plin~ and extraction of the core. The detailed ~nalyses

[FIGURE 21]
f ~
9 l" ~0
STUDLAND HEATH 4B Land Pollen 0/o Total ,_<:-<fi' .f
->' # ., .... <
l f:.:·:·~
-I-_, --1-' ---1 I--~-__ ,_ ---1 1--- I __ ,
--·-___ , I ___ ,
2 1- 1- _
--·----1 1--- I-_, --I_, ---1 1---1---- I-: ___ , 1--
-·--
.:s ~ .... (l~ ~,o;
140 -•0-2
160 -0
-
180 -0-2
-
200 -04
-
220 -0-6
Co-OI'd 50•39'43,. N 1•se·oJ ·w
Gr•d rei SZ 0230 8480
F~ldworll 520804
"o" "o ..,..-'1 ->' ..,..rP
r r-o.--,....,...,r~,r-o-,~r-.r-o ...,~ r-o r-,~ r'""...,r'rrrr...,...,rr"..., ...,...,rrC'r-.~r 7
10 tx ~ ~ ~ ... ..... ...... >+< "' ..... .. ~ ~ ~ 343 520 4 " ~ I"" .. .. ... ... ...._. >+-< 1 >+< ... r .._. 2 5 367
9 ~~ ..,. 1M 1+1 1-+4 • ~ II - 578 361
8 ~ l4ol If! - t+t .. .... 1+1 557 377
7 ~~ " ~ .... .... ~ ...... ..... ... ....... .. ..... 229 441 3 6 ~~ 1+1 ... I+< t+4 .. 1+1 • ... 537 291
5 ~~ "' ~ ..... ~ ...... ... ....... .... 293 283
4 ~~~ .. .... ... ....... ... ...... .... 292 327 2 l :888: ~- .. ~ ...... Ilk *' ... 386358
2 :888: ... • ~ ... • Ito! ... 612 297
1 ~>'/"/~ ... ~ ~ *I 1+4 ... 449 243 1 w__.'--'--'~-'--'-~--''-'w!......_.__..__.--'--' __,L.,~ __.w w~ ~__.w~w~__.wwL..w w__, __, __,ww L_,__. _,_.wwL..w~w
0 TREES
~ SHRUBS
<\,..o'? V~ 0'-t'll ~/,.""1~ ~~~ "o,.. ~ ..... ~.r ".t .... (" ~ ".r +,~..,.(...J" .),../.
'i ".s "s ".r .s~:/1!11+ -'yt!'O!C"·~
~ ~ ..... $""'$
t2J hERBS
• AQUATICS
~ SPORES
~~ -~ 1;."' G'~~ 'C"$ ,"""'"""""c.. ?J,.,C!I:
lj,. 't '? "l" "'" "'.o..
~q.,0o~~;:~{•/i""-0~,_ 'Po~~~'P,_?,"";_,,;"•~_,'%_,"-./,.~,_":0;.-o:'"':O~.S.,._ ~."~$~;~~~"~: ~~;~:~ .. ""~;: ~~-~~~!.,;f"';::~,_~:z:, ~ 1!11 ~ ~ l" ..,C": '\. l" '?. ~ .1t' 'o 'o ';}
,(..; ~ ~ l"c!l._ "{ti("C!I:;(/A '? ~ci' ~ ;s> <>,. .,. o~.,,.
'~ C>
"' "..;(.. •/c.-.,
'\.· q't"
F"MJS

- 83 -
of the pollen from these two cores will be described in the
following section.
1) Studland Heath 4b
At this borehole only one stratum was sampled for pollen;
stratum 2, the mixed herbaceous peat. Eleven samples were taken
in the field at 10 em intervals through the organic material.
These samples were l) -230, 2) -220, 3) -210, 4) -200, 5) -190,
6) -180, 7) -170, 8) -160, 9) -150, 10) -140 ~d 11) -130 em.
A pollen sum of at least 50 tree. pollen was counted. In some levels
(3, 4, 6, 10 and 11) a count of 100 tree pollen was possible. In
all cases a minimum of 200 Lycopodium spores were counted. The
data are displayed as percentages of the total land pollen (TLP)
for comparison with other sites. The results of this analysis
can be found in Appendix IV and seen in Fi.=sure 21. ]!,our LPAZ
have been identified a.t this borehole and are described below.
~PAZ SH ~b;l -230 em to ca.-225 em
This first zone is dominated by shrub pollen. The most
important tree pollen comes from ~uercus with 15.7~ TLP and Alnus
•.,rith 8;~ 'l'1P. Jramineae e1.re the most ioportunt ljAP with 28.);"' TLP.
Cor,ylus pollen reaches 247~ T1P, Calluna has 17 .6~o 'I'LP 3.nd Sph&-6num
reaches 14. 11.) '~:"P + ~-;?ores. The major dry-land tree pollen comes from
Quercus with 59)1> of trees. As to be expected Grarnineae pollen are
found in the greatest concentrations with 49.8 x 10² Grains/cc.
Corylus pollen records a concentration of 41.9 x 10² grains/co.
The concentration of Calluna and Sphagnum are both 30.7 x 10²
grains/co while ~uercus pollen drops to a concentration of
'J7 ' X 102 -~a· I '- olf - 0-'- lns, cc 0 The upper boundary of this first zone was
placed where '.guercus pollen drops from 15•7/'v TLP to 9'/<; TLP, CalJ.una

- 84 -
increases from 17 .6ib TLP to 42;0 'I'LP, }rarnineae f9.ll from
28.5}:. TLP to 11~:> 'l'LP and Sphagnum spores dr:::cret:l.se from 14. 77:> TLP
plus Spores to 8.7~ TLP + Spores.
LPAZ SH 4b:2 ~--2~5 em to ca.-185 em
This zone is characterised by a domindnce of shrub pollen
through the lower three levels but 9. dominance of herb pollen at
the top of the zone. The most imr•ortt:l.nt tree pollen arises from
Quercus with 12.6~ TLP at -210 em while Alnus has 5.6~ TLP at the
same level. Gra~ineae are again the dominant NAP with 43.3~ TLP
at -190 em, which accounts for the dominance of herb pollen at this
level. Calluna pollen has increased to 42~ TLP at -220 em while
Corylus is represented by 41~ TLP at -200 em. Sphagnum once
again is high with 19·2p TLP +Spores at -200 em. Fraxinus pollen
is first found in this ::-.one Hhile Ilex pollen is only found here.
The major dry-land tree pollen comes from Quercus with )8~ of
trees at -190 ern, Betula with 1876 of trees at -200 em and from
Tilia with 8~ of trees at the same level. It is interesting to
note that although Grarnineae are seen to have the highest
representation of the TLP, Calluna pollen records the highest
concentration with 88.3 x 10² grains/co at -220 em. Coryl~~
pollen also has ti high concentration with 49.1 x 10² grains/cs at
:..220 em, although the highest percentage of TLP was recorded at
-200 em. Grarnineae records a concentration of 40.3 x 10² grainsjcc
at -190 em. Sphc.'Illum spores have a concentration of 21.2 x 10²
grains/cc at -190 em, again not at the level that records the highest
percentage count. The upper boundary of this zone was pl~ced
where Alnus pollen increases from 2 .6jo TLP to 7 .4~6 TLP, C9.lluna
pollen incro:J.c,,,:oes from 5·27J 'l'L? to 24.2(;.> TL? 3-.Yld .}rarnineae fall from

- 85 -
43·3~ TLP to 15.1~ TLP.
LPAZ SH 4b:3 ~.-185 to ~.-165 em
This zone is again characterised by a dominance of shrub
pollen. Once again .ctuercus pollen is the most important
representative of the tree pollen l'i'i th l7'fo TLP at -170 em.
Corylus pollen is the dominant NAP with 27.8~ TLP at -180 em.
Calluna pollen has a record of 24.2~ TLP at -180 em, Gramine~e
have 23.9~ TLP at -170 em and at the sa~e level Sphagnum spores
record 19.2~ TLP + Spores. The major dry-land trees are identified
as ~uercus with 60~ of trees at -170 em and Pinus with 7~ of
tree pollen at -180 em. Four species of pollen are only found
in this zona, these are Viburnum, Rumex, Succisa ru1d Cruciferae.
Corylus pollen recorda the greatest concentration with 45 x 102
grains/co at -180 em, Calluna pollen has a concentration of
39.2 x 10² grains/co at -180 em while at the same level Sphagnum
spores show a concentration of 37.7 x 10² grainsjcc and Gramineae
' 2 have 24.5 x 10 grains/co. These last two taxa both record their
highest percentages of TLP at -170 em. The upper boundary is
marked by a fall in 5uercus pollen from 17;6 TLP to 12.1;b TLP, an
increase in Calluna pollen from 16.5~ TLP to 27.4~ TLP and a fall
in Gramineae from 23.9~ TLP to 10.4~ TLP.
LPAZ SH 4b:4 ~.-165 em to -130 em
This last zone is characterised by a dominance of shrub pollen
at all levels except -140 em, where spores are dominant. A~uatic
pollen first appears at the top of this zone. The most important
tree pollen comes from ~uercus with 12.1~ TLP at -160 em and Alnus
with 11.8~ TLP at -140 em. Calluna is the most important shrub

- 86 -
with 27.4~ TLP at -160 em, while Corylus pollen has 27.3~ TLP
at -130 em. Gramineae record 17. 57o TLP at -140 em. The
dominance of spores at -140 em is due to the high percentage of
Sphagnum with 35~ TLP + Spores. The major dry-land tree pollen
comes from ~uercus with 51~ of trees at -160 em, Pinus with
1670 of trees at -130 em and Ulmus with 14;~ of trees at -130 em.
Five species are only found in this last zone. These are Fagus,
Polygonaceae, Potamogeton and Typha }atifolia. Sphagnum records
the highest concentrations with 46 x 102 grains/co at -150 em.
Calluna pollen has a concentration of 34.8 x 10² grains/co at
-160 ern, Corylus pollen records 33.3 x 10² grains/co at the same
level and ·Jramineae have a concentration of 16-3 x 10~ grains/ cc
at -150 em.
Thus we have a stratum of peat which does not have a uniform
nature, as might be expected from the stratigraphic description.
Shrub pollen dominates throughout the levels, except at -190 em
where herb pollen is dominant, as shown by the high Gramineae
presence, and at -140 ern where spores dominate. Corylus and
Calluna pollen makes up the dominant shrubs throughout the levels
with Gramineae being the dominant herb pollen. Quercus remains
the most impor·tant tree pollen throughout but is pr•3sent in
relatively low frequencies. The bottom t.l-10 zones are domintlted by
Gramineae pollen while L~~ SH 4b:3 is dominated by Corylus pollen
and LPAZ SH 4b:4 is dominated by Calluna pollen. Aquatic pollen
is only found in the top level where the boundary with stratum
3 9 the transitional deposit, is present.
Studland Heath 4b was chosen to represent this site due to
the depth of org~nic material in the borehole.

- 87 -
Dating of the LPAZ of Studland Heath 4b.
One organic stratum was found at SH 4b from + 0.31 m.O.D.
(-130 em) to - 0.72 m.O.D. (-233 em). This stratum was overlain
by a sandy deposit with a transitional silty-peat intercalated.
Four LPAZ were recognised at this borehole, which are summarised
below with their dominant AP and NAP.
Table 11 Dating of LPAZ at Studland Heath 4bo
Flandrian Altitude Depth Dominant Dominant Domin an t
Chronozone LPAZ (m.O.Do) (em.) Lifegroup AP NAP ----~
SH 4b:4 +0.31 to -130 Shrubs & Q-A-P-U Sph-Gr--0.04 to -165 Spores Er-Co.
------
SH 4b:3 -0.04 to -165 Shrubs Q-A Sph-ilr--0.24 to -185 Co+Er.
III -- --·----·- - r------ ·---------
SH 4ba2 -0.24 to -185 Shrubs & Q-A-B-T Gr-Co--0.64 to -225 Herbs Sph-Er.
SH 4b:l -0.64 to -225 Shrubs Q-A Gr-Sph--0.69 to -230 Co-Er.
---
These four LPAZ are all th~ught to belong to the early part of
Flandrian Chronozone III (Godwin's Zone VIIb). Quercus values are
all greater than 69~ of the tree pollen throughout the LPAZo
2) Studland Heath 4ho
At SH 4h three strata were sampled for their pollen content,
these were stratum 49 the lower sand below the mixed herbaceous
peat of stratum 5 and stratum 6 9 the silty-sand above the peato
15 samples were taken in total at 1 em intervals over the upper and
lower transitional levels of the peat and at 2 em intervals through
the main body of peat. These levels are 1) -153 9 2) -151, 3) -150 9
4) =149, 5) -148, 6) -147, 7) -145, 8) -143, 9) -141, 10) -139,

~
c QJ --0
0..
"'C c "' _J
:::r:: t<( U.J :::r::
Cl z <( _J
0 :::> tV)
00~,:. 'v. !5,:
'\-
'<._, ~
"'"o
"'" ,., vJJ'
-4'~ m N -I
~ ~ :::1~ ~ "' "'"'" Cl .,.
"' "' - "' Cl
... ~~~~~ ~ ~ .,.
"' ... ,._ N N- .,. :!! ... "' .,. .,. N~l"''fPI o;
"' , ,,... ,.....
Cl Cl Cl ., ,.... ,.. ..... "'
r .I _._]
'I§ ' ! l i i t I f J i I
r .I _j
r • _j r I J r ~ J r .I J r r l [ _I_ r _l_
r .I [ r [
r I _j _j
r ~ .I J I
i l •I ~ f i l t ~ ' ' .
r-~ f +-a---=~-==-~--~-.. - --- -- ~---i
i I lt,o i I I f I I I
I l l J .. ·1... + T T + ' ' +
f
[ J r l J r J
I i l f f t
! I 1 1 f I t I 1 1!
[ J
I • •I~ • • • • r l r i ~ • i i • I • • •_!__.__._ J r • I • • • • . I • • l • _l
I f
I 1 f I t I
I • . . l
~li'i~r~ "' !>!!~<~"'~
,;, ~lblb = !;> m .:. :.. I .:. .:. i-. N -
"' ;; 6 0 I
0 ~ ;! I I
• J •• I- I I I- I I I- I I I- I I 1- I I 1- I I I -I - J - -- -I I I- I I I -I I I- I I I- I I I- I I I- I I
I I I- I I I- I I I- I I I- I I I- I I I- I II I I- I I I- I I I- I I I- I I I- I I I- I I I-
0
j i ~ a ~ 011111!§1·~
z ~ ~
i!: ~ ~ ~ ~
" ~
! " .3
"' , :1 ...

- 88 -
11) -137, 12) -136 9 13) -135 9 14) -134 and 15) -133 em. A
pollen sum of 150 tree pollen was counted through the main body
of peat but levels 1 to 4 were counted to 75 tree pollen while
the upper two levels 9 14 and 15 9 were counted to 100 and 50 tree
pollen. Due to an error in the preparation the number of Lycopodium
marker spore tablets added to the samples was not uniform; levels
1 to 5 received 5 tablets, levels 6 to 9 received none and levels
10 to 15 received 1 tablet. As a result the concentration figures
were corrected to indicate the concentration of pollen in levels
1 to 5 if one tablet had been added instead of five. The results
of this analysis can be seen in Figure 22 and a full table of counts
is given in Appendix IV.
Four LPAZ were identified at this borehole. LPAZ SH 4h:3 has
been divided into two sub-zones 3a and 3b, on the basis of changes
in the NAP curves, namely Corylus, Gramineae and Sphagnum, although
no changes are seen in the AP curves. These four LPAZ are described
in detail 'below.
LPAZ SH 4h:l -153 em to £!·-152 om
This first zone is characterised by a dominance of shrub pollen.
Tree pollen are at their greatest percentages in this zone but are
decreasing rapidly. The most important tree pollen comes from
Pinus with 28.9~ TLP. Ericaceae pollen is represented in the
greatest numbers with 34~ TLP while Corylus pollen accounts for
32.8~ TLP. The concentration figures are low in this zone with
Ericaoeae only having 5·3 x 102 grains/co. The upper boundary is
placed where Pinus pollen falls from 2b.9~ TLP to 10.7~ TLP,
Corylus pollen increases from 32.8~ TLP to 52.5~ TLP and Sphagnum
first appears.

- 89 -
LPAZ SH 4hs2 £!·-152 em to ~·-146 em
This zone is still dominated by shrub pollen but this is
decreasing while herb pollen and spores increase. Pinus pollen
still represents the most important tree with 10.7~ TLP at -151 em,
~uercus pollen records l~ TLP at -147 em and Ulmus pollen has
1.2~ TLP at -149 em. Corylus is the dominant NAP with 60.5~ TLP
at -149 em, Ericaceae pollen is represented by 32~ TLP at -151 em
while Sphagnum bas 26.7~ TLP + Spores at -147 em and at the same
level Gramineae pollen records 13.8~ TLP. Tilia and Fraxinus
pollen is first recorded in this zone while Hedera and Leguminosae
pollen is only found here. Pollen concentrations of Corylus are
very high with 205.2 x 10² grains/co at -149 em while at the same
level the concentration of Sphagnum is 57·5 x 102 grains/co and
Calluna has 50.6 x 10² grains/cc. Pinus and Ulmus also have high
concentrations. The upper boundary to this zone is drawn where
Pinus decreases from 7.6~ TLP to 1.9~ TLP and Ulmus increases from
3.4~ T~P to 8.5% TLP. At this boundary Corylus pollen drops from
49.6~ TLP to 41.6~ TLP.
LPAZ SH 4h:3a ~·-146 em to £!·-135·5 em
The dominant life group in this sub-zone is once again shrub
pollen. Quercus constitutes the most important tree pollen with
13~ TLP at -141 em. Corylus is still the dominant NAP with
41.6~ TLP at -145 em, Gramineae pollen has 28.7~ TLP at -136 em
and Sphagnum makes up 29.5~ TLP + Spores at -145 em. Frangula and
Mercurialis pollen is only found in this sub-zone. Concentration
figures are only available for the upper levels of this sub-zone
and these show that Sphagnum has a concentration of 175,4 x 10²
grains/co at -139 em, while Corylus pollen is concentrated with

- 90 ~
148.3 x 10² grains/co at the same level. Concentrations of
Gramineae pollen are 91.3 x 10² grains/ co at -139 em and of
Quercus are 50.7 x 10² grains/co at =137 emu The upper boundary
of this sub-zone is marked by a rise in Corylus pollen from 28.7~
TLP to 38.6~ TLP, a fall in Gramineae pollen from 28.7~ TLP to
18.5~ TLP and a rise in Sphagnum from 24.1~ TLP + Spores to
30.9~ TLP + Spores.
LPAZ SH 4h:3b ~·-135·5 em to ~·-134·5 em
Shrub pollen dominates this sub-zone and ~uercus pollen still
comprises the most important tree pollen with 10.1~ TLP. The NAP
is dominated by Corylus with 38.6~ TLP, Sphagnum spores record
30o9~ TLP + Spores, Gramineae have 18.5~ TLP and Calluna pol~en is
recorded as having 10.9~ TLP. Concentrations of pollen are very
high in this sub-zone with Sphagnum recording 242.7 x 10² grains/co.
The concentration of Corylus pollen is 205.4 x 10² grains/co and that
of Gramineae is 98.3 x 10² grains/co. The upper boundary of this
sub-zone was placed where Fagus pollen first appears und t;or,yluH
pollen drops from 38.6~ TLP to ~5.6~ TLP9 Gramineae pollen risea
from 18.5~ TLP to 29.6~ TLP and Sphagnum spores fall from 30.9~
TLP + Spores to 20.5~ TLP + Spores.
LPAZ SH 4h:4 £!•=134·5 em to -133 em
This last zone is dominated by herb pollen at the base but by
shrub pollen at the top. Alnus pollen is no~ the most important
representative of the tree pollen with 11.8~ TLP at -133 em while
!:iuerous pollen has dropp~d to 11 d';t TLP lit -134 em. Gr6I11inet,e
are the most importunt NAP with 2'}oG~ 'l'L.P a.t. -Jjtl om, (;or,vlues potion
records 28~9~ TLP at -133 em, Sphagnum spores comprise ~0.5~ TLP +

- 91 -
Spores at -134 em and Calluna pollen has llo8% TLP at -133 em.
In this zone five species are first recorded; these being Fagus,
Compositae liguliflora, Chrysosplenium, Umbelliferae and
Plantago major/media. Concentrations of pollen are once again
low with Gramineae having the highest with 15.7 x 10² grains/cc,
Sphagnum spores being concentrated with 13.9 x 10² grains/co and
Corylus pollen having a concentration of 13.6 x 10² grains/co.
These LPAZ can tentatively be correlated with the stratigraphic
column. LPAZ SH 4hsl corresponds with the basal sand of stratum
4. Here Pinus pollen is the most important representative of the
tree pollen with Ericaceae and Corylus being the dominant NAP.
LPAZ SH 4hz2 can be said to represent the lower levels of the peat
where Pinus pollen is still the most important tree pollen although
Quercus pollen is increasing. Corylus becomes the dominu.nt forrn of
NAP with Ericaceae pollen. The upper levels of the peat correspond
with LPAZ SH 4ha3a and LPAZ SH 4h:3b, where 3uercus becomes the
dominant tree pollen together with Alnus. Corylus pollen still
comprises the dominant shrub pollen but Gramineae pollen have
become the most important herb pollen. LPAZ SH 4h:4 correlates
with stratum 6 9 the silty-sand where Alnus is the most important
tree pollen and Gramineae the most important NAP with Corylus.
3s3 YARMOUTH
3s3al Stratigraphy
The Yarmouth site is found to the south-west of the town of
Yarmouth on the Isle of Wight. The site spans the River Yar and
is divided into two sections; to the east of the river is Yarmouth
Carpark site and to the west is Yarmouth Boatyard site. Both sites

YARMOUTH SITE
[FIGu_RLfi]
90
80
i
~ w J ~~ - b . . ! ;

350
THE YARMOUTH SITE BOREHOLES
., .,. 0
t; g,~
?J l bm S-01m .• .. ~
'l •. ~ 895
' • ¢ ¢
=·o~
Cl 0
LEGEND
I [!] Borehole
~ .
I ill Borehole (m•crofoss•ls examined)
(!) Benchmark (mOO)
[!) Temporary benchmark
GJ l'lean low water
5) l'lean high water
8 Marsh
8 Saltn-.gs
(ill Pond
G Rough grassland
I ~ Scrub
(£] Non-<on•ferous trees
[] Con•ferous trees
8 Orchard trees
~ BUilt up area
.,.
a"' .. boatyard
0 .
oo.--!,
Saltern Wood "' c<l 0 0
q oO
.. ~ 0 oO
i. '.
r"! ·= -o
~ ~
:)0
;_ II •!
. -= -=
i35()
·.. ·-.. o<l
0
355
[FIGURE 24j -l
I
,r--...
--:. .. ~~ ~ .. ~-=,--
\,[ ~ a-~- 'Vll ~ ""tko '
·~fl ~\ ~~ v.,~~ .~:
0 oo
·-'. 0 0
0
.. "t,""l, YARMOUTH- ~ ~ ' o ·~ .. ~~\., ,.., ... "£.~~ .r: .. :.~ ~.0 ~~ ~ 0 ~.-. \' ~"'e ~0 •' • ~ ,/?~_A .. ~" "" ~ ?. • i!ll. ... ~~ 4 ... <lo J> ~ 0 IJI" ~~-·~ t' ~
t'? ' () ~ ,. •: "' "". L~~~~~~
- ·~bm 318m ~l.' ~,
0. ~. -4!-
...... _ _. - --+-
- - - () ~<! ~\(0 ~~ ~~ 895
""' • • • ...._:. t. .. eo ~~
... ""'
' YBS 2/l ~ ~ ' ' :t't~ G! ~~{' • •YBS 1 *..7') ~ ~~ .... ~ t,.,.; ~. ... •YBS 5 Vr ~ •"l11 A.
_.,_ \ car part.
-.G·rss 1 ~ .(\- ~ ~-~·"' ;;; ~ ~- '-1 ~ "' I ~~~~ ~ 0 '
- - -.- ,.. I \ v~= '!· ,
~~~·;,l ~ mud
\__.) ~ ~~:·~~·· r' ~,~,
\ (~ ~~~ ~ \ -:: ;'\ < ~ \ ~~~k ., aj~J J
-~ 3?.?
SCALE 1 1250
so so 100m .....,_,,_,""""~~~=.d
lj

- 92 =
are on the saltmarshes adjacent to the river intertidal flatso
The location or these sites can be seen in Figure 23a
At Yarmouth Carpark seven boreholes were taken in a grid=like
pattern (Figure 24), with a maxi.Jm.ul or 20 m between boreholes. A
regular grid pattern was impossible due to the intervening creeks.
IBS 1, YBS 4, YBS 5, YBS 6, and IBS 7 were taken using the Russian
type sampler, IBS 2 was sampled with a Gouge sampler and YBS 3 was
taken adjacent to IBS 2 vitp., a Piston corer. The ground surface at
Yarmouth Carpark varies in altitude from + 0.72 m.O.D. at YBS 7 to
+ 0.78 m.O.Do at IBS 6.
At Yarmouth Boatyard eight boreholes were taken (Figure 24) ..
Again these were in the form of a grid. The sampling interval
between the corea was under 30 m. A series or four boreholes, YBS 12
to YBS 15, were taken at7 m intervals towards the river. YBS 10,
YBS 12, YBS 13 and YBS 14 were taken with the Russian-type sampler,
YBS S, tBS 111 &nd IBS 1 S were takaa with the Gouge sampler and YBS 9
was sampled with the Piston corer, adjacent to YBS So The ground
surface at Yarmouth Boatyard varies in altitude from + 0,.74 m.O.D.,
at YBS 8 to + Oo91 moOoDo at YBS 14o
The boreholes at Yarmouth Carpark and Yarmouth Boatyard ~11 be
discussed separately in the folloving sectionso
1) Yarmouth Carpark
The stratigraphy of the seven boreholes at Yarmouth Carpark is
shown in Figure 25o These boreholes have been drawn up in four ways

FMJS
YARMOUTH
m DO
•1·0-
0-
·1 0-
·20-
·3 o-
·4 0-
·5o-
·60-
·7 o-
YBS 4
sz 3536 8939
R
I~J I ... -r<::
''"'' •••I'•
i:·<: 6 ' '' I'·"~;, ~
·•· 'L'
I~~~~ ........ ........ ' L ' ~. ~. ' ~- ' .... ,. ~·~· .... ~ !.. '~' •L•L '.'
I
L' L' •L•L n.•l!.• ... 'I. ~. ( II. ' ' l. ' ~. ' . ~ ..
''·
---------~
YBS 2-3
sz 3538 8939
G
.. ~ ... t, ~ • I
I ~~ •
' I ~- I
• ' I ~
~- • . I 1 ~- ••
lr,•l<.•
;, ~ ~- ~-' ~' . '·
[I, I ~- o
' (~ ... ~- ' ~- ' :. ~ ~ ~-' ~- ' '.' '"
•r.•!'. ),•!.•
;_ ~ ;_ ~-1 ' ~ ' ~-;
:· ,:, ~- ~.1
l"·''·'j ., .,. ,'> ~ ~- . ;~, ~- ~- ~ '!I.•L•
~ ~- ~: •t!.•ll., ,.._,,_,1
:' r.. . ~~~- ' II. .I
I' L' L l\.•J.• '"-•1. ~. ' I, ' 'II.' L
,.._ .... 'J:a..!..
p
® .. ' tl"",tl !'.· ' '
~-~~-~
---
CARPARK STRATIGRAPHY 1 FIGURE is]
YBS1
sz 3539 8939
R
,-
....... "" ~ .... ' •I!.••, \.•1!.• ... ' ~-1.' L' •I!. .~or.. ~-1!.~
•ll.<l\, r..•&.• •(1,<!\,
~~ • lb • ,, ' .. . 'L'
•llo•llo. I. I ft. I
1
;, ~ ~ ~:
~~~~I <1\o.•L
Hl: 1
.. '. l, < n. L
L L' L ~~. l'o. • t L, I L ,_.~~.. . .. r>.·!l.: !.=_~
:_~: )-I- -i
YBS 2-3
sz 3538 8939
G p
l·~n.
YBS 5
sz 3538 8937
R
~
YBS 7
sz 3538 8935
R
t\.l• I Ill.•• ' I II. ~
•' II. !.1•1 , .... t..' L' •1!. ' .. lllr.•L• • L • L
;1!.. L L
•n.•l. !. • ~. •11.•1!. .. •!!.•
------- .. 7. 'I- ---~~~~ ' ~~ ... .... ~~ . ....... ~ 0 .. L
~~~~
•llo.·f Jl.•ol.• '!!.' L Po•!!.• ' fl. ' ~ .. n.•ol.· .;,..;,.
•fl.•·
'.' '.' ' '. It\.• • '.'
11,•!1.• • L • L 1!. ~ 1!.. 'L' t., l!.•r..• ~"" '· '· "''!'!.' '""''" 1,•11.• •I.•L 1!.'-llo.•l •t..•L &,>1\.L
•1!.•!.1 ~~~~ ~ 1!.•1'!.• ·~·a.
;II.' L' I•. n. ' ~•I
I~~~~ l!.•e..• L 1!. o ~~
.. <I, L
•II.' ~· I• '. •' ~~
---( 1---·
.. ,
®
'.' ~~~ ~ ~ 11.<1,.1
'L' II. IL • 11. • .. ••llo.•
'L' '.' .. (~' '.'
rl ... ~~j . . ' ... ..
••!',• ' ' ' ~ !.·•· •II.•• <•II.• •••G, L' ' •!.•' ••!!.• ~ ~ : :1 '!'.'' '•II.• .. .... ..... .....
: ~· ~: •·••1\oo
. ~. ' ' .. ,,. ,, ' .. .. . . ' .. ... I"~; . . . 1,• • ., .. ''.
YBS 5
sz 3538 8937
R
,, .. "-''' ' ~. ' . ••P,• ~ ~ ' ro.l
' . '· ' ~ t>.•f,•
;, ~~~~·I
' ~.'
'''· 1!.•' ... ... (',.::~I ' ~. '
'.' ... .. . ' ' ~. '
.. ,,. .. ,,. ... .. ,, . 1~: ~ ;, .
.. ~ .
YBS 6
sz 3536 8937
R
.., .. ' '· . ~ :0..' L' . ~ .. ~ .. . ' . . ' '.'
'·' .. ... '. 1n.: ~·:
1
·:· ~~·;I ' ,,
~ .. '
~~~: ~ ~ : ~· ~ :I ···Lo ~o > L <' . ,,. . .. ,, ' . '.' . ' ,,
YBS 6
sz 3536 8937
R
r-
... •L•'I. \.•P,· . '.' .. '.' '.' 'L' . -~ . ' .. . ' . '
·~
L'' '.' ••r"1 . ' '. . ' 'L .
·• .. ' '.' '.' '.
YBS 4
sz 3536 8939
R
·-•1!.• .,
. L
•1!.·• '•L.· '••l\. li!.••. . '' '.' .. ···~ !>•t.•
'""'" ;!o.•lo.• 'L' L. ~ •• II, •
~.~~~~~· ' .. .t,.•l!.•
·•· L' L' '.' I!.•L•
;'~: ~ ~J
~ '. ·1 :~~I ' ' . ...
,--
I
LEGEND
fd l::J ~~~ 1:;] r;~ [5 []
Sh Undifferentiated organic mater1al
Th Roots of herbaceous plants
Th\Phra) Roots of Phragmttes
Oh Herbaceous plant fragments
01 Wood & bark fragments
As Clay
Ag [] Ga
Stlt
Sand
Transacts
~_3!?_~
6·· .. i 5
® Sampled for macrofossils '7
G =Gouge sampler, R =Russian sampler, P: Percuss1on corer

- 93 -
along the following gridlines.
sz 3539 8939 to sz 3536 8939 sz 3538 8937 to sz 3536 8937 sz 3538 8939 to c,~
cJiJ 3538 8935 sz 3536 8939 to sz 3536 8937
In general, the stratigraphy of these boreholes is predominantly
clastic in composition. True organic deposits are only found in YB3 1,
2 and 3 although transi tionC:Il deposits are found in YBS 5, 6 and 7. 'l'"he
organic deposits are all found at the bottom of the boreholes &.nd range
in altitude from- 3.55 m.O.D. in YBS 1 to - 4.22 m.O.D. in YBS 2. The
depth of this deposit in YBS 1 is 28 em with a 5 em transitional band
of clayey-peat. YBS 2 displays 233 em of this organic material. In
general this organic material can be described as a mixed woody peat.
The bottom transitional deposit found in YBS 2, 3, 5, 6 and 7 ranges
in altitude from- 3.50 m.O.D. in YBS 7 to 4.28 m.O.D. in YilS 6. 'rhe
depth of this varies from 9 c:n in YBS 6 to 123 em in YBS 5· The
transitional deposit is of a woody nature in all boreholes although it
becomes more sandy in boreholes YBS 5 and 7•
'l'he upper clastic daposi t is found in all boreholes. The
altitude of this varies from+ 0.37 m.O.D. in YBS 4 to- 0.78 m.O.D.
in Y3S 5 and the depth ranges from 276 em in Y13S 5 to 429 em in 13.3 6.
In general this can be described as a silt-clay with a lower sandy band
in YBS 5, 6 and 7• A second sandy band is found higher up in all cores
except YBS 7• YBS 1, 2, 5 and 6 all display an upper transitional
deposit which can be allied with a top-soil.
The borehole YBS 3 was sampled with the Percussion cor.3r and the
material was used for further analyses. 'I'he detailed st::'atigraphy is

- 94 =
given belova
The Stratigraphy of YBS 3
Stratum Height ~~ Descripi1Qn
17)
16)
15)
13)
12)
11)
10)
9)
8)
7)
-3.55 to
-3.59
-3.59 to
-3.75
-3 .. 75 to
=3.93
-3.93 to
-3.97
=3.97 to
-4.02
--4,.02 to
-4 .. 26
... 4.26 to
=4o41
=4 .. 41 to
=4o50
<»4. .. 50 to
=4o78
=4o78 to
=4o94
=4-94 to
-5o03
433 Ag 4, As +. to Nig 2+ 1 Strf o, Elas 0, Sicc 3, L(s)Q
437 Grer silt.
437 Ag J+, As 1-, Ga +., Lt +. to Nig 2, Strf 0, Elas 0, Sicc 3, L(s) +
453 Grey silt with dark staining.
453 Ag 3, As 1, Ga +, Dh +9 Lf + to Nig 2, Strf 1, Elas o, Sica 3, L(s) 1
471 Darker grey silt vitb more staining.
471 Ag 2, As 2, Dh +, Part.test.(moll.) + to Nig 2+, Strf 2, Elas +, Sicc 3, L(s) 0
475 Darker gre,y cl&Jer-silt.
475 As 2, Ag 1, Dh 1, Ga + 1 Dl + to Nig 3, Strt 2, Elas 1, Sicc 3-, L(s) 1
480 Dark grer transitional layer.
480 Th(l!hmg)1 9 Tb 1, Sb 2, Dl + to Nig )+, Strf 2, Elas 2, Sicc 2, L(s) 0
504 Dark brovn monocot. peato
504 Sh 2, Db 1, Th 1, Th(lhmg) + to Nig 3-, Strr 1+, Elas 1+, Sicc 2, L(e) 0
519 Lighter brown peat.
519 Sh 39 Dl 19 Dh + to Nig 3, Strf 10 Elae 1+ 9 Sicc 2, L(s) 0
528 Dark brov.o p@ato
528 Sh 3, Db 1, Th(fbrag) + to Nig 3, Strf 1, Elas 1+, Sicc 2, L(s) 0
556 Dark brown peato
556 Dl 19 Th(~) 19 Sh 2p Db+ to Nig )+ 9 Strf 29 Elas 29 Sicc 30 L(s) 0
572 Dark brown peat.
572 Sh 49 Db +, Dl + to Nig 3, Strr 1, Elas 1p Sicc 3g L(s) 0
581 Dark brow. peat

6)
5)
.3)
2)
1)
=5 .. 27 to
=5o 52
-5 .. 52 to
-5 .. 61
-5.61 to
-5 .. 74
-5.74 to
-5 .. 90
-5 .. 90 to
=5e96
- 95 -
581 Sh .3, Dh 11 Dl ~ to Nig .3, Strf 1, Elas 19 Sicc .3 9 L(a) 0
605 Dark broWD peste
605 Dl 1, Db 1 1 'l'h(lJa:&g) 1, Th 1 to Nig .3, Strf 1, Elas 1, Sicc .3, L(s) 0
6.30 Mixed peato
6.30 Sh .3, Dh 1, Dl + to Nig .3, Strf 1, Elae 1, Sicc 3, L(s) 0
6.39 Dark bro1m peat
6.39 Sh .3 11 Tb(lhmg) 1, Dh + to Nig .3, Strt 1, Elas +, Sice .3, L(s) 0
652 Dark browo peato
652 As .3, Dh 1, Ag +1 Dl + to Jig 2+ 1 Strf 1, Elas 0, Sicc .3, L(s) 0
668 Transitional ola;y o .
668 As .31 As 1, Lt + to Nig 2, Strt 0 9 Elae 00 Sicc 2 9 L(s) 0
674 ClaY.,Y-eilt.,
conteDto Strata 1, 2, 12, 1.3 and 14 vere sampled for diatoms and strata
1~ 2, .3, 1.3, 14, 15, 16 and 17 were examined for particle-sizeo
2) Yarmouth Boatyard
At Yarmouth Boatyard sight boreholes were takeno The stratigraphy
of these boreholes is shown in Figure 26., These boreholes are displayed
in four '!:lays follomng grid=linaao
sz .351~ 8928 to sz .3514 8920
sz .3514 8924 to sz .3511 8924
sz .3514 8924 to sz .3516 8922
sz .3516 8922 to sz .3514 8920
The general stratigraphy can be described as a lower and upper
clastic deposit with an intercalated peato The lower clastic deposit
is found in all boreholes except YBS 1.3o Tb@ altitude of this ranges from

YARMOUTH BOATYARD STRATIGRAPHY YBS15 YBS14 YBS13 YBS12 YBS15 YBS10 YBS 8-9
sz 351~ "t20 sz 3515 8921 sz 3516 8922 sz 3516 8922 sz 3514 8920 sz 3514 8924 sz 3515 8928
G R® R® R® G R® G p ,- ,-
1•1., . .. ~ • L' • I ' I.
YBS 11 YBS 10 YBS 10 YBS 12
sz 3511 8924 sz 3514 8924 sz 3514 8924 sz 3516 8922
G
... ,.,
R® R® r-
R® ,-
' L , ~ ... ·.~~~· ----
' ~ ..... ....... ....... ;.~~~I
,--l ~-1 .... ;~~~ '-1'-1. •I• ' ~ .. ' II. '- .. • .. • '
• .. ' • .. • D.'- .... , - - - - - -•Do•' •·L• '"'' -----,~~. ... ... , .... ····----- ... ·•· I•L· '"'-L ____ II.•I'- •L•"' ... ,11. 'I •L --- •I. I •II.• <L• ..... .... ... . .. ,
..... • I L 0. ...... Iloilo•
....... . .... - - -... ... . . ... .
. ...... ofi.>JL• . ... ..
LEGEND
. . . . . • 'L
·•· . '' ... L' L
't!o.·L• ' .. ' ....
'.' ••{1.• •!-.:
. ,, .. . . , : ~ ~; '~
• ~ • Li
~ ~~~ : : ~:
.. ' ~ .. ~-.. ~- . . ' . ~
;:;·1 ... ·'"':""
'-II.' t. 1: 'L' 11o • II.' llo '-L' .•.. .... .... . .. . .. .... ... . .. . .,,, "·• .... . .. . ..... ,... .. . .. 7; ~· J ; ~.:. ~ ~ ~ : ~
-------
• llo' ' L' ~ L • flo
Lt\.' 'r..' r·'!-L·I ...... : I!.•·· •t!.•• :·.e.· il'~ ,. I"_,_, _,_,
=:-1 r::=l·
..... ~ .... ~ llo'.. ' .. . ·~~ ·~·~ 11o ~' ~ • L ' 'II.'' 'L' L ; ~ .. ' .... •-. • •L' L I •" • • L' -:-.. . ..... ; ~; :1 -~!;
!. , , - •- 1 , L • Ll
~~~~ ;~:: ~~~~ .... . ..... .. . .. . ...... .. . .. . : ':.:. ~ ..... _,_, ' .. ' .. L' L' ' ..... ~.:. ':- ~ -t--..
[:) Sh Undifferentiated organic mater1al .. . .
[::;) Th Roots of herbaceous plants
IT] Th(Phra) Roots of Phragmites
~ Dh Herbaceous plant fragments
~ Dl Wood & bark fragments
~ As Clay
0 . Ag Silt
0 Ga Sand
~ . Gglmml Fme gravel
[] ' Ptm Shell fragments
[:;] Lt Iron part1ngs
@ Sampled for macrofossils
G =Gouge sampler, R:Russ1an sampler
P = Percuss1on corer
~--------
Tronsocts
6N
1! •. - -: 10 : ,., 12 ' ,• 13 !~· 11.
IS
--- ---
~~ ... • I. f.. I. -· ....
'• ~ •• I. .t.t.·
®
l"'"~j ... t.•r..• . . ' ...
~~ .
' .
!'--1.4
... ' .. !o.•Lo I L' L ......
'.' ... '.' ... ...
'.' ' .. .. ' ~~
. .... ••'-1 ~~~
. ..... ••e.·
. . ' 'L' I.
..... L'' ... ...... ~~I
: ~ ~ ~ -·-·-· .!.:'
"
I FIGURE 26]
...... . ..... ...... ... ... . '. ...
• t..LI.
~~ll
'~ ~ ~
.. ... . . ... . ...... ...... . ... . . .. .. ..... ..... '' ... ..... ..... .. ' ..
...... ; ::~
::11 :·:j
mOD
r-•1·0
1- 0
f- ·10
f- ·2 0
f- ·3 0
f- ·4 0
f- ·50
'- ·6 0
FMJS

=2.46 m.O.D. in YBS 14 to -4.88 m.O.Do in YBS 8, aDd the depth varies
from 5 em in YBS 10 to 127 om in YBS 11 o This clastic band is
predominantly sandy in nature, becoming 110re silty tovards the boundary
vith the upper organic deposit, which overlies in i.ll boreholes,. The
al~itude of this organic material ranges f'rom =1 o9.3 m.O.D. in YBS 1.3 to
-4.01 m.O.D. in IBS 9. 'l'liO organic bands are found in YBS 12 and YBS 9
and there are three bands in YBS 8. Again this lover peat is predominantly
a woody' peat; a1 though the upper peat bands show no sign or being voody' o
The upper clastic deposit ranges in altitude trom +0.15 m.o.o. in
YBS 14 and 8 to -{).47 m.o.o. in YBS 11 o The depth varies from 99 em in
YBS 10 to .344 em in YBS 8. It is a predominantly silt-clay although a
lower silty band runs through the coree YBS 12 to YBS 15., The boreholes
are all overlain b,y a transitional band which can be correlated with a
top-soil.
YBS 9, 10, 12, 13 and 14 were all sampled and taken back to the
laboratory tor further analyseso The detailed stratigraphy of these
cores is given belowo
The Stratigraphy of YBS 9
S~r1:1i!l! He12ht 12!Plh l&ecrip~
m.OaDo em
1.3) =2.80 354 As 2 9 Ag 2 9 Lt 9
to to Nig 2~, Strf Op Elaa Ov Sioo 2~, L(s) 0 =2o83 357 Grey silty-clay with organic mtaiDingo
12) -2.83. .357 As 2, Ag 2, Sh + to to Nig 2+, Strf 01 Elas o, Sice 2+ 1 L(a) ~
~.3.09 .38.3 Grey silty-ol81 'With more organic stainingo
11) -3.09 .38.3 As 2, Ag 2, Sb + to to Nig 2+ 1 Strf 0, Elas 0~ Sicc 2+ 9 L(s) 0
=)o27 401 Grey silty-clay with some organic staininga

10)
9)
8)
7)
6)
5)
J)
2)
1)
=3 .. 27 to
~3.41
=.3 .. 41 to
-.3 .. 69
=.3 .. 69 to
=.3 .. 91
=3 .. 91 to
-3 .. 98
-.3.98 to
-4 .. 01
-4.01 to
=4 .. 06
=4 .. 06 to
-4 .. 17
-4 .. 17 to
-4 .. 57
=4o57 to
=4 .. 67
-4 .. 67 to
=4o8.3
401 to
415
415 to
44.3
44.3 to
465
465 to
472
472 to
475
475 to
480
480 to
.491
491 to
5.31
5.31 to
541
541 to
556
- 97 -
As .3, Ag 1, Sh + Nig 2+ .. Strf 1, Elas 0, Sicc 2+, L(s) 0 Grey clay with less organic staining ..
As .3 J) Ag 1 , Sb + Nig 2+, Strf 0, Elas 0, Sicc 2+, L(s) 0 Grey sUty..,.clay with organic staining.,
Ag 1, As 2, Sh 1, Th2(~) + Nig 2+, Strf o, Elas 0, Sicc 2+!) L(s) 0 Grey transitional layero
As 2, Sh 2, Dh + Nig .3-, Strf +, Elas 1, Sioo 2+, L(s) 0 Transitional
Sh 4 Nig .3+, Strf 1, Elas 20 Sicc .3, L(s) + Dark brown peat.
As 4, Ag +, Sh + Nig 2, Strf 0, Elas o, Sioc 2+ 9 L(s) 2 Clay with sharp transitione
Dh 1, Sh 3, Tb(fbrag) + Nig .3+, Strf 29 Elas 2+, Sicc 3, L(s) 1+ Peate
As .3, Ga 19 Sh +1 Dh + Nig 2+ 0 Strf 0, Elas o, Sicc 29 L(s) 2= Grey sandy=elay ..
Ga 2, As 1, Ag 1, Dh + Nig 2+ 0 Strf 0, Elas 0, Sicc 2, L(s) 0 Orange=brovn sandy layero
Strata 2, .3 0 4D ~, 6 and 7 vero GxaminGd for their pollQn content,
strata 2, .30 4, 5p 6, 7, 8 and 10 ~erQ looked at for diatoms and strata
1, 20 49 7, 8, 100 11, 12 and 13 were tasted for partiole=sizeo
Th® Stra tigratphy of YBS 10
Stratum Height Depth Description
m.O .. Do em
16) +0 .. 83 0 Topsoil
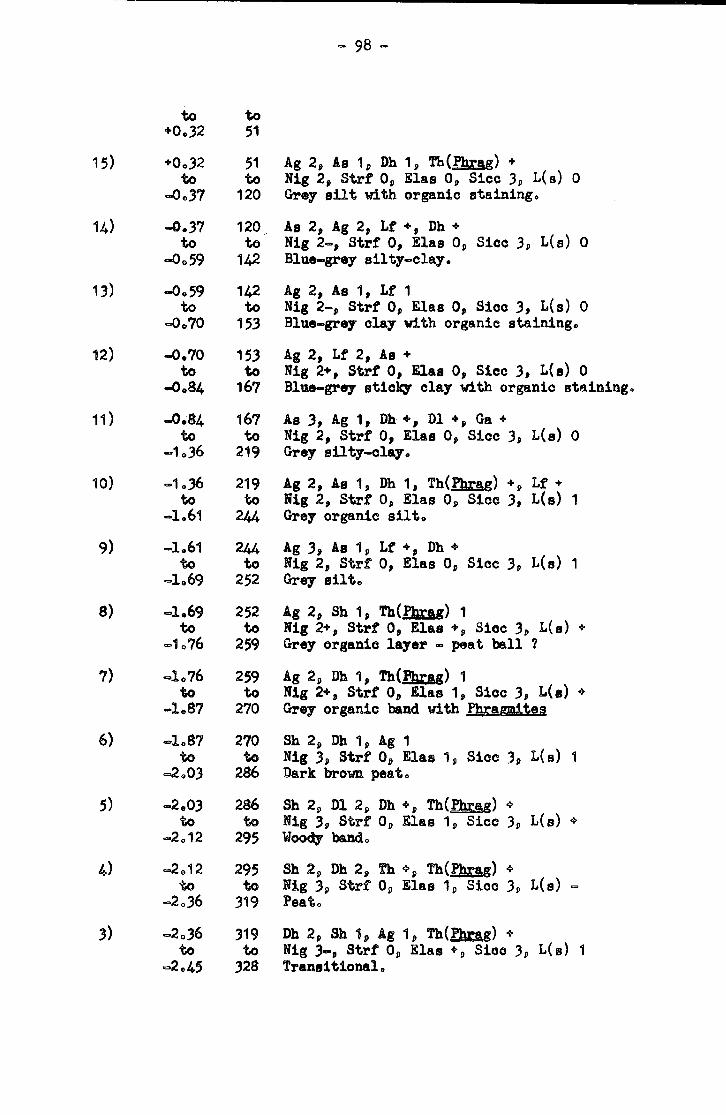
~ 98 -
to to +0.32 51
15) +0.32 51 Ag 21 As 19 Db 1, Th(Pbrag) + to to Nig 2, Strf 0, Elas 011 Sicc J, L(s) 0
-0.,37 120 Grey silt with organic stainingo
14) ~-37 120 As 2, Ag 2, Lf + 1 Dh + to to Nig 2-, Strf o, Elas o, Sicc 311 L(s) 0
-0 .. 59 142 Blue-grey silty-clay.
13) -0 .. 59 142 Ag 2, As 1, Lf 1 to to Nig 2-, Strf 0, Elas 0, Sicc 3, L(s) 0
-Oo70 153 Blue-grey clay with organic staining ..
12) -0.70 153 Ag 2, Lf 2, As + to to Nig 2+, Strf o, Elaa o, Sicc 3, L{s) 0
-o.84 167 Blue-grey stio~ clay with organic staining.
11) ...0.84 167 As 3, Ag 1, Dh· +, Dl +, Ga + to to Nig 2, Strf o, Elas o, Sioc 3g L{s) 0
-1.36 219 Gre7 silty-clay ..
10) =1 .. .36 219 Ag 2, As 1, Db 1, Tb(Pbrag) +, Lf' + to to Nig 2, Strf o, Elas o, Siec 3, L(s) 1
-1.61 244 Grey organic silt.
9) -1.61 244 Ag 3, As 1, Lf + 1 Db+ to to Nig 2, Strf o, Elas 0 9 Siec 3 9 L(s) 1
-1.69 252 Grey silt.
8) -1.69 252 Ag 2, Sh 1, Th(fhrag) 1 to to Nig 2+, Strt 0, Elas + 9 Sioo 3, L(s) +
=1o76 259 Grey organic layer = peat ball ?
7) ... 1.,76 259 Ag 2, Dh 1, Th(fhrag) 1 to to Nig 2+, Strf o, Elas 1, Sico 3, L(a) +
-1.,87 270 Grey organic band with ~mjjes
6) =loS7 270 Sh 29 Dh 1, Ag 1 to to Nig 3 11 Strt 0 9 Elas 111 Sioc J, L(s) 1
-2.,03 286 Dark brown peato
5) =2e03 286 Sh 20 Dl 2, Dh +, Th(~) -¢-
to to Nig 3, Strf 0 0 Elas 1, Sioc J, L(s) 9
=2o12 295 Woody ba!ldo
4) -2.,12 295 Sh 2, Dh 2ll 'fh -¢-, Th(~) 9
to to Nig 39 Strf 0, Elas 10 Sioo J, L(s) = =2o.36 319 Pea to
.3) =2oJ6 319 Dh 2, Sh 1, Ag 1, Th(lm:lg) + to to Nig 3-, Strf o, Elas + 11 Sioo 311 L(s) 1
=2e45 328 TraniJition&lo

2)
1)
-2o45 to
-2e57
-2o57 to
-2o62
328 to
340
340 to
345
- 99 -
Ag 2, Db 1, Sh 1, Lf + 1 Dl +, Th(~) + Nig 2+, Strt o, Elas 0, Sicc 3, L(s) 1 Transitional
Ag 4, Th(~) +, Lt + Nig 2, Strt o, Elas 0, Sicc J, L(s) + Grey silt with organic staining.
In this core strata 2, 3, 4, 5, 6, 7, 8, 9 and 10 were sampled for
pollen. Strata 1, 2, 3, 6, 7, 8, 9, 10 and 11 were examined for diatoms
and strata 19 2, 3, 6, 7, 8, 9, 10 and 11 were tested for partiele-sizee
The Stratigraphy of YBS 12
Sj!:r;:atum H~;L~ JW>.lh Des grip~ m.O .. D. om
18) +0.81 0 Topsoil to te
+Oo31 50
17) +0.31 50 Ag 2, As 1, Dh 1, Th(~g) + to to Nig 2, Strf 0, Elaa 0, Sicc 3, L(a) 0
-e-0.01 80 Grey organic silt.
16) +0.01 80 Ag 2, As 2, Ga +, Dh +, Th(Pbrag) + to to Nig 2, Strr o, Elas O, Sicc 3, L(s) 0
...0 .. 42 123 Grey silt with organic staining •
15) =0.42 123 Ag 3, As 1 , Lf + to to Nig 2, Strt o, Elas o, Sicc 3, L(s) 0
-o.86 167 Grey sticky silt.
14) =().86 167 Ag 3, As 1, Db + 9 Dl + to to Nig 2, Strf 0, Elas 0, Sicc 3, L(s) 0
=Oe99 180 Grey silt with organic remains.
1.3) ...Oo99 180 Ag 2, As 1, Db 1, Dl -eo
to to Nig 2+, Strf 0, Elas 0, Sicc J, L(s) + =lo14 195 Grey-brown organic silt.
12) =1 o14 195 Ag 3, As 1, Dl +, Db + to to Nig 29 Strf 00 Elas 0 0 Sioc 30 L(s) 1
=la.34 215 Grey organic silto
11) =1.34 215 Ag 3, As 1, Ga +, Dh +, Lf + to to Nig 2, Strf 0, Elas 0, Sica J, L(s) +
-1.62 24.3 Grey claye.y-silt with herbaceous remains.
10) -1.62 2 24,3 Sh 2, Th 2, Dh +, Th(lm:u) +
to to Nig 3, Strr + 9 Elas 1~, Sicc 2 0 L(s) 1 =1o70 251 Brown peat.

9)
8)
7)
6)
5)
4)
.3)
2)
1)
-1.70 to
-1.94
-1 .. 94 to
-2 .. 0.3
-2.0.3 to
-2.10
-2.10 to
-2 .. 60
-2.60 to
-2.62
-2.62 to
-2 .. 65
-2.65 to
-2.84
...2.84 to
=-2 .. 94
-2.94 to
-.3.04
- 100 -
251 Ag 2, As 1, Dh 1, Th(~) +, Lf + to Nig 2, Strf o, Elas +, Sicc 2, L(s) 1
275 Grey organic silt.
275 Dh 2, Ag 2, As +, Th(~g) + to Nig .3-, Strf o, Elas +, Sicc 3, L(s) 1+
284 Transitional.
284 Sh 2, Th(.fhmg) 1, Db 1 to Nig .3+, Strf 0, Elas 1, Sico 39 L(s) +
291 Brown peat with Phragmites.
291 Sh 2, Dh 2, Th(Phrag) + to Nig .3, Strf o, Elas 1+, Sioc .3, L(s) 0"
341 Brown peat.
341 Sh .3, Dh 1 to Nig 3, Strf o, Elas 1, Sico .3, L(s) 0
.343 Dark peat
34.3 Ga 2, Sh 2, Dh +, Ag + to Nig .3-. Strf o, Elas 0, Sicc .3, L(s) +
.346 Sandy transition •
346 Ga 3, Ag +1 Sh 1 to Nig 2+, Strf 0, Elas 0, Sioc .3, L(s) 1
365 Sandy bed with some organic.
.365 Ga 3, Ag 1, Dh + to Nig 2+, Strf 0, Elas o, Sicc 3, L(s) 1
.375 Sandy-silt with some organic.
.375 Ga 4, Lf + to Nig 2+, Strf 0, Elas 0, Sioc .3, L(s) +
.385 Sandy bedrock
At YBS 12 strata 4, 5, 6, 7, 8, 9 and 10 vere sampled for their
pollen content while strata 3, 7, 8, 9 and 11 vere sampled for diatoms.
The Stratigraphy of YBS 13
StratWil Hei~ J2!pth Description m.,O.D .. em
15) +0.,88 0 Topsoil to to
+0 .. 33 55
14) +0.,.33 55 Ag 2, Th 1, As 1, Th(~) + to to Nig 2+, Strf 0, Elas o, Sicc .3, L(s) 0
-0 .. 0.3 91 Grey organic silt.

1.3)
12a
nJ
12b)
10)
9)
8)
7)
6)
5)
.3)
2)
1)
=0.0.3 to
-0 • .34
...0.72 to
...0,.77
-o. 77 to
=0 .. 89
...0.89 to
..().97
dJ,.97 to
~1 .. 12
=1 .. 12 to
~lo21
=lo21 to
-1 .. 36
=1.36 to
=1.46
=1.46 to
-lo5.3
=lo5.3 to
=lo61
=lo61 to
=lo84
=1.,84 to
=lo9J
=1.9.3 to
-2 .. 17
- 101 =
91 As 2, Ag 2, Part.test(moll.) +, Th(~g) +, Th + to Nig 2, Strf o, Elas 0, Sicc .3, L(s) 0
122 Grey silty-clay with organic remains.
122 Ag ), As 1, Lf + to Nig 2-, Strf o, Elas 0~ Sicc 3, L(s) 0
160 Blue-grey silt with organic staining.
160 Ag 4, As +, Part.test(moll.) +, Ga + to Nig 2-. Strf 0, Elas o, Sicc 3, L(s) 1
165 Blue-grey silt. Silt ball ?
165 Ag .3, As 1, Lf + to Nig 2-, Strf o, Elas 0, Sicc 3, L(s) 0
177 Blue-grey silt with organic staining.
177 Ag 4, Ga +, Lf + to Nig 2, Strf o, Elas o, Sicc 3, L(s) +
185 Blue silt •
185 As 2, Ag 2, Ga +, Db + to Nig 2, Strf 0, Sicc 3, Elas 0, L(s) +
200 Silt-clay.
200 Lf 1, Th 1, Ag 2, As +, Dh + to Nig 2+, Strf o, Elas 0, Sicc 3, L(s) +
209 Grey organic silt with black staining.
209 Ag 4, As +, Lf +, Db+ to Nig 2-, Strf o, Elas 0, Sicc 3, L(s) +
224 Blue-grey silt.
224 Ag 3, As 1, Db+, Lf + to Nig 2, Strf 0, Elas o, Sicc 3, L(s) +
234 Grey silt.
2.34 Db 1, Ag 2, As 1 to Nig 2, Strf 0, Elas 0, Sicc 3, L(s) 1
241 Organic silt.
241 Ag 2, Sb 2, Th(.fbmg) + to Nig .3-, Strf 0, Elas +, Sicc .3, L(s) +
249 Peat ball ??
249 Ag 3, As 1, Db +, Th(.fhng) + to Nig 2, Strf 0, Elas 0, Sicc .3, L(s)
272 Silt.,
272 Db 1, Sh 2, Ag 1, Tb(~g) + to Nig .3=, Strt 0, Elas 1, Sicc .3, L(s) 1
281 Dark organic with silt.
281 Sh .3, Db 1 to Nig J+, Strf o, Elas 1+ 9 Sicc .3, L(s) +
.305 Peat.
At YBS 13 strata 1, 2, 3, 4, 5 and 6 were sampled for pollen and strata
2, 3, 49 5, 6 and 7 vere examined for diatoms.

~ 102 -
The Stratigraphy of YBS 14
Stratum ~~ Dep~ Descrip~
12)
11)
10)
9)
8)
7)
6)
5)
4)
3)
2)
1)
m.,O.D. em
+0.91 to
+0.50
+0.50 to
+0.15
+0.15 to
-Oo30
-0.,30 to
-Oo50
-Do 50 to
-1.32
=L32 to
-1.62
-1.62 to
-1 .. 87
-1.87 to
-2.05
=2.05 to
-2.25
=2 .. 25 to
=2 .. 36
-2.36 to
=2o46
=2.46 to
-2 .. 75
0 Topsoil to 41
41 Ag 2, Dh 1, D1 +. As 1, Th(Phrag) +, Th + to Nig 2, Strf 0, Elas 0, Sicc 3, L(s) 0 76 Grey organic silt.
76 As 2, Ag 2, •art.test(moll.) +, Th(Phrag) +, Dh + to Nig 2, Strf 0, Elas 0, Sicc 3, L(s) +
120 Grey silty-clay with Phragmites.
120 Ag 3, As 1, Lf +, Th + to Nig 2-, Strf 0, Elae 0, Sico 3, L(s) 1
140 Grey=blue silt with black banding.
140 Ag 4, As +~ Lf + to Nig 2-, Strf o, Elas 0, Sicc 3, L(e) 1
222 Grey-blue sticky silt.
222 As 2, Ag 2, Ga +, Dh +, Lf + to Nig 2, Strf 0, Elas 0, Sicc 3, L(s) +
252 Grey silty-clay with wood.
252 Db 1, Ag 2, As 1 to Nig 2, Strf 0, Elas o, Sicc 3, L(s) 1
277 Grey organic silt.
277 Ag 1, Sh 2, Dh 1, Th(~g) + to Nig 3, Strf 0, Elas 1, Sicc 3, L(s) 1
295 Transitional peat.
295 Sh 2, Db 2.~~ Th(.fbng) ? D Th + to Nig 3, Strf o, Elas 0, Sicc J, L(s) 0
315 Peat.
315 Ag 4, Dh -o-, As + to Nig 2, Strf 0, Elas 0, Sicc 3, L(s) =
326 Silt
326 Ag 29 Dh 2, Ga + to Nig 2+, Strf 0, E1as 0, Sicc 3, L(s) 2
336 Grey transitional peaty-silt.
336 Ag 1, Ga 3, Dh + to Nig 2, Strf 0, Elas 0, Sicc 3, L(s) 1
365 Bedrock.
At YBS 14 strata 2, 3, 4, 5 and 6 were sampled for their pollen
content and strata 1, 2, 3, 5 and 6 for their diatoms.

I
- 103 =
3:3:2 Particle-size Analysis
Atthe Yarmouth sites, three boreholes, YBS 3, YBS 9 and YBS 10 were
examined for their particl0=siz0 distribution in order to assess the validity
of the Troels-Smith method of stratigraphic analyses of inorganic layers.
The results of these analyses are discussed belovo
1) YBS 3
At YBS 3 six strata were sampled for their particle-size distribution;
strata 1, 13, 14, 15, 16 and 17. In total ten samples were taken, one from
the lover clastic deposit and nine from the upper one., The samples were
chosen in order to test the validity of the description given to the cores
using the Troels-Smith ~otation of stratigraphic analysis. The results of
this analysis can be seen in Figure 27 and are tabulated below, together
vith the Troels-Smith classification of results.
Table 12 PArticle-size AnalY,sis of YBS 3 ----
I
Sample Altitude (m.O.,D.) %Clay %Silt %Sand %Gravel
11 =3o55 to =3.,60 2 .. 5 (+) 91.,1 (100) 6.,4 (=) - (=)
10 =3o60 to =3.,65 24 .. 3 (25) 70 .. 3 (75) 5 .. 5 (+) = (=)
9 =.3 .. 65 te =3.70 21ol (25) 69 .. 7 (75) 9.3 (+) = (=)
8 =3o 70 to =3o 75 21 .. 9 (25) 71.9 (75) 6.2 (+) = (=)
7 =3o75 to =)o80 17 .. 8 (25) 76.,8 (75) 5.5 (+) = (=)
6 -.3.80 to =3 .. 85 19o8 (25) 73 .. 2 (75) 7ol (+) = (=)
5 =3o85 to =3o90 2)o0 (25) 70o'i (75) 6.9 (->) = (-)
4 =3 .. 90 to =3 .. 95 12.3 (50) 79 .. 6 (50) 7 .. 9 (=) 0.2 (-)
3 =3.95 to coo4.00 17.,5 (50) 73 .. 2 (25) 9 .. 0 ( +) 0 • .3 (=)
1 =5 .. 90 to =5 .. 95 38.7 (25) 60.2 (75) 1o2 (-) = (-) ---

LLJ N Vl
LL.J _J ~
w '..l
1-a:: ~
, Vl CD >-
"' n "' n I
0 q
! I I
---]
I I r-<-'1
~ ' ' h
"' "'
~ ~rJiJJ~>'JrJJJr, JJ .. II J] 4 ..4 Jl,JJ'\ ...tl • II 4 .n ""'.n 4 JJ J
j - • .ll JJJJ•dl..!i,'
• i 9 ll '; ;<l
.~ :;. ~
,\ ~ • ,\,

- 104 =
The results show that there is an apparent difference between the upper
and lower clastic depositss The lOver clastic deposit is surprisingly finer
in nature than vould be expected from the results of the Troels...Smi th analysis,
due to its proximity to bedrocks The highest recorded clay traction is found
in sample 1 and the lowest sand fraction is also in this sampleo This
&Dalysis shows that strata 13 and 14 are separate lithological units with a
decrease in clay and sand from stratum 13 to stratum 14o The separation of
stratum 15 from 16 is not so apparent but as the Troels-Smith notation shows,
the two strata are distinct purely on a basis of the presence of organic
material in stratum 15o Stratum 17 is Wlique vith a very high silt content
and a considerable drop in cl&Jo
The results of the 'l'roels-Smith analysis of the borehole shows that
the lower clastic deposit is a clayey-silto Once again strata 13 and 14
are show to be separa. te units with stratum 13 finer in nature than stratum
14, although this is shown by" an incr•ase in silt to stratum 14 and a
decrease in sand, and not b,y a decrease in clayo Again strata 15 and 16 are
show to be identical while stratum 17 is distinctly more silty in nature
with just traces of clayo
In conclusion the lithological d:tdmions imposed using tha Troela...Smith '
notation ot stratigraphic a.na~sis hold true when tested bJ particle=size
analysis in most instanceso
2) YBS 9
At YBS 9 seven strata were sampled for particle-sise analysis; 1D 29
40 79 89 100 and 12o Ten samples ~re taken from the core, two from the
lower clastic deposit and eight from the upper clastic depositso These

"' , I
~ ,, J ~.r 't>
.... J v.
~
~ .. ml j '«
')~ '1. ,.._ -._;.:~
.o., d' ~ .. .... ,.,
IL LLJ
J N V) ;.
S' LLJ _J -r, I u <)
1--a:: <( .. , .. ' 0.. ,'' ',,
a.. ·1
_r
V) ,',• L
co ··t_
>- ,':
I 9
5!
00 '<-
"'"4 "' ..,
"' 0 "' "' "' "~ .., "' "' "' "' I I
'<-~
"' iti 0 0 0 8 0 0
""o 0 "' "' "' "'
~ ..,
"' "' .., ,
"' ,
~
~~ ~ c!IJ .,!I.J d!J)~.J
'<-., J c!l J .!1 J ~ J c!l ~ '• .l]J .ll J clJ l ~..!)
~,J'
" 5! ~ • 0
-----

I
- 105 -
samples were chosen in order to identity separate lithological strata, ae
shown by the tmal.yais .or the core usiag the Troels...Smi th scheme. The
results or this particle-size analysis are summarised below~ together with
the Troels...Smith classification of the deposit, and shovn in Figure 28.,
Table 13 Particle-size An&l:ysis or YB§ 9
S&Bple Altitude (m.O .. D.) %Clay %Silt %Sand %Gravel
10 -3.05 to -3.10 40.2 (50) 59.2 (50) 0.6 (-) - (-)
9 -3.25 to -3.30 59.0 (75) 40.5 (25) 0.5 (-) - (-)
8 -.3 .. .30 to ... ) • .35 61.8 (75) .37.8 (25) 0.4 (-) = (-)
7 -.3 .. 80 to =.3 .. 85 .)8 .. 2 (75) 61 o5 (25) O.J (-) = (=)
6 -3 .. 85 to -.3.90 59.6 (75) 39 .. 9 (25) 0 .. 5 (-) ., (-)
5 -.3 .. 90 to =.3 .. 95 54o9 (50} 44 .. 8 (25) 0 • .3 ( ... ) = (=)
4 -4.05 to -4 .. 10 .34.,7(100) 65.0 (+) 0 .. 3 (=) - (-)
3 -4o 10 to =4o 15 .32.1(100) 67 .. 5 (+) o .. s (=) = (-)
2 -4.55 to -4 .. 60 25.2 (75) 56.7 (-) 17 .. 4(25) 0.7(-)
1 I
... 4.65 to =4 .. 70 20., 1 (25) 5)e 1 (25) 26.8(50) = (=) ---- -- --- ---·- -- -- --·-- .. -- ---··
In general, these results show that the lower elastic deposit of
strata 1 and 2 is much coarser than the upper clastic one. This is
oonsistent with the high~e~centages of sand found in samples 1 and 2 ..
It is interesting to not~ that the lower deposit also becomes finer»
in particlG=sizG, toward the intercalated organic deposit., Samples 3
and 4, immediately above the organic depositp are more coarse in aature
than the rest of the upper clastic d0posito Samples 3 and 4 are very
similar in particle~size aa they ar~ taken from th0 same str~tumo Sample
5 is taken from above the upper organic deposit and is found to be coarser
than sample 6~ which 11•~ at the baae of the upper ol~atio material.
Samples 6 and 7 could be expected to show a close correlation as they are
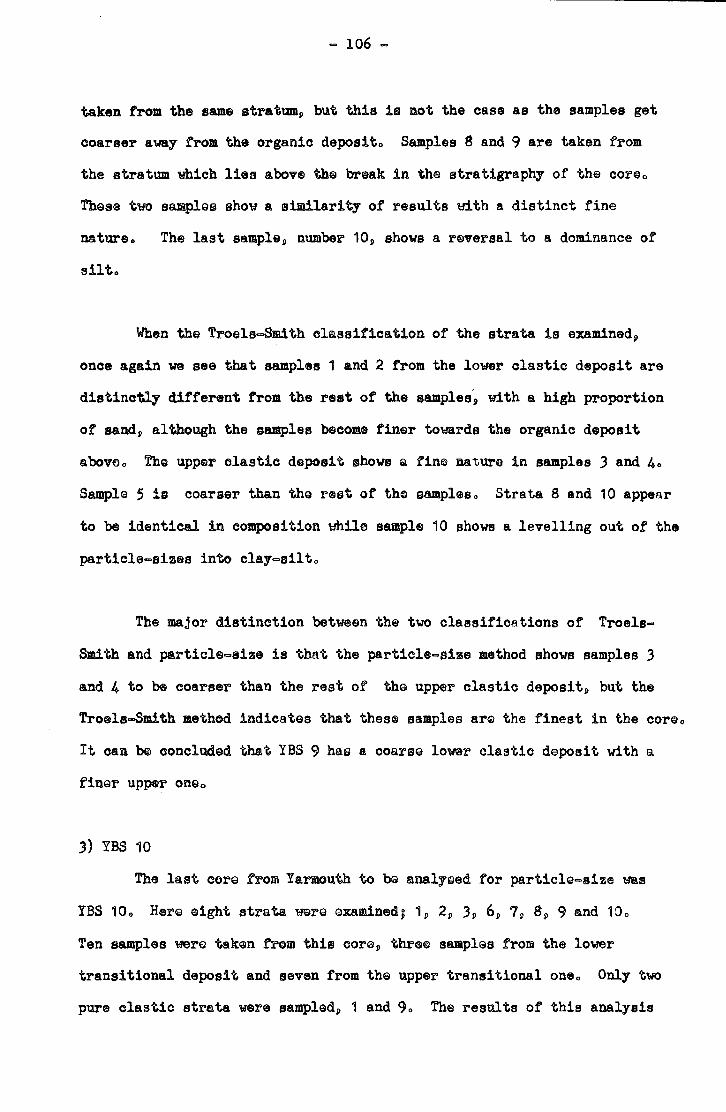
~ 106 -
taken from the same stratum~ but this is not the case as the samples get
coarser away from th~ organic deposito Samples 8 and 9 are taken from
the stratum Which li•s above th~ break in the stratigraphy of the ooreo
These two samples sho~ a similarity of results ~th a distinct fine
natureo The last sample~ number 10» shows a reversal to a dominance of
silto
When the Troels=Smith classification of the strata is examined»
once again we see that samples 1 and 2 from the lover clastic deposit are
distinctly different from the rest of the samples~ with a high proportion
of sand» although the samples become finer to~rde the organic deposit
abov~o The upper clastic deposit shove a fine nature in samples J and 4o
Sample 5 is coarser than the rest of th0 sampl®so Strata 8 and 10 appear
to be identical in composition vhile sample 10 shows a levelling out of the
particle-sizes into clay=silto
The major distinction betveen the two classifications of Troels=
Smith and particle=size is that the particle=size method shows samples J
and 4 to be coarser than the rest of the upper clastic deposit» but the
Troels-Smith method indicates that thea® samples are the finest in the coreo
It can be concluded that YBS 9 baa a coarse lower clastic deposit with a
finer upper oneo
3) YBS 10
The last core from Yarmouth to ba mnalyged for particle~size Yes
YBS 10o Here Qight strata ~re Gxamined; 1p 2 9 39 6» 79 8 9 9 and 10o
Ten samples were taken from this core, three samples from the lower
transitional deposit and seven from the upper transitional oneo Only two
pure clastic strata were sampled9 1 and 9o The results of this analysis

'-:"-:r "\-... .,.
00
1/'J'
~? ~ '\
LJ.J N Vl
LJ.J _. LJ -r.,. -1-
~0
a:: <{ a...
0 -c--
Vl co >-
- 1!1
~ I
•' t'"J r.' •' •' '•' •' •'
•' •' •' •' •' >': •' •' •' ,•' •' •' '•'
n. ~ n Uu U
._
~ ~
~--~~
~ ~ ~~ ~ ~
' •'
"' ~--b 121'- ,• •'
~ ,•
!2 ..
'f <D en 0 N " <D
';" N ,.;. "' N
I I I I
:tl N N N
0 :1,
Jf'i~,-~-rdr.·h J,r tn1rh-'14f• _.,~,- • !r Jl I.., J" I ;,tJ I I I .. ; .... I q 'I. I " I :4 t:• I I' ,I .iJ ,J " I JJ! I I I ... I :, I j I' I • I ' I ":I "":I I I I
.&.'-~'~ -~Ji_' ··~·' J_~t. "-' ~ •.; '·- '.\:. = 2
~ S'
1
~ S'
" i ~ 'J ' ~ lA lA i.
j r -~ ~ ~

- 107 =
are shown below together with the Troels-Smith description~ and in Figure
29.
Table 14 Particle-size AMlyJiiS of YBS 10
Sample Altitude %Clay %Silt %Sand
10 -1 • .35 to -1.40 52.6 (25) 46.0 (50) 1,4 (-)
9 -1.44 to -1.49 53.3 (25) 46.2 (50) Oo5 {-)
s -1.55 to ~1.60 50 .. 0 (25) 50.0 (50) OoL (=)
7 -1.60 to -1.65 52.0 (25) 47.8 (75) 0.2 (~)
6 -1.68 to -1.73 46.3 (-) 5.3.7 (50) 0.1 (-)
5 -LBO to =lo85 50.8 (=) 48.8 (50) 0.4 (-)
4 -1.90 to -1.95 18.1 (-) 79.8 (25) 2,2 (-)
3 -2 • .38 to =2o43 31 .. 8 (-) 67 0 5 (25) 0.7 (-)
2 -2.45 to -2.50 49.4 (-) 50.2 (50) 0 .. 4 (-)
1 =2.56 to -2o61 32.4 (-) 64.8(100) 2.8 (-)
These results show that the lower transitional deposit is coarser than
the upper onep above the intercalated organic deposito The highest recorded
sand content is found in stratum 1. Sample 4 from stratum 6 is unique in
this core with very high silt and low clay fractions. The domina.noe of the
silt is lost in sampla 5 but returns briefly in sample 6D which is the
sample below the truG clastic stratum of aampl~ 7 where clay once again is
dominant. Samples 89 9 and 10 show relative uniformity with near equal
parts of silt and clayo These last three samples vere all tgken from
stratum 10o
These results of the Troels-Smith classification again show that the
lower transitional deposit is coarser than that above the organic deposito
The two samples 3 and 41 bordering the organic materialp show only one
unit of ailto This iner9ases to two units in tha next two samples, 5 and

- 108 -
6, below the clastic sample 7o The latter shows an increase in silt
with the introduction of clay. This clay remains through the last stratum
sampled, While the silt is rsducedo
The correlation between the Troels-Smith analysis and the particle-size
test is very poor, although in both methods the lower samples are show to
be coarsero The largest difference is found in sample 3 vbere particle-size
shows a high proportion of silt and clay although the Troels-Smith analysis
indicates that this sample is from a stratum vith a predominance of organic
material and only one part silto The disagreement between the tvo methods
may be explained by the mixed nature of the material sampledo As mentioned
previouslyp there are only t~ true clastic strata and these are thin bands
of 5 om and 9 Cllo
By examining all three cores sampled, it can be seen that the core to
the east of the River Yarp YBS 3P is far sandier in comparison vith YBS 9
and 10, to the ~st of the rivera There is relatively uniform dominance
of ailt throughout the ooras but moat importantly the lower clastic deposit
found in all three cores is shown to bG coar~er than the upper clastic
materialo
JgJaJ Pollen AnQlyses
At Yarmouthp six boreholes were chosen in order to study their pollen
contentp YBS JP YBS 9P YBS 109 YBS 129 !BS 13 and YBS 14o These cores war@
selected as they Yere the only ones with sufficient organic material for Q
reliabl® analysi9o

- 109 -
1) YES 3
At YBS 3 the organic deposit between the upper and lower clastic
deposits was sampled for pollen. This organic deposit can be described
as a herbaceous peat and consists of ten strata; 3, 4, 5, 6, 1, 8, 9,
10, ll and 12. Sixteen levels were sampled through these strata. The
samplin3 interval through the main body of peat was 10 em with an
interval of 2 em over the upper and lower transitions. These levels are
1) -651, 2) -649, 3) -647, 4) -645, 5) -640, 6) -620, 7) -600, 8) -580,
9) -560, 10) -540, 11) -520, 12) -510; 13) -504, 14) -502, 15) -500
and 16) -498 em. Six local pollen assemblage zones (YBS 3:1 to
liS 3:6) have been identified where major changes occur in the pollen
curves. These are described below. The data from this analysis can be
found in Appendix IV and seen in Figure 30. The data are displayed as
percentages of the total land pollen (TLP) for comparison with other
sites. Data on dry-land pollen has been incluied for relative dating
purposes.
~PAZ YBS 3:1 -651 em to ~·-630 em
The herb pollen are dominant in this zone although they decrease
to the top of the zone as trees increase. The most important tree
pollen comes from Alnus with 27.9~ TLP at -647 em and Quercus with
11.7~ TLP at -645 em, both are increasing. Fraxinus pollen attains
6.5'j> TLP at -649 em. Other dominant taxa are Jramineae with 50~ TLP
at -651 em and Cyperaceae with 12.1~ TLP at -640 em. Corylus and
Ranuncu1us-type pollen both have 6.3~ TLP at -651 em and -647 em.
The major dry-land tree pollen comes from ~uercus with 28~ of trees at
-645 em, Fraxinus with 14~ of trees at -649 em, Tilia with 12~ of trees
at -645 em and Ulmus with lO~ of trees at -651 em. Sphagnum spores are
only found in this zone and Calystegia pollen dis~ppears to return

~
c QJ
0 0..
"C c ro
_J
(Y"'j
Vl co r
l• l\
'<-_,
'Itt \,
v, "''b
"'? ~~ v/J'
'-()Ill ...:t ,., N or-
!:ilil! ~ ~ .. ~ ...
~ § !!:;!;;; ;:;:. ~
~~~~ ... ..,
"' 12 ~ ~ !;;;;!t • (:: (:: "' "'
..,
F l ~~-~ . r • l r .... -~ • X < l
F - • ~~ [_ l [_ .w..l r 1 r ~ l r l r 1 r l
~- --~ 1-•-- --- f~ _____J
r ---- --f--~
r l r l r l r 1 1 r l r . l r l
I
r f___x~-~ F ,, • r ~ ~- z _____J
r l _____J
~- ]
r r r r
F
r L r
Itt ! I ! ! H~ & i
I I HHt
1 44 I l i l --r--
--t-- -~ l
• l . • """' l
ttl II I f I j •l.!Jl _.
LJ.. ~
I! ! I ! f !~ ~1 ! !
,.,.;! lx • • i . •Ilk
~ It • t f ! ! j IIlli
1 .... l
"""" _l . _n l
' ~-- - ~T~: ~ ""GQ ~ ""~
'>
~ r,- -1 - &- l !. -: l 1 llH
"' I I
I ... I I I I 4. I I I ', I '.., I ~I 11
I 11
4. 11
I 1
" _!. ' ~ " IL I 11
Jl cdl , ... ,_,,,, ,,,,, ... ,,11114.111" ... '-"'''..lo.[l"
- I - I 4. I ' I I I " I I I ' I •I I " I I I 6 _.'- 4. _. I I '""' I "c! ,_,,,_,,, .. ,,,,, ..... ,,,,,,,_, ... ,, ... ll..llcd
"' "'
u "' Ill "' w
w ~ Ill .. ~ "' a- rr ::l ,, T "' 0 n . "' T 4 oA
I I ~ D • r-:J

- 110 -
again at the top of the core• The concentration of Jramineae is
40.2 x 10² srains/cc at -651 em and Alnus has 12.6 x 10² grains/cc
at -647 em. The upper boundary was placed where Alnus pollen increases
from 24.4~ TLP to 34.1~ TLP, Gramineae drops from 34·9~ TLP to 7.8~ TLP
and Cyperaceae also drop from 12.2~ TLP to 3.9~ TLP.
LPAZ YBS 3:2 ~.-630 em to ~·-590 em
Tree pollen takes over in dominance in this zone with over 50~
of total pollen. Herb pollen continues to decrease to -600 em. At
this level the maximum count of spores is found. The dominant tree
pollen are once again from Alnus with 53.2~ TLP at -600 em and
Quercus with 15.6~ TLP at -620 em. Cruciferae pollen first appears
with 11.2~ TLP at -620 em but quickly drop to 0.4~ TLP at -600 em.
The rise of spores in this zone is caused by Filicales which record
16.3~ TLP + Spores at -600 em. The major dry-land tree pollen comes
from Quercus with 28~ of trees at -620 em and from Ulmus and Tilia
both 1d th 3/b of trees at -620 em. Viburnum pollen is only found in
this zone with 9·5~ TLP at -620 em. Cruciferae and Lythrum pollen are
also only found here. The concentration of Alnus pollen reaches
80.8 x 10² grains/cc at -600 em while Corylus and Filicales both have
concentrations in the 20 x 102s grains/ca. The upper boundary was
marked where Alnus drops f:rorrt 53.2',1> TLP to 21.2;t- TLP, <iuercus pollen
increases from 8.9'fo TLP to 16.7'jb TLP 9 Corylus pollen drops from 14.6;~
TLP to 6.4~ TLP, Gramineae and Cyperaceae both show large increases
and Filicales show a large decrease.
LPAZ YBS 3:3 ~·-590 em to ~·-550 em
Tree pollen is still dominant in this zone while herb pollen
begins to rise to the top of the zone. The most important tree pol:en
is Alnus with 37.2~ TLP at -560 em and Quercus with 16.7'fo TLP at

- 111 -
-580 em. Corylus pollen is again the dominant NAP with 20.9~ TLP at
-560 em. Gramineae has 19.6~ TLP at -580 em and Cyperaceae has
17.2~ TLP at -580 em. The major dry-land tree taxa are Quercus with
34~ of trees ut -5t0 em, Tilia with 8~ of trees at -560 em, Ulmus with
8~ of trees at -580 em and Betula with 8~ of trees at -560 em. Although
Corylus pollen is the dominant NAP gramineae has the greatest
concentration with 21 x 102 grains/cc, while Corylus has 15.4 x 10²
grainsjcc. Alnus has a high concentration with 27.3 x l02grainsjec.
The upper boundary was placed where Alnus pollen decreases from
37.2'-fo TLP to 15.47; TLP, Gramineae increase from 6.9/b TLP to 17·9~ TLP
and Cyperaceae increase from 4.6~ TLP to 23.5p TLP.
LPAZ YBS 3:4 ~·-550 em to ~·-515 em
At the base of this zone herb pollen is dominant but this is
replaced by tree pollen at the top. Alnus pollen with 32.4~ TLP at
-520 em is increasing while Quercus pollen with 9-3~ TLP at -540 em is
decreasing. The other dominant taxa are Cyperaeeae with 30-3{t. TLP at
-520 em, Jramineae with 17.9~ TLP at -540 em and Corylus with 16.1~ TLP
at -540 em. The major dry-land trees are Quercus with 30~ of trees at
-540 em, Ti'lia with 7 -3'-fo of trees at -520 em and Betula and Fraxinus
with 6~ of trees at -540 em. Mentha and Lathyrus pollen are only
found in this r.one. The concentration of Alnus increases frorn
8.5 X 10² to 42.3 X 10² grainsjcc in this zone while Cyperaceae have a
concentration of 39.6 x 10² grainsjcc at -520 em. The upper boundary
was placed where Pinus and Ulmus pollen disappear. Alnus pollen rises
from 32.4~ TLP to 57·9fo TLP, Corylus pollen increases from 7·5~ TLP to
17.9~ TLP and Gramineae and Cyperaceae show very sharp decreases.
LPAZ YBS 3:5 ~·-515 em to ~--507 em
Tree pollen is dominant in this zone with over 70'};. of total pollen.

- 112 -
'l'he dom:inant tree taxa are Alnus with 57·9/o 'I'LP and Quercus with 9·3f>
TLP;oo Corylus pollen reaches 17·9'f0 TLP and Ranunculus-type also show
high percentages. The ~ajor dry-land tree pollen comes from Suercus
with 26~ of trees, Til i a with 6{t> of trees and Fraxinus with 41> of
trees. Convolvulus pollen is only found in this zone. Although Alnus
pollen reaches its highest recorded percent~ge in this zone, the
concentration of the taxon is relatively low with 21.8 x 10² grainsjcc.
'l'he upper boundary is marked by a decrease in Alnus from 57 .9~ TLP to
21.3~ TLP and a sharp increase in Gramineae and Cyperaceae.
LPAZ YBS 3:6 ~--507 em to -498 em
Tree pollen declines sharply in this zone with a dominance of herb
pollen over 50~ of total pollen. The most important tree taxa are
Alnus with 21.3% TLP at -504 em and Quercus with 11.2~ TLP at -498 em.
Cyperaceae are the dominant NAP with 45 .4~~> TLP at -498 em. Coryl us
pollen·reaches 19.8~ TLP at -500 em and Gramineae have 15.8~ TLP at
-502 em. The major dry-land tree pollen is from Quercus_ with 46~ of
trees at -498 em and Tilia with 10~ of trees at -500 em. Typha
latifolia is only found in this zone while Hedera, Frangula, Cruciferae
and Calystegia pollen all reappear.
These zones can tentatively be correlated with the lithological
strata of YBS 3. LPAZ YBS 3:1 can be said to represent strata 3 and 4.
Herb pollen are found to be domin8nt at the base of this zone, while
tree pollen increase to the top. This change in dominance can be
explained by the change in stratigraphy from the herbaceous peat of
stratum 3 to the more woody peat of stratum 4. LPAZ YBS 3:2 is a zone
where tree pollen is dominant and corresponds to the mixed woody strata
5 ond 6. LPAZ YBS 3:3 also sbo\vS a dominance of tree poll en ui th a:
rising importance of herb pollen to the top. This correspond to strata

- 113 -
7 and 8o LPAZ YBS 3:4 correlates with the upper half of stratum 9,
stratum 10 and the lower parts of stratum 11o The dominant taxa changes
from herb pollen at the base to tree pollen at the topo LPAZ YBS 3:5 can
correlate with the upper levels of stratum 11 which has been shown to be
dominated qy tree polleno Tho last zonop LPAZ YBS 3:6 corresponds to
stratum 12, the herbaceous peat, where herb pollen is once again dominanto
In conclusion ve can see that the organic material is herbaceous at
the base, in stratum 3, passing into a woody peat with Alnus pollen
dominant in strata 5, 6p 7 and So Stratum 9 is again a herbaceous pe~t
with Cyperaceae dominanto Alnus returns to dominance in stratum 11 before
Cyperaceae reappears in stratum 12.
YBS 3 was chosen to represent the Carpark site at Yarmouth as it
reveals the deepest peat deposito
Dating of the LPAZ at YBS 3o
The peat at YBS 3 ranges in altitude from ~4.02 m.O.D. (~480 em) to
=5o74 m.O.D. (=652 cm)o Six LPAZ were recognised and are summarised below
(Table 15) with the dominant AP and NAPo
The frequency of Quercus pollen is greater than 6o% of trees throughout
these LPAZp reaching 89% of trees in LPAZ YBS 3:6. The frequency of Alnus
pollen is also highg over 60% of treesp reaching 81% of trees in LPAZ
YBS 3:5o Tilia pollen is present throughout the LPAZ indicating an early
agep probably Flandrian Chronozone II or the early part of Flandrian IIIo
A tentative division between FII and FIII is proposed at =5.50 maO.B. based
on decreasing Qlrmul vttluesp inor®liaing QQ.ry.J..wi pollan H.nd un increMtJf:l in
the pollen of h~rbao0dlug taxao LPAZ YB:;j Ja2 to LPAl YUS 3:(, are thought
to belong to the early part of FIII as Tilia pollen is still presento

I
- 114 -
Table 15 Dating of' LPAZ at YBS 3
Flandrian I Altitude Depth Dominant Dominant Dominant LPAZ
Chronozone I (m.O.D.) (em) life group AP NAP
=4o18 to =498 to Q...!=T=. Co=Cy-!)Y6 Herbs
=4.27 -507 u Pt-Gr
-4o27 to =507 to AcsQ-T= Co
Y3:5 Trees Fr ""4o35 =515
=4o35 to =515 to A...Q-T- Cy=Co III Y3:4 Herbs
-4o70 =550 B+U+Fr Gr
=4o70 to =550 to Herbs A-Q-T- Co...Qr Y3:3 &
=5e10 =590 Tree a u Cy ------
=5o 10 to =590 to A...Q-T+ Fi-Co-Vi-Y3:2 Trees
=5o 50 -630 B Gr=Cr
=5.50 to =-630 to Q...A-Fr- Gr-PiF II Y3:1 Herbs
-5.71 =651 T-U Co-Cy !
Q=Quercus, !=Alnus, T=Tilia9 O=Ulmus, Fr=Fraxinu§, B=Betula, Co=QQry~,
Cy=Cyperaceae, Pt=Pteridium, Gr=Gramineae, Fi=Filicales, Vi=Viburnum,
Cr=Cruciferae.
2) YBS 9
At YBS 9 six strata verg sampled for their pollen content; 2, 3, 4,
5, 6 and 7o Strata 3 and 5 ~ere organic ~th an intercalated clay, stratum 4o
In total 16 levels ~ere taken from these strata; 1) =532, 2) =530, 3) =528,
4) =526, 5) =524, 6) -520, 7) =514, 8) =510, 9) =500, 10) =498, 11) -494,
12) =492, 13) =480, 14) =476, 15) =472 and 16) -468 em. In the lover peat
the sampling interval was 2 em over the lower transition with the sandy-clay.
Through the main body of lover peat this interval was 6 em and again 2 em

c: QJ -0
CL
""0 c ro
_J
ro -0 I-
~ 0
a-. Vl co >-
..0 • l"f"\ N ..a U1 -:t , .. .,
~ " ~ ~~ ·~18 3 ~ ~~ ~ ~ ~ .. "' ... ... ,., N N N
,., "' ~ .. ~~ 8:!1 ~ !
., .. ., ~-'!! .... ~ ~
.,_ ,., .., . ., ·- Ml'"\ --N
I I ~ l II l l ~ I A
r I l r x .I .A J r I , 1 r x • _T • • .. l r l r l r _I 1 [_ 1
i I ~
r • l [_ • I l r T l r 1 r T ---1---- 1 [_ -~ __. --- ---· 1 r --- -- -~-=--t... -
l L__ --------j ~----
1 [ ___ --- ::_...:4- ---- 1 r____..__ - -- ~--
_] L__ --"- --- --- -- . --- ----- _1 L __ ---- l [j__t_ • • Ao . L __
- --~J p--- f--- ----- .
-- -F 1 * A.L.._j r r ---+. [_ • [
tfl I
~ l I ! H
• • lj
f ! ± I f l •:!I
r
~ I
r r l r
~--
~ I ! l j ~ j! j • --- -- :.1. u____ -- - .. r I Hj
j j I j + • I ' L__
~ L ..i.•4" t f • • • l H j
' . • T r r • I
II ~ • ~ t
,. "' '
0
"
::> ''" s-~j ~
. - - J
"' l - I --- I -~ ,.__ - ---- _ _j
J . . ' l l l
f f
] I " l • f l -;
"l
~ ! ~
f {It q l
l l l -
f---- l __ _,._
-~~' y ! j
-
I I
. . f • .
~~ ~ ~ ~
~
" •
~
q l., I
- " ' •• I
t +t I
!
l j • ••
>uH ] l
l
~ ~
~·~ -
"' "' <,J
"' (I) "' ,___
w ::> (I) <(
w 0: "' ::>
e: I w 0
"' I <(
0181 t:).
~~i ~~~~ •_;Iii i: ~ !;(i>:AW
, I ..
"' w
"' 2 "' IZl

----· -------------------------------
- 115 ~
at the uppe~ transition to the clay of stratum 4· The upper strata,
including the upper peat, were sampled at 4 em intervalsa The pollen sum
counted at this site was 100 tree pollen where possible but where the tree
pollen was scarce a total of 50 tree pollen was made. In all cases the
bY~ marker spore count was at least 200 grains. The data recorded
in this analysis can be found in Appendix IV and is graphically displayed
in Figure 31. At YBS 9 six local pollen assemblage zones have been
identified. LPAZ YBS 9:4 has been subdivided into two sections YBS 9:4a
and YBS 9&4b on the basis of the Gramineae, Cyperaceae and Filicales curves
although no changes vere found within the tree pollen curves. These zones
are described in detail below.
LPAZ YBS 9:1 -532 em to ~·-531 am.
This zone is dominated b.y tree pollen but also has a large proportion
of spores (20.4% of total pollen)e Tilia is the most important tree pollen
with 19.6% TLP, Alnus is a close second with 19% TLPo NAP is dominated by
Q2rylus pollen with 21.7% TLP, Gramineae with 14e1% TLP and Filicales is
recorded to have 17.8% TLP ~ Sporeso Hedera pollen is present here but
disappears until LPAZ YBS 9z4bo The concentration of Tilia and ~ pollen
are 11eJ x 102 grains/co and 11 x 102
grains/cc while Filicales is seen to 2
have 12.9 x 10 grains/ceo The upper boundary of this zone was drawn where
Tilia pollen drops from 19o0% ~LP to 4o4% TLP 9 ~ pollen rises from 19%
TLP to 36$3% TLP and ~lit pollen drops from 21o7% TLP to 2.2% TLPo A
large drop from 17o8% TLP ~ Spores (TLP ~ S) to 1o6% TLP + Sis also seen
in the Filicalee curvea
LPAZ YBS 9:2 ~a-631 em to ~--522 em
In this zone tree pollen is still dominant but herb pollen is rising
quicklyo The dominant tree pollen comes from ~ with 55o4% TLP at

- 116 -
=528 em, and Quercus with 10o9% TLP at ~5.30 cmo NAP is dominated b,y
Cyperaceae with 29.,7% TLP at 526 cm11 Gramineae with 19o2% TLP at =530 am
and Q2a:lus lrlth 10o.3% 'l'LP at cs524cmo Ericacaae pollen ia only found in
this zone at 528 am as is ~~ Artpmisi4 9 Caryophyllaceae9 Leguminosa0
and Menth§ polleDo The concentration curves shov two outstanding taxa,
2 2 Alnua with 88o4 x 10 grains/co and Cyperaoeae with 54o8 x 10 grains/coo
The upper boundary of this zone w.s placed where Alnug pollen d.Nps from
41o1% TLP to 17o4% TLP 11 Gramineae rises from 18o.3% TLP to 28.,.3% TLP and
Cyperaceae rises from 7.2% TLP to 15.2% TLP.
The dominant life group changes from tree to herb pollen in this zoneo
Tbs most important tree pollen comes from Alnup with 26o8% TLP at -514 em
and Quercue vith 14el% TLP at =520 cmo Of the NAP Cyperaceae record 39e1%
TLP at ~514 em, Graminea~ 28.,)% TLP at =520 em and ~lil with 15o6% TLP
at =520 em. Cyperaceae pollen show~ a very high concentration of 67o.3 x 102
grains/co in this zone and perhaps suprisingly9 AlDY§ records a concentration
of 46o 1 x 10²
grains/eo hereo Th~D upper boundary is marked b;r a rise in
Quercus pollen from 5% TLP to 12.,5% TLP, a fall in A1nu1 pollen from
26e8% TLP to 9o1% TLP9 a very large increas® from 9oS% TLP to 49o4% TLP ia
GramineaQ and a C@rrespo&ding large drop in Cyperaoeae from 39o1% TLP to
LPAZ YBS 9 g4a ca.,=509 te Ctao=502
This sub=zonQ is characterised b.r a dominancG of h0rbpollen with ovGr
50% of total polleno Quercus poll~n bcome0 the most imp0rtant tr0e pollen
with 12.5% TLP ~ile Alnua pollen has 9e1% TLPo Gramineas is the dominant
non arboreal taxen vi th 49 e4% TLP while QR.o'lllt! has 12 o 5% TLP. As
empected, Graminea~ has th~ highest concentration with 47o2 x 102 grAinB/ooo

- 117 -
All other curves record low concentrations. The boundary between the two
sub-zones of LPAZ YBS 9:4 was drawn where Gramineae shows a large fall frem
49o4% to 17o9% TLPp Cyperaceae increases from 3.4% TLP to 26.3% TLP and
Filieales increases from 1.7% TLRSto 29. TLP + S.
LPAZ YBS 9:4b ~.~502 em to ,a.=486 em
Herb pollen is still dominant in this sub-zone but not ~ such a clear
margin as recorded previously.. The most important tree pollen comes from
Alnus vith 24.5% TLP at -492 em and Querct!§ with 15.3% TLP at -500 o. The
NAP is dominated by Cyperaceae with 29.7% TLP ~t =498 em, Gramineae with
21% TLP at -494 em and Qiry.JJ!I with 14.5% TLP at =492 em. Filicales spores
reach a maximum of 64% TLP + S at -498 em. Cruciferae pollen first appears
in this sub-zone while Qa!ygtesil and Valerianella pollen are both only
recorded in this eub-zone 11 both at -498 em. Valerianella. pollen it!1 recorded
as being 8.8% TLPo Man, species of pollen reappear here eg., ~~ ltinggla,
Hedera, Cbenopodiaceae, Rosaceae and 1fthrum• The concentration curves show 2 2
that Filicales has 151.3 x 10 grains/co, Cyperaceae with 32.4 x 10 grains/co,
Gramineae with 27 x 102
grains/co and Alnus vi.th 23 .. 1 x 10² grains/ceo The
upper boundary is marked by a drop in Alnus pollen from 24 .. 5% to 9.9% TLP,
a rise in Gramineae from 18.5% TLP to 29o8% TLP gnd a fall in Filioales
from 19o1% TLP ~ S to 1.6% TLP ~ So
LPAZ YBS 9 85 ~ .. =486 em to J;Ao=474 am
This zone is dominated by herb pollen once again. The moat important
tree pollen comes from ~cus ~th 11.6% TLP at =480 em and Alnus with
10 .. 2% TLP at =476 Clilo Of the NAPp Gramineae has 34 .. 9% 'l'LP at =476 em,
Cyperaceae has 19 .. 6% TLP at -476 om and ~lYI has 16.6% TLP at -480 am.
Chenopodia.eeae pollen rises to 6.2% TLP at -476 em. ~ pollen is only
found in this zonao Gramineae recorda the highest concentration vith

- 118 =
38e1 x 102 graina/cc whil0 Cyperaceae has 21o4 x 102
grains/ceo The upper
boundary to this zone was placed vhere ~lue pollen rises from 8 .. 9% TLP
to 24 .. TLP, Gramineae falls from 34o9% TLP to 12oJ% TLP and Cyperaceae also
This zone is dominated ~ herb poll0n at the base but tree pollen at
the topo The most important tree pollen being Alnus with 22.4% TLP at
-468 em and Quercus with 20.6% TLP at =468 cmo QgrY,lus pollen is most
important NAP=type with 24% TLP at ~72 em, Gram.ineae has 15 .. 9% TLP at
=468 em while Chenopodiaceae has 11 .. 6% TLP at -472 Olio b}>horbi& pollen
is only found in this zoneo The concentration curves are all relatively
2 lov but ~lYI has the highest concentration Yith 12o7 x 10 grains/coo
These LPAZ can be tentatively correlated with the lithological strata
or YBS 9o LPAZ YBS 9&1 can be correlated with stratum 2, the clastic
material, vhich is dominated ~ tree pollen and also has a high record of
Filicales sporeso LPAZ YBS 9&2 corresponds to the lover levels of the
Grganic matsrialo Tree pollen is still dominmnt hereo LPAZ YBS 9:3
corresponds to the middle levels of the organic stratum, where herb
pollen first becomes dominanto LPAZ YBS 9a4a mnd LPAZ YBS 9x4b are still
correlated ~tb stratum 3 with dominant herb polleno The upper level of
Btratum 4, the cl8yp and stratum 5P the peatp can be alli0d to LPAZ YBS
9:5 vhere herb pollen is still most importanto LPAZ YBS 9:6 is dominated
qy trGG pollen and corresponds to strata 6 and 7, the transitional stratao
In conclusion ~e can say that th~ basal layers of the organic stratum
are woody in nature ~ith Alnus pollen9 but this passes into a herbaceous
peat for the rest of the deposit ~th a dominance of Cyperaceae and

= 119 -
Gramineae polleno The upper peat is also herbaceous in nature with
Gramineae the dominant herb polleno Above the upper peat the transitional
stratum 6, is still herbaceous but with ~lus pollen as the dominant
taxon. Alnus pollen returns to dominance again in stratum 7o
.3) YBS 10
At YBS 10 the peat deposit together with its upper and lover
transitional deposits were sampled for polleno Nine strata vere examined;
2, .3, 4, 5, 6g 7, 8, 9 and 10o The sampling interval through the main peat
strata (of' stratum 4 and 5) vas 10 om with an interTal of' 4 om over the
upper and lower transiti8nal stratao In total 16 levels vere analysed
for pollen~ 1) -.3379 2) =.3.33, .3)=3299 4) =325, 5) =.321 9 6) =317,
7) =.313, 8) =J0Jp 9) -29.39 10) =28JD 11) =271p 12) =267p 1J) =26,3 9
14) =25.3, and 16) -237 cmo A p0llen sum or at least 100 trees vas made
at all levels e.xcept level 11 wer® only 50 trees wre counted and 492
~~ marker apore&o The results or this analysis are reoorded in
Appendix IV and can be seen in FigurG 32o Fiv@ LPAZ were recognised and
are outlined belovo
LPAZ ·ns 10:1 =3.37 em to .Q.lo=327 em
This zone is characterised b.Y a dominancG of tree pollen with
decreasing herb pollen and increasing shrub p®lleno The most important
tree pollen being Alnus vith 27o8% TLP at =.337 em and Quercus with
25 .. 9% TLP mt =.333 Clilo Ot the NAP Qg,orlJw rtacordSl 17o9% 'l'LP at =3.37 cm9
Gramineae has 15o1% TLP ~t =3.33 em and =329 emD ChGnopodimcea~ has
8o5% TLP ~At =337 em and Ptsgidi.m§ hag 10o5% TLP? S b\t =329 cma Four
species ar0 only round in thi~ zoneD thess are Gompo~t&~ liguli!l~,
Umbelliferaa 9 Conyolyulup and ~~o The concentration of pollen is
2 relatively low with Alnus recording 15o1 x 10 grains/co and Quercus had
2 10o9 X 10 grains/COo The upper boundary is dr&lm Were QuerCUS pollen

c: QJ
0 a_
__, ro -0 I-
~ 0
Vl co >-
..cl rnl ~ ,~ .., "' ~ ~
ro rn
r .. :-_. · j • • , + .. :t ~ ·l LA_ _ _. __ ... _ _ .... _~__1- _ _..__ _ _..__+~-.&. .a_._]
~L--r ~~• __r._' ; ---+-----+-1 ~:--~J'd ~~~+----+~-+---l~J L.o---~--t-~-+----j~
~----~-~---~-~·~
L__ __ - -1----+---+-
c_._______.__ -- ----+-~+--L--~-· L.__ ___ _
* ! L__ __ _..__ __ -+[~ __ ____.___________
[____....-""' -~--+--+-[
f • '" ~ I I 1
LL t l ! -+----r--_· _ .. -+----1 _· • f ! ' .J
i • [
~ L
1 ! ••
[ ...... - -. _J.
r + ~ t r L_
•• J.
"' "'
I . I
0 N
"'
" I
...
l
! t
~ ~ ~ g ~ ~ _-L...,...___l. __ ..... L __ /_ I l_~J._____;
"' -' til -': _.: l ..... -' 4 -' • ~ 4 I I<# I ' I 4 I 4 I 4 I 4 :.0 I 4 ;.1 I ·' 4 l ~ .J of':~ d) J I -' _. , ": 1 .J I <II' I ' I <I I <# I <1 I ;I 4 .J :1 .J <1 .I
.!] J 4 -':dl .J I ' .& -' f/ 1'. J I 4 I -'I' I fl I <I I 4 I f/ ~ .! ":.J <I-' I
~!_-' :' --;_<!_-'_~;! ~''·'-' '-·' ~~-~!~ ~~-~ _1_,
S!
00[1110
~g~2 5:;;~:;

- 120 -
drops from 25.7% TLP to 17,2% TLP, Alnus pollen increases from 12 .. 3%
TLP to 21 o 3% TLP, Q.Q.cr JJH pollen falls from 14 .. 5% TLP to 7. 5% TLP ~
Gramineae also drops from 15 .. 1% TLP to 6.6% TLP while Cyperaceae shows a
large increase from 7.4% TLP to 38 .. 5% TLP.
LPAZ YBS 10:2 ,a.~327 om to .£1•=308 em
In this zone ~erb pollen becomes dominant vith vall over 60% of total
pollen, in the middle tvo levels. The most important tree pollen comes
from Alnus with 24.4% TLP at =313 om and Quercus with 17.2% TLP at -325 em.
Cyperaceae records the highest percentage of NAP with 55o9% TLP at ~317 em
whilQ Gramineae has 15.8% TLP at =313 em and fw'.lYI has 10.6% TLP at -313
em. ~h;rum and Mentha. aJ"e only found in this zone while fi:!ngyl§,,
Ericaceae, ~ ~gustif9lia and lYPh! latifolia pollen first appear.. The
concentration of Cyperaceae grains is high as would be expected with
17.3 x 10² grains/co while Alnus has 29o7 x 102
grains/co and Gramineae
2 records 13.8 x 10 grains/ceo The upper bound~ry to this zone is marked
by a large rise in Alnus pollen from 24a4% to 76 .. 9% TLPp a fall in
Cyperaceae from 25.4% TLP to 2a3% TLP and a fall in Gramineae from 15 .. 8%
TLP to 1.7% TLP.
LPAZ YBS 10:3a£!.=308 om to ~o=288 em
sub-Tree pollen once again is the dominant life group in thisAzona with
over 75% of total polleno Herb pollen is dramatically reduced in importance
here. The dominant tree pollen is Alnus with 76o9% TLP at =303 em While
Quercus has 10.5% TLP at =293 cmo Q2ry'l.YJ! is the only NAP to show any
form of high representation with 9a4% TLP at =293 em. Viburnum pollen is sub-
first found in thieAzoneo As expected ~ pollen has a VP.Ty high 2 2
concentration Yith 110o1 n 10 grains/co and 9Yerous pollen has 12.7 x 10
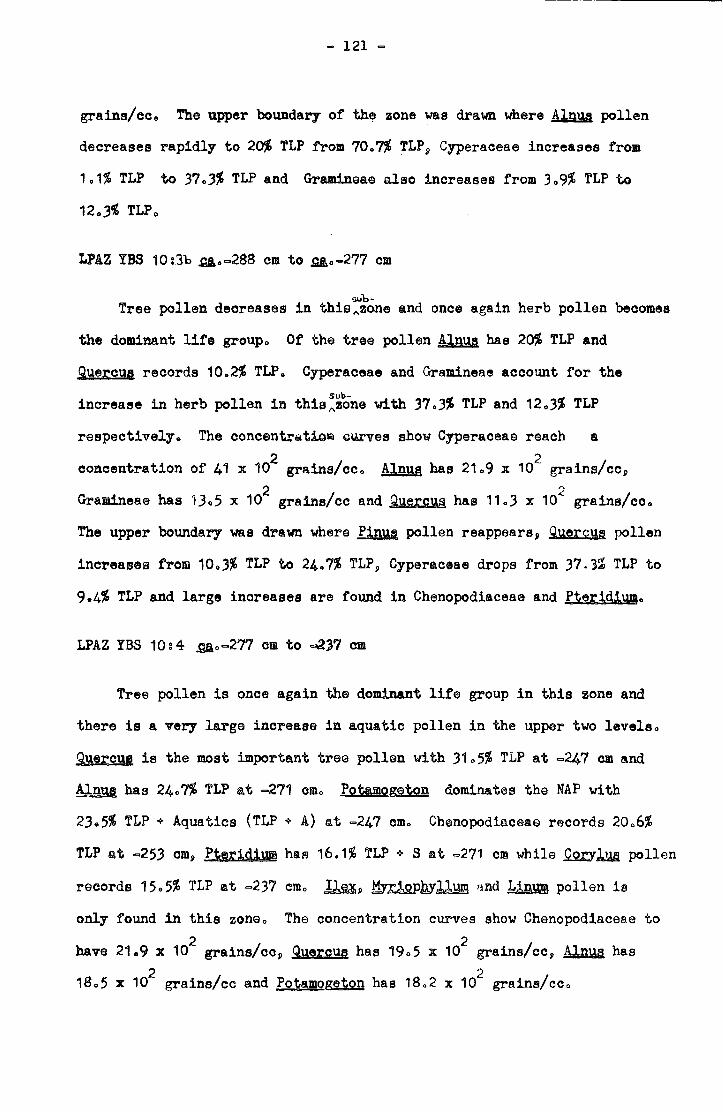
- 121 =
grains/cce The upper boundary of the zone we drawn where Alnus pollen
decreases rapidly to 20% TLP from 70.7% TLP, Cyperaceae increases from
1.1% TLP to 37.3% TLP and Gramineae also increases from 3o9% TLP to
LPAZ YBS 10:.3b .,g&.=288 em to s;J.o-277 em
sub-Tree pollen decreases in thia~zone and once again herb pollen becomes
the dominant life groupo Of the tree pollen Alnus has 20% TLP and
Quercus records 10.2% TLP. Cyperaceae and Gramineae account for the
increase in herb pollen in thia:z~ne with 37.3% TLP and 12.3% TLP
respectively. The coneentratio~ c~es show Cyperaceae reach a
2 2 concentration of 41 x 10 grains/co. Alnus has 21o9 x 10 grains/co,
2 2 Gramineaa has 13.5 x 10 grains/co and Quercus has 11.3 x 10 grains/co.
The upper boundary was drawn where Pinus pollen reappears, Quercus pollen
increases from 10.3% TLP to 24.7% TLP~ Cyperaceae drops from 37.3% TLP to
9.4% TLP and large increases are found in Chenopodiaceae and Pteridium.
LPAZ YBS 10:4 Jao=277 em to ...al7 em
Tree pollen is once again the dominant life group in this zone and
there is a very large increase in aquatic pollen in the upper two levels.
Quercus is the most important tree pollen with 31.5% TLP at =247 em and
Alnus has 24.7% TLP ~t =271 em. Potgmo~ dominates the NAP with
23e5% TLP + Aquatics (TLP + A) at =247 em. Chenopodiaceae records 20o6%
TLP at =253 om, ~er1diym has 16.1% TLP ~ Sat =271 em while ~lY§ pollen
records 15o5% TLP at =237 cmo ~» ~PhYllYm and Liny; pollen ia
only found in this zonao The concentration curves show Chanopodiaceae to
2 2 have 21e9 x 10 grains/co, Quercus has 19o5 x 10 grains/co, Alnus has
2 2 18o5 x 10 grains/cc and Potamo~ has 18.2 x 10 grains/ceo

- 122 =
At first glance the correlation between pollen zones and lithological
strata does not appear strong but when one examines the makeup of the
various LPAZ some conclusions can be drawno LPAZ YBS 10:1 can easily be
correlated vith stratum 2 of the stratigraphic column, which is a mixed
silty-peat with a dominance of tree pollen. LPAZ YBS 10:2 corresponds to
stratum J and the lower levels of stratum 4. This zone is dominated by
herb pollen, the lower levels of stratum 4 being heavily loaded with
Cyperaceae pollen. The upper levels of stratum 4, together with stratum
5 correspond to LPAZ YBS 10:Ja where tree pollen is once again dominant,
Alnus pollen being strongly represented at the top of str~tum 4. LPAI YBS
10:3brepresente the lower part of stratum 6, a silty=peat where herb pollen
is again dominantc Cyperaceae pollen reaches very high percentages again sub-
in this ,,zone" The last zone~ LPAZ YBS 10:4 corresponds to the upper
transitional strata 7, 8, 9 and 10 where once again tree pollen is the
dominant life formo At the base of stratum 9 the clayey-silt, Chenopodiaceae
pollen reaches 20.6% TLP which very high and the level above displays a
large amount of Potamo~ polleno
In conclusion we can s~ the lower transitional deposit is woody in
nature with Alnus pollen the most important taxono The lower level of the
organic stratum 4~ together with stratum 3 is herbaceouao Alnus pollen
once again becomes important in the upper levels of stratum 4 and stratum
5P before herb pollen returns briefly to be dominant in stratum 6o The
upper transitional strata 7, 8, 9 and 10 are all woody with Quercus the
moat important tree polleno
4) YBS 12
At YBS 12 seven strata were examined for their pollen content. These
strata were at the base of the core Where a lowe~ sandy transitional layer
passes into 59 em of peato Above this ie another transition~l deposit which

,---
~-~~t~-~-1# ~-~I,.~,~ I# 1'-1 ~~-·~·-#
•"l#l#i#i#l#l#l#···
I ' I " r # I I' I I' I # I ,. I I' I ... r ,.
I # I ,. I II I ,. I II I # I I' I • • lr' I I
" ~~:
6
. -r~· ---~-.-~- •-ur
#J ' I -I , "' .,._ 1-.
' ';: ()
n•un11 ,, ili __ LLf J_j_ I·~
I· u ()
,, ~ )•
,., '" rn
"'
I ~~ u n
"'
i<> -?.>"~,0
r..,<' ,0
"
~~· IT -y-
.,.-
,~~:~ ---.:-ft _-f;-----;~.----t t+-::-r tf~ttt -~ ~~ ---v--~ ~ ! ~---:~
- , I : ·'' ~- L !
-;.,00~
,? ~
j!
I (
.; ~~;, l tt ·-:,[I I . .:·I ,. ,·· I T
I Q.')
~I' I' I '. ~ '
'~.:~·:-~ ·Af' r.J i l
',\~ .: ... ),) ....
.}'"
\')
•" ,,
!. ,f
' 'I
9
l f
"T --t--y-y-f·y
...-.. ., t
r
t t I . t
:+-.~ T-
0
y-~-~r t
t t
J I
- I I
- J J
l]~_j f I • t
~ f t If ··" .~
I ') c,.,. -~-~ -t~~± . I
t:.:Yor-, ':...-....------~~ ~ ... ~._,o0,yo~ =------~---?-~ ,c.,O ~') L
00· -ae"':, .... ! ,Je~ ~ t ,. t . ... 1
'l
"o'' <e'",.,.;§' r; ~ -c' ~
,-:" _e->""'..;; L~- -------+--f--+-----+--';J ,.,t.· tY~ .,,,(' L t J
>,~? ,.,'l C- --y- ....-· --1--- l~rr- t ·r-r----l tP,<c?" " - - - -- ·- - J
_
1
f.,1J'/):0
b 9 _. -T T ! w - J
4.:',f•0 -i~\" l 'I' • T J ~ ·A -~c. ;;- <· r - J
i prb , - I ;--•,,y"b • .,. • T J
·l· .rr ,¥(' ....,• I'A ,._') :. • f J ,:·\/) .. - -.. r T- y- - - -j
.. ~.,,.,<-I> -- -- ~--y-- - ---.- f-r- ----- -.. - -- J :0 •-"'',.. ( - !------ '-----f-- -J
r€- "}") ,f.- L
?q_"i'' ~ll-(1.)'~-.r ------.--- -- t-· .. ~;oo'',,<> ~- -- y-+--j
, .... ~->q..;:,):ob [ ---y· J .» a->'"ol-' --,.- .. J
,fO t,...) '\- _______,..,-- T f f -~---, -P~~~(':J.}·
\:.~--:>< ~~-y- .
. .;. ~~-.o_ ~ - -- - ... ~---+---h rr I>~
,Q ~;;)
y' ('§··{',~) -~._./"
-·•J "..J ·~ ·J r, .. ._. 'f;l,
~ " ~ ~
"' -. , ... V' 0
'" ..,
__..
+--1--'T~·l
'" -r-- - I ~ ~ "' CD ...., U1..... -.... tJ'I
"' "'"' .., 1D '~ I'IJ ID ._ rv .., .. -... '" '" w ,~ ...
~ ...... 8 ~8 ~:;g: ... '""
0 ,. "
i"-'1"'1 ~ IU"1
-r,A ~,
~,
~). .t')l'.-_,
'-:., ,~,~..,,..
)' o, .. /
'>,
?,n 0
-< OJ Vl __.. N
~ 0
-i 0 -r OJ
I OJ :::J 0..
-u 0 --11)
:::J
<k .oo/,. r~ t~~'>
"' ~,
t
" .. ~
'~l I-'
r;'J r:_ JJ PI
., ,··'1

- 123 -
passes into 8 em of organic material before passing into clastic
deposits again. 'I'he strata sampled are 4, 5, 6, 7, e., 9 and 10. 'l'he
main organic deposit V.'as sampled at 10 ern intervals with the transitional
deposit being sampled at a cJ oser interval. A tota.l of 14 J evel s were
sampled; 1) -343, 2) -341, 3) -330, 4) -320, 5) -310, 6) -300, 7) -294,
8) -288, 9) -284, 10) -278, ll) -270, 12) -260, 13) -248 and 14) -244 em.
A pollen sum of 100 trees was counted in levels 2 to 7, through the peat
and 150 trees in levels 13 and 14 in tbe upper peat. The remaining
levels were counted to 50 trees as pollen was more scarce. Data on dry-
land tree pollen is based on calculations of ~AP plus group and has
been included for relative dating purposes. The results of this
analysis can be found in Appendix IV and are displayed graphically in
Figure 33. At Y13S 12 five LPAZ have been recognised and are outlined
below.
LPAZ YBS 12:1 -343 em to ~.-305 em
This first zone is dominated by herb pollen although levels 2 and 3
have tree pollen as dominant. In this zone the most important tree
pollen eon1es from Alnus with 35·3f:' TLP at -341 em. 'l'ilia pollen has
a high representation with 10. 7fo TLP at -343 em. Of the NAP the rnost
important taxa are Gramineae with 32.8~ TLP at -310 em, Corvlus with
l2.7'J; TLP at -310 em, Crueifer·ae wi tb 12-3~ TLP at -343 em and Cyperaceae
with 11.5~ 'I'LP at -341 em. The major dry-land trees are Tilia with
26~ of trees at ~343 em, Quercus with 16fo of trees at -341 em and
Fraxinus with 7'fo of trees at -320 em. Four species are only found in
this zone, these are llex, Cruciferae, Lytbrum end Valeriana pollen.
Concentrations are high with Alnus recording 41.8 x 1C2 grains/cc,
Gramineae with 32.5 x 10²grair1s/ cc and Cyperaceae has 13.6 x 10² grainsjcc.
The upper boundary was placed where Alnus increases from 17.3~ TLP to
47.37o TLP, Jramine.ae. fall from 31.8;o TLP to 7 .l'f· TLP, Cyperaceae rise

- 124 -
from 9·5~ TLP to 21.9/t> TLP and Typha angustifolia increases to 6'p TLP + A
from no previous record in the level below.
LPAZ YBS 12:2 ~.-305 cr.1 to ~·-291 em
'I'his zone is characterised by a dontinance of tree pollen. Alnus
is the dominant tree with 53·7~ TLP at -294 em. Cyperaceae dominate
the NAP with 21.97o TLP at -300 em, while Typha angustifolia shows a
relatively high record of 6~ TLP + A at the same level. The major dry-
land tree pollen comes fron1 Quercus with 26~ of trees at -294 em and Tilia
with 11~ of trees at -310 em. Alnus and Cyperaceae pollen record the
highest concentrations with 47.2 x 10² grains/cc and 15.2 x 10² grainsjce.
The upper boundary is marked by a fall in Alnus pollen from 53. 7'J:I TLP
to 22.3~ TLP, Gramineae rise from 5.6~ TLP to 17.6~ TLP and Cyperaceae
also rise from 17.3~ TLP to 33.1~ TLP. Typha angustifolia fall from
5·8~ TLP + A to nothing at the boundary beh·een the two zones.
LPAZ YBS 12z3 ~·-291 em to ~.-281 em
Herb pollen is again dominant in this zone. The most important
tree beiLg Alnus with 22.3~ TLP at -288 em. Cyperaceae pollen is
again high with 59·2~ TLP at -284 em while Gramineae has 17-6~ TLP at
-288 em and at the same level Corylus pollen records lC.8~ TLP. The
major dry-land tree pollen comes from \iuercus with 16/0 of trees at
-28~ em and from Fraxinus and 'I'il ia both with 8~:> of trees at -284 em.
2 'I'he concentration of Cyperaceae is high with 62.1 x 10 grains/co while
2 2 ' Alnus has 13.8 x 10 gr~insjcc and Gramineae have 11.7 x 10 grainsjcc.
The upper boundary is marked by a rise in Quercus from 2.2~ TLP to
7.1~ TLP, a rise in Corylus from 2.6~ TLP to 13.5" TLP, a rise in
Gramineae from 11.2~ TLP to 25.6~ TLP and a fall in Cyperaceae from
59.2~ TLP to 18.6~ TLP. Pteridium rises from 0.3~ TLP+S to 5·9~ TLP+S.

- 125 -
LPAZ YES 12:4 ~--281 em to ca.-254 em
This zone is again dondnated by herb pollen. The most important
tree pollen comes from Alnus with 18.7~ TLP at -270 em and Quercus
with 15.9~ TLP at -260 em. Gramineae is recorded with 29.9~ TLP ~t
-270 em, Cyperaceae and Corylus both have 18.6~ TLP at -278 em and
-260 em respectively. It is interesting to note that Chenopodiaceae
pollen and Pteridium spores also have high values at -270 em. The
major dry-land tree pollen comes from Quercus with 46f> of trees at
-260 em and Betula with 12~ of trees at -278 em. Potamogeton pollen
is only found in this zone. The concentration curves are all
relatively low, probably associated with the dearth of tree pollen in
these levels ~s mentioned in the introduction. The upper boundary is
denoted by a fall in Quercus pollen from l5·95b TLP to 6.4ft TLP and a
rise in Gramineae fron• 23·5~ TLP to 33·9/:l TLP.
LPAZ YBS 12:5 ~·-254 em to -244 em
This last zone is again characterised by a dominance of herb
pollen. Alnus is the most important tree pollen with 19.2~ TLP at
-244 ern. The NAP is dominated by Grarnineae with 33·9~ TLP at -248 em
and f.grylus with 24.670 TLP at the same level. The major dry-land tree
pollen comes fron• Quercus with 20.7tt of trees at -248 em, Fraxinus
with 14.7~ of trees at -244 co and Betula with 10.7~ of trees at
-248 em. Three species are only found in this zone, these are
Ericaceae, Umbelliferae and PolygonUL1. Concer:trations rise again here
with Gramineae recording 54·9 x 102 grains/co while Corylus has 39.9
x 102 grainsjcc and Alnus has 29 x 102 grainsjcc.
A correlation between the pollen zones and str~ta i~ the
stratigraphic column can be drawn. LPAZ YBS 12:1 can be said to
correspond to the lower levels of the peat strata 5 and 6 together with
- 126 -
transitional stratum 4o Stratum 4 is dominated b,y herb pollen but the
lowest levels of peat, samples 2 and 3 9 are dominated by tr.ee pollen,
namely Alnuso The other levels in this zone are again dominated by herb
pollen in the form of Gramineae. LPAZ YBS 12:2 corresponds to the upper
levels of this peat or stratum 69 where tree pollen is again dominant.
Stratum 7 correlates with LPAZ YBS 12:3 where herb pollen resumes dominance
with Cyperaceae pollen being very importanto Above this 9 strata 8 and 9
correspond to LPAZ YBS 12:4 which is again dominated b,y herb pollen, but
this time by Gramineae polleno The last zone, LPAZ YBS 12:5 correlates with
the upper peat deposit or stratum 10, where herb pollen is most important,
especially Gramineaeo Thus we have a core with two peat bands, the lower
one being of a mixed nature being dominated by herb pollen at the upper and
lower boundaries passing through tree pollen then back to herb pollen at the
central levelso While the upper peat deposit is herbaceous in nature, the
intercalated transitional layer is also ~minated b,y herb pollen in the form
of Gramineaec
YBS 12 was chosen to represent the Boatyard site at Yarmouth as it
had two peat deposita.
Dating of the LPAZ at YBS 12
The upper peat at YBS 12 ranges in altitude from =1.62 m.O.D.
(=243 em) to =1.70 m.O.D. (=251 em) and the lower peat ranges from =2o03
m. O.D. (~284 em) to =2o62 m.O.D. (=343 em). Five LPAZ were recognised at
this borehole and are summarised belo~ Yith dominant AP 2nd NAP.
The frequency of Alnus pollen exceeds 50% of tree pollen throughout
the LPAZ, while Quercus pollen exceeds 40% of tree polleno These LPAZ
are thought to belong to Flandrian Chronozone III. A tentative division
into two sub=zones equivalent to the Godwin dating scheme is proposed at

~ 127 =
-1.74 m.OoD.; this divides the LPAZ into Zone VIIb and Zone VIII. This
division is based on the paucity of Tilia pollen together with a marked
rise in Chenopodiaceae and Plantaginaceae in YBS 12:4 and YBS 12:5.
Table 16 ~g of LPAZ at YBS 12
Flandrian Altitude Depth Dominant Dominant Dominant LPAZ
Chronozone (moO.D.) (em) life group AP NAP
-1.64 to =244 to A-Q-Fr- Co-Gr Y12:5 Herbs
-1.74 -254 B
-lo74 to =254 to Q~A-B Gr-Co-Y12:4 Herbs
=2o01 -281 Cy-Pt
=2 .. 01 to -281 to A-Q~T+ Cy-Co III !12(3 Herbs
- 2., 11 =291 Fr Fn-Gr
-2 .. 11 to =291 to A-Q-T- Cy-Ta-Y12:2 Trees
-2.25 =305 B Co
=2 .. 25 to =305 to A-T=Q Gr-Co Y12g1 Herbs
-2o63 -343 Fr --~- -- -------
Az:Alnus, Q=Quercus, Fr=Fraxinus, B=Betula, T=Tilia, Co=Corylus,
Gr=Gramineae, Cy=Cyperaceae, Pt=Pteridium, Fn=Frangula, Ta=Typha
angustifolia.
5) YBS 13
At YBS 13 the basal organic materialp together with the overlying
-
transition'l.l deposits, were sampled for polleno Six strata were examined;
1, 2, 3, 4, 5 and 6., In total 14 levels were taken for analysis. The
sampling interval through the lower organic material was 4 om, while over
I
I I ;
the transitional deposita this interval want up to 10 em. These levels are

c:: QJ -0
a_
"'C c:: rtJ
_J
Vl ID >-
'<-J
....:t ..c I tU N fT"' ,., ..-
I ~ "' :1: " ..
~ ~ ~ .... :!!8~~ "' ~ Q 0"'
"' . I ... - ~ l"oo,.,
"' " "' ., .. .. ~ ~ "' . ~ ~ ~ ~ :a " S! !"' " -'2 "' :! "'"' I ~ f--- ~ • ~_j
-l ___ _j
r . ' -4 ~ ; ~ I I
r { • l
r . l
r r l
r l
r l
r r -l
r I -,
r " r I -,
r I l r l
I l l
r 1 l
! ; I l
{ ! I __j ' t .
r I r ____] r
__.__L__..~ ~~~l
t;-&-~--~ __.__.. .__ ... ~_-] L_ __ L_ ______ .I r ---- - ·I- --- - i t= a_ _____ .. - ··-- • -- . I
I f
l
' r f • ! l I ! f
! ! ~ --1--------'-
' I I ' ~ f - f f !
! l • - • ! • r ' I l r ' l r l
~ --- I -,
_ _]
I l r I l
r • l
' ~ I . ~ - • ! i l ! • • ! ! • • r -~ -l r .JLJ,_
-~--
;~:. __ ...______. ...___ -~6-~
L I
l ! l '
f ! !
' I ' l
~--~-r •
- -- -··-+---t--- ---
.[._ +- .... _ .. _ ...... . ' • . l L_, • ' 1- ~ . . I I ' • I - -- _ _._ - • p.- --- .a_ ___ J. -- ...... -- . 6 ~ A •. l
r ...._-r--- ~ I..___... -- ~ ~ f<""
I """11181"' ~
~~ L~ ~ ~- . . :::r:.~
~ .
~ ~l ~ " " 0 ~ I ~ c " ~ ~ . ~ ~ -
0
v... ~ ~ re Q "'"o J ' ' .11 'I # ' I ' I :> ' .11' ' ' .0 ' :1 # I J I # I I I # I I I
IJ.!].J ,;Jo:!J.; I J!Jdj.J J J.!jJ .J :•I.J I <I I I I <I I I I• <(..-? .J .ll J ..J J: .ll J I .J I :.11 J J J c!l J J .; ;I J I " I I I <1 I I I 41
Jta J .J J J D! .J • ..1 I J ;, J '¢1 J J ·' c!J :1 I " I I I <I I I I <I I I ....... s ,..._
o>
"' u "' "' ID "' ;: w
"' ::> aJ <{ cr w cr Q. ::> 0 e :r w 0 :7,
"' :r <{
0 ll1l ru • 0
0 0
~ ;;;
u

- 128 =
1) =304,
8)-276,
3) -296, 4) =292, 5) -288, 6) -284, 7) -280,
10) =258, 11) =248, 12) =244» 13) -238 and 14) -228 cmo
The pollen sum used in this analysis was 150 trees through the lower organic
material of stratum 1 and through the other levels a minimum count of 50
trees was made with over 200 ~~ marker grainso This total fell to
25 trees in level 10o The results of this analysis c~n be found in Appendix
IV and in Figure 34. A total of four LPAZ have been recognised at this
borehole. LPAZ YBS 13:3 has been divided into two sub-zones a and b on the
basis of major changes in NAP curves but not in the arboreal curves. These
zones are outlined belovo
LPAZ YBS 13 :1 = 304 om to .Q.Ao -290 em
This first zone is dominated b.r herb pollen in the lowest level passing
to a dominance of tree pollen b,y levels 3 and 4o There is also a relatively
high proportion of aquatic pollen herao Alnus is the dominant tree pollen
with 62.6% TLP at -292 om and Quercus has 9.9% TLP at -300 em~ The NAP
is dominated b,y Gramineae with 36o3% TLP at =304 em and Cyperaceae has
18.2% TLP at 292 em. Five species are only found in this zone, these are
Cruciferae, Polygonaceae, Menth&, ~hrl!Ym and Potamoget@n pollen.
2 The concentration of Alnus pollen is very high with 120o9 x 10 grains/cop
2 2 Gramineae has 43 x 10 grains/co and Cyperaceae displays 35.3 x 10 grains
/co. The upper boundary was placed where Quercus pollen increases from
4.1% TLP to 12.7% TLPp A1nua pollen falls from 62.6% TLP to 32o4% TLP,
Gramineae increases from 6.5% TLP to 22o1% TLP and Cyperaceae falls from
18.3% TLP to 9% TLPo
LPAZ YBS 13:2 ~.-290 em to ~o=282 em
This zone is characterised ~ a dominance of tree pollen exemplified
b,y Alnus with 45.5% TLP at -284 em and Quercus with 12.7% TLP at -288 cmo
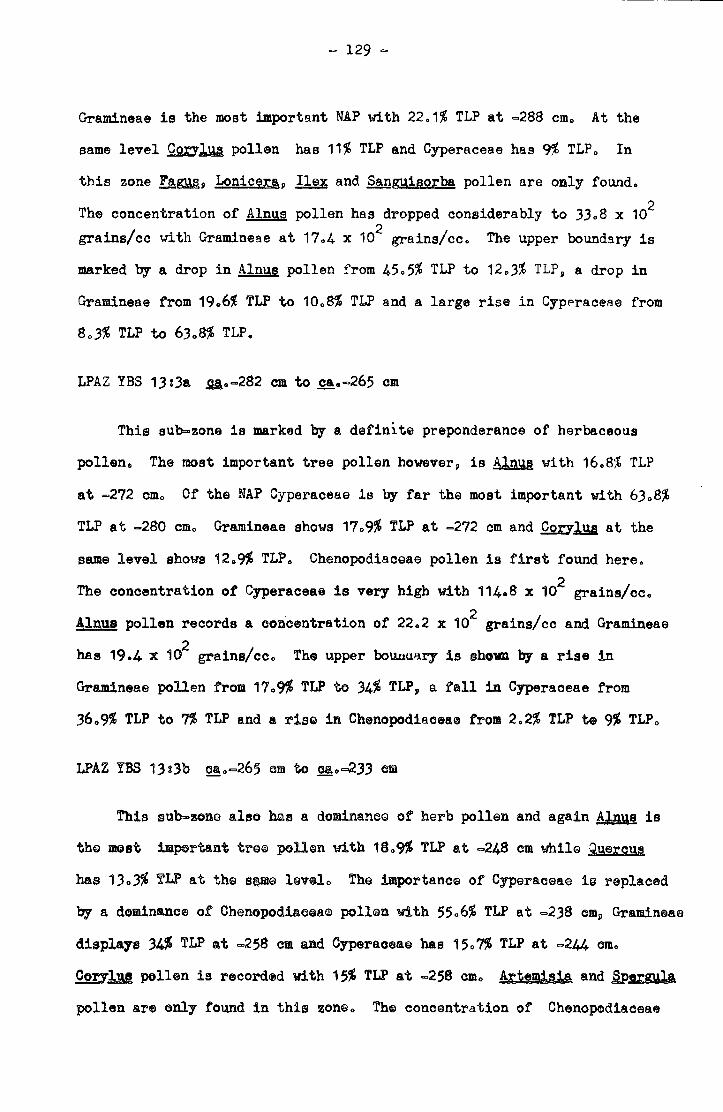
= 129 =
Gramineae is the most important NAP vith 22.1% TLP at =288 em. At the
same level £2ty~ pollen has 11% TLP and Cyperaceae has 9% TLP. In
this zone Fagyg~ Lonicera~ !lex and Sanguisorba pollen are only found.
The concentration of Alnus pollen bas dropped considerably to 33.8 x 10²
grains/co with Gramineae at 17.4 x 10² grains/cc. The upper boundary is
marked qy a drop in Alnus pollen from 45.5% TLP to 12.3% TLP, a drop in
Gramineae from 19.6% TLP to 10.8% TLP and a large rise in Cyperaceae from
8.3% TLP to 63.8% TLP.
LPAZ YBS 13:3a ~o=282 em to ca.=265 em
This sub=zone is marked b,y a definite preponderance of herbaceous
pollena The most important tree pollen hovevarp is~ with 16.8% TLP
at =272 omo Of the NAP Cyperaceae is qy far the most important with 63.8%
TLP at =280 em. Gramineae shows 17.9% TLP at =272 om and £2IylY4 at the
same level sho~s 12o9% TLP. Chenopodiaoaaa pollen is first found here.
The concentration of Cyperaceae is very high with 114.8 x 10² grains/co.
2 Alnus pollen records a concentration of 22.2 x 10 grains/co and Gramineae 2
has 19.4 x 10 grains/co. The upper bou.uuary is show by a rise in
Gramineae pollen from 17o9% TLP to .34% 'l'LPP a fall in Cyperaoeae from
36o9% TLP to 7% TLP and a rise in Chenopodiaoeaa from 2.2% TLP to 9% TLPo
LPAZ YBS 13z.3b oa.=265 em to ca .. =2.33 om
This sub=zon@ also bas a dominance of herb pollen and again Alnus is
thG most important trae pollen with 18o9% TLP at =248 em wile Quereua
has 13o3% TLP at the s~a lQv®lo The importane~ of Cyperaceae is replaced
by a dominance of Chenopodiao~a® poll®n with 55o6% TLP at =2.38 em11 Gramineaa
displa7s 34% TLP at =258 em and Cyperaceae has 15o'7% TLP at =244 omo
Qm:lua pollen is record~d vi th 15% TLP at c.258 cmo Artemisia and .§p,~.tgyl&
pollen are only found in this zonao The concentration or Chenopodiaeeae
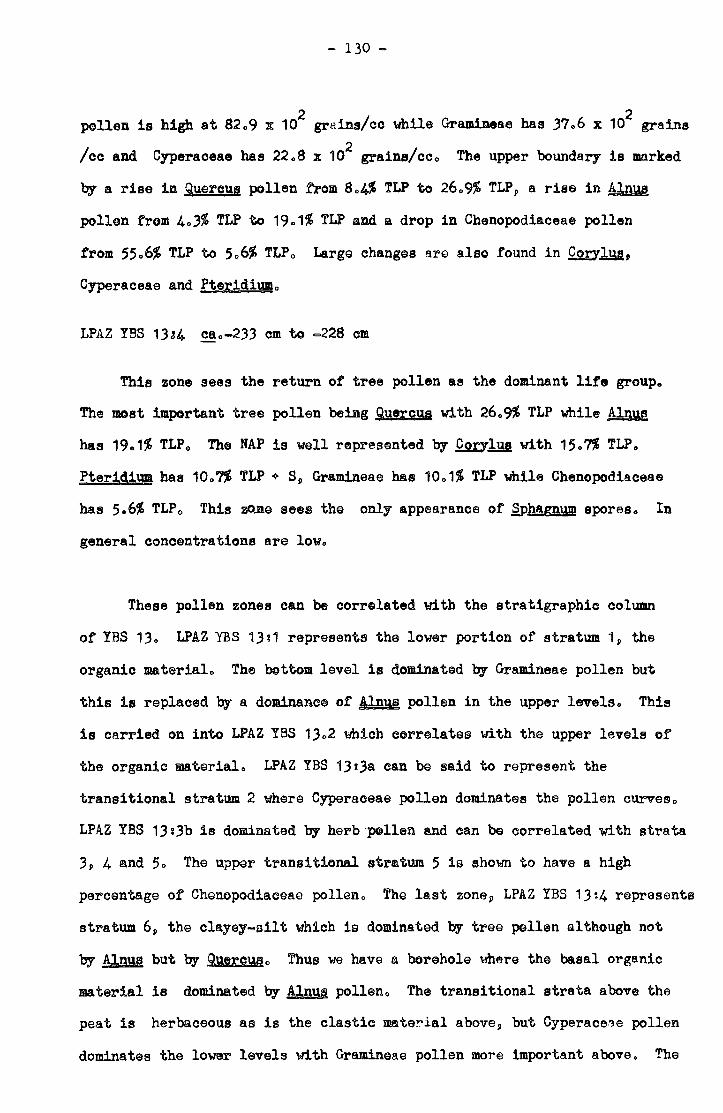
- 130 -
2 2 pollen is high at 82o9 X 10 grains/co while Gram.ineae has 37 o6 X 10 grains
2 /co and Cyperaceae has 22.8 x 10 grains/coo The upper boundary is marked
by a rise in Quercus pollen from 8o4% TLP to 26.9% TLPP a rise in A1nus
pollen from 4o.3% TLP to 19.1% 'l'LP and a drop in Chenopodiaceae pollen
from 55.6% TLP to 5.6% TLPa Large changes are also found in f2IylB4,
Cyperaceae and Pteridiumo
LPAZ YBS 1334 ca.-233 om to =228 em
This zone sees the return of tree pollen as the dominant life group.
The most important tree pollen being Quercus with 26.9% TLP while Alnus
has 19.1% TLPo The NAP is well represented by fsu:ylJ!&! vith 15o'7% TLP.
Pteridium has 10.7% TLP + S, Gramineae has 10.1% TLP while Chenopodiaceae
has 5.6% TLPo This zOne sees the only appearance of .§.pb!gnum spores. In
general concentrations are low.
These pollen zones can be correlated with the stratigraphic column
of YBS 13o LPAZ YBS 13:1 represents the lower portion of stratum 1p the
organic material. The bottom level is dominated by Gramineae pollen but
this is replaced by a dominance of Alnus pollen in the upper levels. This
is carried on into LPAZ YBS 13o2 ~icb correlates with the upper levels of
the organic material. LPAZ YBS 13:3a can be said to represent the
transitional stratum 2 where Cyperacaae pollen dominates the pollen curves.
LPAZ YBS 13~3b is dominated qy herb·pollen and can be correlated with strata
3P 4 and 5o The upper transitional stratum 5 is shown to have a high
percentage of Chenopodiaceae pollen. The last zonev LPAZ YBS 13~4 represents
stratum 6, the clayey-silt Vbich is dominated b,y tree pollen although not
by AJ,nus but by Querc;uso Thus we have a borehole were the basal organic
material is dominated b,r Alnus polleno The transitional strata above the
peat is herbaceous as is the clastic material above, but Cyperace~e pollen
dominates the lower levels vith Gramineae pollen more important above. The

- 131 =
true elastic deposit above 9 is dominated b.r tree pollen in the form of
Quercuso
6) YBS 14
At YBS 14 the upper organic material toge~her with upper and lower
transitional deposits were sampled for polleno Five strata were examined;
2p 39 49 5 and 6o In these strata 14 levels were sampled and analysedo
The sampling interval being 6 em through the organic material and 4 em over
the boundary depositso These levels were 1) -334, 2) =330, 3) -326,
4) =320p 5) -316, 6) =312, 7) -306, 8) -300, 9) -294, 10) -288,
11) -282, 12) -278, 13) =274 and 14) =268 cmo The pollen sum for these
levels was baaed on the number of land pollen counted as the tree pollen
was too scarce for a reliQble pollen sumo A count of 250 land pollen was
counted for levels 4 9 5, 7~ 8, 9p 10, 11, 13 and 14o Level 6 vas counted
to 500 land pollen while the remmining levels wre counted to a sum of 100
land pollen. '!'he results of these counts can be found in Appendix IV and
in Figure 35o Five LPAZ ware recognised at this borehole and are described
belowo
LPAZ YBS 1481 -334 em to ~o=323 em
This first zone is characterised by a dominance of her·b pollen with
a large proportioa of spores which decrease to the top of the zoneo 'l'ha
most important tree pollen is ~ uith 22% TLP at =326 em and Quercus with
18o4% TLP at =330 cmo The Chenopodiaceaa dominate the NAP with 27o5% TLP at
=334 emo ~~ has 19o6% 'l'LP at =334 em and PteLiQium has 16o9% TLRSat
=330 cmo !A~ mnd Artemis~~. pollen is. only found in ~his zoneo
Concentrations are relative~ low with Chenopodiaceae displaying only 6o6
2 x 10 grains/ceo The upper boundary is drawn where lJLgJ,&~ polle~ dies out9
Gramineae increases from 7% TLP to 21.6% TLP 9 Chenopodiaoeae decreases from
24% TLP to Oo8% TLP and Ptaridium drops from B. 7% TLP -e- S to 0.4% TLP ~ S.

~
,,-:)1; ~~ ... -~ : ... :-z::::
''I'
. ----------- ---- -----------ij ·m··· .-.-,--.,-.-,-~,.~,,,:, .. , .. ~ .. s,~ .. , ~'11 ' ' ,. r r r I I> l I> I I> I I> r I P I t I ,.., li" r I> r '-<?, GJ r I r r r • ,. I I> I I' I I> 1 • I,. I r I PI [f' • ,.. r{i" C ,. ' ,. I ' ' I I I " I , I ,. I ,. ,. I I p I ' I ,. I li'" I :::0
1 ~~ • -1 -~ ..- 1 - --~·----- ()t'l f11
~; ~ ~ <J'""' VJ I ( '?) (JI
-,~
"' 'v-1,
.,()_ t•
r.J•LJ~·~lJ
V' u 0
" rn
"'
~
0
' ~ n V'
l
"' "' m
"'
V' ~
J " , "' c "' OJ "' "'
ll> ,..~
-e' ._}) <-'' ~
.,yS,p (,0 ,
,..~
" ~" ~'
!> ,.." "
q,.,>,
(''~ ~q, ~ ,, ·~(' 0')
1-' ~~··
.tt'"J
.:?!'' , e'
,~)~'41...( ~q,? c;\"
>"0 J:~.y,q}
•" •"" •"'.,:)
o~' ... :J
~ v-Y~'J
c---- T---r
['T--T
f t I T ,.
T
L ll--T<' fft't
J
t -.- -· .. --j---.-' "Yj
J _,tit+~ t I•
j
. ~ ~Fj -~-~-~--f~ t t t t
f f . .-+-.- t-o-+ +J---~
,·:~:~~: "~~~~~~~f;~~:~~:~~~jF::~~:~~~~~f==-~ ~,'. ~~,"',..,§ ~') "·t· e.;:,.""'{> !....
-~.,.· ~'}~..).) r---r:Y:,"'./ !I C ' t • • •i,O [: . -~
•"~· o'O l -r-r-r!-- t -y-j--.--·~Q, Alq,:\"' :. . - 0--,.~ -- -l
.,"'.-)v .. :/·' l ''ll<.,,J I
?'<·'~h I ._l·r.?,-.\-- f, [ T
c.' J>),;F .,e , ... )' L
?f"'' e,~:-r" q,;:~c.·/> ~· ( .. :?:>
T T
)~_,e'~"" q,~~c.~,..p·<~
1:'--- --[ ---,.- I F -f;: . ') -·~~:\-'Y
q,'lit.-.,.
q,' It>..) b n:··,...,""'(,.,·i'
e·· o'r? c.·' Y .o~
i-,,_, {Q?t.~,>,
' ~0 ~;i·
c-.-· [ : ! c·-,.----- T
L'' --L~
·-=t
-- '>-~ :;. v. 'i ~
l> L I 'o '" ~ -~ l!' \_o., .. "' '
"' \}' ~
w
"' "'
__, I "' I UJ
1----
"' •o \}' "' "' ~
"' "' "' .. "' \}'
I +"'
-- T
J - -l
~-- .--] -l
-I I
f--.. T ·-=] +-----~-- J --~
----~---~J --.........- --1"--...----J
. ------.r--..,..J r·t--,·--,.l
..,- ...... -.......-] - -·-J
'l
" a; ., "' "' ~
0 - " w
w w "' " "' <P " 0 0 "' w "' "' w "'
I Lf1
<:.? ~~
-< OJ (/)
__, ~
~ 0
~ -1'" OJ
I OJ ::::! a.
-u 0
ft)
:::J
"o ( ,~ J.. ?
co "o<>
~~,
<'_.,
"'<' I I
I -- _j

- 132 -
LPAZ YBS 14:2 _a .. -32.3 em to 9,1 .. -.314 em
This zene is dominated b,y herb pollen at the base but passes to tree
pollen at the top .. The aquatic pollen first appears here. The most important
tree pollen is Alnus with 42.4% TLP at -316 em. Gramineae and Cyperaceae
are the most important NAP taxa with 21 .. 6% TLP and 20% TLP at -320 em.
2 Concentrations increase in this zone., Alnus pollen has 35.5 x 10 grains/co,
2 2 Gramineae has 23.7 x 10 grains/co and Cyperaceae has 21.9 x 10 grains/eo.,
The upper boundar,y is marked b.1 a fall in AlQus pollen from 42.4% TLP to
16.2% TLP, a rise in Gramineae from 14.8% TLP to 27.6% TLP and a rise in
Salix from 0 .. 8% TLP te 9% TLP.
LPAZ YBS 14:3 ~o-314 am to ~.~303 em
This zone is dominated b,r herbaceous pollen. ~he most important tree
pollen is Quercus with 19% TLP at -312 em and AlDM! with 16.2% TLP at the
same levelo The dominant NAP is Gramineae with 39.6% TLP at -306 em with
8alix having 9% TLP at -312 em. The concentration Gramineae is recorded as
45.5 x 10² grains/co while Quercus has 31 .. .3 x 102
grains/co and~ has 2 26.7 x 10 grains/co., !"he upper boundary is denoted by a rise in Alnus
pollen from 13.2% TLP to 37.6% T~ and a fall in Gramineae from 39.6% TLP
to 20.4% TLPo
LPAZ YBS 14:4 ~·=.303 em to ~.=285 em
This zone shows the return of trees as the
dominant pollen. The dominant tree pollen is ~ with 49 .. 6% TLP at
=288 em while Quercus has 10.8% TLP at =300 em. Gramineae has 20.4% TLP
at =300 em and ~lus has 9.6% TLP at =288 em.. Q!lys~egia pollen is
only found here in this zone.. The concentration of Alnus pollen is found
to be 56 • .3 x 102 grains/oc while Gramineae has 21.5 x 10² grains/cc. ~e
upper boundary is marked by a fall in Alnus pollen from 49.6% TLP to

- 133 ~
29.2% TLP, a rise in Cyper!l.Ceae from 5 .. 6% TLP to 18.4% TLP and a rise in
Chenopodiaceae from 2% TLP to 6.8% TLP~
LPAZ YBS 14:5 Mo=285 en to ~8 om
This last zone is again characterised by tree pollen as the dominant
life form. The most important tree pollen being Alns! with J7S TLP at
-278 em and Quercus lrl.th 16.4% TLP at =268 em. Other important taxa are
Cyperaceae with 18.4% TLP at -282 om, Gramineae with 17.9% TLP at -274 em,
~lYI with 17% TLP at -278 em. Pteridium and Chenopodiaceae also show
high percentages. The concentrations are relatively low but Alnus displays
2 a concentration of 2).8 x 10 grains/cc.
These zones can tentatively be correlated with the stratigraphic column
of YBS 14o LPAZ YBS 14:1 can be allied with stratum 2 vherF herb pollen is
dominant although level 1 has a large proportion of Chenopodiaceae pollen.
LPAZ YBS 14:2 corresponds vith stratum J, the silt below the orgunic
material. Here a dominance of herb pollen at thfl base passes to tree polleno
This dominance of tree pollen is short lived as LPAZ YBS 14&3 is dominated
by herbaceous pollen and correlates with the lower levels of the organic
materialo LPAZ YBS 14:4 is dominated by treea 0 although level 8 has
Gramineae pollen as the most importanto This zone corresponds vitb the
upper levels of stratum 4 and the lover levels of stratum 5. The dominant
tree pollen in LPAZ YBS 14g4 is Alnus. This dominance of Alnus is carried
on to LPAZ YBS 14:5 which corresponds to strata 5 and 6o
In conclusion 'triG can say th11t the organic deposit at YHS 14 ia
herbaceous with Gramineae being th~ dominant taxon. Above the peat the
levels are dominated by Alnus pollen. The level immediately below the
peat (level 5) also shows Alnus pollen as dominant. Below the peat the
material is dominated by herb pollen especially Gramineaep although

- 134 -
Chenopodiaceae pollen is important in level 1o
3:3:4 Diatom Analyses
At Yarmouth the sediments from six boreholes were examined for their
diatom compositiono These boreholes are YBS 3~ YBS 9, YBS 10~ YBS 12,
YBS 13 and YBS 14o Diatoms were counted from selected levels in the cores
and were divided into local diatom assemblage zones (LDAZ) at each core.
These analyses are outlined below and all the results are tabulated in
Appendix Vo
1) YBS 3o
At YBS 3 the upper and lowar clastic deposits were examined for their
diatom contento Two strata below the peat (1 and 2) and three above the
peat (12P 13 and 14) wer9 sampled. A total of eight levels were taken in
these strata 1) -673, 2) -671, 3) -669, 4) =667, 5) -483, 6) ~481,
7) =479, and 8) =477 amo Where possible a count of 200 diato~valves was
made but in level 2 only 55 valves were counted, due to a dearth of diatoms
at this levelo The data are expressed as percentages of the total valves
(TV) counted per levelo Eight summary diagrams are given, as described in
section 2s6:4, together Bith a composite diagram of the frequencies of
each species identified showing 95% confidence limitao These diagrams are
shown in Figures J6a and 36bo
In the following descriptions 1Freshwater 1typas (F) of diatoms will
be taken to include both fresh and Fresh-Brackish typesB . 0Brackish' typas
(B) will include Braekish-Fresh9 Bmck~h and Brackish-Marina diatoms and
'Marine' types (M) v1ll include Marine-Btackish and Marine diatoms unless
otherwise statedo
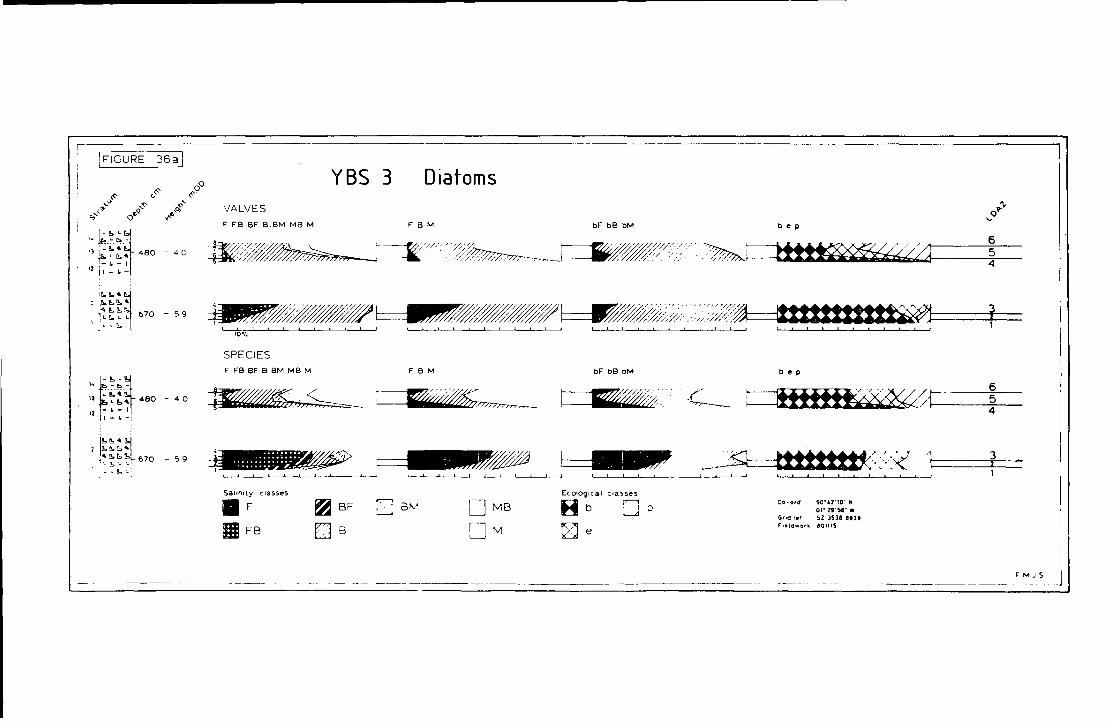
,-----------------------------------------------------'FiGURE 36a) I
,~ ',-. ., ... ... ~
,/1
1- ~-~-~-:-
'-~
1- Jl. c fr n .-~"' ill. c Jl." 480
" I~~~~
,.,. ... -<-"$0
- 4 0
'I .!!.Jl.!!." '"'I!. !h. II!. I!."~ , L !b, ~ L 670 - 59 J 1.. .._ f!:, L
,.. ..e:, ....
11 -~·-· *!!."~ c !!." 480 - 4 0
IZ ~ - 1 - ~-I
Jh.~:b" II!. I!, .. ~ ' .. Jl,l!,!l, 670 ''!\.''I
~ tL. ;..l - 59
OQ ~·
YBS 3 Diatoms VALVES .,. ....
"Q FF88F8.8MMBM FBM bF bB bM be P
''/// '// ' '//~ ~;,;:,.;;:.c~~~:~· ·~ '~'//·':"·;-;;x ··/> //, /. / />). _-- . /_·//:·:/'///)~,-.-~-rr
~;~;y~:·;:/ --~ ~tttt~ 1 g f---~~~~~;:. '· ·;:/~~----~
-~ff~~~~ ~~;~;};~:;·_-~.-/;;;{{~111111111~ 1 '""' ~ ,
SPECIES
F FB SF 8 8M MB M
~-!31~~---b:;;;>_=---
Sat•n•ty classes .F Ill FB
~ BF
Oa
FBM
~~
r.--; . ~
oiV D MB
OM
bF bB bM
~ Ecotog~ea.l ctasses
Bb CJo 0e
be P
// ~ /t· 6 ~-.-... ...... .&::ili:a~~,/. /- 5 4
-~ttttt~~~·~·:·< 1 ? 1
Co-ord so•42'10 .. N 01• zt·sa·· w
Gr•CI rei SZ 3531 89ll F'1elctworll !!OlliS
'----'--'----'---'
F M J S

:'il G"l c ::0 r'l
w (J) CT
---~-
N ~ s, ',., ~.,
~
•', , .rt•rrll'it r r r I?' r r?fl'Q"'JJ r r· Ci' r r ll' 1P ~ fi"
I If. r r r:flj_T£ 0>
" 0
-;:--,-:.~ ..... (ii~(i"
1 - 1 f/ r (? 1> :r r
-I r f I? ~11" :r lr _I ~~~- .V ~p J r_ ..
"' 0
0 ~., ,.,
~.,
.Y,. "' <D
I .. 0 ~ .,,
"'oo
'-:I '7 • ~ ~ N I':' ,,-1> l_L,_Lrr_j __ ~~--- _____ ] _L___! f--'-- J 1 ._.f~<o I> l r J
e'' ~" I> l r J
._o. ~-",o'.,Y I> l I r ! J '1
,,_,,~' .. ~~0('",~""" f t -----~ ----f-- -:] 1 (' .e ..... 0 J
o' ,.,~ "'> l j "' o f f .:..P.$> ~e" r--t-- --
9o <-' .,y-4 ':__ J r ,,0 q;"~ OJ'b,C l-r-r .,---,- ---- r ,. r J t>' e>'>o...,.;.. l~ --..- ----- J
e.,v'~q .q_,'~0 c..'~'l,r- <t\. L "' f Y- v --- ·- ---,..- ---1- J ~~~~~ t.>.t~,4. r v - - 1- J
r)..:. I ~j.'Y q_~~.,->{J L 9 +-- J ~ •) -r" .Y'.''~t.."'> l • J 1
c. ~-" t." ~,) ..... ('> [ f - - J ~'1..) ,·,'"q,,..Y,.r;'>o'J [- V -v 1- J
....,e..!.~...,e(''~ ...... ~ ~o.:ii,">~" L -..---- --- J .. f>',,~ 0 ,>" ['- --- - - v J
t ._ ,r ~.:> ,Q ,-.. l---J-.---.:f J> r e'.,..Y~ .:P.,}>~,~ [- 1 • -.-- '] ~
,--. > ->' ~ o" ~., C ~ f-y -. I j "o,-.. 0~'? ,,>"':e,c:-~c.,'~,.;:,.'io't$ I .fl., c., t. -;,> (' ,v ~
'.:'..... c.,~,c., c.,' .:Y .... "4-$J s 1
,.,> ~,.--- t f f ~ o" f ] .. ~ .. ~ c---- 1---------------- J
,,r ~ [ -- - t------- -------,.
.,,Q;~,$~ ~-- ... ~-~ - ---lt'f~l-)0~ "~"')
q,/.Je e'>' f co ,.~
~ L- -r- -l .y~"\ ~[ - - f • t! j e' _, t f f f
'" t-e p...::;' ,0...,, I ",:J> L,'>e ~ L J. y • r J
,.P~" ~ ~ ···.'·•"o t t I t l
...... - ~·,., 0 I I I I t 1· J e·'' .J~.f· -.. :"\ l •
.... o. /'~, ... l. d' f, f,..) .Ji, [ "
? ,r • .... '~ >o.(') I • q,~ <")·?'~,,~,~-.... l
...,.eo. ,, ,,\ c. \~>, ..... ·~..·/o·J L
",b',-....S~<J'Q e'o..,~~ l ) .:Y .J):IJ.;:, bf4,~ l
,.Yc. >e"' o~...,.., .;9 e~::)"",,~o.;j~'J. l_
,, 41 f'"c,41 r::-4 l ...){'' r,;$1('..).') r:l' c.'"',o c
,V.c., ,c,f;'')~
>,~..>r;- e>"" >"t;o L "o ('Q .,q <', 'ioo o" 0 L' -.."'"8') ...,b' ~) ,.;, ~' --
"r;-. , ... c,<'~..Y "'~?..:::.(>. [ ".,) e,c.,<:-~-r-\r..'\.<'c., l--o,y,y e e e'~>'~.,_. [-
) ;o .. "'./" ') LH--~ ,}'>..>:,0 -c,V ,<' ,<J ,:,.. .... o"'> >C)
<i.v .e"'e.,..,, ",'~,;:;.:/'(;) [ _ -~ v"~," ~ "'~.Y ,y,..... l-
" ..... "0 ~ ). V.J
e'"'....,•'oJP"'.,)~>""0b [ • •• } .._.;:,'~"oqor; r
,,o q,.S ._>~.,~,0 L l,l· ,, .... ",~o ,p"'~ ~ .f l l tf" -s
c. ,fo·:('-," c.,'~c.,o'" > v oO.e>
q'~.Y..<-" "{' """"'' .~
,.--rL')Y!" •
-· _-,
.. ,.o ~ '" "' I
I I
I _ ... itJI I&)
_I
J ~· If • ! fl
y J '= • j !D
! ' J 1 • ' • J
. ]I • --l ~-t-.-- J
-- l t
- J tr--v- ]
J --..- t ] I
- ": . } I • 11 ' J
" • J J
J • J l
'"I"' a; I ai :.l "' .. "'
r-1 1.11 Ia>
> ' ' ... . .. ,
~
'~,·
=< OJ Vl
w
CJ )> -l 0 3: Vl
I
I I
,_;

- 135 -
53 species of diatoms were identified and of these 17 were freshwater,
the ratio of F : B : M species being 17 : 13 : 23. A total count of 1373
diatom valves was made throughout the eight levels: the ratio ofF : B : }1
sp~cies being 168 : 901 r 304.
There were four dominant species at this borehole; ~loneis
interrup~ (B b) with 398 valves, Melosira su1cata (M p) vith 160 valves,
Navicula peregrina (B b) vith 130 valves and Caloneis fort!14!sa (B e) with
92 valves. An examination of the summary diagrams (Figure 36a) shows a
clear pattern. Freshwater valves decrease in number 8. 1•'BY from th!"J organic
deposit with a corresponding increase of Marine valves in the same direction.
The lover clastic deposit appears to have more of a freshwater influence
than the upper clastic deposit, although Brackish valves dominate the lower
levels. This pattern is also seen in the summary diagrams for species.
The lower clastic deposit has a dominance of Freshwater species, replaced
b,r a dominance of Marine species in the upper clastic deposit. Benthonic
diatoms remain dominant throughout the sampled levels except in the upper
levels where planktonic valves are dominant. These eight levels have been
divided into six LDAZ, which are described belov.
LDAZ YBS 3:1 -673 em to a.-672 om
The dominant species in this zone are ~.interrup~ with 71.2% TV and
Nitzschia navicularis (B b) Yith 10o7% TV. The upper boundary is placed
where ~.interrup]§ begins to decrease and ll.navicu1aris increaaes.
Brackish valves and species are dominant throughout this zone with 84% TV.
Benthonic diatoms are the dominant life form.
LDAZ YBS 3:2 ca.-672 em to ca.-670 em
In this zone, the same two epeoies are dominant; ~.interrup~ with
40% TV and ll·n&·viculgtia with 36.4% TV. The upper boundary is placed where
a large increase in Freehwat~r valves oocurs, together with a decrease in

- 136 =
~~rine valves. Here ~.interrup~ increases and ll.nayicularis decreases.
Brackish valves are dominant although Freshwater species have the most
influence. The majority of these Freshwater species are Fresh-Brackish
forms.
LDAZ YBS 3:3 ca.-670 em to -667 om
Only one species of diatom stands out as prevalent in this zone,
~.interrupts with 60.5% TV at -669 em. Eunotia praerupta (F e) and
Eunotia monodon var.bidens (F e) also reach over 10% TV, both at -667 em.
Again Brackish valves are the most numerous types but Freshwater forms
dominate the species curves with over 50% of total species.
LDAZ YBS 3:4 -483 em to ~.-482 em
The dominant species in thie zone are M.paregripa with 45% TV,
Nitzchia scalaris (B b) with 34% TV and Nitzschia filiformi§ (b b) with
8.5% TV. The upper boundary is placed where a large increase begins in
Marine diatoms, as seen in the M-sulcata curvee Freshwater types also
decline here. Brackish valves are dominant in this zone but Freshwater
and Brackish species attain the same percentages.
LDAZ YBS 3:5 ~.-482 em to ~-~478 em
In this zone the characteristic species are M-aulcata with 29.8% TV
at -479 em, Q.f9rmosa with 21% TV at =481 om, ll·filiformja with 13% TV
at -479 em, ,li.peregrina rlth 11.5% TV at -481 em and~ gibberula
(B e) vith 10o5% TV at 0481 em. The upper boundary is dravn where the
large rise in ¥~rine species is abated and Freshwater diatoms increase
again. Marine diatoms dominate this zone for the first timeo Benthonic
valves are no longer outstandingly dominant as there is a marked rise in
planktonic valves.

= 137 -
LDAZ YBS 3:6 SA•=478 om to =477 om
This zone is dominated qy ~·Bu1cata with 30.2% TV, Qoformosa with
12.1% TVp !·filiformis ~th 8.2% TV and !.peregrina with 7.1% TV. Marine
diatoms are once again dominant hereo
These zones can be correlated closely vith the lithological bound~ries
in the core. LDAZ YBS 3:1 and LDAZ YBS 3:2 represent the clayey-silt in
the lover clastic deposit, which is predominantly Brackish with increasing
Freshwater influence at the top of the strata. These two zones have the
same dominant species and a distinction between the tvo vas made on the
basis of changes in the Q.inttrrup~ and !·navicularis curves. LDAZ YBS 3:3
corresponds to the transitional clastic deposit below the peat where
Brackish valves are still dominant but there is an increasing importance of
Jreshwater species. LDAZ YBS 3:4 corresponds to the upper levels of the
peat deposit Where Brackish valves dominate although Freshwater species
attain the same proportions as Brackish specieso LDAZ YBS 3:5 represents
the upper transitional strata from the peat to the upper clastic deposito
This zone is predominantly Marine. The last zone LDAZ YBS 3:6 represents
the silt-clay wherep once again, Marine diatoms are dominant.
The lower clastic deposit uas laid dovn in predominantly brackish
conditions, whilst the ~pper clastic deposit vas laid down under predominantly
marine conditions.
2) YBS 9
At YBS 9 the upper and lower clastic deposits were examined for their
diatom contento These deposits consisted of eight stratap 2, 3, 4, 59 6,
7, 8 and 10o In all, 21 levels vere sampled but of these onl1 15 in the
upper clastic deposit yielded diatom valveso These levels are 1) ~501,
2) =499 3) =495, 4) =493, 5) =489D 6) =485~ 7) ~481, 8) =479, 9) =475,

,<" ,;,~,
~"" .~ Q
...... -r L {b. !b !!:.~ 415C
1:1::. 1.. [!:. ~~ 'j-Ib" r~l-n..- :'too-~
5~480
~~~~L :..".-·;..·:.;1 --4.- 5-0.: --- .. r
::-, :,_, :'"= -a.~:s::::~~&
~ ~~ ~ ~ :: s 1~~~~: ~~:
i~?~~r -~-,---'
- -
f 0:."'' ._,.
-?-
- 3 e
- ~ C•
- 4 L
- 3 B
OQ <" YBS 9 Diatoms
VALVES F F8 oF 8 8M M8 M F 8 M bF b8 bM ~ ~ ~
~'\, Q
v
.. -~ §Wg, '~7-lm~--~:-~'----"----'____...l,..._-l..----..1 . • .. ~-- _J. " • • 1
SPECIES F F8 8F 8 BM MB M F B ,_. bF bB bM
Sal:n•~y cld~ses
.F ~ 8F c 8''
E(Oiog,cal
Bb cla$Ses
!Z1P ~E
ill F8 ~8 ~e
'J
\. .. _ .. \
Co -o''j
~~-.: -~·
" IPoCioa:·•
0 ~ ~
'' . 1
L...--- "'
lilliE;~ ______.;~.-----4
o;.:· .. :~ .. :··x- =·· .. s: ::·:H.:~
!-~
''·'""

~
... I
"'
!;. . s l!
-.--~-TI-,,.,.-,..,..r,,.-;"-n..--;;r-;,.,.-,..,,.,,.-;;r
• I I I I 1• I I •
8 ~ ~
.r,A ~,
'"'?
o,. "\
c'? I ..
0 w
'" I '\.(\
''\ "'oo
'" ~ w• ~ ~ ~~ ;-: : "-';-' ;,1 .,_, -" ..,c..,.:,.,)> ft' ~
<~~· ~. f !f J c.('"~,>,.._..:? (t J
..,,, ... ....,.., "'' b q> ,.:,.'
fl-..;)' ~.... b l ' ! '! l .., ... , o<->:'1'~0 "~"' ~-j ..,
e':.,~o,f>..Y~'? l J j r;-f. .q;~.._o" fl. .o;o'I'Q e' "' r.-T -·'-· ~ e•',f ..Y f
.:> J' <fl' f J' f i .,' , c·---..v- - ~ - -----,
Jt 1'~~<.;,~ f tl .... -· 11 c.' o.s. j
,l·';, c.> ~ t. J -,"'~t-o L t J
"'.;),""'' ,)-4 ~ ..
~' ,. 0-Y0-~0 LtT~~ . ~ -t t J e.,V. ,p'~,.:J'"e..(>o - -·--· -- I
"'"' c.' ,<t· ~ L ------] '1" r-oe~e'o~ .,., "TJ
o'c ,,~., >''}> [ ]j"' co- t:?').Y('"JC,b~ f ~ ,es. "''~"~ s·b j
e "'~.r~ .... c;, l 't: •
e'.) f' ('c.,
e..Y)":>;;,':l J ,o'.J> <-';p? .p t t t
,..v7~.Y6-.'".:,.~~ l v,:..,'~t.'0.,.P,..<t~'J _ !
,p''e~,~· .,~ ~o~~O '• • J 1 e'S"..,>c.'~e~ !' • ..,,>~..t..3b "''· ~,t- -i!- I :r ~
(' ....... 'J~')'":-.,:,' •V:" + $1 <'"' )'I .. Q. !'
""<'):-.~ "..)JJ~ +- ~ ! ! 1' 'I' ,~,o .Y.J> r
",,-4" <-\,o' t ! f e' ._.$' ~ f
'" I 1,._~-~ I o''" ~~~::>[ '- t ! l' -- . ~- -~ -lw
J>,,1' f f ! f .. , .. ?· ~ f... ~ •. t t -~ - -· ~--·-l
•'' ~"' l --~ •'''•') [ f f-. ~
.·~~~ f J 4,>'
0," ~~ .. ~ f f I ! f 1 f--rJ T
~'..Y'•'~-rb+ ~ J"' ·.~.o~o •:...,..)~"" r • , f f , , -~li.
~t:P.;§" .... tP'" ,4 l ,~).,? ... ("..,... .¥
6 •' o
0 •' ,.., .. b'o ~ t t I • t t f f T 1 ,,..;:;f', 9~~o"
..... .,~~ .. ~ ~~,... I ,~•.,_<t- ~
,,~ • .,y ,p'~ + L J •'•&)+ f ~
~,o.•,,~%,+ ~f- Jl: .. -~ 4"-r·\· J.,
... "" ... 0 t--- ] I .,• ~~ ~.,o'J f- J ffi>,j>OI/'
•.:!;' :-. ...... .,•tJ'o l' 1 •'~-f'"'d'~-...~ J i>o' ~'_,>5,-4 ,- ! f . -y·~ • ]1 .. ,, .. ~.~... ... .l' ...... ~ .... -~~..)." 1
,..).•..t' •' ,0 ... ~~ ... .e.~~o
li'§' ~) ... ,...~~ l j
~0<-Q.fl_,.c;~ ~';p'~,+ ' J •'t:; .. "'~'r.c-"• ... "-'
•c'.,o' ":1,{' .,_1" ,th l_ l • o'"' 4',.>' >" l ! f ' -y ] , ~.-r<fo J
~ ,~ .. ·,J,'~ ~ ... <- •• .,_ "',....--- l <t' ,•J.' ~-~..-- l
~~ ... • ... " • l ~z ,PQ ··-v-v-j ~{'?.#; t-· .. . . ~~ 1:1
;..;»%'"~~= r- r- -v· .-r-- . ..,...... -v -,
~'/ .;>. "' ' 4' ~~jf. ~ ~~f- --f-- ~
·'?~ ~ f i f t f t ' f f t tJ j <-<t ..... ~ ~ L w T • -J .. ..... ..~
<-
"T
_.INIW U1 ~ ~
-< CD Vl
..a
Cl ):> -I 0 :::3.:: Vl

- 138 -
10) -471, 11) -467, 12) -46J, · 1J) -459, 14) -455 and 15) -451 em.
A count of roughly 200 valves vas made at each level and a full record of
these counts is given in Appendix V. The data are shown graphically in
Figures J7a and J7b.
In this core 68 species of diatom were identified and the ratio of
F : B : M was 22 : 16 : JO. In total JOJ5 diatom valves ~ere identified
and counted in the fifteen levels and the ratio of F : B : M ~s 787 : 1490
: 758.
Six dominant species were found in the core; Nitzschia nayicularia
(B b) with 690 valves, Naviou1a peregrina (B b) with 390 valves, Melosira
sulcata (M p) with 298 valves, ~ ~ (MB b) with 192 valves,
Ampb2IA ovalis var.~~ (FB b) with 183 valves and Eunotia monodon
var.bidens (Fe) with 162 valves. The summary diagram for valves (Figure
37a) sho~s an obvious dominance of Freshwater diatoms in the lo~er levels.
The dominance changes abruptly at -489 om to Marine 'While Freshwater valves
nearly disappear. This Marine dominance is shortlived and by -485 em
Brackish valves are dominant and remain so for the rest of the levels. This
same pattern is seen in the species summary diagrams. Throughout the levels
benthonic diatoms are dominant with fluctuating epiphytic and planktonic types.
Five assemblage zone are proposed for the data and are outlined belove
LDAZ YBS 9:1 -501 em to ~.~497 em
The dominant species in this zone are !.oyalis var.l!Qy~ with 40.8%
TV at =499 em, Eunotia diodon (F e) ~th 20.4% TV at =499 em, Pinnularia
gentilia (F b) with 19.5% TV at =501 em, and ~loneia oyalis (FB b) with
8.J% TV at -50 em. The upper bound~ry is placed Where !.ovalis varo~~
declines sharply, ~.monodon var.bidens rises and large chnnges nre seen
in ~.diodon, D.oyalia and 1i·P~~· F're::~hwater valves and apflciM

- 139 -
dominate this zone vith over 94% TV and over 80% of total species. There is a
Fresh~ter pe&k of 95% TV at ~499 em and Marine diatoms are absent from this
level. Benthonic life forms are dominant here.
LDAZ YBS 9:2 ~.-497 em to ~.-491 em
In this zone the dominant species are ~.monodon var.bidens with 40.5%
TV at -495 em, ~.~re~ with 27.7% TV at -493 em, A.oyalia var.l!Qy~
with 9.2% TV at -493 em and ~.su1cata with 7% TV at -495 em. The upper
boundary is marked b,y a decrease in Freshwater diatoms and most noticeably
b7 the decrease in ~.monodon var.bidens. !.peregrina also shows a rapid
decrease While M-navicU}aris and M.su1cata begin to rise. Freshwater
diatoms still dominate in this zone although Brackish diatoms begin to
increase in importance and Marine diatoms begin to appear. The Marine
diatoms present are true Marine (M) as opposed to the Marine-Brackish
diatoms of LDAZ YBS 9:1. Benthonic diatoms are again most imp0rtnnt with
increasing epiphytic types.
LDAZ YBS 9:3 ~.-491 om to ~.-483 om
The diatoms of this zone are dominated~ M.sulcata with 28.1% TV
at -489 em, ]!.na,yicule.ris vith 27.7% TV at -485 em and~.~ vith 9.4%
TV at -489 em. The upper boundary is placed where ,li.~re~ and
Nitzschia scalaris (B b) rise and J!.nayicularis decrease. Marine diatoms
are dominant at the base of the zone but give way to Brackish diatoms at
the top. Freshwater diatoms are only present in small numbers in this zoneo
Benthonic diatoms are once again the dominant life group here while pla~~tonic
types reach ~ peak of 35.9% TV at ~489 em.
LDAZ YBS 9:4 ~·=483 em to ~.-465 em
This zone is dominated by N.pere~ eith 56.2% TV at -479 em,

- 140 -
~.pavicu1aris with 55.5% TV at =467 om, ll.sca1aris with 21.3% TV at
21 o3% TV at -479 em and ~i.sulcata with 13a8% TV at -481 em. Q.~
~aovalis are also highly representedo The upper boundary is placed where
Marine diatoms take over in dominance from the Brackish ones. This is
shown b,y D1 oyalis decreasing from 8.5% TV to 0.5% TV, B.navigularia
decreasing from 55.5% TV to 28% TV and~.~ increasing rapidly.
Brackish valves are dominant throughout this zone, although the species
curves are not so clear in their Brackish dominance. Benthonic diatoms
maintain their importance here again.
LDAZ YBS 9:5 ~·=465 em to ~o=451 om
This last zone is characterised ~ N.nayicu1aris with 58% TV at -451
em, Q .. ~ with 36% TV at =46.3 em and :lj.su1cata with 19% TV at -455 em.
Marine valves are dominant at the base of the zone but Brackish valves
dominate the upper levelso The species curves are dominated ~ Marine
diatoms.
Correlations can be drawn between the diatom zones and the
lithological divisions of YBS 9o LDAZ YBS 9:1 and LDAZ YBS 9a2 represent
the peat deposit of stratum 3. Here Freshwater diatoms are dominant.
LDAZ 9:3 is represent&tivG of the clay stratum 49 where Marine diatoms are
dominant at the base but give way to Brackish dominance at the top of the
deposita LDAZ 9:4 represents the transitional strata 51 6, and 7. Here
Brackish diatoms are the dominant types. LDAZ YBS 9:5 correlates with
stratum 8, the silty=clay where Marine diatoms are most important in the
lower levels of the zone but give way to Brackish ones at the top of this
zone. This pattern is a repeat of LDAZ YBS 9:3o It is of interest to
note that the same three species are dominant in both LDAZ YBS 9:3 and
LDAZ YBS 9:5o

= 141 -
3) YBS 10
At YBS 10 the upper and lower clastic deposits were examined for their
diatom content. Nine strata were examined 1, 2, 3, 6, 7, 8, 9, 10 and 11o
A total of 13 levels were sampled, four from the lower clastic deposit and
nine from the upper one. These levels are 1) -341, 2) -335, 3) -329,
4) -323, 5) -283, 6) -273, 7) -263 8) -255, 9) -247, 10) -237,
11) -227, 12) -219, and 13) -215 cmo A count of 200 diatom valves was
made at each level and a full record can be seen Appendix V together with
a graphical representation of these data in Figures 38a and 38b.
At YBS 10,66 species of diatom were identified and the ratio of
F g B 3 M was 20 : 19 : 27o A total of 2600 valves were identified and
counted at the core and of these 247 were Freshwater, 1489 were Brackish
and 864 were Marine valves.
Five dominant species stand out in the counts. These are Nitzschia
navicu1aris (B b) with 636 valves, Melosira nu1cata (M p) with 311 valves,
Nayicu1a pere~ (B b) with 307 valves 11 Jll.ploneis ~ (MB b) with
232 valves and Nitaschia Jiimi!A (BF b) with 103 valves. The summary
diagrams for valves (Figure 38a) at YBS 10 shove that Freshwater valves
increase toward the peat deposit which lies bevteen the upper and lowgr
clastic depositso The Freshwater diatoms are mainly from the Fresh=
Brackish groupo Brackish valves remain fairly constant throughout the
levels and never fall below 40% TV. Marine diatoms increase away from
the peat and attain a dominant position in the upper three levels. In
the summary diagrams for species tha same pattern 0merges; Freshwater
species increase toward the peat and are dominant at level 5o The Brackish
species do not show any uniform pattern, the number of species increases
away from the peato Marine species also increase in the same directiono
Benthonic valves and species dominate throughout the levelsa
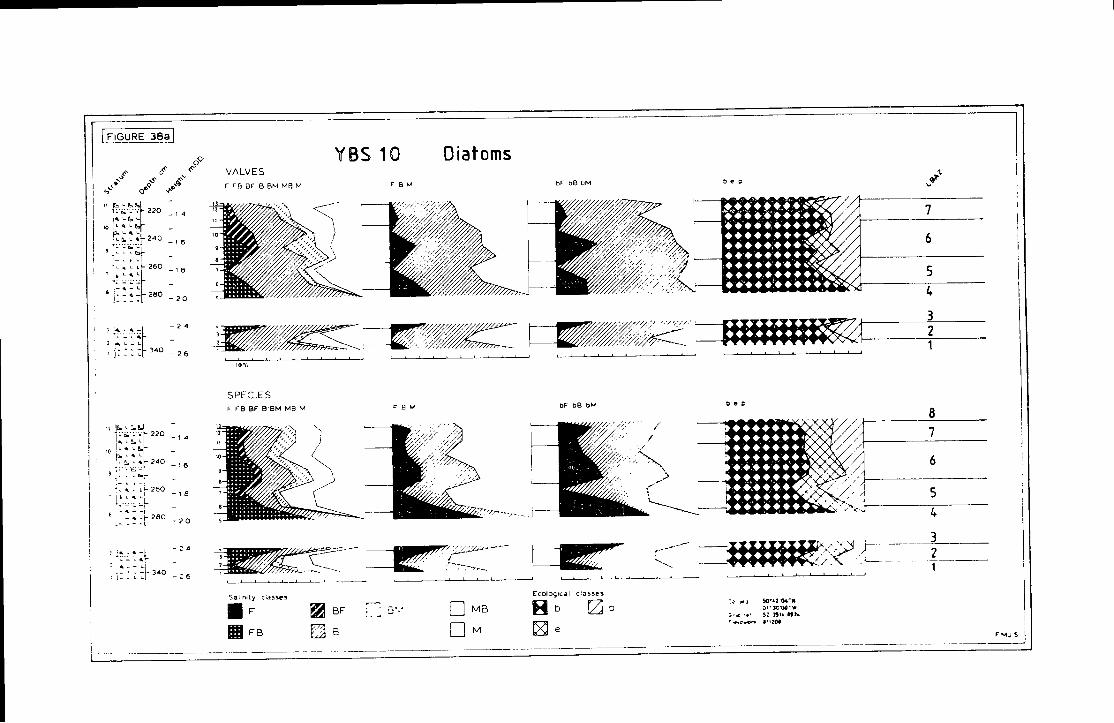
\ FIGURE 38a J
,.-.<'" ,. ~<'" f:'c;P ...._'<:' ~ .....
Q~Q ¥:-~,o; ..,,
"~~~~-220 -14 1"'-1!::.1.. '~'
\0~~~~240_16 ~:.:..:·~·-.:
t ~ - ..
:~ : ~ ~~ 260 - 1 8 , L.' l.. ..... • j~~ ~ ~ 280 -2 0 J---.
-24
' ""- ~-"~ ~ ~~-~ -~ ~ 340 = 2 6 \F .......
., lb' :,!\,~ ·~-- .. -. 220 I" ~ !!:s 1... - 1 4
1(' I ~ 41. L. !:,.
lb."-" Ll
9 :: : ~ ~r 240 - , 6 .· , .. t-.- 1.. ~ '-I • - ... - ~F- 260 . J:~~~~ -18
6 ,-"- -i ~~ : ~ ~r-280 - 2 0
l~.:-
~t 340 1J-.
-:: 4
-26
YBS 10 Diatoms VALVES
F C8 BF 9 BM MB M FSM OF bB bM o e p ,-"" ,If
···~····~/~ 7
6
5 4
~~ ~)¥%f~$~ r ~~~j:c:~/-~ttttttam ~ . w~~-<--. ~#&P~ ~~u;;;o/"--... . . . , 10"f.
SPECIES F FB SF BBM MB M
Sal1n1l:J classes
• F
Ill FB
I'BM
----E=· /;.'>''?-~~-~--. ;"'7----
, -~-
~ BF ~ - ..
EjB 0 MB
OM
bF bB bM
Ecologtcal classes
8 b 0 p
0e
/
,..-___..---
'--..._
o e p
8
;~F_]_ //
/ 6 -~' ::.>7 // )-----
/ . / I
-~'~ .. ; .... , ~---,4---5
111111~>~ <=--=--~--+---~ ,---§CI•U'04~M
~~· Jc:-oa-w :>·oe .... st ,.,4 n2 .. ...... ~ 1'11(111
""JS i --- --- _ _____j

l/)
co >-
ao r-)
~ U§
!;· I
~ ~
-
I~ 1: mf I il
ll ~
i t f---pi ioo---
I t IJl li
1-r .
• r
l t "' J
r
I ~-
p ~ ~_j ~_!_
r I---
[__ I--
[_ [__
c ~-1--
~~ ~-r r
I
~
r ii:L;
..0 11'1 -4' trl N .....
§ ~ § § § § U§ §
1 1
i i 1
~ t ! .
i I l
- & 1
• l 1
, 1
• "'--- H
I • • •
il ~ I-- ~ . !-----" d --- 1---"
l t
·-~ ~ --. _, ----A-_____ ... -- fa ~
• il J • • • ' ~
-A- ~-j . .. J
. I J i
t 1 t I 1 1
• I J
• f
l t L • • i
-- r-" l
__._~
~ ! 1- + _ _!_ f-a-- ----- _ _i ~
--- ~ --- - -- I--L-- -
__ __..__ J_ ____ ~ ~ J -- 1
.,__._ ~o--1 --- - - --~ -- - - -- l
'--- __.. ~ l -- - _ __.L -" l '- -- -- ,_1\- - - ]
--"---"- e-.- ,-"------ . d ~--4 a la_ --- -- --___ & -- ~
•• l
t
J I J _j
l l
,-I' 'i IT " ~ 0 ~ ~ ~ ......... -
00«-
'" " <D "' 0 N " <D
~\. N N
I
«-o 0 0 0
~ 8 ~ 0
~-N ~ ~ ..
"'•o "' M .., ~c!J;.Ic!J.J~.J~.JI '~ • I
,, 10' ...... I;"J ' «-., ""'.J i.£1 J <#Jell :J J J ~ J I J " • I • I <f':t<f':.J I
J_,!I;.J-f..l.!J.J:JJ .. J., ' I "' tcr '"I :.,..1:1_.. ~~ !:liE!:.,. J JJ J ~ :Jd! J 0' J I• I'-. It I f.:, t:..J 1.
viJ' 9
~ ~
;;a 1;: ;~
. ~
... ... 1 ..

- 142 -
At YBS 10 eight assemblage zones are proposed and are outlined below.
LDAZ YBS 10:1 ~341 em to ~o=338 em
The dominant species in this zone are!-~~ with 26% TV,
Nitzschia scalaris (B b) with 20o6% TV» Nitzschia acuminata (HB b)
vith 11o5% TV and M.sulcata with 10% TVo Ano111§eonois ~R (FB b)
and !onavicu1aris are also well representedo The upper boundary is
placed where Freshwater diatoms decrease while Marine types increase.
Large decreases are seen at the boundary in !·P~~ and !.sgalaris,
while increases are found in M~navicu1aris and Qe~o Braakish diatoms
are dominant in this zone although Marine types are beginning to increase
in numbero
LDAZ YBS 10:2 ~,-338 em to ~o=326 am
This zone is dominated h1 !onayicu1aris with 49% TV at ~329 em,
!:!.sulcata with 22% TV at -.329 em and Q.~ 'With 21% TV at =335 em ..
The upper boundary is marked b.y an increase in Freshwater diatoms togeth~r
with e. corresponding decrease of Marine onese At this bound:u-y there is a
large rise in ~loneis oyalia (FB b) and MoPJtl~, while decreases are
found in N.na.viculgis and !ioJulaata.., Brackish valves are still dominant
in this zone although a large increase in Freshwater species is seen at
=329 cm9 with a corresponding decrease in Marine diatoms at this levelo
LDAZ YBS 10:3 CS.o=326 en to e&o=323 em
Three species mre characteristically dominant in this zone;
l!eR.E!l~ with 42o9% TV'j) 1\!oM.V,cularis mth 17o5% TV and ]2ooyalis with
9e5% TV o The upper boundary was artificially impoaad by the break-off of
sampled levelao Brackish diatoms are dominant through this zone with s
large decrease of Marine typaso Freshwater species have increased to
39% of total species here but the valves only 2ccount for 25% of total valveso

- 143 -
LDAZ YBS 10:4 -283 em to ~.-278 em
Th~ dominant species in this zone are !f.~regriM vith 66% TV and
~oscalaris with 7.5% TV. The upper boundary is placed where Freshwater
diatoms again begin to decline, while Marine diatoms increase. A large
decrease in B.peregrina is seen at the top of this zone together with an
increase in B.navicularis. Brackish valves are dominant although Freshwater
diatoms dominate the species with 64% of total species. No Marine valves
are found in this zone.
LDAZ YBS 10:5 ,Wi.-278 em to ,a.-259 CJI
This zone is characterised qy li•navicu1aris with 45.5% TV at -263 em,
~.sulcata with 25% TV at -263 em, ~.oyalis with 11% TV at -273 em and
]!.p~ with 7.5% TV at the same level. The upper boundary of this
zone is marked b,y a renewed rise in Freshwater diatoms and decreases in
].navicularis and £!.pu1cata. Brackish valves are dominant but Marine
species out-number Brackish species here. Benthonic diatoms decrease
through this zone with a rise of planktonic life forms.
LDA.Z YBS 10:6 £4.-259 em to ,a.-23 em
The species vhich dominate this zone are N.navicularis with 35.5% TV
at ~237 em, ,li.,§J.fZ with 20% TV at -237 em, ,M.11ulce.ta vith 17.5% TV at
-247 om, .Qnoaifli!!A acum1 natum (FB b) vi th 10.5% ·rv at ~24 7 em and .Q.~
with 10% TV at -237 em. The upper boundary is placed where Marine diatoms
become dominant and where ~.BimmLand N4 navicu1aris show large decreases.
An increase in Q.~ is also visible at this boundaryo Brackish valves
are dominant through this zone, but Marine species take over in dominance
at -247 em.

- 144 -
LDAZ YBS 10:7 ca.-232 em to ca.-217 em
This zone has three dominant species; li.nayicu}aris with 26% TV
at -219 em, ~-su1cata with 23% TV at -219 em and ll·~ ~ith 17.5%
TV at -227 em. The upper boundary marks the position where Freshwater
diatoms die away and where a large decrease is found in ~.navicylaris
and M.sulcata, together uith a rise in Seoliopleura tumida (BM b) and
~.~. Marine diatoms are dominant in this zone ~th over 50% of
total valves and species. Benthonic d!Qtoms begin declining through
this zone with rising planktonic diatoms.
LDAZ YBS 10:8 ca.-217 em to -2l5 om
This last zone is dominated by .Q.~ vi th 38% TV, .§.. tumida ~ th
17.5% TV, N.nayicu1aris with 10.5% and M.sulcata vith 7.5% TV. Marine
diatoms continue to increase in this zone although true Marine valves
decrease.
The comparisons between diatom assemblage zones and lithological
boundaries in this core are not so clear as in the other boreholes at
this site. LDAZ YBS 10:1 corresponds with the lo~er cl~stic stratum of
silt Ybere Brackish diatoms are dominant. LDAZ YBS 10:2 can be identified
with the transitional stratum 2 of silt-peat, where Brackish diatoms are
once again donimant. LDAZ YBS 10:3 clearly shows an increasing Freshwater
influence of species with Brackish dominance of valves. This zone can be
correlated with the sitlty-peat transitional stratum 3. LDAZ YBS 10:5 and
LDAZ YBS 10:6 can be compared with the upper transitional strata 6 and ?o
Although Brackish valves are still dominant in these zones the species are
dominated by Marine diatoms. LDAZ YBS 10:7 shows a Marine dominance and
corresponds to the upper transitional stratum 10o The last zone, LDAZ YBS
10: 8 can bo identified with the upper silty-clay vhich is Marine in
composition.

- 145 -
Thus we have a cora with upper and lover transitional strata of a
Brackish type topped qy a clearly Marine silty-clayo
4) YBS 12
At YBS 12 the upper and lover clastic deposits were analysed for
their diatom content. Five strata 3g 7, 8, 9, and 11 were examined but
only the upper four strata provided sufficient diatoms for reliable counts.
In all, 11 levels were sampled and the eight in the upper clastic deposit
were used in this analysis. These levels are 1) -284, 2) -278, 3) -270,
4) -260, 5) -254 9 6) -240, 7) -230 9 and 8) -220 cme A count of 200 diatom
valves was made wherever possible, but only 166 valves were counted at
level 7 and 73 at level 8o The results are presented in Appendix V and the
data are displayed graphically in Figures 39a and J9b.
At YBS 12, 53 species of diatoms were identified and of these 12 were
recorded as Freshwater, 14 were Brackish and 27 were Marine speciese A
total of 1442 valves were counted in this core and 62 were Freshwater, 952
were Brackish and 428 were Marine valvesa
Four species of diatoms were dominant in the countso These were
NJ.tzschia qavicu1aris (B b) with 566 valves, Melosira su.lcata (M p) with
143 valves, Navicu1a peregrina (B b) ldth 136 valves and Diploneis .rll.<iYmf!
(MB b) with 96 valveso
The summary diagram for valves (Figures J9a) shows that in general,
Freshwater valves decreasa away from the peat with a corresponding increase
in Marine valves in the same directiono However 9 in the species summary
diagram, the pattern is not so clearo Freshwater species decrease away from
the peat but the Marine species tend to increase to the middle levels and
then decrease upwardo Benthonic diatoms are dominant throughout the levelsa

,f ~-
<,'-'
~~ ._<'
•" Q
~i\.''L22a ~ ~ l.l
L. L.!k,~ 1' I. l. L
-~~-~ •. t-240 -I- I
10 -=i·L·~r - ....... _260
9 ~-~\..'I .. q,. 't '--"\..!!::.
I.:.·." . ._ .. " 280
a L" L "L 7 "-"-
<:-'c'o;
<-
OQ ~
- , 4
-16
- 18
- 20
~:, ·\... <?C - '4 - "' c 'ell. " ~ : ~f 240 - 1 5
-~~~ 10 - '-
L. ... -a; l.. .... L. 260 - 18
'l>~~r .......... ~ ,.,-·c ..... -~ 2ac - 2 c
• j ... - .. r l ~ - 4. -,...
:-,GtJt:(E ?9a:
YBS 12 VALVES
F FB BF B BM MB M FBM
SPECIES F FB BF B BM MB M FBM
'\ \ ------
_____..L_.....,_L_
Sattn1ty classes
.F ~ BF U BM
II FB [JB
Diatoms
~ MB
M l-
bF bB bM
:__
oF 08 OM
Ecotog1cat classes
~ b up """! be
;.; "/
'\ / --~
I I
'
I
I
0., " t e D
~ 3 l'-i r------------------------~ ' /.
' ~-
X. ''. -~ I I I .l l 1 I _j
o eo
~::::~t:~t~·. >~~~ .... :X.·. ', ' ,: ~ ..... 641~~-- .. '<::}
=w~~~-~:z ~ ........ ~ -~ ~~ .. •!•"'l:1-ts; ;>0-~ \
Co-ord
GroG rl'l
S0"1.2"04""N 01")0"07"W SZ JS16 8921
~:,I'ICiwCH~ B1120B
J
3
2 1
f"M.; S i ---- _____ _)

Vl L 0 .,...._ < D
N <r"""
Vl co >-
(>6 '<..
~0 >
~
I I
CD ~
I I I 1
T ~ CD
1
CD
T "-'E
I Ill "-
l T "-
1
-~ <I; '%-
'<..__, v, "'~o
'<-, ,., y's
-~
~ I
M N .......
M ~ 2 ~ ~ ~ "' ~ " 0
"'
r • 1
! f l I l f ~ i
~ l r • ' I 1 [ l
X l l ,
~ . .. 1
l 1
___] r &~
l l l
r ~ . 'I li & . . ··~ -r I • l r . _ ___.]
-- f- __.._] r _.__l - _j ·--··
f ! _j I • 1 .A. -"'· -
u_ _ __.___.._ -- ---- ... -- -- J.J E.! t t
. -------- J [__ -·- ------ ... .J u • ~ .... _,.a_ __ ~ J f --f-----. .. .... J
± • . ... _. __ __j --. ___ _!_]
t f 1
t l
1 ! ±
~ ! . . !
l 1 • .
r -- f.---___]
~ f f---..._]
- - _j r t • i
~ l [_ . __j
~-----"-- - ·----·-j-- .... .J . -----1--__j
r _.......-----..& _______ j.._.. _..._] u_ ____ _,.__ __ & __ &_- .... !-·-___] L ______ - -- -L~
"' .. - -~J -- -- ----~--- --- -- ...... _!_]
----- __.._]
--------- 1--o. .1 Q ~ ~ ~ ~ ~ -
" "' "' 0
~ "' ..
~
0 0 f6 iil 0
~~ N ... "' N N N !;< ~~ I I I I I I I I
J J JJ J .J J o:!l..J ...J :- I - :. .J .!1 J 4 ..J c!l .J 4 ..J !4' ...J 4 , ~ I ..J ~J J .J .!l.J .J ..J ;1- I :J.!I.J t~ ..J o::!'l _J, ..J cn;.J '* .J. I ~
0 .ll...J _.. _J .!l _J .J J dl:- I- ;[l.J t1 J ~ ..J d J dl J;4 J <t J ~ I u
~ .J .,~ J .Jl _; J -' .n J II - __!_J~_:!_~--=..__~ _J .:'J J 1 ;...J t1 J • I ~
£> L" .;:

- 146 -
Three assemblage zones were recognised at YES 12 and are
outlined below.
:..DAZ YBS 12:1 -284 em to ~·-274 em.
rrhe dominant species in this zone are .!!,.peregrina with 48~ TV at
-284 em, ~.navicularis with 35~ TV at -278 em and Nitzschia circumsuta
(B b) with 19~ TV at -278 em. Other species with relatively high
percentages are N.sulcata and Diploneis smithi (MB e). The upper
boundary of this zone is placed where FreshHater diatoms begin to
decrease and where ~.peregrina and !.circumsuta show large decreases
with an increase in N.navicularis. Brackish valves are dominant although
the species curves are dominated by Marine types. ~iany Freshwater
species die out above this zone.
LDAZ YBS 12:2 ~-~274 em to ca.-247 em.
The species dominating this zone are !•navicularis with 74·5~ TV
at -260 em and M.suleata with 8~ TV at -254 em. The upper boundary is
placed in the upper peat where Marine valves increase at the expense of
the Brackish valves, as shown by the increase in ~.didyma and the decrease
in n.navicularis. Brackish valves are dominant although .Marine types are
again lominant in the species curves.
LDP2 YES 12:3 ~·-247 em to -220 em.
This last zone is dominated by ~.didyma with 20.5~ TV at -220 cm 1
!.navicularis with 18.5~ TV at -240 em, ~.sulcata with 18.1~ TV at -230 em
and Scoliopleura tumida (BM b) with 16.4~ TV at -220 em. Once again the
same pattern is found with dominant Brackish valves and lllarine species
which decrease upward.
The zones of diatoms correspond to the lithological boundaries.
LDAZ YBS 12: l is iclentifi ed with the lower transitional stra turn above the

- 147 -
peat. LDAZ YBS 12:2 corresponds to the upper transitional stratum and
LDAZ YBS 12:3 to the upper clastic deposit of clayey-silto
5) YBS 13
At YBS 13 the upper clastic deposit was examined for its diatom contento
Six strata were sampled 2~ 3, 4, 5, 6 and 7 and 12 levels were extracted
1) -278, 2) -270, 3) -264, 4) =258, 5) =252, 6) ~244, 7) =238 8) =234,
9) =230, 10) -226, 11) -222 and 12) -218 ern. A count of 200 valves was
made at each level and the results are tabulated in Appendix Vo The data
are shown graphically in Figures 40a and 40be
At YBS 13 58 species of diatoms were found. Of these 14 species were
Freshwater, 16 Brackish and 28 Marine types. A total of 2386 valves were
identified and counted and 74 valves were Freshwater, 1429 were Brackish and
883 were Marineo
At this borehole five species were found to be dominant. These were
Nitzschia navicu.laris (B b) tdth 668 valves, 12!P.loneis ~ (MB b) with
446 valves, Navicula p£!~ (8 b) with 331 valves, Melosira sulcata
(M p) with 202 valves and Caloneia formgsa (B e) with 135 valveso The
summary diagram for valves (Figure 40a) indicates a general decrease in
Freshwater valves upward from the peat with a corresponding increase in
Marine valveso This pattern is broken at -238 om ~ere a large increase in
Brackish valves is recorded and this is due to fun increase in the fre~uenoy
of N·P~~ and a drop in ~.AU1catao Benthonic valves are dominant
throughout the levelso The summary diagrams for species show the same
pattern of decreasing Freshwater species away from the peat with increasing
Brackish species in the same directiono The pattern for Marine species is
not so clear; there is a general decrease in the number of Marine species
away from the peato Again benthonic species are dominant.

~"~ _, c.;,"'
~~ ~"'
~Q Q
:- =~ 220
,..__ ._,o;
-?'
:~~~-~~~ -14
.. ~-:-.: ~ .:r 240 ~::~-.:-·...:~ - , 6
'r;·=~~tl 260 - - L '-
- ~- - - 18
E -~ - c- 280 , __
--- _, -- - -~ 220
E~~~~=L -14
~ .. ~ --~-!bi
: 1- -- -~ 240 .. ~-;; :-=::~ - 15
- -!'=-1
; ik : : ~~250 - '8
,_ ..:.···~
:~ .: :r 2eo
- - ~-~ 4ua
OQ ~
YBS 13 Diatoms
VALVES
F F8 8F 8 8M M8 M F 8 M
~~/})/)))/)Jn"7"5 n•••~ ~
SPECIES
F F8 8F 8 8M M8 M F8M
·-~"'
Sal1n1ty t.ld~Se5
• ~ ~
~~ ..... ./, r t:o:-~
Ill rB il L..J -
'/.
'··
~' '-> -~-";r
·/;:7
0 MB
~ M
bF b8 bM
bF·b8 bM
-::-~-~ _.· . .,>
/
..: -----..
2._ ---
be p
b e p
,_". ,,Q
6 5 4 3
2
~x:-><·06.(/ ~ 6 ···/<<<~'?- 5 - .. ~·::: <.~'Y--, _- 3 - ~--.-_-:; -
. - '\ .. .... ~~:::>~-) l 2 _ ______."~,...~-;!!;-:;._·,' :· .. ·-- l---- --------r---
~-----'------'-~---- ~ l __ ___J. ---L-J
[cOIOg 1ca I CIa SSe'S
t:J b [] k"Zje
Co-ora
c; .. cs r•l •••l::lworh
SO"~o2"01o''N
Ot• )0'07 .. W
SZ l516 S9Z1 !11209
I
-~d

I I
~d
Vl co >-
..,/4!,
~0 )
'• -~
..0
"' 8 "' ~ 0
"' "'
Ln
"' "' ~ ~
I.,.
8 "'
u ..
,., N
"' ; 8 "' ~ " 0 !! 0
"' "' "'
~ u N N " "'
-J j J ''j ~J J·_j ~-~~J I J d j.!! _j jj I Jl J } 1: I /·, J .I I .!l I I :1 .D _j I I J j .n J J J .!l j J _j ~: I ., I I
<(...., I J l]_j J I :ll J., J I/.:._; 1 .Jd)l J J .!JI' f/ I J I L ____ -__ ~_ ... v'J'-~-"----c _; __ J_._._~ ~~~,I I~·"~" • ~ o •, 1 • 1 .•
--------l ~ I
~ & . ~~ 5l ~~
- 148 -
Six assemblage zones are applied to the data at YBS 13 and are
outlined belowe
LDAZ YBS 13:1 -278 em to ca.=274 em
There are two dominant species in this zonep M·P~~ ~th 66.7%
TV and AmPh2rA ovalis var.JJ.gya (FB b) with 7.4% TV., The upper boundary
is placed where Marine diatoms begin to rise sharply and Freshwater diatoms
decrease from 10 to 3., This is indicated b,y the increase of species and
the rise of H.su1cataG Brackish valves are dominant in this zone, with
Freshwater~es dominating the species curvee
LDAZ YBS 13:2 ca.-274 em to ca.=248 em
The dominant species found in this zone are E.navicularis with 64.5%
TV at -258 em, ~phoneis ~phiceros (MB (b) e) with 51.6% TV at -264 em,
Q.~ with 19.5% TV at =252 em, Nitzschia ~~euta (B b) with 14% TV
at -270 em and M.au1cata with 11% TV at -270 om. The upper boundAry marks
where Brackish valves decrease with rising Marine valves. A large decrease
of N.navicularis is seen at the boundar,r accompanied by an increase in
Q.formosa and Q.~. Brackish valves are again dominant but the species
are dominanted by Marine types.
LDAZ YBS 13:3 ~.=248 em to ca.-241 em
Four species dominate this zonev ~-~\lith 37.5% TV, .Q..formgea with
15.5% TV v lf.p~Wn! and H·ftulcata with 9% TV each. The upper boundary is
placed where Freshwater diatoms decre&se again and where a very sharp
increase in Brackish diatoms is foundv as shown qy M.peregrinao Marine
diatoms decrease a.e shown by~.~ and li·§ulCatao 1·1arine diatoms are,
hovever, dominant in this zone.

= 149 =
LDAZ YBS 13:4 ~o=241 em to QAo=236 em
This zone is dominated by M·P~grina ~th 57% TV 9 Q.formosa vith 8%
TV and Achanthes brtv:!,pn var .i.ntermedia m th 7% TV. The upper bo•J.Ildary
is marked by a decrease in Brackish diatoms and an increase in Marine ones.
This is shown cy .Q.~ and ,!:1.sulcata., Brackish diatoms Are dominant
again here.
LDAZ YBS 13:5 ca.-236 em to ca.=228 em
In this zone the species Which dominate are ~.~ with 50% TV at
=234 em, .Q.formosJ. with 16o'7% TV at =230 em, M·Bulcata with 13o6% TV at
-234 em and NoDaviau1aris vith 7o3$ TV at -230 cmo The uppar boundary
is placed where Brackish valves increase ~ith decreasing Marlna valveeo
This increase in Brackish valves is seen by the increase in Monnvicu1arie
and the decrease in Marine valves is shown by ~.~. Marine diatoms are
once again dominant hereo
LDAZ YBS 13:6 ca.-22S em to .f"218 em
'1'h1s last zone i&J dominated b,y lf.nayicul,aris with 49.3% TV at ~226 om,
Qo~ with 38% TV at =218 cmp H.Muloata with 12.5% TV at =227 em and
Q.for;oaa with 8.5% TV Bt =218 omo Brmekish vslvea dominate the upper
levels &nd the species are d@miaated by Marine diatoms throughouto
A close c6rrelation exists batwsan the diatom zGnes and the lithological
strata of YBS 13o LDAZ YBS 13g1 represents the upper transitional stratum
2p from the peat bel®~ to the clQstic deposit above" The only Freshwater
influence is sean in the species with valves ~ing dominated bw Brackish
typeso LDAZ YBS 13:2 clearly coincides with stratum 3, the clayey-silto
Here the Brackish.valves are still dominant but the species are dominated
b,y Marine diatomso LDAZ YBS 13:3 corresponds with stratum 4 which is a

- 150 -
transitional peaty layer where Marine diatoms dominate. Stratum 5
coincides with the Brackish zone LDAZ YBS 13:4. LDAZ YES 13:5 represents
the clayey-silt of stratum 6 where Marine diatoms are dominant. The
last zone LDAZ YBS 13:6 represents the upper stratum 7 of silt where
Marine valves at the base give way to Brackish ones in the upper levels
and Marine diatoms dominate the species. LDAZ YBS 13:5 and LDAZ YES
13:6 have the same dominant species.
6) YBS 14
At YBS 14 the upper and lower clastic deposits were sampled for
their diatoms. Five strata were examined; 1, 2, 3, 5 and 6, and 15
levels sampled. In these 15 levels the diatom counts were very poor.
Only 5 levels yielded a count of around 100 valves; 2) -350, 3) -346,
6) -332, 7) -328 and 8) -324 em. These levels were in the lower
clastic deposits. 7 other levels; l) -354, 4) -342, 5) -338, 9) -320,
10) -316, 11) -284 and 13) -272 em yielded very low counts and level
12) -276 em yielded no diatoms. These low counts give rise to large
fluctuations on the frequency diagrams and so calculations used for the
analyses and for the graphical display of the data are based on
percentages calculated from the total number of valves (~ V) counted
over only 10 levels; level l to level 10. This method is different to
that used at the other boreholes, n~~ely calculations based on the
number of Vi:ilves cou:r:ted per level. The 95~ confidence lir.1its c..re not
shown on the diagram due to the large fluctuations of numbers.
At YBS 14, 57 species were identified and of these 18 species were
Freshwater, 17 Brackish and 22 Marine. A total of 629 valves were
counted over the 10 levels; 154 were Freshwater, 280 were Brackish and
195 were Marine.
Four dominant species were picked out from this borehole, Navicula
peregrina (B b) with 147 valves, Diploneis didyrna (MB b) with 88 valves,

~... .::.." t. ~·
_ .... .,. ...
.. . -.
..._<:
•" ·~
-220
- :'4 ('
-~ .c. :
------
,_if'-,-
- < 4
- 2 5
- ... 4
- :' 5
YBS 14 DIATOMS
VALVES F 188F88MM B M F B M
SPECI ES F F B SF B BM MB M FBM
..J L..
S.JI1n•ty c ass ~ s
• F ~ - S'\.11 L~ ill rs c 5 r
' l
bF bB bM
-~
"'-.....'-...
--->
oF bB bM
' . I
[COIOq•Ca • c J sses
ME3 B b L.....-0
::
M [J e
be o
o e o
Co o•:l' 'S0"'-1 04 N
o·· 10 01 ..,. .:.·. ;: ' " ' SI 1~•-:, B1l l• r r ta ... or. 811 . 0 9
~ . .. ,
. ' . .. . .-J . -·
..-"()
.....
4 3
2 1
4
3 2 1
-,

Vl :E 0 I<(
0
Vl co >-
~~
'"1/'tlo_,
/" ~~ ~ '£ "' ;:;; "' "' -
r + + '
-!!' ~ ~ "' 9
,,,
9
1
.'' 'I
1
,,,
" '''J l''

- 151 -
Nitzschia nayicu1arie (B b) with 42 valves and Melosira su1cata (M p)
with 41 valveso A full record of these counts is given in Appendix V and
the_data displayed graphically in Figures 41a and 41b.
The summary diagram for valves (Figure 41a) shows no general trends
Which stand out in the curves. Freshwater valves tend to increase toward
the peat vhile Brackish and Marine valves decrease. Benthonic valves
dominate the levels. The summary diagrams for species show much the same
pattern although Brackish species tend to remain more subdued through the
levels.
At YBS 14 four separate assemblage zones are recognised. These are
described belO\lo
LDAZ YBS 14:1 -354 em to ca.=344 em
The dominant species in this zone are ~.peregrina with 7.5% ~V at
-350 em, Q.~ with lo5% i. V at ~346 em, and Nitzschia Punctat! (BH b)
with lol% 2: V at 346 em. The upper boundary is placed i.;here Freshv:ater
diatoms decrease after a peak at =350 em and where Marine diatoms begin
to riseo A large change is seen in the M.peregrina curve. This zone is
dominated by Brackish diatomso
LDAZ YBS 14:2 ca.-344 em to ca.~335 em
This zone is dominated by Dj,plonaia ~ with 1.7% i. V at -342 em.
The upper boundary is marked by a rise in Fresh~mter diatoms together with
a decrease in Marine types. !·P~~ shows Q large rise at this
boundaryp together with ~.nayicularis. Thie zone is dominated b1 Marine
diatoms as shown b,y the composition of the valves and specieso
LDAZ YBS 14:3 cao=335 em to oa.~J26 om
The species vhioh dominate this zone are l!. per~p;rina. with 5. 2% :LV at

- 152 -
~332 em, N.navicn]sris 'With 2.1% 'i. V at -332 cm9 Pinnu1aria ~
with 1.8% ~Vat =332 em, Q.~ with 1.5% 'LV at -332 em and ,M.suJ.cata
mth 1.4% r. V. The upper boundary is dravn where Fresh,.,ater diatoms
decline before rising again and ~ere Marine diatoms increase. At this
boundary Q.~ shows a very large increase. The zone is dominated ~
Brackish valves at the base but this gives way to a dominance of
Freshwater valves at the top of the zona. Freshwater types dominate the
species.
LDAZ YBS 14:4 ca.-326 em to =316 em
This last zone ie dominated by ]2.~ with 6.2% L. V at -324 em,
~.suleata with 1.8% I. V at =324 omp !!·P.§n~ tmd ,!!.nayicularis both
with 1.5% LV at =324 em. f.~ is also highly represented in the upper
levels of this zone. Marine valves dominate the lowest levels but are
replaced by Freshwater valves in the upper levels of the zone. Likewise,
Brackish species dominate tha lowest level but the upper level is dominated
by Freshwater species.
Although the counte at levels 11 and 13 were too small to be
reliable, it is interesting to note that lresh~o•ater diato!D8 have diaappearfld
from the upper level 13 9 and that both levels are dominated ~ Brackiah
diatomso
These zones can be correlated with the lithological column of YBS 14.
LDAZ YBS 14:1 is representative of the lower part of str~iturn 1, the
sil ty-sand 9 ,,rhere Brackish diatoms are dominanto LDAZ YBS 14:2 corresponds
to the upper levels of this stratum9 where the dominance has changes to
Marine types. At stratum 2p the lover transitional layer is represented
b,y LDAZ YBS 14:3 ~ere Brackish valves are dominant at the base but the
:rest of the zone is Fresh in natureo The last zoneD LDAZ YBS 14z4

- 153 -
corresponds to the silt stratum 3, below the peat. Here Freshwater
types are dominant in the upper levels but Marine and Brackish types
dominate the lower levels.
3:4 Pett Level
3!4:1 Stratigraphy
The site known as Pett Level in this study is located to the
south-west of Pett Level in East Sussex. It is situated at Cliff End,
where a tract of submerged forest outcrops on the foreshore (Fig. 42).
A series of seven sampling sites (Figure 43) were put down in a
straight line out from the shingle barrier at the top of the beach:
TQ 8903 1331 to TQ 8912 1327. Five pits were dug at Pett 1, Pett 2,
Pett 3, Pett 4 and Pett 5 with samples taken from the pit sides of
Pett 1, Pett 2 and Pett 3 and monolith samples from Pett 4 and Pett 5·
Pett la and Pett 2a were taken adjacent to Pett l and Pett 2 using a
Gouge sampler. The monolith sample of Pett 5 was taken at a first
site visit at TQ 8904 1332. The ground level at this site varies in
altitude from + 0.03 rn.O.D. at Pett 4 to - 1.35 m.O.D. at Pett 1.
The stratigraphy of the Pett Level site can berseen in Figure 44.
In general the stratigraphy can be described as two clastic horizons
~,.i th tHo intercalated peats. This holds tr-ue for all sample zi tes
except Pett 4 and Pett 5 which will be dealt with separately.
The lower clastic deposit is found in Pett la and Pett 2a, the
deepest sites and ranges in altitude from - 2.29 m.O.D. at Pett la to
- 2.58 rn.O.D. at Pett 2a and has the greatest depth of 21 em at Pett la.
It is a silty-clay at both boreholes. In Pett la this clastic deposit
passes into 3 ern of transitional deposit. The lower orgaLic deposit is
only found in Pett la and Pett 2a with a sharp lower boundary zone.
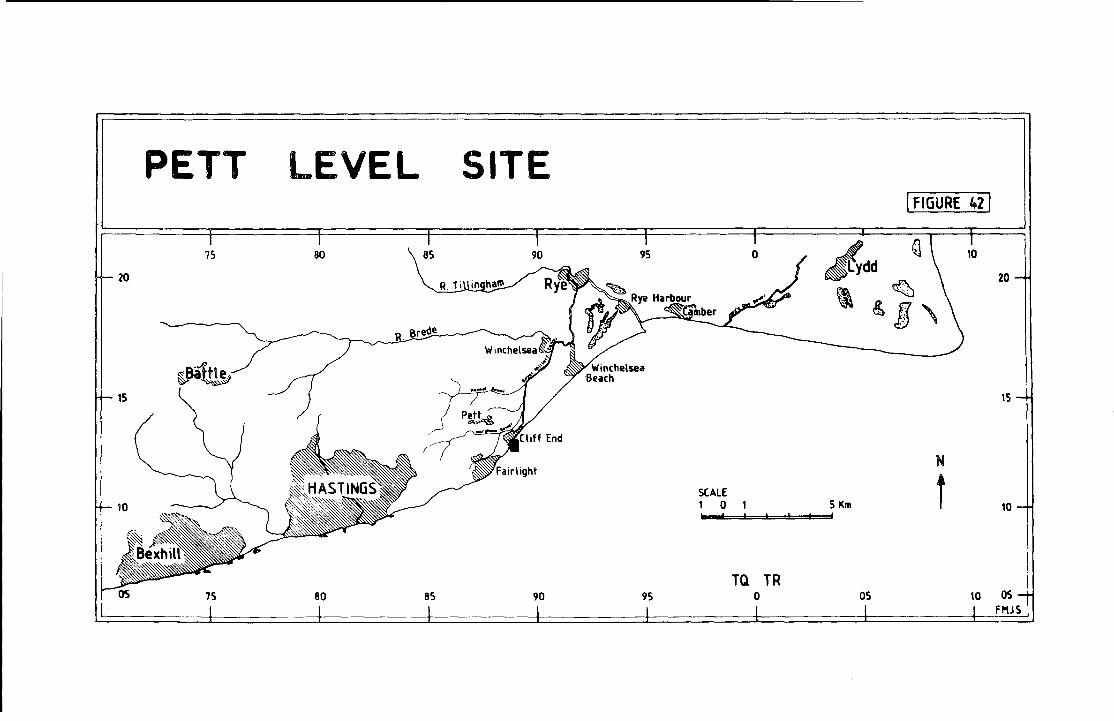
PETT LEVEL SITE
75 80
\85 -···· ·--~ 95
20
~~~y/ Winchelsea .~ /
~~ 15 \. _./( ~/1 /
75 80 85 90 95
I FIGURE 421
0
j' ~dd Q ' ~ ~
'E \
N
SCALE 5 Km 1 0 1 f
TQ TR 0 05
20
15
10
10 OS FI'\JS

~
~
PETT LEVEL BOREHOLES
0 -
0
. '. .. '~(! ; Q '.
/
89
89
'
~~ s"~>
.P3 ~' • P2
Pt• ---//
~
[R@R-E 43}
~~ ~ r.== ) FMJS. I
LEGEND
.. Borehole
0 Benchmark N l~ Temporary benchmarll r ~ MHW -MLW
[~ Drams
[5] Groyne
~ Buildings
[Q] Non-coniferous trees
G Rough grassland
[l] Clift SCALE ca Steep face 100 0 200m
[J Boulders L _,
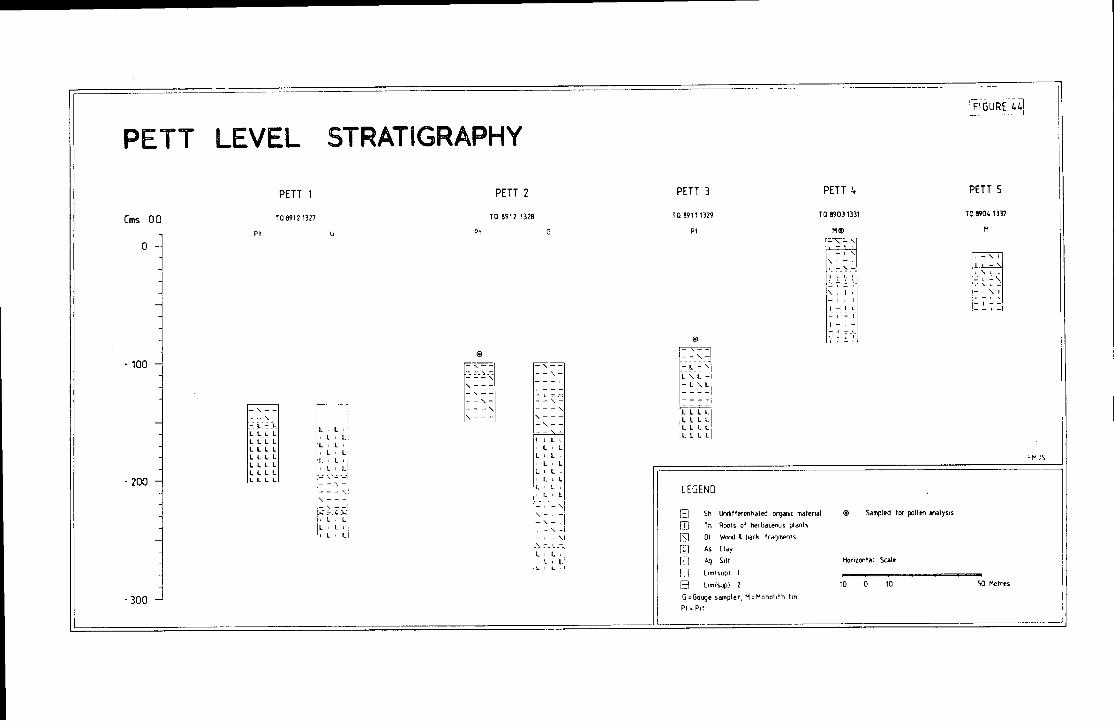
PETT
Cms 00
0 -
-
-100 -
-
- 200 -1
-
-300 -
LEVEL
PETT 1
TO 89111327
Pt
~ --'-.-:~~.:~L~ L L L L L L L L L L L L L L L L L L L L L L L L L L L L
STRATIGRAPHY
PETT 2
TO 6911 1326
l ' l. ' l. I l
L I l I
I l I L I. I l I
I l L ...:·,-.=.-....:-1
-- '\,-___ ,
~~~;I· I A.. • l L I l I
' l ' l
Pt
®
[m .
---' -
1- '----'\.-
-::-,-: ___ , , __ _ _, __ =~ t1 Lt I L I L L I l I
• L • L l I l I
I L l L l L • I rL I l _, '-_,_, I-'\,
-I - '\,
·' 7.C.cc l• l• I l I t
PETT 3
TO 6911 1329
Pt
l!l r=--;:--=-= __ ,_ .-::.k:_\ L 'l-L'L
P,-·~~ L L L L L L L L l l l L L l L l
LEGEND
·-----
PETT 4
TO 69031331
M® r_'-' ~~: '-' =--~--: L l. I
=r-.:.-:-'\ I I
- I L I I- I L ...: ~ -..:. -,-l-1--: J _7 -~\_- L I
-----
!~CiuRf4~
PETT 5
TOB904 1331
H
I;~~~: 1.::-.. l l
-::~=7~ -I' I -I --
I~ Sh l.lnr1lfferenhated orgaruc materral ® Sampled for pollon anolys•s
ITI Th Roots of herbaceous plants
I'J 01 Wood & bark fragments
G.J As Clay
t::l Aq Slit
0 L1m!supl , B l•mlsup) 1
G :Gouge sampler. M :Monoltth t1n
Pt, P•t
Hor•zontal Scale
10 0 10 50 Metres
FM J5

- 154 -
This deposit ranges in altitude from- 1.96 m.o.D. at Pett la to
- 2.19 m.O.D. at Pett 2a. It reaches a greatest depth of 39 em in
Pett 2a. 'l'he composition of this material Vhl'ies in the two boreholes
from a pure organic material in Pett la with wood fractions, to a
similar material but with a silt fraction in Pett 2a. This organic
deposit passes into the upper clastic deposit with a sharp boundary
zone. The upper clastic deposit is found in Pett 1, Pett la, Pett 2a
and Pett 3. It varies in altitude from- 1.40 m.O.D. at Pett 3 to
- 1.62 m.O.D. at Pett 2a and has the greatest depth of 57 em at Pett 2a.
The composition of this deposit takes two forms; the silty-clay, found
in the lower clastic deposit is again found in Pett la and Pett 2a
while a pure clay is found in Pett 1 ru1d Pett 3· In Pett 1, Pett 2a
and Pett 3 this passes into the upper organic material with a very
sharp boundary zone. The upper organic material is found in all but
Pett 2. It varies in altitude from- 0.89 m.o.D. at Pett 3 to- 1.35
m.O.D. at Pett 1 but it must be remembered that the top of this deposit
is not found in any of the sample sites. Its greatest depth is found
at Pett 2a where 61 ern were recovered. In the main it is the same
composition as the lower organic deposit, namely a peat with a wood
fraction. Transitional horizons with clastic material are found within
this peat at Pett 2a and Pett 3.
At Pett 4, 89 em of material were recovered in monolith tins.
This material can not be regarded as a reliable_record of the true
chronologically, stratified sequence as it has been disturbed by the
action of live mollusca. Four pure organic layers were found at
altitudes of + 0.03 m.O.D., - 0.06 m.O.D., - 0.32 rn.O.D. and- 0.36 m.O.D.
The rest of the core is predominantly silty-peat. At Pett 5, one pure
organic deposit was found at an altitude of- 0.50 rn.o.D. with a depth
of 10 ern, but the rest of the core was mixed due to the live mollusca.

= 155 =
Three boreholes were used for further analyses; th~se are Pett 2,
Pett J and Pett 4~ The detailed stratigraphy of these cores is outlined
belov.
1) The Stratigraphy o£ Pett 2.
Stratum 1idghjj ~l.h Descripllsm
J)
2)
1)
-1.01 to
-1.11
=1.11 to
=1.23
=1.23 to
=1 .51
0 to 10
10 to 22
22 to 50
Sh 3, Dl 1 Nig J+, Strf 0, Elas 3, Sicc 3, L(s) ? Brown peat.
ShJ, Dl 1, As + Nig 3=, Strf 0, Elas 2, Sicc 3, L(s) 1 Transitional
Sh J, Dl 1 Nig J+, Strf 0, Elas 3, Sicc J, L(s) ? Brovn Je&t
All the strata of this core were s&mpled for pollen analyses.
2) The Stratigraphy of Pett J.
Stratum Rei~ Depth Description
5)
4)
3)
2)
1)
...0.89 to
-1 .01
=1.01 to
=1 o09
=1.09 to
=1.24
-1.24 to
=1.40
=~o40 to
=1 .. 67
0 to 15
15 to 20
20 to 35
35 to 51
51 to 78
Sh 3, Dl 1, As+ Nig 3, Strf 0, Elas 2, Sicc 3, L(s) ? Dark mixed woody=peat
Sh 2, Dl 1, As 1 Nig 2+, Strf o, Elas 1p Sicc 3, L(s) 1 Transitional
Sh 1, Dl 1, As 2 Nig 2, Strf O, ElGs +, Sicc J, L(s) 1 Clay mth wod.
Sh 4P Dl + Nig J+, Strf 0 9 Elas 2, Sicc )p L(s) ? Brown peat.
As 4, Sh + Nig 29 Strf 0, Elas 0, Sicc 3P L(s) 2+ Clay.
Strata 2, 3, 4 and 5 were sampled for pollen analyses.

= 156 =
3) The Stratigraphy of Pett 4·
Sttatg liei,gM Q!p~ Description
m.O.D. em
14) ~0.03 0 Dl 211 Sh 2~ Th + to to Nig J+g Strf 1, Elas 2, Sicc 3, L(s) ?
...0,.03 6 Dark brown woody-peat with monocots + -wood.
13) =0 .. 03 6 Sh 1, Th 11 Dl 1, Ag 1 to to Nig 3, Strf 2~ Elas 1, Sicc 3, L(s)
...0.06 10 Monocot remains lamin~ted in silt penetrated qy wood and molluscs.
12) -0.06 10 Dl 4 to to Nig 4, Strf 0, Elas 1, Sicc 3, L(s) 3
....0.07 11 Wo~4 .
11) -0,.()7 11 Sh 1, (Dl + Th) 1, Ag 2 to to Nig 2+, Strf 2, Elas 1, Sica 3, L(e) 3
=0.18 21 JunoYJ:! ~11 fuilm§,, ~ achorotea + fungal aolorotae at 12 om. Ali§ma at 17 em.
10) -0.18 21 Dl 1, Sh 2 1 Ag 1 to to Nig 3=~ Strf 1, Elas 1, Sicc 3, L(s) +
....0.25 28 Organic silt with Carex seed, Alisma and sedge fruits. JuncU§.
9) ...0 .. 25 28 Dl 1~ Tl 1, Ag 3, Th +, As+ to to Nig 2+, Strf 2, Elas 0~ Sicc 3, L(s) 1
...0.32 35 Silt with very laminated wood and monocot bits.
8) ...0.32 35 Wood to to
=0.34 37
7) =0.34 37 Sh 19 Tl 1, Ag 2, Dl + to to Nig .3, Strf 1~, Elas 1, Sicc .3, L(s) 0
=0 • .36 .39 Transitiona.l
6) ...0.36 39 Sh 2, Tl 2, Ag +9 Th + to to Nig 3+, Strf 1, Elas 19 Sicc 3, L(s) 1
..().39 42 Brown paat.
5) =0.39 42 Dl 1, Th 111 Ag 2, As+ to to Nig 2+, Strf 2, Elas o, Sicc 3, L(s)?
=0.47 50 Bark, monocots + Carex • Very laminated organic/silt.
4) ..0.47 50 Tl 2, Sh 1, Ag 19 Th + 9 As+ to to Nig 29 Strf 1~ Elas 011 Sicc 311 L(s) +
=0.6o 63 GTe;r silty~peat with wood + laminated.
3) =0.60 6.3 Sh 2, Tl 1, Ag 1, Th + to to Nig 3+, Strf 1, Elas 1+ 9 Sicc 3, L(s) 1
=(). 78 81 ~ gannabinum seed, woody peat + herbs.

2)
l)
-0.78 to
-0.83
-0.83 to
-0.86
iH to 86
86 to 89
- 157 ~
Sh 1, Tl l, Ag 2, Th +• ~ig 2, Strf 1, Elas +, Sicc 3, L(s) 1. Grey peaty-silt.
Sh 1, Tl l, ~5 2, ~h +• Kig 2+, Strf 1, Elas +, Sicc 3, L(s) +. Dark transitional peaty-silt.
St::.-ata 2, 3, 4, 5, 6, 1~ 8, 9, 10, ll, 12, 13 a11d 14 were sarnplt~d for
pollen.
3:4:2 PollAn Analyses
Three pits ~t Pett Level were s~pled for their pollen content.
These were Pett 2, Pett 3, and Pett 4. In all cases the upper organic
deposit was investigated. The results of these analyses are outlined
and discussed below.
l) Pett 2
At Pett 2 all three strata were sampled for their pollen. Nine
levels were taken through this organic material at 5 em intervals
except for levels 1 and 2 ••hich were ta;.:en at 10 em intervals. These
levels were taKen at the following depths t~rough the pit; l) -S·O,
2) -40, 3) -30, 4) -25, 5) -20, 6) -15, 7) -10, 8) -5 and 9) 0 em.
A poLon sum of 500 land pollen \BS counted throu5hout this 2.nalysis,
:-...::-> ~"~Y c~our-.t based on arboreal :l)oL'cen was deemed as un::"'eliable due to
the ~;::•t:dominance of Alnus poll en in the pit. 'l'be results of this
ar1ELlysj s can be seen graphically in Figure 45 and a.re tabula ted in
Appendix IV. The data are expr8ssad as :t 1)arcentage of the total land
pollen (r.rLP). Two LPAZ were recognised at Pett 2 :md are outlined below.
LPAZ ?2:1 ~so em to ~·-35 em.
Tree pollen do~inates this first zone although there is a
relatively high presence of herb pollen. "~lnus is the most inpo!'tE.tnt
type of tree poll en with 68.6j" T~I' at - 50 em ,,.,,i th ·~uercus represented
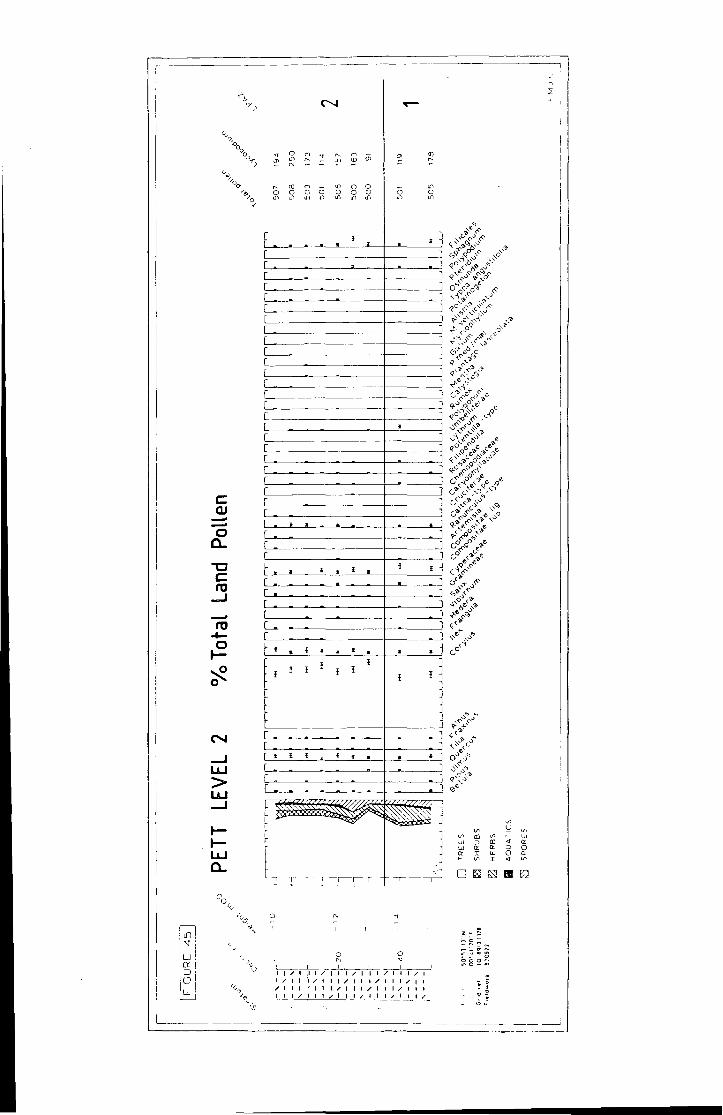
~ l
w: lXI ::J· (.91 -I
L::J
c: QJ --0
Q_
"'C c: ro
....J -ro ...... 0 .,._ ~ 0
N
...J L&.J
> L&.J ....J
<D 0 0 0 0 0
"' "' Ul
L ' '-~~~ii
! -r---r----- r
: •. J "1
0 0 0;
- __l_~____..._L_ ______L_____j II/I l/lll/111/111/1 1/11 /111/111/111/jl /I I I I 1 I/ I I I / I I I/ I I I I_...!.__ I/ I I/ I I I / __ 1 _1_1_/_1_!_1 /_
j
~ "'
"' Cll "' w :J aJ w Clc Clc a: I W 1- V> I
v' <J "' w <l Clc :0 0 0 Q_
<l "'
~--_j

- 158 -
by 5.6~ TL.? at the same level. 'l'he NAP is domini:i.ted by Cyperaceae
pollen with 11.8~ TLP at - 40 em while Filicales spores show 7.6~
TLP + S at - 50 em. Pot'3ntilla-type, Lvthrum, Calystegia :3_nd Alisr:1a.
1.1ollen :J.re only found in this first zone. Alnus ~ollen has a
concentration of 294·3 x 102 grainsjcc at - 40 em while Cyperaceae
have 53.1 x 10² grains/ cc at the same level. Again at - 40 em
Umbelliferae pollen have a com;entration of 20.7 x 10? grains/cc and
at the same level Corylus has a concentration of 19.8 x 10² grainR/cc.
The upper boundary of this zone was. drawn where tree poll en increases
vli th rising Alnus poll en and where herb poll en decreases shoHn by a
significant decrease in Cyperaceae and Umbelliferae pollen.
LPAZ P2:2 ~--35 em to 0 em.
Tree pollen again dominates this zone with _Unus showing a record
of 85.4~ TLP at - 30 em. The NAP is dominated by Cyperaceae pollen
with 7 .4~~ ':''LP at - 25 em and Corylus with 8.07o TL? at 0 em. A rise
of S,Jores is seen at - 25 em with a.'rl increase in Filica1es to ll.8p
T.LP + s. :..lnus has the greioltest concentration \vi th 512.4 x 10² grains/ce
at - 30 em while the peak of s~_lOl'eS at - 25 em records a concentration
of Filica1es of 48.3 x 10² ;rains/cc.
:ie can see that the pit at Pett 2 has Alnus pollen d.omi:·wtine
the tree pollen throughout the levels while the NAP is dominated
by C:,rperaceae and Caryl us poll en. The two LPAZ of Pett 2 have been
tentatively dated using the pollen evidence.
Dating of LPAZ at Pett 2
The peat at Pett 2 was found between altitudes of- 1.51 m.C.D.
and - 1.01 m.O .D. Two LPAZ were identified s.nd are sumi"larL_;:~d
br2lo·,.,r \ii th their major characteristics.

- 159 -
Table 17 Dating of LPAZ at Pett 2
Flandrian LPAZ I Altitude Depth Dominant Dominant Dominant
Chronozone m.O.D. em I life group AP NAP
P2:2 -1.01 to 0 to Trees A-Q. Cy-Co-fta-
III -1.36 -35 Fi
P2:1 -1.36 -35 to Trees A-Q-B Cy-Um-Co
-1.51 -50
A=Alnus, Q=5uercus, B=Betula, Cy=Cyperaceae, Co=Cor·rlus, Ra=Ranunculus
type, Fi=Filicales and Um=Umbelliferae.
The frequency of tree pollen exceeds 60~ of all pollen in
LPAZ P2:1 and is over 70~ of all pollen in LPAZ P2:2. These LPAZ are
thought to belong to Flandrian Chronozone III, which is dated from
5010 ± 80 BP (West 1970).
2) Pett 3
At Pett 3, strata 2, 3, 4 and 5 were sampled for their pollen
content. These strata range from pure organic material in strata 2 and
5 to mixed silty-peat in strata 3 and 4. Six levels were taken in this
pit at 10 em intervals. These levels are l) -SO, 2) -40, 3) -30, 4) -20,
5) -10 and 6) 0 em. A pollen sum of 500 land pollen was counted
throughout the levels. C~lculations of these data were expressed as
a per'centage of total land pollen (TLP) and the :results can be seen in
Figure 46 and are tabulated in Appendix IV. Three LFAZ were recognised
at Pett 3 and are outlined below.
1PAZ P3:l -50 em to ca.-45 em.
This first LPAZ is dominated with tree Pollen with over 70~ of
all pollen and also a relatively high presence of herb pollen. Alnus
is the dominant tree pollen with 76.6'jo TLP at- 50 em v:hile ',~uercus
has 6.8~-· TLP at - 110 em. The .NAP is clo1'linatel hy Gype:raceac po::.len
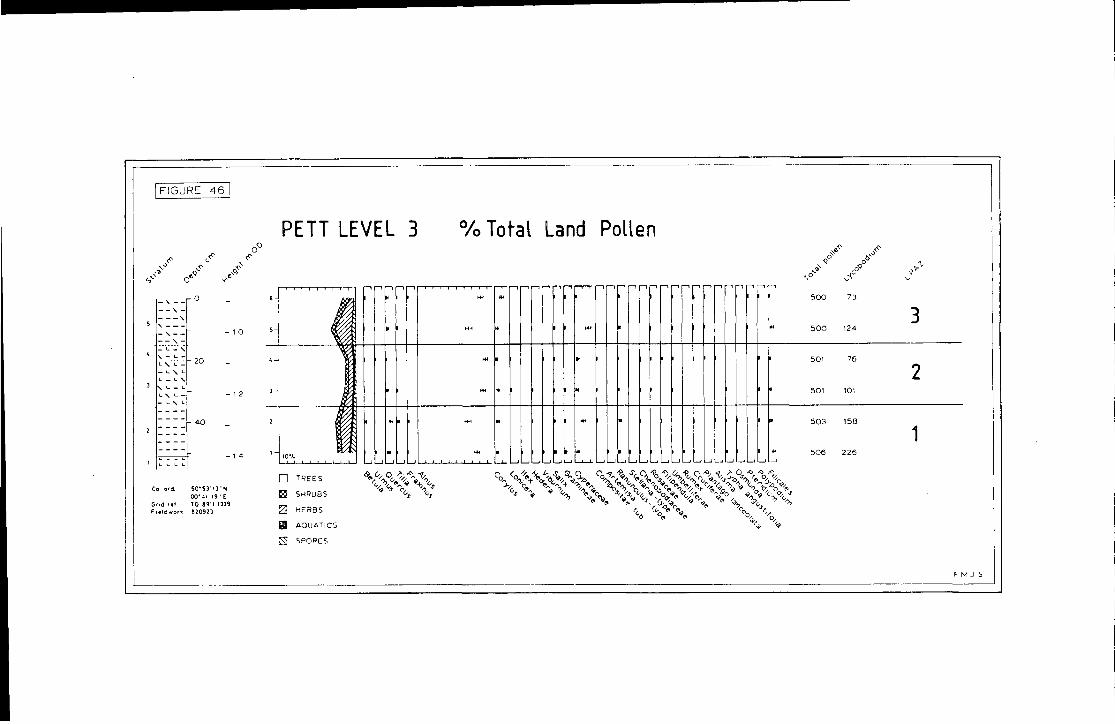
,- I FIGURE 46[
./' " t.,'-''1;
L<!' .:!'
o"<~
-'- -· 0 __ , _ ___ , 5 r,- --_, __ __ ,_
.:.~-~-:-,
~-~-~ =~ 20 -'-''-L- "-'
J ~ L- L
L' L.
- L' L
~
40
<:-"
-<-"'"'
-10
-12
-14
Co- orc1 SQ•Ij)'I)"N
OO"Ll' 19" E Gr1d ret TQ 8911 1329 Fieldwork 82092)
L_
00
"'
5-
4-
PETT LEVEL 3 0/o Total Land Pollen
"'lTTI '' I I I~~ r:rrrrrr,..-.-rrrrrrrrrrrrrrrrr
4 I~ ... ~ I•
~ ... ~ I•
>« I• ~
I' I I·· IQ•J. LLtl.Jw ~~.., lLLLLllLLLlLLLLLLLLLLLLLL:
f+-1 1 .. ... I• "
0 TREES s~ u/ o" ~ ..... -~ "'"~/.., ... " ..... "?v. <',.. "~ ¥-t. "'s
c;:l SHRUBS ~ ;r C'"s "<-s
0 HERBS
HI AQUATICS
C'o~ <o~~/"~6~<~~,:.,,. 0o{;:.,:~,.~<os;/,,;,:'>)~,{"<-).,js~<>~s'?;<'o;]~~ 'v..r ~ ..... ¥ ...... "v_, ... ..,<":C'('II s,..( ... s:(""-G.. .... ~ ~..oo"<"'~<"""'~-it- ... ~,..:..9o tV~~ "o:"'"c o~;..-('.ls
t" Cl><.' ¥<." ¥ .r, ~ ~~ ~ ..... .:i) {" ~ '"±>v 0 "'), t: tJ_. :.ol"rt't <." "r. st' "6 c('.l •<." ('.lo~ "~"o/
.~~ "<$>
IS3 SPORES
~ <.o"
~f.{:(/0
500
500
501
501
503
""'"" ~0 Lo
-v'~
73
124
75
10:
158
506 226
'\~''?-
3
2
1
F M J S
- 160 -
with 11.2~ TLP at - 40 en while ?ilicales has 7.0~ TLP + Sp at - 50 en.
Four species are only found in this :S:?AZ. These are Ilex, Artemisia,
Stellaria-type and Rumex. Alnus pollen reco:t·d:; the highest concentration
Hi th 228.2 x 10² grains/cc at - 40 em. The hj_ghest NAP concentration
is shown by Cyperaceae pollen with 39.2 x 10² grains/cc at the same
') level and Filicales has a concentration of 19.0 x 10- grains/cc at
- 50 em. The upper boundary 1-:as placed where tree pollfm begins to
increase and herb pollen decreases. At this boundc:>...ry a rise in Alnus
pollen is seen from 65.2~ TLP to 85.4~ TLP while Quercus pollen
decreases from 6 .8~:,, ':'LP to 2 .4~;;, TLP and Fraxinus pollen temporarily
disa~pears. Cyperaceae pollen also decreases from 11.2~ TLP to 3.2~ TLP.
LPAZ P3:2 ~·-45 em to ~·-15 em.
This LPAZ is again dominated by tree pollen with over 801~ of all
pollen, and decreasing herb pollen. Alnus pollen again dominates the
tree pollen with 88.4~ ~LP at- 20 em. The NAP is very low wit~
Corvlus pollen recording 4.4~ TLP at- 30 em and Cyperaceae with 4.2~ TLP
at - 20 em. Lonicera pollen is only fotmd in this LPAZ. The
concentration of Alnus pollen is again high with 663 x 102 grains/cc
at - 20 em. ? Cyperaceae pollen show a concentration of 31.5 x 10-
;rain~Jcc at - 2C Cffi and at - 30 em Corvlus pollen has 24.2 ·:> X 10-
::;-l'c.ins/ cc. The upper boundary is rr,o:_:rked by a decrease in tree pol~ n_
v:i_"t.h a cor:c'esponding rise of herb pollen, and the dying a\\'ay of aquatic
pollen. Alnus decreases fret~. 88.4;." TLP to 66.6jb TLP, Cyperaceae
records a rise from 4.27o TLP to l8.f.j" TLP and Filic3.les rise from
1.8~ TLP+SP to 4.8~ TLP+Sp.
LPAZ P3:3 ~·-15 em to 0 em.
Tree po=len don,inates this last i,PAL: Hith a peak of herb pollen
~t - 10 c~. ~ln0~ pollen doffiin~tes the tree pollen with 85.3; TL? at

- 161 -
0 em while Quercus pollen has 3.4~ TLP at - 10 em. The NAP is
dominated by Cyperaceae pollen with 18.8~ ~LP at - 10 em, Corylus
pollen has 9.2;u TLF at 0 em and Filicales has 4.2;a r::'LP + Sp s.t - 10 em.
?teridium spores O!.re only found in this zone while Viburnum, Gomposi tae
tubuliflora, Chenopodiaceae, Fili1'endula, iDismA. and Tynha angustifolia
all die out in this zone. Concentration of Alnus pollen is again high
with 616.5 x 10² g~ains/cc at 0 em. Cyperaceae pollen has a concentration
of 84.6 x 10² grains;'cc at - 10 em, Corylus has 69 x 10~ grainsjcc and
Filicdes has 22.5 x 10² grains/cc at - 10 em.
The pit at Pett 3 is dorLinated by tree pollen throughout the
levels with two peaks of herb pollen at - 40 em and- 10 em. LPAZ P3:1
can be said to correlate with the lower organic stratum 2 where Alnus
is the dominant tree pollen and Cyperaceae dominate the NAP. The
transitional peaty-silt of stratum 3 and silty-peat of stratum 4
corresponJ with LPAZ P3:2 where .Unus again dominates the tree curves
and where Corylus and Cyperaceae pollen dominate the NAP. The upper
orga.'1ic stratum 5 correlates with LPAZ P3: 3 Nhere Alnus pollen don-,inates
the trees and where Cyperaceae pollen shows a peak of NAP at - 10 em.
The three LPA;:, of Pett 3 have been tentatively dated using the pollen
evid8nce.
Dating of L?AZ at Pett 3
At Pett 3 a lower and upper peat was found between altitudes of
- 1.40 m.O.D. to - 1.2~ m.o.D. and - l.Ol m.o.D. to - 0.89 m.O.D.
Three L?AZ were identified and are sum:narised beloH Hi th their major
characteristics.

- 162 -
~able 18 Datin~ of L?AZ at Patt 1
Fl and:- ian Altitude Depth Dominant T\ • .... .... om1nan L Do[LincL"lt LPAZ
Chronozone m.O.D. em life group AP l:AP
I -0.89 to 0 to '
I P3:3 Trees A-'~ Cy-Co-Fi -1.01 -15
-1.01 to -15 t.o III ?3:2 Trees A Co-Cy
-1.34 -45
-1.34 to -45 to
j P3:l Trees A-Q Cy-Fi-Co -1.39 -50
A=Alnus, Q=4uercus, Cy=Cyperaceae, Co=Corylus, Fi=Filicales.
Tree pollen dominates all of these LPAZ and reaches up to 87.7~
of all pollen at - 20 em. These LPAZ are thought to belong to
Flandrian Chronozone III Hhich is dated from 5010 t. 80 :BP (Hest 1970).
3) Pett 4
At Pett 4 thirteen strata were sampled for their pol1en content;
strata 2, 3, 4, 5, 6, 7 7 8, 9, 10, 11, 12, 13 and 14. These included
the pure or,_s:mic strata 6, 8 and 12 together r;i th the mixed inorganic
and organic strata. 'l'he sampling interval va:-ied from 8 em to l em
depending on the stratigra.phic boundaries inposed on the core by the
Troels-Smi th analysis. In total 22 levels were take~ for analysis from
this site. These are l) -84, 2) -82, 3) -80, 4) -74, 5) -70, 6) -66,
7) -60, 8) -56, 9) -52, 10) -46, 11) -41, 12) -40, 13) -38, 14) -36,
15) -31, 16) -25, 17) -17, 18) -13, 19) -10, 20) -8, 21) -5 and 22) -1 em.
In all cases a pollen sum of 500 l:m::l pollen was counted. 'l'he data are
displayed in Figure 47 in the form of ;.otota1 land pollen (':'LP). The
results are tabulated in Appendix IV. Seven LPAZ are recognised at
this pit and are outlined be1o-.;.

, J >
L ~ I I I r- I lJ"'I -:tl m J
N
r ~
' . . ~ _j r . r - ~J----->.~-
. ' . . ~ :a. •.• .1. " • 1 r l
I l -l
r l
~ _]
~ ~ -- . . .
r -~-~ ~ r ---
- l -- --r--- -- -
.• . l r I ~ j ~ I '••
I I I i • . . . .
.... ~; ~u •• l • ' • • I . .. ~ -
f.l c [ I QJ I - ' f u { - r I ;
" l
0 . • . CL I 1
r 1
"'CJ r l
c I l ro r l
_J I r l - r ' . i ro c . .. . . • ~~-- 'I . . ••• - F w, ~ 0 f
1- t I f ! 1
~ I
tf l l
l [ f ! I I 0 L l
t ! ' I
r l
-:t l
- I f-.-] - -- l _J - ]. . . .. • l UJ -~ -l-- . > r
--·- l UJ - . •" & & . . 1 _J
'w ~ , ~, ~ ~
1- j
1- w J UJ a..
~ ;::;;~ ,;, ~ • - - - " ~~ ........ .,. ~ -
"' "' "' "' •J> "' "' ';; w w if "' "' w "' :J 0
"' 2i w 0 :;; ~ I ~
0 ~ ;s; Ill i2l
0~ -'<.
'< 0 N " "' "'
~ '5, 0 0 0 0 0 . ., I I
'-o <, 0 ~ 0 0 0 .,_ " "' "' ~ ~
0 ,, - 1:1 ".J - .J - I _!.____
I: I J - I: .J-
I/ I j_ ..J - J- I -:.J I - I .J :- ' '-, :, -I'- I- J:l- I ' I: J I
'• I-_;_:_ I ' I ' J
"',r ' 0
3 2
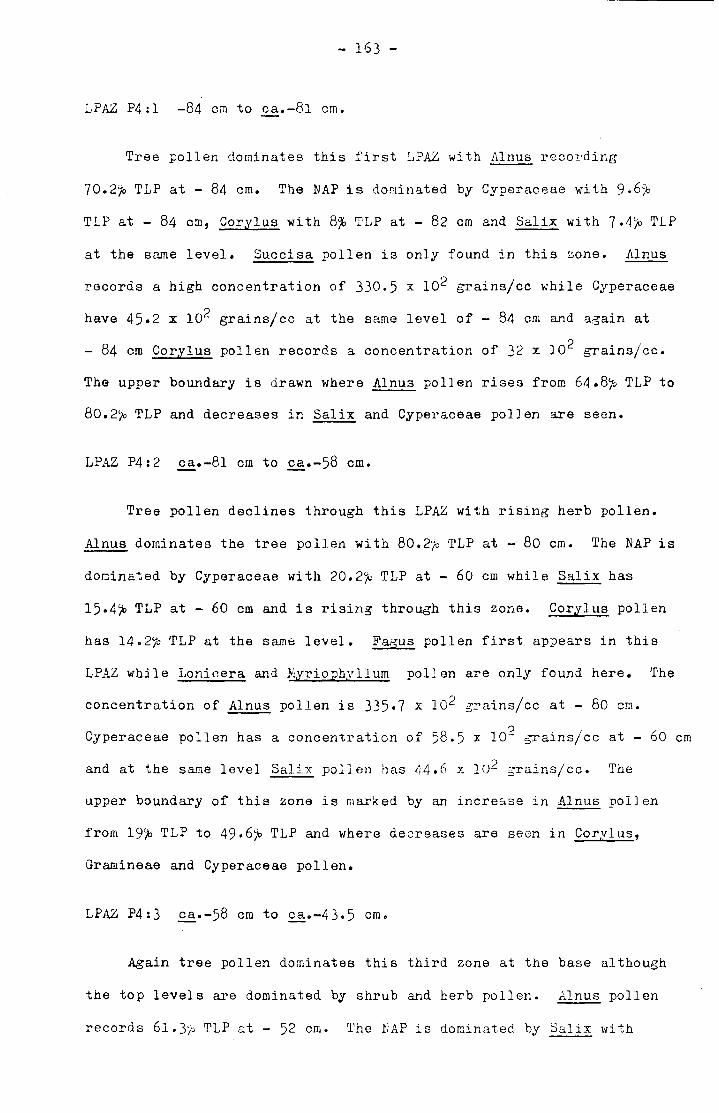
- 163 -
LPAZ P4:1 -84 ern to ca.-81 em.
Tree pollen dominates this first L?AZ with Alnus recor·ding
70.2~ TLP at - 84 em. The NAP is dominated by Cyperaceae with 9.6~
TLP at - 84 em, Corylus with 8% TLP at - 82 em and Salix with 7·4~ TLP
at the same level. Succisa pollen is only found in this zone. Alnus
records a high concentration of 330.5 x 10² grains/co while Cyperaceae
have 45.2 x 10² grains/cc at the same level of - 84 em and again at
- 84 em Cor,ylus pollen records a concentration of 32 x 102 grainsjcc.
The upper boundary is drawn where Alnus pollen rises from 64.8~ TLP to
80.2ju TLP and decreases in Salix and Cyperaceae pollen 3.I'e seen.
LPAZ P4:2 ca.-81 em to ~·-58 em.
Tree pollen declines through this LPAZ with rising herb pollen.
Alnus dominates the tree pol1en with 80.2;o TLP at - 80 ern. The NAP is
doninated by Cyperaceae with 20.2~ TLP at - 60 em while Salix has
15.4~ TLP at - 60 em and is rising through this zone. Corylus pollen
has 14.2~ TLP at the same level. Fagus pollen first appears in this
LPAZ while Lonicera and !v!,yrioph;dlum pollen are only found here. The
concentration of Alnus pollen is 335.7 x 10² grains/cc at - 80 em.
? . Cyperaceae pollen has a concentration of 58.5 x 10- grainsjcc at - 60 ern
and at the same level Salix pollen has 44.6 x 10² ;-rainsjcc. The
upper boundary of this zone is marked by an increa.se in Alnus pollen
from 19~ TLP to 49.6~ TLP and where decreases are seen in Corvlus,
Gramineae and Cyperaceae pollen.
LPAZ P4:3 ~--58 em to ca.-43.5 em.
Again tree pollen dominates this third zone at the base although
the top levels are dominated by shrub and herb pollen. Alnus pollen
records 61.3~ TLP at- 52 em. The NAP is dominated by Salix with

- 164 -
19.4~ TLP at - 56 em and Cyperaceae with l7 .6~ TLP at - 46 em. The
concentration of pollen decreases overall in this LPAZ with Alnus
recording 142.1 x 10² grains/cc at- 46 em, Cyperaceae with 56.8 x 10²
grains/co at the same level and at 56 em Salix has a concentration of
53·5 x 102 grains/co. The upper boundary was placed where there is
an increased rise of Alnus pollen from 44~ TLP to 79.2~ TLP with a
decrease in Gramineae pollen from 9.8~ TLP to 1.4~ TLP and in
Cyperaceae from 17.6~ TLP to 2.0~ TLP.
LPAZ P4:4 ~--43·5 em to ~·-33·5 em.
This LPAZ shows the peak of tree pollen with over 84% of all
pollen at - 38 em. Alnus pollen has a peak of 84.2~ TLP at - 40 em.
The record of NAP is very low throughout this zone. Calystegia and
Pilularia species are only found in this LPAZ. Alnus pollen records
a concentration of 1034.6 x 102 grains/co at - 36 em while Filicales
has a concentration of 55·5 x 102 graine/cc at - 38 em. Corylus has
55.2 x 10² grains/co at - 36 em and at - 40 em Betula has a
? concentration of 53.4 x 10- grains/co. The upper boundary is marked
by the beginnings of a decline in tree pollen with Alnus falling from
82.4f? TLP to 60.6~ TLP and rises in Corvlus, Gramineae and Cyperaceae
pollen.
LPAZ P4:5 ~·-33·5 em to ca.-21 em.
This zone shows a decrease of tree pollen with a corresponding
rise of herb pollen. Alnus pol~en has a record of 60.6~ TLP at
- 31 em. The NAP is dominated by Cyperaceae pollen with 25.5~ TLP at
- 25 em, Salix pollen with 12.8~ TLP at the same level and again at
- 25 em Corylus pollen has 10.8~ ~LP. The concentration of Alnus
pollen has dropped to 428 x 102 grainsjcc at - 31 em while Cyperaceae
records a concentration of 96.4 x 10² grainsjcc at - 25 em and at

- 165 -
- 31 em Corylus pollen has a concentration of 60.7 x 10² grains/cc.
The upper boundary was drawn where there is a renewed rise of .linus
pollen from 29.3~ TLP to 42.7% TLP and also a rise of Salix pollen
from 12.8~ TLP to 25.1~ TLP and where Cyperaceae fall from 25.5~ TLP
to 4·41'- TLP.
LPAZ P4:6 ca.-21 em to ~--11.5 em.
This zone is dominated by NAP in the form of herb and shrub
pollen. The tree pollen decreases to a minimum at - 13 em. Alnus
is the most important tree pollen with 42.7'1:> TLP at- 17 em. The NAP
is dominated by Salix with 32.2% TLP at - 13 em, Gramineae have 15~ TLP
at - 13 em and Typha angustifolia has a peak of 10.8~ TLP + Aq at the
same level. Centaurea pollen is only found in this zone, while the
first record of ~laux pollen is here. The concentration of Alnus
Pollen is 322.4 x 10² grains/co at- 17 em and at the same level
Salix pas a concentration of 189.8 x 10² grains/co and Gramineae has
90.4 x 10² grains/co at the same level. The upper boundary is marked
by a renewed rise of tree pollen with Alnus rising from 18.8~ TLP to
45.6~ TLP, Salix pollen falls from 32.2~ TLP to 21~ TLP and decreases
~e also recorded in Jramineae and Cyperaceae pollen.
LPAZ P4:7 .£!!_--11.5 em to -1 em.
This last LPAZ sees a large rise of shrub pollen. The trees are
dominated by Alnus pollen with 48.6~ TLP at - 8 em. Salix dominates
the NAP with 48.8~ TLP at - 5 em. Cyperaceae records 13.8~ TLP at
- l em and Gramineae has 8~ TLP at - 10 em. Convolvulus pollen is
only found in this last zone. The concentration of Alnus pollen is
343.5 x 1c2
grainsjcc at - 10 em while Salix records a high concentration
of 250.7 x 10² grains/co at - 5 em. The concentrations of Gramineae
and C~· peraeeae are· 60.3 x 10² grains/ cc at - 10 em and at - 5 em tte

- 166 -
latter has 57·5 x 102 grains/co.
These LPAZ show a record of changing vegetation types closely
associated with the strata of Pett 4. LPAZ P4:l correlates with
stratum 2 which is a transitional peaty-silt bed where Alnus dominates
the tree pollen and where Corylus and Cyperaceae dominate the l;AP.
LPAZ P4:2 can be said to correspond to the silty-peat of stratum 3
where tree pollen is most important and to the base of stratum 4 where
NAP is more important in the form of Cyperaceae and Salix pollen.
The top levels of stratum 4 and stratum 5 correspond to LPAZ P4:3,
here tree pollen is again dominant and Salix_is the most important
NAP. LPAZ P4:4 clearly shows the peak of tree pollen corresponding
to the wood stratum 8, where there is little evidence of NAP. The
peaty-silt of stratum 9 is dominated by tree pollen while the silty
peat of stratum 10 is shown to be dominated by NAP in the form of
Cyperaceae and Salix pollen. LPAZ P4:6 can be correlated with
stratum ll and is dominated by NAP with Salix the most important
species. At LPAZ P4:7 there is a change of dominance from NAP to
tree pollen at the base corresponding to stratum 12, which is a
bed of wood; the upper levels of this LPAZ are dominated by NAP.
It is obvious that Pett 4 displays the most complex of patterns
of local vegetational change at the Pett Level site and as previously
mentioned this is thought to be due to the action of live mollusca,
which have disturbed the sample site. As a result this pit has not
been dated using the pollen evidence, although it would of been useful
to represent the uppermost organic deposit of the site.

- 167-
2_ :5 Browndown
3:5:1 Stratigraphy
The core at Bro~dovn was taken b.Y the Civil Engineering Department at
Portsmouth Polytechnico This coreg Browndown 13/14 53, vas taken using a
typa of Percussion corer from the sea-bed off the coast from Gosport in
Stokes Bay (Figurcg 48) (SZ 585 985) o The sampled material consists of four
one metre sections:=
Tube 26 ~ .. 4 m.O.D. to -10.4 m.O.D.
n 27 -10.2 m .. O .. D. to ~11o2 m.O.D.
It 28 =11o2 m .. O.D. to =12.2 m.O.D.
" .36 =18o8 m.O.D. to =19.8 m.O.D.
The indication or depth~ in centimetres, from the top of the core is given
with the sea=bed, at =5 .. 5 moO.D. taken as the top or the core ..
'!'he stratigraphy of this core at Brovndow can be divided into four
sections and is seen in Figure 49o The basal strata consist of a sandy
daposi t 42. 5 em deepo .4. bove this lies the only organic material found
in Brovndown 13/14 53o This organic deposit is not a pure peat but mainly
a transitional peaty-silt bordering stratum 69 Which is a silty-peat with
n depth of 12 em, at an altitude of =19.2 m.O.Do Above the organic deposit9
approximately 9o26 m of mixed clays and silts are found with no definite
trends apparent within the stratao The last type of mate~ial found at this
borehole is coarser than the mixed silts and clays and is a sandy deposit
becoming coarser towards the top of the sampled materislo The detailed
stratigraphy of this borehole is given belo~o
The Stratigraphy of Browdown 13/14 53
Stratum Altitude Depth Description
29 390 Ag 1p Ga 3D Partotasto(mollo) + to Nig 1+» Strf Op Elas ? 9 Sioc 4» L(s) 0
40B Light gray silty=~and with ~

N
i
l) , .. c:~r~/ a. '
(~, ~t··;' I - I t:
~~~ I.
""' . . \, ~~·
' . . ~~T
fly~
So,~tv,.
:~-- ~
RYDE '...:..-.._--~
~WIGHT
?
.··~~···
\.'-~ ""··
THE BROWNDOWN
SITE
[FfGuRE:48]
m BRO.VNDOWN SITE
1(1 HWM I LWM
LJ SAND & MUD
D URBAN AREA
SCALE 2 3 Km ,L..~o~=±=,====~=-
FM.JS
-:l DORSET '-{-~ v,...,"'V
''-'>

BROWNDOWN 13/14 53 STRATIGRAPHY
mOD Tubes 26-27-28 -90-
@)
-9 5 '. n -100-
~ "! ... ..... ......
~;~, -10 5 b'
r ... .... .. -110- . ~~ . :~ (! ... ,,, ... I!:.•[!,L
-11 5 , ..
-120- ~ I·
-12 5
Tube 36 mOD -18 5
f- -19 0
-19 5
I ...
--200
~ I
® Sampled for macrofossils
~ Sh Undifferentiated organic material
~ As Clay
CJ Ag Silt
0 Ga Sand
[~ Gg(min) Fine gravel
l
i
FMJ s I -

28
27
26
25
24
23
22
21
20
19
18
17
16
15
=9o6 to
-9o7
=9o7 to
=9o9
=9o9 to
-10., 1
=10o1 to
-10.2
-10.2 to
=10,.4
=10 .. 4 to
=10o5
=10 .. 5 to
=10o8
-10.8 to
=10o9
=10 .. 9 to
=11o1
-11 .. 1 to
=11o2
=11o2 to
-11o5
=11o5 to
=11o6
=11o6 to
=11oS
=11o8 to
=11o9
- 168 =
408 Ag 3+, Ga 1=9 As +, Part.testo(moll.) + to Nig 1+, Strf 0, Elae ?, Sica 4o L(s) 0
424 Light sandy-silt with whole Os~a
424 Ag 3, As 1, Partotest.(moll.) + to Nig 1+ 9 Strf 0, Elas ? 9 Sica 4, L(s) 0
435 Light clayey-silt with parts and shells
435 to Not sampled
457
457 Ag 1=9 As 3+, _eart.testo(mollo) + to Nig 3, Strf o, Elas ?, Sica 4, L(s) 0
468 Dark grey transitional clay. Flame of silty-clay and shell fragments.
468 As 4, Ag +, Sh + to Nig 3-9 Strf 0, Elas ?, Sicc 4, L(s) 0
491 Dark grey clay and organic staining
491 As 2, Ag 2, Ga +" Sh + to Nig 3=, Strf 0, Elas ?, Sicc 4, L(s) 0
503 Dark grey clay=silt and organic remains
503 to Not sampled
529
529 Ag 2p As 2 to Nig 2-, Strf 0, Elas ?, Sica 4, L(s) 0
539 Light gr~ clay-silt
539 Ag 2, As 2, Sh +, Lf + to Nig 2, Strf o, Elas ?, Sicc 4, L(s) 0
562 Dark grey clay-silt and organic stains
562 Ag 1+, As 3=, Sh +o Lf + to Nig 2, Strf 0 9 Elas ?, Sica 4, L(s) 0
570 Silty-clay and great organic staining
570 As 2, Ag 2, Sh + 9 Lf + to Nig 1+, Strf 1=, Elas ?, Sicc 4, L(s) 0
602 Light gray silt-clay and charcoal Feo2 Cl~y balls present
602 Ag 3=, As 1+ to Nig 1+, Strf 0, Elas ?, Sicc 4, L(s) 0
605 Light clayey-silt
605 to Not sampled
630
630 Ag 2=. As 2+, Sh + to Nig 1 , Strf 0, Elas ?, Sicc 4, L(a) 0
639 Silt-clay and organic remains

- 169 -
14 -11.9 639 As 3+, Ag 1-, Sh + to to Nig 2, Strf 2, Elas ?, Sicc 4, L(s) 0
-12.0 646 Dark grey silty-clay and charcoal, wood and organic staining
13 ~12.0 646 Ag 2-, As 2+ 1 Sh + 1 Lf + to to Nig 2-, Strf 2, Elas ?, Sicc 4, L(s) 0
=12o2 666 Grey silt=elay, transitional and silt bands
12 -12.2 666 Ag 3, As 1, Sh +, Lf + to to Nig 2-, Strf 1, Elas ?, Sicc 4, L(s) 0
-12.2 670 Grey clayey-silt and charcoal remains
11 -12.2 670 to to Not sampled
-18.9 1338
10 -18.9 1338 As 2, Ag 2, Sh + 1 Gg(min) + to to Nig 1-, Strf 1+, Elas ?, Sicc 4, L(s) 0
-18.9 1342 Light clay-silt and dark organic stains
9 -18 .. 9 1342 Ag 1, As 3~ Sh +, Th + to to Nig 2, Strf 2+, Elas ?, Sicc 4, L(s) 0
-19.01 1351 Grey silty-clay transitional and organic
8 -19 .. 01 1JJ1 Ag 3+~ Sh 1-, Th + to to Nig 3-, Strf 31 Elas ?, Sioc 4, L(e) 0
-19o06 1356 Light grey peaty-silt
7 -19.,06 1356 Ag )p Sh 1, Th? to to Nig 3, Strf 2+, Elas ?, Sicc 4, L(s) 0
=19o2 1370 Grey peaty-silt and dark banding
6 =19.2 1370 Ag 1, Sh 3, Ga ? 1 Lf + to to Nig 3+~ Strf 3+, Elas ?, Sicc 4, L(s) 0
-19 .. 3 1382 Dark silty-peat, rusty stains
5 -19.3 1382 Ag 2-, Sh 2, Gg(mag) +, Ga + to to Nig 3, Strf +, Elas ?, Sicc 4, L(s) 0
=19o4 1388 Dark transitional, nodules of chalk
4 -19.4 1388 Ga 211 Ag 2, Sh + to to Nig 2, Strf 011 Elas ?, Sicc 4, L(s) 0
=19o4 1391 Transitional silt-sand and organic
3 =19o4 1391 Ga .3=, Ag 1, Lf +, Gg(min) ?,Sh? to to Nig 2, Strf o, Elas ?, Sico 4D L(s) 0
=19o5 1401 Silty=sand and nodules of chalk
2 =19o5 1401 Ag 3-0 As 1+, Gg(mag) ? 1 Sh + to to Nig 2, Strf 06 Elas ?, Sicc 4, L(s) 0
=19o6 1412 Sandy=silt and chalk and flint, organic stain
1 -19.6 1412 Ga 2-, Ag 1+, Gg(min) 1, Gg(mag) + to to Nig 2, Strf o, Elas ?, Sicc 4, L(s) 0
=19o8 1430 Silty=sand and chalk and flint noduleso
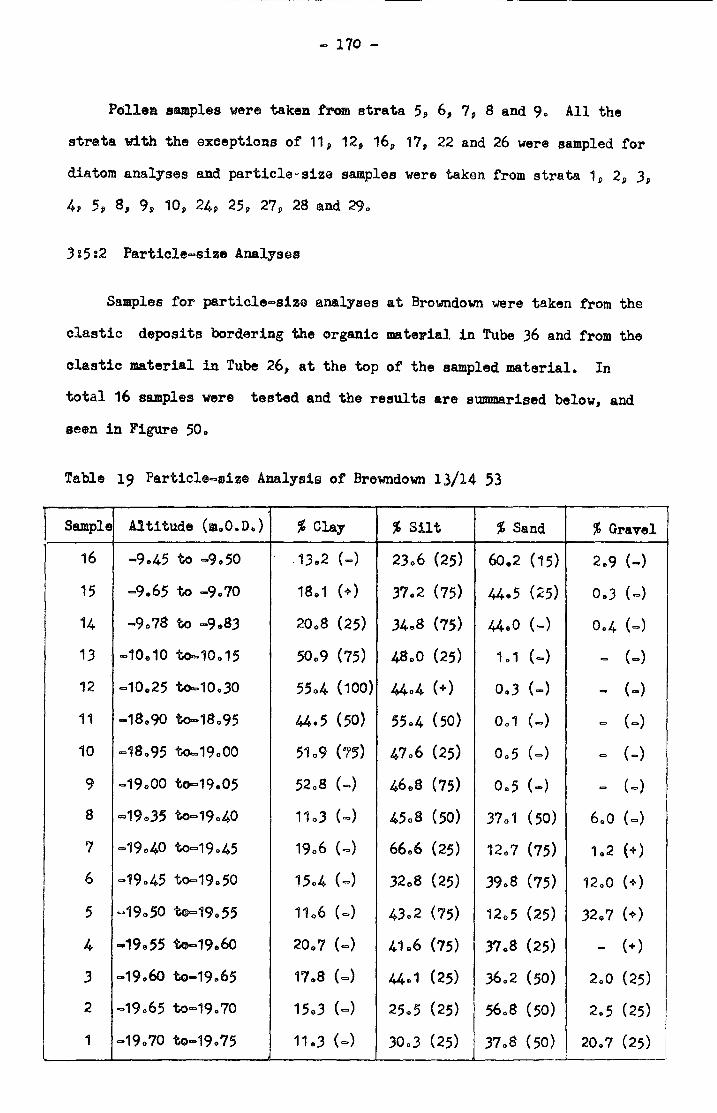
- 170 =
PGllen samples were taken from strata 5, 6, 7, 8 and 9. All the
strata vith the exceptions of 11, 12, 16, 17, 22 and 26 were sampled for
diatom analyses and particle-size samples were taken from strata 1p 2p 3P
3:5:2 Particle-size Analyses
Samples for particle-size analyses at Browndovn vere taken from the
clastic deposits bordering the organic material in Tube 36 and from the
clastic material in Tube 26, at the top of the sampled material. In
total 16 samples were tested and the results are summarised below, and
seen in Figure 50 ..
Table 19 Particl~~t=tdza Analysis of Browdown 13/14 53
Sample Altitude (m .. O.D.) %Clay % Silt % Sand % Gravel
16 -9.45 to -9.50 .13.2 (~) 23o6 (25) 6o.2 (15) 2.9 (-)
15 =9.65 to =9e70 18 .. 1 (+) 37.2 (75) 44 .. 5 (25) 0.3 ( ... )
14 -9,78 to -9.83 20o8 (25) 34 .. 8 (75) 44o0 (-) 0.4 (-)
13 =10.10 to=10 .. 15 50.,9 (75) 48 .. 0 (25) 1.1 (-) = ( ... ) 12 =10.25 to=10.30 55o4 ( 100) 44o4 (+) O.,J (-) - ( ... ) 11 -18 .. 90 to..-18 .. 95 44.5 (50) 55 .. 4 (50) o. 1 (-) = (-)
10 =18.,95 toc.19o00 51 o9 ('?5) 47o6 (25) o.5 ( ... ) = (-)
9 -19o00 'to=19o05 52.8 (=) 46.8 (75) Oo5 {-) = ( =)
8 =19.,.)5 to=19o40 11 • .3 (=) 45o8 (50) 37o1 (50) 6.0 ( ... )
7 =19 .. 40 1io=19o45 19.6 (-) 66o6 (25) 12 .. 7 (75) 1o2 (+)
6 =19.45 t0=19 .. 50 15o4 (=) 32,8 (25) 39.8 (75) 12.0 (+)
5 =19o50 ~19o55 11o6 ( ... ) 4Jo2 (75) 12.5 (25) 32e7 (+)
4 -19e55 ~19e60 20.,7 (.,) 41 .. 6 (75) 37.8 (25) = (+)
3 -19.60 to-19.65 17 .. 8 (=) 44o1 (25) 36.2 (50) 2.0 (25)
2 =19.65 to=19.70 15.3 (-) 25 .. 5 (25) 56.8 (50) 2.5 (25)
1 =19.70 to-19.75 11 .. 3 (-) JOoJ (25) J7o8 (50) 20.7 (25) I I
I l

r:E-:---~-- BR:WNDOWN 13/14 53 OQ
<" <<" <"
I ./' "'~""' ~~
PARTICLE -SIZE 0:::-'
<:'~" ,,f
""~
'?:::-'
'?.5 (l' -?-e.
1. ,_. J -9 4 Z9~L~..,.40Q
c . LLL -96
Zl jL • L L 420 I L. L
n~~~:.. -98
€
1
c~~ 460 lS tb -!!:. ~e. L. -10 2 S.I!:.ll...
24 [1, 'b_ 480 {1;, :t, ~.
10~':, '[1340 -1!1.•-:l.,
t ~~c. -19 0 I - L \. L
... -·-I. 1360 1 L I.- -
._ ___ -192
I 0 ~:: J 1380
I - -- =r ' ::::: l -19 4 , l . -. r 1400
l ~ ~ ~ 't -196
1 - . ~ 1420 I ~ - .
: ' - - '38
Groa '"' Sl S&S98S
c.,'"'~
'' T 11///////TIIIIIIIIIA//j
.. ~/,0'ff///~I.IIA
"r__:____r_-~.:.:-;:Wffff ffff//MI F '',
I
''~ -- I L'·,'-.Iill ~~ ·,, -~.- ', -,, -,,. ',
~~~ . r-.-. ::m t=~===============:J ~===:J I
I
"C 10 . --~-~ f- ___ ]
07 10•/. 10 ....
,, co
~'
,~
<-,'
VW~/ff/.11
f
~ff///////////&1// iz;Lzw/ff///.//////1
I
I
~ I
~
~~ ~~ I
~'""
,o c.,'> ,,f
""'
,o ,_,.. .~
co' :-0
~
,o c.,'>
L
~( •' .. ~
~~-
-~~-JS j
- 171-
The results outlined above display a few trendso The lower clastic
material of samples 1 to 8, below the organic material in Tube 36, has
a definite high proportion of sand and overall is a ve1·y coarse deposit
with a representative proportion of gravel also present. In general this
lover clastic material can be described as a sandy-silt, although clay
is also presento The clastic deposit above the organic material of
Tube 36, loses the gravel component and only traces of sand are present,
this can be described as a silt-clay. In Tube 26, again a pattern of
different sediments can be seem. Below the break in stratigraphy, the
material is a silt-clay, similar to the material above the organic strata
in Tube 36. Above this break, the strata become more coarse 'With high
proportions of sand and low elayo This can be described as a silty-sand~
Turning now to the samples taken from the same strata we see that no cl~
pattern is evidente Samples 1» 2 and 3 were taken from stratum 1, samples
4 and 5 from stratum 2 and samples 6 and 7 from stratum 3o We can see that
this is not apparent in the results.
The results of the Troels=Smith analyses of the strati:':.graphy of
Browndown 13/14 53 corresponds quite well with the particle-size tests
carried out on the core. Again it is apparent that the clastic material
below the organic deposit in Tube 36~ is of a coarse nature and can indeed
be described as a sandy-silto The clastic material above the organic strata
shows the same loss of coarse components and is composed of clays and silts
aloneo Again in Tube 26~ below the break in stratigraphy~ the strata are
similar to the silts and clays of Tube 36» and above this break the
deposits become much coarser in natureo Thus we co.n see a close correlation
between the two ahalyses of the stratigraphy of Browndown using particle=
size and stratigraphic analyseso

- 172-
3:5:3 Pollen Analysis
Organic material was only found in Tube 36 of Browndown 13/14 53.
The samples for pollen analyses were t~ken from strata 5, 6, 7, 8 and
9· Eight levels were sampled at 5 em intervals; l) -1385, 2) -1380,
3) -1375, 4) -1370, 5) -1365, 6) -1360, 7) -1355 and 8) -1350 em. A
pollen sum counted to 200 Lycopodium spores was made at each level. The
results of these counts are calculated as a percentage of the total land
pollen (TLP) and are tabulated in Appendix IV, being displayed in
Figure 51. Three LPAZ have been recognised in this core and are
outlined below. LPAZ B 36:2 has been subdivided into two on the basis
of changes in the NAP. The dry-land pollen data are based on calculations
of percentage trees plus group and are used for relative dating
purposes.
LPAZ B 36:1 -1385 em to ~--1378 em.
This first zone is dominated by herb pollen. The most important
tree pollen is Quercus with 11~ TLP at - 1385 em and Pinus with 5-4~
TLP at - 1380 em. The NAP is dominated by Corylus with 39.6~ TLP at
- 1385 em. Gramineae has 32.4~ TLP at - 1380 em while Cyperaceae has
13.5~ TLP at the same level, and at - 1385 em Pteridium show 9·7~
TLP + Sp. The major dry-land pollen comes from Quercus with 65.4~ AP
at- 1385 em, Pinus with 25~ AP at- 1380 em and from Ulmus with
19.2~ AP at - 1385 em. Ericaceae are only found here. Concentrations
are generally low throughout ''i th Gramineae having 19.5 x 10² grains/ cc
at - 1380 em, Corylus has 16.5 x 10² grains/co at - 1385 em, Cyperaceae
has 8.1 x 10² grains/cc at - 1380 em and at the same level ~uercus has
5·9 x 102 grainsjcc although the greatest record of Quercus pollen in
this LPAZ is found at - 1385 em. The upper boundary of this

!FIGURE ~1J
v~ ?>'"
c.,-5 -.-<::
Q"-q
~[!,[!,~ ~~~L L L- t_
- L L :..._
.v--
~ L '-~ L- L L ~)5C L , - Ll L L.. L -1
- L :r L-=---!....--
:: ~ -;:1 c-- -t ne.::
- L- Lt
L- L -l ~
Gr1d re1 s: 5.!:5-!:
L--~~
~'e'O>
-<'
Q ~0
-19-0
-192
- '? 4
BROWN DOWN 13/14 53
0 TREES
1.89 SHRUBS
&..-cvo "",<-.,<-." '~'t ,., /".1 " 1, "~ ~ o,.,
"/ "s "s '~'>,., "s +}~"s .J-/
~ C'"s ""s "s D HERBS
• AQUATICS
rs3 SPORES
0/o Total
s // -Y. ~ G',., ~~:t<>+ fi'Q '"' ~,.,_. + t<>,., ~(' ,,/,
~ (<>~(<> (<>.;>(<>
Land Pollen
,...., }
,_,e<:- ~ ',p J>'v
'-,. oq ..._o v.:.,c;
116 200 3 266 200
363 200 2b 362 200 - -
241 200 2a 566 200
222 200 1 154 200
(' C"C"-9('('('('0'-<:IC"~-t,.>OJ--<:1 -<:>s.,<-. .;...o o"..o-?.1~.,~/"v~"'-')l!l~+o/ o_, ~ :~-_..ot.;...o ti!' o/:o') /~
!!'" :o :o_~ ""- ~~ <">.;,.J-o "o /,,.,:J-.9. "o "t. 'o_ ~ ...... ~~ "',,:, :J-4.. ~ ('~ ~ o.-o (' i>) 1!1 <::> ;o ~ o, / ~ <::> ''o v/ ~., 1-
('(0> s,t~'t "/. 't "<» ~.;.. oO<~"'- "'- "" ,., ~.;.. :9. O!l? "-?.1 '<- "-?.1 s ~l'> ~t<> ~t<> "s .J-.o " -;~ ~ <'!!' <'",,/"s ~<' //"!!'to~" ".1
t. -~ 't t<> rt<> <'"' O!l"' 1!1 l'>~ ".1 " st/ ""6 ¥ :J-.ol'> ~ ... ""l'> "' 'o/ ,.,
r M J s

- l7J -
first zone is placed where tree pollen decreases and also spores begin
to decrease. Here Pinus pollen falls from 5.4~ TLP to 1.8~ TLP,
Corylus increases from 22.5~ TLP to 35·9~ TLP, Cyper&ceae drop from
13.5~ TLP to 2~ TLP and Pteridium also fall from 1·1~ TLP + S to 1.4~
TLP + S.
LPAZ B 36:2a ~--1378 em to ~·-1367 em
'l'his sub-zone is characterised by a dominance of herb pollen with
the first appearance of aquatic poll en. ~uercus is still the most
important tree with 11.3~ TLP at -1370 em. Gramineae are the most
important NAP with 39·3/b TLP at -1375 em while at -1370 em Corylus has
36.3~ TLP. The major dry-land tree pollen comes from Quercus with
61.4~ T at -1370 em and Ulmus with 13.5~ T at -1375 em. Here the first
Fagus, Ilex, Plantaginaceae, 'l'ypha angustifolia and Sphagnum are seen.
Concentrations have risen here and Gramineae have 59·9 x 102 grainsjcc
at -1375 em, Corylus has 54.8 x 10² grains/cc at the same level and
again at -1375 em Quercus has 14.1 x 10² grains/co. The division
between the two subzones is marked by a rise of Corylus from 36.3;<> TLP
to 50.8~ TLP, a fall in Gramineae from 34·5~ TLP to 23.9~ TLP and a
decrease in Pteridium from 3-5~ TLP + S to 0.6~ TLP + s.
LPAZ B 36:2b ca.-1367 em to ~--1357 em
Shrub pollen dominate for tha first time in this sub-zone, and
spores decline to a mir:irr,um. ~uercus is again the most in1portant tree
pollen with ll.l)b TLP at -1365 em. Corylus is now the dominant 1\AP with
50.8~ TLP at -1365 em and at the same level Gramineae have 23.9~ TLP
while at -1360 em Chenopodiaceae rise to 5·3~ TLP. The major dry-land
trees are Quercus with 64.5)b T at -1365 em, Ulmus with 24.2~ T at -1360~m
and Betula _.with 14.5~ T at -1360 em. Hedera, Caryophyllaceae and
Myriophyllum pollen are only found in this sub-zone. Concentrations are
"l. ag&in high with Corylus showing 49.6 x 10 grainsjcc. Gramineae has

= 174=
2.3o.3 x 102 gra.ins/ec and Querc..JM bas 10 .. 9 x 10²
grains/cc. The upper
boundary to this sub-zone is placed where tree pollen begins to increase
as do spores and aquatic poll~n. At this boundary Quercus rises from
7oO% TLP to 19 • .3% TLP and QgrylY§ decreases from 48o.3% TLP to 31.7% TLP.
LPAZ B .36:3 ~o=1357 em to =1.350 em
This last zone sees the return of herb pollen as the dominant life
formp although tree pollen is at its maximum presence. Quercus is the
most important AP although it has fr,llen to 34.8% TLP at -1.350 em,
Gramineae has 29o3% TLP at -1.355 em and Pteridium rises to 7.4% TLP + Sp
at -1.350 em. The major dry-land tree pollen comes from Quercus with 65%
T at -1.355 em and from Pinus ~th 14.8% T at =1.350 em. Four species are
only found in this zone and these are Cruciferae, Saxifragiaceae,
Convolyulus and Potamogeton. The concentrations in this zone are low
with £2Iylus having 22.2 x 10² grains/cc, Gramineae having 20.6 x 10²
grains/cc and Quercus with 1.3.6 x 102 grains/cc.
These zones correspond quite well with the litho~ogical boundaries of
the core. LPAZ B .36:1 represents stratum 5 and the lower level of stratum
6~ where herb pollen is the dominant life group with ~uercus the most
important tree pollen and fgrylus the most important NAP. LPAZ B 36:2&
corresponds to the upper levels of stratum 6. Again herb pollen is most
important with Quarcgg the dominant tree pollen but Gramineae now being the
dominant NAP. Aquatic pollen first appears at the boundaryhetween strata
6 and 7. LPAZ B J6;2b represents stratum 7 where shrub:pollen is the
dominant life form with Quercus and fQrylYg the most abundant tree pollen
and NAPo The last zone can be said to represent stratum 8 where again
herb pollen dominates together with Quercus and f2Ay~o To summarise:
this core is dominated ~ herb pollen except in stratum 7 where shrub pollen

- 175-
becomes more important. ~uercus is the most important tree pollen
throughout the levels and Corvlus the most important NAP except in
stratum 6 where Grrunineae are dominant. Aquatic pollen is only found
above stratum 6, in the upper transitional peaty-silt.
Dating of LPAZ at Bro•wdown 13/14 53·
'l'he organic deposit found at Browndo1m ranges in altitude from
19.01 m.O.D. at- 19.38 m.O.D. and it is the deepest organic deposit
found in this study. Four LPAZ are recognised ru1d are outlined below
with their major characteristics.
Table 20 Dating LPAZ at 5rowndown 13/14 53.
Flandrian Altitude Depth Dominant Dominant Dominant LPAZ
Chronozone m.O.D. em life group AP NAP
-19.0 to -1350 to B 36:3 Herb Q-P Co-Gr-Pt
-19.1 -1357
-19.1 to -1357 to B36: 2b Shrub Q-U-B Co-Gr
-19.2 -1367 ld
-19.2 to -1367 to B36:2a Herb ~~-U Co-Gr-Pt
-19.3 -1377
-19.3 to -1377 to Co-Gr-B 36:1 Herb ~-P-U
-19.4 -l385 I
Pt-Cy
~=3:uercus, P=Pinus, U=Ulrr:us, .3=Betula, Gr=Gramineae, Pt=Pteridiu;r;
and Cy~Cyperaceae.
Tree pollen is very low throughout the levels of Browndown 13/14 53
with a dominance of shrub and herb pollen shown by Coryl us and Gr2.1llineae
pollen. These LPAZ are thought to belong to the late part of Flandrian
Chronozone I, probably Zone Id before the rise of tree pollen. This
Chronozone has been dated from 8196 ! 150 to 7107 ! 120 BP (West 1970).
~ 176 =
The expamsion of ~lB§ pollen being complete, together with the
presence or Quercus pollen in large J_U9.1ltities and the relatively
poor representation of Alnus pollen indicates a . correlation with
Godwin's Zona VIb which is post 8~000 BPo
3:5:4 Diatom Analyses
At Browndown 13/14 53, nearly all the strata were sampled for their
diatom content (see section 3:5:1). A total of 31 samples ~ere taken
but of these, only 15 yielded enough diatoms for a representative counto
These levels were taken at 10 em intervals from the upper levels of the
organic material and the upper clastic deposit of Tube 36, the whole
of Tube 28 and the lower clastic deposit, below the stratigraphic break,
in Tube 26e The levels are 1) =1363, 2) =1353, 3) =1346, 4) -1340,
5) -665, 6) ~55, 7) ~45, 8) -635, 9) =595, 10) -585, 11) -57~,
12) -488, 13) -478, 14) -468 and 15) 460 cmo A count of 200 diatom
valves was aimed at but this was rarely achieved due to the paucity of
diatom valves present in the levelso A record of these counts is given
in Appendix V and can be seen in Figures 52 and 53. For ease of
description and interpretation, these data have been dra·.n up on t~o
graphs; the first represents the diatoms of Tube 36 (Figure 52) and the
second the diatoms of Tubes 28 amd 26 (Figure 53)o These will be analysed
separately and the information obtained from these analyses will be
compared at the end of this sectiono
1) Browndown 13/14 53 Tube 36.
In Tube 36 of Browndown 13/14 53~ four levels were examined for their
diatom content as described above. A total of just 15 species of diatom

[ FIGURI::_2?j
,~ <-~ ?;" '-'<:'
,~ if~
10 I L!, '11340 lb•!',. 9 f!:.!!::, '-
L(',!',(',
- L L L
8 L- L L
..... 1..- -
~.. ......... -' - L L L ,360
-- '- -
10 I , !b ,
1
1340 (',L[b
9 !bib' l..~~lb
- ..._ L L
8 -- L -
L ..... - '
L. L L-
7 - I.. L L 1360 L.- - -
1(',"' - !b
c:· ~ ...
,<f <-"'
-190
-190
' 3
BROWNDOWN 13/14 53 -Tube 36
VALVES
8 8M MB M 8M
'?!ifJi?/): . . ~ rt/;;;;;;;:-:· /;' -~ -~~-;·· }({: /3::' ___ ·/ . ' ' ; ;_-;:// •. .·, •/ '• .. •// . ' >/ . . ;/.·// ' ' '/
/•''/// / ,1-//,/_/ '; ', /-
(~ii;1;';;;:::/;::~~; :::·· . . . . . </>;>/:';(; --~{:,:////;/~///,~"/; '•, /,//,; .· .· ' "~/.' ....
DIATOMS
b8 bM b" p
/:W~i%~1#~ /// /// /Zf, ' , , ' /~:;:;_ '/ // ---' .;//.///,;: ;./::_;.'//c/·-··· .· ·: --- //
·1· r IIIIIBm~ ~"'
"Q
2 1b
1a
L_L_L_~L_L_ ~~~~
fl;;i~f~c~:,J .=t:tk=t ~ ~
SPECIES 8 8M M8 M
~ Ofo TOTAL VAL.VES
BM
n;0_::/ -{~.·-.·:~· '-',' / //:.;:/_ ///---: :;_ ,-;:/;%; :·--:-·. 0'/_0 . / /,~_..
f--- 8 -------i tBM~ I---M8---i 1------M -----1
150 2 200 1b
b8 bM
nd[?~:~,,~ /.-,</./· ·>:/·,/., /';/// /. ;/ '•
~/_%;-,%/ ;J, ;:-..::
Sa!1nlty :lasses
~ 8 [] .
b" p . /·/·F .. _ 2
1~~~~· / /' . ' />>/ ___ _)~ / ,·' --.----
. /
..• ·:_/,~ 1a
BM D MB 0 M 9 I::.~[!:, I.
--~[!:.!b
10 j"'. - !b c~ '34C - 19 0 - - -1- - -------
- L. - -
8 \ L- .._ '--
~ ~ ~ .:! , 1-= ~ ~ ~ r , 3 5C
Gr•CI r•l s;: '58'59e5
' I "~ 1-
'tL-~ i"Hl lOt. _J___J._j~
1-~t-:~~s ("'"/~('-'!~,..~
<)('>A 1.>,_ ~.9 .... ,..~(-v~ ....
" 's
1- o, ('Q ~1 "1(' )'1 ~ 1> G'A 0.o ('Q"" "' .ov.., ;o/o C'C' ~.a t,...., ~,. "?~:~s ~"'> t"~sC"',..~/o "-(II
C't "~ o..,~o %~s o ("'-?..,.., c "'os,..,... s,. ~,. "s t",.. ?t" ~s,..O~" ~ ~~ ...... ~ 0:.. ~ ,.. ~ o; s s "..r ('1: ..r,..,... q)..,g,...% .0~ ..r("' sv
O'J... C'v 3v,... "s o::i' ·?: ql.., "o ..... r ... ,.. ':.~ /c-o::i' ""~ ,..~/ ... ,..... v-:'1 o--t"~ .,Y~ ~ "("'~ -?,..1 to:;
·v;/~ O"y~~ ... ~..,ot~ s~..... "o--"'s I l'll-? ,.. .0(1:1 "s s L-?. ?1
~..,~ ... ..,o::i'
130 Eco1og1ca1 Classe-s
1a 187 B b Q e 0 p
;- <o otql/ "9._:-
t-q)/L-
"s
FMJ 5

- 177-
vere identified in this tube and none of these were Fresh types. 12 species
were Marine and 3 were Brackish. The four levels yielded 667 diatom valves
and of these 215 were Marine and 452 were Brackish. Thus we see that
although there are more Marine species present in tube 36 the greatest
number of valves are Brackish types.
There are three dominant species; Nitzschia nayicu1aris (B b) with
404 valves, Melosira sulcata (M p) with 121 valves and Nitzschia punctata
(BM b) with 45 valves. The swnmary diagram (Figure 52) shows relatively
constant features. Overall Brac~sh valves dominate throughout the
levels, although these decrease to the top of the levels. These valves
are dominated qy benthonic types. The species are dominated by Marine
types and although the benthonic species are not as abundant, they do
dominante the levels. Planktonic species increase to the top of the levels.
These levels have been segregated into two local assemblage zones Yhich
are described below. LBAZ B:1 has been subdivided into two sub-zones.
LDAZ B:1a -1363 em to ca.-1349.5 am
Three species dominate this first sub-zone; B.nayicularis with
64.6% of total valves (TV) at -1353 em, B.punctata with 11.8% TV at
~1363 em and M·su1cata with 20.8% TV at =1353 ern. The upper boundary is
placed where Y~rine species begin to increaseo The sub-zone is dominated
by Brackish valves and Marine species. Benthonic types dominate both v~lvea
and species. Planktonic species increase to -1353 em.
LDAZ B:1b ~.-1349 em to ~.-1343 em
This sub-zone is dominated Q1 B.nayicularis with 68% TV and M·sulcata
with 12.5% TV. The upper boundary to this sub-zone is marked by a decrease
of ~.navicularis from 68% TV to 42o7% TV, a rise in ~.sulcata from 12.5% TV
to 33.3% TV. At'. this boundary Mar-ine valves begin a rise together mth a

- l?B-
rise of Brackish species. Again wa see that Brackish valves but V~rine
species dominate this sub-zone, while benthonic valves and sp~cies are
the most important life forms.
LDAZ B:2 ca.-1343 em to -1340 em
This zone is again dominated by M.nayicularis with 42.7% TV,
,M.sulcata with 33.3% TV and M.punctata 'With 6.7% TV. Brackish valves are
again dominant but Marine valves are rising. Marine species are the most
important but the life form diagram shows that benthonic Brackish types
are dominant. Benthonic types dominate this zone although planktonic types
are on the increase.
These zones agreed well. vith the lithological divisions of this
tubeo LDAZ B:1a corresponds to strata 7 and 8. LDAZ B:1b reflects the
diatoms of stratum 9 tmile LDAZ B:2 can be said to represent stratum 10.
2) Bro~~down 13/14 53 Tubes 28 and 26
In tubes 28 and 26, 11 levels were examined for their diatom content.
These levels have been described at the beginning of this section.
A total of 29 species have been identified in these levels. The
ratio ofF : B M was 3: 5 : 21. In all, 1302 diatom valves were counted
and again the F B : H ratio wa 49 597 : 656. We can see that Hl'lrine
valves and species are the dominant types throughout these levels.
Three species ~re identified as being dominant; these are
Nitzschia navicularis (B b) vith 506 valves~ Helosira sulcata (M p)
with 328 valves and Diploneis ~ (NB b) 'With 148 valves. Looking
at the summary diagram for valves (Figure 53) ve see that Marine valves
dominate at the base of Tube 28, up to -655 em but above this Brackish
valves are most important up to ~575 em. It is interesting to note that
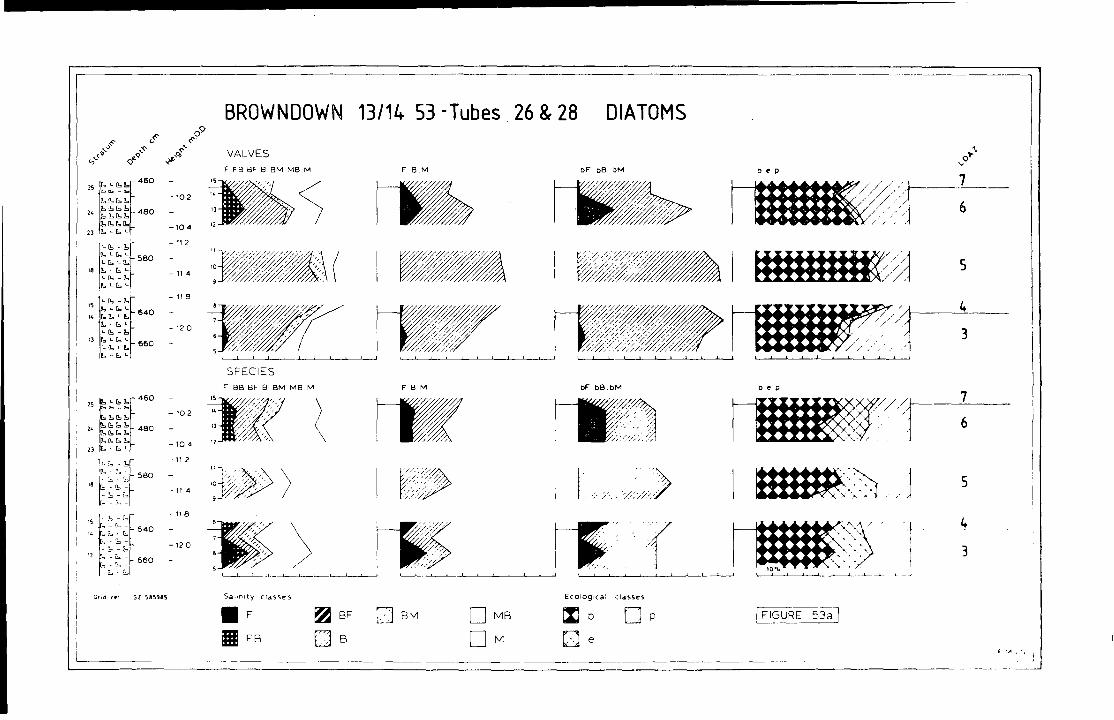
c.,'-'
_,<" .....
<!"' OQ
" <" ..... ~ ~ ..... Q~<i -<f-'o;
2SI •!', L[l,[l,~46Q -1.'.:>1.'.:>'-l!::o
~.1',1',1', -102
24 11',1',1',1', 480 1',~1',1',
J!,J!,[l,l', 23 lib ... tb ... -10 4
-112
'(b L tb L L[l, L[l, 580
BROWN DOWN 13/14 53- Tubes 26 & 28 DIATOMS
VALVES
F FB BF 8 BM MB M
~ :::BV~ <; I
F B.M bF bB bM
r. b ~ p
L[l, l[l,f
16 !(h. L {b L
L!!::,L(b ~Ll1:,L
:~~0j}Jj!&f!!:lfjjj::) ( -114 9 ~$$"&:\ 1 ... I ~~~HJA I tllllllllll~:jj
IS jL 1', L [l,r - 11 8 (bL{bL 14 lb lb, L 1b, 640 -
(bL{bL ,L(bL{b -120
I) lib, L lb, L L lb, L 1b, 660 (bL!!:,l.
~L"'
lb.lblb -102
24 ~~~ 480
1S! L lb,lb,~ 460
[l,lblblb. I 23 ~ [b L - 10 4
' ~:, .. J!,~ -112 ~ ~ nL 580
I ,. -~~J -114
! IS f[~ ~ ~ ~r~ -11 8 I "' .. !'- L
1 1.. r= ~:::. l lb 640
I -:!::, L
\] ~- ~ ~ ~ - 12 0
I ~. '}:, ..._ 660
-"' - "· l Gr1d r•!
I I I I
Sl 58~985
L_
:~•,;:·-~~/r ;0./ s 0,:?#/;
SPECIES
F BB BF B BM M 8 M
11s ~,of/,,• ( ~;<,_->' / '
12 '~ ~~~-
::tJ-!0:\) ._.¥/
-~', \ '•
' / s /
/~~-.{(# :;gffi:;:i-;;¥ ~#;;?~/
FBM
~ I~~
I r'//,',_/~'•/; /~~-~ ::~-~.-:-' :;'~~;;;;~··'/
bF bB.bM b ~ p
~///j
I t· .;. /: :c~///.~-> I 11111~:~ . J
[--I : · ·.(· I IIIII~"~- .. ·+-1 •• ' \J ~;<:> i
l___.l____1__.. _J. _ ____j____l__.J.__l.__l__.....l._...j ~~ __.&,.___J._ __ .. L--'
Sai1n1ty classes .F II FB
~ BF
UB [] 8.V1 D MB
OM
Ecologrca: ·: lass.es
~b Do Qe
I FIGURE53a]
.,. ... vQ
7
6
5
4
3
7
6
5
4
3
~ 'A J ~. I

I FIGURE 53b I
v~ 7i"
c,'-< .s
<Ji~
'-~
25 lib ~ ib ibf 460 ibibLib ibibibib
24 lib ib ib ib ib ib ib lb 480 iblhlblb
23 Jib L [b L
ib ib L [b~ 19 lib L ib L
Lib L [b 580 ibL[bL
18 I L lb L ib ib~ib'-
Lib Lib 600
15 lb c lb Lr Lib Lib, 14 ib L [b ib 640
LJbLib, 13 ib L [b L
LibL[b 12 ib L lb L 660
~ lb L C.
G"d ret SZ 585985
0 0 ~
~'" ~tt-'~
-102
-10 4
-11 2
-11 4
-118
-12 0
15
14
13
12
11
10
BROWNOOWN 13/14 53- Tubes 26 & 28 DIATOMS
fFH-FB-i B f-BM~ MB M-------1
r!"rr ~~t=l=h=ITTTT'IIh"l~llllllll' ~· 'C 1-+-'
4-1 4-1
>+< 1-H
...., ~--~
>--+--<
jH 1---+---<
H-i
~ 1-H
..--+----<
... ,,.. 1,..._.. 111~1~~~~ IH-1
t ... iH
,.._.
>+-<
....
>+<
>-+---'
i !'-+-
[ I
'"
.....
'" ~ t l~
~ t ~
>-+-<jt<
~ 1-H t >-+-<
t f -~ 1>-
1+-1~ .........
r 1-t-1
1-H
I ~ tl~+-< ....
6 -b---~ ~ ~ ! llTIIfltLLrrlLL1 11 ~ ~~ ~~L.u~~u~~~. , tlLLltL - Ll[ , .'=.l fl-; t----t-------1
>-+--l
-12 2
~ 'V "V· ~ ()~ "<>< -'t.-/t.,s ">_, "'o :9,;,. <'v/ <'~ "~ ""' <»,., "' '<»
,...../'$ .... s .... ~ .o(Q,.... "~ _, o~.- 6,.,"' "'.9,.,'-'<'
/<'~ "'/,s 1:-sl' /,.,_,<--~,., ~rr -;..~ <r
-'<.-,., <"_, o,
(' -?~ ~(' ()~/. "'/o % <'s 0">,.
""' "'/. <'.; /s ~'s 0o "Q) o-,....o /c$1 .¢" ;0',
""'.9/6 "<'. -, os_, ~('>_.,'<»~ ~
"~
1-"' ~ (), -?~ -? "(' ~ 1q, ~· ~ G',., G' G' o.., ~ ~ ('0 ()_ ~ '-, <'<' ;o/o ~ s" <", "'/ ~· t., -'<' ~,..,. o<' s"' "'.o ~ oco sr ;o/o (10/o r" o _, '? ",;.. "o~s <'" s<' . ~ -~<""'-:;, '? 'o s, /" ? s, ~ ""' "',s· o_, "'/ ::ot s,o· ~ ~,. "- "' ?, <",., o,.,:»,..~ ... ., o_~'/s ""~ / ('> / J, "' ,., t, r •/t ~ ~ v/ ~
"> s s s,;s <i' <'~ s,,., ~ ... ,..9,., s %.;"' ,_, _,">,.,.st. sr 60 sv/ ~",.<'<.- '/:,)'?, "s ~ ,_,('> ~? <i'~ o,., <i' '->,.,'1~ "'% "s "> <'.;>
"~ ('('> .;, ;o~ " 0'"' 0' (,/ ... ,., ~ '?_, s, 3\. ?, ¢" t., ~(., /~ "o: ("/:.J....I' ~t s ..,.. 'OJ' ~ .... t/. s
"' ... ,., <.-,;o,. ~ "' '->,., v,., 0'.:, OS ·~t::?s '?~ o.o_, S
s o,..
~
"">
't-(10 st/
'li' .,_o"
86
192
199
95
69
91
179
173
57
50
111
r."' ,..:. _.'li
,_"v <J v
7
6
5
4
3
FM J S

- 179-
the levels of Tube 28 are all dominated qy benthonic Brac~ah types.
Tube 26 has Marine valves as the dominant forms throughout the levelso
Fresh valves are found below the stratigraphic break in Tube 28 and also
in Tube 26.. Benthonic valves dominate the life fmrm diagrams. Marine
species are dominant throughout all the levels analysed here as are
benthonic forms.
These data have been divided into five local asse~blage zones of
diatoms. Some of the zone boundaries are imposed qy the nature of the
sampled material ~ere breaks in the stratigraphic record occur. These
zones are described below.
LDAZ B:3 -665 em to £!.-640 em
This zone has four dominant species: J!.navieular.ia. with 45.6% TV
at -645 em, ~-su1cata with 37.8% TV at -665 em, Melosir§ westi (M p)
with 10.5% TV at -645 em, and~.~ with 9% TV at -665 em. The upper
boundary is marked by a rise in~-~ from 1.8% TV to 13.9% TV and a
fall in M.sulcata from 26.3% TV to 10.4% TV. This zone is characterised
by a dominance of Marine valves at the base which changes to a dominance
of Brackish valves at the top. Fresh valves are only important at -655 em.
The species are dominated by Marine types with constant Brackish species
and fluctuating Fresh species. Benthonic types dominate the valves and
species ..
LDAZ B :4 .ru!,.-640 em to -635 em
This zone has three dominant speciesJ B.navicularis with 60.1% TV~
Q.~ with 13.9% TV and tl.sulcs.te, with 10.4% TV. The upper boundary is
artificially imposed by the break in the stratigraphic record of the coreo
Brackish valves dominate this zone but Marine species are present in the
great~st numbers. Benthonic valves and species are most importqnt with
decreasing planktonic valves and decreasing epiphytic species.

- 180-
LDAZ B :5 -595 em to -575 em ·
This zone is domin~ted by B.nayicu1aris witl~ 61.5% TV at -595 em,
tl.sulcata 'With 19.8% TV at -585 em, Q.~ with 11.6% TV at -575 em
and Nitzschia Runctata (BM b) with 9.9% TV at -585 em. No Fresh species
are found in this zQne. Brackish walves dominate throughout with a slight
increase of Marine valves to the top of the zone. ~~rine species are the
most important here. Benthonic valves dominate but benthoni~ and epiphytic
are equal at the base of the zone before benthonic species become dominant
at the top ot the zone.
LDAZ B:6 -488 em to £&.-464 em
Five species are very important in this zone; ~.sulcata with
42.2% TV at -468 em, ].navicularis with 32.6% TV at -488 em, Q.~
with 17.2% TV at -468 em, Diploneie ovalis (FB b) with 14.1% TV at
-478 em and TrachY,Ueis ~~ (M b) with 10.5% TV at -488 em. The upper
bo~~dary is marked by a rise in M·~unctata from 3.1% TV to 16.3% TV, a fall
in ~.sulcate from 42.2% TV to 26.7% TV, here also Q.ovalis dies out and
Fresh diatoms decrease. Marine valves and species are dominant in this
zone although Fresh vnlves ahov a peak at -478 em. Benthonic valves and
species are most important with planktonic valves increasing to the top of
the zone.
LDAZ B:7 ~.-464 em to -460 em
This last zone is dominated by Q.~ with 27.9% TV, M,sulcata with
26.7% TV, ll.pypctata with 16.3% TV and fl.nayicu1aris with 14% TV. Marine
valves and species dominate, with a dying out of Fresh diatoms. The
valves and species are dominated by benthonic types with a decrease of
planktonic types and an increase of epiphytic species.

- 181 =
These zones correspond vell with the lithological strata of the core.
LDAZ B:3 corresponds to strata 13 and 14 where M.navicuJaris is the
dominant species. Marine species are the most important here but the
valves are dominated br Marine types at the base passing to Brackish
types at the top. LDAZ B:4 correlates with stratum 15~ again
N.navicu1aris is the dominant species with a dominance of Brackish
valves and Marine specieso The zone LDAZ B:5 can be said to represent
stratum 18o The only difference between this zone and LDAZ B:4 is that
the former zone has no Fresh diatoms. LDAZ B:6 corresponds to stratum 24
where ~.sulcata is the most important species and the valves and species
are both dominated qy Marine types. The last zone represents stratum 25
where Q.~ is the most important species and again the valves and
species are dominated by Marine types.
When the two diatom analyses of Tube 36 and Tubes 28 and 26 are
examined we see that up to LDAZ B:6g H.nayiculari§ is the dominant
species and the zones are all dominated by Brackish valves and Marine
species. The upper two zones 9 6 and 7~ have M.sU}cata and Q.~ as
the dominant species with Marine valves and species as most importanto
Thus we see that Brackish diatoms are most important in Tubes 36 and 28
but Tube 26 shows a dominance of Marine diatoms.

- 182 -
CHAPTER 4
FLANDRIAN SEA-LEVEL CHA.NJES ON THE SOUTH COAST
4:1 REVIEW OF LITERATURE
There are very few studies of Fla.ndrian sea levels \oJhich are
concerned with the South Coast region of Britain. As a result of
this, literature dealing directly >'fi th sea-level studies and ir.dire:::tly
by polle~ analyses are dealt with in this review. The information on
pollen studies has been included when the stratigraphic position of
organic material is relevant to sea-level studies. A:l sites
mentioned in this review can be located in Figure 2.
4:1:1 Review of Literature on Sea-Level Studies.
There are a nw~1ber of factors that explain the few studies dealing
directly with sea-level fluctuations on the South Coast. A deficit
of swn.rner precipitation along the South Coast hinders the development
of blanket bogs and of peat and thus lici ts the availabili t~' of sites
that can be used to reconstruct past environmental condi tio!"~s. The
South-East of &1gland was beyond the limits of the last glaciat~oL
m:d so no major gl~cial features were eroded in which sediments could
accumulate. The geological nature of the South of England is such
that the major rock types are of a calcareous nature. These are
alkaline which is detrimental to pollen preservation. The long history
of nan 1 s occupation in the region has lead to the cutting of ·,.hat peat
there was, and enclosure and farming have resulted in oxidation of what
peat survived. Nevertheless, organic material has survived in valleys
v!here it has been buried by colluviuJ1 'lnd in the flood plc.i:1s.

- 183 -
A number of authors in the Nineteenth Century encountered
features associated with ~ast sea levels. Ja~es (1847) noted forest
layers exposed in excavations at Portsmouth Dockyard at altitudes
of- 0.6 m.O.D. and- 4.1 m.O.D. 'dhich 1vere overlain by a blue,
silty-clay. Lyell (::.85.3) describes the coastal Flandrian succession
of deposits along the South Coast. 1-ieyer (1870) again noted the
presence of a blue clay at Portsmouth 1vi th an inte:::-cal a ted deposit
of roots and trees in situ between- 5 o.O.D. and- 5·3 m.O.D.
Reid (1893) discovered organic horizons at Stone in Hampshire and in
the same year Shore (1893) noted gravels overlain by estuarine mud
deposits in the southern part of Southampton Water.
Levlis and Balchin (l9!JO) studied storm ridges at Dungeness and
used -':-he:Jt as indicators of past sea levels. They noted that Drew
(1864, in Lewis & Balchin £12.· c: t.) had recorded the levels of older
storm ridges at 6' (1.8 m) below that of present-day storm ridges,
but he had ascribed these to variations in tidal r~~ge and not to
sea levels. The study made by Lewis a~d Balchin showed that sea level
was 5' to 6' (1.5 to 1.8 m) lower in Roman Times, appo:::-oximately the
same as present in the Thirteenth Century and l' (c'.3 r,,) lower in the
Eighteenth Century and that the annual o:.veTage rate of advance of the
Dtm?;eness foresho:-e vias ca. 8' toll'/ year (2.7 to 3.6 mjyear).
Godwin, Suggate and Willis (1958) found freshwater peat overlain
by marine clays at Lo1.,rer Harnwortby ( SZ 005 902) at an altitude of
- 11.5 w.O.D. which was quoted as being aged 7340.:!: 110 BP (Q lEn).
Infact the date of Q 181 as quoted in Radiocarbon (19 ) is
9298.:!: 100 BP at an altitude of- 12.8 m.O.D. This has led to great
con~usion in subsequent literature where the earlier date has been
::j_UOted.

- 184 -
Gilbertson (1967) was one of the first to do a detailed study
of .sea-level changes on the South Coast. Two sites in Dor .c:;et at
Coldharbour River ( SY 897 894) f_nd Keym~orth Farm ( SY 9 39 391) v:ere
investigated. The results of the analyses of deposits at these two
sites led to the conclusions that ~·7340 BP ~he sea level was
- 11.4 rn.O.D. There followed a period of rising sea level to - 0.9
m.O.D. by ~· 5500 BP, which was follo1·1ed by a fall of sea level tel
- 4.8 m.O.D. by~· 3800 BP. Finally -the sea level rose to its
present position by ca. 2500 BP.
Devoy (1972) carried out a study of sea-level fluctuations at
the Western River Yar (SZ 3485 8927) on the Isle of \'light and at
Southsea (SZ 6505 9866). Stratigrap!lic analyses of these boreholes
showed that peat growth began ca. 4750 BP, indicating a marine
transgression at this time. The peak of sea level was reached by
§• 5500 BP with an altitude of - 3 m .0 .D. which was follo·1.,red by
a fall to - 5 rn.O.D. at ~· 4500 BP. A less rapid transgression of
sea level ensued from ca. 3500 TIP to r-each - 1 M.O.D. by £.§:_• 2500 BP.
Hodson and West (1972) worked on deposit2 at Fawley (SU 477 026).
The thickest (3.35 rn) and best developed bed of p<3at at Fa-.dey is
fot;.nd above a succession of freshwater clays. The uppm· part of the
peat is dated as 3689 ! 120 BP (~ 831) at an altit~de of- 2.7 m.O.D.
'l'he authors found more than 7 rn of sediment had been deposited on a
surface which has been submerged to - 7 rn.O.D. since 6366 ~ 124 3P
(Q 834); the average rate of submergence being given as l cm/100 years.
The sea is first thought to have entered Southrunpton Water early in
the Flandrian before ca. 6366 BP.

- 185 -
Poole Harbour was the area examined by Byrne (1975). Two
sites at The .Moors (SY 95 87) and Slepe Moor (SY 95 86) were
analysed. At Slepe Moor the analysis of borehole sediments showed
an abrupt truncation of peat growth at - 1. 0 3 m. 0 .D., dated to
ca. 6500 BP, which could be indicative of a transgressive period of
sea level. A sea level of ca. - 0.45 m.O.D. was given at ca. 5000 BP.
Evidence from The Moors site shows a fall of sea level to ca - 2 m.O.D.
by ~· 3800 BP followed by a transgressive episode ca. 2500 BP when
sea level was at or just above present level. The final transgression
at this site had receded by ca. 1300 BP.
Dyer (1975) worked on the ancient 'River Solent'. He found
evidence of a sea level at - 6 m.O.D. ca. 7500 BP and at ca. 3500 BP
the sea level was - 2 m.O.D.
Shephard-Thorn reviewed the data available on the Quaternary of
the ~eald area. Terrestrial periods were stated as being 10,000 to
8000 BP, 6000 to 3000 BP and 3000 to 1500 BP. These are very
generalised periods based on few 14c dates and give no clear
indications of sea-level movement. This review was compiled in 1975.
Cunliffe (1980) published a preliminary report on the evolution
of homney Marsh. he proposed that during the early Flandrian
transgression of t;ea level a wide, shallo>-: bay was created between
Fairlight and Hythe which eventually silted-up into a lagoonal
environment with a protective sand bar -The Midley Sand- to seaward.
A shingle spit formation began to accumulate on the seaward side of
'The l>'!idley Sand. Various periods of rising and falling sea level are
recorded in the marsh sediments behind the barrier including the
deposition of a 'forest layer' of Oak and Birch, dated 3340 ~ 92 BP
(NPL 24) and 3020 ± 94 BP (NPL 23). The shingle barrier was breached

- 186 -
ca. 1550 z 120 BP (NPL 25).
The course of sea-level movement ins. Britain was reviewed by
Jones (1981) during the Flandrian. He postulated that during the
early Flandrian sea level rose from below - 100 m.O.D. ca 14,000 BP
to - 20 m.O.D. ca. 8000 BP. The sea advanced quickly up the English
Channel and through the Strait of Dover by~· 9600 BP with a final
separation of Britain from mainland Eul'ope by ca. 8600 BP, the present
shoreline configuration of Southern England being attained ca. 6000 BP.
Jennings and Smyth (l982a) studied the South Coast sites of
Langney Point (TQ 64 01), Lottbridge Drove (TQ 61 01) and Coombe
Haven (TQ 77 09) and compared them to the study made by Jones (1981)
at The Vale of Brooks. These authors state that a peat deposit at
Langney Point is found between altitudes of- 27.1 m.O.D. and
- 27.0 m.O.D. and is dated from 9510 ! 75 BP (SRR 380) to 8760 ~ 75 BP
(SRR 379)· The authors believe this peat accumulated landward of a
coastal barrier during the early rise of Flandrian sea level. The
barrier was transgressed by the sea by 8760 ± 75 BP. At '1he Vale of
Eroo!:s an extensive peat deposit was recognised with intercalated clay
layers and is overlain by silts and sc:J-cis which have been identified as
having a marine origin (Jones op. cit.). The authors assu;ne the
intercalated cl~s are the result of breaching of a coastal oarrier.
Tnus at The Vale of :Brooks a trans.sressive overlap is posttJ.lated at
3190 ± 125 BP at an altitude of- 2.3 m.O.D. due to a breaching of a
coastal barrier. This paper initiated a lively debate between various
authors in the following years.
Burrin (1982) 1...orked at The Vale of Brooks, Littlehampton (TQ 62 02),
Shoreham (TQ 20 06) and Cuckmere Haven (TQ 51 97). At The Vale of
Brooks a freshi-iater deposit of sil ty-cl9.:J with pest intercalations .:md

- 187 -
freshwater shells overlies the marine silts c;.nd sands above the peat
found by Jennings and Smyth(££· cit.). The peat itself is desc:ribed
as 'generally discontinuous' with interbedded silty-clays. It is
su:;gested thc:..t these silty-clays are due to f_;_uvial processes and not
to barrier breaching. 'l'he peat deposit at Langney Point is given an
altitude range of - 24.8 m,O.D. to - 28.3 m.O.D. in the present paper
and the author concludes that no evidence of offshore barriers has been
found on the coastal uargins of the Southern Weald.
Jennings and Smyth (1982b) reply to the preceding paper by
re-emphasising a number of points from their previous paper (l982a),
including the possibility of barrier breaching at the Langney Point
site. Evidence is given from particle-size, pollen and macrofossil
analyses of the deposit overlying the peat at The Vale of Brooks.
The debate is continued by Burrin (1983) where he says that there
is a possibility of 'an environQent protected to some degree by
offshore barriers or spits' but also adds that evidence for'this type
of environment is not present at The Vale of Brooks.
A paper by Carter (1982) elucidates the process of barrier
breaching ~~d shows where such events may be expected. In this paper
the author states that caution should be observed when identifying
a breaching process in a vertical se~iment sequence. It is sh~wn that
breaching usually occurs from the landwa~d side of the barrier by
seepage, which is seen in the sedimentary sequence as disturbed layers
together with erosional contacts and channels, as the lag on level
drops. Thia is followed by a return to lacustrine facies as the
barrier reforms. If the barrier is over-topped frorr, the seaward the
sediment record will reveal rapid alterations of sedi~ent types near
the ::;c..rrier with less maT,·:ed evidence further' from the biii'I'ie:r.

- 188 -
In 1982 the final report from the IGCP Project 61 'tlas published
concerning sea-level movement over the past 15,000 years. A paper by
Devoy (1982) analysed the geological evidence for Holocene sea-level
movement in South-East England using 55 sea-level indicator points
gathered since 1950 and subjected to statistical tests in order to
elucidate a sea-level curve for South-East England. The results show
that levels above- 30 m.O.D. \vere inundated by marine conditions
after ca. 9300 BP with a rapidly rising sea level. At ca. 4500 BP
to ca. 3000 BP the sea-level curve levels out showing either a stillstand
or a reduction in the rate of sea-level rise. From ~· 3000 BP to the
present day the effects of man together with a deterioration of
climatic conditions and a greater freshwater input into estuarine
zones is observed, whilst sea level continues to rise to above
+ 0.5 m.O.D. by ca. 1700 BP. 'l'he data points show the course of
sea-level rise to contain alter ations of speed and direction
p:r·oducing an oscillating sea-level curve for South-East England.
Flemming ( 1982) used mul tipl a-regression analyses on 143
sea-level index points and produced a predicted sea-level curve and
a map showing the rates of vertical isostatic displacement in the
United hingdom. This showed South-East England is an area of
vertical isostatic uplift compared to the generally accepted view that
this area is undergoing vertical displacement. This anomaly was
explained by the lack of data points for this region.
Eddison ~ al (1983) studied the occurence of offshore shingle
barriers along the Sussex Coast. Shingle barriers are thought to have
accumulated at the end of the main Flandrian Transgression by the
action of predominantly north-east littoral drift. By ca. 5300 BP
the barriers were well developed and peat accumulation began off
Cliff :Jnd, in East Sussex. Two radiocarbon dates for submerged forest

- 189 -
deposits at Pett Level are -"iven· 0 . '
an in situ tree trunk is dated ---S20S + lOS BP (IGS-Cl4/SS) while be soil baloH the trun.k is dated
5300 + 100 BP (IGS-Cl4/S6). Lo''' level shingle and sand has been
located at Broomhill ('I'~ 9:37 J.8,:)) at - l m.O.Il. 3.11d at + 2 m.O.Il.
which could be dated ca. SSOO . BP to ca. 4000 BP.
Eddison (1983) continued to discuss barrier beaches in the area
east of Fairlight and the mechanisms of sh::.n.§;:'.e move:Jent in the area.
The low level shingle of Broornhill is thought to be evidence of a very
early barrier dating from when sea level was more than 4 m bel0\'1
present. It is postulated that the Ilungeness shingle formation
accumulated outside this early barrier. It is also suggested that
barriers have been in existance in this area for most of the last
6000 years.
Further ideas on the origins of Langney Point were given in
Jennings and Smyth (1985). In this paper three sea-level index
points are recognised; at- 2S.94 m.O.Il. there is a positive
tendency of sea level noted, at - 24.82 m.O.D. there is ~regressive
contact and at - 24.7 m.O.D. there is a transgressive contact which is
dated as 8770 ~ SO BP (SRrt 24S2). At - 14.2 m.Q.IJ. an acc~nulation of
'-'c.:'1d particles with related marine Foraminifera and Cstracoda indicate
the over-running of a ~;c:nd ta.rriel' at tl~e site and at- 3.7 m.O.D. the
sand is repla.ced by shingle depor:.its. It is thought that the
accumulation of the Crw:1bles Shingle, in the area, may have initiated
tte formation of peat on Willington levels (TQ 61 01) dated
37SO ~ 40 BP (SRR 24S5) to 3390! 40 EP (SRR 24S4).
4:1:2 Review of Literature on Pollen Studies.
The first detailed study of submerged peat dspo~its along the
South Coast wa.!:'- b,>i }ocbir. and ~od1•in (1940) at SoutharTJpton. ''" lDe

- 190 -
conclusions from this work i·ias ttat a mar·irie tranf>gre'=;s:ion affected
levels of- 1.83 ~.O.D. after Godwin's Zone VII. Following this work
Godwin (1940) used data from the whole of the British Isles to
conclude that the greater part of tte 'North Sea Transgression'
took plc..ce betv.·een Zone V and Zone VII. Analyses of pea.t beds in
Svransea Bay at- 54' C.D., separated by marine silts, revealed ttat
a rapid transgression occurred :in the latter half of Zone VI at a
rate of 4.5'/lUO years, wher-eas higher peat beds at- 5' O.D. were
dated to Zone VII showing that tl'e pace of this sea-level rr.ovement
had slowed by the end of Zone VIc and rr,ay have been interrupted by
a marine regression. In this paper Godwin mentions that transgression
rates vary from region to r·egion, due to isostatic moveoents of the
land and sea, and that wore research v:as needed at that time on the
subject of sea-level fluctuations.
Seagrief (1959) began a series of poll en studies front Southern
England beginning vii th a study at ~lareham in Dorset, and 1iursling in
Hampshire. At \·iareham (SY 923 892) be i'ound a peat over 30C em thick
Vibich ranged in age from i..~odwin' s Zone IV to Zone VII. He noted
possibj]jtjes of valley flooding to levels of+ 1.22 m.O.D. before
peat growtt was initiated. At Nursling (SZ 356 158) the peat deposit
w2.s 380 em thick ar:d rc.nged in age fron, Zone III to Zone VIb. Tlle
greatest accumulation of peat vias in the Pre-Bore.:tl and Boreal.
Pinus pollen was found. in Zone III, IV and V which is em early age
for this species at this site. Fagus pollen was also found from the
early part of the ·Atlantic.
'I'he second of this series of poll en diagrams from the South of
England was by Seagrief (1960) at Crane's ~·;oor. The greatest record
at this site is of peat growtt froo Codwi~'s Zone V to Zone VIIa at
S!)hE-.6'JUri, J:og, 'cut e,ccurnu::.c-,tion P.t Flush Bog begw in L::one IV. Again

- 191 -
the evidence points to an e<u·ly c.nd rapid accumulation of peat in
Pre-Boreal and Boreal times and alBo Pinus and Fagus pollen are
recorded early.
The third of this series of analyses was at Elstead, in Surrey
by Seagrief ar.d Godwin ( 1960). Here poll en .snalyses showed Zone III
to be dorr!inated by Fagus poll en and Zones IV, V and VI we1·e dou1inated
by Pinus pollen, v'hic.h is again an early record for tbis species.
Godwin (1962) investigated two sites in Kent. At Frogholt
(TR 176 375) a peat deposit from + 52.25 m.O.D. to + 50.90 m.O.D. was
found to have fluviatile origins. This peat was underlain by sands
and overlain by a blue cla,y. The organic deposit was dated from
ca. 2980 BP to ~· 2490 BP. The Hingham site revealed a detrital
mud l'lith organic remains from + 3-3 m.O.D. to + 1.6 m.O.D. and is
underlain by silty-clay and is overlain by a fine mud and clay. 'l'tis
whole deposit has been dated from~· 3650 BP to~· 1750 BP, and
shows a decrease in Tilia pollen at ca. 3150 BP and the presence of
Fagus pollen from an Early Bronze Age. 'lhis site also revealed
evicence of an increase in 1\a ter-logging after 'Neolithic A' >·ihich
could te the result of a rise in sea level.
B.srber (1975) carried ou~ ~ frelilfinary investigation into the
pollen recc~d at Churct Moor (SU 247 069) in the New Forest. At this
site 250 em of peat were analysed showing peat accur~,u] c_tion began in
the Boreal with more Quercus poll en present than would be expected,
together with a great spread of l:'agus pollen and Ilex pollen in the
upper levels of the peat. 'l'he Atlantic boundary is thou,sht to te
pre- 7450 BP.
'l'he Poole Harbour area HcS cho:::en by Haskins (1978) for a
c stc.iJ ed poll en inve~'tiga-tion. i-. nun,ber· of sites c.::.'ound tbe l-ia.rbour

- 192 -
were examined including Luscombe (SZ 047 895), Morden A (SY 916 912),
Morden B (SY 924 892), East St6ke (SY 864 866), The Moors (SY 949 865),
Rempstone (SY 983 843) and Godlingstone (SZ 01 83). It was found ttat
Fagus pollen Has prE:sent in the Boreal and that Pi:rcus pollen persisted
throughout the Flandrian Stage.
\>laton (1980) published a prelirr.inBTY report on pollen analyses
at Rimsmoor in Dorset (SY 814 922). Peat had accumulated e:.t the site
to a depth of 18 rn since the Early Fl andTian and showed a total
regeneration of the forest cover after the 'Elm decline'.
Thorley (1981) worked on a site in The Vale of Brooks at Lewes
(TQ 413 092). Here Alder-carr peats were truncated by marine and
fl uvi a tile clays. Peat growth ;..-as considered to be very rapid in
the early stages of the marine transgression at the site.
Scaife (1982) worked on two sites on the Isle of Wight; at
Gatcombe (sz 502 858) and Munsley Bog (SZ 526 825). These sites
showed pollen records from Godwin's Zone III to present. 1he
bumified peat deposit found at Gatcombe is dated as 9970 + 50 BP
(SRR 1433) which is underlain by a sandy-silt. Continuous records of
\:,;uercus pollen and Alnus pollen are recorded from §· 9970 BP.
From 6385:: 50 BF (SRR 1339) no Tiha or Fraxinus pol1en is found
on the Isle of Wight. Scaife argues that the betula and Pinus pollen
found in Zone III is of long distance origins as compared to
Seagrief (1959) who concluded that these species were present at the
sites. Scaife points out that this coul~ be ttought to be true as
the data were calculated as a percentage of the tree pollen, instead
of as a percentage of ti:e total land pollen, and thus tree poll en
will be over-represented.

- 193 -
Waton (1982) published a report on his earlier work at himsmoor
together with pollen records from sites at ~inchester (SU 486 799),
Snelsmore (SU 463 704) and Amberley (TQ 037 145). At 'riinchester the
pollen record dates from the Boreal to the present day with an 'Elm
decline' date of 5630 ! 90 BP (HAR 4342). At Rimsmoor the peat records
pollen from the Late Boreal to the present with an 'Elm decline' date
at 5150 ~ 70 BP (HAR 3919) to 4690 + 70 BP (HP~ 3920). Here pe~t
accumulation v;as at a rate of ca. 26 cmj100 years.
Although not many of these studies are relevant to the
evaluation of past sea levels, they have been used in this work for
dating purposes. The present study bas no radiocarbon dates
available and so it must rely on other dates available from
differer.t authors and sites. These dates have been used in tte
following section to construct a relative chronology of pollen zones
on the South Coast of England.
4:2 RELATIVE CHRONOLOGY OF SOUTH COAST POLLEN ZONES
As already rr,entioned above, a number of sites on the South Coast
tave been worked on w~ th regard to vegetc:_tional changes during the
Fl andrian ;:)ta.ge. '£i:e:o,e ::nclude ·ouried peats at Southcu;1pton
(Godwin 1940), Hareha.r:i, llursling and Crane's Moor (Seagrief 1959,
1960), Elstead (Seagrief & Godwin 1960), Yarmouth and Soutbsea
(Devoy 1972), Church Moor (Barber 1975), S.E. Dorset (Haskins 1978),
Lewes (Thorley 1981), Rimsmoor (Waton 1982) plus two sites on the
Isle of Wight, Munsley and Gatcombe (Scaife 1982). 'l'he latter four
author.s plus Devoy (1972) have dated pollen zone boundaries and these
together with the generally accepted dated pollen zone boundaries of
Godwin (1940) e.nd \{est (1970) are outlined in Table 21.

- 194 -
Table 21 Dated LPAZ Boundaries from tl::e South Coast.
-GODHIN \-.'EST DEVOY HAS1..INS THORLEY WATON SCAIFE 1940 1970 1972 1978 1981 1982 1982
VIII I GTW ll 11.-B-~-Fg P-B
------~
H A-B-Q-P Q-A
- 2500 --- F III !-2950- NAP VIIb G GTW 10
Q-A ~-j}.-_F~- - - :\-_Q:-B_-~~ -A-Q-T
F GTW 9 U-Q-A A-Q-B-T
1---- 5000 --1- 501 o.:so - 4500 f-- 4950 - 1-5670 - 46902:70
t- --r--5150:!:70 5500 4750
VII a F II E GTW 8
A-Q-U-T Q-U-A A-T-P-B AP A-Q-U-T
1---- 7500 - 1--71072:120 t-6979 - r-63852'50 -
VI F Id D GTW 7
P-Co P-Co-U Q-U-P-B Q-P-U
i-- 9000 - 1-- 81962:150- t- 8950 -
v F Ic c GTW 6
Co-B-P Co-P P-Q( u) P-Q-B
f- 9500 - 1-- 8880±170 t- 9650 -
IV F Ib B GTW 5
B-P B-P-Co P-B B-P-Q
1-- 10500 - - 9798:!:200 11~250-III F Ia GTW 4
Sa B-P-J B-P P-B-A i
A=Alnus, ~=Quercus, B=Betula, T=Tilia, P=Pinus, U=Ulmus, Fg=Fa~us,
J=Juniperus, Co=Corvlus and Sa=Salix.
Discrepancies arise in tte dates of the LPAZ boundaries. The
beginning of Flandrian Chronozone II (G-odwin's Zone VIjVIIa) is seen
to range from 6385 2: 50 BP (SRR 1339) at Gatcombe on the Isle of
Hight to~· 6979 BP (SRR 789) at Poole, a maximum of 714 yeaTs,
while the 1 Elm decline 1 boundary, v1hich corresponds to tbe
beginnir_g of F III varies over 1260 years from ~· 4500 BP at
South sea to ca. 5670 BP at Levres. 'rhus we can see that dating tLe
LPAZ at the sites in t!:is study is rather complex and ir: r:wst cases

- 195 -
dates are taken from the closest dated dic.gram to the site: Thus
the dates for The Moors site and tbe Studland Heath site are t.sken
from Hc;.skins (1978), the dates for the Yarmouth site are taken from
Devoy (1972) and Scaife (1982), the Pett Level dates are from
Thorley (1981) and the dates for Browndo-vm are ta...ken straight from
West (1970) as there is no dated diagram close to the site.
4:3 ANALYSES OF INDICATORS OF SEA-LEVEL .li!OVEMENT FROM SITES STUDIED
4:3:1 The Moors Site
At The Moors site there is evidence for one period of biogenic
sedimentation and one period of minerogenic sedimentation (Figure 8).
These sediments are thought to have accumulated during the Flandrian
Age and lie on a bedrock of Eagshot Beds of Eocene Age.
The organic horizons, of the site, lie above this bedrock e~d
are found in all boreholes. The altitude of the lower contact of
these deposits varies from- 2.39 m.O.D. to- 0.46 m.O.D. and the
thickness ranges from 13 em tc 176 em witt increasing thickness to
the land't1ard of the site. The upper contact of these peats is taken
vi here :;:Jredominantly orgc;.nic sediments e.re replaced by _predor;:ina:r•tly
cl:o,stic deposits. 'This conte.ct varies in altituje fror;1- l.ll m.O.D.
to - 0.04 ffi.O.D. The minerogecic deposit is found in all boreholes
above the peat and accumulated during the Fl a...YJdri an A.ge, continuing
to accumulate probably until Ramen Times when the site was drained b,y
an extensive system of dykes. The upper contac~ is with the top-soil
of the f,ite .and varies from- 0.34 m.O.D. to+ ·J.l2 m.O.D. The
minerogenic material was divided 'into hro f&.cies in the particle-size
and field anal.J'ses; a lo\ver coarser silt ar.cl clay (Ag 2, As 2) and an
upper finer si.Lt,y-cL:.y (As l, .i,.s 3).

THE
I FIGURE 541
MOORS-- PARTICLE-S~ZE
'
I
t 'lo SAND
/ \ SANOY- \
" SILT- LOAM
\ /
\/
LEGEND
Moors 7 sample
+ Moors B samp(e
Moors 9 sample
LOAM •. ,/ ,I
I \ / \ /
FMJS
I I !
I
- 196 -
The particle-size analy2es of ti1e three boreholes M. 7, 1,,; 8 and
M 9 at The Moors site (Section 3:1:2) has been 3umrnarised in
Figure 54. These analyses reveal that although the field andyses
divided the deposit into a silt and clay and a silty-clay, the
particle-size a.nalyses (B.S. 1377, 1967) shov;s the minerogenic
deposit to be a sil t,y-cl ay, using the Soil Survey of England s.nd
\{ales terr:,inol oc;y, but t~ese analyses also reveal the.t there is a
fining of the sediment up through the deposit ie. M 7:2 and k 7:3
are coarser than M 7:4, M 7:5 and .M 7:6. These sediments indicate
deposition in a relatively higher enere;y environment above the peat
-fl"hich passes into deposition in a lower energy environment above.
Pollen analyses were carried out at M 7 and M 10. At M 7,
(Figure 12) the analysis of pollen revealed a series of changes in
the local environmental comli tions. A loHer wet Alder carr fen
environment is indicc..terl with Alnus pollen dominant and Betula and
Quercus pollen also recorded at the site (LPAZ M7:l). Gramineae,
Frangula, Ranuncu:lus-type, C::.l tha-type and Rubiaceae (probably
Ga.lium-typE:) pollen are found here v.'hich are indicative of a darr,p
fen enviro~ment. Major changes in the pol:en spectra are found at
the top of tie organic material where pollen of increasingly
ir,ter-tidal comli tion;:O ::_s ;.,:·8.3er:t in the for1.1 :Jf ChenopodiaceaG,
Ca.ryo;>hyllaceae, lVJYriop\vl::.um and Cooposit2.e species (LPAZ Iq:2b).
At M 10 (Figure 13) the pollen anal,Ysis revealed c. sec.uence of
sewi-terrestrial peat gro·fl"th with Alder carr (LPAZ JvilO:l) giving
way to an herbaceous peat in the top levels. 'rne pollen taxa
indicate a change-over from Alder carr to a r:10re open environment
\vith a rise of Gramineae (L.?AZ Ml0:2-5) and Cyperaceae (LPAZ In0:3-5)
together with the increase in saltm::.rsh taxa such as Cbenopodia.ceae
and Compositae (LPAZ J.U0:5) and 2. rise ir, cVJT:lt~c pol:en. Thu:3

- 197 -
althou~h sediments with a high pr ?Ortion of or~anic m~tter were
recorded above - 0.95 m.O.D. (ca. _J2 em) in M 10, the pollen data
indicc.te that marine influenced rr.inerogeni c sedimentation i12.S
underway before full marine conditions \~ere reco::-ded at the site,
ie. the che.nge-over at the site was transition:J.l.
Diatoo analyses were perforined at I~ 7, !vi 8, M 9 and K 10
(Section 3: l :4). One must take care when i.:1terpreting t:'1e results
f:::-om ~he diatom d.ia5rams as it will be seen that major changes in tie
lifestyle diagrams are the result of a change in ;:erhaps just a
single species ie. at M 8 (Figure l5a) the change to a dominance of
Marine valves in LDAZ M8:3 is caused by the rise in the frequency of
Melosira sulcata (Figure l5b.). Thus it is only possible to say that
the diatom analyses of The Moors site indicates that the environment
was predominantly Brackish/Marine when t}J.e diatorr.s were deposited in
the minerogenic material.
'=.'he particle-size anal,yses of The ~ioors site suggests t~1e
minerogenic lFij'ers were deposited first in a relatively higher energy
environment with coarser sedimentation end later in a lower energy
environment with finer sedimentation. The sequence of deposits found
at The Moors, a basal peat topped by a minerogenic st:::-atwn, could
be explained by the rise of water level at t~1e site leading to the
truncation of peat growth 3Jld the deposition of Brackish/I··iarine
sediments above. This sedimentary environment could be the result of
a rise of sea level in the environment causing an increase in t:1e
level of the local water-table with subsequent deposition of
minerogenic deposits as the water inundated the site. This type of
deposition ~t t~e site could be expected if a coastal barrier,
protecting the site, was breached, such as the spit formation at the
entr':ince to Poole ~ac-bour. 'l'his 1-;ould ~~llo·.,- th~ ra.pid jr:un:iation of
- 198 -
The liioors by marine ·Hater from the English Channel replacing the
more brackish water of the harbour. If this was the case then
erosion of t~e top levels of the peat could be expected in some
boreholes, particularly nearer the breaching point, with a rapid
truncation of peat gro;.,rth and the deposition of marine sediments,
with sharp li tholo0ic,,1 bound::.ries. 'l'he stratigraphic sequences
seen in Figure 8 show that in e~ch borehole the peat is overlain by
a transitional biogenic-minerogenic deposit with no eviience of a rapid
truncation of peat growth. The pollen and diatom analyses also show
no evidence of barrier breaching in the imoediate vicinity. The
pollen analyses at The Moors shows increasing water-logging and marine
influence at the site in the upper levels of peat, shown by the
saltmarsh and aquatic pollen types. This sequence is seen in both
M 7 ~~d M 10 where wet Alder carr vegetation is replaced by open
water taxa and sal tmarsh species. The diatom analyses reveals only
the presence of predominantly Brackish/Marine water above the peat.
Although the microfossil evidence at The Moors site suggest no rapid
inundation by marine conditions it is perhaps worth noting that the
site is h'ell sheltered from the entrance to Poole harbour by the
Arne Peninsula and it is also rather far, ~· 9 km, to receive
imrr,ediate inund:.:.ting if the spit at the entrance vias breached. If vie
assume a breach ca. 9 km a\'lay, instead of a rapid tru..YJc:.:;.tion of pe:o.t
~rowth we would expect a more gentle transition to n:arine condi tiol".s
at The Moors, which could explain the lack of erosional horizons
above the peat yet also explain the fining of the minerogenic deposit
~s the estuary silted up following tje re-establishment of quieter
sedimentation behind a re-aligned barrier. The Studland Heath site
is closer to the harbour entrance, ~· 2 km, and although it is also
parti3.lly sheltered by the Sout.h :laven Peninsula we c.ou.'.rJ expect to

- 199 -
find other evidence at this site if there was a breaching of the
spit formation at the entrance to Poole Harbour. This idea l'lill
be discussed further.
The beginning of marine sedimentation at The Moors site is
thought to have be;sun during early Flandria..'1 Chronozone III, uh:'..ch
starts ca. 5000 BP (West 1970) and covers Godwin's Zone VIIb, whi~h
has been assigned time limits of ca. 5500/5000 BP to ca. 2500 BP
( God1'lin 1940). In the Poole Harbour region Haskins (1978) has
assigned time limits of ca. 4950 BP to ca. 2950 EP for this zone.
Thus at The Moors site we have indiactions of positive tendencies
of sea-level movement with a range of altitude from- 1.11 8.0.D. to
- 0.04 m.O.D. w"ld dating fro1r, the rc.nge of ca. 4950 BP to
ca. 2950 BP.
4:3:2 The Studland Heath Site
At Studland Heath there is evidence of one episode of biogenic
sedimentation of a very limited extent Literally, and one period of
minerogenic deposition thought to h:we accumul:lted during the
Flandrian Age. The biogenic material lies above the bedrock of
5agshot Beds of ~cene Age.
The altitude of the lower contact between the peat ~nd the
bedrock varies from+ 0.02 m.O.D. to - 0.72 m.O.D. The thickness of
this peat ranges from 17 em to 103 em. Again the upper contact of
the peat is taken to be w~ere predominantly orgimic sediments are
replaced by predominantly clastic sediments. 'This contact varies in
al~itude from + 0.11 m.O.D. to + 0.56 m.O.D •• The minerogenic material
at this site l!c.<: a rather comple:c configuration and has been described
in Section 3:2:1.

- 200 -
Poll en analyses were carried out at SH 4 b and SH 4h. At SH 4 b
(Figure 21) the pol:en spectra from the pe~t levels indicate the
pr..::sence of an Oak-Alder carr with a1Jundant Jra.r:Lineae pollen
(LPA.Z SH 4b:l-3). This ·.;as probably qu.ite an acid environment
locall.J· shown by the pollen of Ericaceae and the spores of 3uhagnum.
At the top of the organic deposit, the pollen a.YJalysis revealed some
evidence for the presence of saltmarsh conditions with Chenopod~aceae
and Plantaginaceae poll en, also open water taxa like Pota."JJ_:Seton and
reedsvJa.'llp taxa such as Typha latifolia (LPAZ SH 4b:4). At SH 4h
(Figure 22) the peat is predoD~nantly shrubby in nature with high
Corylus and Ericaceae values (LPAZ SH 4h:l-2). The rise in
}ramineae poll en (LPAZ SH 4h :3a-3b) together with an increase in the
frequencies of Alnus and Quercus pollen indicates a change to more
damp Oa1::.-A.lder carr environment. A change to sal tmarsh conditions is
reflected in the vegetation of the silty-sand (LPAZ SH 4h:4) where
Chenopodiaceae, Compositae and Plantaginaceae pollen are all present.
There are however no aquatic pollen present here but this could be
iue to probable erosion of t~e top levels of peat as the lithological
boundary between the peat and minerogenic material is very sharp. At
the borehole SH 4h, above + 0.13 m.O.D. (ca. 134 em) the strata are
rr:inerogenic but ;ol~en analysis revealed that sal tmarsh taxe. v:ere
present thJ.s indicc:.ting that marine influenced sedimentation v>as :in
progress at Studland Heath before fully marine conditions were prevalent.
No particle-size analyses or diatom analyses were performed at
Studla.YJd Heath but the field c.naly:3es of the sediments shoHed that at
SH 4b a transitional silty-peat is fou~d above the organic material
·which passes into a silty-sand (Ag 1, Ga 3) at+ 0.62 m.O.D. and
above to a finer sand-silt ( Ag 2, Ga 2) before graduating to an
organic cla:.'ey-silt ('I'h l, J:..s 1, As 2). At SH 4h the o:::-gCJ.r.:'cc ~~epsit

- 201 -
is sharply del :'..mi ted from a thin band of si ::_ ty-sand ( Ag 1, }a 3) at
+ 0.19 m.O.D. passing upward into a coarser gravel-sand (Ga z,
Gg(min) 2) and finally to a finer organic sandy-silt (Th l, Ga 1,
Ag 2).
These deposi~s could indicate deposition occu~red first in a
higher energy environment and later in a lo·,.;er energy envirom;Jent.
The Studland Heath site is close to the entrance of Poole Harbour,
£§;• 2 km, and if we are to ,?osttllate a hypothetical spit :~.::>::-mation
~cross the entrance was breached ~t some time, then the evidence of
this event should be seen in the boreholes of Studland Heath
(Figure 20). The transect from SH 1 to SH 8 shows clearly that a
lower predoir.inantly sandy deposit is found in all boreholes, which
is overlain by a finer natured deposit of clays and silts, except at
SH 1 and SH 2. This could be the result of deposition in a higher
energy environment, such as follov1ing the breaching of a protective
barrier, followed by deposition in a lo1ver energy environment, as
the estuary silted up. The second transect from SH 4a to SH 4h
shows that at SH 4 and SH 4h there is a rapid truncation of peat
~::-owth with a sharp upper lithological boundary, being replaced by
minerogenic material. This pattern is not however found at SH 4a
and SH 4b Hhere transi ticna.l material lies rtbove the peat. Thus at
Studland Heath we have evidence of encroaching marine conditions,
indicated by the sal trnarsh taxa and open Hater taxa of pollen, but
locally the change to marine sedimentation is characterised by some
erosional horizons and high energy sedimentation. The minerogenic
deposits show a lack of homogeneous layers but this is to De
expected if the site were close to a mobile spit environment.
The beginnin.~ of marine sedimentation at Studland Heath is_
thought to nc.v:; been during F'le.ndri an Chronozone III ( God;:i:1 's

--------------------------............ . - 202 -
Zone VIIb) which is dated from ca. 5000 EP (Hest 1970) and dated by
Haskins (l978) from ca. 4950 EP to ca. 2950 BP.
Thus at the Studland Heath site we have evidence of a pos:i. tive
tendency of sea-level movement betHeen ~· 4950 EP and ca. 2950 BP
within a range of altitude from + 0.11 m.O.D. to + 0.56 m.O.D.
4:3:3 The Yarmouth Site
'l'he Yarmouth site was subdivided in Section 3:3 into Yarrr:ou·!;h
Carpark and Yarmout~ Boatyard to facilitate the discussion of the
deposits; this scheme will be continued here and the site discussed
as a whole at the end of this section.
At Yarmouth Carpark the stra tigrapbi c diagram (Figure 25) shows
a single period of biogenic sedimentation together with two periods
of minerogenic sedimentation. These deposits are all thought to have
accumulated during the Flandrian .1ige and lie on a bedrock of
Headon Beds, which are Olicocene in age.
The lower minerogenic deposit is only found at YES 2 and YBS 3,
and consists of silts and clays. The upper contact of this material
ranges in altitude from- 6.55 m.O.D. to- 5.74 m.O.D. Biogenic
material is fou..YJ.d only at YES l, YES 2 and YBS 3, although transitional
peaty-clastic strata are found in YBS 5, YES 6 and YES 7. The true
organic material reaches a depth 248 c:r, at YES 2. The up_t:Jer contact
of this peat with a clay and silt deposit above, varies in altitude
from- 3.55 m.O.D. to - 4.07 m.O.D. The upper minerogenic deposit
is found in ·all boreholes and co~0ists in the main of silts and clays
with a lower sandy band at YBS 5, n.s 6 and YES 7 and c..n upper sanely
band in al J torehoJ es except YES 7. She] J ren:ains 1'ere locEtted in all

li j
YARMOUTH- PARTICLE -SIZE
I FIGURE ssl
.,.
'!,
%SAND
"t,
LEGEND
• YBS 3 ~~ • YBS 9 sample
• YBS 10 ~~

- 203 -
The borehole YES 3 was the only one to tte east of the River
Yar to be examined for micJ·ofossils. The field analysis of the
strata (Section 3:3:1) showed that the lower ni~erogenic deposit
wc.s a clayey-silt and that the upper minerogenic de:;Josi t ·,.;as e-el so a
clayey-silt. 'l'he particle-size analysis (Section 3:3:2) is
swnrr,c.rised in Figure 55 and also seen in Figure 27 (:B.S. 1377; 1967).
The lower minerog-enic deposit is shown to be a sil t.}'-cl ay according
to Soil Survey of England and vlales ternir:ology while above the peu.t
the deposit is a silt-loam which passes into a silty-clay loam and to
a coarser silt-loam at the top of the borehole. The pollen analysis
of YES 3 (Section 3:3:3) revealed a series of LPAZ indicative of a
greatly fluctuating water level at the site (Figure 30). The base of
the peat contains an herbaceous pollen flora, vihich could be a
swamp carr environment sto1m by Salix and Typha angustifo= ia pollen
(LPAZ YES 3:1) with local stands of Oak-Alder scrub wioodland. This
gives way to a drying out of the site with a predomin2..nce of Alder
scrub v;oodland (LPAZ YES 3:2), although Cruciferae and Lythrurn pollen
could indicate localised reedswa..r;Jp conditions together with high
!1iyriophyllwn pollen values indicating open Hater conditions. Furt.her
drying out e,t the site is recognif:ed in LPAZ YES 3:3, vlith Alder scrub
i-ioodle:.nd o..nd no ir.dications of v1etland conditions. Ttis l'BVE:rts t·ack
to S\'i&lp c2crr conditions (LPAZ Y3S 3:4) with hhamnus a.'1d Fra.neula
pollen showing fen peat. The Mentha and Latbyrus pollen found tere
together with the fen peat indicators confirm this view. Again a
drying out of tbe site is seen above this swamp carr wi tb the
reappearance of Alder-Oak scrub \o.'oodl and ( LPAZ YES 3:5). 'I'ne
-irarnineae and Cyperaceae poll en die tack dramatically here together
with all shrub pollen except Corvlus. The top levels of peat show
swamp conditions (LPAZ1BS 3:6) v;ith tile expansion of saltrr.&.r·sh ta ... -xa
like Cnenopodiaceae and 1-'lantagir:::;,ceae and sn exp&nsio::--, of c,::tla~ic

- 204 -
pollen. 'llhe diatom analysis at YBS 3 (Section 3:3:4) showed -'che
lower minerogenic deposit to be predominantly Brackish in natGre
(Figure 36a) 1vi th increasing Fresh diatoms toHards the lower ccnta.ct
with the peat ~bove. The u;per minerogenic deposit is shown to be
predominantly Brackish;Marine with decreasing Freshwater influence
away from the peat deposit.
There are two periods of minerogenic sedimentation recognised
at Yarmouth Carpark. The lower phase of clastic deposition is
thought to have accumulated ca. 6385 BP (Scaife 1982) in a
brackish environment. This was followed by a period of peat
accuoulation Hi thin en age range from post ca. 6385 BP.
BP (Godwin 1940). The final phase of clastic sedimentation is thought
to be post ~· 2500 BP with indicators of marine condi · tions at the
site sean in the particle-size, pollen and diatom analyses.
Thus at Yarrr~outh Carpark there is evidence of a nega.tive
tendency of se~-level move~ent with an altitude range of- 6.55 m.O.D.
to - 5.74 rr .• O.D. and dated from post ca. 6385 BP.
This is followed by a positive tendency of sea-level moveGent with
an altitude range of- 4.07 rr~.o.L. to- 3-55 m.O.D. and dating fror:-1
pre ca. 2500 BP •
.nt Yarmouth Boatyard the str·atigr·arhic analyses (Figure 26)
revealed a more complex pattern of strata. There appears to have
been two D1ain periods of biogenic accumulation; the lower period
bejng equivalent in altitudinal rc.nge to :he biogenic deposit of
Yarmouth Carpark, and a possibility of :hree periods of minerogenic
deposition. 'l'he biogenic c.nd minerogenic deposits are e:.ll thought
to have accumulated dur_ing tbe Flandria.n Stage ond lie on a bedroc!:
of Eeadon Eeds of Oligocene age.

- 205 -
The lo,-;est minerogenic deposit is onl,r found at YES 8 and
YES 9 where it consists of silts, clays and sc.nds. 'l'he upper
contact of this deposit is with biogenic materic,l and varies in
altitude from - 4.88 m.O.D. to - 4-57 m.O.D. The lower biogenic
deposit is observed at YES 8 and 1nS 9 and the upper contact of this
peat varies in altitude from- 3.98 m.O.D. to- 3.50 m.O.D., it
being overlain in both boreholes by silts and clays. At YES 8,
three peat bands are seen and at YES 9, two peats were observed.
Both boreholes display intercalated silts and clays. A second
minerogenic deposit is thought to be in evidence at YES 10 through
to YES 14 and consists predominantly of silts and sands. The upper
contact of this deposit with the peat above varies in altitude from
- 2.80 m.O.D. to - 2.25 m.O.D. A possible second psriod of biogenic
accumulation is observed at YBS 10, YES 11, YES 12, YES 13 and YES 14.
The upper contact, with clastic materico.l, varies in altitude from
- 2.53 m.O.D. to - 1.62 m.O.D. J;o upper biogenic material is found
g.t YES 15. The uppermost minerogenic deposit at Yarmouth Boatyard
is found at all boreholes and consists of silty-clays but a band of
lower silt runs through cores YES 12 to YES 15, which are closest to
the River Yar. Evidence of ~~tel:':. remains found at Yarmouth Carpc.rk
c.re c.lso present at ThS 13, YBS 14 2.nd YES 15.
Microfossil analyses ,,:ere c&rried out c.t YBS 9, 1'3S 10, YES 12,
YBS 13 and YES 14. 'l'te particle-size analyses of YES 9 and YES 10
have been summarised in Figure 55· The field analysis of YES 9
(Section 3:3:1) showed a fining of the particle-size of the strata
towards the base of the lower peat deposit, from a silty-clayey-sand
to a sandy-clay. 'I'he intercalated minerogenic stratum between the
peats is a pure clay and above tbe upper peat, the field analysis
sho1·1ed a sil ty-cle:.y strc.tum. The psrtic2e-size

- 206 -
of this borehole a.l so revealed a fining of the pc.rticle-size
tov1o.rds the contact vri th the lower peat. h.ccording to the Soil
Survey of England and v:ales tern;inology, this is e:. cl;:;_y loam pa:::sing
to a silty-clay loaJn. 'l'te interce:.lo.ied strc.tum is revealed as a
silty- clay loam v1hich ;::asses in-:o a silty-clay below tLe upper peat.
Above this upper peat tb.e strata are a mix of silty-clays a'1d cleys.
At YBS 10 tr.e :'ield analysis sho1.;ed tte lowest minerogenic deposit to
be predominantly silty w: th a pure silt at the base of tb8 borehole.
This lowest stratum was shown to be a silty-clay loam in the particle
size analysis fining to a silty-clay and above to a silty-clay loam
just below the peat. Above the peat of J.'BS 10 the field e.nalysis
showed a suite of silts but the particle-size analysis showed a
silty-clay loam immediately above the peat passing to a series of
silty-clays above. Pollen analyses were carried out at YES 9, YBS 10,
YBS 12, YBS 13 and YBS 14 (Section 3:3:3). Each borehole revealed a
sequence of changing vegetd.tional environments reflecting fluctuations
in the local water level at the site. rtt YBS 9 (Figure 31) the base
of the pec:.t sho·v;ed a dry scrub Alder woodland ( LPAZ YBS 9: l). 'l'his
passed into a wetter Alder fen with local open wo.ter aquatics shown
by the pollen of MyriophylJum and tte reedswo.sp t&xa such as Tyoha
angustifolia and 'l'ycha Jatifo~ia (LPAZ YbS 9:2). Conditions at the
cite dr~·ed out in LPAZ YES 9:3 1>1Lere Alder-Oak carr is the dornin&r,t
vegetation type. The i;.lder-Oa.lz v;oodland died back in LPAZ Y3S 9:4::..
·.·:i th an expansion of open habitat vegetation. Eelow the clay of
stratum 4, the vegetation reflected a damp Alder carr fen with
increasing saline conditions at the site shown by tte pollen of
Chenopodi ac eae c:.nd Cooposi tae tutul ifl o:c-a ( LPAZ YES 9:4 b) and reedsvlaEp
taxa such as Cruciferae, L~thrum and Valerianella; This rise in
l·:ater level cor;tin~J on above -:l:e clay into a c:econd upper bjogenic
- 207 -
stratum ~>here Chenopodiaceae and Plantc..ginaceae pollen expand
(LPAZ YBS 9:5)· Above this upper peat the pollen indicate a wet
Alder-Oa..t.c fen with increasing r.1arsh pollen of Cheno~•odiaceae a11d
Plantaginaceae (LPAZ YBS 9:6) sho1.;:ing the proximity of marshes to tte
site. The beginning of peat growtt at YBS 9 is thought to have been
after ca. 6385 BP and the 'Elm decline• is recognised at- 4.57 rr..O.D.
and dated using tte Levey (1972) dates of ca. 4750/4500 BP. T'he end
of peat growth at the borehole is not dated. bt YBS 10 a sequence of
fluc-tuating water levels is reflected in tte pollen analysis of tte
site (Figure 32). The lowest levels of peat revealed an O&k-Alder
fen vii th Chenopodiaceae and Plantaginaceae pollen showing evidence
of localised marsh conditions (LPAZ YBS 10:1) and open water with
the pollen of Pot2mogeton. Above this the vegetation reflects the
drying out at the site with Alder-Oak scrub (LPAZ YBS 10:2) and
localised swamp carr conditions shown by the pollen of Rh2mnus,
Frangula and }·,entha. This drying out continues into LPAZ YBS lO:]a
where there is an expansion of n.lder woodland with some localised
open water conditions reflected by the pollen of Potamo~eton and
fringing reedsv:amps vii th 'l'ypha angustifo] ia pollen. The drying out
is carried on in:o LFAZ YBS lO:]b w~th a dying back of Alder ~nd
nore open ts.bi ts.t vec;etaticn expand:ng in the form of G-ran:ir;ee:e ~ncl
Cyperaceae pollen. The top levels of peat showed a rise in the
local Hater level at the site and the expansion of sal tn:arsh taxa
of Chenopodi,~ceae and Compositae (LPAZ YBS 10:4) and open water
aquatic pollen of Potarnogeton and Typha angustifolia. 'l'he pollen
analysis of YES 10 showed that peat grovrth began ca. 4750/4500 BP
(after Devoy 1972). At an altitude of- 1.94 m.O.D. a date of
ca. 2500 BP is tentatively recognised by the re-establishment of
Pine pollen and the continuous .F'raxinus curve. The pollen anal.J'Sis
of the borehole YBS 12 revealed a series of alternati~g ~~ter levels

- 208 -
(Figure 33). The tase of tte lowest peat deposit is herbaceous in
nature v:i th indications of a very wet environn,ent, probably
reedsivc.n:p (LPAZ YBS 12:1) shown by tte r,ollen of ac;uatio species
together with Cruciferae, L,ythrum, Valeriana and Salix. 'l'his passed
into a drier zone of woody peat (LPAZ YBS 12:2) which is probably
a scrub Alder-Oak >wodland Hith localised reedm,amp comrr:unit.ies
shovm by -tte pollen of ~yperaceae and 'f·r:::ria ang-ustifolia. 'I'he upper
levels of the loHer peat are drier in nature Hi t.h Alder-Oak carr
(LPAZ YBS 12:3) although Frangula pollen is present indicating
moist soil conditions. 'l'he transitional deposit betv;een the two
peats is again predominantly herbaceous with Chenopodiaceae,
Potamogeton and Compositae species of pollen (LPJ.Z YBS 12:4) which
could indiacte sal tms.rsh envir·onments with swamp conditions and
stands of Oa!:.-h.lder scrub •;oodland. The upper peat deposit is
herbaceous with very low .. aqua clC pollen present (LPAZ YBS 12:5)
v.-hich ir.dicates a return to carr conditions and Alnus becomes the
dominant tree pollen. At YBS 12 peat gro>vth is thought to have been
initiated from ca. 4750/4500 BP. At- 1.76 m.O.D. a date of
ca. 2500 :BP is assumed where 'l'ilia pollen declines and Fraxinus
Pollen ezpa~cls. The pollen analysis of YBS 13 (Figure 34) showed
t~1at t!le base of the ~Je<::.t :-:as inC.icators of a d~-:;p .~.lde:.:" fen
s.nviror:r.ent i-;i th Eubiaceae, -Jramineae, ?0.nunculus-type ancl :~o;.l tha-t,ype
pollen, to2;et":er v1it:1 o::;:;sn 1.-i'::.ter taxa of 'Iynha 'illgustifolia a'1d
Potu.mogeton (LPAZ YES 1.3:1 ). 'l'his environment dried out above to
an Alder carr Hith less aqu3.tic polle:-" (L?Ai~ YES 13:2). 'l'he first
indications of a risiLg Hater level are seen . - D. -ln l..,ln.'.. Y3S 13: ja v.'hsre
the ve~etation is Alder fen with rising water levels indicated by
the poll en of (.;henopodiaceae, Plan ta_':;inaceae and Composi tae species
together with high Cyperaceae va:ues. The rise of water level is

- 209 -
carried on into LPAZ YES l3:3b where a peak of Ghenopodiacefle
pollen occurs just below the clayey-sil~ of stratuo 6. The top
level analysed in this core showed a drying out at the site with
Oak-Alder- scrub 1wodl::.nd and no 2.:J_Uatic pollen (LPAZ YES 13:4), tut
higher- Hater levels are maintained still. sho'.m by the Chenopodiaceae
pollen. The pec.t growth at YBS 13 is thought to Lave been initia.ted
ca. 4750/4500 E·P with the Tip a decline recogn.'..sed at - 1.94 m.O.D.
and dateJi at ca. 2500 :BP, seen by the decline o.f' '~-'ilia pol~ en c<nd the
expansion of herb pol1 en. r::'he end of peat growth is not de. ted.
The final core at Yarmouth Boatyard to be analysed for pollen is
YBS 14 (Figure 35). 'l'he botto;n levels are found in a transitional
peat-silt 1-:hich revealed an Alder-Oak fen vegetation with high
local water levels shown by Chenopodiaceae and Compositc.e pol:en
(:0?AZ YBS 14:1) but no aquatic pollen is pJ·dsent. The pure silt of
stratum 3, found below the peat deposit, showed indications of diDp
Alder fen v<i th a decrease of se.l t:T1arsh taxa and rising aquatic pollen
(LPAZ YBS 14:2). The base of the true peat showed vegetation of
reedswamp condi ticns Hi th _;ramineae, CrucifsTae and I..·..rt'trwn pollen
(LPAZ YBS 14: 3) and localised. Alder-Oak scrub and open Hater habitats
,,,::_-:.:): :}r;,l.ix snd 'I:.ypha s.ngustifolia _::;:l~en. 'l'he trcmsitional material
~bove t~e peat showed a dryin~ out of tbe environment with ~Ide~ carr
vegetation (LP.h.Z YnS lLi-:4). The bot:on: of the upper minero:;enic
deposit revealed an environrnen t of Aider fen ~~i th '~1arsb c:ondi tions
shown by Chenopodi aceae, Pl antaginaceae and Compo sitae species
(LPAZ YBS 14:~>) =.nd open ivater taxa of Typha a:1gustifolia c..nd
kyriophyllum. At Y.BS 14 the pe3.t gTo\vth is thought to have been
initiated from ca. 4750/4500 3P but ~gain the end of peat ~rowth is
not datsd. Diatoir, a.,'1alyses at Yarmo'.lth Bos.tyard 1·1ere perfor'ned at
YES 9, YBS 10, YES 12, YES 13 and YES 14 •. il.t YES 9 the diat:::Jrn

- 210 -
clir.gram (Figure 37a) showed a FreshKater influence at the top of
the lower peat which changes to a Brackish environment in the
intercalated clay and upper peat and to a rno.:r'e :3:-ac~ishj!,larine
environment in the upper clastic deposit. At YES 10 (Figure 3Ba)
the minerogenic material below t~e peat was shown to be influenced
by Brackish/Marine waters while above the peat there was a stro~g
Fresh·..:ater influence with Brackish conditions and no Larine <liatoos
present. The transitional ~Jaterial above t:1.e peat was predominantly
BrackishjMarine changing to a more !1iarine environn~ent of deposition
in the clayey-silt of the upper minerogenic material. At YES 12
(Figure 39a) the lower minerogenic deposit did not yield any diatoms
but tie upper minerogenic deposit showed signs of being predominantly
Brackish/Marine. The diatoms of YES 13 (Figure 40a) showed Fresh/
Brackish influences above the peat deposit which changed to a
Erackishj!viarine environment in t[,e upper minerogenic deposit. YBS 14
''as the last core at Yarmouth Boatyard to be analysed (Figure 4la).
The lo·,.;er silty-sand was shown to be predor:Jina.'1 tly B::'acki sh/Jvlarine
while the pure silt below tbe peat was Freshwater/Brackish in nature.
~he lower peat showed a strong Freshwater influence.
At the Yarmouth site the st::'atigraphic configuration of :he
boreholes together witn the ~icrofos~il ana~yses leads to at least
t·11o possible exp2.anations for sediment accwnulation; The site could
display two separate peat layers indicating the possibili-':,y of three
periods of positive sec.-1 evel tendency. As an alternative h:,· pothesi s
the peat deposit could be synchronous across the site leading to the
assumption that there are two pe~io~H of positive sea-level tendency at
the site.
The altitudinal rlifferences of the peat deposits at Yarmouth

- 211 -
indicate a division into tv10 separate peat <:tccumul a tion. pho.ses 11i th
the peats of YBS l, YBS 2, YBS 3, YES 8 and YBS 9 accumulating
before t:'1e peats of YES 10, YES ll, YilS 12, YBS 13 cu'1d YES 14. If
this were the case the relative dating of the peat deposits should
indicate distinctly separate phases of growth. Although the peats
of ':filS 3 and YBS 9 are thought to begin after ca. 6385 .BP, a date
of ca. 4750/4500 B? is recognised throughout the seven cores
anal.J'sed. Thus peat gro11th seems to have been synchronous ac:::-oss
the site.
'l'he peats of Yarmouth all display evidence of fluctuating
water levels in their vegetation. At YBS 3, three periods of
predominantly rising l·iater levels are seen at - 5.71 m.O.D., - 4.70
m.O.D. and- 4.18 m.O.D. At YBS 9, two of these phases are
recognised at - 4.57 m.O.D. and- 4.27 rn.O.D. which correspond >1ell
with the altitude of the upper two phases at YBS 3 although the dates
do not correspond, but this could be due to compression of the
borehole samples from YES 9· In the cores YBS 10 to TIS 14, t',.,ro
periods of rising Hater level are seen in each core, at the base of
the peat and at the top of the pee.. t. The altitudes of these two
events correspond -.·:ell and esive a mean altitude of- 2.44 m ~ 0.20 m.O.I~
for the lowest rise of water level and a me::: .. n a::_ ti ":ui0 of
- 1.97 :n:!: 0.03 m.O.D. for 1-te upper event. At YES 12 and YES 13
a further drjing out of the site is observed above the upper rise of
water level. The date of the lower water level rise is thought to
be~· 4750/4500 B? and there is evidence at Y:BS 10 and YES 13 that
the upper rise dates from ca. 2500 3? Hi th an incre=tse in sal trnarsh
taxa indicating the onset of fully marine conditions at the site.
The diatom anal.)'ses of the boreholes indicate that the l.Ji-.'est
rr,in""rot;enic deposit f:Jund at YI3S 3, YES lC and YES 14 5.1'8 reL:c;.ted to

- 212 -
changes in the water level at the site and are not bedrock deposits
as first assurr,ed. Above t~e upper peat at both the Yarmouth
Carpark and :Boatyard, shell fragments were recorded in the strata.
These deposits can be rels.ted to the shelly silty clay Hhich l)evoy
(1372) found above the peat :ieposi ts at Yarmouth and v:hich he
assumed to indicate estuarine condi tior.f3 z.cnd fluct•.1ating h'ater levels
at the site. The boreholes taken by Devoy sho1·1 8Vidence of peat
growth corresponding in altitude to the lower peat found in the
present study together with peat growth corresponding to the upper
peat of Yarmouth Boatyard. At one borehole in the Devoy study
(YB 2) the peat growth has an altitudinal range from- 4-75 m.O.D.
to - 2.15 m.O .D. which spans the altitudinal range from Yc.rmouth
Boatyard and Carpark. Devoy also finds evidence of peat growth at
much lower altitudes, - 5-75 m.O.D., - 6.25 m.O.D. and- 9.85 m.O.D.
than found in the present study. Devoy shows peat growth be5a."1
ca. 4750/4500 BP and ends ca. 3750/3250 BP. A series of boreholes
tal(_en by the Wimpey Company (1973) close to the northern edge of the
Carpark site showed peat growth from altitudes of- 3.10 m.O.D.,
- Li.05 !:i.O.D. and- 6.80 m.O.D. i-.'hich again correspond with the
lowest peats found in t~e presen~ s~udy.
At YE..rmouth this work has s~own that peat accumulation at the
site is synchronous. The altitude differences between the peats
is thought to be the result of t~e topography of the sites ~"ld
could also explain the lack of biogenic sediments at YES 4, YES 5,
YES 6, YES 7 and YES 15, ',.;here a rise in the land surface would not
allow the accCJ.mu~ation of peat material. At Yarmouth the evidence
presented suggests initiation of peat growth after~· 6385 EP as
a result of a drop in the local ~ater level at the site. This
ea::-l.r grov;th is seen in YES 3 and YES 9. Peat deposits continued to

.~-·-------------------------------------------------- 213 -
c..ccunulate in these bo:reholes and by ca. 4750/4500 JP growth \·:as
initiated at YES 10, YES 12, YBS 13 and YBS 14. h. drying out of the
site is recognised in al1 t.oreholes 'd~ th a renewed rise in the local
Hater level at ca. 2500 BP. The change-over to minerogenic
sedimentation post dates ~· 2500 BP and varies greatly in e.l ti tude
from- 4.07 m.O.D. at YES 2 to- 1.62 m.O.D~ at YBS 12. The microfossil
evidence indicates this upper minerogenic deposition was during
marine conditions at t~e site.
Thus at the Yarmouth site we see that there is a rather complex
history of sea-level movements. Two phases of positive sea-level
tendency are recognised and one period of negative sea-level tendency.
Due to the topographical configuration ·Of the site, the altitudinal
range of these events varies considerably. The first period of
positive sea-level tendency is dated prior to~· 6385 BP with an
upper contact ranging in altitude from- 6.55 m.O.D. to - 4.57 m.O.D.
This is followed by a period of negative sea-level tendency which is
dated from ca. 6385 BP to ca. 2500 :SF. 'l'his phase involved s. series
o:' fluctuating local water levels at the site which are reco:rded in
the pollen spectra. The second phase of positive sea-level tendency
is dc:tted post ca. 2500 :SP v;ith an altitude :c-:ms-e of- 4.07 t,.o.D.
to - 1.62 m.O.D. when fully marine condi-tions we:re expe~ie~ced at
the Y2.rmouth· site.
4:3:4 The Pett Level Site
At Pett Level in Sussex there is evidence for two cajor periods
of minerogenic sedimentation together with two main periods of
biogenic seuimentation (Fi6ure 44). These deposits are thought to
ha.ve accumulated during the Flandrian Age and lie on a bedrock of
C~etaceous .:'1.:3hdo~:n. Sancls e:.nd Fe;.irli;-'r~t Clays.

- 214 -
The lowest minerogenic deposit is found at Pett la and Fett 2a.
In both 'ooreholes it occurs 2.s a clay plus silt. It is not :.'CEsi~Js
to state the altitude of tte lower contact of this deposit as it
was found at the bottom of the boreholes. The upper contact is
1:ith a b:iof!;·enic horizon and varies in altitude from- 2.58 r:.O.:U.
to - 2.26 rn.O.D. The lowest biogenic oaterial found at Pett Level
is only present c..t Pett la and Fett 2a and is a woody r·eco.t v.'i th
traces of silt o.t Pett 2a. 'l'he uppe:::- contact of ttis peat varies ir:.
altitude from- 2.19 m.O.D. to- 1.96 m.O.D. ~nd is seen to possess
a sharp lithological boundary in both cases. The upper miLerogenic
deposit is found at Pett 1, Pett la, Pett 2a and Pett 3 and varies
from a pure clay at Pett l a c.nd Pett 3 to a silt plus clay at Pet t l a
~nd Pett 2a. P~ain it is difficult to determine the lower contact
altitude as the deposit 11as not reached at Pett l G.nd Fett 3. The
upper contact of the minerogenic deposit is with a peat at Pett 1,
Pett 2a ~nd Pett 3 and varies in altitude from- 1.62 rn.O.D. to
- 1.40 m.O.D. The upper biogenic ho:::-izon is found c.t Pett l, Pett 2,
.?ett 2a and Fett 3 and has a ver'J' shcTP lower li tbological contact
at Pett 2a c-.nd Pett 2· The upper contc.ct of this peat is at ground
1evel as it is exposed on t.be :o:::-estore. It varies :fr·om- 1.~,5 m.C.D.
to - c.es; r:;.O • .J. .".. tTansi tional zone of si~ ty-peat is foLmd tH?.tv;esn
2.ltitudec; of- 1.14 rr:.O.D. -:,o- 1.30 m.C.D. at Pett 2a ancl oeh;een
- 1.01 ffi.O.D. to - 1.24 rn.O.D. at Pett 3. At ?ett 4 no clear
rr:inerogenic and biogenic strata can be ciscerned but the presence of
r;redominantly biogenic sediments sho1·1ed that peat accumulation at
tne site continued to an altitude of+ c.03 fil.O.D. although it rr.ust
te ren,er:bered that erosion by i\i'J.Ve action is occurring at the present
day •
.:.-'ollen z..r1:::.J,y;:;es (Scc+ion 3:L:2) \':el'e cal'ried out at Pett 2, ?e-.t ~

- 215 -
and Pett 4, all these c.nc.lyses reve<"led that .-.lnus pollen is present
at the site in very great numl:::ers indicating that the site cah be
described as having a vegetation of Alder fen with localised
communities indicative of otter habitat conditions. It is these
localised comn,unitie<; that -v;ill be de~ccribed in the following
section ren1en:bering that they occur as a background to the predominant
Alder fen of Pett Level.
At Fett 2 (Figure 45) the pollen of the bottom levels of peat
revealed c..n .~-.lder carr environment ( LPAZ P2: l) with l OCiilised swan:p
conditions sho1m by the pollen of Lythrum, Alisma and Frangula. 'I'his
passes into a 't;etter environment (LPAZ P2:2) with the expansion of
Alnus pollen. The top levels of peat showed an increase in damp
conditions at the site with localised damp fen habitats shown by the
pollen of Frangula, Mentta. and Rubiaceae toget~~er Hi th rising v;ater
levels c.nd marsh conditions with Plantaginaceae, .Artemisia,
Composi tae liguliflora and high Cyperaceae pollen. Localised open
Hater conditions c.re seen in tte pollen of Mvriophyllum and Fotamogeton.
At Pett 3 (Figure 46) the pollen analysis showed a sequence of
differing vegetation communities reflecting fluctuat~ng ~ter levels
at the site. The base of the peat (LPA~ P3:l) has pollen indicators
of high >.-ater levels with ITiarsh t&xa of Chenopodiacec.e, Arts;nisir:..
and Compositae tubuliflora together with h~~h Cyperaceae pollen
values. This passes into an environn,ent of expanding Alnus pollen
(LPAZ P3: 2) and marsh indicators of Chenopodiaceae, Composi tae
tubuliflora and Plantagin~ceae pollen. The top levels of peat
revealed a d:-ier environment (LPAL". P3:3) of h.lder carr v.-ith an
expansion of Corylus pollen and the d.)•ir;g back of ac;uatic pol] en
to[;ether Hi th less marsh pollen indj catOTs. At Pett 4 the biogenic
and II!inero,;;·er:ic str·c_ t a \·.ere exam:i ned for their pol J en conta,,t

- 216 -
(Figure 47). The lowest levels of the lliaterial revealed a damp
fen env irom1!ent ( L?.4Z P4: l) Hi th "che poll en of Rhamnus, Frangul a,
Cruciferae 2nd hanunculus-tjpe. 'l'h.is environliient is carried on
c:,bove (LPAZ P4:2) Hith O_;Jer: v:ater conditions reflected at the site
b.)· H"e pollen of Potamogeton and l':,yriophylluG, tcgetner hi th locctl
reedswamp conditions sho'tm by lvtbrum, Cruciferc.e, Ty::;ha e:.ngustifolia
and Typha latifolia pollen. These conditions <u·e carried on to
LPAZ P4:3 v1ith .::.lisma and ?ote:unogetcn pollen iridic:1ting open V.'ater
conditions, with marsh communities shoKn by the pol~en of Compositae
species, .i,rtemisia, Chenopodi.aceae and Plantaginaceae. A drying out
of': the site is experienced above (LPAZ P4 :4) with no open Hater taxa.
i'l'etter conditions return ;.;i th an increase in the v;ater level of tte
site (LPAZ P4:5) shown by the pollen of Cyper·aceae and damp fen
conditions. Saltmarsh taxa expand in LPAZ P4 ;6 with Composi te:.e
species, Artemisia, Chenopodiaceae and PlantCI.ginaceae pollen cu~d
open water indicators of Alisma C;.nd Fotamogeton polJ en. 'l'he uppeT
levels of material show localised reedswamp (LPAZ P4 :7) witt Lytbrurr:,
'3',ypha c.n&"ustifolia and Typha latifolia pollen.
ll.t Pett Level C::tere c.ppeG.rs to be evidence for tv;o periods of
positive sea-level tendency togetter witt t~o periods of ne~ative
sec.-level "cender.c,Y. E·;idance for tl:e first _;::,)Ja~;e of ;•osi ti·;e
sea-level tendency lies at tLe 1::ase of Fett la and ?ett 2a v.·here
minerogenic sedinents are found. 'The change-over frorr. m arir.e to
terrestrial facies occurs over an altitude r·ange of - 2.58 m.O.D.
to- 2.29 G.O.D. l:o dates are available for tbis phase. T:C1i,, is
followed by a period of ~egative sea-level tendency, seen at Fett la
and Pett 2a when peat 2ccurmlated. I\o dates c.re avc:,ilable for this
period but the change-over from terrestrial to n:arine fc.c::.es occurs
~ithin an altitude ra~ge of- 2.19 G.O.D. to- 1.96 ~.O.D. ana La3

- 217-
a sharp li tbological boundary. '=.'he second phase of 3-•osi tive sea
level tendency is seen at Fett 1, Fett la, Fett 2a and Fett 3. The
change to terrestrial f::J.cies occurs ove~ an altitude r<mge of
- 1.62 m.O.D. to- 1.40 m.O.D. and appears to have occurred rc::.pidly
::;.s the lithological boundary is \'erJ' sh:>.rp at bott Fett 2a end
Fett 3, but this could be due to subaerial erosion of the top levels
of tte minerogenic material. '1')-,e ctenge-over is de ted ce. 5670 BF
(after Thorley 1981) and represents the end of the positive ptase of
sea-level tendency. The follov:ing pericd of pec::.t accun:ulation is
dated from ca. 5670 BP to post ca. 2500 BP (.jadwin 1940) and rq:resE:nts
a period of negative sea-level tendency.
Thus at the Pett Level site two periods of positive sea-level
tendeccy are recognised. The firHt of these phases occurs prior
to ca. 5670 BP with the change-over to terrestrial facies occurring
over an altitude range of - 2.5b m.O.D. to - 2.29 m.O.D. The
second phase of positive se~-level tendency at Pett level covers an
altitude r:_cnge of- 2.19 m.O.D. -:o- 1.96 rr..O.D. and ended ca. 5670 I3F.
4:3:5 The bro~ndown Site
The borehole material supplied froc Bro~niow~ reve~led only
one period of ~iogenic CiCcLunuJ ation \·r.:.. tLin n sequer~ce of t.~insrozsni8
deposits of Flandrian Age.
'l'he predominantly organic material, found at Broi>ndown 13/14 53,
was recovered bet~een altitudes of- 19.38 m.O.D. and- 19.20 rr..O.D.
This was a ~il ty-peat which lies above a sil t-sa.nd c.r:.d ~~·as::ces
through a peaty-silt before true cinerogenic dsposits are reacted
at- 19.01 m.O.D. 11.tove the biogenic ma.terial, 9.26 o of n,ixed
clayfc; and silts v1ere reco::;n~sed i·:ith a sandy ~eposit c.t L1e to_o of

- 218 -
the borehole sa.rnple from - 9.74 rn.O.D. to - 9.40 m.O.D.
'I'te particle-size anal,y·sis (Sec+.ion 3:5:2) of t!:.is core
(Figure 50) shov1ed that below the organ::_c strata, Lhe dspos:it is
a sandy-silt loam while CJ.bove tte organic strata there 2<re c:ilty-cla;y's.
The upper sandy deposit noted in the field analysis is recognised
in t.he particle-size :anaJysiE as a sc.ndy-sil t loam passir,g into a
sandy loam c.bove. Pollen ,.nalysis ·,·:as perforH,ed on the org2.nic
rr:aterial and U.e results can be seen in Figure 51. h. nur.,ber of
different vegetation communities were observed. ~he bc.se of the
organic oaterial indicates the presence of a relatively dry scrub
Oak woodland (LPAZ B 36:1) with local heattland habitats shown by
the pollen of Ericaceae and the spores of Pteridium. This scrub
woodland passes into a wetter carr environment Kith Plantaginaceae
and Typha angustifolia pollen (LPAZ B 36:2a). Above this is a
shrubby fen S\oo'aiJip environment with increasing Chenopodiaceae
and l'Jyriophyllum pollen (LPAZ B 36:2b). The upper levels of orgc.nic
EJQ.terial are indicative of a wet sv;a.r.,p with Saxifrc..giacec.c ,,_nd
Fote:cr:.ogeton _.ollen (LPAZ B 36:3) and the rise of Chenopociacec.e
pollen ~hich is indicative of saltmarsh conditions c.t
'::.'he di.atom :cnc.~ys:.s of the .D:;o·,:ndovm core sho· .. ed tL::ct e:.bove ";>_s
crgc..Eic de,::-o:::.it, r.o .F'resh1:ater c::.2torus were rscovered in ':··ube 36,
but only Brackish and 11iei.rine tn:es (FigC~re 52) but in the r..:.xsd
clays and silts of Tubes 26 c.nd 28 lFigure :<)a) Fresh·1,2. ter eli :cd.oms
do appear.
The change-over from bio0enic to r:.ine:coc;snic :cs:imsntation lS
taken at an altitude of- 19.20 r.,.o.D. and !-Jas been dated c.s
ca. 7100 BP (after \'lest 1970). '.chis cham;-e-over \-;as gradual and
is reflected in tne pol~en ::"ecorus t.,y c. :'Sr=-dual t::.·a..nsi tion to ro;a:r-~r;s

- 219 -
conditions at the site. Thu~ at Browndown 13/14 53 we have
indications of a positive phase of sea-level movement with an
altitude of- 19.20 rn.O.D. and has been dated in the range from
ca. 8190 BP to ca. 71CO BP.
4:4 RSGIONAL SYNTHESIS OF EVIDENCE FOR SEA-LEVEL 1WVEl•1ENT FROM
SITES STUDIED.
In this section it is proposed to treat the South Coast on a
regional basis and to assess the environmental changes within these
regions before an attempt is made to identify changes within the
depositional environment over the whole South Coast. Three regions
have been delimited; The Poole Harbour Region will include data
from The Moors Site and the Studland Heath Site. The Selent Region
will include the Yarmouth Site together with the Browndown Site and
the Sussex Region will deal with data from the Pett Level Site.
4:4:1 The Poole Harbour Region (Figure 1).
A number of features is common to The Moors Site and Studland
Heath Site: They are both situated to the west of The Arne Peninsula
and tbe South Haven Peninsula respectively, and as such are protected
from the entrance to Poole Ha:r':Jour. Both sites are underlain by a
bedrock of Eocene Bagshot Beds. The two sites also display one
period of minerogenic deposition and a single period of biogenic
accumulation. The Moors Site has suffered disturbance by the actions
of man in the form of drainage for land management and the
construction, to the north of the site, of a sea defence. The
Studland Heath Site has also had a disturbed history but not at the
hands of man. The site lies on the west of South Haven Peninsula
which is a mobile .spit environment undergoing morphological changes

- 220 -
during its history.
At The .Moors Site there is evidence of peat accwnulation
dating within the age range~· 4950 BP to ca. 2950 BP, which
shoHs a sequence of cha'1ging environmental conditions from damp
Alder carr to saltmarsh conditions upwards through the peat. This
peat is overlain firstly by a coarse silt and clay which passes
into a finer silty-clay. The altitude of the lower contact of this
minerogenic material varies from + 1.11 m.O.D. to - 0.04 m.O.D.
At the Studland Heath Site there is also evidence of peat
accumulation within the age range of~· 4950 BP to~· 2950 BP,
which shows the local vegetation changing from a damp Oak-Alder carr
to a more intertidal environment with saltmarsh taxa present. The
peat, which is of a very limited lateral extent, is overlain by a
predominantly silty-sand deposit and upwards to a finer sand and
silt. The altitude range of the lower contact of the minerogenic
material is from + 0.11 m.O.D. to + 0.56 m.O.D.
lt has alrea.dy been suggested thc..t these lithological sequences
are the result of a rise of sea level in the local area, perhaps
accompanied by a breaching of a barrier across the entrance to
Poole Harbour. If this was the case, it would explain the coarser
sedimentation above both peat deposits, indicative of a higher energy
environment, followed by a lower energy deposition with a finer
particle-size fraction as displayed at both sites. This minerogenic
material is seen to be Brackish/Marine in nature by the diatom
analyses at-The Moors Site. As previously suggested, had such a
breach occurred the Studland Heath Site would register the change of
depositional environment more clearly than at The Noors Site (Carter
1982), which is some 7 krn further away from the harbour entrance.

-.221 -
'l'his can be seen in the tidal_ range at both sites; at The Moors Site
the range of Spring Tides is 1.5 rn while at Studland Heath this
range is 1.7 m. At Studland Heath there is evidence of the truncation
of peat growth with a shar·p li tbological boundi:iry wi tl.tin the
sedimentary sequence, as would be expected with a sudden inundation
of the site. At The Moors the change-over from biogenic to
minerogenic sedimentation is more transitional in nature with no
sharp breaks in the lithological sequence. This change-over is
marked at a highE-r altitude at Studland Heath, from + 0.11 m.O.D. to
+ 0.56 m.O.D. compared to - 1.11 m.O.D. to - 0.04 m.o.D. at The
Moors Site.
Thus the upper minerogenic rr.aterial at both sites is thought to
have been deposited synchronously as the result of the breaching of a
barrier across the entrance to Poole Harbour, in the age range from
~· 4950 BP to ca. 2950 BP, resulting in the inundation of the sites
by marine conditions.
4:4:2 The Solent Region (Figure 1).
The Yarmouth and Browndown Sites are over 27 krn apart but are
treated together. Both sites are located on the margins of the
Solent; the Yarmouth Site is on the shore of the Isle of Wight
while the Browndown Site is on the north-east shore. The deepest
records of peat in this study are found in this region. The tidal
conditions of the Solent are very complex with a double peak of high
water and of Spring Tides. At Yarmouth the range of Spring Tides is
2.5 m while·at Browndown it is 3.6 m.
At the Erowndown Site a single phase of positive sea-level
tendency is recognised at an altitude of- 19.2 m.O.D. and has been

- 222 -
dated in the range from ca. 8190 EP to ca. 7100 BP.
The Yarmouth Site reveals a stratigraphic sequence of strata
with a complex history of deposition. At Yarmouth Carpark two
periods of minerogenic sedimentation were recognised with one period
of biogenic accumulation. At Yarmouth Boatyard there is a possibility
of three periods of minerogenic sedimentation together with two
periods of biogenic accumulation. It has already been shown (Section
4:3:3) that the biogenic accumulation was synchronous over the whole
site, although peat accumulation began later at Yarmouth Boatyard.
Thus at the Yarmouth Site we have evidence of the initiation of peat
growth after~· 6385 BP at YBS 3 and YBS 9, in the altitude range
of - 6.55 m.O.D. to - 4.57 m.O.D. This accumulation of biogenic
sediments continued and by ~· 4 750/4500 BP peat growth was initiated
at YBS 10, YBS 12, YBS 13 and YBS 14, within an altitude range of
- 2.80 m.O.D. to - 2.25 m.O.D. The pollen spectra reveal a drying
out at the site with a range of altitude from- 2.44 m.O.D. to
- 2.03 m.O.D., recognised at YBS 10; YBS 12; YBS 13 and YBS 14
followed by a renewed rise of the local water level dated ca. 2500 EP
at an altitude of- 1.97 ~ 0.03 m.O.D. This rather prolonged phase
of biogenic accumulation was followed by a period of minerogenic
deposition post-dating ~· 2500 BP wi tb an altitude range of
- 4.07 m.O.D. to - 1.62 m.O.D.
Thus at Ihe Yarmouth Site there is evidence of an early phase of
positive sea-level tendency before~· 6385 BP, this being followed
by a period of negative sea-level tendency with a lower contact
altitude varying from- 6.55 m.O.D. to- 4-57 m.O.D. and dating in
the range from ~· 6385 BP to ~· 2500 BP. A renewed rise of I·Jater
level at the site is seen during this negative phase of sea-level

- 223 -
tendency at ca. 2500 BP with an altitude of- 1.97 ~ 0.03 m.O.D.
The last period of positive sea-level tendency is seen across the
site with an altitude range of- 4.07 m.O.D. to- 1.62 m.O.D. and
has been dated post ca. 2500 BP.
At the Yarmouth and Browndown Sites there is evidence of a change
of iepositional environment in the upper minerogenic de~osit. Coarse
bands of silts and sands run through the boreholes at Yarmouth and
an upper sandy deposit is seen at Erowndown. These horizons would
indicate deposition in an higher energy environment, which is
probably due to local tidal regimes or to channel development at the
sites. There is no evidence for the abrupt truncation of peat
growth at either site as both sites display a gradual transition to
minerogenic sedimentation from biogenic accumulation. This shows
that ~arine inundation at the sites was gradual occurring over a
relatively long period of time.
The Solent Region displays evidence of at least three periods
of poai tive sea-level tendency but the events at Yarmouth and
Browndovm car,not be linked temporally. 'l'he first phase of positive
sea-level tendency is seen at br::Jwncio-.m at ::.n altitude of- 19.2 m.O.L.
iilld has been dated in t~1e ran,se =~ro~, ca. El90 BP to ca. 7100 BP.
The second phase of positive sea-level tendency is reco6nised at
Yarmouth and is t~ought to be before ca. 6385 BP. This is followed
by a period of negative sea-level tendency with an altitude range of
- 6.55 m.O.D. to - 4.57 rn.O.D. ~~d is dated in the range from
ca. 6385 BP to ca. 2500 BP. A possible shortlived phase of higher
•-.rater level is seen at Yarmouth at - 1.97 2: 0.03 rn.O.D. and is dated
ca. 2500 BP. The last phase of positive sea-level tendency is
::.'ecognised with an altitude rwge of- 4.07 o.O.D. to- 1.62 rr;.O.D.

- 224 -
and is dated from after ca. 2500 BP.
4:4:3 The Sussex Region (Figure 1).
This region covers a great areal extent, stretching from
Sel sey Bill eash1ards along the South Coast towards Lent. To
facilitate disscussion this region will be sub-divided into The West
Sussex Region and The East Sus.:.;ex ..:legion; the two being divided in
the vicinity of beachy Head. ~he West Sussex ~e~iOL contains no
site studied in this present work but the Pett Level Site is located
in the East Sussex Region.
~he Pett Level Site is found on the foreshore south of Cliff
End. 'I'bis site has submerged forest deposits exposed on the foreshore,
which are being eroded by wave action at the present time. At Pett
Level there is evidence of two periods of positive sea-level
tendency together with two periods of negative sea-level tendency.
The first phase of positive sea-level tendency is thought to have
occ.urred prior to ca. 567C ~p Hi th the change-over to terrestrial
fa.cies occurrinr5 over an altitude range of- c:.58 m.O.D. to
- 2.26 m.O.D. The second phase of positive sea-level tendency
covers an altitude range from- C..l9 m.O.D. to- 1.?6 m.O.D. and is
t~wught to have ended COl:· 5670 EP. This phase revealed a sharp
lithological boundar·y at the change-over from terrestrial to :~arine
facies, which indicates sudden in• . .mdation of the site by marine
conditions. This could be due to a very rapidly rising sea level or
to the over-running of an offshore protective barrier at the site,
although there is no evidence of the latter possibility in the
field analyses of the strata. The end of this phase of posi t::_ve
sea-level tendency also disc] oses a sharp 1 i thological boundary
which could represent a sudden fall of sea level, t~e buildin~ up of
a protective coastal barrier or subOi.srial erosion of the facies by
\'lave action at the site.

±:5 DISCUSSION OF RESULTS - 225 -
It is clear that within each region, local factors play an
important part in- the fluctuations of sea levels. 'l'his is
especially true where offshore barriers are asswned to have been
present at the sites. Evidence of barrier development in the present
study was only found at The Moors Site and the Studland Heath Site.
Cunliffe (1980) and Eddison et al. (1983) note the development of
a tarrier system from Fairlight to Hythe but no positive indications
of this barrier were found in the li-thological sequences at the Pett
Level ::ii te.
Each region has a distinct topography: The Poole Harbour
Hegion is a sheltered harbour environment. 'l'he Selent hegion is a
semi-exposed estuarine environment and the Sussex Regions are
exposed environments on the shore of the English Channel. It is
therefore not feasible to make further correlations between events
of sea-level tendencies found in separate regions, although a few
trends do seem apparent (Figure 57) especially from ca. 6500 BP to
the present day.
The evidence presented would support the theory of an
oscillating sea-level curve during the Flandrian Age, but the data
is too imprecise to actually plot a curve to shovl these trends.
4:6 FU'l1 URE RESEARCH NEEDS
'l'here is a need for further investigations of sea-level
tendencies on the South Coast of England and for dating the limits
of the positive sea-level tendencies.
The South Coast of England is very densely populated with a
great nwnber of industrial cooplexes on coastal sites, including
power stations such as the one at Dungeness. Tooley (1979) points
out the problE:ms involved with coastal locations of industry and

- ?26-
settlements in North v/est England but on the South Coast the
problem is more serious. There is a need for future research on
return periods of flood events so th~t adequate coastal protection
can be provided for industrial and urban sites on the South Coast of
England.

- 227-
R E F E R E N C E S
ADMIRALTY. (1983). AdrniTal b- '.:'i je Tacl es· :L'l:c--ooean Waters Includin,;:; the Mediterranean Sea. (l • Hydrogr:tpher of the Navy. Admiralty Hydrographic Department : Taunton.
AJARDH, C.A. (1824). Svstema A:garurr,. (Lund).
A...\EROYD, A. (1972). 1 A.I'chaeoloe7ical and Historical Eviuence for Subsidence in Southern Britain'. Phil. Trans. R. Soc. Lo~d.
A 272, 151-169.
A.lf9ERSEN, S.T. (1976). 'The Relative Pollen Productivity of North European Trees and Correction Factors for Tree Pollen S.;Jectra'. D~n. Geol. Unders. II, 96, l-99·
BARBER, K.E. (1975)· Frel iminary Note 1 •
'Vegetational History of the New Forest: A Proc. Hants. Field Club Archaeol. Soc. 30, S-8.
BIRD, E.C.F and PASKOFF, R. (1979). 'Relationships :Between Vegetation Changes of Land and Sea Level and the Advance and Retreat of Coastlines'. Froc. of the 1978 International Symposium on Coastal Evolution in the Quaternary, Sao Paulo, Brasil. 29-40
BRISTOW, H.W. (1889). Geology of the Isle of Hight. Mem. Jeol. Surv. of England and vial es.
BRITISH STANDARDS INSTITUTION. ( 1967). Methods of TestinF-7 Soils for Civil Engineering Purposes. British St=w1da.rd 1377: 1967, 61-72.
BURRIH, P.J. (1982). 'The Coastal Jeposits of the Southern Heald'. Quat. Newsl. 38, 16-24.
BURRil~, P.J. (1983). 'On the Coastal De.;Josi ts of :S:1st Sussex: A Further Corn;aent'. ({uat. Newsl. 39, 29-31.
BYRNE, S. (1975). the Flanrl.rian.
Environmental Changes in Poole HaT-c.our liuring Unpubl. B.A. Thesis. University of Durham.
CARTER, E.H.J. (1982). 'Barrier Breaching'. (.,;uat • .Kewsl. 38, 29-32.
CHURCHILL, D.I,L (1965). 'The Di spl ace;nent of Deposits Forned at Sea Level, 6500 Years Ago in SoutheTn Britain'. Quaternaria 7, 239-249.
CLEVE, P.T. (1868). Vet-Akad. Fohandl.
'DiatOQaceen fran Spetsbergen'. 1867, 24, 661-6{0.
Ofv. L:d.
CLEVE-EULER, A. (1951-1955). 'Die Diatomeen von Schweden und Finnland'. Kungl; Svens. Vetensk. A':ad. Handl. (Ser. 4), 2:1, l-163. 3:3, l-153· 4:1, l-158. 4:5, l-255· 5:4, l-232.
CUNLIFFE, B.W. (1980). 'The Evolution of Romney I'.arsh: Preliminary Statement'. In Tho:n:;Json, C .F .A. (Ed.) ArchaeoloPT and Coasta.l Change~. The Soc. of .l'mtiquaries, Occasional .'"a~J. ',.,el-i ;:;e:c·; _:_, .-~7-~5·

- 228 -
CUSHING, E.J. (1967). 'Evidence for Differential PollEn ~·es0rvation in Late Quaternary Sediments in ~innesota'. Rev. Palaeobot. Palyn. 4, 87-10:.
DAVIS, M.B. and :UEEVEY, E.S. (1963). 'Zstimation of Absolute Pollen Rain from Pollen Frequencies in Sediments of }~nown AccurLI..:lation Rate'. Ecol. Son. i.r.::e:dca Bull. 44(3), 1293-1295·
DEVOY, R.J.N. (1972). Environmental Changes in the Solent Area During the Fl andri an Era. Unpubl. B. A. Thesis. Uni. of Durham.
DEVOY, R.J.N. (1982). 'Analysis of the Geological Evidence for Holocene Sea-Level I•iovements in Southeast England'. Pro c. Geol. Ass. 93(1), 65-90.
d 'OLlER, B. ( 1972). 'Subsidence and Sea-Level li.i se in the Thames Estuary'. Phil. Trans. R. Soc. Land. A 272, 121-130.
DUl\H.ftJ.1, K.C. (1972). The Regional Setting. In Dur:harn, K.C. and Gray, D.A. (Eds.) A Disscussion on Problorr:s Associated rli th the Subsidence of Southeastern England. Phil. Trans. R. Soc. Land. A 272, 81-86.
DYER, K.R. (1975). 'The Euried Channels of the 'Solent River',. Southern England'. Proc. Geol. Ass. 86, 239-245.
EDDISON, J. (1983). 'Flandrian Barrier Beaches off the Coast of Sussex and Southeast Kent'. Quat. Newsl. 39, 25-29.
EDDISON, J., CARR, A.P. and JOLLIFE, I.P. (1983). 'Endangered Coastlines of Geomorphological Importance'. Geog. J. 149 (1), 39-53·
EDMUNDS, F.H. (1935). British Regional Jeology: The Wealden District. H • .M.s.o.
ERDTMP..N, G. (1921). 'Pollenanalytische !Jr,tersuchungen von Torfmooren und Marin en Sediment en in Stidwest-SchvTeden'. Arki v. f~r Bot~Dik Ed 17 (10). Stockholm.
ERDTMAB, ::;.. (1943) •. m Introduction to Pollen LDalvsis. ·.-ialtha;:,, L'S • .:...
EVERA..qD, C.E. (1980). On Sea-Level C:C,anges. In Tho:npson, C.F.A. (Ed.) Archaeology and Coastal Change. The Soc. of Antiqua::-ies, Occ. Pap. (New Series) 1, l-23.
FAEJRI, K. and IVERSEN, J. (1950). Textbook of Modern Fallen Analvsis. Copenhagen.
FAEJRI, K. and IV&.qsEN, J. (1964). Textbook of Pollen Analysis. Hafner Publ. Co. liew York.
FAIRBRIDGE, R.W. (1958). Quaternary Sea Levels'. 471-482.
'Dating the Latest Movements of the Trans. N.Y. Acad. Sci. Series 2.20,
FLSMkiNG, 11. C. ( 1982). 'Nul tipl e .hegression Analysis of Earth kovements ancl Eustatic Sea-Level Change in -::he Uni tee~ }"ingdor'l in the Past 90CO Years'. Proc. :;eo::.. Ass. 9.3 (l), 113-125.

- 229-
J.ILBEHTSON, D.D. (1967). Post-Glacial Sea Levels in Poole Harbour Dorset. Unpubl. B.A. Thesis. Uni. of lancaster.
JOD\HN, H. (1}40). 'Pollen Analysis and Forest History of Englund and 'wales'. llew Phytol. 39, 308-321.
JODWIN, H. (1962). 'Vegetational History of the hentish Chalk Downs as seen at Wingham and Frogholt'. Ver~ff. Geobot. Inst. Rubel. 37, 83-99·
GODWIN, H. and GODVIIN, M.E. (1933). 'British .Maglemos-e Harpoon Sites'. imtiquity 7, 36-42.
GODiVIN, H. and GODWIN, M.E. (1940). 'Submerged Peat at Southampton'. New Phytol. 39, 303-307.
J.ODWIN, H., SUGGATE, R.P. and 'vil_LIS, E.H. (1958). 'Hadiocarbon Dating of the Eustatic Rise in Ocean Level'. Nature 181, 1518-1519.
J:ODVJIN, H., 1tlALhER, D. and ltiiLLIS' E.H. (1957). 'Radiocarbon Dating and Post-J:lacial History: Scaleby Moss'. Proc. H. Soc. B 147, 352-366.
GOUDIE, A. (1977)· Environmental Change. Clarendon Press. Oxford.
HASKINS, L.E. (l97F). The Vegetational History of South-East Dorset. Unpubl. Ph.D. Thesis. Uni. of Southampton.
HEN DEY, N • I. An Introductor
HEYWORTH, A. (1978). Submerged Forests Around the British Isles: 'l'heir Dating c..nd helevance as Indicators of Post-Glacial Land c..nd Sea-Level Changes. In FLETCHER, J. (Ed.). Dendrochronolo~y in Europe. B.A.R. International Series 51: ~79-288.
HODSON, F. and WEST, I .M. (1972). 'Holocene Deposits at Fawley, Hampshire and the Development of Southampton 'i1ater 1
• Proc. Jeol. Ass. 83, 421-441.
II
HUSTEDT, F. (1927-1962). Die Kieselalagen Deutschlands, Oesterreichs und der Schweiz. (I-III). In RABENHORS'l', 1. (Ed.) Kr,v-ptogamen. Leipzig.
HYDE, H.A. (lSSO). 'Studies in f..t.mospheris Pollen. IV Pollen Deposition in Jreat Britain 1 • :t<:ew Phytol. 49, 398-406.
IVEhSEN, J. (1937). 'Understlgelser over Lito:rirln,t:rangressione i D01runark 1
• Medr. Dansk. Geol. Forenen. 9, 223-232.
IVERSEN, J. (1944). 'Viscum, Hedera and Ile:% as Climatic Indicators'. Geol. Foren. Stockh. Forb. 66;3, 463-48~
IVERSEN, J. (1947). 'Centaurea cyanus Pollen in D:1nish Late-Glacial Deposits'. Medd. Dansk. Geol. Foren. II:2, 197- 1
JAl\'lES, H. (1847). 'On the Section Exposed by the Excavation at the New Steam Basin in Portsmouth Dockyard'.. Q. J. Geol. Soc. 3, 249-251.

- 2.30 -
<1A.H.Dil~E, W. J. (1975). 'Chronology of Holocene l•.1.arine Transgression and Regression in South-West Scotland'. Boreas 4, 173-196.
J ELGERSMA, s. ( 1961). 1 Holocene Sea-Level Changes in the :Netherlands' • fueded. Geol. Sticht. Serie C-VI, 7, l-100.
JELGERSMA, S., BOEP, Th.B. and BEETS, D.J. Sea-Level Changes in the Netherlands'. Meeting Belgium, Netherlands, Germany.
(1975). 'New Data on Juidebook INQUA Shoreline
JElHGliGS, s. and S!V;YTH, c. (l982a). 'A Preliminary lnterpretation·of Coastal Deposits from East Sussex'. <(uat. Newsl. 37, 12-19.
JENN UGS, S. and SMYTH, C. of the Sout~'lern Weald"'.
(l982b). 'A Reply to "The Coastal Deposjts Quat. Newsl. 38, 24-29.
JENNINGS, S. and SMY'l'H, c. (1985). 'The Origin and Development of Langney Point: A Study of Flandrian Coastal and Sea-Level Change'. ~uat. Newsl. 45, 12-22~
JONASSEN, H. (1950). Poll en Diagrams'.
'Recent Pollen Sedimentation and Jutland Heath Dansk. Bot. Arkiv. V 13, 7, 1-
JOimS, D.k..C. (1981). South East and Southern England. l'iethuen. London.
JO'viSEY, P.C. (1966). 'An Improved Peat Sampler'. l~ew Phytol. 65, 245-<:Lj8.
r..IDSON, C. and HEYWOhTH, A. (1979). 'Sea Levels'. Proc. of the 1978 International Symposium on Coastal Evolution in the Quaternary, Sao Paulo, Brasil. l-28.
KING, C.A.M. (1972). Beaches and Coasts. Arnold. london.
LEWIS, W.V. and BALCHIN, W.J.V. (1940). 'Past Sea Levels at Dungeness'. Geogr. J. 96, 258-285.
LYELL, C. (1853). Principles of J.eology. John lvmrray. London.
l•.:.ACFAH.LANE, I.C. (1965). 'The Engineering Characteristics of Peat'. Proc. lOth ll>uskeg Research Conference l;ational heaearch Council of Canada. Associate Comrni ttee on ::Joil and Snow Mechanics. 'l'ech. lV,em. 85
l11ERK'I', Jo and STREIF, H. (1970). 'Stechashr Bohogerate fur Liminische und Marche Lockersedimente'. Jeol. J. 88, 137-146.
hEYEH., C .J .A. (1870). 'On the Lower 'I'ertiary Deposits Recently Exposed at Portsmouth'. Q. J. Geol. Soc. 27, 74-89.
kiLLER, U. ( 1964) o 'Diatom Floras in the ~uaternary of the J.ota River Valley'. Sver. J.eol. Undo 44, l-67 o
fi,OORE, P.D. and WEBB, J.A. (1978). An lllustrated Guide to Pollen Analysis. Hodder and Stoughton. London.
MORNER, N-A. (1969). 'Eustatic and Climatic Changes During the Last 15,000 Years'. Geol. en Mijnb. 48, 389-399·

- 231 -
r·10R1ER, N-A. (1971). "I'he Holocene Eustatic Sea-Level Problem'. Jeol. en Mijnb. 50, 699-702.
1•'J0li.NER, N-A. (1976). 'Eustasy a.nd Jeoidal Changes'. J. ~eol. 84, 123-151.
PENNINGTON, W. (1970). 'Vegetational History in the North-West of England: A Regional Synthesis 1 • In viALKEli., D. and WEST, R.G. (Eds.) Studies in the Vegetational History of thE British Isles: Essays in Honour of Harry Godwin. Cambridge Uni. Press. 266, 41-79·
REID, C. (1893). 'A Fossiliferous Deposit at Stone, on the Hampshire Coast'. ~. J. Geol. Soc. Lond. 49, 325-329.
SCAIFE, R. G. (1982). 'Late Devensian and Early .F'l and:cian \t egetational Changes in Southern Britain'. In LIMBREY, S. and BELL, M. (Eds.) Archaeological Aspects of Woodland Ecology. B.A.R. International Series 146, 57-74·
SEAJHIEF, S.C. (1959). 'Pollen Diagrams from Southern England: ~~a..11ehaiTJ, Dorset and Nursling, Hants.'. :New Phytol. 58, 316-325.
SEAGRIEF, S.C. (1960). 'Pollen Diagrams from Southern England: Cranes 1'1oor, Hampshire'. New Phytol. 59, 73-83.
SEAGRIEF, S.C. and GODWIN, H. England: Elstead, Surrey'.
(1960). 'Pollen Diagrams from Southern New Phytol. 59, 84-91.
SHEPARD, F.P. (1963). 'Thirty-Five Thousand Years of Sea ~evel'. Essays in l11arine Geology. Uni. of S.California Press. Los Angeles, l-10.
SHEPHARD-THOR:N, E.li.. (1975). 'The ~uaternary of the Weald: A Review'. Proc. Geol. Ass. 86, 537-547.
SHORE, T.W. (1893). 'Hampshire Mudland and Other Alluvium'. Pap. Proc. Hampsh. Fld. Club 2, 181-200.
SHORE, T.W. and ELWES,J.~i. (1889). "l'he New Dock Excavation at Southampton'. Pap. Proc. Hampsh. Fld. Club 1, 43-56.
SHOT'l'ON, F.W. (1967). 'The Problems.and Contributions of l••ethods of Absolute .0ating viithin the Pleistocene Period'. ~· J. Jeol. Ass. L:'2, 357-383.
SMI'I'H, .D.E., CULLINGFOHD, R.A. and BROOKS, C.L. (1983). ''Flandrian Sea-Level Changes in the Ythan Valley, North East ~cotland'. Earth Surface Processes and Landforms. 8, 423-438.
SlviiTH, W .M. (1853-1856). A Synopsis of l3ri tish Diatomc..ceae. V 1, 1853; V 2, l8j6. London.
SMITH, A.G. and PILCHER, J.R. (1973). 'Radiocarbon vates and Vegetational History of the British Isles'. New Phytol. 72, 903-914·
STRAHAN, A. Weymouth.
\1098). The Geology of the Isle of Purbeck and Mem. Geol. Surv. lfL.

- 2·.- -
TAUBER, H. (1965). 'Differential Pollen Dispersion and the Interpretation of Pollen Diagrams'. Dansk. ~eol. Unds. Series II. 89, l-69.
TAUBER, H. (1977). 'Investigation of Aerial Pollen Transport in a Forested Area'. In CLAYTON, K. (Ed.) Xth IN~UA Congress, Birmingham 1977 Abstracts.
THORLEY, A.J. (1981). 'Pollen Analytical Evidence Relating to the Vegetational History of the Chalk'. J. Biog. 8, 93-106.
TOOLEY, M.J. (1979). 'Sea-Level Changes During the Flandrian Stage and the Implications for Coast Defence'. Proc. 1078 International Symposium on Coastal Evolution in the Quaternary. Sao Paulo, Brasil. 502-533·
TROELS-SMITH, J. (1955)· 'Karakterising of 1¢se Jordarter•. Dansk. Geol. Unds. IV, 3, l-73·
THOELS-SIUTH, J. (1960). 'The Muldbjerg Dwelling Place: An Early Archaeological Site in the Aamosen Bog, West Zealand, Denmark'. Smithsonian Report for 1959· Publ. 4413.
VALEN'l'IN, H. (1953) • Isles'. Geogr. J.
'Present Vertical Movements in the British ll9, 229-305.
VAN DE PLASSCHE, 0. (1982). 'Sea-Level Change and .vater-Level Movement in the Netherlands'. Free Uni. of Amsterdam.
VAN DEn WEHFF, A. and HULS, H. (1958-1974). Diatome~nflora van Nederland. (l-10).
VON POST, (1916). 'Forest Tree Pollen in South Sweden Peat Bog Deposits'. Pollen et Spores. V 9· (3), 375-401•
WATON, P.V. (1980). 1 Himsmoor, Dorset: Pollen Becord from Late Boreal to Present in Eighteen Metres of Peat'. Quat. Newsl. 30, 25-
WATON, P.V. (1982). '.Man's Impact on the Chalklands: Some New Pollen Evidence'. In BELL, M. and LIMBHEY, s. (Eds. ). Archaeological Aspects of Woodland Ecology. B.A.R. International Series. 1~6,
WEST, B.J. \l968)o Pleistocene J.eology and Biology. Longmans. London.
WEST, H.G. (1970). 'Pollen Zones in the Pleistocene of J.reat Britain and Their Correlatior:• o New Phytol. 69, ll79-ll83.
ivEST, R .~ o ( 1972). 'Relative Land-Sea-level Changes in Southeastern England During the Pleisto~ene 1 o Phil. Trans. R. Soc. Lond. A 272, 87-98.
wES'l', R.G. ans SPARKS, B.W. of the English Channel'.
(1960). 1 Coastal Interglacial .iJeposi ts Phil. Trans. B. Soc. Lond. B 243, 95-133.
Wil:viPEY. (1964). Series of Exploratory Boreholes Taken in Yarmouth Harbour. Wimpey Labs., Haynes, Middlesex.

- 2
L.11.~WIJN, W .H. (1970). Early and .Middle Pleistocene Coastlines in the Southern North Sea Basin. In OELE, E., SCUTTENHElM, R.T.E. and wiG.iERS, A.J. (Eds.). The Quaternary History of the North ·Sea. Acta Univ. Ups. S,ymp. Univ. Ups. Annum Quingentesimum Celebrantis. 2, 31-42.
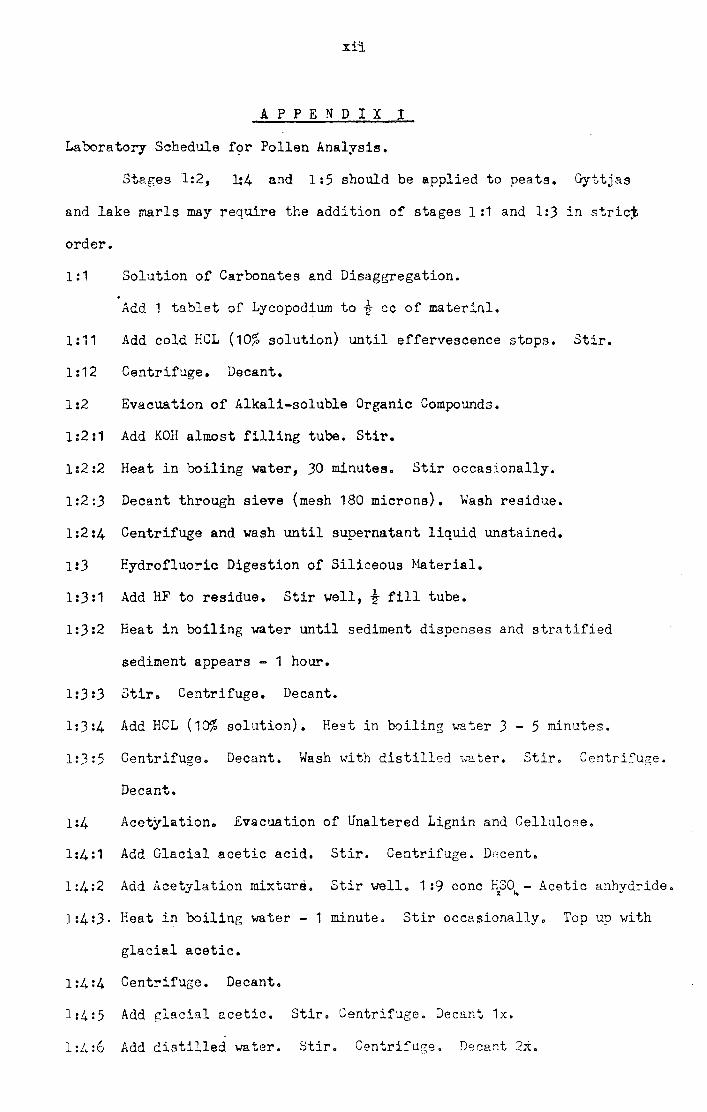
xi'i
A P P E N D I X I
Laboratory Schedule for Pollen Analysis.
Stages 1:2, 1:4 and 1 :5 should be applied to peats. Gyttjas
and lake marls may require the addition of stages 1:1 and 1:3 in stric~
order.
1:1 Solution of Carbonates and Disaggregation.
Add 1 tablet of Lycopodiwn to t cc of materinl.
1:11 Add cold HCL (10% solution) until effervescence stops. Stir.
1:12 Centrifuge. Decant.
1:2 Evacuation of Alkali-soluble Organic Compounds.
1:2:1 Add KOH almost filling tube. Stir.
1:2:2 Heat in boiling water, 30 minutes. Stir occasionally.
1:2:3 Decant through sieve (mesh 180 microns). Wash residue.
1:2:4 Centrifuge and wash until supernatant liquid unstained.
H3 Hydrofluo!"ic Digestion of Siliceous Haterial.
1:3:1 Add HF to residue. Stir well, t fill tube.
1:3:2 Heat in boiling vater until sediment dispenses and stratified
sediment appears - 1 hour.
1:3:3 Stir. Centrifuge. Decant.
1:3:4 Add HCL (10% solution). He~t in boiling '\..'ater 3- 5 minutes.
1:3:5 Centrifuge. Decant. Wash with distilled ,,-ater. Stir. Centrifuge.
Decant.
1:4 Acetylation. Evacuation of Unaltered Lignin and Cellulose.
1:4:1 Add Glacial acetic acid. Stir. Centrifuge. DRcent.
1:4:2 Add Acetylation mixture. Stir well. 1 :9 cone HSO - Acetic anhydride. z ...
1:4:3. Heat in boiling water - 1 minute. Stir occasionally. Top up with
glacial acetic.
1:4:4 Centrifuge. Decant.
1:4:5 Add blacial acetic. Stir. Centrifuge. Jecant 1x.
1:L:6 Add distEled water. Stir. Centri~uge. !Jocant 2x.

x.iii
1:5 Staining
1:5:1 Add Tertiary Butyl. Alcohol. Centrifuge. Dec-ant.
1:5:2 1 rnl Tert. Butylo Alcohol+ 2 drops safranin solution into sn~ll
vials. Centrifuge. Decant.
1:5:3 Add silicone fluid same volume as sample. Stir. Plug with cotton
wool.

xiv
A P P E N D I X II
L::J.borEt tory Schedule for Diatom Ar.alysi s.
2:1 Place l crn3 material i"1 150 ml. Pyrex beaker.
2:2 Add 30~ solution of H202
2:3 Leave overnight. If reactiotJ not already complete, heat gently
until effervescence stol)S (with samples containing a lot of
organic matter EIO::'e H2o2 may be necessary).
2:4 Place one drop of diatom rn~xture on a cover slip (22 x 22 mm)
with five drops of distilled water.
2; 5 Place cover slip on a hot plate and evaporate liquid.
2:6 Place a small amount of :tviicrops 163 mountant on a microscope
slide and heat gently.
2:7 Invert microscope coverslip onto Eiicroscope slide and cool.

A P P E N D I X 111
Laboratory Schedule for Particle-size Analysis.
3:1 Pretreatment of Soil
3:1:1 A sample of 30 g is weighed (Wa) and placed in the 650 ml conical
Flask.
3:1:2 Add 50 ml of distilled water and boil until the volume reduces to
40 ml.
3:1:3 Cool then add 75 ml of hydrogen peroxide and leave to stRnd over
night.
3:1:4 Gently heat to reduce volume to 30 ml.
3 :1:5 Filter the mixture through a B~chner funnel washing through with
'lo1S.rlD. water •
3 :1 :6 Transfer damp soil on filter paper to an evaporating dish using
a jet of distilled water.
3:1:7 Place evaporating dish in oven and dry at 105- 110°C.
3 :1:8 Weigh evaporating dish (Wb).
3:2 Dispersion of Soil
3:2:1 Add 25 ml of sodium hexametaphosphate solution and 25 ml of
distilled water.
3 :2:2 Gently warm and tr~nsfer to dispersion cup and agitate for 15
minutes with mechanical mixero
3 :2:3 Transfer mixture to 75 ? m sieve placed on a reciever and \offi.Sh
through using distilled water.
3 :2:4 The sieved suspension material is transferred to a graduated
sedimentation tube and volume of liquid is made up to 500 ml with
distilled watero
3:2:5 The material remaining on 75fAm sieve is oven dried at 105- 110°C.
3 :2:6 Dried materhl is re-sieved on 2 mm, 600 J.AID, 210 fAID and 75 ;Urn and
material remaining on each sieve is weighed (W g H c Wm and '..If).

xvi
3:3 Sedimentation
3:3:1 25 ml of sodi~ hexamet~phosphate solution is added to 500 ml
distilled water to act as a control.
3:3:2 All the sedimentation tubes are transferred to a constant
temperature bath.
3:3:3 Shake sedimentation tube and at same time set stop watch.
3:3:4 Samples from each tube are t~ken at intervals of 4 mins., 5 sec.;
46 mins.; and 6 hrs., 54 mins.
3:3:5 Weight of solid material in ecch sample is determined after oven
drying over night.
3:4 Calculations
Calculations for the analyses are found in the Methods of Testing
Soils for Civil Engineering Purposes handbook {British Standard
1377 : 1967) on pages 69 and 70o

xvii
A P P E N D I X IV
POLLEN COUNTS
Moors 7
Moors 10
Studland Heath 4b
Studland Heath 4h
YBS 3
YBS 9
YBS 10
Yl3S 12
YBS 13
YBS 14
Pett Level 2
Pett Level 4
Browndown 13/14 53

---------------------------,
xviii
Moors 7; Pollen Counts
Co-ord. 500 40' 56" N Grid ref. SY 9491 8702 02° 05' 41" w Fieldwork 800622.
Level 8 7 6 5 4 3 2 l Height M.O.D. -0.70 -0.72 -Oo17 -0.87 -0.97 -1.07 -1.17 -1.19 Depth em. -93 -95 -100 -110 -120 -130 -140 -142
13etul a. 13 5 3 14 10 16 15 25 Pinus 1 1 1 Ulmus l 3 17 5 9 6 5 Quercus 12 15 13 55 61 58 30 12 Tilia 1 8 4 6 Alnus 21 27 25 54 63 55 96 106 Fraxinus 3 4 2 7 5 3 1 Fagus 3 Cory1us 84 67 66 252 259 98 64 55 Salix 1 2 3 1 1 Fra.ngula l Erica.oeae 26 53 9 24 43 ~3 ll 1£' Viburnum 2 Gra.mineae 48 27 41 119 143 127 59 43 Cyperaceae 4 4 4 3 4 4 4 Compoaitae tub. 3 3 2 Compositae 1ig. 5 l Artemisia. 1 Ra.nunoulus-type 10 24 12 15 18 3 3 2 Caltha-t,ype 2 3 2 l Caryophyllaoeae 1 Chenopodiaceae 2 Cruciferae l l 1 1
J..
Rosaceae 4 3 3 2 Saxifragaceae l L,ythrum l l 2 Umbelliferae 1 1 Pol,ygonaoeae l l 2 2 l P1a.nta.gina.oeae 1 2 1 Rubiaoeae 2 Myriophyllum l Pteridium 8 17 13 4 6 4 24 23 Polypodium 1 2 2 4 1 1 Sphagnum 69 168 61 159 108 96 45 18 Fi1ica.les 1 2 2 1
Lycopodium 348 273 264 355 260 248 245 371 Total land pollen 244 233 181 570 621 414 302 275

02° 05' 41" w Fieldwork 500622
Level 15 14 13 12 11 10 9 8 7 6 5 4 3 2 1
Height M.O.D. -0.23 -0.33 -0.43 -0.53 -0.63 -0.73 -0.83 -0.93 -0.98 -1.06 -1.53 -1.63 -1.73 -1.83 -1.93
Depth -60 -70 -80 -90 -100 -110 -120 -130 -135 -143 -190 -200 -210 -220 -230
Betula 7 1 2 2 3 10 6 5 8 4 6 23 16 261 36
Pinus 2 1 2 4 3 - - 2 1 - 1 - - 1 - ~ Ulmus - - 2 3 - - 1 1 - 1 4 7 5 7 9
~uercus 4 8 4 5 8 8 6 6 5 27 12 51 23 26 20 0 ...,
Tilia - - 1 - - - - - - - - 1 136 6 7 Ill
Alnus 10 13 10 9 9 7 10 11 10 12 24 63 91 402 76 I-'
Fraxinus 2 1 4 - 1 - 1 - 1 4 2 5 - 6 1 0
Fagus - 1 - 2 1 - 1 - - 2 1 - - 1
Corylus 15 14 15 27 32 21 61 37 154 282 154 142 118 166 132 dl Salix 1 4 1 - 1 1 1 - 1 2 4 6 - 10 1 I-'
illlamnus - - - - - - - - - - 1 1 - - - I-' (I)
llex - 2 2 - - - - 1 - - 1 - 1 2 - ::s
Hedera - - - - - - - - - - - - 1 1 - 0
Ericacea.e 7 5 5 6 11 10 31 20 25 6 11 70 978 34 42 0
Ulex - - - - - - - - - 2 - - - - - §
Graminae 52 78 35 33 52 29 45 42 66 ue 70 343 181 155 206 c+
Cyperaceae 12 7 13 18 19 13 24 15 ll 6 25 8 3 7 2 Cll
Composi tae tub. 8 9 10 5 3 2 2 6 - - 1 1 6 1
Composi tae lig. 5 7 3 5 4 b 4 6 - - 7 - 5 1
Artemisia 1 1 ) 1 1 - - 1 - - - - - - -Ranuncu1 us type 4 2 2 1 4 3 1 - 3 7 1 14 9 8 1
:X: f-'·
Caltha type 1 1 - - - - - 1 - - - 2 1 1 I><
Caryopey11aceae - - 1 - - - - - - 1 1 - 6 4
Chenopodiaceae 11 1 2 1 2 1 3 11 3 - 6 1 - 1
Cruciferae 1 - - - - - - 2 - l - 1 - - 1
Legwninosae - - - - 1 1 - - - 1 - - 2
:rtosaceae - - - 1 - - - - 1 - 2 24 302 12 '2
Saxifragaceae - - - 1 - - - - 1
Lythrwn - - - - - - - - - 1 1 - 33 1
Umbelliferae - - - - - - - - - - - 2
Po1ygonwn 2 2 1 - 2 - - 1 - - - - 100 1 1
H.wnex - - 1 - - 2 - - - 1 1
Urtica - - - - - - 2
Plantaginaceae 2 4 13 2 5 2 3 3 2 1 3 1 10 35 1
Rubiaceae - - 1 - - - - - - - - - 2
Nymphaea - - - - - 1
M,yTiophyllum 1 3 - - - - - - - 1 1 - - - 1
Potamogeton 2 - 3 1 2 " 1 5 3 - 1 - 2 - 1 .)
Typha lat. - - - - - - - - - - 1 - 5
Pteridium 7 3 7 2 2 5 6 8 6 9 11 16 - 7 8
Poly podium - - 1 3 0 2 1 3 - 1 2 2 . ~ 2 1
Sphagnum 6 3 3 3 11 10 2e 22 44 50 43 330 11 25 13
Filica1es 6 - 4 5 2 :. 3 5 1 1 5 - 7 50
Lycopodium 457 250 302 316 308 337 337 377 202 273 322 383 200 200 231

Co-ord 50° 39' 43" N Jrid ref. SZ 0230 8480 01° 56' 03" w Fieldwork 820804.
Level 11 10 9 e 7 6 5 4 3 2 1 Height lli.O.D. +0.31 +0.21 +0.11 +0.01 -0.09 -0.19 -0.29 -0.39 -0.49 -0.59 -0.69 Depth CIJlo -1.30 -140 -150 -160 -170 -1!30 -190 -200 -210 -220 -230
tJ)
<+ ~
Betula 2 4 5 ) 3 3 7 9 5 4 p. - t-J
Pinus 8 3 8 7 2 7 1 - 1 - 1 ~ Ulmus 7 4 9 7 - l 3 1 6 8 4 p.
~uercus 16 12 4.3 51 30 54 29 24 43 so 59 II: Tilia - l 1 3 - 3 3 4 4 4 2 (I)
Alnus 15 25 32 26 13 31 6 12 19 ;!5 30 Ill <+
Fruin us 2 1 - 1 2 1 1 - 2 5 - 1:7"
Fagus - - 2 - - - - - - - - ~
Corylus 56 53 106 111 38 116 56 95 96 129 90 o'
Salix - - 3 - 1 2 1 - 3 2 llex - - - - - - 1 - - - - d' Hedera 1 1 - - - - 1 2 1 - - t-J
Gc.lluna 44 43 103 116 29 101 12 20 77 232 66 1-'
Erica-type - 7 14 23 6 15 2 22 20 5 (I) - ::s
Myrica - - - 1 - - - - - - - n Viburnum 1 - - - - - - - - - - 0
Gramineae 35 37 52 44 42 63 101 54 53 61 107 § Cyperaceae 11 8 17 6 2 8 4 3 2 3 2 <+ ><I
Composi tae tub. 3 1 1 1 CD ><I - - - - - - -
Composi tae lig. 1 - 1 - - - - 1 Artemisia - - 1 - - 1 Ranunculus-type 2 2 1 2 - 3 3 1 - 1 1
Cal tha-type - - - 1 - - - 2 Chenopodiacec.e 1 - 2 3 - 2 - - 2 1 Cruciferae - - - - 3 1 Rosaceae - 2 2 - - 1 1 - 2 1 Fil ipendul a 2 - - l l - 2 1 5 2 2 Polygonaceae - 1 Rumex - - - - 1 Plantaginaceae 1 Plantago lane. l 8 4 1 1 1 1 - 2 1 Plantago media. - - 4 5 1 2 - - 1 - 1 Valeriane11a - - 3 Succi sa - - - - 1 Potamogeton 2 Typha latifolia 1 Pteridium 1 9 12 9 8 19 4 3 5 4 5 Polypodium 2 1 5 2 1 1 2 l - - 3 Sphagnum 58 120 147 121 44 91 53 56 39 53 66 Filice>les - 1 l 2 - 2 1 1 - 2
Lycopodium 367 520 361 377 441 291 283 327 358 297 243

Stud1and Heath ~' Pollen Counts
Co-ord 50° 39' 43" N Grid ref. sz 0230 8480 01° 58' 03" w Fieldwork 820804
Level 15 14 13 12 11 10 9 8 1 6 5 4 3 2 1 Ul
Height m.O.D. +0.20 +0.19 +0.18 +0.17 +0.16 +0.14 +0.12 +0.10 t-0.08 +0.06 +0.05 +0.04 +0.03 +0.02 o.o c+-s::
Depth em -133 -134 -135 -136 -137 -139 -141 -143 -145 -147 -148 -149 -150 -151 -153 p. ......
Betula 4 6 12 9 14 19 24 21 20 19 14 6 6 8 4 ~ Pinus 1 3 9 4 - 1 15 10 9 40 ')1 30 38 55 68 p.
Ulmus 3 9 20 18 18 32 22 29 41 18 31 21 18 6 1 :::r: ~uercus 16 42 55 63 65 52 65 60 58 53 46 11 12 6 1 CD
I»
Tilia 1 3 5 5 11 5 7 2 - 3 - - - - - c+-
Alnus 22 31 41 48 38 37 15 27 21 14 2 1 1 l:r' - -Fraxinus 2 5 :· 3 4 4 :? 1 1 3 - 1 - - - ~
l:r' Fagus 1 1 - - - - -- - - - - - - -Corylus 54 95 200 158 111 164 19.7 204 202 262 3.)8 227 213 269 11
Salix 1 2 3 - 4 5 - 2 1 2 - - - - - ~ Frangul a - - - - - - 1 - - - - - - - - ......
1-'
Hedera - - - - - - - - - - 1 - - - - CD
Ericaceae (27) (38) (71) (62) (53) (41) (45) (48) (41) (33) (48) (56) (88) (164) (80) ::s
Call una 22 34 59 48 37 33 32 44 39 29 46 - - - - 0
Erica-type 5 4 12 14 16 8 13 4 2 4 2 - - - - 0
Gramineae 33 110 lOC 158 109 101 95 84 76 13 58 15 8 4 1 § ~
Cyperaceae 4 9 2 10 14 4 4 1 5 2 - 1 2 - 1 c+-Ol .....
Composi tae tub. 1 1 Composi tae lig. - 1 Artemisia 2 - 1 - 1 - - - - - 1 1
Ranunculus-type 4 4 1 4 5 - 4 3 3 2 1 - 1
Cal tha-type 1 - - - - 1 Chenopodi aceae 2 1 1 - - - ·- 2 - 1
Cruciferae - 1 1 - 1 Legwninosae - - - - - - - - - - - - 1
Rosaceae 1 1 - - - 1 l - 1 - 1 - 1
Filipendula 1 3 2 3 3 2 2 3 6 1 3 Po ten till a-type 1 3 - 2 - 2 Umbelliferae - 1 Mercuri ali s - - - - 1 Rumex 1 - - - - 2 - 1
St achy a-type - - 1 2 - 1 Plantago lane. 3 - - 1 1 - l 1 - 2 1 - 1
P.maj/med. 1 Pteridium 5 2 6 9 7 5 9 4 2 5 1
Polypodium 1 2 3 1 1 3 2 2 - - 2 - 1
Sphagnum 30 91 247 178 189 194 148 188 204 194 186 57 37 6
Filicalee - 2 l 2 - ·3 - 2 1 - 1 - 3 1 3
Lycopodium 185 158 23 40 29 25 - - - - 118 25 86 179 344

Co-ord. 50° 42' 10" N 01° 29' 50" w
Grid ref. SZ 3538 8939 Fieldwork 801115
Level 16 15 14 13 12 11 10. 9 8 1 6 5 4 3 2 1
Height M.O.ll. -5.71 -5.69 -5.67 -5.65 -5.60 -5.40 -5.20 -5.00 .-4.80 -4.60 -4.40 -4.10 -4.06 -4.04 -4.02 -4.00
Depth em. -651 -649 -647 -645 -640 -620 -600 -580 -560 -540 -520 -490 -486 -484 -482 -480
Betu1 a 1 1 1 2 3 1 1 bl
- - 4 4 4 2 - ·- - en Pinus 1 - - - - 1 1 - 1 - 1 1 2 1 2 2 VJ
Ulmus - 2 2 3 - 4 2 1 8 3 3 3 - 2 4 5 ~uercus 23 13 21 11 13 11 15 21 34 25 28 13 14 lC. 9 12
~ Tilia 2 5 1 5 3 8 1 8 8 4 3 3 6 4 4 4 Alnus 24 28 24 30 81 78 25 64 43 149 61 30
I-' 24 )1 23 24 I-'
Frc.xinus - 2 1 - 2 - 3 2 2 1 2 - 4 1 7 3 <D
Corylus 21 39 32 20 25 18 26 36 13 41 6 5 10 ::3
5 7 4 Salix 1 1 1 - - 3 1 3 3 3 1 4 2 1 2 2 0
0
l:thamnus - - - 1 - 9 - - - - - - - - - - § Frangula 4 1 2 - - - 4 - - - - - - - - - c+ Hedera 1 1 - - - - - - 1 - - - - - - 1 (Q
Viburnum - - - - - - - - - 2 11 lramineae 24 11 41 15 1 17 29 12 40 18 14 43 42 34 34 80
Cyperaceo.e 93 75 120 51 2 73 38 8 35 16 7 15 10 10 13 11
Compositae tub. - 3 - - - - 3 - - 2 - - l
Composi tae lig. - - - - - - - - - - 1 - - 2
nrtemisia 1 6 2 2 1 6 1 >< - - - - - - - - - I><
l:tanuncul us-type 5 3 5 3 8 2 2 6 1 6 2 1 7 7 j 5 1-'· 1-'·
Cal tha-type - 1 1 1 - - 1 3 - 1 - - 1
Cruciferae 3 - 1 - - - - - - l 20 Chenopodiaceae 1 3 3 - - - 2 - 6 - - - 1
Lathyrus - - - - - 1 1 l:tosaceae .1 1 - - - 2 1 - 2 - - 2 - - 2
Sc.xifragaceae - - - - - - - - 1 Lythrum - - - - - - - - - 1 Umbelliferae - - 1 - - - - - l 1 Rumex - - - - 1 - - - - - 2 1
Convolvulus - - - - 2 0 0 (I
Ca1ystegia - - 1 - - - - - - - - 1 1
Mentha - - - - - - 1 Plantaginaceae 1 1 2 - - - - - - - 1 Rubiaceae - - - - - - 1 2 - - 2 M,yr i o phy 11 um 1 - - - - 3 - 2 1 5 - - - - - 1
Alisma - 3 - - - - 1 Typha angustifolia - - - 1 - 1 - - 1 - 2 - 3 1 3 3 Typha latifolia 1 - - - - - - - - - - - - - - -Pteridium - 7 6 2 1 - 1 1 2 2 6 10 12 3 7 6
Po1ypodium 4 1 5 4 - 1 6 1 4 1 7 2 - 1 - 1
Sphagnum - - - - - - - - - - - - - 1
Filica1es 1 1 2 - 1 1 3 3 4 55 1 1 3 - - 4
Lycopodium 279 261 362 536 404 200 319 254 207 200 409 238 411 266 492 216

... _ JU ""'"" "
aau--wu-- yuu••--
Level 16 15 14 13 12 11 10 9 8 7 6 5 4 3 2 1 Height M.O.D. -3.94 -3.98 -4.02 -4.06 -4.18 -4.20 -4.24 -4.26 -4-30 -4-40 -4.46 -4-50 -4.52 -4.54 --4. 56 -4-58 Depth em. -468 -472 -476 -480 -492 -494 -498 -500 -504 -514 -520 -524 -526 -528 -530 -532
Betula - 2 4 5 4 3 1 - 1 2 2 3 2 4 l 2 Pinus - 3 2 - 1 1 1 1 - - - - 4 2 - 7 Ulmus - 2 3 1 3 9 - 3 3 2 5 1 2 6 5 2 ~ ~uercus 22 27 51 21 20 33 40 42 22 16 39 25 20 20 20 18 CIJ
Tilia 3 2 - 5 9 5 11 15 3 2 5 5 16 11 8 36 \,Q
Alnus 24 14 38 18 61 48 45 37 16 85 48 108 118 163 66 35 Fraxinus 1 - 2 - 2 1 2 2 5 - 1 - 12 7 - - d' Corylus 19 35 33 30 36 27 20 26 22 44 43 27 19 18 4 40 ..... Salix 1 1 2 1 2 2 1 - 3 1-' - - - 1 2 1 - il)
Ilex - - - - - - - - - - - - - - 1 ::s -Frc.ngu1a - - - 1 - - - 1 - - - 1 - - - 0 -Hedera - - - - 1 - - 1 - - - - - - 1 0 - § Ericaceae - - - - - - - - - - - - - 1 - -Viburnum 1 - - - 1 - 2 - - 1 - 1 2 M-- - - fll Gramineae 17 18 130 54 46 56 40 49 87 31 78 48 31 32 35 26 Cyperaceae 5 8 73 31 53 63 84 72 6 124 42 19 101 10 20 12 Composi tae tub. - 4 2 - 1 1 - 2 4 2 - 2 - 1 - 2 Gomposi tae 1 i g. - - - 2 - - - - - - 1 2 - 1 1 Artemisia - - - - - - - - - - - - 3 Ranuncu1us type 3 8 5 1 5 8 5 6 3 2 6 9 6 5 b Caltha type - - - - - - - 1 - 1 3 - - 1 - H -Cruciferae - - 1 - - 2 1 1 - - - - - - - - H
1-'· Gar yo phyll aceae - - - - - - - - - - - - 1 - - 1-'· -Ghenopodiaceae 10 17 23 6 2 1 1 - - - - - - - 3
1-'· -Leguminosae - - - - - - - - - - - - - 1 Lotus - - - 2 Rosacea.e - 1 - - 2 1 1 - - - - 1 1 1 Lythrum - - - - 1 1 - - - - - - - - 1 Umbe1liferae - - - - - 1 - 1 2 - - - - 3 Po1ygonum - 1 1 1 - - - - - - - - 1 Rumex - - - - - 3 - 1 - - 1 7 1 4 7 Euphorbia 1 Galystegia - - - - - - 1 Mentha - - - - - - - - - - - 1 Plantaginaceae 1 4 3 2 - - - - - 3 2 - 1 1 1 Rubiaceae - - 1 - - 1 2 11 - 1 - - - - 1 Valerianella - - - - - - 25 Nymphaea - - - - 1 - - - - - - 1 M,yriopb.y11 um - - - - 2 3 3 2 1 1 1 3 1 2 1 2 Alisma - l - - - 1 - - - 1 - 2 6 3 1 Typha latifolia - - - - 2 - - - - - - - 2 1 Typha angustifolia 2 1 - - 5 10 1 3 6 1 13 6 12 1 4 Pteridium 4 3 5 1 1 1 5 3 - - 2 - 4 3 2 4 Poly podium 3 1 - 1 4 1 2 6 2 3 3 - 2 9 3 2 Sphagnum - - - - - - - 1 Filicales 3 1 2 3 60 153 516 116 3 3 1 - 2 5 3 41

Co-ord. 50° 42' 04" I Grid ref. SZ 3514 8924 ,01° 30' 08" v Fieldwork 811208
Level 16 15 14 13 12 11 10 9 !l 7 6 5 4 3 2 1 Height M.O.D. -1.54 -1.64 -1.70 -1.80 -1.84 -1.88 -2.00 -2.10 -2.20 -2.30 -2-34 -2.38 -2.42 -2.46 -2.)0 -2-54 Depth em. -237 -247 ,..253 -263 -267 -271 -283 -293 -303 -313 -317 -321 -325 -329 -333 -:>37
:Betula 1 2 4 2 - 2 2 1 1 3 4 1 2 5 4 2 Pinus 5 10 3 4 1 5 - - 1 - - 2 3 4 4 4 t;j Ulmus 2 - 1 1 5 1 2 - 1 4 4 2 1 4 1 8 Quercus 48 56 40 51 52 21 31 19 13 32 37 30 60 13 48 18 to Tilia 1 3 3 2 3 - 4 2 1 12 3 10 1 12 3 2 1-' Alnus 40 24 38 35 37 21 60 128 113 97 50 102 14 35 3/:l 62 0 Fraxinus 3 5 10 5 2 - 1 - - 2 2 3 2 17 2 4 P'agu,s - - 1 - - - - - - - - - 1 - - - d1 Corylus 26 31 20 30 33 9 24 17 11 42 16 23 26 41 23 40 Salix - - - 1 1 - - - - - - - 2 5
1-' - - 1-' RhBIIIllUB - - - - - - 7 1 - 9 2 - - 1 - 2 CD Ilex - - - 1 - - - - - - - - - - - - ::s Frangula - - - - - 1 1 - - 6 - - - - - - 0 Hedera - 1 - 2 - - 1 - - - - - 1 - 2 1 0 lilrioaceae - - - - - - 2 - - 0 1 1 - - - - § Empetrum - - - - - - - - - 1 - - - - - -IJC,yrioa 1 1 c+ - - - - - - - - - - - - - - Dl Viburnum - - 2 - 1 - - 1 - - - - - - - -Gremineae 8 17 21 22 28 12 37 1 3 63 45 30 23 43 28 30 Cyperaceae 14 11 23 5 14 8 112 2 4' 101 215 262 134 21 5 8 Composi tae tub. 1 - 1 2 1 1 2 - - 2 2 5 2 - 1 Compoei tae lig. - - - - - - - - - - - - - 1 1 1 Artemisia 2 1 1 - 2 - - - - - .. 1 - - - 1 :i< Ranunculus type - 1 - 3 - - 1 3 2 10 - 2 1 3 1 12 X Caltha type - - - 2 - - - - 1 1
._._ - - - - - - <: Chenopodiaceae 12 14 45 8 9 4 5 - 1 6 1 4 5 19 15 19
Cruoiferae - - l - - - - - - 1 - - - - 1 2 LinWD 1 - - - - - - - - - - - - -Lagu,minoeaa - - 1 - 1 - - - - -. - - - 1 Rosaceae 2 1 - - - - 1 - 1 - - 1 - 1 Filipandula 1 - 1 - - - - - - 1 1 - 1 Lytbrum - - - - - - - - - 2 Umbelliferae - - - - - - - - - - - - - - - 1 Rumex - - 1 - - - 1 - - 1 - 1 1 - 1 2 Convo 1 vul us - - - - - - - - - - - - - 2 1 Calyatagia - - 1 - - - - - - - 1 1 Mentha - - - - - - - - - 2 Plantago lane. - - - 1 - - - - - 1 - 1 2 - - 3 Rubiaoeaa - - - - - - - - 1 -' - - - 1 M. olterniflorun - - - - 3 - - - - - - - - -Aliama 1 - - 1 ~ - - 1 - 1 - 2 - - 2 Pot!ll!logeton 31 55 1 1 1 - 1 1 - - - - - 4 - 2 Typha latifolia - - - - - 1 - - - - 1 1 1 Typha angustifolia 1 1 1 2 - - 2 - 1 2 - 4 1 P'teridiWI 18 21 5 23 8 18 3 1 1 2 4 7 23 35 17 22 PolypodiUII 3 5 2 2 - 4 3 4 2 5 9 6 5 5 3 2 Sphagnum .. - - - "
,. - "!' - - - - - - 1 Filicales 7 2 6 B 1 5 4 - - 7 2 9 8 6 7 6
~co podium 369 341 232 658 430 492 309 335 116 516 391 388 763 758 694 463

Co-ord. 50° 42' 04" N Grid ref. SY 9491 8702 01° 30' 07" w Fieldwork 811208
Level 14 13 12 11 10 9 8 7 6 5 4 3 2 1
Height M.O.IJ. -1.64 -1.68 -1.80 -1-90 -1.98 -2.04 -2.08 -2.14 -2.20 -2.30 -2.40 -2.50 -2.61 -2.63
Depth em. -244 -248 -260 -270 -278 -284 -288 -294 -300 -310 -320 -330 -341 -343
Betula 8 16 3 - 6 - - 2 1 2 4
Pinus - - 1 1 1 - 1 1 - 1 - - - - ~ Ulmus 2 5 - 1 1 1 1 - 1 5 3 3 - - Cf.l
Quercus 25 31 23 19 11 1 8 8 11 26 10 13 16 5 I-'
Tilia 6 8 2 3 2 4 3 2 6 11 7 5 6 13 1\)
Alnus 86 75 19 25 27 34 33 87 eo 49 69 75 77 32 d1 Fraxinus 22 15 2 1 2 4 2 - 1 6 7 3 1 -Juglans 2 1
I-'
- - - - - - - - - - - - I-'
Corylus 83 119 27 23 21 8 16 10 15 36 15 27 22 10 CD ::s Salix 2 2 - - 2 - - - - - 1 - 1 5
Ilex - - - - - - - - - - - - - 1 0 0
Frangula 1 - 1 - - 11 - - - 1 1 - - - § Hedera - 1 - 1 - 1 - 2 1 1 2 - 1 1 c+
Ericaceae 2 - - - - - - - - - - - - - IXl
Viburnum - - 1 - - - - 1 - - - 1 - 3
Gramineae 149 164 34 40 40 35 26 9 12 90 65 64 58 28
Cyperacsae 33 15 8 6 29 186 49 28 37 27 25 20 25 6
Composi tae tub. - - 1 - - 1 2 1 1 - ::: 1 2 1
Compositae 1ig. 1 1 - - - - - - - - - - 1
Artemisia - - 6 - - - - - - - - 1 -Ranuncu1us 20 21 9 4 10 20 4 4 2 19 8 8 3 2
~ M
Caltha - - 1 2 1 1 - - - 1 - - - - <
Cruciferae - - - - - - - - - - - - - 15
Chenopodiaceae 1 1 2 6 3 1 - - - - 4 1
Leguminosae - 1 ... - - - - - - - - -Rosaceae 1 4 3 1 - - - - 1 1 - - 1
Lythrum - - - - - - - - 4 1 - 2
Umbelliferae - 2 Polygonum 1 -Rumex - - - - - - - 1 - 1 2 - 1
Calystegia - - - - - - - 5 - - 1
P1antaginaceae 2 1 2 1 - - 1 - - 1
hubiaceo.e - 2 - - - - 1 1 - 1
Valeriana My rio pb.yll um - 1 4 - - - 1
Alisma - - 1 0 1 - - - - - - - 1
Potamogeton - - - 2 1 - - - - - - -Typha latifolia - - - - 2 - - - 3 - ";' 5
Typha angustifo1ia - - - - - - - 10 11 - 5 7 4 2
Pteridium 2 1 5 10 10 1 1 - ... l 2 1 - l
Po1ypodium 2 2 - 1 3 4 2 4 4 3 l 5 4 2
Sphagnum - - 1 - 1 - - - - - - - -Filica1es - - 1 5 - - - 1 2 - 2 2 3
Lycopodium 322 324 430 366 426 325 260 200 299 300 307 255 200 484

Co-ord, 50° 42' 04" N Grid ref. SZ 3516 8922 01° 30' 07" 1i Fieldwork 811209
Level 14 13 12 11 10 9 8 7 6 5 4 3 2 1 Height M.O.D. -1.40 -1.50 -1.56 -1.60 -1.70 -1.84 -1.88 -1.92 -1.96 -2.00 -2.04 -2.08 -2.12 -2.16 Depth em. -228 -238 -244 -248 -258 -272 -276 -280 -284 -288 -292 -296 -300 -304
Betula - 1 3 - - 1 3 3 • 1 1 2 2 1 ~ Pinus 2 - - 1 1 - 1 - 3 1 - - 1 - en Ulmus 2 1 7 - 1 1 1 3 1 5 1 2 2 4 ~
Quercus 24 29 65 19 11 15 13 20 14 38 9 17 33 27 lN Tilia 4 4 7 - 2 2 - e 4 6 1 10 10 14 tun us 17 15 55 27 10 30 30 88 121 97 137 116 100 95 d' Fraxinus 1 - 13 2 - 1 ~ 3 3 1 1 3 2 9 li'B&US - - - - - - - - - 1 - - - - .....
~ Pioea - - - 1 - - - - - - - - - - (J)
Cor,11us 14 22 58 14 15 23 20 31 22 33 15 18 30 36 ::s Salix - 1 3 1 4 1 - - 1 - 1 2 1 8 (") Lonicera - - - - - - - - 1 1 - - - - 0 Rhamnus - - - - - - - 2 3 - - - - - § Ilu - - - - - - - - - 1 - - - - c+ Frangu1a - - 2 - - - - - 1 - - - - - Ul Bed era - - - - - - l 1 - 1 - - 1 Erioaoeae - 1 - - 1 - - 2 - - - - 1 Viburnum - - 2 1 1 - - - 1 - 1 - 1 2 Gramineae 9 24 145 34 34 32 22 77 52 66 7 21 76 150 Cyperaceae 3 48 88 20 7 66 108 455 22 27 40 38 44 27 Compositae tub. 2 6 1 2 - - 1 6 - 9 - 1 1 5 \><! Compositae 1ig. - - 1 - 1 - - - - - - - - 1 1><1
Artemisia - - - - 1 - - - - - - - - - < R&nuncu1us-t,Jpe 3 9 1 2 3 3 7 7 8 4 4 15 22
1-'· -Caltb.a-t,Jpe - 1 2 - - - - - - - - - 1 1 Cruciferae - - - - - - - - - - 1 Spergu1a 1 1 Chenopodiaceae 5 193 98 20 9 4 1 1 Rosaceae 2 - - - - - - - 1 - - - 1 5 Sanguisorba - - - - - - - - 2 - - - -L,ythrum - - - - - - - 3 1 - - - 8 Umbelliferae - - - - - - 1 - - - - - -Po 1.1 gonac sa.e - - - - - - - - - - - 1 - 1 Rumu - - - - - - - - - 2 - - 1 Ca1yetsgia - - - - - - - 2 2 - - - 1 ll!!entha. - - - - - - - - - - - - - 1 Plant~inaoeae - - 2 - - - 2 1 Rubiaceae - - - - - - - - - 1 - - 2 4 Myr io ph.f 11 UD - - - - - - - - - - - - 2 Alisma - - 1 - - - - - - - 1 Potamopton - - - - - - - - - - - 2 T.fpha 1at1folia - - 1 - - 1 - - - - - 1 14 1 Typha anguetifo11a - - - - - - 1 - - 5 1 15 16 1 Pteridium 11 8 4 3 7 9 2 6 1 2 - 1 2 2 Po1,rpodiWII 2 1 3 2 2 - 2 2 5 5 1 1 9 9 Sph~um 1 - - - - - - - ;;. - ;;.. - ;;.
P'ilicalaa - 1 2 - - - 1 5 1 3 1 3 3 3
L,yoopodiua 300 263 436 247 304 316 240 448 404 428 128 200 228 394 i
!1

Co-ord 50° 42' 04" N Grid ref. SZ 3515 8921 01° 30' 07" w Fieldwork 811209
Level 14 13 12 11 10 9 8 7 6 5 4 3 2 1
Height m.O.D. ·-1. 78 -1.84 -1.88 -1.92 -1.98 -2.04 -2.10 -2.16 -2.22 -2.26 -2-30 -2.36 -2.40 -2.44
Depth em -268 -274 -278 -282 -288 -294 -300 -306 -312 -316 -320 -326 -330 -334
Betula 1 2 4 4 1 - 2 4 3 - 5 1 2 1
Pinus - 2 - 1 - 1 1 1 - - - 3 4 6 ~ Ulmus 2 3 - 5 4 6 9 11 5 - 5 - 1 1 Cll
Quercus 41 33 4 29 35 25 27 31 95 30 22 12 20 6 ...... Tilia 12 4 2 3 6 5 13 17 16 11 8 1 1 - ~
Alnus 74 85 37 13 124 122 94 33 81 106 47 22 16 20
Fraxinus 6 2 1 1 2 3 2 6 3 - 6 1 1 - d' Fagus - - - - - - - - - - - 1 - 1 ......
Cory1us 34 26 17 21 24 20 21 16 41 23 27 9 16 20 ...... (!)
Salix 1 4 - - 1 2 1 - 45 2 3 - 1 2 ::s Ilex - - - - - - - 1 1 - - 1 - - 0
Frangu1a - - - 1 - - 1 - - - 3 - .., - 0
Hedera - - 1 1 - 1 - 3 2 1 2 - - - § Viburnum - 1 - 1 - 1 - 1 - - - l l .. c+
Gramineae 40 43 15 31 21 37 51 99 138 37 54 7 13 7 IJ}
Cyperaceae 23 18 8 46 14 17 10 10 31 28 50 11 4 4
Composi tae tub. 3 1 1 s 1 - 1 1 3 1 2 l - 1
Composi tae lig. - - - 2 - - - - - - - - 1 l
Artemisia - - - - - - - - - - - 1
Ranunculue-type 1 1 3 3 4 6 4 7 11 2 12 - - - ~ ~
Cal tha-type - 1 1 1 2 1 2 1 1 1 - - - - < Chenopodiaceae 8 8 3 17 5 2 1 6 - 1 2 24 26 28 f-'·
f-'·
Cruciferae - - - - - - - - 4
Rosaceae 2 1 - 1 4 - - - 1 3 - 1 1 1
Lythrum - - 1 2 - - 5 2 2 1 1
Umbelliferae - - - - 1 - - - 1
Euphorbia - - - - - - - - - - - 1
Po1ygonaceae 1 - - - - - - - - - - 1 1
Rumex - 2 - - 1 1 2 - 9 1 1 - - 1
Ca1ystegi a - - - - - - 1 Mentha - - - - - - 1 - 1
Plantago lane. 1 1 1 1 - - 1 - - 1 1
Rubiaceae - 2 - 1 - - - - 6 1 - 1
.Myrioph,y11 um - 1 - - - 1 Alisma 1 1 - - - - - - 3 1
Typha 1 atifolia - 2 1 - 1 2 - - 3 4 T.angustifolia 4 2 2 2 - 2 2 2 2 15 Pteridium 4 9 9 6 - - - - - 7 1 10 23 17
Polypodium 5 2 2 2 5 8 4 3 10 3 1 1 - 2
Sphagnum - - - - - - - - - 1 - - - 1
Filioa1ee 9 7 3 1 4 4 3 2 5 4 1 4 4 5
Lycopodium 382 403 208 346 353 245 268 366 343 337 258 414 461 1131

Co-ord. 50° 53' 13" }I Grid ref. N 8912 1328 00° 41' 20" E Fieldwork 820922
Level 9 8 7 6 5 4 3 2 1 Height m.o.D. -1.01 -1.06 -1.11 -1.16 -1.21 -1.26 -1.31 -1.41 -1.51 Depth em 0 -5 -10 -15. -20 -25 -30 -40 -50
:Betula 10 8 5 3 3 6 2 3 14 ~ Pinus 1 - 1 - 1 1 - - 2 c+
Ulmus 2 2 - 1 3 - l 3 - c+
Querous 30 31 31 6 32 18 1~ 17 28 t'" Tilia 1 1 2 2 10 4 3 5 6 CJ)
Alnus 350 379 379 402 368 381 427 327 344 < (1)
Fraxinus 6 1 5 3 2 1 1 2 2 ....... Corylus 40 19 32 27 21 35 18 22 21 Salix 15 5 4 1 3 1 1 - 4
1\)
llu - 1 3 1 - - - - 1 Frangula 4 3 1 - - - - l - d' Reder a - - 1 - l - - - 2 ....... Viburnum 2 l 2 6 1 - - 1 - ....... iJramineae 8 5 4 3 11 4 2 14 6 CJ)
Cyperaceae 14 18 4 30 23 37 20 59 44 t:S
Compoei tae tub. - - - - 1 - - 1 1 0 Composi tae 11g. 1 - - - - - - - - 0
Artemisia l 2 - - - - - 1 1 § RanUIIculus-t.Ype 1 1e 15 1 12 7 2 6 14 c+ Cal tha-t.YPe 1 1 - - - - - - - to
Cruciferae - - 1 - - - - - - ~ Caryophyllacsae - - - - - 1 - - - H Chenopodiaceae - l - - 1 2 - l - < Rosaceae 2 1 1 2 1 - 1 5 3
1-'· 1-'·
11lipendula 1 - 2 - 1 1 - 6 4 1-'·
Potentilla-type - - - - - - - - 1 Lythrum - - - - - - - 1 Umbelliferae - 1 1 2 - - 1 23 Po17gonum - - - - - 1 RU1811x 3 - 2 - 3 - - 1 2 Calystegia - - - - ·- - - 1 Mentha 1 1 Plantago lano. - - 3 - 2 Plantago maj/med. - - 1 Galium - l ~riopeyllum 1 - l lll.verticillatUII l Aliema - - - - - - - l Potemogeton 1 l T7pha anguetifo1ia 4 7 2 1 6 - - - 5 Osmund a 5 3 3 8 2 l - 2 Pteridium 2 1 5 - 1 - 1 Po1JPodium 6 1 7 3 5 14 1 10 6 Sphii8Dum - - - - ·- l - - 2 Filioales 6 9 9 13 20 69 20 18 42
L1oopodiwn 194 250 173 114 15'7 163 91 119 178

xxix
.Pett Level 3; Pollen Counts
Co=ordo 50° 53° 13" N Grid refo TQ. 8911 1329 00° 41 I 19" E: Fieldwork 820923
Level 6 5 4 3 2 1 Height m .. O.D. -0.89 -Oo99 -1.09 -1.19 -1.29 -1.39 Depth em .. 0 -10 -20 -30 -40 -50
Betula 5 4 2 3 11 5 Ulmus l 2 3 ~ctuercus 11 17 3 12 34 22 Ti1ia 1 4 a 4 12 2 Alnus 411 333 442 427 326 383 Pra.xinus 2 6 2 Cory1us 46 20 11 22 21 16 Salix l 6 1 2 6 12 !ionic era 1 1 I1ex l Hedera 1 l 1 l Viburnum 1 l Gramineae 3 3 2 4 9 Cyperaceae 7 94 21 16 56 22 Composi tae tubo 1 3 l Artemisia l Ranunculus-type 5 10 l 3 16 9 Stell aria-type l Chenopodiaceae l l 2 l Rosaceae 4 3 6 2 4 Filipendula 2 Umbelliferae 1 1 2 l 2 Rumex l Cruciferae 2 2 2 2 2 Plantaginaceae l l 1 Alisma 1 l Typha angustifolia 1 2 6 Osmund a 5 1 2 Pteridiu.m 2 1 Polypodiu.m 5 4 5 5 3 It'ilicales 4 25 9 14 19 38
Total Lycopodium 73 124 76 101 158 226

13rovndovn 13/lL:U_I Pollen Counts
Grid ref. SZ585 985
Level 8 7 6 5 4 3 2 1 Height a.o.D. -19.00 -19.05 -19-10 -19.15 -19.20 -19-25 -19.30 -19-35 tD Depth om. -1350 -1355 1360 -1365 -1370 -1375 -1380 -1385 'i
0
Betula 1 5 9 5 5_ 9 3 1 ~ Pinus 4 10 6 4 4 10 12 3
p. 0
Ulmus 3 6 15 12 5 12 1 5 ~ Quercus 17 50 25 40 21 52 22 17 Alnus - 1 1 1 - 1 1 - ......
~
Fra.xinus 2 5 4 3 3 3 - - .......... Fagus - - 1 - - 1 - - ......
Cor;y1us 39 82 172 183 87 202 50 61 ~
Salix 1 2 2 5 1 3 1 2 VI VJ
Ilex - - - - 1 1 Hedera 1 - 1 - - - - - d' Ericaceae - - - - - - 2 -Gramineae 26 76 83 86 83 221 72 37
......
...... Cyperaceae 3 3 2 5 3 11 30 10 CD
Composi taa tub. 2 - - 1 3 5 3 5 ::s
Composi tae lig. - - - 1 - - 5 3 (")
Ranunou1us-type 5 5 13 8 9 17 6 1 0 ~
Cal tha-type - - 1 - - 2 1 - § I< .+ I-'·
Crucifer as 1 2 - - - - - - m Caryophyllacaae - - - 1 Chenopodiaceae 5 ll 19 8 9 7 4 3 Sa.xifre.gaoeae 1 Po1ygonWII 1 - 1 - - 3 Convolvulus - 1 Plantaginaceae - - - - - 1 Myriophyllum - - 2 ;...
Potamogeton 2 ~ypha angustifo1ia 2 6 2 :2 1 FteridiWII 9 10 3 2 9 8 19 17 Polypodium - 2 - - - - - 1 SphagnWII - 1 - - - 1 Filiaeles 1 5 1 2 5 3 5 2
Lycopod! um 200 200 200 200 200 200 290 ·200

x.xxii
APPENDIX V
DIATOM COUNTS
Moors 1
Moors 8
Moors 9
Moors 10
YBS 3
YBS 9
YBS 10
YBS 12
YBS 13
YBS 14
Browndol:ln 13/14 53

xxx1ii
Moors 7; Diatom Counts
Co-ord 500 40 1 56" N Grid ref. SY 9491 8702 02° 05' 41" w Fieldwork 800622
Level 6 5 4 3 2 1 Height m.O.D. -0.15 -0. 27, -0.42 -0.60 -0.67 -0.10 Depth em. -38 -50 -65 -83 -90 -93
Fragilaria construens v.bid 1 F.lapponica l: l F.virescens v.elliptica l 3 4 1 Diploneis ovalis 1 2 Navicula gracilis 1 Nitzschia sigma 4 Cocconeis pediculus 1 3 3 3 Diploneis interrupta 1 2 l 1 2 2 Navioula digitoradiata 1 5 8 N.peregrina 2 9 2 14 1 Nitzschia navicularis 49 54 82 76 66 19 Surirella ovalis 1 4 s.striatula 1 Caloneis formosa 8 1 17 10 7 Rhopalodia gibberula 1 l l 1 Nitzschia punctata 24 20 16 11 17 22 Achnanthes brevipes 1 Diploneis didyma 3 2 2 3 2 Navicula marina l 2 Cocconeis scutellum 4 2 3 6 4 5 Diploneis smithi 5 4 1 Rhaphoneis amphiceros 1 1 1 R.surirella 1 Actinoptychus undulatus 3 1 4 Thalassiosira decipiens 1 1 1 2 Auliscus sculptus 1 1 1 l 1 3 Dimerogramma minor 3 1 1 D.minor v.nana 8 2 4 2 8 6 Gyrosigma littorale 2 Navicula lyra l Nitzschia granul at a 2 5 9 6 10 32 Achnanthes septata l 1 Cocconeis costata 3 2 1 Grammatophora marina 6 l 4 l G.oceanica v.macilenta 9 5 4 2 Opephora marina 3 O.pacifica l 1 3 l Pl agiogramma stauro phorum 2 1 l 3 Podosira stelliger 2 Coscinodiscus nitidus l 3 6 Coperforatus v.pavillardii l l Diploneis bombus 2 2 3 Melosira sulcata 74 87 59 19 19 1~ M.westi l J
Total valves 201 199 200 194 <:>02 19'}

xx~iv
Moors 8; Diatom Counts
Co-ord 50° 40' 57" N Grid ref. SY 9491 8707 01° 05° 41 II w Fieldwork 800622
Level 4 3 2 1 Height moO.D. -0.30 -0.40 -o.so -0.60 Depth em. -50 -60 -10 -80
Pinnmularia microstauron 2 Fragilaria lapponica 5 1 1 F.virescens v.elliptica 2 Diploneis ovalis 4 Gomphonema constrictum 1 Cocconeis pediculus 1 2 2 Diploneis interrupta 20 l 3 Navicula digitoradiata 1 1 5 Neperegrina 16 l 1 2 Nitzschia navicularis ll 79 90 95 Caloneis formosa 1 2 2 Rhopalodia gibberula 1 1 Nitzschia punctata 4 15 18 17 Achnanthes brevipes 1 1 Diploneis didyma J 6 )
Navicula abrupta 1 l N.marina 103 1 3 Cocconeis scutellum 3 6 1 Diploneie smithi 17 6 1 1 Rhaphoneis amphiceros 1 Actinoptychus undulatus 2 l Thalassiosira decipiens 4 2 Auliscus sculptus 2 Dimerogramma minor v.nana 6 1 Nitzschia granulata 3 12 6 Cocconeis disc1oides 4 Grammatophora marina l 2 2 G.oceanica v.macilenta 4 l Opephora marina 1 1 Plagi.ogramrna staurophorum 2 Coscinodiscus nitidus 1 l 2 Melosira su1cata 14 69 39 45 M.westi 2 1
Total valves 201 200 202 199

XXXV
Moors 9; Diatom Counts
Co-ord 50° 41' 01" N 02° 05 9 41" w
Level Height moO.Do Depth em.
Fragilaria vireacens Voe1liptica Dip1oneis ovalis Opephora martyi Dip1oneis interrupta Navicula digitoradiata N.peregrina Nitzschia navicu1aris Ca1oneis formosa Nitzschia punctata Diploneis didyma Navicula abrupta N.forcipata Cocconeis scutellum Dip1oneis smithi Actinoptychus undu1atus Au1iscus sculptus Dimerogramm& minor D .. minor v.nana Nitzschia granulata Trachyneis aspersa Achnanthes septata Cocconeis discloides Grammatophora marina Gooceanica v .. maci1enta P1agiogramma staurophorum Podosira ste1liger Coscinodiscu apiculatus v.ambigua C.nitidus Melosira sulcata M.westi
Total valves
Grid ref. SY 9491 8717 Fieldwork 800622
1 -0.61 -27
9 1 l
19 1
31 3
5 l
1 1
l 1 3 3 1 1
50 2
135
2 -0-71 -37
1 1 3 4
l 65
29 3 l 3 6 1 2 5
5 4
1 2 4 5 1 1
1 49
3
201

xxxvi .Moors 101 Diatom Ceunts
Co-ord 50° 41' 04" N Grid ref. SY 9491 8727 02° 05' 41" li Fieldwork 800622
Level 8 7 6 5 4 3 2 1 Height m.o.D. -Oa22 -0.~2 -0.42 -0.52 -0.62 -0.72 -0.82 -0.92 Depth om. -fio· -70 -80 -90 -100 -110 -120 -130
Navicula lacustrie l 1 Pinnularia microstauron 1 Cymbel.la affinis 1 Fragilaria atomis 1 F.construens 2 F.construene v.venter 2 6 4 2 F.1apponica 1 2 1 F.scbu1zi l 2 F.viresoens v.elliptica 8 1 1 6 Amphora ovalis v.libyoa 1 2 6 lliploneis ovalis 2 2 l 1 2 Navicula gracilis 1 1 1 N.menisoulus 1 1 2 N.pupula 1 2 C,ymbella aepara l c.sinuata 1 Eunotia tenella 1 1 Fragilaria breviatriato 1 1 3 Oompbonema 1ongioops v.subol. 1 Opephora mart,yi 1 1 3 6 1 Meridian circularo 1 Ni tzsobi a sigma 1 1 N.trybl1one11a v.1evidensis l 4 Cooconeis pediculus 1 3 7 5 2 2 7 3 Diploneis interrupts 1 1 1 2 10 2 2 Navicula digitoradiata 1 2 3 1 l 2 N.peregrina 5 1 2 l 2 4 Nitzschia naviou1aris 21 4 5 2 8 16 34 39 Achnantbes brevipes v.parvula l A. delioatul a l Caloneis formosa 4 l 1 1 2 12 3 Rhopalodia gibberu1a 1 3 6 2 Nitzschia punctata 10 38 38 34 16 12 14 9 Aohnanthes brevipes 2 1 1 A.brevipes v.intermedia 3 Dip1oneia did,yma 17 2 6 3 4 2 5 1 Navicula abrupta l 1 2 8 N.forcipata 1 2 N.bwnerosa 1 N.marina 1 1 1 2 5 Cocconeis scutellum 9 16 18 21 2 8 10 3 c.scutellum v.stauroformis 1 6.speoicsa 5 4 1 Diploneis smithi 1 1 1 2 3 3 8 Rhaphcneia ampbioeros 1 2 It. aurire11a 1 1 1 Actincptyohua undulatua 1 2 2 3 2 Tbalassiosira !1eoip1ens 2 4 8 <! Auliscus eou1ptue 3 2 6 3 6 3 Dimerograouna marinum 1 D.minor 1 2 D.minor v.nana 10 13 11 9 5 1 4 9 Gyrosigma littorale 1 Navicula lyra 1 Nitzschia granulata 2 2 3 2 N.panduriformis 2 1 Surirella faatuosa l l Traohyneis aspers& 2 2 3 Biddulphia aurita 1 Cooconeis oostata 6 ]l
C,discloides 3 1 2 Orammatopbora marina 2 2 1 6 1 2 4 l G.ooeanica v.maoilenta 5 19 24 14 4 5 5 6 G.serpentina 1 1 1 Opepbora pacifica 1 1 6 1 1 Plagiograouna staurophorwn 3 1 l Podosira ste1liger Cosoinodisoua nitidus 1 4 3 lliploneie bomboidoe 1 Diploneio bombue 2 1 l 1 ~eloeira au1oata 92 ?2 23 39 43 47 33 41 M.~toeti 2 2 l 2 2 l l
Total valves 201 201 198 198 102 142 205 155

rns IO; Diatom Counts
Cc ord 50° 42' 04" h )r)_cl :ref c sz 3514 5924 o1o 30' o8" rJ Field~·;o:r:\. 811208
Level 13 12 11 10 9 8 7 6 5 4 3 2 1 Height m.O.D. -1.32 -1.36 -1.44 -1.54 -1.64 -1.72 -1.80 -1.90 -2.00 -2.40 -2.46 -2.52 -2.58
~ Depth em. -215 -219 -227 -237 -247 -255 -263 -273 -283 -323 -329 -335 -341 Cll
Eunotia monodon v.bidens - - - - 1 - - - 3 4 - - - ...... Amphora ovalis v.li\Yfca - - - - - - - 1 12 9 - - 1 0 Anomoeoneis scu1pta - - - - - 3 - - - 1 - - 17 Cymatopleura elliptica - - - - - - - 2 ~ - - - - t:l
IJ• Dip1oneis ovalie - 2 - - 2 3 - 22 - 19 2 - - ill D.ovQ1is v.ob1ongel1a - - 2 1 - - 1 2 9 c+ - - - - 0 Jyrosigma acuminatum - - 9 - 21 - - - - - - - 4 e J.attenuatum - 1 - - - - -· - - - - - - Q Navicula cincta - - - - 9 8 - - - - - - - 0 :N. dicepha1 a - 1 - - - - - - - - - - - § N.graci1is - - - - - - - - - 1 - - - c+
CIJ lo.graciloides - 1 - 1 1 1 - - e - - - -N.pusilla - - - - 1 3 - - 3 4 - - 1 N. rhyncocephal a - - - - - - - - "' -" Pinnm1aria maier - - - - - - - 3 2 P.viridie - - - - - - - 2 10 3 1 Surire1la americana - - - - - - - 1 - - 1 9R~Ji9/M'JD_a i~tricatum - - - - - - - 2 12 1 1
' __ (Jy.:_I>i)~i!,;gm-~~,""iBC.alpro idee v. eximi a - - - - 1 Nitzschia sigma 5 6 9 40 13 10 2 - - 6 1 5 4 Cocconeis pediculus - 1 - - - 2 1 Dip1oneis interrupta 4 1 2 - - 3 1 - - - 3 1 6 ~avicu1a digitoradiata - - - - - 3 2 - - - - 1 4 N.e1egans - - - - 1 - - - 3 l N.peregrina - 4 1 2 4 19 7 15 119 73 3 6 54 Nitzschia circumsuta - - - - 1 1 - 10 - 2 2 1 N.navicularie 21 52 46 71 19 t 51 91 62 5 36 98 67 17 li.scalaris 2 2 2 - 1 4 - - 15 6 - 2 30 Surirella crumena - 1 S.striatula - - - - - - 1 l:aloneis formosa 3 1 7 5 6 5 - 1 - 1 1 7 15 Rbopa1odia gibberu1a ~ 1 5 - 4 1 - - 1 1 - - 1(; Dip1oneis aestuarii - - 2 - 2 - - - - - - - -Nitzschia punctata 6 14 2 8 15 6 10 8 - l ]] 7 l ~coliopleura tumida 35 4 11 3 9 13 - - - - - 0 8 / Achnantbes brevipes 1 - - - 5 11 A.brevipes v.intermedia 7 2 l - 16 3 - 3 - 4 - - 4 Dip1oneis didyma 76 d 35 <>0 9 2 3 4 - 6 7 42 7 Navicula marina - 1 8 1 - - 2 - - - - 3 lli tzscbia acuminata - 2 12 3 2 1 - 1 - - - - 3 Cocconeis scutellum 2 2 1 - ,., 2 l 2 - 2 - l ~
C.speciosa - - - - - 1 Dip1oneis smithi - - - - - - - 10 - - l 3 7 Rbaphoneis amphiceros 1 - - 1 1 • - 3 - - - 2 R. surirell a - - - - - - - 1 - - 1 2 Actinoptychus undu1atus 3 9 2 s 5 4 5 3 - 2 3 6 1 Tha1assiosira decipiens - 1 1 - 3 - 1 Dimerogramma minor - - 1 - - - - 1 - - 1 Dip1oneis fusca - - - - - - - 8 - - 1 Nitzschia granulata - - - - 1 - 1 3 N.panduriformi s - l 1 1 1 1 - 1 - - 3 Surire11a fastuosa 1 - - - 1 - - - - - - - 1 Trachyneis aspersa - 1 - 1 1 1 1 - - - - 1 Cocconeis britannica - - - - - - - - - - 1 Diploneis weiasf1ogi - - - - - - - - - - - 1
..)
Grammatophora oceanica v.mac l 9 1 1 - 8 6 1 - - 1 3 G, serpentina - 1 - l - - 1 l - - 2 Podosira stelliger 5 2 - 3 3 1 2 - - - 2 3 fihabdonema minutum l - - - - - - - - - - -Coscinodiscus apiculatus 2 2 2 - 2 1 4 1 - - - 1 c.nitidus 1 1 1 1 ~
l 5 - ,_ - - 1 l Diploneis bombus - 5 - l - - - 2 - - 2 6 1 Melosira sulcata 15 46 25 28 35 24 50 22 - 6 44 14 2 M.westi 6 2 11 3 l 1 3 l - - 4 4 1
Total valves 200 200 200 200 200 200 200 20C 200 200 200 200 200

Level 8 7 6 5 4 3 2 1
Height m.O.D. -1.40 -1.50 -1.60 -1.74 -1.80 -1.90 -1.98 -2.04 Depth em. -220 -230 -240 -254 -260 -270 -278 -284
Pinnularia gentilis - - - - - - 3 5 P.lidcrostauron - - - - - - 1
Eunotis diodon - - - - - - - 2
E.~nodon v.bidene - - - - - - 1 8 b1 Amphora ovalia v.1ibyca 1 - 1 2 - - 1 7
Anomoeoneia sculpts - - - - - - 1 - [/.)
Diploneis ovslie 1 - 2 2 9 4 - - ...... navicula pusilla - 1 - - 1 - 1 4 N
Cymbella aspers c.ahronbergii - 1 - - - - - - t::l Eunotia tonella - - 1 - - - - - 1-'·
Go1:1phonema intricatUIII - - - - - - - 1 Ill
Meridion oirculare - - - - - 1 c+
- - 0 :Dli beohia Bigma 4 9 11 - - - - - El Cooooneis pediculus - 1 - - - - - -Bav1cu1a digitoradiata 1 1j - 1
0
- - - - 0
lll.elegans - - 1 - - - - - § li!.peregrina 1 4 3 - - 4 28 96 c+ 51tzech1a oircumsuta - 1 - - 2 6 38 4 !I)
lll.navicularis 5 29 37 132 149 125 70 19 lll.ooslariB - 4 1 - - - - 9 Coloneis formosa 7 12 4 - - 1 3 Rhopalodia gibberula 1 - - - - 1 - 1
N1tzsoh1a punotata 5 6 9 4 2 8 lll.punctata v.oonstriota - - 1 Sooliopleura tumida 12 23 29 Achnanthes brevipes v.int. 1 3 3 - - 1 - 7 Diplone1a did3ma 15 11 36 13 8 7 4 2 ?<
1-' lllav1cula lyroidas - - 1 - - - -l!l.marina - - - - - - 1 Aohnanthee longipes - - - - - - - 1 Cooconeis scutellam 1 - - - - - - -Diploneie smithi 1 1 1 3 1 2 16 4 Rhaphoneie smpbioeros - - - 3 1 1 Aotinoptychus undulatue 2 9 9 3 2 4 3 2 1'ha1aeaioeira decipiens - 1 - - - - - 1 Diploneis crabro 1 1 ll).fueca - - - - - - 1 D.inourvi t a 1 - 2 - - 1 Navicula inflexa - - - - - - - l !l.lati sam a - - - - 1 ra tzeohia granulata - 1 1 1 2 - 2 !i.panduriformia - - - - - - - 1 Cocconeie costate - 1 1 - - 3 Dip1one1e veiseflogi - 1 Qrammatophora oceanica - - 3 4 2 G.oerpentina - 3 - 3 - 2 Rhabdonoma minutum - 1 Plog1ogruaa ataurophorum - - - - - - - 1 Pbdosira atel1iger 1 4 1 2 1 - 1 Coooinodiecua nitidus - - 1 2 8 12 8 1 Diploneis ~mbua - 1 2 7 2 - 1 tleloeira aulcata 13 30 25 16 7 15 17 20 nl.ueati - 6 1 3 3 3 - 2
Total val vos 73 166 200 200 201 200 202 200

I»~ i~l ~~a"uw vgun~a
Co-ord. 50° 42' 04" N Grid ref. SZ 3516 8922 01° 30' 07" W Field~ork 811209
Level 12 11 10 9 8 7 6 5 4 3 2 1 Height m.o.D. -1.30 -1.34 -1.38 -1•42 -1.46 -1.50 -1.56 -1.64 -1.70 -1.76 -1.82 -1.90 ~ Depth em. -218 -222 -226 ~230 -234 -238 -244 -252 -258 -264 -270 -278 en ......
Navicula lacustris - 1 - - - - - ~ - - - - V.1
Pinnular&s gentilis - - - - - - l - 1 - ~ 4 Eunotia gracilis - - - - - - - - - - - 1 ~ E.monodon v.bidens - - - - - - - - - - - 4 ~ Amphora ovalis v.libyca - - - - - - - - - - - 15 g Anomoeoneis sculpta - - - - - - - - - - - 1 S Cymatopleura elliptica - - - - - - - - - 1 - - o Diploneis ovalis - - - - - - 11 3 3 1 2 ~ o Navicula pusilla - - - - - 3 1 - - - - 3 § N.rbyncocephala - - - - - - - - - - - 3 ~ Surirella americana - - 1 - - - 1 - - - - - I'll
Eunotia tenella - - - - - - - - - 4 Fragilaria brevistriata - - - 1 Gomphonema angustatum - - - - - - - - - - - 3 Nitzschia sigma 2 2 4 - - - - - 1 N.tr¥blionella - - - - - - - 1 Cocconeis pediculus - - 3 Diploneis interrupta 3 5 - - 4 5 2 - - 1 Navicula digitoradiata 5 7 4 11 ~ 7 5 1 - - - 1 ~ N. el egan a - - - - - - - t - - - - 7 ~ N.peregrina 6 2 9 1 3 114 18 12 11 10 9 136 Nitzschia circumsuta - - - - - - - - - 22 28 lhnavic\4~.is 30 67 100 14 13 3 7 109 129 103 90 3 Jllo,~C.~~J:a 1 - 1 .., ,.. 1 3 - - - - 5
. ~liri~~l~~-15.ttiriatuia - ... .... :·~:- :-: { -~ _. _,.. .. . Ca!J..oneia.o.f<o!l'moaa·-- ili.7. U 1 32: 20 ])6· 3ll: 3 ·. - -Rhopa1odia gibberula 1 1 _ _ _ 10 . 1
4 - -· .... ;
Nitzschia punctata 8 10 6 5 7 n 2 6 - - - 2
Scoliopleura tumida 9 _ _ 1 1 7 8 2 1 12
8 Achnanthes brevipes v.int - 3 3 1 1 14 3 Diploneis didyma 76 31 25 80 99 1 75 29 Navicula marina _ _ _ 13 10 7 Nitzschia acuminata _ _ ~ - - - - - - - - 2 Achnanthes 1ongipes - _ ~ _ _ _ 1 Ca1oneis subsalina - - _ Cocconeie scutellum 2 5 _ ; = : :, = - - - 1 C.scute11um v.stauroneiformis _ _ _ 1 1 1 1 Diplonei~ smithi 2 3 _ 1~ 6 _ Rhaphone1s amphiceros 1 2 _ 2 4
1 5 4 5 1
R.surire1la 1 - -1
2 1 3 1
Actinoptychus undu1atus 5 2 6 1 1 Tha1assiosira decipiens 1 _ 1
2 3
1 2 3 5 1
Dimerogramma minor v.nana - _ -Navicula lyra _ 1 - - - 1 1
Nitzschia granu1ata - 5 4 Surirel1a fastuosa 1 1 _ : ~ 3
2 1 - - 1
Trachyneia aspersa 1 2 2 1 _ - - 1 1 1 Diploneis veiasflogi _ _ - 1 - 2 Grammatophora oceanica _ 2 - - - - - - - - 1 G.serpentina 7 2 1 1 1 2 3 3 3 p - - 1 lagiogramma staurophorum _ _ - - - 1 1 1 Podoaira stel1iger 1
1 - - - - - - - 1
Rhabdonema adria ticum 7 1 3 4 - - 1 - 1
R.minutum ; : : 1 Coscinodiscus nitidus _ 1 - - - - 1 Dip1oneis bombue - - - - 1 1 - - 12 Melosira au1cata 2; - - - - - - 2 - - 1 M.westi
2 25 20 23 27 3 18 19 11 10 22 2
4 1 - 1 - 3 - 3 3 3
Total val vee 199 200 203 1~2 198 200 202 199 200 189 200 204

YBS 14; Diatom Counts
Co-ord. 5ff 42' 03" N Grid ref. sz 3515 8980 01° 30' 07" w Fieldwork 811210
Level 10 9 8 7 6 5 4 3 2 1 Height m.O.D. -2.26 -2-30 ~2-34 -2.38 -2.42 -2.48 -2.52 -2.56 -2.60 -2.64 b1 llepth om. -316 -320 -324 -328 -332 -338 -342 -346 -350 -354 ttl
1-'
Pinnularia gentilis 4 3 - 4 5 - 2 4 2 - ~
Stauroneis spp. - - - 3 - - - - - -Eunotia exigua - - - - - - - - 1 - t;;; ...... E.gracilis - - - - 1 - - - - - p)
E.monodon v.bidena - - - 7 4 - - 3 6 - c+ 0
Amphora ovalis v.1ibyca 2 - 5 4 2 - - - 6 - El Di pl onei a ov ali s - - - - - - - 1 2 1 Q
.Navicula dicephal a - 1 - 2 1 - - - - - 0
N.gracilis 1 3 - 2 - - - 2 4 - § N.pusilla - - - 1 1 - - - 2 - c+ Pinnalaria maior 5 7 - 9 12 - - 3 01
Cymbella aspera 1 1 2 - - - - 1 C.sinuatWII - - - - - - - 1 2 Eunotia tenella - - - 1 Gomphonema angustatum - 1 - 1 3 G.constrictum - - - - - - - 2 J.intrioatwn - - - 6 - - - 3 G.loncipes v.aubclavata ' 2
H - - - - - - - - - f-'
2 - - 2 - - - - ...... .......
1 - - - 2 -.'- - -1 .J - - l __ 2.:
,., a ·- 1~ ·3~ - ~ '4 ·'1: -4 '5 ·10 1 Ei 26 4'9
Nitzschia circumsuta - - 2 - 1 1 - 1 2 ~ N.navicular!l.s - - 10 4 14 - 4 5 5 N.scalaris 2 2 2 1 2 - - 4 6 acbnanthea dalicuta ~ ~ - - - - 1 A. baucki ana - - 1 Ca1onei s formosa - - 3 - - - - 3 Rhopalodia gibberula - - 1 - 3 - 1 3 Nitzschia punctata - - 3 5 2 2 4 7 1 N.punctata v.constricta - - - - - - - 1 Scoliopleura tumida - - 2 - . - - 1 - 1 achnanthes brevipes - - :t 1 A.brevipes v.intermedia - - - - - - - - 1 Diploneis didyma - 1 41 7 10 6 11 10 2 Cocconeis scutellum - - - 6 2 1 - 1 C.speciosa - - 1 Diploneis smithi - - 2 - - 1 Hhaphoneis surire11a - - - - - - 1 Actinoptychus undulatus - - 1 1 1 2 - 3 Diploneis incurvita - - - - - - - l Navicula cancellate. - - - - - - - l 1 Nitzschia granulate. - - - - 1 N.panduriformis - - - - - - - l Pinnularia ambiqua 1 Surirella fastuosa 1 - - 2 l - 1 2 Trachynais aspersa - - - 1 1 - 1 2 Grammatophora oceanica v. - - 1 1 - 1 - 1 G.serpentina - - - - - - 1 - 1 Plagiogramma staurophorum - - - 1 Podosira stelliger - - 2 - - - 1 - 1 Coscinodiscus apiculatus - - 1 C.nitidus - 1 1 - - - - - 1 Diploneis bombus - 1 Melosira sulcata - - 12 9 9 2 3 5 1 M.ves ti - - 7 2
Total valves 21 27 115 92 111 19 39 100 105 10

xxxvii
YBS 3; Diatom Counts
Co-ord 50° 42' 10" N Grid ref. sz 3538 8939 01° 29' 56" \:1 Fieldwork 801115
Level 8 7 6 5 4 3 2 1 Height m.O.D. -3-97 -3·99 -4.01 -4.03 -5.87 -5.89 -S-91 -5-93 .!Jep.th em. -417 -479 -481 -483 -667 -669 -671 -673
Pinnularia l>al tica 1 P.gentilis l 4 P.microstauron 3 P.minuta 6 3 3 Eunotia monodon v.bidens 22 13 E.praerupta 24 15 2 Amphora ovalis v.libyca 2 .!Jiploneis ovalis 4 7 5 10 3 1 ~avicula amphibola 1 N.pusilla 2 4 4 3 2
AcAanthea lanceolata v.vent. 3 Cymbella ainuata 1 Epithemia zebra v.porcellus 3 Eunotia tenella 11 Jomphonema intricatum 1 2
~eridion circulars 1 ~tephanodiscus astrea l Nitzschia sigma 2 2 1 Diploneis interrupta 2 3 13 1 110 121 22 126 Navicula digitoradiata 2 N.elegans 6 N.peregrina 13 2 <'3 90 2 ~it~schia filiformis 15 cl 5 17 N.navicularis 5 7 4 10 12 20 19 N.scalaris 6 1 68 Caloneis formosa 22 28 42 rthopalodia gibberula 2 21 Nitzschia punctata 8 7 3 3 1 N.punctata v.constricta 1 Achnanthes brevipea ') 1 ..J.
A.brevipes v.intremedia 2 Diploneis didyma 11 5 1 l 2
llav icu1 a marina l Cooconeis scutellum 2 1 rthaphoneis amphiceros 1 1 Actinoptychus undulatus 7 11 9 1 'l'halassiosira decipiens 1 5 1 Auliscus soultptus 1 Dimerogramma minor v .nana 1 Diploneis fusca 1 1 D,incurvi ta 6 Nitzschia granu1ata 7 1 Surirel1a recendens 2 Achnanthes septata 1 6 1 1 Cocconeis costata 1 Grammatopbora oceanica v.mac. 7 2 1 1 G. marina l Grammatophora ssrpentina 1 Podosira ste1liger 4 1 1 l Coscinodiscus nitidus 1 <' Diploneis bombus 2 ~elosira su1cata 55 48 31:l 3 4 4 8
M.westi 4 10 6 1 1 1 4
'l'otal valves l!:l3 161 198 200 .'01 199 ?5 171

Co-ord. 50° 42' 05" N 01° 30' 08" w
Level Height m.O.D. Depth em.
Nitzschia subtilie PiJUlularia cardinalis P.genti 1 is P.interrupta P.microetauron Cymbella Bouleana Eunotia diodon E.monodon v.bidens Fragilaria virescens v.ell Amphora ovalie v.libyca Anomoeoneis sculpts Diploneis ovalis Navicula dicephal a N.gastrum N.gracilis 1'. pusi lla Pinnularia maior ~tauroneis pboenicentron Surirella americana Cocconeis placentula Gomphonema intricatum Meridion circulars Cocconeis pediculus Diploneis interrupta Navicula digitoradiata N.elegane N.balopbila N.peregrina Nitzschia bilobata B•navl:cu!rariia
__ _ y;,., - i~ac.d&rii!:~- ----· __ -·-. -----. -. ~~- ~- -- ·T~lieifl~ s:ti~i &tul-a ··:.
Jl;~ll-onei·£{Jf.o:Poi0:s&. Rhopalodia gibberula Nitzschia punctata ~.punctata v.conetricta Scoliopleura tumida Achnanthes brevipes v.int. Diploneis didyma Navicula abrupta N.Galikii N.marina Nitzschia acuminata Achnanthes 1ongipee Cocconeis scutellum C.epecioea Diploneis emithi fihaphoneie amphiceros Actinoptychue undulatms Tha1aseioeira decipiens Dimerogramma minor v.nana !Jiploneis fueca liavicu1a hennedyi Nitzschia granulata ~urirella fastuosa Trachyneis aspersa Dip1oneis weissf1ogi lhammatophmra marina G.oceanica v.maci1enta G.serpentina Opepbora pacifica Plagiogramma staurophorum Podosira atel1iger fibabdonema minutum ~oscinodiscus nitidus lJiplonaia bombue Melosira su1cata 1-l.,teoti
Total valves
1' -3·76 -451
11
1
1
3 1
1
l-1;6
.. 2-'
6
3
13
3
3 1
5
1
1 2 1
1
1 24
.:>01
Grid ref. SZ 3515 8928 Fieldwork 801116
14 13 -3.80 -3.84 -455 -459
3
3
1 2 2
3
6g -- _2'.
;-~-~·
. -7" 1
12
5. ~
1
2
1 1
7
85 2-
.... 6~
6
11 10 12 -3.88 -3.92 -3.96
-463
1
1
1 1
1 2
56 --. ...... .
'i'
3
-467 -471
8
17
3
1
1 1
1 6 1
111-
-- .
10
2
1 1 7 2
105
6-
1 ~
5
3 1 3
9 1
11 10
14
1 2 5 1 3 1
6
3
2 l
1 3
1 3
38 8
l;i';l
10
20
2
1 2
2
1 7
4
2
2 1
1 1
25 l
l';!J
21
73
8
1
2
1
1 17
7
l;l;i
13
6
2 1
2
1
1]
2
.:!UL
19
2
3 1
1
2
19
~uc
9 8 -4.00 -4.04
-475 -479
6
l 15
1 9
J5 11
86 3
- 7
;~~ ~'9:c . 14
c
3
ll
1
1
14 1
cv)
2
3 9
6
2
114
8 }Jj ·~'
7
9
..:Vj
7 6 5 -4.06 -4.10 -4.14
-481 -485 -489
4
1 2
3 2 3
56
!~~ ~~~o"• ... '2::
8
10
8
1
1 2 1
1
5 1 7
3
1
29
clv
1
1
2 1
1 3 1
'!io _.,. ~8.
:..-•fl
12 2 6
13 l
1
3 1 7 4
1 3
10
4
6
42 1
~(;2
2
1
2 1 3 8 1 3
45 1 -'4''
13 1 2
19
1
3
1 8 1 1
1 1 9
5
1
1
57 7
Cvj
4 3 2 -4.18 -4.20 -4.24
-493 -495 -499
1 12
8 4 4
62
19
3 2 1 2 1
3
8
1
3
57
3 ...;
3
1
e
c.UC
10 1
7 4 2
81 1
15
2 1
4 1
2
10 4 1
2
30
2 2
3
1
1.<1
8 16
3 '3
41 5
82
12 1
4
6 3
11
-
._\y.).
1 -4.26
-501
8 40
9 6
24 14
63 1
17
1 4
7
9
1
1
c'O';
bj t:f.l
\.0
t:i 1-'·
"' ri-o a 0 0
§ rl(/)
s < ..... .... !-'·
>.

Browndown 13/1~ 2l; Diatom Counts
Grid ref. SZ 585 985
Level 15 14 13 12 11 10 9 8 1 6 5 4 3 2 1
Height m.OD. -10.10 -10.18 -10.28 -10.38 -11.25 -11.35 -11.45 -11.85 -11.95 -12.05 -12.15 -18.90 -18.96 -19.03 -19.13
Dep;th em -460 -468 -478 -488 -575 -585 -595 -635 -645 -655 -665 -1340 -1346 -1353 -1363 tJj ~ 0
Pinnularia microstauron - - - - - - 1 - - - - - ~ Diploneis ovalis - 13 28 4 - - - 2 - - - - - - - p.
Fragil&ria brevistriata - - - - - - - - - 1 - - - - - 0
Cooconeis pediculus - - - - - - - - - - - - - - - § Diploneis interrupta - - - - - - - - - - - - - - - I-'
Navicula peregrina - - - - - 1 - - - - - 1 - - 2 IJol
Bitzschia navicularis 12 33 51 31 40 50 110 104 26 17 32 64 136 84 120 ~ Caloneis formosa 1 7 4 2 - - - - - - - - - - - ~
Rhopalodia gibberula 1 - - - - - - - - - - - - - - VI
Nitzschia punctata 14 6 10 1 4 9 11 1 4 3 6 10 6 1 242 VJ
Diploneis didyma 24 33 20 16 8 5 5 24 1 2 10 4 9 3 '5
Navicula marina 3 - - - - - - - - - - - - - - t::j
Cocconeis scutellum 2 2 - - -.....
- - - - - - - - - 2 Ill
Diploneis smithi - - 2 1 - - - - - - - - - - - c+
Rhaphoneis amphiceros 1 1 - - - - 0
- - - - - - - - - 8
R.surire11a - - - - - - 3 - 1 1 1 4 5 2 4 (') ~
Actinoptyohus undulatus - 2 11 1 - - - - - 1 5 2 2 2 - 0 1--'
Thalassiosira decipiens - - - 1 - - - - 1 - - 3 - - § ..... - -b'·
Dimerogramma minor v.nana - - - - - - - - - - - - 1 - - c+ 1-'·
Navicula hennedyi -- - - - - - - - - 1 - - - - - Ol
Nitzschia granulata 2 3 1 2 2 1 6 4 1 2 2 4 8 4 1
Trachyneis aspersa - 9 4 10 Diploneis ~eissflogi ~rammatophora marina 1 - 2
G.oceanioa v.macilenta - - - - - 1 3 - 1
G. serpent ina - - - - - - 1 - 1 - - - 1
Opephora marina - - - - - - - - - - 1
O.pacifica - - - - - - - - - - - - - - 1
PJ. agiogramma staurophorum - - - - - - 1
Podosira stelliger - - - - 4 4 3 4 - 2 5
Cosoinodiscus nitidus - - 1 - 1 - - - - - - 2 4 1 11
Diploneie bombue - - - - - - 2 1 - - 3
~elosira sulcata 23 81 53 25 8 18 28 18 15 17 42 50 25 27 19
M.vesti 5 4 3 1 2 2 4 9 6 2 4 6 3
Total valves 86 192 199 95 69 91 179 113 57 50 111 150 200 130 187

·I
xx.x·.
Pett Level 4; Pollen Counts
Co-ord. 50° 53 1 14" N ooo 41' 15" E
Jrid ref. TQ 8903 1331 Fieldwork 820924
Level Height m.O.D. Depth em.
Betula Pinus Ulmus -iuercus Tilia , Fraxinfis Fagus Carpinus Alnus Corylus Lonicera Rhamnus Ilex ~angula Hedera Call una Viburnum Salix Gramineae Cyperaceae Composi tae tub. Centaurea Composi tae lig. Artemisia Ranwwul us-type Qal tha-type Cruciferae Caryophyllaoeae Chenopodiaceae Leguminosae J:tosaceae Filipendu1a Potentilla..:type Lythrum ·. Hydrocotyle vulgare Umbelliferae Rumex Glaux Convolvulus Ca1ystegia Plantago lane. Plantago maj/med. Wahlenbergia Galium Succi sa Myriophyllum Alisma Potamogeton 'l'ypha latifolia 'l'ypha angustifolia Osmund a Pteridium folypodium Sphagnum Filicales Pilillaria
Lycopodium
22 21 20 19 +0.02 -0.02 -0.05 -0.07 -1 -5 -8 -10
17
15
1 1
206 16
1
136 25 69 1
4
2
1 3
2
1 3
16
33
16
1 10
6 1
107 11
1 3
244 28 56
1
1 5 3
2
3 1
1
3
5
22
18
1 7
1 2
243 18
1 1
2 1
101 38 45
3
1
2
1
5 2
1
5
1
8
5
3
24
20
1 10
3 1
228 25
1 1
2 105
40 31
2
4
2
3 1 6
1 1 1 4 1
6
1 13
11'
12
15
18 -0.1() -13
17 3 1
11
1 2
94 17
3
1 3
161 75 55 9
1 2 8
1
1 20 1 4
4 1 1
2 1
2 2 1
61
13 1
44
36
17 16 -0.14 -0.22
-17 -25
18 1 1 8
1 1
214 23
1
1
126 60 22 1 1
4
1 1 3
1
2 2 2
5
1
1
22
3
11
15
5
12
2 2
147 24
1 64 54
128 4
3
6 1 1
1 14
1
12 7
7 2 1 2
27 2
17 1
6
30
15' 114 -0.2.8 0-33 -31! -36
I I
2')
!I 1~ I !-:2
,8
'16
2 3
3~; 14l2 4;3 22 ,-
:5 ;-
1 !3
3,4 3,8 ,_ I :-
i1 !5 I ,_ l ~ ~ r ~ I r r r [
~ I c ~ ~
~ r [ L r-I r
~ 15
l!l !3 '-
6 '-
16
1
1 11
6 !
'5
1
8
• 2
1
,2 2
:4
l9 1
19
;.
13 12 11 10 9 8 7 6 5 4 3 2 1 -0.35 -0.37 -0.38 -0.43 -0.49 -0.53 -0.57 -0.63 -0.67 -0.71 -0.77 -0.79 -0.81
-38 -40 -41 -46 -52 -56 -60 -66 -70 -14 -80 -82 -84
26 14 1 1
11 11 2 2 1 2
414 421 12 19
~
1
4 4 4 7
12 8
·-7 4
1!:.
1
3 4
1
1
1
1 1
1
7 5 1 5 1 4 1
27 20
11 13
17
14
2
396 25
2 8 7
10
5
2 8
1
3
14 3
24
15
8
1 18
1 2
220 27
2 21 48 88
3
2 1 6
3 3 1
25
1 , 3 3
5
4
1 1
20
35
7
10
2
306 33
1
I
2 38 40 29
1
3 1 1
1 2
15
1
3
2
1
1
2 37 19-
1
11
52
12 1 1
14 2
2
248 37
1
97 32 20
1 10
l
3 2
7 1
1 2
3 1
1
2
1 3
23 14 .2 1 4
41
7
1 20
3
95 71
3
4 77 70
101 10
1
2
3
21 1
6 3
1
11 18 34
1 1
16
39
10 3 2
22
2
209 40
1
1 1
6 23 34 67 9
4
5
4
3
1 30 7 1 1
1
8 5
1
5 3 7
44 40
1 1
11
59
7
31 5 3
278 45
1 1 2
6 10 26 11
1 5
18 1
2
1 32 1 1
1 2
8 1
l 4
35 58
4
67
6 1 3
15 1 3
366 28
1
2 2
4 3
10 21
9
1 15
1
3
3
2
1
45 7
9
55_
12
7 2 1
401 34
.,
13 3 9 9
2
1 1
2
2
1
1 19 4 2
5
27
9 2 1
18 7 1
324 40
2
2
3 37 4
39
4
1
1 1
2 1
1
1
1 25 8 1
10
34
10 1
23 4 1
351 34
2 1
9 3
48
7t
3
2
1
2
3 13
8 8 1
11
24