Waste polymeric materials valorization through microwave ...
282
Waste polymeric materials valorization through microwave assisted pyrolysis DOTTORATO DI RICERCA IN Scienze Chimiche CICLO XXVI COORDINATORE Prof. Andrea Goti Settore Scientifico Disciplinare CHIM/04 Dottorando Tutore Dott. Undri Andrea Prof. Frediani Piero Coordinatore Prof. Goti Andrea Anni 2011/2013
-
Upload
khangminh22 -
Category
Documents
-
view
1 -
download
0
Transcript of Waste polymeric materials valorization through microwave ...

Waste polymeric materials valorization throughmicrowave assisted pyrolysis
DOTTORATO DI RICERCA IN Scienze Chimiche
CICLO XXVI
COORDINATORE Prof. Andrea Goti
Settore Scientifico Disciplinare CHIM/04
Dottorando TutoreDott. Undri Andrea Prof. Frediani Piero
CoordinatoreProf. Goti Andrea
Anni 2011/2013


This work is formy best supporters,
my family


Contents
Acknowledgements ...................................................................................... XXIAbstract ....................................................................................................... XXIII1. Introduction ........................................................................................... 1
1.1. Main polymers ..................................................................................... 21.1.1. Poly(ethylene): Production and use ................................................ 31.1.2. Poly(propylene): Production and use .............................................. 51.1.3. Poly(styrene): Production and use .................................................. 61.1.4. Poly(lactic acid): Production and use .............................................. 71.1.5. Tire: Production and use ................................................................. 81.1.6. Multi-layer packaging: Production and use ..................................... 101.1.7. Automotive shredder residue: Production and use ......................... 111.1.8. Biomasses, wood: Production and use ........................................... 121.1.9. MaterBi: Production and use........................................................... 13
1.2. Waste management............................................................................. 141.3. Pyrolysis .............................................................................................. 18
1.3.1. Polyolefins ...................................................................................... 191.3.2. Poly(styrene) .................................................................................. 211.3.3. Poly(lactic acid) (PLA) .................................................................... 211.3.4. Wood .............................................................................................. 231.3.5. MaterBi ........................................................................................... 241.3.6. Tire ................................................................................................. 241.3.7. Multi-layer packaging (MLP) ........................................................... 271.3.8. Automotive shredder residue (ASR) ............................................... 28
2. Microwave and Materials ...................................................................... 392.1. Microwave equipment .......................................................................... 402.2. Microwave interaction with materials and microwave heating .............. 42
3. Microwave Processing of Materials ..................................................... 473.1. Biomasses ........................................................................................... 483.2. Polymers .............................................................................................. 52
3.2.1. Patent Literature ............................................................................. 533.3. Other processed materials .................................................................. 55
4. Microwave Pyrolysis System ............................................................... 614.1. Oven and apparatus set-up ................................................................. 614.2. Variables .............................................................................................. 614.3. Sample preparation and products collection ........................................ 63
5. Waste Tire .............................................................................................. 655.1. Operating Parameters and Yields ........................................................ 665.2. Gas Product ......................................................................................... 695.3. Solid .................................................................................................... 70

1 - ContentsVI
5.3.1. Physical properties ......................................................................... 705.3.2. ICP-MS ........................................................................................... 735.3.3. FTIR ............................................................................................... 745.3.4. BET Surface area ........................................................................... 755.3.5. Scanning electron microscopy ........................................................ 765.3.6. X-ray diffraction............................................................................... 795.3.7. Main achievements ......................................................................... 82
5.4. Liquid ................................................................................................... 835.4.1. Physical properties ......................................................................... 835.4.2. GC/MS ............................................................................................ 855.4.3. 1H-NMR ......................................................................................... 995.4.4. Distillation curve ............................................................................. 1015.4.5. FTIR ............................................................................................... 1035.4.6. Main achievements ......................................................................... 104
5.5. Temperature detection problem ........................................................... 1055.6. Hydrodesulfurization ............................................................................ 108
6. Microwave Assisted Pyrolysis of Waste Polymers ............................. 1176.1. Polyethylene ........................................................................................ 118
6.1.1. Operating conditions and yields ..................................................... 1186.1.2. Liquid product ................................................................................. 1206.1.2.1. Physical properties .................................................................... 1206.1.2.2. GC/MS ...................................................................................... 1216.1.2.3. FTIR .......................................................................................... 1276.1.2.4. Distillation curve ........................................................................ 128
6.2. Polypropylene ...................................................................................... 1306.2.1. Operating conditions and yields ..................................................... 1306.2.2. Liquid product ................................................................................. 1316.2.2.1. Physical properties .................................................................... 1316.2.2.2. GC/MS ...................................................................................... 1326.2.2.3. FTIR .......................................................................................... 1386.2.2.4. Distillation curve ........................................................................ 139
6.3. Polystyrene .......................................................................................... 1406.3.1. Operating conditions and yields ..................................................... 1406.3.2. Liquid product ................................................................................. 1426.3.2.1. Physical properties .................................................................... 1426.3.2.2. GC/MS ...................................................................................... 1436.3.2.3. FTIR .......................................................................................... 148
6.4. Main achievements .............................................................................. 1497. Composites, waste multi-layer packaging .......................................... 153
7.1. Operating parameters and yields......................................................... 1537.2. Liquid products .................................................................................... 155
7.2.1. Physical properties ......................................................................... 1557.2.2. GC/MS analysis .............................................................................. 1567.2.3. FT-IR analysis ................................................................................. 1607.2.4. 1H NMR ......................................................................................... 162
7.3. Gas product ......................................................................................... 1657.4. Solid product ........................................................................................ 1667.5. Main achievements .............................................................................. 166
8. Biomasses, wood pellets ..................................................................... 1698.1. Operating conditions and yields .......................................................... 1698.2. Solid Product ....................................................................................... 172

1 - Contents VII
8.2.1. Physical properties ......................................................................... 1728.2.2. FTIR of Char................................................................................... 174
8.3. Liquid product ...................................................................................... 1768.3.1. Physical properties ......................................................................... 1768.3.2. Thin layer chromatograph ............................................................... 1788.3.3. GC/MS-FID ..................................................................................... 1808.3.4. HPLC/MS ....................................................................................... 1918.3.5. 1H NMR ......................................................................................... 1958.3.6. FTIR ............................................................................................... 197
8.4. Gas product ......................................................................................... 2008.4.1. FTIR ............................................................................................... 2008.4.2. Chemical trapping .......................................................................... 202
8.5. Main achievements .............................................................................. 2039. Bio-polymers ......................................................................................... 209
9.1. Poly(lactic acid) .................................................................................... 2099.1.1. Operating conditions and yields ..................................................... 2099.1.2. Collected lactide ............................................................................. 2119.1.3. Liquid product ................................................................................. 2129.1.3.1. Physical properties .................................................................... 2129.1.3.2. GC/MS ...................................................................................... 2139.1.3.3. FTIR .......................................................................................... 216
9.1.4. Main achievements ......................................................................... 2189.2. Corn-derived plastics ........................................................................... 219
9.2.1. Operating conditions and yields ..................................................... 2199.2.2. iquid product ................................................................................... 2219.2.2.1. Physical properties .................................................................... 2219.2.2.2. GC/MS ...................................................................................... 2229.2.2.3. FTIR .......................................................................................... 2289.2.2.4. 1H NMR .................................................................................... 231
9.2.3. Main achievements ......................................................................... 233Conclusion .................................................................................................... 237Appendix I: Materials and Instruments ....................................................... i
I. Tire ...................................................................................................... iII. High density polyethylene (HDPE) ...................................................... iiIII. PP ........................................................................................................ iiIV. PS ........................................................................................................ iiiV. PLA ...................................................................................................... ivVI. Wood pellets ........................................................................................ ivVII. Crop derived plastic ............................................................................. ivVIII. Multi-layer packaging ........................................................................... vIX. Reagents and Solvents........................................................................ vi
Appendix II: Analytical Methods .................................................................. viiI. Sample collection and storage ............................................................ viiII. Density ................................................................................................ viiIII. Viscosity .............................................................................................. viiiIV. Distillation curve .................................................................................. ixV. Ultimate analysis.................................................................................. xVI. Calorific values .................................................................................... xVII. Thin layer chromatography .................................................................. xVIII. GC/MS ................................................................................................. xiIX. GC/FID and GC/TCD........................................................................... xi

1 - ContentsVIII
X. FTIR .................................................................................................... xiiXI. ICP/MS ................................................................................................ xiiXII. NMR .................................................................................................... xiiXIII. HPLC/MS ............................................................................................ xiiiXIV. Proximate analysis ............................................................................... xiiiXV. Apparent density of char ..................................................................... xivXVI. BET ..................................................................................................... xivXVII. ESEM-EDX .......................................................................................... xivXVIII. Powder XRD ...................................................................................... xivXIX. Hydrodesulfurization ............................................................................ xivXX. Chemical trapping of gas ..................................................................... xv
Appendix III: Abbreviation ........................................................................... xvii

List of Figures
Figure 1.1. Ideal closed loop cycle for plastic items. ...................................... 1
Figure 1.2. Schematic structure of PE. a) LDPE; b) HDPE; c) LLDPE. ......... 3
Figure 1.3. Three classes of PP: a) isotactic; b) syndiotactic; c) atactic. ........ 5
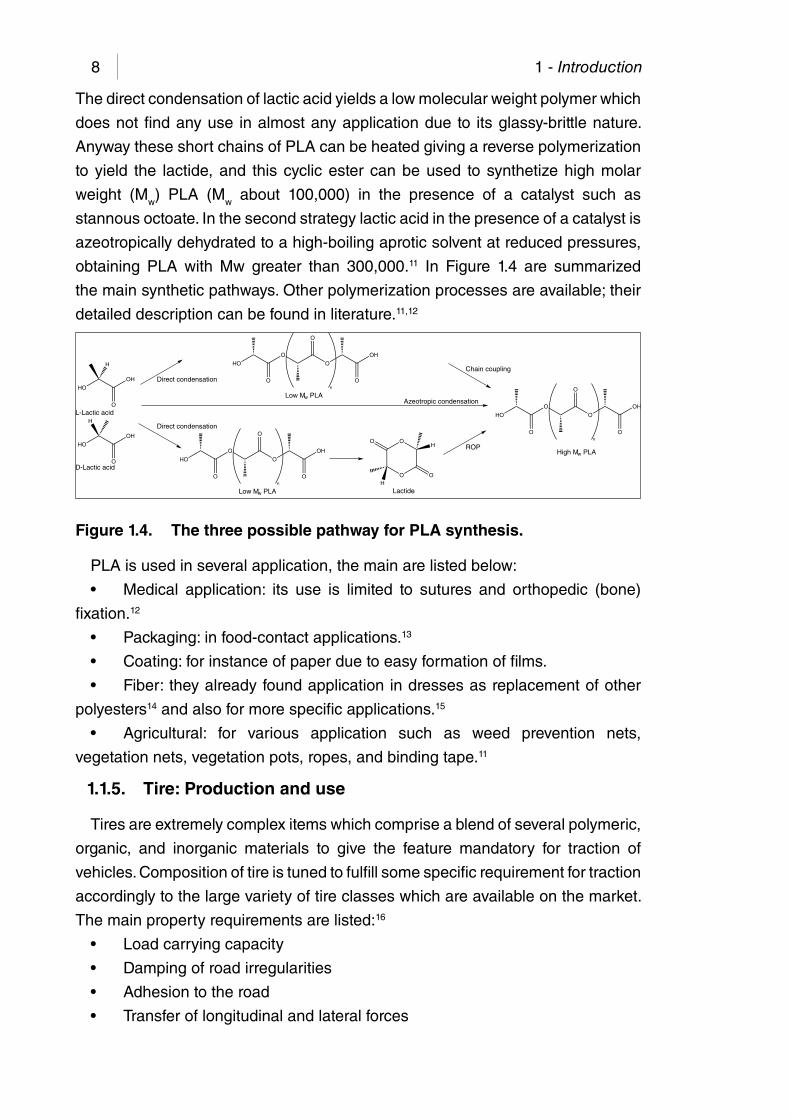
Figure 1.4. The three possible pathway for PLA synthesis. ........................... 8
Figure 1.5. Schematic cut view of a tire. ........................................................ 9
Figure 1.6. Schematic views of MLP: a) with aluminum foil; b) without aluminum
foil. ............................................................................................... 11
Figure 1.7. Lignin general structure ............................................................... 12
Figure 1.8. Cellulose repeting unit. ................................................................ 13
Figure 1.9. Hemicellulose general structure. ................................................. 13
Figure 1.10. A general scheme for plastics recycling. ...................................... 15
Figure 1.11. A schematic pyrolysis unit. .......................................................... 19
Figure 1.12. Pyrolysis of PE, main reactions and products. a) C-C bond cleavage
with alkane and 1-alkene formation; b) chain end radical formation
followed by a ring formation and a dehydrogenation reaction; c)
dialkene formation; d) Diels-Alder followed by a dehydrogenation
reaction. ....................................................................................... 20
Figure 1.13. Pyrolysis of PP, main reactions and products; It is highlighted the
formation of 1- or 2- alkenes. ....................................................... 20
Figure 1.14. Pyrolysis of PS and formation of its degradation products. ......... 21
Figure 1.15. Possible non-radical reactions involving PLA pyrolysis. ............... 22
Figure 1.16. Possible pathways for radical reactions for pyrolysis of PLA. ....... 22
Figure 1.17. Typical composition of a liquid from pyrolysis of wood.96 ............. 23
Figure 1.18. Possible reaction routes for PAHs formation. ............................... 26
Figure 1.19. Possible reaction routes for aromatics formation. ........................ 26
Figure 1.20. Possible reaction route for limonene formation and pyrolysis. ..... 26
Figure 2.1. MW frequency and relative energy. C: carbon-carbon covalent bond
energy; H: carbon-hydrogen covalent bond energy; I: ionic solid
average bond energy. .................................................................. 40
Figure 2.2. Schematic diagram of a magnetron. a) top view; b) side view.1 ... 41
List of figureX
Figure 2.3. Schematic representation of MW heating of carbon material. ..... 42
Figure 2.4. Schematic representation of a MW cavity. a) the MW are not absorbed,
the sample has a low tanδ value, 1, incident radiation; 2 and 3,
radiation returned to the sample after reflection from oven walls.; b)
the MW are absorbed, the sample has a high tanδ value, 1, incident
radiation; 2, radiation reflected from the sample; 3, radiation returned
to the sample after reflection from oven walls. ............................. 45
Figure 4.1. Schematic representation of set-up A. (1) Oven; (2) Flask; (3) MW
suppliers; (4) Flat pipe; (5) Cooler at 298 K; (6) Cooler at 263 K; (7)
Liquid collecting flask; (8) Gas collecting system. ........................ 62
Figure 4.2. Schematic representation of set-up B. (1) Oven; (2) Flask; (3) MW
suppliers; (4) Flat pipe (5) Cooler at 298 K; (6) Cooler at 263 K; (7)
Liquid collecting flask; (8) Gas collecting system. ........................ 62
Figure 5.1. A tire chip after different irradiation time. (a) Tire chip not irradiated;
(b) tire chip irradiated for 40 s; (c) tire chip irradiated for 90 s, it flakes
if handled; (d) bulge effect of an irradiated tire chip, side view. .... 65
Figure 5.2. The fractionating system. ............................................................. 68
Figure 5.3. FTIR of T1S, T4S, T6S, and T9S. ................................................ 75
Figure 5.4. SEM images of: (a) tire M: magnification 4000 times; (b) T1S:
magnification 500 times; (c) T1S: magnification 4000 times; (d) T9S:
magnification 400 times. .............................................................. 77
Figure 5.5. SEM back scattering image of S1. The microanalyses are referred to
spots identified with the same shape in the SEM image. ............ 78
Figure 5.6. SEM images and microanalysis of metal wires. (a) metal wire before
pyrolysis; (b) metal wire after pyrolysis; (c) microanalysis of metal
wire before pyrolysis; (d) microanalysis of metal wire after pyrolysis,
cracked coating; (e) microanalysis of metal wire after pyrolysis, inner
surface. ........................................................................................ 79
Figure 5.7. XRD patterns of samples T1S, T4S and T9S. .............................. 80
Figure 5.8. XRD patterns of sample T6S. ...................................................... 81
Figure 5.9. Aspect of some liquid products: T4L, T5L, T10L, and T11L. ........ 83
Figure 5.10. Total ion chromatography of samples: a. T4L; b. T5L. The numbers in
the chromatogram correspond to those reported in Table 5.8. .... 98
Figure 5.11. Total ion chromatography of samples: a. T10L; T11L The numbers in
the chromatogram correspond to those reported in Table 5.8. .... 98
Figure 5.12. 1H-NMR spectra of samples: a. T4L; b. T5L; c. T10L; d. T11L. The
range of aliphatic, olefinic and aromatic resonances are reported.
.................................................................................................... 100
Figure 5.13. FT-IR spectra of liquids : a. T4L; b. T5L; c. T10L; d. T11L. ............ 104
Figure 5.14. Infrared thermometer. a. cone of temperature detection; b. the vapor

List of figure XI
covered the feed and only the vapor temperature is detected. .... 106
Figure 5.15. TIC of HDS 10 and HDS_12 before (dotted lines) and after (solid
lines) normalized to internal standard. In both TIC: a. toluene; b:
ethylbenzene; c. limonene; d. tetrahydrolimonene; e. internal standard;
f. BT. ............................................................................................ 110
Figure 5.16. HDS of BT in liquid from MAP of tires. ......................................... 111
Figure 5.17. TIC of HDS_16 before (dotted lines) and after (solid lines) normalized to
internal standard. In both TIC: a. toluene; b: aniline; c. N-methylaniline;
d. N,N-dimethylaniline; e. limonene; f. tetrahydrolimonene; g. internal
standard; h. BTZ. ........................................................................ 111
Figure 6.1. Degradation of polyolefins during MW irradiation: a. polyolefin and
MW absorber; b. Melted polymer swallowed the MW absorber; c.
pyrolysis take place. ..................................................................... 117
Figure 6.2. TIC of samples obtained from MAP of HDPE with set-up A: PE2L_II.
.................................................................................................... 121
Figure 6.3. TIC of samples obtained from MAP of HDPE with set-up B: PE6L.
.................................................................................................... 121
Figure 6.4. FT-IR spectra of liquids: a) PE1L; b) PE5L_I; c) PE3L; d) PE6L. . 128
Figure 6.5. TIC of samples obtained from MAP of PP with set-up A: PP1L. .. 132
Figure 6.6. TIC of samples obtained from MAP of PP with set-up B:PP5L. .. 132
Figure 6.7. FTIR spectra of liquids from MAP of PP. a) PP1L; b) PP2L; c) PP3L;
d) PP5L. ....................................................................................... 138
Figure 6.8. TIC of a) PS2L; b) PS4L; c) PS1L. The numbers in the chromatogram
correspond to those reported in Table 6.12. ................................. 146
Figure 6.9. Yields calculated for the main aromatic compounds. ................... 147
Figure 6.10. FTIR of: a) PS2L; b) PS4L; c) PS6L; d) PS1L; e) T4L. ................ 149
Figure 7.1. Aluminum recovered after MAP. ................................................... 154
Figure 7.2. FTIR spectra of: a. WMP1L-H; b. WMP2L-H; c. WMP5L-H. ......... 161
Figure 7.3. FTIR spectra of a: WMP4L-W, water spectrum subtracted; b:
WMP4L-W. ................................................................................... 162
Figure 7.4. 1H-NMR of LnH where n is the number reported in ordinates. .... 163
Figure 7.5. 1H NMR spectrum of WMP2L-W (b) and its relative water subtract
spectrum (a) together with the integral region. ............................ 164
Figure 8.1. WP after pyrolysis: a) from WP2, no MW absorber; b) from WP6,
carbon was the MW absorber; c) from WP12, Fe was the MW
absorber. ...................................................................................... 169
Figure 8.2. Three-dimension Van Krevelen diagram of char from MAP of WP.
.................................................................................................... 174
Figure 8.3. FTIR spectra of: a) WP; b) WP1S; c) WP2S; d) WP3S; e) WP4S..
.................................................................................................... 175

List of figureXII
Figure 8.4. TLC using MeOH/AcN/H2O, from left to right, TLC chromatograms
examined under daylight and UV light, longwave and shortwave, of:
a) WP1L_UP; b) WP3L_UP; c) WP4L_UP; d) WP5L_UP; e) WP11L_
UP; f) WP8L_UP; g) WP12L_UP. ................................................. 178
Figure 8.5. TLC using MeOH/AcN/H2O, from left to right, TLC chromatograms
examined under daylight and UV light, longwave and shortwave, of:
b) WP3L_BOT; c) WP4L_BOT; d) WP5L_BOT; e) WP11L_BOT; f)
WP8L_BOT; g) WP12L_BOT. ...................................................... 178
Figure 8.6. TLC using CH2Cl2/H2O, from left to right, TLC chromatograms
examined under daylight and UV light, longwave and shortwave, of:
a) WP1L_UP; b) WP3L_UP; c) WP4L_UP; d) WP5L_UP; e) WP11L_
UP; f) WP8L_UP; g) WP12L_UP. ................................................. 179
Figure 8.7. TLC using CH2Cl2/H2O, from left to right, TLC chromatograms
examined under daylight and UV light, longwave and shortwave, of:
b) WP3L_BOT; c) WP4L_BOT; d) WP5L_BOT; e) WP11L_BOT; f)
WP8L_BOT; g) WP12L_BOT. ...................................................... 179
Figure 8.8. Comparison between RRFfound and RRFcalc reported in Table 8.7; a)
for guaiacol, slope: 1.00, intercept: 7.82E-06, R2: 0.9807; b) for furfural,
slope: 1.00, intercept: 2.77E-07, R2: 0.9907. ................................. 186
Figure 8.9. FID and TIC chromatograms of a) FID of WP12L_UP; b) FID of
WP12L_BOT; c) TIC of WP12L_BOT. .......................................... 191
Figure 8.10. 1H NMR spectra of WP5L_UP and their relative water subtract
spectra together with the integral region. ..................................... 195
Figure 8.11. 1H NMR spectra of W5L_BOT. .................................................... 197
Figure 8.12. FTIR spectra of: a) WP12L_UP; b) WP12L_BOT. ........................ 198
Figure 8.13. FTIR spectra of WP11G after 3, 13, and 26 min from the start of
pyrolysis. ...................................................................................... 201
Figure 8.14. Hydrazine form DNPH (a) and formaldehyde, acetaldehyde,
and acetone: b) 1-(2,4-dinitrophenyl)-2-methylenehydrazine; c)
1-(2,4-dinitrophenyl)-2-ethylidenehydrazine; d) 1-(2,4-dinitrophenyl)-
2-(propan-2-ylidene)hydrazine. .................................................... 202
Figure 8.15. 1H NMR spectrum of precipitate from WP6G. ............................ 203
Figure I.I. Tire M and Tire G. ........................................................................ i
Figure I.II. HDPE barrel and chopped HDPE. ............................................... ii
Figure I.III. PP barrel and chopped PP. .......................................................... iii
Figure I.IV. PS foam and PS chips. ................................................................ iii
Figure I.V. PLA pellets from NatureWorks LLC. ............................................ iv
Figure I.VI. WP from beech. ........................................................................... iv
Figure I.VII. Shopping bags from CDP. ........................................................... v
Figure I.VIII. ....................................................................................................

List of figure XIII
MLP beverage carton. ................................................................. v
Figure II.I. Ostwald viscometer: a. starting point of measure; b. ending point for
measure; c. reservoir. .................................................................. viii
Figure II.II. a. Claisen’s flask; b. detail of Claisen’s flask distillation head. ...... x
Figure II.III. Shimadzu modelIRAffinity-1. ......................................................... xii


List of Tables
Table 1.1. 2011 European productions of the main polymer classes. ........... 2
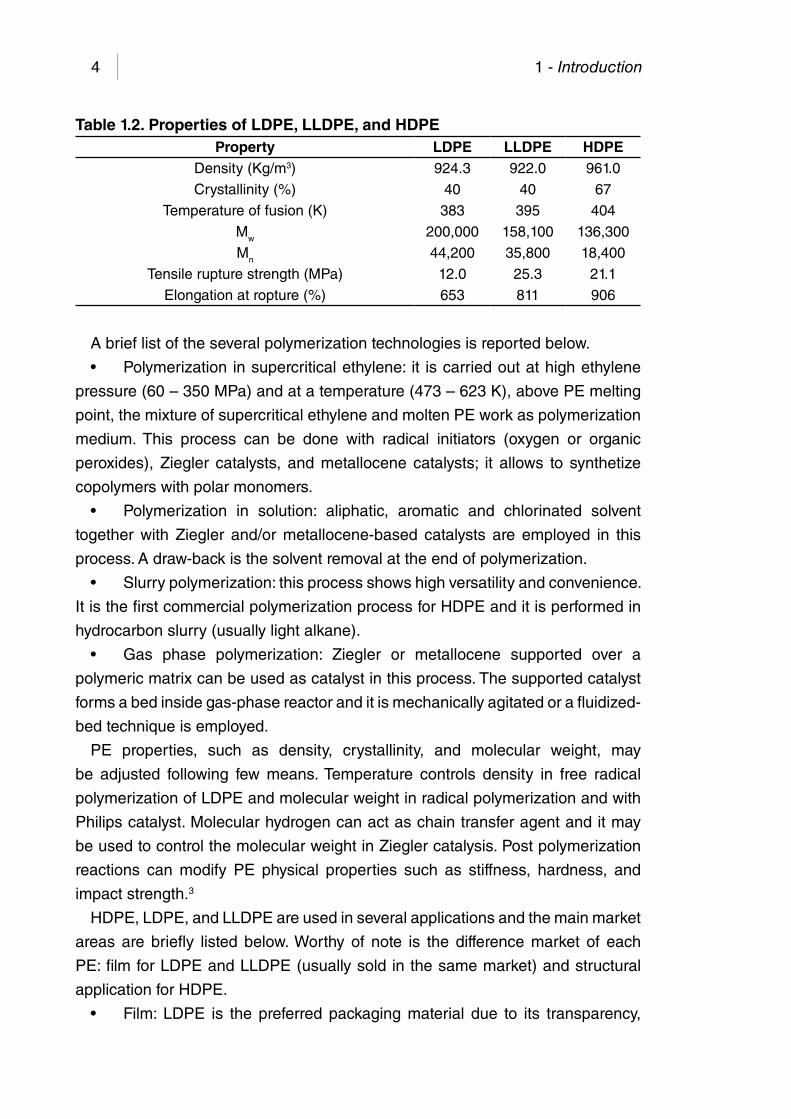
Table 1.2. Properties of LDPE, LLDPE, and HDPE ..................................... 4
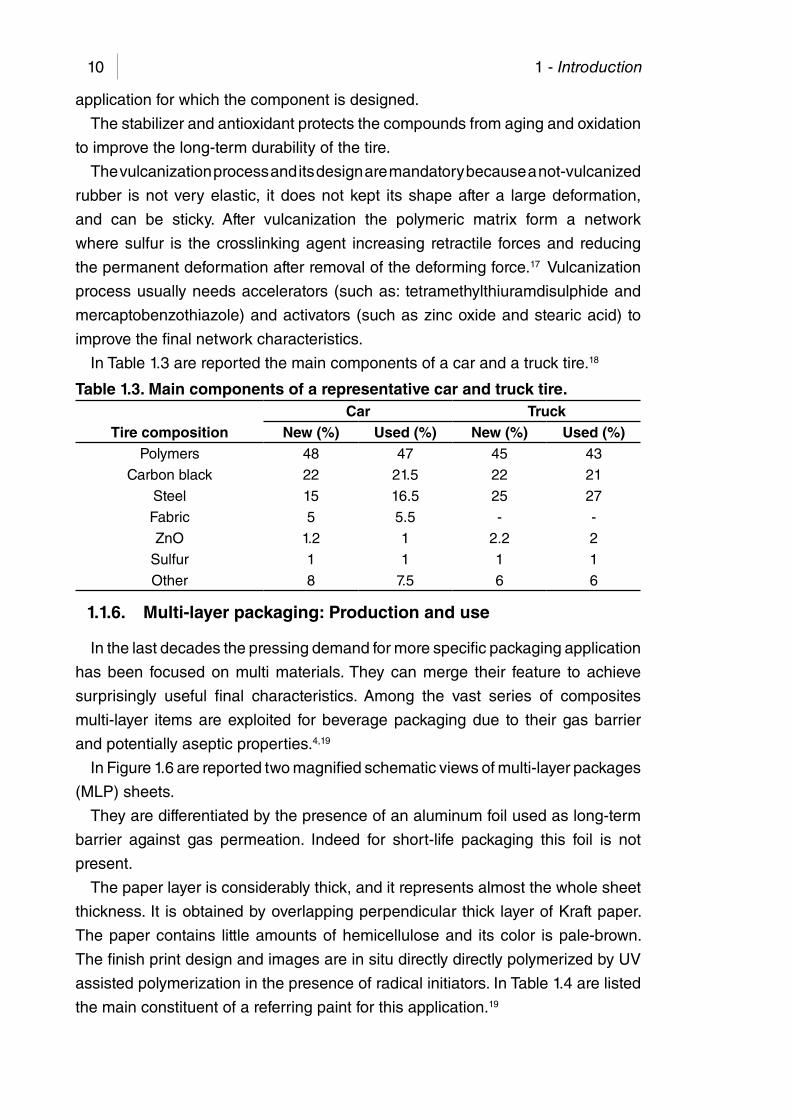
Table 1.3. Main components of a representative car and truck tire. ............. 10
Table 1.4. Composition of a referring paint.19 ............................................... 11
Table 1.5. Typical garbage composition in the United States. ...................... 15
Table 1.6. Main parameters and yield for pyrolysis of tire. ........................... 25
Table 1.7. Technologies and relative yields used in pyrolysis of ASR. ......... 28
Table 2.1. Some tanδ values of selected materials at 298 K. 4, 5 .................. 44
Table 3.1. Summary of MAP of biomass, compiled drawn by Yin.9 .............. 48
Table 3.2. Main features of patented MAP processes. ................................. 53
Table 5.1. MAP of tire: influence of tire brand, and reaction parameters on
the yields of products formed (metal wires not include in yield
calculations). ................................................................................ 66
Table 5.2. Main substances identified in gases. ........................................... 69
Table 5.3. Properties of chars obtained by MAP of tires. .............................. 71
Table 5.4. ICP-MS analyses of char, reported as mg/Kg (ppm). .................. 73
Table 5.5. BET surface areas their pore volume and its distribution of collected
and degassed char samples. ....................................................... 75
Table 5.6. Characteristic of liquid obtained by MAP of tire. .......................... 84
Table 5.7. Compounds identified in liquids. .................................................. 86
Table 5.8. 15 main compounds in liquids from MAP of tire. .......................... 97
Table 5.9. Abundance for each proton class in liquids from MAP of tires. .... 101
Table 5.10. Distillation curve of liquids from MAP of tire. ............................... 101
Table 5.11. IR absorptions of liquids from MAP of tiresa. ............................... 103
Table 5.12. Temperature detected and extrapolated in MAP. ......................... 107
Table 5.13. HDS parameters and yields. ........................................................ 109
Table 6.1. MAP of HDPE, operating parameters. ......................................... 118
Table 6.2. Characteristic of liquid obtained by MAP of HDPE. ..................... 120
Table 6.3. Compounds in liquids from MAP of HDPE. ................................. 121
Table 6.4. Distillation of liquids from MAP of HDPE. .................................... 129

List of tableXVI
Table 6.5. MAP of PP, operating parameters. ............................................... 130
Table 6.6. Characteristic of liquid obtained by MAP of PP. ........................... 131
Table 6.7. Compounds in liquids from MAP of PP. ....................................... 133
Table 6.8. Distillation of liquids. .................................................................... 139
Table 6.9. MAP of PS operating parameters ................................................ 140
Table 6.10. Yield calculation for entry 5, together with the experimental values.
.................................................................................................... 142
Table 6.11. Physical characteristics of liquid obtained by MAP of PS. ........... 142
Table 6.12. Compounds identified in liquids from MAP of PS, by GC-MS. ..... 144
Table 6.13. IR absorptions of liquid samplesa. .............................................. 148
Table 7.1. Microwave assisted pyrolysis of WMP. ......................................... 153
Table 7.2. Physical characteristics of liquid obtained by MAP of WMP. ........ 156
Table 7.3. Compounds identified in WMP5L-H from MAP of WMP by GC/MS
analyses. ...................................................................................... 157
Table 7.4. Compositions of heavy liquid phases by GC/MS analyses from MAP
of WMP. ........................................................................................ 159
Table 7.5. FTIR absorption of upper liquid phases, WMPnL-H. ................... 160
Table 7.6. FTIR absorptions of heavy liquid phases, WMPnL-W. ................ 161
Table 7.7. Proton distribution and medium chain length of a linear alkane from 1H-NMR. ...................................................................................... 163
Table 7.8. Normalized areas of water fractions. ........................................... 165
Table 8.1. MAP of WP, operating parameters. .............................................. 170
Table 8.2. Solids from MAP of WP. ............................................................... 173
Table 8.3. IR absorptions of char from MAP of WP. .................................... 175
Table 8.4. Liquid from MAP of WP ............................................................... 177
Table 8.5. Standard compounds injected both in GC/MS and HPLC/MS .... 182
Table 8.6. Parameters defined (P, Z, and Q) for Eq. 8.5 obtained using the
experimental RRF from Table 8.7. ................................................ 185
Table 8.7. RRFfound, from experimental data, compared with the RRFcalc predicted
with Eq. 8.5 and parameter reported in Table 8.6 for reference
compounds. ................................................................................. 185
Table 8.8. Concentration (g/L) of WP3L_UP, WP4L_UP, WP5L_UP, WP8L_UP,
WP11L_UP, and WP12L_UP calculated using RRFfound or RRFcalc.
.................................................................................................... 187
Table 8.9. Concentration (g/L) of WP3L_BOT, WP4L_BOT, WP5L_BOT, WP8L_
BOT, WP11L_BOT, and WP12L_BOT calculated using RRFfound or
RRFcalc. ........................................................................................ 188
Table 8.10. Standards detected in HPLC/MS analysis together with their retention
time and fragmentation. ithin brac ............................................... 192
Table 8.11. Stadands identified into selected liquids (WP4L_UP, WP4L_BOT,
List of table XVII
WP8L_UP, WP8L_BOT). When identified the MS peak was of very
weak intensity (below 1% of relative intensity). P: present; n.d.: not
detected. ...................................................................................... 194
Table 8.12. Normalized areas of upper phase of liquids. ............................... 196
Table 8.13. IR absorptions of upper phase of liquids from MAP of WPa. ....... 199
Table 8.14. IR absorption of selected samples, second fraction of the gas
streama. ....................................................................................... 202
Table 9.1. MAP of PLA, operating parameters. ............................................ 209
Table 9.2. Theoretical yield calculation for entry PLA1, together with the
experimental values. .................................................................... 211
Table 9.3. Lactide recovered from each pyrolysis experiment. ..................... 212
Table 9.4. Physical characteristics of liquid obtained by MAP of PLA. ......... 212
Table 9.5. Compounds in liquids from MAP of PLA...................................... 213
Table 9.1. MAP of corn-derived plastics, operating parameters. .................. 219
Table 9.2. Liquid from MAP of CDP. ............................................................. 221
Table 9.3. GC/MS of liquid from MAP of CDP, upper fraction. ...................... 222
Table 9.4. GC/MS of liquid from MAP of CDP, medium fraction. .................. 225
Table 9.5. FTIR of liquid from MAP of CDP, upper fractiona. ....................... 229
Table 9.6. FTIR of liquid from MAP of CDP, middle fractiona. ...................... 230
Table 9.7. FTIR of liquid from MAP of CDP, bottom fractiona. ...................... 230
Table I.I. Characteristics of tire used in this work. ...................................... ii

List of Equations
2.1. Loss tangent. ............................................................................... 43
2.2. Power of heating per unit volume. ............................................... 43
2.3. Effective high-frequency conductivity. .......................................... 43
2.4. Loss factor ................................................................................... 43
2.5. Penetration depth. ....................................................................... 43
2.6. Reflected power. ......................................................................... 43
2.7. Absorbed fraction of the incident MW power. .............................. 45
5.1. Temeperature relation between infrared thermometer measurment
and extrapolated values. .............................................................. 107
8.1. Calibration curve. ......................................................................... 180
8.2. Relative response factor. ............................................................. 180
8.3. Relative response factor. ............................................................. 180
8.4. Concetration from the relative response factor. ........................... 180
8.5. Relative response factor prediction. ............................................. 181
8.6. RRF, Eq. 8.5 applied to vanillin referred to guaiacol. ................... 181
II.I. Density. ........................................................................................ viii
II.II. Flow rate. ..................................................................................... viii
II.III. Flow rate, law of Poiselle. ............................................................ viii
II.IV. Flow rate. ..................................................................................... ix
II.V. Flow rate, for fluid 1. ..................................................................... ix
II.VI. Flow rate, for fluid 1. ..................................................................... ix
II.VII. Flow rate, comparison. ................................................................ ix
II.VIII. Instantaneous difference in pressure. .......................................... ix
II.IX. Flow rate. ..................................................................................... ix
II.X. Flow rate. ..................................................................................... ix
II.XI. Relative kinematic visosity. .......................................................... ix
II.XII. Relative kinematic visosity for fluid. ............................................ ix
II.XIII. Relative kinematic visosity for fluid 2. .......................................... ix
II.XIV. Lower heating value or lower calorific value. ............................... x
II.XV. Proximate analysis, fixed Carbon. ................................................ xiii


Acknowledgements
I would like to thank Cooperativa Autotrasportatori Fiorentini – CAF Scral and
Fondazione Ente Cassa di Risparmio di Pistoia e Pescia for financial support;.
I would particularly like to thank my PhD supervisor Piero Frediani and every
member of the research group of industrial chemistry at Department of Chemistry
– University of Florence, Luca Rosi, Marco Frediani, and my colleague for great
support and scientific contribution to this thesis.
I am very grateful to Franco Berruti, Cedric Briens, Mamdouh Abou-Zaid, and the
people at ICFAR (Institute for Chemicals and Fuels from Alternative Resources)
- Western University, London, Canada, for hosting me during a fruitful period of
scientific collaboration focused on development of an analytical method for bio-oil
characterization.
Many thanks also to Maurizio Passaponti of University of Florence for CHN
analysis and his glassware masterpieces.


Abstract
Microwave assisted pyrolysis (MAP) was exploited to convert several classes
of waste polymers into a solid, a liquid, and a gas with promising application
as energy, power, and chemical sources. The polymeric materials tested were:
tires, high density poly(ethylene) (HDPE), poly(propylene) (PP), poly(styrene)
(PS), multilayer packaging beverage (WMP), wood pellets (WP), poly(lactic acid)
(PLA), and corn-derived plastic bags (CDP).
Pyrolysis experiments were carried out in a batch laboratory scale reactor, using
a microwave (MW) oven operating at 2.45 GHz, an energy output up to 6KW, and
for some pyrolysis a fractionating system, directly connected to the pyrolysis oven.
The presence of a fractionating system minimized the influence of different MW
powers enhancing the residence time and usually improving the quality of the
liquid product.
MAP of tire might be run without the addition of a MW absorber. The liquid
obtained showed a reduced density (from 0.92 to 0.88 g/cm3), and viscosity (from
3.92 to 1.25 cP) when working with the fractionating system. Furthermore aromatic
and olefinic compounds were formed in high amount. Different tire affected the
MAP results: Tires containing a large amount of aromatics (styrene copolymers)
were pyrolyzed faster than tire containing large amount of natural rubber. X-ray
diffraction of solid from MAP of tire showed two different crystalline forms of ZnS,
spharelite or wurtzite present due to the different pyrolysis condition. The presence
of these compounds suggested that tires were heated to a temperature higher
than the usually accounted.
MAP of polyolefins, HDPE, PP, and PS was performed using different MW
absorbers (tire, carbon, or Fe) and MW power, obtaining a high quality liquid
fraction with tailoring properties. From HDPE a mixture of linear alkanes, the
corresponding 1-alkenes, and a very low amount of aromatics was obtained. On
the contrary liquids from MAP of PP contained a mixture of methyl branched
alkanes and alkenes, some aromatics and dienes. From MAP of PS a clear and
low viscosity liquids were always collected (yield 91.6 wt%) together with low
amount of gas (3.0 wt %) and solid (0.9 wt %). Using a MW power of 3 KW the

AbstractXXIV
styrene in the liquid was increased up to 65.98 %.
MAP of WMP might by run with or without a MW absorber, and five products
were always collected: char, gas, unscratched Al, and two liquid fractions. The
organic liquid phase contained large amount of hydrocarbons, useful as fuel or
the source of chemicals. The other liquid phase contained large amount of water
and oxygenated organic compounds, such as acetic acid, 2-hydroxypropan-2-one
and levoglucosan.
MAP of WP might be run without a MW absorber but the pyrolysis could not be
completed in a short time. WP were converted into a char which preserved their
former shape and a two phase liquid. These latter phases were characterized
using an innovative chromatographic methodology.
MAP of PLA was performed using different MW absorbers (tire, carbon, or Fe)
and MW power, obtaining a liquid rich in lactide (the cyclic dimer of lactic acid)
and other oxygenated hydrocarbons. The collected lactide was enantiopure and it
was collected, separate, and directly purified from the liquid. Up to 9 wt% of initial
PLA was recovered as L-lactide.
MAP CDP was performed using different MW absorbers (carbon or Fe) and
MW power, obtaining a liquid and large amount of gas accordingly to the pyrolysis
conditions. The liquid after centrifugation was separate in three phases, upper,
medium, and lower. Medium fractions were mainly composed of water (70 wt%),
acids, alcohols, and anydrosugars and their pyrolysis products. Upper and lower
fractions showed close properties and composition except that the lower fraction
was a wax. Indeed the lower fraction was composed of oligomers and the upper
phase was composed by the pyrolyzed products of these oligomers. It contained
large amount of aromatic acid and phthalates and their derivatives.

1. Introduction
Polymers are well-established constituent of almost any object from everyday life
to professional uses. In the 20th century their wide exploitation has been reached
due to key characteristics of plastic-made items such as great adaptability of
properties, low energy demand for production, and low final price. In late ‘80s due
to these features plastics overcame steel volumetric production for the first time
in history. 1
Nowadays our lifestyle will not be possible without polymers, or rather great
changes of it will be necessary. In this polymer related society plastic items
are produced from raw chemical feedstock, used for whatever application, and
disposed in various ways, as expected. Indeed living matter for a sound and
healthy society should be the preservation and valorization of its energy, matter,
and “environment” feedstock otherwise this actual lifestyle is hardly sustainable.
The ceaseless claim for raw materials and energy, together with large production
of wastes are the two faces of the same coin. Plastics require petroleum or
biomasses derived monomer together with energy for their synthesis. So it is
possible to say that plastics store up matter and energy used for their production.
At the end of their life plastic-made items are disposed and their matter and energy
contents could be lost if they are not properly valorized. So far a closed loop life-
cycle for a plastic item must be achieved (Figure 1.1)
Figure 1.1. Ideal closed loop cycle for plastic items.
Waste plastics should be the source of matter and/or energy, instead of merely
waste, for renewed products to minimize the use of fresh raw material.
Raw Monomer Polymers
Commercial
ProductsEnd-life
products

1 - Introduction2
Many efforts are bestowed on waste valorization through reuse and recycling
processes. In the next sections are addressed the features of the main polymers
actually produced together with the technologies available for their disposal. A
more detailed review is reported for pyrolysis processes because pyrolysis is a
promising technology and its study is the main subject of this work.
1.1. Main polymers
Polymers are macromolecules made of repeating structural units, from few
hundreds to thousands units per each molecule itself. Aside from this general
definition with “polymer” is outlined a wide-range of compounds. So far many
classifications are possible when speaking of polymers, anyway a first distinction
can be done between natural and synthetic polymers.
Natural polymers are parts of our everyday life from very ancient time; such
as: cellulose, natural rubber, wool, silk, amber, polysaccharides, and ribonucleic
acids; even if it is far from being complete.
Synthetic polymers also comprise an extremely broad number of different
macromolecules even if obtained from the same monomer; some of the main
classes are listed: poly(ethylene) (PE), poly(propylene) (PP), poly(vinylchloride)
(PVC), poly(styrene) (PS), poly(ethylene terephthalate) (PET), poly(urethane)
(PUR), poly(lactic acid) (PLA), and poly(carbonate) (PC).
Polymers in both classes are seldom used in item manufacturing as pure
macromolecules but more frequently with the addition of inorganic/organic
compounds or mixed/blended with other materials accordingly to desired final
properties and application. For instance any PVC contains always different amount
of phthalates as plasticizers. Tires are even more complex items because they are
realized using different polymers, inorganics, and metal wires. The list could be far
much longer than this.
All these polymers have large market share and in Table 1.1 are listed the
2011 European production. In 2011 the turnover increases for European polymer
market and it is worthy of note an increment of 0.3% even if the financial crisis
was spreading.2
Table 1.1. 2011 European productions of the main polymer classes.Polymer Production (×109 Kg) Production (%)
PE 13.6 29
PP 8.9 19
PVC 5.2 11
PS 3.5 7.5
PET 3.1 6.5
PUR 3.3 7
Others 9.4 20
TOTAL 47 100

1 - Introduction 3
In the following sections a brief description of some of the previously cited
polymers is reported. A detailed description of their synthesis and characterization
can be found in the literature reported in each section.
1.1.1. Poly(ethylene): Production and use
Ethylene polymers enclose a large number of PE plastics which could include
other alkenes monomer, as minor compounds, into their structure. These PEs
are synthetized through radical or catalytic polymerizations. According to the
polymerization reaction completely different PEs could be obtained. Branching
degree is used as a discriminating parameters for PEs classification.
High pressure polymerization processes led to spontaneous branch formation
which could be linear or branched alkyl groups. This PE is called low density
poly(ethylene), LDPE, its branches vary also within the same PE molecule from
methyl group to thousand carbon atoms.
Catalytic polymerization of ethylene produces PE polymers without branches
at all, it is widely known as high density poly(ethylene), HDPE. Catalyzed
polymerization can be used also to introduce branching intentionally, even with
total control on the branching distribution, by polymerizing ethylene together with
low amount of terminal alkenes. Among these the most produced PE is linear low
density poly(ethylene), LLDPE. In Figure 1.2 is reported a schematic structure of
these three cited PEs, the main features are maximized to enhance differences
among them.
Figure 1.2. Schematic structure of PE. a) LDPE; b) HDPE; c) LLDPE.
LDPE and LLDPE are white translucent solids and rather flexible; as films they
are transparent and the white color is slightly perceptible. However HDPE is a
more rigid, white opaque solid and it forms film with turbid appearance.
PE is not soluble in any solvent at room temperature, but above its melting point
it becomes soluble in aromatics and chlorinated hydrocarbons. It may also swell
in some solvent like xylenes. In Table 1.2 are listed some of the main properties
of PEs.
a) b) c)
1 - Introduction4
Table 1.2. Properties of LDPE, LLDPE, and HDPEProperty LDPE LLDPE HDPE
Density (Kg/m3) 924.3 922.0 961.0
Crystallinity (%) 40 40 67
Temperature of fusion (K) 383 395 404
Mw 200,000 158,100 136,300
Mn 44,200 35,800 18,400
Tensile rupture strength (MPa) 12.0 25.3 21.1
Elongation at ropture (%) 653 811 906
A brief list of the several polymerization technologies is reported below.
• Polymerizationinsupercriticalethylene: it iscarriedoutathighethylene
pressure (60 – 350 MPa) and at a temperature (473 – 623 K), above PE melting
point, the mixture of supercritical ethylene and molten PE work as polymerization
medium. This process can be done with radical initiators (oxygen or organic
peroxides), Ziegler catalysts, and metallocene catalysts; it allows to synthetize
copolymers with polar monomers.
• Polymerization in solution: aliphatic, aromatic and chlorinated solvent
together with Ziegler and/or metallocene-based catalysts are employed in this
process. A draw-back is the solvent removal at the end of polymerization.
• Slurrypolymerization:thisprocessshowshighversatilityandconvenience.
It is the first commercial polymerization process for HDPE and it is performed in
hydrocarbon slurry (usually light alkane).
• Gas phase polymerization: Ziegler or metallocene supported over a
polymeric matrix can be used as catalyst in this process. The supported catalyst
forms a bed inside gas-phase reactor and it is mechanically agitated or a fluidized-
bed technique is employed.
PE properties, such as density, crystallinity, and molecular weight, may
be adjusted following few means. Temperature controls density in free radical
polymerization of LDPE and molecular weight in radical polymerization and with
Philips catalyst. Molecular hydrogen can act as chain transfer agent and it may
be used to control the molecular weight in Ziegler catalysis. Post polymerization
reactions can modify PE physical properties such as stiffness, hardness, and
impact strength.3
HDPE, LDPE, and LLDPE are used in several applications and the main market
areas are briefly listed below. Worthy of note is the difference market of each
PE: film for LDPE and LLDPE (usually sold in the same market) and structural
application for HDPE.
• Film: LDPE is thepreferredpackagingmaterial due to its transparency,

1 - Introduction 5
toughness, and adaptability to contents shape. HDPE can be processed but the
final appearance is not usually accepted by final users. LDPE is produced by
film blowing process at 433- 453 K. Apart for packaging issues LDPE films are
used for impermeable or stabilizing membranes in civil engineering constructions.
Additives are used such as UV stabilizer in finished product.
• Extrusioncoating:LDPEisusedforcoatingpurposeofcardboard,paper
and aluminum for multi-layer packaging, and for low level impurities applications.4
• Blow-molding: HDPE is actually the preferred material for containers
because it merges stress crack resistance with higher rigidity than LDPE, so low
bottle weight is obtained. They are used for detergent, milk, but also fuel and
solvent storage and transportation.
• Injectionmolding:itisusedforalargevarietyofproductssuchascaps,
lids, housewares, toys, and industrial containers. LDPE and HDPE are both used.
LLDPE can be used only if they have narrow molecular mass distribution.
• Extrusion,pipe:theuseforpipesisoneofthefewengineeringapplications
where a continuous stress is applied. Indeed it is used for water and natural gas
distribution systems. They are manufactured with HDPE.
• Extrusion,wireandcable insulation:LDPE isusedas insulator forhigh
frequency and telephone cables due to its dielectric properties.
1.1.2. Poly(propylene): Production and use
Nowadays propene derived polymers are widely used due to monomer low
price and appealing finish product properties.5
PP is produced in three type accordingly to PP tacticity: isotactic (is the most
produced PP, tough semi-crystalline material used as engineering plastic),
syndiotactic (semi-crystalline, used as engineering material), and atactic
(amorphous material used as binder for plastic and inorganics in construction
industry); detailed description is reported in Figure 1.3.
Figure 1.3. Three classes of PP: a) isotactic; b) syndiotactic; c) atactic.
Two catalytic systems are actually used for isotactic PP synthesis: based on
n
n
n
a)
b)
c)

1 - Introduction6
TiCl4 supported (Ziegler-Natta), and metallocene catalyst. Syndiotactic PP is
produced only through metallocene catalysis.
PP can be obtained with various technologies; the main two are briefly described
below:
• Polymerization in slurry: two approaches are actually in use; the first
one uses propene as reaction medium. While the second uses a non-reactive
hydrocarbon as diluent.
• Polymerizationingas-phase:fluidizedbedgas-phasetechnologyemploys
either supported Ziegler-Natta or metallocene catalyst.
Isotactic PP is a rigid semi-crystalline plastic with a density of 0.903 g/cm3
and a melting point of 438 K. It is less stiff but shows higher tensile properties
than HDPE. Isotactic PP is used as competing material in other engineering
thermoplastics, such as acrylonitrile-butadiene-styrene rubber (ABS).
PP obtained with metallocene catalysis showed small fraction of chemical
defects.
Syndiotactic PP is a rigid semi-crystalline plastic with a density of 0.88 g/cm3.
It has a low melting point (403 K), crystallinity and tensile strength than isotactic
PP. However, syndiotactic PP has exceptional softness, high clarity and gloss,
together with good scratch resistance.
Atactic PP is an amorphous material with a glass transition temperature (Tg) of
293 K. It is always present in small quantities (1 – 5%) in PP produced with Ziegler–
Natta catalysts. Amorphous PP is separate by solvent extraction. It modifies their
properties improving their low temperature performance, processability and
optical properties, but decreases stiffness and long-term ageing properties.6
Isotactic PP is processed by injection molding into articles with complex profiles
such as internal trim in cars, household items, toys, and rigid packaging. It is also
used for melt spun fibers and nonwoven fibers production, for rugs and wall-to-wall
carpeting (melt spun fiber); hygiene products and single-use clothes (nonwoven
fiber).
Syndiotactic PP cover a small market volume, it is used for sheet, film, and
injection molding applications or in blending with other polymers.
Atactic PP is used for modified bitumen roofing, as an adhesive and a sealant,
where enhance bitumen flexibility and ultraviolet resistance are mandatory.
1.1.3. Poly(styrene): Production and use
PS is a thermoplastic polymer and due to its properties PS can be used in
an extremely wide range of applications. PS is commercialized as amorphous
transparent resin. At ambient temperature is a clear glass polymer due to phenyl
group presence which raises the Tg slightly over 373 K. Over that temperature
PS is a viscous liquid which can be easily processed by extrusion or injection-

1 - Introduction 7
molding techniques.7
PS is synthetized using continuous bulk polymerization plants, the polymerization
easily occurred because styrene, PS monomer, is extremely reactive and polymers
are obtained just by heating without the addition of initiators.
Performance enhancement of PS materials are obtained by the addition of
processing aids, antistatic agent, UV stabilizers, glass fibers, or by copolymerization
with other monomers such as acrylonitrile and/or butadiene. These materials are
not discussed in this brief review.
PS is employed in packaging applications (such as disposable tumblers,
television cabinets, meat and food trays, and egg cartons) and in building industry
as rigid foam insulator.
As already outlined styrene is extremely reactive, indeed it can work as electron
donor as well as electron acceptor. So it can be polymerized through radical,
cationic, or anionic mechanisms, or by coordination propagation steps. Anyway
industrial polymerization is carried out by self-started free radical mechanism. The
propagation mechanism for the chain growth proceeds by addition of monomer to
the radical chain end. Growing chain is mainly terminated by coupling reactions.
If a proper control of temperature is not achieved radical degradation of newly
formed PS may occur, a more detail discussion is reported in Section 1.3. A good
control of molecular weight may be achieved by controlling temperature obtaining
PS with average masses between 100,000 and 400,000.
Other polymerization processes such as, cationic, anionic, and catalytic, may
produce PS with interesting properties but few commercial applications are known.
Successful large scale use of PS is explained because a tailor made product
may be achieved at very low cost if compared with other competitive materials.
1.1.4. Poly(lactic acid): Production and use
Lactic acid is a yearly renewable feedstock which was polymerized for the
first time to a high molecular weight polymer in 1932 through ring opening
polymerization (ROP) of cyclic dimeric ester of lactic acid, the lactide.8 Anyway it
has found large scale applications only in recent years.
Both lactic acid stereoisomers can be polymerized with good stereoisomeric
control in poly(lactic acid) (PLA) allowing a control on the final polymer properties.
PLA is an aliphatic polyester, thermoplastic, with a Tg about 333 K, and a melting
point of 453 K for homopolymers. It is stable up to 473 K and it usually shows high
crystallinity, mechanical and chemical resistance, and permeability to aqueous
vapors.9
Amorphous PLA is soluble in common solvents such as tetrahydrofuran (THF),
chlorinated hydrocarbons, and benzene.10
PLA is obtained by polymerization of lactic acid following two main strategies.
1 - Introduction8
The direct condensation of lactic acid yields a low molecular weight polymer which
does not find any use in almost any application due to its glassy-brittle nature.
Anyway these short chains of PLA can be heated giving a reverse polymerization
to yield the lactide, and this cyclic ester can be used to synthetize high molar
weight (Mw) PLA (Mw about 100,000) in the presence of a catalyst such as
stannous octoate. In the second strategy lactic acid in the presence of a catalyst is
azeotropically dehydrated to a high-boiling aprotic solvent at reduced pressures,
obtaining PLA with Mw greater than 300,000.11 In Figure 1.4 are summarized
the main synthetic pathways. Other polymerization processes are available; their
detailed description can be found in literature.11,12
Figure 1.4. The three possible pathway for PLA synthesis.
PLA is used in several application, the main are listed below:
• Medical application: its use is limited to sutures and orthopedic (bone)
fixation.12
• Packaging:infood-contactapplications.13
• Coating:forinstanceofpaperduetoeasyformationoffilms.
• Fiber:theyalreadyfoundapplicationindressesasreplacementofother
polyesters14 and also for more specific applications.15
• Agricultural: for various application such as weed prevention nets,
vegetation nets, vegetation pots, ropes, and binding tape.11
1.1.5. Tire: Production and use
Tires are extremely complex items which comprise a blend of several polymeric,
organic, and inorganic materials to give the feature mandatory for traction of
vehicles. Composition of tire is tuned to fulfill some specific requirement for traction
accordingly to the large variety of tire classes which are available on the market.
The main property requirements are listed:16
• Loadcarryingcapacity
• Dampingofroadirregularities
• Adhesiontotheroad
• Transferoflongitudinalandlateralforces
HO
OH
O
H
HO
OH
O
H
HO
O
O
OH
O
O
On
HO
O
O
OH
O
O
On
O
OO
O
H
H
HO
O
O
OH
O
O
On
L-Lactic acid
D-Lactic acid
Direct condensation
Direct condensation
Azeotropic condensation
Lactide
Low Mw PLA
Low Mw PLA
High Mw PLA
Chain coupling
ROP

1 - Introduction 9
• Immediatesteeringresponse
• Dimensionalstability
• Structuralresistance
• Lowenergyconsumption
• Lownoisegeneration
A tire is essentially a cord–rubber composite and in Figure 1.5 is reported a
schematic view of tire section.
Figure 1.5. Schematic cut view of a tire.
Tires have plies of reinforcing cords extending transversely from bead to bead,
on top of which it is located a belt below the tread. The belt cords have low
extensibility and are made of steel and fabric depending on tire application.17
Aside from steel wires and fabric cords tires comprise a polymeric matrix,
inorganic fillers, and additives for manufacturing issue and for enhancing finish
product characteristics. The formulation of tire consists of four main components:
polymers, filler or other reinforcing agents, stabilizer, and vulcanization systems.
Other secondary components may be included, such as: resins, oil, and/or short
fiber. 17
There are five classes of polymers used in tire manufacturing: natural rubber,
synthetic polyisoprene rubber, styrene-butadiene and acrylonitrile-butadiene
copolymers, poly(butadiene), and butyl rubber (poly(isobutene) copolymerized
with small amounts of isoprene).
Carbon blacks, clays, and silica constitute the filler or reinforcement system.
Optimization of the amount of these materials in a formulation depends on the
Tread
Belts
Inner liner
Sidewall
Bead
Wire bead
Shoulder
1 - Introduction10
application for which the component is designed.
The stabilizer and antioxidant protects the compounds from aging and oxidation
to improve the long-term durability of the tire.
The vulcanization process and its design are mandatory because a not-vulcanized
rubber is not very elastic, it does not kept its shape after a large deformation,
and can be sticky. After vulcanization the polymeric matrix form a network
where sulfur is the crosslinking agent increasing retractile forces and reducing
the permanent deformation after removal of the deforming force.17 Vulcanization
process usually needs accelerators (such as: tetramethylthiuramdisulphide and
mercaptobenzothiazole) and activators (such as zinc oxide and stearic acid) to
improve the final network characteristics.
In Table 1.3 are reported the main components of a car and a truck tire.18
Table 1.3. Main components of a representative car and truck tire.Car Truck
Tire composition New (%) Used (%) New (%) Used (%)Polymers 48 47 45 43
Carbon black 22 21.5 22 21
Steel 15 16.5 25 27
Fabric 5 5.5 - -
ZnO 1.2 1 2.2 2
Sulfur 1 1 1 1
Other 8 7.5 6 6
1.1.6. Multi-layer packaging: Production and use
In the last decades the pressing demand for more specific packaging application
has been focused on multi materials. They can merge their feature to achieve
surprisingly useful final characteristics. Among the vast series of composites
multi-layer items are exploited for beverage packaging due to their gas barrier
and potentially aseptic properties.4,19
In Figure 1.6 are reported two magnified schematic views of multi-layer packages
(MLP) sheets.
They are differentiated by the presence of an aluminum foil used as long-term
barrier against gas permeation. Indeed for short-life packaging this foil is not
present.
The paper layer is considerably thick, and it represents almost the whole sheet
thickness. It is obtained by overlapping perpendicular thick layer of Kraft paper.
The paper contains little amounts of hemicellulose and its color is pale-brown.
The finish print design and images are in situ directly directly polymerized by UV
assisted polymerization in the presence of radical initiators. In Table 1.4 are listed
the main constituent of a referring paint for this application.19

1 - Introduction 11
Figure 1.6. Schematic views of MLP: a) with aluminum foil; b) without aluminum foil.
Table 1.4. Composition of a referring paint.19
Component Amount (%)Bisphenol A epoxyacrilate 44.0
Neopentyl glycol propoxylate diacrylate 30.9
Dimethylpropan tetraacrilate 3.2
Benzophenone 6.0
Acrilated amine 9.9
Bentonite 0.4
ZnO 3.6
The PE employed is LDPE for its transparency and ability to form films, as
reported in Section 1.1.1 and insolubility into the liquid inside the container.
1.1.7. Automotive shredder residue: Production and use
End-of-life vehicles (ELV) were recycled since 1958 recovering useful materials
such as metals and re-sales used parts.20 However ELVs comprise four classes
of materials: ferrous and non-ferrous metals, polymers, and other materials. Their
distribution among ELVs varies according to vehicle designs but the non-metal
fraction may represent up to 20 wt% of ELVs. This fraction is ground and scraps
with dimension of few centimeters are collected. They are called automotive
shredder residue (ASR) and also known as car-fluff.20 Usually ASRs are made of
polymers (rubber, PEs, and PUR foams), textiles, metals, cable, dirt, wood, and
so call fines (the smallest particles). ASR are heavily contaminated by chlorine,
chromium, and lead compounds.21,22
a) b)
PE
Paper
Al

1 - Introduction12
1.1.8. Biomasses, wood: Production and use
Wood is the most available natural and renewable resource, furthermore its
composition and appealing properties makes wood an economic valuable
product. Wood is exploited as raw material for pulp, structural timber, sawn wood,
panels, furniture and other purposes but its use for energy production is limited
in industrialized countries. The total phytomass of the earth is estimated to be
1.24×10¹² t, among which 80% is attributed to wood.23
Wood is defined as the inner tissue of stems, branches, and roots of perennial
plants. It is a transport system for water and its solutes, a storage tissue for reserve
material, and provides the plant with mechanical stability.
The main components of wood are assembled into wood cell walls; they are
cellulose, hemicellulose, and lignin. The amount of cellulose in European wood
is 41 – 43 %, while lignin and hemicellulose contents are strongly dependent of
wood species and growth conditions (22 – 27 % and 25 – 35% respectively).
Lignin is a cross-linked macromolecule made up of phenylpropane units, which
are linked together by at least ten different C−C and C−O bonds (Figure 1.7). The
irregular structure of lignin arises from its biosynthesis, in which the last step is a
non-enzymatic, random recombination of phenoxy radicals.
Figure 1.7. Lignin general structure
Cellulose is the most important wood component having linear long chains
of β-(1,4)-glycosidically bonded D-glucose units, in the form of pyranose rings
(Figure 1.8). The Mw of native cellulose is between 1,800,000 and 2,500,000. In
OH
O
OO
OH
HO
O
HO O
O
HO OH
O
HO OH
O
O
OHO
O
O
HO
OH
OHO HO O
O
O
HO
O
OH
O
HO
O
OO
HO
OH
HO
O
O
O
OH
HO
O
OH
OHO

1 - Introduction 13
industrial pulp however, cellulose is degraded to Mw values of 180,000 – 540,000.
Figure 1.8. Cellulose repeting unit.
Hemicelluloses are polysaccharides that differ from cellulose due to the presence
of several branched sugar moieties, which have lower molecular masses than
cellulose. The two main types of hemicelluloses are xylans and glucomannans
(Figure 1.9). Structural differences also exist between hemicelluloses form different
wood species.
Figure 1.9. Hemicellulose general structure.
1.1.9. MaterBi: Production and use
Europe introduced measures on management of packaging waste through
the directive 85/339/EEC in 1985. Anyway it was too vague to find any effect on
national policies. Only in 2005 the revision through Directive 94/62/EC and the
introduction of EN 13432:2000 clarified the characteristics of bio-material. From
2011 these directives were adopted in Italy and as acknowledgment the PE based
shopping bags were forbidden and must be replaced by bio-degradable bags.
Actually a bio-plastic material (MaterBi®) from vegetable is largely used, especially
from corn starch to gether with other bio-polymers such as PLA. Its production
require starch destructurization, complexation, and addition of compatibilizers, in
the presence of specific synthetic and/or natural polymers, plasticizer, and other
additives.24,25 This great variability of processing brings different type of so called
grades of bio-polymers with a wide range of properties which allows their use in
various field.26
O
OH
OH
OH
OH
OO
HO OH
OH
OH
O
n
O
OO
O
n
OH
HO
OH
OH
OHHO

1 - Introduction14
1.2. Waste management
The concept of waste is defined in several ways and an unambiguous definition
is not easy to propose because a waste for someone could be still useful for
others. Two definition of waste are reported. “materials that are not prime products (that is, products produced for
the market) for which the generator has no further use in terms of his/
her own purposes of production, transformation or consumption, and
of which he/she wants to dispose. Wastes may be generated during
the extraction of raw materials, the processing of raw materials into
intermediate and final products, the consumption of final products,
and other human activities. Residuals recycled or reused at the place
of generation are excluded. See also biological waste, solid waste,
industrial wastes and household waste.”27
“waste shall mean any substance or object in the categories set out
in […] which the holder discards or intends or is required to discard.”28
Wastes comprise a wide assortment of materials, items, and stuffs in solid,
liquid, and gaseous phases. Even so the discussion is focused on solid waste
management and routes for waste valorization.
Indeed since the 1970s the practice of waste management, which initially was
targeted to their collection and disposal, started to gain interest regarding recycling
and reuse of wastes collected.
Initially the policy proposed was focused on reducing waste generation by
putting emphasis of three R rule: reduction, reuse, and recycle. Anyway wastes
were produced and incinerated or landfilled if no other options were available.
Today these policies are consolidated and they try to evolve in a more efficient
system to achieve the final goal of zero waste; the key elements foreseen for this
objective are listed as follow:29
• investmentincommunityforwastereductionandresourcerecovery;
• participationofcitizensinrecycling;
• productredesigntomakewastenon-toxicandreusable;
• extensionofproducer’sresponsibilitybeyondinitialsalethatwillenhance
buy-back programs;
• endofsubsidiestoenterprisesthatusesvirginresourcesonly.
Nowadays the waste management is considerably enhanced but the way to
obtain zero waste is still long.
Waste is primarily generated from three different sources: households, commercial
establishments, and health care or research institutions. The composition of these

1 - Introduction 15
wastes may vary considerably among different neighborhood and period of the
year. In Table 1.5 is reported a typical garbage composition in the United States.29
Table 1.5. Typical garbage composition in the United States.Component Range (wt%)Food waste 4.4-15.3
Garden waste 12.5-24.2
Glass 6.5-10.9
Iron and aluminium 4.0-9.0
Moisture 27.1-35.0
Other combustible 1.6-12.1
Other noncombustible 1.8-11.1
Paper 41.6-53.5
Plastic 0.76-5.7
As outlined before when a waste is generated few options are available recycling,
incineration, composting, and landfilling.
When choosing the way to dispose an item must be kept in mind that this item
is produced using energy and raw material and they are partially stored in it. If
it is disposed in landfills its energy and material content are completely lost. So
far landfilling should be avaoided because nothing is recovered form a waste
displaced into the ground.
Recycling can be defined as the process by which waste materials are
separated from unrecoverable wastes and/or remanufactured into usable or
marketable materials.30 However recycling is not always worthwhile depending
if the emissions, energy consumption, and environmental pollution caused by
collection and reprocessing are lower than those required to manufacture new
products from raw materials.
Recycling of polymeric materials can be a challene and a worthwhile recycling
because it allows both reducing the amount of waste by recirculation of recovered
materials and opening new market areas. In Figure 1.10 is reported a schematic
diagram for plastic waste recycling.
Figure 1.10. A general scheme for plastics recycling.
Monomers
Virgin polymer
Productionr
Regrinding
Cleaning
Consumer
Discarded article
Collection
Sorting
Landfill
Inceneration
Process scarp
Depol
ymer
izat
ion

1 - Introduction16
Anyway plastic recycling shows the same problems arouse for the other wastes
and a complete recycling is far from to be reached. Mixed, polluted, finely divided,
or strongly bonded materials are hardly recycled and strong efforts are spent to
upgrade the actual technologies for achieve their worthwhile recycling.
Currently plastic recycling are achieved with optimal results if it is possible to
sort and clean a single plastic component from waste stream.31 Only thermoplastic
polymers can be reprocessed by using them directly or more often mixed with
virgin polymer of the same type. This is the best way to safeguard the energy and
hydrocarbons required for their synthesis. This is called Primary Recycling. From a
long time it is carried out in industries which produce and process plastics mainly
for economic reasons. Indeed recovered materials have a price up to 70% of
the new one. 31 Anyway some technical problem may be encountered in primary
recycling. 31
• Degradationofthematerialduetorepeatedprocessingfollowedbyadrop
of its properties.
• Contamination(suchasagreymaterialfromplasticsofdifferentcolors).
• Handlingoflowdensityitemsuchasfoams.
Recycling of mixed and composite wastes, where polymers are not separable, is
more difficult than single thermoplastic polymers. Indeed mixed plastic can enter
into the material recycling system if large quantities are available with a constant
composition. Anyway the reprocessing of mixed plastics by molding shows some
limitations. Only thermoplastic are able to melt and their miscibility among different
type of plastics is poor and frequently they are completely immiscible.31
Nevertheless these procedures can be applied for a limited number of times and
they are not applicable to some plastic waste (such as: contaminated, degraded
from previous recycling, composite materials, filled plastic, thermosetting plastics,
and elastomers).32 Anyway recycling of these materials is still possible but it can
be achieved by breaking down polymer structures to smaller compounds. Several
technologies are able to break a polymer chain and they can be applied to recover
the starting monomer or hydrocarbons in agreement with polymer characteristics
and technology employed: hydrolysis, alcoholysis, aminolysis, hydrogenation, or
pyrolysis are available. These processes were thoroughly investigated and some
of them are patented.33-35
Hydrolysis may allow recovering the starting compounds used for polymer
synthesis. Water molecules may hydrolyze the linkage points in polymers back-
bone. Hydrolysable plastics are polyamides, polyesters, polycarbonates, poly(urea)
s, and polyurethanes. Strong reaction conditions are required in order to obtain an
efficient hydrolysis.36
Alcoholysis works like hydrolysis but the cleavage of back-bone chains is done by
an alcohol. In this way the alcohol derivatives of the starting monomer is obtained.

1 - Introduction 17
Alcoholysis can be performed also with diols and the products may contain
terminal hydroxyl groups.37 Polymers such as polyolefins are not hydrolysable,
they are stable in hydrolysis conditions.
Hydrogenation process breaks the carbon bonds in polyolefin through
hydrogenolysis. As expected alkanes are the main products. Furthermore almost
any polymer can be decomposed and any sorting operation can be avoided.
Hydrogenation proceeds slowly so strong reaction conditions (773 K and 400
bar) and a catalyst are required to improve the efficiency but the life of the catalyst
is short.31
Pyrolysis is thoroughly described in Section 1.3.
Incineration is also a possible recycling path if any other reuse for plastic waste
is not possible. In this way the chemical content used to produce and manufacture
the plastic is lost. Anyway the energy content of plastic, regarded as calorific value,
is high as a fuel and higher than coal.31,38 So far plastic waste can be employed as
feedstock for power station to produce electricity. However incineration may leak
some pollutants into the environment.
Landfilling is the worst possible outcome for a plastic waste. Its energy and
chemical content are completely lost, their low density and long degradation time
cause a rapid and long term filling of dumping sites. Anyway dumping sites can be
seen as a future source of materials by mining them.39
A detailed description of waste management and disposal can be found in
literature.29-31,38

1 - Introduction18
1.3. Pyrolysis
Pyrolysis is a high temperature treatment (starting from 600 K, for biomasses,
700 K, for plastics) which breaks polymeric macromolecules giving compounds
having a lower molecular weight. It is usually performed in an inert, not oxidizing,
environment and three classes of products are obtained: a gas (volatile), a liquid/
wax (condensable), and a char (inorganic compounds such as fillers stable to
pyrolysis conditions).40
Thermoplastics, thermosetting polymers, elastomers, composite materials, and
heavily soiled or aged plastics can be recycled through pyrolysis. Furthermore
mixed waste stream, which are not easy separated, can be pyrolyzed. Products
obtained may show less economic value than those from hydrogenation nut the
process is less expensive.31
Nevertheless a pyrolysis process shows sound advantages compared to other
chemical recycling technologies. Pyrolysis does not require any source of hydrogen
or a catalyst (even if it can be used) such as for hydrogenation; the energy and
chemical content present in the waste is preserved together with a reduction of
gas production up to 20 fold and toxic oxidized species (dioxins and NOx) are not
formed if compared to incineration. The pollutants, if they do not pyrolyze, are
concentrated into the char.31
Pyrolysis is an endothermic process which requires large amount of energy to
break down polymers bond and an efficient heat transfer system to overcome the
poor thermal conductivity of polymers. It is driven by free radical reactions like
thermal cracking processes.41
Several technologies were developed to convert efficiently any sort of polymers
structure into useful products; it is achieved by different heating technology,
apparatus design, and sometimes using catalysts.
The heat transfer from the source to the polymer covers a mandatory issue
in a pyrolysis system due to poor thermal conductivity of polymer. The heating
source may be internal or external to the pyrolysis reactor. An internal source
can be realized when the polymers are partially oxidated to fulfill the energy
requirement.42 The external sources may be realized if the reactor is heated by an
electric oven or by any other equipment where an external combustion is run and
the heat is transferred to the polymeric material by a heating transport system. The
efficient transfer of heat is improved by adjusting the apparatus design such as
fixed,43 fluidized,44 or conical spouted bed,45 autoclave,46 and rotary kiln47 reactors.
Other technologies transfer heat to polymers in different way such as plasma48
or microwave radiation (MW). MW nature and application in pyrolysis field are
discussed in next Sections. In Figure 1.11 is reported a schematic pyrolysis system.

1 - Introduction 19
Figure 1.11. A schematic pyrolysis unit.
The pyrolysis process is characterized by several parameters which play decisive
roles on products properties such as: feed size,49 temperature, and residence
time in the reactor.50
Feed size determines how the polymer is heated, due to its poor thermal
conductivity. If large pieces are pyrolyzed a gradient of temperature between the
outside and the inside parts of the samples is always observed. Smaller seizes
are faster and more uniformly heated. Anyway small pieces of plastic require a
pretreatment and an accurate milling/chopping process.
Temperature can be kept constant or varied during the experiment. Together
with the residence time of vapors inside the reactor it is a roughly indication of
how energy is transferred to the polymer.
In the next paragraphs a brief literature review of pyrolysis in classical heating
experiments is reported.
1.3.1. Polyolefins
PE and PP are the most produced polyolefins thus they are largely investigated
in pyrolysis experiment. The main product collected from polyolefin pyrolysis is a
high or low viscous liquid depending on the reaction conditions.
Polyolefin pyrolysis is driven by a series of radical homolytic bonds cleavage
and the main products in PE pyrolysis are linear alkanes, their corresponding
1-alkenes (from C1 to C54), cyclic, and aromatic compounds.51 Usually in classical
pyrolysis, when the heat transfer is not optimal, the main product form PE is a wax
or a high viscous liquid, semi-solid at room temperature.
Meanwhile PP pyrolysis gives branched alkanes, and alkenes together with
aromatic compounds.52 Furthermore PP may be used as starting material
for production of carbon nanotubes, using a catalyst and specific pyrolysis
conditions.53,54
Reactor
Solid product
Liquidproduct
Gasproduct
Heatexchange
Refining of liquidEnergy production
Energyproduction

1 - Introduction20
The cleavage of C-C bonds requires a higher activation energy for PE than
PP,45 respectively 225 kJ mol-1 and 176 kJ mol-1. The lower energy requirement,
for PP, is connected with the presence of tertiary carbon atoms in the main chain
which are easily broken giving tertiary radical intermediates more stable than
secondary one formed by PE.
In a fluidized bed reactor (characterized by a very efficient heat transfer) PE,
and PP are pyrolyzed giving waxes, low viscosity liquid,51, 55 and even BTX,56 while
in a conical spouted bed reactor (heat transfer is less efficient) a wax is the sole
product.45 In Figure 1.12 and Figure 1.13 are reported the main reactions involved
in polyolefin pyrolysis.
Figure 1.12. Pyrolysis of PE, main reactions and products. a) C-C bond cleavage with alkane and 1-alkene formation; b) chain end radical formation followed by a ring formation and a dehydrogenation reaction; c) dialkene formation; d) Diels-Alder followed by a dehydrogenation reaction.
Figure 1.13. Pyrolysis of PP, main reactions and products; It is highlighted the formation of 1- or 2- alkenes.
High grade products, especially connected with the liquid fraction, may be
obtained using a catalytic system such as: zeolites,57-60 basic salts,61 and Zigler-
Natta catalyst,44, 62 but the catalyst must be very frequently regenerated.
+
+
R1
R2 R2
R R
R
RR
+ + 2H 2
H H
R2n
R1R1
nn
R1
n
R1
n
R1
n
+ 3H 2 +
R2
R2 +
+
a)
b)
c)
d)
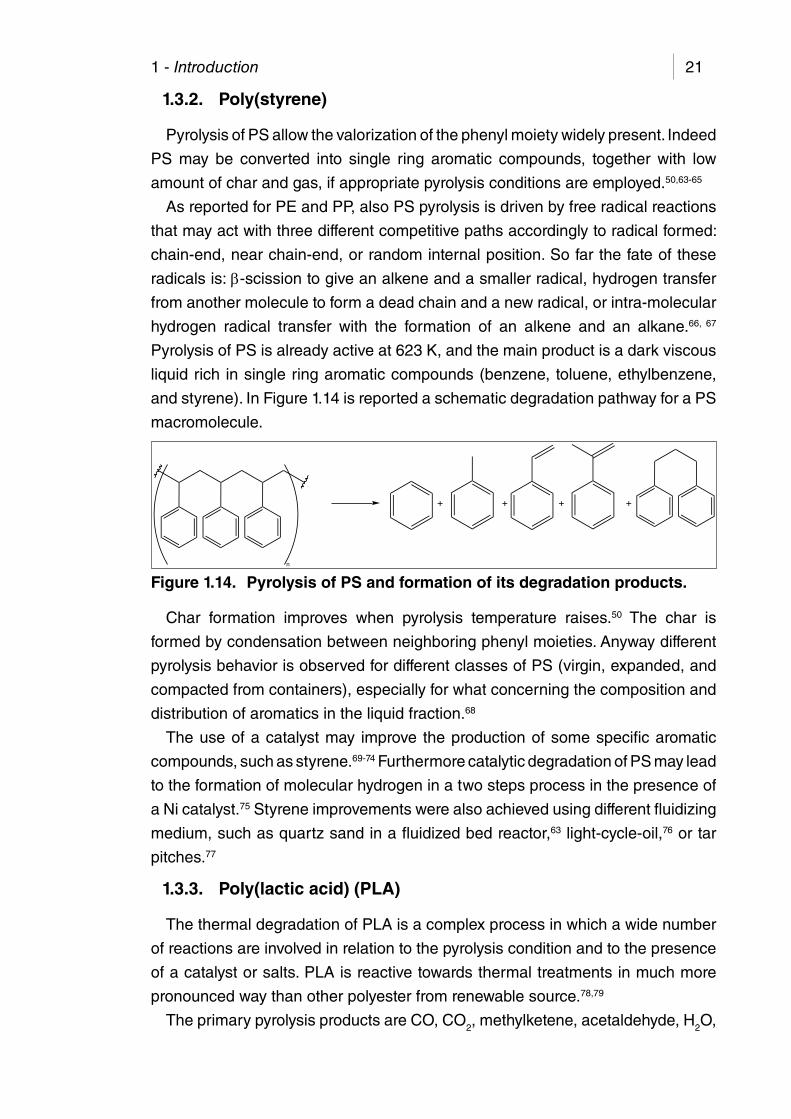
1 - Introduction 21
1.3.2. Poly(styrene)
Pyrolysis of PS allow the valorization of the phenyl moiety widely present. Indeed
PS may be converted into single ring aromatic compounds, together with low
amount of char and gas, if appropriate pyrolysis conditions are employed.50,63-65
As reported for PE and PP, also PS pyrolysis is driven by free radical reactions
that may act with three different competitive paths accordingly to radical formed:
chain-end, near chain-end, or random internal position. So far the fate of these
radicals is: β-scission to give an alkene and a smaller radical, hydrogen transfer
from another molecule to form a dead chain and a new radical, or intra-molecular
hydrogen radical transfer with the formation of an alkene and an alkane.66, 67
Pyrolysis of PS is already active at 623 K, and the main product is a dark viscous
liquid rich in single ring aromatic compounds (benzene, toluene, ethylbenzene,
and styrene). In Figure 1.14 is reported a schematic degradation pathway for a PS
macromolecule.
Figure 1.14. Pyrolysis of PS and formation of its degradation products.
Char formation improves when pyrolysis temperature raises.50 The char is
formed by condensation between neighboring phenyl moieties. Anyway different
pyrolysis behavior is observed for different classes of PS (virgin, expanded, and
compacted from containers), especially for what concerning the composition and
distribution of aromatics in the liquid fraction.68
The use of a catalyst may improve the production of some specific aromatic
compounds, such as styrene.69-74 Furthermore catalytic degradation of PS may lead
to the formation of molecular hydrogen in a two steps process in the presence of
a Ni catalyst.75 Styrene improvements were also achieved using different fluidizing
medium, such as quartz sand in a fluidized bed reactor,63 light-cycle-oil,76 or tar
pitches.77
1.3.3. Poly(lactic acid) (PLA)
The thermal degradation of PLA is a complex process in which a wide number
of reactions are involved in relation to the pyrolysis condition and to the presence
of a catalyst or salts. PLA is reactive towards thermal treatments in much more
pronounced way than other polyester from renewable source.78,79
The primary pyrolysis products are CO, CO2, methylketene, acetaldehyde, H2O,
n
+ + + +

1 - Introduction22
cyclic oligomers, and lactide.80 The main reaction routes for non-radical reactions
are backbiting inter-esterification reactions involving OH chain ends. There are two
main pyrolysis mechanisms for polyesters: cis-elimination and trans-esterification
(Figure 1.15). Over 570 K radical reactions may occur, they are assumed to start
with either an alkyl-oxygen or an acyl-oxygen homolysis (Figure 1.16). If residual
tin is present different route are available and larger amount of lactide is formed.81
Figure 1.15. Possible non-radical reactions involving PLA pyrolysis.
Figure 1.16. Possible pathways for radical reactions for pyrolysis of PLA.
The increasing presence of residue tin catalyst in PLA increases the unzipping
reaction rate to yield lactide and lowered the decomposition temperature.82
Furthermore if a purified PLA is pyrolyzed the formation of enantiopure lactide is
reduced and diastereoisomers and cyclic oligomers are formed.83
The pyrolysis of PLA is influenced by the different chain-end at the carboxyl
group, the presence of a metal ion (such as calcium or magnesium) end/or capped
types.84, 85 In this case the control over temperature seems to be mandatory to
control the stereochemistry of lactides obtained.86
In addition pyrolysis of PLA can be performed with comparable results using
virgin PLA or the reprocessed one.87
PLA can be pyrolyzed also in the presence of other polymers and metal oxides
with negligible effects on its pyrolysis behavior and low racemization of the lactide
O
O
O
R
O O
O
O
O
R
+
nO
O
O O
O
On
O
O
O
R
O O
O
On
O
OR
OO
R
H
O
O+ +
O
O
O
O
O
HH
H
RRO
O
OH
R
O
O
R
+
O
O
O
O
O
O
O
O
O
O
O
O
O
OO
OO
O
H
H
O+ CO2
+
C
O
HO
O
O
+
O
H
O
H
+
O
O
Cyclic oligomers

1 - Introduction 23
formed.88 However PLA interactions are reported in co-pyrolysis with different
materials such as biomasses. Biomasses pyrolysis formed water (an unwanted
degradation product in pyrolysis of biomasses) which could hydrolyze ester bonds
in PLA. Thus PLA is hydrolyzed to lactic acid and the water content in liquid from
biomasses is reduced.89
1.3.4. Wood
Pyrolysis of wood-derived materials is exploited mainly to obtain raw liquid fuels
which undergo to catalytic upgrading.90, 91
Kinetics and thermal decomposition mechanisms for the pyrolysis of plant
biomass and its constituents have been extensively studied. In contrast, few studies
have focused on the use of catalysts for biomass cracking (in situ upgrading) to
generate chemicals. The pyrolysis of wood produces a wide number of substances
and their amounts are markedly dependent on the process variables and whether
a hardwood or softwood is pyrolyzed.
Permanent gases contain CO2, CO, CH4 and low amounts of H2 and C2
hydrocarbons.92, 93 The composition of the liquid (Figure 1.17) is highly dependent
on the severity of the thermal treatment (temperature and residence time of
the vapors) and the presence of char. During the pyrolysis process when the
temperature is below 673 – 773 K primary vapors (oxygenates) are formed; at
higher temperature (up to 1123 K) hydrocarbon or secondary tars are formed;
above 1123 – 1273 K aromatic or tertiary tars are collected.94,95 The amount of
mixed oxygenated compounds increases with temperature: phenolic ethers, alkyl
phenols, heterocyclic, and ethers. Polyaromatic hydrocarbons (PAH) are also
formed.91 Liquid products contain also an appreciable amount of water from both
the moisture content of the feed and decomposition reactions.
Figure 1.17. Typical composition of a liquid from pyrolysis of wood.96
Pyrolysis of wood is extensively studied and several detailed review are now
available.91,96-98
High molecular lignin25%
Reactive Water10%
GC-detectable10%Moisture
10%
HPLC detectable15%
Quantified via GC30%
1 - Introduction24
1.3.5. MaterBi
To the best of our knowledge pyrolysis of starch-based plastics is not exploited.
The thermal behavior of these plastics is studied in blend with synthetic polymers.
The blend is buried in soil and the tests are performed by the means of TGA.99-104
Anyway some researches were performed on the pyrolysis of starch and starch
materials. The main products were similar to those obtained in the pyrolysis of
cellulosic materials such as anydrosugars and other oxygenated compounds.105-108
1.3.6. Tire
Pyrolysis of tire allows the formation of three worthwhile products: a gas (H2,
CO, CO2, H2S, and volatile hydrocarbons), a liquid (condensable hydrocarbons),
and a carbonaceous char (carbon and inorganic compounds such as fillers or
their derivatives stable to pyrolysis conditions). The non-condensable fraction
contains C1 – C4 hydrocarbons, hydrogen, and other inorganics (COx, nitrogen,
and H2S) and may show a high heating value among 30 – 40 MJ Nm-3 which
is connected with reaction conditions.46 The condensable fraction, the liquid,
contains a wide amount of hydrocarbons from the pyrolysis of the polymeric matrix
such as limonene, benzene, toluene, xylenes, and phenyl derivatives.109, 110 The
char contains carbon and inorganic fillers which are not pyrolyzed, they are widely
investigated for active carbon production111-118 or inks for printing issue.119
The amounts and characteristics of the three products are affected by several
experimental variables: apparatus design, type of heating, composition and size
of tire stock, temperature, residence time, and the eventual presence of a catalytic
system.
A wide selection of layout for pyrolysis is reported such as autoclave46, 109, 120-123,
fixed-bed reactor43, 124-129, moving-bed reactor130-133, and rotary kiln.47 As expected
the choice of a specific apparatus allow controlling the other parameters. For
instance moving-bed or fluidized bed show good heat transfer to the polymeric
matrix but require a small feed size and short residence time.
Until now only the conventional heating technologies show promising worthwhile
application to large scale plant and they are the only discussed in this section.
Pyrolysis starts over 770 K; below this temperature degradation products are
not formed.
The brand of tire may also play an important role because different brand
has different composition and the polymer used in their manufacturing could
be completely different. Thus different gas and liquid yield and composition are
expected due to different polymers degradation.
The main parameters of several reported pyrolysis experiment are listed in
Table 1.6.134

1 - Introduction 25
Table 1.6. Main parameters and yield for pyrolysis of tire. Tire size(mm)
Time(min)
T(K)
Yield of liquid (wt%)
Pressure(Pa)
Other Ref.
1.5-2.0 60
823 47.4-55.6
101,325 43923 45.4-56.0
1073 47.2-55.1
13-15198-246
723 43.081,000-91,000
Rotary klin reactor 47823 44.6
923 42.9
20-30 30
573 4.8
n.r. 109773 38.0
973 38.5
20-30 30
573 4.8
101,325 Fluidized bed pyrolysis 120773 38.8
973 38.5
2
n.r. 733
75.5
n.r. 125
6 66.5
10 60.5
16 60.0
20 64.0
25 x 30 60 773 56.1-60.1 n.r. 126
n.r. 143 773 65 101,325 Steam pyrolysis 131
13.9 437 773 57.5 12,000138<15.6 780 773-843 56.5 13,000
600 783-843 40.9 10,000
1.0-1.4 n.r.
723 42.0
101,325
Fluidized bed pyrolysis. CBV Y-Zeolite; catalyst to feed ratio 1:1. ZSM-5 zeolite; catalyst to feed
ratio 1:1.
140
773 41.5
873 40.0
723 49.0
773 45.0
873 40.0
n.r.: not reported.
The yield may be influenced by the way they are calculated (for instance if metal
wire are counted or not). Anyway yield of liquid never exceeds 55 wt%, and yield
of gas may reach 55 wt% in relation to the pyrolysis condition.
The mechanism for hydrocarbons formation is quite complex and many reactions
are involved, anyway some general reaction route are proposed; they are reported
in Figure 1.18 and Figure 1.19.

1 - Introduction26
Figure 1.18. Possible reaction routes for PAHs formation.
Figure 1.19. Possible reaction routes for aromatics formation.
Limonene is a typical polyisoprene degradation product; its formation may
follow the route reported in Figure 1.20.135-138
Figure 1.20. Possible reaction route for limonene formation and pyrolysis.
R
+ + 4H2
R R
a a
b
a
b
nn
CH
R11 R 22 R11
H2C
R22
+
+R11
CH2
R11
H2
CH4 +
CH4
H2

1 - Introduction 27
A catalytic system may be employed for upgrading the liquid. It may modify
yield and quality of the products. The main effects are enhancement of aromatics
formation139-142, pyrolysis efficiency143, 144, and hydrogen production.145
1.3.7. Multi-layer packaging (MLP)
Pyrolysis of MLP is investigated in both nitrogen146 and oxygen environment.147,
148 These materials contain paper, PE, and sometimes metals and other inorganics
in their structure such as aluminum foil (Section 1.1.7). Pyrolysis behavior of
MLP was mainly investigated by thermo gravimetric analysis (TGA)149 showing
negligible influence during pyrolysis between cellulose, PE degradation products,
and aluminum. Indeed the products formed were accounted for the separate
pyrolysis of cellulose and PE. In fact kinetics study indicates two clear different
stages during pyrolysis which correspond to the degradation of cellulose and
PE.147, 150-152
Details on PE pyrolysis can be found in Section 1.3.1.
During cellulose pyrolysis several successive reactions may take place.
Cellulose undergo in a first step to a back biting reaction of polysaccharide to
anydrosugars, among which the main component is levoglucosan (1,6-anhydro-
β-D-glucopyranose), and oxygenated compounds such as furans, aldehydes,
alcohols, and aromatics accordingly to reaction conditions.153-157 These latter
compounds may be formed also through levoglucosan and other anydrosugars
pyrolysis.156
At the same time more efforts are exploited in researching the pyrolysis behavior
of lignocellulosic materials in the presence of synthetic polymers. On the contrary
to the pyrolysis of MAP the findings reported show a significant interaction between
paper and PE ensuing an increase of char yield when slow heating and long
running process is employed.158 Sharypov et al. report in several studies strong
interactions between degradation products of synthetic and natural polymers in
an autoclave reactor at 670 K.159-161 Other interactions between synthetic polymers
such as PP and wood-derived materials are reported by Jakab et al. They observe
a shift of PP pyrolysis temperature to lower values.162 Rutkowski and Kubacki
investigated the co-pyrolysis of cellulose and PS. They obtained a liquid in high
yield and having a better quality than the product from pure biomass.163
These results evidence an interaction between pyrolysis product from wood-
derived materials and synthetic polymers if the radicals formed during polymers
degradation are present in large amount or stay in strict contact for longer time
with the pyrolysis products of biomasses. Indeed PP and PS has lower activation
energy and radicals are formed easily than PE, which need long reaction time to
show interaction with paper.158

1 - Introduction28
1.3.8. Automotive shredder residue (ASR)
ASR shows a composition extremely variable and their pyrolysis products show
extremely variable characteristics. Pyrolysis of ASR was investigated with TGA164
and laboratory scale systems.165, 166 A brief illustration of the main technologies
employed together with the products yield is reported in Table 1.7.21
Table 1.7. Technologies and relative yields used in pyrolysis of ASR. T
(K)Solid(%)
Liquid(%)
Gas(%)
Other Ref.
773 47.5 35 7.7
Conventional pyrolysis; tubular reactor
165
873 37.5 43 5.8
973 33 55 8.5
1073 25 53 12.2
773 55 25.7 5.8
Fast pyrolysis873 52.3 30 11.5
973 39 21.2 24.1
1073 37 21.8 34
673 69.4 7.1 23.5
Autoclave, light ASR
166
573 63.6 10.3 26.1
973 58.8 8.8 32.4
673 54.1 25.5 20.4
Autoclave, heavy ASR573 39.4 29.0 31.6
973 38.3 20.2 41.5
Liquid and solid from ASR pyrolysis contain carcinogenic compounds, chlorine
containing materials, and metal compounds which may jeopardize the further use
of these products.164
The gas fraction as expected contains hydrogen, methane, propane, acetylene,
and butane. They have high energy content and can be safely used as heat source
for the process.167
Improvements in products characteristics are obtained by a preliminary
mechanical sorting followed by a catalytic pyrolysis.168 Pretreatments seem to be
mandatory to collect products with more affordable characteristics.169
Pyrolysis of ASR can be performed also to produce hydrogen in the presence
of a catalytic system.170

Reference
1. Kaminsky, W.; Predel, M.; Sadiki, A., Feedstock recycling of polymers by pyrolysis in a fluidised bed. Polym. Degrad. Stabil. 2004, 85, 1045-1050.2. Plasticeurope Plastics – the Facts 2012 An analysis of European plastics production, demand and waste data for 2011. http://www.plasticseurope.org/Document/plastics-the-facts-2012.aspx?Page=DOCUMENT&FolID=2 (Accessed: 26.02.2013), 3. Whiteley, K. S., Polyethylene. In Ullmann's Encyclopedia of Industrial Chemistry, Wiley-VCH Verlag GmbH & Co. KGaA: 2000.4. Weikert, R. J. Method of making aseptic packaging. US 4,021,283, 1977.5. Heggs, T. G., Polypropylene. In Ullmann's Encyclopedia of Industrial Chemistry, Wiley-VCH Verlag GmbH & Co. KGaA: 2000.6. Benedikt, G. M.; Goodall, B. L., Metallocene Catalyzed Polymers. William Andrew Publishing: Norwich, NY, 1998; p 394.7. Maul, J.; Frushour, B. G.; Kontoff, J. R.; Eichenauer, H.; Ott, K.-H.; Schade, C., Polystyrene and Styrene Copolymers. In Ullmann's Encyclopedia of Industrial Chemistry, Wiley-VCH Verlag GmbH & Co. KGaA: 2000.8. Carothers, W. H.; Dorough, G. L.; Natta, F. J. v., Studies of polymerization and ring formation. x. the reversible polymerization of six-membered cyclic esters. J. Am. Chem. Soc. 1932, 54, 761-772.9. Spinu, M.; Jackson, C.; Keating, M. Y.; Gardner, K. H., Material Design in Poly(Lactic Acid) Systems: Block Copolymers, Star Homo- and Copolymers, and Stereocomplexes. J. Macromol. Sci. A 1996, 33, 1497-1530.10. Hartmann, M. H., High Molecular Weight Polylactic Acid Polymers. In Biopolymers from Renewable Resources, Kaplan, D., Ed. Springer Berlin Heidelberg: 1998; pp 367-411.11. Garlotta, D., A Literature Review of Poly(Lactic Acid). J. Polym. Environ. 2001, 9, (2), 63-84.12. Poly(Lactic Acid): Synthesis, Structures, Properties, Processing, and Applications. John Wiley & Sons, Inc.: Canada, 2010; p 522.13. Datta, R.; Tsai, S.-P.; Bonsignore, P.; Moon, S.-H.; Frank, J. R., Technological and economic potential of poly(lactic acid) and lactic acid derivatives. FEMS Microbiol. Rev. 1995, 16, 221-231.14. Vink, E. T. H.; Rábago, K. R.; Glassner, D. A.; Springs, B.; O'Connor, R. P.; Kolstad, J.; Gruber, P. R., The Sustainability of NatureWorks™ Polylactide Polymers and Ingeo™ Polylactide Fibers: an Update of the Future. Macromol. Biosci. 2004, 4, 551-564.15. Li, D.; Frey, M. W.; Baeumner, A. J., Electrospun polylactic acid nanofiber membranes as substrates for biosensor assemblies. J. Membr. Sci. 2006, 279, 354-363.16. Overhoff, D., Tires. In Ullmann's Encyclopedia of Industrial Chemistry, Wiley-VCH Verlag GmbH & Co. KGaA: 2000.17. Mark, J. E.; Erman, B.; Eirich, F. R., Science and Technology of Rubber. 3 ed.; Elsevier Academic Press: Burlington, 2005.18. Sharma, V. K.; Mincarini, M.; Fortuna, F.; Cognini, F.; Cornacchia, G., Disposal of waste tyres for energy recovery and safe environment—Review. Energ. Convers. Manage. 1998, 39, 511-528.19. Petrucci, G., Tecnologia di produzione e confezionamento dei contenitori di poliaccoppiato e problematiche connesse alla cessione di isopropiltioxantone agli
1 - Introduction30
alimenti. Il Bollettino degli Esperti Ambientali 2007, 1, 16-22.20. Vermeulen, I.; Van Caneghem, J.; Block, C.; Baeyens, J.; Vandecasteele, C., Automotive shredder residue (ASR): Reviewing its production from end-of-life vehicles (ELVs) and its recycling, energy or chemicals’ valorisation. J. Hazard. Mater. 2011, 190, 8-27.21. Harder, M. K.; Forton, O. T., A critical review of developments in the pyrolysis of automotive shredder residue. J. Anal. Appl. Pyrolysis 2007, 79, 387-394.22. Morselli, L.; Santini, A.; Passarini, F.; Vassura, I., Automotive shredder residue (ASR) characterization for a valuable management. Waste Manage. 2010, 30, 2228-2234.23. Nimz, H. H.; Schmitt, U.; Schwab, E.; Wittmann, O.; Wolf, F., Wood. In Ullmann's Encyclopedia of Industrial Chemistry, Wiley-VCH Verlag GmbH & Co. KGaA: 2000.24. Bastioli, C., Properties and applications of Mater-Bi starch-based materials. Polym. Degrad. Stabil. 1998, 59, 263-272.25. Haque, M. M.-U.; Alvarez, V.; Paci, M.; Pracella, M., Processing, compatibilization and properties of ternary composites of Mater-Bi with polyolefins and hemp fibres. Compos. Part. A: Appl. S. 2011, 42, 2060-2069.26. La Mantia, F. P.; Morreale, M., Green composites: A brief review. Compos. Part. A: Appl. S. 2011, 42, 579-588.27. Division, U. N. S. Environment Glossary. http://unstats.un.org/unsd/environmentgl/gesform.asp?getitem=1178 (Accessed: 22.04.2013), 28. 75/442/EEC, EuropeanUnion, 197529. Bagchi, A., Waste Management, Solid. In Kirk-Othmer Encyclopedia of Chemical Technology, John Wiley & Sons, Inc.: 2000.30. Boerner, C.; Chilton, K.; Updated by, S., Recycling. In Kirk-Othmer Encyclopedia of Chemical Technology, John Wiley & Sons, Inc.: 2000.31. Kaminsky, W., Plastic, Recycling. In Ullmann's Encyclopedia of Industrial Chemistry, Wiley-VCH, Ed. Wiley-VCH: Verlag GmbH & Co. KGaA, 2000; Vol. A 21.32. Fletcher, B. L.; Mackay, M. E., A model of plastics recycling: does recycling reduce the amount of waste? Resour. Conserv. Recy. 1996, 17, 141-151.33. Frediani, P.; Rosi, L.; Frediani, M.; Undri, A.; Occhialini, S.; Meini, S. Production Of Hydrocarbons From Pyrolysis of Tyres. WO2012110991, 2012.34. Frediani, P.; Rosi, L.; Frediani, M.; Undri, A.; Occhialini, S. Production of Hydrocarbons from Copyrolysis of Plastic and Tyre Material with Microwave Heating. WO2012110990, 2012.35. Dai, S. A.; Lin, C.-H.; Lin, H.-y.; Liao, W.-Z. Process for producing bis-alkoxylated diols of bisphenol a from spent polycarbonate discs(PC) or PC waste. US20070978561, 2008.36. Grause, G.; Buekens, A.; Sakata, Y.; Okuwaki, A.; Yoshioka, T., Feedstock recycling of waste polymeric material. J. Mater. Cycles Waste Manage. 2011, 13, 265-282.37. Kim, D.; Kim, B.-k.; Cho, Y.; Han, M.; Kim, B.-S., Kinetics of Polycarbonate Glycolysis in Ethylene Glycol. Ind. Eng. Chem. Res. 2008, 48, 685-691.38. Khait, K., Recycling, Plastics. In Encyclopedia of Polymer Science and Technology, John Wiley & Sons, Inc.: 2002.39. Bosmans, A.; Vanderreydt, I.; Geysen, D.; Helsen, L., The crucial role of Waste-to-Energy technologies in enhanced landfill mining: a technology review. J. Clean. Prod. 2012, 55, 10-23.40. Feedstock Recycling and Pyrolysis of Waste Plastics. John Wiley & Sons,
1 - Introduction 31
Ltd: 2006.41. Panda, A. K.; Singh, R. K.; Mishra, D. K., Thermolysis of waste plastics to liquid fuel A suitable method for plastic waste management and manufacture of value added products—A world prospective. Renew. Sust. Energ. Rev. 2010, 14, 233-248.42. Conesa, J. A.; Martin-Gullon, I.; Font, R.; Jauhiainen, J., Complete Study of the Pyrolysis and Gasification of Scrap Tires in a Pilot Plant Reactor. Environ. Sci. Technol. 2004, 38, 3189-3194.43. Ucar, S.; Karagoz, S.; Ozkan, A. R.; Yanik, J., Evaluation of two different scrap tires as hydrocarbon source by pyrolysis. Fuel 2005, 84, 1884–1892.44. Kaminsky, W.; Zorriqueta, I.-J. N., Catalytical and thermal pyrolysis of polyolefins. J. Anal. Appl. Pyrol. 2007, 79, 368-374.45. Aguado, R.; Olazar, M.; José, M. J. S.; Gaisàn, B.; Bilbao, J., Wax Formation in the Pyrolysis of Polyolefins in a Conical Spouted Bed Reactor. Energy Fuels 2002, 16, 1429-1437.46. Laresgoiti, M. F.; Marco, I. d.; Torres, A.; Caballero, B.; Cabrero, M. A.; Chomòn, M. J., Chromatographic analysis of the gases obtained in tyre pyrolysis. J. Anal. Appl. Pyrol. 2000, 55, 43-54.47. Li, S.-Q.; Yao, Q.; Chi, Y.; Yan, J.-H.; Cen, K.-F., Pilot-Scale Pyrolysis of Scrap Tires in a Continuous Rotary Kiln Reactor. Ind. Eng. Chem. Res. 2004, 43, 5133-5145.48. Tang, L.; Huang, H., Thermal plasma pyrolysis of used tires for carbon black recovery. J. Mater. Sci. 2005, 40, 3817-3819.49. Meng, X.; Xu, C.; Li, L.; Gao, J., Cracking Performance and Feed Characterization Study of Catalytic Pyrolysis for Light Olefin Production. Energy Fuels 2011, 25, 1357-1363.50. Onwudili, J. A.; Insura, N.; Williams, P. T., Composition of products from the pyrolysis of polyethylene and polystyrene in a closed batch reactor: Effects of temperature and residence time. J. Anal. Appl. Pyrol. 2009, 86, 293-303.51. Mastral, F. J.; Esperanza, E.; Garcìa, P.; Juste, M., Pyrolysis of high-density polyethylene in a fluidised bed reactor. Influence of the temperature and residence time. J. Anal. Appl. Pyrol. 2002, 63, 1-15.52. Wong, H.-W.; Kruse, T. M.; Woo, O. S.; Broadbelt, L. J., Tertiary resource recovery from waste polymers via pyrolysis: polypropylene. Prepr. Symp. - Am. Chem. Soc., Div. Fuel Chem. 2000, 45, 480-484.53. Mishra, N.; Das, G.; Ansaldo, A.; Genovese, A.; Malerba, M.; Povia, M.; Ricci, D.; Di Fabrizio, E.; Di Zitti, E.; Sharon, M.; Sharon, M., Pyrolysis of waste polypropylene for the synthesis of carbon nanotubes. J. Anal. Appl. Pyrol. 2012, 94, 91-98.54. Liu, J.; Jiang, Z.; Yu, H.; Tang, T., Catalytic pyrolysis of polypropylene to synthesize carbon nanotubes and hydrogen through a two-stage process. Polym. Degrad. Stabil. 2011, 96, 1711-1719.55. Kaminsky, W.; Schlesselmann, B.; Simon, C., Olefins from polyolefins and mixed plastics by pyrolysis. J. Anal. Appl. Pyrol. 1995, 32,19-27.56. Jung, S.-H.; Cho, M.-H.; Kang, B.-S.; Kim, J.-S., Pyrolysis of a fraction of waste polypropylene and polyethylene for the recovery of BTX aromatics using a fluidized bed reactor. Fuel Process. Technol. 2010, 91, 277-284.57. Zhao, W.; Hasegawa, S.; Fujita, J.; Yoshii, F.; Sasaki, T.; Makuuchi, K.; Sun, J.; Nishimoto, S.-i., Effects of zeolites on the pyrolysis polypropylene. Polym. Degrad. Stabil. 1996, 53, 129-135.

1 - Introduction32
58. Elordi, G.; Olazar, M.; Lopez, G.; Artetxe, M.; Bilbao, J., Continuous Polyolefin Cracking on an HZSM-5 Zeolite Catalyst in a Conical Spouted Bed Reactor. Ind. Eng. Chem. Res. 2011, 50, 6061-6070.59. Arandes, J. M.; Torre, I.; Castano, P.; Olazar, M.; Bilbao, J., Catalytic Cracking of Waxes Produced by the Fast Pyrolysis of Polyolefins. Energy Fuels 2007, 21, 561-569.60. Arandes, J. M.; Torre, I.; Azkoiti, M. J.; Castano, P.; Bilbao, J.; Lasa, H. d., Effect of catalyst properties on the cracking of polypropylene pyrolysis waxes under FCC conditions. Catal. Today 2008, 133-135, 413-419.61. Tekin, K.; Akal; n, M. K.; Kad; Ç; Karagöz, S., Catalytic degradation of waste polypropylene by pyrolysis. J. Energy Inst. 2012, 85, 150-155.62. Donaj, P. J.; Kaminsky, W.; Buzeto, F.; Yang, W., Pyrolysis of polyolefins for increasing the yield of monomers’ recovery. Waste Manage. 2012, 32, 840-846.63. Williams, P. T.; Williams, E. A., Interaction of Plastics in Mixed-Plastics Pyrolysis. Energy Fuels 1999, 13, 188-196.64. Park, B.-I.; Bozzelli, J.; Booty, M.; Bernhard, M. J.; Mesuere, K.; Pettigrew, C. A.; Shi, J.-C.; Simonich, S. L., Polymer Pyrolysis and Oxidation Studies in a Continuous Feed and Flow Reactor: Cellulose and Polystyrene. Environ. Sci. Technol. 1999, 33, 2584-2592.65. Kiran, N.; Ekinci, E.; Snape, C. E., Recyling of plastic wastes via pyrolysis. Resour. Conserv. Recy. 2000, 29, 273-283.66. Poutsma, M. L., Further considerations of the sources of the volatiles from pyrolysis of polystyrene. Polym. Degrad. Stabil. 2009, 94, 2055-2064.67. Snegirev, A. Y.; Talalov, V. A.; Stepanov, V. V.; Harris, J. N., Formal kinetics of polystyrene pyrolysis in non-oxidizing atmosphere. Thermochim. Acta 2012, 548, 17-26.68. Mo, Y.; Zhao, L.; Chen, C.-L.; Tan, G. Y. A.; Wang, J.-Y., Comparative pyrolysis upcycling of polystyrene waste: thermodynamics, kinetics, and product evolution profile. J. Therm. Anal. Calorim. 2013, 111, 781-788.69. Puente, G. d. l.; Sedran, U., Recycling polystyrene into fuels by means of FCC: performance of various acidic catalysts. Appl. Catal., B 1998, 19, 305-311.70. Marczewski, M.; Kaminska, E.; Marczewska, H.; Godek, M.; Rokicki, G.; Sokolowski, J., Catalytic decomposition of polystyrene. The role of acid and basic active centers. Appl. Catal., B 2013, 129, 236-246.71. Park, J. J.; Park, K.; Kim, J.-S.; Maken, S.; Song, H.; Shin, H.; Park, J.-W.; Choi, M.-J., Characterization of Styrene Recovery from the Pyrolysis of Waste Expandable Polystyrene. Energy Fuels 2003, 17, 1576-1582.72. Williams, P. T.; Bagri, R., Hydrocarbon gases and oils from the recycling of polystyrene waste by catalytic pyrolysis. Int. J. Energ. Res. 2004, 28, 31-44.73. Wu, C.; Williams, P. T., Pyrolysis-gasification of plastics, mixed plastics and real-world plastic waste with and without Ni-Mg-Al catalyst. Fuel 2010, 89, 3022-3032.74. Sun, H.; Rosenthal, C.; Schmidt, L. D., Oxidative Pyrolysis of Polystyrene into Styrene Monomers in an Autothermal Fixed-Bed Catalytic Reactor. ChemSusChem 2012, 5, 1883-1887.75. Acomb, J. C.; Nahil, M. A.; Williams, P. T., Thermal processing of plastics from waste electrical and electronic equipment for hydrogen production. J. Anal. Appl. Pyrol., In Press, http://dx.doi.org/10.1016/j.jaap.2012.09.014.76. Arandes, J. M.; Erena, J.; Azkoiti, M. J.; Olazar, M.; Bilbao, J., Thermal recycling of polystyrene and polystyrene-butadiene dissolved in a light cycle oil. J.

1 - Introduction 33
Anal. Appl. Pyrol. 2003, 70, 747-760.77. Andreikov, E. I.; Amosova, I. S.; Dikovinkina, Y. A.; Krasnikova, O. V.; Pervova, M. G., Pyrolysis of polystyrene in coal tar and ethylene tar pitches. Russ. J. Appl. Chem. 2012, 85, 89-97.78. Aoyagi, Y.; Yamashita, K.; Doi, Y., Thermal degradation of poly[(R)-3-hydroxybutyrate], poly[ε-caprolactone], and poly[(S)-lactide]. Polym. Degrad. Stabil. 2002, 76, 53-59.79. Sivalingam, G.; Madras, G., Thermal degradation of binary physical mixtures and copolymers of poly(ε-caprolactone), poly(D, L-lactide), poly(glycolide). Polym. Degrad. Stabil. 2004, 84, 393-398.80. Kopinke, F. D.; Mackenzie, K., Mechanistic aspects of the thermal degradation of poly(lactic acid) and poly(β-hydroxybutyric acid). J. Anal. Appl. Pyrol. 1997, 40–41, 43-53.81. Kopinke, F.-D.; Remmler, M.; Mackenzie, K.; Milder, M.; Wachsen, Thermal decomposition of biodegradable polyesters -II. Poly(lactic acid). Polym. Degrad. Stabil. 1996, 53, 329-342.82. Nishida, H.; Mori, T.; Hoshihara, S.; Fan, Y.; Shirai, Y.; Endo, T., Effect of tin on poly(l-lactic acid) pyrolysis. Polym. Degrad. Stabil. 2003, 81, 515-523.83. Mori, T.; Nishida, H.; Shirai, Y.; Endo, T., Effects of chain end structures on pyrolysis of poly(L-lactic acid) containing tin atoms. Polym. Degrad. Stabil. 2004, 84, 243-251.84. Fan, Y.; Nishida, H.; Hoshihara, S.; Shirai, Y.; Tokiwa, Y.; Endo, T., Pyrolysis kinetics of poly(l-lactide) with carboxyl and calcium salt end structures. Polym. Degrad. Stabil. 2003, 79, 547-562.85. Fan, Y.; Nishida, H.; Mori, T.; Shirai, Y.; Endo, T., Thermal degradation of poly(L-lactide): effect of alkali earth metal oxides for selective L,L-lactide formation. Polymer 2004, 45, 1197-1205.86. Fan, Y.; Nishida, H.; Shirai, Y.; Endo, T., Racemization on thermal degradation of poly(l-lactide) with calcium salt end structure. Polym. Degrad. Stabil. 2003, 80, 503-511.87. Badia, J. D.; Santonja-Blasco, L.; Martínez-Felipe, A.; Ribes-Greus, A., A methodology to assess the energetic valorization of bio-based polymers from the packaging industry: Pyrolysis of reprocessed polylactide. Bioresour. Technol. 2012, 111, 468-475.88. Omura, M.; Tsukegi, T.; Shirai, Y.; Nishida, H.; Endo, T., Thermal Degradation Behavior of Poly(Lactic Acid) in a Blend with Polyethylene. Ind. Eng. Chem. Res. 2006, 45, 2949-2953.89. Cornelissen, T.; Yperman, J.; Reggers, G.; Schreurs, S.; Carleer, R., Flash co-pyrolysis of biomass with polylactic acid. Part 1: Influence on bio-oil yield and heating value. Fuel 2008, 87, 1031-1041.90. Vitolo, S.; Seggiani, M.; Frediani, P.; Ambrosini, G.; Politi, L., Catalytic upgrading of pyrolytic oils to fuel over different zeolites. Fuel 1999, 78, 1147-1159.91. Di Blasi, C., Modeling chemical and physical processes of wood and biomass pyrolysis. Progr. Energ. Combust. 2008, 34, 47-90.92. Blasi, C. D.; Branca, C., Kinetics of Primary Product Formation from Wood Pyrolysis. Ind. Eng. Chem. Res. 2001, 40, 5547-5556.93. Di Blasi, C.; Branca, C.; Santoro, A.; Gonzalez Hernandez, E., Pyrolytic behavior and products of some wood varieties. Combust. Flame 2001, 124, 165-177.94. Morf, P.; Hasler, P.; Nussbaumer, T., Mechanisms and kinetics of

1 - Introduction34
homogeneous secondary reactions of tar from continuous pyrolysis of wood chips. Fuel 2002, 81, 843-853.95. Branca, C.; Giudicianni, P.; Di Blasi, C., GC/MS Characterization of Liquids Generated from Low-Temperature Pyrolysis of Wood. Ind. Eng. Chem. Res. 2003, 42, 3190-3202.96. Mohan, D.; Pittman, C. U.; Steele, P. H., Pyrolysis of Wood/Biomass for Bio-oil: A Critical Review. Energy Fuels 2006, 20, 848-889.97. Bridgwater, A. V., Renewable fuels and chemicals by thermal processing of biomass. Chem. Eng. J. 2003, 91, 87-102.98. Bridgwater, A. V.; Peacocke, G. V. C., Fast pyrolysis processes for biomass. Renew. Sust. Energ. Rev. 2000, 4, 1-73.99. Ramis, X.; Cadenato, A.; Salla, J. M.; Morancho, J. M.; Vallés, A.; Contat, L.; Ribes, A., Thermal degradation of polypropylene/starch-based materials with enhanced biodegradability. Polym. Degrad. Stabil. 2004, 86, 483-491.100. Cadenato, A.; Ramis, X.; Salla, J. M.; Morancho, J. M.; Contat-Rodrigo, L.; Vallés-Lluch, A.; Ribes-Greus, A., Calorimetric studies of PP/Mater-Bi blends aged in soil. J. Appl. Polym. Sci. 2006, 100, 3446-3453.101. Vallés-Lluch, A.; Contat-Rodrigo, L.; Ribes-Greus, A., Degradation studies of LDPE–Mater-Bi blends annealed and aged in soil. J. Appl. Polym. Sci. 2002, 86, 405-413.102. Alvarez, V. A.; Ruseckaite, R. A.; Vázquez, A., Degradation of sisal fibre/Mater Bi-Y biocomposites buried in soil. Polym. Degrad. Stabil. 2006, 91, 3156-3162.103. Moriana-Torró, R.; Contat-Rodrigo, L.; Santonja-Blasco, L.; Ribes-Greus, A., Thermal characterisation of photo-oxidized HDPE/Mater-Bi and LDPE/Mater-Bi blends buried in soil. J. Appl. Polym. Sci. 2008, 109, 1177-1188.104. Buckley, J.; Halliday, A.; Lewis, A.; Druminski, D.; Shivkumar, S., Mechanical properties and degradation of commercial biodegradable plastic bags. Annu. Tech. Conf. - Soc. Plast. Eng. 2011, 69th, 1032-1039.105. Yang, Z.; Liu, X.; Yang, Z.; Zhuang, G.; Bai, Z.; Zhang, H.; Guo, Y., Preparation and formation mechanism of levoglucosan from starch using a tubular furnace pyrolysis reactor. J. Anal. Appl. Pyrol. 2013, 102, 83-88.106. Patwardhan, P. R.; Satrio, J. A.; Brown, R. C.; Shanks, B. H., Product distribution from fast pyrolysis of glucose-based carbohydrates. J. Anal. Appl. Pyrol. 2009, 86, 323-330.107. Gómez-Martínez, D.; Barneto, A. G.; Martínez, I.; Partal, P., Modelling of pyrolysis and combustion of gluten–glycerol-based bioplastics. Bioresour. Technol. 2011, 102, 6246-6253.108. Choi, S.-S.; Kim, M.-C.; Kim, Y.-K., Influence of silica on formation of levoglucosan from carbohydrates by pyrolysis. J. Anal. Appl. Pyrol. 2011, 90, 56-62.109. Laresgoiti, M. F.; Caballero, B. M.; de Marco, I.; Torres, A.; Cabrero, M. A.; Chomón, M. J., Characterization of the liquid products obtained in tyre pyrolysis. J. Anal. Appl. Pyrol. 2004, 71, 917-934.110. Frigo, S.; Seggiani, M.; Puccini, M.; Vitolo, S. Liquid fuel production from waste tyre pyrolysis and its utilisation in a Diesel engine. Fuel 2014, 116, 399-408.111. Hofman, M.; Pietrzak, R., Adsorbents obtained from waste tires for NO2
removal under dry conditions at room temperature. Chem. Eng. J. 2011, 170, 202–208.112. Lòpez, G.; Olazar, M.; Artetxe, M.; Amutio, M.; Elordi, G.; Bilbao, J., Steam
1 - Introduction 35
activation of pyrolytic tyre char at different temperatures. J. Anal. Appl. Pyrol. 2009, 85, 539-543.113. Aranda, A.; Murillo, R.; Garcìa, T.; Callén, M. S.; Mastral, A. M., Steam activation of tyre pyrolytic carbon black: Kinetic study in a thermobalance. Chem. Eng. J. 2007, 126, 79-85.114. Zabaniotou, A.; Madau, P.; Oudenne, P. D.; Jung, C. G.; Delplancke, M.-P.; Fontana, A., Active carbon production from used tire in two-stage procedure: industrial pyrolysis and bench scale activation with H2O–CO2 mixture. J. Anal. Appl. Pyrol. 2004, 72, 289-297.115. Mui, E. L. K.; Ko, D. C. K.; McKay, G., Production of active carbons from waste tyres – a review. Carbon 2004, 42, 2789-2805.116. Ko, D. C. K.; Mui, E. L. K.; Lau, K. S. T.; McKay, G., Production of activated carbons from waste tire – process design and economical analysis. Waste Manage. 2004, 24, 875–888.117. Zabaniotou, A. A.; Stavropoulos, G., Pyrolysis of used automobile tires and residual char utilization. J. Anal. Appl. Pyrol. 2003, 70, 711-722.118. Lucchesi, A.; Maschio, G., Semi-active carbon and aromatics produced by pyrolysis of scrap tires. Conserv. Recycling 1983, 8, 85-90.119. Jie, Z.; Jingdai, W.; Xiaohong, R.; Yongrong, Y.; Binbo, J., Surface Modification of Pyrolytic Carbon Black from Waste Tires and Its Use as Pigment for Offset Printing Ink. Chin. J. Chem. Eng. 2006, 14, 654-659.120. Rodriguez, I. d. M.; Laresgoiti, M. F.; Cabrero, M. A.; Torres, A.; Chomòn, M. J.; Caballero, B., Pyrolysis of scrap tyres. Fuel Process. Technol. 2001, 72, 9-22.121. Piskorz, J.; Majerski, P.; Radlein, D.; Wik, T.; Scott, D. S., Recovery of Carbon Black from Scrap Rubber. Energy Fuels 1999, 13, 544-551.122. Murena, F., Kinetics of sulphur compounds in waste tyres pyrolysis. J. Anal. Appl. Pyrol. 2000, 56, 195-205.123. Miranda, M.; Pinto, F.; Gulyurtlu, I.; Cabrita, I., Pyrolysis of rubber tyre wastes: A kinetic study. Fuel 2013, 103, 542–552.124. Berrueco, C.; Esperanza, E.; Mastral, F. J.; Ceamanos, J.; Garcìa-Bacaicoa, P., Pyrolysis of waste tyres in an atmospheric static-bed batch reactor: Analysis of the gases obtained. J. Anal. Appl. Pyrol. 2005, 74, 245-253.125. Barbooti, M. M.; Mohamed, T. J.; Hussain, A. A.; Abas, F. O., Optimization of pyrolysis conditions of scrap tires under inert gas atmosphere. J. Anal. Appl. Pyrol. 2004, 72, 165-170.126. Kyari, M.; Cunliffe, A.; Williams, P. T., Characterization of Oils, Gases, and Char in Relation to the Pyrolysis of Different Brands of Scrap Automotive Tires. Energy Fuels 2005, 19, 1165-1173.127. Banar, M.; Akyıldız, V.; Özkan, A.; Çokaygil, Z.; Onay, Ö., Characterization of pyrolytic oil obtained from pyrolysis of TDF (Tire Derived Fuel). Energ. Convers. Manage. 2012, 62, 22-30.128. Juma, M.; Koreňová, Z.; Markoš, J.; Annus, J.; Jelemenský, L., Pyrolysis and combustion of scrap tire. Petroleum & Coal 2006, 48, 15-26.129. Dìez, C.; Sànchez, M. E.; Haxaire, P.; Martìnez, O.; Moran, A., Pyrolysis of tyres: A comparison of the results from a fixed-bed laboratory reactor and a pilot plant (rotatory reactor). J. Anal. Appl. Pyrol. 2005, 74, 254-258.130. Aylòn, E.; Fernàndez-Colino, A.; Murillo, R.; Murillo, R.; Garcìa, T.; Mastral, A. M., Valorisation of waste tyre by pyrolysis in a moving bed reactor. Waste Manage. 2010, 30, 1220-1224.131. Kaminsky, W.; Mennerich, C., Pyrolysis of synthetic tire rubber in a fluidised-

1 - Introduction36
bed reactor to yield 1,3-butadiene, styrene and carbon black. J. Anal. Appl. Pyrol. 2001, 58-59, 803-811.132. Dai, X.; Yin, X.; Wu, C.; Zhang, W.; Chen, Y., Pyrolysis of waste tires in a circulating fluidized-bed reactor. Energy 2001, 26, 385-399.133. Conesa, J. A.; Font, R.; Marcilla, A., Gas from the Pyrolysis of Scrap Tires in a Fluidized Bed Reactor. Energy Fuels 1996, 10, 134-140.134. Quek, A.; Balasubramanian, R., Liquefaction of waste tires by pyrolysis for oil and chemicals—A review. J. Anal. Appl. Pyrol. 2013, 101, 1-16.135. William J. Hall; Norasalwa Zakaria; Williams, P. T., Pyrolysis of latex gloves in the presence of Y-zeolite. Waste Manage. 2009, 29, 797–803.136. Stanciulescu, M.; Ikura, M., Limonene ethers from tire pyrolysis oil Part 2: Continuous flow experiments. J. Anal. Appl. Pyrol. 2007, 78, 76-84.137. Stanciulescu, M.; Ikura, M., Limonene ethers from tire pyrolysis oil Part 1: Batch experiments. J. Anal. Appl. Pyrol. 2006, 75, 217-225.138. Pakdel, H.; Pantea, D. M.; Roy, C., Production of dl-limonene by vacuum pyrolysis of used tires. J. Anal. Appl. Pyrol. 2001, 57, 91–107.139. Williams, P. T.; Brindle, A. J., Aromatic chemicals from the catalytic pyrolysis of scrap tyres. J. Anal. Appl. Pyrol. 2003, 67, 143-164.140. Williams, P. T.; Brindle, A. J., Catalytic pyrolysis of tyres: influence of catalyst temperature. Fuel 2002, 81, 2425-2434.141. Boxiong, S.; Chunfei, W.; Cai, L.; Binbin, G.; Rui, W., Pyrolysis of waste tyres: The influence of USY catalyst/tyre ratio on products. J. Anal. Appl. Pyrol. 2007, 78, 243-249.142. Boxiong, S.; Chunfei, W.; Binbin, G.; Rui, W.; Cai, L., Pyrolysis of waste tyres with zeolite USY and ZSM-5 catalysts. Appl. Catal., B 2007, 73, 150-157.143. Qu, W.; Zhou, Q.; Wang, Y.-Z.; Zhang, J.; Lan, W.-W.; Wu, Y.-H.; Yang, J.-W.; Wang, D.-Z., Pyrolysis of waste tire on ZSM-5 zeolite with enhanced catalytic activities. Polym. Degrad. Stabil. 2006, 91, 2389-2395.144. Olazar, M.; Aguado, R.; Arabiourrutia, M.; Lopez, G.; Barona, A.; Bilbao, J., Catalyst Effect on the Composition of Tire Pyrolysis Products. Energy Fuels 2008, 22, 2909-2916.145. Elbaba, I. F.; Wu, C.; Williams, P. T., Hydrogen production from the pyrolysise gasification of waste tyres with a nickel/cerium catalyst. Int. J. Hydrogen Energy 2011, 36, 6628-6637.146. Haydary, J.; Susa, D.; Dudáš, J., Pyrolysis of aseptic packages (tetrapak) in a laboratory screw type reactor and secondary thermal/catalytic tar decomposition. Waste Manage. 2013, 33, 1136-1141.147. Chao-Hsiung, W.; Ching-Yuan, C.; Yu-Fen, L.; Yeou-Lih, Y., Effects of Oxygen on Pyrolysis Kinetics of Tetra Pack. J. Environ. Eng. 2003, 129, 382-286.148. Wu, C.-H.; Liu, Y.-F., Pyrolysis Products of Tetra Pack in Different Oxygen Concentrations. Energy Fuels 2001, 15, 841-847.149. Korkmaz, A.; Yanik, J.; Brebu, M.; Vasile, C., Pyrolysis of the tetra pak. Waste Manage. 2009, 29, 2836-2841.150. Wu, C.-H.; Chang, H.-S., Pyrolysis of tetra pack in municipal solid waste. J. Chem. Technol. Biot. 2001, 76, 779-792.151. Grammelis, P.; Basinas, P.; Malliopoulou, A.; Sakellaropoulos, G., Pyrolysis kinetics and combustion characteristics of waste recovered fuels. Fuel 2009, 88, 195-205.152. Reyes, J. A.; Conesa, J. A.; Marcilla, A., Pyrolysis and combustion of polycoated cartons: kinetic model and MS-analysis. J. Anal. Appl. Pyrol. 2001,

1 - Introduction 37
58–59, 747-763.153. 152. Shen, D. K.; Gu, S., The mechanism for thermal decomposition of cellulose and its main products. Bioresour. Technol. 2009, 100, 6496-6504.154. Lin, Y.-C.; Cho, J.; Tompsett, G. A.; Westmoreland, P. R.; Huber, G. W., Kinetics and Mechanism of Cellulose Pyrolysis. J. Phys. Chem. C 2009, 113, 20097-20107.155. Sánchez-Jiménez, P.; Pérez-Maqueda, L.; Perejón, A.; Pascual-Cosp, J.; Benítez-Guerrero, M.; Criado, J., An improved model for the kinetic description of the thermal degradation of cellulose. Cellulose 2011, 18, 1487-1498.156. Mettler, M. S.; Mushrif, S. H.; Paulsen, A. D.; Javadekar, A. D.; Vlachos, D. G.; Dauenhauer, P. J., Revealing pyrolysis chemistry for biofuels production: Conversion of cellulose to furans and small oxygenates. Energ. Environ. Sci. 2012, 5, 5414-5424.157. Zhang, X.; Yang, W.; Blasiak, W., Kinetics of levoglucosan and formaldehyde formation during cellulose pyrolysis process. Fuel 2012, 96, 383-391.158. Grieco, E. M.; Baldi, G., Pyrolysis of polyethylene mixed with paper and wood: Interaction effects on tar, char and gas yields. Waste Manage. 2012, 32, 833-839.159. Sharypov, V. I.; Marin, N.; Beregovtsova, N. G.; Baryshnikov, S. V.; Kuznetsov, B. N.; Cebolla, V. L.; Weber, J. V., Co-pyrolysis of wood biomass and synthetic polymer mixtures. Part I: influence of experimental conditions on the evolution of solids, liquids and gases. J. Anal. Appl. Pyrol. 2002, 64, 15-28.160. Marin, N.; Collura, S.; Sharypov, V. I.; Beregovtsova, N. G.; Baryshnikov, S. V.; Kutnetzov, B. N.; Cebolla, V.; Weber, J. V., Copyrolysis of wood biomass and synthetic polymers mixtures. Part II: characterisation of the liquid phases. J. Anal. Appl. Pyrol. 2002, 65, 41-55.161. Sharypov, V. I.; Beregovtsova, N. G.; Kuznetsov, B. N.; Membrado, L.; Cebolla, V. L.; Marin, N.; Weber, J. V., Co-pyrolysis of wood biomass and synthetic polymers mixtures. Part III: Characterisation of heavy products. J. Anal. Appl. Pyrol. 2003, 67, 325-340.162. Jakab, E.; Várhegyi, G.; Faix, O., Thermal decomposition of polypropylene in the presence of wood-derived materials. J. Anal. Appl. Pyrol. 2000, 56, 273-285.163. Rutkowski, P.; Kubacki, A., Influence of polystyrene addition to cellulose on chemical structure and properties of bio-oil obtained during pyrolysis. Energ. Convers. Manage. 2006, 47, 716-731.164. Rausa, R.; Pollesel, P., Pyrolysis of automotive shredder residue (ASR) influence of temperature on the distribution of products. J. Anal. Appl. Pyrol.1997, 40–41, 383-401.165. Zolezzi, M.; Nicolella, C.; Ferrara, S.; Iacobucci, C.; Rovatti, M., Conventional and fast pyrolysis of automobile shredder residues (ASR). Waste Manage. 2004, 24, 691-699.166. de Marco, I.; Caballero, B. M.; Cabrero, M. A.; Laresgoiti, M. F.; Torres, A.; Chomón, M. J., Recycling of automobile shredder residues by means of pyrolysis. J. Anal. Appl. Pyrol. 2007, 79, 403-408.167. Joung, H.; Seo, Y.; Kim, K.; Hong, J.; Yoo, T., Distribution and characteristics of pyrolysis products from automobile shredder residue using an experimental semi-batch reactor. Korean J. Chem. Eng. 2007, 24, 996-1002.168. Santini, A.; Passarini, F.; Vassura, I.; Serrano, D.; Dufour, J.; Morselli, L., Auto shredder residue recycling: Mechanical separation and pyrolysis. Waste Manage. 2012, 32, 852-858.

1 - Introduction38
169. Hwang, I. H.; Yokono, S.; Matsuto, T., Pretreatment of automobile shredder residue (ASR) for fuel utilization. Chemosphere 2008, 71, 879-885.170. Lin, K.-S.; Chowdhury, S.; Wang, Z.-P., Catalytic gasification of automotive shredder residues with hydrogen generation. J. Power Sources 2010, 195, 6016–6023.

2. Microwave and Materials
Radiation in the microwave (MW) region was initially used during the Second
World War as a key technology in radar applications. During these first applications
the ability of MW to heat foodstuff was discovered.
Nowadays MW is widely exploited in our daily-life in MW oven, chemist work
as heating technology, and industrial applications from polymer curing to ceramic
sintering.
The MW region of the electromagnetic spectrum corresponds to wavelengths
from 1 cm to 1 m (30 GHz to 300 MHz). The wavelengths of 1–25 cm are used
for radar and telecommunication issues, and by international agreement only
the frequencies at 2.45 GHz (12.2 cm) and 900 MHz (33.3 cm) are available for
heating purpose. Only if the leakage of stray microwave radiation is prevented
other frequency may be used.
Today it is well known, that MW are able to heat a wide range of materials.
In conventional heating energy is transferred by three ways: convection,
conduction, and radiation from the source to the surfaces of the material. A thermal
gradient is always required to achieve heat transfer. MW delivers their energy
content at molecular level that is thorough the conversion of the electromagnetic
energy of the MW to thermal energy rather than heat transfer.1 So far MW shows
several physical differences compared to conventional heating, that is:2
• Volumetricheatingofmaterials
• Selectiveheating
• Highheatingrates
• Reductionofprocessingtime
• Increasedproductquality
• Processingofnewmaterials
• Savingsofenergyconsumption
• Greentechnology.
Indeed the transfer of energy does not rely on diffusion of heat from the
surfaces, and it is possible to achieve rapid and uniform heating of thick materials
(especially carbon, metals, and ceramics which are materials with low thermal

2 - Microwave and Materials40
conductivities).
The first wide spreading measurement of MW interaction with materials was
performed by von Hippel et al. providing the actual basic dielectric parameters
governing the extent of interaction between microwaves and solid/solution
samples.3
MW interaction with materials is not a quantum mechanical phenomenon
localized on a single molecule but it is a collective property. In Figure 2.1 is reported
the energy associated to a MW photon at 2.45 GHz and the energies relative to
carbon-carbon and carbon-hydrogen covalent bond and the bond energy in an
average ionic solid.
Figure 2.1. MW frequency and relative energy. C: carbon-carbon covalent bond energy; H: carbon-hydrogen covalent bond energy; I: ionic solid average bond energy.
In the following sections an introduction of MW equipment and MW interaction
with material for heating purpose are briefly reviewed.
2.1. Microwave equipment
Any MW system comprises a MW source, a transmission line, and an applicator.
The MW source is a device where the MW at a fixed frequency is produced.
The transmission line transfers the MW from the source to the applicator. The
applicator is the cavity where the sample is placed and heated, also known as
the oven.
MW is generated by accelerating charges, and high power and frequencies
are achieved inside vacuum tubes. The most used MW generator for heating
application are magnetrons, traveling wave tubes, and klystrons. Magnetrons are
used in domestic oven so they are mass produced and available on the market
at very low price. They use resonant structures to generate the electromagnetic
Wavelength (m)
Frequency (Hz)
Energy(eV) H C I
103 102 101 1 10-1 10-2 10-3 10-4 10-5 10-6 10-7 10-8 10-9 10-10 10-11 10-12
106 107 108 109 1010 1011 1012 1013 1014 1015 1016 1017 1018 10191020
10-9 10-8 10-7 10-6 10-5 10-4 10-3 10-2 10-1 1 101 102 103 104 105 106
Radio Waves Microwaves Gamma rays
X RaysInfrared
Ultraviolet

2 - Microwave and Materials 41
field, and, therefore, they are capable of generating a fixed frequency of an
electromagnetic field. For variable frequency applications traveling wave tubes
are employed.
Magnetrons are constituted by an anode at a high potential compared to a
cathode. Therefore the potential difference produces a strong electric field, then
the cathode is heated to produce electron that are accelerated toward the anode by
the electric field (Figure 2.2). An external magnet creates an orthogonal magnetic
field that creates a circumferential force on the electron as it is accelerated to
the anode. So far as electrons pass the resonant cavities, the cavities starts with
oscillations in an electron cloud, and the frequency of the oscillations depends on
the size of the cavities. At this point the electromagnetic energy is transferred to
the applicator through a coaxial transmission line.
Figure 2.2. Schematic diagram of a magnetron. a) top view; b) side view.1
The output power can be adjusted in three ways. In the first one the magnetron
works at full power but alternate on-off cycle. In the second the current amplitude
of the cathode is varied. In the third the intensity of magnetic field is varied.1
The transmission line transfers energy from the source to the applicator. In low
power systems, the transmission lines are often coaxial cables, which are similar
to those used on televisions. At high frequencies and output power, the losses
that occur in coaxial cables are significant, and hollow rectangular tubes are used.
These devices are called waveguides and the electromagnetic waves propagate
with low loss.
The applicator is a cavity where the MW energy is transferred to the sample.
There are two main kind of applicator: single mode and multi-mode.
Single mode applicators are based on strict geometry and their size is close
to wavelength used, and in order to maintain the resonant mode, they require
Coupling Probe Waveguide
Cathode AnodeCathode
Magnetic Field
Magnets
a) b)

2 - Microwave and Materials42
a microwave source that has little variation in the frequency output. In general,
single mode cavities have one ‘‘hot spot’’ where the microwave field strength is
high.
Multi-mode applicators have several high order mode at the same time in their
cavity. They do not need fixed size at given frequency, and as the cavity size
increases the number of mode increases as well. Usually the size of an applicator
is larger than one wavelength. The rule of thumb to achieve uniformity within an
applicator is to have the longest dimension 100 times greater than the wavelength
of the operating frequency (for 2.45 GHz should be larger than 12 m).1
2.2. Microwave interaction with materials and microwave heating
MW interacts with materials following several mechanisms and an exhaustive
review could become a huge work but far from the aim of this work.
Usually materials that are heated through MW are dielectrics. A dielectric
material contains permanent or induced dipoles, which when placed between two
electrodes acts as a capacitor (charge are stored and no direct current conductivity
is observed if the electrodes are connected by a circuit). In this situation dielectrics
show polarization from the finite displacement of charges or rotation of dipoles.
This is different from conduction where a translational motion of electric charges
is realized when a field is applied.
Also conducting materials are heated by the electric field due to the motion of
its electric charges which cause Joule heating. It can be observed in metals but
also in carbon-based materials where a graphitic texture is present (Figure 2.3).4
Figure 2.3. Schematic representation of MW heating of carbon material.
At molecular level dielectrics show two main effects when exposed to MW: a
distortion of the distribution of the electronic cloud of the molecule or the physical
e-
e-
e-
e-
e-
e-
E
D HEAT
D HEAT

2 - Microwave and Materials 43
rotation of dipoles. The latter effect is predominant in dielectric heating because
the rotational relaxation time occurs in the microwave region for many polar
organic molecules.5 In general terms if the external electric field is alternating, the
dielectric response follows it, generally with some lag behind the field changes.
A measure of such response of a material to an external electric field is the
dielectric permittivity, ε.6 To quantify this phenomenon in an alternating field a
complex dielectric permittivity that depends on the field frequency, ω, is formally
introduced in 2.1:2.1
The imaginary part of the 2.1 is greater when the lag in dielectric response is
larger. The change of polarization is coupled by the motion of electric charges which
generates heat inside the material. The effective high-frequency conductivity, σ,
can be introduced in order to characterize the power of heating (P). The power of
heating per volume is equal to the absorbed microwave power and it is reported
in 2.2:
2.2
E is the strength of the electric field inside the material. σ is linked to the
imaginary part of the dielectric permittivity as reported in 2.3:
2.3
ε0 is the permittivity of free space. While the MW pass through the material E
decreases. This electromagnetic energy dissipation is characterized by the loss
factor (2.4):
2.4
The penetration depth (L) of MW, that is the space in which the field strength is
reduced by a factor “e”, is described by 2.5:
2.5
Where c is the speed of light.
The incident electromagnetic wave can be also partially reflected by the surface
of a material, the fraction of reflected power (R) is reported in 2.6:
2.6
So far any process involving MW heating can be described by L and R.
Furthermore the dependence of ε from ω determines the feature of MW heating
at different frequencies.
In classical heating the energy is transferred by thermal radiation (usually in the
infrared range). Its L is small (1 10-4 m) and the energy is localized in a thin layer
over the material surface. Heating in this case depends only on heat transfer from
ε ω ε ω ε ω( ) = ) + )'( "(i
P E=σ 2
σ ωε ε= 0
tan''
'δ
εε
=
L c=
+ +′ω
δε δ
2 1 12
2
[ tan ]
tan
R =− + + + +
+ + + + +
′ ′
′ ′
1 2 1 1 1
1 2 1 1 1
2 2
2 2
ε δ ε δ
ε δ ε δ
( tan ) tan
( tan ) tan

2 - Microwave and Materials44
the hot surface to the cold bulk by thermal conductivity. Worthy of note is that
polymers have a poor thermal conductivity.
The absorption of MW may vary strongly because tan δ values vary from 10-4
to 1 together with R and L. In Table 2.1 are reported some tanδ values of selected
materials.
Table 2.1. Some tanδ values of selected materials at 298 K. 4, 5
material tanδCoal 0.02–0.08
Carbon foam 0.05–0.20
Charcoal 0.11–0.29
Carbon black 0.35–0.83
Activated carbon 0.57–0.80
Activated carbon 0.22–2.95
Carbon nanotube 0.25–1.14
CSi nanofibres 0.58–1.00
ZnO 0.0529
TiO 0.0322
H2O 0.123
MeOH 0.659
EtOH 0.941
1-Propanol 0.757
Me2SO 0.825
HCONMe2 0.161
MeNO2 0.064
THF 0.047
CH2Cl2 0.042
CHCl3 0.091
MeCOMe 0.054
MeCO2Et 0.059
HCO2H 0.722
MeCO2H 0.174
MeCN 0.062
PhCN 0.459
CH2OHCH2OH 1.35
A material that show a low tanδ (<10-3) shows almost no heating when irradiated
at 2.45 GHz and the MW pass through without any strong effects (Figure 2.4a).
Anyway the not absorbed MW, if the oven is well designed, could be summed in
phase enhancing E so the absorbed power. A possibility to heat low tanδ materials
is to mix them with high tanδ materials such or metals.
Materials with high tanδ (> 10-1) quickly interact with MW and they are heated
at any MW frequency. Anyway the effective conductivity is typically so large that a
strong reflection of radiation from the surface inhibits further heating (Figure 2.4b).
The absorbed fraction of the incident MW power can be estimated approximately

2 - Microwave and Materials 45
as reported in 2.7:
2.7
Figure 2.4. Schematic representation of a MW cavity. a) the MW are not absorbed, the sample has a low tanδ value, 1, incident radiation; 2 and 3, radiation returned to the sample after reflection from oven walls.; b) the MW are absorbed, the sample has a high tanδ value, 1, incident radiation; 2, radiation reflected from the sample; 3, radiation returned to the sample after reflection from oven walls.
Therefore the knowledge of dielectric properties, chemical composition, micro
and macro structure are fundamental to apply worthwhile a MW heating. However
a theoretical approach to a MW heating issue can give only qualitative information
because these mechanisms are strongly dependent on the structure of materials,
type and strength of chemical bonds among atoms.
Further consideration can be done when materials are heated at high temperature
because changes in their structure affect tanδ and the other parameter described
above. Indeed at elevated temperatures, microwave absorption grows sharply.
This feature is found in ionic and covalent solids. In these solid the increase in MW
absorption starts at temperatures about 40 – 50% of the melting temperature. In
this temperature range the bonds between ions start to break, and the electrons
in covalent materials begin to populate the conduction bands. The increase in
microwave absorption with temperature can cause a thermal instability, which
is known as a temperature runaway. Thus an increase in the local temperature
is followed by an enhancement of MW absorption, which ensues in the local
acceleration of heating and further growth of temperature.6
1
2
3
a) b)
1 222
− ≈′
Rε δtan �

2 - Microwave and Materials46
Reference
1. Thostenson, E. T.; Chou, T. W., Microwave processing: fundamentals and applications. Compos. Part. A: Appl. S. 1999, 30, 1055-1071.2. Feher, L. E., Energy Efficient Microwave Systems. Springer: 2009; p 124.3. Von Hippel, A. R., Dielectric materials and applications. MIT Press, Cambridge, MA, 1954.4. Menéndez, J. A.; Arenillas, A.; Fidalgo, B.; Fernández, Y.; Zubizarreta, L.; Calvo, E. G.; Bermúdez, J. M., Microwave heating processes involving carbon materials. Fuel Process. Technol. 2010, 91, 1-8.5. Tierney, J. P.; Lidstrom, P., Microwave Assisted Organic Synthesis. 1 ed.; Blackwell Publishing Ltd: Oxford, UK, 2005; p 289.6. Bykov, Y. V.; Rybakov, K. I.; Semenov, V. E., High-temperature microwave processing of materials. J Phys. D Appl. Phys 2001, 34, R55.

3. Microwave Processing of Materials
MW heating shows a sound and worthwhile application in several fields due to
the benefits of this heating technology. It has been developed and used in food (for
baking, vacuum drying, tempering and thawing, pasteurization, and sterilization),1
polymer industries (for rubber vulcanization, polymerization or curing of resins
and polymers by elimination of polar solvents),2 chemical reactions and so on.
In recent years there is a growing interest toward developing microwave assisted
pyrolysis (MAP) processes. MW heating, as outlined in Section 2, may overwhelm
all the heat transfer and diffusion problems by localizing the energy directly on
compounds able to interact with MW. Furthermore may allow a careful control
of pyrolysis parameters to maximize one of the products. Must be taken into
account that operating parameters can induce and/or alter particular chemical
reactions, resulting in different chemical profiles of the products themself.3 As
a consequence, feedstock for MAP requires few pretreatment and conditioning
steps (such as grinding or chopping) with respect to conventional pyrolysis. These
benefits may reduce time and energy, and they may allow a cleaner conversion to
valuable products than gasification and conventional pyrolysis.
MW heating shows further difference and unique feature with respect to
conventional and other heating methods. These effects are observed on materials
which possess electrons able to move freely in its structure such as carbon or
metals. These moving charges may cause the formation of arcing or microplasmas
on the surface.2, 4-8
Anyway switching to a MW heated system may present some new problematic
issue. Homogeneity of MW radiation and heating can be challenging on large
sample and a mixing system may solve the problem. However the mixing system
should be transparent to MW otherwise it may change the behavior of the
pyrolysis itself. The formation of char into the oven may cover the quartz windows
from which the MW are delivered into the oven. So the char may absorb the
MW preventing them to enter inside the oven and this deposit may damage the
windows themselves or the generator if the MW is sent back.

3 - Microwave processing of Materials48
3.1. Biomasses
Pyrolysis of biomasses to obtain liquid, also known as bio-fuel, requires rapid
heating at moderate temperature followed by a rapid quenching of the intermediate
volatile products.9, 10 In MAP this requirement is achieved without finely milling the
feedstock because MW allows the volumetric heating of sample, furthermore the
presence of water may enhance the heating rate and mitigate the temperature
reached during pyrolysis. MAP has been employed to convert wood block to tar
(up to 30 wt%), oil, and charcoal.11 However, MAP sometimes may need other
kind of pretreatments of biomasses because they are characterized by low tanδ
values and shows poor MW absorption. Thus MW absorbers are added and
homogeneously blended with biomass before MAP.
The rapid volumetric heating promote the rapid release of moisture from the
feedstock, increasing the surface area and improving the pore structure, which
favors a quick release of volatiles during pyrolysis. This account and the lower
surface temperature (the heat is focused on the core of the feed) reduces the
residence time (the time at which substances are heated at pyrolysis condition).
So far char-catalyzed secondary cracking are minimized. Furthermore MW power
may be easily controlled and the reaction behavior may be tuned to achieve mild
pyrolysis conditions. The vapors coming out from the reactor must be fast cooled
to avoid other char-catalyze reactions because char can be transported by the
gas flow.
In Table 3.1 are listed the biomasses pyrolyzed and the MAP technology
employed.
Table 3.1. Summary of MAP of biomass, compiled drawn by Yin.9
Biomass and pretreatments
MAP conditions Products main features Ref.
A e r o b i c a l l y digested sewage sludge, from an urban waste water treatment plant
15 g plus 1g of a MW absorber (graphite or char). 1 kW for 6 min. Temperature detected above 1270 K. He flow (15 mL/min).
Fast heating and preservation of some of initial functional groups. Secondary reactions to form polycyclic aromatic hydrocarbons (PAHs) are avoided. Products with high heating values.
12-14
Coffee hulls, rich in cellulose; 3 mm x 2 cm pellets
15 g plus 3 g of char from a previous experiment (as MW absorber). N2 flow (60 mL/min). Temperature 773, 1073, and 1273 K. 20 min runs.
MAP produce large amount of gas and few liquids. The gas is rich in CO and H2. Calorific values evaluated for the three products; energy recovery close to 100%.
15
(continue)
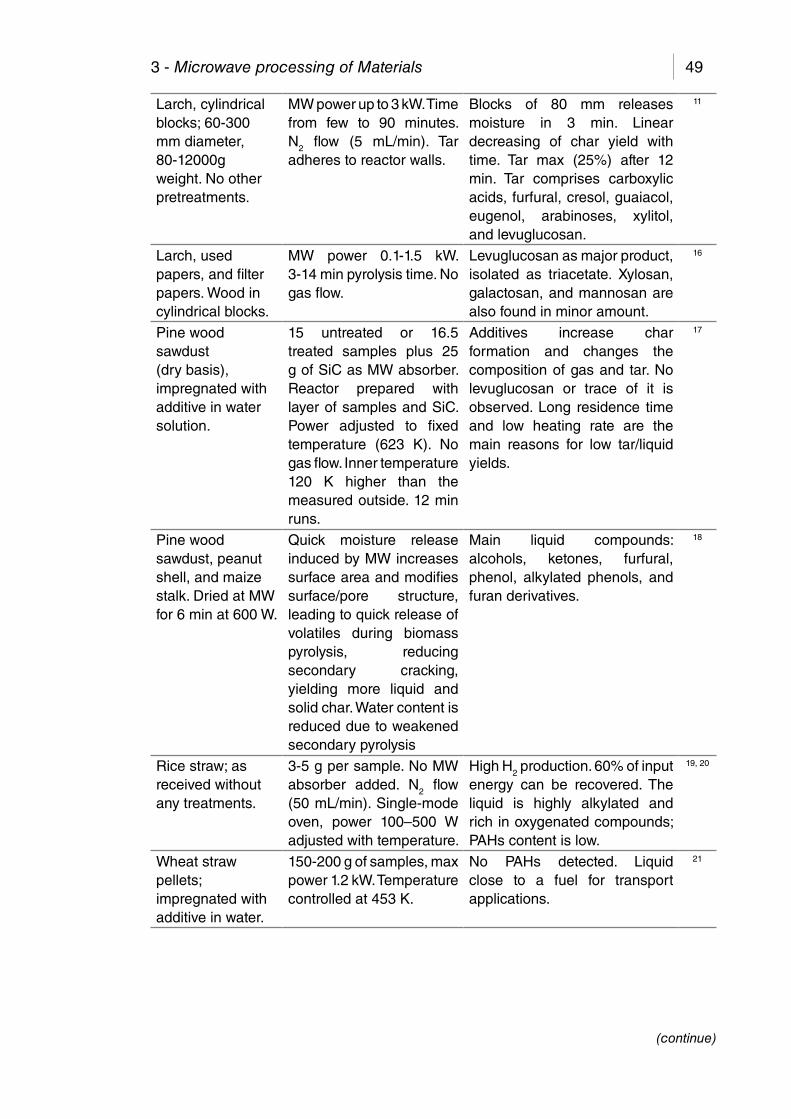
3 - Microwave processing of Materials 49
Larch, cylindrical blocks; 60-300 mm diameter, 80-12000g weight. No other pretreatments.
MW power up to 3 kW. Time from few to 90 minutes. N2 flow (5 mL/min). Tar adheres to reactor walls.
Blocks of 80 mm releases moisture in 3 min. Linear decreasing of char yield with time. Tar max (25%) after 12 min. Tar comprises carboxylic acids, furfural, cresol, guaiacol, eugenol, arabinoses, xylitol, and levuglucosan.
11
Larch, used papers, and filter papers. Wood in cylindrical blocks.
MW power 0.1-1.5 kW. 3-14 min pyrolysis time. No gas flow.
Levuglucosan as major product, isolated as triacetate. Xylosan, galactosan, and mannosan are also found in minor amount.
16
Pine wood sawdust (dry basis), impregnated with additive in water solution.
15 untreated or 16.5 treated samples plus 25 g of SiC as MW absorber. Reactor prepared with layer of samples and SiC. Power adjusted to fixed temperature (623 K). No gas flow. Inner temperature 120 K higher than the measured outside. 12 min runs.
Additives increase char formation and changes the composition of gas and tar. No levuglucosan or trace of it is observed. Long residence time and low heating rate are the main reasons for low tar/liquid yields.
17
Pine wood sawdust, peanut shell, and maize stalk. Dried at MW for 6 min at 600 W.
Quick moisture release induced by MW increases surface area and modifies surface/pore structure, leading to quick release of volatiles during biomass pyrolysis, reducing secondary cracking, yielding more liquid and solid char. Water content is reduced due to weakened secondary pyrolysis
Main liquid compounds: alcohols, ketones, furfural, phenol, alkylated phenols, and furan derivatives.
18
Rice straw; as received without any treatments.
3-5 g per sample. No MW absorber added. N2 flow (50 mL/min). Single-mode oven, power 100–500 W adjusted with temperature.
High H2 production. 60% of input energy can be recovered. The liquid is highly alkylated and rich in oxygenated compounds; PAHs content is low.
19, 20
Wheat straw pellets; impregnated with additive in water.
150-200 g of samples, max power 1.2 kW. Temperature controlled at 453 K.
No PAHs detected. Liquid close to a fuel for transport applications.
21
(continue)

3 - Microwave processing of Materials50
Fibrous cellulose, as received.
300 mg of sample. Oxygen free environment. 100–300 W, 373–573 K. Optimal temperature 453 K.
MW has a dramatic effect on the rate of decomposition when cellulose softens; yielding products which would require much higher temperatures (100 K higher) to be produced with conventional heating.
22
Chlorella sp. (a wide-type algae strain); naturally-dried.
30 g of sample and 6 g of char from previous pyrolysis as MW absorber. N2 flow (500 mL/min). Max power 1.25 kW. 20 min reaction time.
750 W is the optimum MW power which allows the maximum bio-oil yield of 28.6%. Better quality than lignocellulosic bio-oils in terms of physical and chemical properties; low oxygen content with aliphatic and aromatic hydrocarbons constituting 22.18%.
23
Corn stover; air dried then pulverized
700 W of power. Reaction temperature 788–958 K, reaction time 4–22 min.
The liquid mainly includes phenols (28–40 area%), aliphatic hydrocarbons (11–24 area%), aromatic hydrocarbons, furan derivatives, and some acids.
24
Distillers dried grain with solubles; no pretreatments.
100 g of sample. Reaction temperature 789–957 K, reaction time 4–22 min, and power 0.6-1.0 kW. No flow gas. Pyrolysis under N2.
Reaction temperature and time are the main factors affecting yields. Highest heating value of liquid is obtained at 920 K for 8 min, which is 66.7% of the heating value of gasoline. Liquids contain a series of useful chemical compounds which are related to the pyrolysis conditions and can be blended with gasoline without phase separation.
25
Douglas fir; no pretreatments
Activated carbon is used as MW absorber and mixed in various ratios with samples to a total of 120 g. Different additive tested, temperature measured with infrared thermometer. 3-15 min reaction time
Increase in phenol and phenol derivatives. High concentration of long chain fatty acid esters was obtained in the presence of Zn powder.
26
Sewage sludge; from urban wastewater treatment plant
100 g of sample plus 25 g of graphite as MW absorber blended together. Power 0.2-1.2 kW. Max temperature 1473 K. N2 flow (100 mL/min).
At 400 W yields 49.79% of liquid. Negligible PAHs presence.
27
(continue)

3 - Microwave processing of Materials 51
Anaerobic sewage sludge; from urban wastewater treatment plant
20 g of sample. Char residue from previous pyrolysis as MW absorber. Power 1 kW, 5 min pyrolysis time. N2 flow (100 mL/min).
MW makes possible to achieve a volume reduction of more than 80%, obtaining a porous carbonaceous residue of basic nature and providing a source of fuel gases and liquids.
28
Four sewage sludges: three from urban waste water treatment plants and one from a milk-derivative factory.
15 of sample plus 0.5-3 g of strips of graphoil as MW absorber. He flow (10 mL/min). Power 1 kW. Pyrolysis time 4-14 min. Max temperature detected 1473 K.
Rapidly and efficiently dried and pyrolyzed. CaO, may play an important role in the catalytic reactions that enhance H2 production. The gases are potential fuels and it makes them a valuable pyrolysis product.
29
Empty fruit bunch; 4 x 40 mm. No pretreatment.
100 g of sample mixed with activated carbon (as MW absorber) in different ratios. N2 flow (4 mL/min). Pyrolysis time 25 min. Power 300 and 450 W.
5–21 wt.% liquid, 48–80 wt.% char and 14–31 wt.% gas. Pyrolysis in absence of MW absorber, but intensive ball lightning (plasma arc) phenomenon are observed. Liquid comprise high amount of phenolic compounds. Char has a calorific value of 25 MJ/kg and it has the potential to be used as fuel.
30
Oil palm shell; milled.
150 g of sample plus activated carbon (as MW absorber) in various ratios. N2 flow (10 mL/min). Pyrolysis time 25 min. Power 300 and 450 W.
A metal stirrer can be successfully employed to pyrolyze solid biomass materials. The biomass to carbon ratio affects the temperature as well as the product yield. Carbonaceous material let to have an increase of temperature, and allows controlling it. 50 wt% carbon provided a temperature of 773 K, and the optimum yield and highest phenol content in the liquid. (oleic acid and phenol).
31
Wheat straw, no pretreatment
Power of 18 kW. N2 flow (1000 mL/min). Reaction time 85 min when 0.334 kW/kg-straw MW power used; 46 min when 0.668 kW/kgstraw used. Final temperature about 873 K.
Pyrolysis products: close to 1:1:1 for gas, liquid and char. The gas: 18 vol.% CO, 36 vol.% H2, 22 vol.% CH4, 19 vol.% CO2; LHV 15 MJ/Nm3. Electricity consumption: 0.58–0.65 kWh/kgstraw.
32
(continue)

3 - Microwave processing of Materials52
Wheat straw; air dried under sun irradiation.
5-30 g of sample plus residual char from residual experiment as MW absorber (in ratio 2:1). 10 min pyrolysis time. Temperature between 673-873 K. N2 flow (3000 mL/min)
Temperature is the key parameter affecting MAP. High temperature increases the production of gas. Gas contains a higher concentration of syngas and lower concentrations of CO2 and CH4 with the increase in temperature. The high amounts of H2 are attributed to the partial decomposition of CH4.
33
Microalgae; dried at 378 K for 24h then milled.
30 g of sample mixed with MW absorber (activated carbon, CaO, SiC and solid residue). Power 0.75-2.25 kW. Pyrolysis time 20 min.
Power of 1.5 and 2.25 kW are optimal for maximum liquid yield of 35.83% and the maximum fuel yield of 74.93%, respectively. Pyrolysis reaction is enhanced in the most prominent way by mixing activated carbon.
34
The data reported in Table 3.1 show how many possibility are offered by a
MAP process which may be tuned to yield products ranging from char to gas with
desired properties according to biomass characteristics.
3.2. Polymers
The scientific literature for MAP of synthetic polymers is less abundant than
related to biomass. The leading efforts are exploited in finding commercial
application than sole scientific research so it is possible to find several patents on
MAP of polymers, see Section 3.2.1. Anyway some of these papers are reviewed
as follow.
Even simple hydrocarbons can undergo MAP over carbon as MW absorber to
yield a large variety of molecular compounds from cyclic to linear alkanes and
alkenes together with H2 and gaseous hydrocarbons.35
PE as single polymer in a multi-layer system is pyrolyzed to a gas and a liquid/
wax in the presence of carbon as MW absorber.36 However in the same operating
conditions but using activated carbon as MW absorber, the pyrolysis efficiency
is improved. Activated carbon show an higher efficiency in transforming MW into
heat, because they show higher tanδ values, than not-activated carbon (Table
2.1),2 “microplasma” discharges are widely observed, and higher spot-point
temperature has been claimed.
MAP of PS has been investigated in the presence of a MW absorber such as iron
mesh,37 or aluminum as coil or mesh.38, 39 Iron can reach temperature up to 1470
K, and the main products collected were styrene, ethylbenzene, and condensed
ring aromatics, but data about their relative abundance were not reported.37 Using
aluminum in various shapes and arrangements high temperatures were also
achieved (aluminum melting point is 993 K); the best performance were obtained
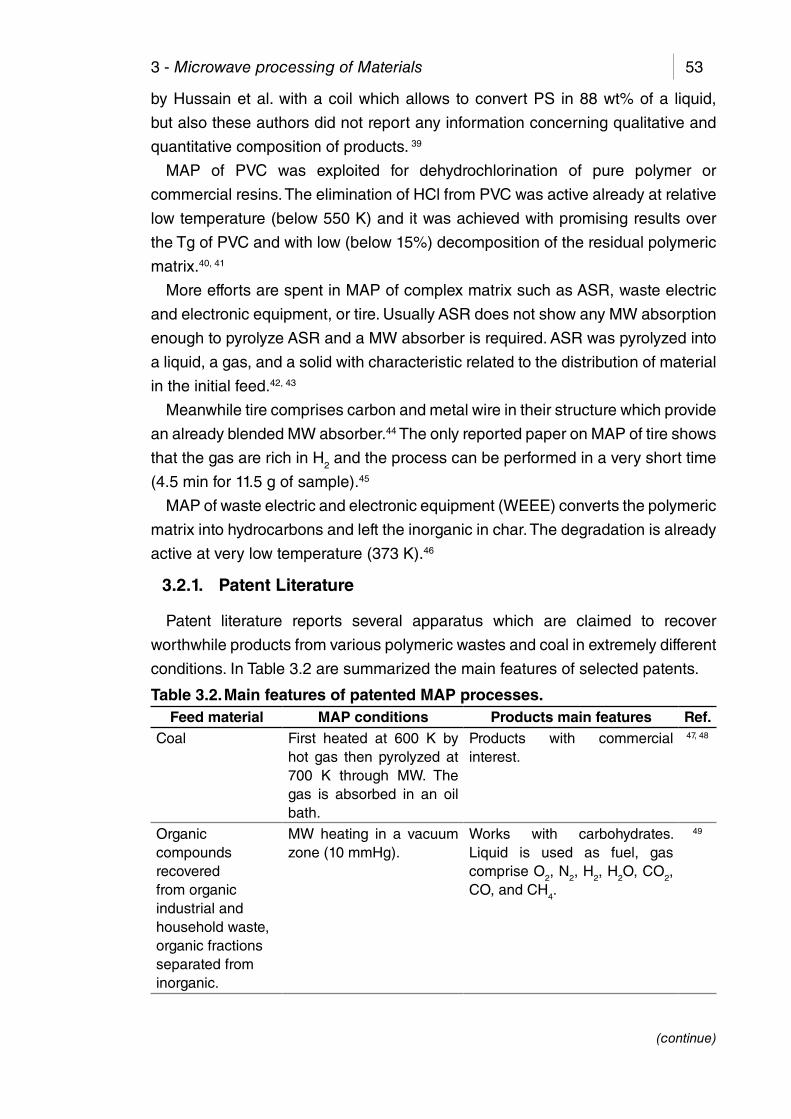
3 - Microwave processing of Materials 53
by Hussain et al. with a coil which allows to convert PS in 88 wt% of a liquid,
but also these authors did not report any information concerning qualitative and
quantitative composition of products. 39
MAP of PVC was exploited for dehydrochlorination of pure polymer or
commercial resins. The elimination of HCl from PVC was active already at relative
low temperature (below 550 K) and it was achieved with promising results over
the Tg of PVC and with low (below 15%) decomposition of the residual polymeric
matrix.40, 41
More efforts are spent in MAP of complex matrix such as ASR, waste electric
and electronic equipment, or tire. Usually ASR does not show any MW absorption
enough to pyrolyze ASR and a MW absorber is required. ASR was pyrolyzed into
a liquid, a gas, and a solid with characteristic related to the distribution of material
in the initial feed.42, 43
Meanwhile tire comprises carbon and metal wire in their structure which provide
an already blended MW absorber.44 The only reported paper on MAP of tire shows
that the gas are rich in H2 and the process can be performed in a very short time
(4.5 min for 11.5 g of sample).45
MAP of waste electric and electronic equipment (WEEE) converts the polymeric
matrix into hydrocarbons and left the inorganic in char. The degradation is already
active at very low temperature (373 K).46
3.2.1. Patent Literature
Patent literature reports several apparatus which are claimed to recover
worthwhile products from various polymeric wastes and coal in extremely different
conditions. In Table 3.2 are summarized the main features of selected patents.
Table 3.2. Main features of patented MAP processes.Feed material MAP conditions Products main features Ref.
Coal First heated at 600 K by hot gas then pyrolyzed at 700 K through MW. The gas is absorbed in an oil bath.
Products with commercial interest.
47, 48
Organic compounds recovered from organic industrial and household waste, organic fractions separated from inorganic.
MW heating in a vacuum zone (10 mmHg).
Works with carbohydrates. Liquid is used as fuel, gas comprise O2, N2, H2, H2O, CO2, CO, and CH4.
49
(continue)

3 - Microwave processing of Materials54
Any polymeric waste mixed with carbonaceous materials as MW absorber.
Pre-heated from 523 to 773 K then pyrolyzed. Pyrolysis time 15-60 min.
A solid and a gas. 50-55
PAHs Covered with inert and a MW absorber (granulated charcoal)
Condensation carbonaceous products.
56
Tire MW system designed to work below 623K.
No information about products characteristics and distribution.
57
Tire Tower-type reactor, N2 flow.
No information about products characteristics and distribution.
58
Aluminum/polymer laminates
Two reactors filled with carbon as MW absorber.
Aluminum is recovered unscratched while polymers (PE) give their typical degradation product. Wax formation is avoided.
59
Any kind of waste Circulating of feed from once to several times through the process, enabling the control of different processes of materials to yield desired end-products.
Reclaim of matter and energy through the production of solid and liquid products
60-64
Tire and petroleum derived polymeric materials.
Preheated, then moved in a second chamber to pyrolyze.
Liquid, gas, and char, no details are given.
65, 66
Organic materials Reductive pyrolysis in the presence of an inert gas and MW
Pyrolysis products are recovered as fuel gases (C1-C6 alkanes) and distillates, such as a synthetic crude oil, heavy gas oil, lubricating base oils, naphtha, and middle distillates.
67
Biomass material, particularly plant-derived biomass material.
Biomass is agitated during the MAP. The pyrolysis temperature is between about 340 K and 450 K (torrefaction).
Char solid product use as feedstock coal and for fired power station. Also used as compressed char product, which can be prepared by further processing the char by mixing with a binding agent, such as starch, and the mixture is compressed.
68
(continue)

3 - Microwave processing of Materials 55
Carbon-containing feedstock such as: biomass, manure, p l a n t - b a s e d cellulose, landfill material, and municipal solid waste.
A reaction chamber (for various kind of reactions) comprising at least one microwave-transparent chamber wall and a reaction cavity configured to hold the carbon-containing feedstock
Fuel like products. 69
The information provided in patents is much more limited than the one available
in scientific publications. Thus little information can be obtained on product
properties and distribution.
3.3. Other processed materials
MAP and other high temperature treatments by the means of MW are not
limited to biomasses and synthetic polymers, but also other classes of waste or
other materials are processed.
Waste engine oil is widely investigated through MAP to recover light hydrocarbons
or even H2 in the presence of carbon as MW absorber.70-74 Light hydrocarbons
show fuel like feature as density and calorific values.
Other syngas source by MAP is glycerol which is pyrolyzed in the presence of
carbonaceous materials.75
Ceramic materials are heated through MW for sintering application for two
main reason: the faster heating than conventional methods and the volumetric
distribution of heat that avoid tension in the heated materials and more
homogeneous characteristics.76, 77
MW heating of coal is performed and high temperature is reached in short time,
and tar is collected and analyzed in comparable but faster way than conventional
technologies.78 MW heating for sulfur removal from coals are realized by long
irradiation time and HCl addition to avoid sulfur fixation.79 This MW based approach
is extended also for sulfur removal from refinery streams80 and in general for
petroleum upgrading.81

3 - Microwave processing of Materials56
Reference
1. Meredith, R., Engineers' Handbook of Industrial Microwave Heating. The Institution of Electrical Engineers: London, United Kindom, 1998; Vol. 25, p 377.2. Menéndez, J. A.; Arenillas, A.; Fidalgo, B.; Fernández, Y.; Zubizarreta, L.; Calvo, E. G.; Bermúdez, J. M., Microwave heating processes involving carbon materials. Fuel Process. Technol. 2010, 91, 1-8.3. Luque, R.; Menendez, J. A.; Arenillas, A.; Cot, J., Microwave-assisted pyrolysis of biomass feedstocks: the way forward? Energ. Environ. Sci. 2012, 5, 5481-5488.4. Russell, A. D.; Antreou, E. I.; Lam, S. S.; Ludlow-Palafox, C.; Chase, H. A., Microwave-assisted pyrolysis of HDPE using an activated carbon bed. RSC Advances 2012, 2, 6756-6760.5. Menéndez, J. A.; Juàrez-Pérez, E. J.; Ruisànchez, E.; Bermùdez, J. M.; Arenillas, A., Ball lightning plasma and plasma arc formation during the microwave heating of carbons. Carbon 2011, 49, 339-342.6. Horikoshi, S.; Osawa, A.; Abe, M.; Serpone, N., On the Generation of Hot-Spots by Microwave Electric and Magnetic Fields and Their Impact on a Microwave-Assisted Heterogeneous Reaction in the Presence of Metallic Pd Nanoparticles on an Activated Carbon Support. J. Phys. Chem. C 2011, 115, 23030-23035.7. Dawson, E. A.; Parkes, G. M. B.; Barnes, P. A.; Bond, G.; Mao, R., The generation of microwave-induced plasma in granular active carbons under fluidised bed conditions. Carbon 2008, 46, 220-228.8. Tsukahara, Y.; Higashi, A.; Yamauchi, T.; Nakamura, T.; Yasuda, M.; Baba, A.; Wada, Y., In Situ Observation of Nonequilibrium Local Heating as an Origin of Special Effect of Microwave on Chemistry. J. Phys. Chem. C 2010, 114, 8965-8970.9. Yin, C., Microwave-assisted pyrolysis of biomass for liquid biofuels production. Bioresour. Technol. 2012, 120, 273-284.10. Bridgwater, A. V.; Peacocke, G. V. C., Fast pyrolysis processes for biomass. Renewable and Sustainable Energy Reviews 2000, 4, 1-73.11. Miura, M.; Kaga, H.; Sakurai, A.; Kakuchi, T.; Takahashi, K., Rapid pyrolysis of wood block by microwave heating. J. Anal. Appl. Pyrol. 2004, 71, 187–199.12. Domìnguez, A.; Menéndez, J. A.; Inguanzo, M.; Pis, J. J., Investigations into the characteristics of oils produced from microwave pyrolysis of sewage sludge. Fuel Process. Technol. 2005, 86, 1007-1030.13. Domínguez, A.; Menéndez, J. A.; Inguanzo, M.; Bernad, P. L.; Pis, J. J., Gas chromatographic–mass spectrometric study of the oil fractions produced by microwave-assisted pyrolysis of different sewage sludges. J. Chromatogr. A 2003, 1012, 193-206.14. Domìnguez, A.; Menéndez, J. A.; Inguanzo, M.; Pis, J. J., Production of bio-fuels by high temperature pyrolysis of sewage sludge using conventional and microwave heating. Bioresour. Technol. 2006, 97, 1185-1193.15. Domìnguez, A.; Menéndez, J. A.; Fernàndez, Y.; Pis, J. J.; Valente Nabais, J. M.; Carrott, P. J. M.; Ribeiro Carrott, M. M. L., Conventional and microwave induced pyrolysis of coffee hulls for the production of a hydrogen rich fuel gas. J. Anal. Appl. Pyrol. 2007, 79, 128-135.16. Yoshida, M. M. H. K. T.; Ando, K., Microwave pyrolysis of cellulosic materials for the production of anhydrosugars. J. Wood Sci. 2001, 47, 5.17. Chen, M.-q.; Wang, J.; Zhang, M.-x.; Chen, M.-g.; Zhu, X.-f.; Min, F.-f.; Tan, Z.-c., Catalytic effects of eight inorganic additives on pyrolysis of pine wood

3 - Microwave processing of Materials 57
sawdust by microwave heating. J. Anal. Appl. Pyrol. 2008, 82, 145-150.18. Wang, X.; Chen, H.; Luo, K.; Shao, J.; Yang, H., The Influence of Microwave Drying on Biomass Pyrolysis†. Energy Fuels 2007, 22, 67-74.19. Huang, Y. F.; Kuan, W. H.; Lo, S. L.; Lin, C. F., Hydrogen-rich fuel gas from rice straw via microwave-induced pyrolysis. Bioresour. Technol. 2010, 101, 1968-1973.20. Huang, Y. F.; Kuan, W. H.; Lo, S. L.; Lin, C. F., Total recovery of resources and energy from rice straw using microwave-induced pyrolysis. Bioresour. Technol. 2008, 99, 8252-8258.21. Budarin, V. L.; Clark, J. H.; Lanigan, B. A.; Shuttleworth, P.; Breeden, S. W.; Wilson, A. J.; Macquarrie, D. J.; Milkowski, K.; Jones, J.; Bridgeman, T.; Ross, A., The preparation of high-grade bio-oils through the controlled, low temperature microwave activation of wheat straw. Bioresour. Technol. 2009, 100, 6064-6068.22. Budarin, V. L.; Clark, J. H.; Lanigan, B. A.; Shuttleworth, P.; Macquarrie, D. J., Microwave assisted decomposition of cellulose: A new thermochemical route for biomass exploitation. Bioresour. Technol. 2010, 101, 3776-3779.23. Du, Z.; Li, Y.; Wang, X.; Wan, Y.; Chen, Q.; Wang, C.; Lin, X.; Liu, Y.; Chen, P.; Ruan, R., Microwave-assisted pyrolysis of microalgae for biofuel production. Bioresour. Technol. 2011, 102, 4890-4896.24. Lei, H.; Ren, S.; Julson, J., The Effects of Reaction Temperature and Time and Particle Size of Corn Stover on Microwave Pyrolysis. Energy Fuels 2009, 23, 3254-3261.25. Lei, H.; Ren, S.; Wang, L.; Bu, Q.; Julson, J.; Holladay, J.; Ruan, R., Microwave pyrolysis of distillers dried grain with solubles (DDGS) for biofuel production. Bioresour. Technol. 2011, 102, 6208-6213.26. Bu, Q.; Lei, H.; Ren, S.; Wanga, L.; Zhang, Q.; Tang, J.; Ruan, R., Production of phenols and biofuels by catalytic microwave pyrolysis of lignocellulosic biomass. Bioresour. Technol. 2012, 108, 274-279.27. Tian, Y.; Zuo, W.; Ren, Z.; Chen, D., Estimation of a novel method to produce bio-oil from sewage sludge by microwave pyrolysis with the consideration of efficiency and safety. Bioresour. Technol. 2011, 102, 2053-2061.28. Menéndez, J. A.; Inguanzo, M.; Pis, J. J., Microwave-induced pyrolysis of sewage sludge. Water Res. 2002, 36, 3261-3264.29. Menéndez, J. A.; Domìnguez, A.; Inguanzo, M.; Pis, J. J., Microwave pyrolysis of sewage sludge: analysis of the gas fraction. J. Anal. Appl. Pyrol. 2004, 71, 657-667.30. Salema, A. A.; Ani, F. N., Pyrolysis of oil palm empty fruit bunch biomass pellets using multimode microwave irradiation. Bioresour. Technol. 2012, 125, 102-107.31. Salema, A. A.; Ani, F. N., Microwave-assisted pyrolysis of oil palm shell biomass using an overhead stirrer. J. Anal. Appl. Pyrol. 2012, 96, 162-172.32. Zhao, X.; Zhang, J.; Song, Z.; Liu, H.; Li, L.; Ma, C., Microwave pyrolysis of straw bale and energy balance analysis. J. Anal. Appl. Pyrol. 2011, 92, 43-49.33. Zhao, X.; Wang, M.; Liu, H.; Li, L.; Ma, C.; Song, Z., A microwave reactor for characterization of pyrolyzed biomass. Bioresour. Technol. 2012, 104, 673-678.34. Hu, Z.; Ma, X.; Chen, C., A study on experimental characteristic of microwave-assisted pyrolysis of microalgae. Bioresour. Technol. 2012, 107, 487-493.35. Tanner, D. D.; Kandanarachchi, P.; Ding, Q.; Shao, H.; Vizitiu, D.; Franz, J. A., The Catalytic Conversion of C1-Cn Hydrocarbons to Olefins and Hydrogen: Microwave-Assisted C-C and C-H Bond Activation. Energy Fuels 2001, 15, 197-

3 - Microwave processing of Materials58
204.36. Ludlow-Palafox, C.; Chase, H. A., Microwave-Induced Pyrolysis of Plastic Wastes. Ind. Eng. Chem. Res. 2001, 40, 4749-4756.37. Hussain, Z.; Khan, K. M.; Hussain, K., Microwave–metal interaction pyrolysis of polystyrene. J. Anal. Appl. Pyrol. 2010, 89, 39-43.38. Hussain, Z.; Khan, K. M.; Basheer, N.; Hussain, K., Co-liquefaction of Makarwal coal and waste polystyrene by microwave–metal interaction pyrolysis in copper coil reactor. J. Anal. Appl. Pyrol. 2011, 90, 53-55.39. Hussain, Z.; Khan, K. M.; Perveen, S.; Hussain, K.; Voelter, W., The conversion of waste polystyrene into useful hydrocarbons by microwave-metal interaction pyrolysis. Fuel Process. Technol. 2012, 94, 145-150.40. Moriwaki, S.; Machida, M.; Tatsumoto, H.; Otsubo, Y.; Aikawa, M.; Ogura, T., Dehydrochlorination of poly(vinyl chloride) by microwave irradiation. Appl. Therm. Eng. 2006, 26, 745-750.41. Ito, M.; Ushida, K.; Nakao, N.; Kikuchi, N.; Nozaki, R.; Asai, K.; Washio, M., Dechlorination of poly(vinyl chloride) by microwave irradiation I: A simple examination using a commercial microwave oven. Polym. Degrad. Stabil. 2006, 91, 1694-1700.42. Donaj, P.; Yang, W.; Błasiak, W.; Forsgren, C., Recycling of automobile shredder residue with a microwave pyrolysis combined with high temperature steam gasification. J. Hazard. Mater. 2010, 182, 80-89.43. Donaj, P.; Blasiak, W.; Yang, W.; Forsgren, C., Conversion of microwave pyrolysed ASR’s char using high temperature agents. J. Hazard. Mater. 2011, 185, 472-481.44. Sharma, V. K.; Mincarini, M.; Fortuna, F.; Cognini, F.; Cornacchia, G., Disposal of waste tyres for energy recovery and safe environment—Review. Energ. Convers. Manage. 1998, 39, 511-528.45. Yatsun, A. V.; Konovalov, P. N.; Konovalov, N. P., Gaseous Products of Microwave Pyrolysis of Scrap Tires. Solid Fuel Chem. 2008, 42, 187-191.46. Andersson, M.; Knutson Wedel, M.; Forsgren, C.; Christéen, J., Microwave assisted pyrolysis of residual fractions of waste electrical and electronics equipment. Miner. Eng. 2012, 29, 105-111.47. Knapp, E. M.; Ellis, W. T. Recovery of gaseous hydrocarbons from pyrolysis of coal with microwave energy. US3523405A, 1970.48. Knapp, E. M.; Ellis, W. T., Jr. Pyrolysis of coal with microwave energy. US3449213A, 1969.49. Grannen, E. A.; Robinson, L. Microwave pyrolysis of wastes. US3843457A, 1974.50. Holland, K. M. A. Pyrolysis and apparatus of organic materials using microwaves. EP780457A2, 1997.51. Holland, K. M. Pyrolysis of macromolecular wastes by microwave heating. US5084140A, 1992.52. Holland, K. M. Destruction of waste solids by pyrolysis. WO9202598A1, 1992.53. Holland, K. M. Process of destructive distillation of organic material. 1992.54. Holland, K. M. Pyrolysis of organic material such as scrap tires. WO8904355A1, 1989.55. Holland, K. M. Destruction of plastics waste. WO8808871A1, 1988.56. Dauennan, L. Microwave-Assisted Pyrolysis Of Waste Polyaromatic Hydrocarbons. US 5,698,762, 1997.

3 - Microwave processing of Materials 59
57. Bell, J. R.; Skeels, P. R. Apparatus and processes suitable for tire degradation. US6693265B1, 2004.58. Kim, T., Jin The Waste rubber or waste tire resolution method and system by avail of microwave. WO2005073344A1, 2005.59. Ludlow-Palafox, C.; Chase, H. A. Microwave induced pyrolysis reactor and method for recycling of laminates. WO2005061098A1, 2005.60. Kasin, K. I. Microwave assisted flash pyrolysis system and method using the same. US20130032464A1, 2013.61. Kasin, K. I. Novel microwave assisted flash pyrolysis system and method thereof. WO2013016866A1, 2013.62. Kasin, K. I. Microwave gasification, pyrolysis and recycling of waste and other organic materials. US20090000938 A1. 2009.63. Kasin, K. I. Screw conveyor with microwave generator for pyrolysis and recycling of organic waste. GB2420542A, 2006.64. Kasin, K. I. Microwave gasification, pyrolysis and recycling of waste and other organic materials. WO2006083168A1, 2006.65. Pringle, F. G. Microwave-Based Recovery Of Hydrocarbons And Fossil Fuels. US20070131591A1, 2007.66. Pringle, J. A. Microwave Pyrolysis Apparatus For Waste Tires. US7101464B1, 2006.67. Farneman, J. O.; Welch, K. L. Material recovery from reductive pyrolysis of organic feedstocks in inert gas in presence of electromagnetic radiation. US20080141589A1, 2008.68. Taylor, R.; McMahon, L.; Way, G. P. W. Pyrolysis of biomass. WO2011107789A2, 2011.69. Van, T. D.; Catto, M.; Aaron, S. System and method for production of fuel from a carbon-containing feedstock using a microwave-transparent reaction chamber. WO2011019931A1, 2011.70. Lam, S. S.; Russell, A. D.; Lee, C. L.; Lam, S. K.; Chase, H. A., Production of hydrogen and light hydrocarbons as a potential gaseous fuel from microwave-heated pyrolysis of waste automotive engine oil. Int. J. Hydrogen Energy 2012, 37, 5011-5021.71. Lam, S. S.; Russell, A. D.; Lee, C. L.; Chase, H. A., Microwave-heated pyrolysis of waste automotive engine oil: Influence of operation parameters on the yield, composition, and fuel properties of pyrolysis oil. Fuel 2012, 92, 327-339.72. Lam, S. S.; Chase, H. A., A Review on Waste to Energy Processes Using Microwave Pyrolysis. Energies 2012, 5, 4209-4232.73. Lam, S. S.; Russell, A. D.; Chase, H. A., Pyrolysis Using Microwave Heating: A Sustainable Process for Recycling Used Car Engine Oil. Ind. Eng. Chem. Res. 2010, 49, 10845–10851.74. Lam, S. S.; Russell, A. D.; Chase, H. A., Microwave pyrolysis, a novel process for recycling waste automotive engine oil. Energy 2010, 35, 2985-2991.75. Fernández, Y.; Arenillas, A.; Bermúdez, J. M.; Menéndez, J. A., Comparative study of conventional and microwave-assisted pyrolysis, steam and dry reforming of glycerol for syngas production, using a carbonaceous catalyst. J. Anal. Appl. Pyrol. 2010, 83, 155-159.76. Bykov, Y. V.; Rybakov, K. I.; Semenov, V. E., High-temperature microwave processing of materials. J Phys. D Appl. Phys 2001, 34, R55.77. Charmond, S.; Carry, C. P.; Bouvard, D., Densification and microstructure evolution of Y-Tetragonal Zirconia Polycrystal powder during direct and hybrid

3 - Microwave processing of Materials60
microwave sintering in a single-mode cavity. J. Eur. Ceram. Soc. 2010, 30, 1211-1221.78. Monsef-Mirzai, P.; Ravindran, M.; McWhinnie, W. R.; Burchill, P., Rapid microwave pyrolysis of coal Methodology and examination of the residual and volatile phases. Fuel 1995, 74, 20-27.79. Jie, W.; Jiankang, Y., Behaviour of coal pyrolysis desulfurization with microwave energy. Fuel 1993, 73, 155-159.80. Ito, E.; Veen, J. A. R. v., On novel processes for removing sulphur from refinery streams. Catal. Today 2006, 116, 446-460.81. Mutyala, S.; Fairbridge, C.; Paré, J. R. J.; Bélanger, J. M. R.; Ng, S.; Hawkins, R., Microwave applications to oil sands and petroleum: A review. Fuel Process. Technol. 2010, 91, 127-135.

4. Microwave Pyrolysis System
The equipment used in this work was developed after several pyrolysis
experiments and then patented.1, 2 This equipment allows controlling the products
properties by tuning the residence time inside the oven of selected compounds.
By varying the MW power and inserting a fractionating system online with the
gas flow. In the next sections the set-ups are described together with the sample
preparation and products collection.
4.1. Oven and apparatus set-up
Two set-ups are used in this work. Both of them employ a MW oven (1, Figure
4.1 and Figure 4.2) with four external MW generators each having an absorption
of electric power of 2 KW capable of delivering up to 6 KW of microwave power
inside the oven. It was designed and supplied by Bi.Elle s.r.l. (Via Ho Chi Min, 6,
Modena, Italy). Samples were placed in a 1000 cm3 borosilicate Erlenmeyer flask
(2), the container was placed inside the oven and connected with two condensing
systems cooled at 298 K (5) and 263 K (6), respectively. Liquids were collected in
the flask (7) and gas in the gasometer (8). The set-up indicate as “A” has an empty
pipe in (4) (Figure 4.1); while the set-up indicate as “B” has a fractionating column
in (4) (Figure 4.2). The column has a length of 0.2 m, internal diameter of 0.03 m
and it was filled with glass spheres having a diameter of 4 mm.
Experiments were carried out in anoxic atmosphere without any carrier gas thus
avoiding the dilution of gas products with carrier gas, and preventing the formation
of oxygen and nitrogen containing compounds. The flow of pyrolysis products
from the oven to the condensing system was achieved by the gas formed during
pyrolysis, the pressure fall provided by the condensing system and the gasometer.
4.2. Variables
The choice of operative and descriptive parameters for any experiment is
crucial because their evaluation and tuning may allow controlling the experimental
behavior obtaining products with tailor made characteristics.

4 - Microwave Pyrolysis system62
Figure 4.1. Schematic representation of set-up A. (1) Oven; (2) Flask; (3) MW suppliers; (4) Flat pipe; (5) Cooler at 298 K; (6) Cooler at 263 K; (7) Liquid collecting flask; (8) Gas collecting system.
Figure 4.2. Schematic representation of set-up B. (1) Oven; (2) Flask; (3) MW suppliers; (4) Flat pipe (5) Cooler at 298 K; (6) Cooler at 263 K; (7) Liquid collecting flask; (8) Gas collecting system.
In a classical experiment temperature is the key parameter. Also in a MW heated
system it remains a key parameter but it is hardly detected because mercury
in glass and metal thermocouples interact with MW, infrared thermometers give
only information about surface temperature, fiber optic thermometers give the
temperature of material in strict contact with them and they are very fragile.
Furthermore the temperature is strictly connected to the MW absorber.3 A more
detailed discussion is reported in Section 5.5 in light of the experimental findings.
Thus temperature has not been chosen as descriptive parameter.
In a MAP experiment only the input MW power can be measured with high
(2)
(3)
(3)
(4)
(6)
(7)(8)
(5)
MWOven
(1)
(2)
(3)
(3)
(4)
(6)
(7)(8)
(5)
MWOven
(1)

4 - Microwave Pyrolysis system 63
precision. So MW power (P) may be a good descriptive parameter. Also feed
mass (M) is easily determined so the ratio P/M may be a good parameter which
represents the energy supplied to the feed. Anyway if both MW power and feed
mass are varied together during the test, especially in a batch system, also this
parameter may give misunderstanding informations.
A new parameter is introduced to overcome this difficulty, the ratio between
MW power and square feed mass: P/M2. The introduction of this parameter may
allow evaluating the influence of reflection and penetration depth of MW inside
the sample by working at fixed MW power and varying the feed mass.
4.3. Sample preparation and products collection
All samples were chopped to flakes of 2 × 2 cm and then dried at least for 24 h
before pyrolysis. No further preparations or pretreatments were made.
Liquids were collected in a flask, centrifuged at 2000 rpm for 10 min and then
filtered to evaluated and eliminate any particulate before any analysis. They were
stored at 277 K.
Chars were recovered from the reactor as brittle pieces, milled to a homogeneous
powder, separated from metal wires, if present, with a magnet, and stored in a
desiccator.
Gas were collected in a gasometer and analyzed straight after the end of each
experiment.

4 - Microwave Pyrolysis system64
Reference
1. Frediani, P.; Rosi, L.; Frediani, M.; Undri, A.; Occhialini, S. Production of Hydrocarbons from Copyrolysis of Plastic and Tyre Material with Microwave Heating. WO2012110990, 2012.2. Frediani, P.; Rosi, L.; Frediani, M.; Undri, A.; Occhialini, S.; Meini, S. Production of hydrocarbons from pyrolysis of tyres. WO2012110991, 2012.3. Farag, S.; Sobhy, A.; Akyel, C.; Doucet, J.; Chaouki, J., Temperature profile prediction within selected materials heated by microwaves at 2.45 GHz. Appl. Therm. Eng. 2012, 36, 360-369.

5. Waste Tire
MAP of tires was exploited and our main experimental findings have been
already published.1-3 In the next sections the data already reported are further
discussed and enhanced with new experimental findings.
MAP of tires was performed without the addition of any MW absorbing material
because carbon black is present in tire together with metal wires and they were
MW absorbing materials and they allow a fast heating of tire chips.
The progressive destructive effect of MW radiation on tire chips was reported in
Figure 5.1. After 40 s from MW irradiation the polymeric matrix in close contact with
the absorbing material was heated and quickly melted, then pyrolyzed. Gas was
formed inside the material, in close contact to the MW absorber, and shattered tire
chips. During pyrolysis carbon particles were suspended in the melted polymeric
matrix which was continuously pyrolyzed.
Figure 5.1. A tire chip after different irradiation time. (a) Tire chip not irradiated; (b) tire chip irradiated for 40 s; (c) tire chip irradiated for 90 s, it flakes if handled; (d) bulge effect of an irradiated tire chip, side view.
This pictorial representations show the progressive decomposition of tires to
carbon particles partially coated with polymeric matrix and finally carbon particles
alone, when all surrounding organic molecules were pyrolyzed. The presence of
residual polymer from not fully pyrolyzed matrix was evidenced by CHN and FTIR
(see Section 5.3). These results showed the possibility to pyrolyze whole tire
without any previous treatments.
d.a. b. c.

5 - Waste Tire66
5.1. Operating Parameters and Yields
Pyrolysis were investigated by varying four parameters: apparatus set-up, tire
brand, MW power (P) and tire chip mass (M). The experimental details together
with the yield of solid, liquid, and gas are reported in Table 5.1. The ratio between
microwave power (P) and tire mass square (M2) was chosen as a descriptive
parameter (Section 4.2).
In each experiment MW power was always kept constant and pyrolysis was
stopped when gas evolution was not further detectable. Pyrolysis was assumed
to be complete if organic materials were not detected in the residue analyzed via
FT-IR (Section 5.3.3), and hydrogen detected by ultimate analyses was lower
than 1 % (Section 5.3.1).
Pyrolysis entries are named “Tn” where “n” is an arbitrary ascending number for
each experiment.
Table 5.1. MAP of tire: influence of tire brand, and reaction parameters on the yields of products formed (metal wires not include in yield calculations).
Entry Set-upTire
BrandPower Tire P/M2 Time Solid Liquid Gas
(kW) (kW) (kW/kg2) (min) (wt%) (wt%) (wt%)
T1 A Tire M 6.0 208.8 137.6 14 41.1 31.5 27.4
T2 A Tire G 6.0 250.4 95.7 17 42.4 42.8 14.8
T3 A Tire M 4.8 212.8 106.0 15 40.6 43.1 16.3
T4 A Tire M 3.0 233.3 55.1 35 43.2 42.6 14.1
T5 A Tire G 3.0 250.9 47.7 38 44.6 38.8 16.6
T6 A Tire M 3.0 1501.1 1.3 70 50.7 39.3 9.0
T7 A Tire M 3.0 502.8 11.9 59 40.6 44.0 13.4
T8 A Tire M 3.0 64.1 730.1 47 47.5 30.1 22.4
T9 A Tire M 1.5 252.1 23.6 100 65.0 20.7 14.3
T10 B Tire M 6.0 242.6 101.9 22 46.2 27.8 26.0
T11 B Tire G 6.0 252.9 93.8 23 45.4 35.7 18.9
T13 B Tire M 3.0 243.0 50.8 36 46.6 27.6 25.8
T14 B Tire G 3.0 250.3 47.9 43 53.3 26.3 20.4
T15 B Tire G 6.0 500.5 24.0 35 49.7 37.0 13.3
T16 B Tire G 3.0 500.4 12.0 80 54.5 31.9 13.6
Entries T5 and T9 were the only two pyrolyses which showed noteworthy
presence of residual organic compounds into solid, thus they were accounted
as not-complete pyrolysis (see Section 5.3.1 and Section 5.3.3). Reducing P/M2
ratio below 10 × 10-3 W/g2 or using a MW power of 1.5 kW the pyrolysis was not
completed and some residual compounds remained into the solid. In entry T5,
a large mass of tire was used, the external part of the material was pyrolyzed
and the residual carbon might shield the deeper material from the MW radiation,

5 - Waste Tire 67
according to Bykov et al.4 Due to its low thermal conductivity, the inner part might
be partially heated and they were not-fully decomposed. In entry T9 a MW power
of 1.5 KW was high enough to keep the matrix molten but heat dispersion was
too high to provide the temperature required for completing pyrolysis. However a
complete pyrolysis could be achieved in these two experiments using a longer
time.
Decreasing P/M2 ratio a longer reaction time was necessary to pyrolyze
tire chips. Also using a fractionating system (set-up B) the pyrolysis time was
increased, because heavy substances were constrained for a longer time inside
the reactor (Section 5.3). Different tire brands gave only negligible differences
in pyrolysis time. This outcome suggested a close interaction between MW and
absorbing material present in different tires. However Russell et al. reported
different interaction between MW absorbing material and polymeric matrix by
varying the structure of MW absorber especially its surface area.5
Experiments using set-up A were initially ran to analyze the behavior of different
tire brands. A fast cracking of the polymeric matrix of tire M was performed (T1,
Table 5.1), and a high yield of gas was obtained. Pyrolysis performed with tire
G using the same P/M2 ratio of T1 gave a larger amount of liquid and a reduced
fraction of gas, while the amount of solid was almost the same. These results
suggested that tire M had a composition able to form more stable radicals than
those formed in the pyrolysis of tire G. These radical intermediates gave further
reactions giving higher amount of low molecular weight compounds. Furthermore
the two brands of tire contained the same amount of inorganic fillers because
showed almost the same solid yield.
Variation in P/M2 ratio deeply affected the yield of all the three products solid,
liquid, and gas. Its effects might be clarified by taking into account two parallel
phenomena: bond cleavage by pyrolysis or cross reaction between two radicals
or a radical and another compound. Bond cleavage gave low molecular weight
compounds through radical intermediates. These radicals may react with other
compounds through several ways: transfer of a hydrogen atom, functional group
migration (radical was transferred to other molecules), or coupling between
radicals to form condensation product. Several condensation reactions might form
large structure or even carbon network, so cocking occurred. Increasing radical
formation the pyrolysis was more effective. An efficient pyrolysis could trigger other
non-chemical effects such as transportation phenomena of inorganics and high
boiling compounds which could be found mixed with the liquid fraction (no gas
flow was employed). So far, aside from chemical composition of pyrolyzed tire, the
increase of P/M2 ratio promoted one or both of these effects.
Working with set-up A and reducing P/M2 (from 730.1 to 11.9 × 10⁻³ W/g2) the
liquid yield rose from 30.1 to 44.0 % for tire M; while changing P/M2 ratio (from

5 - Waste Tire68
95.7 to 47.7 × 10⁻³ W/g2) the yield decreased from 42.8 to 38.8 % for tire G. At the
same time solid and gas yields showed an opposite trend. The only exception
was for entry T1 which showed the highest gas yield. Probably the balance of
the condition employed was particularly favorable to gas formation. Using tire
M and high P/M2 values both gas formation and cocking were promoted. The
same behavior was evidenced for tire G at low P/M2. Degradation products were
easily formed from tire M, but they did not further react, meanwhile large amount
of degradation products were formed from tire G but they further reacted. The
pyrolysis time was increased by lowering P/M2 ratio as well as for cocking reaction
especially over 35 minutes.
Working with set-up B the following effects were noticed and attributed to the
presence of a fractionating system:
• Transportphenomenawerestronglylimitedorcompletelyavoided;
• Lowboilingcompoundswerealmosttheonlypresentintheliquidcollected,
meanwhile high boiling compounds were separated inside the fractionating system
and sent back into the reactor so they were further pyrolyzed (Figure 5.2).
• Theresidencetimeofhighboilingcompoundswasincreased(thethreshold
between low and high boiling compounds was still function of the P/M2 ratio and
it was hardly predictable);
• Unsaturatedsubstancesremainedforalongtimeathightemperature,gave
Diels-Alder condensation followed by further pyrolysis reactions as proposed by
Cunliffe and Williams.6
Figure 5.2. The fractionating system.
These hypotheses were supported by the findings reported in Table 5.1,
especially the yields data. A lower yield of liquid was obtained using set-up B than
set-up A. At the same time the yield of solid was increased while the amount of
gas was almost the same. Furthermore transportation phenomena were avoided
Low Boiling compunds
High Boiling compunds
Vapour Stream from Reactor

5 - Waste Tire 69
and clear and transparent liquids were collected. Solid microparticles were not
evidenced nor separated even after centrifugation at high speed for long time.
Set-up B reduced the influence of P/M2 ratio when tire M was used; the yields of
solid, liquid and gas in pyrolysis T10 and T12 were almost the same as well as
the properties of liquid products even if the P/M2 ratio was 101.9 and 50.8 × 10⁻³
W/g2 respectively. Tire G was more stable than tire M in the pyrolysis conditions
and a lower amount of gas was obtained. This behavior might be attributed to the
different composition of tire as above discussed and suggested by the different
pyrolysis behavior of different classes of polymers.7, 8
5.2. Gas Product
The gas was analyzed by GC-FID and GC-TCD: small organic molecules were
present such as methane, ethane, ethene, propene, C4 hydrocarbons and in low
amount isoprene. Also inorganic molecules, such as: hydrogen, hydrogen sulfide,
CO and CO2 were identified. Under our GC conditions it was not possible to
separate the mixture of C1 and C2 hydrocarbons; but we had no interest to do it
because it was not relevant for our purpose.
The hydrocarbons identified in gas are reported in Table 5.2 (coded “TnG” where
“n” is the pyrolysis entry).
Table 5.2. Main substances identified in gases.
Substances
Ent
ry
C1
+ C
2
Pro
pene
1-B
uten
e
2-B
uten
e-tr
ans
2-B
uten
e-ci
s
2-M
ethy
l-1-
bute
ne
n-P
enta
ne
Isop
rene
2-H
exen
e (c
is+
tran
s)
TOTA
L re
port
ed
HH
Va
(MJ/
Kg)
LHV
a (M
J/K
g)T1G 46.54 9.27 22.06 1.99 1.24 - 1.20 10.23 - 92.53 47 43
T2G 46.63 14.76 23.70 0.60 0.31 2.62 0.00 2.29 0.00 90.91 46 43
T3G 64.7 8.05 15.21 - 0.27 0.79 - 5.13 2.05 96.20 49 46
T4G 76.79 3.70 10.10 0.94 0.56 - 0.75 3.60 - 96.44 50 46
T5G 46.58 13.90 17.14 2.22 1.40 3.06 - 2.70 - 86.99 44 41
T6G 26.28 11.71 39.80 2.74 1.10 - 3.45 3.41 - 88.49 44 41
T7G 51.18 10.91 14.16 1.68 0.96 1.64 - 1.99 - 82.52 42 39
T8G 38.13 13.42 21.78 2.19 1.34 - 7.67 3.78 - 88.31 44 41
T9G 70.29 3.27 14.56 1.19 0.61 0.94 - 5.18 - 96.04 49 46
T10G 42.03 13.73 23.58 2.31 1.38 3.22 - 2.05 - 88.30 44 41
T11G 0.15 4.98 64.24 6.41 3.33 4.77 - 3.25 - 87.13 42 39
T12G 26.71 7.60 15.82 1.69 1.10 4.81 - 2.86 - 60.58 30 28
T13G 39.03 16.27 23.81 2.15 1.21 3.33 - 2.36 - 88.15 44 41
T14G 52.19 15.64 11.59 1.93 1.33 1.98 - 1.37 - 86.04 44 41
T15G 51.12 17.16 11.31 1.69 1.22 1.47 - 1.13 - 85.09 43 40
aHHV and LHV were calculated from gas composition and tabulated calorific value.9

5 - Waste Tire70
Working with set-up A and tire M (T4G and T9G) the highest value for C1 +
C2 and 1-butene together with the lowest amount for other hydrocarbons was
achieved. T9 was performed with the lowest MW power which promoted a slow
heating ensuing a feeble gas flow. C1 + C2 hydrocarbons were the main products.
In entry T4 working variables were balanced to promote an efficient pyrolysis,
indeed C1 + C2 hydrocarbons were the main compounds collected but the gas yield
was one of the lowest together with a high liquid yield. Tire G showed a different
behavior because the C1 + C2 amount was low and the other hydrocarbons were
increased. Probably it contained a large amount of polyisoprene which pyrolyzed
giving a wider number of low molecular weight compounds than other rubber
such as styrene-butadiene copolymers probably present in tire M.
Working with set-up B the gas yield increased with both tires. Surprisingly the
C1 + C2 mixture was reduced with respect to the one collected with set-up A even
if the residence time was improved. Probably C1 + C2 hydrocarbons were not
formed by further pyrolysis of high boiling compounds kept in the oven.
T9G was also analyzed with a GC-TCD for H2 quantification and a concentration
of 35.7% (vol %) was found. It was lower than the value reported by other authors10
for the gas mixture obtained by MW pyrolysis of tires but slightly higher than
the amount present in the thermal pyrolysis.11 Other inorganic substances were
identified in an amount lower than 1%, such as H2S, CO and CO2, but they were
not quantified.
5.3. Solid
The solid were odorless black powders, if fully pyrolyzed material was present.
Incompletely pyrolyzed residue was a sticky, hard to handle solid. Solids were
thoroughly characterized with several techniques and a detailed description is
reported in the following sections. These characterization were run because new
commercial applications for tire-derived char are of great interest12 and several
authors indicate the economic viability of tire pyrolysis on an industrial scale
depends on finding uses for this solid waste.13, 14 One of the most investigated
applications for tire-derived char is the production of activated carbons through
demineralization followed by physical or chemical activation,6. 14-16 however this
application need further research to reduce treatments costs.
5.3.1. Physical properties
The main physical properties of solids are reported in Table 5.3 (coded “TnS”
where “n” is the pyrolysis entry).

5 - Waste Tire 71
Table 5.3. Properties of chars obtained by MAP of tires.
a volatiles free basis; b performed on sample as collected; c by difference; d bulk density; e
sticky char, not analyzed.
En
try
Tir
e M
Tir
e G
T1S
T2S
T3S
T4S
T5S
T6S
T7S
T8S
T9S
T10
ST
11S
T12
ST
13S
T14
ST
15S
Set
-up
--
AA
AA
AA
AA
AB
BB
BB
B
Bra
nd-
-Ti
re M
Tire
GTi
re M
Tire
MTi
re G
Tire
MTi
re M
Tire
MTi
re M
Tire
MTi
re G
Tire
MTi
re G
Tire
GTi
re G
P/M
2 (1
03 W/g
2 )-
-13
7.6
95.7
106.
055
.147
.71.
311
.973
0.1
23.6
101.
993
.850
.847
.924
.012
.0
Cha
r yi
eld
(wt %
)-
-41
.142
.440
.643
.244
.650
.740
.647
.565
.046
.245
.446
.653
.349
.754
.5
Cha
r yi
elda
(wt %
)-
-40
.441
.07
46.8
41.5
42.8
47.7
n.d.
43.4
53.4
43.1
43.9
45.6
51.6
48.4
52.7
GC
V (
MJ/
Kg)
32±
332
±3
35±
429
±3
36±
433
±3
33±
334
±3
n.d.
n.d.
31±
333
±3
31±
329
±3
30±
330
±3
26±
3
LCV
(M
J/K
g)30
±3
30±
335
±4
29±
336
±4
33±
333
±3
34±
3n.
d.n.
d.30
±3
33±
331
±3
28±
330
±3
29±
326
±3
Cb
(wt %
)88
.19
87.4
889
.33
91.4
489
.99
89.0
191
.77
89.7
089
.25
92.0
388
.71
88.0
991
.33
90.5
192
.77
91.1
692
.75
Hb
(wt %
)7.
237.
520.
350.
380.
580.
830.
861.
610.
330.
533.
211.
000.
872.
550.
551.
381.
09
Nb
(wt %
)0.
230.
350.
150.
010.
010.
480.
010.
420.
800.
010.
330.
210.
010.
010.
010.
010.
41
Sb
(wt %
)1.
81.
72.
31.
61.
82.
01.
61.
61.
61.
61.
31.
51.
52.
41.
70.
72.
0
Oc (
wt %
)2.
552.
977.
876.
577.
637.
685.
766.
678.
025.
836.
459.
206.
294.
534.
976.
783.
75
S s
olid
/S fe
ed
(%)
--
52.5
39.9
40.6
48.0
42.0
45.1
36.1
42.2
46.9
38.5
40.1
62.1
53.3
20.5
64.1
Ash
(w
t %)
2.18
2.67
7.93
6.14
7.72
7.57
4.74
6.29
7.40
9.50
5.88
8.57
5.96
7.37
4.65
6.93
4.12
Vol
atile
s (w
t %
)-
-1.
773.
182.
953.
903.
935.
98n.
d.4.
6017
.90
6.70
3.19
2.25
3.14
2.79
3.32
Fix
ed c
arbo
n (w
t %)
--
89.3
090
.69
89.3
488
.53
91.3
387
.72
n.d.
85.9
076
.23
84.7
390
.86
90.3
892
.21
90.2
892
.56
App
aren
t D
ensi
ty
(g/m
L)1.
26d
1.14
0.40
10.
424
0.42
00.
492
0.40
70.
560
n.d.
0.52
6n.
d.e
0.48
604
480.
453
0.49
90.
489
0.51
9

5 - Waste Tire72
Only T6S and T9S were obtained from not-complete pyrolysis.
The calorific values were slightly higher than virgin tires, commercial pet coke,
and coal (except for anthracite coal which usually shows similar values).17 GCV
and LCV were very close among each char and they were in the same range if
standard deviations were taken into account. The GCV were higher than those
reported by other authors.9, 10
Residual hydrocarbons were always present in char but they slightly affected
LCV. They might be due to two different sources: absorbed compounds in the
pore structure of char which were not able to leave the reactor at the end of the
pyrolysis or residual polymeric matrix which was not fully-pyrolyzed. The presence
of residual volatiles in the char was a peculiarity of the experimental methodology
adopted because it was carried out in a batch process without a carrier gas. As a
consequence a slight amount of liquid remained always in the reactor, about 2 - 5
wt% for complete experiments for both tire brand performed with set-up A.
T9S could be regarded as the only char with a relevant amount of volatiles (17.9
wt %). However this amount was close to that one reported for a typical petroleum
coke, and lower than several coals.17
Working with set-up B the liquid returned back into the reactor and it was further
pyrolyzed increasing the amount of volatiles at the end of the pyrolysis, as shown
by T10S.
The ultimate analyses showed a sharp difference among pyrolysis run with
different conditions especially with different P/M2 ratio. Low hydrogen content
(below 1 wt%) was shown using a P/M2 higher than 47.7×10⁻³ W/g2 and even for
lower P/M2 ratio if a MW power over 3 kW was employed. Using these conditions
the amount of not pyrolyzed or absorbed compounds in the residue was reduced
independently of set-ups and tire brands. Carbon content was always in the range
of 89.33-92.03 wt % and it decreased if hydrogen increased.
The ultimate analysis of char reported by many authors seemed to be directly
correlated to different initial tire composition18, 19 especially for what concern the
carbon amount. It is worthy to be noted that the hydrogen content varied always
in the 1-3% range. Helleur et al.20 and Zabaniotou and Stavropoulos21 reported a
hydrogen content, respectively of 1.3% and 3.3% for standard heating pyrolysis.
I. de Marco Rodriguez et al.22 also reported, for standard heating pyrolysis using
an autoclave as a reactor, hydrogen content higher than 1% if pyrolysis was ran
below 673 K. Aylon et al.23 reported, for classical heating in a moving bed or in
a fixed bed reactor, a hydrogen content slightly lower than 1%. Hydrogen higher
than 1% in the char could be an indication of a not-fully pyrolyzed residue.
Sulfur seemed to be involved in various reactions, but only 50% of the initial
sulfur present in tires remained in the char in agreement with the data reported by
other authors for conventional heating pyrolysis.22, 24 Anyway the amount of sulfur
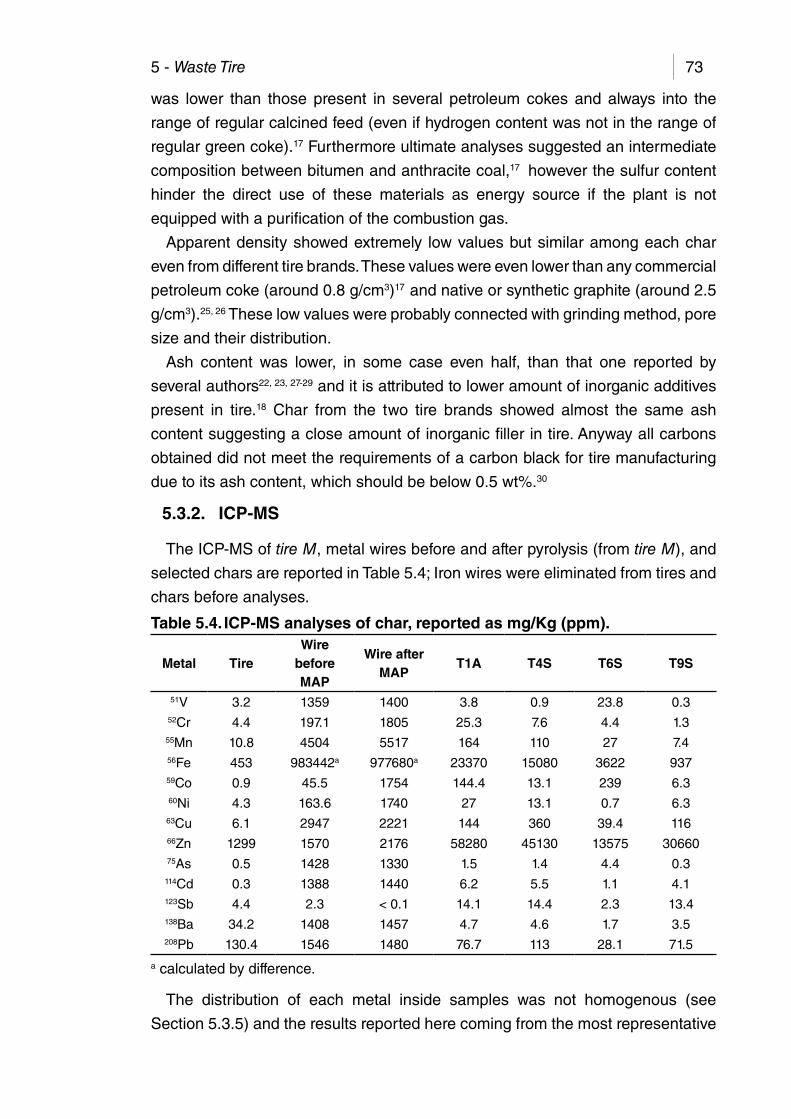
5 - Waste Tire 73
was lower than those present in several petroleum cokes and always into the
range of regular calcined feed (even if hydrogen content was not in the range of
regular green coke).17 Furthermore ultimate analyses suggested an intermediate
composition between bitumen and anthracite coal,17 however the sulfur content
hinder the direct use of these materials as energy source if the plant is not
equipped with a purification of the combustion gas.
Apparent density showed extremely low values but similar among each char
even from different tire brands. These values were even lower than any commercial
petroleum coke (around 0.8 g/cm3)17 and native or synthetic graphite (around 2.5
g/cm3).25, 26 These low values were probably connected with grinding method, pore
size and their distribution.
Ash content was lower, in some case even half, than that one reported by
several authors22, 23, 27-29 and it is attributed to lower amount of inorganic additives
present in tire.18 Char from the two tire brands showed almost the same ash
content suggesting a close amount of inorganic filler in tire. Anyway all carbons
obtained did not meet the requirements of a carbon black for tire manufacturing
due to its ash content, which should be below 0.5 wt%.30
5.3.2. ICP-MS
The ICP-MS of tire M, metal wires before and after pyrolysis (from tire M), and
selected chars are reported in Table 5.4; Iron wires were eliminated from tires and
chars before analyses.
Table 5.4. ICP-MS analyses of char, reported as mg/Kg (ppm).
Metal TireWire
before MAP
Wire after MAP
T1A T4S T6S T9S
51V 3.2 1359 1400 3.8 0.9 23.8 0.352Cr 4.4 197.1 1805 25.3 7.6 4.4 1.3
55Mn 10.8 4504 5517 164 110 27 7.456Fe 453 983442a 977680a 23370 15080 3622 93759Co 0.9 45.5 1754 144.4 13.1 239 6.360Ni 4.3 163.6 1740 27 13.1 0.7 6.3
63Cu 6.1 2947 2221 144 360 39.4 11666Zn 1299 1570 2176 58280 45130 13575 3066075As 0.5 1428 1330 1.5 1.4 4.4 0.3
114Cd 0.3 1388 1440 6.2 5.5 1.1 4.1123Sb 4.4 2.3 < 0.1 14.1 14.4 2.3 13.4138Ba 34.2 1408 1457 4.7 4.6 1.7 3.5208Pb 130.4 1546 1480 76.7 113 28.1 71.5
a calculated by difference.
The distribution of each metal inside samples was not homogenous (see
Section 5.3.5) and the results reported here coming from the most representative

5 - Waste Tire74
samples analyzed for each char. Fe and Zn were the most abundant metals in any
char. Fe was probably due to residue of metal wires present in virgin tires and it
was present in char as very small particles pasted with carbon and not attracted
by the magnet or they were non-ferromagnetic particles or included in some
crystalline phases of ZnS (Section 5.3.6). Zn compounds derived from ZnO used
as additive in tires formulation, and from brass coating of metal wires (see also
Section 5.3.5). Cu was leaked from brass coating of metal wire. Other metallic
elements were probably present in the carbon black or other additives used for
tire production, indeed their abundance was below the restrictive European limits
for commercial carbon blacks.17
5.3.3. FTIR
Infrared spectra were collected using two techniques: an attenuated total
reflectance (ATR) to evaluate the surface composition and a transmission sampling
technique (using KBr disk) to evaluate the presence of organic functional groups
in the bulk of char.
IR spectra of degassed samples did not showed any peaks distinguishable from
background. Therefore IR absorptions could be attributed to volatiles remained in
the reactor, as previously hypothesized (Section 5.3.1) or to volatiles that were
fully pyrolyzed in the course of heating at 623 K under a reduced pressure of 80
Pa for 5 h (degassing procedure).
Spectra from KBr disk showed very weak absorptions in each sample (Figure
5.3), with a maximum transmittance of 2.0 % and even if they were attributed with
uncertainty, suggested the presence of low amount of hydrocarbons.
ATR spectra were extremely noisy due to scattering phenomena and the
absence of absorbing substance on the surface except for T6S and T9S. These
latter chars showed significant peaks. Aliphatic and aromatic hydrocarbons were
present (Figure 5.3).

5 - Waste Tire 75
Figure 5.3. FTIR of T1S, T4S, T6S, and T9S.
Main frequencies identified in ATR spectra of T6S and T9S are listed as follow.
Frequencies of alkanes were found at: 2950 (s) (H2C-H asymmetric stretching),
2910 (s) (HC-H asymmetric stretching and C-H stretching), 1446 (m) and 1409
(w) (HC-H asymmetric bending), and 723 (m) (-(CH2)n- rocking) cm-1. Absorptions
of aromatic groups were present at: 1720 (s) (aromatic combination bands), 1343
(m), 1254 (m), 1246 (m), 1231 (m), 1128 (m), 1023 (m), 967 (m) (aromatic C-H
in-plane bending), 871 (w) (aromatic C-H out-of plane bending) cm-1.
5.3.4. BET Surface area
The surface area and pore volume of collected and degassed samples are
reported in Table 5.5.
Table 5.5. BET surface areas their pore volume and its distribution of collected and degassed char samples.
Entry T1S T4S T6S T9SP/M2(103W/g2) 137.6 55.1 1.3 23.6
BET surface area, collected sample (m2/g) 49 46.9 26.8 10.9
BET surface area, degassed sample (m2/g) 65.3 65.0 45.0 32.6
D BET (m2/g) 16.3 18.1 18.2 21.7
VT (cm3/g) 0.82 1.67 0.38 0.35
BJH PVD Macropore (%) n.d. n.d. 17.85 39.59
BJH PVD Mesopore (%) n.d. n.d. 82.15 60.41
BJH PSD Macropore (%) n.d. n.d. 9.33 25.02
BJH PSD Mesopore (%) n.d. n.d. 90.67 74.98
BET surface area of degassed char from complete pyrolysis was 65 m2/g and
T1S T4S
T6S T9S
5 - Waste Tire76
it seemed to be independent from P/M2 ratio (see entry T1S and T4S). However
if the sample contained volatiles, the surface area was reduced as expected. T6S
showed lower values than T1S and T4S but higher than T9S, probably due to the
presence of lower amount of volatiles. The lower values of BET area for degassed
T6S and T9S could be a hint for the presence of heavy compounds which were
not removed during the degassing procedure at 623 K and reduced pressure.
They remained in the pore structure.
The presence of volatiles or high molecular weight compounds influenced also
the porous structure of samples. T6S and T9S showed similar total pore volume
(VT), 0.35 and 0.38 cm3/g respectively; meanwhile T1S and T4S showed higher
values (0.82-1.67 cm3/g), surprisingly higher than those reported by López et
al. (among 0.3-0.5 cm3/g).12 Probably the carbon black employed in the two tire
productions was different.
Microporosity BJH measurements were not detected due to limit of our
instrument. However T1S and T4S probably showed a micropore structure with
strongly trapped compounds preventing the evaluation. On the contrary T6S and
T9S showed a mesopore structure (between 2 and 50 nm) which included the
most pore volume and area.
5.3.5. Scanning electron microscopy
In Figure 5.4 SEM image of a tire M before pyrolysis and three images of char
T1S and T9S, are reported.
No significant morphological variation was evidenced among each char
obtained at different P/M2 in a complete pyrolysis. Apparently MW neither modified
the carbon black used as filler in tire nor noticeably affected the morphology of
char (Figure 5.4c). The less magnified image (Figure 5.4b) show a macropore
structure of T1S which was left after pyrolysis of the polymeric matrix. Meanwhile
in T6S the macropore structure could not be observed (Figure 5.4d) because
residual polymeric matrix and other organic substance filled it. Visual structure
seemed to be similar to the one observe for not pyrolyzed tire (Figure 5.4a).
Back scattering images of char S1 showed a granular structure, with grain
diameters in the range 2-50 mm. Bright spots and large dark areas were present.
Different color areas and spots were investigated by X-EDS microanalysis. In
Figure 5.5 a spread view of T1S back scattering image and X-EDS spectra of
bright, gray and dark spots are reported. All bright spots showed close composition
as well as for spots of different colors.

5 - Waste Tire 77
Figure 5.4. SEM images of: (a) tire M: magnification 4000 times; (b) T1S: magnification 500 times; (c) T1S: magnification 4000 times; (d) T9S: magnification 400 times.
Elements identified by microanalysis were those present in large amount in
Table 5.4, together with Mg, Si, O, S and C. Sulfur was the main element, after C.
Few differences between SEM X-EDS and ICP analyses are due to C, S and Si
that were not examined by ICP and to Mg which was present only in low amount
in the bright spot. These differences might be attributed to different sampling of the
two analytical method, ICP was performed on the bulk of the char while X-EDS
on spots of the micro-samples. Areas with different brightness were correlated to
a different distribution of metals inside each sample (images with back scattered
electrons, showed brighter areas in the presence of heavier elements): indeed the
microanalysis reported for bright spots showed higher amounts of metals (Fe, Zn,
Co, Cr, Cu, Si and Mg) than dark spots. The oxygen was probably due to inorganic
compounds such as ZnO or silicates.

5 - Waste Tire78
Figure 5.5. SEM back scattering image of S1. The microanalyses are referred to spots identified with the same shape in the SEM image.
On the contrary Ucar et al.28 reported a homogenous distribution of particles
over the sample surface and difference may be attributable to a different pyrolysis
procedure and conditions.
Further consideration could be done on metal wires in consideration of their SEM
images before and after pyrolysis together with the corresponding microanalyses
(Figure 5.6).
The metal wire before pyrolysis showed a compact coating (Figure 5.6a) where
the polymeric matrix was tight linked (Figure 5.6a black area in the low part of
the wire). The microanalysis showed the presence of Cu and Zn (Figure 5.6c),
suggesting the presence of a brass alloy. This presence was not surprising
because brass is often employed to promote polymer adhesion on metal surface.
The coating after pyrolysis (Figure 5.6b) showed a cracked surface while compact
materials were present in the deep layers. The cracked surface was easily
removed (Figure 5.6b) by a mild bending of the wire. On the cracked surface were
present sulfur, Fe, Zn, and Cu (Figure 5.6d). The relative amount of Cu on the
wire after pyrolysis was reduced, suggesting that Cu found in the char by ICP-
MS analysis came from brass coating. Furthermore the sulfur compounds of tire
probably reacted with Fe and Cu to give amorphous compounds not evidenced by
XRD together with crystalline ZnS. The compact surface below the cracked layer
showed iron as the sole metal (Figure 5.6d).

5 - Waste Tire 79
Figure 5.6. SEM images and microanalysis of metal wires. (a) metal wire before pyrolysis; (b) metal wire after pyrolysis; (c) microanalysis of metal wire before pyrolysis; (d) microanalysis of metal wire after pyrolysis, cracked coating; (e) microanalysis of metal wire after pyrolysis, inner surface.
Other metals were not detected except for Fe, that is the inner part of steel
wires. Sulfur was also found in this layer but in minor amount with respect to
the external surface, suggesting its migration from the rubber, through the brass,
to wire during pyrolysis. These finding suggested that also metal wires were
modified during MAP, brass coating was transformed and Cu was partially leaked.
Furthermore the sulfur compounds partially reacted with the brass coating and
ZnO filler forming ZnS which was present in char.
5.3.6. X-ray diffraction
X ray patterns of sample T1S, T4S and T9S were very close and they can be
fully overlapped except for the different intensity of the broad peak centered at
25° (Figure 5.7). This peak was attributed to amorphous carbon in agreement with
SEM morphological analyses (Section 5.3.5). T9S showed the highest intensity
due to the high amount of residual not-pyrolyzed matrix and absorbed compounds
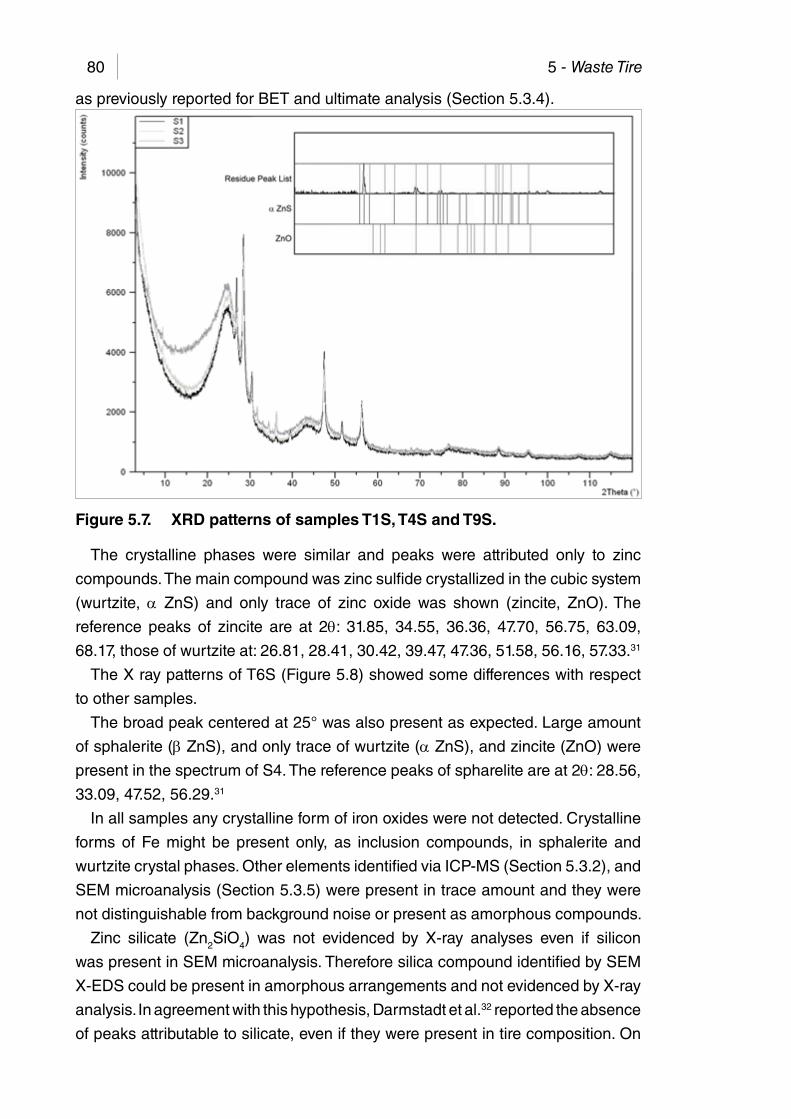
5 - Waste Tire80
as previously reported for BET and ultimate analysis (Section 5.3.4).
Figure 5.7. XRD patterns of samples T1S, T4S and T9S.
The crystalline phases were similar and peaks were attributed only to zinc
compounds. The main compound was zinc sulfide crystallized in the cubic system
(wurtzite, a ZnS) and only trace of zinc oxide was shown (zincite, ZnO). The
reference peaks of zincite are at 2q: 31.85, 34.55, 36.36, 47.70, 56.75, 63.09,
68.17, those of wurtzite at: 26.81, 28.41, 30.42, 39.47, 47.36, 51.58, 56.16, 57.33.31
The X ray patterns of T6S (Figure 5.8) showed some differences with respect
to other samples.
The broad peak centered at 25° was also present as expected. Large amount
of sphalerite (β ZnS), and only trace of wurtzite (a ZnS), and zincite (ZnO) were
present in the spectrum of S4. The reference peaks of spharelite are at 2q: 28.56,
33.09, 47.52, 56.29.31
In all samples any crystalline form of iron oxides were not detected. Crystalline
forms of Fe might be present only, as inclusion compounds, in sphalerite and
wurtzite crystal phases. Other elements identified via ICP-MS (Section 5.3.2), and
SEM microanalysis (Section 5.3.5) were present in trace amount and they were
not distinguishable from background noise or present as amorphous compounds.
Zinc silicate (Zn2SiO4) was not evidenced by X-ray analyses even if silicon
was present in SEM microanalysis. Therefore silica compound identified by SEM
X-EDS could be present in amorphous arrangements and not evidenced by X-ray
analysis. In agreement with this hypothesis, Darmstadt et al.32 reported the absence
of peaks attributable to silicate, even if they were present in tire composition. On
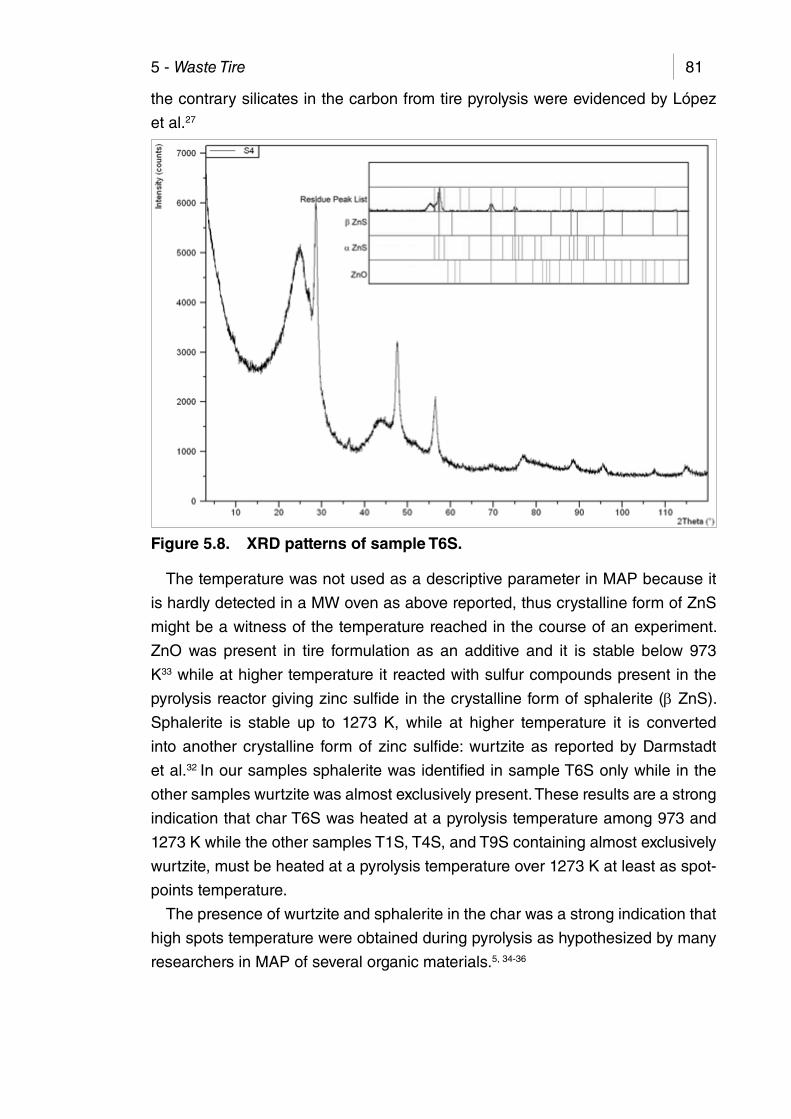
5 - Waste Tire 81
the contrary silicates in the carbon from tire pyrolysis were evidenced by López
et al.27
Figure 5.8. XRD patterns of sample T6S.
The temperature was not used as a descriptive parameter in MAP because it
is hardly detected in a MW oven as above reported, thus crystalline form of ZnS
might be a witness of the temperature reached in the course of an experiment.
ZnO was present in tire formulation as an additive and it is stable below 973
K33 while at higher temperature it reacted with sulfur compounds present in the
pyrolysis reactor giving zinc sulfide in the crystalline form of sphalerite (β ZnS).
Sphalerite is stable up to 1273 K, while at higher temperature it is converted
into another crystalline form of zinc sulfide: wurtzite as reported by Darmstadt
et al.32 In our samples sphalerite was identified in sample T6S only while in the
other samples wurtzite was almost exclusively present. These results are a strong
indication that char T6S was heated at a pyrolysis temperature among 973 and
1273 K while the other samples T1S, T4S, and T9S containing almost exclusively
wurtzite, must be heated at a pyrolysis temperature over 1273 K at least as spot-
points temperature.
The presence of wurtzite and sphalerite in the char was a strong indication that
high spots temperature were obtained during pyrolysis as hypothesized by many
researchers in MAP of several organic materials.5, 34-36

5 - Waste Tire82
5.3.7. Main achievements
Char obtained from MAP of waste tires showed chemical and physical
characteristics slightly influenced by pyrolysis parameters and, mainly, by residual
substances present.
BET surface areas, pore dimensions and distribution were influenced by the
amount of absorbed compounds. Surface areas were increased by degassing
the samples analyzed.
Metals were identified via ICP-MS and X-EDS analysis and they were presumably
present in carbon black or other fillers employed for tire manufacturing and due
to metal leaching from metal wires (especially for Cu and Zn compounds). In
fact metal wires coating were almost completely destroyed and Fe, Cu and Zn
compounds were released in char. These metals reacted with sulfur compounds
present in tires giving sulfides and reducing the amount of sulfur compounds in
liquid and gas.
XRD spectra of char gave relevant informations concerning crystalline ZnS
phases sphalerite (β ZnS), and wurtzite (a ZnS). The presence of the crystalline
wurtzite phase, stable over 1273 K, confirms that a high temperature was reached
in MAP of tires when a P/M2 ratio of 25.0×10⁻³ W/g2 or higher was used. Char
obtained using a lower P/M2 ratio (1.3×10⁻³ W/g2) showed sphalerite as the
alone crystalline form of ZnS present and it was a witness of a lower pyrolysis
temperature (700-1273 K).
Characteristics of carbon obtained from MAP were intermediate between
anthracite and bitumen. The sulfur content was almost 50 % of that one present
in waste tire. Anyway char showed relatively high content of sulfur and ash which
hindered some direct uses. These characteristics allowed them to be employed as
starting material for active carbon synthesis if a low expensive demineralization
process is realized. Carbon characteristics precluded also its direct use in tire
manufacturing because a preliminary process to reduce undesired component is
required, or it might be usesed if different grades of carbon black were accepted.
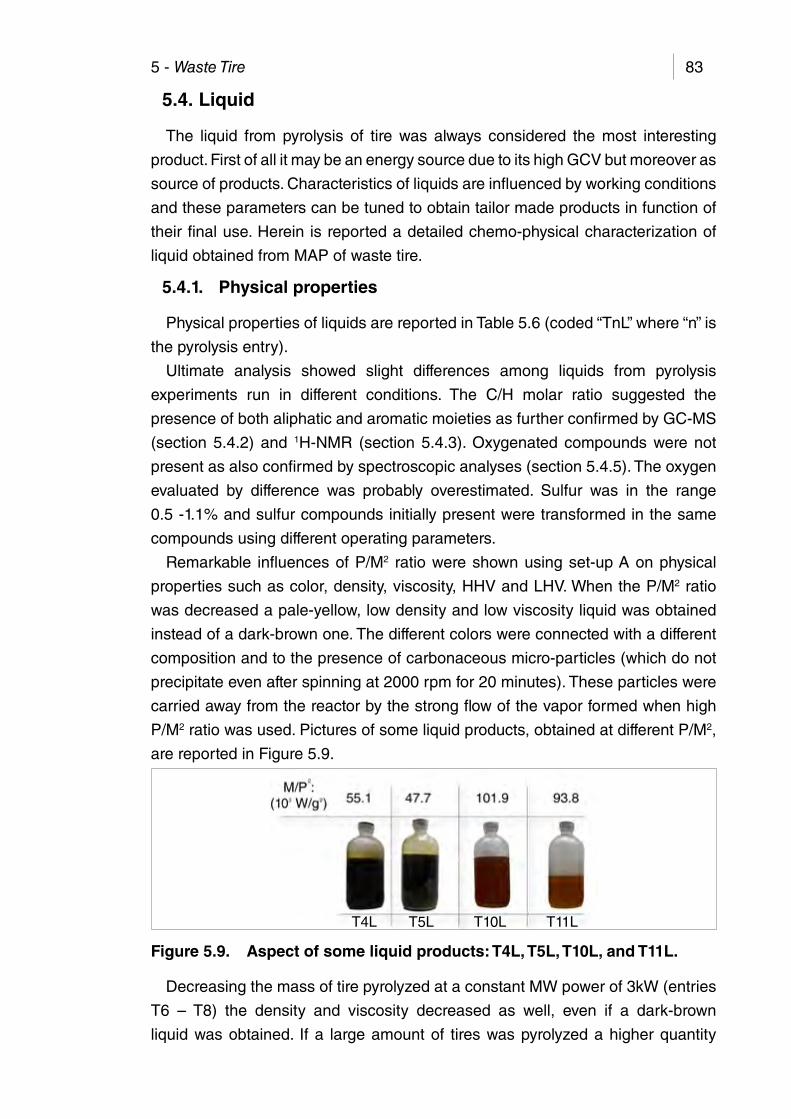
5 - Waste Tire 83
5.4. Liquid
The liquid from pyrolysis of tire was always considered the most interesting
product. First of all it may be an energy source due to its high GCV but moreover as
source of products. Characteristics of liquids are influenced by working conditions
and these parameters can be tuned to obtain tailor made products in function of
their final use. Herein is reported a detailed chemo-physical characterization of
liquid obtained from MAP of waste tire.
5.4.1. Physical properties
Physical properties of liquids are reported in Table 5.6 (coded “TnL” where “n” is
the pyrolysis entry).
Ultimate analysis showed slight differences among liquids from pyrolysis
experiments run in different conditions. The C/H molar ratio suggested the
presence of both aliphatic and aromatic moieties as further confirmed by GC-MS
(section 5.4.2) and 1H-NMR (section 5.4.3). Oxygenated compounds were not
present as also confirmed by spectroscopic analyses (section 5.4.5). The oxygen
evaluated by difference was probably overestimated. Sulfur was in the range
0.5 -1.1% and sulfur compounds initially present were transformed in the same
compounds using different operating parameters.
Remarkable influences of P/M2 ratio were shown using set-up A on physical
properties such as color, density, viscosity, HHV and LHV. When the P/M2 ratio
was decreased a pale-yellow, low density and low viscosity liquid was obtained
instead of a dark-brown one. The different colors were connected with a different
composition and to the presence of carbonaceous micro-particles (which do not
precipitate even after spinning at 2000 rpm for 20 minutes). These particles were
carried away from the reactor by the strong flow of the vapor formed when high
P/M2 ratio was used. Pictures of some liquid products, obtained at different P/M2,
are reported in Figure 5.9.
Figure 5.9. Aspect of some liquid products: T4L, T5L, T10L, and T11L.
Decreasing the mass of tire pyrolyzed at a constant MW power of 3kW (entries
T6 – T8) the density and viscosity decreased as well, even if a dark-brown
liquid was obtained. If a large amount of tires was pyrolyzed a higher quantity
T4L T5L T10L T11L

5 - Waste Tire84
of vapors was produced ensuing a fast stripping of products from the oven, that
is a reduction of the residence time of the gas in the reactor. As a consequence
the vapor was heated for a short time and the overall cracking effectiveness was
partially reduced giving a liquid with a high density and viscosity (for comparison
see T4L and T7L).
Table 5.6. Characteristic of liquid obtained by MAP of tire.
En
try
T1L
T2L
T3L
T4L
T5L
T6L
T7L
T8L
T9L
T10
LT
11L
T12
LT
13L
T14
LT
15L
Set
-up
AA
AA
AA
AA
AB
BB
BB
B
Bra
ndT
ire
MT
ire
GT
ire
MT
ire
MT
ire
GT
ire
MT
ire
MT
ire
MT
ire
MT
ire
MT
ire
GT
ire
MT
ire
GT
ire
GT
ire
G
P/M
2 (1
03 W/g
2 )13
7.6
95.7
106.
055
.147
.71.
311
.973
0.1
23.6
101.
993
.850
.847
.924
.012
.0
Liqu
id y
ield
(w
t %)
31.5
42.8
43.1
42.6
38.8
39.3
44.0
30.1
20.7
27.8
35.7
27.6
26.3
3731
.9
HH
V(M
J/K
g)47
±5
37±
448
±5
44±
436
±4
43±
443
±4
n.d.
43±
445
±5
n.d.
42±
441
±4
40±
440
±4
LHV
(MJ/
Kg)
45±
435
±4
46±
542
±4
34±
441
±4
40±
4n.
d.40
±4
43±
4n.
d.40
±4
39±
438
±4
38±
4
C (
wt %
)87
.72
87.4
385
.78
86.8
786
.84
87.4
187
.68
84.7
787
.35
86.2
784
.98
87.1
486
.20
86.5
685
.76
H (
wt %
)11
.31
9.85
11.0
110
.12
10.9
710
.77
10.8
410
.78
11.8
38.
539.
309.
339.
2710
.72
10.1
7
N (
wt %
)0.
230.
490.
290.
660.
760.
390.
150.
340.
020.
280.
640.
330.
510.
400.
47
S (
wt %
)0.
71.
11.
00.
90.
80.
80.
8n.
d.0.
80.
70n.
d.0.
800.
500.
700.
80
Oa
(wt %
)0.
041.
131.
921.
450.
630.
630.
534.
110.
004.
225.
082.
403.
521.
622.
80
C/H
mol
ar r
atio
0.65
0.74
0.65
0.72
0.66
0.68
0.68
0.66
0.62
0.84
0.76
0.78
0.77
0.67
0.7
Vis
cosi
ty (
cP)
2.58
3.92
2.44
1.73
2.56
2.36
2.88
n.d.
0.73
0.90
1.25
1.00
0.73
1.34
0.89
Den
sity
(g/
cm3 )
0.90
00.
921
0.88
90.
874
0.90
70.
890
0.90
00.
907
0.81
60.
864
0.87
70.
858
0.83
80.
866
0.84
4
a b
y di
ffere
nce.
5 - Waste Tire 85
Furthermore the volume of the reactor played a role: If a 1000 mL vessel was
used (T7L) instead of a large vessel of 5000 mL (T6L) the vapors remained in the
oven for a shorter time and their cracking was partially reduced. In fact the liquid
T7L has the highest viscosity among those obtained from tire M.
Moreover high P/M2 ratio and strong flow of gases from the reactor were
linked with two others outcomes that influenced the physical properties: a) deep
cracking to volatile substances and b) pushing some molecules with relatively
high molecular weight outside the oven.
Otherwise, if set-up B was used the influence of the P/M2 ratio was negligible,
liquids showed almost the same pale-yellow color, viscosity, density, and no
remarkable physical differences were highlighted. The fractionating system
prevented that high boiling substances, and particles to be pushed away. This
set-up deeply affected the physical properties of liquid.
However it must keep in mind that all the liquid showed a viscosity lower than
any crude oil and almost any commercial fuel oil.9
Using set-up A a direct correlation between P/M2 ratio and calorific data (HHV
and LHV) were found for liquid from tire M and lower values of HHV were found
with tire G. If set-up B was used closer values of HHV were found independently
of tire brand and P/M2 ratio.
5.4.2. GC/MS
All liquids contained more than 300 different compounds (Table 5.8 and Figure
5.11) and an almost complete identification via GC/MS analysis was performed and
reported in Table 5.7. Composition of liquid was evaluated by their chromatographic
area without any response factors correction. They were identified using the
NIST mass spectral library and reference compounds. Most of these compounds
were present in amount lower than 1%. Toluene and limonene were the main
compounds identified in each liquid even from different tire brands. The 15 main
substances identified in liquid are reported in Table 5.8., they represent up to
46.08 % for T8L.
Several factors play a role on the formation of compounds: a) the P/M2 ratio
affected both the rate of heating and consequently the temperature reached by
the sample, the rate of cracking, and the amount of vapor formed; b) the free
volume of the reactor alongside the apparatus set-up influenced the residence
time of products inside the reactor; c) the temperature reached by the absorber
affected the qualitative and quantitative composition of liquids; d) the polymeric
composition of tire. As a consequence a correlation between P/M2, and other
variables, with the amount of each compounds was not easily predictable.
Oxygenated compounds were not incontrovertible identified.

5 - Waste Tire86
Set
-up
AA
AA
AA
AA
BB
BB
BB
Bra
ndT
ire
MT
ire
GT
ire
MT
ire
GT
ire
MT
ire
MT
ire
MT
ire
MT
ire
MT
ire
GT
ire
MT
ire
GT
ire
GT
ire
G
P/M
2 (1
03W
/g2)
137.
695
.755
.147
.71.
311
.973
0.1
23.6
101.
993
.850
.847
.924
.012
.0
n°T
ime
Sub
stan
cea.
c.*
112
.02-
bute
ne-t
rans
C1.
70.
31.
50.
41.
21.
21.
11.
10.
82.
11.
10.
20.
71.
7
212
.2bu
tane
C0.
40.
10.
20.
00.
10.
10.
20.
20.
10.
20.
00.
1
312
.61-
bute
neC
0.3
0.1
0.2
0.1
0.1
0.1
0.2
0.2
0.1
0.2
0.1
0.1
413
.52-
met
hyl-1
-but
ene
C0.
20.
10.
20.
10.
10.
10.
20.
20.
20.
10.
1
514
.12-
met
hylb
utan
eC
0.1
0.1
0.2
0.1
0.1
0.2
0.1
0.2
0.0
0.2
0.1
0.1
0.1
614
.81-
pent
ene
C0.
20.
10.
30.
10.
10.
10.
10.
40.
10.
40.
10.
10.
10.
2
715
.02-
pent
ene-
tran
sC
0.8
0.1
0.6
0.1
0.3
0.4
0.5
0.7
0.2
0.6
0.3
0.2
0.1
0.3
815
.3pe
ntan
eC
0.1
0.1
0.3
0.1
0.2
0.1
0.1
0.4
0.1
0.3
0.1
0.1
0.1
0.3
915
.52-
met
hyl-1
,3-b
utad
iene
C3.
20.
41.
70.
40.
91.
33.
61.
50.
52.
20.
60.
40.
50.
9
1015
.62-
pent
ene-
cis
C0.
20.
10.
20.
10.
10.
10.
20.
30.
10.
40.
20.
10.
10.
3
1116
.33-
met
hyl-1
-hex
ene
C2.
10.
31.
60.
41.
01.
11.
81.
40.
51.
90.
70.
50.
41.
0
1216
.41.
4-pe
ntad
iene
P0.
40.
10.
20.
10.
10.
10.
30.
30.
10.
40.
20.
10.
1
1317
.1cy
clop
enta
dien
eP
0.5
0.1
0.3
0.1
0.1
0.1
0.5
0.3
0.1
0.6
0.3
0.1
0.2
1418
.54-
met
hyl-1
-pen
tene
P0.
30.
10.
20.
10.
10.
10.
20.
30.
10.
30.
10.
10.
1
1518
.63-
met
hyl-1
-pen
tene
P0.
10.
10.
10.
10.
10.
10.
00.
10.
1
1619
.62-
met
hylp
enta
neP
0.2
0.4
0.3
0.2
0.2
0.6
0.1
0.1
0.2
1721
.12-
met
hyl-1
-pen
tene
P0.
10.
10.
10.
20.
10.
10.
40.
70.
60.
20.
30.
3
1821
.21-
hexe
neC
0.3
0.4
0.2
0.2
0.2
0.2
0.0
1922
.1he
xane
C0.
00.
00.
10.
20.
10.
10.
40.
10.
10.
10.
2
2022
.33-
hexe
ne-c
isP
0.0
0.1
0.6
0.0
0.1
2122
.63-
hexe
ne-t
rans
P0.
10.
00.
10.
10.
10.
0
2222
.82.
3-di
met
hyl-1
-but
ene
P0.
20.
30.
10.
20.
20.
20.
50.
10.
10.
10.
1
(continue)
Tab
le 5
.7. C
om
po
un
ds
iden
tifi
ed in
liq
uid
s.

5 - Waste Tire 87
2323
.13-
met
hyl-2
-pen
tene
P0.
30.
40.
10.
20.
20.
20.
60.
10.
10.
10.
0
2424
.02-
met
hyl-2
-pen
tene
P0.
40.
50.
10.
30.
30.
30.
70.
10.
10.
1
2524
.7m
ethy
lcyc
lope
ntan
eP
0.1
0.2
0.0
0.2
0.1
0.6
0.3
0.1
0.1
2625
.02,
4-di
met
hylp
enta
neP
0.1
0.2
0.2
0.1
0.3
0.0
0.0
0.0
2725
.22-
met
hyl-1
.3-p
enta
dien
eP
0.3
0.2
0.1
0.1
0.3
0.4
0.1
0.1
0.0
2825
.31,
3-cy
cloh
exad
iene
P0.
40.
40.
20.
20.
70.
60.
20.
20.
10.
10.
1
2925
.51,
3-he
xadi
ene
P0.
30.
30.
10.
20.
30.
40.
10.
0
3025
.71,
4-cy
cloh
exad
iene
P0.
30.
30.
10.
20.
60.
50.
20.
20.
10.
0
3126
.11,
4-he
xadi
ene
P0.
20.
10.
10.
10.
20.
20.
00.
0
3226
.72-
met
hyl-1
-hex
ene
P0.
40.
10.
10.
20.
40.
00.
10.
0
3326
.93-
met
hylc
yclo
pent
ene
P0.
60.
00.
40.
30.
30.
60.
20.
20.
10.
10.
2
3427
.0be
nzen
eC
4.0
0.1
1.8
0.1
0.9
1.2
5.7
2.8
1.5
0.7
0.8
0.1
0.3
0.2
3527
.43,
4-di
met
hyl-2
-pen
tene
P0.
30.
40.
30.
30.
20.
70.
20.
10.
1
3628
.12,
4-dy
met
hyl-2
-pen
tene
P0.
40.
20.
10.
10.
40.
30.
10.
0
3728
.44-
met
hyl-1
-hex
ene
P0.
10.
10.
10.
2
3829
.5cy
cloh
exen
eP
0.3
0.3
0.3
0.2
0.2
0.5
0.1
0.1
3930
.91-
hept
ene
C0.
20.
30.
20.
20.
30.
70.
20.
20.
10.
10.
10.
2
4031
.02,
2,4-
trim
ethy
lpen
tane
P0.
10.
20.
20.
10.
10.
30.
10.
10.
1
4132
.02,
4-di
met
hyl-1
,3-p
enta
dien
eP
0.6
0.6
0.0
0.4
0.4
0.4
1.8
0.2
0.2
0.2
0.1
0.1
0.1
4232
.1H
epta
neC
0.1
0.3
0.2
0.1
0.1
0.1
0.1
0.1
0.1
0.2
4332
.32-
met
hyl-2
-hex
ene
P0.
10.
10.
10.
10.
10.
30.
10.
00.
0
4433
.25,
5-di
met
hyl-2
-hex
ene
P0.
50.
70.
00.
60.
50.
41.
20.
30.
20.
20.
10.
10.
2
4533
.93-
ethy
lcyc
lope
nten
eP
0.1
0.1
0.1
0.2
0.1
0.0
4634
.34-
met
hyl-2
-pen
tano
neP
0.3
0.5
0.0
0.5
0.4
0.1
1.0
0.1
0.1
0.1
0.2
4734
.92,
3,4-
trim
ethy
l-2-p
ente
neP
0.3
0.3
0.3
0.2
0.2
0.6
0.0
0.1
0.1
0.1
4835
.4et
hylc
yclo
pent
ane
P0.
10.
10.
10.
10.
10.
20.
20.
00.
0
4935
.61-
met
hyl-1
,3-c
yclo
esad
iene
P0.
40.
60.
00.
30.
40.
61.
10.
10.
20.
20.
10.
1
5035
.91-
met
hyl-1
,4-c
yclo
esad
iene
P0.
10.
10.
10.
10.
30.
10.
00.
0
(continue)
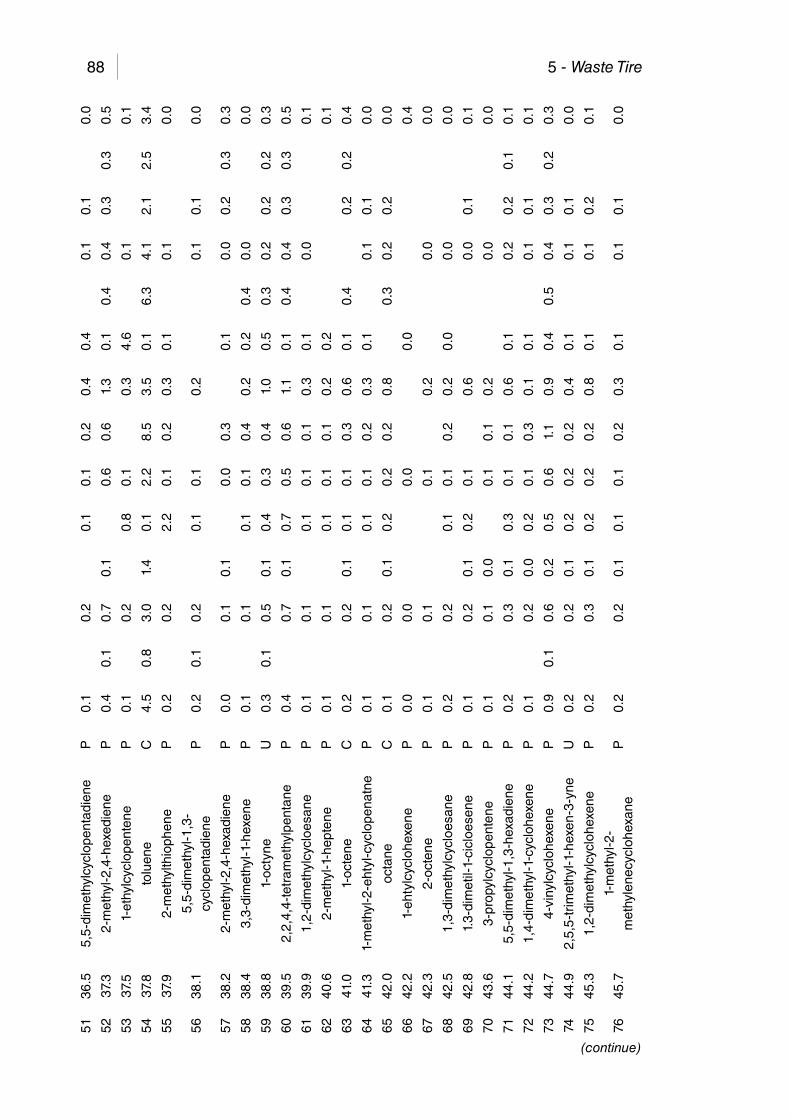
5 - Waste Tire8851
36.5
5,5-
dim
ethy
lcyc
lope
ntad
iene
P0.
10.
20.
10.
10.
20.
40.
40.
10.
10.
0
5237
.32-
met
hyl-2
,4-h
exed
iene
P0.
40.
10.
70.
10.
60.
61.
30.
10.
40.
40.
30.
30.
5
5337
.51-
ethy
lcyc
lope
nten
eP
0.1
0.2
0.8
0.1
0.3
4.6
0.1
0.1
5437
.8to
luen
eC
4.5
0.8
3.0
1.4
0.1
2.2
8.5
3.5
0.1
6.3
4.1
2.1
2.5
3.4
5537
.92-
met
hylth
ioph
ene
P0.
20.
22.
20.
10.
20.
30.
10.
10.
0
5638
.15,
5-di
met
hyl-1
,3-
cycl
open
tadi
ene
P0.
20.
10.
20.
10.
10.
20.
10.
10.
0
5738
.22-
met
hyl-2
,4-h
exad
iene
P0.
00.
10.
10.
00.
30.
10.
00.
20.
30.
3
5838
.43,
3-di
met
hyl-1
-hex
ene
P0.
10.
10.
10.
10.
40.
20.
20.
40.
00.
0
5938
.81-
octy
neU
0.3
0.1
0.5
0.1
0.4
0.3
0.4
1.0
0.5
0.3
0.2
0.2
0.2
0.3
6039
.52,
2,4,
4-te
tram
ethy
lpen
tane
P0.
40.
70.
10.
70.
50.
61.
10.
10.
40.
40.
30.
30.
5
6139
.91,
2-di
met
hylc
yclo
esan
eP
0.1
0.1
0.1
0.1
0.1
0.3
0.1
0.0
0.1
6240
.62-
met
hyl-1
-hep
tene
P0.
10.
10.
10.
10.
10.
20.
20.
1
6341
.01-
octe
neC
0.2
0.2
0.1
0.1
0.1
0.3
0.6
0.1
0.4
0.2
0.2
0.4
6441
.31-
met
hyl-2
-eht
yl-c
yclo
pena
tne
P0.
10.
10.
10.
10.
20.
30.
10.
10.
10.
0
6542
.0oc
tane
C0.
10.
20.
10.
20.
20.
20.
80.
30.
20.
20.
0
6642
.21-
ehty
lcyc
lohe
xene
P0.
00.
00.
00.
00.
4
6742
.32-
octe
neP
0.1
0.1
0.1
0.2
0.0
0.0
6842
.51,
3-di
met
hylc
yclo
esan
eP
0.2
0.2
0.1
0.1
0.2
0.2
0.0
0.0
0.0
6942
.81.
3-di
met
il-1-
cicl
oese
neP
0.1
0.2
0.1
0.2
0.1
0.6
0.0
0.1
0.1
7043
.63-
prop
ylcy
clop
ente
neP
0.1
0.1
0.0
0.1
0.1
0.2
0.0
0.0
7144
.15,
5-di
met
hyl-1
,3-h
exad
iene
P0.
20.
30.
10.
30.
10.
10.
60.
10.
20.
20.
10.
1
7244
.21,
4-di
met
hyl-1
-cyc
lohe
xene
P0.
10.
20.
00.
20.
10.
30.
10.
10.
10.
10.
1
7344
.74-
viny
lcyc
lohe
xene
P0.
90.
10.
60.
20.
50.
61.
10.
90.
40.
50.
40.
30.
20.
3
7444
.92,
5,5-
trim
ethy
l-1-h
exen
-3-y
neU
0.2
0.2
0.1
0.2
0.2
0.2
0.4
0.1
0.1
0.1
0.0
7545
.31,
2-di
met
hylc
yclo
hexe
neP
0.2
0.3
0.1
0.2
0.2
0.2
0.8
0.1
0.1
0.2
0.1
7645
.71-
met
hyl-2
-m
ethy
lene
cycl
ohex
ane
P0.
20.
20.
10.
10.
10.
20.
30.
10.
10.
10.
0
(continue)

5 - Waste Tire 89
7746
.4et
enhy
lcyc
lohe
xane
P0.
20.
20.
10.
20.
20.
20.
40.
10.
10.
10.
1
7846
.8et
hylb
enze
neC
2.2
1.1
2.2
1.5
1.8
1.6
2.3
2.7
2.6
4.7
2.8
2.4
2.2
3.7
7947
.51,
4-di
met
hylb
enze
neC
3.8
0.6
2.4
0.9
1.5
1.6
5.1
3.5
2.3
3.5
2.4
1.5
0.9
1.9
8047
.82-
met
hyl-2
-oct
ene
P0.
00.
10.
10.
00.
10.
30.
20.
40.
10.
60.
10.
10.
1
8148
.1oc
tahy
drop
enta
lene
P0.
20.
10.
10.
30.
10.
20.
70.
30.
20.
20.
20.
20.
2
8249
.0st
yren
eC
3.1
1.3
1.4
1.2
0.9
1.1
2.8
1.5
2.7
4.5
1.9
1.8
1.4
1.8
8349
.51.
2-di
met
hylb
enze
neC
1.0
0.3
0.8
0.4
0.5
0.6
1.5
1.3
0.7
1.0
0.8
0.8
0.4
0.6
8450
.01-
none
neC
0.3
0.1
0.4
0.2
0.3
0.0
0.4
0.7
0.4
0.6
0.5
0.6
0.3
0.7
8550
.51,
4-bi
s(m
ethy
lene
)cyc
lohe
xane
U0.
10.
20.
00.
20.
10.
50.
10.
10.
20.
1
8650
.77,
7-di
met
hyl-2
-met
hyle
ne-
bicy
clo[
2.2.
1]he
ptan
eU
0.2
0.1
0.2
0.1
0.1
0.2
0.2
0.3
0.1
0.4
0.1
0.1
0.1
8750
.9no
nane
C0.
10.
10.
20.
10.
20.
10.
20.
40.
20.
20.
40.
20.
5
8851
.21,
2,3-
trim
ethy
lcyc
lohe
xane
P0.
10.
10.
10.
10.
10.
30.
30.
10.
10.
10.
1
8951
.73,
5,5-
trim
ethy
lcyc
lohe
xene
P0.
20.
10.
30.
10.
30.
20.
10.
60.
10.
20.
20.
10.
2
9052
.2cu
men
eC
0.3
0.2
0.5
0.3
0.4
0.3
0.3
1.0
0.3
0.5
0.5
0.6
0.3
0.5
9152
.81,
2-di
met
hylc
yclo
hexe
neP
0.1
0.1
0.1
0.1
0.1
0.4
0.0
0.1
0.2
0.1
9253
.31-
buty
lcic
loes
ene
P0.
20.
20.
10.
20.
20.
20.
30.
10.
10.
20.
1
9353
.72-
met
hyls
tiren
eP
0.2
0.1
0.2
0.1
0.2
0.1
0.2
0.2
0.2
0.2
0.2
0.3
0.1
0.2
9454
.04-
met
hyl-1
-(1-
met
hyle
thyl
)-cy
cloh
exen
eP
0.1
0.1
0.0
0.1
0.1
0.1
0.3
0.3
0.1
0.1
0.0
9554
.52,
5-di
met
hyl-3
-vin
yl-1
,4-
hexa
dien
eP
0.2
0.1
0.3
0.1
0.3
0.2
0.3
0.2
0.2
0.3
0.2
0.2
9654
.6pr
opyl
benz
ene
C0.
40.
20.
50.
30.
50.
40.
31.
20.
30.
60.
50.
70.
30.
7
9754
.84-
met
hyl-1
-(1-
met
hyle
thyl
)cy
cloh
exen
eP
0.2
0.1
0.2
0.1
0.3
0.2
0.2
0.4
0.5
0.2
0.2
0.1
0.1
9855
.05-
ethy
l-1-m
ethy
lthio
phen
eP
0.3
0.1
0.4
0.2
0.8
0.3
0.4
0.2
0.5
0.2
0.3
0.2
0.4
9955
.21,
2,3-
trim
ethy
lben
zene
C1.
30.
41.
20.
60.
21.
01.
62.
11.
11.
01.
61.
10.
50.
8
100
55.4
1,2,
4 tr
imet
hylb
enze
neP
0.6
0.3
0.8
0.5
0.6
0.6
0.8
1.1
0.8
0.9
1.1
1.0
0.4
0.7
(continue)

5 - Waste Tire9010
155
.6is
olim
onen
eP
0.4
0.2
0.4
0.3
0.4
0.4
0.7
0.6
0.3
0.5
0.4
0.5
0.3
0.4
102
55.8
1,3,
4 tr
imet
hylb
enze
neP
0.3
0.1
0.2
0.1
0.1
0.2
0.3
0.3
0.2
0.2
0.2
0.3
0.1
103
55.9
4-m
ethy
l-1-d
ecen
eP
0.1
0.1
0.2
0.1
0.2
0.2
0.2
0.3
0.1
0.2
0.3
0.2
104
56.3
2,6,
6-tr
imet
hylb
icyc
lo[3
.1.1
]he
ptan
eU
0.1
0.1
0.2
0.1
0.1
0.2
0.2
0.5
0.2
0.2
0.3
0.3
0.1
0.2
105
56.5
-m
ethy
lsty
rene
C0.
60.
30.
40.
40.
20.
30.
50.
90.
60.
90.
50.
60.
30.
4
106
56.6
1-et
hyl-4
-met
hylb
enze
neP
0.3
0.2
0.3
0.2
0.1
0.2
0.4
0.2
0.3
0.3
0.4
0.2
0.3
107
56.7
1,3,
5-tr
imet
hylc
yclo
hexa
neP
0.1
0.1
0.1
0.1
0.2
0.1
0.2
0.1
0.2
0.2
0.1
108
57.0
1-m
ethy
l-4-(
1-m
ethy
leth
yl)
cycl
ohex
ene
P0.
10.
10.
20.
10.
10.
20.
40.
20.
20.
30.
40.
10.
2
109
57.5
2-pr
open
ylbe
nzen
eP
0.7
0.2
0.6
0.2
0.2
0.3
1.1
0.6
0.5
0.4
0.3
0.6
0.2
0.4
110
57.7
1,3,
5-tr
imet
hylb
enze
neP
1.4
0.4
1.1
0.6
0.5
0.5
0.9
1.4
1.1
1.5
1.3
1.0
0.4
0.7
111
58.0
1-de
cene
C0.
10.
20.
10.
20.
30.
10.
80.
30.
10.
60.
30.
90.
30.
9
112
58.5
3,5-
dim
ethy
l-1,6
-oct
adie
neP
0.2
0.2
0.3
0.2
0.3
0.3
0.4
0.6
0.3
0.3
0.3
0.4
0.2
0.4
113
58.8
deca
neC
0.2
0.2
0.3
0.3
0.4
0.2
0.2
0.4
0.3
0.5
0.3
0.6
0.3
0.7
114
58.9
7,7-
dim
ethy
l-2-
met
hyle
nebi
cycl
o[2.
2.1]
hept
ane
U0.
30.
20.
40.
30.
10.
40.
50.
50.
40.
40.
40.
60.
20.
4
115
59.1
(1-m
ethy
lpro
pyl)-
benz
ene
P0.
10.
10.
10.
10.
20.
10.
30.
20.
10.
20.
20.
2
116
59.3
1,5-
cycl
odec
adie
neU
0.2
0.2
0.2
0.2
0.1
0.2
0.2
0.2
0.2
0.2
0.3
0.1
0.2
117
59.5
3-(1
,1-d
imet
hyle
thyl
)-th
ioph
ene
P0.
10.
10.
20.
10.
30.
10.
10.
20.
11.
30.
20.
20.
1
118
59.9
1-et
hyl-3
-met
hylb
enze
neP
1.0
0.6
1.0
0.9
0.7
0.2
0.8
1.3
1.0
1.2
1.6
0.5
1.0
119
60.1
1,2,
4,5-
tetr
amet
hylb
enze
neC
0.8
0.7
1.4
1.0
1.5
0.6
0.9
2.1
1.5
1.6
2.2
1.9
0.7
1.4
120
60.6
1-m
ethy
l-4-(
1-m
ethy
leth
yl)
cycl
ohex
neP
0.2
0.3
0.4
0.3
0.5
1.2
0.4
0.6
0.3
0.5
0.4
0.6
0.3
0.5
121
60.9
limon
ene
C3.
84.
33.
42.
83.
63.
49.
02.
53.
39.
84.
33.
55.
48.
8
122
61.3
inde
neC
0.9
0.4
0.4
0.5
0.1
0.2
0.2
0.3
0.6
0.8
0.7
0.6
0.2
0.2
123
61.7
1-m
ethy
l-2-p
enty
lcyc
lohe
xane
P0.
50.
50.
70.
50.
60.
51.
20.
80.
70.
90.
80.
90.
61.
1
124
61.8
1,4-
dieh
tylb
enze
neP
0.2
0.1
0.2
0.2
0.2
0.2
0.2
0.2
0.3
0.3
0.1
(continue)
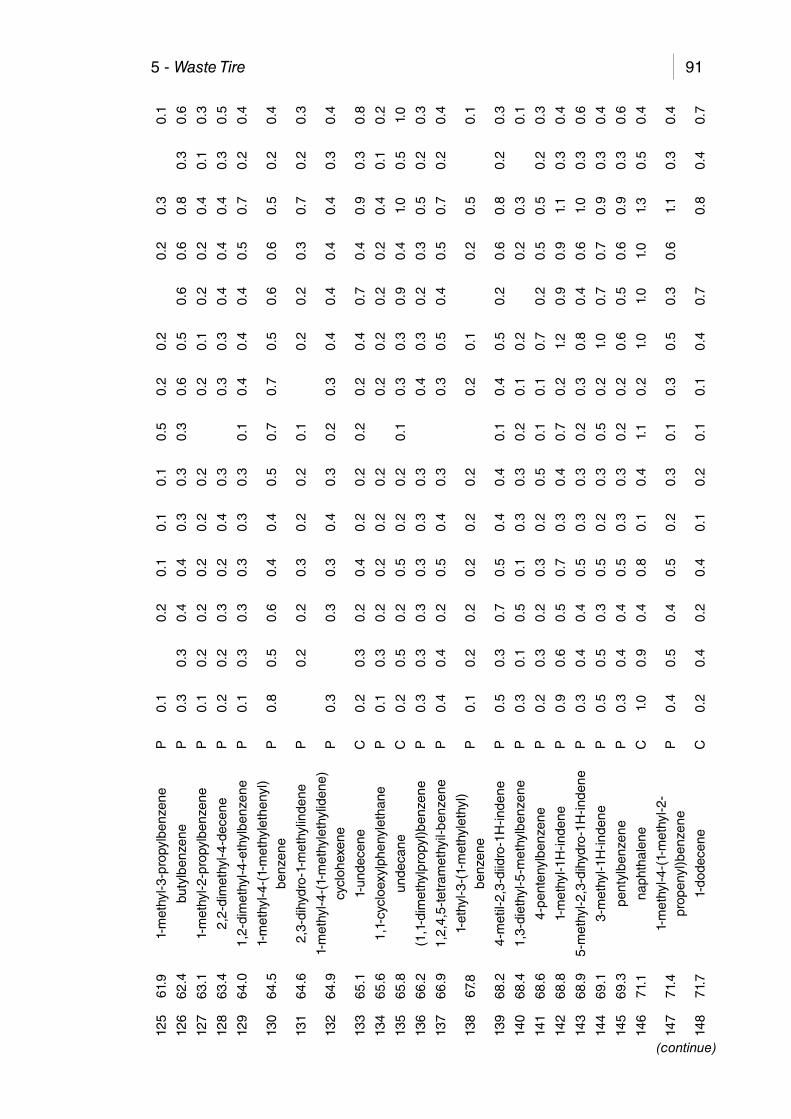
5 - Waste Tire 91
125
61.9
1-m
ethy
l-3-p
ropy
lben
zene
P0.
10.
20.
10.
10.
10.
50.
20.
20.
20.
30.
1
126
62.4
buty
lben
zene
P0.
30.
30.
40.
40.
30.
30.
30.
60.
50.
60.
60.
80.
30.
6
127
63.1
1-m
ethy
l-2-p
ropy
lben
zene
P0.
10.
20.
20.
20.
20.
20.
20.
10.
20.
20.
40.
10.
3
128
63.4
2,2-
dim
ethy
l-4-d
ecen
eP
0.2
0.2
0.3
0.2
0.4
0.3
0.3
0.3
0.4
0.4
0.4
0.3
0.5
129
64.0
1,2-
dim
ethy
l-4-e
thyl
benz
ene
P0.
10.
30.
30.
30.
30.
30.
10.
40.
40.
40.
50.
70.
20.
4
130
64.5
1-m
ethy
l-4-(
1-m
ethy
leth
enyl
)be
nzen
eP
0.8
0.5
0.6
0.4
0.4
0.5
0.7
0.7
0.5
0.6
0.6
0.5
0.2
0.4
131
64.6
2,3-
dihy
dro-
1-m
ethy
linde
neP
0.2
0.2
0.3
0.2
0.2
0.1
0.2
0.2
0.3
0.7
0.2
0.3
132
64.9
1-m
ethy
l-4-(
1-m
ethy
leth
ylid
ene)
cycl
ohex
ene
P0.
30.
30.
30.
40.
30.
20.
30.
40.
40.
40.
40.
30.
4
133
65.1
1-un
dece
neC
0.2
0.3
0.2
0.4
0.2
0.2
0.2
0.2
0.4
0.7
0.4
0.9
0.3
0.8
134
65.6
1,1-
cycl
oexy
lphe
nyle
than
eP
0.1
0.3
0.2
0.2
0.2
0.2
0.2
0.2
0.2
0.2
0.4
0.1
0.2
135
65.8
unde
cane
C0.
20.
50.
20.
50.
20.
20.
10.
30.
30.
90.
41.
00.
51.
0
136
66.2
(1,1
-dim
ethy
lpro
pyl)b
enze
neP
0.3
0.3
0.3
0.3
0.3
0.3
0.4
0.3
0.2
0.3
0.5
0.2
0.3
137
66.9
1,2,
4,5-
tetr
amet
hyil-
benz
ene
P0.
40.
40.
20.
50.
40.
30.
30.
50.
40.
50.
70.
20.
4
138
67.8
1-et
hyl-3
-(1-
met
hyle
thyl
)be
nzen
eP
0.1
0.2
0.2
0.2
0.2
0.2
0.2
0.1
0.2
0.5
0.1
139
68.2
4-m
etil-
2,3-
diid
ro-1
H-in
dene
P0.
50.
30.
70.
50.
40.
40.
10.
40.
50.
20.
60.
80.
20.
3
140
68.4
1,3-
diet
hyl-5
-met
hylb
enze
neP
0.3
0.1
0.5
0.1
0.3
0.3
0.2
0.1
0.2
0.2
0.3
0.1
141
68.6
4-pe
nten
ylbe
nzen
eP
0.2
0.3
0.2
0.3
0.2
0.5
0.1
0.1
0.7
0.2
0.5
0.5
0.2
0.3
142
68.8
1-m
ethy
l-1H
-inde
neP
0.9
0.6
0.5
0.7
0.3
0.4
0.7
0.2
1.2
0.9
0.9
1.1
0.3
0.4
143
68.9
5-m
ethy
l-2,3
-dih
ydro
-1H
-inde
neP
0.3
0.4
0.4
0.5
0.3
0.3
0.2
0.3
0.8
0.4
0.6
1.0
0.3
0.6
144
69.1
3-m
ethy
l-1H
-inde
neP
0.5
0.5
0.3
0.5
0.2
0.3
0.5
0.2
1.0
0.7
0.7
0.9
0.3
0.4
145
69.3
pent
ylbe
nzen
eP
0.3
0.4
0.4
0.5
0.3
0.3
0.2
0.2
0.6
0.5
0.6
0.9
0.3
0.6
146
71.1
naph
thal
ene
C1.
00.
90.
40.
80.
10.
41.
10.
21.
01.
01.
01.
30.
50.
4
147
71.4
1-m
ethy
l-4-(
1-m
ethy
l-2-
prop
enyl
)ben
zene
P0.
40.
50.
40.
50.
20.
30.
10.
30.
50.
30.
61.
10.
30.
4
148
71.7
1-do
dece
neC
0.2
0.4
0.2
0.4
0.1
0.2
0.1
0.1
0.4
0.7
0.8
0.4
0.7
(continue)

5 - Waste Tire92
149
72.0
(1-m
ethy
l-1,3
-but
adie
nyl)
benz
ene
P0.
10.
30.
30.
30.
30.
10.
20.
30.
20.
40.
40.
10.
2
150
72.1
1,6-
dim
ethy
l-2,3
-dih
ydro
-1H
-in
dene
P0.
10.
30.
40.
30.
20.
40.
40.
90.
20.
4
151
72.3
dode
cane
C0.
10.
20.
20.
40.
20.
10.
10.
20.
50.
31.
00.
40.
9
152
72.9
benz
othi
azol
eC
0.6
0.6
0.6
0.5
0.5
46.0
0.3
0.3
0.6
0.7
0.8
0.4
0.5
153
73.2
1,2-
dim
ethy
l-2,3
-dih
ydro
-1H
-in
dene
P0.
10.
20.
10.
20.
10.
10.
10.
20.
10.
20.
10.
2
154
73.8
cycl
open
tylb
enze
neP
0.1
0.4
0.2
0.4
0.3
0.2
0.0
0.3
0.2
0.3
0.9
0.3
0.4
155
74.2
3-ph
enil-
2-pe
nten
eP
0.0
0.2
0.1
0.2
0.2
0.1
0.1
0.1
0.2
0.4
0.1
0.1
156
74.4
3-et
hyl-2
,3-d
ihyd
ro-1
H-in
dene
P0.
10.
20.
10.
20.
20.
10.
10.
20.
20.
50.
2
157
74.8
(1-m
ethy
l-1,3
-pen
tadi
enyl
)be
nzen
eP
0.1
0.3
0.2
0.3
0.2
0.2
0.2
0.2
0.2
0.3
0.1
158
75.4
(1,1
-dim
ethy
l-2-p
rope
nyl)
benz
ene
P0.
10.
40.
20.
40.
20.
10.
10.
20.
30.
70.
10.
2
159
75.6
1,2-
dihy
dro-
6-m
ethy
lnaf
tale
neP
0.3
0.4
0.3
0.5
0.2
0.3
0.2
0.1
0.5
0.3
0.5
0.6
0.2
0.3
160
75.8
hexy
lben
zene
P0.
20.
40.
20.
40.
20.
20.
10.
10.
40.
40.
40.
70.
30.
5
161
76.0
1,3-
dim
ethy
l-1H
-inde
neP
0.3
0.4
0.3
0.5
0.2
0.3
0.1
0.1
0.5
0.3
0.5
0.7
0.2
0.3
162
76.1
1-(2
-met
hyle
ne-3
-but
enyl
)-1-
(1-
met
hyle
nepr
opyl
)cic
lopr
opan
eP
0.5
0.4
0.3
0.4
0.2
0.2
0.2
0.4
0.3
0.3
0.4
0.3
0.3
163
76.2
1,2,
3,4-
tetr
ahyd
ro-2
-met
hyl-
nafta
lene
P0.
20.
20.
30.
30.
20.
20.
40.
70.
20.
2
164
76.5
(1-m
ethy
l-1,3
-but
adie
nyl)
benz
ene
P0.
30.
40.
30.
50.
20.
20.
10.
10.
40.
20.
40.
70.
20.
2
165
76.7
(1-m
ethy
lene
-2-p
ente
nyl)
benz
ene
P0.
10.
30.
20.
40.
20.
20.
10.
10.
30.
20.
50.
20.
2
166
77.1
1-ph
enyl
cycl
ohex
ane
P0.
10.
30.
20.
50.
30.
20.
10.
40.
40.
70.
20.
3
(continue)

5 - Waste Tire 93
167
77.4
4,7-
dim
ethy
l-2,3
-dih
ydro
-1H
-in
dene
P0.
20.
40.
30.
50.
20.
30.
10.
40.
20.
10.
70.
30.
3
168
77.6
2-et
hyl-1
,2,3
,4-
tetr
ahyd
rona
ftale
neP
0.0
0.1
0.2
0.1
0.3
0.1
0.0
0.1
0.1
0.3
0.1
169
77.7
1-tr
idec
ene
C0.
10.
40.
20.
40.
40.
10.
10.
40.
60.
40.
60.
30.
6
170
78.0
1-m
ethy
lnap
htal
ene
C0.
91.
10.
61.
20.
20.
50.
60.
21.
31.
31.
31.
60.
81.
1
171
78.3
trid
ecan
eC
0.1
0.5
0.2
0.5
0.1
0.2
0.1
0.1
0.4
0.6
0.4
0.9
0.5
1.0
172
78.6
5-et
hyl-1
,2,3
,4-
tetr
ahyd
rona
ftale
neP
0.1
0.2
0.1
0.2
0.2
0.1
0.1
0.2
0.2
0.3
0.1
0.2
173
79.0
2-m
ethy
lnaf
tale
neC
0.6
0.8
0.4
1.0
0.1
0.4
0.4
0.1
0.9
0.8
0.8
1.2
0.5
0.6
174
79.6
3-et
il-3-
met
ilexa
neU
0.2
0.4
0.2
0.4
0.3
0.3
0.1
0.4
0.2
0.3
0.5
0.2
0.3
175
79.7
cycl
ohex
ylbe
nzen
eP
0.1
0.3
0.2
0.3
0.2
0.2
0.1
0.2
0.2
0.4
0.2
0.3
176
80.0
1,2,
3,4-
tetr
ahyd
ro-1
,8-
dim
ethy
lnap
htal
ene
P0.
10.
30.
10.
20.
20.
10.
10.
60.
20.
50.
10.
2
177
80.5
(1,1
-dim
ethy
l-2-b
utin
yl)b
enze
neP
0.2
0.2
0.2
0.4
0.1
0.2
0.1
0.4
0.2
0.2
0.2
0.2
178
81.2
1-(1
-but
en-3
-yl)-
2-vi
nylb
enze
neP
0.1
0.4
0.1
0.5
0.3
0.2
0.1
0.4
0.2
0.5
0.3
0.3
179
81.3
1,2-
dipr
opyl
cycl
open
tane
P0.
10.
10.
10.
20.
10.
10.
10.
10.
10.
20.
10.
2
180
81.8
hept
ylbe
nzen
eP
0.1
0.3
0.2
0.4
0.1
0.1
0.1
0.3
0.2
0.3
0.4
0.3
0.3
181
82.2
1,2,
3,4-
tetr
ahyd
ro-2
,7-
dim
ethy
lnaf
tale
neP
0.1
0.3
0.2
0.3
0.2
0.2
0.1
0.3
0.2
0.3
0.2
0.2
182
82.4
1-te
trad
ecen
eC
0.3
0.5
0.4
0.5
0.5
0.4
0.2
0.2
0.4
0.4
0.4
0.2
0.6
0.7
183
82.5
biph
enyl
C0.
60.
80.
40.
80.
30.
30.
30.
90.
70.
80.
60.
50.
5
184
82.7
1,2,
3-tr
imet
hyl-1
H-in
dene
P0.
30.
60.
40.
60.
40.
30.
10.
10.
60.
30.
50.
40.
40.
4
185
83.1
1,1,
3-tr
imet
hyl-1
H-in
dene
P0.
20.
30.
10.
30.
20.
20.
10.
40.
20.
30.
10.
2
186
83.4
tetr
adec
ane
C0.
30.
60.
40.
60.
40.
30.
10.
10.
60.
70.
50.
50.
50.
8
187
83.7
1-et
hyln
afta
lene
P0.
40.
80.
40.
70.
30.
40.
10.
10.
80.
40.
50.
40.
40.
3
188
83.9
2,3-
dim
ethy
lnaf
tale
neP
0.2
0.4
0.3
0.8
0.4
0.2
0.1
0.1
0.4
0.2
0.6
0.2
0.2
1.3
189
84.3
2,2,
4,4,
5,5,
7,7-
octa
met
hylo
ctan
eP
0.4
0.6
0.4
0.6
0.5
0.4
0.1
0.2
0.6
0.5
0.5
0.7
0.8
(continue)

5 - Waste Tire9419
084
.51,
7-di
met
hyln
afta
lene
P0.
20.
30.
30.
40.
30.
30.
10.
40.
20.
40.
20.
20.
2
191
84.7
2,5-
dim
etil-
benz
o[b]
tiofe
neP
0.1
0.2
0.1
0.3
0.3
0.1
0.0
0.2
0.2
0.2
0.2
0.2
192
85.2
2,6-
dim
ethy
lnaf
atal
ene
P0.
40.
90.
40.
70.
30.
30.
20.
10.
90.
40.
60.
30.
40.
3
193
85.4
1,5-
dim
ethy
lnaf
atal
ene
P0.
40.
70.
50.
80.
50.
50.
30.
20.
80.
60.
80.
30.
60.
7
194
85.9
2,4-
dim
ethy
lqui
nolin
eU
0.2
0.5
0.3
0.5
0.4
0.4
0.1
0.1
0.2
0.1
0.4
0.3
195
86.3
1,8-
dim
ethy
lnaf
tale
neP
0.2
0.5
0.2
0.4
0.3
0.3
0.1
0.4
0.3
0.3
0.2
0.4
0.3
196
86.5
1,2,
3,4-
tetr
ahyd
ro-1
,4,6
-tr
imet
hyln
afta
lene
P0.
20.
40.
20.
40.
30.
30.
10.
30.
20.
30.
10.
30.
4
197
86.7
(2-e
thyl
-4-m
ethy
l-1,3
-pe
ntad
ieny
l)ben
zene
P0.
10.
40.
20.
30.
30.
30.
10.
20.
20.
20.
10.
30.
3
198
87.1
(3,3
-dim
ethy
l-1-m
ethy
lene
-but
yl)
benz
ene
P0.
30.
80.
30.
70.
60.
50.
10.
10.
60.
40.
40.
20.
50.
4
199
87.5
(3-c
yclo
pent
ylpr
opyl
)ben
zene
P0.
10.
40.
10.
40.
20.
20.
10.
30.
30.
20.
10.
40.
4
200
88.2
3-m
ethy
l-1,1
'-dip
heni
lP
0.3
0.7
0.3
0.7
0.3
0.3
0.1
0.1
0.7
0.4
0.4
0.2
0.5
0.2
201
88.7
1-pe
ntad
ecen
eC
0.6
1.4
0.7
1.3
0.3
0.3
0.1
0.1
1.2
1.1
0.8
0.3
1.0
0.8
202
89.1
2-et
il-5-
met
il-be
nzo[
b]tio
fene
P0.
10.
20.
10.
30.
20.
20.
10.
10.
20.
1
203
89.2
pent
adec
ane
C0.
41.
40.
81.
20.
80.
70.
20.
21.
31.
81.
10.
41.
92.
3
204
89.8
1,3,
4,5,
6,7-
hexa
hydr
o-1,
1,5,
5-te
tram
ethy
l-2h-
2,4a
-m
etha
nona
phth
alen
eU
0.3
0.6
0.2
0.8
0.3
0.2
0.1
0.7
0.3
0.3
0.5
0.2
205
90.1
dibe
nzyl
P0.
10.
30.
10.
20.
10.
10.
10.
00.
10.
10.
10.
0
206
90.4
7,11
-dim
ethy
l-3-m
ethy
lene
-1,
6,10
-dod
ecat
riene
U0.
10.
50.
20.
40.
40.
30.
00.
30.
30.
20.
50.
3
207
90.6
2-(1
-met
hyle
thyl
)-na
phth
alen
eP
0.1
0.4
0.2
0.4
0.2
0.2
0.0
0.3
0.1
0.1
208
90.8
trim
ethy
lnap
htal
ene
P0.
10.
30.
10.
30.
20.
20.
00.
20.
10.
30.
1
209
91.2
trim
ethy
lnap
htal
ene
P0.
30.
60.
40.
70.
60.
50.
10.
70.
40.
60.
10.
20.
2
210
91.5
1,2-
dihy
dro-
2,5,
8-tr
imet
hyl-
naph
thal
ene
P0.
00.
30.
00.
20.
10.
10.
10.
00.
20.
1
(continue)

5 - Waste Tire 95
211
91.9
trim
ethy
lnap
htal
ene
P0.
10.
40.
20.
40.
20.
20.
00.
30.
20.
20.
30.
1
212
92.1
trim
ethy
lnap
htal
ene
P0.
10.
60.
20.
40.
30.
20.
00.
30.
20.
20.
40.
1
213
92.8
2,2’
-dim
ethy
lbip
heny
lP
0.3
0.9
0.3
0.6
0.4
0.3
0.1
0.1
0.6
0.3
0.3
0.7
0.1
214
93.7
1-he
xade
cene
C0.
30.
70.
30.
60.
30.
40.
10.
60.
70.
40.
80.
2
215
93.8
1,1'
-eth
ylid
eneb
isbe
nzen
eP
0.1
0.3
0.1
0.3
0.2
0.2
0.3
0.2
0.1
0.3
0.0
216
94.1
3,4'
-dim
ethy
l- 1,
1'-d
iphe
nyl
P0.
20.
30.
20.
30.
30.
20.
70.
10.
2
217
94.1
hexa
deca
neC
0.5
0.2
0.4
0.4
0.1
0.4
0.3
0.1
0.9
0.6
218
94.3
diph
enyl
amin
eU
0.1
0.5
0.1
0.2
0.2
0.2
0.3
0.1
0.2
0.1
0.5
219
94.7
3-m
ethy
l-1,1
'-dip
heny
lP
0.1
0.4
0.2
0.4
0.3
0.2
0.2
0.2
0.4
0.0
220
95.1
1-(2
-pro
peny
l)-na
phth
alen
eP
0.1
0.3
0.1
0.2
0.3
0.3
0.0
0.1
0.1
0.3
0.0
221
95.3
1-m
ethy
l-2-p
enty
l-cyc
lohe
xane
P0.
20.
40.
20.
30.
30.
30.
10.
20.
20.
10.
40.
1
222
95.4
1-m
ethy
l-4-(
phen
ylm
ethy
l)-be
nzen
eP
0.2
0.5
0.2
0.5
0.3
0.3
0.0
0.3
0.2
0.2
0.6
223
95.8
1,4,
5,8,
9,10
- he
xahy
droa
nthr
acen
eP
0.2
0.6
0.1
0.4
0.1
0.3
0.1
0.0
0.2
0.0
0.2
224
96.3
1,3,
5-tr
is(1
-met
hyle
thyl
)-be
nzen
eP
0.1
0.3
0.1
0.3
0.3
0.3
0.0
0.1
0.1
0.2
225
96.6
1,1'
-(1,
3-pr
opan
ediy
l)bis
-be
nzen
eP
0.2
0.8
0.2
0.6
0.5
0.4
0.1
0.3
0.6
0.2
0.9
0.1
226
97.0
4,9-
dipr
opyl
dode
cane
P0.
10.
30.
10.
30.
30.
40.
00.
20.
10.
50.
1
227
97.7
decy
lben
zene
P0.
10.
30.
10.
30.
10.
10.
00.
10.
4
228
98.0
1-m
ethy
l-7-(
1-m
ethy
leth
yl)-
ph
enan
thre
neP
0.2
0.4
0.1
0.4
0.6
0.3
0.2
0.0
0.1
0.3
0.1
0.6
0.1
229
98.4
1-he
ptad
ecen
eC
0.5
0.2
0.4
0.3
0.3
0.1
0.1
0.2
0.5
0.2
0.9
0.1
230
98.9
hept
adec
ane
C0.
61.
50.
91.
00.
90.
80.
50.
20.
92.
41.
23.
10.
7
231
99.4
2,6,
10,1
4-
tetr
amet
hylh
exad
ecan
eU
0.3
0.6
0.3
0.4
0.5
0.4
0.3
0.1
0.2
0.4
0.2
1.3
0.2
232
99.6
2-m
ethy
l-9H
-fluo
rene
P0.
70.
20.
40.
30.
30.
10.
00.
10.
20.
10.
6
(continue)

5 - Waste Tire96
233
99.9
1-(1
-met
hyle
htyl
)-9,
10-
dihy
droa
nthr
acen
eU
0.1
0.3
0.1
0.2
0.1
0.2
0.0
0.1
0.1
0.3
234
100.
61-
met
hyl-4
-(ph
enyl
met
hyl)-
benz
ene
P0.
10.
40.
20.
20.
10.
10.
00.
00.
3
235
101.
02,
2-di
met
hylu
ndec
ane
P0.
40.
10.
30.
40.
30.
20.
00.
10.
20.
10.
70.
1
236
101.
31,
1'-(
1,4-
buta
nedi
yl)b
is-b
enze
neP
0.4
0.2
0.2
0.2
0.3
0.3
0.0
0.1
0.1
0.7
237
101.
91,
1'-(
2-m
ethy
l-2-p
rope
nylid
ene)
bis-
benz
ene
P0.
00.
40.
10.
20.
10.
30.
20.
10.
00.
5
238
103.
2ph
enan
thre
neP
0.2
0.4
0.1
0.3
0.1
0.3
0.2
0.0
0.1
0.2
0.1
0.4
239
105.
19,
10-d
ihyd
ro-9
,10-
dim
ethy
lant
hrac
ene
P0.
10.
40.
10.
30.
40.
20.
30.
00.
00.
7
240
106.
91-
nona
dece
neC
0.1
0.4
0.1
0.3
0.2
0.2
0.1
0.0
0.2
0.0
241
107.
2no
nade
cane
C0.
30.
10.
30.
30.
20.
00.
50.
01.
10.
0
242
109.
31-
met
hyla
nthr
acen
eP
0.1
0.3
0.1
0.2
0.1
0.3
0.2
0.0
0.0
0.4
243
110.
02-
met
hyl a
nthr
acen
eP
0.1
0.3
0.1
0.2
0.6
0.3
0.1
0.0
0.3
244
110.
44-
met
hylp
hena
nthr
ene
P0.
20.
30.
00.
20.
10.
10.
2
245
110.
69-
met
hyla
nthr
acen
eP
0.3
0.0
0.3
0.1
0.0
0.2
0.0
0.3
246
112.
71-
phen
ylna
phta
lene
P0.
20.
30.
10.
20.
10.
10.
00.
3
Alip
hat
ic
37.0
24.3
40.6
24.3
35.5
32.3
41.9
51.3
33.7
45.2
29.7
26.4
32.1
43.1
Het
ero
-alip
hat
ic
0.5
0.2
0.7
0.3
3.2
0.5
0.8
0.5
0.4
1.9
0.5
0.5
0.2
0.5
Aro
mat
ic s
ing
le r
ing
35
.023
.030
.927
.122
.423
.837
.934
.432
.936
.837
.141
.421
.131
.2
PAH
s
10.9
21.2
9.7
19.4
10.8
11.3
7.0
2.4
16.8
12.2
13.7
10.4
15.9
8.6
Het
ero
-aro
mat
ic
1.1
2.0
1.2
1.9
1.3
1.3
0.5
0.4
1.1
0.4
1.0
1.2
1.7
1.1
TOTA
L
84.4
70.6
83.1
72.9
73.3
69.2
88.1
89.0
84.8
96.4
81.9
79.9
70.9
84.5
*a.c
.: at
trib
utio
n co
nfide
nce;
C, c
erta
in (
>98
%);
P, p
roba
ble
(86-
97%
); U
, unc
erta
in (
<85
%).

5 - Waste Tire 97
Tab
le 5
.8. 1
5 m
ain
co
mp
ou
nd
s in
liq
uid
s fr
om
MA
P o
f ti
re.
Ent
ryT
1LT
2LT
4LT
5LT
6LT
7LT
8LT
9LT
10L
T11
LT
12L
T13
LT
14L
T15
L
Set
-up
AA
AA
AA
AA
BB
BB
BB
Bra
ndT
ire M
Tire
GT
ire M
Tire
GT
ire M
Tire
MT
ire M
Tire
MT
ire M
Tire
GT
ire M
Tire
GT
ire G
Tire
G
P/M
2 (1
03 W/g
2 )13
7.6
95.7
55.1
47.7
1.3
11.9
730.
123
.610
1.9
93.8
50.8
47.9
24.0
12.0
n°T
ime
Sub
stan
ce
112
.02-
bute
ne-t
rans
1.7
0.3
1.5
0.4
1.2
1.2
1.1
1.1
0.8
2.1
1.1
0.2
0.7
1.7
915
.52-
met
hyl-1
,3-b
utad
iene
3.2
0.4
1.7
0.4
0.9
1.3
3.6
1.5
0.5
2.2
0.6
0.4
0.5
0.9
1116
.33-
met
hyl-1
-hex
ene
2.1
0.3
1.6
0.4
1.0
1.1
1.8
1.4
0.5
1.9
0.7
0.5
0.4
1.0
3427
.0be
nzen
e4.
00.
11.
80.
10.
91.
25.
72.
81.
50.
70.
80.
10.
30.
2
5437
.8to
luen
e4.
50.
83.
01.
40.
12.
28.
53.
50.
16.
34.
12.
12.
53.
4
7846
.8et
hylb
enze
ne2.
21.
12.
21.
51.
81.
62.
32.
72.
64.
72.
82.
42.
23.
7
7947
.51,
4-di
met
hyl-b
enze
ne3.
80.
62.
40.
91.
51.
65.
13.
52.
33.
52.
41.
50.
91.
9
8249
.0st
yren
e3.
11.
31.
41.
20.
91.
12.
81.
52.
74.
51.
91.
81.
41.
8
8349
.51.
2-di
met
hyl-b
enze
ne1.
00.
30.
80.
40.
50.
61.
51.
30.
71.
00.
80.
80.
40.
6
9052
.2cu
men
e0.
30.
20.
50.
30.
40.
30.
31.
00.
30.
50.
50.
60.
30.
5
9955
.21,
2,3-
trim
ethy
lben
zene
1.3
0.4
1.2
0.6
0.2
1.0
1.6
2.1
1.1
1.0
1.6
1.1
0.5
0.8
100
55.4
1,2,
4 tr
imet
hylb
enze
ne0.
60.
30.
80.
50.
60.
60.
81.
10.
80.
91.
11.
00.
40.
7
110
57.7
1,3,
5-tr
imet
hylb
enze
ne1.
40.
41.
10.
60.
50.
50.
91.
41.
11.
51.
31.
00.
40.
7
121
60.9
limon
ene
3.8
4.3
3.4
2.8
3.6
3.4
9.0
2.5
3.3
9.8
4.3
3.5
5.4
8.8
146
71.1
naph
thal
ene
1.0
0.9
0.4
0.8
0.1
0.4
1.1
0.2
1.0
1.0
1.0
1.3
0.5
0.4
Alip
hat
ic10
.85.
48.
24.
06.
67.
015
.56.
45.
115
.96.
84.
66.
912
.4
Aro
mat
ic23
.16.
415
.58.
27.
611
.130
.620
.914
.125
.618
.413
.79.
714
.8
Tota
l33
.911
.723
.812
.214
.218
.146
.127
.419
.241
.525
.118
.316
.627
.2

5 - Waste Tire98
Figure 5.10. Total ion chromatography of samples: a. T4L; b. T5L. The numbers in the chromatogram correspond to those reported in Table 5.8.
Figure 5.11. Total ion chromatography of samples: a. T10L; T11L The numbers in the chromatogram correspond to those reported in Table 5.8.
Working with set-up A aliphatic and single ring aromatic compounds were more
abundant than PAH using tire M instead of tire G.
Working with set-up B the amount of aliphatic and aromatic compounds were
higher for tire G than M; while the amount of PAH was reduced. Probably increasing
the residence time, due to the fractionating system, prevented the formation
or allowed the cracking of condensed ring structure. The latter hypothesis was
supported by the increasing amount of char.
The most abundant aliphatic compounds were linear alkane and alkene from
C4 to C19, 2-methyl-1,3-butadiene (isoprene), and limonene. A scheme showing
the formation of limonene through radical pyrolysis of polyisoprene is reported in

5 - Waste Tire 99
Figure 1.20.
T11L and T15L, obtained with set-up B, using tire G and, respectively, the highest
and lowest P/M2 ratio, contained almost the same high amount of limonene due
to initial tire composition and two opposite effects. The first one, for T11L, the
pyrolysis with the highest P/M2 ratio, promotes a fast cracking and a high volume
of gas was produced, pushing the newly formed limonene outside the reactor. On
the contrary, for T15L, the pyrolysis with the lowest P/M2 ratio, caused a slow and
less efficient cracking avoiding the pyrolysis of substances having a relatively low
stability, like limonene.
Single ring aromatics were mainly benzene, toluene, xylenes, and
trimethylbenzenes. Their amount was low in liquid obtained from tire G via set-
up A, probably due to low amount or absence of styrene rubber in tire. In liquid
obtained via set-up B the amount of aromatics was always increased because
Diels-Alder condensations and dehydrogenation reactions might take place as
suggested by Cunliffe et al.,6 involving reactions reported in Figure 1.12.
In addition to single ring aromatic hydrocarbons, relevant amount of polyaromatic
hydrocarbon were present such as 1H-indene, and naphthalene, anthracene,
phenanthrene, and their mono- and poly-methyl substituted. Their formation might
follow the steps reported in Figure 1.18.
Hetero-compounds contained sulfur, such as thiophene and its alkyl-derivatives,
and they gave the typical strong smell of liquids. They might be formed by reaction
between sulfur and radical intermediates. Also Williams and Bottrill found large
amount of sulfur compounds in liquid from classical pyrolysis.37 The most abundant
hetero-aromatic was benzothiazole. Its derivatives are usually employed as
additive in tire formulation,38 but they were pyrolyzed and only benzothiazole was
present in liquid. Further discussion on benzothiazole and hetero compounds is
reported in Section 5.6.
As note before the use of set-up B, especially for tire M, minimized the influence
of P/M2 ratio. Similar amount of aromatics and non-aromatics were present in
these liquid.
5.4.3. 1H-NMR
The amount of different classes of organic products was also evaluated via 1H-NMR. The nature of protons was assigned as follow: δ 8.0-6.6 (aromatic
ring); 6.0-4.5 (C=CH olefins); 3.0-2.0 (Ar-CH), 2.0-1.5 (CH paraffins), 1.5-1.0
(CH2 paraffins), and 1.0-0.6 (CH3 paraffins) ppm (Figure 5.12). The amount of
hydrocarbon types was calculated according to the Myer’s formulas39 and reported
in Table 5.9.
Liquids obtained using set-up A from tire M showed lower amount of aromatics
and olefins with respect to those obtained with set-up B due to a less efficient
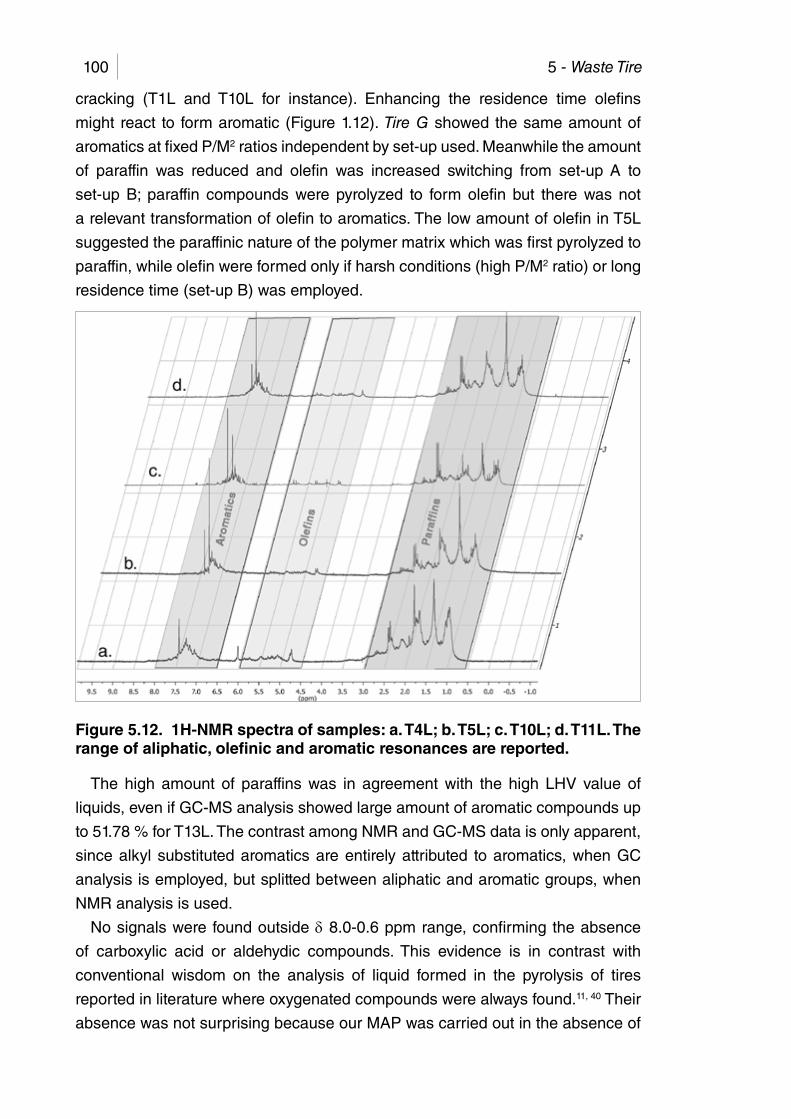
5 - Waste Tire100
cracking (T1L and T10L for instance). Enhancing the residence time olefins
might react to form aromatic (Figure 1.12). Tire G showed the same amount of
aromatics at fixed P/M2 ratios independent by set-up used. Meanwhile the amount
of paraffin was reduced and olefin was increased switching from set-up A to
set-up B; paraffin compounds were pyrolyzed to form olefin but there was not
a relevant transformation of olefin to aromatics. The low amount of olefin in T5L
suggested the paraffinic nature of the polymer matrix which was first pyrolyzed to
paraffin, while olefin were formed only if harsh conditions (high P/M2 ratio) or long
residence time (set-up B) was employed.
Figure 5.12. 1H-NMR spectra of samples: a. T4L; b. T5L; c. T10L; d. T11L. The range of aliphatic, olefinic and aromatic resonances are reported.
The high amount of paraffins was in agreement with the high LHV value of
liquids, even if GC-MS analysis showed large amount of aromatic compounds up
to 51.78 % for T13L. The contrast among NMR and GC-MS data is only apparent,
since alkyl substituted aromatics are entirely attributed to aromatics, when GC
analysis is employed, but splitted between aliphatic and aromatic groups, when
NMR analysis is used.
No signals were found outside δ 8.0-0.6 ppm range, confirming the absence
of carboxylic acid or aldehydic compounds. This evidence is in contrast with
conventional wisdom on the analysis of liquid formed in the pyrolysis of tires
reported in literature where oxygenated compounds were always found.11, 40 Their
absence was not surprising because our MAP was carried out in the absence of

5 - Waste Tire 101
oxygen, while in classical pyrolysis air was sometimes employed as combustive
agent in the reactor.
Table 5.9. Abundance for each proton class in liquids from MAP of tires.
Entry Set-upTire
BrandP/M2 Aromatic Paraffin Olefin
(103W/g2) (vol%) (vol%) (vol%)
T1L A Tire M 137.6 24.0 35.1 40.9
T2L A Tire G 95.7 28.2 56.3 15.5
T3L A Tire M 106.0 22.3 37.7 40.0
T4L A Tire M 55.1 21.7 47.3 31.0
T5L A Tire G 47.7 25.8 66.7 7.6
T6L A Tire M 1.3 29.1 53.7 17.2
T7L A Tire M 11.9 16.9 74.9 8.1
T8L A Tire M 730 26.1 49.0 24.9
T9L A Tire M 23.6 20.0 39.8 40.3
T10L B Tire M 101.9 30.3 42.0 27.6
T11L B Tire G 93.8 27.1 48.1 24.8
T12L B Tire M 50.8 31.0 45.0 24.0
T13L B Tire G 47.9 24.8 46.6 28.6
T14L B Tire G 24 23.6 59.8 16.6
T15L B Tire G 12 21.1 53.5 25.3
5.4.4. Distillation curve
The amount of distillate collected below 473 K and the total distillable fraction
together with the maximum distillation temperature are reported in Table 5.10.
Table 5.10. Distillation curve of liquids from MAP of tire.
EntrySet-up
Tire Brand
P/M2
Distilled below 473 K
Distilled over
473 KTmax
Total distilled
Not Distilled
(103W/g2) (%) (%) (K) (%) (%)
T1L A Tire M 137.6 13.25 15.93 492 29.18 70.82
T2L A Tire G 95.7 25.82 25.12 582 50.94 49.06
T4L A Tire M 55.1 29.18 29.25 528 68.43 41.57
T5L A Tire G 47.7 27.70 27.65 583 55.43 44.57
T6L A Tire M 1.3 35.37 47.47 579 82.84 17.16
T7L A Tire M 11.9 35.48 25.24 595 60.72 39.28
T8L A Tire M 730 30.34 42.48 533 73.15 26.85
T9L A Tire M 23.6 74.61 - 473 74.61 25.39
T10L B Tire M 101.9 44.99 20.05 597 65.04 34.96
T11L B Tire G 93.8 32.77 44.34 595 77.11 22.89
T12L B Tire M 50.8 43.28 37.35 579 80.63 19.37
T13L B Tire G 47.9 65.51 25.73 548 91.24 8.76
T14L B Tire G 24 33.28 23.30 591 79.88 20.12
T15L B Tire G 12 64.40 19.04 543 83.44 16.56

5 - Waste Tire102
A different distillation behavior was noticed for liquids from pyrolysis of different
tire brands, but product distilled below 473 K, and total amount of distilled products
was increased if the P/M2 ratio decreased, and the set-up A was used.
As well as for other properties, when tire M was pyrolyzed with set-up B
differences were reduced, the amount of distillable fraction below 473 K was almost
the same, using different P/M2 ratio (T10L, and T12L, Table 5.10), but higher than
the one achieved with set-up A (T1L, and T4L). A sharp difference was noticed
concerning the distillable fraction when the P/M2 ratio was further reduced and
more than 80% (T12L) of liquid was distilled instead of 65% (T10L). This behavior
was attributed to a more efficient cracking and reduced transportation phenomena
of pyrolyzed substances. This behavior was also observed for pyrolysis of tire G.
The improvement of distillable fraction was higher when pyrolysis of tire G was
run at low P/M2. This fraction was higher in liquids from entries T13L than T12L
(respectively 91.24 and 80.63 wt %) or T11L than T10L (respectively 77.11 and
65.04 wt %). However a further reduction of P/M2 did not improve the amount of
distillable fraction that remain in the range 79.9-91.2 %.
The residue contained oligomers formed in the course of the pyrolysis by coupling
of radical intermediates as usually happen in the thermal cracking and as also
reported by Kyari et al.11 analyzing the liquid via size exclusion chromatography.

5 - Waste Tire 103
5.4.5. FTIR
IR analysis did not evidence any remarkable differences among liquids obtained
by different pyrolysis: absorptions of alkane/alkyl, alkene and aryl groups were
present (Table 5.11).
Table 5.11. IR absorptions of liquids from MAP of tiresa.
Freq
uen
cyA
ttri
buti
on
T1L
T2L
T3L
T4L
T5L
T6L
T7L
T8L
T9L
T10
LT
11L
T12
LT
13L
T14
LT
15L
3104
; 306
0A
rom
atic
C-H
st
retc
hing
ww
ww
ww
ww
ww
ww
ww
w
3082
; 302
7Te
rmin
al v
inyl
C
-H s
tret
chin
gw
ww
ww
ww
ww
ww
ww
ww
3009
Inte
rnal
alk
ene
C-H
str
etch
ing
n.d.
n.d.
n.d.
n.d.
n.d.
n.d.
n.d.
n.d.
n.d.
n.d.
n.d.
n.d.
n.d.
n.d.
n.d.
2961
; 287
0M
ethy
l C-H
st
retc
hing
ss
ss
ss
ss
ss
ss
ss
s
2920
; 286
0M
ethy
lene
C
-H s
tret
chin
gs
ss
ss
ss
ss
ss
ss
ss
1691
; 175
2;
1804
; 187
7;
1944
Aro
mat
ic
com
bina
tion
band
n.d.
n.d.
n.d.
n.d.
n.d.
n.d.
n.d.
n.d.
n.d.
n.d.
n.d.
n.d.
n.d.
n.d.
n.d.
1630
Alk
enyl
C=
C
stre
tchi
ngw
ww
ww
ww
ww
ww
ww
ww
1601
; 157
6;
1495
; 145
0C
=C
-C a
ryl
ring
stre
tchi
ngm
mm
mm
mm
mm
mm
mm
mm
1452
HC
-H b
endi
ngs
ss
ss
ss
ss
ss
ss
ss
1202
; 108
3;
1028
; 102
0A
rom
atic
C
-H in
-pla
ne
bend
ing
ww
ww
ww
ww
ww
ww
ww
w
840:
774
; 75
5; 7
48;
Aro
mat
ic C
-H
out-
of-p
lane
be
ndin
g
mm
mm
mm
mm
ww
mw
mm
m
729
-(C
H2)
n-
rock
ing
ss
ss
ss
ss
ss
ss
ss
s
a In
tens
ity r
epor
ted
as fo
llow
: s, s
tron
g; m
, med
ium
; w, w
eak;
n.d
. not
det
ecte
d

5 - Waste Tire104
There were not relevant differences among spectra.The FT-IR spectra of some
liquids, collected in ATR mode, are reported in Figure 5.13.
Figure 5.13. FT-IR spectra of liquids : a. T4L; b. T5L; c. T10L; d. T11L.
Peaks attributable to carbonyl or carboxyl groups, between 1725÷1700 cm-1,
were not distinguishable from background noise.
5.4.6. Main achievements
MAP of two different brands of tire was achieved obtaining liquids having
physical and chemical properties very close to commercial fuels even if a
hydrodesulfurization process is required. Reactions were run using different
amounts of tire in a batch laboratory scale using different apparatus set-up.
Pyrolysis were performed in an anoxic atmosphere without any carrier gas,
avoiding mass transportation phenomena and increasing the residence time of
the gas inside the oven. Furthermore the gas fraction was not diluted by the carrier.
An on-line fractionating system (a packed column filled with glass spheres) was
sometimes inserted between the oven and the condensing system (set-up B).
Results, obtained using different apparatus set-up, were compared especially
with regard to the liquid product. The use of a fractionating system increased the
residence time of the high boiling substances avoiding their stripping from the
reactor. A correlation between pyrolysis and liquid characteristics was obtained
using the ratio between the microwave power (P) and square mass (M2), the P/M2
parameter. This ratio was used as descriptive parameter because it gave a bright
and concise correlation among different experimental conditions and results of
pyrolysis test.

5 - Waste Tire 105
Lowering the P/M2 ratio, or more generally the microwave power, liquid showed
a progressive reduction of viscosity, density, and calorific values together with an
increasing amount of liquid distilled below 473 K. This behavior was independent
on brand of tires employed. Tire M pyrolyzed with set-up A gave the highest liquid
yield (42.6 wt%) using a P/M2 ratio of 55 × 10-3 W/g2. This liquid showed a low
density (0.874 g/cm3), viscosity (1.73 cPs), and the distillable fraction below 473 K
was 30 wt%. Tire G gave the highest liquid yield (42.8 wt%) using a P/M2 ratio of
96 × 10-3 W/g2 with a density of 0.921 g/cm3, viscosity of 3.92 cPs, and a distillable
fraction below 473 K of 26 wt%.
Remarkable differences were evidenced when set-up B was employed, namely
using a fractionating system inserted between the oven and the condensing
system. A pale-yellow transparent liquid was obtained instead of a dark-brown
opaque one, with lower density and viscosity, and containing a large amount of
aromatics and olefins.
Pyrolysis of tire M with set-up B minimize any effect of P/M2 ratio even if the
liquid product was obtained with a lower yield 28 wt%, but having a density of 0.86
g/cm3 viscosity of 1 cPs, and the distillable fraction below 473 K was 44 wt%. So
far in these conditions liquids showed the same physical properties of that one
obtained with set-up A, but in a shorter time.
Also pyrolysis of tire G using set-up B gave liquids with lower values of physical
properties; even if the influence of different set-up is less evident for tire G than
tire M, the density was reduced from 0.92 to 0.88 g/cm3, and viscosity from 3.92
to 1.25 cPs. In the same time the distillable fraction was increased up to 91.2 % of
the liquid collected.
The chemical composition of liquids were also affected by the use of different
set-up and high amount of aromatics and olefins were present than in the liquid
obtained with set-up A, even if lower changes were shown for tire G. The lower
influence of different set-up was attributed to a different composition of tire. Tire
G might have a prevailing aliphatic composition (polyisoprene moiety was higher
than in tire M) which gave less stable radical intermediates during pyrolysis.
As a conclusion the set-up B gave a more efficient pyrolysis, giving a liquid
product with more affordable properties very close to those of a commercial fuel
even if a hydrodesulfurization treatment must be undergone, before its use.
5.5. Temperature detection problem
Temperature is a key parameter to describe almost any chemical reaction and
pyrolysis experiment. However in a MW heated system the detection of temperature
shows some hard challenges. Several devices are available for temperature
detection in classical heated system, such as alcohol, mercury-in-glass, infrared
thermometer, or thermocouple. Alcohol and mercury-in-glass thermometer cannot

5 - Waste Tire106
be used in a MW pyrolysis system because their temperature limit is below the
common operating temperature and mercury absorbs MW.
Thermocouple are made in metals. They are widely used to detect temperature
in classical heating system. However in a MW system metal absorb MW and it is
heated so they cannot be employed in any MW system.
Infrared thermometer does not have any temperature limitations but it provides
the surface temperature. A schematic representation of temperature detection
with an infrared thermometer is reported in Figure 5.14a. This thermometer gave
the medium temperature of the oven reported in Figure 5.14a, furthermore the
ability to measure only the surface temperature is a limitation of this thermometer.
In a pyrolysis experiment, where a lot of vapors are produced, the temperature
measured is that of vapor (Figure 5.14b). Furthermore in a MW system radiation
is turned into heat inside the absorber which is usually covered by vapors during
pyrolysis so the temperature measure by an infrared thermometer is that one of
the gases present in the reactor.
Figure 5.14. Infrared thermometer. a. cone of temperature detection; b. the vapor covered the feed and only the vapor temperature is detected.
Other systems are available on the market, where the metal is replaced
with monolithic single-crystal which does not interact with MW: fiber optic
thermometers. They can provide information on the working temperature , but also
this thermometer shows some limitation because they detected the temperature
of object in thigh contact with it.
In the reported MAP several efforts were devoted to understand the pyrolysis
temperature.
The MW oven is equipped with an infrared thermometer, it provided the vapor
temperature. As a matter of fact the temperature measured by the infrared
thermometer was in agreement with the temperature of the gas flow measured
at the exit of the oven. It was calibrated correlating the temperature of a silicon
oil bath measured by the infrared and a mercury-in-glass thermometer. A linear
relationship was obtained (R2 = 0.9910, Equation 5.1):
a. b.

5 - Waste Tire 107
5.1
Where TIR was the temperature of the infrared thermometer and TEXT the
temperature extrapolated. The temperature of pyrolysis T6, T7, and T8 was
detected also using a fiber optic thermometer. In Table 5.12 are summarized the
temperature detected and extrapolated.
Table 5.12. Temperature detected and extrapolated in MAP.Entry Temperature detected (K) Temperature extrapolated (K)
T1 573 872
T2 553 830
T3 546 814
T4 523 765
T5 503 723
T6 533 787
T7 513 745
T8 453 617
T9 523 765
T10 563 851
T11 563 851
T12 523 765
T13 533 787
T14 573 872
T15 483 681
Temperatures measured by the infrared thermometer (TIR) and extrapolated
(TEXT) were different from those measured with the fiber optic thermometer
because the heat of the sample, having a poor thermal conductivity, is not uniformly
distributed. The heterogeneous distribution of the MW absorber results in a spot
point temperature profile. An experiment (entry T8) was arranged with fiber optic
thermometer in close contact with the tire chips to measure the temperature of
the heated tire surface. Tire chips were piled around the fiber optic thermometer
to avoid the problem of contact losing during the experiment especially when
the tire chips collapsed; the tire chips remained in strict contact with the fiber
optic thermometer and the temperature was correctly detected. It was higher
(719 K) than the one extrapolated (617 K) because a lower amount of tire was
used, a lower amount of gases was produced and rapidly distilled away and the
overall measurable temperature by the infrared thermometer inside the oven was
consequently lower.
Further consideration has been extrapolated from XRD analysis of char. Two
crystalline forms of ZnS (sphalerite, β ZnS; wurtzite a ZnS) was found due to
ZnO transformation during pyrolysis. Wurtzite phase is stable over 1273 K,
T TEXTIR
=−( . )
.�
18 861
0 469
5 - Waste Tire108
confirming that a high temperature was reached in MAP. When sphalerite is the
sole or predominant phase a pyrolysis temperature between 700 and 1273 K
was achieved because this is the range of stability of sphalerite. These values
are higher than those measured and extrapolated using the previusly reported
methods.
As a conclusion of temperature detection, our evidence shows that the MW
radiation is transformed into heat inside the absorber and initially only the
polymeric matrix in close contact with the surface of the absorber is heated to the
pyrolysis temperature. As a consequence temperature is not a good parameter to
characterize a MAP experiment.
5.6. Hydrodesulfurization
All liquid collected contained variable amount of sulfur, as evidenced in Section
5.4.1, which limited any further use.41, 42 Furthermore the presence of unsaturated
compounds reduced the stability of liquids if they were stored. These two
problematic issues might be eliminated by a hydrodesulfurization process (HDS)
which could reduce the amount of sulfur and hydrogenate the unsaturated bonds.
Moreover an HDS process might reduce corrosive effects.
Typical HDS processes work with pressure of hydrogen in the range 68 – 138
atm and temperature around 570 – 710 K. The feed stream is mixed with hydrogen
and heated before it is passed through the catalyst bed in the reactor. The
outgoing gas/liquid mixture is separated and the hydrogen in the gas is purified
and recycled. The H2S separated from hydrogen is transformed in elemental sulfur
through the Claus process.43 The most employed are molybdenum/cobalt based
catalysts because they are active to HDS but do not hydrogenate aromatic rings
and they are not deactivated by sulfur compounds 43
A commercial HDS catalyst was tested on reference compounds and on liquids
obtained in MAP of tires to check sulfur removal and double bonds hydrogenation.
It was a molybdenum/cobalt supported catalyst which was activated through
reaction with dimethyldisulfide at room temperature for 24 h prior HDS experiments.
Reactions were carried out in a stainless steel autoclave without stirring. The
detailed experimental procedure can be found in “Appendix II: Analytical Methods”.
Benzo[b]thiophene (BT) and benzothiazole (BTZ) were chosen as reference
compounds and they were HDS using anhydrous toluene or the fraction distilled
below 579 K of liquid T6L as solvent. In Table 5.13 are summarized the results.
BT is particularly challenging to hydrogenate44-50 and for this reason was chosen
as main referring compound. BTZ was present as main hetero-compound in
liquids thus its hydrogenation was also investigated.
HDS is usually run in a continuous process while the tests were carried out in
a batch process in toluene as solvent to allow the tuning of the reaction condition.

5 - Waste Tire 109
Low conversion of BT was achieved working at 553 K and 10 atm of H2 (6%,
HDS_01); however raising temperature of 30 K the reaction was about 5 time faster
(HDS_02). HDS efficiency was improved also increasing the H2 pressure from 10
to 50 atm (HDS_03); this latter pressure is closer to the one used in continuous
processes and it was chosen for further investigation. 2,3-dihydrobenzo[b]
thiophene and ethylbenzene were the products identified through GC-MS as
expected from the data reported by Frediani et al.44
Table 5.13. HDS parameters and yields.
EntrySulfur
compoundSolvent (10 mL)
Catalyst (wt %)a
T (K)
H2 (Atm)
Time (h)
Sulfur compound conv (%)
HDS_01 BT Toluene 10.4 553 10 4 6
HDS_02 BT Toluene 9.0 583 10 4 33
HDS_03 BT Toluene 12.2 553 50 4 88
HDS_04 BT Toluene 10.5 553 50 2 43
HDS_05 BT Toluene 12.6 553 50 1 19
HDS_06 BT Toluene 20.6 553 50 1 41
HDS_07 (6 run) BT Toluene 20.4 553 50 2 mean 89
HDS_08 BT T6L 23.6 553 50 4 8
HDS_09 BT T6L 15.9 553 50 2 6
HDS_10 BT T6L 11.6 553 50 24 11
HDS_11 BT T6L 18.0 583 50 2 19
HDS_12 BT T6L 13.1 583 50 24 >99
HDS_13 (6 run) BT T6L 58.5 583 50 4 mean 63
HDS_14 (6 run) BTZ Toluene 9.7 553 50 2 75
HDS_15 BTZ Toluene 26.4 583 50 2 83
HDS_16 BTZ T6L 31.1 583 50 2 80a The catalyst Albemarle KF752 is a supported catalyst of unknown composition and the
reported percentage was referred on the whole weight.
A linear conversion of BT as a function of time was shown (HDS_04, HDS_05,
and HDS_07). Moreover the catalyst might be used for 6 run, using every time a
fresh solution, without losing its activity (HDS_07).
Switching from toluene to T6L as solvent the conversion of BT dramatically
dropped (HDS_08 – HDS_10) and the conversion never overcame 11 % even
after 24 h. Increasing temperature (HDS_11) and the catalyst amount (HDS_12)
the conversion increased as expected. Probably compounds present in T6L
interacted with the catalyst reducing its activity.
The catalyst might be reused for 6 run with comparable results (HDS_12), but
the conversion of BT did not overcome 63 %; a nonlinear correlation between time
or catalyst amount with conversion was obtained. Indeed the catalyst was also
active toward double bonds hydrogenation and low conversion of BT was achieved
when working at 553 K. At this temperature alkenes had a very low reactivity but

5 - Waste Tire110
a strong interaction with the catalyst and lower the overall hydrogenation (Figure
5.15).
Figure 5.15. TIC of HDS 10 and HDS_12 before (dotted lines) and after (solid lines) normalized to internal standard. In both TIC: a. toluene; b: ethylbenzene; c. limonene; d. tetrahydrolimonene; e. internal standard; f. BT.
The evident reduction of the peak of limonene and the appearance of a new
peak attribute to the tetrahydrolimonene is shown in Figure 5.15; while in TIC of
HDS_10 there was not noticeable reduction of BT. Meanwhile in HDS_12, BT

5 - Waste Tire 111
disappeared and ethylbenzene was increased. All the reaction involved in the
HDS process of liquid derived from tire pyrolysis mixed with BT are reported in
Figure 5.16.
Figure 5.16. HDS of BT in liquid from MAP of tires.
Figure 5.17. TIC of HDS_16 before (dotted lines) and after (solid lines) normalized to internal standard. In both TIC: a. toluene; b: aniline; c. N-methylaniline; d. N,N-dimethylaniline; e. limonene; f. tetrahydrolimonene; g. internal standard; h. BTZ.
S
H2
H2
S
SH
H2
H2
H2
SH
H2S
H2
H2
H2S
R
R 11
R 22
R
R 11
R
R 11
R
R
R 11
R
R 11
R
R
R 11
R 22
+ + + +
H2 583KCatalyst
H2 553KCatalyst

5 - Waste Tire112
BTZ was converted easily than BT and already at 553 K and 50 atm (HDS_14
and HDS_15) it is converted to: aniline, N-methylaniline, and N,N-dimethylaniline.
A comparable conversion of BTZ was achieved also using T6L as solvent
(HDS_16).
In Figure 5.17 is reported the TIC of HDS_16 before and after HDS.
The reduction of BTZ was evident but also the hydrogenation of some alkene
moieties such as styrene and limonene.
Liquids obtained from MAP of tire can be efficiently treated with conventional and
well-established technologies to reduce their sulfur and reactive double bonds.

5 - Waste Tire 113
Reference
1. Undri, A.; Sacchi, B.; Cantisani, E.; Toccafondi, N.; Rosi, L.; Frediani, M.; Frediani, P., Characterization of Carbon from Microwave Assisted Pyrolysis of Tires. J. Anal. Appl. Pyrol. 2013, 104, 396-404.2. Undri, A.; Rosi, L.; Frediani, M.; Frediani, P., Upgraded Fuel from Microwave Assisted Pyrolysis of Waste Tire. Fuel 2014, 115, 600-608.3. Undri, A.; Meini, S.; Rosi, L.; Frediani, M.; Frediani, P., Microwave Pyrolysis of Polymeric Materials: Waste Tires Treatment and Characterization of the Value-Added Products. J. Anal. Appl. Pyrol. 2013, 103, 149-158.4. Bykov, Y. V.; Rybakov, K. I.; Semenov, V. E., High-temperature microwave processing of materials. J. Phys. D Appl. Phys. 2001, 34, R55.5. Russell, A. D.; Antreou, E. I.; Lam, S. S.; Ludlow-Palafox, C.; Chase, H. A., Microwave-assisted pyrolysis of HDPE using an activated carbon bed. RSC Advances 2012, 2, 6756-6760.6. Cunliffe, A. M.; Williams, P. T., Composition of oils derived from the batch pyrolysis of tyres. J. Anal. Appl. Pyrol. 1998, 44, 131-152.7. Aguado, R.; Olazar, M.; José, M. J. S.; Gaisàn, B.; Bilbao, J., Wax Formation in the Pyrolysis of Polyolefins in a Conical Spouted Bed Reactor. Energy Fuels 2002, 16, 1429-1437.8. Kaminsky, W.; Mennerich, C.; Zhang, Z., Feedstock recycling of synthetic and natural rubber by pyrolysis in a fluidized bed. J. Anal. Appl. Pyrol. 2009, 85, 334-337.9. Parkash, S., Petroleum Fuels Manufacturing Handbook. The McGraw-Hill Companies, Inc.: 2010; p 463.10. Yatsun, A. V.; Konovalov, P. N.; Konovalov, N. P., Gaseous Products of Microwave Pyrolysis of Scrap Tires. Solid Fuel Chem. 2008, 42, 187-191.11. Kyari, M.; Cunliffe, A.; Williams, P. T., Characterization of Oils, Gases, and Char in Relation to the Pyrolysis of Different Brands of Scrap Automotive Tires. Energy Fuels 2005, 19, 1165-1173.12. López, F. A.; Centeno, T. A.; Alguacil, F. J.; Lobato, B.; Urien, A., The GRAUTHERMIC-Tyres process for the recycling of granulated scrap tyres. J. Anal. Appl. Pyrol. 2013, 103, 207–215.13. Piskorz, J.; Majerski, P.; Radlein, D.; Wik, T.; Scott, D. S., Recovery of Carbon Black from Scrap Rubber. Energy Fuels 1999, 13, 544-551.14. Chan, O. S.; Cheung, W. H.; McKay, G., Preparation and characterisation of demineralised tyre derived activated carbon. Carbon 2011, 49, 4674-4687.15. Teng, H.; Lin, Y.-C.; Hsu, L.-Y., Production of Activated Carbons from Pyrolysis of Waste Tires Impregnated with Potassium Hydroxide. J. Air Waste Manag. 2000, 50, 1940-1946.16. Lin, Y.-R.; Teng, H., Mesoporous carbons from waste tire char and their application in wastewater discoloration. Microporous Mesoporous Mater. 2002, 54, 167–174.17. Crelling, J. C.; Hagemann, H. W.; Sauter, D. H.; Ramani, R. V.; Vogt, W.; Leininger, D.; Krzack, S.; Meyer, B.; Orywal, F.; Reimert, R.; Bonn, B.; Bertmann, U.; Klose, W.; Dach, G., Coal. In Ullmann's Encyclopedia of Industrial Chemistry, Wiley-VCH Verlag GmbH & Co. KGaA: 2000.18. Murillo, R.; Aylón, E.; Navarro, M. V.; Callén, M. S.; Aranda, A.; Mastral, A. M., The application of thermal processes to valorise waste tyre. Fuel Process. Technol. 2006, 87, 143-147.

5 - Waste Tire114
19. Juma, M.; Korenová, Z.; Markoš, J.; Annus, J.; Jelemenský, L., Pyrolysis and combustion of scrap tire. Petroleum & Coal 2006, 48, 15-26.20. R., H.; Popovic, N.; Ikura, M.; Stanciulescu, M.; Liu, D., Characterization and potential applications of pyrolytic char from ablative pyrolysis of used tires. J. Anal. Appl. Pyrol. 2001, 58-59, 813-824.21. Zabaniotou, A. A.; Stavropoulos, G., Pyrolysis of used automobile tires and residual char utilization. J. Anal. Appl. Pyrol. 2003, 70, 711-722.22. Rodriguez, I. d. M.; Laresgoiti, M. F.; Cabrero, M. A.; Torres, A.; Chomòn, M. J.; Caballero, B., Pyrolysis of scrap tyres. Fuel Process. Technol. 2001, 72, 9-22.23. Aylòn, E.; Fernàndez-Colino, A.; Navarro, M. V.; Murillo, R.; Garcìa, T.; Mastral, A. M., Waste Tire Pyrolysis: Comparison between Fixed Bed Reactor and Moving Bed Reactor. Ind. Eng. Chem. Res. 2008, 47, 4029-4033.24. Kaminsky, W.; Mennerich, C., Pyrolysis of synthetic tire rubber in a fluidised-bed reactor to yield 1,3-butadiene, styrene and carbon black. J. Anal. Appl. Pyrol. 2001, 58-59, 803-811.25. Chen, G.; Wu, D.; Weng, W.; Wu, C., Exfoliation of graphite flake and its nanocomposites. Carbon 2003, 41, 579-581.26. Vohler, O.; Nutsch, G.; Collin, G.; von Sturm, F.; Wege, E.; Frohs, W.; Henning, K.-D.; von Kienle, H.; Voll, M.; Kleinschmit, P.; Vostrowsky, O.; Hirsch, A., Carbon. In Ullmann's Encyclopedia of Industrial Chemistry, Wiley-VCH Verlag GmbH & Co. KGaA: 2000.27. López, F. A.; Centeno, T. A.; Alguacil, F. J.; Lobato, B.; López-Delgado, A.; Fermoso, J., Gasification of the char derived from distillation of granulated scrap tyres. Waste Manage. 2012, 32, 743-752.28. Ucar, S.; Karagoz, S.; Ozkan, A. R.; Yanik, J., Evaluation of two different scrap tires as hydrocarbon source by pyrolysis. Fuel 2005, 84, 1884–1892.29. Napoli, A.; Soudais, Y.; Lecomte, D.; Castillo, S., Scap Tyre pyrolysis: Are the effluents valuable products? J. Anal. Appl. Pyrol. 1997, 40-41, 373-382.30. Sahouli, B.; Blacher, S.; Brouers, F.; Sobry, R.; Van den Bossche, G.; Diez, D.; Darmstadt, H.; Roy, C.; Kaliaguine, S., Surface morphology of commercial carbon blacks and carbon blacks from pyrolysis of used tyres by small-angle X-ray scattering. Carbon 1996, 34, 633-637.31. The International Centre for Diffraction Data. http://www.icdd.com/ (Accessed: 15.03.2013), 32. Darmstadt, H.; Roy, C.; Kaliaguine, S., Characterization of pyrolytic carbon blacks from commercial tire pyrolysis plants. Carbon 1995, 33, 1449-1455.33. Darmstadt, H.; Roy, C.; Kaliaguine, S., ESCA characterization of commercial carbon blacks and of carbon blacks from vacuum pyrolysis of used tires. Carbon 1994, 32, 1399-1406.34. Horikoshi, S.; Matsubara, A.; Takayama, S.; Sato, M.; Sakai, F.; Kajitani, M.; Abe, M.; Serpone, N., Characterization of microwave effects on metal-oxide materials: Zinc oxide and titanium dioxide. Appl. Catal., B 2009, 91, 362-367.35. Lam, S. S.; Chase, H. A., A Review on Waste to Energy Processes Using Microwave Pyrolysis. Energies 2012, 5, 4209-4232.36. Menéndez, J. A.; Arenillas, A.; Fidalgo, B.; Fernández, Y.; Zubizarreta, L.; Calvo, E. G.; Bermúdez, J. M., Microwave heating processes involving carbon materials. Fuel Process. Technol. 2010, 91, 1-8.37. Williams, P. T.; Bottrill, R. P., Sulfur-polycyclic aromatic hydrocarbons in tyre pyrolysis oil. Fuel 1995, 74, 736-742.38. Mark, J. E.; Erman, B.; Eirich, F. R., Science and Technology of Rubber. 3

5 - Waste Tire 115
ed.; Elsevier Academic Press: Burlington, 2005.39. Myers, M. E.; Stollstelmer, J.; Wims, A. M., Determination of Hydrocarbon-Type Distribution’ and Hydrogen/Carbon Ratio of Gasolines by Nuclear Magnetic Resonance Spectrometry. Anal. Chem. 1975, 47, 2010-2015.40. Laresgoiti, M. F.; Caballero, B. M.; de Marco, I.; Torres, A.; Cabrero, M. A.; Chomón, M. J., Characterization of the liquid products obtained in tyre pyrolysis. J. Anal. Appl. Pyrol. 2004, 71, 917-934.41. Quek, A.; Balasubramanian, R., Liquefaction of waste tires by pyrolysis for oil and chemicals—A review. J. Anal. Appl. Pyrol. 2013, 101, 1-16.42. Frigo, S.; Seggiani, M.; Puccini, M.; Vitolo, S. Liquid fuel production from waste tyre pyrolysis and its utilisation in a Diesel engine. Fuel 2014, 116, 399-40843. Speight, J. G., The Chemistry and Technology of Petroleum. CRC Press: Laramie, Wyoming, 2006.44. Frediani, P.; Salvini, A.; Finocchiaro, S., Ruthenium carbonyls as benzo[b]thiophene hydrodesulfurization catalysts in homogeneous phase. J. Organomet. Chem. 1999, 584, 265-273.45. Bianchini, C.; Casares, J. A.; Meli, A.; Sernau, V.; Vizza, F.; Sànchez-Delgado, R. A., Efficient rhodium catalysts for the hydrogenolysis of thiophenic molecules in homogeneous phase. Polyhedron 1997, 16, 3099-3114.46. Vanrysselberghe, V.; Froment, G. F., Hydrodesulfurization of Dibenzothiophene on a CoMo/Al2O3 Catalyst: Reaction Network and Kinetics. Ind. Eng. Chem. Res. 1996, 35, 3311-3318.47. Sánchez-Delgado, R. A., Breaking C---S bonds with transition metal complexes. A review of molecular approaches to the study of the mechanisms of the hydrodesulfurization reaction. J. Mol. Catal. 1994, 86, 287-297.48. Froment, G. F.; Depauw, G. A.; Vanrysselberghe, V., Kinetic Modeling and Reactor Simulation in Hydrodesulfurization of Oil Fractions. Ind. Eng. Chem. Res. 1994, 33, 2975-2988.49. Bianchini, C.; Meli, A.; Vizza, F., Role of single-site catalysts in the hydrogenation of thiophenes: from models systems to effective HDS catalysts. J. Organomet. Chem. 2004, 689, 4277-4290.50. Chehata, A.; Oviedo, A.; Arévalo, A.; Bernès, S.; Garcìa, J. J., Reactivity of [Ru3(CO)12] with Dibenzothiophene, Methylbenzothiophene, and Methyldibenzothiophene. Organometallics 2003, 22, 1585-1587.

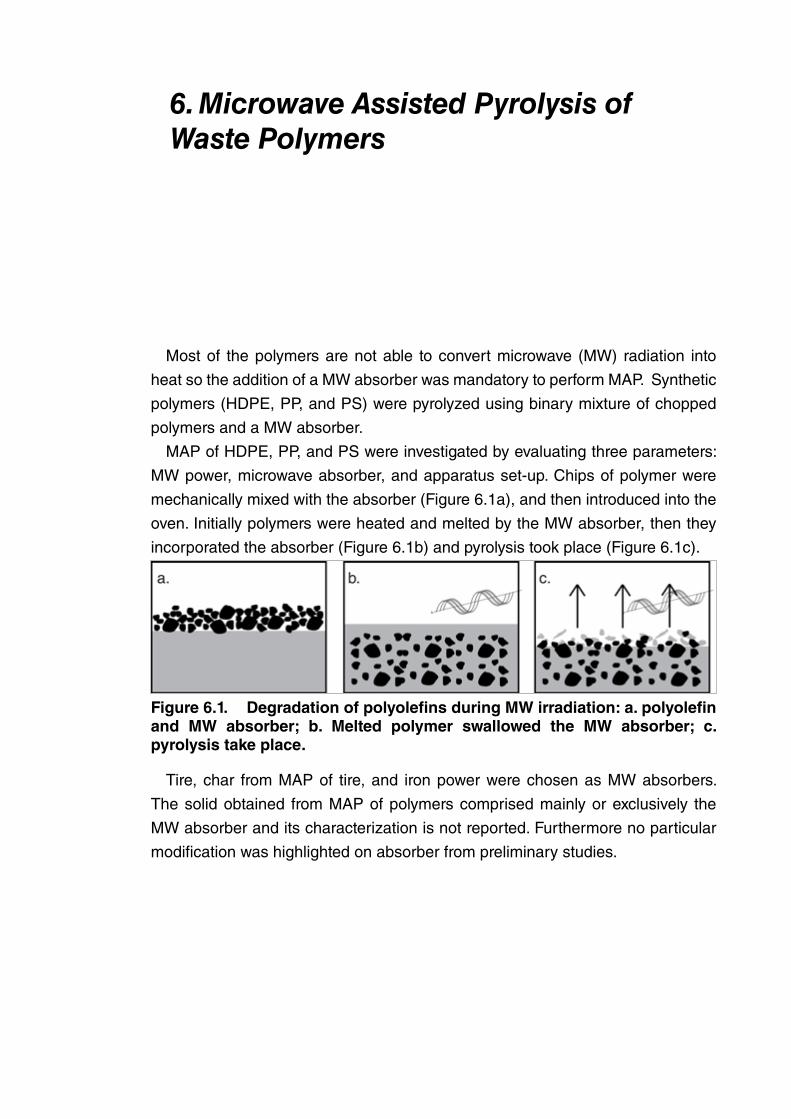
6. Microwave Assisted Pyrolysis of Waste Polymers
Most of the polymers are not able to convert microwave (MW) radiation into
heat so the addition of a MW absorber was mandatory to perform MAP. Synthetic
polymers (HDPE, PP, and PS) were pyrolyzed using binary mixture of chopped
polymers and a MW absorber.
MAP of HDPE, PP, and PS were investigated by evaluating three parameters:
MW power, microwave absorber, and apparatus set-up. Chips of polymer were
mechanically mixed with the absorber (Figure 6.1a), and then introduced into the
oven. Initially polymers were heated and melted by the MW absorber, then they
incorporated the absorber (Figure 6.1b) and pyrolysis took place (Figure 6.1c).
Figure 6.1. Degradation of polyolefins during MW irradiation: a. polyolefin and MW absorber; b. Melted polymer swallowed the MW absorber; c. pyrolysis take place.
Tire, char from MAP of tire, and iron power were chosen as MW absorbers.
The solid obtained from MAP of polymers comprised mainly or exclusively the
MW absorber and its characterization is not reported. Furthermore no particular
modification was highlighted on absorber from preliminary studies.

6 - Microwave Assisted Pyrolysis of Waste Polymers118
6.1. Polyethylene
MAP of HDPE was investigated with the aim to obtain liquid with tunable
properties from a wax to a low viscosity liquid. The results reported herein were
already partially published.1
6.1.1. Operating conditions and yields
the operating parameters employed (entries are named “PEn” where “n” is an
arbitrary ascending order for each experiment) are reported in Table 6.1.
Table 6.1. MAP of HDPE, operating parameters.
MAP of tire alone (entries T4 and T12) were reported as referring pyrolysis to
help results interpretation when tire was used as MW absorber. Indeed products
En
try
Set
-up
MW
Ab
sorb
erP
ow
erP
oly
mer
MW
Ab
sorb
erT
ime
So
lidL
iqu
idG
as
(kW
)a(g
)(g
)(m
in)
(wt%
)(w
t%)
(wt%
)
T4
AT
ire M
3-
233.
335
43.2
42.6
14.1
PE
1A
Tire
M1.
8(13
); 2.
7(4)
; 3.
0(16
)14
4.6
302.
733
31.3
47.9
20.7
PE
2A
Tire
M
1.2(
55);
1.5(
125)
; 2.
7(65
); 3.
0(10
); 6.
0(5)
106.
725
5.3
260
30.1
49.7
b20
.2
PE
3A
Car
bon
3.0(
61);
6.0(
14)
150.
570
.275
0.4
83.9
15.7
PE
4A
Fe
3.0
139.
359
.913
610
.681
.87.
6
T12
BT
ire M
3.0
-24
3.0
3646
.627
.625
.8
PE
5B
Tire
M1.
8(13
); 3(
47);
6.0(
60)
139.
528
5.0
120
33.2
43.9
c22
.9
PE
6B
Car
bon
3.0(
27);
6.0(
73)
115.
660
.010
00.
680
.219
.2
PE
7B
Fe
313
3.3
64.1
142
5.9
71.9
22.2
a) w
ithin
bra
cket
s th
e tim
e fo
r w
hich
eac
h M
W p
ower
was
em
ploy
ed.
b) t
wo
liqui
d fr
actio
ns w
ere
colle
cted
, th
e fir
st w
orki
ng b
etw
een
1.2-
2.7
kW (
yiel
d 12
.7 w
t%)
and
the
seco
nd b
etw
een
2.7-
6.0
kW
(yie
ld 3
7.0
wt%
); c)
tw
o liq
uid
frac
tions
wer
e co
llect
ed,
the
first
wor
king
bet
wee
n 1.
8-3.
0 kW
(yi
eld
17.8
wt%
) an
d th
e se
cond
bet
wee
n 3.
0-6.
0 kW
(yi
eld
26.1
wt%
).

6 - Microwave Assisted Pyrolysis of Waste Polymers 119
from MAP of tire were mixed with those from HDPE.
MAP of HDPE in the presence of tire as MW absorber (PE1, and the second
fraction of entry PE2_II, Table 6.1) gave a waxy product (from HDPE pyrolysis),
mixed with the liquid formed from tire pyrolysis, when a high MW power was
used. These waxy products were solid at room temperature. Using carbon as MW
absorber, liquid solidified already in cooling systems and in order to collect it the
temperature of the cooling system was set at 300 K (PE3, Table 6.1).
Working with a low MW power (among 1.2-2.7 kW, the first fraction of entry
PE2, Table 6.1) a more efficient degradation of HDPE to low molecular weight
compounds was obtained, and a semi-fluid liquid was collected (yield 12.7 wt%).
However at this level of MW power pyrolysis could not be completed and a fully
degradation of HDPE was only achieved by increasing MW power up to 6 kW
(yield of liquid 37.0 wt%, PE2L_II). Anyway this latter fraction was a wax/liquid
mixture with an appearance close to that one of entry PE1 as already outlined.
On the contrary set-up B allowed obtaining always a low viscosity liquid, fluid
at room temperature, in a short time using a high MW power in the presence of
carbon as MW absorber. This set-up allowed only distilling low boiling compounds
as outlined in Chapter 5. The heavy fraction, carried away by the gas and vapors
formed, was separated in the fractionating system and sent back to the oven
as expected (Entries PE5 – PE7, Table 6.1). Higher amount of gas was formed,
together with a low viscosity liquid, due to the increased efficiency of the pyrolysis.
A completely different behavior was observed when iron was the absorber and
a low viscosity liquid was always collected even if the MW power was kept at 3.0
kW for the entire pyrolysis (entry PE4). Iron showed an efficient interaction with
MW and it was heated in shorter time than tire and carbon. This effect led to a
fast pyrolysis of HDPE and short residence time. First of all working with set-up A,
a comparable yield in liquid was observed between entries PE4 and PE3 but for
PE4 a lower gas yield was formed. Higher solid yield was observed in entry PE4
than PE3 because cocking phenomena were improved. Working with set-up B the
cocking phenomenon was less effective but the gas formation was improved as
expected (entry PE7, Table 6.1).
The solid in MAP of HDPE in the presence of tire was accountable only to tire
residue, as confirmed by pyrolysis in the presence of carbon as MW absorber
(entries PE3 and PE6). The residue was 0.4 and 0.6 wt% respectively because
cocking, or formation of carbon structure from HDPE, was negligible. So far if tire
was the MW absorber the solid collected was attributable only to not-pyrolyzable
products present in tire.
Finally the MAP of HDPE in the presence of tire as MW absorber suggested the
possibility to perform MAP of any inorganic and/or organic pollutant containing
HDPE. In fact tire or carbon, other than MW absorber, could be seen as an

6 - Microwave Assisted Pyrolysis of Waste Polymers120
inorganic/polymeric pollutant mixed with waste HDPE which did not affect the
pyrolyses.
6.1.2. Liquid product
6.1.2.1. Physical properties
Physical properties of liquids, coded as “PEnL” where “n” is an arbitrary ascending
number for each experiment were strongly affected by reaction conditions (Table
6.2).
Table 6.2. Characteristic of liquid obtained by MAP of HDPE.
PE1L, PE2L_II, and PE3L were waxy liquids, solid at room temperature;
therefore density and viscosity were not evaluated. Using low MW power the
residence time of the polymer in the oven was increased because volatiles were
slower produced and the residence time was increased (no gas flow employed),
thus polymers degradation was considerably improved. As a result of this
experimental condition PE5L_I showed the lowest density and viscosity among
every experiment because it was collected in the first step of the process, when
very low MW power and set-up B were employed. Anyway this fraction was only
1/3 of the liquid collected. On the contrary PE5L_II had a higher viscosity and
density, even if it was partially diluted with the liquid from MAP of tire. However it
must be considered that the viscosity was only 1.31 cP while PE2L_II and PE3L
were solid at room temperature.
The C/H molar ratios of all liquids from MAP of HDPE were close and as
expected these values were lower than liquid from MAP of tire alone, confirming
a predominant aliphatic composition of these liquids.
All liquids showed very high calorific values and together with their extremely
EntryDensity Viscosity HHV LHV
Ultimate analysesC/H
molar ratio
C H N S
(g/cm3) (cP)(MJ/kg)
(MJ/kg)
(wt%) (wt%) (wt%) (wt%)
T4L 0.874 1.73 44±4 42±4 86.87 10.12 0.66 0.9 0.72
PE1L n.d. n.d. 42±4 40±4 83.01 12.86 1.03 0.8 0.54
PE2L_I 0.780 0.57 39±4 36±4 85.31 12.81 1.21 0.7 0.55
PE2L_II n.d. n.d. 43±4 41±4 86.05 7.06 2.11 0.5 1.02
PE3L n.d. n.d. 47±5 44±4 84.82 14.66 0.49 0.03 0.48
PE4L 0.777 n.d. 41±4 38±4 85.51 14.36 0.00 0.0 0.50
T12L 0.858 1.00 42±4 40±4 87.14 9.33 0.33 0.8 0.78
PE5L_I 0.763 0.49 41±4 39±4 83.53 12.32 1.00 0.4 0.57
PE5L_II 0.910 1.31 45±4 42±4 85.89 11.94 0.97 0.3 0.60
PE6L 0.762 1.04 48±5 44±4 84.58 15.37 0.00 0.0 0.46
PE7L 0.784 n.d. 42±4 39±4 84.83 14.53 0.00 0.0 0.49

6 - Microwave Assisted Pyrolysis of Waste Polymers 121
low heteroatoms content were suited for direct energy production or source of
chemicals.
6.1.2.2. GC/MS
All liquids contained a large number of compounds especially when tire pyrolysis
products were present. In Table 6.3 are listed only the most representative
compounds identified only from MAP of HDPE. Abundances were evaluated by
the TIC without any response factor correction. In Figure 6.2 and Figure 6.3are
reported TICs of PE2L_II and PE6L for visual comparative purposes.
Figure 6.2. TIC of samples obtained from MAP of HDPE with set-up A: PE2L_II.
Figure 6.3. TIC of samples obtained from MAP of HDPE with set-up B: PE6L.
MAP of HDPE gave mainly aliphatic hydrocarbons through the reaction schemes
reported in Figure 1.12a,b. Low amount of aromatic were present and they might
be formed through an aromatization process during the cracking of HDPE
followed by a radical rearrangement (Figure 1.12b) or a Diels Alder condensation
(Figure 1.12d).2 Large amount of aromatics were formed through pyrolysis of tire
due to polyisoprene cracking (Figure 1.19), or decomposition of other polymers
containing an aromatic moiety and present in tire (for instance styrene rubber,
Figure 1.14).
As a witness of this assumption PE4L, PE6L, and PE7L (obtained using Fe or
carbon as MW absorber) showed a low presence of aromatics, while T4L and
T12L, where only tire was pyrolyzed, showed the highest amount of aromatics.
Table 6.3. Compounds in liquids from MAP of HDPE.
Furthermore collecting the liquid in two fractions, higher amount of aromatics
were present in the first fraction collected when low MW power was used (PE1L_I

6 - Microwave Assisted Pyrolysis of Waste Polymers122an
d P
E5L
_I).
The
se fr
actio
ns w
ere
riche
r in
aro
mat
ics
than
PE
1L_I
I and
PE
5L_I
I res
pect
ivel
y. T
he a
rom
atic
com
poun
ds w
ere
the
sam
e E
ntry
T4L
PE
2L_I
PE
2L_I
IP
E4L
T12
SP
E5L
_IP
E5L
_II
PE
6LP
E7L
Set
-up
AA
AA
BB
BB
B
Abs
orbe
r-
Tire
MT
ire M
Fe
-T
ire M
Tire
MC
arbo
nF
e
n°T
ime
Sub
stan
cea.
c.
112
.02-
bute
ne-t
rans
C1.
51.
20.
80.
31.
11.
70.
60.
30.
2
212
.2bu
tane
C0.
20.
30.
20.
20.
00.
40.
10.
20.
2
312
.61-
bute
neC
0.2
0.1
0.1
0.1
0.1
0.2
0.1
0.1
0.0
414
.81-
pent
ene
C0.
30.
70.
60.
50.
10.
90.
80.
50.
5
515
.02-
pent
ene-
tran
sC
0.6
0.5
0.1
0.0
0.3
0.4
0.0
0.0
615
.3pe
ntan
eC
0.3
0.7
0.4
0.4
0.1
0.9
0.3
0.4
0.4
715
.52-
met
hyl-1
,3-b
utad
iene
C1.
71.
00.
20.
00.
61.
40.
10.
10.
0
815
.62-
pent
ene-
cis
C0.
20.
30.
20.
10.
20.
30.
20.
10.
0
916
.33-
met
hyl-1
-hex
ene
C1.
61.
20.
30.
00.
71.
50.
10.
10.
0
1016
.41.
4-pe
ntad
iene
P0.
20.
20.
20.
10.
20.
30.
20.
20.
1
1117
.1cy
clop
enta
dien
eP
0.3
0.2
0.2
0.1
0.3
0.3
0.3
0.1
0.1
1221
.21-
hexe
neC
0.4
1.9
1.6
1.5
0.2
3.2
2.7
1.4
1.6
1322
.1he
xane
C0.
01.
00.
60.
70.
11.
20.
50.
60.
5
1422
.52-
hexe
neP
0.1
0.0
0.2
0.1
0.0
0.0
0.1
0.1
0.0
1524
.7m
ethy
lcyc
lope
ntan
eP
0.2
0.3
0.2
0.3
0.4
0.1
0.2
0.2
1626
.93-
met
hylc
yclo
pent
ene
P0.
60.
70.
30.
20.
10.
60.
20.
40.
1
1727
.0be
nzen
eC
1.8
1.6
0.9
0.1
0.8
1.1
1.3
0.1
0.1
1829
.5cy
cloh
exen
eP
0.3
0.4
0.2
0.1
0.1
0.3
0.2
0.2
0.1
1930
.91-
hept
ene
C0.
31.
71.
51.
40.
12.
72.
21.
51.
4
2032
.1he
ptan
eC
0.3
1.4
0.8
1.1
0.1
1.9
0.7
1.1
1.0
2132
.52-
hept
ene
P0.
10.
20.
10.
10.
00.
20.
10.
10.
1
2234
.2m
ethy
lcyc
lohe
xane
P0.
20.
10.
30.
10.
10.
30.
2
(continue)
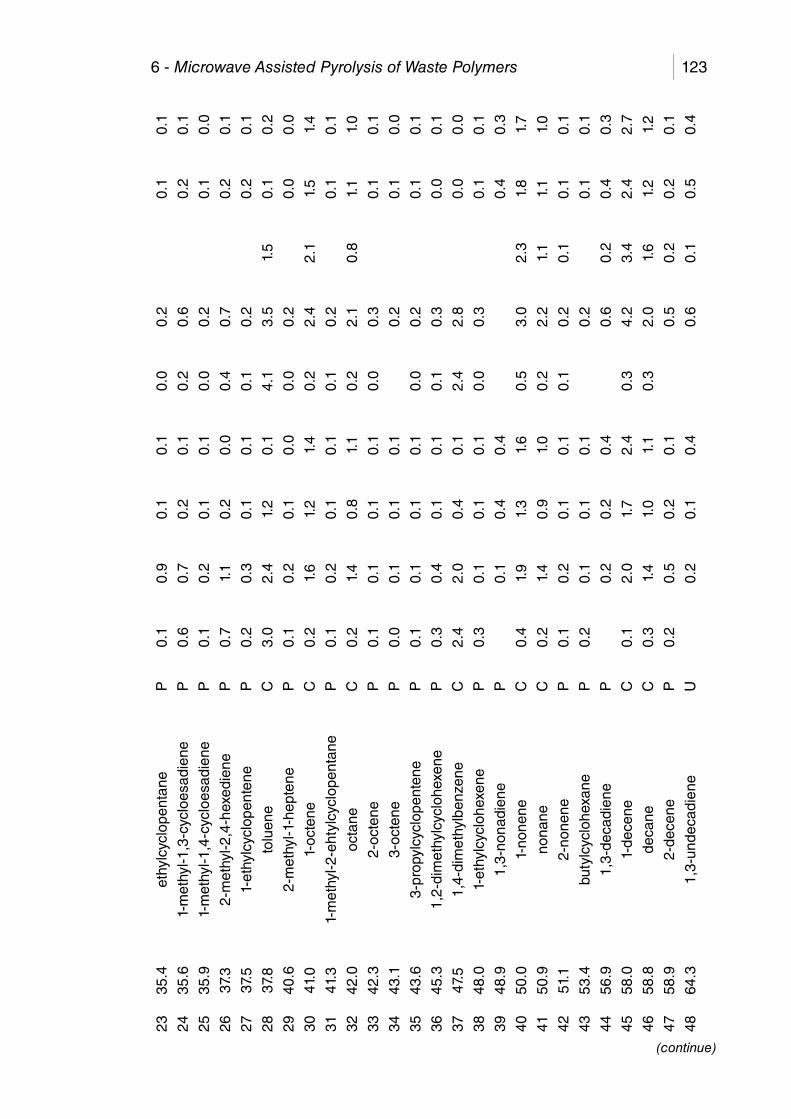
6 - Microwave Assisted Pyrolysis of Waste Polymers 123
2335
.4et
hylc
yclo
pent
ane
P0.
10.
90.
10.
10.
00.
20.
10.
1
2435
.61-
met
hyl-1
,3-c
yclo
esad
iene
P0.
60.
70.
20.
10.
20.
60.
20.
1
2535
.91-
met
hyl-1
,4-c
yclo
esad
iene
P0.
10.
20.
10.
10.
00.
20.
10.
0
2637
.32-
met
hyl-2
,4-h
exed
iene
P0.
71.
10.
20.
00.
40.
70.
20.
1
2737
.51-
ethy
lcyc
lope
nten
eP
0.2
0.3
0.1
0.1
0.1
0.2
0.2
0.1
2837
.8to
luen
eC
3.0
2.4
1.2
0.1
4.1
3.5
1.5
0.1
0.2
2940
.62-
met
hyl-1
-hep
tene
P0.
10.
20.
10.
00.
00.
20.
00.
0
3041
.01-
octe
neC
0.2
1.6
1.2
1.4
0.2
2.4
2.1
1.5
1.4
3141
.31-
met
hyl-2
-eht
ylcy
clop
enta
neP
0.1
0.2
0.1
0.1
0.1
0.2
0.1
0.1
3242
.0oc
tane
C0.
21.
40.
81.
10.
22.
10.
81.
11.
0
3342
.32-
octe
neP
0.1
0.1
0.1
0.1
0.0
0.3
0.1
0.1
3443
.13-
octe
neP
0.0
0.1
0.1
0.1
0.2
0.1
0.0
3543
.63-
prop
ylcy
clop
ente
neP
0.1
0.1
0.1
0.1
0.0
0.2
0.1
0.1
3645
.31,
2-di
met
hylc
yclo
hexe
neP
0.3
0.4
0.1
0.1
0.1
0.3
0.0
0.1
3747
.51,
4-di
met
hylb
enze
neC
2.4
2.0
0.4
0.1
2.4
2.8
0.0
0.0
3848
.01-
ethy
lcyc
lohe
xene
P0.
30.
10.
10.
10.
00.
30.
10.
1
3948
.91,
3-no
nadi
ene
P0.
10.
40.
40.
40.
3
4050
.01-
none
neC
0.4
1.9
1.3
1.6
0.5
3.0
2.3
1.8
1.7
4150
.9no
nane
C0.
21.
40.
91.
00.
22.
21.
11.
11.
0
4251
.12-
none
neP
0.1
0.2
0.1
0.1
0.1
0.2
0.1
0.1
0.1
4353
.4bu
tylc
yclo
hexa
neP
0.2
0.1
0.1
0.1
0.2
0.1
0.1
4456
.91,
3-de
cadi
ene
P0.
20.
20.
40.
60.
20.
40.
3
4558
.01-
dece
neC
0.1
2.0
1.7
2.4
0.3
4.2
3.4
2.4
2.7
4658
.8de
cane
C0.
31.
41.
01.
10.
32.
01.
61.
21.
2
4758
.92-
dece
neP
0.2
0.5
0.2
0.1
0.5
0.2
0.2
0.1
4864
.31,
3-un
deca
dien
eU
0.2
0.1
0.4
0.6
0.1
0.5
0.4
(continue)
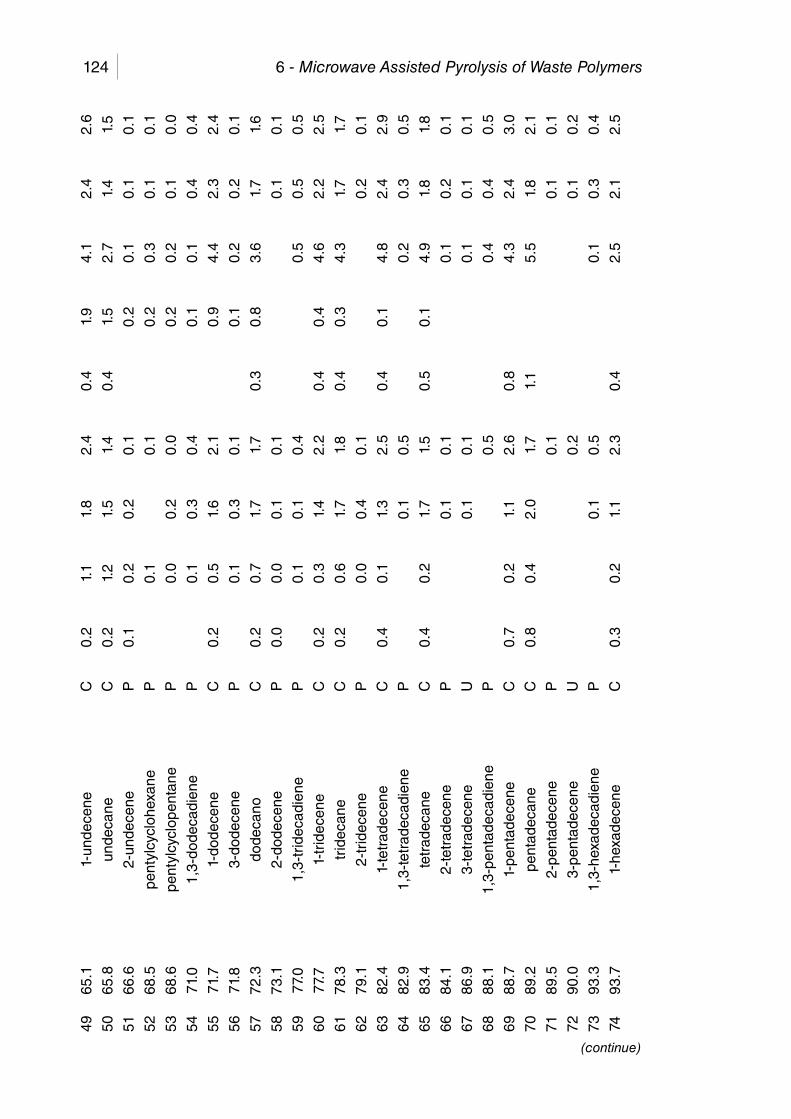
6 - Microwave Assisted Pyrolysis of Waste Polymers12449
65.1
1-un
dece
neC
0.2
1.1
1.8
2.4
0.4
1.9
4.1
2.4
2.6
5065
.8un
deca
neC
0.2
1.2
1.5
1.4
0.4
1.5
2.7
1.4
1.5
5166
.62-
unde
cene
P0.
10.
20.
20.
10.
20.
10.
10.
1
5268
.5pe
ntyl
cycl
ohex
ane
P0.
10.
10.
20.
30.
10.
1
5368
.6pe
ntyl
cycl
open
tane
P0.
00.
20.
00.
20.
20.
10.
0
5471
.01,
3-do
deca
dien
eP
0.1
0.3
0.4
0.1
0.1
0.4
0.4
5571
.71-
dode
cene
C0.
20.
51.
62.
10.
94.
42.
32.
4
5671
.83-
dode
cene
P0.
10.
30.
10.
10.
20.
20.
1
5772
.3do
deca
noC
0.2
0.7
1.7
1.7
0.3
0.8
3.6
1.7
1.6
5873
.12-
dode
cene
P0.
00.
00.
10.
10.
10.
1
5977
.01,
3-tr
idec
adie
neP
0.1
0.1
0.4
0.5
0.5
0.5
6077
.71-
trid
ecen
eC
0.2
0.3
1.4
2.2
0.4
0.4
4.6
2.2
2.5
6178
.3tr
idec
ane
C0.
20.
61.
71.
80.
40.
34.
31.
71.
7
6279
.12-
trid
ecen
eP
0.0
0.4
0.1
0.2
0.1
6382
.41-
tetr
adec
ene
C0.
40.
11.
32.
50.
40.
14.
82.
42.
9
6482
.91,
3-te
trad
ecad
iene
P0.
10.
50.
20.
30.
5
6583
.4te
trad
ecan
eC
0.4
0.2
1.7
1.5
0.5
0.1
4.9
1.8
1.8
6684
.12-
tetr
adec
ene
P0.
10.
10.
10.
20.
1
6786
.93-
tetr
adec
ene
U0.
10.
10.
10.
10.
1
6888
.11,
3-pe
ntad
ecad
iene
P0.
50.
40.
40.
5
6988
.71-
pent
adec
ene
C0.
70.
21.
12.
60.
84.
32.
43.
0
7089
.2pe
ntad
ecan
eC
0.8
0.4
2.0
1.7
1.1
5.5
1.8
2.1
7189
.52-
pent
adec
ene
P0.
10.
10.
1
7290
.03-
pent
adec
ene
U0.
20.
10.
2
7393
.31,
3-he
xade
cadi
ene
P0.
10.
50.
10.
30.
4
7493
.71-
hexa
dece
neC
0.3
0.2
1.1
2.3
0.4
2.5
2.1
2.5
(continue)

6 - Microwave Assisted Pyrolysis of Waste Polymers 125
7594
.1he
xade
cane
C0.
20.
31.
61.
80.
34.
11.
92.
2
7694
.52-
hexa
dece
neP
0.2
0.2
0.2
0.2
7795
.03-
hexa
dece
neP
0.2
0.2
0.3
0.2
7898
.11,
3-he
ptad
ecad
iene
P0.
10.
30.
50.
40.
4
7998
.41-
hept
adec
ene
C0.
20.
10.
82.
30.
21.
32.
02.
4
8098
.9he
ptad
ecan
eC
0.9
0.3
1.7
1.9
1.2
3.0
1.9
2.3
8199
.0cy
cloh
epat
adec
ane
P0.
20.
30.
2
8299
.72-
hept
adec
ene
P0.
20.
10.
20.
2
8310
2.7
1,3-
octa
deca
dien
eP
0.1
0.5
0.4
0.3
8410
3.3
1-oc
tade
cene
C0.
30.
62.
32.
01.
82.
1
8510
3.6
octa
deca
neC
0.3
1.4
2.2
0.3
1.9
2.5
8610
4.4
2-oc
tade
cene
P0.
20.
20.
10.
2
8710
5.9
3-oc
tade
cene
U0.
10.
20.
20.
2
8810
7.6
1,3-
nona
deca
dien
eP
0.1
0.1
0.4
0.3
0.3
8910
8.2
1-no
nade
cene
C0.
10.
10.
62.
10.
01.
31.
71.
8
9010
8.7
nona
deca
neC
0.1
0.2
1.3
2.1
0.0
2.0
2.6
9110
9.5
2-no
nade
cene
U0.
00.
20.
20.
30.
2
9211
2.9
decy
lcyc
lohe
xane
P0.
10.
10.
20.
1
9311
3.2
1,3-
icos
adie
neP
0.0
0.2
0.3
0.1
0.1
9411
3.8
1-ic
osen
eC
0.1
0.4
1.9
0.2
1.2
1.4
9511
4.4
icos
ane
C0.
22.
12.
20.
81.
52.
5
9611
5.3
2-ic
osen
eP
0.1
0.2
0.0
0.2
9711
9.9
1,3-
heni
cosd
iene
P0.
30.
40.
20.
1
9812
0.6
1-he
nico
sene
P0.
10.
41.
50.
10.
61.
0
9912
1.3
heni
cosa
neP
0.1
2.1
2.3
0.5
1.2
2.2
100
122.
52-
heni
cose
neP
0.1
0.3
0.1
0.2
(continue)
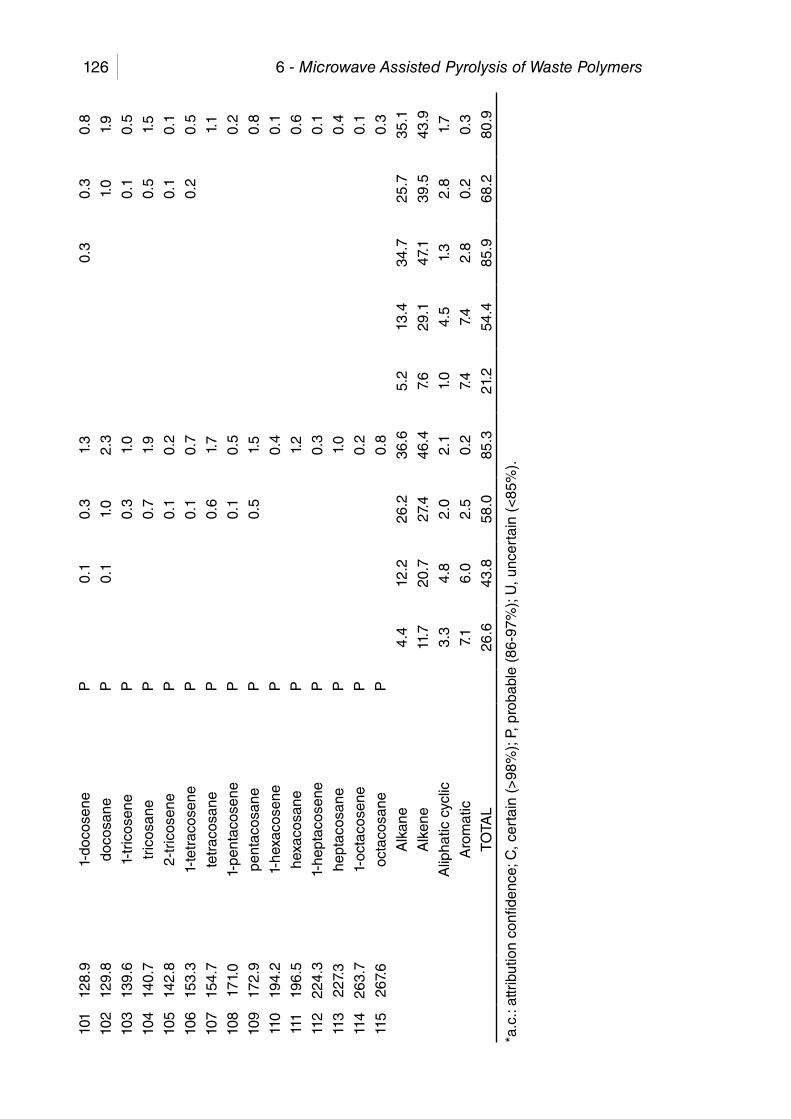
6 - Microwave Assisted Pyrolysis of Waste Polymers12610
112
8.9
1-do
cose
neP
0.1
0.3
1.3
0.3
0.3
0.8
102
129.
8do
cosa
neP
0.1
1.0
2.3
1.0
1.9
103
139.
61-
tric
osen
eP
0.3
1.0
0.1
0.5
104
140.
7tr
icos
ane
P0.
71.
90.
51.
5
105
142.
82-
tric
osen
eP
0.1
0.2
0.1
0.1
106
153.
31-
tetr
acos
ene
P0.
10.
70.
20.
5
107
154.
7te
trac
osan
eP
0.6
1.7
1.1
108
171.
01-
pent
acos
ene
P0.
10.
50.
2
109
172.
9pe
ntac
osan
eP
0.5
1.5
0.8
110
194.
21-
hexa
cose
neP
0.4
0.1
111
196.
5he
xaco
sane
P1.
20.
6
112
224.
31-
hept
acos
ene
P0.
30.
1
113
227.
3he
ptac
osan
eP
1.0
0.4
114
263.
71-
octa
cose
neP
0.2
0.1
115
267.
6oc
taco
sane
P0.
80.
3
Alk
ane
4.4
12.2
26.2
36.6
5.2
13.4
34.7
25.7
35.1
Alk
ene
11.7
20.7
27.4
46.4
7.6
29.1
47.1
39.5
43.9
Alip
hatic
cyc
lic3.
34.
82.
02.
11.
04.
51.
32.
81.
7
Aro
mat
ic7.
16.
02.
50.
27.
47.
42.
80.
20.
3
TOTA
L26
.643
.858
.085
.321
.254
.485
.968
.280
.9
*a.c
.: at
trib
utio
n co
nfide
nce;
C, c
erta
in (
>98
%);
P, p
roba
ble
(86-
97%
); U
, unc
erta
in (
<85
%).
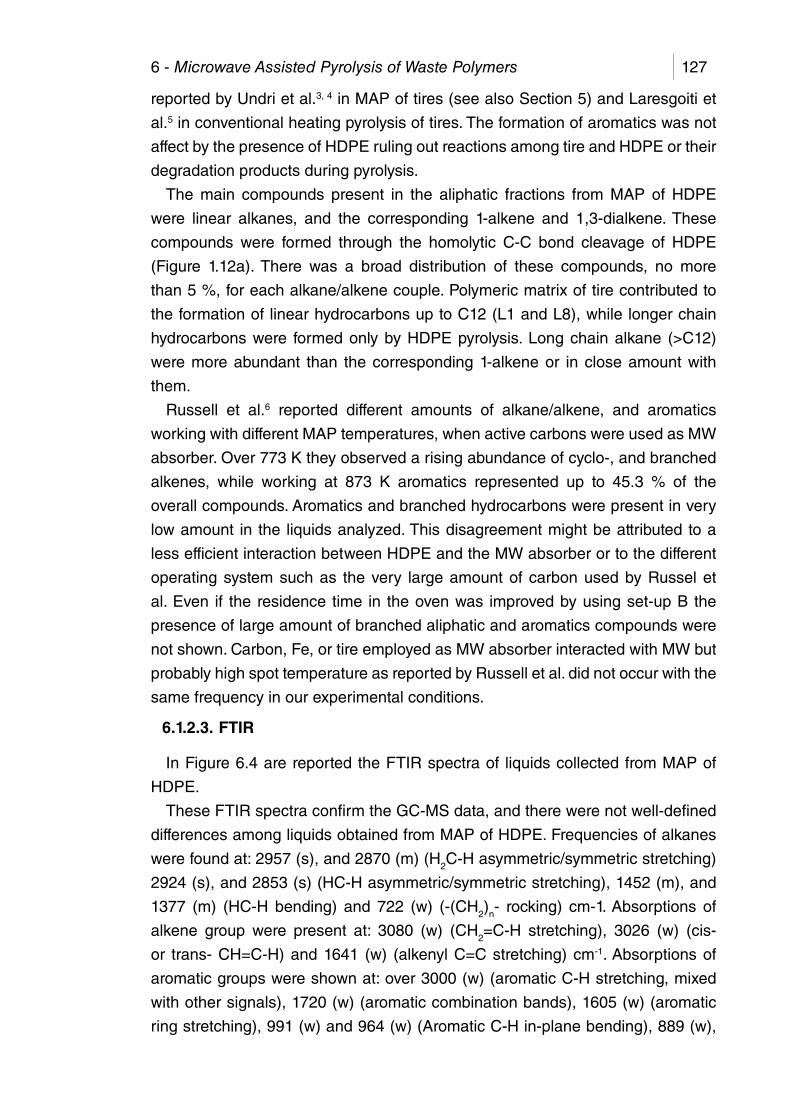
6 - Microwave Assisted Pyrolysis of Waste Polymers 127
reported by Undri et al.3, 4 in MAP of tires (see also Section 5) and Laresgoiti et
al.5 in conventional heating pyrolysis of tires. The formation of aromatics was not
affect by the presence of HDPE ruling out reactions among tire and HDPE or their
degradation products during pyrolysis.
The main compounds present in the aliphatic fractions from MAP of HDPE
were linear alkanes, and the corresponding 1-alkene and 1,3-dialkene. These
compounds were formed through the homolytic C-C bond cleavage of HDPE
(Figure 1.12a). There was a broad distribution of these compounds, no more
than 5 %, for each alkane/alkene couple. Polymeric matrix of tire contributed to
the formation of linear hydrocarbons up to C12 (L1 and L8), while longer chain
hydrocarbons were formed only by HDPE pyrolysis. Long chain alkane (>C12)
were more abundant than the corresponding 1-alkene or in close amount with
them.
Russell et al.6 reported different amounts of alkane/alkene, and aromatics
working with different MAP temperatures, when active carbons were used as MW
absorber. Over 773 K they observed a rising abundance of cyclo-, and branched
alkenes, while working at 873 K aromatics represented up to 45.3 % of the
overall compounds. Aromatics and branched hydrocarbons were present in very
low amount in the liquids analyzed. This disagreement might be attributed to a
less efficient interaction between HDPE and the MW absorber or to the different
operating system such as the very large amount of carbon used by Russel et
al. Even if the residence time in the oven was improved by using set-up B the
presence of large amount of branched aliphatic and aromatics compounds were
not shown. Carbon, Fe, or tire employed as MW absorber interacted with MW but
probably high spot temperature as reported by Russell et al. did not occur with the
same frequency in our experimental conditions.
6.1.2.3. FTIR
In Figure 6.4 are reported the FTIR spectra of liquids collected from MAP of
HDPE.
These FTIR spectra confirm the GC-MS data, and there were not well-defined
differences among liquids obtained from MAP of HDPE. Frequencies of alkanes
were found at: 2957 (s), and 2870 (m) (H2C-H asymmetric/symmetric stretching)
2924 (s), and 2853 (s) (HC-H asymmetric/symmetric stretching), 1452 (m), and
1377 (m) (HC-H bending) and 722 (w) (-(CH2)n- rocking) cm-1. Absorptions of
alkene group were present at: 3080 (w) (CH2=C-H stretching), 3026 (w) (cis-
or trans- CH=C-H) and 1641 (w) (alkenyl C=C stretching) cm-1. Absorptions of
aromatic groups were shown at: over 3000 (w) (aromatic C-H stretching, mixed
with other signals), 1720 (w) (aromatic combination bands), 1605 (w) (aromatic
ring stretching), 991 (w) and 964 (w) (Aromatic C-H in-plane bending), 889 (w),

6 - Microwave Assisted Pyrolysis of Waste Polymers128
813 (w), 696 (m) and 677 (m) (Aromatic C-H out-of plane bending) cm-1. Aromatic
absorptions were not present, as expected, in PE3L, PE4L, PE6L, and PE7L
(Figure 6.4a,b,c,d) because these liquids were exclusively formed through MAP of
HDPE in the presence of carbon or Fe as MW absorber and they did not contain
any compounds from tire pyrolysis.
Figure 6.4. FT-IR spectra of liquids: a) PE1L; b) PE5L_I; c) PE3L; d) PE6L.
Very close FTIR spectra were collected from liquids obtained in different MAP
conditions; small differences were accountable only for the compounds formed in
the degradation of the MW absorber.
6.1.2.4. Distillation curve
The amount of distillate collected below 473 K, the total distillable fraction, and
the maximum distillation temperature are reported in Table 6.4.
PE1L and PE3L were solid at room temperature and they were not distillable in
the condition reported.
Liquids collected from MAP of HDPE PE2L_I and PE5L_I, both obtained using
low MW power, were distillable in large extent below 473 K. Amounts of these
distillates were close and apparently there was no strong influence of set-up when
low MW power was employed. However must be noted that PE5L_I was 17.8 wt%,
which was significantly higher than the amount of PE2L_I (12.7 wt %).
Using Fe as absorber only 10.81 wt% of liquids were distilled below 473 K and

6 - Microwave Assisted Pyrolysis of Waste Polymers 129
the remaining fraction was not distilled over 473 K, even for PE7L which was
obtained through set-up B.
Table 6.4. Distillation of liquids from MAP of HDPE.
Entry Set-upMW
Absorber
Distilled below 473 K
Distilled over
473 K
Tmax Distillation
Total distilled
Not distilled
(%) (%) (K) (%) (%)
T4L A Tire M 29.18 29.25 528 58.43 41.57
PE2L_I A Tire M 72.53 0.00 468 72.53 27.47
PE2L_II A Tire M 11.54 35.15 518 46.68 53.32
PE4L A Fe 10.31 0.00 365 10.31 89.69
T12L B Tire M 43.28 37.35 579 80.63 19.37
PE5L_I B Tire M 81.93 0.00 474 81.93 18.87
PE5L_II B Tire M 31.69 5.18 511 36.87 63.13
PE6L B Carbon 30.35 45.45 519 75.80 24.20
PE7L B Fe 31.94 0.00 365 31.94 68.06
Working with set-up B the amount distilled below 473 K increased three times
respectively from PE2L_II and PE5L_II, PE4L and PE7L.
Finally the distillation curve showed the possibility to employ these liquid
as fuels especially those obtained when carbon or Fe were the MW absorber
because they did not contain any sulfur compounds. On the contrary liquids from
MAP of polyolefin using tire as MW absorber contained sulfur compounds due to
the liquid formed through pyrolysis of tire.

6 - Microwave Assisted Pyrolysis of Waste Polymers130
6.2. Polypropylene
MAP of PP was investigated in order to obtain worthwhile liquids with tunable
proprieties. The results reported herein were already partially published.1
6.2.1. Operating conditions and yields
In Table 6.5 are reported the operating parameters employed (entries are named
“PPn” where “n” is an arbitrary ascending order for each experiment).
Table 6.5. MAP of PP, operating parameters.
MAP of tire alone (entry T4) was reported as referring pyrolysis to help results
interpretation of entry when tire was used as MW absorber. Indeed products from
MAP of tire were mixed with those from PP.
MAP of PP gave a low viscosity liquid in any pyrolysis condition due to its lower
stability7 than HDPE and using a reaction time to 50 min a complete degradation
En
try
Set
-up
MW
Ab
sorb
erP
ow
erP
oly
mer
MW
Ab
sorb
erT
ime
So
lidL
iqu
idG
as
(kW
)a(g
)(g
)(m
in)
(wt%
)(w
t%)
(wt%
)
T4
AT
ire M
3-
233.
335
43.2
42.6
14.1
PP
1A
Tire
M1.
8(9)
; 2.
7(5)
; 3.
0(36
)
126.
725
8.7
5029
.458
.911
.7
PP
2A
Car
bon
3.0(
63);
6.0(
5)14
2.2
82.9
6812
.074
.713
.3
PP
3A
Car
bon
1.2(
120)
; 1.
5(42
); 2.
7(12
); 3.
0(21
); 6.
0 (3
2)
124.
057
.621
511
.960
.627
.5
PP
4A
Fe
3.0
117.
262
.660
11.1
56.7
32.2
PP
5B
Car
bon
3.0
123.
846
.740
9.1
56.5
34.4
PP
6B
Fe
3.0
114.
064
.977
13.3
45.6
41.1
a) w
ithin
bra
cket
s th
e tim
e fo
r w
hich
eac
h M
W p
ower
was
em
ploy
ed.

6 - Microwave Assisted Pyrolysis of Waste Polymers 131
was achieved (entry PP1, Table 6.5).
In MAP of PP an efficient cracking was achieved and a low viscosity liquid was
formed.
There was always high formation of solid (roughly 10 wt%) when carbon and
Fe were MW absorber (PP2 – PP6). Anyway the pyrolyzed PP contained large
amount of ash (5.5 % as evaluated by proximate analysis, “Appendix I: Materials
and Instruments”), and char amount could be partially attributable to coking
reactions.
Formation of liquid was reduced and formation of gas was increased when
working with set-up B instead of set-up A, and using Fe as MW absorber instead
of carbon. Indeed the lowest liquid yield was achieved for PP6 (45.6 %; Fe as
absorber and set-up B), while the highest liquid yield was obtained for PP2 (74.7
%; carbon as absorber and set-up A).
6.2.2. Liquid product
6.2.2.1. Physical properties
Physical properties of liquids, coded as “PPnL” where “n” is the pyrolysis entry,
Table 6.6, were strongly affected by reaction conditions.
Table 6.6. Characteristic of liquid obtained by MAP of PP.
EntryDensity Viscosity HHV LHV
Ultimate analyses C/H molar ratio
C H N S(g/cm3) (cP) (MJ/kg) (MJ/kg) (wt%) (wt%) (wt%) (wt%)
T4 0.874 1.73 44±4 42±4 86.87 10.12 0.66 0.9 0.72
PP1L 0.831 2.99 46±5 44±4 84.54 11.71 1.93 0.5 0.61
PP2L 0.746 >4 38±4 34±3 84.30 14.34 0.00 0.1 0.49
PP3L 0.746 0.63 38±4 35±4 85.53 14.48 0.00 0.0 0.50
PP4L 0.752 >4 38±4 35±4 85.12 14.03 0.00 0.0 0.50
PP5L 0.760 0.95 41±4 38±4 85.60 14.41 0.00 0.0 0.50
PP6L 0.746 0.57 39±4 37±4 85.34 14.38 0.00 0.0 0.50
MAP of PP gave always low viscosity liquid (0.63-4.0 cP) with almost the same
low density when tire pyrolysis products were not present (0.746 – 0.760 g/cm3).
C/H molar ratios of all liquids from MAP of PP were close and as expected they
were lower than liquid from MAP of tire alone, confirming the prevailing aliphatic
composition of these liquids.
All liquids had a high calorific value (LHV about 35 MJ/Kg) and could be
employed for energy production or as a source of chemicals.
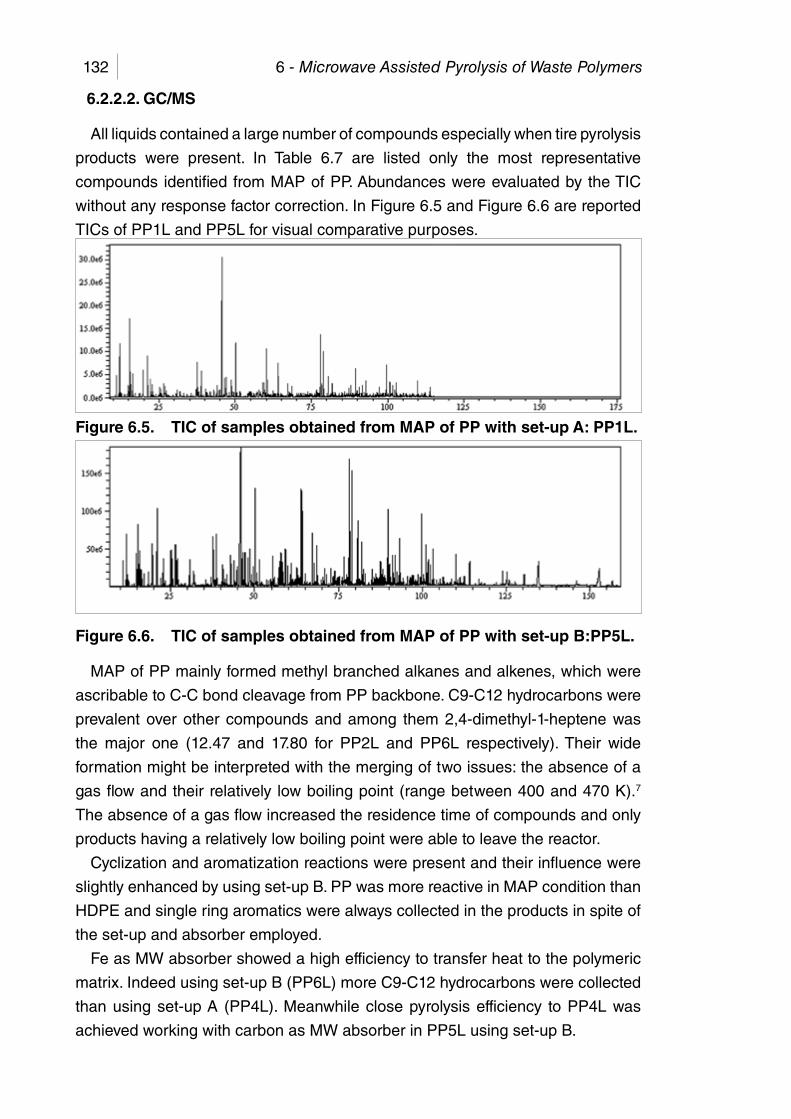
6 - Microwave Assisted Pyrolysis of Waste Polymers132
6.2.2.2. GC/MS
All liquids contained a large number of compounds especially when tire pyrolysis
products were present. In Table 6.7 are listed only the most representative
compounds identified from MAP of PP. Abundances were evaluated by the TIC
without any response factor correction. In Figure 6.5 and Figure 6.6 are reported
TICs of PP1L and PP5L for visual comparative purposes.
Figure 6.5. TIC of samples obtained from MAP of PP with set-up A: PP1L.
Figure 6.6. TIC of samples obtained from MAP of PP with set-up B:PP5L.
MAP of PP mainly formed methyl branched alkanes and alkenes, which were
ascribable to C-C bond cleavage from PP backbone. C9-C12 hydrocarbons were
prevalent over other compounds and among them 2,4-dimethyl-1-heptene was
the major one (12.47 and 17.80 for PP2L and PP6L respectively). Their wide
formation might be interpreted with the merging of two issues: the absence of a
gas flow and their relatively low boiling point (range between 400 and 470 K).7
The absence of a gas flow increased the residence time of compounds and only
products having a relatively low boiling point were able to leave the reactor.
Cyclization and aromatization reactions were present and their influence were
slightly enhanced by using set-up B. PP was more reactive in MAP condition than
HDPE and single ring aromatics were always collected in the products in spite of
the set-up and absorber employed.
Fe as MW absorber showed a high efficiency to transfer heat to the polymeric
matrix. Indeed using set-up B (PP6L) more C9-C12 hydrocarbons were collected
than using set-up A (PP4L). Meanwhile close pyrolysis efficiency to PP4L was
achieved working with carbon as MW absorber in PP5L using set-up B.
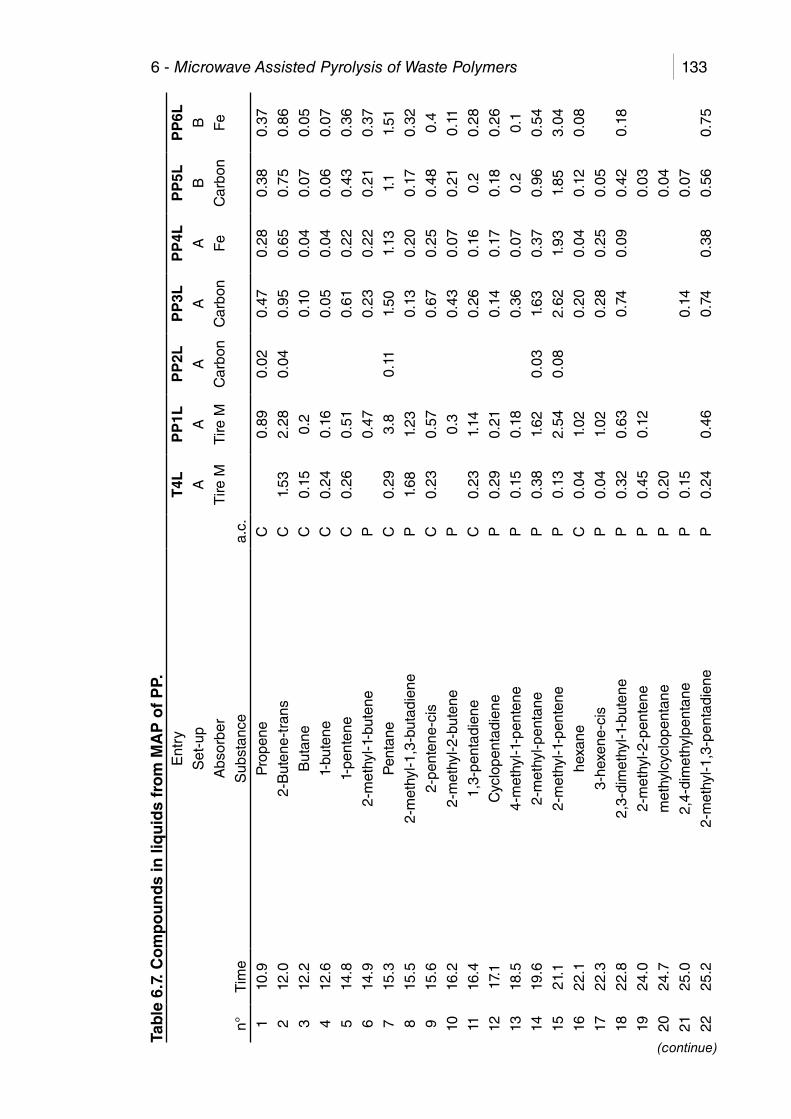
6 - Microwave Assisted Pyrolysis of Waste Polymers 133
Tab
le 6
.7. C
om
po
un
ds
in li
qu
ids
fro
m M
AP
of
PP.
Ent
ryT
4LP
P1L
PP
2LP
P3L
PP
4LP
P5L
PP
6LS
et-u
pA
AA
AA
BB
Abs
orbe
rT
ire M
Tire
MC
arbo
nC
arbo
nF
eC
arbo
nF
e
n°T
ime
Sub
stan
cea.
c.
110
.9P
rope
neC
0.89
0.02
0.47
0.28
0.38
0.37
212
.02-
But
ene-
tran
sC
1.53
2.28
0.04
0.95
0.65
0.75
0.86
312
.2B
utan
eC
0.15
0.2
0.10
0.04
0.07
0.05
412
.61-
bute
neC
0.24
0.16
0.05
0.04
0.06
0.07
514
.81-
pent
ene
C0.
260.
510.
610.
220.
430.
36
614
.92-
met
hyl-1
-but
ene
P0.
470.
230.
220.
210.
37
715
.3P
enta
neC
0.29
3.8
0.11
1.50
1.13
1.1
1.51
815
.52-
met
hyl-1
,3-b
utad
iene
P1.
681.
230.
130.
200.
170.
32
915
.62-
pent
ene-
cis
C0.
230.
570.
670.
250.
480.
4
1016
.22-
met
hyl-2
-but
ene
P0.
30.
430.
070.
210.
11
1116
.41,
3-pe
ntad
iene
C0.
231.
140.
260.
160.
20.
28
1217
.1C
yclo
pent
adie
neP
0.29
0.21
0.14
0.17
0.18
0.26
1318
.54-
met
hyl-1
-pen
tene
P0.
150.
180.
360.
070.
20.
1
1419
.62-
met
hyl-p
enta
neP
0.38
1.62
0.03
1.63
0.37
0.96
0.54
1521
.12-
met
hyl-1
-pen
tene
P0.
132.
540.
082.
621.
931.
853.
04
1622
.1he
xane
C0.
041.
020.
200.
040.
120.
08
1722
.33-
hexe
ne-c
isP
0.04
1.02
0.28
0.25
0.05
1822
.82,
3-di
met
hyl-1
-but
ene
P0.
320.
630.
740.
090.
420.
18
1924
.02-
met
hyl-2
-pen
tene
P0.
450.
120.
03
2024
.7m
ethy
lcyc
lope
ntan
eP
0.20
0.04
2125
.02,
4-di
met
hylp
enta
neP
0.15
0.14
0.07
2225
.22-
met
hyl-1
,3-p
enta
dien
eP
0.24
0.46
0.74
0.38
0.56
0.75
(continue)

6 - Microwave Assisted Pyrolysis of Waste Polymers13423
25.3
1,3-
cycl
ohex
adie
neP
0.36
0.22
0.10
0.06
0.11
0.13
2425
.51,
3-he
xadi
ene
P0.
250.
410.
520.
230.
420.
48
2525
.71,
4-cy
cloh
exad
iene
P0.
290.
180.
100.
10.
13
2626
.41
2,4-
dim
ethy
l-1-p
ente
neP
0.79
0.02
1.19
0.48
0.71
0.83
2726
.93-
met
hyl-c
yclo
pent
ene
P0.
580.
230.
140.
040.
090.
08
2827
.0be
nzen
eC
1.76
0.64
0.38
0.46
0.50
0.81
2927
.43,
4-di
met
hyl-2
-pen
tene
P0.
420.
120.
590.
350.
420.
66
3028
.44-
met
hyl-1
-hex
ene
P0.
090.
060.
020.
030.
05
3129
.5C
yclo
hexe
neP
0.33
0.05
0.10
0.05
0.06
3230
.91-
hept
ene
C0.
330.
360.
490.
250.
480.
46
3332
.02,
4-di
met
hyl-1
,3-p
enta
dien
eP
0.60
0.23
0.44
0.12
0.24
0.19
3432
.1H
epta
neC
0.29
0.18
0.32
0.05
0.19
0.19
3532
.32-
met
hyl-2
-hex
ene
P0.
120.
150.
120.
030.
060.
1
3637
.32-
met
hyl-2
,4-h
exed
iene
P0.
740.
440.
250.
120.
170.
22
3737
.8to
luen
eC
2.95
2.30
1.27
0.84
1.13
1.52
3837
.70
4-m
ethy
l-3-h
epte
neP
0.47
0.83
0.43
0.57
0.79
3938
.43,
3-di
met
hyl-1
-hex
ene
P0.
100.
30.
210.
780.
92
4038
.839
2,4-
dim
ethy
lhex
ane
P1.
30.
031.
521.
23
4140
.62-
met
hyl-1
-hep
tene
P0.
120.
40.
450.
290.
330.
54
4241
.01-
octe
neC
0.23
0.24
0.39
0.24
0.26
0.4
4342
.84
2,4-
dim
ethy
l-2-h
epte
neP
0.16
0.55
0.64
0.89
4444
.01
2,4-
dim
ethy
lhep
tane
P0.
490.
050.
180.
490.
3
4546
.004
2,4-
dim
ethy
l-1-h
epte
neP
12.4
70.
57.
6517
.80
4646
.8et
hylb
enze
neC
2.19
1.06
0.02
0.96
0.24
0.63
4747
.51,
4-di
met
hylb
enze
neC
2.41
1.22
0.62
0.45
0.57
0.42
4849
.0st
yren
eC
1.43
0.9
0.61
0.81
0.65
1.02
(continue)

6 - Microwave Assisted Pyrolysis of Waste Polymers 135
(continue)
4949
.51,
2-di
met
hylb
enze
neC
0.78
0.48
0.20
0.22
0.33
5050
.02,
4,6-
trim
ethy
l-1-h
epte
neP
0.23
0.09
0.50
2.40
2.33
3.45
5150
.9no
nane
C0.
212.
980.
530.
240.
320.
40
5251
.73,
5,5-
trim
ethy
lcyc
lohe
xene
P0.
250.
270.
080.
520.
370.
86
5355
.21,
2,3-
trim
ethy
lben
zene
P1.
190.
370.
250.
48
5455
.41,
2,4
trim
ethy
lben
zene
P0.
780.
230.
280.
060.
140.
16
5556
.5-
met
hyls
tyre
neC
0.40
0.1
0.15
0.14
0.15
5657
.79
1-de
cene
C0.
310.
180.
440.
62
5758
.01,
9-de
cadi
ene
P0.
130.
370.
480.
050.
360.
11
5858
.02,
4,6-
trim
ethy
l-2-o
cten
eP
0.29
0.08
0.48
0.48
5958
.52,
4,6-
trim
ethy
l-1-o
cten
eP
0.34
0.60
0.33
0.32
0.78
6058
.8D
ecan
eC
0.28
0.23
0.02
0.61
0.31
0.45
6159
.04-
met
hyld
ecan
eP
0.35
0.42
0.53
0.18
6259
.46
2-m
ethy
ldec
ane
P0.
740.
130.
460.
630.
61
6364
.12,
4,6-
trim
ethy
l-1-n
onen
eP
1.79
0.09
0.32
2.58
1.88
3.59
6464
.32,
4,6-
trim
ethy
l-2-n
onen
eP
0.96
0.06
2.23
1.33
1.12
1.86
6567
.27
2,4,
6,8-
tetr
amet
hyl-1
-non
ene
P0.
610.
030.
150.
790.
821.
18
6667
.68
2,4,
6,8-
tetr
amet
hyl-2
-non
ene
P0.
280.
020.
110.
260.
350.
40
6768
.67
2,4,
6,8-
tetr
amet
hyl-1
,3-n
onad
iene
P0.
620.
030.
120.
870.
601.
29
6870
.85
2,4,
6,8-
tetr
amet
hyl-2
-non
ene
P0.
070.
060.
320.
290.
27
6971
.71-
dode
cene
C0.
240.
20.
360.
040.
230.
46
7072
.71
2,4,
6,8-
tetr
amet
hyl-1
-dec
ene
P0.
390.
290.
260.
05
7174
.00
2,4,
6,8-
tetr
amet
hyld
ecan
eP
0.16
0.02
0.11
0.25
0.34
0.21
7276
.78
2,4,
6,8-
tetr
amet
hyl-2
-dec
ene
P0.
190.
020.
130.
600.
480.
12
7378
.22,
4,6,
8-Te
tram
ethy
l-1-u
ndec
ene
P3.
40.
770.
224.
372.
580.
27
7478
.58
2,4,
6,8-
tetr
amet
hyl-1
-und
ecen
eP
0.8
0.31
0.30
1.16
1.02
0.21

6 - Microwave Assisted Pyrolysis of Waste Polymers13675
79.1
2,4,
6,8-
Tetr
amet
hylu
ndec
ane
P2.
240.
742.
213.
132.
035.
03
7680
.68
2,4,
6,8,
10-p
enta
met
hyl-1
-und
ecen
eU
0.12
0.42
1.45
0.80
0.94
3.53
7781
.93
2,4,
6,8,
10-p
enta
met
hyl-2
-und
ecen
eU
0.98
0.33
0.74
0.35
0.55
0.91
7887
.54,
6,8,
10-T
etra
met
hyltr
idec
ane
U0.
110.
40.
210.
380.
420.
09
7988
.02,
4,6,
8,10
-Pen
tam
ethy
l-2-t
ridec
ene
U0.
50.
270.
250.
250.
340.
11
8089
.72,
4,6,
8,10
-Pen
tam
ethy
l-3-t
ridec
ene
U0.
140.
550.
181.
391.
150.
17
8190
.22,
4,6,
8,10
-Pen
tam
ethy
l-1-t
ridec
ene
U1.
342.
470.
100.
370.
380.
12
8291
.02,
4,6,
8,10
-Pen
tam
ethy
l-4-t
ridec
ene
U0.
181.
950.
490.
650.
630.
92
8391
.62,
4,6,
8,10
-Pen
tam
ethy
l-5-t
ridec
ene
U0.
180.
740.
240.
180.
25
8491
.92,
4,6,
8,10
-Pen
tam
ethy
l-6-t
ridec
ene
U0.
141.
330.
070.
450.
47
8592
.43,
5,7,
9,11
-Pen
tam
ethy
l-1-t
etra
dece
neU
0.5
0.37
0.27
0.28
0.23
0.37
8693
.23,
5,7,
9,11
-Pen
tam
ethy
l-1,1
2-te
trad
ecad
iene
U0.
192.
180.
221.
040.
660.
12
8796
.566
3,5,
7,9,
11-P
enta
met
hyl-1
,3-t
etra
deca
dien
eU
0.09
0.66
0.05
0.14
0.2
8898
.41-
hept
adec
ene
C0.
170.
530.
060.
100.
160.
07
8998
.9he
ptad
ecan
eC
0.86
0.13
0.96
0.06
0.28
0.22
9099
.415
2,4,
6,8,
10,1
2-H
exam
ethy
l-1,3
-pen
tade
cadi
ene
U0.
490.
110.
170.
2
9199
.82,
4,6,
8,10
,12-
Hex
amet
hyl-1
-pen
tade
cene
U0.
152.
810.
091.
241.
06
9210
1.0
2,4,
6,8,
10,1
2,14
-hep
tam
ethy
l-1,3
-pen
tade
cadi
ene
U1
0.31
0.09
0.98
0.89
0.06
9310
1.4
2,4,
6,8,
10,1
2-H
exam
ethy
l-2-p
enta
dece
neU
3.1
0.33
0.37
0.31
0.45
9410
1.8
3,5,
7,9,
11,1
3-H
exam
ethy
l-2-h
exad
ecen
eU
0.21
0.95
0.08
0.47
0.46
0.07
9510
2.5
2,4,
6,8,
10,1
2-H
exam
ethy
l-3-p
enta
dece
neU
1.46
0.25
0.40
0.34
0.32
9610
3.1
3,5,
7,9,
11,1
3-H
exam
ethy
l-1-h
exad
ecen
eU
0.33
2.13
0.04
0.97
0.56
0.09
9710
6.0
3,5,
7,9,
11,1
3-H
exam
ethy
l-1,3
-hex
adec
adie
neU
0.21
0.33
0.05
0.30
0.21
9810
8.8
2,4,
6,8,
10,1
2,14
-Hep
tam
ethy
lhep
tade
ca-1
,3-d
iene
U0.
450.
280.
2
9911
0.0
2,4,
6,8,
10,1
2,14
-Hep
tam
ethy
lhep
tade
c-1-
ene
U0.
941.
880.
050.
730.
62
100
112.
52,
4,6,
8,10
,12,
14-H
epta
met
hylh
epta
dec-
2-en
eU
0.14
0.78
0.15
0.24
0.25
(continue)

6 - Microwave Assisted Pyrolysis of Waste Polymers 137
101
114.
23,
5,7,
9,11
,13,
15-H
epta
met
hylo
ctad
eca-
1,3-
dien
eU
0.65
1.64
0.08
0.92
0.7
102
125.
23,
5,7,
9,11
,13,
15-H
epta
met
hylo
ctad
ec-3
-ene
U0.
320.
040.
550.
64
104
134.
73,
5,7,
9,11
,13,
15,1
7-O
ctam
ethy
licos
a-1,
3-di
ene
U0.
110.
172.
26
Alk
ane
2.65
15.2
02.
319.
677.
287.
4910
.87
Alk
ene
9.38
46.9
930
.64
33.6
038
.80
39.0
352
.59
Cyc
lic a
lkan
e0.
200.
000.
000.
000.
000.
040.
00
Cyc
lic A
lken
e2.
101.
110.
000.
610.
890.
901.
52
Aro
mat
ic13
.89
7.30
0.02
4.72
3.08
4.57
4.08
TOTA
L28
.22
70.6
32.9
748
.650
.05
52.0
369
.06
*a.c
.: at
trib
utio
n co
nfide
nce;
C, c
erta
in (
>98
%);
P, p
roba
ble
(86-
97%
); U
, unc
erta
in (
<85
%).

6 - Microwave Assisted Pyrolysis of Waste Polymers138
Fe was more efficient than carbon to convert and ransfer the MW radiation, as
heat, to the polymeric matrix.
6.2.2.3. FTIR
The FTIR spectra of liquids collected from MAP of PP are reported in Figure 6.7.
Figure 6.7. FTIR spectra of liquids from MAP of PP. a) PP1L; b) PP2L; c) PP3L; d) PP5L.
These FTIR spectra confirm the GC-MS data, and there were not well-defined
differences among liquids obtained from MAP of HDPE or PP, except for weak
absorptions due to aromatic moieties. Frequencies of alkanes were found at:
2957 (s), and 2870 (m) (H2C-H asymmetric/symmetric stretching) 2924 (s), and
2853 (s) (HC-H asymmetric/symmetric stretching), 1452 (m), and 1377 (m) (HC-
H bending) and 722 (w) (-(CH2)n- rocking) cm-1. Absorptions of alkene group were
present at: 3080 (w) (CH2=C-H stretching), 3026 (w) (cis- or trans- CH=C-H) and
1641 (w) (alkenyl C=C stretching) cm-1. Absorptions of aromatic groups were
shown at: over 3000 (w) (aromatic C-H stretching, mixed with other signals), 1720
(w) (aromatic combination bands), 1605 (w) (aromatic ring stretching), 991 (w)
and 964 (w) (aromatic C-H in-plane bending), 889 (w), 813 (w), 696 (m) and 677
(m) (aromatic C-H out-of plane bending) cm-1.
Very close FTIR spectra were collected from liquids obtained in different MAP
conditions; small differences were accountable only for compounds formed in the
degradation of the MW absorber.
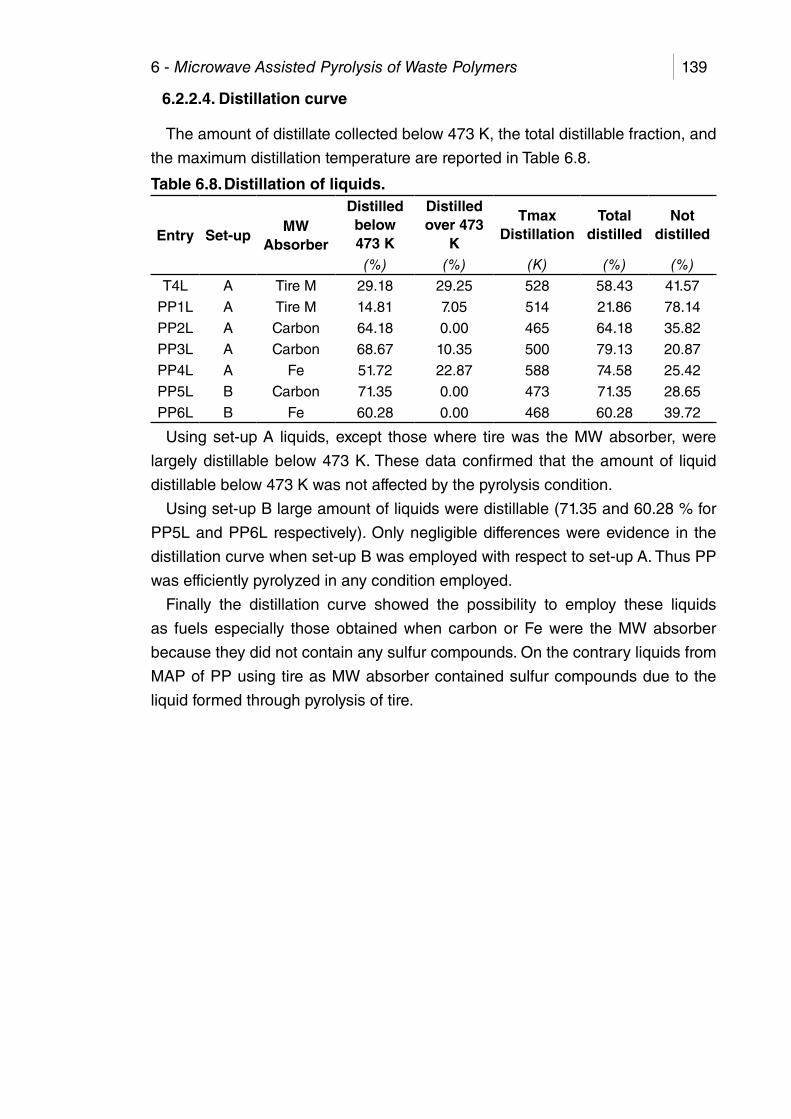
6 - Microwave Assisted Pyrolysis of Waste Polymers 139
6.2.2.4. Distillation curve
The amount of distillate collected below 473 K, the total distillable fraction, and
the maximum distillation temperature are reported in Table 6.8.
Table 6.8. Distillation of liquids.
Entry Set-upMW
Absorber
Distilled below 473 K
Distilled over 473
K
Tmax Distillation
Total distilled
Not distilled
(%) (%) (K) (%) (%)
T4L A Tire M 29.18 29.25 528 58.43 41.57
PP1L A Tire M 14.81 7.05 514 21.86 78.14
PP2L A Carbon 64.18 0.00 465 64.18 35.82
PP3L A Carbon 68.67 10.35 500 79.13 20.87
PP4L A Fe 51.72 22.87 588 74.58 25.42
PP5L B Carbon 71.35 0.00 473 71.35 28.65
PP6L B Fe 60.28 0.00 468 60.28 39.72
Using set-up A liquids, except those where tire was the MW absorber, were
largely distillable below 473 K. These data confirmed that the amount of liquid
distillable below 473 K was not affected by the pyrolysis condition.
Using set-up B large amount of liquids were distillable (71.35 and 60.28 % for
PP5L and PP6L respectively). Only negligible differences were evidence in the
distillation curve when set-up B was employed with respect to set-up A. Thus PP
was efficiently pyrolyzed in any condition employed.
Finally the distillation curve showed the possibility to employ these liquids
as fuels especially those obtained when carbon or Fe were the MW absorber
because they did not contain any sulfur compounds. On the contrary liquids from
MAP of PP using tire as MW absorber contained sulfur compounds due to the
liquid formed through pyrolysis of tire.

6 - Microwave Assisted Pyrolysis of Waste Polymers140
6.3. Polystyrene
MAP of PS was performed to transform an aromatic polymer into a liquid with
high amount of styrene and single ring aromatics. The results reported herein
were already partially published.8
6.3.1. Operating conditions and yields
Microwave assisted pyrolysis (MAP) of PS was investigated by varying three
parameters: microwave power, microwave absorber, and apparatus set-up (Table
6.9, entries are named “PPn” where “n” is an arbitrary ascending number for each
experiment). Although temperature plays an important role, this parameter is
detected with high uncertainty in MAP, as previously reported in Section 5.5 and
by Bykov et al.,10 but it was not used as a descriptive parameter.
During MAP polymers were initially melted then the absorber was incorporated
into the melted PS and pyrolysis started.
Table 6.9. MAP of PS operating parameters
a) within brackets the time for which each MW power was employed.
PS in the presence of carbon as MW absorber was almost completely converted
into a liquid fraction using MAP (PS2, Table 6.9). Reducing MW power the yield
of liquid was further increased (PS3, Table 6.9). In this latter pyrolysis solids yield
was lower than 1.0 wt%; while it was improved up to 6.8, 9.8 and 10.0 wt% (PS2,
and PS3 respectively) increasing MW power. Gas was formed in small amount in
PS2 – PS4 and its yield was improved (PS6) through the use of a fractionating
system. Gas from MAP of PS alone contained C1-C4 hydrocarbons, and there
was not noteworthy variation of their relative distribution among each experiment.
The high yield of gas in PS1 was largely attributable to tire degradation3 while
that one of solid was due to fillers and other inorganic compounds present in
EntrySet-up
MWAbsorber
Power PolymerMW
AbsorberTime Solid Liquid Gas
(kW)a (g) (g) (min) (wt%) (wt%) (wt%)
T4 A Tire M 3 - 233.3 35 43.2 42.6 14.1
PS1 A Tire M 3 141.1 298.4 43 31.8 57.4 10.8
PS2 A Carbon 3(46); 6(13)
196.3 106.7 59 6.8 89.3 3.9
PS3 A Carbon 1.2(82); 1.5(58); 3(45)
160.3 81.8 185 0.9 96.1 3.0
PS4 A Carbon 3 100.4 47.3 22 9.8 86.5 3.7
PS5 A Fe 3 29 1.9 88.3 9.8
PS6 B Carbon 3 100.3 50.2 28 10.0 83.6 6.4
PS7 B Fe 3(24); 6(47)
146.1 71.1 71 32.0 64.5 3.5
6 - Microwave Assisted Pyrolysis of Waste Polymers 141
tire that contribute to increase the yield of the residue present at the end of the
experiment.
As well as for MAP of PE and PP (see Sections 6.1.1 and 6.2.1), Fe showed
a completely different behaviour than carbon as MW absorber. Using set-up A
(PS5) PS was pyrolyzed to a liquid fraction with close yield to PS4 (88.3% for PS5
and 86.5% for PS4) but with small amount of solid and high amount of gas. Iron
was able to convert and fast transfer the energy to the polymeric matrix ensuing
negligible cocking phenomena and strong gas formation. Meanwhile using set-up
B the effect was completely opposite, cocking was enhanced while gas formation
was avoided. Probably the presence of a fractionating system (set-up B) promoted
the condensation of benzene ring by increasing the residence time of high boiling
compounds.
All liquids obtained in the presence of carbon and Fe were clear pale-yellow
solutions in contrast with the results reported by Onwudili et al.11 They used a
classical heating and a closed batch system obtaining a dark-coloured liquid at
low temperature (623 K) and char from condensation of aromatics, using higher
temperature (723 K). These different results might be attributed to the different
heating system and the different apparatus employed.
Reactions involving char or gas formation were reduced by using low MW power
(PS3). Anyway a MW power of 3 kW was enough to promote aromatic condensation
(PS4, Table 6.9) as suggested for MAP of PS by Hussain et al.12 Furthermore
improving the residence time in the oven, achieved with the fractionating system
(PS6), the condensation and gasification reactions were slightly enhanced. This
issue were clearer when Fe was the MW absorber as previously highlighted.
Separate considerations might be done when tire was the MW absorber. The
amount of tire was higher than carbon because it contains more of 50 % products
unable to absorb MW. Liquids from MAP of PS obtained in the presence of tire
contained the same compounds formed in all other PS pyrolysis together with
those formed from MAP of tire alone. It is possible to evaluate the contribution
of tire and PS to the liquid formed. The amount of liquid from PS was calculated
assuming the same yields of experiment 5 for MPA of PS where carbon was the
MW absorber (PS4) while the yields of tire were assumed to be analogous to
that reported in T4. These results (Table 6.10) were compared with the results
obtained in PS1.
Experimental yield for gas were the same than calculated while that one of
solid was slightly higher and that one of liquid slightly lower than those calculated.
Probably the degradation products of tire and PS reacted together to form a slight
amount of solid through liquid cooking.
Solids formed by PS pyrolysis were mixed with large amount of MW absorber in
all experiments and they were not characterized (see also Section 5.3).

6 - Microwave Assisted Pyrolysis of Waste Polymers142
Table 6.10. Yield calculation for entry 5, together with the experimental values.
Solid Liquid Gas
Tire PS Tire PS Tire PS
Relative amount calculated (g)a 104.6b 13.8c 103.2b 122.1c 34.2b 7.7c
Total amount calculated (g) 118.5 225.2 41.9
Yield calculated (%) 30.9 58.8 10.9
Experimental yield (%) 31.8 57.4 10.8
a) Starting materials: tire 298.4 g, PS 141.1 g, b) amount calculated from MAP of tire, T4;
c) amount calculated from PS4.
The MAP of PS in the presence of tire (PS1, Table 6.9) or carbon (PS2-PS4,
and PS6 Table 6.9) suggested the possibility to perform a MAP process in the
presence of an inorganic and/or organic material. In fact tire or carbon, other than
MW absorber, could be seen as a pollutant mixed with waste PS which did not
affect the pyrolyses results as evidenced in Table 6.10.
6.3.2. Liquid product
6.3.2.1. Physical properties
Physical characteristics of liquids from MAP of PS with carbon or tire as MW
absorber were not affected by variation of MW power, or apparatus set-up,
meanwhile Fe affected deeply them (Table 6.11).
Table 6.11. Physical characteristics of liquid obtained by MAP of PS.
a) by difference.
Density was in a narrow range among 0.891 - 0.930 g/cm3 and viscosity was
also in a very thin interval (0.79 – 1.07 cP). Furthermore close values of ultimate
analyses and C/H molar ratios suggested that all liquids had similar composition
even if different reaction condition were used. Some differences were shown for
PS1L because this liquid contained products from MAP of PS and tire. These
EntryDensity Viscosity HHV LHV
Ultimate analyses C/H molar ratio
C H N S Oa
(g/cm3) (cP)(MJ/kg)
(MJ/kg)
(wt%) (wt%) (wt%) (wt%) (wt%)
T4L 0.874 1.73 44±4 42±4 86.87 10.12 0.66 0.9 1.45 0.72
PS1L 0.896 0.79 40±4 39±4 88.48 8.52 1.67 0.4 0.93 0.87
PS2L 0.917 0.90 41±4 39±4 90.61 7.66 0.96 0.0 0.77 0.99
PS3L 0.891 0.79 41±4 40±4 90.76 9.01 0.23 0.0 0.00 0.85
PS4L 0.923 0.91 41±4 40±4 90.39 7.74 1.00 0.0 0.87 0.97
PS5L 0.930 1.07 42±4 40±4 91.92 8.08 0.00 0.0 0.00 0.95
PS6L 0.913 0.80 40±4 39±4 91.70 8.05 0.07 0.0 0.18 0.96
PS7L 0.903 0.78 42±4 40±4 90.67 8.58 0.00 0.0 0.75 0.88
6 - Microwave Assisted Pyrolysis of Waste Polymers 143
differences were confirmed by the data of T4L, the liquid obtained by MAP of tire
alone. The C/H molar ratio increased from PS3L to PS1L and PS2L confirming
the prevailing presence of aryl moiety in liquids from PS pyrolysis. Worthy of note
were the date reported for PS5L and PS7L. Density and C/H molar ratio of PS5L
was the highest while the one of PS7L the lowest of all pyrolysis. Working without
a fractionating system (set-up A) preserve most of the aromatic fraction of liquid
while working with a fractionating system reduce the aromatic content of liquids.
Also the high heating value (HHV) of liquids from MAP of PS shown the same
tendency of C/H molar ratio, they were close to styrene, benzene, and ethyl
benzene HHV (42.20, 41.83, and 43.00 MJ/kg respectively).9
The presence of compounds from MAP of tire did not affect significantly density,
viscosity, HHV, and lower heating value (LHV) of PS1L with respect to PS2L –
PS7L. Only T4L showed different values because this liquid was obtained from
MAP of tires alone.
6.3.2.2. GC/MS
Liquids contained few compounds when PS was pyrolyzed in the presence of
carbon or Fe as evidenced by GC-MS analysis, while a large number of components
were present if tire was the MW absorber due to its simultaneous degradation. In
Table 6.12 are listed the compounds identified in MAP of PS and only the main
compounds from tire degradation (T4L). Their abundance was evaluated by the
total ion chromatography (TIC) without any response factor correction. In Figure
6.8 are reported the TIC of PS1L, PS2L, and PS4L.
As expected from literature the main products of PS pyrolysis were aromatic
hydrocarbons such as: benzene, toluene, ethylbenzene, styrene, and
a-methylstyrene.11-15. They represented up to 91.26 % of products present in
liquids, and single ring aromatic compounds reached up to 94.99 % in PS4L.
Styrene was always the predominant compound in each liquid, also in L5 where
the liquid was diluted by tire degradation products. The highest amount of styrene
was present in PS4L and PS5L (65.98 and 63.27 %, respectively).
Also PS6L contained large amount of styrene (60.09%). This evidence for PS5L
was surprising because the fractionating system, improved the residence time of
products in the oven and styrene could be further degraded or condensed. In fact
the yield of solid (10.0 wt%) and gas (6.4 wt%) products were enhanced. Probably
styrene was not involved in these reactions because was rapidly distilled away.
On the contrary PS7L showed a low amount of styrene, in this case styrene was
dramatically reduced by using Fe as MW absorber together with a fractionating
system. However Fe showed similar features to carbon in producing styrene when
a fractionating system was not employed.

6 - Microwave Assisted Pyrolysis of Waste Polymers144Ta
ble
6.1
2.
Co
mp
ou
nd
s id
enti
fied
in li
qu
ids
fro
m M
AP
of
PS
, by
GC
-MS
.E
ntry
T4L
PS
1LP
S2L
PS
3LP
S4L
PS
5LP
S6L
PS
7LS
et-u
pA
AA
AA
AB
B
Abs
orbe
rT
ire M
Tire
MC
arbo
nC
arbo
nC
arbo
nF
eC
arbo
nF
e
No.
R.t.
Sub
stan
cea.
c.*
112
.02-
But
ene-
tran
sC
1.5
1.9
216
.41,
3-P
enta
dien
eC
1.6
0.9
319
.63-
Met
hyl-1
-hex
ene
C1.
60.
7
427
.0B
enze
neC
1.7
1.1
1.6
0.8
2.1
1.4
1.2
0.7
537
.8To
luen
eC
2.9
7.6
9.0
11.0
8.0
5.2
9.3
9.2
646
.8E
thyl
benz
ene
C2.
116
.38.
710
.14.
81.
45.
618
.0
747
.51,
4-D
imet
hylb
enze
neC
2.3
1.0
0.0
849
.0S
tyre
neC
1.4
24.9
47.7
50.1
66.0
63.3
60.1
34.4
949
.51,
2-D
imet
hylb
enze
neC
0.8
0.3
0.0
1052
.2C
umen
eC
0.4
3.5
0.7
1.4
0.3
0.5
4.5
1155
.21,
2,3-
Trim
ethy
lben
zene
P1.
20.
40.
0
1255
.41,
2,4-
Trim
ethy
lben
zene
P0.
80.
3
1356
.5-
Met
hyls
tyre
neC
0.4
8.7
13.4
14.1
10.4
4.7
13.3
12.7
1457
.71,
3,5-
Trim
ethy
lben
zene
P1.
10.
4
1559
.91-
Eth
yl-3
-met
hylb
enze
neP
1.0
1.1
0.5
1660
.11,
2,4,
5-Te
tram
ethy
lben
zene
P1.
40.
5
1760
.9Li
mon
ene
C3.
41.
6
1896
.81,
3-D
iphe
nylp
ropa
neP
0.2
3.9
2.8
3.4
0.9
1.7
1.9
5.0
1998
.63-
But
enyl
benz
ene
P0.
55.
11.
32.
42.
92.
2
2098
.8C
yclo
prop
ane-
1,1-
diyl
dibe
nzen
eP
0.6
2.5
0.6
1.1
0.9
2199
.83-
bute
ne-1
,3-d
iyld
iben
zene
P0.
511
.6
(continue)

6 - Microwave Assisted Pyrolysis of Waste Polymers 145
2211
0.7
2-P
heny
lnap
htal
ene
P0.
61.
60.
20.
50.
40.
2
Tota
l Aro
mat
ic17
.772
.493
.192
.996
.490
.095
.886
.7
Tota
l Alip
hatic
8.1
5.1
0.0
0.0
0.0
0.0
0.0
0.0
*a.c
.: at
trib
utio
n co
nfide
nce;
C, c
erta
in (
>98
%);
P, p
roba
ble
(86-
97%
); U
, unc
erta
in (
<85
%).

6 - Microwave Assisted Pyrolysis of Waste Polymers146
Figure 6.8. TIC of a) PS2L; b) PS4L; c) PS1L. The numbers in the
chromatogram correspond to those reported in Table 6.12.
Styrene formation increased from PS2L, to PS3L, to PS6L and PS4L even if
the MW power did not remain constant. In PS1L the styrene amount was close to
that shown in PS2L (42.15 and 47.69 % respectively) if the dilution effect caused
by liquids from tire pyrolysis were taken in account.
The formation of a-methylstyrene was not influenced by MW power or apparatus
set-up, and it was almost steady in the 11 - 15% range. Other single ring aromatic
compounds (toluene and ethylbenzene) were also detected in a narrow distribution
range which did not suggest any clear influence of pyrolysis variables tested.
Otherwise switching MW absorber from carbon to Fe brought several changes in
distribution of compounds other than styrene. P5L contained less a-methylstyrene
but a compounds in large amount (11.56%) which was hardly found in other liquid,
3-butene-1,3-diyldibenzene, a possible dimer of styrene. However P7L, always
obtained with Fe but using a fractionating system, showed the same amount of
a-methylstyrene than any other liquid.
Without a fractionating system styrene was quickly produced and it stayed for a

6 - Microwave Assisted Pyrolysis of Waste Polymers 147
shorter time at the pyrolysis condition because, as previously reported, Fe rapidly
transfers heat to the polymeric feed as heat (see Section 6.1.2)
Additional aromatic compounds were detected such as 1,3-diphenylpropane,
and apparently their amount increased by improving the residence time, that is
the fractionating system reduces the amount of styrene while increase the amount
of 1,3-diphenylpropane. Other aromatics were present in minor amount but an
incontrovertible attribution was not possible due to their low amount and similar
mass spectra.
An increase of ethylbenzene, cumene and 1,4-dimethylbenzene were shown in
PS1L that is in pyrolysis run with tire as MW absorber. These improvements might
be attributed to a reaction between intermediates from MAP of PS and tire.
Limonene was present only in liquid when tire was the MW absorber confirming
its formation through polyisoprene pyrolysis of rubber present in tires.2 This
hypothesis was supported by the composition of the liquids from PS pyrolysis in
the presence of carbon as MW absorber: limonene was never present. Its amount
was close in PS1L and T4L if the dilution effect of products from MAP of PS was
taken into account. The yield of the main compounds was calculated with the
formula: Yield compound (%) = TICarea (%) × Liquid yield (%) and the results are
reported in Figure 6.9.
Figure 6.9. Yields calculated for the main aromatic compounds.
This figure gives a clear indication of the efficiency of the reverse polymerization
of waste polystyrene.
The GC/MS analyses showed strong differences from the data reported by

6 - Microwave Assisted Pyrolysis of Waste Polymers148
Onwudili11 and Hussain12, 16, 17 due to different heating technology, in the first case,
and to the very high temperature employed by the second author. Furthermore
the latter study was obtained working in a flux of N2 which was not used in this
work.
6.3.2.3. FTIR
FTIR spectra of liquids confirmed the GC/MS data, indeed absorptions of
aromatic hydrocarbons were the only detected (Table 6.13) in PS2L-PS7L while
aliphatic and aromatics hydrocarbons were present in PS1L and T4L.
Table 6.13. IR absorptions of liquid samplesa.
IR analysis showed similar absorptions among liquids obtained in different MAP
conditions as shown in Figure 3; strong differences were shown only in spectra
Frequencies Attribution T4L PS1L PS2L PS3L PS4L PS5L PS6L PS7L3104; 3060 Aromatic C-H
stretchingn.d. m m m m m m m
3082; 3027 Terminal vinyl C-H stretching
w m m m m m m m
3009 Internal alkene C-H stretching
n.d. m w w w w w w
2961; 2870 Methyl C-H stretching
s m n.d. w n.d. n.d. n.d. n.d.
2920; 2860 Methylene C-H stretching
s m n.d. w n.d. n.d. n.d. n.d.
1691; 1752; 1804; 1877;
1944
Aromatic combination
band
w n.d. w w w w w w
1630 Alkenyl C=C stretching
w w s m m m m m
1601; 1576; 1495; 1450
C=C-C aryl ring stretching
w m s m m m m m
1412 Vinyl C-H in-plane bending
n.d. w m w m w w w
1290 Vinylidene C-H in-plane bending
n.d. w w n.d. w w w w
1202; 1083; 1028; 1020
Aromatic C-H in-plane bending
w m m m m m m m
990; 907 Vinyl C-H out-of-plane bending
n.p. s s s s s s s
840: 774; 755; 748;
731
Aromatic C-H out-of-plane
bending
w s s s s s s s
694 C-C ring bending
w s s s s s s s

6 - Microwave Assisted Pyrolysis of Waste Polymers 149
from PS1L and T4L (Figure 6.10d,e), because these spectra were obtained from
oil containing the product of tire degradation. These spectra were substantially
different in 3200 – 2900 cm-1 region from L1, L2 and L4 (Figure 6.10a,b,c) even
through a visual evaluation. The absorptions reported in Table 6.13 were in
agreement with those reported by Mo et al. 13
Figure 6.10. FTIR of: a) PS2L; b) PS4L; c) PS6L; d) PS1L; e) T4L.
6.4. Main achievements
Microwave assisted pyrolysis (MAP) of HDPE, PP, and PS was performed
using different MW absorbers (tire, carbon, or Fe), apparatus set-up, and MW
power, obtaining a high quality liquid fraction with tailoring properties. The main
achievements might be summarized in the following key points.
MAP of polyolefins (HDPE and PP) might be carried out with a low MW power
obtaining a liquid having a low viscosity, but HDPE was only partially decomposed
while PP and PS were fully pyrolyzed. A low viscosity liquid was always formed
when a fractionating system was placed on the oven, avoiding to waxy products
to leave the reactor. Liquids from MAP of HDPE contained a mixture of linear
alkanes, the corresponding 1-alkenes, and a very low amount of aromatics. On
the contrary liquids from MAP of PP contained a mixture of methyl branched
alkanes and alkenes, some aromatics and dienes. The relative amounts of these
products were affected by pyrolysis conditions.
6 - Microwave Assisted Pyrolysis of Waste Polymers150
From MAP of PS a clear and low viscosity liquids were always collected together
with low amount of gas (3.0 wt %) and solid (0.9 wt %). Styrene in the liquid was
increased up to 65.98 % by using a MW power of 3 KW. The liquid shows lower
density and viscosity if a fractionating system was inserted between the oven
and the coolers due to lower presence of high molecular weight compounds and
it contained up to 92.70% of single ring aromatic compounds such as styrene,
toluene, ethylbenzene, and a-methylstyrene.
The gas from MAP of HDEP, PP, and PS did not contain neither nitrogen, usually
employed as carrier, nor combustion gas present in classical pyrolysis and could
be used for energy production without any treatments.
Tire and carbon could be assimilated to pollutant other than MW absorber, and
they did not markedly affect the pyrolyses results, but almost only the products
composition if some of these materials might be pyrolyzed. In fact some cross
reactions between intermediates from PS and tire degradation products were
observed. These results let us to affirm that MAP of HDPE, PP, and PS might be
performed even when large amount of inorganic and polymeric compounds was
present as contaminants.
Finally waste polyolefins may be disposed through MAP pyrolysis obtaining
liquids that may be employed as a source of chemicals or fuel without any
preliminary treatments.
The environmental burden caused by a polluted waste HDPE, PP, and PS,
otherwise difficult to recycle, could be efficiently reduced together with its
valorisation by MAP producing large amount of valuable chemicals such as
styrene and other aromatics while gas and solid may be used as fuel.
This process is an efficient green chemical approach to waste polymers
producing valuable chemicals and avoiding pollution due to some plastic waste.

6 - Microwave Assisted Pyrolysis of Waste Polymers 151
Reference
1. Undri, A.; Rosi, L.; Frediani, M.; Frediani, P. Efficient Disposal of Waste Polyolefins through Microwave Assisted Pyrolysis. Fuel 2013, 116, 662-671.2. Cunliffe, A. M.; Williams, P. T. Composition of oils derived from the batch pyrolysis of tyres. J. Anal. Appl. Pyrol. 1998, 44, 131-152.3. Undri, A.; Meini, S.; Rosi, L.; Frediani, M.; Frediani, P. Microwave Pyrolysis of Polymeric Materials: Waste Tires Treatment and Characterization of the Value-Added Products. J. Anal. Appl. Pyrol. 2013, 103, 149-158.4. Undri, A.; Sacchi, B.; Cantisani, E.; Toccafondi, N.; Rosi, L.; Frediani, M.; Frediani, P. Characterization of Carbon from Microwave Assisted Pyrolysis of Tires. J. Anal. Appl. Pyrol. 2013, 104, 396-404.5. Laresgoiti, M. F.; Caballero, B. M.; de Marco, I.; Torres, A.; Cabrero, M. A.; Chomón, M. J. Characterization of the liquid products obtained in tyre pyrolysis. J. Anal. Appl. Pyrol. 2004, 71, 917-934.6. Russell, A. D.; Antreou, E. I.; Lam, S. S.; Ludlow-Palafox, C.; Chase, H. A. Microwave-assisted pyrolysis of HDPE using an activated carbon bed. RSC Advances 2012, 2, 6756-6760.7. Aguado, R.; Olazar, M.; José, M. J. S.; Gaisàn, B.; Bilbao, J. Wax Formation in the Pyrolysis of Polyolefins in a Conical Spouted Bed Reactor. Energy Fuels 2002, 16, 1429-1437.8. Undri, A.; Rosi, L.; Frediani, M.; Frediani, P. Reverse Polymerization of Waste Polystyrene through Microwave Assisted Pyrolysis. J. Anal. Appl. Pyrol. 2013, http://dx.doi.org/doi:10.1016/j.jaap.2013.10.001.9. Haynes, W. M.: CRC Handbook of Chemistry and Physics; CRC Pr Inc: Colorado, USA, 2011.10. Bykov, Y. V.; Rybakov, K. I.; Semenov, V. E. High-temperature microwave processing of materials. J. Phys. D Appl. Phys 2001, 34, R55.11. Onwudili, J. A.; Insura, N.; Williams, P. T. Composition of products from the pyrolysis of polyethylene and polystyrene in a closed batch reactor: Effects of temperature and residence time. J. Anal. Appl. Pyrol. 2009, 86, 293-303.12. Hussain, Z.; Khan, K. M.; Hussain, K. Microwave–metal interaction pyrolysis of polystyrene. J. Anal. Appl. Pyrol. 2010, 89, 39-43.13. Mo, Y.; Zhao, L.; Chen, C.-L.; Tan, G. Y. A.; Wang, J.-Y. Comparative pyrolysis upcycling of polystyrene waste: thermodynamics, kinetics, and product evolution profile. J. Therm. Anal. Calorim. 2013, 111, 781-788.14. Undri, A.; Rosi, L.; Frediani, M.; Frediani, P.: Microwave Pyrolysis of Polymeric Materials. In Microwave Heating; Chandra, U., Ed.; InTech: Janeza Trdine 9, 51000 Rijeka, Croatia, 2011; pp 219.15. Park, J. J.; Park, K.; Kim, J.-S.; Maken, S.; Song, H.; Shin, H.; Park, J.-W.; Choi, M.-J. Characterization of Styrene Recovery from the Pyrolysis of Waste Expandable Polystyrene. Energy Fuels 2003, 17, 1576-1582.16. Hussain, Z.; Khan, K. M.; Basheer, N.; Hussain, K. Co-liquefaction of Makarwal coal and waste polystyrene by microwave–metal interaction pyrolysis in copper coil reactor. J. Anal. Appl. Pyrol. 2011, 90, 53-55.17. Hussain, Z.; Khan, K. M.; Perveen, S.; Hussain, K.; Voelter, W. The conversion of waste polystyrene into useful hydrocarbons by microwave-metal interaction pyrolysis. Fuel Process. Technol. 2012, 94, 145-150.


7. Composites, waste multi-layer packaging
Microwave assisted pyrolysis (MAP) waste and/or polluted multi-layer beverage
packaging (WMP) is reported in this section. WMP interacted with microwave
radiation (MW) and they could be heated to pyrolysis temperature. However
heating rate was much lower than using any other MW absorber tested in Section
6 and their mixing with the composite material was necessary to perform MAP in
a short time.
7.1. Operating parameters and yields
MAP of WMP was investigated at constant MW power of 3 kW varying two
parameters: microwave absorber, and apparatus set-up (Table 7.1).
Table 7.1. Microwave assisted pyrolysis of WMP*.
En
try
Set
-up
MW
Ab
sorb
er
WM
P
Tim
e
Al
So
lid
Liq
uid
Up
per
p
has
e
Liq
uid
Bo
tto
m
ph
ase
Gas
type (g) (g) (min) (g) (%) (wt%) (wt%) (wt%) (wt%)
WMP1 A - - 165.4 52 12.0 7.3 31.6 7.8 35.9 24.7
T4 A Tire 233.3 - 35 - 43.2 42.6 - 14.1
WMP2 A Tire 61.5 123.0 41 7.4 6.0 34.3 24.3 18.6 22.8
WMP3 A Carbon 20.1 149.4 40 11.7 7.8 24.9 8.5 24.1 42.5
WMP4 A Fe 76.8 158.1 27 17.9 11.3 32.4 9.8 33.0 24.8
WMP5 B Carbon 64.3 154.2 62 12.9 8.4 59.9 6.0 25.0 9.0
WMP6 B Fe 76.8 155.2 40 14.9 9.6 28.7 8.1 28.5 34.7
* Al residual foils were separated and excluded from yields calculation.
In spite of the use of different pyrolysis conditions the liquid collected formed
two phases. The bottom phase was always a clear low viscosity fluid with a color
from pale yellow to dark-orange. The upper phase, except for entry 6, was a waxy
liquid, solid at room temperature; it was formed by organic products from PE
pyrolysis accordingly to data reported in the literature.1-4

7 - Composites, waste multi-layer packaging154
MAP of WMP has been performed without the addition of a MW absorber,
WMP1 (Table 7.1). The absence of an added MW absorber did not affect the
pyrolysis behavior and yields were close to those obtained using iron as MW
absorber (WMP4). Al of WMP was initially heated by the MW and contributed
to heat paper and PE. Furthermore the formation of sparks was observed and
nearby paper or PE was pyrolyzed to char which, in turn, was able to absorb MW
improving the MW absorbing capacity of the material. Pyrolysis in the presence
of an added MW absorber allowed to reduce the reaction time of 30% Using
tire as microwave absorber allowed also to verify if MAP could be achieved in
the presence of any inorganic and/or organic pollutant. The liquid formed from
tire degradation was enclosed in the upper phase, and a higher amount of this
organic phase was collected with respect to any other pyrolysis of WMP (WMP2).
Fe as MW absorber reduced considerably the pyrolysis time with respect to
carbon or tire (WMP4 and WMP5), confirming its high ability to convert MW into
heat ensuing a faster pyrolysis.
Al was always recovered as unscratched material at the end of each experiment
(Figure 7.1), suggesting that pyrolysis temperature never exceeded 993 K (Al
melting point), not even in spot points close to Al foil.
Figure 7.1. Aluminum recovered after MAP.
Close yields were obtained independently on different MW absorber employed
(none, tire, and Fe respectively, WMP1, WMP2, and WMP4). On the contrary in
WMP3, performed with carbon, as MW absorber, the bottom liquid fraction and
solid were strongly reduced while higher gas yields was obtained.
In WMP5 and WMP6 using set-up B, the fractionating system avoid to high
boiling fractions to leave the oven, and the residence time of only high boiling
compounds was increased leading to an increase of gas and char formation and
a decrease of liquid yield.5-7 In fact in WMP6 the gas and solid were significantly
higher than WMP4. Surprisingly using set-up B and carbon as MW absorber
(WMP5) the lowest gas yield and the highest solid one were obtained. Probably
pyrolysis intermediates reacted among them and further pyrolyzed yielding char.

7 - Composites, waste multi-layer packaging 155
Results from WMP6 was in agreement with reported data on cellulose pyrolysis8-10:
fast heating minimized char formation while slow heating maximized it. So far Fe
showed a faster heating and high rate of heat transfer to WMP than carbon.
The bottom liquid phase was the mostly reduced working with set-up B.
The upper liquid phase of WMP6 was a waxy product. It was unexpected, the
pyrolysis in the presence of Fe as absorber was very fast (40 min instead of 62
min, WMP6 and WMP5 respectively) and the fractionating system did not prevent
the distillation of products having a relatively high molecular weight.
7.2. Liquid products
7.2.1. Physical properties
Physical properties of liquids were reported in Table 7.2; entries are coded as
“WMPnL” where “n” is the pyrolysis entry, followed by “-H” for upper phase fraction
or “-W” for bottom phase fraction. In T4 where tire was the only pyrolyzed material
a homogeneous liquid was obtained.
The physical properties showed that the upper light fractions (WMPnL-H) were
composed of hydrocarbons with a water content below 0.1 wt% while the heavy
liquid fractions (WMPnL-W) were mainly composed of water (up to 92.6 wt% Table
7.2). Different MW absorber did not considerably affect the physical properties of
liquids.
Working with set-up B, the overall amount of water was increased in the
bottom phase up to 77.6 wt% (WMP6L-W) and 92.6 wt% (WMP5L-W), because
the improved residence time increased the pyrolysis efficiency thus oxygenated
hydrocarbons had been further pyrolyzed to COx or alkene and water, in agreement
to their oxygen content and data reported in the literature.8,11,12

7 - Composites, waste multi-layer packaging156
Table 7.2. Physical characteristics of liquid obtained by MAP of WMP.
En
try
Set
-u
pA
bso
rber
Den
sity
Ult
imat
e an
alys
esC
/H
mo
lar
rati
o
Wat
er
con
ten
tC
HN
OS
(g/c
m3 )
(wt%
)(w
t%)
(wt%
)(w
t%)
(wt%
)(w
t%)
WP
M1L
-WA
-1.
089
19.1
810
.43
0.50
0.0
69.8
90.
1573
.8W
PM
1L-H
A-
-77
.42
12.4
92.
640.
07.
450.
52n.
d.T
4LA
Tire
0.87
486
.87
10.1
20.
660.
91.
450.
71n.
d.
WP
M2L
-WA
Tire
1.07
316
.15
7.25
0.00
0.0
76.6
00.
1977
.6W
PM
2L-H
AT
ire-
76.4
510
.57
1.90
0.0
11.0
80.
60n.
d.W
PM
3L-W
AC
arbo
n1.
075
17.4
110
.67
0.46
0.0
71.4
60.
1474
.1W
PM
3L-H
AC
arbo
n-
73.1
310
.18
0.75
0.0
15.9
40.
60n.
d.W
PM
4L-W
AF
e1.
100
21.7
29.
780.
630.
067
.87
0.18
63.3
WP
M4L
-HA
Fe
-85
.51
12.3
70.
640.
01.
480.
58n.
d.W
PM
5L-W
BC
arbo
n1.
022
8.86
10.9
31.
260.
078
.95
0.07
92.6
WP
M5L
-HB
Car
bon
0.80
483
.13
10.1
80.
750.
05.
940.
68n.
d.W
PM
6L-W
BF
e1.
054
14.7
210
.35
1.02
0.0
73.9
10.
1277
.6W
PM
6L-H
BF
e-
82.0
712
.75
0.92
0.0
4.26
0.54
n.d.
* by
diff
eren
ce. n
.d.:
not d
etec
ted.
7.2.2. GC/MS analysis
Liquid fractions were analyzed through GC/MS. Compositions were evaluated
by the total ion chromatography (TIC) without any response factor correction.
WMPnL-H fractions were waxy liquid which solidified at room temperature except
for WMP5L-H (Table 7.3). Waxy products were not analyzed by GC/MS because,
as previously reported, it was not possible to introduce them in the chromatograph
and probably they were not vaporized nor eluted. In Table 7.4 are reported the
main organic products present in the heavy liquid fractions (WMPnL-W); water
was excluded from the composition.
The main classes of products in WMP5L-H (Table 7.3) were linear alkanes and

7 - Composites, waste multi-layer packaging 157
1-alkenes due to PE pyrolysis according to data reported in the literature.13-16 They
were formed by direct cleavage of carbon-carbon bonds. It was not surprising
that a C25 hydrocarbon was the longest one, because the use of a fractionating
system improved the residence time of long chain compounds and promoted
their pyrolysis.5,7 Anyway the presence of cyclic and aromatic compounds was
unexpected because Undri et al. (Section 6) did not found these compounds in
MAP of high density polyethylene (HDPE) working in the same conditions, also if
a fractionating system was used.7 Their wide presence could be explained by low
density polyethylene (LDPE) pyrolysis or interaction with cellulose products during
pyrolysis. In fact branched PE such as LDPE are usually employed to prepare films
used for WMP as confirmed by FTIR of the plastic layer of the WMP employed.
Furthermore LDPE might pyrolyze in a way very close to PP where aromatic
compounds are formed. In fact LDPE contains large amount of tertiary carbons
with respect to HDPE and an intermediate behavior between HDPE and PP may
be expected. On the other hand aromatics may be formed through an interaction
between cellulose and PE intermediates inside the reactor. It is in fact reported
that cellulose is extremely reactive and during pyrolysis produces large amount of
radicals. These intermediates could be involved in reactions with other molecules
such as PE to give cyclization and aromatization reactions.11 These latter reactions
are enhanced in MAP when an active carbon was used as MW absorber as a very
efficient heat transfer agents.13 Single ring aromatic compounds were the main
products present in these fractions, however also indene, naphthalene, and their
methyl derivates were formed. Also some products from cellulose pyrolysis were
found in this fraction (2-methylfuran, 3-methylbut-3-en-2-one, 2,5-dimethylfuran,
furfural, cyclohexanone, 5-methylfuran-2-carbaldehyde, and phenol). They
showed higher affinity with the hydrocarbon fraction than to water.
Table 7.3. Compounds identified in WMP5L-H from MAP of WMP by GC/MS analyses.*Entry Compound Area
(%)Entry Compound Area
(%)
1 But-1-ene 0.3 40 Indene 0.7
2 Acetone 0.3 41 3-Methylphenol 0.7
3 Pent-1-ene 0.5 42 Undec-1-ene 3.6
4 Pentane 0.4 43 Undecane 2.7
5 Pent-2-ene 0.3 44 1-Methyl-1H-indene 0.6
6 Butan-2-one 0.4 45 Naphatalene 1.1
7 Hex-1-ene 2.3 46 Dodec-1-ene 2.3
8 2-Methylfuran 0.3 47 Dodecane 2.5
9 Hex-2-ene 0.4 48 Tridec-ene 1.5
10 Methylcyclopentane 0.3 49 1-Methylnaphtalene 0.7
11 3-Methylcyclopentene 0.4 50 Tridecane 1.7
(continue)

7 - Composites, waste multi-layer packaging158
12 Benzene 1.9 51 2-Methylnaphtalene 0.8
13 3-Methylbut-3-en-2-one 0.3 52 Bipheyl 0.3
14 Cyclohexene 0.3 53 Tetradec-1-ene 1.1
15 2-Methylhex-ene 0.3 54 Tetradecane 1.3
16 Hept-1-ene 2.5 55 Pentadec-1-ene 1.0
17 2,5-Dimethylfuran 0.3 56 Pentadecane 1.1
18 Heptane 2.1 57 Hexadec-1-ene 0.8
19 Hept-2-ene 0.5 58 Hexadecane 0.8
20 Methylcyclohexane 0.4 59 Heptadec-1-ene 0.5
21 Toluene 3.6 60 Heptadecane 0.8
22 1-Methylcyclohexene 0.4 61 Octadec-1-ene 0.4
23 Oct-1-ene 3.0 62 Octadecane 0.6
24 Octane 2.5 63 Nonadec-1-ene 0.3
25 Furfural 0.3 64 Nonadecane 0.5
26 Oct-2-ene 0.5 65 Eicos-1-ene 0.3
27 Cyclohexanone 0.3 66 Eicosane 0.5
28 Ethylbenzene 2.6 67 Henicos-1-ene 0.4
29 1,4-Dimethylbenzene 1.0 68 Henicosane 0.3
30 Styrene 2.3 69 Docos-1-ene 0.4
31 1,2-Dimethylbenzene 1.7 70 Docosane 0.4
32 Non-1-ene 3.4 71 Tricos-1-ene 0.1
33 Nonane 2.5 72 Tricosane 0.3
34 5-Methylfuran-2-carbaldehyde
0.5 73 Tetracos-ene 0.1
35 Propylbenzene 0.7 74 Tetracosane 0.2
36 Phenol 0.3 75 Pentacos-1-ene 0.1
37 1-Ethyl-3-methylbenzene 1.2 76 Pentacosane 0.4
38 Dec-1-ene 4.1
39 Decane 2.7 Total identified 79.6
* Compositions were reported by percent peak areas without any response factors
correction; other peaks in concentration lower than 0.1 % were not reported.
On the other hand Russell et al.13 reported in pyrolysis of HDPE different amounts
of alkane/alkene and aromatics working with MAP at different temperatures, when
active carbons were used as MW absorber. Over 773 K they reported a rising
abundance of cyclo- and branched alkenes while working at 873 K aromatics were
present up to 45.3 % of the overall compounds. The different results obtained may
be attributed to an efficient interaction between PE and cellulose intermediates or
to the different operating system.
The main component of the bottom phase was water (Table 7.2) and it was
not detected by GC/MS nor considered in the composition reported in Table
7.4. Almost all listed substances were those usually identified and reported for
classical pyrolysis of cellulose.8,17-20

7 - Composites, waste multi-layer packaging 159
Table 7.4. Compositions of heavy liquid phases by GC/MS analyses from MAP of WMP.*
Entry Substance
WM
P1L
-W
WM
P2L
-W
WM
P3L
-W
WM
P4L
-W
WM
P5L
-W
WM
P6L
-W
1 Acetaldehyde 1.0 1.2 1.8 0.6 3.5 0.9
2 Acetone 1.8 2.0 3.8 1.3 7.1 2.6
3 2-Oxopropanal 1.3 0.5 1.3 0.2 0.6 0.0
4 Formic acid 3.1 1.9 2.0 2.3 0.0 4.0
5 2-Hydroxyacetaldehyde 0.8 0.3 0.0 0.0 0.0 0.0
6 Acetic acid 10.6 10.3 16.5 3.5 23.3 4.8
7 1-Hydroxypropan-2-one 9.6 9.4 13.7 10.4 15.1 25.9
8 1-Hydroxybutan-2-one 2.6 1.6 2.9 1.2 2.2 1.2
9 Furfural 1.6 1.4 2.0 1.1 4.1 2.3
10 2-Furanmethanol 2.5 3.2 3.1 1.3 3.9 3.4
11 2(5H)-Furanone 3.0 2.0 3.2 2.7 1.0 4.6
12 Cyclohexanone 3.8 2.3 4.2 4.0 0.7 4.6
13 3-Methylcyclopenta-1,2-dione
2.3 1.5 2.3 3.1 0.0 4.4
14 2-Methylphenol 1.4 0.9 2.0 0.5 0.3 1.9
15 2-Propenyl butanate 2.0 0.3 0.5 3.6 0.0 0.0
16 Unidentified alcohol 5.7 4.2 4.3 8.0 0.0 1.2
17 5-(Hydroxymethyl)- 2-furancarboxaldehyde
1.1 0.8 1.0 0.9 0.0 0.0
18 1,6-Anhydro-β-D-glucopyranose (Levuglucosan)
4.9 1.9 2.3 0.0 0.0 0.0
Total identified 59.1 45.4 67.1 44.7 61.7 61.8
* Compositions were reported by percent peak areas without any response factors
correction; other peaks in concentration lower than 0.1 % were not reported.
Levuglucosan was collected in low amount with respect to other reported
pyrolysis.8,17,21,22 It might be further degraded after its formation in appropriate
pyrolysis conditions9,17 suggesting that samples were heated at higher temperature
or for a prolonged time. As a confirm to this suggestions levuglucosan was not
present in the liquid obtained from pyrolysis performed with set-up B. Furthermore
1,6-anhydro-β-glucofuranose and glyceraldehyde also are widely reported as
cellulose pyrolysis products17 but they were not identified among products formed.
Probably these compounds were completely pyrolyzed or they were not formed in
the conditions tested.
Several effects were accountable to the MW absorber. WMP2L-W contained
water soluble products from tire degradation and pyrolysis of cellulose. Carbon
as MW absorber with set-up A (WMP3L-W) was able to promote a more efficient

7 - Composites, waste multi-layer packaging160
pyrolysis than the Al present in WMP as the sole MW absorber (WMP1L-W).
Indeed lower amount of levuglucosan and other heavy compounds were found
in low extent together with low molecular weight products such as acetaldehyde,
acetone, and in higher amount acetic acid, and 1-hydroxypropan-2-one. WMP5L-W,
obtained with set-up B and carbon as MW absorber, showed even lower amount
of heavy pyrolyzable compounds and the highest amount of acetic acid.
Fe as MW absorber showed other effects. Levuglucosan, if formed, was always
further pyrolyzed and it was not found even in trace (WMP4L-W), suggesting
a very efficient heating or its Fe catalyzed decomposition. Also acetic acid was
present in lower amounts (3.51 - 4.84 %, WMP4L-W and WMP6L-W respectively).
Fe might work as a catalyst for pyrolysis or it reacted with organic acid present
in the reaction medium. It contributed to reduce the amount of free acid and,
somehow, to upgrade the quality of this fraction.
7.2.3. FT-IR analysis
FTIR spectra were recorded on heavy and light fractions. Spectra of upper
phase of each liquid did not show remarkable water absorption (Table 7.5). Only
WMP1L-H showed medium intensity water absorptions due to small amount of
water swallowed by the wax present (Figure 7.2).
Table 7.5. FTIR absorption of upper liquid phases, WMPnL-H.*
Frequency (cm-1)
Attribution
WM
P1L
-H
T4L
WM
P2L
-H
WM
P3L
-H
WM
P4L
-H
WM
P5L
-H
WM
P6L
-H
3475 Alcohol O-H stretching m n.d. n.d. m m n.d. w
3078, 3020 Terminal vinyl C-H stretching w w w w w w w
2957, 2872 Methyl C-H stretching m s s m m m m
2924, 2854 Methylene C-H stretching m s s m m s s
1710 Carboxylic/ketone C=O s n.d. m s s m s
1668 Conjugated C=O w n.d. w w w w w
1640 Alkenyl C=C stretching w w w w w w w
1496, 1457 C=C-C aryl ring stretching m w m m m m m
1407, 1366 Phenol or tertiary alcohol O-H bending
m n.d. m m m w m
1279 Primary or secondary O-H in-plane bending
m n.d. w m m w w
1238, 1193 Phenol C-O stretching m n.d. w m m w w
1202; 1083, 1028, 1020
Aromatic C-H in-plane bendingm w w m m w w
1080 Secondary alcohol, C-O stretching
m n.d. w m m n.d. w
1050, 1039 Primary alcohol C-O stretching s n.d. w s s w w
(continue)

7 - Composites, waste multi-layer packaging 161
840, 774, 755, 748,
731
Aromatic C-H out-of-plane bending m w m m m w m
694 C-C ring bending m w m m m w m
615 brAlcohol O-H out-of-plane
bendingw n.d. n.d. w w n.d. n.d.
* Absorption intensities: s: strong; m: medium; w: weak; br: broad; n.d.: not detected.
FTIR spectra confirmed the prevailing presence of alkane and alkene in
WMPnL-H fractions. However noteworthy absorptions of alcohols and phenols
groups were incontrovertibly evidenced. Probably some aromatic and alcoholic
substances had higher affinity for this hydrocarbon phase than the aqueous one
as confirmed also by GC/MS data.
Figure 7.2. FTIR spectra of: a. WMP1L-H; b. WMP2L-H; c. WMP5L-H.
Bottom phase showed strong water absorption bands which overwhelm any
other absorption. Thus FTIR spectrum of pure water was subtracted from spectra
of WMPnL-W (Figure 7.3) to remove water absorptions; the residual absorptions
and their relative attributions are reported in Table 7.6.
Table 7.6. FTIR absorptions of heavy liquid phases, WMPnL-W. *
Frequency (cm-1)
Attribution
WM
P1L
-W
WM
P2L
-W
WM
P3L
-W
WM
P4L
-W
WM
P5L
-W
WM
P6L
-W
3475 Alcohol O-H stretching m s m m m m
2954, 2886 Methyl C-H stretching m m m m w w
1712 Carboxylic/ketone C=O s s s s s s
1668 Conjugated C=O m m m w m m
1407, 1366 Phenol or tertiary alcohol O-H bending
w m m m m m
1279 Primary or secondary O-H in-plane bending
w m m m s m
(continue)

7 - Composites, waste multi-layer packaging162
1238, 1193 Phenol C-O stretching w m m m m m
1080 Secondary alcohol, C-O stretching s s s m s s
1050, 1039 Primary alcohol C-O stretching s s s m s s
615 broad Alcohol O-H out-of-plane bending w s s s s s
* Absorption intensities: s: strong; m: medium; w: weak.
WMPnL-W fraction contained large amount of water soluble compounds which
included the following functional groups: alcohols, carbonyls, carboxyls, and
phenols in agreement with by GC/MS analyses (Section 7.2.2). Medium/weak
absorptions of methyl group were always present. They intensities were weaker
in WMP5L-W and WMP6L-W; because these liquids were collected with set-up B
and the methyl containing intermediates were further pyrolyzed.
Figure 7.3. FTIR spectra of a: WMP4L-W, water spectrum subtracted; b: WMP4L-W.
7.2.4. 1H NMR
WMPnL-H fractions were also analyzed via 1H-NMR (Figure 7.4). Distribution
of different proton classes (aromatics, paraffins, and olefins) were evaluated
using Myers equation;23 the chain length of linear alkanes from PE pyrolysis was
evaluated through the following equation: Chain Length = 2 + 3(Ii/It).
Where Ii was the integral of the internal -CH2- groups (δ: 1.10 - 1.45 ppm) and It
was the integral of the terminal -CH3 groups (δ: 0.60 - 1.00 ppm). These data are
summarized in Table 7.7.

7 - Composites, waste multi-layer packaging 163
Table 7.7. Proton distribution and medium chain length of a linear alkane from 1H-NMR.
WM
P1L
-H
T4L
WM
P2L
-H
WM
P3L
-H
WM
P4L
-H
WM
P5L
-H
WM
P6L
-H
Aromatics (vol%) 16.0 21.7 17.4 9.3 5.7 20.2 10.9
Paraffins (vol%) 70.6 47.3 54.1 63.7 75.5 53.6 64.8
Olefins (vol%) 13.4 31.0 28.5 27.0 18.9 26.2 24.2
Chain Length (n° of atoms) 18.8 - 8.2 18.5 22.5 16.0 17.1
The presence of aromatics (5.7 - 32.7%) was in agreement with GC/MS data.
As above hypothesized, pyrolysis of cellulose produced large amount of radicals
intermediates which might reacted with PE degradation products to form aromatics.
The presence of olefins was in agreement with GC/MS data and results
reported in the literature.7,13 In fact the main pyrolysis products of PE are alkanes
and 1-alkenes together with minor amount of aromatics and cyclic hydrocarbons.7
Pyrolysis performed with Fe as MW absorber showed a lower amount of aromatics;
probably the faster heating, already described, improved the gas formation and
reduced the residence time (shortest pyrolysis time, Table 7.1). So far aromatization
reaction occurred in minor extent.
Figure 7.4. 1H-NMR of LnH where n is the number reported in ordinates.
The chain length, evaluated through 1H-NMR was reported in Table 7.7 even
if it was an approximate value (alkene presence was not taken in account) but
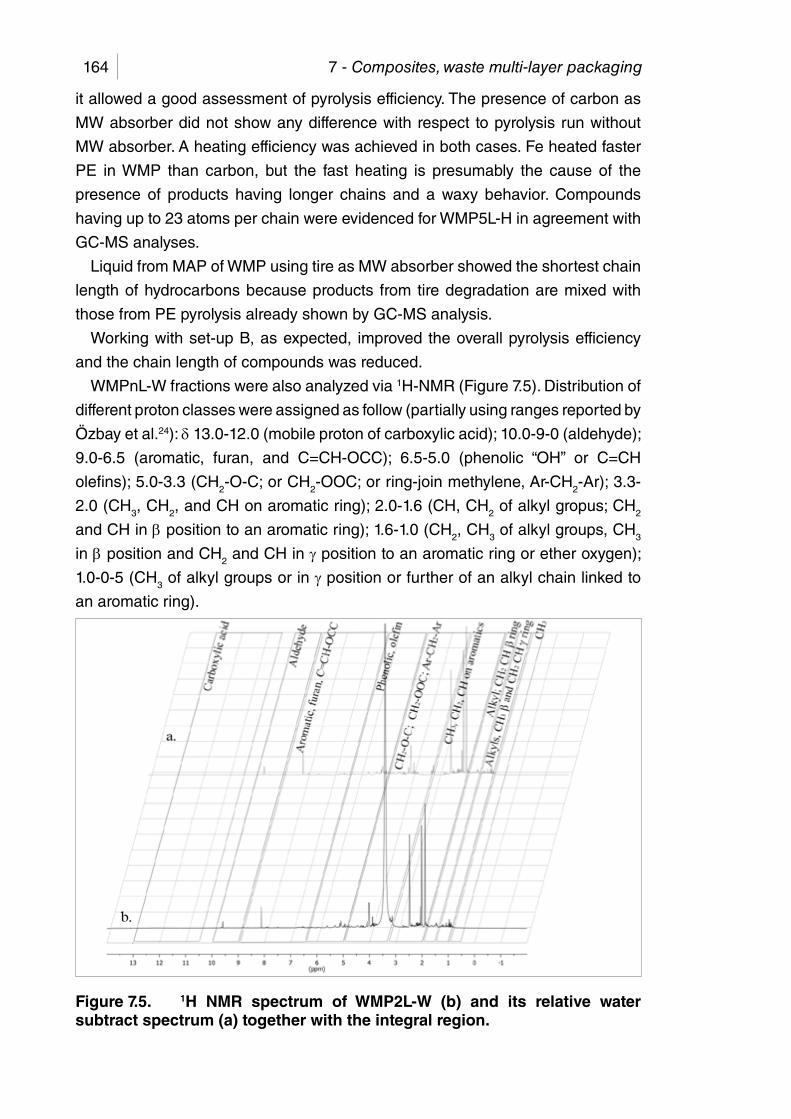
7 - Composites, waste multi-layer packaging164
it allowed a good assessment of pyrolysis efficiency. The presence of carbon as
MW absorber did not show any difference with respect to pyrolysis run without
MW absorber. A heating efficiency was achieved in both cases. Fe heated faster
PE in WMP than carbon, but the fast heating is presumably the cause of the
presence of products having longer chains and a waxy behavior. Compounds
having up to 23 atoms per chain were evidenced for WMP5L-H in agreement with
GC-MS analyses.
Liquid from MAP of WMP using tire as MW absorber showed the shortest chain
length of hydrocarbons because products from tire degradation are mixed with
those from PE pyrolysis already shown by GC-MS analysis.
Working with set-up B, as expected, improved the overall pyrolysis efficiency
and the chain length of compounds was reduced.
WMPnL-W fractions were also analyzed via 1H-NMR (Figure 7.5). Distribution of
different proton classes were assigned as follow (partially using ranges reported by
Özbay et al.24): δ 13.0-12.0 (mobile proton of carboxylic acid); 10.0-9-0 (aldehyde);
9.0-6.5 (aromatic, furan, and C=CH-OCC); 6.5-5.0 (phenolic “OH” or C=CH
olefins); 5.0-3.3 (CH2-O-C; or CH2-OOC; or ring-join methylene, Ar-CH2-Ar); 3.3-
2.0 (CH3, CH2, and CH on aromatic ring); 2.0-1.6 (CH, CH2 of alkyl gropus; CH2
and CH in β position to an aromatic ring); 1.6-1.0 (CH2, CH3 of alkyl groups, CH3
in β position and CH2 and CH in g position to an aromatic ring or ether oxygen);
1.0-0-5 (CH3 of alkyl groups or in g position or further of an alkyl chain linked to
an aromatic ring).
Figure 7.5. 1H NMR spectrum of WMP2L-W (b) and its relative water subtract spectrum (a) together with the integral region.

7 - Composites, waste multi-layer packaging 165
Integrals of 1H NMR spectra of WMPnL-W fractions are reported in Table 5,
they were calculated after subtracting the water peak, and then integrals were
normalized to 1000.0.
Table 7.8. Normalized areas of water fractions.H
ydro
gen
clas
s
Mob
ile p
roto
n fr
om c
arbo
xylic
ac
ids
Ald
ehyd
es
Aro
mat
ic, f
uran
, and
C=
CH
-O
CC
Phe
nolic
“OH
” or
C=
CH
ole
fins
CH
2-O
-C; o
r C
H2-
OO
C; o
r rin
g-jo
in m
ethy
lene
, Ar-
CH
2-A
r
CH
3, C
H2,
and
CH
on
arom
atic
rin
g
CH
, CH
2 al
kyl g
ropu
s; C
H2,
C
H β
to a
n ar
omat
ic r
ing
CH
2, C
H3
alky
l gro
ups,
CH
3 in
β a
nd C
H2,
CH
in g
to a
n ar
omat
ic r
ing
or e
ther
oxy
gen
CH
3 of
alk
yl g
roup
s or
in g
or
furt
her
of a
n al
kyl c
hain
link
ed to
an
aro
mat
ic r
ing
Chemical shift (ppm)
13.0-12.0
10.0-9.0
9.0-6.5
6.5-5.0
4.5-3.3
3.3-2.0
2.0-1.6
1.6-1.0 1.0-0.5
Entry
WMP1L-W 0.1 11.8 35.5 98.5 217.7 328.9 143.7 115.9 47.9
WMP2L-W 0.2 9.3 41.9 120.9 239.9 260.3 162.8 115.2 49.4
WMP3L-W 0.1 9.7 26.0 43.2 297.2 340.2 146.2 98.0 39.3
WMP4L-W 12.2 58.7 188.1 187.4 196.1 226.6 61.6 49.0 20.3
WMP5L-W 0.1 7.9 18.4 7.3 112.1 435.6 224.2 107.7 86.8
WMP6L-W 0.0 13.0 40.3 54.5 260.4 350.7 154.2 74.7 52.1
The signal of acid protons was barely noticeable from background, if present
they were in very low amount and hardly discriminated. Also aldehydes integrals
were weakly present suggesting that the medium strength carbonyl band in FTIR
was probably attributable to ketones. The strongest signals were those related
to protons close to oxygen or aromatic moieties. These data were in agreement
with GC/MS and FTIR analyses. All results reported in Table 7.8 were very close
among them suggesting a weak influence of the reaction condition over products
distribution. Only WMP4L-W showed some remarkable differences. Indeed
aldehydes and furans were more abundant, probably the simultaneous use of
set-up A and Fe as MW absorber promoted slightly different reaction path than in
any other conditions.
7.3. Gas product
Gas was mainly constituted by C1 – C3 hydrocarbons and COx, while several
C4 hydrocarbons were identified as minor products. Hydrocarbon was mainly
formed from PE pyrolysis; while COx were due to cellulose degradation products
accordingly to literature.8,17,25 CO2 amount was improved enhancing the residence
time. Indeed total amount of CO2 was 0.087 and 0.113 mol respectively for WMP4
and WMP6.

7 - Composites, waste multi-layer packaging166
7.4. Solid product
Solid residues were mainly constituted by MW absorber, Al, and char formed
by WMP residue (except for WMP1, where only Al and WMP residue were
present). Solid from WMP1, did not had any MW absorber and it was composed
of Al and residue of paper foils (Figure 7.1a). It contained high amount of ash
(17% for solid, from WMP1, Al foil depleted) from paper manufacturing and an
ultimate composition of C: 66.0%, H: 1.0%, and N: 0.5% suggesting a formulation
C11H2N0.08O4.
7.5. Main achievements
Fuel has been obtained, even in relatively low amount by waste and/or polluted
multi-layer beverage packaging (WMP) through microwave assisted pyrolysis
(MAP). Two apparatus set-up and three MW absorbers (tire, powder of carbon or
Fe) were tested. The main achievements of this research are:
Microwave assisted pyrolysis (MAP) of WMP might by run with or without a MW
absorber, and five products were always collected: char, gas, unscratched Al, and
two liquid fractions.
Fe promoted a faster pyrolysis than the others MW absorbers, and avoided
the formation of large amount of cyclic and aromatic compounds from PE layers.
Furthermore Fe let a better pyrolysis of anydrosugars and acids from paper
pyrolysis.
Pyrolysis time with carbon as MW absorber was higher than using any other
absorbers, and is allowed cross reaction between paper and PE degradation
products enhancing aromatics formation.
An organic liquid fraction containing large amount of hydrocarbons, useful as fuel
or the source of chemicals might be obtained, even in limited amount, using set-
up B. Also a liquid containing large amount of water was recovered from the heavy
liquid fraction. It contained large amounts of oxygenated organic compounds,
such as acetic acid, and 2-hydroxypropan-2-one as the main components.
A fractionating system (set-up B), inserted between the oven and the condensing
system increases the residence time of high Mw products in the oven. As a
consequence char formation was enhanced together with the pyrolysis efficiency
and large amount of compounds having a lower molecular weight were formed
than pyrolysis ran without the fractionating system, that is liquid shows better
performances as fuel.

7 - Composites, waste multi-layer packaging 167
Reference
1. Ludlow-Palafox, C.; Chase, H. A. Microwave-Induced Pyrolysis of Plastic Wastes. Ind. Eng. Chem. Res. 2001, 40, 4749-4756.2. Arabiourrutia, M.; Elordi, G.; Lopez, G.; Borsella, E.; Bilbao, J.; Olazar, M. Characterization of the waxes obtained by the pyrolysis of polyolefin plastics in a conical spouted bed reactor. J. Anal. Appl. Pyrol. 2012, 94, 230-237.3. Elordi, G.; Olazar, M.; Lopez, G.; Artetxe, M.; Bilbao, J. Product Yields and Compositions in the Continuous Pyrolysis of High-Density Polyethylene in a Conical Spouted Bed Reactor. Ind. Eng. Chem. Res. 2011, 50, 6650-6659.4. Elordi, G.; Olazar, M.; Lopez, G.; Amutio, M.; Artetxe, M.; Aguado, R.; Bilbao, J. Catalytic pyrolysis of HDPE in continuous mode over zeolite catalysts in a conical spouted bed reactor. J. Anal. Appl. Pyrol. 2009, 85, 345-351.5. Undri, A.; Rosi, L.; Frediani, M.; Frediani, P. Upgraded Fuel from Microwave Assisted Pyrolysis of Waste Tire. Fuel 2014, 115, 600-608.6. Undri, A.; Rosi, L.; Frediani, M.; Frediani, P. Reverse Polymerization of Waste Polystyrene through Microwave Assisted Pyrolysis. J. Anal. Appl. Pyrol. 2013, http://dx.doi.org/doi:10.1016/j.jaap.2013.10.001.7. Undri, A.; Rosi, L.; Frediani, M.; Frediani, P. Efficient Disposal of Waste Polyolefins through Microwave Assisted Pyrolysis. Fuel 2013, 116, 662-671.8. Lin, Y.-C.; Cho, J.; Tompsett, G. A.; Westmoreland, P. R.; Huber, G. W. Kinetics and Mechanism of Cellulose Pyrolysis. J. Phys. Chem. C 2009, 113, 20097-20107.9. Ronsse, F.; Bai, X.; Prins, W.; Brown, R. C. Secondary reactions of levoglucosan and char in the fast pyrolysis of cellulose. Environ. Prog. Sustain. Energy 2012, 31, 256-260.10. Wang, Y.; Li, X.; Mourant, D.; Gunawan, R.; Zhang, S.; Li, C.-Z. Formation of Aromatic Structures during the Pyrolysis of Bio-oil. Energy Fuels 2012, 26, 241–247.11. Korkmaz, A.; Yanik, J.; Brebu, M.; Vasile, C. Pyrolysis of the tetra pak. Waste Manage. 2009, 29, 2836-2841.12. Liu, C.; Huang, J.; Huang, X.; Li, H.; Zhang, Z. Theoretical studies on formation mechanisms of CO and CO2 in cellulose pyrolysis. Comp. Theor. Chem. 2011, 964, 207-212.13. Russell, A. D.; Antreou, E. I.; Lam, S. S.; Ludlow-Palafox, C.; Chase, H. A. Microwave-assisted pyrolysis of HDPE using an activated carbon bed. RSC Advances 2012, 2, 6756-6760.14. Mastral, F. J.; Esperanza, E.; Garcìa, P.; Juste, M. Pyrolysis of high-density polyethylene in a fluidised bed reactor. Influence of the temperature and residence time. J. Anal. Appl. Pyrol. 2002, 63, 1-15.15. Kim, S.-S.; Kim, S. Pyrolysis characteristics of polystyrene and polypropylene in a stirred batch reactor. Chem. Eng. J. 2004, 98, 53-60.16. Kaminsky, W.; Zorriqueta, I.-J. N. Catalytical and thermal pyrolysis of polyolefins. J. Anal. Appl. Pyrol. 2007, 79, 368-374.17. Shen, D. K.; Gu, S. The mechanism for thermal decomposition of cellulose and its main products. Bioresour. Technol. 2009, 100, 6496-6504.18. Zhang, X.; Yang, W.; Blasiak, W. Kinetics of levoglucosan and formaldehyde formation during cellulose pyrolysis process. Fuel 2012, 96, 383-391.19. Mettler, M. S.; Mushrif, S. H.; Paulsen, A. D.; Javadekar, A. D.; Vlachos, D. G.; Dauenhauer, P. J. Revealing pyrolysis chemistry for biofuels production: Conversion of cellulose to furans and small oxygenates. Energ. Environ. Sci. 2012,

7 - Composites, waste multi-layer packaging168
5, 5414-5424.20. Sánchez-Jiménez, P.; Pérez-Maqueda, L.; Perejón, A.; Pascual-Cosp, J.; Benítez-Guerrero, M.; Criado, J. An improved model for the kinetic description of the thermal degradation of cellulose. Cellulose 2011, 18, 1487-1498.21. Choi, S.-S.; Kim, M.-C.; Kim, Y.-K. Influence of silica on formation of levoglucosan from carbohydrates by pyrolysis. J. Anal. Appl. Pyrol. 2011, 90, 56-62.22. Patwardhan, P. R.; Satrio, J. A.; Brown, R. C.; Shanks, B. H. Product distribution from fast pyrolysis of glucose-based carbohydrates. J. Anal. Appl. Pyrol. 2009, 86, 323-330.23. Myers, M. E.; Stollstelmer, J.; Wims, A. M. Determination of Hydrocarbon-Type Distribution’ and Hydrogen/Carbon Ratio of Gasolines by Nuclear Magnetic Resonance Spectrometry. Anal. Chem. 1975, 47, 2010-2015.24. Özbay, N.; Pütün, A. E.; Pütün, E. Structural analysis of bio-oils from pyrolysis and steam pyrolysis of cottonseed cake. J. Anal. Appl. Pyrol. 2001, 60, 89-101.25. Paulsen, A. D.; Mettler, M. S.; Vlachos, D. G.; Dauenhauer, P. J. The Role of Sample Dimension and Temperature in Cellulose Pyrolysis. Energy Fuels 2013, 27, 2126–2134.

8. Biomasses, wood pellets
Microwave assisted pyrolysis (MAP) of wood pellets (WP). MAP of WP was
exploited by varying four parameters: set-up, MW power, MW absorber, and
mixing protocol between WP and MW absorber.
8.1. Operating conditions and yields
WP were able to interact with MW radiation even without a MW absorber, and
they were transformed into three products: liquid (also known as bio-oil), gas, and
char.
When MAP was carried out in the presence of a MW absorber (carbon or Fe)
and MW were turned on, WP did not melt and they did not amalgamate with MW
absorber because WP contained non-thermoplastic polymer.1,2 MW absorber
remained on the outer surface of pellets and at the end of pyrolysis WP kept their
former shape and they could be quantitatively separated from the MW absorber.
Manual separation was achieved by splitting up the residual WP, when carbon was
the MW absorber, or with the aid of a magnet, when Fe was the MW absorber
(Figure 8.1b).
Figure 8.1. WP after pyrolysis: a) from WP2, no MW absorber; b) from WP6, carbon was the MW absorber; c) from WP12, Fe was the MW absorber.
The mixing protocol between WP and MW absorber might be of crucial
importance to control the final products characteristics because a different
distribution of the MW absorber on the surface of WP might influence final
properties of products. Indeed three way of mixing the MW absorber with WP
was tested: none, the MW absorber were simply transferred in the reaction flask;
mild agitation, MW absorber and WP were manually shaken for 15 seconds prior
pyrolysis; strong agitation, MW absorber and WP were shaken for at least 90

8 - Biomasses170
seconds prior pyrolysis.
Carbon did not show any remarkable difference in yield and physical
characteristics of products among different mixing protocol. Meanwhile Fe showed
sound differences switching from a protocol to another one. Three pyrolyses were
run with different agitation: WP3, none; WP4, mild; and WP5, strong (Table 8.1) to
report any effects and difference.
The operating parameters employed, set-up, MW absorber, and MW power are
reported in Table 8.1 (entries are named “WPn” where “n” is an arbitrary ascending
number for each experiment).
Table 8.1. MAP of WP, operating parameters.
En
try
Set
-up
Ab
sorb
er
Ab
sorb
er
WP
MW
p
ow
er
WP
/A
bso
rber
Tim
e
So
lid
Liq
uid
Gas
(g) (g) (kW) (min) (wt%) (wt%) (wt%)
WP1 A - 150.5 - 3 - 10 95.75 0.00 4.25
WP2 A - 150.1 - 3 - 36 61.16 27.98 10.86
WP3 A - 151.0 - 3 - 45 68.08 23.25 8.68
WP4 A Fe 150.4 78.6 3 1.9 26 46.28 35.44 18.28
WP5 A Fe 150.5 78.9 3 1.9 26 38.01 39.27 22.72
WP6 A Fe 151.1 81.3 3 1.9 26 32.50 41.50 26.01
WP7 A Carbon 300.2 63.5 3 4.7 25 22.95 47.70 29.35
WP8 A Carbon 150.5 78.8 3 1.9 23 23.26 41.86 34.88
WP9 A Carbon 211.7 75.0 1.2-3.0
2.8 67 24.89 46.10 29.00
WP10 B Fe 149.0 77.6 3 1.9 29 32.75 34.56 32.68
WP11 B Fe 150.5 78.6 3 1.9 26 35.35 37.41 27.24
WP12 B Carbon 150.6 78.6 3 1.9 24 25.90 40.77 33.33
WP13 B Carbon 301.0 100.0 3 3.0 35 23.62 42.92 33.46
WP14 B Carbon 212.0 75.3 1.2-3.0
2.8 67 26.32 41.89 31.79
Entries WP1, WP2, and WP3, were performed without any MW absorber. Only
in these pyrolyses WP did not preserve their former shape and partially bulged
or burst. The internal part of WP were initially heated in agreement with Miura et
al.,3,4 Farag et al.5, and Vongpradubchai and. Rattanadecho.6 Even WP1, which
was interrupted after 10 min as soon as vapor evolution was stopped, showed
this bulge/burst effect. WP1 clearly displayed that a simple drying of WP without
losing their former shape was impracticable in this condition (Figure 8.1a). Most
of WPs were converted into gas and liquid was not recovered although few drops
of it were recovered from the glass joint and some analysis were performed (liquid
yield below 0.005 wt%).
WP2 and WP3 were performed in the same conditions but substantial

8 - Biomasses 171
differences in yield were highlighted. The oven always showed a homogeneous
magnetic field in spite of feeding materials employed (see Section 5 and 6) so
far this different behavior might be explained only through non-homogeneity of
samples.1,2,7,8 150 g of WP were not a representative sample. The distribution of
wood pellets inside the reactor was crucial for reproducibility of MAP. Furthermore
formation of randomly distributed carbon and/or char during pyrolysis might vary
stochastically the absorbing ability of WP. A critical issue was represented by the
moisture content. As a matter of fact only water was able to absorb MW radiation
and cause pyrolysis while heating up.9 However only strong MW radiation is
able to pyrolyze WP without a MW absorber as reported by Robinson et al. who
impregnated WP to increase the moisture content.9
These accounts were true only for MAP without MW absorber. Indeed if a MW
absorber was present and the same mixing protocol was employed pyrolysis
were reproducible. The energy was transferred in a completely different way; MW
absorber was in contact with the outer surface of WP so heat was transferred from
the outside to the inside part of pellets while without a MW absorber the heat was
produced into the center of WP.
WP3, WP4, and WP5 were performed under the same operating conditions
but different mixing protocol. The solid yield decreased as the mixing strength
and time were improved (46.3, 38.0, and 32.5 wt% respectively). The solid yield
was greater because the pyrolysis was not complete, in agreement with ultimate
analyses which showed a rising carbon content as the mixing was stronger (see
Section 8.2.2). Therefore a strong mixing protocol was adopted for the other
pyrolysis. However this protocol was not enough to achieve a good reproducibility
of tests (difference in yield higher than 1 wt%) when Fe was the absorber, WP10
and WP11.
Effects from mixing protocol were not evidenced in pyrolyses where carbon was
the MW absorber. The yield reproducibility was within the range of 1 wt% and
herein were reported only the most relevant pyrolysis. The carbon employed had
a density of 0.5 g/cm3 while Fe had a density of 7.86 g/cm3 (see Section 5.3.1).10
So far carbon took up a volume 16 times higher than Fe(0) for the same amount
of absorber. Its distribution, even after the mild mixing protocol, was enough to
envelop homogenously WP. Furthermore carbon was more finely grinded than
Fe and could adhere more efficiently to the rough surface of WP. Furthermore the
surface tension of carbon was very close to WP with respect to Fe.
Nevertheless Fe as MW absorber increased the formation of solid compared
to carbon (about 32 wt% for Fe and about 23 wt% for carbon). Simultaneously
higher yield of liquid and gas were observed when carbon was the MW absorber
instead of Fe. Fe seemed to promote condensation reactions to yield non-
volatiles compounds (solid or products remained trapped in the solid structure).
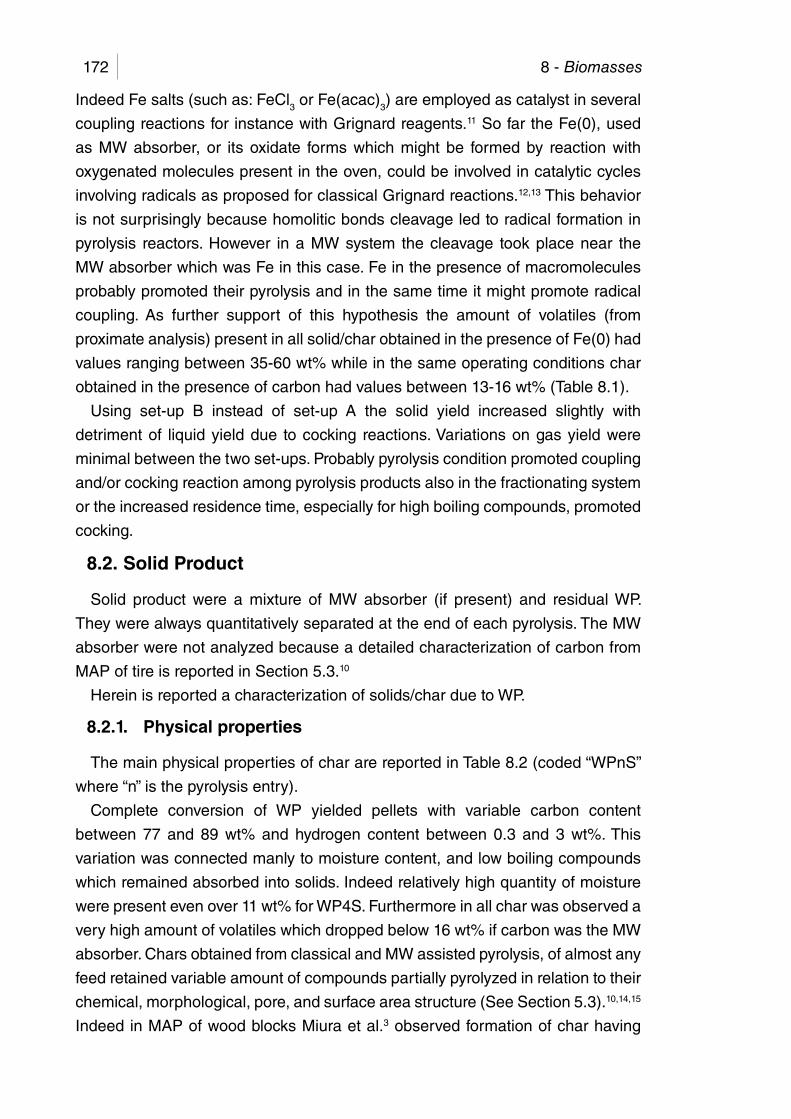
8 - Biomasses172
Indeed Fe salts (such as: FeCl3 or Fe(acac)3) are employed as catalyst in several
coupling reactions for instance with Grignard reagents.11 So far the Fe(0), used
as MW absorber, or its oxidate forms which might be formed by reaction with
oxygenated molecules present in the oven, could be involved in catalytic cycles
involving radicals as proposed for classical Grignard reactions.12,13 This behavior
is not surprisingly because homolitic bonds cleavage led to radical formation in
pyrolysis reactors. However in a MW system the cleavage took place near the
MW absorber which was Fe in this case. Fe in the presence of macromolecules
probably promoted their pyrolysis and in the same time it might promote radical
coupling. As further support of this hypothesis the amount of volatiles (from
proximate analysis) present in all solid/char obtained in the presence of Fe(0) had
values ranging between 35-60 wt% while in the same operating conditions char
obtained in the presence of carbon had values between 13-16 wt% (Table 8.1).
Using set-up B instead of set-up A the solid yield increased slightly with
detriment of liquid yield due to cocking reactions. Variations on gas yield were
minimal between the two set-ups. Probably pyrolysis condition promoted coupling
and/or cocking reaction among pyrolysis products also in the fractionating system
or the increased residence time, especially for high boiling compounds, promoted
cocking.
8.2. Solid Product
Solid product were a mixture of MW absorber (if present) and residual WP.
They were always quantitatively separated at the end of each pyrolysis. The MW
absorber were not analyzed because a detailed characterization of carbon from
MAP of tire is reported in Section 5.3.10
Herein is reported a characterization of solids/char due to WP.
8.2.1. Physical properties
The main physical properties of char are reported in Table 8.2 (coded “WPnS”
where “n” is the pyrolysis entry).
Complete conversion of WP yielded pellets with variable carbon content
between 77 and 89 wt% and hydrogen content between 0.3 and 3 wt%. This
variation was connected manly to moisture content, and low boiling compounds
which remained absorbed into solids. Indeed relatively high quantity of moisture
were present even over 11 wt% for WP4S. Furthermore in all char was observed a
very high amount of volatiles which dropped below 16 wt% if carbon was the MW
absorber. Chars obtained from classical and MW assisted pyrolysis, of almost any
feed retained variable amount of compounds partially pyrolyzed in relation to their
chemical, morphological, pore, and surface area structure (See Section 5.3).10,14,15
Indeed in MAP of wood blocks Miura et al.3 observed formation of char having
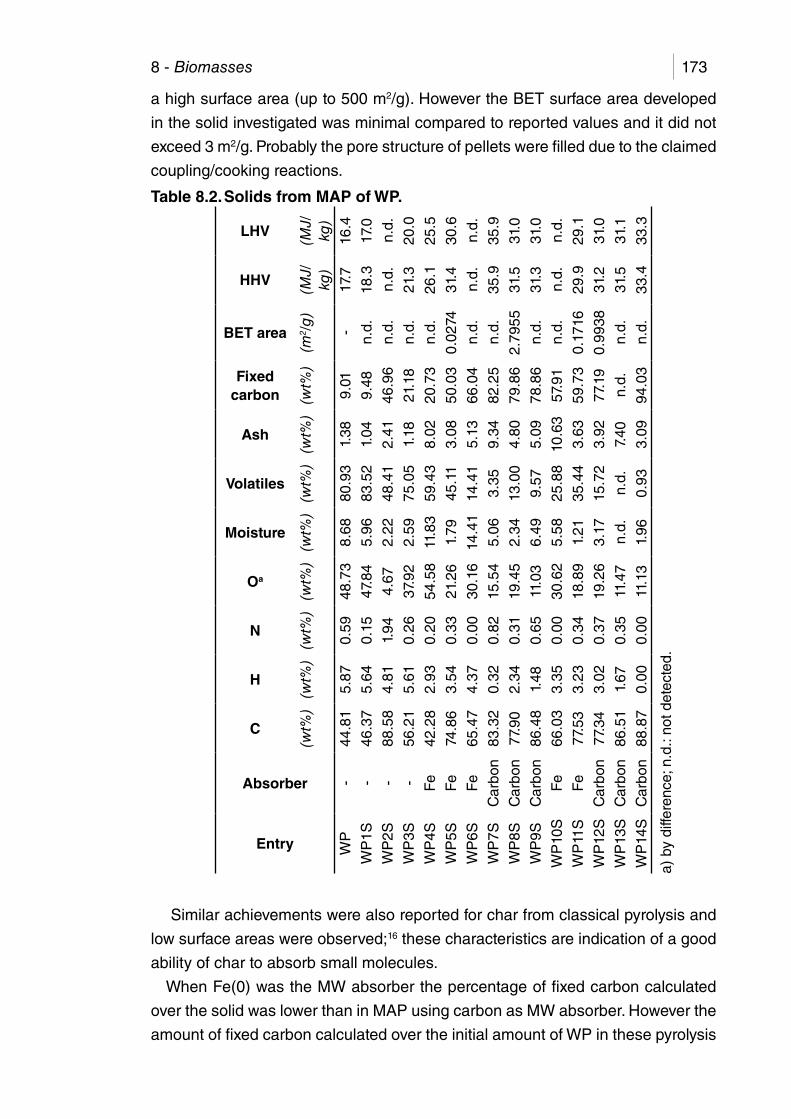
8 - Biomasses 173
a high surface area (up to 500 m2/g). However the BET surface area developed
in the solid investigated was minimal compared to reported values and it did not
exceed 3 m2/g. Probably the pore structure of pellets were filled due to the claimed
coupling/cooking reactions.
Table 8.2. Solids from MAP of WP.
Similar achievements were also reported for char from classical pyrolysis and
low surface areas were observed;16 these characteristics are indication of a good
ability of char to absorb small molecules.
When Fe(0) was the MW absorber the percentage of fixed carbon calculated
over the solid was lower than in MAP using carbon as MW absorber. However the
amount of fixed carbon calculated over the initial amount of WP in these pyrolysis
Entry
Absorber
C
H
N
Oa
Moisture
Volatiles
Ash
Fixed carbon
BET area
HHV
LHV
(wt%
)(w
t%)
(wt%
)(w
t%)
(wt%
)(w
t%)
(wt%
)(w
t%)
(m2 /
g)
(MJ/
kg)
(MJ/
kg)
WP
-44
.81
5.87
0.59
48.7
38.
6880
.93
1.38
9.01
-17
.716
.4
WP
1S-
46.3
75.
640.
1547
.84
5.96
83.5
21.
049.
48n.
d.18
.317
.0
WP
2S-
88.5
84.
811.
944.
672.
2248
.41
2.41
46.9
6n.
d.n.
d.n.
d.
WP
3S-
56.2
15.
610.
2637
.92
2.59
75.0
51.
1821
.18
n.d.
21.3
20.0
WP
4SF
e42
.28
2.93
0.20
54.5
811
.83
59.4
38.
0220
.73
n.d.
26.1
25.5
WP
5SF
e74
.86
3.54
0.33
21.2
61.
7945
.11
3.08
50.0
30.
0274
31.4
30.6
WP
6SF
e65
.47
4.37
0.00
30.1
614
.41
14.4
15.
1366
.04
n.d.
n.d.
n.d.
WP
7SC
arbo
n83
.32
0.32
0.82
15.5
45.
063.
359.
3482
.25
n.d.
35.9
35.9
WP
8SC
arbo
n77
.90
2.34
0.31
19.4
52.
3413
.00
4.80
79.8
62.
7955
31.5
31.0
WP
9SC
arbo
n86
.48
1.48
0.65
11.0
36.
499.
575.
0978
.86
n.d.
31.3
31.0
WP
10S
Fe
66.0
33.
350.
0030
.62
5.58
25.8
810
.63
57.9
1n.
d.n.
d.n.
d.
WP
11S
Fe
77.5
33.
230.
3418
.89
1.21
35.4
43.
6359
.73
0.17
1629
.929
.1
WP
12S
Car
bon
77.3
43.
020.
3719
.26
3.17
15.7
23.
9277
.19
0.99
3831
.231
.0
WP
13S
Car
bon
86.5
11.
670.
3511
.47
n.d.
n.d.
7.40
n.d.
n.d.
31.5
31.1
WP
14S
Car
bon
88.8
70.
000.
0011
.13
1.96
0.93
3.09
94.0
3n.
d.33
.433
.3
a) b
y di
ffere
nce;
n.d
.: no
t det
ecte
d.

8 - Biomasses174
was the same. In fact the values reported for fixed carbon multiplied for the solid
yield gave the same values of fixed carbon for each entry. These data showed that
cocking reactions were not preferentially promoted by Fe or carbon. At the same
time volatiles were higher using Fe and lower when carbon was the MW absorber
as already discussed in Section 8.1, even if the percentage of volatiles (Table 8.2)
were multiplied for the solid yield.
A general trend could be observed on the three-dimensional Van Krevelen
diagram (H/C, O/C, and LCV, Figure 8.2). H/C and O/C molar ratios jointly
decreased when a MW absorber was employed and the conversion of WP was
complete (entries WP5 - WP14). Lower calorific value (LCV) increased together
with H/C and O/C reduction and all the values gathered in a narrow space as
highlighted in Figure 8.2.
Figure 8.2. Three-dimension Van Krevelen diagram of char from MAP of WP.
An O/C molar ratio below 0.2 suggested a good stability of these solids in soil
and a good substrate for carbon sequestration.17
LCV tended to an average value of 31 MJ/kg which was close to the value
observed for char from wood pyrolysis and other carbon based material.16,18-20
The LCV of WP1S was 4% higher than LCV of not-pyrolyzed WP while the
yield of char in entry WP1 was 96 wt%. This is an indication that there was no
loss in heating capability after pellets irradiation. Anyway the reduction of moisture
content made WP1S a better fuel than not-pyrolyzed WP.
8.2.2. FTIR of Char
FTIR spectra of char are reported in Figure 8.3. WP9S - WP14S did not show
any remarkable absorption. Relative intensity of each peak for all the other char
BiomassPeat
LigniteCoal
Anthracite
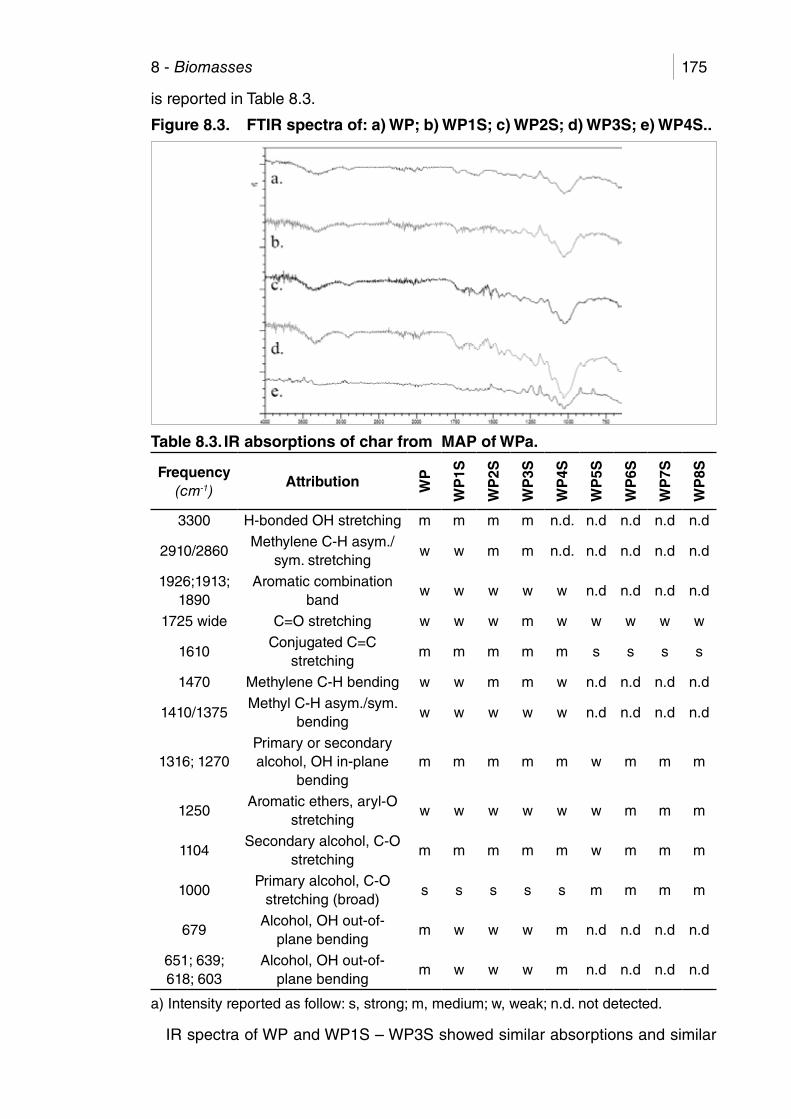
8 - Biomasses 175
is reported in Table 8.3.
Figure 8.3. FTIR spectra of: a) WP; b) WP1S; c) WP2S; d) WP3S; e) WP4S..
Table 8.3. IR absorptions of char from MAP of WPa.
Frequency (cm-1)
Attribution WP
WP
1S
WP
2S
WP
3S
WP
4S
WP
5S
WP
6S
WP
7S
WP
8S
3300 H-bonded OH stretching m m m m n.d. n.d n.d n.d n.d
2910/2860Methylene C-H asym./
sym. stretchingw w m m n.d. n.d n.d n.d n.d
1926;1913; 1890
Aromatic combination band
w w w w w n.d n.d n.d n.d
1725 wide C=O stretching w w w m w w w w w
1610Conjugated C=C
stretchingm m m m m s s s s
1470 Methylene C-H bending w w m m w n.d n.d n.d n.d
1410/1375Methyl C-H asym./sym.
bendingw w w w w n.d n.d n.d n.d
1316; 1270Primary or secondary alcohol, OH in-plane
bendingm m m m m w m m m
1250Aromatic ethers, aryl-O
stretchingw w w w w w m m m
1104Secondary alcohol, C-O
stretchingm m m m m w m m m
1000Primary alcohol, C-O
stretching (broad)s s s s s m m m m
679Alcohol, OH out-of-
plane bendingm w w w m n.d n.d n.d n.d
651; 639; 618; 603
Alcohol, OH out-of-plane bending
m w w w m n.d n.d n.d n.d
a) Intensity reported as follow: s, strong; m, medium; w, weak; n.d. not detected.
IR spectra of WP and WP1S – WP3S showed similar absorptions and similar

8 - Biomasses176
relative intensities between peaks in each spectrum. Without a MW absorber the
conversion of the polymeric matrix of WP was low and most of the functional
groups remained stable into the matrix.
However when a MW absorber was present the intensity of each absorption
was reduced. Char obtained in the presence of Fe (WP4S – WP6S) showed
absorptions higher than those obtained in the presence of carbon (WP7S and
WP8S). As highlighted in Section 8.1 carbon was able to envelop better the WP
and promote a higher conversion of the polymeric matrix.
8.3. Liquid product
All liquids collected were separated in a two phase system. These phases were
hardly separable, the lower phase stuck on the glass surface thus making difficult
to handle it without significant mass loss during operation. Thus a quantification of
yield for each phase was not performed. Anyway the amount of the lower phase
was qualitatively reduced using a fractionating system (set-up B).
8.3.1. Physical properties
The main physical properties of liquid are reported in Table 8.4 (coded “WPnS_p”
where “n” is the pyrolysis entry and “p” is referred to the phase: “UP”, upper phase;
“BOT”, bottom phase). Only WP1L was a single phase liquid.
Viscosity, density, and HHV were measured only for upper phases (except HHV
for WP8L_BOT) because it was not possible to obtain sufficient amount of the
bottom phases.
Upper phases were transparent liquids with a color from pale yellow (when a
MW absorber was not employed) to orange (when a MW absorber was employed).
Bottom phases were dark viscous sticky liquids which adhered to glass surface
and made their handling problematical.
Water content was higher than in classical heating pyrolysis of woody feeds
where it usually did not exceed 30 wt%.16,21 However water content of upper
phases was close to those reported by Shoujie et al. for MAP of Douglas fir
sawdust pellet.22 The heat transfer through MW was different from classical
heating causing a different degradation of cellulose and hemicellulose promoting
water formation. Anyway high amounts of water could not be only ascribed to the
heating method, also quenching speed and efficiency of vapors collection from
reactor might influence kinetics of secondary reactions involving cellulose and
hemicellulose pyrolysis products.21,23,24
Viscosity was lower than those reported in several publications, even 200
times lower.25-27 It was below the common reported viscosity range (25 – 1000
cSt).16 As outlined before MW heating and fractionating and collecting systems,
might promote secondary pyrolysis reactions of cellulose and hemicellulose

8 - Biomasses 177
giving smaller molecules (up to water) and it was not surprising the low values
for viscosity. Density was close to 1 g/cm3, and no significant differences were
highlighted among samples collected.
Table 8.4. Liquid from MAP of WP
Only WP11L_UP showed a density below 1 g/cm3 which was correlated to a
strong pyrolysis as indicated by the highest water content (63.2 wt%). Fe as MW
En
try
Vis
cosi
tyD
ensi
tyW
ater
co
nte
nt
CH
NO
aC
/H
mo
lar
rati
o
Em
pir
ical
fo
rmu
la
HH
VL
HV
(cP
)(g
/cm
3 )(w
t%)
(wt%
)(w
t%)
(wt%
)(w
t%)
(MJ/
kg)
(MJ/
kg)
WP
1L_U
Pn.
d.n.
d.48
.6n.
d.n.
d.n.
d.n.
d.n.
d.n.
d.n.
d.n.
d.
WP
2L_U
P1.
961.
053
n.d.
19.2
29.
680.
0071
.10
0.16
5C
H6.
00O
2.78
n.d.
n.d.
WP
3L_U
P1.
691.
049
40.5
13.8
98.
700.
0077
.41
0.13
3C
H7.
46O
4.18
6.0
4.0
WP
3L_B
OT
n.d.
n.d.
n.d.
n.d.
n.d.
n.d.
n.d.
n.d.
n.d.
n.d.
n.d.
WP
4L_U
P2.
351.
073
38.6
19.9
28.
580.
0071
.50
0.19
3C
H5.
13O
2.69
8.1
6.2
WP
4L_B
OT
n.d.
n.d.
n.d.
48.5
94.
750.
0046
.66
0.85
2C
H1.
16O
0.72
n.d.
n.d.
WP
5L_U
P2.
351.
059
47.4
19.9
27.
130.
0072
.95
0.23
3C
H4.
27O
2.75
8.3
6.7
WP
5L_B
OT
n.d.
n.d.
n.d.
49.6
15.
240.
0045
.15
0.78
8C
H1.
26O
0.68
n.d.
n.d.
WP
6L_U
P>
41.
076
n.d.
23.8
99.
950.
0066
.16
0.20
0C
H4.
96O
2.08
7.5
5.2
WP
7L_U
P>
41.
086
n.d.
46.6
24.
670.
0048
.71
0.83
1C
H1.
19O
0.78
n.d.
n.d.
WP
8L_U
P2.
291.
076
32.3
18.9
68.
730.
0072
.30
0.18
1C
H5.
49O
2.86
7.4
5.5
WP
8L_B
OT
n.d.
n.d.
n.d.
58.9
15.
830.
2035
.05
0.84
2C
H1.
18N
0.00
O0.
4525
.0
WP
9L_U
P2.
091.
055
n.d.
23.0
19.
410.
0067
.58
0.20
4C
H4.
87O
2.20
n.d.
n.d.
WP
10L_
UP
2.00
1.06
0n.
d.18
.76
10.4
40.
0070
.80
0.15
0C
H6.
63O
2.83
n.d.
n.d.
WP
11L_
UP
1.66
0.94
063
.216
.84
8.18
0.00
74.9
80.
172
CH
5.78
O3.
348.
46.
6
WP
11L_
BO
Tn.
d.n.
d.n.
d.58
.63
6.05
0.00
35.3
20.
807
CH
1.23
O0.
45n.
d.n.
d.
WP
12L_
UP
1.88
1.05
351
.518
.96
8.73
0.00
72.3
00.
181
CH
5.49
O2.
867.
45.
5
WP
12L_
BO
Tn.
d.n.
d.n.
d.60
.31
6.37
0.18
33.0
00.
788
CH
1.26
N0.
00O
0.41
S0.
00n.
d.n.
d.
WP
13L_
UP
>4
1.06
7n.
d.20
.60
9.31
0.00
70.0
90.
184
CH
5.39
O2.
55n.
d.n.
d.
WP
14L_
UP
1.76
1.03
2n.
d.23
.10
9.91
0.00
66.9
90.
194
CH
5.11
O2.
18n.
d.n.
d.
a) b
y di
ffere
nce.
n.d
., no
t det
ecte
d.

8 - Biomasses178
absorber together with set-up B was the most efficient system to pyrolyze WP
even if the reproducibility was not good.
HHV of upper phases was similar (within 6 and 8 MJ/kg) compared to reported
data,28 but lower than conventional liquid from fast pyrolysis due to the large
presence of water.21
Otherwise the bottom phase showed a remarkable high value (25 MJ/kg) which
was close to some reported values for liquids from woody biomasses.28,29
8.3.2. Thin layer chromatograph
Thin layer chromatography (TLC) is a quick, cheap, and powerful method to test
qualitatively the nature of liquids. Elution performance of liquids were compared
to those of selected standards to evaluate the affinity with the solvent mixture and
to evaluate the possibility to analyze liquid via GC and HPLC.
Figure 8.4. TLC using MeOH/AcN/H2O, from left to right, TLC chromatograms examined under daylight and UV light, longwave and shortwave, of: a) WP1L_UP; b) WP3L_UP; c) WP4L_UP; d) WP5L_UP; e) WP11L_UP; f) WP8L_UP; g) WP12L_UP.
Figure 8.5. TLC using MeOH/AcN/H2O, from left to right, TLC chromatograms examined under daylight and UV light, longwave and shortwave, of: b) WP3L_BOT; c) WP4L_BOT; d) WP5L_BOT; e) WP11L_BOT; f) WP8L_BOT; g) WP12L_BOT.
All liquids showed broad range of retention factors (Rf) from 0 to 1 with two
solvent mixtures (MeOH/AcN/H2O, Figure 8.4 and Figure 8.5, and CH2Cl2/H2O,

8 - Biomasses 179
Figure 8.6 and Figure 8.7). Compounds with a Rf below 0.5 (with both solvent
mixtures) were not expected to be detectable in GC and HPLC. Compounds with
a Rf between 0.5 and 0.9 were expected to be mainly detectable in HPLC, while
compounds with a Rf over 0.9 were expected to be mainly detectable in GC and
probably even in minor amount in HPLC.
Furthermore all samples were prepared with the same concentration (50.00
mg/mL) and contained compounds having similar structures so a semiquantitative
analysis may be run by visual comparison of absorption intensities under UV
lights. The liquids showed the strongest and prevalent absorption between 0.8
and 1. So they were suited for GC and HPLC investigation.
Figure 8.6. TLC using CH2Cl2/H2O, from left to right, TLC chromatograms examined under daylight and UV light, longwave and shortwave, of: a) WP1L_UP; b) WP3L_UP; c) WP4L_UP; d) WP5L_UP; e) WP11L_UP; f) WP8L_UP; g) WP12L_UP.
Figure 8.7. TLC using CH2Cl2/H2O, from left to right, TLC chromatograms examined under daylight and UV light, longwave and shortwave, of: b) WP3L_BOT; c) WP4L_BOT; d) WP5L_BOT; e) WP11L_BOT; f) WP8L_BOT; g) WP12L_BOT.

8 - Biomasses180
A m Ci i i= ⋅
RRF MW A CMW A Ci
i i S
S S i
=⋅ ⋅⋅ ⋅
RRF MW AMW m Ci
i i
S S i
=⋅
⋅ ⋅
C MW AMW m RRFi
i i
S s i
=⋅
⋅ ⋅
8.3.3. GC/MS-FID
The gas chromatographic analyses were performed using a compound already
found to be already present that worked as an internal standard. Guaiacol and
furfural were two compounds chosen to act as internal standards because
they were typical and reoccurring pyrolysis products of lignin, for guaiacol, and
cellulosic materials, for furfural.30-34 A calibration curve was prepared and used to
quantify their concentration in tested samples (general equation is reported Eq.
8.1; guaiacol, slope: 70818, intercept: 0.00, R2: 0.9959; furfural, slope: 46660,
intercept: 0.00, R2: 0.9952).
8.1
Where Ai is chromatographic peak area of analyte i; mi, , is the slope of analyte
i; Ci, is the concentration of analyte i in g/L.
The relative response factor (RRF), with respect to guaiacol or furfural, for
references compounds detected by GC analysis, is reported in Table 8.7 (RRFfound
column) and it was calculated using Eq. 8.2.
8.2
Where subscript “i” refer to a target compound and “S” to standard; A,
chromatographic area; MW, molecular weight; C concentration in g/L.
The following equation (Eq. 8.3) was obtained by substitution of Eq. 8.1 in Eq.
8.2.
8.3
The RRF allowed for a fast calculation of the concentration of any known
compound (Eq. 8.4). This equation could be used regardless of the absence or
presence of any internal standard in the bio-oil because the Cs was not necessary
for calculations but just the slope of the calibration curve.
8.4
This procedure required to know the RRF of each compounds so their injection
were necessary before its application. Since bio-oil produced from any kind of
biomass could contain up to several hundred compounds of different classes and
chemical functionalities, the expense in terms of time and money required to obtain
individual data for so many compounds is seldom worthwhile. Consequently, a
new route to determine the RRF was a mandatory issue.
The RRFfound might be correlated with the chemical composition and predicted,
as reported by several authors.35-39 Since none of the equations reported allowed
for an unambiguous and effective prediction of all data required for Eq. 8.2, a
new method to estimate RRF. It took into account the chemical composition of

8 - Biomasses 181
the compounds (aromatic rings, double bonds C=C, ketones, carboxylic (acids,
esters, anhydride), alcohols, aldehydes, and ethers) and a contribution factors
for each atom present (carbon, hydrogen, and oxygen) in its molecular formula.
Furthermore each contribution was modulated by a power function Z. These value
was also connected with the molecular weight and chromatographic retention time.
Therefore a new general equation to predict the RRF (RRFcalc) was proposed as
reported below (Eq. 8.5).
8.5
Where subscript “i” refer to a reference compound, “S” refers to a given standard,
and “k” refers to a type of atom or group present into the compound (Table 8.6);
rrt, refers to the chromatographic retention time; MW, molecular weight; P, Z, and
Q parameters refined for each n (Table 8.6); nn number of atom and groups into
the reference and standard compound.
Considering the RRF for a specific compound such as vanillin, and guaiacol as
standard (Table 8.5) as standard, Eq. 8.5 could be expressed as follow (Eq. 8.6):
8.6
Parameters P and Z and constant Q, in Eq. 8.5 and Eq. 8.6, were optimized
using the RRF experimentally evaluated with Eq. 8.3 (RRFfound) for 30 reference
compounds (Table 8.5). The RRFfound were compared with RRFcalc (calculated
using the parameter reported in Table 8.6) in Table 8.7 and a visual comparison
is shown in Figure 8.8.
Using this equation (Eq. 8.5) is possible to set-up quickly a new a set of parameters
(P, Z, and Q) for different instrument and reference compounds using the data
reported in Table 8.5. Indeed the program employed to refine the parameters P, Z,
and Q gave more reliable results if the starting point for calculation was close to
the final values. The initial values, before any calculation, were established equal
to 1.
This method might be applied if the chemical structure of the target compound is
known. It was possible to use Eq. 8.5 even if the structure was relatively uncertain
and only one possible isomer was guessed.
RRFrt MW P n Q
rt MW P n Qcalc i
S ik
k kSZ
i Sk
k kiZ
k
k� =
⋅ ⋅ ⋅ +( )⋅ ⋅ ⋅ +( )
∑∑
RRF rtrt
P P P
calc iS
i
CZ
HZ
OZC H O
�
� � �
.
.=
⋅⋅
⋅
( ) + ( ) + ( ) +
152 15
124 14
8 8 3 PP P P P PringZ
C CZ
C OZ
OHZ
COCZring C C C O OH COC1 3 1 1 1( ) + ( ) + ( ) + ( ) += =
= = (( ) +
( ) + ( ) + ( ) + ( ) + ( )==
Q
P P P P PCZ
HZ
OZ
ringZ
C CZC H O ring C C7 7 2 1 3 ++ ( ) + ( ) +
P P QOH
ZCOC
ZOH COC1 1

8 - Biomasses182
Table 8.5. Standard compounds injected both in GC/MS and HPLC/MS
FormulaTraditional
nameIUPAC name
Monoisotopic mass (Da)
O
HO
OOH
Sinapyl alcohol
4-(3-hydroxyprop-1-enyl)-2,6-
dimethoxyphenol
210.089203
O
HO
OH
Coniferyl alcohol
4-(3-hydroxy-1-propenyl)-
180.078644
HO
OH
p-coumaryl alcohol
2-methoxyphenol 150.068085
O
HO Eugenol 4-[(1E)-3-Hydroxy-1-propen-1-yl]phenol
164.083725
HO
OO
Vanillin 4-propen-2yl-2-methoxyphenol
152.047348
O
HO
OH
OH
HO
HO
(+)-catechin 4-Hydroxy-3-methoxybenzaldehyde
290.079041
O
HO
OH
OH
HO
HO
(-)-catechin (2R,3S)-2-(3,4-dihydroxyphenyl)-3,4-dihydro-2H-chromene-
3,5,7-triol
290.079041
O
HO
OH
OH
HO
HO
(-)-epicatechin (2S,3R)-2-(3,4-Dihydroxyphenyl)-3,5,7-
chromanetriol
290.079041
OH
OOH
HO OOH
OH Quercitin (2R,3R)-2-(3,4-Dihydroxyphenyl)-3,5,7-
chromanetriol
302.042664
(continue)

8 - Biomasses 183
O
O
Furfural 2-(3,4-dihydroxyphenyl)-3,5,7-trihydroxy-4H-
chromen-4-one
96.02113
O
OH Guaiacol Furan-2-carbaldehyde 124.052429
O
O Veratrole 2-methoxyphenol 138.068085
OH
OH
Catechol 1,2-dimethoxybenzene 110.036781
HO OH Resorcinol 1,2-dihydroxybenzene 110.036781
HO m-cresol 1,3-dihydroxybenzene- 108.057518
OH
OH
OH
Pyrogallol 3-Methylphenol 126.031693
OH
HO
HO
O
OH
Gallic acid 1,2,3-trihydroxybenzene 170.02153
(continue)

8 - Biomasses184
HO
O
O
O
OH
Syringic acid 3,4,5-trihydroxybenzoic acid
198.052826
Guaiazulene 4-hydroxy-3,5-dimethoxybenzoic acid
198.140854
1,4-dimethyl-7-isopropylazulene
74.073166
2-methyl-2-propanol 86.10955
Hexane 60.02113
Acetic acid 74.073166
2-methyl-1-propanol 78.046951
Benzene 84.093903
Cyclohexane 92.062599
Toluene 84.057518
Cyclopentanone 94.041862
Phenol 120.093903
2-ethyltoluene 120.093903
1,2,4-trimethylbenzene 120.093903
1,2,3-trimethylbenzene 108.057518
Benzyl alcohol 122.036781
Benzoic acid 128.062607
Naphthalene 124.052429
4-methoxyphenol 196.073563
2,3,4-trimethoxy benzaldehyde
154.026611
2,6-dihydroxy benzoic acid
154.026611
2-naphtol 144.05751

8 - Biomasses 185
Table 8.6. Parameters defined (P, Z, and Q) for Eq. 8.5 obtained using the
experimental RRF from Table 8.7.Number referred to Guaiacol Furfural
PC Number of atom of carbon atoms 0.98 99.70
PH Number of atom of hydrogen atoms -5.45 5.33E-06
PO Number of atom of oxygen atoms -25.21 -12.21
Pring Number of aromatic ring 629.64 68.29
PC=C Number of C-C double bonds -7.90 -0.03
PC=O Number of ketones 394.61 70.55
PCO2R Number of carboxylic -1644.83 -181.85
POH Number of alcohols 36.46 11.21
PCHO Number of aldehyde -161.68 -9.05
PCOC Number of ethers 95.86 6.96
Q Constant -1195.74 -367.61
ZC Number of atom of carbon atoms 2.821 0.416
ZH Number of atom of hydrogen atoms 0.873 5.763
ZO Number of atom of oxygen atoms 0.031 0.490
Zring Number of aromatic ring 0.930 0.753
ZC=C Number of C-C double bonds 2.911 4.426
ZC=O Number of ketones 1.000 1.000
ZCO2R Number of carboxylic 1.000 1.000
ZOH Number of alcohols 1.111 0.825
ZCHO Number of aldehyde 1.000 1.000
ZCOC Number of ethers 0.091 1.424
Table 8.7. RRFfound, from experimental data, compared with the RRFcalc
predicted with Eq. 8.5 and parameter reported in Table 8.6 for reference
compounds.
CompoundRRFfound RRFcalc RRFfound RRFcalc
Guaiacol Furfural1 2-methyl-2-propanol 1.02 1.35 2.01 2.42
2 hexane 1.57 1.46 3.08 3.38
3 acetic acid 0.35 0.38 0.68 0.73
4 2-methyl-1-propanol 1.00 1.05 1.95 1.89
5 benzene 1.66 1.83 3.25 3.55
6 cyclohexane 1.51 1.14 2.96 2.39
7 toluene 1.84 1.53 3.61 3.08
8 cyclopentanone 0.92 0.89 1.80 1.78
9 furfural 0.51 0.53 1.01 1.00
10 phenol 0.64 -1.21 1.26 -2.96
11 2-ethyltoluene 2.80 2.83 5.49 5.51
12 1,2,4-trimethylbenzene 1.88 1.61 3.69 3.23
13 1,2,3-trimethylbenzene 1.28 1.52 2.50 3.04
14 benzyl alcohol 0.93 0.79 1.82 1.54
15 m-cresol 0.84 0.66 1.64 1.40
(continue)

8 - Biomasses186
16 guaiacol 0.93 1.00 1.82 1.65
17 veratrole 1.08 1.21 2.11 2.09
18 benzoic acid 0.31 0.18 0.60 0.40
19 catechol 0.39 0.59 0.77 1.08
20 naphtalene 1.70 1.68 3.34 3.33
21 4-methoxyphenol 0.61 0.82 1.19 1.36
22 resorcinol 0.42 0.53 0.82 0.96
23 eugenol 1.31 1.37 2.56 2.63
24 vanillin 0.81 0.73 1.58 1.36
25 2,3,4-trimethoxy benzaldehyde 1.72 1.72 3.37 3.36
26 2,6-dihydroxy benzoic acid 0.21 0.15 0.41 0.35
27 syringic acid 0.22 0.20 0.43 0.46
28 coniferyl alcohol 1.23 1.29 2.40 2.39
29 guaiazulene 4.87 4.86 9.55 9.60
30 sinapyl alcohol 4.86 4.84 9.54 9.55
Figure 8.8. Comparison between RRFfound and RRFcalc reported in Table 8.7; a) for guaiacol, slope: 1.00, intercept: 7.82E-06, R2: 0.9807; b) for furfural, slope: 1.00, intercept: 2.77E-07, R2: 0.9907.
The ratio between retention times of the standard and the reference compound
roughly related the chromatographic conditions (such as flows, split ratio, and so
on) with the RRF. All these conditions are related to the amount of each compound
which arrived to the detector and this ratio worked like an empirical correction
factor. It was assumed, by using this ratio, that higher retention time corresponded
to peak having a wide Gaussian shape that were harder to integrate.
The power function, Z, showed how much a variable influenced the RRF. Values
closer to zero meant that the variable has a very low influence on the calculated
RRF. Rising values of Z meant rising influence of the moiety on RRF.
These data gave reasonable values for compound similar chemical composition
and structure to these reported in Table 8.5, however the date did not give
reasonable values for polycyclic aromatic hydrocarbons (negative RRFs) and
some tetra/penta substituted benzene.
The main compounds identified in the upper fractions are listed in Table 8.8, while
those identified in the bottom fractions are listed in Table 8.9. The concentration
of each compounds was calculated by averaging the values obtained using the

8 - Biomasses 187
RRFs relative to guaiacol and furfural. The GC/FID of WP12L_UP and WP12L_
BOT and total ion chromatogram (TIC) chromatograms of WP12L_BOT are
reported in Figure 8.9.
Table 8.8. Concentration (g/L) of WP3L_UP, WP4L_UP, WP5L_UP, WP8L_UP, WP11L_UP, and WP12L_UP calculated using RRFfound or RRFcalc.
n rt Compound a.c.
WP
3L_U
P
WP
4L_U
P
WP
5L_U
P
WP
8L_U
P
WP
11L
_UP
WP
12L
_UP
1 3.88 2-butanone P 0.066 0.121 0.135 0.144 0.164 0.024
2 4.07 acetic acid S 1.670 0.998 1.244 0.753 1.256 0.629
3 4.71 benzene S 0.002 0.001 0.002 0.002 0.005 0.003
4 4.81 2-oxo-propanoic acid U 0.000 0.004 0.006 0.006 0.010 0.007
5 4.90 1-hydroxy-2-propanone
U 0.098 0.144 0.177 0.131 0.171 0.155
6 5.07 3-Buten-2-one U 0.032 0.032 0.032 0.029 0.060 0.044
7 5.45 4-Penten-2-one P 0.017 0.022 0.009 0.020 0.011 0.021
8 5.67 2,3-Pentanedione P 0.000 0.000 0.000 0.010 0.000 0.000
9 7.75 Toluene S 0.000 0.000 0.001 0.018 0.001 0.000
10 7.86 1,4-diol-2-butene U 0.054 0.042 0.077 0.058 0.061 0.046
11 7.97 Pyruvaldehyde P 0.039 0.047 0.059 0.009 0.047 0.051
12 8.41 Tetrahydro-3-furanol U 0.038 0.069 0.094 0.000 0.068 0.075
13 8.71 cyclopentanone S 0.009 0.027 0.028 0.000 0.033 0.024
14 10.23 furfural S 0.564 0.405 0.483 0.003 0.607 0.414
15 10.62 cyclohexanone P 0.000 0.001 0.002 0.000 0.002 0.017
16 11.11 2-furanmethanol P 0.005 0.023 0.037 0.000 0.003 0.004
17 11.31 etheylbenzene U 0.003 0.012 0.022 0.001 0.008 0.007
18 11.68 1,4-dimethylbenzene U 0.001 0.002 0.003 0.000 0.003 0.002
19 12.05 1,2-dimethylbenzene U 0.001 0.002 0.003 0.000 0.003 0.002
20 12.36 1,3-dimethylbenzene U 0.001 0.001 0.000 0.001 0.001 0.001
21 15.29 5-methyl-2-furancarboxaldehyde
P 0.032 0.044 0.067 0.054 0.051 0.036
22 15.84 phenol S 0.000 0.042 0.058 0.000 0.049 0.038
23 16.45 3,4-dimethyl-2-Cyclopenten-1-one
P 0.000 0.003 0.003 0.006 0.004 0.002
24 16.60 benzofuran P 0.004 0.009 0.012 0.012 0.008 0.008
25 16.92 tetrahydrofuran methanol
U 0.003 0.012 0.013 0.123 0.003 0.000
26 17.56 1,2,3-trimethyl benzene
U 0.008 0.047 0.072 0.000 0.030 0.036
27 18.55 o-cresol P 0.000 0.024 0.033 0.000 0.031 0.023
28 19.30 m-cresol S 0.000 0.024 0.046 0.000 0.021 0.023
29 19.79 Guaiacol S 0.016 0.040 0.058 0.000 0.041 0.031
30 20.80 veratrol S 0.001 0.007 0.013 0.000 0.003 0.003
31 24.05 4-methoxyphenol S 0.002 0.023 0.025 0.012 0.000 0.000(continue)

8 - Biomasses188
32 25.90 resorcinol S 0.000 0.046 0.069 0.000 0.033 0.034
33 26.77 2-methylnaphtalene U 0.000 0.000 0.000 0.001 0.000 0.000
34 28.04 2,6-dimethoxy-phenol P 0.016 0.105 0.134 0.000 0.024 0.033
35 28.22 eugenol S 0.006 0.001 0.007 0.000 0.001 0.000
36 30.69 1,2,4-Trimethoxy benzene
U 0.000 0.000 0.079 0.000 0.010 0.015
37 32.77 1,2,3-trimethoxy-5-methyl-benzene
P 0.002 0.008 0.011 0.000 0.002 0.002
38 35.97 benzophenone P 0.000 0.007 0.012 0.000 0.000 0.002
39 36.19 levoglucosan S 0.052 0.318 0.307 0.552 0.000 0.000
40 37.98 syringic acid S 0.000 0.027 0.056 0.091 0.000 0.006
TOTAL (%)b 5.5% 5.5% 7.0% 4.1% 5.7% 3.6%
a) a.c.: attribution confidence of identification with NIST:; P, probable, similarity index
>91%; U, uncertain, similarity index with NIST <91% and S, standard, identified by
retention time and MS spectrum; b) Total amount identified, calculated as follow: SCi/50;
where Ci is the concentration of each compound and 50 is the initial concentration of the
vial.
Table 8.9. Concentration (g/L) of WP3L_BOT, WP4L_BOT, WP5L_BOT, WP8L_BOT, WP11L_BOT, and WP12L_BOT calculated using RRFfound or RRFcalc.
n rt compound a.c.
WP
3L_B
OT
WP
4L_B
OT
WP
5L_B
OT
WP
8L_B
OT
WP
11L
_BO
T
WP
12L
_BO
T1 3.82 2-methylpropanal U 0.000 0.037 0.061 0.061 0.093 0.058
2 3.87 2-butanone p 0.000 0.118 0.207 0.364 0.282 0.247
3 3.98 acetic acid s 0.003 0.000 0.564 0.000 1.192 0.222
4 4.30 2-methyl-1-propanol s 0.000 0.000 0.004 0.000 0.017 0.008
5 4.69 2-Butenal p 0.000 0.003 0.018 0.025 0.070 0.047
6 4.81 benzene s 0.001 0.002 0.022 0.032 0.059 0.063
7 4.92 2-oxo-propanoic acid u 0.000 0.294 0.131 0.118 0.232 0.103
8 5.07 3-Buten-2-one p 0.001 0.000 0.061 0.079 0.139 0.102
9 5.40 4-Penten-2-one p 0.000 0.000 0.036 0.035 0.058 0.045
10 5.66 2,3-Pentanedione p 0.000 0.003 0.009 0.012 0.031 0.014
11 5.82 2,5-dimethylfuran p 0.001 0.000 0.014 0.025 0.028 0.014
12 7.74 Toluene s 0.003 0.004 0.044 0.061 0.176 0.120
13 7.87 1,4-diol-2-butene u 0.000 0.040 0.061 0.051 0.144 0.092
14 8.03 Acetic acid ethenyl ester
u 0.000 0.108 0.099 0.053 0.105 0.013
15 8.69 cyclopentanone s 0.001 0.024 0.048 0.051 0.112 0.062
16 10.23 furfural s 0.019 0.643 1.099 1.138 2.753 1.587
17 10.62 cyclohexanone u 0.001 0.003 0.074 0.063 0.106 0.077
18 11.08 2-furanmethanol u 0.000 0.000 0.123 0.193 0.121 0.114
19 11.32 etheylbenzene p 0.002 0.012 0.034 0.056 0.093 0.069
(continue)

8 - Biomasses 189
20 11.68 1,4-dimethylbenzene p 0.003 0.022 0.071 0.112 0.202 0.162
21 12.05 1,2-dimethylbenzene p 0.001 0.002 0.009 0.014 0.030 0.021
22 12.57 1,3-dimethylbenzene u 0.004 0.004 0.029 0.036 0.182 0.097
23 12.91 2-methyl-2-cyclopenten-1-one
u 0.000 0.000 0.000 0.001 0.009 0.003
24 13.26 1-(2-furanyl)-ethanone u 0.000 0.000 0.033 0.033 0.108 0.052
25 15.26 5-methyl-2-furancarboxaldehyde
p 0.006 0.084 0.230 0.262 0.959 0.394
26 15.83 phenol s 0.034 0.121 0.312 0.278 0.938 0.533
27 16.43 3,4-dimethyl-2-Cyclopenten-1-one
u 0.000 0.006 0.011 0.040 0.098 0.053
28 16.50 1,2,4-trimethyl benzene
s 0.003 0.002 0.011 0.021 0.072 0.040
29 16.59 benzofuran u 0.014 0.027 0.090 0.108 0.457 0.291
30 16.89 tetrahydrofuran methanol
u 0.000 0.005 0.021 0.026 0.024 0.023
31 17.54 1,2,3-trimethyl benzene
s 0.001 0.086 0.118 0.150 0.313 0.162
32 18.15 indene p 0.007 0.029 0.057 0.057 0.235 0.116
33 18.54 o-cresol p 0.037 0.090 0.235 0.223 0.825 0.419
34 18.78 1,2-diethylbenzene u 0.001 0.002 0.006 0.008 0.025 0.014
35 18.86 1-(2-methylcyclopent-1-en-1-yl)ethan-1-one
p 0.003 0.006 0.021 0.031 0.066 0.040
36 19.16 Acetophenone p 0.000 0.000 0.002 0.003 0.007 0.004
37 19.30 m-cresol s 0.035 0.110 0.371 0.285 0.953 0.632
38 19.78 Guaiacol s 0.040 0.107 0.318 0.319 0.973 0.525
39 20.62 2-methyl-benzofuran u 0.018 0.014 0.074 0.074 0.363 0.155
40 20.97 4-methyl benzoic acid u 0.005 0.000 0.034 0.067 0.153 0.121
41 21.38 2-ethylphenol u 0.004 0.004 0.018 0.020 0.117 0.040
42 21.67 2,3-dihydro-1-methyl-1H-indene
p 0.001 0.000 0.005 0.011 0.031 0.017
43 21.80 veratrol s 0.009 0.020 0.062 0.073 0.321 0.138
44 21.99 2-methyl-1H-indene p 0.008 0.000 0.026 0.043 0.127 0.066
45 22.05 1-methyl-1H-indene p 0.005 0.003 0.019 0.028 0.111 0.060
46 22.25 benzoic acid s 0.022 0.004 0.065 0.099 0.541 0.234
47 22.40 4-ethylphenol p 0.007 0.002 0.003 0.002 0.005 0.003
48 22.48 2,5-dimethylphenol u 0.006 0.024 0.083 0.089 0.273 0.175
49 23.24 pyrocatechol s 0.126 0.418 1.194 2.335 3.034 3.574
50 24.09 4-methoxyphenol s 0.003 0.017 0.022 0.026 0.124 0.042
51 24.19 4,7-dimethyl benzofuran
p 0.009 0.003 0.024 0.023 0.188 0.061
52 24.30 5-(hydroxymethyl)-furfural
s 0.030 0.046 0.235 0.326 1.192 0.405
53 24.66 2-ethyl-6-methyl-phenol
u 0.005 0.008 0.036 0.052 0.190 0.088
(continue)

8 - Biomasses190
54 25.30 2-ethyl-4-methyl-phenol
u 0.000 0.040 0.114 0.151 0.157 0.083
55 25.65 2,6-Dimethoxytoluene p 0.001 0.002 0.037 0.044 0.182 0.068
56 25.75 2-Methoxy-1,3-dimethylbenzene
u 0.000 0.001 0.018 0.022 0.074 0.028
57 25.89 resorcinol s 0.022 0.077 0.320 0.328 1.698 0.695
58 26.08 4-methyl-1,2-benzenediol
p 0.001 0.001 0.003 0.004 0.002 0.002
59 26.75 2-methylnaphthalene p 0.002 0.002 0.010 0.127 0.057 0.156
60 27.22 3-methylnaphtalene p 0.002 0.001 0.012 0.073 0.060 0.093
61 28.03 2,6-dimethoxy-phenol p 0.000 0.252 0.573 0.674 0.540 0.560
62 28.22 eugenol s 0.003 0.050 0.101 0.086 0.194 0.132
63 28.28 4-(tert-butyl)benzene-1,2-diol
p 0.001 0.000 0.023 0.035 0.049 0.030
64 28.51 2-methoxy-4-propyl-phenol
u 0.007 0.028 0.111 0.100 0.416 0.215
65 29.50 Vanillin s 0.001 0.002 0.001 0.001 0.001 0.001
66 30.69 1,2,4-Trimethoxy benzene
p 0.007 0.141 0.414 0.509 0.420 0.430
67 30.92 2-methoxy-4-(1-propenyl)-phenol
u 0.008 0.039 0.322 0.392 0.479 0.380
68 32.76 1,2,3-trimethoxy-5-methyl-benzene
u 0.001 0.024 0.081 0.111 0.106 0.101
69 34.17 2,3,4-trimethoxy benzaldehyde
s 0.000 0.001 0.012 0.023 0.020 0.017
70 35.51 p-coumaryl alcohol s 0.010 0.000 0.039 0.170 0.056 0.059
71 35.98 benzophenone p 0.000 0.014 0.123 0.183 0.144 0.093
72 36.24 syringaldehyde s 0.000 0.030 0.075 0.099 0.108 0.068
73 37.27 2,6-dimethoxy-4-(2-propenyl)-phenol
u 0.000 0.014 0.197 0.277 0.138 0.049
74 37.97 syringic acid s 0.000 0.052 0.168 0.147 0.213 0.114
75 39.67 9-methylene-9H-fluorene
p 0.000 0.000 0.033 0.804 0.050 0.586
76 51.35 sinapyl alcohol s 0.004 0.000 0.000 0.001 0.002 0.001
TOTAL (%)b 3.7 6.7 18.7 24.1 48.4 31.6
a) a.c.: attribution confidence of identification with NIST:; P, probable, similarity index
>91%; U, uncertain, similarity index with NIST <91% and S, standard, identified by
retention time and MS spectrum; b) Total amount identified, calculated as follow: SCi/50;
where Ci is the concentration of each compound and 50 is the initial concentration of the
vial.
Levoglucosan, furfural, and acetic acid were formed by cellulose and
hemicellulose pyrolysis16,25,32,40-43 and they were present only in the upper fractions
which were rich in water and they were not observed in the bottom fraction. Only
WP11L_BOT showed large amount of acetic acid which remained present in this

8 - Biomasses 191
liquid too.
Figure 8.9. FID and TIC chromatograms of a) FID of WP12L_UP; b) FID of WP12L_BOT; c) TIC of WP12L_BOT.
The main phenolic compounds (phenol, m-cresol, guaiacol, veratrol,
pyrocatechol, 4-methoxyphenol, resorcinol, and vanillin) were formed from lignin
pyrolysis30,32,34,44,45 and they were widely present in bottom fractions and in minor
extent into water rich fractions. Their concentration rose when a MW absorber
was employed suggesting that lignin was particularly transparent to MW radiation
and an adsorber was required for its pyrolysis.
On the other hand concentration of furfural was steady, also in the absence of a
MW absorber, in upper fractions and rose in bottom fraction due to the presence
of phenolic compound able to dissolve it.
Some of monomers of lignin (such as syringaldehyde, syringic acid, coniferyl
alcohol, and sinapyl alcohol), with a mass over 180 Da, were detected in very low
concentration. They represent the upper limit of heavy compounds to be evaluated
in the GC condition reported. Indeed other compounds with higher mass was not
detected, such as catechin, quercitin, gallic acid methyl and ethyl esters.
8.3.4. HPLC/MS
HPLC analyses were performed over the standards with a mass over 100 Da,
reported in Table 8.5, to validate the gradient technique employed and to record
the actual mass spectrum and fragmentation of each compounds. The detected
compound together with their fragmentation, in the positive and negative modes,
are reported in Table 8.10.
Only a limited number of the analyzed standards were detected. Most of them
were detected selectively in the positive or in the negative mode, thus the analysis
in both mode was mandatory to detected the largest number of compounds.
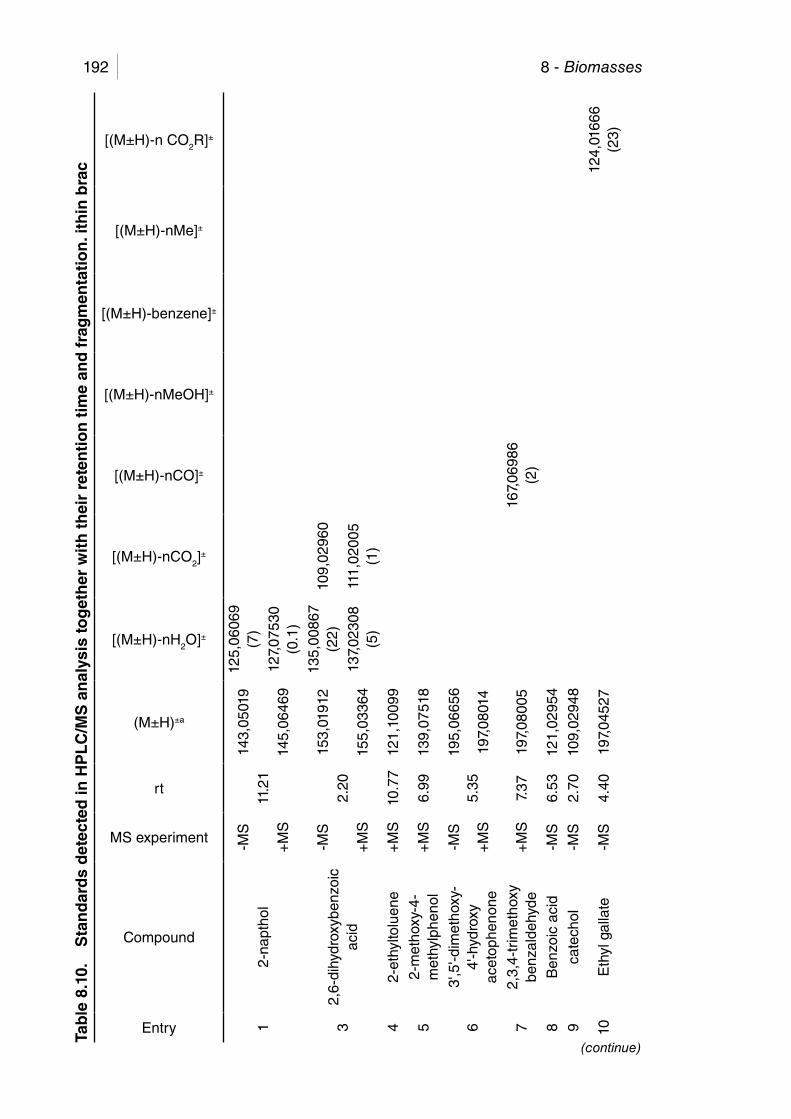
8 - Biomasses192Ta
ble
8.1
0.
Sta
nd
ard
s d
etec
ted
in H
PL
C/M
S a
nal
ysis
tog
eth
er w
ith
th
eir
rete
nti
on
tim
e an
d f
rag
men
tati
on
. ith
in b
rac
Entry
Compound
MS experiment
rt
(M±H)±a
[(M±H)-nH2O]±
[(M±H)-nCO2]±
[(M±H)-nCO]±
[(M±H)-nMeOH]±
[(M±H)-benzene]±
[(M±H)-nMe]±
[(M±H)-n CO2R]±
12-
napt
hol
-MS
11.2
114
3,05
019
125,
0606
9 (7
)
+M
S14
5,06
469
127,
0753
0 (0
.1)
32,
6-di
hydr
oxyb
enzo
ic
acid
-MS
2.20
153,
0191
2 13
5,00
867
(22)
109,
0296
0
+M
S15
5,03
364
137,
0230
8 (5
)11
1,02
005
(1)
42-
ethy
ltolu
ene
+M
S10
.77
121,
1009
9
52-
met
hoxy
-4-
met
hylp
heno
l+
MS
6.99
139,
0751
8
63'
,5'-d
imet
hoxy
-4'
-hyd
roxy
ac
etop
heno
ne
-MS
5.35
195,
0665
6
+M
S19
7,08
014
72,
3,4-
trim
etho
xy
benz
alde
hyde
+M
S7.
3719
7,08
005
167,
0698
6 (2
)
8B
enzo
ic a
cid
-MS
6.53
121,
0295
4
9ca
tech
ol-M
S2.
7010
9,02
948
10E
thyl
gal
late
-MS
4.40
197,
0452
7 12
4,01
666
(23)
(continue)
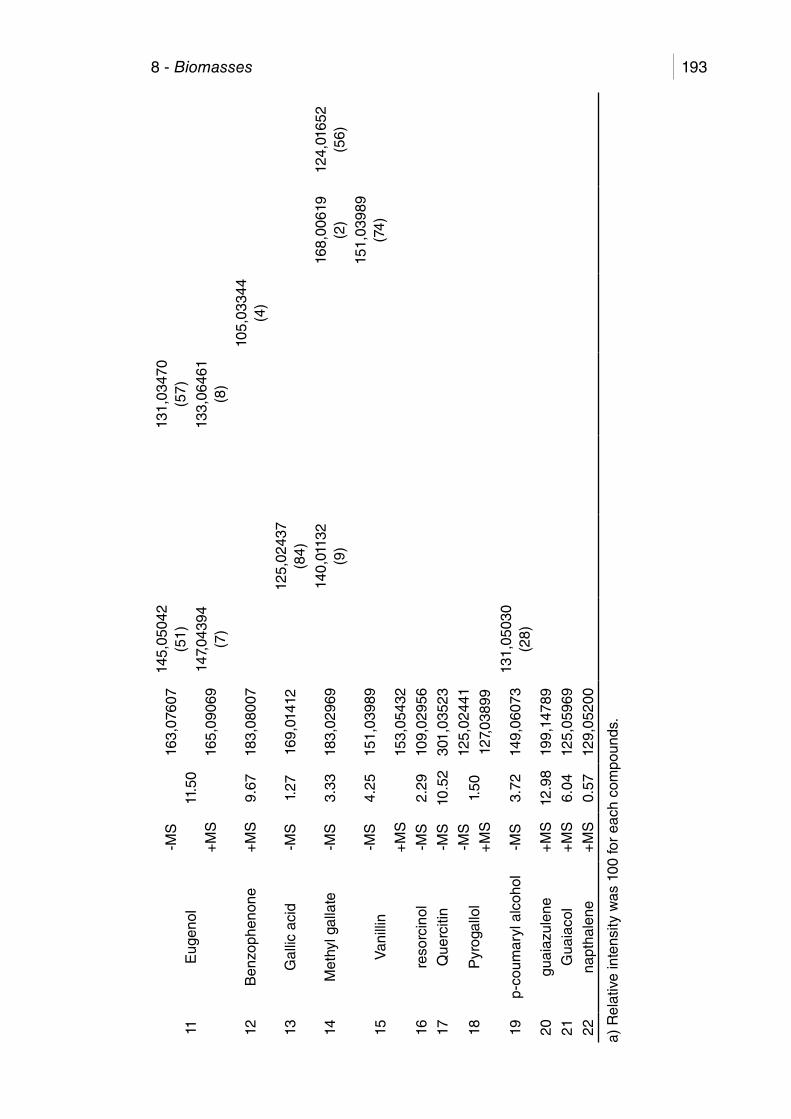
8 - Biomasses 193
11E
ugen
ol-M
S11
.50
163,
0760
7 14
5,05
042
(51)
131,
0347
0 (5
7)
+M
S16
5,09
069
147,
0439
4 (7
)13
3,06
461
(8)
12B
enzo
phen
one
+M
S9.
6718
3,08
007
105,
0334
4 (4
)
13G
allic
aci
d-M
S1.
2716
9,01
412
125,
0243
7 (8
4)
14M
ethy
l gal
late
-MS
3.33
183,
0296
9 14
0,01
132
(9)
168,
0061
9 (2
)12
4,01
652
(56)
15V
anill
in-M
S4.
2515
1,03
989
151,
0398
9 (7
4)
+M
S15
3,05
432
16re
sorc
inol
-MS
2.29
109,
0295
6
17Q
uerc
itin
-MS
10.5
230
1,03
523
18P
yrog
allo
l-M
S1.
5012
5,02
441
+M
S12
7,03
899
19p-
coum
aryl
alc
ohol
-MS
3.72
149,
0607
3 13
1,05
030
(28)
20gu
aiaz
ulen
e+
MS
12.9
819
9,14
789
21G
uaia
col
+M
S6.
0412
5,05
969
22na
ptha
lene
+M
S0.
5712
9,05
200
a) R
elat
ive
inte
nsity
was
100
for
each
com
poun
ds.

8 - Biomasses194
Few of the standards were identified into selected liquids (WP4L_UP, WP4L_
BOT, WP8L_UP, WP8L_BOT); a list of the presence or absence of them is reported
in Table 8.11.
Table 8.11. Stadands identified into selected liquids (WP4L_UP, WP4L_BOT, WP8L_UP, WP8L_BOT). When identified the MS peak was of very weak intensity (below 1% of relative intensity). P: present; n.d.: not detected.
Ent
ry
Com
poun
d
MS
ex
perim
ent
WP
4L_B
OT
WP
4L_U
P
WP
8L_B
OT
WP
8L_U
P
1 2-ethyltoluene +MS n.d. n.d. n.d. p
2 2-methoxy-4-methylphenol +MS n.d. n.d. p p
3 3’,5’-dimethoxy-4’-hydroxy acetophenone-MS p n.d. n.d. n.d.
+MS p p n.d. n.d.
4 2,3,4-trimethoxy benzaldehyde +MS n.d. p p p
5 Ethyl gallate -MS p P p p
6 Eugenol +MS p n.d. P P
7 Benzophenone +MS p P P P
8 Gallic acid -MS n.d. p p n.d.
9 Methyl gallate -MS n.d. n.d. p p
10 Vanillin +MS p p p p
11 Pyrogallol +MS p n.d. p p
12 Guaiacol +MS n.d. p p p
13 napthalene +MS n.d. p p n.d.
Few of the standards identified were present in the liquids (Table 8.11), and
even if they were identified, using both their rt and MS spectrum, the intensity of
their base peak was below 1 % of relative intensity. Probably these compounds
were more diluted than the standards, the sensitivity of the mass analyzer was
low for these compounds, and they were mixed with the background noise which
contribute with peaks in the range of 100 – 200 m/z. So far the HPLC did not work
to its fullest potential with compounds with a masses below 300 Da which were
the expected one in these liquids (see Sections 8.3.2 and 8.3.3). Furthermore
several studies on liquids, which employed similar mass analyzer, limited the
investigate masses range above 400 Da.46-50
However the HPLC analyses, even at this level, might give some information
on the presence/absence of the reference compounds (Table 8.11) and the
presence/absence of other relevant peaks over the 300 Da threshold. However
no other relevant peaks were identified over 300 Da suggesting a prevalent mass
distribution below 200 Da.

8 - Biomasses 195
8.3.5. 1H NMR
1H NMR spectra of liquids (up and bottom phases) were a source of several
informations. NMR was employed to evaluate water content by using an internal
standard (see “Appendix II: Analytical Methods”). The nature of protons was
assigned as follow (partially using ranges reported by Özbay et al.51): δ 13.0-12.0
(mobile proton of carboxylic acid); 10.0-9-0 (aldehyde); 9.0-6.5 (aromatic, furan,
and C=CH-OCC); 6.5-5.0 (phenolic “OH” or C=CH olefins); 5.0-3.3 (CH2-O-C;
or CH2-OOC; or ring-join methylene, Ar-CH2-Ar); 3.3-2.0 (CH3, CH2, and CH on
aromatic ring); 2.0-1.6 (CH, CH2 of alkyl gropus; CH2 and CH in β position to an
aromatic ring); 1.6-1.0 (CH2, CH3 of alkyl groups, CH3 in β position and CH2 and
CH in g position to an aromatic ring or ether oxygen); 1.0-0-5 (CH3 of alkyl groups
or in g position or further of an alkyl chain linked to an aromatic ring).
The 1H NMR spectra of WP5L_UP, and their water subtracted spectra together
with the integral region, are reported in Figure 8.10.
Figure 8.10. 1H NMR spectra of WP5L_UP and their relative water subtract spectra together with the integral region.
Areas of residual spectra are reported in Table 8.12, they were calculated after
subtracting the water peak, and then the sum of all areas was normalized to 100.0.
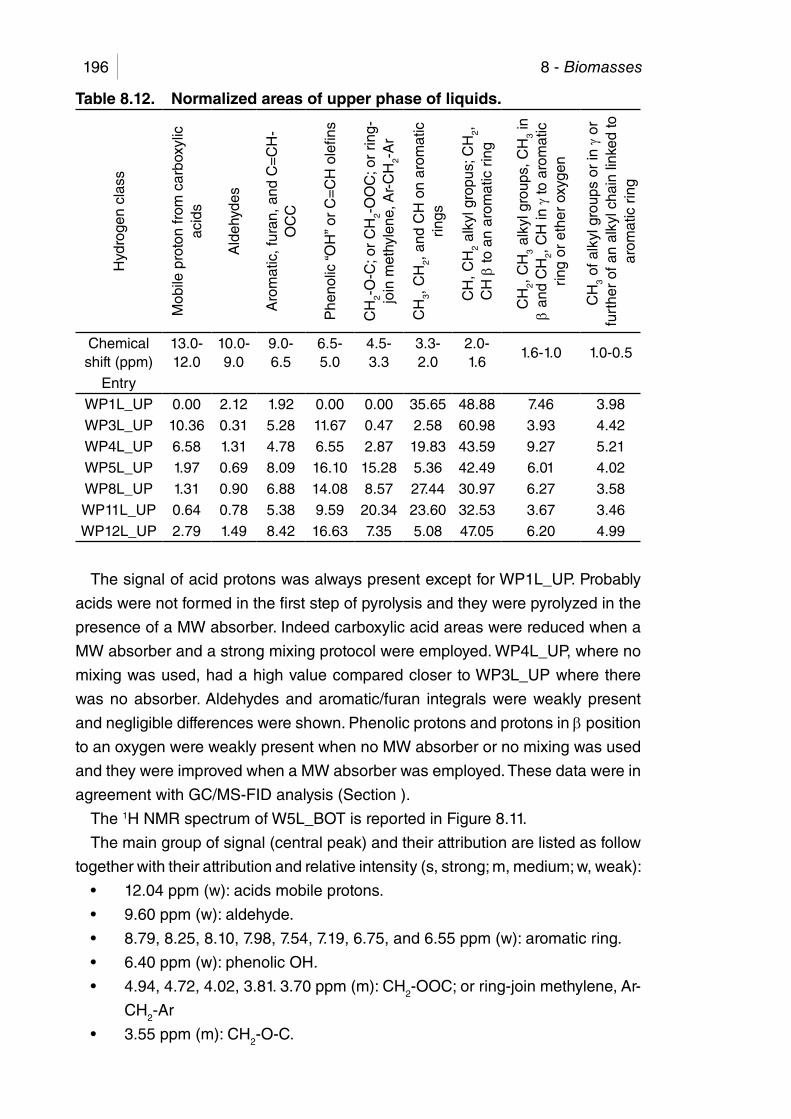
8 - Biomasses196
Table 8.12. Normalized areas of upper phase of liquids.H
ydro
gen
clas
s
Mob
ile p
roto
n fr
om c
arbo
xylic
ac
ids
Ald
ehyd
es
Aro
mat
ic, f
uran
, and
C=
CH
-O
CC
Phe
nolic
“OH
” or
C=
CH
ole
fins
CH
2-O
-C; o
r C
H2-
OO
C; o
r rin
g-jo
in m
ethy
lene
, Ar-
CH
2-A
r
CH
3, C
H2,
and
CH
on
arom
atic
rin
gs
CH
, CH
2 al
kyl g
ropu
s; C
H2,
C
H β
to a
n ar
omat
ic r
ing
CH
2, C
H3
alky
l gro
ups,
CH
3 in
β
and
CH
2, C
H in
g to
aro
mat
ic
ring
or e
ther
oxy
gen
CH
3 of
alk
yl g
roup
s or
in g
or
furt
her
of a
n al
kyl c
hain
link
ed to
ar
omat
ic r
ing
Chemical shift (ppm)
13.0-12.0
10.0-9.0
9.0-6.5
6.5-5.0
4.5-3.3
3.3-2.0
2.0-1.6
1.6-1.0 1.0-0.5
Entry
WP1L_UP 0.00 2.12 1.92 0.00 0.00 35.65 48.88 7.46 3.98
WP3L_UP 10.36 0.31 5.28 11.67 0.47 2.58 60.98 3.93 4.42
WP4L_UP 6.58 1.31 4.78 6.55 2.87 19.83 43.59 9.27 5.21
WP5L_UP 1.97 0.69 8.09 16.10 15.28 5.36 42.49 6.01 4.02
WP8L_UP 1.31 0.90 6.88 14.08 8.57 27.44 30.97 6.27 3.58
WP11L_UP 0.64 0.78 5.38 9.59 20.34 23.60 32.53 3.67 3.46
WP12L_UP 2.79 1.49 8.42 16.63 7.35 5.08 47.05 6.20 4.99
The signal of acid protons was always present except for WP1L_UP. Probably
acids were not formed in the first step of pyrolysis and they were pyrolyzed in the
presence of a MW absorber. Indeed carboxylic acid areas were reduced when a
MW absorber and a strong mixing protocol were employed. WP4L_UP, where no
mixing was used, had a high value compared closer to WP3L_UP where there
was no absorber. Aldehydes and aromatic/furan integrals were weakly present
and negligible differences were shown. Phenolic protons and protons in β position
to an oxygen were weakly present when no MW absorber or no mixing was used
and they were improved when a MW absorber was employed. These data were in
agreement with GC/MS-FID analysis (Section ).
The 1H NMR spectrum of W5L_BOT is reported in Figure 8.11.
The main group of signal (central peak) and their attribution are listed as follow
together with their attribution and relative intensity (s, strong; m, medium; w, weak):
• 12.04ppm(w):acidsmobileprotons.
• 9.60ppm(w):aldehyde.
• 8.79,8.25,8.10,7.98,7.54,7.19,6.75,and6.55ppm(w):aromaticring.
• 6.40ppm(w):phenolicOH.
• 4.94,4.72,4.02,3.81.3.70ppm(m):CH2-OOC; or ring-join methylene, Ar-
CH2-Ar
• 3.55ppm(m):CH2-O-C.

8 - Biomasses 197
• 3.34ppm(s):water
• 3.14(m)and2.48,1.18,and2.06ppm(s):CH3, CH2, and CH on aromatic
ring.
• 1.98,1.89,and1.21(w):CH2, CH3 of alkyl groups, CH3 in b position and
CH2 and CH in g position to an aromatic ring or ethereal oxygen.
• 0.96and0.91ppm(w):CH3 of alkyl groups or in g position or further of an
alkyl chain linked to an aromatic ring.
These data were in agreement with GC/MS-FID analysis confirming the phenolic
nature of the bottom phases.
Figure 8.11. 1H NMR spectra of W5L_BOT.
8.3.6. FTIR
FTIR analyses of both fractions supported the other data reported. Upper
fractions were mainly composed of water and water spectrum was always
subtracted. Bottom fractions had a low content of water anyway water spectrum
was subtracted also from them. Water subtracted spectra of WP5L_UP and
WP5L_BOT are reported in Figure 8.12. Relative intensity of each peak is reported
in Table 8.13 for upper phase and listed for bottom phase. The relative intensities
were referred to water subtracted spectra.

8 - Biomasses198
Figure 8.12. FTIR spectra of: a) WP12L_UP; b) WP12L_BOT.
All IR spectra had similar absorption and similar relative intensities between
peaks in each spectrum. However some distinctive differences were highlighted.
WP1L_UP spectrum perfectly overlapped WP3L_UP spectrum except for the
overall intensity. All spectra from WP4L_UP to WP12L_UP had almost the same
absorptions of WP3L_UP but stronger intensity below 1700 cm-1.

8 - Biomasses 199
Table 8.13. IR absorptions of upper phase of liquids from MAP of WPa.
Freq
uen
cy
(cm
-1)
Att
ribu
tio
n
WP1L_UP
WP2L_UP
WP3L_UP
WP4L_UP
WP5L_UP
WP6L_UP
WP7L_UP
WP8L_UP
WP9L_UP
WP10L_UP
WP11L_UP
WP12L_UP
WP13L_UP
WP14L_UP
3400
H-b
onde
d O
H s
tret
chin
gs
ss
ss
ss
ss
ss
ss
s29
64/2
876
Met
hyl C
-H a
sym
./sym
. str
etch
ing
mm
mm
mm
mm
mm
mm
mm
2910
/286
0M
ethy
lene
C-H
asy
m./s
ym.
stre
tchi
ngm
mm
mm
mm
mm
mm
mm
m
1710
wid
eC
=O
str
etch
ing
ss
ss
ss
ss
ss
ss
ss
1650
Alk
enyl
C=
C s
tret
chin
gw
ww
ww
ww
ww
ww
ww
w16
10C
onju
gate
d C
=C
str
etch
ing
wm
mm
mm
mm
mm
mm
mm
1515
C-C
str
etch
ing
(nea
r ox
ygen
)w
ww
wm
mm
mw
ww
n.d.
ww
1470
Met
hyle
ne C
-H b
endi
ngw
ww
ww
ww
ww
ww
ww
w14
10/1
375
Met
hyl C
-H a
sym
./sym
. ben
ding
mm
mm
mm
mm
mm
mm
mm
1316
; 127
0P
rimar
y or
sec
onda
ry a
lcoh
ol,
OH
in-p
lane
ben
ding
ms
ss
mm
mm
ss
ss
ss
1250
Aro
mat
ic e
ther
s, a
ryl-O
str
etch
ing
n.d.
n.d.
n.d.
n.d.
mm
mm
n.d.
n.d.
n.d.
mn.
d.n.
d.11
20Te
rtia
ry a
lcoh
ol, C
-O s
tret
chin
gw
ww
wm
ms
mw
ww
ww
w
1104
Sec
onda
ry a
lcoh
ol, C
-O
stre
tchi
ngm
mm
mw
wn.
d.w
mm
mm
mm
1050
Prim
ary
alco
hol,
C-O
str
etch
ing
mw
ww
mm
mm
ww
ww
ww
720
Met
hyle
ne –
(CH
2)n-
roc
king
, n≥
3w
ww
ww
ww
ww
ww
ww
w67
9A
lcoh
ol, O
H o
ut-o
f-pl
ane
bend
ing
ss
ss
ss
ss
ss
ss
ss
651;
639
; 61
8; 6
03A
lcoh
ol, O
H o
ut-o
f-pl
ane
bend
ing
ss
ss
ss
ss
ss
ss
ss
a) In
tens
ity r
epor
ted
as fo
llow
: s, s
tron
g; m
, med
ium
; w, w
eak;
n.d
. not
det
ecte
d.
The main absorptions frequencies identified in each bottom phase are reported
as follow together with their attribution and relative intensity (s, strong; m, medium;
w, weak):
• 3400boardcm-1 (m): H-bonded OH stretching.
• 2964and2865cm-1 (m): Methyl C-H asym./sym. Stretching.

8 - Biomasses200
• 2931and2853cm-1 (m): Methylene C-H asym./sym. Stretching.
• 1850-1750multiplebandscm-1 (w): Aromatic combination bands.
• 1707cm-1 (s): C=O stretching
• 1675cm-1 (s): C=O stretching, conjugated.
• 1636cm-1 (w): Alkenyl C=C stretching.
• 1610cm-1 (m): Conjugated C=C stretching.
• 1515cm-1 (s): C-C stretching (near oxygen).
• 1465cm-1 (m): Methylene C-H bending.
• 1425and1365cm-1 (m): Methyl C-H asym./sym. bending.
• 1265cm-1 (w): Primary or secondary alcohol, OH in-plane bending.
• 1240cm-1 (m): Aromatic ethers, aryl-O stretching.
• 1115cm-1 (m): Tertiary alcohol, C-O stretching.
• 1020cm-1 (w): Primary alcohol, C-O stretching.
• 1020and965-880cm-1 (w): Aromatic bending.
• 750cm-1 (m): Methylene –(CH2)n- rocking, n≥3.
• 679cm-1 (m): Alcohol, OH out-of-plane bending.
• 651;639;618;and603cm-1 (w): Alcohol, OH out-of-plane bending.
Both phases had similar absorption but different intensities. The broad
absorption at 3400 cm-1 was stronger for the upper phase, confirming its larger
water content while below 1600 cm-1 bottom phase had absorption with stronger
intensities supporting the presence of large amount of organic materials.
8.4. Gas product
Gases were a mixture of CO, CO2, H2, aldehydes, ketones, and other short chain
alkanes and alkenes. Gases were analyzed through FTIR for functional group
identification and chemical trapping for aldehydes and ketones identification.
8.4.1. FTIR
Three fractions of selected pyrolyses were analyzed using FTIR. These fractions
were collected at 3, 13 minutes, and the end of pyrolysis. Similar absorption were
shown by the three fractions but different intensities were shown. A comparison
between the three FTIR spectra of WP11G is reported in Figure 8.13.
CO2 was predominant and except for WP1G the asymmetric stretching was
always out-of-scale in all three collected fractions. Its formation started after
the beginning of pyrolysis and its concentration increased during the course of
pyrolysis. Indeed other absorption of CO2 (at 3850 and 3750 cm-1) increased
their relative intensity from the first to the third fraction. CO formation was low
if compared to CO2, and it was maxim in the middle fraction. Water was always
present but its concentration remained extremely low in any gas analyzed.
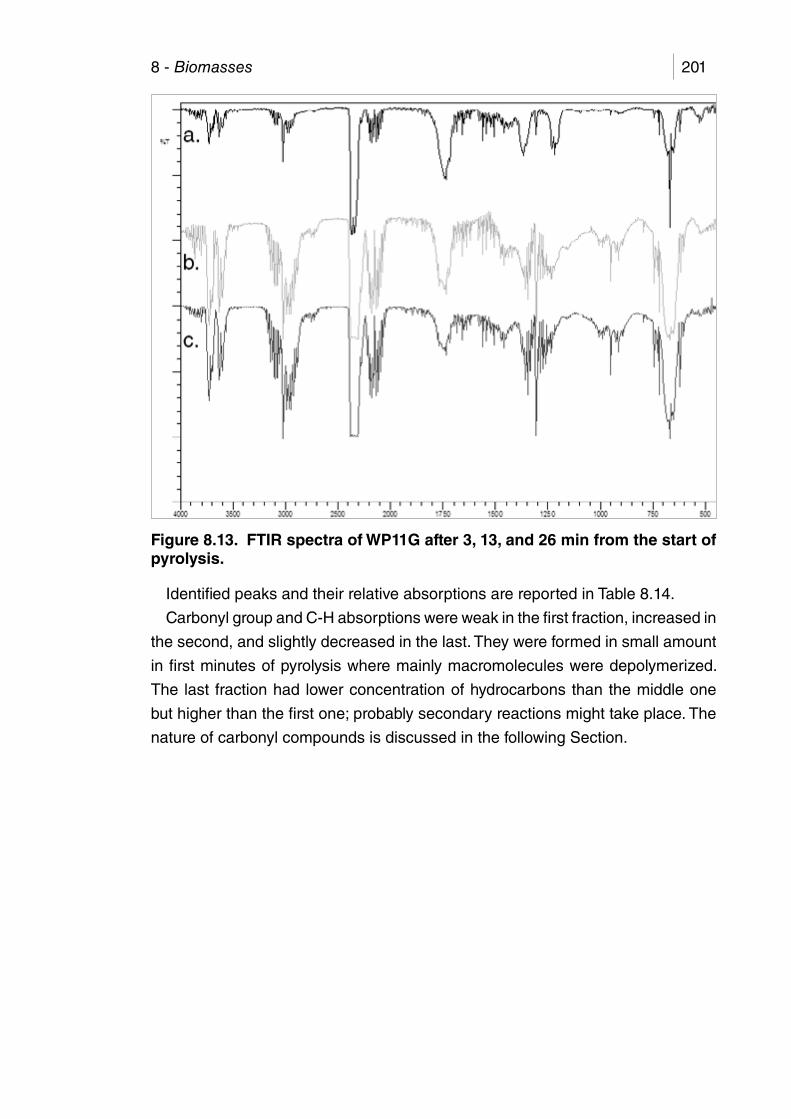
8 - Biomasses 201
Figure 8.13. FTIR spectra of WP11G after 3, 13, and 26 min from the start of pyrolysis.
Identified peaks and their relative absorptions are reported in Table 8.14.
Carbonyl group and C-H absorptions were weak in the first fraction, increased in
the second, and slightly decreased in the last. They were formed in small amount
in first minutes of pyrolysis where mainly macromolecules were depolymerized.
The last fraction had lower concentration of hydrocarbons than the middle one
but higher than the first one; probably secondary reactions might take place. The
nature of carbonyl compounds is discussed in the following Section.

8 - Biomasses202
Table 8.14. IR absorption of selected samples, second fraction of the gas streama.
Frequency (cm-1)
Attribution
WP
1G
WP
3G
WP
4G
WP
5G
WP
8G
WP
11G
WP
12G
3853; 3750 CO2 bands mixed with water vapors
m m m m s m s
3017 Aldehyde C-H stretching n.d. m s s s s s
2951; 2872 Methyl CH asym./sym. Stretching
n.d. w w m m m m
2360; 2341 CO2 asymmetric stretching m oos oos oos oos oos oos
2179; 2120 multiple bands
CO n.d. m m m s m s
1730; 1717 CO carbonyl stretching n.d. n.d. n.d. m m m m
1653; 1559 multiple bands
Water gas phase s w w w w w w
1457; 1373 Methyl CH asym./sym. bending
n.d. n.d. n.d. w w w w
720 Methylene –(CH2)n- rocking, n≥3
n.d. n.d. n.d. w w w w
668 CO2 bending modes w s s s s s s
617 Alcohol, OH out-of-plane bending
n.d. n.d. n.d. w w w w
a) Intensity reported as follow: oos, out-of-scale; s, strong; m, medium; w, weak; n.d. not
detected.
8.4.2. Chemical trapping
Gas formed in the course of WP6 and WP10 were bubbled in an acid solution of
2,4-dinitrophenylhydrazine (DNPH) in methanol in order to trap and characterize
the hydrazones formed. Possible compounds formed between DNPH and simple
aldehydes and ketones are reported in Figure 8.14.
NO2
O2N
HNNH2
R1
O
R 2
R1= H, CH3
R2= H, CH3
+
NO2
O2N
HNN
+
NO2
O2N
HNN
+
NO2
O2N
HNN
(a) (b) (c) (d)
Figure 8.14. Hydrazine form DNPH (a) and formaldehyde, acetaldehyde, and acetone: b) 1-(2,4-dinitrophenyl)-2-methylenehydrazine; c) 1-(2,4-dinitrophenyl)-2-ethylidenehydrazine; d) 1-(2,4-dinitrophenyl)-2-(propan-2-ylidene)hydrazine.
An orange precipitate was always obtained, filtered, washed, and characterized
via 1H NMR, the spectrum from WP6G is reported in Figure 8.15.

8 - Biomasses 203
Figure 8.15. 1H NMR spectrum of precipitate from WP6G.
1H NMR peaks: δ 11.14 (s, 1H), 10.80 (s, 12.5H), 8.86 (d, J4 = 2.7 Hz, 13.5H),
8.36 (dd, J3 = 9.6, 2.7 Hz, 13.5H), 8.09 (d, J3 = 9.6 Hz, 2H), 7.85 (d, J3 = 9.6 Hz,
13.5H), 3.15 (s, 10.75H), 2.44 (s, 6,75H), 2.11 (s, 37.5H), 2.07 (s, 37.5H), 1.22 (m,
3H).
1-(2,4-dinitrophenyl)-2-(propan-2-ylidene)hydrazine was the only compound
identified. Formaldehyde, acetaldehyde, and acetone were not identified via GC/
MS-FID (Section 8.3.3) and probably they were overwhelmed by the solvent signal
in GC. However only acetone went in gas phase and then was trapped.
8.5. Main achievements
Microwave assisted pyrolysis (MAP) of wood pellets (WP) was performed
using different MW absorber (none, Fe, and carbon), mixing protocol of the MW
absorber, apparatus set-up, and MW power.
MAP of WP might be run without a MW absorber but the pyrolysis could not
be completed. MW absorber (Fe and carbon) were mixed with WP with three
mixing protocol, none, mild, and strong, which affected the properties of solid and
liquid only when Fe the MW absorber. Furthermore Fe was probably involved in
coupling reaction within radical intermediates in the reactor which increased the
yield of solid.
WP were converted into a char which preserved their former shape except
when a MW absorber was not used.

8 - Biomasses204
The liquid obtained was separated in two phases, an upper and a bottom
phase. These phases were characterized using an innovative chromatographic
methodology. A single sample were prepared for thin layer chromatography, GC,
and HPLC analyses. Quantitative analysis of liquid were performed using the
relative response factor (RRF) referred to a compound present in the liquid. For
the compound identified, but for which a RRF was not available, the RRF was
predicted using an innovative formula.
The upper phases were composed of water and furans (such as furfural) and
single ring phenols as minor compounds. The bottom phases were rich in phenols
which were from lignin degradation.
MAP of WP showed the possibility to convert efficiently a biomass, non-
thermoplastic, as all the other polymer tested (Sections 6 and 9), in products
which might be employed in energy production (solid and liquid product), carbon
sequestration (solid product), or source of chemicals (liquid product).

8 - Biomasses 205
Reference
1. Undri, A.; Rosi, L.; Frediani, M.; Frediani, P. Efficient Disposal of Waste Polyolefins through Microwave Assisted Pyrolysis. Fuel 2013, 116, 662-671.2. Undri, A.; Rosi, L.; Frediani, M.; Frediani, P. Reverse Polymerization of Waste Polystyrene through Microwave Assisted Pyrolysis. J. Anal. Appl. Pyrol. 2013, http://dx.doi.org/doi:10.1016/j.jaap.2013.10.001.3. Miura, M.; Kaga, H.; Sakurai, A.; Kakuchi, T.; Takahashi, K. Rapid pyrolysis of wood block by microwave heating. J. Anal. Appl. Pyrol. 2004, 71, 187–199.4. Miura, M.; Kaga, H.; Yoshida, T.; Ando, K. Microwave pyrolysis of cellulosic materials for the production of anhydrosugars. J. Wood Sci. 2001, 47, 502-506.5. Farag, S.; Sobhy, A.; Akyel, C.; Doucet, J.; Chaouki, J. Temperature profile prediction within selected materials heated by microwaves at 2.45GHz. Appl. Therm. Eng. 2012, 36, 360-369.6. Vongpradubchai, S.; Rattanadecho, P. The microwave processing of wood using a continuous microwave belt drier. Chem. Eng. Process. 2009, 48, 997-1003.7. Undri, A.; Rosi, L.; Frediani, M.; Frediani, P. Upgraded Fuel from Microwave Assisted Pyrolysis of Waste Tire. Fuel 2014, 115, 600-608.8. Undri, A.; Meini, S.; Rosi, L.; Frediani, M.; Frediani, P. Microwave Pyrolysis of Polymeric Materials: Waste Tires Treatment and Characterization of the Value-Added Products. J. Anal. Appl. Pyrol. 2013, 103, 149-158.9. Robinson, J. P.; Kingman, S. W.; Barranco, R.; Snape, C. E.; Al-Sayegh, H. Microwave Pyrolysis of Wood Pellets. Ind. Eng. Chem. Res. 2010, 49, 459-463.10. Undri, A.; Sacchi, B.; Cantisani, E.; Toccafondi, N.; Rosi, L.; Frediani, M.; Frediani, P. Characterization of Carbon from Microwave Assisted Pyrolysis of Tires. J. Anal. Appl. Pyrol. 2013, 104, 396-404.11. Bolm, C.; Legros, J.; Le Paih, J.; Zani, L. Iron-Catalyzed Reactions in Organic Synthesis. Chemical Reviews 2004, 104, 6217-6254.12. Dongol, K. G.; Koh, H.; Sau, M.; Chai, C. L. L. Iron-Catalysed sp3–sp3 Cross-Coupling Reactions of Unactivated Alkyl Halides with Alkyl Grignard Reagents. Advanced Synthesis & Catalysis 2007, 349, 1015-1018.13. Hayashi, Y.; Shinokubo, H.; Oshima, K. Intramolecular Radical Cyclization of 2-Haloethanal Allyl Acetal and Allyl 2-Halophenyl Ether with a Grignard Reagent in the Presence of Iron(II) Chloride. Tetrahedron Lett. 1998, 39, 63-66.14. López, F. A.; Centeno, T. A.; Alguacil, F. J.; Lobato, B.; Urien, A. The GRAUTHERMIC-Tyres process for the recycling of granulated scrap tyres. J. Anal. Appl. Pyrol. 2013, 103, 207–215.15. López, F. A.; Centeno, T. A.; Alguacil, F. J.; Lobato, B.; López-Delgado, A.; Fermoso, J. Gasification of the char derived from distillation of granulated scrap tyres. Waste Manage. 2012, 32, 743-752.16. Mohan, D.; Pittman, C. U.; Steele, P. H. Pyrolysis of Wood/Biomass for Bio-oil: A Critical Review. Energy Fuels 2006, 20, 848-889.17. Spokas, K. A. Review of the stability of biochar in soils: predictability of O:C molar ratios. Carbon Management 2010, 1, 289-303.18. Ptasinski, K. J.; Prins, M. J.; Pierik, A. Exergetic evaluation of biomass gasification. Energy 2007, 32, 568-574.19. Crelling, J. C.; Hagemann, H. W.; Sauter, D. H.; Ramani, R. V.; Vogt, W.; Leininger, D.; Krzack, S.; Meyer, B.; Orywal, F.; Reimert, R.; Bonn, B.; Bertmann, U.; Klose, W.; Dach, G.: Coal. In Ullmann’s Encyclopedia of Industrial Chemistry; Wiley-VCH Verlag GmbH & Co. KGaA, 2000.
8 - Biomasses206
20. Predel, H.: Petroleum Coke. In Ullmann’s Encyclopedia of Industrial Chemistry; Wiley-VCH Verlag GmbH & Co. KGaA: Karlsruhe, Germany, 2000.21. Bridgwater, A. V.; Peacocke, G. V. C. Fast pyrolysis processes for biomass. Renew. Sust. Energ. Rev. 2000, 4, 1-73.22. Ren, S.; Lei, H.; Wang, L.; Bu, Q.; Chen, S.; Wu, J.; Julson, J.; Ruan, R. Biofuel production and kinetics analysis for microwave pyrolysis of Douglas fir sawdust pellet. J. Anal. Appl. Pyrol. 2012, 94, 163-169.23. Bridgwater, A. V. Renewable fuels and chemicals by thermal processing of biomass. Chem. Eng. J. 2003, 91, 87-102.24. Ronsse, F.; Bai, X.; Prins, W.; Brown, R. C. Secondary reactions of levoglucosan and char in the fast pyrolysis of cellulose. Environ. Prog. Sustain. Energy 2012, 31, 256-260.25. Westerhof, R. J. M.; Brilman, D. W. F.; Garcia-Perez, M.; Wang, Z.; Oudenhoven, S. R. G.; van Swaaij, W. P. M.; Kersten, S. R. A. Fractional Condensation of Biomass Pyrolysis Vapors. Energy Fuels 2011, 25, 1817-1829.26. Nolte, M. W.; Liberatore, M. W. Viscosity of Biomass Pyrolysis Oils from Various Feedstocks. Energy Fuels 2010, 24, 6601-6608.27. Wang, X.; Chen, H.; Luo, K.; Shao, J.; Yang, H. The Influence of Microwave Drying on Biomass Pyrolysis. Energy Fuels 2007, 22, 67-74.28. Salehi, E.; Abedi, J.; Harding, T. Bio-oil from Sawdust: Effect of Operating Parameters on the Yield and Quality of Pyrolysis Products. Energy Fuels 2011, 25, 4145-4154.29. Salehi, E.; Abedi, J.; Harding, T. G.; Seyedeyn-Azad, F. Bio-oil from Sawdust: Design, Operation, and Performance of a Bench-Scale Fluidized-Bed Pyrolysis Plant. Energy Fuels 2013, 27, 3332-3340.30. Kibet, J.; Khachatryan, L.; Dellinger, B. Molecular Products and Radicals from Pyrolysis of Lignin. Environ. Sci. Technol. 2012, 46, 12994-13001.31. Mani, T.; Murugan, P.; Abedi, J.; Mahinpey, N. Pyrolysis of wheat straw in a thermogravimetric analyzer: Effect of particle size and heating rate on devolatilization and estimation of global kinetics. Chem. Eng. Res. Des. 2010, 88, 952-958.32. Branca, C.; Giudicianni, P.; Di Blasi, C. GC/MS Characterization of Liquids Generated from Low-Temperature Pyrolysis of Wood. Ind. Eng. Chem. Res. 2003, 42, 3190-3202.33. Wang, Y.; Li, X.; Mourant, D.; Gunawan, R.; Zhang, S.; Li, C.-Z. Formation of Aromatic Structures during the Pyrolysis of Bio-oil. Energy Fuels 2012, 26, 241–247.34. Ben, H.; Ragauskas, A. J. NMR Characterization of Pyrolysis Oils from Kraft Lignin. Energy Fuels 2011, 25, 2322-2332.35. Musumarra, G.; Pisano, D.; Katritzky, A. R.; Lapucha, A. R.; Luxem, F. J.; Murugan, R.; Siskin, M.; Brons, G. Prediction of gas chromatographic response factors by the PLS method. Tetrahedron Computer Methodology 1989, 2, 17-36.36. Tissot, E.; Rochat, S.; Debonneville, C.; Chaintreau, A. Rapid GC-FID quantification technique without authentic samples using predicted response factors. Flavour Frag. J. 2012, 27, 290-296.37. Jones, F. W. Estimation of Flame-Ionization Detector Relative Response Factors for Oligomers of Alkyl and Aryl Ether Polyethoxylates using the Effective Carbon Number Concept. J. Chromatog. Sci. 1998, 36, 223-226.38. Katritzky, A. R.; Ignatchenko, E. S.; Barcock, R. A.; Lobanov, V. S. Prediction of Gas Chromatographic Retention Times and Response Factors Using a General

8 - Biomasses 207
Quantitative Structure-Property Relationship Treatment. Anal. Chem. 1994, 66, 1799-1807.39. de Saint Laumer, J.-Y.; Cicchetti, E.; Merle, P.; Egger, J.; Chaintreau, A. Quantification in Gas Chromatography: Prediction of Flame Ionization Detector Response Factors from Combustion Enthalpies and Molecular Structures. Anal. Chem. 2010, 82, 6457-6462.40. Bai, X.; Johnston, P.; Sadula, S.; Brown, R. C. Role of levoglucosan physiochemistry in cellulose pyrolysis. J. Anal. Appl. Pyrol. 2013, 99, 58-65.41. Zhou, C.-H.; Xia, X.; Lin, C.-X.; Tong, D.-S.; Beltramini, J. Catalytic conversion of lignocellulosic biomass to fine chemicals and fuels. Chem. Soc. Rev. 2011, 40, 5588-5617.42. Lin, Y.-C.; Cho, J.; Tompsett, G. A.; Westmoreland, P. R.; Huber, G. W. Kinetics and Mechanism of Cellulose Pyrolysis. J. Phys. Chem. C 2009, 113, 20097-20107.43. Ertas, M.; Alma, M. H. Pyrolysis of laurel (Laurus nobilis L.) extraction residues in a fixed-bed reactor: Characterization of bio-oil and bio-char. J. Anal. Appl. Pyrol. 2010, 88, 22-29.44. Zakzeski, J.; Bruijnincx, P. C. A.; Jongerius, A. L.; Weckhuysen, B. M. The Catalytic Valorization of Lignin for the Production of Renewable Chemicals. Chem. Rev. 2010, 110, 3552-3599.45. Jiang, G.; Nowakowski, D. J.; Bridgwater, A. V. Effect of the Temperature on the Composition of Lignin Pyrolysis Products. Energy Fuels 2010, 24, 4470-4475.46. Li, X.; Franke, A. A. Improved LC−MS Method for the Determination of Fatty Acids in Red Blood Cells by LC−Orbitrap MS. Anal. Chem. 2011, 83, 3192-3198.47. Pereira, A. S.; Bhattacharjee, S.; Martin, J. W. Characterization of Oil Sands Process-Affected Waters by Liquid Chromatography Orbitrap Mass Spectrometry. Environ. Sci. Technol. 2013, 47, 5504-5513.48. Zhurov, K. O.; Kozhinov, A. N.; Tsybin, Y. O. Evaluation of High-Field Orbitrap Fourier Transform Mass Spectrometer for Petroleomics. Energy Fuels 2013, 27, 2974-2983.49. Smith, E. A.; Lee, Y. J. Petroleomic Analysis of Bio-oils from the Fast Pyrolysis of Biomass: Laser Desorption Ionization−Linear Ion Trap−Orbitrap Mass Spectrometry Approach. Energy Fuels 2010, 24, 5190-5198.50. Cole, D. P.; Smith, E. A.; Lee, Y. J. High-Resolution Mass Spectrometric Characterization of Molecules on Biochar from Pyrolysis and Gasification of Switchgrass. Energy Fuels 2012, 26, 3803-3809.51. Özbay, N.; Pütün, A. E.; Pütün, E. Structural analysis of bio-oils from pyrolysis and steam pyrolysis of cottonseed cake. J. Anal. Appl. Pyrol. 2001, 60, 89-101.


9. Bio-polymers
Microwave assisted pyrolysis (MAP) of two different classes of macromolecules
obtained from natural resources: poly(lactic acid) (PLA) and corn-derived plastic
bags (CDP) is herein reported. CDP was a mixture of different classes of polymer
and lower molecular weight molecules meanwhile PLA is a pure commercial
grade polymer.
9.1. Poly(lactic acid)
MAP of poly L-lactic acid (PLA) could be run only in the presence of a MW
absorber. It was exploited by varying three parameters: set-up, MW absorber, and
MW power.
9.1.1. Operating conditions and yields
The operating parameters employed, set-up, MW absorber, and MW power
are reported in Table 9.1 (entries are named “PLAn” where “n” is an arbitrary
ascending number for each experiment).
Table 9.1. MAP of PLA, operating parameters.
EntrySet-up
MWAbsorber
Power PLAMW
AbsorberTime Solid Liquid Gas
(kW)a (g) (g) (min) (wt%) (wt%) (wt%)
T4 A Tire M 3.0 - 233.3 35 43.2 42.6 14.1
PLA1 A Tire M 3.0 151.1 303.6 30 38.2 44.2 17.6
PLA2 A Carbon 3.0 150.3 70.2 30 2.6 28.4 69.0
PLA3 A Carbon 1.2(25); 1.35(6); 1.5(59); 2.1(3); 2.4(9); 3.0(6)
101.9 32.2 107 2.7 48.4 48.9
PLA4 A Fe 3.0 100.2 50.2 41 7.6 42.9 49.5
PLA5 B Carbon 3.0 123.0 57.6 25 3.8 57.7 38.5
PLA6 B Fe 3.0 100.0 50.4 70 29.6 18.2 52.2
a) within brackets the time for which each MW power was employed.
MAP of PLA produced large amount of gases and liquids with low formation of

9 - Bio-polymers210
solids when carbon was the MW absorber. Liquid yield was increased by reducing
the MW power with detriment to gas production. In these condition pyrolysis time
was incremented as a consequence of MW power reduction. Liquid yield was
further increased by using set-up B. In these last conditions high boiling products
remained in the oven for a longer time and pyrolyze. Furthermore cross reactions
between degradation products might occur in the gas phase. Worthy of note was
always the low formation of solid even using set-up B.
Fe as MW absorber increased the formation of solid (entry PLA4) moreover
using set-up B the yield of solid was further increased to 29.6 wt% (entry PLA6).
The effect of Fe as MW absorber was completely opposite to carbon. The gas
formation was not influenced by set-up A or B, meanwhile liquid considerably
decreased using set-up B. Fe seemed to be involved in condensation reactions to
yield non-volatiles compound (which remained in the reactor as solid or high boiling
compounds soaked in the solid) which were more effective than cross reactions
when carbon was the MW absorber (entry PLA5). Indeed Fe salts are employed
as catalyst in several coupling reactions for instance with Grignard reagents.1
So far the Fe(0), used as MW absorber, or its oxidate form, could be involved
in radical catalytic cycles as proposed for classical Grignard reactions.2,3 This
behavior was not surprisingly because bonds cleavage led to radical formation in
pyrolysis reactors. Furthermore in a MW system the cleavage took place near the
MW absorber which was Fe in this case. Fe in the presence of macromolecules
promoted their pyrolysis meanwhile coupling of radicals formed was promoted.
MAP of tire alone (entries T4) were reported as referring pyrolysis to help results
interpretation when tire was used as MW absorber. Indeed products from MAP of
tire were mixed with those from PLA.
Separate considerations might be done when tire was the MW absorber. The
amount of tire was higher than carbon or Fe because it contains more than 50 % of
products unable to absorb MW. Liquids from MAP of PLA obtained in the presence
of tire contained the same compounds formed in all other PLA pyrolysis together
with those formed from MAP of tire. It is possible to evaluate the contribution of
tire and PLA to the liquid formed. The amount of liquid from PLA was calculated
assuming the same yields of entry PLA2 where carbon was the MW absorber
while the yields of tire were assumed to be analogous to that reported in T4.
These results (Table 9.2) were compared with the results obtained in PLA1.
Significant differences were highlighted suggesting cross reactions between
products with a completely different behavior from those reported for MAP in the
presence of carbon or Fe. Solid yield was surprisingly increased as well as liquid.
Meanwhile gas was almost halved. The presence of tire degradation products
probably enhanced cross reaction between products.

9 - Bio-polymers 211
Table 9.2. Theoretical yield calculation for entry PLA1, together with the experimental values.
Solid Liquid GasTire PLA Tire PLA Tire PLA
Relative amount calculated (g)a 131.2b 3.9c 129.3b 42.9c 43.1b 103.3c
Total amount calculated (g) 135.1 172.2 147.4
Yield calculated (%) 29.5 37.9 32.4
Experimental yield (%) 38.2 44.2 17.6
a) Starting materials: tire 303.6 g, PLA 151.1 g; b) amount calculated from MAP of tire, T4;
b) amount calculated from PLA2.
Moreover the pyrolysis time was reduced from T4 to PLA1, probably these
interactions positively affected decomposition.
Probably tire pyrolysis gave liquid and gas products at the reaction temperature
and these products worked as heat transfer agent more efficient than carbon or
Fe. In this way pyrolysis was rapidly realized.
9.1.2. Collected lactide
After about one hour, from the end of some pyrolysis, crystals precipitated
from solution. They were separated as white crystal after filtration over a Buchner
funnel, washed with methanol, and dried. In Figure 9.6 is reported the 1H NMR
spectra of these crystals.
4.995.005.015.025.035.045.055.065.07ppm
5.00
5.02
5.05
5.07
1.651.661.671.681.691.701.71ppm
1.67
1.69
0.00.20.40.60.81.01.21.41.61.82.02.22.42.62.83.03.23.43.63.84.04.24.44.64.85.05.25.4ppm
0
50
100
150
200
250
300
350
400
450
1.671.69
5.005.025.055.07
O
O
O
O
Figure 9.6. 1H NMR spectrum of crystals collected from liquid.
1H NMR (CDCl3) peaks: δ 5.04 (q, J3 = 6.8 Hz, 1H), 1.69 (d, J3 = 6.8 Hz, 3H).
These crystals were pure L-lactide (cyclic dimeric ester of lactic acid) in agreement
with literature, where lactide was formed though a back biting process from PLA.4
Furthermore racemization of L-lactide to its meso-form could be excluded, due to
the presence of only one doublet at δ 1.69.5 The amount of recovered lactide as
weight, and yield % over the initial PLA and liquid collected are reported in Table

9 - Bio-polymers212
9.3.
Table 9.3. Lactide recovered from each pyrolysis experiment.
Entry Set-upMW
Absorber
Lactide recovered
Lactide recovered
Lactide recovered
(g) (%)a (%)b
T4 A Tire M 0.0000 0.00 0.00
PLA1 A Tire M 0.0000 0.00 0.00
PLA2 A Carbon 7,6875 5.13 18.00
PLA3 A Carbon 7.5747 7.43 15.36
PLA4 A Fe 3.9692 3.96 9.23
PLA5 B Carbon 11.0497 8.98 15.57
PLA6 B Fe 0.0000 0.00 0.00
a) calculated from initial PLA; b) calculated from liquid collected.
Lactide precipitated form liquids only if it is a poor solvent for lactide itself
because alcohols and linear alkanes were largely present while aromatics and
chlorinated molecules were not present (see Section 9.1.3.2).6
This procedure could be a way to recover lactide from a waste PLA, even if it
was contaminated with inorganics (such as carbon or Fe) but if other polymeric
materials were mixed with it the overall recovery might be deeply affected. In the
presence of tire pyrolysis compounds contained aromatics capable to solubilize
efficiently the lactide and there was no formation of any precipitate (PLA1).
9.1.3. Liquid product
9.1.3.1. Physical properties
Physical properties of liquids, coded as “PLAnL” where “n” is an arbitrary
ascending number for each experiment, are listed in Table 9.4. Liquid described
in this section were partially depleted in lactide because it precipitated from liquid
and it was analyzed separately (Section 9.1.2).
Table 9.4. Physical characteristics of liquid obtained by MAP of PLA.
EntryDensity
Ultimate analyses C/H molar ratio
C H N S Oa
(g/cm3) (wt%) (wt%) (wt%) (wt%) (wt%)
T4 0.874 86.87 10.12 0.66 0.90 1.45 0.72
PLA1L 1.079 47.92 7.32 0.74 0.68 43.34 0.55
PLA2L 1.067 48.60 7.41 0.00 0.00 43.99 0.55
PLA3L 1.087 47.74 5.09 0.00 0.00 47.17 0.78
PLA4L 1.120 48.89 6.84 0.00 0.00 44.27 0.60
PLA5L 1.134 48.20 6.83 0.00 0.00 44.97 0.59
PLA6L 0.953 47.62 8.53 0.00 0.00 43.85 0.47
a) by difference.
Liquids showed a dark-yellow appearance except PLA1L which was dark due

9 - Bio-polymers 213
to the presence of tire degradation products.
However the presence of tire degradation products did not affected the ultimate
composition and very similar composition with PLA2L was observed. Different
set-ups and MW absorber showed negligible effects over ultimate composition.
Anyway for all liquids there was a reduction of carbon and oxygen content with
respect to initial PLA (ultimate analysis,C: 49.32 %, H: 5.66 %, O: 45.03 %, C/H
molar ratio: 0.73), connected with CO2 formation. Only PLA6L showed a slightly
lower C/H value and together with the lower density suggested a more efficient
pyrolysis when Fe was the MW absorber and set-up B was employed.
Using set-up A and carbon or tire as MW absorber density was steady in a
narrow interval, 1.067 – 1.087 g/cm3. Surprisingly using set-up B and carbon as
MW absorber the density was higher.
An opposite behavior was shown for Fe as MW absorber, a higher value of
density was reported when using set-up A (1.120 g/cm3) than set-up B (0.953 g/
cm3). This value was higher than those reported for carbon as MW absorber and
set-up A.
9.1.3.2. GC/MS
All liquids contained a large number of compounds especially when tire pyrolysis
products were present. In Table 9.5 are listed only the most representative
compounds attributed to MAP of PLA. Abundances were evaluated by the TIC
without any response factor correction. TICs of PLA3L and PLA4L are reported in
Figure 9.7, while in Figure 9.8 are reported these of PLA5L and PLA6L for visual
comparative purposes.
Table 9.5. Compounds in liquids from MAP of PLA.Entry
T4L
a
PLA
1L
PLA
2L
PLA
3L
PLA
4L
PLA
5L
PLA
6L
Set-up A A A A A B B
Absorber
Tire
M
Tire
M
Car
bon
Car
bon
Fe
Car
bon
Fe
n Substance a.c.b
1 acetaldehyde C 2.04 2.53 2.56 2.94 1.07 7.75
2 2-Butene-trans C 1.53 0.49 0.01
3 butane C 0.15 0.02
4 ethanol C 0.17 0.09 0.03 0.14
5 acetone C 0.69 0.83 1.26 0.43 1.53
6 ethenyl acetate C 0.18 0.60 0.24 0.12 0.82
7 2-butanone P 1.95 2.56 1.30 0.71 3.64
8 acetic acid P 0.46 2.39 5.68 1.18 1.25 3.20
9 tetrahydrofura P 1.06
(continue)

9 - Bio-polymers214
10 1-hydroxy-2-propanone
P 0.56 0.59 0.41 0.07 0.38 0.34
11 1-penten-3-one P 0.21 0.36 0.21 0.09 0.12
12 3-methyl-2-butanone P 0.22 0.11 0.17 0.08 0.10
13 3-pentanone U 2.76 6.45 4.11 2.67 4.46 10.69
14 3-hydroxy-2-butanone U 0.15 0.22 0.03 0.30 1.79
15 propanoic acid P 6.82 10.50 9.65 8.03 11.23 17.73
16 2-methyl-2-butenal U 0.44 0.76 0.12
17 toluene C 2.95 1.34 0.20 0.17
18 paraldehyde C 0.08 0.55 7.91 0.57 1.52
19 2-methylpentanal U 0.69 0.33 0.30 0.12 0.55 0.41
20 1-propen-2-ol, acetate P 0.80 1.45 0.78 0.18 0.65 0.29
21 1-(2-furanyl)-ethanone U 0.18 0.29 0.11 0.08
22 methyl 2-methoxypropanoate
U 0.23 0.87 0.21
23 2-hydroxy-propanoic acid ethyl ester
C 0.56 0.19 2.85 1.31 4.98
24 5-methyl-1,4-dioxin-2(3H)-one
U 0.16 0.14
25 2-cyclopent-1-one U 0.19 0.66 1.73 0.08 0.42
26 1-(acetyloxy)-2-propnanone
P 0.53 1.36 0.51 0.16 1.71 3.42
27 hydroxy ester (C5H10O3)
U 0.82 0.65 0.11 0.36
28 Alcohol C7H12O U 0.22 0.19 0.35 0.11
29 pentanoic acid U 1.25 0.21 0.45 0.05 5.74 0.15
30 5,6-dihydro-2H-Pyran-2-carboxaldehyde
U 0.18 0.31 0.27
31 C8 alkyne or C8 cyclic alkene
U 1.11 1.28 0.26 0.55
32 1-(acetyloxy)-2-butanone
U 1.03 1.25 0.44 1.66
33 propanoic acid, ethenyl ester
P 0.47 0.36 0.30 1.57 1.59
34 aldheyde C6H12O U 1.25 1.16 1.92
35 2,3-dimethyl-2-cyclopenten-1-one
P 0.21 0.32 0.37
36 octahydro-1H-Inden-1-one
U 0.15 0.19 0.12
37 lactide C 15.24 22.17 17.81 30.13 25.52 9.19
38 lactide C 20.19 17.56 16.05 27.85 12.85 16.24
39 C11H6O7 (m/z: 252) U 0.58 1.46 3.09
40 C11H6O7 (m/z: 252) U 3.58 0.17 0.25
41 C11H6O7 (m/z: 252) U 5.38
42 C11H6O7 (m/z: 252) U 0.19 1.09 0.46 1.90
43 C11H8O7 (m/z: 254) U 1.21 1.47
(continue)

9 - Bio-polymers 215
44 C11H8O7 (m/z: 254) U 0.17 0.92
45 C12H12O7 (m/z: 272) U 0.14 0.60 1.20
46 C12H12O7 (m/z: 272) U 1.17 1.23 0.13 1.83
47 C12H12O7 (m/z: 272) U 0.87 0.70 1.24 0.03
48 C12H12O7 (m/z: 272) U 0.06 0.61 0.72 1.05 0.14
49 C12H16O7 [2-((1-(5-methyl-3,6-dioxo-1,4-dioxan-2-yl)-3-oxobutan-2-yl)
oxy)propanal]
U 0.07 0.15 0.17 0.20
TOTAL Alkanes, alkenes, and aromatics
4.63 1.83 1.34 1.45 0.26 0.55 0.00
TOTAL Alcohols 0.00 0.17 0.31 0.19 0.38 0.00 0.25
TOTAL Ketones 0.00 6.02 11.33 9.29 4.55 5.10 15.86
TOTAL Aldheyde 0.00 3.17 4.87 4.14 3.06 3.54 8.16
TOTAL Esters 0.00 0.65 0.96 0.54 1.69 0.00 2.41
TOTAL Ethers 0.00 0.08 1.61 7.91 0.57 0.00 1.52
TOTAL Acids 0.00 8.53 13.10 15.78 9.26 18.22 21.08
TOTAL Hydroxy ester 0.00 35.99 40.74 37.36 59.40 38.37 30.77
TOTAL Mixed 0.00 2.43 6.02 3.55 0.82 3.48 7.79
TOTAL PLA fragment 0.00 4.43 5.39 4.95 3.68 15.16 0.62
TOTAL 4.63 63.3 85.67 85.16 83.67 84.42 88.46
a) other compounds were present as reported in Table 5.7; b) a.c.: attribution confidence
C, certain (>98%); P, probable (86-97%); U, uncertain (<85%).
Figure 9.7. TIC of samples obtained from MAP of PLA with set-up A: PLA3L and PLA4L.
All liquid (except for T4L) contained large amount of lactide, even if this precipitated
in large extent, in two forms, meso and enantiopure forms in agreement with data
from literature.7-13 However only L-lactide precipitated from solution as shown in
Section 9.1.2. Probably the first peak attribute to lactide (entry 37, Table 9.5), in
agreement with literature, was attributable to the meso form. Using carbon as
MW absorber the meso lactide increased and the enantiopure form decreased

9 - Bio-polymers216
using set-up B with respect to set-up A. An opposite effect was observed for Fe,
it reduced the amount of meso lactide and increased the enantiopure lactide
working with set-up B instead of set-up A.
Figure 9.8. TIC of samples obtained from MAP of PLA with set-up B: PLA5L and PLA6L.
Using Fe and set-up B (PLA6) the pyrolysis of PLA was more efficient and less
amount of lactide was formed. In fact there was no lactide precipitated (Table 9.3)
and the area relative to lactide in Table 9.5 was the lowest and the acid was the
highest.
The identification of some compounds was nearly impossible from their mass
spectrum. Several compounds were separated in the GC but shared the same
MS spectrum and similar structure because they were formed by partial cleavage
of PLA backbone and followed analogous rearrangements (entries 39 – 49 Table
9.5). For entry 49 (Table 9.5) a structure might be proposed from its mass spectrum:
2-((1-(5-methyl-3,6-dioxo-1,4-dioxan-2-yl)-3-oxobutan-2-yl)oxy)propanal (Figure
9.9, following the peak attribution).
Figure 9.9. Proposed structure for entry 49 of Table 9.5.
9.1.3.3. FTIR
The FTIR spectra of liquids collected from MAP of PLA and depleted from
precipitated lactide are reported in Figure 9.10.
OO
O
O
O
O
O

9 - Bio-polymers 217
Figure 9.10. FTIR spectra of liquids from MAP of PLA: a) PLA1L; b) PLA2L; c) PLA3L; d) PLA5L.
All spectra showed the same absorptions with very close intensities. The main
absorptions frequencies are reported as follow together with their attribution and
relative intensities (s, strong; m, medium; w, weak):
• 3477,broad(m)cm-1: H-bonded OH stretching.
• 3196(w)cm-1: normal polymeric OH stretching.
• 2993(m)and2883(w)cm-1: methyl C-H asym./sym. stretching.
• 2942(m)cm-1: methyne C-H stretching.
• 1735 (w) and 2743 (w) cm-1: aldehyde and aldehydic C-H stretching,
overlapped with ester.
• 1715(s)cm-1: carboxylic acid, ketone.
• 1452(m)and1377(m)cm-1: methyl C-H asym./sym. bending.
• 1410(m)cm-1: tertiary alcohol, OH in-plane bending.
• 1350(m)cm-1: secondary alcohol, OH in-plane bending.
• 1202(m)cm-1: secondary alcohol, CO stretching.
• 647,639,618,601(m)cm-1: primary or secondary alcohol, OH out-of-plane
bending.
Only PLA1L showed few differences compared with other spectra because tire
pyrolysis products were mixed with PLA one. Methyl and methyne absorptions
were more intense and corresponding weak aromatic absorption were observed.
The data were in agreement with GC/MS analyses, the main component of
liquid contained a mixture of simple organic acid, lactide, and substructure from
PLA backbone cleavage. FTIR spectra also showed the absence of strong water
absorption. The absence of water, or its low amount, suggested the negligible
presence of dehydratation reactions.
9 - Bio-polymers218
9.1.4. Main achievements
Microwave assisted pyrolysis (MAP) of PLA was performed using different MW
absorbers (tire, carbon, or Fe), apparatus set-up, and MW power, obtaining a
liquid rich in lactide and other oxygenated hydrocarbons. The main achievements
might be summarized in the following key points.
The meso-form of the lactide was found only in chromatogram from GC/MS
analysis. Except for any form of lactide GC/MS analyses showed the presence of
simple acids (such as acetic acid and propanoic acid), carbonyl compounds, and
fragments from PLA backbone random cleavage for which were not possible to
propose any definite structure.
FTIR spectra showed mainly the presence of alcohols and carbonyl groups
confirming the GC/MS data.
The pyrolysis of PLA together with other polymers, which might pyrolyze to
aromatic compounds, prevent the precipitation of lactide and moreover cross
reactions between products took place affecting the yield and characteristics of
liquid. MAP of PLA could not be performed in the presence of other polymers in
order to recover lactide.

9 - Bio-polymers 219
En
try
Set
-u
pM
W
abso
rber
MW
p
ow
erM
W
abs.
CD
PC
DP
/ab
s.T
ime
Solid
Liquidb
Liquidc
Liquidd
Gas(k
W)a
(g)
(g)
(min
)(w
t%)
(wt%
)(w
t%)
(wt%
)(w
t%)
CD
P1
AC
arbo
n3
127.
756
.42.
2630
13.3
47.5
39.2
CD
P2
AC
arbo
n1.
2(23
); 1.
35(5
); 1.
5(22
); 3(
10)
126.
256
.62.
2360
18.3
22.3
5.7
18.1
35.6
CD
P3
AF
e3
129.
663
.62.
0432
25.9
30.0
6.0
9.4
28.7
CD
P4
BC
arbo
n3
126.
056
.62.
2335
30.1
16.8
9.0
2.7
41.3
CD
P5
BC
arbo
n1.
2(18
); 1.
35(3
); 1.
5(49
); 3(
26)
129.
854
.32.
3986
13.2
26.0
12.1
2.5
46.2
CD
P6
BF
e3
132.
965
.72.
0241
32.7
11.3
8.5
2.5
45.0
a)
with
in b
rack
ets
the
time
for
whi
ch e
ach
MW
pow
er w
as e
mpl
oyed
; b)
uppe
r fr
actio
n (U
); c)
mid
dle
frac
tion
(M);
d) lo
wer
frac
tion
(L)
9.2. Corn-derived plastics
MAP of corn-derived plastic bags (CDP) might be run only in the presence of a
MW absorber. It was exploited by varying three parameters: set-up, MW absorber,
and MW power.
9.2.1. Operating conditions and yields
In Table 9.1 are reported the operating parameters employed (entries are
named “CDPn” where “n” is an arbitrary ascending number for each experiment).
Table 9.1. MAP of corn-derived plastics, operating parameters.
Pyrolysis could be performed in 30 minutes, but using set-up B the reaction
time was slightly longer. The presence of a fractionating system increased the

9 - Bio-polymers220
residence time of products into the oven and the overall pyrolysis time in agreement
with MAP of other polymeric materials (Section 6).14-19
MAP of CDP produced large amount of gases (28.7 – 46.2 wt%) and liquids
(28.5 – 47.5 wt%) together with a significant amount of solids when carbon was
the MW absorber. Liquid yield was increased by reducing the MW power (as
a consequence pyrolysis time was increased) with detriment to gas formation.
Anyway the liquid yield was decreased by using set-up B (an online fractionating
system). Solid was formed in higher amount but it was reduced working with a lower
MW power. Long reaction time and the presence of a fractionating system allowed
further reactions between pyrolyzed products and solid or cocking reactions.
Fe as MW absorber increased the formation of solid (entry CDP4) moreover
using set-up B the solid yield was further increased to 32.7 wt% (entry CDP6).
The gas formation was dramatically influenced by set-up; as a matter of fact
using set-up B gas yield was 45.0 wt% instead or 28.7 wt% for set-up A. On
the contrary liquid yield was reduced from 45.4 wt% using set-up A to 22.7 wt%
with set-up B. Fe was involved in condensation reactions as highlighted for PLA
pyrolysis in the presence of Fe (Section 9.1).
Apparently liquids were always collected as one phase. However after 30
minutes liquids separated in three phases. These three phases were thoroughly
separated after centrifuging and they were weighted and analyzed separately.
The upper phase was always the predominant one. Its amount decreased
working with set-up B and a MW power of 3 kW. On the contrary low MW power
and the same set-up B increased the amount of this fraction. The bottom fraction
was reduced by working with a MW power of 3 kW and further reduction was
achieved by using set-up B. FTIR analysis (Section 9.2.2.3) showed for these two
fractions, (upper and lower) the same FTIR spectra, so far the bottom fraction
was probably a mixture of oligomers/plasticizers (heavy materials) which were not
soluble in the other two fractions. Indeed using set-up B the lower fraction was
dramatically reduced suggesting a more efficient pyrolysis of these oligomers.
Middle fraction yields was almost constant when varying any parameters. Only
when a high yield of gas was obtained the yield of middle fraction was increased
(CDP5), or more generally when set-up B was used. This fraction was mainly
composed of water (Section 9.2.2.3) and when the pyrolysis was more efficient
(that is when the ability to obtain small molecules was improved) gas collected
was increased.

9 - Bio-polymers 221
9.2.2. iquid product
9.2.2.1. Physical properties
Physical properties of liquids, coded as “CDPnL_f” where “n” is an arbitrary
ascending number for each experiment and “f” is referred to one of the liquid
fractions (U, upper; M, middle; L, lower), are listed in Table 9.2.
Table 9.2. Liquid from MAP of CDP.
Entry Set-upMW
absorberDensity
Ultimate analyses C/H molar ratio
C H N Oa
(g/cm3) (wt%) (wt%) (wt%) (wt%)
CDP1L_U A Carbon 61.95 5.75 1.44 30.86 0.897
CDP1L_M
CDP1L_L n.d.
CDP2L_U A Carbon 1.0258 64.93 7.52 1.21 26.34 0.719
CDP2L_M 1.0317 8.89 6.29 0.00 84.82 0.118
CDP2L_L n.d. 55.60 8.58 0.18 35.64 0.540
CDP3L_U A Fe 1.0249 59.37 7.90 1.39 31.34 0.626
CDP3L_M 1.0467 12.79 9.02 0.55 77.64 0.118
CDP3L_L n.d. 57.67 8.69 0.48 33.16 0.553
CDP4L_U B Carbon 1.0048 61.13 7.28 0.40 30.89 0.699
CDP4L_M 1.0435 12.44 7.06 0.00 80.50 0.147
CDP4L_L n.d. 59.91 6.92 2.37 30.80 0.721
CDP5L_U B Carbon 0.9905 51.73 8.76 0.00 39.51 0.492
CDP5L_M 1.0394 12.04 7.04 3.74 77.18 0.142
CDP5L_L n.d. 58.03 6.58 0.44 34.95 0.734
CDP6L_U B Fe 0.9872 47.51 6.36 1.85 44.28 0.622
CDP6L_M 1.0388 10.90 8.59 0.00 80.51 0.106
CDP6L_L n.d. 59.82 6.52 0.37 33.29 0.764
a) calculated by difference.
The lower fraction was a pale-yellow milky liquid, semi-solid a room temperature
and it was not possible to evaluate its density. Probably this fraction was composed
by the same products of the upper fraction but with compounds with high molecular
weight.
The water content was very similar among each phase. Upper and bottom
fractions had a water content between 4 and 10 wt % probably due to the
presence of compounds which were able to solubilize water in these fractions.
Middle fraction contained almost only water with about 75 wt % of water content.
Ultimate analyses confirmed the similarity between upper and lower phases, and
the predominant presence of water in the middle fractions. Nevertheless ultimate
analyses highlighted noticeable differences among CDP2L_U and CDP5L_U,
CDP3L_U and CDP6L_U; using different reaction condition such as switching from
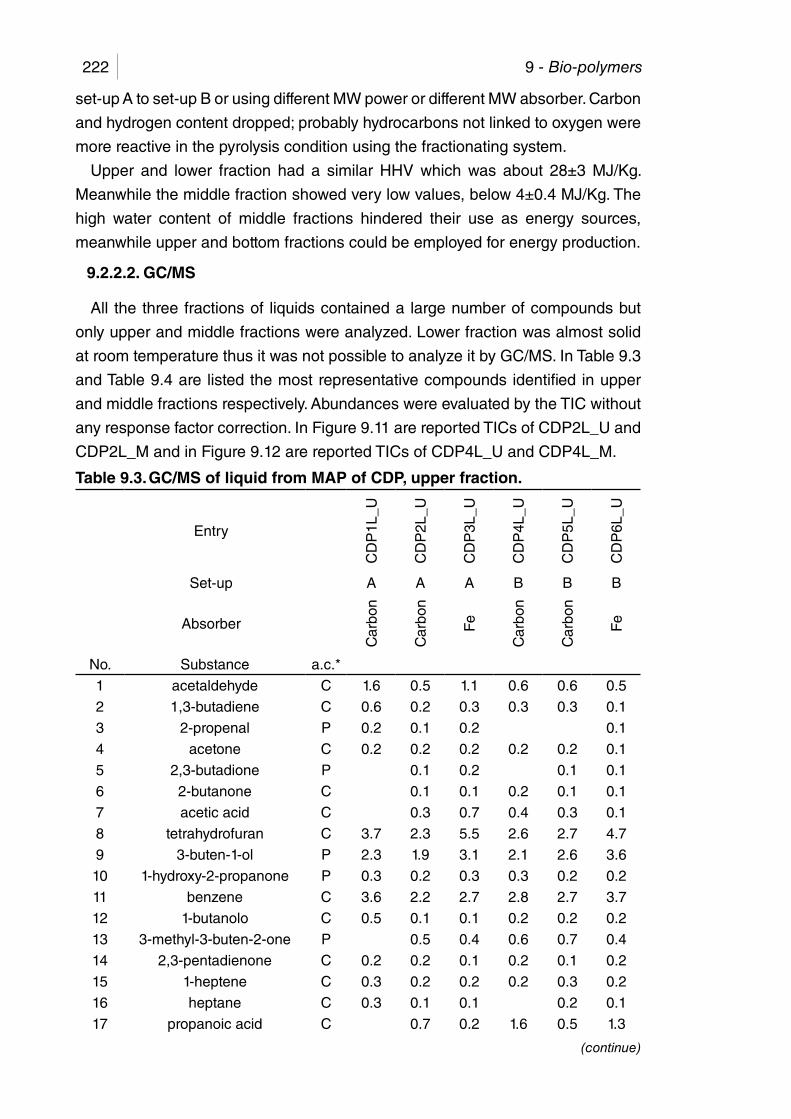
9 - Bio-polymers222
set-up A to set-up B or using different MW power or different MW absorber. Carbon
and hydrogen content dropped; probably hydrocarbons not linked to oxygen were
more reactive in the pyrolysis condition using the fractionating system.
Upper and lower fraction had a similar HHV which was about 28±3 MJ/Kg.
Meanwhile the middle fraction showed very low values, below 4±0.4 MJ/Kg. The
high water content of middle fractions hindered their use as energy sources,
meanwhile upper and bottom fractions could be employed for energy production.
9.2.2.2. GC/MS
All the three fractions of liquids contained a large number of compounds but
only upper and middle fractions were analyzed. Lower fraction was almost solid
at room temperature thus it was not possible to analyze it by GC/MS. In Table 9.3
and Table 9.4 are listed the most representative compounds identified in upper
and middle fractions respectively. Abundances were evaluated by the TIC without
any response factor correction. In Figure 9.11 are reported TICs of CDP2L_U and
CDP2L_M and in Figure 9.12 are reported TICs of CDP4L_U and CDP4L_M.
Table 9.3. GC/MS of liquid from MAP of CDP, upper fraction.
Entry
CD
P1L
_U
CD
P2L
_U
CD
P3L
_U
CD
P4L
_U
CD
P5L
_U
CD
P6L
_U
Set-up A A A B B B
Absorber
Car
bon
Car
bon
Fe
Car
bon
Car
bon
Fe
No. Substance a.c.*
1 acetaldehyde C 1.6 0.5 1.1 0.6 0.6 0.5
2 1,3-butadiene C 0.6 0.2 0.3 0.3 0.3 0.1
3 2-propenal P 0.2 0.1 0.2 0.1
4 acetone C 0.2 0.2 0.2 0.2 0.2 0.1
5 2,3-butadione P 0.1 0.2 0.1 0.1
6 2-butanone C 0.1 0.1 0.2 0.1 0.1
7 acetic acid C 0.3 0.7 0.4 0.3 0.1
8 tetrahydrofuran C 3.7 2.3 5.5 2.6 2.7 4.7
9 3-buten-1-ol P 2.3 1.9 3.1 2.1 2.6 3.6
10 1-hydroxy-2-propanone P 0.3 0.2 0.3 0.3 0.2 0.2
11 benzene C 3.6 2.2 2.7 2.8 2.7 3.7
12 1-butanolo C 0.5 0.1 0.1 0.2 0.2 0.2
13 3-methyl-3-buten-2-one P 0.5 0.4 0.6 0.7 0.4
14 2,3-pentadienone C 0.2 0.2 0.1 0.2 0.1 0.2
15 1-heptene C 0.3 0.2 0.2 0.2 0.3 0.2
16 heptane C 0.3 0.1 0.1 0.2 0.1
17 propanoic acid C 0.7 0.2 1.6 0.5 1.3
(continue)

9 - Bio-polymers 223
18 toluene C 1.2 1.1 0.9 1.5 1.6 2.0
19 2-methylene-butanal P 5.0 3.0 3.8 4.0 4.0 7.2
20 3-hepten-1-ol acetate P 0.3 0.2 0.0 0.4 0.3 0.6
21 1-octene C 0.2 0.0 0.3 0.4 0.3
22 octane C 0.6 0.0 0.6 0.7 0.8
23 furfural C 0.4 0.2 0.4 0.3 0.2 0.3
24 4-ethenyl-cyclohexene P 0.3 0.3 0.0 0.3 0.4 0.2
25 ethylbenzene C 0.4 0.4 0.2 0.5 0.6 0.5
26 2-Propenoic acid, 1,4-butanediyl ester
P0.2 0.0 0.2 0.2 0.4
27 1,4-dimethylbenzene C 0.3 0.3 0.2 0.4 0.5 0.4
28 cyclohexanone U 0.5 0.2 0.2 0.2
29 1-penten-1-ol P 0.2 0.3 0.3 0.3 0.7
30 styrene C 0.9 1.0 1.1 1.6 1.2 1.8
31 5-methyl-1,3,5-heptatriene
U0.2 0.1 0.2 0.2 0.2
32 1.2-dimethylbenzene C 0.4 0.1 0.5 0.5 0.5
33 pentanoic acid C 0.2 0.2 0.3
34 1-nonene C 0.1 0.0 0.4 0.2 0.2
35 3-methylcyclopentanone U 0.2 0.1 0.3 0.2
36 nonane C 0.1 0.1 0.2 0.2 0.1
37 2-methyl-2-pentanone P 0.1 0.1 0.3 0.3 0.3
38 5-methyl-2-furancarboxaldehyde
U0.6 0.6 0.5 0.9 0.8 1.2
39 benzaldeyhde C 0.4 0.5 0.4 0.6 0.5 1.0
40 propylbenzene P 0.4 0.2 0.1 0.3 0.3 0.4
41 1,2,3-trimethylbenzene C 0.1 0.1 0.2 0.2 0.2
42 hexanoic acid P 0.3 0.5 0.2 0.5 0.5 0.6
43 butanoic acid, 2-hexenyl ester
U0.1 0.1 0.4 0.3 0.3
44 2-nornarbonone U 0.4 0.0 0.3 0.4 0.5
45 a-methylstyrene C 0.3 0.2 0.1 0.5 0.4 0.4
46 2-Buten-1-ol, formate U 0.2 0.3 0.3 0.4 0.6
47 1-decene C 0.1 0.2 0.2 0.3
48 Bicyclo[2.2.1]hept-5-ene-2-carboxaldehyde
P0.2 0.1 0.3 0.3 0.1
49 3-methyl-1,2-cyclopentadienone
P0.3 0.4 0.4 0.4 0.6
50 1-ethenyl-2-methylbenzene
U0.2 0.0 0.3 0.3 0.2
51 2-methylphenol P 0.2 0.1 0.2 0.2 0.1
52 indene C 0.2 0.0 0.4 0.3 0.2
53 acetophenone P 0.4 0.6 0.5 0.8 0.7 1.2
54 1-methylpropylbenzene P 0.3 0.1 0.3 0.2 0.3
55 butylbenzene P 0.4 0.1 0.0 0.2 0.2 0.1
(continue)
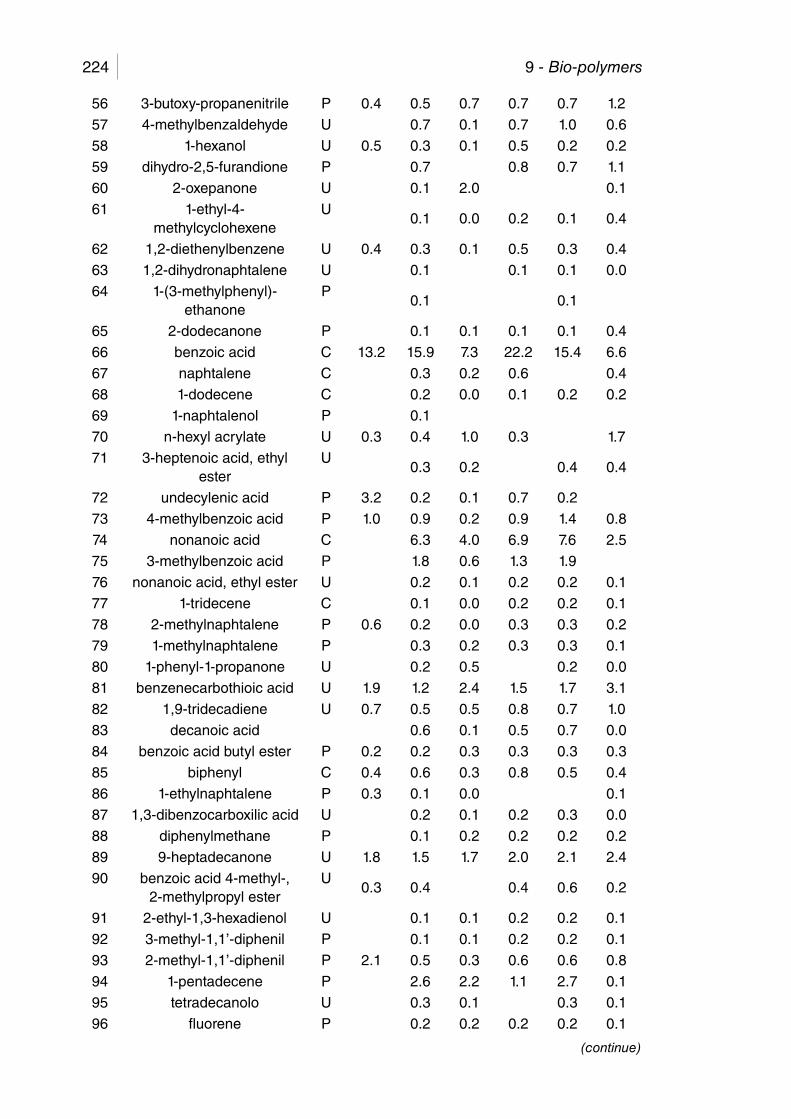
9 - Bio-polymers224
56 3-butoxy-propanenitrile P 0.4 0.5 0.7 0.7 0.7 1.2
57 4-methylbenzaldehyde U 0.7 0.1 0.7 1.0 0.6
58 1-hexanol U 0.5 0.3 0.1 0.5 0.2 0.2
59 dihydro-2,5-furandione P 0.7 0.8 0.7 1.1
60 2-oxepanone U 0.1 2.0 0.1
61 1-ethyl-4-methylcyclohexene
U0.1 0.0 0.2 0.1 0.4
62 1,2-diethenylbenzene U 0.4 0.3 0.1 0.5 0.3 0.4
63 1,2-dihydronaphtalene U 0.1 0.1 0.1 0.0
64 1-(3-methylphenyl)-ethanone
P0.1 0.1
65 2-dodecanone P 0.1 0.1 0.1 0.1 0.4
66 benzoic acid C 13.2 15.9 7.3 22.2 15.4 6.6
67 naphtalene C 0.3 0.2 0.6 0.4
68 1-dodecene C 0.2 0.0 0.1 0.2 0.2
69 1-naphtalenol P 0.1
70 n-hexyl acrylate U 0.3 0.4 1.0 0.3 1.7
71 3-heptenoic acid, ethyl ester
U0.3 0.2 0.4 0.4
72 undecylenic acid P 3.2 0.2 0.1 0.7 0.2
73 4-methylbenzoic acid P 1.0 0.9 0.2 0.9 1.4 0.8
74 nonanoic acid C 6.3 4.0 6.9 7.6 2.5
75 3-methylbenzoic acid P 1.8 0.6 1.3 1.9
76 nonanoic acid, ethyl ester U 0.2 0.1 0.2 0.2 0.1
77 1-tridecene C 0.1 0.0 0.2 0.2 0.1
78 2-methylnaphtalene P 0.6 0.2 0.0 0.3 0.3 0.2
79 1-methylnaphtalene P 0.3 0.2 0.3 0.3 0.1
80 1-phenyl-1-propanone U 0.2 0.5 0.2 0.0
81 benzenecarbothioic acid U 1.9 1.2 2.4 1.5 1.7 3.1
82 1,9-tridecadiene U 0.7 0.5 0.5 0.8 0.7 1.0
83 decanoic acid 0.6 0.1 0.5 0.7 0.0
84 benzoic acid butyl ester P 0.2 0.2 0.3 0.3 0.3 0.3
85 biphenyl C 0.4 0.6 0.3 0.8 0.5 0.4
86 1-ethylnaphtalene P 0.3 0.1 0.0 0.1
87 1,3-dibenzocarboxilic acid U 0.2 0.1 0.2 0.3 0.0
88 diphenylmethane P 0.1 0.2 0.2 0.2 0.2
89 9-heptadecanone U 1.8 1.5 1.7 2.0 2.1 2.4
90 benzoic acid 4-methyl-, 2-methylpropyl ester
U0.3 0.4 0.4 0.6 0.2
91 2-ethyl-1,3-hexadienol U 0.1 0.1 0.2 0.2 0.1
92 3-methyl-1,1’-diphenil P 0.1 0.1 0.2 0.2 0.1
93 2-methyl-1,1’-diphenil P 2.1 0.5 0.3 0.6 0.6 0.8
94 1-pentadecene P 2.6 2.2 1.1 2.7 0.1
95 tetradecanolo U 0.3 0.1 0.3 0.1
96 fluorene P 0.2 0.2 0.2 0.2 0.1
(continue)

9 - Bio-polymers 225
97 benzophenone C 0.2 0.4 0.3 0.2 0.1
98 11-hexadecenoic acid U 0.2 0.1 0.2 0.2
99 unknown acrylate U 2.2 1.1 1.1 1.8 1.8 0.9
100 dodecandioic acid U 0.7 5.5 5.6 0.1
101 1-phenyl-1-decanone P 0.1 0.2 0.1
102 dibuthylphtalate P 10.8 7.0 8.0 2.6 3.3 2.3
103 1,2-benzenedicarboxylic acid,monobuthyl ester
U0.7 0.2 0.2 0.4 0.3
104 9-methylantracene P 0.1 0.6 0.0
105 dodecyl acrylate U 7.3 6.8 6.4 2.2 2.7 2.5
106 hexadecanoic acid P 0.2 0.3 0.2 0.2 0.1
107 11-hptadecenoic acid U 3.9 2.2 0.4 1.5 2.3 1.9
108 2-phenilnaphtalene P 0.1 2.5 0.1
109 1,2-benzenedicarboxylic acid, buthyl octyl ester
P0.4 0.4 4.6 0.2 0.3 0.3
110 2-propenoic acid, 1,4-butanediyl ester
U1.6 2.3 3.0
TOTAL Aldehyde 7.1 4.9 5.7 6.1 6.4 9.4
TOTAL Ketones 3.1 5.2 5.0 5.4 6.0 6.7
TOTAL Acids 24.2 36.7 22.3 38.6 33.1 17.4
TOTAL Esters 22.4 18.3 24.1 11.7 14.3 14.9
TOTAL Ethers 4.1 2.8 6.2 3.3 3.4 5.9
TOTAL Alcohols 3.3 3.3 3.9 3.4 4.0 5.0
TOTAL Aliphatic 2.2 5.7 3.7 5.0 7.1 4.2
TOTAL Aromatics, not reported in previous classes
11.3 9.6 10.3 13.1 11.3 13.3
TOTAL Mixed 1.3 1.0 1.2 1.6 1.2 1.7
TOTAL 78.9 87.3 82.3 88.2 86.7 78.5
*a.c.: attribution confidence; C, certain (>98%); P, probable (86-97%); U, uncertain (<85%).
Table 9.4. GC/MS of liquid from MAP of CDP, medium fraction.
Entry
CD
P1L
_M
CD
P2L
_M
CD
P3L
_M
CD
P4L
_M
CD
P5L
_M
CD
P6L
_M
Set-up A A A B B B
Absorber
Car
bon
Car
bon
Fe
Car
bon
Car
bon
Fe
No. Substance a.c.a
1 acetaldehyde C 8.7 5.0 2.2 4.5 4.9 4.0
2 ethanol C 0.4 0.6 0.1 0.6 0.5 0.2
3 2-propenal C 0.2 0.4 0.1 0.4 0.5 0.3
4 acetone C 1.2 1.6 0.2 0.9 1.1 0.5
5 acetic acid ethenyl ester P 1.8 0.7 0.1 0.5 0.1
(continue)

9 - Bio-polymers226
6 formic acid C 0.6 0.4 0.1 0.6 0.4
7 2,3-butadione P 0.8 0.7 0.2 0.8 0.7 0.6
8 2-butanone C 0.4 0.2 0.3 0.2
9 acetic acid C 7.6 12.4 4.9 18.5 22.2 13.2
10 THF C 4.3 4.2 3.4 4.5 4.7 6.4
11 3-buten-1-ol P 4.0 4.8 2.2 4.0 6.9 9.3
12 1-hydroxy-2-propanone P 0.5 2.5 1.1 3.6 2.7 2.4
13 3-methyl-3-buten-2-one C 0.5 0.3 0.1 0.4 0.5 0.3
14 2,3-pentadienone P 0.4 0.3 0.1 0.3 0.3 0.2
152-methoxy-ethanol
acetateU 0.3 0.2 0.3 0.1
16 2-propenoic acid P 3.4 3.2 1.3 6.8 4.1 4.3
17 cyclopentanone C 8.0 5.2 3.0 7.5 8.0 14.4
18 2-methyl propanoic acid P 0.1 0.3 0.1 0.3
19 2-cyclopenten-1-one P 0.8 0.5 0.2 1.0 0.8 1.1
20 furfural P 0.3 0.3 0.1 0.6 0.5 0.4
21 1-acetyloxy-2-propanone P 0.4 0.4 0.2 0.7 0.4 0.8
22 butyrolactone P 0.1 1.1 0.2 0.5 0.3
23 propylene glycol P 6.6 8.1 8.0 9.2 13.0 8.4
24 pentanoic acid P 0.3 0.5
251-methyl-2-cyclopenten-
1-oneP 0.2 0.2 0.8 0.4
26 2,5-hexadienone P 0.2 0.2 0.3 0.4 0.4
27 cyclohexanone U 0.5 0.5 0.2 1.2 0.7 0.8
28 2,4-pentadienone U 0.2 0.3 0.2 0.5 0.4 0.4
29 4-methyl-5H-furan-2-one P 0.3 0.4 0.4 0.7 0.8 1.1
30 benzoic acid P 7.2 4.3 1.1 10.2 0.9
31 heptanal P 1.0 2.8 3.8 1.1
32 4-cyclopenten-1,3-diol U 0.5 0.2 0.1 0.4 0.8
33 5-nonanol U 0.1 0.5 0.3 0.8 0.3 0.3
345-hydroxymethyl-
furancarboxylaldheydeP 0.3 0.2 0.7 0.4 0.2
352-hydroxy-propionic acid
ethyl esterU 3.5 3.3 5.6 2.5 5.8 7.9
36 1,4-butandiol diacetate U 0.1 0.5 0.3 0.5
37 3-hepten-1-ol U 0.1 3.3 0.1
381,4-butanediyl ester-2-
propenoic acidU 0.4 8.6 0.1
391-butanediyl-4-propyl
ester, 2-propenoic acidU 8.6 0.1
40 hexadienoic acid U 3.8 6.3 2.5 1.5 4.8
41 Levoglucosan C 11.5 3.8 22.1 1.7 5.8
424-pentanoic acid ethyl
esterU 0.5 0.4 0.4 0.3 0.2
43 4-butoxy-1-butanol U 0.8 0.3 0.5 0.2 0.3
(continue)

9 - Bio-polymers 227
441,2-benzenedicarboxylic acid, buthyl octyl ester
P 22.0 0.2
TOTAL Aldehyde 8.9 5.4 3.2 7.7 9.1 5.3
TOTAL Ketones 12.9 10.1 4.3 13.9 13.1 19.0
TOTAL Acids 22.6 27.1 9.8 37.6 31.9 18.7
TOTAL Esters 3.2 20.3 23.4 1.7 1.6 1.9
TOTAL Ethers 4.3 4.2 3.4 4.5 4.7 6.4
TOTAL Alcohols 11.7 17.4 10.8 14.6 21.1 18.9
TOTAL Mixed 17.2 11.1 29.8 10.0 10.0 17.8
TOTAL 80.8 95.6 84.7 90.0 91.6 88.1
*a.c.: attribution confidence; C, certain (>98%); P, probable (86-97%); U, uncertain (<85%).
Figure 9.11. TIC of samples obtained from MAP of PLA with set-up A: a) CDP2L_U; b) CDP2L_M.
Figure 9.12. TIC of samples obtained from MAP of PLA with set-up B: a) CDP4L_U; b) CDP4L_M..
Most of the compounds identified were present in both upper and middle
fractions except for non-oxygenated aromatics which were concentrated in the
upper fraction.
Single ring aromatics (benzene, toluene, xylenes, and styrene) were identified
together with indene, naphthalene, and their methyl derivatives. Large presence
of aromatics, oxygenated or not, was attributed to pyrolysis of plasticizers. In
point of fact several phthalates species were also found in both phases such as
1,2-benzenedicarboxylic acid, butyl octyl ester, also known as Plasticizer BOP, or
1,2-benzenedicarboxylic acid, monobutyl ester. Only CDP3L_U and CDP3L_M

9 - Bio-polymers228
showed an extremely large amount of phthalates (22.0 % of 1,2-benzenedicarboxylic
acid, butyl octyl ester CDP3L_M), probably Fe (the MW absorber) promoted a fast
pyrolysis together with a transportation of compounds which were usually further
pyrolyzed in other reaction condition. Indeed in CDP3L_M the largest amount of
Levoglucosan (22.1 %) was found suggesting a low efficiency of pyrolysis.20-23
Also some acids were present and they might be correlated to plasticizer pyrolysis
such as propionic, pentanoic, hexanoic, and benzoic acids. Actually the latter was
observed in larger amount (up to 22.2 % in CDP4L_UP) when carbon was the
MW absorber suggesting a higher efficiency in pyrolysis for carbon.
Nevertheless acetic acid was probably formed from pyrolysis of polysaccharide
as well as Levoglucosan, acetone, and furan derivatives.24-26
The pyrolysis efficiency was increased using carbon and the fractionating system,
as supported by the increasing amount of lower molecular weight compounds
in the middle fraction, such as: acetic acid, 3-buten-1-ol, cyclopentanone, and
propylene glycol.
9.2.2.3. FTIR
In Figure 9.13 are reported the FTIR spectra of liquids collected from MAP of
CDP. A detailed description of absorption present in each series of liquid fractions
is reported in Table 9.5, Table 9.6, and Table 9.7.
Figure 9.13. FTIR spectra of: a) CDPL1_U; b) CDPL1_M; c) CDP1L_M water subtracted; d) CDP1L_L.
All spectra from the three phases of the same fraction could be perfectly
overlapped, and only one of them is reported. Upper fractions showed a broad
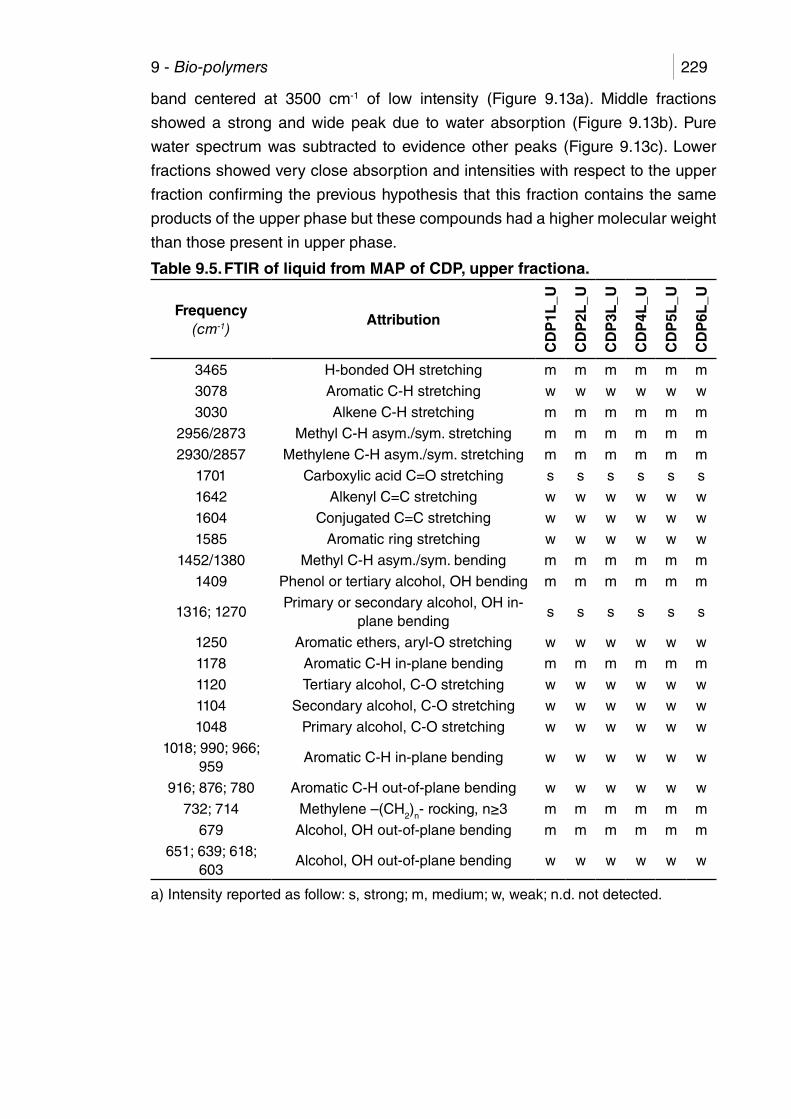
9 - Bio-polymers 229
band centered at 3500 cm-1 of low intensity (Figure 9.13a). Middle fractions
showed a strong and wide peak due to water absorption (Figure 9.13b). Pure
water spectrum was subtracted to evidence other peaks (Figure 9.13c). Lower
fractions showed very close absorption and intensities with respect to the upper
fraction confirming the previous hypothesis that this fraction contains the same
products of the upper phase but these compounds had a higher molecular weight
than those present in upper phase.
Table 9.5. FTIR of liquid from MAP of CDP, upper fractiona.
Frequency (cm-1)
Attribution
CD
P1L
_U
CD
P2L
_U
CD
P3L
_U
CD
P4L
_U
CD
P5L
_U
CD
P6L
_U
3465 H-bonded OH stretching m m m m m m
3078 Aromatic C-H stretching w w w w w w
3030 Alkene C-H stretching m m m m m m
2956/2873 Methyl C-H asym./sym. stretching m m m m m m
2930/2857 Methylene C-H asym./sym. stretching m m m m m m
1701 Carboxylic acid C=O stretching s s s s s s
1642 Alkenyl C=C stretching w w w w w w
1604 Conjugated C=C stretching w w w w w w
1585 Aromatic ring stretching w w w w w w
1452/1380 Methyl C-H asym./sym. bending m m m m m m
1409 Phenol or tertiary alcohol, OH bending m m m m m m
1316; 1270Primary or secondary alcohol, OH in-
plane bendings s s s s s
1250 Aromatic ethers, aryl-O stretching w w w w w w
1178 Aromatic C-H in-plane bending m m m m m m
1120 Tertiary alcohol, C-O stretching w w w w w w
1104 Secondary alcohol, C-O stretching w w w w w w
1048 Primary alcohol, C-O stretching w w w w w w
1018; 990; 966; 959
Aromatic C-H in-plane bending w w w w w w
916; 876; 780 Aromatic C-H out-of-plane bending w w w w w w
732; 714 Methylene –(CH2)n- rocking, n≥3 m m m m m m
679 Alcohol, OH out-of-plane bending m m m m m m
651; 639; 618; 603
Alcohol, OH out-of-plane bending w w w w w w
a) Intensity reported as follow: s, strong; m, medium; w, weak; n.d. not detected.

9 - Bio-polymers230
Table 9.6. FTIR of liquid from MAP of CDP, middle fractiona.
Frequency (cm-1)
Attribution
CD
P1L
_M
CD
P2L
_M
CD
P3L
_M
CD
P4L
_M
CD
P5L
_M
CD
P6L
_M
3441 H-bonded OH stretching s s s s s s
2985/2895 Methyl C-H asym./sym. stretching m m m m m m
2940/2865 Methylene C-H asym./sym. stretching m m m m m m
1714 Ketones and carboxylic acid s s s s s s
1653 Conjugated ketones w w w w w w
1453/1363 Methyl C-H asym./sym. bending w w w w w w
1407 Tertiary alcohol, OH bending m m m m m m
1275Primary or secondary alcohol, OH in-
plane bendingm m m m m m
1095 Secondary alcohol, C-O stretching m m m m m m
1050 Primary alcohol, C-O stretching m m m m m m
694 Alcohol, OH out-of-plane bending m m m m m m
651; 639; 618; 603
Alcohol, OH out-of-plane bending w w w w w w
a) Intensity reported as follow: s, strong; m, medium; w, weak; n.d. not detected.
Table 9.7. FTIR of liquid from MAP of CDP, bottom fractiona.
Frequency (cm-1)
Attribution
CD
P1L
_L
CD
P2L
_L
CD
P3L
_L
CD
P4L
_L
CD
P5L
_L
CD
P6L
_L3465 H-bonded OH stretching m m m m m m
3078 Aromatic C-H stretching w w w w w w
3030 Alkene C-H stretching m m m m m m
2956/2873 Methyl C-H asym./sym. stretching m m m m m m
2930/2857 Methylene C-H asym./sym. stretching m m m m m m
1701 Carboxylic acid C=O stretching s s s s s s
1642 Alkenyl C=C stretching w w w w w w
1604 Conjugated C=C stretching w w w w w w
1585 Aromatic ring stretching w w w w w w
1452/1380 Methyl C-H asym./sym. bending m m m m m m
1409 Phenol or tertiary alcohol, OH bending m m m m m m
1316; 1270 Primary or secondary alcohol, OH in-plane bending
s s s s s s
1250 Aromatic ethers, aryl-O stretching w w w w w w
1178 Aromatic C-H in-plane bending m m m m m m
1120 Tertiary alcohol, C-O stretching w w w w w w
1104 Secondary alcohol, C-O stretching w w w w w w
1048 Primary alcohol, C-O stretching w w w w w w
1018; 990; 966; 959
Aromatic C-H in-plane bendingw w w w w w
(continue)
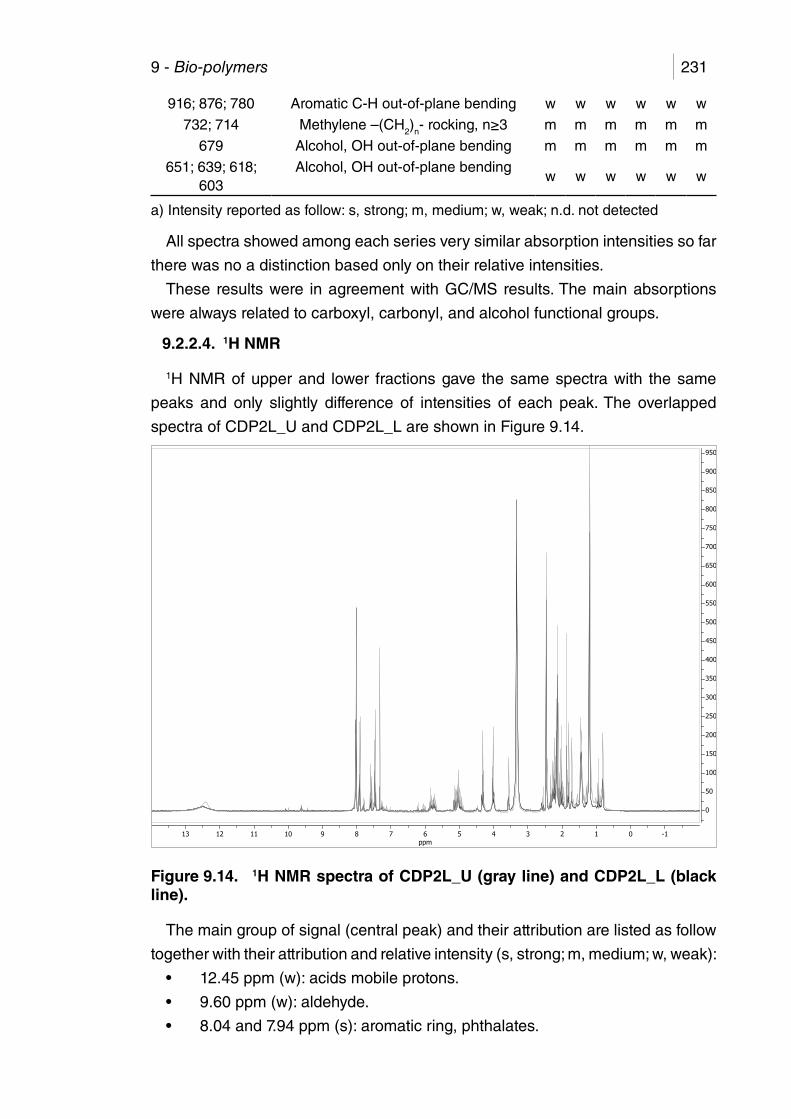
9 - Bio-polymers 231
916; 876; 780 Aromatic C-H out-of-plane bending w w w w w w
732; 714 Methylene –(CH2)n- rocking, n≥3 m m m m m m
679 Alcohol, OH out-of-plane bending m m m m m m
651; 639; 618; 603
Alcohol, OH out-of-plane bendingw w w w w w
a) Intensity reported as follow: s, strong; m, medium; w, weak; n.d. not detected
All spectra showed among each series very similar absorption intensities so far
there was no a distinction based only on their relative intensities.
These results were in agreement with GC/MS results. The main absorptions
were always related to carboxyl, carbonyl, and alcohol functional groups.
9.2.2.4. 1H NMR
1H NMR of upper and lower fractions gave the same spectra with the same
peaks and only slightly difference of intensities of each peak. The overlapped
spectra of CDP2L_U and CDP2L_L are shown in Figure 9.14.
-1012345678910111213ppm
0
50
100
150
200
250
300
350
400
450
500
550
600
650
700
750
800
850
900
950
Figure 9.14. 1H NMR spectra of CDP2L_U (gray line) and CDP2L_L (black line).
The main group of signal (central peak) and their attribution are listed as follow
together with their attribution and relative intensity (s, strong; m, medium; w, weak):
• 12.45ppm(w):acidsmobileprotons.
• 9.60ppm(w):aldehyde.
• 8.04and7.94ppm(s):aromaticring,phthalates.

9 - Bio-polymers232
• 7.60,7.40,and7.35ppm(m):aromaticring.
• 5.80ppm(w):phenolicOH.
• 5.00(w),4.30(m),and4.00ppm(m):CH2-OOC; or ring-join methylene,
Ar-CH2-Ar
• 3.58ppm(m):CH2-O-C.
• 3.34ppm(s):water
• 2.20–2.40(m)and2.10ppm(s):CH3, CH2, and CH on aromatic ring.
• 1.80, 1.74, and 1.46 (w), 1.89 (m), and 1.20 ppm (s): CH2, CH3 of alkyl
groups, CH3 in β position and CH2 and CH in g position to an aromatic ring
or ethereal oxygen.
• 0.96and0.80ppm(w):CH3 of alkyl groups or in g position or further of an
alkyl chain linked to an aromatic ring.
These data were in agreement with both GC/MS and IR analyses confirming
the close nature of upper and lower fractions and the wide presence of phthalates
and their derivatives.1H NMR of middle fractions were overwhelmed by the peak of water, however
some other absorption were present. The spectra of CDP2L_M is shown in Figure
9.15.
-1012345678910111213ppm
0
20
40
60
80
100
120
140
160
180
200
220
240
260
280
300
320
340
360
380
400
Figure 9.15. 1H NMR spectra of CDP2L_M.
The main group of peaks (central peak) and their attribution are listed together
with their attribution and relative intensity (s, strong; m, medium; w, weak):

9 - Bio-polymers 233
• 9.60ppm(m):aldehyde.
• 8.10(w):aromaticring,phthalates.
• 6.20(w),5.85(w),5.10ppm(w):furanandphenolicOH.
• 4.79(w)and4.57ppm(m):
• 4.00ppm(m):esters.
• 2.10ppm(m):alkylgroupinβ position to an aldehyde.
• 1.46,1.89,and1.20ppm(s):CH2, CH3 of alkyl groups, CH3 in β position
and CH2 and CH in g position to an aromatic ring or ethereal oxygen.
• 0.96ppm(s):CH3 of alkyl groups or in g position or further of an alkyl chain
linked to an aromatic ring.
The peaks reported for middle fractions were close to these present in both
upper and lower fractions even with strong differences in intensities. Especially in
the range of δ 1.5 - 3.0 ppm the difference were stronger. Middle fractions, rich in
water, was able to dissolve alkyl compounds in low extent.
9.2.3. Main achievements
Microwave assisted pyrolysis (MAP) of corn derived plastic bags (CDP) was
performed using different MW absorbers (carbon or Fe), apparatus set-up, and
MW power, obtaining a liquid and large amount of gas accordingly to the pyrolysis
conditions. The main achievements might be summarized in the following key
points.
The liquid after spinning was separated in three phases, upper, medium, and
lower. Medium fractions were mainly composed of water (70 wt%), acids, alcohols,
and anydrosugars and their pyrolysis products. Upper and lower fractions showed
close properties and composition except that the lower fraction was a wax. Indeed
the lower fraction was composed of oligomers and the upper phase was composed
of the pyrolyzed form of these oligomers. The upper fractions contained large
amount of aromatic acid and phthalates and their derivatives. Lower fraction was
reduced working with set-up B together with an increasing of solid yield.
MAP of CDP might be performed to convert a material intended for compost
porpouse into a source of chemicals or even fuel from the upper and lower phases.

9 - Bio-polymers234
Reference
1. Bolm, C.; Legros, J.; Le Paih, J.; Zani, L. Iron-Catalyzed Reactions in Organic Synthesis. Chemical Reviews 2004, 104, 6217-6254.2. Dongol, K. G.; Koh, H.; Sau, M.; Chai, C. L. L. Iron-Catalysed sp3–sp3 Cross-Coupling Reactions of Unactivated Alkyl Halides with Alkyl Grignard Reagents. Advanced Synthesis & Catalysis 2007, 349, 1015-1018.3. Hayashi, Y.; Shinokubo, H.; Oshima, K. Intramolecular Radical Cyclization of 2-Haloethanal Allyl Acetal and Allyl 2-Halophenyl Ether with a Grignard Reagent in the Presence of Iron(II) Chloride. Tetrahedron Letters 1998, 39, 63-66.4. Yoo, D.; Kim, D.; Lee, D. Synthesis of lactide from oligomeric PLA: Effects of temperature, pressure, and catalyst. Macromol. Res. 2006, 14, 510-516.5. Yoo, D.-K.; Kim, D. Production of optically pure poly(lactic acid) from lactic acid. Polym. Bull. 2009, 63, 637-651.6. Poly(Lactic Acid): Synthesis, Structures, Properties, Processing, and Applications; John Wiley & Sons, Inc.: Canada, 2010.7. Kopinke, F.-D.; Remmler, M.; Mackenzie, K.; Milder, M.; Wachsen. Thermal decomposition of biodegradable polyesters -II. Poly(lactic acid). Polym. Degrad. Stabil. 1996, 53, 329-342.8. Mori, T.; Nishida, H.; Shirai, Y.; Endo, T. Effects of chain end structures on pyrolysis of poly(L-lactic acid) containing tin atoms. Polym. Degrad. Stabil. 2004, 84, 243-251.9. Nishida, H.; Mori, T.; Hoshihara, S.; Fan, Y.; Shirai, Y.; Endo, T. Effect of tin on poly(l-lactic acid) pyrolysis. Polym. Degrad. Stabil. 2003, 81, 515-523.10. Fan, Y.; Nishida, H.; Mori, T.; Shirai, Y.; Endo, T. Thermal degradation of poly(l-lactide): effect of alkali earth metal oxides for selective l,l-lactide formation. Polymer 2004, 45, 1197-1205.11. Fan, Y.; Nishida, H.; Shirai, Y.; Endo, T. Racemization on thermal degradation of poly(l-lactide) with calcium salt end structure. Polym. Degrad. Stabil. 2003, 80, 503-511.12. Fan, Y.; Nishida, H.; Hoshihara, S.; Shirai, Y.; Tokiwa, Y.; Endo, T. Pyrolysis kinetics of poly(l-lactide) with carboxyl and calcium salt end structures. Polym. Degrad. Stabil. 2003, 79, 547-562.13. Kopinke, F.-D.; Mackenzie, K. Mechanistic aspects of the thermal degradation of poly(lactic acid) and poly(β-hydroxybutyric acid). J. Anal. Appl. Pyrol. 1997, 40-41, 43-53.14. Undri, A.; Rosi, L.; Frediani, M.; Frediani, P. Upgraded Fuel from Microwave Assisted Pyrolysis of Waste Tire. Fuel 2014, 115, 600-608.15. Undri, A.; Meini, S.; Rosi, L.; Frediani, M.; Frediani, P. Microwave Pyrolysis of Polymeric Materials: Waste Tires Treatment and Characterization of the Value-Added Products. J. Anal. Appl. Pyrol. 2013, 103, 149-158.16. Undri, A.; Rosi, L.; Frediani, M.; Frediani, P. Efficient Disposal of Waste Polyolefins through Microwave Assisted Pyrolysis. Fuel 2013, 116, 662-671.17. Undri, A.; Rosi, L.; Frediani, M.; Frediani, P. Reverse Polymerization of Waste Polystyrene through Microwave Assisted Pyrolysis. J. Anal. Appl. Pyrol. 2013, http://dx.doi.org/doi:10.1016/j.jaap.2013.10.001.18. Frediani, P.; Rosi, L.; Frediani, M.; Undri, A.; Occhialini, S.; Meini, S. Production Of Hydrocarbons From Pyrolysis of Tyres WO2012110991.19. Frediani, P.; Rosi, L.; Frediani, M.; Undri, A.; Occhialini, S. Production of Hydrocarbons from Copyrolysis of Plastic and Tyre Material with Microwave

9 - Bio-polymers 235
Heating WO2012110990.20. Miura, M.; Kaga, H.; Yoshida, T.; Ando, K. Microwave pyrolysis of cellulosic materials for the production of anhydrosugars. J. Wood Sci. 2001, 47, 502-506.21. Lin, Y.-C.; Cho, J.; Tompsett, G. A.; Westmoreland, P. R.; Huber, G. W. Kinetics and Mechanism of Cellulose Pyrolysis. J. Phys. Chem. C 2009, 113, 20097-20107.22. Ronsse, F.; Bai, X.; Prins, W.; Brown, R. C. Secondary reactions of levoglucosan and char in the fast pyrolysis of cellulose. Environ. Prog. Sustain. Energy 2012, 31, 256-260.23. Zhang, X.; Yang, W.; Blasiak, W. Kinetics of levoglucosan and formaldehyde formation during cellulose pyrolysis process. Fuel 2012, 96, 383-391.24. Patwardhan, P. R.; Satrio, J. A.; Brown, R. C.; Shanks, B. H. Product distribution from fast pyrolysis of glucose-based carbohydrates. J. Anal. Appl. Pyrol. 2009, 86, 323-330.25. Yang, Z.; Liu, X.; Yang, Z.; Zhuang, G.; Bai, Z.; Zhang, H.; Guo, Y. Preparation and formation mechanism of levoglucosan from starch using a tubular furnace pyrolysis reactor. J. Anal. Appl. Pyrol. 2013, 102, 83-88.26. Gómez-Martínez, D.; Barneto, A. G.; Martínez, I.; Partal, P. Modelling of pyrolysis and combustion of gluten–glycerol-based bioplastics. Bioresour. Technol. 2011, 102, 6246-6253.

Conclusion
Microwave assisted pyrolysis (MAP) was exploited to convert several classes of
waste polymers into a solid, a liquid, and a gas product with promising application
as sources of chemicals, energy, and power production. The polymeric material
tested were: tires, high density poly(ethylene) (HDPE), poly(propylene) (PP),
poly(styrene) (PS), multilayer packaging beverage (WMP), wood pellets (WP),
poly(lactic acid) (PLA), and corn-derived plastic bags (CDP).
Pyrolysis experiments were carried out in a batch laboratory scale reactor, using
a microwave (MW) oven operating at 2.45 GHz, an energy output up to 6KW (set-
up A), and for some pyrolysis a fractionating system, directly connected to the
pyrolysis oven (set-up B). The presence of a fractionating system minimized the
influence of different MW powers enhancing the residence time of the high boiling
substances avoiding their stripping from the reactor and usually improving the
quality of the liquid product. Pyrolysis were performed in an anoxic atmosphere
without any carrier gas, avoiding mass transportation phenomena and increasing
the residence time of the gas inside the oven. Furthermore the gas fraction was
not diluted by the carrier.
MAP of different waste plastics might be transformed in a gas, a liquid, a solid.
The gas fraction was usually constituted by H2, CO, CO2 (in some cases) and
C1-C4 hydrocarbons. It might be used as energy source. The liquid was mainly
constituted by hydrocarbons which might be used as source of chemicals or as
a fuel. Finally the solid contained large amount of carbon and might be source
of energy or after further transformation as carbon black for tire production or as
activated carbon.
MAP of tire might be run without the addition of a MW absorber. The liquid
showed a reduced density (from 0.92 to 0.88 g/cm3), and viscosity (from 3.92
to 1.25 cP) when working with the fractionating system. Furthermore aromatic
and olefinic compounds were formed in high amount. Different tire affected the
MAP results: Tires containing a large amount of aromatics (styrene copolymers)
were pyrolyzed faster than those containing large amount of natural rubber. X-ray
diffraction of solid from MAP of tire showed two different crystalline forms of ZnS,
spharelite or wurtzite due to the different reaction conditions. Their presence

10 - Conclusion238
suggested that tires were heated to a temperature higher than the usually
accounted, over 1273 K, at last as hot spot points.
MAP of polyolefins, HDPE, PP, and PS was performed using different MW
absorbers (tire, carbon, or Fe) and MW power, obtaining a high quality liquid
fraction with tailoring properties. From HDPE a mixture of linear alkanes, the
corresponding 1-alkenes, and a very low amount of aromatics was obtained. On
the contrary liquids from MAP of PP contained a mixture of methyl branched
alkanes and alkenes, some aromatics and dienes. From MAP of PS a clear and
low viscosity liquids were always collected together with low amount of gas (3.0
wt %) and solid (0.9 wt %). Using a MW power of 3 KW the styrene in the liquid
was increased up to 65.98 %. Tire and carbon could be assimilated to pollutant
other than MW absorber, and they did not markedly affect the pyrolyses results,
but almost only the products composition if some of these materials might be
pyrolyzed. These results let us to affirm that MAP of HDPE, PP, and PS might be
performed even when large amount of inorganic and polymeric compounds was
present as contaminants.
MAP of WMP might by run with or without a MW absorber, and five products
were always collected: char, gas, unscratched Al, and two liquid fractions. The
organic liquid phase contained large amount of hydrocarbons, useful as fuel or
the source of chemicals. The other liquid phase contained large amount of water
and oxygenated organic compounds, such as acetic acid, 2-hydroxypropan-2-one
and levoglucosan. Fe promoted a faster pyrolysis than the others MW absorbers,
and avoided the formation of large amount of cyclic and aromatic compounds
from PE layers. Furthermore Fe let a better pyrolysis of anydrosugars and acids
from paper pyrolysis. Pyrolysis time with carbon as MW absorber was higher than
using any other absorbers, and is allowed cross reaction between paper and PE
degradation products enhancing aromatics formation.
MAP of WP might be run without a MW absorber but the pyrolysis could not
be completed. WP were converted into a char which preserved their former
shape and a two liquid phases. These latter phases were characterized using an
innovative chromatographic methodology. A single sample were prepared for thin
layer chromatography, GC, and HPLC analyses. Quantitative analysis of liquid
were performed using the relative response factor (RRF) referred to a compound
present in the liquid. For the compound identified, but for which a RRF was not
available, the RRF was predicted using an innovative formula.
MAP of PLA was performed using different MW absorbers (tire, carbon, or Fe)
and MW power, obtaining a liquid rich in lactide (the cyclic dimer of lactic acid)
and other oxygenated hydrocarbons. The collected lactide was enantiopure and it
was collected, separate, and purified directly from the liquid. Up to 9 wt% of initial
PLA was recovered as L-lactide.

10 - Conclusion 239
MAP of CDP was performed using different MW absorbers (carbon or Fe) and
MW power, obtaining a liquid and large amount of gas accordingly to the pyrolysis
conditions. The liquid was separated in three phases, upper, medium, and lower.
Medium phases were mainly composed of water (70 wt%), acids, alcohols, and
anydrosugars and their pyrolysis products. Upper and lower fractions showed
close properties and composition except that the lower fraction was a wax. It
was composed of oligomers and while the upper phase was composed of the
pyrolyzed form of these oligomers. The upper fractions contained large amount of
aromatic acid and phthalates and their derivatives.
This MAP process represent a very interesting way to transform a waste or
contaminated plastics, otherwise hardly disposable, in the source of chemicals or
energy.


Appendix I: Materials and Instruments
All materials used as feed for the microwave assisted pyrolysis and all solvents
and reagents employed in this work are herein reported.
I. Tire
Two different tires were investigated in this work (Figure I.I). In Table I.I are
reported the characteristics of both.
Figure I.I. Tire M and Tire G.

Appenix Iii
Table I.I. Characteristics of tire used in this work.Brand Michelin BFGoodrich
Commercial model Agilis 81–195/65 R16C Touring t/a 205/60 R15
Commercial segment Camping van Car
ID for this work Tire M Tire G
Ash (wt%) 2.18 2.87
C (wt%) 88.19 87.48
H (wt%) 7.23 7.52
N (wt%) 0.23 0.35
S (wt%) 1.76 1.68
Both tires were chopped to 2 x 2 cm chips before pyrolysis.
II. High density polyethylene (HDPE)
HDPE was recovered from a waste solvent barrel (Figure I.II). It had an ultimate
composition of, C: 85.10 %, H: 14.90 %, and ash: 0.02 %. It was chopped to 2 x 2
cm chips prior pyrolysis
Figure I.II. HDPE barrel and chopped HDPE.
III. PP
PP was recovered from a waste barrel (Figure I.III). It had an ultimate composition
of, C: 81.35 %, H: 13.60 %, and ash: 5.50 %. It was chopped to 2 x 2 cm chips
prior pyrolysis.

Appenix I iii
Figure I.III. PP barrel and chopped PP.
IV. PS
PS was recovered from waste expanded packaging used for freight of chemicals.
It was heated a 388 K to de-foam and chopped it to 2 x 2 cm chips (Figure I.IV). It
had an ultimate composition of, C: 92.10 %, H: 7.84 %, and ash: 0.76 %.
Figure I.IV. PS foam and PS chips.

Appenix Iiv
V. PLA
PLA was supplied by NatureWorks LLC in pellets form (Figure I.V) and it was
used without any other treatments. It had an ultimate composition of, C: 49.32 %,
H: 5.66 %, O: 45.03 %.
Figure I.V. PLA pellets from NatureWorks LLC.
VI. Wood pellets
WPs were bought in a local store. They were intended for wood stove usage.
They were obtained by processing residual sawdust of beech to form 2 cm pellets
(Figure I.VI). Their ultimate and proximate analyses are: C 44.81 %, H: 5.87 %, N:
0.59 %, O: 48.74 %; moisture: 8.68 %, volatiles: 80.93 %, fixed carbon: 9.01 %,
ash: 1.38 %.
Figure I.VI. WP from beech.
VII. Crop derived plastic
CDP was obtained from shopping bags purchased from a local store (Figure
I.VII). They were pyrolyzed as received. Their ultimate and proximate analyses
are: C 58.68 %, H: 7.67 %, O: 33.65 %; moisture: 2.09 %, volatiles: 92.52 %, fixed

Appenix I v
carbon: 4.50 %, ash: 0.90 %.
Figure I.VII. Shopping bags from CDP.
VIII. Multi-layer packaging
MLP was obtained from waste beverage carton. Bricks were thoroughly washed
with demineralized water, dried in a ventilated oven at 373 K for at least 24 h and
then chopped in 2 × 2 cm flakes (Figure I.VIII). Proximate analysis was: moisture:
5.25 %, volatiles: 72.46 %, fixed carbon: 15.89 %, ash: 6.40 %.
Figure I.VIII. MLP beverage carton.

Appenix Ivi
IX. Reagents and Solvents
All the solid, liquid, and gas compounds used are listed below:
• Liquidnitrogen:Siad,purity99.998%,dessicatedpriorusebyflowingitover
a column filled with Drierite.
• Drierite:Aldrich,composition97%diCaSO4 e 3% di CoCl2.
• Hydrogen:Siad,purity99.8%.
• Acetone:ProlabioGPRRectapur,purity99.5%.
• Siliconoil:Fluka,temperaturerange223-473K.
• Cyclohexane:Aldrich,purity99.5%.
• Chlorobenzene:Aldrich,purity99.5%.
• 1,4-dimethylbenzene:Aldrich,purity99%.
• Toluene:Aldrich,purity99.5%(distilledoverLiAlH4prioruse).
• Benzothiazole:Aldrich,purity96%.
• 1-Benzothiphene:Aldrich,purity98%(recrystallizedfromanhydroustoluene
prior use).
• 2,4-Dinitrophenylhydrazine:Aldrichpurity97%(moistenedwithwater).
• Methanol:Aldrich,anhydrouspurity99.8%.
• Sulfuricacid:Aldrich,purity95%.
• Tetrahydrofuran:VWRinternational,HPLCgrade.
• Hexane:VWRinternational,HPLCgrade.
• 1,1,2,2-Tetrachloroethane-d2:Aldrich,purity99.5%.
• Chloroform-d:Aldrich,purity100%.
• Dimethylsulfoxide-d6:VWRinternational,purity100%.
• Acetonitrile:VWRinternational,HPLCgrade.
• Water:VWRinternational,HPLCgrade.
• Formicacid:Fluka,purity99.8%.

Appendix II: Analytical Methods
All preparation methods for samples collection after any pyrolysis experiment
together with all analytical methods employed to characterize and refine samples
are herein reported.
I. Sample collection and storage
In the next section are briefly described the sample preparation and storage of
the three products always collect in any pyrolysis experiment.
Liquid products were recovered straight after the end of each experiment and
transferred into test tube. They were centrifuged at 2000 rpm for 10 min and then
filtered to evaluate if any particulate was present. The filtered liquid was stored at
277 K prior any other analysis.
Liquids from MAP of corn derived plastic were three phases liquid. They were
centrifuged, separated, and weighted to evaluate the yield in each fraction.
Liquids from MAP of multi-layer packaging were a two phases liquid and
separation was achieved by using a separation funnel.
Liquids from MAP of WP were prepared as follow: about 50 mg of each sample
were dissolved in AcN (about 1 mL) obtaining a concentration of 50.00 mg/mL.
All samples were filtered through a Minispike GHP Acrodisk 13 mm syringe filter
0.2 mm filter Pall Life Sciences before HPLC analysis. No further treatments were
employed in sample preparation.
Solid products were recovered directly from the reactor, and then they were
milled and homogenized. They were stored in desiccator prior any other analysis.
Eventual metal fragment and/or Al foil were removed and stored in plastic bags.
Gas products were collected in a gasometer and analyzed via GC-FID straight
after the end of each experiment. Further analyses were performed on sample of
gas stored in commercial tedlar gas sampling bags.
II. Density
Density was determined with a pycnometer thermostated at 298.14 K.
Approximately 10 cm3 of liquid were placed and weighted in a 10.01 cm3 graduated
picometer and immersed in a thermosated bath for at least 15 minutes and then

Appenix IIviii
the volume was checked with the referring line.
Density was calculated with the following equation (Eq. II.I):
II.I
Where mliquid was the mass of the liquid placed into the graduated flask,
expressed in grams (g); V the volume of graduated flask (10.01 cm3). Density was
reported as g/cm3.
III. Viscosity
Kinematic viscosity (ASTM method D 2854–00) was detected with an Ostwald
viscometer (Figure II.I) thermostated with a Julabo model ME-18V at 298.14 K.
Kinematic viscosity was reported in centiPoise (cP).
Figure II.I. Ostwald viscometer: a. starting point of measure; b. ending point for measure; c. reservoir.
Viscosity was measured with the following assumptions. The liquid that flowed
into the capillary viscometer had a null velocity at walls and maximum in center.
The flow rate (Q) could be defined by Eq. II.II:
II.II
Using the law of Poiselle it was possible to rewrite Eq. II.II as (Eq. II.III):
II.III
Where Dp, difference of pressure at capillary extremes; l, length of capillary; r,
radius of capillary; n, kinematic viscosity.
From Eq. II.III, Q could be expressed as (Eq. II.IV):
dmVliquid
liquid
298 =
Q Vt
=∂∂
Q r pl
=∆4
8
πη
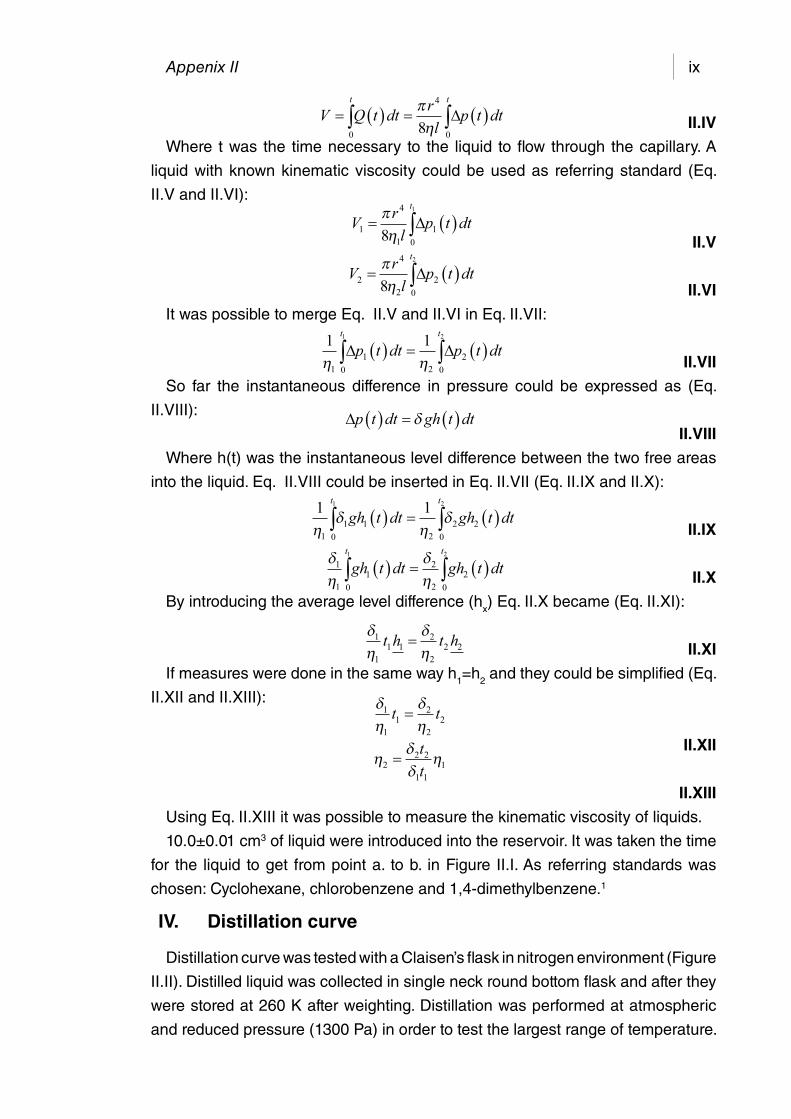
Appenix II ix
II.IV
Where t was the time necessary to the liquid to flow through the capillary. A
liquid with known kinematic viscosity could be used as referring standard (Eq.
II.V and II.VI):
II.V
II.VI
It was possible to merge Eq. II.V and II.VI in Eq. II.VII:
II.VII
So far the instantaneous difference in pressure could be expressed as (Eq.
II.VIII):
II.VIII
Where h(t) was the instantaneous level difference between the two free areas
into the liquid. Eq. II.VIII could be inserted in Eq. II.VII (Eq. II.IX and II.X):
II.IX
II.X
By introducing the average level difference (hx) Eq. II.X became (Eq. II.XI):
II.XI
If measures were done in the same way h1=h2 and they could be simplified (Eq.
II.XII and II.XIII):
II.XII
II.XIII
Using Eq. II.XIII it was possible to measure the kinematic viscosity of liquids.
10.0±0.01 cm3 of liquid were introduced into the reservoir. It was taken the time
for the liquid to get from point a. to b. in Figure II.I. As referring standards was
chosen: Cyclohexane, chlorobenzene and 1,4-dimethylbenzene.1
IV. Distillation curve
Distillation curve was tested with a Claisen’s flask in nitrogen environment (Figure
II.II). Distilled liquid was collected in single neck round bottom flask and after they
were stored at 260 K after weighting. Distillation was performed at atmospheric
and reduced pressure (1300 Pa) in order to test the largest range of temperature.
V Q t dt rl
p t dtt t
= ( ) = ( )∫ ∫0
4
08
πη
∆
V rlp t dt
t
1
4
1 0
18
1
= ( )∫πη
∆
V rlp t dt
t
2
4
2 0
28
2
= ( )∫πη
∆
1 1
1 0
1
2 0
2
1 2
η η
t t
p t dt p t dt∫ ∫( ) = ( )∆ ∆
∆p t dt gh t dt( ) = ( )δ
1 1
1 0
1 1
2 0
2 2
1 2
ηδ
ηδ
t t
gh t dt gh t dt∫ ∫( ) = ( )
δη
δη
1
1 0
12
2 0
2
1 2t t
gh t dt gh t dt∫ ∫( ) = ( )
δη
δη
1
1
1 12
2
2 2t h t h=
δη
δη
1
1
12
2
2t t=
ηδδ
η2
2 2
1 1
1=
tt

Appenix IIx
Figure II.II. a. Claisen’s flask; b. detail of Claisen’s flask distillation head.
V. Ultimate analysis
CHN analysis was performed using a Perkin-Elmer CHNS/O Analyzer model
2400 Series II. Sulfur content was evaluated through a calorimetric bomb, see
Section VI.
VI. Calorific values
Higher heating values (HHV), for liquid, and gross calorific value (GCV), for
solids, together with sulfur content of the products were detected by an external
laboratory, ESSE.TI.A. srl, (Via dell’arte della paglia 3, Campi Bisenzio, Italy)
using a homemade adiabatic bomb calorimeter.
LCV was calculated taking into account GCV and ultimate analysis. Lower
heating value (LHV), for liquid, and lower calorific value (LCV), for solid were
calculated taking into account HHV or GCV and ultimate analysis using the
following Equation (Eq. ):
II.XIV
Where: 2500 kj/kg was the DH for water evaporation; W, water content of the
sample; H hydrogen content of the sample.
VII. Thin layer chromatography
Thin layer chromatography (TLC silica gel 60 F254) plates were from EMD.
They were cut in 10 × 20 cm and 3 drops for each solution of sample was spotted
on the plates. Two solvent mixtures were used: MeOH, AcN, and H2O (6:3:1);
CH2Cl2 and MeOH (9:1). TLC chromatograms were examined under daylight and
UV light, longwave (365 nm) and shortwave (254 nm).
LHV HHV Kj Kg U H� /= − +( )2500 9

Appenix II xi
VIII. GC/MS
Gas chromatographic analyses were performed using a Shimadzu GC/MS
QP5050A equipped with a capillary column PetrocolTM DH 24160-U, (100 m length,
0.25 mm diameter, 0.5 mm stationary phase, max temperature 593 K) using a
1:30 split ratio and a quadrupole mass (MS) detector, with an electron impact ions
generator, operating in the mass range 40–450 m/z. The oven operated at 298
K for 15 min, then heated at 2.5 K/min up to 523 K and kept at this temperature
for 15 min. For liquids from MAP of HDPE this latter hold time was 180 min.
Other noteworthy peaks were not detected working at higher temperature. Total
ion chromatography (TIC) was obtained with a signal/noise ratio of five, and
composition was reported without any response factors correction. Compounds
were identified using the NIST mass spectral library and commercial standards
for selected compounds.
Liquids obtained from pyrolysis of WP where performed using a Shimadzu GC-
2010 equipped with a capillary column Agilent DB-5MS, (30 m length, 0.25 mm
diameter, 0.25 mm stationary phase, max temp 598 K) using a 1:25 split ratio,
injected volume 1 mL. The oven operated at 303 K for 5 min, then heated at 5 K/
min up to 553 K and kept at this temperature for 2 min, total run 55 min. Pressure
was hold at 100 kPa with a column flow of 1.78 mL/min, and a total flow of 49.3
mL/min. The injection port and the interfaces were kept at 523 K. Two detectors
were employed: a Shimadzu QP2010S quadrupole mass (MS) detector, with an
electron impact ions generator with a voltage of 0.85 kV, operating in the mass
range 35 – 650 m/z, scan speed 1428; and a flame ionization detector (FID)
operating at 579 K.
Autotuning conditions: sensitivity adjustment over mass target of 264 m/z;
adjustment of resolution with full width at half maximum of target mass of 0.6.
Compounds were identified using the NIST 05 mass spectral library when
standards were not available.
IX. GC/FID and GC/TCD
Gas chromatographic analyses of gas product were performed using two
different instruments equipped with a flame ionization detector (FID) or a thermal
conductivity detector (TCD). The GC-FID analysis was carried out with a Shimadzu
GC-2010 working with a capillary column Supelco SPB-5 (60 m length, 0.25 mm
stationary phase, 0.25 mm diameter, column flow 0.98 mL/min.) The sample
was injected using a 1:30 split ratio. The GC operated at 308 K for 20 min. The
gaseous components were identified using pure standards. GC-TCD analysis
was performed with a GC-HP model working with a capillary column Supelco
Carbonex 1010 (30 m length, 0.53 mm diameter). The sample was injected using

Appenix IIxii
a 1:30 split ratio. The GC operated at 308 K for 45 min. The quantitative analyses
of gases were performed using a reference standard calibration curve obtained
with standard gas mixtures at different concentrations.
X. FTIR
Infrared (FTIR) analyses were performed with a Shimadzu modelIRAffinity-1
(Figure II.III), using two methodologies. A transmission technique only for solid
samples (using KBr disk) or a diamond Golden Gate single reflection attenuated
total reflectance (ATR) accessory supplied by Specac. For FTIR-ATR spectra
samples were directly placed on the diamond surface without any pretreatments.
Figure II.III. Shimadzu modelIRAffinity-1.
XI. ICP/MS
Ion coupled plasma-mass spectroscopy (ICP-MS) analyses were determined
by an external laboratory, Eureka srl, (Italy) using a MW mineralizer CEM Mars
Xpress and ICP-MS Thermo Xseries2. Silicon was not quantified. Solid samples
were not pretreated.
XII. NMR
1H NMR spectra were recorded with an NMR Varian VXR 200, using
various deuterated solvents accordingly to the investigated liquid.
1,1,2,2-tetrachloroethane-d2 (C2Cl4D2) was employed for tire derived liquid.
Chloroform-d (CDCl3) was employed for all liquids from synthetic polymer.
Dimethyl sulfoxide-d6 (C2D6SO, DMSO) was employed for liquids from wood and
paper pyrolysis.
Hydrogen of the solvent was employed as internal standard and spectra were
referred to TMS.
Water content in wood and paper derived liquid was evaluated by standard
addition method. Three spectra were recorded for each tube: pure solvent; solvent
plus weighted amount of sample; solvent, plus weighted amount of sample and
Appenix II xiii
distilled water. Areas in each set of three spectra were calculated using the area
of residual hydrogen of solvent as reference.
XIII. HPLC/MS
High performance liquid chromatography was performed with a Thermo
Scientific LTQ Orbitrap Discovery MS 2.5.5, autosampler Accela AS 2.2.1, and
pump Accela pump 1.04.05, equipped with a Thermo Scienctific column Syncronis
C18, length 50 mm, I.D. 2.1 mm, and particle size 1.7 mm. A gradient technique
was used at room temperature, solvent A AcN acidified with 0.1 vol% formic acid;
solvent B water acidified with 0.1 vol% formic acid. Flow rate 0.3 mL/min. Initially
solvent A was 5 vol %, increasing to 15 vol% at 1 min, increasing to 20 vol% at 8
min, increasing to 50 vol% at 10 min, increasing to 80 vol% at 13 min, decreasing
to 5 vol% at 15 min, followed by 1 min of isocratic elution with 5% of solvent B
(total eluition time 16 min).
LTQ Orbitrap MS was equipped with an ESI source operating in positive and
negative ionization mode using the following operating parameters: electrospray
voltage 3.1 kV, sheath gas flow rate 8 abu, auxiliary gas flow rate 1 abu, capillary
temperature 543 K, capillary voltage -49.00 V, tube lens offset -148.43 V.
Instrument calibration was performed externally prior to each sequence with a
calibration solution: Thermo Scientic Pierce LTQ Velos ESI positive ion and ESI
negative calibration solution. Accurate mass spectra of [M+H]+ and [M-H]- ions
were recorded from 100 to 1000 m/z, the mass resolution power of the mass
analyzer was set to 30,000 (m/Δm). Nitrogen (99.95%) was used as sheath gas,
aux gas and served as the collision gas in the HCD cell and the bath gas in the
C-trap.
XIV. Proximate analysis
Moisture content was evaluated by heating weighted solid samples at 378 K for
4 hours.
Volatiles were evaluated by the weight loss after heating samples at 623 K
under a reduced pressure of 80 Pa for 5h and in a stop up crucible at 900 K in a
muffle furnace for 6 minutes.
Ash content was detected according to ASTM D 2866 – 94 method. Samples
were placed in a crucible into a muffle furnace at 900 K (temperature reached in
4 hours) for 4 hours.
Fixed carbon was evaluated by difference using the following Equation (Eq.
II.XV):
II.XV
Where M, was the wt% of moisture; V, was the wt% of volatiles; A, was the wt%
of ash.
Fixed carbon M V A� = − + +( )100

Appenix IIxiv
XV. Apparent density of char
Apparent density was measured following the ASTM D 2854 – 00 method.
Finely milled char were packed in a wide mouthed graduated cylinder by using a
vibrating plate.
XVI. BET
Surface area of char samples (BET) was determined by isotherm nitrogen
adsorption at 77 K using a Coulter SA3100 instrument. The BET area was
evaluated either on collected samples or sample and degassed at 623 K, under
a reduced pressure of 80 Pa for 5h. BJH method was used to provide information
on the porous structure of char.
XVII. ESEM-EDX
Surface physical morphology and surface microanalyses were detected using an
environmental scanning electron microscopy, ESEM Quanta-200 FEI, equipped
with an X-ray energy dispersive spectroscopy (X-EDS) for microanalysis. Samples
(granules of 0.3 – 0.5 mm) were mounted on a carbon tape and transferred into
the analysis chamber; images and spectra were collected under reduced pressure
(133 Pa).
XVIII. Powder XRD
X ray diffraction analysis was carried out using a PANalytical diffractometer
X’Pert PRO with radiation CuKa1= 1.545 Å, operating at 40 KV, 30 mA, 2q range
3-120°, equipped with X’Celerator RTMS (Real Time Multiple Strip) X-ray detection
technology, an High Score data acquisition and interpretation software. A zero
background sample holder was used. Crystalline phases were identified using the
ICDD database.2
XIX. Hydrodesulfurization
Hydrodesulfurization process was carried out in a 150 mL stainless steel Parr
autoclave electrically heated (±1 K). The experiments were performed in H2. The
autoclave was loaded with the solid catalyst prior closing it in nitrogen flow to
avoid oxygen presence during HDS process. Then vacuum was made into the
autoclave to facilitate the introduction of the solution. The solution to be treated
was prepared in a Schlenk tube in N2 environment and then transferred into the
autoclave.
The gas chromatographic analyses of liquids were performed using a Shimadzu
GC MS QP5050A previuosly reported (Section VIII) using a 1:30 split ratio, a
injection temperature of 523 K, and a quadrupole mass (MS) detector with electron
ionization, operating in the mass range 40–450 m/z. The oven operated at 308

Appenix II xv
K for 15 min, then heated at 2.5 K/min up to 190 K. Other significative peaks
were not detected at higher temperature. The total ion chromatography (TIC) was
obtained with a signal-noise ratio of five, and the area percentage was reported
without any response factors correction. The compounds were identified using the
NIST mass spectra library.
The gas chromatographic analyses of liquids were also performed using a
Shimadzu GC 2010 (Section IX) using helium as carrier gas, a 1:30 split ratio,
injection port temperature of 563 K. The oven operated at 313 K for 10 min, then
heated at 6 K/min up to 553 K.
XX. Chemical trapping of gas
Gas were bubbled in a solution of 2,4-dinitrophenylhydrazine (DNPH) for the
qualitative analysis of aldehydes and ketones. About 1 g of moistened DNPH
was placed in a gas-washing bottle, and then 200 mL of MeOH was added. While
stirring 1 mL of H2SO4 was added drop-by-drop. The precipitate was recovered
over a Buchner funnel and washed with MeOH, and then dried. Solid obtained
were analyzed through 1H NMR.
CO2 in gas of pyrolysis was trapped in a 1M NaOH solution, and at the end of
the experiment the residual NaOH was volumetrically titrated with a HCl solution.

Appenix IIxvi
Reference
1. Haynes, W. M., CRC Handbook of Chemistry and Physics. CRC Pr Inc: Colorado, USA, 2011.2. The International Centre for Diffraction Data. http://www.icdd.com/
(Accessed: 15.03.2013).
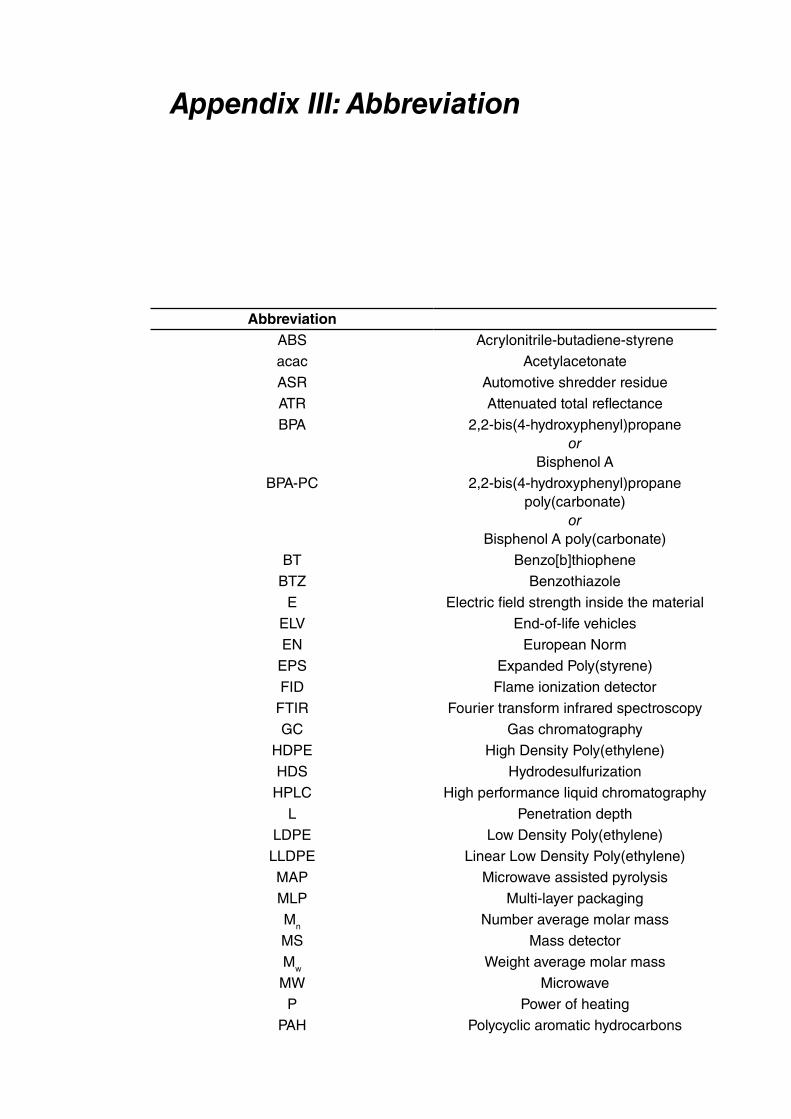
Appendix III: Abbreviation
AbbreviationABS Acrylonitrile-butadiene-styrene
acac Acetylacetonate
ASR Automotive shredder residue
ATR Attenuated total reflectance
BPA 2,2-bis(4-hydroxyphenyl)propaneor
Bisphenol A
BPA-PC 2,2-bis(4-hydroxyphenyl)propane poly(carbonate)
orBisphenol A poly(carbonate)
BT Benzo[b]thiophene
BTZ Benzothiazole
E Electric field strength inside the material
ELV End-of-life vehicles
EN European Norm
EPS Expanded Poly(styrene)
FID Flame ionization detector
FTIR Fourier transform infrared spectroscopy
GC Gas chromatography
HDPE High Density Poly(ethylene)
HDS Hydrodesulfurization
HPLC High performance liquid chromatography
L Penetration depth
LDPE Low Density Poly(ethylene)
LLDPE Linear Low Density Poly(ethylene)
MAP Microwave assisted pyrolysis
MLP Multi-layer packaging
Mn Number average molar mass
MS Mass detector
Mw Weight average molar mass
MW Microwave
P Power of heating
PAH Polycyclic aromatic hydrocarbons

Appenix IIIxviii
PC Poly(carbonate)
PE Poly(ethylene)
PET Poly(ethylene terephthalate)
PLA Poly(lactic acid)
PP Poly(propylene)
PS Poly(styrene)
PSD Pore surface distribution
PUR Poly(urethane)
PVC Poly(vinylchloride)
PVD Pore volume distribution
R Reflected power
ROP Ring opening polymerization
tan δ Loss tangent
TCD Thermal conductivity detector
tg Glass transition temperature
TGA Thermal gravimetric analysis
THF Tetrahydrofuran
TLC Thin layer chromatography
VT Total pore volume
WEEE waste electric and electronic equipment
ε0 Permittivity of free spaceσ Effective high-frequency conductivityε Dielectric permittivity