Valorization Potentials of Rapeseed Meal in a Biorefinery ...
Upload
khangminh22Category
view
1download
0
HAL Id: tel-01066765https://tel.archives-ouvertes.fr/tel-01066765
Submitted on 22 Sep 2014
HAL is a multi-disciplinary open accessarchive for the deposit and dissemination of sci-entific research documents, whether they are pub-lished or not. The documents may come fromteaching and research institutions in France orabroad, or from public or private research centers.
L’archive ouverte pluridisciplinaire HAL, estdestinée au dépôt et à la diffusion de documentsscientifiques de niveau recherche, publiés ou non,émanant des établissements d’enseignement et derecherche français ou étrangers, des laboratoirespublics ou privés.
Valorization of Mexican agriculture by preservation anddrying by instant autovaporization : case of green pepper
Carmen Tellez Perez
To cite this version:Carmen Tellez Perez. Valorization of Mexican agriculture by preservation and drying by instantautovaporization : case of green pepper. Other. Université de La Rochelle, 2013. English. �NNT :2013LAROS399�. �tel-01066765�
Numéro attribué par la bibliothèque :
THÈSE
Pour obtenir le grade de DOCTEUR de L’UNIVERSITE DE LA ROCHELLE
Discipline : Génie des Procédés Industriels Soutenue par
Carmen TÉLLEZ PÉREZ
Le 14 mai 2013 à La Rochelle
« Valorisation de la production agricole mexicaine par préservation et séchage par autovaporisation instantanée ; cas du piment vert »
Directeurs de thèse : Professeur Vaclav SOBOLIK, Professeur. Karim ALLAF et Dr. José Gerardo MONTEJANO GAITÁN
Jury:
Rapporteur Fethi ALOUI ; Professeur, Génie des Procédés, Université de Valenciennes, France
Rapporteur Farid ZERROUQ ; Professeur, Génie des Procédés, Université de Fès, Maroc
Examinateur Karim ALLAF ; Professeur, Génie des Procédés, Université de La Rochelle, France
Examinateur Anaberta, CARDADOR-MARTÍNEZ ; Docteur, Sciences des aliments, Instituto Tecnológico y de Estudios Superiores de Monterrey, Mexique
Examinateur Sandra Teresita MARTÍN DEL CAMPO BARBA; Docteur en Génie de Procédés Biotechnologiques, Instituto Tecnológico y de Estudios Superiores de Monterrey, Mexique
Examinateur José Gerardo MONTEJANO-GAITÁN ; Docteur, Sciences des aliments, Instituto Tecnológico y de Estudios Superiores de Monterrey, Mexique
Examinateur Sabah MOUNIR ; Maitre de Conférences, Docteur en Génie des Procédés, Université de Zagazig, Egypte
Examinateur Vaclav SOBOLIK ; Professeur, Génie des Procédés, Université de La Rochelle, France
UNIVERSITE DE LA ROCHELLE
UFR Pôle Science et technologie
Et
INSTITUTO TECNOLÓGICO Y DE ESTUDIOS SUPERIORES DE MONTERREY
Année 2013
Encomienda tus obras al Señor, y se realizarán tus proyectos
Salmos 16:3
ACKNOWLEDGMENTS I would like to express my deepest gratitude to my supervisors, Professor Vaclav Sobolik, Professor Karim Allaf and the Dr. José Gerardo Montejano Gaitán for their excellent guidance, support, mentorship and friendship. Special thanks to Professor Karim Allaf, who gives me the opportunity to discover the beauty of research, the passion to work, its creativity and in its high quality human values. I am thankful and always proud to be your student.
I would like also thanks, the Assisted Professor Sabah Mounir and Dr. Anaberta Cardador Martínez for their friendship, advice, assistance and time.
I am grateful to all committee members for accepting to participate in this work: Pr. Fethi ALOUI, Pr. Farid ZERROUQ, Pr. Karim ALLAF, Dr. Anaberta, CARDADOR-MARTÍNEZ, Dr. Sandra Teresita MARTÍN DEL CAMPO BARBA, Dr. José Gerardo MONTEJANO-GAITÁN, MCF. Sabah MOUNIR et Pr. Vaclav SOBOLIK. Else, I want to thanks, the “Programme de Coopération Post-Gradué France-Mexique” (PCP - CLAVE: PCP/06/09) and the “Consejo Nacional de Ciencia y Tecnología” (CONACyT–Mexico) for the full scholarship for my studies on Mexico and France, and to ABCAR-DIC PROCESS SAS to allows me to start to build this project.
Thanks are also gratefully given to the LaSIE of the University of La Rochelle and to the “Instituto Tecnológico y de Estudios Superiores de Monterrey, Campus Estado de México and Querétaro”, for providing me an excellent space of work and research environment. I would like to express appreciation to the staff of both universities, especially Dr. Anan, Dr. Prashant, Dr. Abdullah Galal, Blanquita, MCF Colette, Armelle and Antony, for all his help during the development of this project.
I also want to thanks all my colleagues from both universities: Quang, Ismail, Thu-Ha, Alice, Valerian, Alioune, Mohamed Ngem, Ikbal, Phu-to, Victor, Priscila, Leticia, for their friendship, ideas and recommendations. Special grateful to my friend and colleague Maritza with who I share a lot of unforgettable beautiful moments.
Finally, but not at least I would like to thank those closest to me who provide their emotional support, entertainment, time and advice.
To my parents and sister: Carmen, Victoriano and Victoria for being such wonderful family. Thanks for all your love and unconditional support through my life. To Allaf’s family, especially to my lovely friend and guide Vicenta, who believes in me before I do it, and who teach me to see the life with other eyes.
To my family and friends for provide me their support love, encourage and patience, especially thanks to Karla, Yazmin, Marce, Lilia, Israel, Saúl, Aleyda, Kharel, Ludovic and Griffon’s family. The completion of this project has required the help and support of numerous people, enlist of all them will be a challenging task, even though I remember you and thank you for all your support all over these years.
Carmen Téllez Pérez
March, 2013
4
RESUME Après la récolte, les fruits et légumes suivent de divers altérations qui compromettent leur qualité. C’est pourtant donc nécessaire l’utilisation d’opérations de conservation pertinentes capables de prolonger leur durée de vie, ainsi comme leurs principales caractéristiques de qualité.
Le piment (Capsicum spp.) est un produit très important dans les cuisines de tout le monde, ainsi comme dans plusieurs industries. Cependant, en état frais il est facilement périssable à cause de sa teneur en eau élevée (300-900% d.b). En conséquence, il est donc indispensable l’application des procèdes de conservation sur les piments. C’est ainsi que le principale objectif de ce travail de recherche, est donc de contribuer à la définition et optimisation de procédés traditionnels de séchage et congélation des piments, à fin de valoriser ces produits tout en gardant sa qualité.
Dans le cas du procède de séchage, l’étude fondamentale des principaux phénomènes de transferts qui se produisent pendant cette opération, ainsi comme l’identification des processus limitant, ont montré que malgré la simultanéité temporelle des processus de transfert de matière et de chaleur, leur action couplée sur l'élément moteur de l'opération est de type de causalité en série. C'est ainsi que, lors du séchage par entraînement du produit, le transfert de matière interne correspond au phénomène limitant. De cette manière, à fin d’intensifier l’opération de séchage, le procédé « swell drying », couplage du séchage par air chaud à la technologie de Détente Instantanée Contrôlée (DIC), a été étudié. L’application du procédé « swell drying » sur les piments, as permis d’améliorer les cinétiques de séchage à travers de l’augmentation de la diffusivité effective de l’eau et l’accessibilité initiale de la surface des produits. De même, grâce à due à la nouvelle structure expansée, ce procédé a permis d’augmenter la durée de vie des produits secs à travers la réduction de l’activité de l’eau et l’augmentation de la surface spécifique. Par ailleurs, les propriétés fonctionnelles (habilité de réhydratation et capacité de rétention d’eau) et les propriétés nutritionnelles (contenu d’antioxydants et capacité antioxydant) ont été aussi améliorées. Respect au procédé de congélation traditionnel, pour d’intensifier ce procédé, une étape de séchage partielle, suivi du traitement DIC avant la congélation a été proposé. Ce couplage, as permis de augmenter l’extraction des antioxydants ainsi comme leur capacité antioxydant, en état plus remarquable dans le cas de flavonoïdes.
Finalement, avec ces résultats, il peut être conclu que le procédé DIC couplé au séchage par convection et à la congélation peut jouer un rôle important pour la valorisation et transformation des piments.

5
ABSTRACT After harvest, fruit and vegetable products can follow several alterations that compromise their quality characteristics. Then, the processing of food is imperative to prolong the shelf life and the principal quality characteristics of products.
Pepper (Capsicum) is an important crop; nevertheless it is highly perishable because of their high moisture content (300–900% d.b). Therefore, the improvement of the preserving process of pepper is highly important
The present research work had as main objective to contribute to the comprehension, development and improvement of the traditional drying and freezing process applied to peppers.
In the case of drying process, the fundamental study of the main transfer phenomena occurred during hot air drying and the identification of the limiting process, showed that even if there exist simultaneity of the four processes of heat and mass transfer, the whole process take place in causality series. Therefore, it has been highlighted the internal mass transfer as the mainly limiting process. In this manner, with the aim to intensify the drying operation, the “Swell drying” process, the hot air drying coupling to the Instant Controlled Pressure Drop (DIC process) was studied. The application of “swell drying” process on peppers, allowed enhancing the drying kinetics by increasing the effective diffusivity of water and the starting accessibility at the surface of the products. Furthermore, thanks to the new expanded structure, this process allowed to increase the shelf life of products by decreasing their water activity and increasing their specific surface area. Moreover, the functional properties (ability of rehydration and water holding capacity) and nutritional properties (antioxidant content and antioxidant capacity), were also improved.
Regarding the freezing process, in order to intensify it, a stage of partial dehydration followed by the DIC treatment was inserted previous freezing. This coupling of processes, allowed to increase the antioxidant extraction and the antioxidant capacity of the products, being special important for flavonoids.
Finally, with these results it can be concluded that the DIC process, coupling to traditional drying and freezing could play an important role on the valorization and transformation of peppers.
6
TABLE OF CONTENTS
ACKNOWLEDGMENTS ................................................................................................................................... 3
RESUME 4
ABSTRACT 5
TABLE OF CONTENTS .................................................................................................................................... 6
TABLE LIST 8
FIGURES LIST 9
NOMENCLATURE .......................................................................................................................................... 11
INTRODUCTION 13
PART I . STATE OF ART ............................................................................................................................... 14
CHAPTER I-1. RELEVANCE OF PEPPER (CAPSICUM SPP.) CROP ........................................................ 15
I-1.1. INTRODUCTION ................................................................................................................. 15 I-1.2. HISTORY ............................................................................................................................... 15 I-1.3. BOTANICAL CLASSIFICATION OF PEPPERS .............................................................. 16 I-1.4. PHYSIOCHEMICAL COMPOSITION ............................................................................... 17 I-1.5. MAIN QUALITY CHARACTERISTICS OF PEPPERS ................................................... 18 I-1.6. WORLD PRODUCTION AND CONSUMPTION ............................................................. 18 I-1.7. THE RELEVANCE OF PEPPER CROP ON MEXICO ..................................................... 20 I-1.8. MEXICAN CROP PRODUCTION ZONES AND PRINCIPAL CULTIVATED
VARIETIES ........................................................................................................................... 21
CHAPTER I-2. COMMON PRESERVATION METHODS APPLIED ON PEPPERS ................................. 23
I-2.1. INTRODUCTION ................................................................................................................. 23 I-2.2. DRYING OF PEPPER .......................................................................................................... 24 I-2.3. FREEZING OF PEPPERS ................................................................................................... 27
CHAPTER I-3. FUNDAMENTAL APROACH OF DRYING ........................................................................... 28
I-3.1. INTRODUCTION ................................................................................................................. 28 I-3.2. HEAT AND MASS TRANSFER PROCESSES DURING DRYING ................................ 28 I-3.3. MODELS AND STAGES OF DRYING ............................................................................... 31
CHAPTER I-4. INTERACTION OF THE WATER AND SOLID DURING DRYING OPERATION ......... 34
I-4.1. THERMODYNAMIC STUDY OF THE INTERACTION SOLID-WATER ................... 34 I-4.2. KINETICS ANALYSIS ......................................................................................................... 44
CHAPTER I-5. INTENSIFICATION OF DRYING AND FREEZING ............................................................ 47
I-5.1. INTENSIFICATION OF DRYING ...................................................................................... 47 I-5.2. INTENSIFICATION OF FREEZING ................................................................................. 49
CHAPTER I-6. QUALITY CHARACTERISTICS OF DRIED AND FROZEN PRODUCTS ........................ 52
I-6.1. ANTIOXIDANT CONTENT AND ACTIVITY OF FRUITS AND VEGETABLES ....... 52 I-6.2. REHYDRATION CAPACITY .............................................................................................. 56 I-6.3. WATER HOLDING CAPACITY ......................................................................................... 57
PART II MATERIALS AND METHODS ..................................................................................................... 58
7
CHAPTER II-1. MATERIALS ............................................................................................................................. 59
II-1.1. RAW MATERIAL ................................................................................................................. 59 II-1.2. CHEMICALS ......................................................................................................................... 59
CHAPTER II-2. METHODS ................................................................................................................................ 60
II-2.1. PRESERVING PROCESS AND ASSESSMENTS APPLIED TO MOROCCAN PEPPERS ............................................................................................................................... 60
II-2.2. ASSESMENTS PROCESS ................................................................................................... 63 II-2.3. EXPERIMENTAL DESIGN ................................................................................................. 70 II-2.4. PRESERVING PROCESS AND ASSESSMENTS APPLIED TO POBLANO PEPPERS
................................................................................................................................................. 72 II-2.5. ASSESMENTS PROCESS ................................................................................................... 74 II-2.6. EXPERIMENTAL DESIGN ................................................................................................. 75
PART III RESULTS ......................................................................................................................................... 76
CHAPTER III-1. IMPACT OF INSTANT CONTROLLED PRESSURE DROP TREATMENT ON DEHYDRATION AND REHYDRATION KINETICS OF GREEN MOROCCAN PEPPER (CAPSICUM ANNUUM) ...................................................... 77
CHAPTER III-2. EFFECT OF THE INSTANT CONTROLLED PRESSURE DROP TREATMENT ON THE ADSORPTION ISOTHERM OF DRIED MOROCCAN PEPPER (CAPSICUM ANNUM) .................................................................................................. 98
CHAPTER III-3. EFFECT OF THE INSTANT CONTROLLED PRESSURE DROP TREATMENT ON THE ANTIOXIDANT ACTIVITY OF MOROCCAN AND POBLANO PEPPER ......................................................................................................................... 123
PART IV CONCLUSIONS AND PERSPECTIVES .................................................................................. 144
CONCLUSIONS 145
PERSPECTIVES 147
REFERENCES 148
8
TABLE LIST
Table 1. Taxonomy of cayenne pepper ................................................................................................ 16
Table 2. Common varieties of capsicum .............................................................................................. 16
Table 3. Nutrimental composition of Capsicum spp. ...................................................................... 17
Table 4. The 20 highest produced countries of Chillies and peppers, green – 2011 [38] 19
Table 5. The 20 highest produced countries of dry Chillies and peppers, dry – 2011 [38] ............................................................................................................................................................................. 20
Table 6. Minimum aw for Growth of Microorganism ..................................................................... 36
Table 7. List of popular sorption models (T - theoretical, E - empirical). Adopted from [104] .................................................................................................................................................................. 43
Table 8. Source of the main natural oxidation inhibitors [116] ................................................. 52
Table 9. Classification of inhibitors of lipid oxidation [116] ....................................................... 54
Table 10. In Vitro Antioxidant Capacity Assays ................................................................................ 55
Table 11. Water activities (aw) of saturated salt solutions at 25, 40 and 50 °C .................. 66
Table 12. Coded levels for independent variables used in the developing experimental data of Moroccan Peppers ......................................................................................................................... 70
Table 13. Run experimental values applied on Moroccan Peppers .......................................... 70
Table 14. Coded and real levels of independent variables used in the experimental design applied on Poblano pepper. Axial distance α = 1.4142. ................................................. 75
Table 15. Run experimental values applied on Poblano Pepper ............................................... 75
9
FIGURES LIST
Figure 1. Main part of capsicum fruit.................................................................................................... 17
Figure 2. World production increase quantity of green (right) and dry (left) chillies and peppers during the last years [38] ........................................................................................................ 18
Figure 3. The highest producers’ countries of peppers on 2011- green (right) and dry (left) ................................................................................................................................................................... 19
Figure 4. The 10 most important food and agricultural commodities on Mexico during 2011 (ranked by value) ............................................................................................................................. 21
Figure 5. Total production pepper volume on a state-by-state basis. ..................................... 21
Figure 6. Open air sun drying of Poblano pepper (Puebla, Mexico) ......................................... 24
Figure 7. Prototype of greenhouse solar drying built in the North of Argentina [55] ....... 25
Figure 8. Hot air drying of peppers (USA - Commercial Process) [24]. .................................. 26
Figure 9. Flow diagram of freezing process of vegetables. Adopted from Barbosa, et al., 2005 [46] ....................................................................................................................................................... 27
Figure 10. Schematic representation of heat and mass transfers involved during hot air drying. Addapted from Allaf et al., 2012 [67] .................................................................................... 28
Figure 11. Mass transport pathways in actual plant storage tissues (Adapted Toupin, Marcotte [76]) ............................................................................................................................................... 31
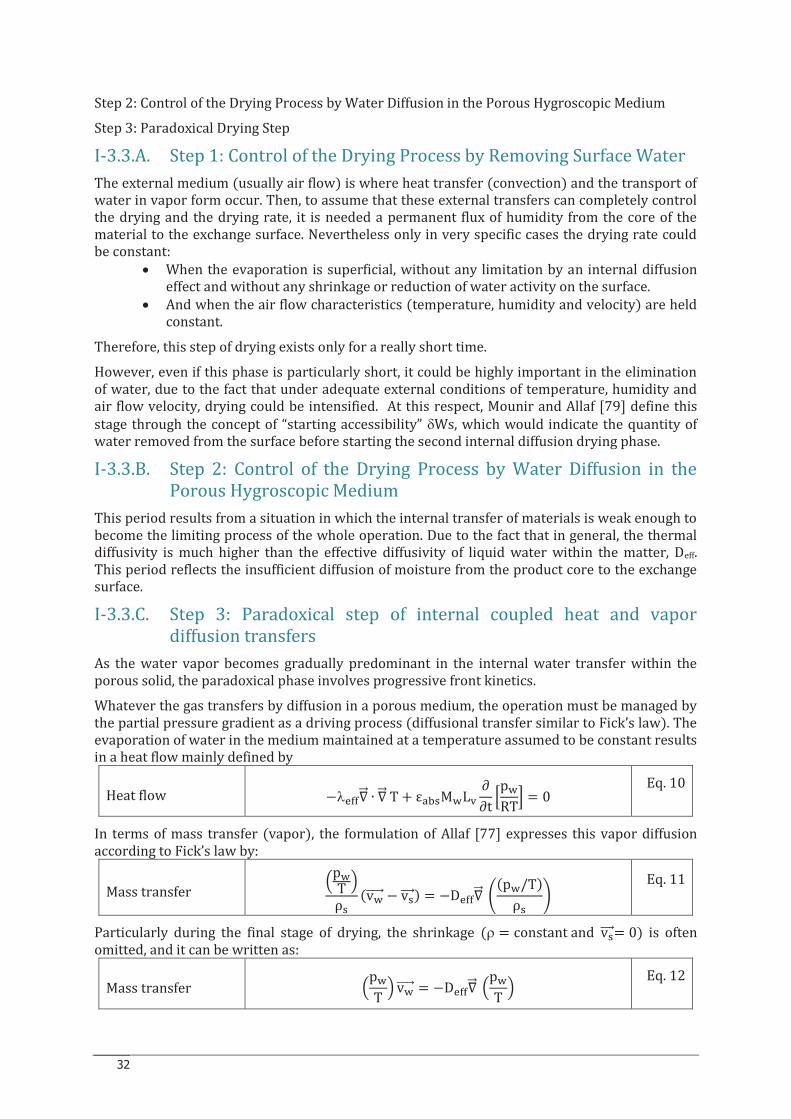
Figure 12. Schematic description of the hot air drying paradoxical phase carried by progressive front kinetics Addapted from Allaf et al., 2012 [67] ............................................. 33
Figure 13. Food stability map as a function of water activity (adapted from Labuza, Tannenbaum [89]) ....................................................................................................................................... 36
Figure 14. Revised Food Stability Map Based on Water Activity and glass transition, adopted from Rahman [93]. ..................................................................................................................... 37
Figure 15. The five types of sorption isotherms proposed by Brunauer et al. (1940). ..... 38
Figure 16. Sorption isotherms for typical food showing three different zones (Adapted from Rahman [95]) ...................................................................................................................................... 39
Figure 17. Hysteresis loop. Adopted from [81] ................................................................................ 39
Figure 18. Plot of log aw versus temperature for predicting aw, from Labuza, 1984 [100]. Adapted from Barbosa-Cánovas, Fontana [92] ................................................................................. 40
Figure 19. Position of hot air drying and DIC processing vis-à-vis the glass transition curve (T,W)g Adopted from Mounir et al., 2012 [107].................................................................. 48
Figure 20. Schematic description of the third instensification by DDS process. Addapted from Allaf et al., 2012 [67] ........................................................................................................................ 49
Figure 21. Practical definition of the freezing process for pure wáter Adopted from Mallet, 1993 [112] ........................................................................................................................................ 50
Figure 22. Practical definition of the freezing process for foods. Adopted from Mallet, 1993 [112]....................................................................................................................................................... 50
10
Figure 23. Schematic representation of dehydrofreezing process couple to DIC process ............................................................................................................................................................................. 51
Figure 24. Phenolic compounds. ............................................................................................................... 53
Figure 25. Chemical structures of capsaicinoids compounds [24] ........................................... 54
Figure 26. Studied Capsicum annuum varieties: A) Moroccan Peppers and B) Poblano Pepper ............................................................................................................................................................... 59
Figure 27. Preserving process and assessments applied on Moroccan peppers ................. 60
Figure 28. Schematic time-temperatures-pressures profiles of a DIC processing cycle. (a): establishment of the vacuum within the processing reactor; (b): injection of steam at the selected pressure; (c) maintain of treatment pressure during selected time; (d): instant controlled pressure drop towards vacuum and (e): establishment of the atmospheric pressure within the processing reactor .................................................................... 61
Figure 29. Right: Schematic diagram of DIC Equipment: (1) DIC Reactor, (2) Vacuum tank, (3) Vacuum pump, (4) Trap, V1-V7-valves, S1 and S2- saturated steam injection, W1- cooling water, P-Pressure gauge and T- thermocouples. Left: DIC reactor ................. 62
Figure 30. Preserving process and assessments applied on Poblano peppers .................... 72
Figure 31. Righ: Schematic diagram of DIC Equipment LABIC0.1 (ABCAR-DIC Process; La Rochelle; France): (1) DIC Reactor, (2) Vacuum tank, (3) Vacuum pump, (4) Trap, V1-V7-valves, F1 and F2- saturated steam injection, F3- cooling water, P-Pressure gauge and T- thermocouples. Left: DIC LABIC0.1 equipment ........................................................................... 73
11
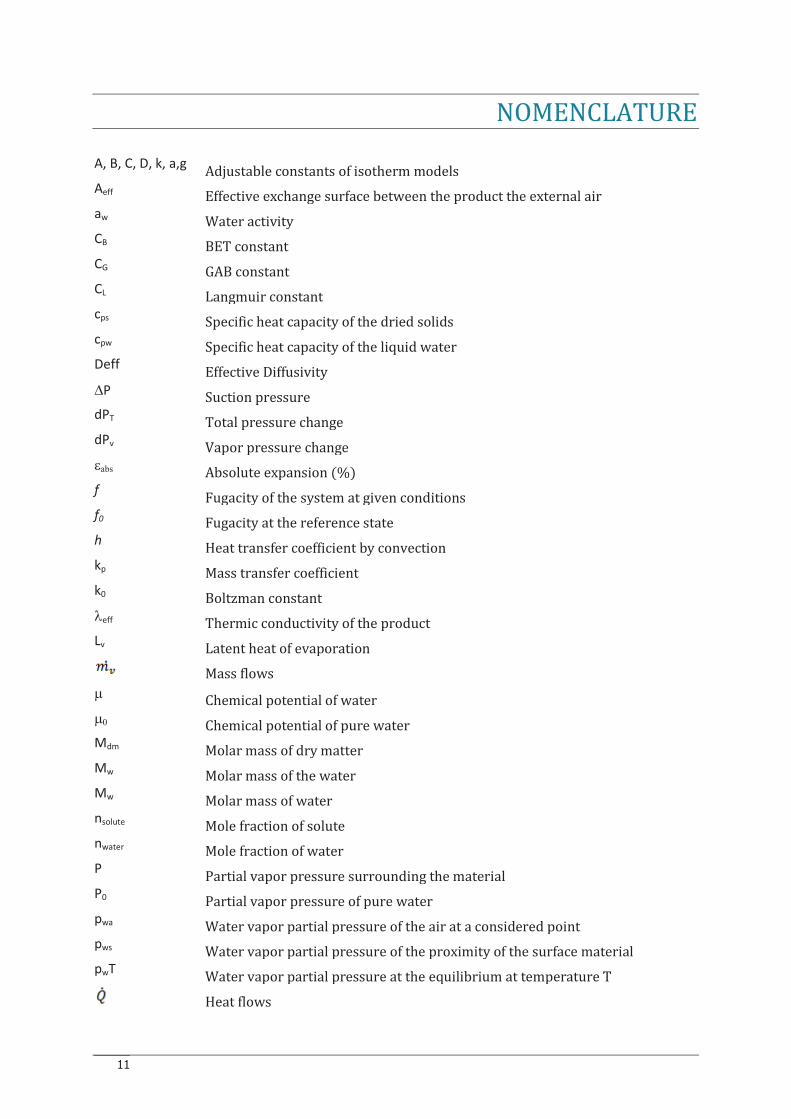
NOMENCLATURE A, B, C, D, k, a,g
Adjustable constants of isotherm models Aeff Effective exchange surface between the product the external air aw
Water activity CB
BET constant CG
GAB constant CL Langmuir constant cps Specific heat capacity of the dried solids cpw
Specific heat capacity of the liquid water Deff
Effective Diffusivity DP Suction pressure dPT Total pressure change dPv Vapor pressure change eabs Absolute expansion (%) f
Fugacity of the system at given conditions f0
Fugacity at the reference state h
Heat transfer coefficient by convection kp
Mass transfer coefficient k0 Boltzman constant leff Thermic conductivity of the product Lv Latent heat of evaporation
Mass flows m Chemical potential of water m0 Chemical potential of pure water Mdm
Molar mass of dry matter Mw
Molar mass of the water Mw
Molar mass of water nsolute
Mole fraction of solute nwater Mole fraction of water P
Partial vapor pressure surrounding the material P0 Partial vapor pressure of pure water pwa Water vapor partial pressure of the air at a considered point pws Water vapor partial pressure of the proximity of the surface material pwT
Water vapor partial pressure at the equilibrium at temperature T
Heat flows
12
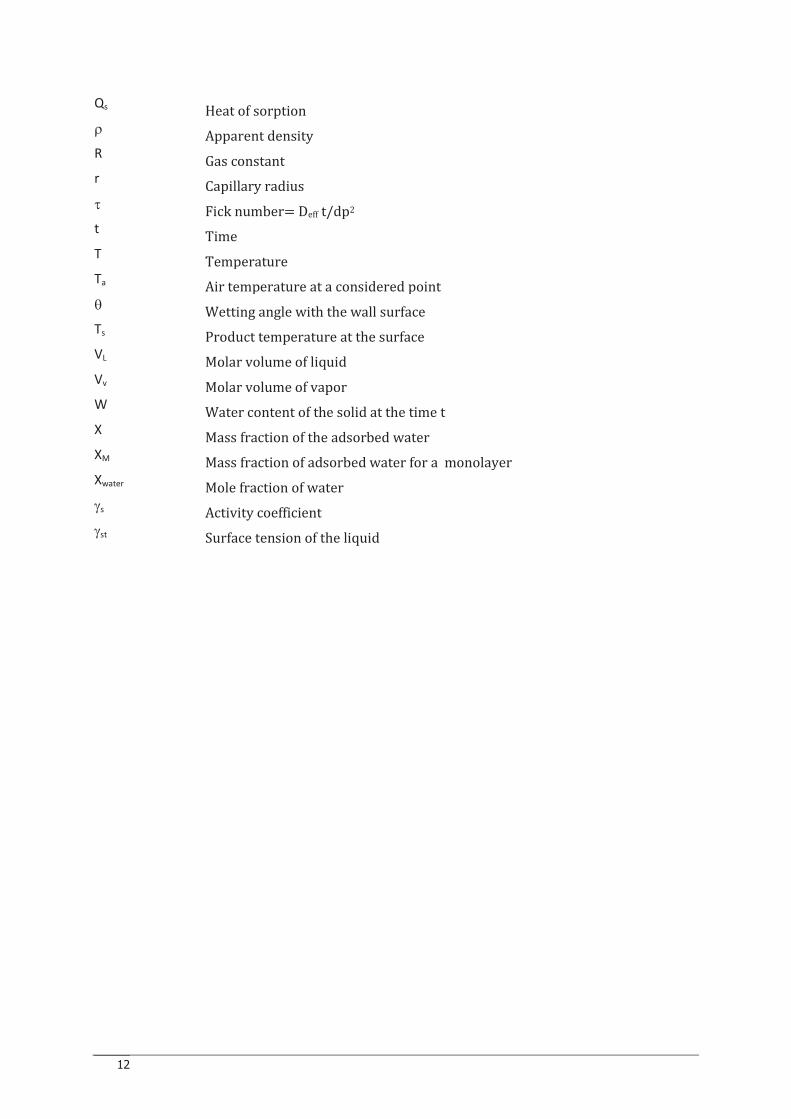
Qs Heat of sorption r Apparent density R
Gas constant r
Capillary radius t Fick number= Deff t/dp2 t
Time T
Temperature Ta Air temperature at a considered point q Wetting angle with the wall surface Ts Product temperature at the surface VL Molar volume of liquid Vv Molar volume of vapor W
Water content of the solid at the time t X
Mass fraction of the adsorbed water XM
Mass fraction of adsorbed water for a monolayer Xwater Mole fraction of water gs Activity coefficient gst Surface tension of the liquid
13
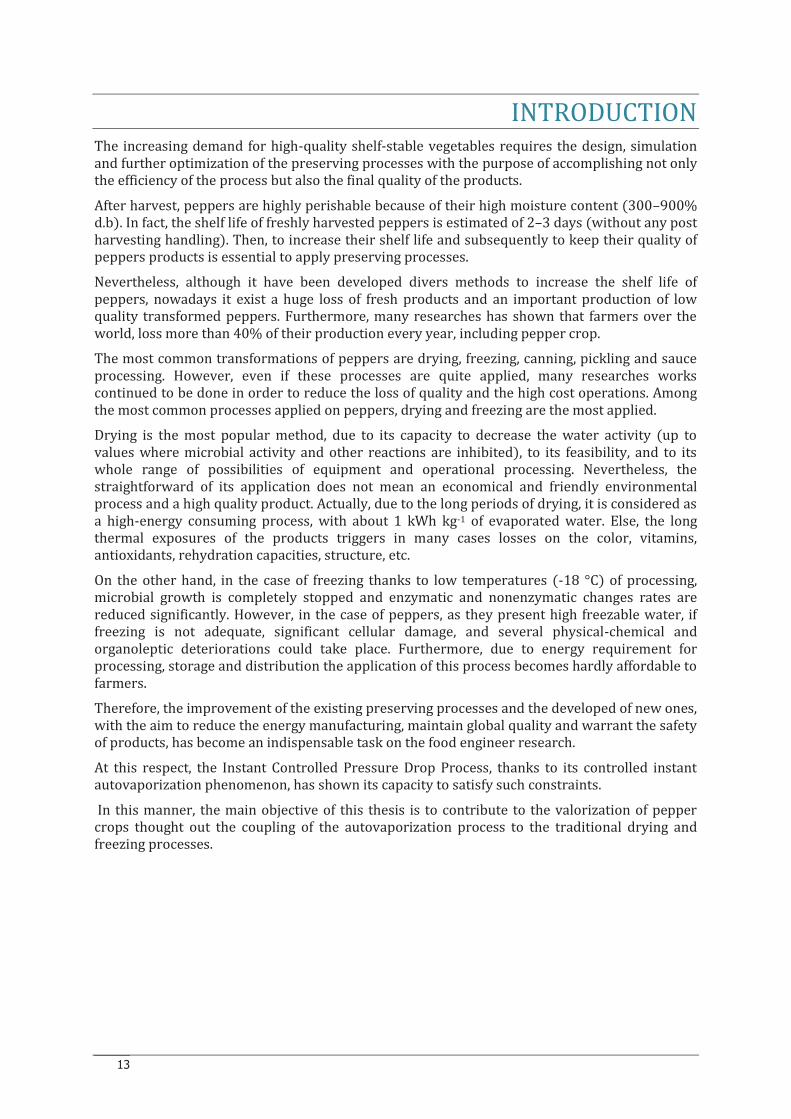
INTRODUCTION The increasing demand for high-quality shelf-stable vegetables requires the design, simulation and further optimization of the preserving processes with the purpose of accomplishing not only the efficiency of the process but also the final quality of the products.
After harvest, peppers are highly perishable because of their high moisture content (300–900% d.b). In fact, the shelf life of freshly harvested peppers is estimated of 2–3 days (without any post harvesting handling). Then, to increase their shelf life and subsequently to keep their quality of peppers products is essential to apply preserving processes.
Nevertheless, although it have been developed divers methods to increase the shelf life of peppers, nowadays it exist a huge loss of fresh products and an important production of low quality transformed peppers. Furthermore, many researches has shown that farmers over the world, loss more than 40% of their production every year, including pepper crop.
The most common transformations of peppers are drying, freezing, canning, pickling and sauce processing. However, even if these processes are quite applied, many researches works continued to be done in order to reduce the loss of quality and the high cost operations. Among the most common processes applied on peppers, drying and freezing are the most applied.
Drying is the most popular method, due to its capacity to decrease the water activity (up to values where microbial activity and other reactions are inhibited), to its feasibility, and to its whole range of possibilities of equipment and operational processing. Nevertheless, the straightforward of its application does not mean an economical and friendly environmental process and a high quality product. Actually, due to the long periods of drying, it is considered as a high-energy consuming process, with about 1 kWh kg-1 of evaporated water. Else, the long thermal exposures of the products triggers in many cases losses on the color, vitamins, antioxidants, rehydration capacities, structure, etc.
On the other hand, in the case of freezing thanks to low temperatures (-18 °C) of processing, microbial growth is completely stopped and enzymatic and nonenzymatic changes rates are reduced significantly. However, in the case of peppers, as they present high freezable water, if freezing is not adequate, significant cellular damage, and several physical-chemical and organoleptic deteriorations could take place. Furthermore, due to energy requirement for processing, storage and distribution the application of this process becomes hardly affordable to farmers.
Therefore, the improvement of the existing preserving processes and the developed of new ones, with the aim to reduce the energy manufacturing, maintain global quality and warrant the safety of products, has become an indispensable task on the food engineer research.
At this respect, the Instant Controlled Pressure Drop Process, thanks to its controlled instant autovaporization phenomenon, has shown its capacity to satisfy such constraints.
In this manner, the main objective of this thesis is to contribute to the valorization of pepper crops thought out the coupling of the autovaporization process to the traditional drying and freezing processes.

14
PART I.
STATE OF ART
15
CHAPTER I-1.
RELEVANCE OF PEPPER (CAPSICUM SPP.) CROP
I-1.1. Introduction
Peppers are popular vegetables because of the combination of color, taste and nutritional value [1]. In fact, the high interest of their cultivation is due to their use as seasonings in culinary preparations and to their applications on divers industries [2].
Furthermore, mainly because of their characteristics of pungency, they have been used all over the world in their raw and processed states (cooked, fried, dried, canned, frozen, pickled, etc.), as a basic ingredient in a great variety of diets [2-4].
Its applications on divers industries are also highly spreading. Food industry employs them widely as coloring and flavoring agents in sauces, soups, processed meats, lunches, sweetmeats, salad dressings, cheeses, butters, condiment mixtures, and alcoholic beverages [1, 2].
Else, thanks to their active pungent ingredients “capsaicinoids” they have also a significant role in pharmacy [5]. Indeed, many studies have shown their therapeutic properties such as topical analgesic, tonic, antiseptic, carminative and counterirritant. They have also been used for a number of ailments such as rheumatism, pain, arthritis, neuralgia, itching, lumbago, psoriasis, diabetic neuropathy, cluster headache and spasms. [5-7]. It has prevented allergies, reduced the levels of circulating proinflammatory cytokines, modulated gene expression and cell cycle progression, prevented some forms of cancer and neurological (Alzheimer, Parkinson, Huntington and cerebral ischemia) and cardiovascular diseases, among others [8, 9]. In traditional medicine they have also been employed as antimicrobial and insecticide[10].
Moreover, the oil soluble extract obtained from pungent peppers, well known as oleoresins, are also used on pharmaceuticals products, the formulations of nutraceuticals and colorants for food and cosmetics industries [11, 12] and the manufacturing of irritant sprays [5].
Therefore, due to this extensive use, the improvement on the quality of raw and transformed pepper products is highly important.
I-1.2. History
The origin of pepper has been archeologically defined from primitive communities of America [10, 13]. In fact, found microfossils at the states of Puebla and Tamaulipas, designate Mexico, as the country were exists the oldest evidence of its culture, 7500 B.C. [14] [5].
Furthermore, it is thought that domestication began perhaps 5000 years ago, by different groups within different regions independently and that the process may have begun when peppers were given a privileged status as a tolerated weed [15].
Historically, peppers are associated with the voyage of Columbus, who went to the new world looking for the black pepper “Piper nigrum L.” of Asia and found the genus, Capsicum. He thought he had reached the Indies, therefore he named the people “Indians” and the Capsicum spice “Piper”, subsequently creating endless confusion [16]. Nowadays, they are commonly called pepper, chili, chile, chilli, aji, pimiento, paprika, Capsicum, among other names.
The original Mexican term, chilli (now chile in Mexico) came from the Nahuatl word chilli or xilli, referring to plants now knows as Capsicum variety. The botanical name of chilli is the Latin name Capsicum, word that comes from a Greek based derivative on Latin “Kapto” meaning “to bite” [17].
By the time the Spanish arrived in America, native people had already developed dozens of varieties of peppers, being domesticated at least five times in different parts of South and Middle
16
America. Then, when Spanish colonies started the commerce of peppers, the five domesticated species (C. annuum L., C. baccatum L., C. chinense Jacq., C. frutescens L., and C. pubescen) spread rapidly into the world [15], enabling peppers being part of the world’s people staple diet. I-1.3. Botanical classification of peppers
Pepper fruits are considered to be vegetables, but botanically speaking, they are berries. In fact, they are usually classified by fruit characteristics, i.e., pungency, color, fruit shape, as well as by their use. They belong to the Solanaceae family and to the genus Capsicum [16]. Table 1 shows an example of the taxonomy of cayenne pepper [18].
Table 1. Taxonomy of cayenne pepper Kingdom Plantae – Plants Subkingdom Tracheobionta – Vascular plants Superdivision Spermatophyta – Seed plants Division Magnoliophyta Flowering plants Class Magnoliopsida – Dicotyledons Subclass Asteridae Order Solanales Family Solanaceae Genus Capsicum L. – pepper Species Capsicum annuum L. Variety Capsicum annuum L. var. annuum- cayenne pepper
The genus Capsicum includes more than 200 wild and domesticated species, which vary widely in size, shape, flavour and sensory heat [19] [20] [2]. According to recent taxonomist studies, only around 30 species are domesticated [6]. Among the domesticated species, the most consumed fruits belongs to C.annuum, C.frutescens, C. chinense, C. baccatum and C. pubescens [5, 15, 16, 21, 22] (Table 2)
Table 2. Common varieties of capsicum Variety Common name C. annuum Red bell pepper, jalapeño, paprika , Poblano, cherry, chili pepper,
cayenne C. Chinese Habanero, aji dulce, rica red, rocotillo, Scotch Bonnet C. frutescens Tabasco C. pubescens Manzano, perón, rocoto C. baccatum Yellow, aji,
Furthermore as all these fruits varied from non-pungent to very pungent, one more popular classification of peppers is: hot and sweet peppers [16].
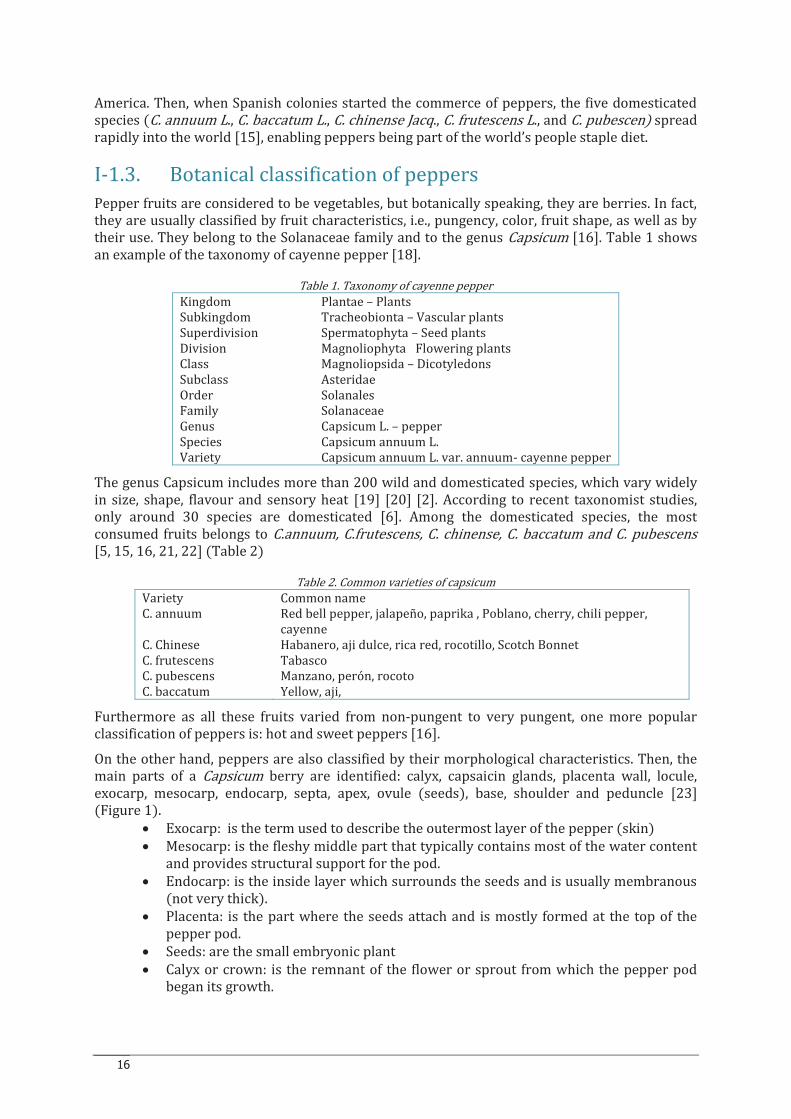
On the other hand, peppers are also classified by their morphological characteristics. Then, the main parts of a Capsicum berry are identified: calyx, capsaicin glands, placenta wall, locule, exocarp, mesocarp, endocarp, septa, apex, ovule (seeds), base, shoulder and peduncle [23] (Figure 1).
· Exocarp: is the term used to describe the outermost layer of the pepper (skin) · Mesocarp: is the fleshy middle part that typically contains most of the water content
and provides structural support for the pod. · Endocarp: is the inside layer which surrounds the seeds and is usually membranous
(not very thick). · Placenta: is the part where the seeds attach and is mostly formed at the top of the
pepper pod. · Seeds: are the small embryonic plant · Calyx or crown: is the remnant of the flower or sprout from which the pepper pod
began its growth.
17
· Capsaicin Glands: are the glands where capsaicin is produced, founded just between the placenta and endocarp. Most concentrations are near the top about where the seeds are.
· Apex: is the top of the fruit · Peduncle: is the botanical term for the stem
Figure 1. Main part of capsicum fruit
I-1.4. Physiochemical composition
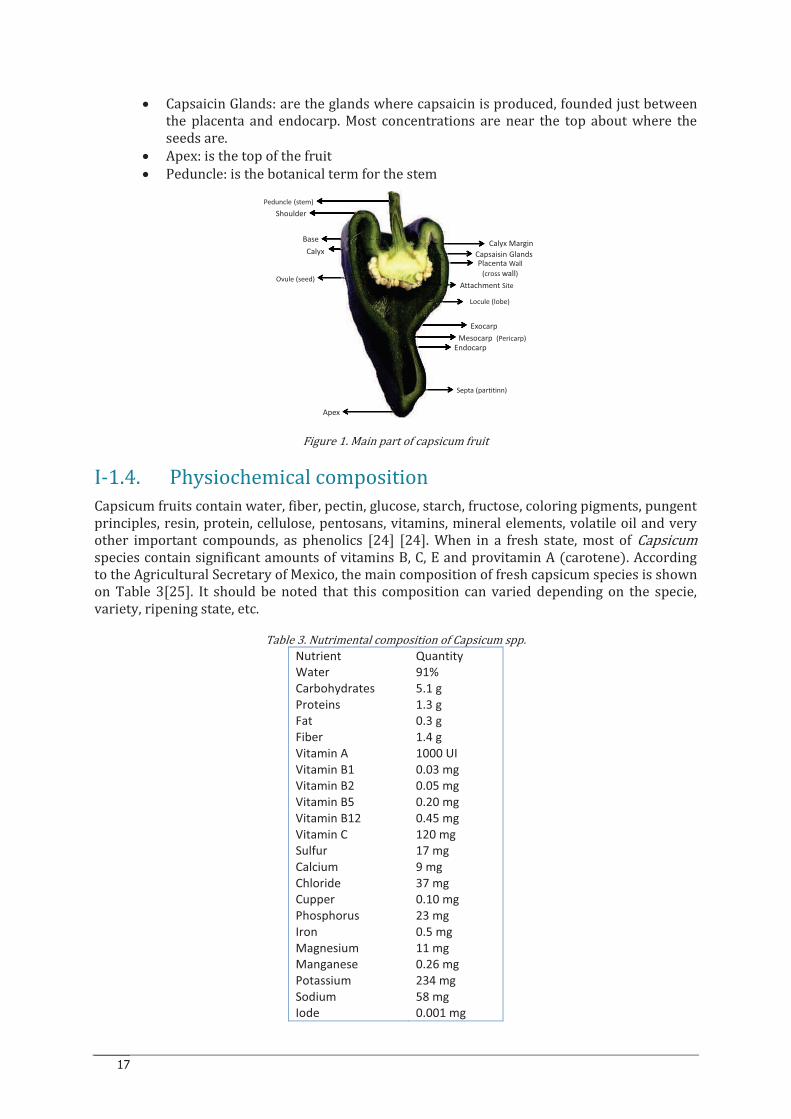
Capsicum fruits contain water, fiber, pectin, glucose, starch, fructose, coloring pigments, pungent principles, resin, protein, cellulose, pentosans, vitamins, mineral elements, volatile oil and very other important compounds, as phenolics [24] [24]. When in a fresh state, most of Capsicum species contain significant amounts of vitamins B, C, E and provitamin A (carotene). According to the Agricultural Secretary of Mexico, the main composition of fresh capsicum species is shown on Table 3[25]. It should be noted that this composition can varied depending on the specie, variety, ripening state, etc.
Table 3. Nutrimental composition of Capsicum spp. Nutrient Quantity Water 91% Carbohydrates 5.1 g Proteins 1.3 g Fat 0.3 g Fiber 1.4 g Vitamin A 1000 UI Vitamin B1 0.03 mg Vitamin B2 0.05 mg Vitamin B5 0.20 mg Vitamin B12 0.45 mg Vitamin C 120 mg Sulfur 17 mg Calcium 9 mg Chloride 37 mg Cupper 0.10 mg Phosphorus 23 mg Iron 0.5 mg Magnesium 11 mg Manganese 0.26 mg Potassium 234 mg Sodium 58 mg Iode 0.001 mg
Calyx Margin
Capsaisin GlandsPlacenta Wall
(cross wall)
Attachment Site
Locule (lobe)
Exocarp
Mesocarp (Pericarp)
Endocarp
Septa (partitinn)
Apex
Ovule (seed)
Calyx
Base
Shoulder
Peduncle (stem)
18
I-1.5. Main quality characteristics of peppers
The quality factors of fresh and processed pepper depend on the ulterior applications of the products. In a general way, researched characteristics are good color, well size, good shape, normal seed content, pungency, flavor, aroma and nutritional value preservation, freedom of damage and safety (freedom of dirt, dust, moulds, insects and foreign matter),.
The colour of spices is important from the point of view of quality as well as economic worth. In fact, many of the applications of pepper are related to its varied flavors and colors, i.e. natural colorants production. The color of C. annuum fruits is variable, starting from green, yellow or white for the unripe fruit, and turning to red, dark red, brown and sometimes almost black in the ripe state. The color variation in the full-ripe stage of each variety, depends on its capacity for synthesizing carotenoids and even for retaining chlorophyll pigments [26]
The color value of pepper is usually expressed in terms of ASTA color value (American Spice Trade Association), which is the extractable color presented in peppers[27]. Nevertheless, as color is a highly important parameter of quality pepper, some producers resort the use of adulterants as starch, synthetic coloring, turmeric powder, beet pulp, etc. Therefore, an increasing interest of research to identify adulterants and preserve the natural colors has been developed during the last years [28-32].
On the other hand, pepper is an important agricultural crop because its nutritional value [33]. In fact, they can accumulate in their cells a great variety of phytochemicals including alkaloids, flavonoids, tannins, capsaicins, saponins, cyanogenic glycosides, phenolic compounds, lignin and lignans, carotenoids among other compoudns which make of them an excellent source of vitamins and antioxidant compounds [34] [35] [36]. Therefore, peppers play a relevant role on human health thanks to their content of bioactive and antioxidant compounds.
I-1.6. World production and consumption
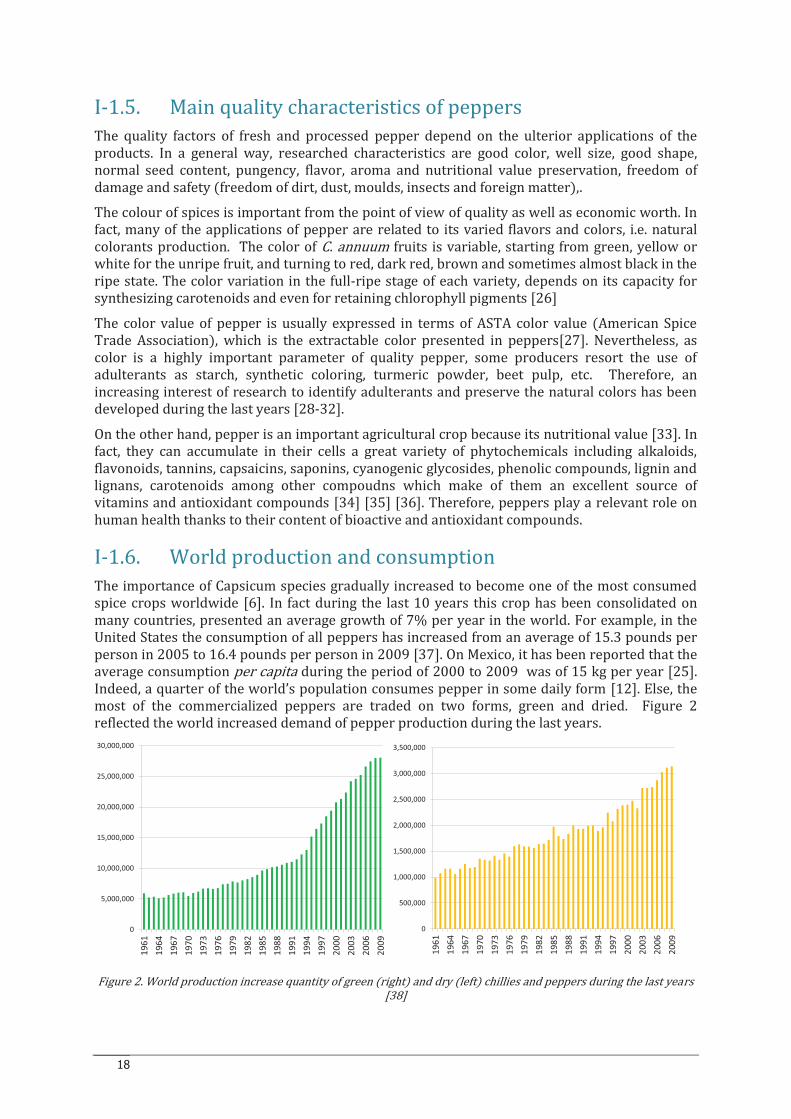
The importance of Capsicum species gradually increased to become one of the most consumed spice crops worldwide [6]. In fact during the last 10 years this crop has been consolidated on many countries, presented an average growth of 7% per year in the world. For example, in the United States the consumption of all peppers has increased from an average of 15.3 pounds per person in 2005 to 16.4 pounds per person in 2009 [37]. On Mexico, it has been reported that the average consumption per capita during the period of 2000 to 2009 was of 15 kg per year [25]. Indeed, a quarter of the world’s population consumes pepper in some daily form [12]. Else, the most of the commercialized peppers are traded on two forms, green and dried. Figure 2 reflected the world increased demand of pepper production during the last years.
Figure 2. World production increase quantity of green (right) and dry (left) chillies and peppers during the last years [38]
0
5,000,000
10,000,000
15,000,000
20,000,000
25,000,000
30,000,000
19
61
19
64
19
67
19
70
197
3
19
76
19
79
19
82
19
85
19
88
19
91
19
94
19
97
20
00
20
03
200
6
20
09
0
500,000
1,000,000
1,500,000
2,000,000
2,500,000
3,000,000
3,500,000
19
61
19
64
19
67
19
70
19
73
19
76
19
79
19
82
19
85
19
88
19
91
19
94
19
97
20
00
20
03
20
06
20
09
19
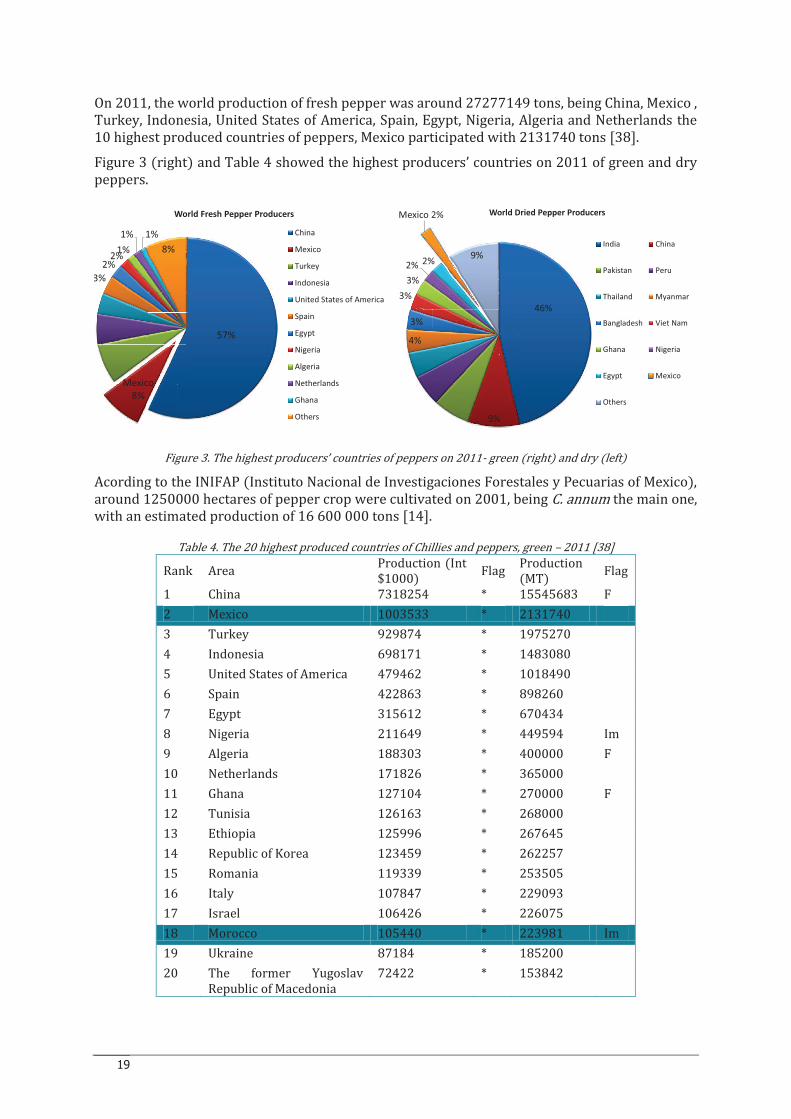
On 2011, the world production of fresh pepper was around 27277149 tons, being China, Mexico , Turkey, Indonesia, United States of America, Spain, Egypt, Nigeria, Algeria and Netherlands the 10 highest produced countries of peppers, Mexico participated with 2131740 tons [38].
Figure 3 (right) and Table 4 showed the highest producers’ countries on 2011 of green and dry peppers.
Figure 3. The highest producers’ countries of peppers on 2011- green (right) and dry (left)
Acording to the INIFAP (Instituto Nacional de Investigaciones Forestales y Pecuarias of Mexico), around 1250000 hectares of pepper crop were cultivated on 2001, being C. annum the main one, with an estimated production of 16 600 000 tons [14].
Table 4. The 20 highest produced countries of Chillies and peppers, green – 2011 [38]
Rank Area Production (Int $1000)
Flag Production (MT)
Flag
1 China 7318254 * 15545683 F
2 Mexico 1003533 * 2131740
3 Turkey 929874 * 1975270
4 Indonesia 698171 * 1483080
5 United States of America 479462 * 1018490
6 Spain 422863 * 898260
7 Egypt 315612 * 670434
8 Nigeria 211649 * 449594 Im
9 Algeria 188303 * 400000 F
10 Netherlands 171826 * 365000
11 Ghana 127104 * 270000 F
12 Tunisia 126163 * 268000
13 Ethiopia 125996 * 267645
14 Republic of Korea 123459 * 262257
15 Romania 119339 * 253505
16 Italy 107847 * 229093
17 Israel 106426 * 226075
18 Morocco 105440 * 223981 Im
19 Ukraine 87184 * 185200
20 The former Yugoslav Republic of Macedonia
72422 * 153842
57%
Mexico 8%
3%
2%2%
1%
1% 1%
8%
World Fresh Pepper Producers
China
Mexico
Turkey
Indonesia
United States of America
Spain
Egypt
Nigeria
Algeria
Netherlands
Ghana
Others
46%
9%
4%
3%
3%
3%
2% 2%
Mexico 2%
9%
World Dried Pepper Producers
India China
Pakistan Peru
Thailand Myanmar
Bangladesh Viet Nam
Ghana Nigeria
Egypt Mexico
Others

20
*: Unofficial figure, [ ]: Official data, F: FAO estimate, Im: FAO data based on imputation methodology
Respect to dried pepper on 2011, the world production of dried peppers was of 3118466 tons. Being India, China, Pakistan, Peru, Thailand, Myanmar, Bangladesh, Viet Nam, Ghana and Nigeria the 10 highest producers of dried pepper. Mexico ranked 12 with 59189 tons (Figure 3 (left) and Table 5).
Table 5. The 20 highest produced countries of dry Chillies and peppers, dry – 2011 [38]
Rank Area Production (Int $1000)
Flag Production (MT)
Flag
1 India 1583934 * 1445950 Im
2 China 309285 * 282342 Im
3 Pakistan 222299 * 202934 Im
4 Peru 188335 * 171929
5 Thailand 152617 * 139322 Im
6 Myanmar 136184 * 124321 Im
7 Bangladesh 119046 * 108676 Im
8 Viet Nam 98589 * 90001 Im
9 Ghana 96397 * 88000 F
10 Nigeria 71444 * 65221 Im
11 Egypt 68294 * 62345 Im
12 Mexico 64837 * 59189 Im
13 Ethiopia 58019 * 52965 Im
14 Romania 52240 * 47690 Im
15 Democratic Republic of the Congo
43221 * 39456 Im
16 Morocco 30915 * 28222 Im
17 Benin 30671 * 28000 F
18 Côte d'Ivoire 30407 * 27759 Im
19 Bosnia and Herzegovina 29837 * 27238 Im
20 Hungary 29473 * 26906 Im
*: Unofficial figure [ ]: Official data F: FAO estimate Im: FAO data based on imputation methodology
I-1.7. The relevance of pepper crop on Mexico
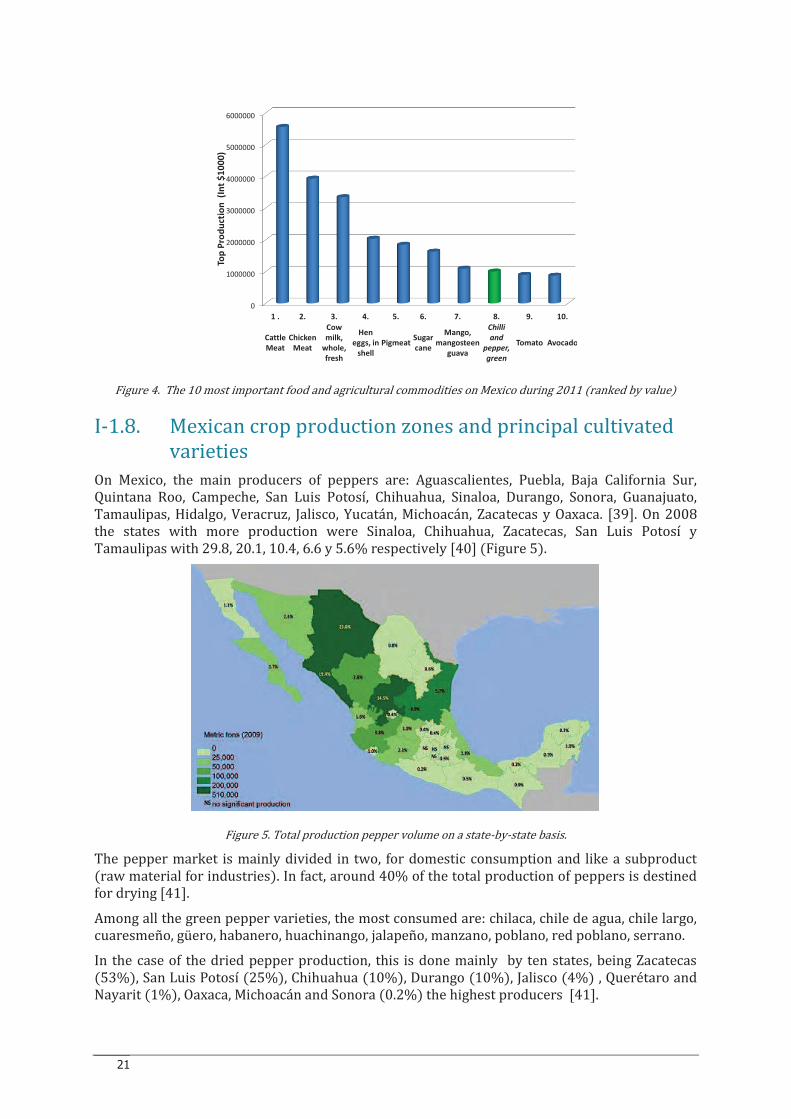
As mentioned before, peppers have been cultivated in Mexico for centuries, becoming along this time, not only a nutrient but also a national tradition and cultural identity. In fact, pepper (Capsicum sp.) is one of most economical important crop on Mexico [8, 20]. Due to the vast quantity and the diverse varieties used, on 2011, they were part of the 10 most important food and agricultural commodities of the country [38] (Figure 4).
21
Figure 4. The 10 most important food and agricultural commodities on Mexico during 2011 (ranked by value)
I-1.8. Mexican crop production zones and principal cultivated
varieties
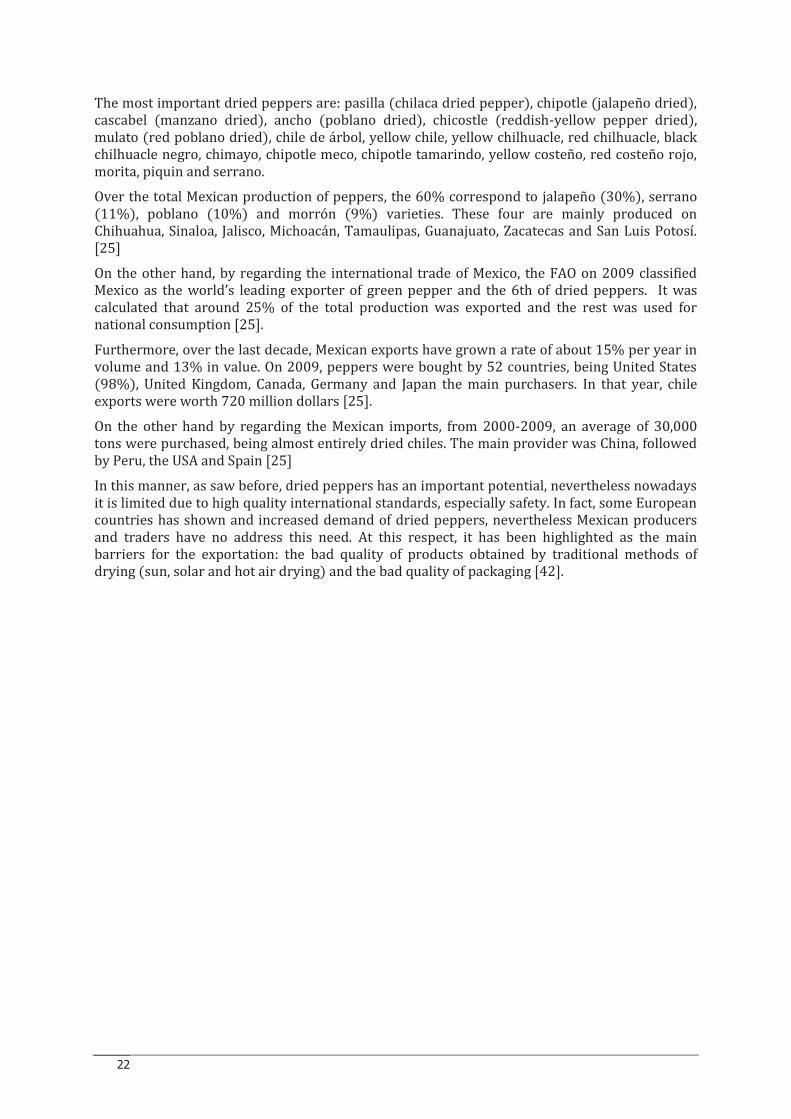
On Mexico, the main producers of peppers are: Aguascalientes, Puebla, Baja California Sur, Quintana Roo, Campeche, San Luis Potosí, Chihuahua, Sinaloa, Durango, Sonora, Guanajuato, Tamaulipas, Hidalgo, Veracruz, Jalisco, Yucatán, Michoacán, Zacatecas y Oaxaca. [39]. On 2008 the states with more production were Sinaloa, Chihuahua, Zacatecas, San Luis Potosí y Tamaulipas with 29.8, 20.1, 10.4, 6.6 y 5.6% respectively [40] (Figure 5).
Figure 5. Total production pepper volume on a state-by-state basis.
The pepper market is mainly divided in two, for domestic consumption and like a subproduct (raw material for industries). In fact, around 40% of the total production of peppers is destined for drying [41].
Among all the green pepper varieties, the most consumed are: chilaca, chile de agua, chile largo, cuaresmeño, güero, habanero, huachinango, jalapeño, manzano, poblano, red poblano, serrano.
In the case of the dried pepper production, this is done mainly by ten states, being Zacatecas (53%), San Luis Potosí (25%), Chihuahua (10%), Durango (10%), Jalisco (4%) , Querétaro and Nayarit (1%), Oaxaca, Michoacán and Sonora (0.2%) the highest producers [41].
0
1000000
2000000
3000000
4000000
5000000
6000000
Top
Pro
du
ctio
n (
Int
$1
00
0)
1 . 2. 3. 4. 5. 6. 7. 8. 9. 10.
Cattle
Meat
Chicken
Meat
Cow
milk,
whole,
fresh
Hen
eggs, in
shell
PigmeatSugar
cane
Mango,
mangosteen
guava
Chilli
and
pepper,
green
Tomato Avocado
22
The most important dried peppers are: pasilla (chilaca dried pepper), chipotle (jalapeño dried), cascabel (manzano dried), ancho (poblano dried), chicostle (reddish-yellow pepper dried), mulato (red poblano dried), chile de árbol, yellow chile, yellow chilhuacle, red chilhuacle, black chilhuacle negro, chimayo, chipotle meco, chipotle tamarindo, yellow costeño, red costeño rojo, morita, piquin and serrano.
Over the total Mexican production of peppers, the 60% correspond to jalapeño (30%), serrano (11%), poblano (10%) and morrón (9%) varieties. These four are mainly produced on Chihuahua, Sinaloa, Jalisco, Michoacán, Tamaulipas, Guanajuato, Zacatecas and San Luis Potosí. [25]
On the other hand, by regarding the international trade of Mexico, the FAO on 2009 classified Mexico as the world’s leading exporter of green pepper and the 6th of dried peppers. It was calculated that around 25% of the total production was exported and the rest was used for national consumption [25].
Furthermore, over the last decade, Mexican exports have grown a rate of about 15% per year in volume and 13% in value. On 2009, peppers were bought by 52 countries, being United States (98%), United Kingdom, Canada, Germany and Japan the main purchasers. In that year, chile exports were worth 720 million dollars [25].
On the other hand by regarding the Mexican imports, from 2000-2009, an average of 30,000 tons were purchased, being almost entirely dried chiles. The main provider was China, followed by Peru, the USA and Spain [25]
In this manner, as saw before, dried peppers has an important potential, nevertheless nowadays it is limited due to high quality international standards, especially safety. In fact, some European countries has shown and increased demand of dried peppers, nevertheless Mexican producers and traders have no address this need. At this respect, it has been highlighted as the main barriers for the exportation: the bad quality of products obtained by traditional methods of drying (sun, solar and hot air drying) and the bad quality of packaging [42].
23
CHAPTER I-2.
COMMON PRESERVATION METHODS APPLIED ON
PEPPERS
I-2.1. Introduction
After harvest, peppers are highly perishable because of their high moisture content (300–900% d.b). In fact, the shelf life of freshly harvested peppers is estimated of 2–3 days (without any post harvesting handling)[43]. Then, is essential to apply food preserving processes to increase their shelf life and subsequently keep their quality. The most common transformations of peppers are drying, freezing, canning, pickling and sauce processing.
The aim of drying is to reduce the moisture content of peppers and to prevent the development of microflora and the consequent loss of quality or total spoilage [44]. In most of the cases, drying is done by smoked, hot air dried, sun and solar dried. However, even if these processes have been quite applied, many studies continued to take place to reduce the long periods of processing, which affects the final quality and further applications of the products.
In the case of freezing thanks to low temperatures (-18 °C) of processing, microbial growth is retarded and enzymatic and nonenzymatic changes rates are reduced significantly [45]. This process is highly popular on developed countries, and when carried under the optimum conditions it is well appreciated for its capacity to preserve sensory and nutritional attributes. Nevertheless, when the freezing rate is slow, pepper lose their crispness texture. Else, because of its high cost of processing, storage and transport many developing countries have no access to this process [46]. Then, it is required to improve the freezing process, in order to keep their quality and to make it more affordable.
The canning pepper is also claimed by consumers, in fact its thermal processing conditions allows to kill or inhibit pathogen microorganism, and extend considerably their shelf life (around two years). To avoid the presence of pathogen microorganism, mainly the Clostridium botulinum, this operation is carried out at 121 °C at least for 2.4 minutes at the coldest point, on acid conditions (pH of 4.6). Even if the conditions of treatments assure the safety of the canned products, the prolonged exposure to high temperatures, causes an excessively soft of fruits and a general quality loss [47, 48]. To minimize the textural damage, additives has been used, as calcium treatments [49].
The pickling or brining pepper processes involves adding sufficient quantities of salts and acetic acid to prevent microbial spoilage. The effectiveness of brining for preservation is related to the rate of acid diffusion into all parts of the fruits, and to the time to reach an equilibrium pH of 4.6 or lower. Industrial operations are carried out in two steps, a first brining period of 2-8 weeks, followed by a washing and a second step of brining. The first week of brining is the most critical. The textural qualities of pickling peppers is considered superior of those of canned peppers, nevertheless this process requires also additional preservatives as calcium chloride to improve the firming of products [48].
Sauce processing is another recurrent preserving process. In fact, hot sauces are found in much gastronomy as “harissa” from the Middle East, chili oil from China (known as rāyu in Japan), habanero sauces in Central America and “sriracha” from Thailand. Generally the industrial processes to obtain sauces are evaporation and mixing. The partial concentration of the pepper puree is carried out on automatic continuous evaporators. Therefore, quality loss depends on the control of temperature and time of processing [45].
24
I-2.2. DRYING OF PEPPER
Despite the existence of many preserved process applied to peppers, drying continuous to be one of the most popular method. Thanks to its capacity to decrease the water activity (up to values where microbial activity and other reactions are inhibited), to its feasibility, and to its whole range of possibilities of equipment and operational processing, it remains an important method to preserve the peppers products. Nowadays, the main drying processes applied on peppers are: the sun and solar drying, the smoking and the hot air drying.
I-2.2.A. Open air sun drying
The sun drying is the most widely used methods throughout the developing countries of Asia, Africa, Central and South America [43]. It consists to spread out peppers on miscellaneous surfaces (dry ground, concrete floor, polyethylene sheets, houses’ roofs, etc.) and to expose them directly to solar radiation, wind and other enviromental conditions. Then, according to the weather, mainly the solar radiation, the wind velocity, the ambient temperature and relative humidity, the whole period of drying varied from 8-21 days [7, 24, 43, 50].
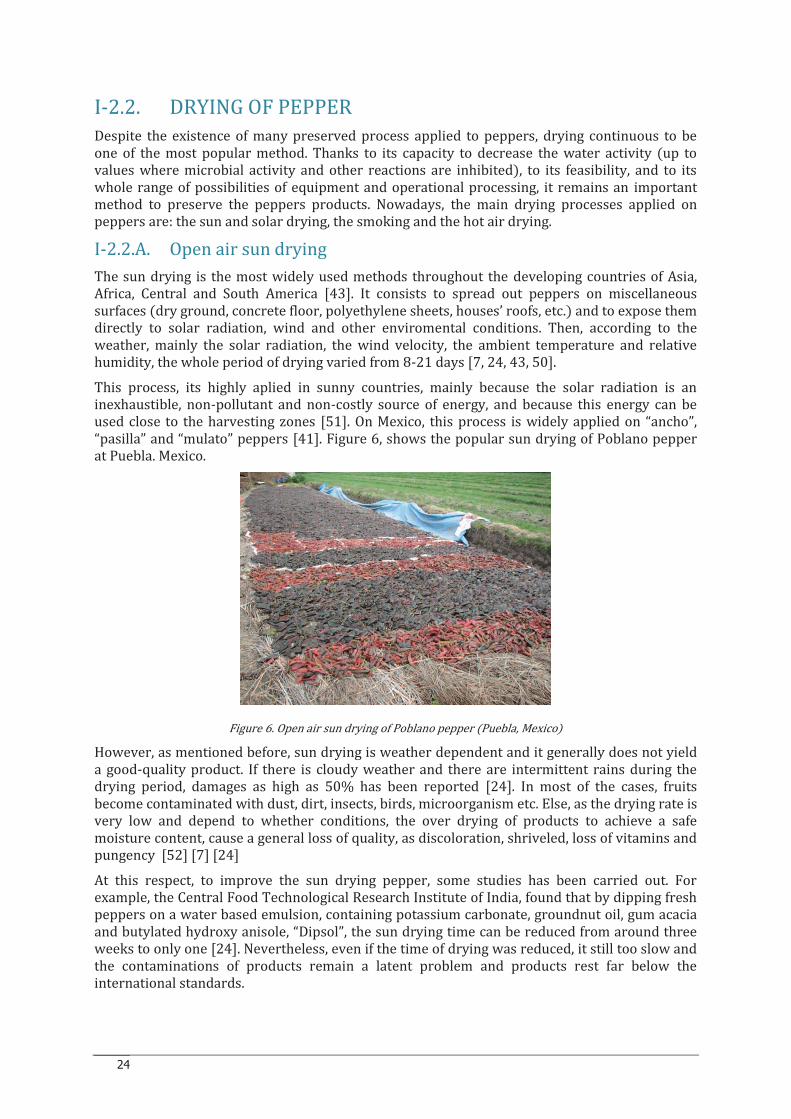
This process, its highly aplied in sunny countries, mainly because the solar radiation is an inexhaustible, non-pollutant and non-costly source of energy, and because this energy can be used close to the harvesting zones [51]. On Mexico, this process is widely applied on “ancho”, “pasilla” and “mulato” peppers [41]. Figure 6, shows the popular sun drying of Poblano pepper at Puebla. Mexico.
Figure 6. Open air sun drying of Poblano pepper (Puebla, Mexico)
However, as mentioned before, sun drying is weather dependent and it generally does not yield a good-quality product. If there is cloudy weather and there are intermittent rains during the drying period, damages as high as 50% has been reported [24]. In most of the cases, fruits become contaminated with dust, dirt, insects, birds, microorganism etc. Else, as the drying rate is very low and depend to whether conditions, the over drying of products to achieve a safe moisture content, cause a general loss of quality, as discoloration, shriveled, loss of vitamins and pungency [52] [7] [24]
At this respect, to improve the sun drying pepper, some studies has been carried out. For example, the Central Food Technological Research Institute of India, found that by dipping fresh peppers on a water based emulsion, containing potassium carbonate, groundnut oil, gum acacia and butylated hydroxy anisole, “Dipsol”, the sun drying time can be reduced from around three weeks to only one [24]. Nevertheless, even if the time of drying was reduced, it still too slow and the contaminations of products remain a latent problem and products rest far below the international standards.
25
I-2.2.B. Solar drying
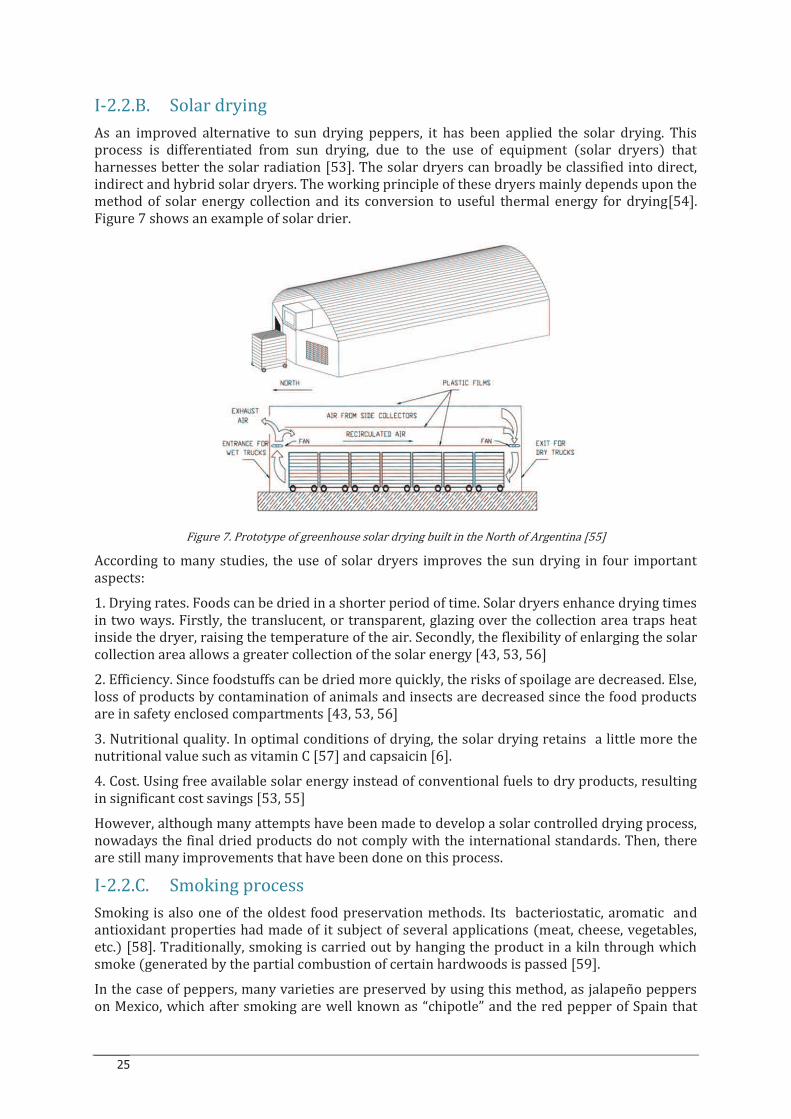
As an improved alternative to sun drying peppers, it has been applied the solar drying. This process is differentiated from sun drying, due to the use of equipment (solar dryers) that harnesses better the solar radiation [53]. The solar dryers can broadly be classified into direct, indirect and hybrid solar dryers. The working principle of these dryers mainly depends upon the method of solar energy collection and its conversion to useful thermal energy for drying[54]. Figure 7 shows an example of solar drier.
Figure 7. Prototype of greenhouse solar drying built in the North of Argentina [55]
According to many studies, the use of solar dryers improves the sun drying in four important aspects:
1. Drying rates. Foods can be dried in a shorter period of time. Solar dryers enhance drying times in two ways. Firstly, the translucent, or transparent, glazing over the collection area traps heat inside the dryer, raising the temperature of the air. Secondly, the flexibility of enlarging the solar collection area allows a greater collection of the solar energy [43, 53, 56]
2. Efficiency. Since foodstuffs can be dried more quickly, the risks of spoilage are decreased. Else, loss of products by contamination of animals and insects are decreased since the food products are in safety enclosed compartments [43, 53, 56]
3. Nutritional quality. In optimal conditions of drying, the solar drying retains a little more the nutritional value such as vitamin C [57] and capsaicin [6].
4. Cost. Using free available solar energy instead of conventional fuels to dry products, resulting in significant cost savings [53, 55]
However, although many attempts have been made to develop a solar controlled drying process, nowadays the final dried products do not comply with the international standards. Then, there are still many improvements that have been done on this process.
I-2.2.C. Smoking process
Smoking is also one of the oldest food preservation methods. Its bacteriostatic, aromatic and antioxidant properties had made of it subject of several applications (meat, cheese, vegetables, etc.) [58]. Traditionally, smoking is carried out by hanging the product in a kiln through which smoke (generated by the partial combustion of certain hardwoods is passed [59].
In the case of peppers, many varieties are preserved by using this method, as jalapeño peppers on Mexico, which after smoking are well known as “chipotle” and the red pepper of Spain that
26
changes its name to “paprika” [60]. Even if this process confers a whole range of aromas, the slow drying could result in degradation processes associate with loss of sensorial and nutritional quality [61]. Moreover, the main disadvantage of this process lays on the generation of carcinogenic polycyclic aromatic hydrocarbons (PAH), due to the incomplete combustion of wood [62]. Then, to ensure the safety of the smoked peppers it is needed to identify the optimal conditions of smoking, in order to avoid or minimize the production of carcinogenic PAH.
In this manner, even if smoking confers new aromas to dried peppers, this process put in danger the health of consumers.
I-2.2.D. Hot air drying
In the look for the improvement of the sun and solar drying, since the 18th century new technologies based on artificial heat sources has been developed. In fact, the first record of artificial drying of food was applied on vegetables. In this experience, vegetables were blanching in hot water and then placed in a hot stove for drying [63]. Then, since this period the now commonly known hot air drying process has been applied.
The hot air drying is defined as the process where the heat to evaporate the water content of the food, is supplied by a hot stream of air. In fact, nowadays this method is one of the most applied for the preservation of vegetables and fruits, being its simplicity to be applied its main advantage [64].
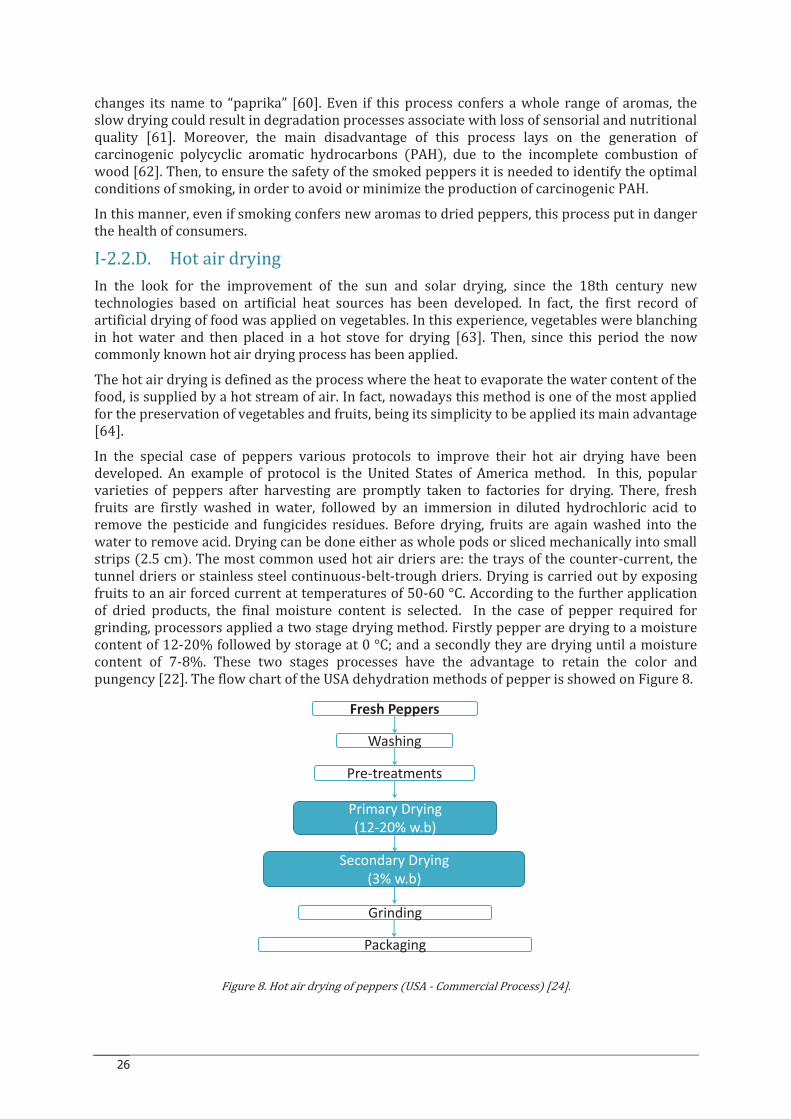
In the special case of peppers various protocols to improve their hot air drying have been developed. An example of protocol is the United States of America method. In this, popular varieties of peppers after harvesting are promptly taken to factories for drying. There, fresh fruits are firstly washed in water, followed by an immersion in diluted hydrochloric acid to remove the pesticide and fungicides residues. Before drying, fruits are again washed into the water to remove acid. Drying can be done either as whole pods or sliced mechanically into small strips (2.5 cm). The most common used hot air driers are: the trays of the counter-current, the tunnel driers or stainless steel continuous-belt-trough driers. Drying is carried out by exposing fruits to an air forced current at temperatures of 50-60 °C. According to the further application of dried products, the final moisture content is selected. In the case of pepper required for grinding, processors applied a two stage drying method. Firstly pepper are drying to a moisture content of 12-20% followed by storage at 0 °C; and a secondly they are drying until a moisture content of 7-8%. These two stages processes have the advantage to retain the color and pungency [22]. The flow chart of the USA dehydration methods of pepper is showed on Figure 8.
Figure 8. Hot air drying of peppers (USA - Commercial Process) [24].
Fresh Peppers
Washing
Pre-treatments
Primary Drying(12-20% w.b)
Secondary Drying(3% w.b)
Grinding
Packaging
27
Therefore, although the straightforward of the hot air drying method is not an economical and friendly environmental process. Actually, due to its long periods of drying, it is considered as a high-energy consuming process, it employs about 1 kWh kg-1 of evaporated water [65]. Else, the long thermal exposures of the products triggers in many cases losses on the color, vitamins, antioxidants, rehydration capacities, shrinkage structure, etc.
I-2.3. Freezing of peppers
Freezing is a widely used method on food preservation, as peppers. It has been successfully employed for the long-term preservation of many foods, providing a significantly extended shelf life.
Nowadays, in developed countries the freezing of foods represents a major industry. However, in developing countries it is hardly developed [46]. In the case of peppers, the demand for sliced and diced frozen raw peppers has been increasing considerably in the last years [4]; being the bell pepper, one of the most common preserved by this technology.
As on drying processing, there is a variety of available freezing systems. The industrial equipment for freezing can be categorized in many ways, namely as equipment used for batch or in-line operation, heat transfer systems (air, contact, cryogenic), and product stability.
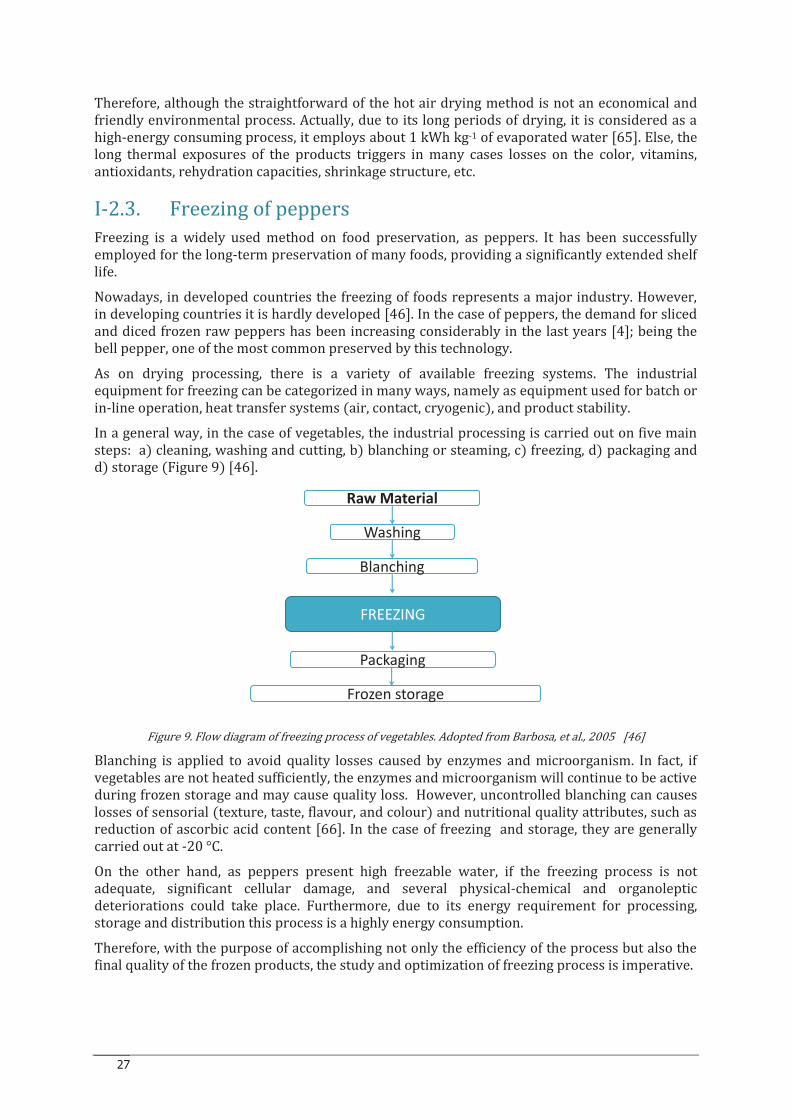
In a general way, in the case of vegetables, the industrial processing is carried out on five main steps: a) cleaning, washing and cutting, b) blanching or steaming, c) freezing, d) packaging and d) storage (Figure 9) [46].
Figure 9. Flow diagram of freezing process of vegetables. Adopted from Barbosa, et al., 2005 [46]
Blanching is applied to avoid quality losses caused by enzymes and microorganism. In fact, if vegetables are not heated sufficiently, the enzymes and microorganism will continue to be active during frozen storage and may cause quality loss. However, uncontrolled blanching can causes losses of sensorial (texture, taste, flavour, and colour) and nutritional quality attributes, such as reduction of ascorbic acid content [66]. In the case of freezing and storage, they are generally carried out at -20 °C.
On the other hand, as peppers present high freezable water, if the freezing process is not adequate, significant cellular damage, and several physical-chemical and organoleptic deteriorations could take place. Furthermore, due to its energy requirement for processing, storage and distribution this process is a highly energy consumption.
Therefore, with the purpose of accomplishing not only the efficiency of the process but also the final quality of the frozen products, the study and optimization of freezing process is imperative.
Raw Material
Washing
Blanching
FREEZING
Packaging
Frozen storage
28
CHAPTER I-3.
FUNDAMENTAL APROACH OF DRYING
I-3.1. Introduction
The drying process is different of the other dehydration process because water is eliminated from the product exclusively by evaporation. Then, the driving force of this process is the gradient of the partial pressure of water vapor between the surface of the product and the external environment. The evaporation of water at the surface depends on the temperature and the water activity at the surface of the material.
The partial pressure of water at the environment depends, in the case of the air as the heat transfer fluid, from the characteristics of the air (velocity, temperature and relative humidity). Nevertheless, as the increase of temperature causes a possible degradation of the material, the unique element of intensification that implies the lower risk of loss of quality, is the increase of the air velocity.
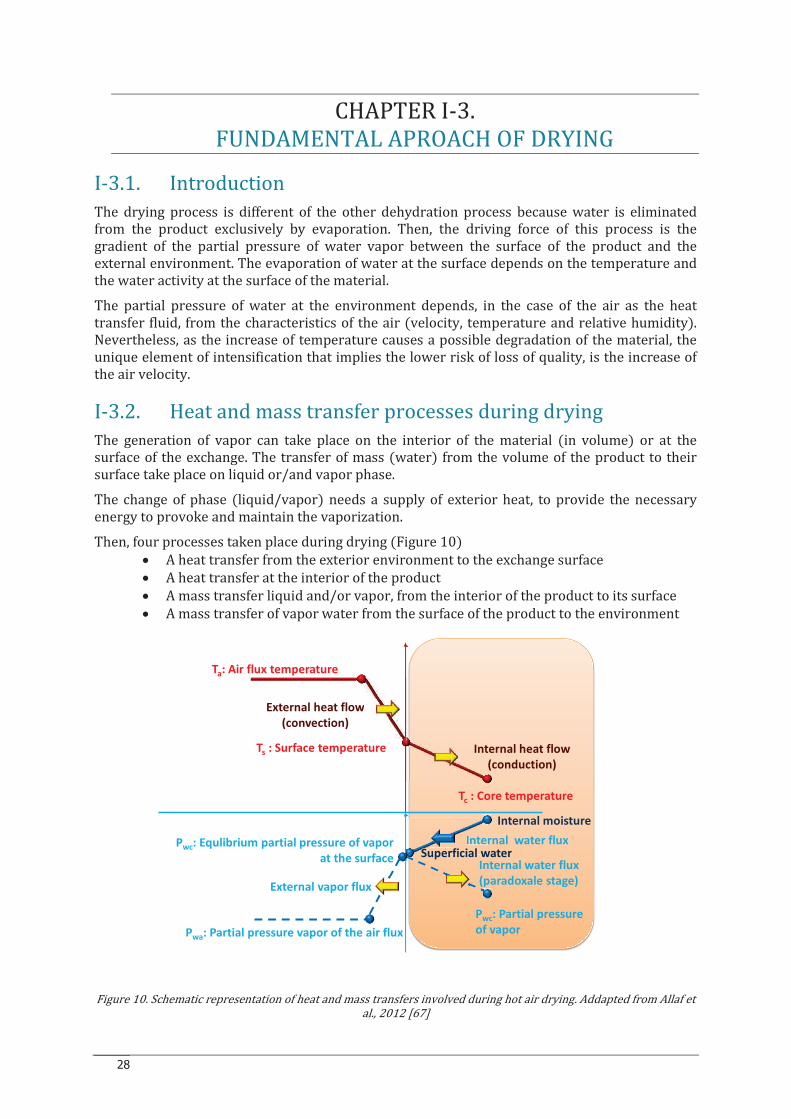
I-3.2. Heat and mass transfer processes during drying
The generation of vapor can take place on the interior of the material (in volume) or at the surface of the exchange. The transfer of mass (water) from the volume of the product to their surface take place on liquid or/and vapor phase.
The change of phase (liquid/vapor) needs a supply of exterior heat, to provide the necessary energy to provoke and maintain the vaporization.
Then, four processes taken place during drying (Figure 10) · A heat transfer from the exterior environment to the exchange surface · A heat transfer at the interior of the product · A mass transfer liquid and/or vapor, from the interior of the product to its surface · A mass transfer of vapor water from the surface of the product to the environment
Figure 10. Schematic representation of heat and mass transfers involved during hot air drying. Addapted from Allaf et al., 2012 [67]
Internal heat flow
(conduction)
Tc : Core temperature
Internal moisture
Internal water fluxSuperficial water
Internal water flux
(paradoxale stage)
Pwc: Partial pressure
of vaporPwa: Partial pressure vapor of the air flux
External vapor flux
Pwc: Equlibrium partial pressure of vapor
at the surface
Ts : Surface temperature
External heat flow
(convection)
Ta: Air flux temperature
InternSuSuSuSuSuSuSuSuSuSuSuSuSuperficial wa
at
ow
Inte
29
Even if there exist simultaneity of the four processes of heat and transfer, the whole process take place in causality series. Then, in terms of kinetics, the slowest process determines the drying rate.
On the interior of the product, the heat and mass transfers are based on the action of temperature and concentration (water) gradients respectively.
I-3.2.A. External transfers
The drying operation needs the presence of mass transfer (water vapor) from the surface of the product to the external environment. Then, the establishing and maintain of the partial pressure of water vapor from the surface to the environment is essential.
This process has to be closely linked to the heat transfer in order to: · Maintain the exchange surface of the material at a temperature that ensure the best
partial pressure of vapor water (without taking into account the quality preservation of the product)
· Provide the necessary heat flow for the change of phase (liquid-vapor or in the case of sublimation solid – vapor)
The heat could be transfered to the surface by convection (from the air or from the superheated steam), by conduction (through a plate or heat carpet) or by radiation (infrared). In the case of microwaves the heating is consider throughout their volume (instead of through its outer surface) [68].
In the case of convection drying by hot air, the heat flow transfer to the surface depends to the difference on the temperature, to the surface (which changes in function of the shrinkage phenomena) and to the convection coefficient generally forced. This last, depending mainly on the air velocity [69, 70]
The air in contact with the surface of the product forms a layer correspondingly thin as the air flux is important.
Within this layer, two opposite fluxes of heat and mass are established. This ensemble of flux could be expressed as heat flows # and mass flows %& , in function of the gradients of temperature and partial pressure of water vapor respectively. Through the heat transfer coefficient by convection h, expressed on (' ∙ %+- ∙ /+3) and the mass transfer coefficient kp, expressed on(57 89 :;<>? %+- ∙ @+3 ∙ B;+3), this flows could be expressed as:
Heat flow # = ℎWXYY(Z[ − Z]) Eq. 1
Mass flow %& = 5^WXYY(_`] − _`[) Eq. 2
The wet bulb temperature can be reached with the equilibrium of the system:
Heat flow # = %& j Eq. 3
The wet bulb temperature Ts is defined by:
Wet bulb temperature Z] = Z[ − 5^jℎ (_`] − _`[) Eq. 4
The rate of drying %& , when the operation is controlled by the external processes, evolve generally with the temperature level and the water activity at the surface of exchange, thus defining the partial pressure vapor of water _`[. Then, the partial pressure of the water at the surface of the product is linked to the temperature and the water activity:
Partial pressure vapor
_`] = ;` ∙ _`z{ Eq. 5
30
It depends also to the exchange surface value, which is reduced during the drying process due to the shrinkage phenomena.
Therefore, the intensification of the external heat and mass transfers could be carried out by the changes on the air flux in terms of temperature, relative humidity and air velocity.
Moreover, it has been highlighted that the drying operation is mainly controlled by the internal transfers of heat and mass, which are highly difficult to modify and intensify.
I-3.2.B. Internal Transfers
I-3.2.B.1. Heat Transfer
Once the operation of drying is controlled by the internal transfers, intensifications could be done through the modification of temperature inside the product. Due to this temperature is much smaller than external temperature; it has to be limited in order to preserve the quality of the product (texture, color, form, aromas, nutritional molecules, etc.).
The heat flux ensures at the surface or at the interior of the material the change of the water to the vapor phase. At the surface, the diffusion of water takes place in liquid form from the internal material, and at the interior of the material the diffusion takes place in form of vapor
In many cases, the material is considered as porous, in which the transfers of heat and mass intervene in a specific manner. In fact, the presence of pores containing air, allowed the evaporation and condensation of the water, which reinforce the heat flux. This phenomenon could be expressed by a transfer similar to conduction. Then, Fourier laws could be applied with an effective conductivity generally superior:
Fourier law |} = −lXYY�} Z Eq. 6
Moreover, one important part of this heat flow is used to water evaporation at the interior of the porous, and the other part, which is considered negligible, serves to modify the temperature of the material (solid and water):
Heat flow −lXYY∇}} ∙ ∇}} Z + ��]�^{ + �`�^�� �Z�< + �[�]�`j& ��< �_`�Z� = 0 Eq. 7
The thermic effective conductivity leff depends from the structure and the water content of the product. Then, during drying, the reduction of the water content induce a decrease on the thermic conductivity, which reinforce more and more the shrinkage of the structure, causing an opposing phenomena.
I-3.2.B.2. Mass transfer (water)
At the interior of a porous structure, water is transferred in a liquid form and or vapor, according to different mechanisms [71]
I.3.2.B.2.a. Classic diffusion
The liquid water is transfer by classic diffusion, capillarity or osmoses throughout numerous cell wall, etc. The main source of water inside the plant tissue is the cells. The transport of water from inner tissue to the outside involves migration through the cells, its enveloping structure, through the porous tissue structure, and then through the outside boundary layers. It is now generally accepted that there are three main potential pathways which water can follow while traversing through a plant tissue Figure 11:(i) the apoplastic transport pathway (cell wall pathway), which occurs outside the cell membranes (plasmalemma) and can be defined as water transport through cell walls and intercellular space between cells; (ii) the symplastic transport pathway (symplasm pathway), which is inside the plasmalemma and characterized by a sap transport from one cell directly into another cell through small channels (plasmodesmata); and (iii) the transmembrane transport pathway (vacuolar pathway), which is defined as a water
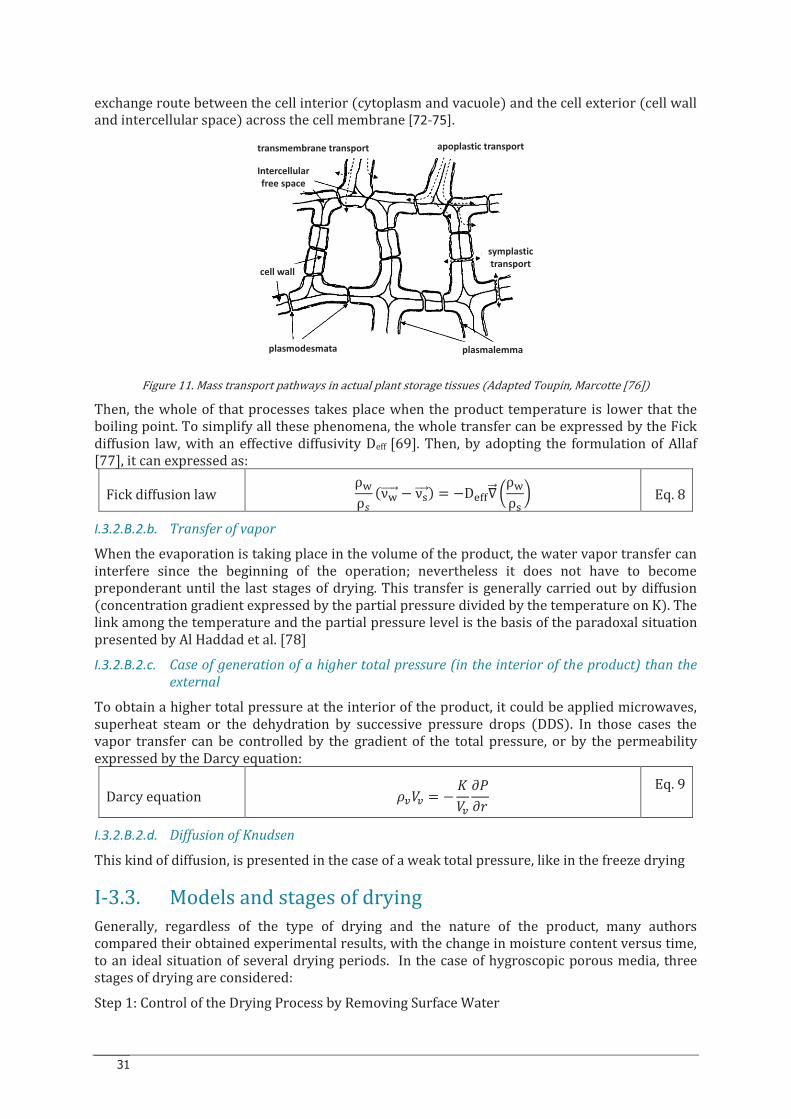
31
exchange route between the cell interior (cytoplasm and vacuole) and the cell exterior (cell wall and intercellular space) across the cell membrane [72-75].
Figure 11. Mass transport pathways in actual plant storage tissues (Adapted Toupin, Marcotte [76])
Then, the whole of that processes takes place when the product temperature is lower that the boiling point. To simplify all these phenomena, the whole transfer can be expressed by the Fick diffusion law, with an effective diffusivity Deff [69]. Then, by adopting the formulation of Allaf [77], it can expressed as:
Fick diffusion law ρ�ρ] (ν�}}}}} − ν�}}} ) = −D���∇}} �ρ�ρ� � Eq. 8
I.3.2.B.2.b. Transfer of vapor
When the evaporation is taking place in the volume of the product, the water vapor transfer can interfere since the beginning of the operation; nevertheless it does not have to become preponderant until the last stages of drying. This transfer is generally carried out by diffusion (concentration gradient expressed by the partial pressure divided by the temperature on K). The link among the temperature and the partial pressure level is the basis of the paradoxal situation presented by Al Haddad et al. [78]
I.3.2.B.2.c. Case of generation of a higher total pressure (in the interior of the product) than the
external
To obtain a higher total pressure at the interior of the product, it could be applied microwaves, superheat steam or the dehydration by successive pressure drops (DDS). In those cases the vapor transfer can be controlled by the gradient of the total pressure, or by the permeability expressed by the Darcy equation:
Darcy equation �&�& = − /�&�B�?
Eq. 9
I.3.2.B.2.d. Diffusion of Knudsen
This kind of diffusion, is presented in the case of a weak total pressure, like in the freeze drying
I-3.3. Models and stages of drying
Generally, regardless of the type of drying and the nature of the product, many authors compared their obtained experimental results, with the change in moisture content versus time, to an ideal situation of several drying periods. In the case of hygroscopic porous media, three stages of drying are considered:
Step 1: Control of the Drying Process by Removing Surface Water
apoplastic transporttransmembrane transport
Intercellular
free space
cell wall
plasmodesmata plasmalemma
symplastic
transport
32
Step 2: Control of the Drying Process by Water Diffusion in the Porous Hygroscopic Medium
Step 3: Paradoxical Drying Step
I-3.3.A. Step 1: Control of the Drying Process by Removing Surface Water
The external medium (usually air flow) is where heat transfer (convection) and the transport of water in vapor form occur. Then, to assume that these external transfers can completely control the drying and the drying rate, it is needed a permanent flux of humidity from the core of the material to the exchange surface. Nevertheless only in very specific cases the drying rate could be constant:
· When the evaporation is superficial, without any limitation by an internal diffusion effect and without any shrinkage or reduction of water activity on the surface.
· And when the air flow characteristics (temperature, humidity and velocity) are held constant.
Therefore, this step of drying exists only for a really short time.
However, even if this phase is particularly short, it could be highly important in the elimination of water, due to the fact that under adequate external conditions of temperature, humidity and air flow velocity, drying could be intensified. At this respect, Mounir and Allaf [79] define this stage through the concept of “starting accessibility” dWs, which would indicate the quantity of water removed from the surface before starting the second internal diffusion drying phase.
I-3.3.B. Step 2: Control of the Drying Process by Water Diffusion in the
Porous Hygroscopic Medium
This period results from a situation in which the internal transfer of materials is weak enough to become the limiting process of the whole operation. Due to the fact that in general, the thermal diffusivity is much higher than the effective diffusivity of liquid water within the matter, Deff. This period reflects the insufficient diffusion of moisture from the product core to the exchange surface.
I-3.3.C. Step 3: Paradoxical step of internal coupled heat and vapor
diffusion transfers
As the water vapor becomes gradually predominant in the internal water transfer within the porous solid, the paradoxical phase involves progressive front kinetics.
Whatever the gas transfers by diffusion in a porous medium, the operation must be managed by the partial pressure gradient as a driving process (diffusional transfer similar to Fick’s law). The evaporation of water in the medium maintained at a temperature assumed to be constant results in a heat flow mainly defined by
Heat flow −l���∇}} ∙ ∇}} T + ε���M�L ∂∂t �p�RT� = 0 Eq. 10
In terms of mass transfer (vapor), the formulation of Allaf [77] expresses this vapor diffusion according to Fick’s law by:
Mass transfer ¢p�T £ρ� (v�}}}}} − v�}}} ) = −D���∇}} ¤(p�/T)ρ� ¦
Eq. 11
Particularly during the final stage of drying, the shrinkage (r = constant and v�}}} = 0) is often omitted, and it can be written as:
Mass transfer ¢p�T £ v�}}}}} = −D���∇}} ¢p�T £ Eq. 12
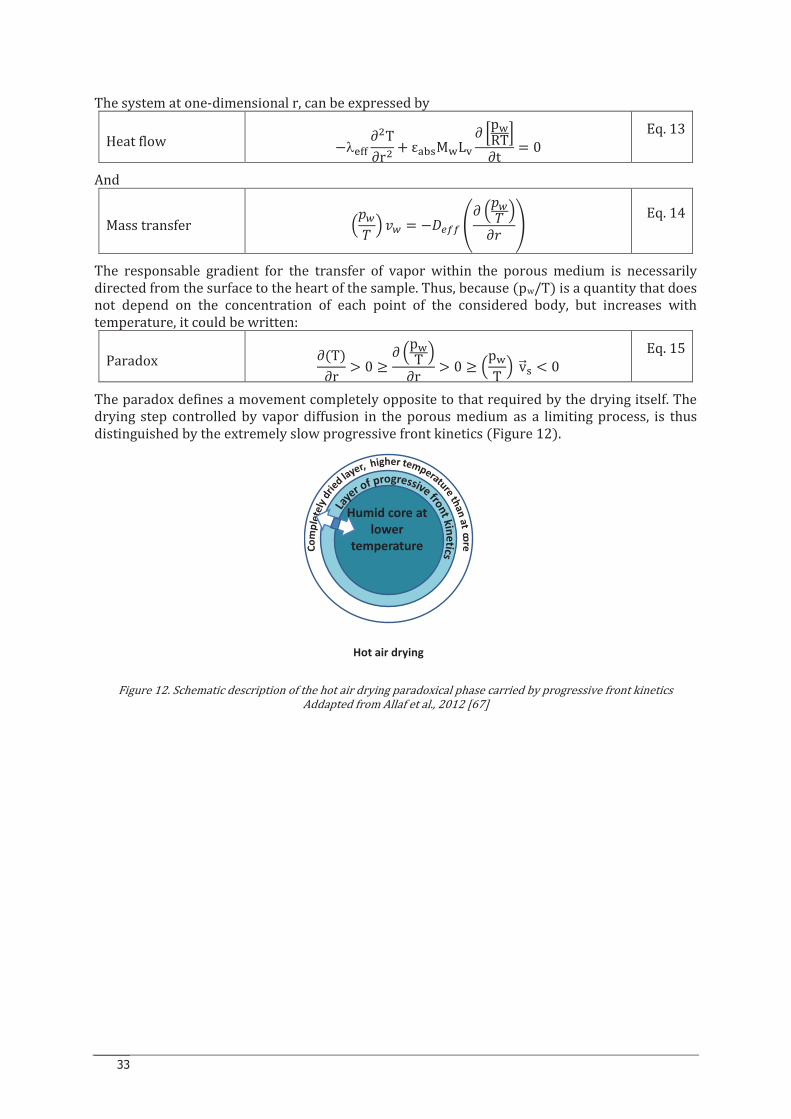
33
The system at one-dimensional r, can be expressed by
Heat flow −l��� ∂-T∂r- + ε���M�L ∂ �p�RT�∂t = 0 Eq. 13
And
Mass transfer ¢_Z £ §` = − XYY ©� ¢_Z £�? ª Eq. 14
The responsable gradient for the transfer of vapor within the porous medium is necessarily directed from the surface to the heart of the sample. Thus, because (pw/T) is a quantity that does not depend on the concentration of each point of the considered body, but increases with temperature, it could be written:
Paradox ∂(T)∂r > 0 ≥ ∂ ¢p�T £∂r > 0 ≥ ¢p�T £ v} � < 0 Eq. 15
The paradox defines a movement completely opposite to that required by the drying itself. The drying step controlled by vapor diffusion in the porous medium as a limiting process, is thus distinguished by the extremely slow progressive front kinetics (Figure 12).
Figure 12. Schematic description of the hot air drying paradoxical phase carried by progressive front kinetics Addapted from Allaf et al., 2012 [67]
Hot air drying
Humid core at
lower
temperature
34
CHAPTER I-4.
INTERACTION OF THE WATER AND SOLID DURING
DRYING OPERATION
The fundamental study of the interaction of the water and solids of a product during the drying operation has to be done in two different axes: the thermodynamic and the kinetic approach.
I-4.1. Thermodynamic study of the interaction solid-water
The thermodynamic fundamental approach its generally realized independently of the implication of the time, it is about the equilibrium states coming from the 1st order transformation (water phase changes, solid-water bounds, water activity, etc.) linked mainly to thermodynamic parameters (temperature, pressure, etc.). The pseudo-static operations, as the glass transition, are defined as 2nd order transformation, due to the fact that they depend on the modification velocity of thermodynamic parameters [80]
Water can interact with dried solids in a specific way depending on the nature of the product, its composition, structure, etc. The content of water in the product, identified throughout the measure of moisture content, does not represent the water activity of the product (equilibrium thermodynamic stage) and the mobility of water (linked to the glass transition) [80]
I-4.1.A. Water activity
Water activity, is a thermodynamic property defined as the ratio of vapor pressure of water in a system and the vapor pressure of pure water at the same temperature, or the equilibrium relative humidity of the air surrounding the system at the same temperature [81].
In 1957, to measure the water availability in the food, Scott defined the water activity (aw) [82]. The thermodynamic basis of this property is:
Chemical potential of water
m = m¯ + �Z ln(9/9 ) Eq. 16
Where m and m0 are respectively the chemical potential of water and those of pure water (the reference state); f is the fugacity of the system at given conditions and f0 is the fugacity at the reference state [83]; T and R are the temperature (K) and gas constant (8.314 J K-1 mol-1) respectively. Since in practical conditions fugacity may be considered equal to partial vapor pressure (P) it is possible to obtain the following equation:
Chemical potential of water
m = m + m¯�Z ln(B/B ) Eq. 17
If the thermodynamic equilibrium is reached it is possible to use the following:
Chemical potential of water
m = m + m¯�Z ln(;`) Eq. 18
Thus, water activity may be defined as the ratio between vapor pressure surrounding food (P) and the vapor pressure of pure water (reference state, P0) both measured at the same temperature and pressure values:
Water activity ;` = B/B Eq. 19
It is worth nothing that this parameter is valid only if thermodynamic equilibrium is reached (no water molecules move inside food due to different chemical potential). Nevertheless, although in practical application this condition is often not satisfied. Since 1975, water activity is the most

35
important parameter used to relate the water availability with the rate of degradation reactions [84].
The notion of water activity summarizes the different thermodynamic equilibrium states of the water contained in a food product; such as that containing solutes, that bounded with insoluble molecules, that on the meniscus, etc. [68]
Then, the water can be considered formed by:
Free water: it is the main form in which water is presented on fresh fruits and vegetables. It is in a solvent form with salts. In the case of solid corps, this water is retained on interstitial spaces and pores by capillarity forces created links to the liquid phase superficial tension. This water presents similar properties that pure water (aw =1) [80]
Bound water: it is the water bounded chemically, physically or both to solid matrix. It exists in the vicinity of solutes and non-aqueous constituents (Fennema 1999). This does not form part of the real hydric phase and it does not help to the dilution of soluble elements, as salts. The bound water can be absorbed by cohesion forces with the solid matrix and/or with the other water molecules (psychochemical forces as the kind of Van der Waals, hydrogen bonds, etc.). Generally, the water around the solids could be divided on:
· Structural water: the function of this water is to give to solid molecules their spatial conformation thanks to hydrogen bonds, hydrophobias, etc.
· Monolayer water: This water is fixed on the solid exchange surface, thanks to specific sites of electrostatics interaction and hydrogen bonds
· Hydrodynamic water: This water join the solid movements [85]
On the drying process, by regarding the kinetics it could be a confusion between free and bound water, mainly in terms of water elimination, nevertheless the bound water notion has only be linked to the thermodynamic equilibrium characteristics.
In fact, during drying, it could be observed: · Aw= 1: when the product contains free water. During drying, this water behaves as
pure. · Aw<1: when the product contains only bound water. Despite of the weak water
vapor pressure at an specific temperature and contrary to the explanations of Bimbenet [86], the difficulties to eliminate this water in comparison to the first stage of drying (which implies mainly free water), are in the case of structural milieus, of the kind of kinetics. Then, the structural modification by expansion can intensify the drying process and often reduce the water activity [87]
I-4.1.B. Importance of Water Activity
Water activity (aw), is a successful concept commonly used in correlation with food safety and quality. It is a unique factor in food stability that enables the development of generalized limits within ranges where certain types of deteriorative reactions are dominant [82]. One of the main preservation methods to ensure food safety against microbial and chemical deterioration is controlling the aw in food, which can extend shelf-life and create convenience with new food products. Therefore, several food preservation techniques rely on lowering the aw so as to reduce the rates of microbial growth and chemical reactions, as described in the global stability map (Figure 13) developed by Labuza et al., 1970 [88, 89]
The stability map indicates that for reactions requiring an aqueous phase, such as nonenzymatic browning and enzyme reactions, there is a lower limit, usually at aw between 0.2 and 0.3, below which the reactivity is 0; above that, the reaction rate increases until reaching a maximum at an aw essentially between 0.6 and 0.8 and then decreases again, reaching 0 at aw of 1.0 [90]. Lipid oxidation, on the other hand, shows a minimum in the 0.2 to 0.35 aw range and increases in rate on both sides, i.e., an increase or a decrease in aw [91].
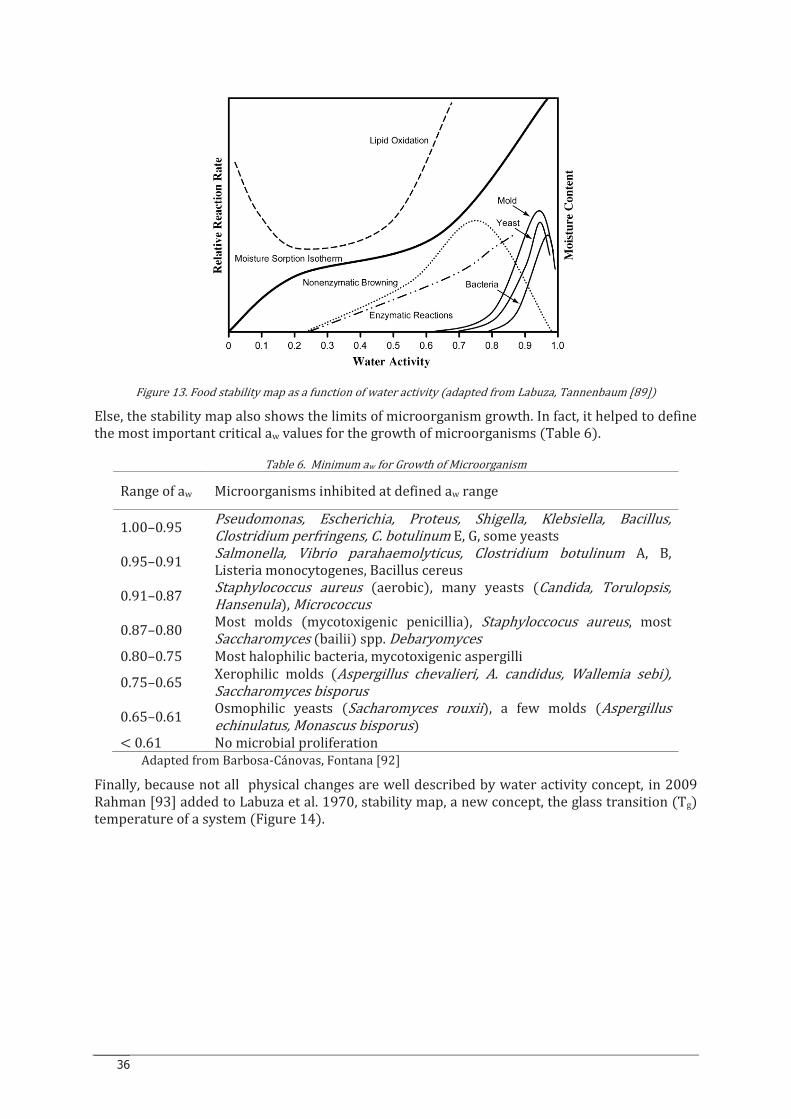
36
Figure 13. Food stability map as a function of water activity (adapted from Labuza, Tannenbaum [89])
Else, the stability map also shows the limits of microorganism growth. In fact, it helped to define the most important critical aw values for the growth of microorganisms (Table 6).
Table 6. Minimum aw for Growth of Microorganism
Range of aw Microorganisms inhibited at defined aw range
1.00–0.95 Pseudomonas, Escherichia, Proteus, Shigella, Klebsiella, Bacillus, Clostridium perfringens, C. botulinum E, G, some yeasts
0.95–0.91 Salmonella, Vibrio parahaemolyticus, Clostridium botulinum A, B, Listeria monocytogenes, Bacillus cereus
0.91–0.87 Staphylococcus aureus (aerobic), many yeasts (Candida, Torulopsis, Hansenula), Micrococcus
0.87–0.80 Most molds (mycotoxigenic penicillia), Staphyloccocus aureus, most Saccharomyces (bailii) spp. Debaryomyces
0.80–0.75 Most halophilic bacteria, mycotoxigenic aspergilli
0.75–0.65 Xerophilic molds (Aspergillus chevalieri, A. candidus, Wallemia sebi), Saccharomyces bisporus
0.65–0.61 Osmophilic yeasts (Sacharomyces rouxii), a few molds (Aspergillus echinulatus, Monascus bisporus)
< 0.61 No microbial proliferation Adapted from Barbosa-Cánovas, Fontana [92]
Finally, because not all physical changes are well described by water activity concept, in 2009 Rahman [93] added to Labuza et al. 1970, stability map, a new concept, the glass transition (Tg) temperature of a system (Figure 14).
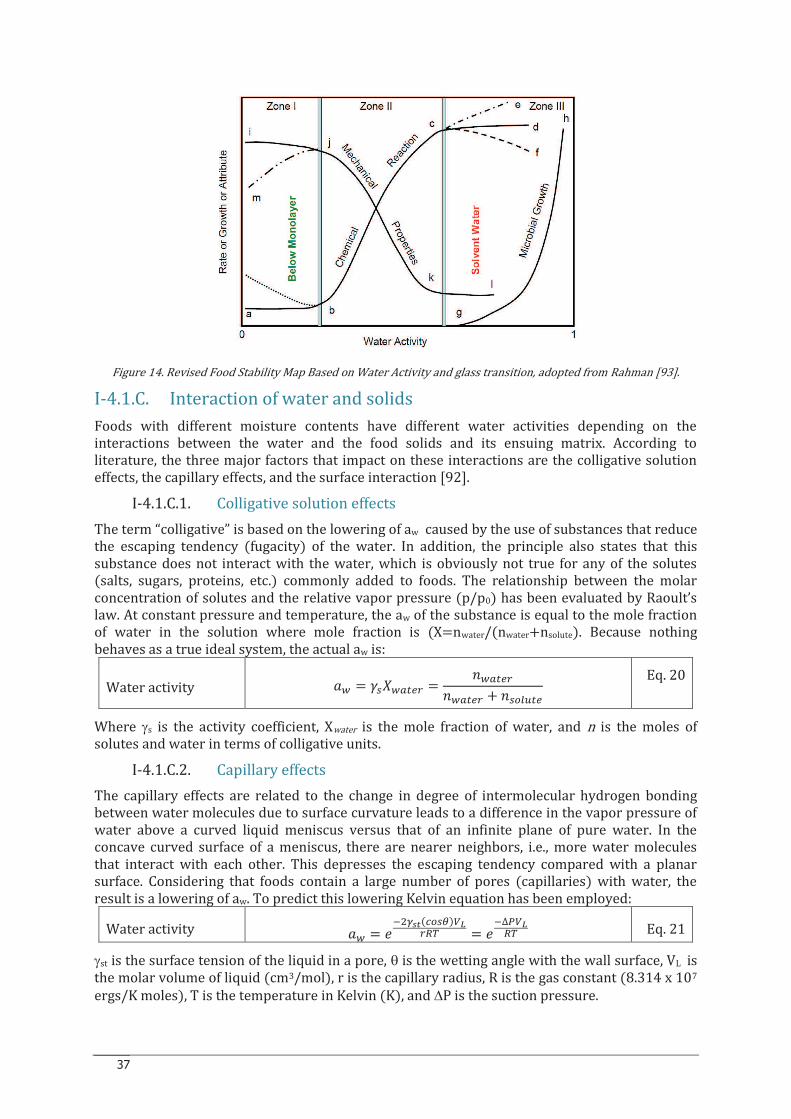
37
Figure 14. Revised Food Stability Map Based on Water Activity and glass transition, adopted from Rahman [93].
I-4.1.C. Interaction of water and solids
Foods with different moisture contents have different water activities depending on the interactions between the water and the food solids and its ensuing matrix. According to literature, the three major factors that impact on these interactions are the colligative solution effects, the capillary effects, and the surface interaction [92].
I-4.1.C.1. Colligative solution effects The term “colligative” is based on the lowering of aw caused by the use of substances that reduce the escaping tendency (fugacity) of the water. In addition, the principle also states that this substance does not interact with the water, which is obviously not true for any of the solutes (salts, sugars, proteins, etc.) commonly added to foods. The relationship between the molar concentration of solutes and the relative vapor pressure (p/p0) has been evaluated by Raoult’s law. At constant pressure and temperature, the aw of the substance is equal to the mole fraction of water in the solution where mole fraction is (X=nwater/(nwater+nsolute). Because nothing behaves as a true ideal system, the actual aw is:
Water activity ;` = °]±`[²X³ = ´`[²X³´`[²X³ + ´]µ¶·²X Eq. 20
Where gs is the activity coefficient, Xwater is the mole fraction of water, and n is the moles of solutes and water in terms of colligative units.
I-4.1.C.2. Capillary effects
The capillary effects are related to the change in degree of intermolecular hydrogen bonding between water molecules due to surface curvature leads to a difference in the vapor pressure of water above a curved liquid meniscus versus that of an infinite plane of pure water. In the concave curved surface of a meniscus, there are nearer neighbors, i.e., more water molecules that interact with each other. This depresses the escaping tendency compared with a planar surface. Considering that foods contain a large number of pores (capillaries) with water, the result is a lowering of aw. To predict this lowering Kelvin equation has been employed:
Water activity ;` = >+- {¹(ºµ]¼)½¾³¿z = >+∆Á½¾¿z Eq. 21
gst is the surface tension of the liquid in a pore, q is the wetting angle with the wall surface, VL is the molar volume of liquid (cm3/mol), r is the capillary radius, R is the gas constant (8.314 x 10⁷ ergs/K moles), T is the temperature in Kelvin (K), and DP is the suction pressure.
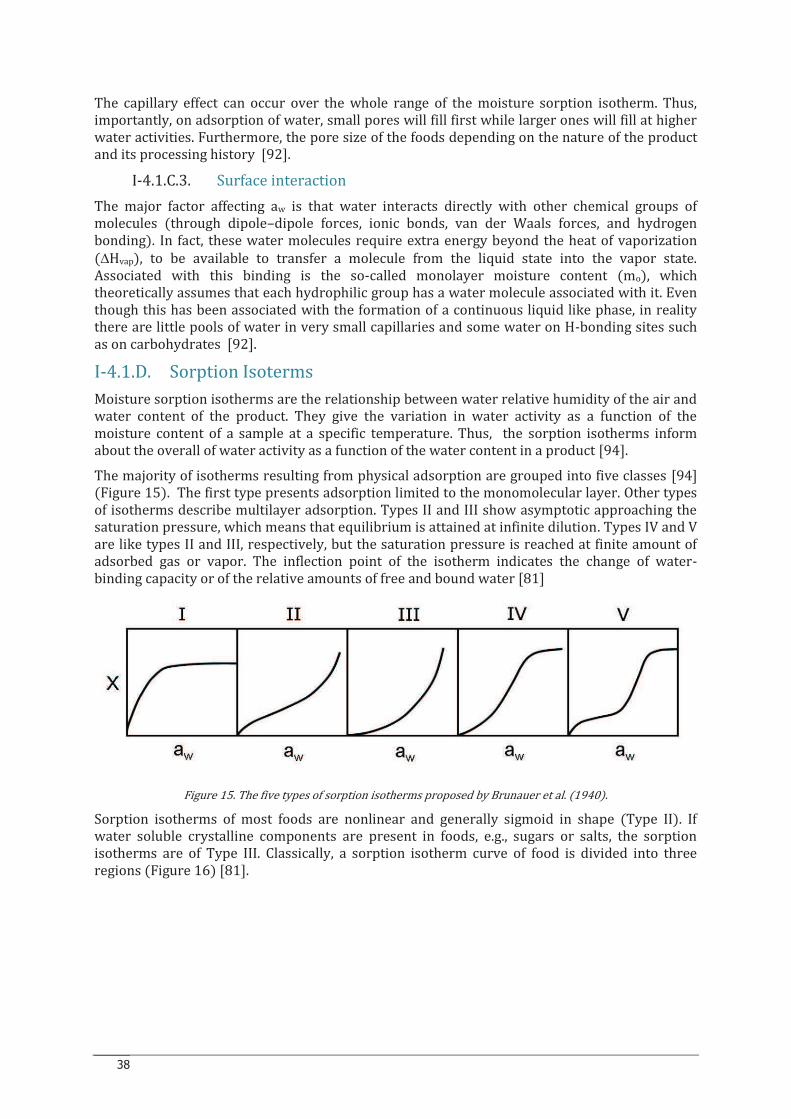
38
The capillary effect can occur over the whole range of the moisture sorption isotherm. Thus, importantly, on adsorption of water, small pores will fill first while larger ones will fill at higher water activities. Furthermore, the pore size of the foods depending on the nature of the product and its processing history [92].
I-4.1.C.3. Surface interaction
The major factor affecting aw is that water interacts directly with other chemical groups of molecules (through dipole–dipole forces, ionic bonds, van der Waals forces, and hydrogen bonding). In fact, these water molecules require extra energy beyond the heat of vaporization (DHvap), to be available to transfer a molecule from the liquid state into the vapor state. Associated with this binding is the so-called monolayer moisture content (mo), which theoretically assumes that each hydrophilic group has a water molecule associated with it. Even though this has been associated with the formation of a continuous liquid like phase, in reality there are little pools of water in very small capillaries and some water on H-bonding sites such as on carbohydrates [92].
I-4.1.D. Sorption Isoterms
Moisture sorption isotherms are the relationship between water relative humidity of the air and water content of the product. They give the variation in water activity as a function of the moisture content of a sample at a specific temperature. Thus, the sorption isotherms inform about the overall of water activity as a function of the water content in a product [94].
The majority of isotherms resulting from physical adsorption are grouped into five classes [94] (Figure 15). The first type presents adsorption limited to the monomolecular layer. Other types of isotherms describe multilayer adsorption. Types II and III show asymptotic approaching the saturation pressure, which means that equilibrium is attained at infinite dilution. Types IV and V are like types II and III, respectively, but the saturation pressure is reached at finite amount of adsorbed gas or vapor. The inflection point of the isotherm indicates the change of water-binding capacity or of the relative amounts of free and bound water [81]
Figure 15. The five types of sorption isotherms proposed by Brunauer et al. (1940).
Sorption isotherms of most foods are nonlinear and generally sigmoid in shape (Type II). If water soluble crystalline components are present in foods, e.g., sugars or salts, the sorption isotherms are of Type III. Classically, a sorption isotherm curve of food is divided into three regions (Figure 16) [81].
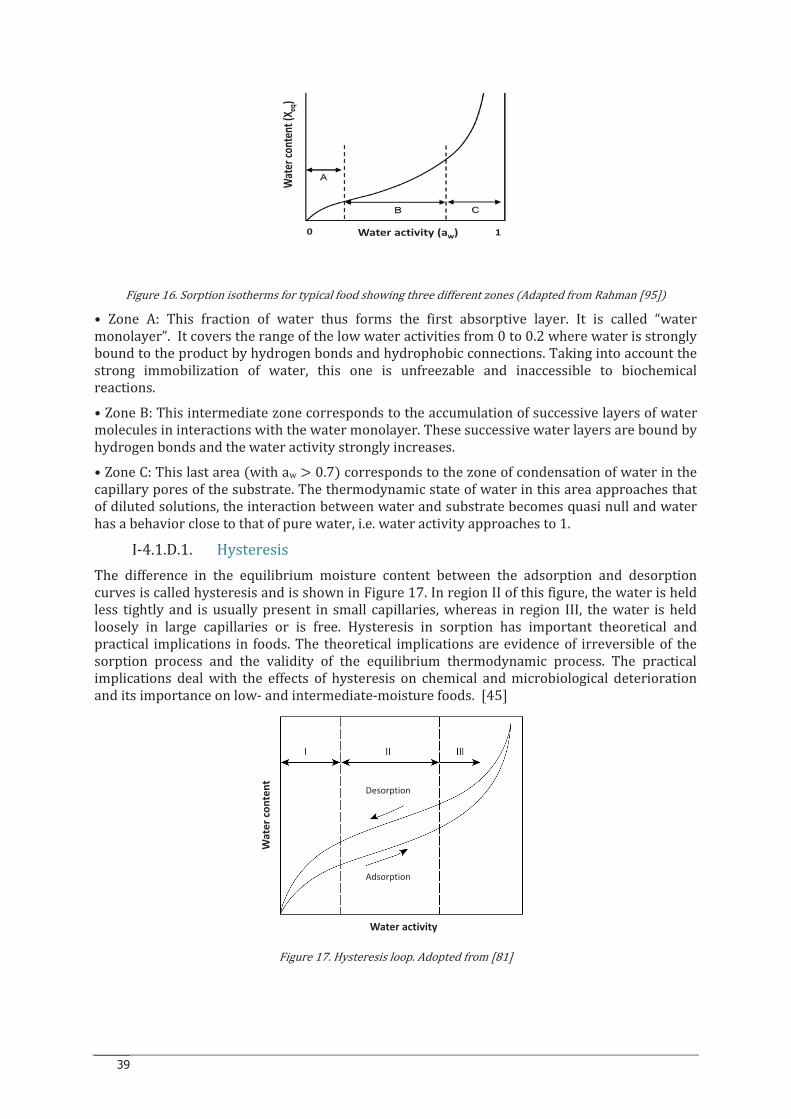
39
Figure 16. Sorption isotherms for typical food showing three different zones (Adapted from Rahman [95]) • Zone A: This fraction of water thus forms the first absorptive layer. It is called “water monolayer”. It covers the range of the low water activities from 0 to 0.2 where water is strongly bound to the product by hydrogen bonds and hydrophobic connections. Taking into account the strong immobilization of water, this one is unfreezable and inaccessible to biochemical reactions. • Zone B: This intermediate zone corresponds to the accumulation of successive layers of water molecules in interactions with the water monolayer. These successive water layers are bound by hydrogen bonds and the water activity strongly increases. • Zone C: This last area (with aw > 0.7) corresponds to the zone of condensation of water in the capillary pores of the substrate. The thermodynamic state of water in this area approaches that of diluted solutions, the interaction between water and substrate becomes quasi null and water has a behavior close to that of pure water, i.e. water activity approaches to 1.
I-4.1.D.1. Hysteresis
The difference in the equilibrium moisture content between the adsorption and desorption curves is called hysteresis and is shown in Figure 17. In region II of this figure, the water is held less tightly and is usually present in small capillaries, whereas in region III, the water is held loosely in large capillaries or is free. Hysteresis in sorption has important theoretical and practical implications in foods. The theoretical implications are evidence of irreversible of the sorption process and the validity of the equilibrium thermodynamic process. The practical implications deal with the effects of hysteresis on chemical and microbiological deterioration and its importance on low- and intermediate-moisture foods. [45]
Figure 17. Hysteresis loop. Adopted from [81]
Water activity (aw)0 1
Wat
erco
nten
t(X
eq)
Water activity
Wa
ter
con
ten
t
Desorption
Adsorption
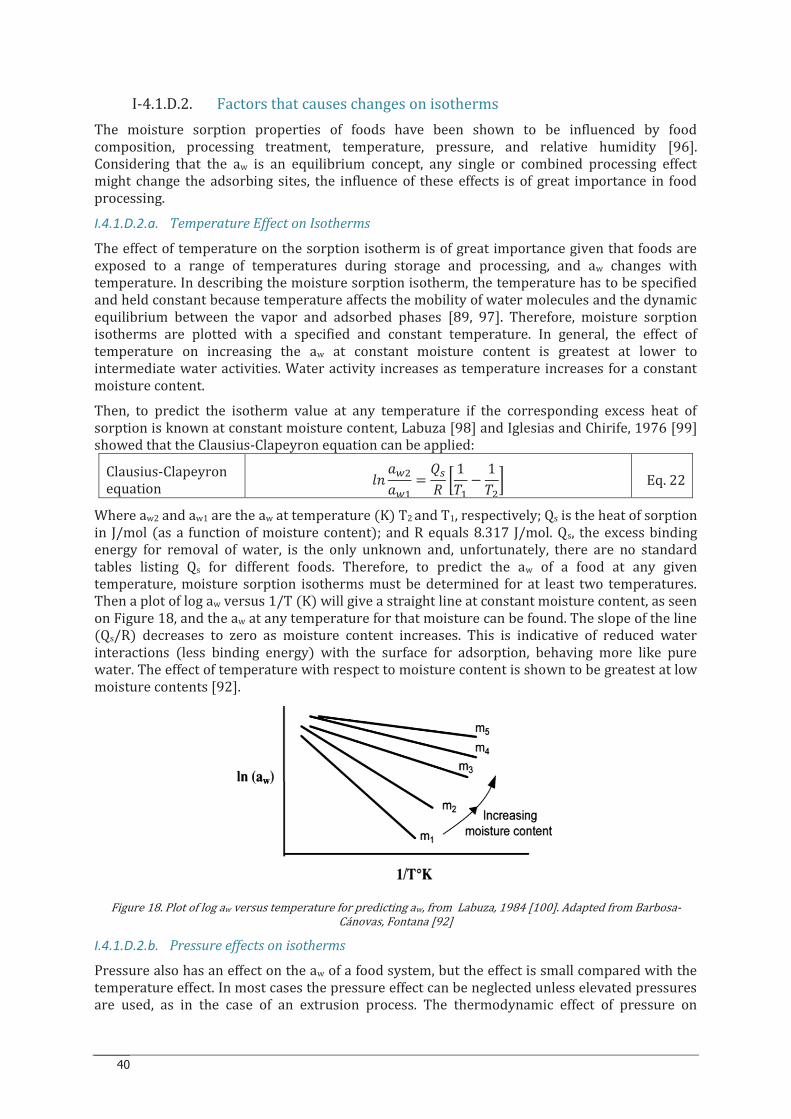
40
I-4.1.D.2. Factors that causes changes on isotherms
The moisture sorption properties of foods have been shown to be influenced by food composition, processing treatment, temperature, pressure, and relative humidity [96]. Considering that the aw is an equilibrium concept, any single or combined processing effect might change the adsorbing sites, the influence of these effects is of great importance in food processing.
I.4.1.D.2.a. Temperature Effect on Isotherms
The effect of temperature on the sorption isotherm is of great importance given that foods are exposed to a range of temperatures during storage and processing, and aw changes with temperature. In describing the moisture sorption isotherm, the temperature has to be specified and held constant because temperature affects the mobility of water molecules and the dynamic equilibrium between the vapor and adsorbed phases [89, 97]. Therefore, moisture sorption isotherms are plotted with a specified and constant temperature. In general, the effect of temperature on increasing the aw at constant moisture content is greatest at lower to intermediate water activities. Water activity increases as temperature increases for a constant moisture content.
Then, to predict the isotherm value at any temperature if the corresponding excess heat of sorption is known at constant moisture content, Labuza [98] and Iglesias and Chirife, 1976 [99] showed that the Clausius-Clapeyron equation can be applied:
Clausius-Clapeyron equation
Ç´ ;`-;`3 = #]� È 1Z3 − 1Z-É Eq. 22
Where aw2 and aw1 are the aw at temperature (K) T2 and T1, respectively; Qs is the heat of sorption in J/mol (as a function of moisture content); and R equals 8.317 J/mol. Qs, the excess binding energy for removal of water, is the only unknown and, unfortunately, there are no standard tables listing Qs for different foods. Therefore, to predict the aw of a food at any given temperature, moisture sorption isotherms must be determined for at least two temperatures. Then a plot of log aw versus 1/T (K) will give a straight line at constant moisture content, as seen on Figure 18, and the aw at any temperature for that moisture can be found. The slope of the line (Qs/R) decreases to zero as moisture content increases. This is indicative of reduced water interactions (less binding energy) with the surface for adsorption, behaving more like pure water. The effect of temperature with respect to moisture content is shown to be greatest at low moisture contents [92].
Figure 18. Plot of log aw versus temperature for predicting aw, from Labuza, 1984 [100]. Adapted from Barbosa-Cánovas, Fontana [92]
I.4.1.D.2.b. Pressure effects on isotherms
Pressure also has an effect on the aw of a food system, but the effect is small compared with the temperature effect. In most cases the pressure effect can be neglected unless elevated pressures are used, as in the case of an extrusion process. The thermodynamic effect of pressure on

41
activity was discussed by Glasstone and Lewis [101], who showed that a change in total pressure of the system will affect the vapor pressure. At equilibrium, any change in chemical potential of the liquid state will be equal to a change in chemical potential of the vapor. Thus, beginning with the equilibrium point of the chemical potential of water and the vapor state,
Change in Chemical potential
ÊËÌ = �ÌÊBz = Ê˽ = �½ÊB½ Eq. 23
where VL and VV are the molar volume of the liquid and vapor, respectively, and dPT and dPV are the total pressure change and vapor pressure change, respectively. Rearranging the equation for pressure effect on aw:
Pressure effect on water activity Ç´ ;`3;`- = �ÌÍÍÍ�Z [B- − B3] Eq. 24
where P1 and P2 are the total initial and final pressure, respectively.
I.4.1.D.2.c. Food composition effect on isotherms
When working with complex food systems consisting of multidomain systems of ingredients, the effect of composition plays one of the most important roles affecting moisture sorption behavior. For example, proteins are generally represented as type II moisture sorption isotherms due to their easily plasticized nature, resulting in increased availability of all polar groups [92].
I-4.1.D.3. Sorption isotherms models
Because of the complex composition and structure of foods, mathematical prediction of sorption behavior is difficult. Since the moisture sorption isotherms of food materials represent the integrated hygroscopic properties of various constituents and the sorption properties may change as a result of chemical and physical interactions induced by some pre-treatment methods, it is difficult to have an unique mathematical model, theoretical or empirical, that describes accurately the sorption isotherm in the whole range of water activity and for various types of foods [102]. Moisture sorption isotherms of foods have been described by more than one sorption model. The criteria used to select the most appropriate sorption model, has been the degree of fit to the experimental data and the simplicity of the model.
In order to be able to exploit the sorption isotherms it is necessary to express the water activity and water content relation in mathematical form. These models are classified as theoretical, semi-empirical or empirical. In fact, more than 270 isotherm equations have been proposed for biological materials [83].
I.4.1.D.3.a. Theoretical (Kinetic Based) Models
Kinetic models based on a monolayer or multilayer sorption and a condensed film are grouped as theoretical models. The constants of the kinetic models, in contrast with those of the empirical models, defined physical properties of the materials [92].
Langmuir isotherm model
The Langmuir isotherm model is one of the oldest one. Developed by Irving Langmuir on 1916, its theory is based on the following assumptions: a) a uniform surface with equivalent adsorption sites; b) only a single molecule per site; c) adsorption energy is independent of occupancy of neighboring sites [103]. The adsorption takes place on specific sites of the interface until all these sites are taken by water (or gas) molecules. In this way a layer with a thickness of one molecule is obtained. Based on the thermodynamic laws, the equation is:
Langmuir model ±±Ð = ÑÌ ∙ ;`5 + ÑÌ ∙ ;` Eq. 25

42
Where X is the mass fraction of the adsorbed water (57 ∙ 57ÒÓ+3 ), XM is the mass fraction of adsorbed water for a monolayer (57 ∙ 57ÒÓ+3 ), CL is the Langmuir constant and k=1/P0 where P0
is the vapor pressure of water a temperature T0 (K)
Constant of Langmuir
ÑÌ = 5¯�Z >Ô_ �#]�Z� Eq. 26
Where Qs is sorption energy on the homogenous binding sites, k0 is constant of Boltzman (1.38 x10⁻²³ J K-1), R is the universal gas constant (8.314 J K-1 mol-1).
The Langmuir equation cannot be applied for food products because: Qs is not constant as at the interface there are different binding sites with different binding forces for water vapor molecules; the model neglects the existing lateral interactions between the water molecules and the maximal amount of water that can be absorbed is much larger than the amount corresponding to XM [104].
Brunauer-Emmet-Teller (BET) and GAB isotherm model
These models are based on the fundamental phenomena of the adsorption of water, particularly on the process of water sorption in successive layers. The BET (Brunauer Emmet and Teller) equation was first postulated by Brunauer et al., on 1938 and 1940 [94, 105] connecting the water activity (aw) to the water content (57 ∙ 57ÒÓ+3 ) and has the following form:
BET Model ±±Ð = ÑÕ ∙ ;`(1 − ;`) ∙ [1 + (ÑÕ − 1) ∙ ;`] = ÑÌ ∙ ;`1 + ÑÌ ∙ ;` + ;`1 − ;`
Eq. 27
The parameters of model XM and CL or CB have physical significance. XM is the water content of the monolayer, CL is the Langmuir constant and CB is the BET constant. It should be noted that CL = CB - 1 and this parameter characterizes the interaction between monolayer and other water layers. This decomposition on two water populations with different properties is incorporated into the model. The first term of the right hand side of the equation corresponds to the monolayer accordingly to Langmuir while the second term comes directly from the law of Raoult. The applicability of the BET model is limited to low water activities (from 0 to 0.5 maximum).
In order to extend the applicability of the BET model towards a higher water activity range, in 1966, Guggenheim, Anderson and Boer (GAB) introduced a new parameter k into the BET model [106]:
GAB model
±±Ð = ÑÖ ∙ 5 ∙ ;`(1 − 5 ∙ ;`) ∙ [1 + (ÑÖ − 1) ∙ 5 ∙ ;`]= (ÑÖ − 1) ∙ 5 ∙ ;`1 + (ÑÖ − 1) ∙ 5 ∙ ;` + 5 ∙ ;`1 − 5 ∙ ;`
Eq. 28
The GAB model simplifies to the BET model for k=1. The parameter k was introduced to take into account the fact that the multilayer zone is not an ideal solution. The term k.aw/(1-k.aw) has the same form as equation:
;` = g`Ô` = g` ±± + �×/�ÒÓ Eq. 29
So that
±�×/�ÒÓ = ;`/g`1 − ;`/g` Eq. 30
With Mw and Mdm the molar mass of water and dry matter.
Its applicability is limited to aw = 0.94 and varies without theoretical reason between products. CG and XM have the same meaning as in the BET model. The parameter k poses a problem when
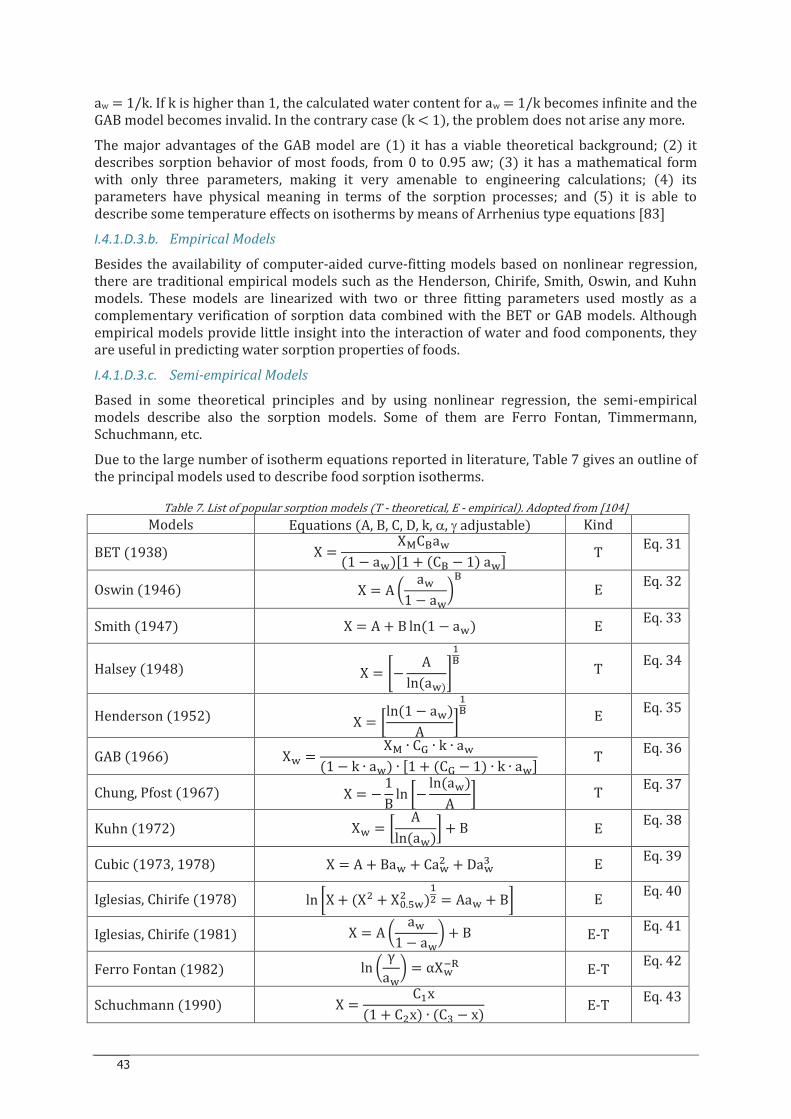
43
aw = 1/k. If k is higher than 1, the calculated water content for aw = 1/k becomes infinite and the GAB model becomes invalid. In the contrary case (k < 1), the problem does not arise any more.
The major advantages of the GAB model are (1) it has a viable theoretical background; (2) it describes sorption behavior of most foods, from 0 to 0.95 aw; (3) it has a mathematical form with only three parameters, making it very amenable to engineering calculations; (4) its parameters have physical meaning in terms of the sorption processes; and (5) it is able to describe some temperature effects on isotherms by means of Arrhenius type equations [83]
I.4.1.D.3.b. Empirical Models
Besides the availability of computer-aided curve-fitting models based on nonlinear regression, there are traditional empirical models such as the Henderson, Chirife, Smith, Oswin, and Kuhn models. These models are linearized with two or three fitting parameters used mostly as a complementary verification of sorption data combined with the BET or GAB models. Although empirical models provide little insight into the interaction of water and food components, they are useful in predicting water sorption properties of foods.
I.4.1.D.3.c. Semi-empirical Models
Based in some theoretical principles and by using nonlinear regression, the semi-empirical models describe also the sorption models. Some of them are Ferro Fontan, Timmermann, Schuchmann, etc.
Due to the large number of isotherm equations reported in literature, Table 7 gives an outline of the principal models used to describe food sorption isotherms.
Table 7. List of popular sorption models (T - theoretical, E - empirical). Adopted from [104]
Models Equations (A, B, C, D, k, a, g adjustable) Kind
BET (1938) X = XÙCÚa�(1 − a�)[1 + (CÚ − 1) a�] T Eq. 31
Oswin (1946) X = A � a�1 − a��Ú E
Eq. 32
Smith (1947) X = A + B ln(1 − a�) E Eq. 33
Halsey (1948) X = Û− Aln (a�)Ü3Ú T
Eq. 34
Henderson (1952) X = Èln (1 − a�)A É3Ú E
Eq. 35
GAB (1966) X� = XÙ ∙ CÝ ∙ k ∙ a�(1 − k ∙ a�) ∙ [1 + (CÝ − 1) ∙ k ∙ a�] T Eq. 36
Chung, Pfost (1967) X = − 1B ln È− ln (a�)A É T Eq. 37
Kuhn (1972) X� = È Aln (a�)É + B E Eq. 38
Cubic (1973, 1978) X = A + Ba� + Ca�- + Da�Þ E Eq. 39
Iglesias, Chirife (1978) ln ÈX + (X- + X¯.ß�- )3- = Aa� + BÉ E Eq. 40
Iglesias, Chirife (1981) X = A � a�1 − a�� + B E-T Eq. 41
Ferro Fontan (1982) ln � γa�� = αX�+â E-T Eq. 42
Schuchmann (1990) X = C3x(1 + C-x) ∙ (CÞ − x) E-T Eq. 43
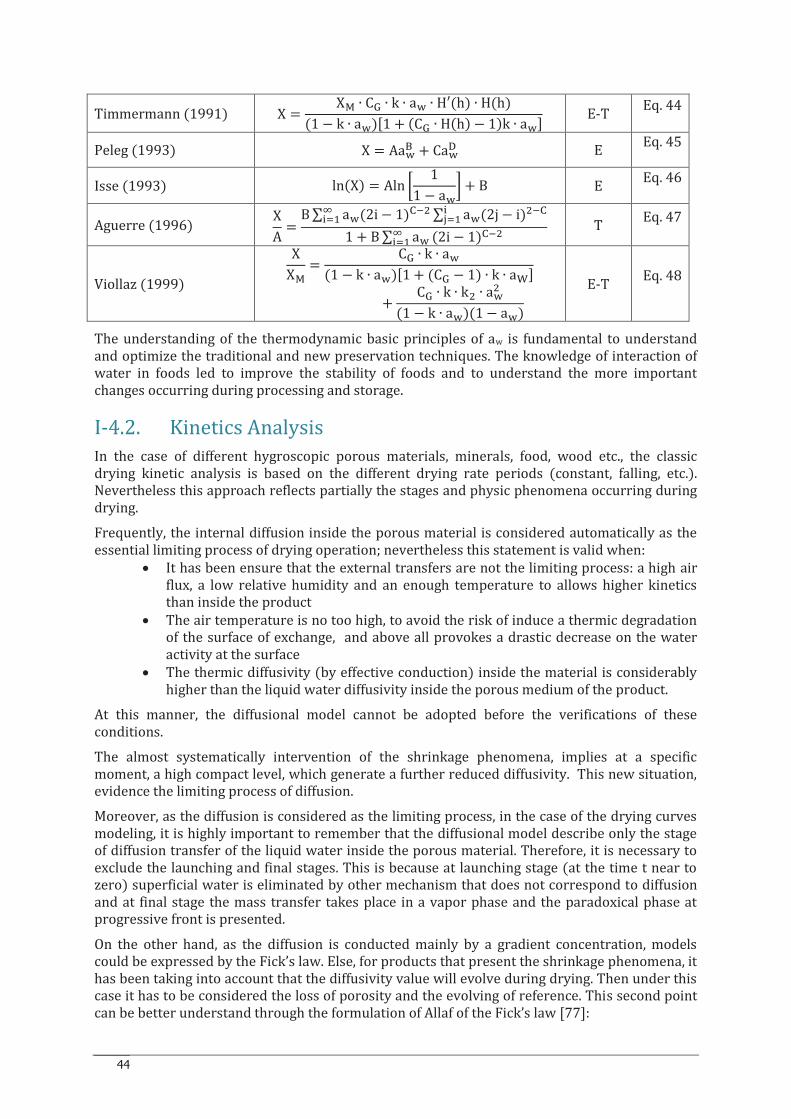
44
Timmermann (1991) X = XÙ ∙ CÝ ∙ k ∙ a� ∙ H′(h) ∙ H(h)(1 − k ∙ a�)[1 + (CÝ ∙ H(h) − 1)k ∙ a�] E-T Eq. 44
Peleg (1993) X = Aa�Ú + Ca�ä E Eq. 45
Isse (1993) ln(X) = Aln È 11 − a�É + B E Eq. 46
Aguerre (1996) XA = B ∑ a�(2i − 1)æ+- ∑ a�(2j − i)-+æêëì3íêì3 1 + B ∑ a�íêì3 (2i − 1)æ+- T
Eq. 47
Viollaz (1999)
XXÙ = CÝ ∙ k ∙ a�(1 − k ∙ a�)[1 + (CÝ − 1) ∙ k ∙ aî]+ CÝ ∙ k ∙ k- ∙ a�-(1 − k ∙ a�)(1 − a�)
E-T Eq. 48
The understanding of the thermodynamic basic principles of aw is fundamental to understand and optimize the traditional and new preservation techniques. The knowledge of interaction of water in foods led to improve the stability of foods and to understand the more important changes occurring during processing and storage.
I-4.2. Kinetics Analysis
In the case of different hygroscopic porous materials, minerals, food, wood etc., the classic drying kinetic analysis is based on the different drying rate periods (constant, falling, etc.). Nevertheless this approach reflects partially the stages and physic phenomena occurring during drying.
Frequently, the internal diffusion inside the porous material is considered automatically as the essential limiting process of drying operation; nevertheless this statement is valid when:
· It has been ensure that the external transfers are not the limiting process: a high air flux, a low relative humidity and an enough temperature to allows higher kinetics than inside the product
· The air temperature is no too high, to avoid the risk of induce a thermic degradation of the surface of exchange, and above all provokes a drastic decrease on the water activity at the surface
· The thermic diffusivity (by effective conduction) inside the material is considerably higher than the liquid water diffusivity inside the porous medium of the product.
At this manner, the diffusional model cannot be adopted before the verifications of these conditions.
The almost systematically intervention of the shrinkage phenomena, implies at a specific moment, a high compact level, which generate a further reduced diffusivity. This new situation, evidence the limiting process of diffusion.
Moreover, as the diffusion is considered as the limiting process, in the case of the drying curves modeling, it is highly important to remember that the diffusional model describe only the stage of diffusion transfer of the liquid water inside the porous material. Therefore, it is necessary to exclude the launching and final stages. This is because at launching stage (at the time t near to zero) superficial water is eliminated by other mechanism that does not correspond to diffusion and at final stage the mass transfer takes place in a vapor phase and the paradoxical phase at progressive front is presented.
On the other hand, as the diffusion is conducted mainly by a gradient concentration, models could be expressed by the Fick’s law. Else, for products that present the shrinkage phenomena, it has been taking into account that the diffusivity value will evolve during drying. Then under this case it has to be considered the loss of porosity and the evolving of reference. This second point can be better understand through the formulation of Allaf of the Fick’s law [77]:
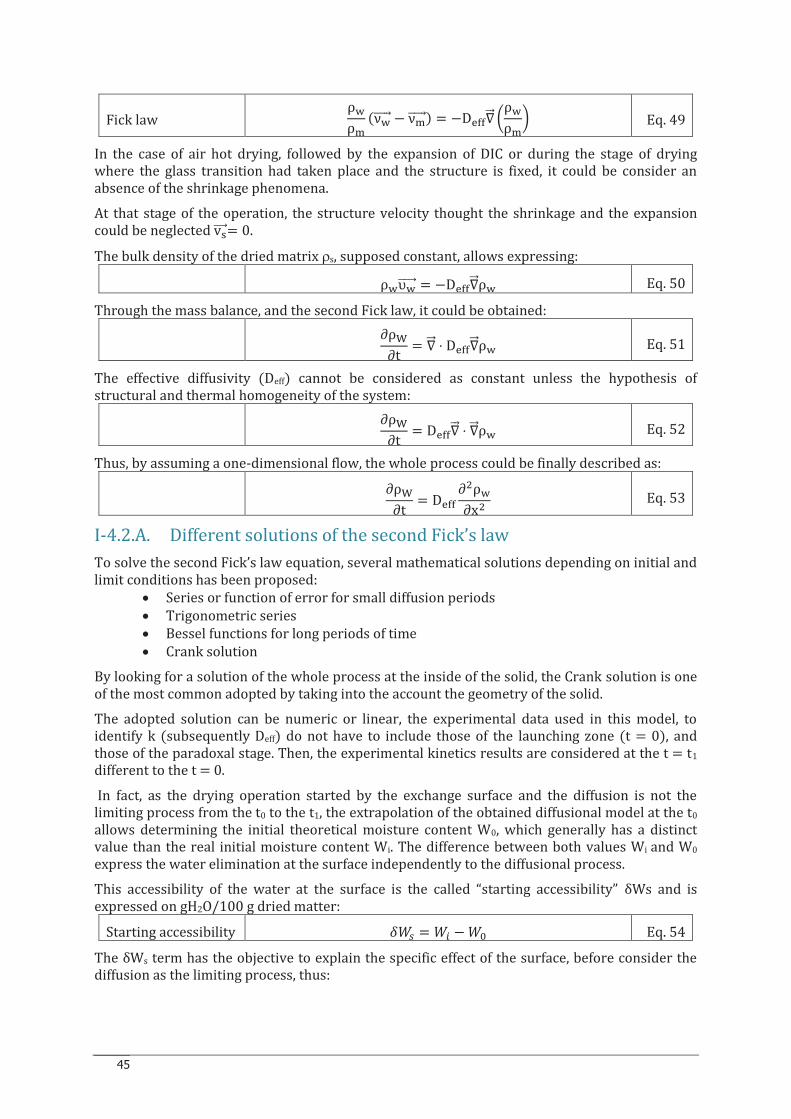
45
Fick law ρ�ρï (ν�}}}}} − νï}}}}} ) = −D���∇}} �ρ�ρï� Eq. 49
In the case of air hot drying, followed by the expansion of DIC or during the stage of drying where the glass transition had taken place and the structure is fixed, it could be consider an absence of the shrinkage phenomena.
At that stage of the operation, the structure velocity thought the shrinkage and the expansion could be neglected v�}}} = 0.
The bulk density of the dried matrix rs, supposed constant, allows expressing:
ρ�υ�}}}}} = −D���∇}} ρ� Eq. 50
Through the mass balance, and the second Fick law, it could be obtained:
∂ρî∂t = ∇}} ⋅ D���∇}} ρ� Eq. 51
The effective diffusivity (Deff) cannot be considered as constant unless the hypothesis of structural and thermal homogeneity of the system:
∂ρî∂t = D���∇}} ⋅ ∇}} ρ� Eq. 52
Thus, by assuming a one-dimensional flow, the whole process could be finally described as:
∂ρî∂t = D��� ∂-ρ�∂x- Eq. 53
I-4.2.A. Different solutions of the second Fick’s law To solve the second Fick’s law equation, several mathematical solutions depending on initial and limit conditions has been proposed:
· Series or function of error for small diffusion periods · Trigonometric series · Bessel functions for long periods of time · Crank solution
By looking for a solution of the whole process at the inside of the solid, the Crank solution is one of the most common adopted by taking into the account the geometry of the solid.
The adopted solution can be numeric or linear, the experimental data used in this model, to identify k (subsequently Deff) do not have to include those of the launching zone (t = 0), and those of the paradoxal stage. Then, the experimental kinetics results are considered at the t = t1 different to the t = 0.
In fact, as the drying operation started by the exchange surface and the diffusion is not the limiting process from the t0 to the t1, the extrapolation of the obtained diffusional model at the t0 allows determining the initial theoretical moisture content W0, which generally has a distinct value than the real initial moisture content Wi. The difference between both values Wi and W0 express the water elimination at the surface independently to the diffusional process. This accessibility of the water at the surface is the called “starting accessibility” δWs and is expressed on gH2O/100 g dried matter:
Starting accessibility ô'] = 'õ − '¯ Eq. 54
The δWs term has the objective to explain the specific effect of the surface, before consider the diffusion as the limiting process, thus:

46
· When δWs = 0, the surface present a non-specific behavior, completely similar to the rest of the volume. The diffusion of water inside the material is the limiting process since the beginning of the drying operation
· When δWs < 0, the surface structure present a strong adsorption effect, limiting or reducing the humidity passage. Then, a dried surface obtained by a previous drying stage implies a more dried surface than the core, this could imply the presence of the “case hardening” phenomena
· When δWs > 0, the drying operation start by an elimination of the available water at the surface, and the diffusion become the limiting process at the end of this first stage.
47
CHAPTER I-5.
INTENSIFICATION OF DRYING AND FREEZING
I-5.1. Intensification of Drying
To intensify the overall operation of hot air drying the optimization has to be done by focusing the limits of each stage of drying. Then, the first intensification could be done by selecting the adequate conditions of relative humidity, temperature and air flow. For the second intensification, it has been taking into account the natural structure of the product. In the case of biological products as they present a very low effective diffusivity value and this is even truer after shrinkage; to intensify the second stage of drying it is necessary to change the product itself. Finally, to intensify the third drying stage, which is the paradoxical stage; this would require a total modification of the technology.
I-5.1.A. First Intensification of External Transfers
Heat and water can be transferred between the matrix and its environment in opposite directions. Heat can be transferred by contact, convection and/or radiation or provide by microwaves. In the case of air-drying process, the heat and mass transfer can be completely correlated. The heat flux depends on the temperature and the velocity of the surrounding medium (air).
At this respect, it has been observed that to intensify the water vapor flow from the exchange surface to the environment, it must be decreased the relative humidity and increased the temperature and velocity of the air flow. However, the temperature increase has to be done with caution, because it must not exceed a certain level to avoid generating thermal degradation.
These external transfers of heat and vapor are relatively simple to perform and easily controllable, nevertheless it has to be taking into account that drying process is generally highly correlated with the phenomenon of shrinkage; thus exterior heat and steam transfers must inevitably decline with the exchange surface (Aeff) changes.
I-5.1.B. Second Intensification: Thermomechanical Texturing
After having increased the external transfers, internal transfers would normally become the new limiting processes. Generally, thermal diffusivity and water diffusivity (liquid and vapor) directly depend on many materials and, in opposite ways, on the degree of porosity and pore distribution. Numerous experimental data and various studies have shown a much higher thermal diffusivity than effective water diffusivity; this phenomenon is more effective with higher compactness due to shrinkage. Only freeze drying with highly porous materials may involve the opposite situation, there the internal transfer of heat by conduction is the limiting process. Then, the expansion of the porous structure enhances water diffusivity, regardless of the liquid or vapor phase. Thus, expansion by extrusion, puffing, DIC process etc., are particularly appropriate at this stage of the drying operation.
The Instant Controlled Pressure Drop Process (DIC)
The Instant Controlled Pressure Drop Process, well known by its French acronym DIC (Détente Instantanée Contrôlée), is a thermo-mechanical process that consist to subject a product to a high pressure saturated steam (about 0.1–0.6 MPa according to the product) for a short period of time (seconds), followed by an abrupt pressure drop towards a vacuum (about 5 kPa). This abrupt pressure drop (ΔP/Δt> 0.5MPa/s) triggers simultaneously autovaporization of water (produced as a function of the difference in the temperature between the initial heat stage and the final equilibrium temperature), swelling, a possibly rupture of the cell walls and instantaneous cooling of the products, which stops thermal degradation.
This process involves many parameters that can be controlled, mainly, divided on:

48
· Intrinsic parameters: shape and size of the raw material, initial water content, specific heat, thermal conductivity, effective diffusivity, and rheological characteristics such as elasticity, viscosity, glass transition, etc.
· Operating process parameters: initial pressure and temperature, total pressure, partial pressure of vapor, initial vacuum pressure, pressure drop rate, thermal processing time, minimal temperature of the product, temperature drop rate, volume ratio of the vacuum tank to the processing vessel, intrinsic density or filling ratio, quantity and apparent volume of the product to be processed, etc.
Therefore, the wide range of possibilities for the selection and control of the treatment parameters, allows optimizing one or more target characteristics on the product and/or the process.
In the case of the intensification of hot air drying, to address the compactness of the product, the coupling of DIC expansion to the hot air drying has been a solution, commonly known as Swell drying process.
The expansion of the product depends on the stress caused by the quantity of autovaporized water as well as the hydro-thermo-rheological behavior of the product and the difference between the internal and external pressures. Thus, this operation is generally achieved when the moisture content results in the glass transition of the material at ambient temperature (Figure 19) [107].
Figure 19. Position of hot air drying and DIC processing vis-à-vis the glass transition curve (T,W)g Adopted from Mounir et al., 2012 [107].
Conventional hot air drying normally follows the cycle A-AD-AD’-A0, which consist on a first heating period, (A-AD), that is assumed to be carried out almost at a constant humidity, a dehydration period (AD-AD’) at a constant temperature and a cooling period (AD’-A0) which often allows the product to cross the glass transition border.
DIC treatment follows the cycle A0-B0-C0, which consists to a first period of heating (A0-B0) usually carried out with saturated steam, follows by an instant cooling (B0-C0), in this the expansion and autovaporization phenomena take place.
Therefore, this new structure increases the mass transfer diffusivity as well as the starting accessibility during drying.
I-5.1.C. Third Intensification: Addressing the Paradoxical Phase of Drying
In the final stage of drying, the residual water, either free or bound, is merely transferred within the porous matrix as a vapor. Evaporation, which is carried out within the pores, is even more important in the case of high-porosity materials. It results in a low conductivity and a significant
Wi500W025
-135
Ti
Td
Tt
C0
A’D
B0
A0 A
AD
DW’0
DW0
W (% d.b)
T (
°C
)
AADA’DA0: Drying schematic cycle
A0 B0 C0 : DIC schematic cycle
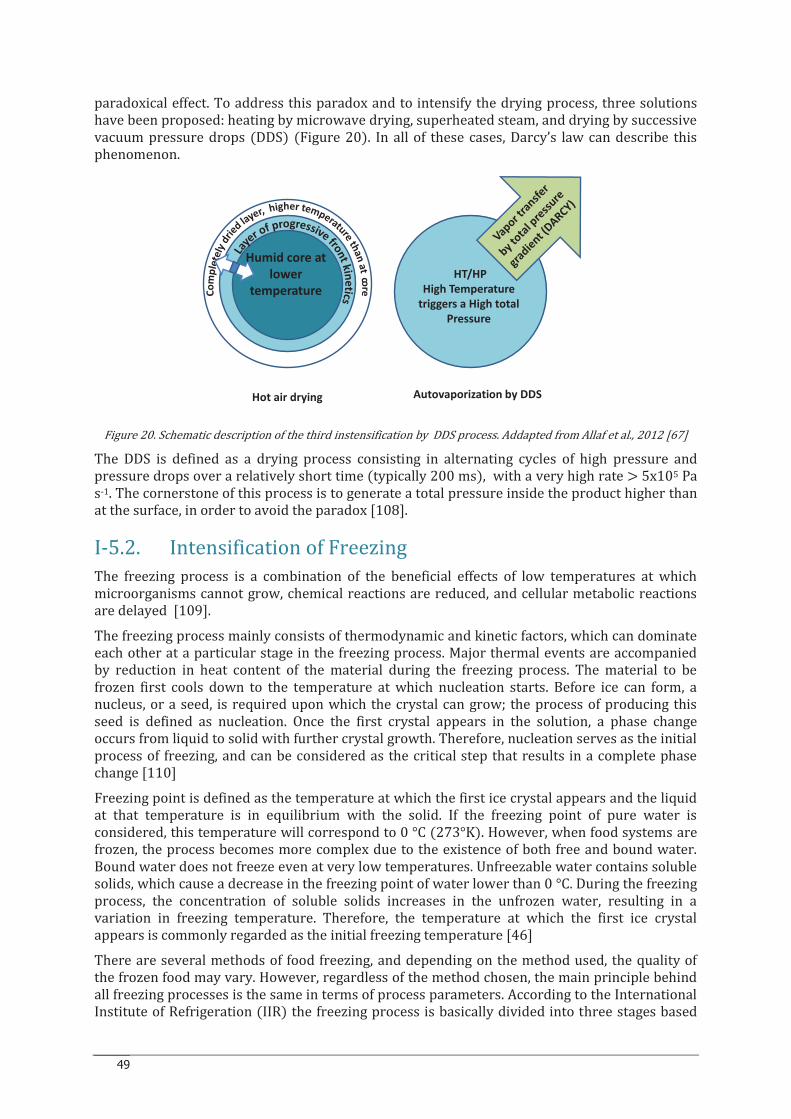
49
paradoxical effect. To address this paradox and to intensify the drying process, three solutions have been proposed: heating by microwave drying, superheated steam, and drying by successive vacuum pressure drops (DDS) (Figure 20). In all of these cases, Darcy’s law can describe this phenomenon.
Figure 20. Schematic description of the third instensification by DDS process. Addapted from Allaf et al., 2012 [67]
The DDS is defined as a drying process consisting in alternating cycles of high pressure and pressure drops over a relatively short time (typically 200 ms), with a very high rate > 5x10⁵ Pa s-1. The cornerstone of this process is to generate a total pressure inside the product higher than at the surface, in order to avoid the paradox [108].
I-5.2. Intensification of Freezing
The freezing process is a combination of the beneficial effects of low temperatures at which microorganisms cannot grow, chemical reactions are reduced, and cellular metabolic reactions are delayed [109].
The freezing process mainly consists of thermodynamic and kinetic factors, which can dominate each other at a particular stage in the freezing process. Major thermal events are accompanied by reduction in heat content of the material during the freezing process. The material to be frozen first cools down to the temperature at which nucleation starts. Before ice can form, a nucleus, or a seed, is required upon which the crystal can grow; the process of producing this seed is defined as nucleation. Once the first crystal appears in the solution, a phase change occurs from liquid to solid with further crystal growth. Therefore, nucleation serves as the initial process of freezing, and can be considered as the critical step that results in a complete phase change [110]
Freezing point is defined as the temperature at which the first ice crystal appears and the liquid at that temperature is in equilibrium with the solid. If the freezing point of pure water is considered, this temperature will correspond to 0 °C (273°K). However, when food systems are frozen, the process becomes more complex due to the existence of both free and bound water. Bound water does not freeze even at very low temperatures. Unfreezable water contains soluble solids, which cause a decrease in the freezing point of water lower than 0 °C. During the freezing process, the concentration of soluble solids increases in the unfrozen water, resulting in a variation in freezing temperature. Therefore, the temperature at which the first ice crystal appears is commonly regarded as the initial freezing temperature [46]
There are several methods of food freezing, and depending on the method used, the quality of the frozen food may vary. However, regardless of the method chosen, the main principle behind all freezing processes is the same in terms of process parameters. According to the International Institute of Refrigeration (IIR) the freezing process is basically divided into three stages based
Hot air drying Autovaporization by DDS
Humid core at
lower
temperature
HT/HP
High Temperature
triggers a High total
Pressure
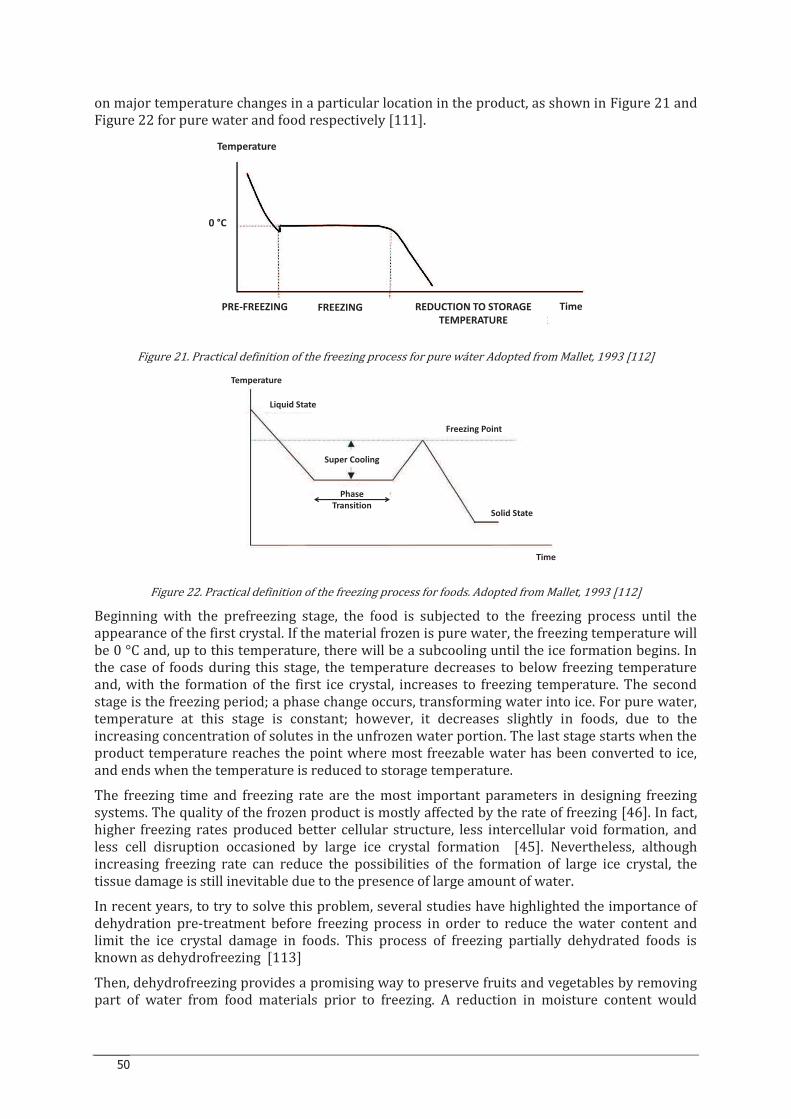
50
on major temperature changes in a particular location in the product, as shown in Figure 21 and Figure 22 for pure water and food respectively [111].
Figure 21. Practical definition of the freezing process for pure wáter Adopted from Mallet, 1993 [112]
Figure 22. Practical definition of the freezing process for foods. Adopted from Mallet, 1993 [112]
Beginning with the prefreezing stage, the food is subjected to the freezing process until the appearance of the first crystal. If the material frozen is pure water, the freezing temperature will be 0 °C and, up to this temperature, there will be a subcooling until the ice formation begins. In the case of foods during this stage, the temperature decreases to below freezing temperature and, with the formation of the first ice crystal, increases to freezing temperature. The second stage is the freezing period; a phase change occurs, transforming water into ice. For pure water, temperature at this stage is constant; however, it decreases slightly in foods, due to the increasing concentration of solutes in the unfrozen water portion. The last stage starts when the product temperature reaches the point where most freezable water has been converted to ice, and ends when the temperature is reduced to storage temperature.
The freezing time and freezing rate are the most important parameters in designing freezing systems. The quality of the frozen product is mostly affected by the rate of freezing [46]. In fact, higher freezing rates produced better cellular structure, less intercellular void formation, and less cell disruption occasioned by large ice crystal formation [45]. Nevertheless, although increasing freezing rate can reduce the possibilities of the formation of large ice crystal, the tissue damage is still inevitable due to the presence of large amount of water.
In recent years, to try to solve this problem, several studies have highlighted the importance of dehydration pre-treatment before freezing process in order to reduce the water content and limit the ice crystal damage in foods. This process of freezing partially dehydrated foods is known as dehydrofreezing [113]
Then, dehydrofreezing provides a promising way to preserve fruits and vegetables by removing part of water from food materials prior to freezing. A reduction in moisture content would
Temperature
PRE-FREEZING FREEZING REDUCTION TO STORAGE
TEMPERATURE
Time
0 °C
Temperature
Time
Liquid State
Super Cooling
Phase
Transition
Freezing Point
Solid State
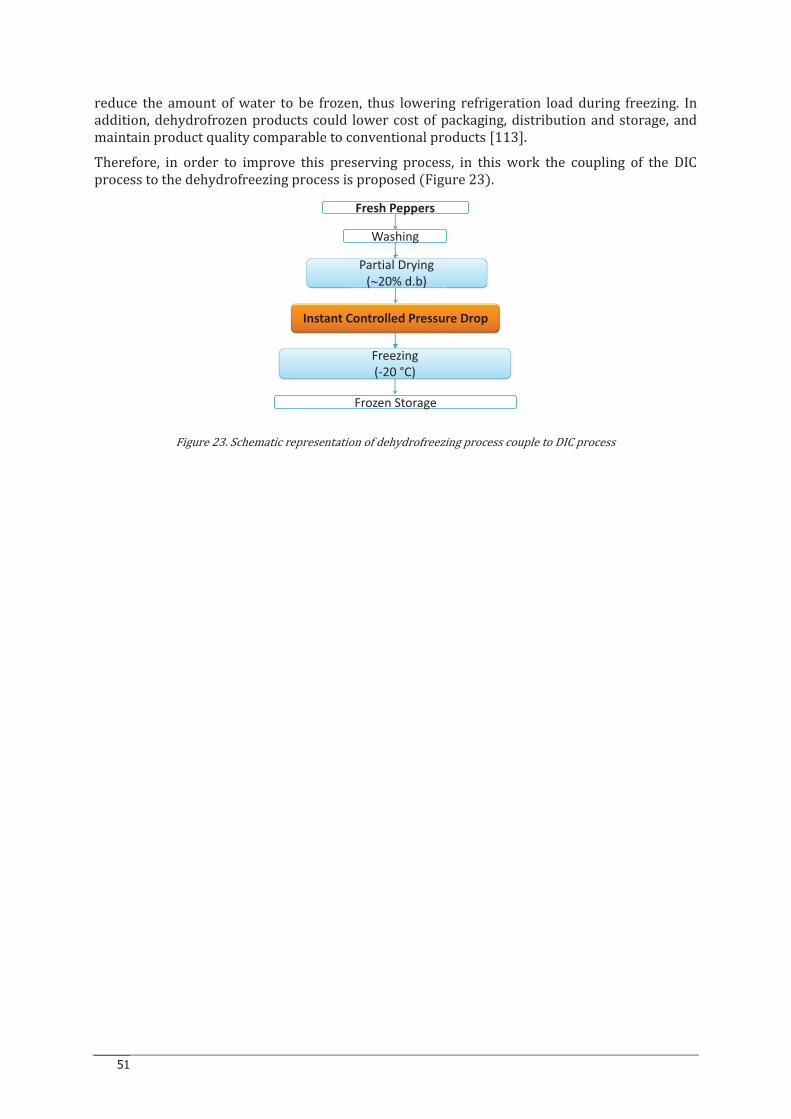
51
reduce the amount of water to be frozen, thus lowering refrigeration load during freezing. In addition, dehydrofrozen products could lower cost of packaging, distribution and storage, and maintain product quality comparable to conventional products [113].
Therefore, in order to improve this preserving process, in this work the coupling of the DIC process to the dehydrofreezing process is proposed (Figure 23).
Figure 23. Schematic representation of dehydrofreezing process couple to DIC process
Fresh Peppers
Washing
Instant Controlled Pressure Drop
Partial Drying(~20% d.b)
Freezing(-20 °C)
Frozen Storage
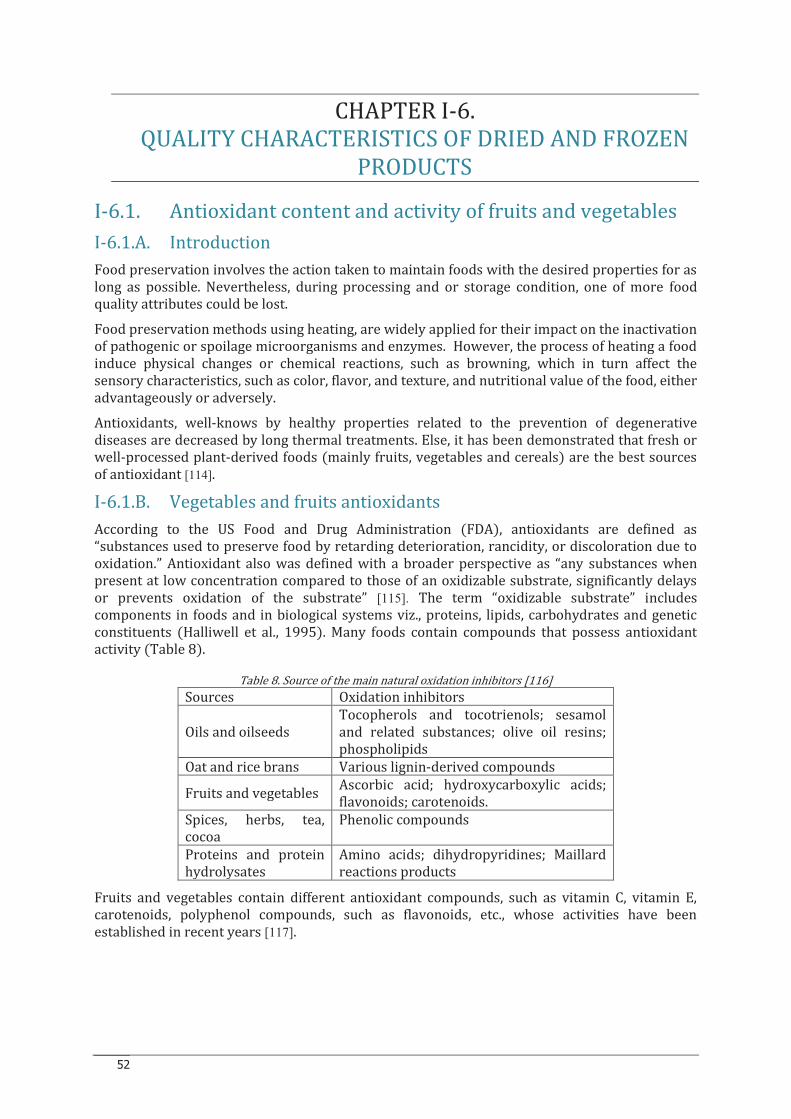
52
CHAPTER I-6.
QUALITY CHARACTERISTICS OF DRIED AND FROZEN
PRODUCTS
I-6.1. Antioxidant content and activity of fruits and vegetables
I-6.1.A. Introduction
Food preservation involves the action taken to maintain foods with the desired properties for as long as possible. Nevertheless, during processing and or storage condition, one of more food quality attributes could be lost.
Food preservation methods using heating, are widely applied for their impact on the inactivation of pathogenic or spoilage microorganisms and enzymes. However, the process of heating a food induce physical changes or chemical reactions, such as browning, which in turn affect the sensory characteristics, such as color, flavor, and texture, and nutritional value of the food, either advantageously or adversely.
Antioxidants, well-knows by healthy properties related to the prevention of degenerative diseases are decreased by long thermal treatments. Else, it has been demonstrated that fresh or well-processed plant-derived foods (mainly fruits, vegetables and cereals) are the best sources of antioxidant [114].
I-6.1.B. Vegetables and fruits antioxidants
According to the US Food and Drug Administration (FDA), antioxidants are defined as “substances used to preserve food by retarding deterioration, rancidity, or discoloration due to oxidation.” Antioxidant also was defined with a broader perspective as “any substances when present at low concentration compared to those of an oxidizable substrate, significantly delays or prevents oxidation of the substrate” [115]. The term “oxidizable substrate” includes components in foods and in biological systems viz., proteins, lipids, carbohydrates and genetic constituents (Halliwell et al., 1995). Many foods contain compounds that possess antioxidant activity (Table 8).
Table 8. Source of the main natural oxidation inhibitors [116]
Sources Oxidation inhibitors
Oils and oilseeds Tocopherols and tocotrienols; sesamol and related substances; olive oil resins; phospholipids
Oat and rice brans Various lignin-derived compounds
Fruits and vegetables Ascorbic acid; hydroxycarboxylic acids; flavonoids; carotenoids.
Spices, herbs, tea, cocoa
Phenolic compounds
Proteins and protein hydrolysates
Amino acids; dihydropyridines; Maillard reactions products
Fruits and vegetables contain different antioxidant compounds, such as vitamin C, vitamin E, carotenoids, polyphenol compounds, such as flavonoids, etc., whose activities have been established in recent years [117].
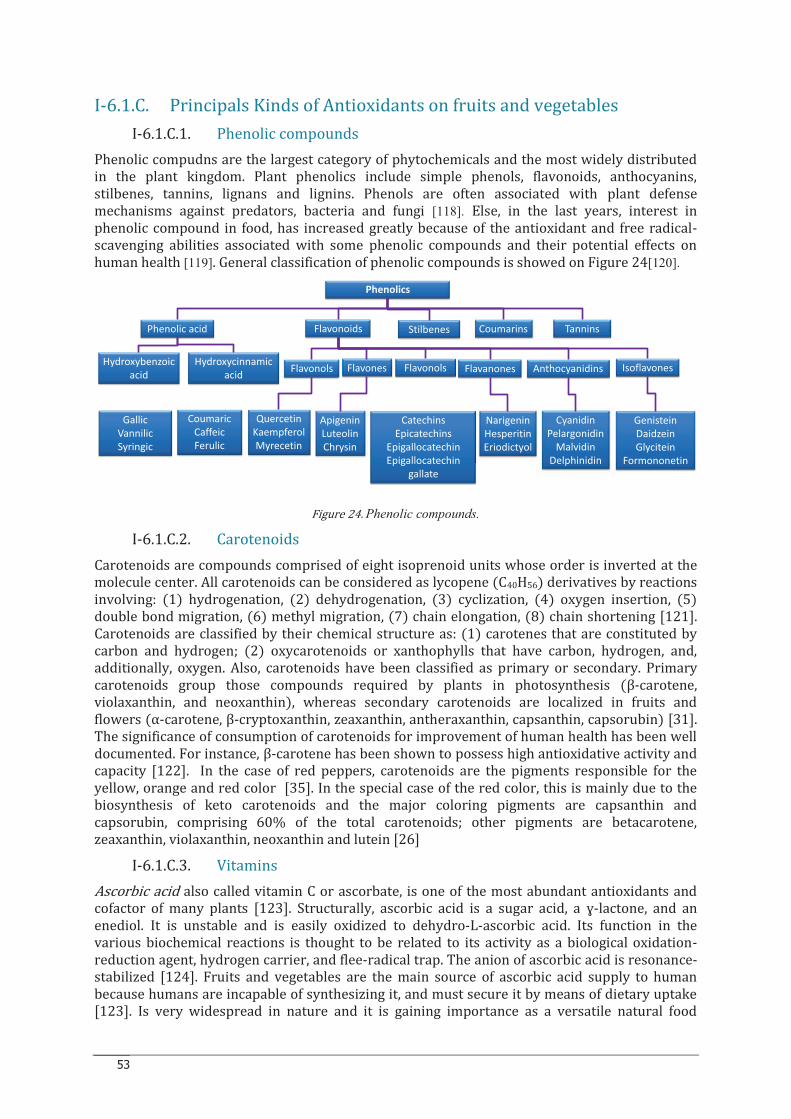
53
I-6.1.C. Principals Kinds of Antioxidants on fruits and vegetables
I-6.1.C.1. Phenolic compounds
Phenolic compudns are the largest category of phytochemicals and the most widely distributed in the plant kingdom. Plant phenolics include simple phenols, flavonoids, anthocyanins, stilbenes, tannins, lignans and lignins. Phenols are often associated with plant defense mechanisms against predators, bacteria and fungi [118]. Else, in the last years, interest in phenolic compound in food, has increased greatly because of the antioxidant and free radical-scavenging abilities associated with some phenolic compounds and their potential effects on human health [119]. General classification of phenolic compounds is showed on Figure 24[120].
Figure 24. Phenolic compounds.
I-6.1.C.2. Carotenoids
Carotenoids are compounds comprised of eight isoprenoid units whose order is inverted at the molecule center. All carotenoids can be considered as lycopene (C40H56) derivatives by reactions involving: (1) hydrogenation, (2) dehydrogenation, (3) cyclization, (4) oxygen insertion, (5) double bond migration, (6) methyl migration, (7) chain elongation, (8) chain shortening [121]. Carotenoids are classified by their chemical structure as: (1) carotenes that are constituted by carbon and hydrogen; (2) oxycarotenoids or xanthophylls that have carbon, hydrogen, and, additionally, oxygen. Also, carotenoids have been classified as primary or secondary. Primary carotenoids group those compounds required by plants in photosynthesis (β-carotene, violaxanthin, and neoxanthin), whereas secondary carotenoids are localized in fruits and flowers (α-carotene, β-cryptoxanthin, zeaxanthin, antheraxanthin, capsanthin, capsorubin) [31]. The significance of consumption of carotenoids for improvement of human health has been well documented. For instance, β-carotene has been shown to possess high antioxidative activity and capacity [122]. In the case of red peppers, carotenoids are the pigments responsible for the yellow, orange and red color [35]. In the special case of the red color, this is mainly due to the biosynthesis of keto carotenoids and the major coloring pigments are capsanthin and capsorubin, comprising 60% of the total carotenoids; other pigments are betacarotene, zeaxanthin, violaxanthin, neoxanthin and lutein [26]
I-6.1.C.3. Vitamins
Ascorbic acid also called vitamin C or ascorbate, is one of the most abundant antioxidants and cofactor of many plants [123]. Structurally, ascorbic acid is a sugar acid, a ɣ-lactone, and an enediol. It is unstable and is easily oxidized to dehydro-L-ascorbic acid. Its function in the various biochemical reactions is thought to be related to its activity as a biological oxidation-reduction agent, hydrogen carrier, and flee-radical trap. The anion of ascorbic acid is resonance-stabilized [124]. Fruits and vegetables are the main source of ascorbic acid supply to human because humans are incapable of synthesizing it, and must secure it by means of dietary uptake [123]. Is very widespread in nature and it is gaining importance as a versatile natural food
Phenolics
FlavonoidsPhenolic acid CoumarinsStilbenes
Hydroxybenzoicacid
Flavonols
Tannins
Flavones Flavonols Flavanones Anthocyanidins IsoflavonesHydroxycinnamic
acid
GallicVannilicSyringic
CoumaricCaffeicFerulic
QuercetinKaempferolMyrecetin
ApigeninLuteolinChrysin
CatechinsEpicatechins
EpigallocatechinEpigallocatechin
gallate
NarigeninHesperitinEriodictyol
CyanidinPelargonidin
MalvidinDelphinidin
GenisteinDaidzeinGlycitein
Formononetin

54
additive [125]. Two main mechanisms can cause ascorbic acid loss in food: degradation by oxidation during processing and storage, and release by diffusion during processing such as blanching [126]. Peppers are an excellent source of ascorbic acid [8] [127]
I-6.1.C.4. Capsaicins
The capsaicins of peppers (capsaicin, dihydrocapsaicin, nordihydrocapsaicin, homocapsaicin, homdihydrocapsaicain and norcapsaicin) [24] have also presented potent antioxidative activity [128]. Figure 25 shows the chemical structures of capsaicinoids compounds.
Figure 25. Chemical structures of capsaicinoids compounds [24]
Capsaicin (8-methyl-N-vanillyl-6-nonenamide) the major alkaloid responsible for the mucosal irritant properties of Capsicum [5], has also shown substantial anticarcinogenic and antimutagenic activities [129].
I-6.1.D. Antioxidant Mechanism of Action of Fruits and Vegetables
Antioxidants are substances capable of delaying, retarding or preventing the development in food of rancidity or other flavour deterioration due to oxidation. Antioxidants can inhibit or retard oxidation in two ways: either by scavenging free radicals, in which case the compound is described as a primary antioxidant, or by a mechanism that does not involve direct scavenging of free radicals, in which case the compound is a secondary antioxidant [130]. Inhibitors of autoxidation may be classified into groups according to their mechanism of action (Table 9. Classification of inhibitors of lipid oxidation [116]).
Table 9. Classification of inhibitors of lipid oxidation [116]
Type of inhibitor Mechanism of action
Antioxidants Reaction with free radicals, interrupting the propagation phase of the chain reaction
Synergists Increasing antioxidant activity
Retarders Reducing hydroperoxides without forming free radicals
Metal scavengers Inhibiting the ability of heavy metals to catalyses the production of free radicals
Singlet-oxygen quenchers
Deactivating the free radical chain reaction
Compounds
Norcapsaicin
Capsaicin
Homocapsaicin
Nornordihydrocapsaicin
Nordehydrocapsaicin
Dihydrocapsaicin
Homodihydrocapsaicin
Nornorcapsaicin
NH
O
R
HO
H3CO
R
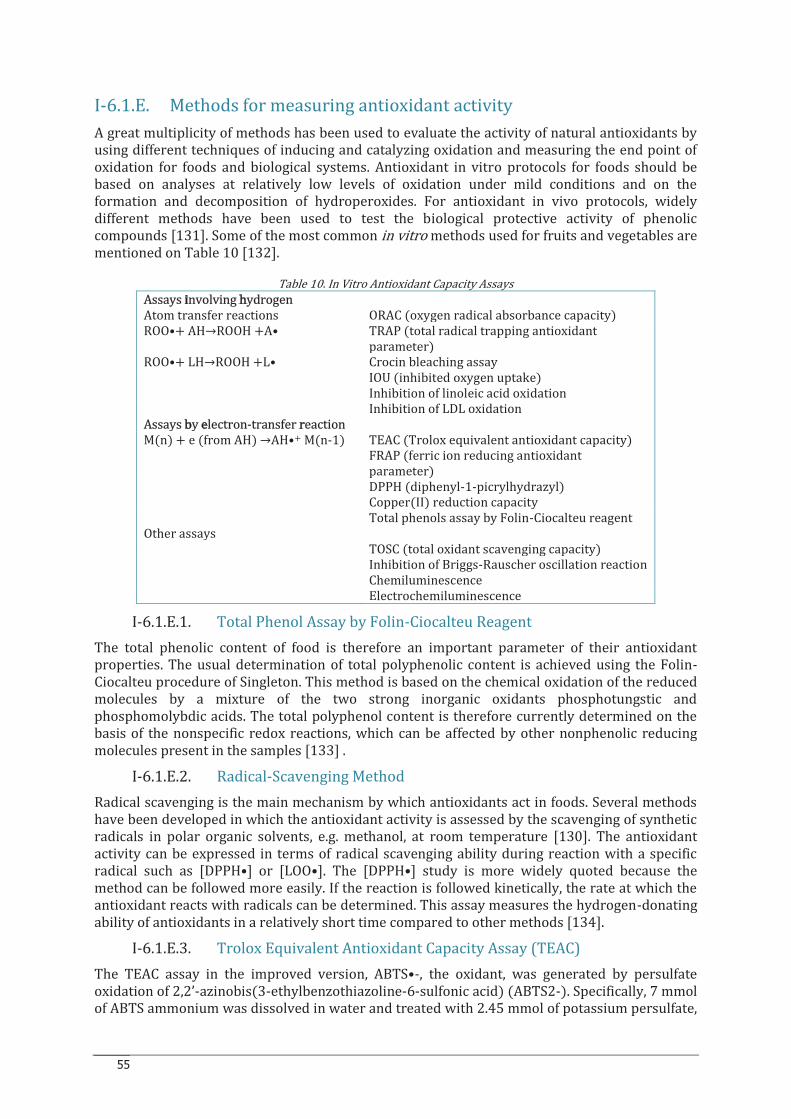
55
I-6.1.E. Methods for measuring antioxidant activity
A great multiplicity of methods has been used to evaluate the activity of natural antioxidants by using different techniques of inducing and catalyzing oxidation and measuring the end point of oxidation for foods and biological systems. Antioxidant in vitro protocols for foods should be based on analyses at relatively low levels of oxidation under mild conditions and on the formation and decomposition of hydroperoxides. For antioxidant in vivo protocols, widely different methods have been used to test the biological protective activity of phenolic compounds [131]. Some of the most common in vitro methods used for fruits and vegetables are mentioned on Table 10 [132].
Table 10. In Vitro Antioxidant Capacity Assays Assays involving hydrogen Atom transfer reactions ORAC (oxygen radical absorbance capacity) ROO•+ AH→ROOH +A• TRAP (total radical trapping antioxidant
parameter) ROO•+ LH→ROOH +L• Crocin bleaching assay IOU (inhibited oxygen uptake) Inhibition of linoleic acid oxidation Inhibition of LDL oxidation Assays by electron-transfer reaction M(n) + e (from AH) →AH•+ M(n-1) TEAC (Trolox equivalent antioxidant capacity) FRAP (ferric ion reducing antioxidant
parameter) DPPH (diphenyl-1-picrylhydrazyl) Copper(II) reduction capacity Total phenols assay by Folin-Ciocalteu reagent Other assays TOSC (total oxidant scavenging capacity) Inhibition of Briggs-Rauscher oscillation reaction Chemiluminescence Electrochemiluminescence
I-6.1.E.1. Total Phenol Assay by Folin-Ciocalteu Reagent
The total phenolic content of food is therefore an important parameter of their antioxidant properties. The usual determination of total polyphenolic content is achieved using the Folin-Ciocalteu procedure of Singleton. This method is based on the chemical oxidation of the reduced molecules by a mixture of the two strong inorganic oxidants phosphotungstic and phosphomolybdic acids. The total polyphenol content is therefore currently determined on the basis of the nonspecific redox reactions, which can be affected by other nonphenolic reducing molecules present in the samples [133] .
I-6.1.E.2. Radical-Scavenging Method
Radical scavenging is the main mechanism by which antioxidants act in foods. Several methods have been developed in which the antioxidant activity is assessed by the scavenging of synthetic radicals in polar organic solvents, e.g. methanol, at room temperature [130]. The antioxidant activity can be expressed in terms of radical scavenging ability during reaction with a specific radical such as [DPPH•] or [LOO•]. The [DPPH•] study is more widely quoted because the method can be followed more easily. If the reaction is followed kinetically, the rate at which the antioxidant reacts with radicals can be determined. This assay measures the hydrogen-donating ability of antioxidants in a relatively short time compared to other methods [134].
I-6.1.E.3. Trolox Equivalent Antioxidant Capacity Assay (TEAC) The TEAC assay in the improved version, ABTS•-, the oxidant, was generated by persulfate oxidation of 2,2’-azinobis(3-ethylbenzothiazoline-6-sulfonic acid) (ABTS2-). Specifically, 7 mmol of ABTS ammonium was dissolved in water and treated with 2.45 mmol of potassium persulfate,
56
and the mixture was then allowed to stand at room temperature for 12-16 h to give a dark blue solution. This solution was diluted with ethanol or buffer (pH 7.4) until the absorbance reached 0.7 at 734 nm. One milliliter of the resulting solution was mixed with 10/L of sample. The absorbance was read at 30 °C, 1, 4, and 6 min after mixing at 30 °C. The difference of the absorbance reading is plotted versus the antioxidant concentrations to give a straight line. The concentration of antioxidants giving the same percentage change of absorbance of the ABTS•- as that of 1 mM Trolox was regarded as TEAC [132].
I-6.1.F. Antioxidant functionality before and after processing of
vegetables and fruits
After harvest and before consumption, vegetables may be stored for varying periods of time and may be processed and prepared under a wide variety of conditions. Previous studies of vegetable antioxidant activity have shown the conditions of storage, processing and preparation have very significant effects on content of antioxidants [135].
The study of the effects of soaking, boiling and steaming processes on the total phenolic components and antioxidant activity in legumes showed that all process decreased the in total phenolic content (TPC) and DPPH free radical scavenging activity of the products [136].
Several reports have documented the losses of b-carotene from vegetables during cooking procedures such as boiling, stewing, frying, blanching, and pressure cooking, etc. [137, 138]. Research work of Gayathri et al, shows considerable amounts of β-carotene were lost during the two domestic methods of cooking commonly used, namely, pressure cooking and open pan boiling, the loss ranging from 27 to 71% during pressure cooking and 16–67% during boiling for spinach. [139].
Another study, evaluating the effect of thermal blanching prior to freezing of vegetable, has shown losses of sensorial (texture, taste, flavor, and color) and nutritional quality attributes, such as reduction of ascorbic acid content due to heating on pepper and peas [140, 141].
On the other hand, a large part of fruits and vegetables preserved through hot air drying (industrial or solar processes); has shown important losses on nutritional molecules; texture and functional characteristics. For example in the case of dried mangoes and peppers losses on carotenoids has been showed (Chen a, C.Y. Tai), [114].
Therefore, by adopting new preserving methods and optimizing the parameters of processing one could often reduce these degradations.
I-6.2. Rehydration Capacity
Rehydration relates the amount of water that a dry food is able to absorb in a given period of time. This term is usually associated with the kinetics and technological aspects of the process. In fact, during the rehydration process, the dry material, which is submerged in water or some other aqueous medium, undergoes several simultaneous physicochemical changes (e.g., in moisture and solids content, porosity, volume, temperature, gelatinization, and texture)[63].
The rehydration involves various processes running in parallel, including imbibition of liquid into the dried material, transport of the liquid through the porous network and diffusion through the solid matrix, swelling of certain domains in the solid matrix, and leaching of soluble solids into the external liquid. As a result of all of these processes, rehydration of dry foods is a very complex phenomenon that involves several different, simultaneously occurring physical mechanisms. [63]
The quality of rehydrated products is affected by the drying conditions and rehydration processes utilized. During the drying process, physicochemical changes, including textural and structural modifications, migration of solutes, irreversible cellular rupture and dislocation, resulting in loss of integrity and hence, in a dense structure of collapsed, greatly shrunken
57
capillaries with reduced hydrophilic properties, which are reflected by the inability to imbibe sufficient water to fully rehydrate. [142]
Therefore, the drying and rehydration processes needs to be understood and controlled in order to create a dried product with optimal nutritional, sensorial, and rehydration characteristics.
The most common approach to describing the mechanism of liquid uptake during rehydration of dry food is diffusion. Thus, as in the case of the drying modeling by doing several assumptions and solving Fick’s laws, the value of the effective diffusivity (Deff), starting accessibility and final moisture content can be derived from experimental data.
I-6.3. Water holding capacity
The water holding capacity (WHC) is considered as a physical property to indicate the capacity of dried material to hold water, in fact as it asses the water retention when a mechanical force such as centrifugal force was exerted on the rehydrated product, it is a reference of the tissue structural damages (as shrinkage and collapse) caused by the different drying processing [143]
58
PART II
MATERIALS AND METHODS
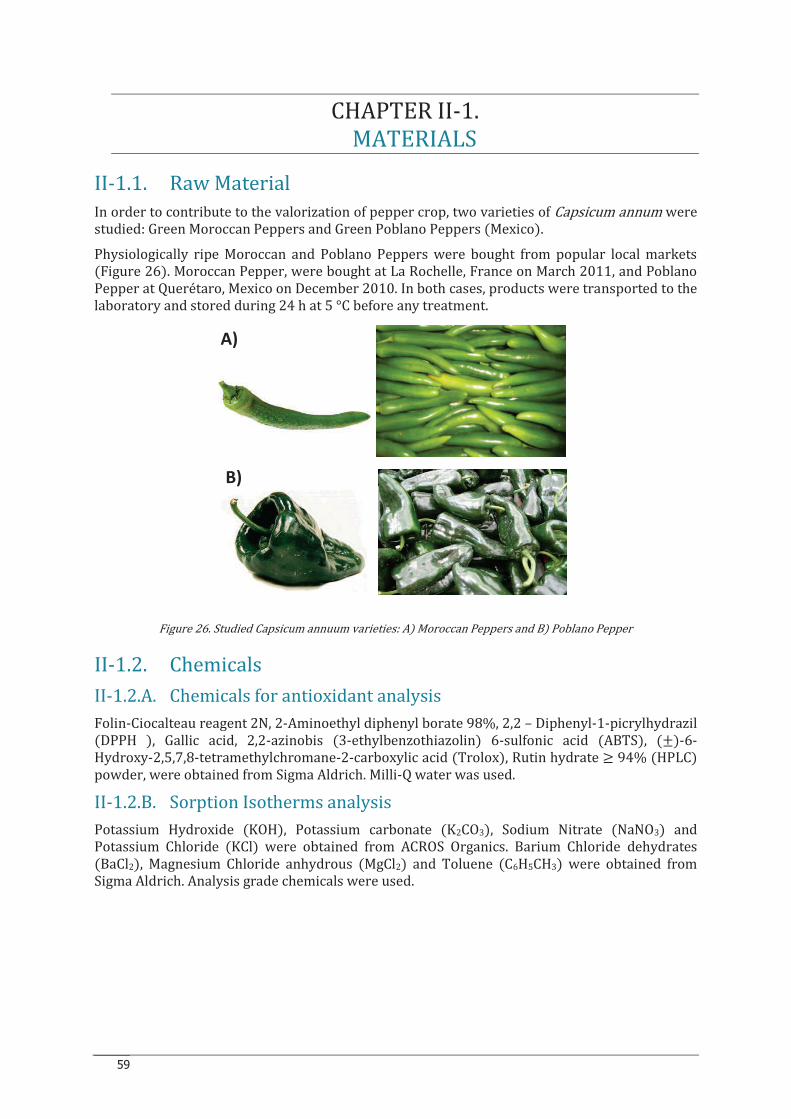
59
CHAPTER II-1.
MATERIALS
II-1.1. Raw Material
In order to contribute to the valorization of pepper crop, two varieties of Capsicum annum were studied: Green Moroccan Peppers and Green Poblano Peppers (Mexico).
Physiologically ripe Moroccan and Poblano Peppers were bought from popular local markets (Figure 26). Moroccan Pepper, were bought at La Rochelle, France on March 2011, and Poblano Pepper at Querétaro, Mexico on December 2010. In both cases, products were transported to the laboratory and stored during 24 h at 5 °C before any treatment.
Figure 26. Studied Capsicum annuum varieties: A) Moroccan Peppers and B) Poblano Pepper
II-1.2. Chemicals
II-1.2.A. Chemicals for antioxidant analysis
Folin-Ciocalteau reagent 2N, 2-Aminoethyl diphenyl borate 98%, 2,2 – Diphenyl-1-picrylhydrazil (DPPH ), Gallic acid, 2,2-azinobis (3-ethylbenzothiazolin) 6-sulfonic acid (ABTS), (±)-6-Hydroxy-2,5,7,8-tetramethylchromane-2-carboxylic acid (Trolox), Rutin hydrate ≥ 94% (HPLC) powder, were obtained from Sigma Aldrich. Milli-Q water was used.
II-1.2.B. Sorption Isotherms analysis
Potassium Hydroxide (KOH), Potassium carbonate (K2CO3), Sodium Nitrate (NaNO3) and Potassium Chloride (KCl) were obtained from ACROS Organics. Barium Chloride dehydrates (BaCl2), Magnesium Chloride anhydrous (MgCl2) and Toluene (C6H5CH3) were obtained from Sigma Aldrich. Analysis grade chemicals were used.
A)
B)
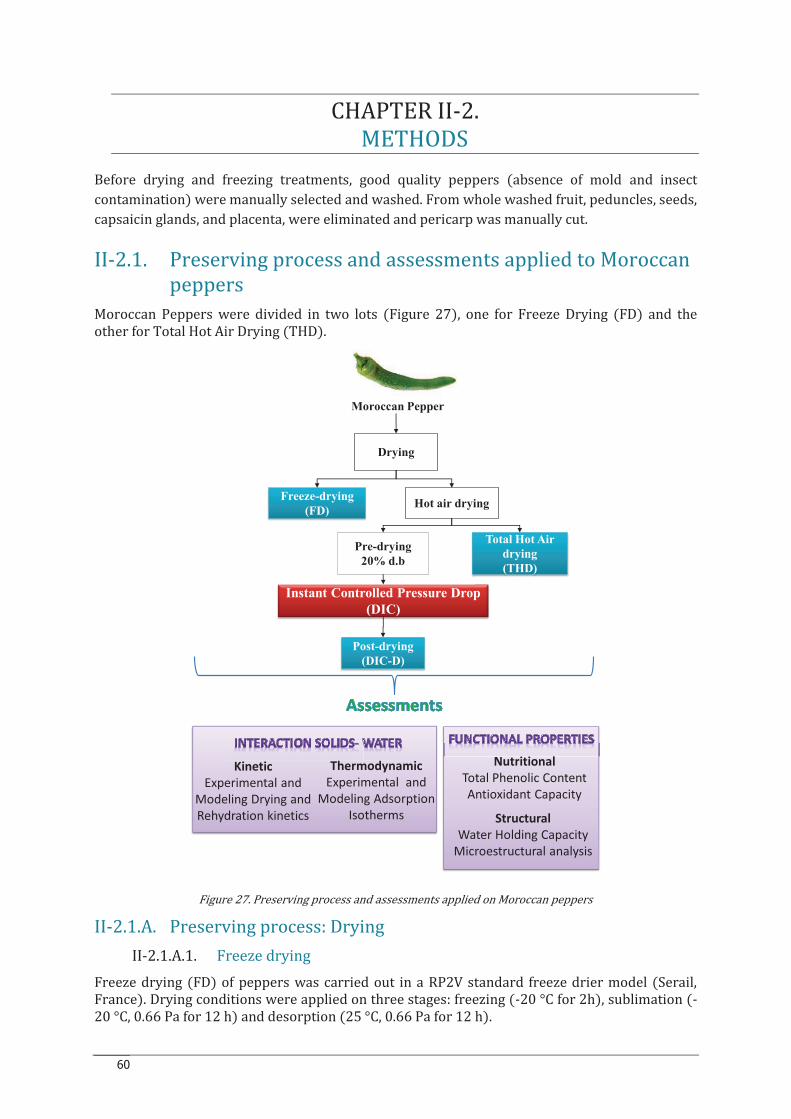
60
CHAPTER II-2.
METHODS
Before drying and freezing treatments, good quality peppers (absence of mold and insect contamination) were manually selected and washed. From whole washed fruit, peduncles, seeds, capsaicin glands, and placenta, were eliminated and pericarp was manually cut.
II-2.1. Preserving process and assessments applied to Moroccan
peppers
Moroccan Peppers were divided in two lots (Figure 27), one for Freeze Drying (FD) and the other for Total Hot Air Drying (THD).
Figure 27. Preserving process and assessments applied on Moroccan peppers
II-2.1.A. Preserving process: Drying
II-2.1.A.1. Freeze drying
Freeze drying (FD) of peppers was carried out in a RP2V standard freeze drier model (Serail, France). Drying conditions were applied on three stages: freezing (-20 °C for 2h), sublimation (-20 °C, 0.66 Pa for 12 h) and desorption (25 °C, 0.66 Pa for 12 h).
Moroccan Pepper
Drying
Freeze-drying
(FD)Hot air drying
Pre-drying
20% d.b
Total Hot Air
drying
(THD)
Instant Controlled Pressure Drop
(DIC)
Post-drying
(DIC-D)
Kinetic
Experimental and Modeling Drying and Rehydration kinetics
Thermodynamic
Experimental and Modeling Adsorption
Isotherms
Nutritional
Total Phenolic ContentAntioxidant Capacity
Structural
Water Holding CapacityMicroestructural analysis
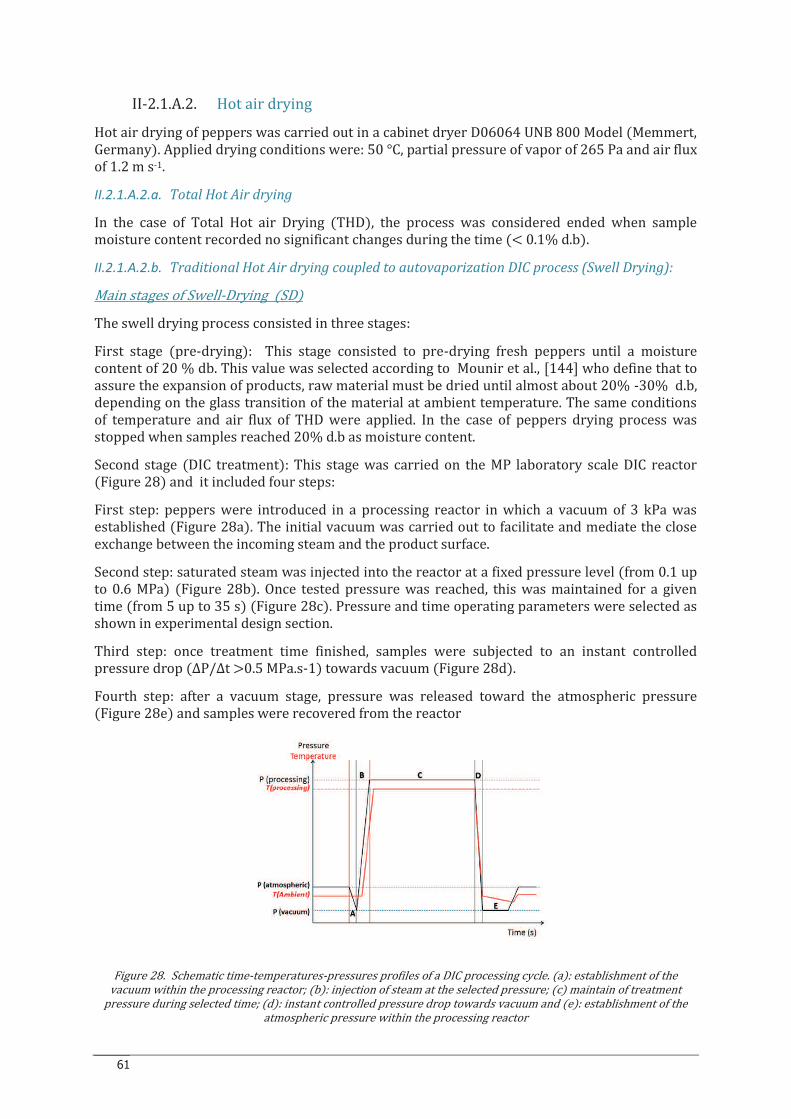
61
II-2.1.A.2. Hot air drying
Hot air drying of peppers was carried out in a cabinet dryer D06064 UNB 800 Model (Memmert, Germany). Applied drying conditions were: 50 °C, partial pressure of vapor of 265 Pa and air flux of 1.2 m s-1.
II.2.1.A.2.a. Total Hot Air drying
In the case of Total Hot air Drying (THD), the process was considered ended when sample moisture content recorded no significant changes during the time (< 0.1% d.b).
II.2.1.A.2.b. Traditional Hot Air drying coupled to autovaporization DIC process (Swell Drying):
Main stages of Swell-Drying (SD)
The swell drying process consisted in three stages:
First stage (pre-drying): This stage consisted to pre-drying fresh peppers until a moisture content of 20 % db. This value was selected according to Mounir et al., [144] who define that to assure the expansion of products, raw material must be dried until almost about 20% -30% d.b, depending on the glass transition of the material at ambient temperature. The same conditions of temperature and air flux of THD were applied. In the case of peppers drying process was stopped when samples reached 20% d.b as moisture content.
Second stage (DIC treatment): This stage was carried on the MP laboratory scale DIC reactor (Figure 28) and it included four steps:
First step: peppers were introduced in a processing reactor in which a vacuum of 3 kPa was established (Figure 28a). The initial vacuum was carried out to facilitate and mediate the close exchange between the incoming steam and the product surface.
Second step: saturated steam was injected into the reactor at a fixed pressure level (from 0.1 up to 0.6 MPa) (Figure 28b). Once tested pressure was reached, this was maintained for a given time (from 5 up to 35 s) (Figure 28c). Pressure and time operating parameters were selected as shown in experimental design section.
Third step: once treatment time finished, samples were subjected to an instant controlled pressure drop (ΔP/Δt >0.5 MPa.s-1) towards vacuum (Figure 28d).
Fourth step: after a vacuum stage, pressure was released toward the atmospheric pressure (Figure 28e) and samples were recovered from the reactor
Figure 28. Schematic time-temperatures-pressures profiles of a DIC processing cycle. (a): establishment of the vacuum within the processing reactor; (b): injection of steam at the selected pressure; (c) maintain of treatment
pressure during selected time; (d): instant controlled pressure drop towards vacuum and (e): establishment of the atmospheric pressure within the processing reactor
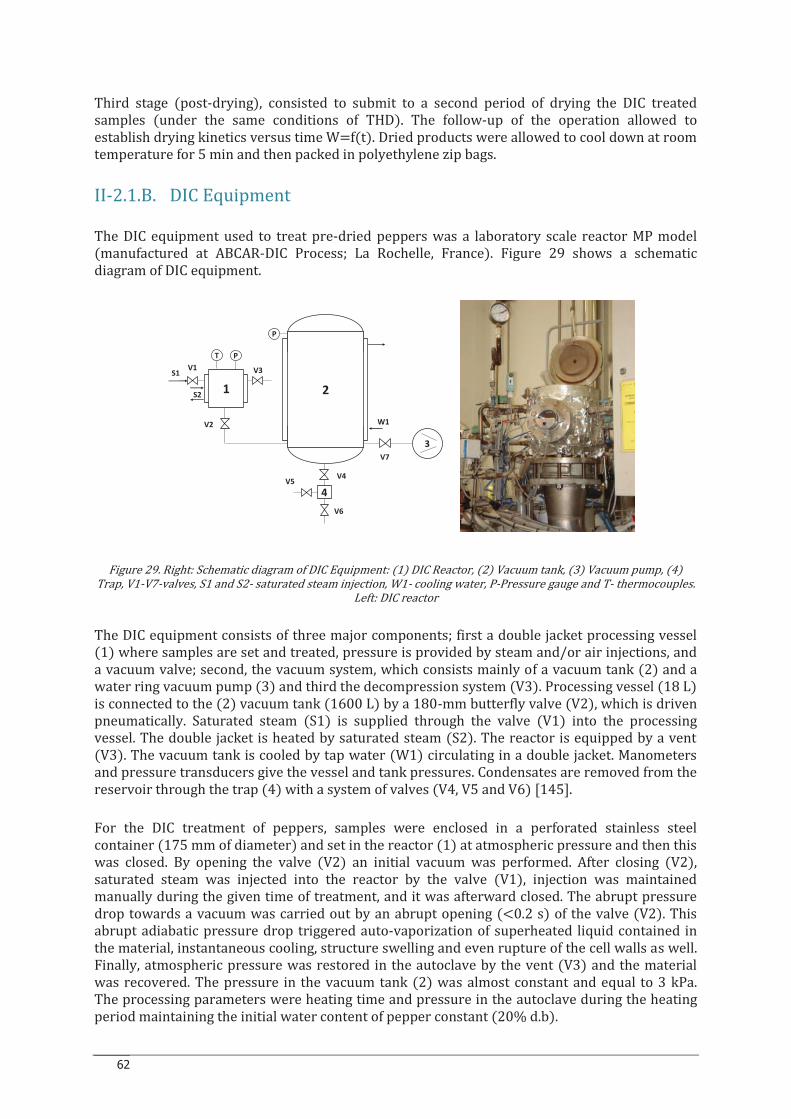
62
Third stage (post-drying), consisted to submit to a second period of drying the DIC treated samples (under the same conditions of THD). The follow-up of the operation allowed to establish drying kinetics versus time W=f(t). Dried products were allowed to cool down at room temperature for 5 min and then packed in polyethylene zip bags.
II-2.1.B. DIC Equipment
The DIC equipment used to treat pre-dried peppers was a laboratory scale reactor MP model (manufactured at ABCAR-DIC Process; La Rochelle, France). Figure 29 shows a schematic diagram of DIC equipment.
Figure 29. Right: Schematic diagram of DIC Equipment: (1) DIC Reactor, (2) Vacuum tank, (3) Vacuum pump, (4) Trap, V1-V7-valves, S1 and S2- saturated steam injection, W1- cooling water, P-Pressure gauge and T- thermocouples.
Left: DIC reactor
The DIC equipment consists of three major components; first a double jacket processing vessel (1) where samples are set and treated, pressure is provided by steam and/or air injections, and a vacuum valve; second, the vacuum system, which consists mainly of a vacuum tank (2) and a water ring vacuum pump (3) and third the decompression system (V3). Processing vessel (18 L) is connected to the (2) vacuum tank (1600 L) by a 180-mm butterfly valve (V2), which is driven pneumatically. Saturated steam (S1) is supplied through the valve (V1) into the processing vessel. The double jacket is heated by saturated steam (S2). The reactor is equipped by a vent (V3). The vacuum tank is cooled by tap water (W1) circulating in a double jacket. Manometers and pressure transducers give the vessel and tank pressures. Condensates are removed from the reservoir through the trap (4) with a system of valves (V4, V5 and V6) [145].
For the DIC treatment of peppers, samples were enclosed in a perforated stainless steel container (175 mm of diameter) and set in the reactor (1) at atmospheric pressure and then this was closed. By opening the valve (V2) an initial vacuum was performed. After closing (V2), saturated steam was injected into the reactor by the valve (V1), injection was maintained manually during the given time of treatment, and it was afterward closed. The abrupt pressure drop towards a vacuum was carried out by an abrupt opening (<0.2 s) of the valve (V2). This abrupt adiabatic pressure drop triggered auto-vaporization of superheated liquid contained in the material, instantaneous cooling, structure swelling and even rupture of the cell walls as well. Finally, atmospheric pressure was restored in the autoclave by the vent (V3) and the material was recovered. The pressure in the vacuum tank (2) was almost constant and equal to 3 kPa. The processing parameters were heating time and pressure in the autoclave during the heating period maintaining the initial water content of pepper constant (20% d.b).
2
3
1
P
PT
V3
V2
4
V7
V4
V6
V5
W1
S2
S1V1
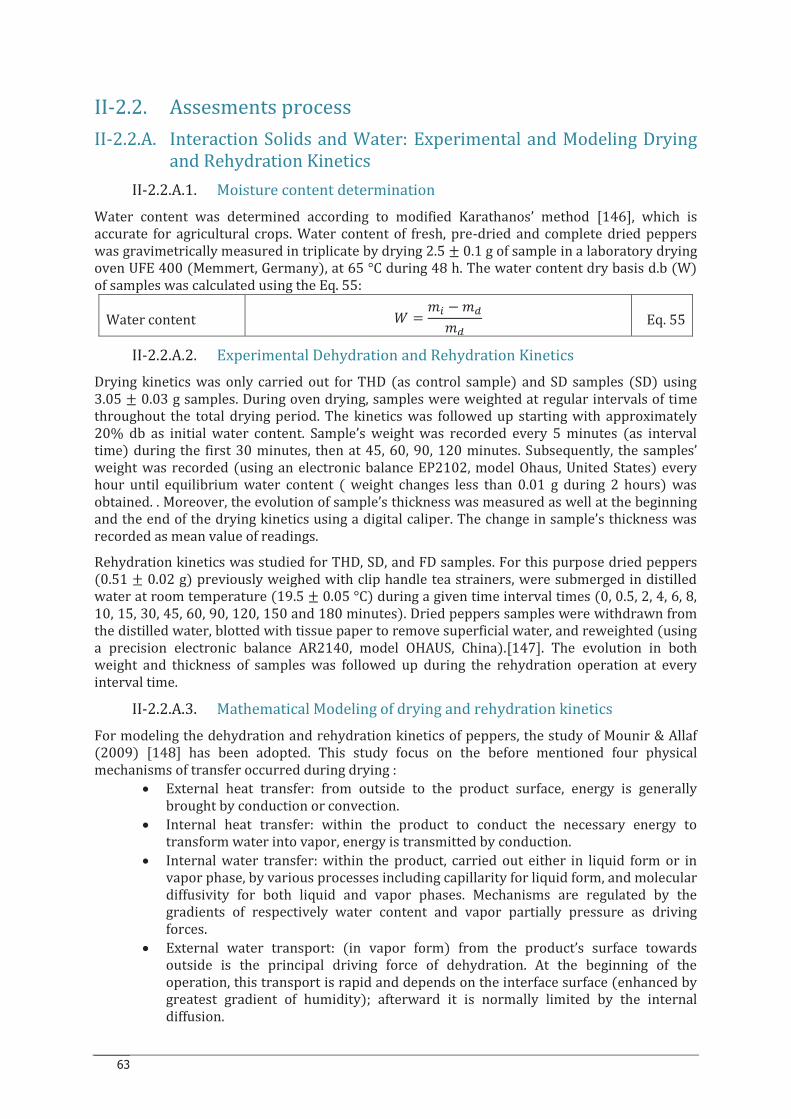
63
II-2.2. Assesments process
II-2.2.A. Interaction Solids and Water: Experimental and Modeling Drying
and Rehydration Kinetics
II-2.2.A.1. Moisture content determination Water content was determined according to modified Karathanos’ method [146], which is accurate for agricultural crops. Water content of fresh, pre-dried and complete dried peppers was gravimetrically measured in triplicate by drying 2.5 ± 0.1 g of sample in a laboratory drying oven UFE 400 (Memmert, Germany), at 65 °C during 48 h. The water content dry basis d.b (W) of samples was calculated using the Eq. 55:
Water content ' = %õ − %Ò%Ò Eq. 55
II-2.2.A.2. Experimental Dehydration and Rehydration Kinetics
Drying kinetics was only carried out for THD (as control sample) and SD samples (SD) using 3.05 ± 0.03 g samples. During oven drying, samples were weighted at regular intervals of time throughout the total drying period. The kinetics was followed up starting with approximately 20% db as initial water content. Sample’s weight was recorded every 5 minutes (as interval time) during the first 30 minutes, then at 45, 60, 90, 120 minutes. Subsequently, the samples’ weight was recorded (using an electronic balance EP2102, model Ohaus, United States) every hour until equilibrium water content ( weight changes less than 0.01 g during 2 hours) was obtained. . Moreover, the evolution of sample’s thickness was measured as well at the beginning and the end of the drying kinetics using a digital caliper. The change in sample’s thickness was recorded as mean value of readings.
Rehydration kinetics was studied for THD, SD, and FD samples. For this purpose dried peppers (0.51 ± 0.02 g) previously weighed with clip handle tea strainers, were submerged in distilled water at room temperature (19.5 ± 0.05 °C) during a given time interval times (0, 0.5, 2, 4, 6, 8, 10, 15, 30, 45, 60, 90, 120, 150 and 180 minutes). Dried peppers samples were withdrawn from the distilled water, blotted with tissue paper to remove superficial water, and reweighted (using a precision electronic balance AR2140, model OHAUS, China).[147]. The evolution in both weight and thickness of samples was followed up during the rehydration operation at every interval time.
II-2.2.A.3. Mathematical Modeling of drying and rehydration kinetics
For modeling the dehydration and rehydration kinetics of peppers, the study of Mounir & Allaf (2009) [148] has been adopted. This study focus on the before mentioned four physical mechanisms of transfer occurred during drying :
· External heat transfer: from outside to the product surface, energy is generally brought by conduction or convection.
· Internal heat transfer: within the product to conduct the necessary energy to transform water into vapor, energy is transmitted by conduction.
· Internal water transfer: within the product, carried out either in liquid form or in vapor phase, by various processes including capillarity for liquid form, and molecular diffusivity for both liquid and vapor phases. Mechanisms are regulated by the gradients of respectively water content and vapor partially pressure as driving forces.
· External water transport: (in vapor form) from the product’s surface towards outside is the principal driving force of dehydration. At the beginning of the operation, this transport is rapid and depends on the interface surface (enhanced by greatest gradient of humidity); afterward it is normally limited by the internal diffusion.
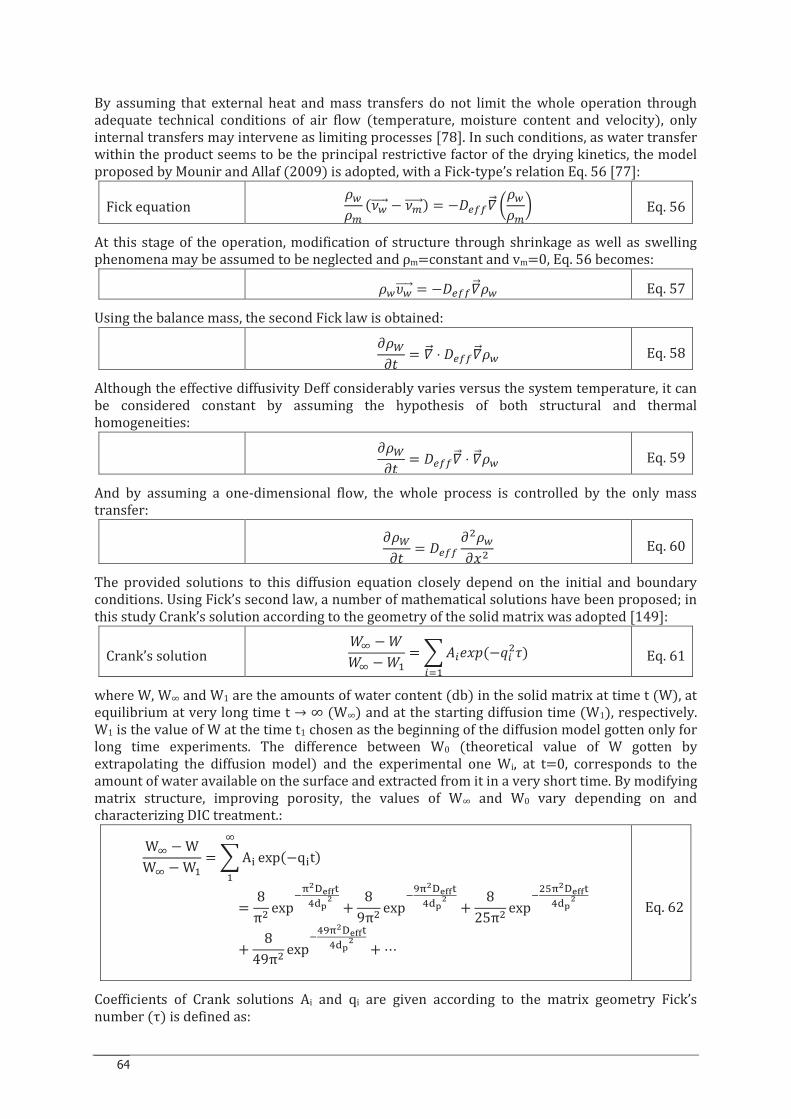
64
By assuming that external heat and mass transfers do not limit the whole operation through adequate technical conditions of air flow (temperature, moisture content and velocity), only internal transfers may intervene as limiting processes [78]. In such conditions, as water transfer within the product seems to be the principal restrictive factor of the drying kinetics, the model proposed by Mounir and Allaf (2009) is adopted, with a Fick-type’s relation Eq. 56 [77]:
Fick equation �`�Ó (þ`}}}} − þÓ}}}}} ) = − XYY�} ��`�Ó� Eq. 56
At this stage of the operation, modification of structure through shrinkage as well as swelling phenomena may be assumed to be neglected and ρm=constant and vm=0, Eq. 56 becomes:
�`ÿ`}}}} = −¨XYY�} �` Eq. 57
Using the balance mass, the second Fick law is obtained:
����< = �} ⋅ ¨XYY�} �` Eq. 58
Although the effective diffusivity Deff considerably varies versus the system temperature, it can be considered constant by assuming the hypothesis of both structural and thermal homogeneities:
����< = ¨XYY�} ⋅ �} �` Eq. 59
And by assuming a one-dimensional flow, the whole process is controlled by the only mass transfer:
����< = ¨XYY �-�`�Ô- Eq. 60
The provided solutions to this diffusion equation closely depend on the initial and boundary conditions. Using Fick’s second law, a number of mathematical solutions have been proposed; in this study Crank’s solution according to the geometry of the solid matrix was adopted [149]:
Crank’s solution 'í − ''í − '3 = Wõ>Ô_ (−!õ-")õì3 Eq. 61
where W, W∞ and W1 are the amounts of water content (db) in the solid matrix at time t (W), at equilibrium at very long time t → ∞ (W∞) and at the starting diffusion time (W1), respectively. W1 is the value of W at the time t1 chosen as the beginning of the diffusion model gotten only for long time experiments. The difference between W0 (theoretical value of W gotten by extrapolating the diffusion model) and the experimental one Wi, at t=0, corresponds to the amount of water available on the surface and extracted from it in a very short time. By modifying matrix structure, improving porosity, the values of W∞ and W0 vary depending on and characterizing DIC treatment.:
Wí − WWí − W3 = Aê exp(−qêt)í3
= 8π- exp+%&ä'(()*+,& + 89π- exp+-%&ä'(()*+,& + 825π- exp+-ß%&ä'(()*+,&+ 849π- exp+*-%&ä'(()*+,& +⋯
Eq. 62
Coefficients of Crank solutions Ai and qi are given according to the matrix geometry Fick’s number (τ) is defined as:
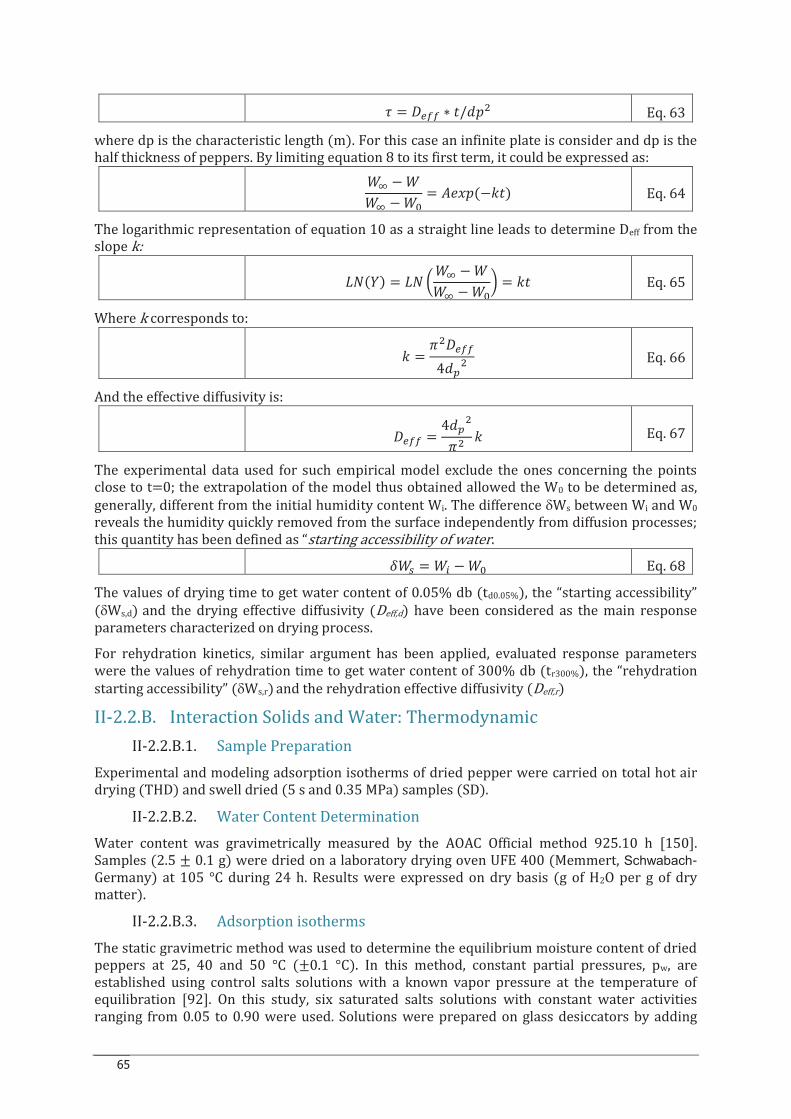
65
" = ¨XYY ∗ </Ê_- Eq. 63
where dp is the characteristic length (m). For this case an infinite plate is consider and dp is the half thickness of peppers. By limiting equation 8 to its first term, it could be expressed as:
'í − ''í − '¯ = W>Ô_(−5<) Eq. 64
The logarithmic representation of equation 10 as a straight line leads to determine Deff from the slope k:
j1(2) = j1 � 'í − ''í − '¯� = 5< Eq. 65
Where k corresponds to:
5 = 3- XYY4Ê^- Eq. 66
And the effective diffusivity is:
¨XYY = 4Ê^-3- 5 Eq. 67
The experimental data used for such empirical model exclude the ones concerning the points close to t=0; the extrapolation of the model thus obtained allowed the W0 to be determined as, generally, different from the initial humidity content Wi. The difference dWs between Wi and W0 reveals the humidity quickly removed from the surface independently from diffusion processes; this quantity has been defined as “starting accessibility of water.
ô'] = 'õ − '¯ Eq. 68
The values of drying time to get water content of 0.05% db (td0.05%), the “starting accessibility” (dWs,d) and the drying effective diffusivity (Deff,d) have been considered as the main response parameters characterized on drying process.
For rehydration kinetics, similar argument has been applied, evaluated response parameters were the values of rehydration time to get water content of 300% db (tr300%), the “rehydration starting accessibility” (dWs,r) and the rehydration effective diffusivity (Deff,r)
II-2.2.B. Interaction Solids and Water: Thermodynamic
II-2.2.B.1. Sample Preparation
Experimental and modeling adsorption isotherms of dried pepper were carried on total hot air drying (THD) and swell dried (5 s and 0.35 MPa) samples (SD).
II-2.2.B.2. Water Content Determination
Water content was gravimetrically measured by the AOAC Official method 925.10 h [150]. Samples (2.5 ± 0.1 g) were dried on a laboratory drying oven UFE 400 (Memmert, Schwabach-Germany) at 105 °C during 24 h. Results were expressed on dry basis (g of H2O per g of dry matter).
II-2.2.B.3. Adsorption isotherms
The static gravimetric method was used to determine the equilibrium moisture content of dried peppers at 25, 40 and 50 °C (±0.1 °C). In this method, constant partial pressures, pw, are established using control salts solutions with a known vapor pressure at the temperature of equilibration [92]. On this study, six saturated salts solutions with constant water activities ranging from 0.05 to 0.90 were used. Solutions were prepared on glass desiccators by adding
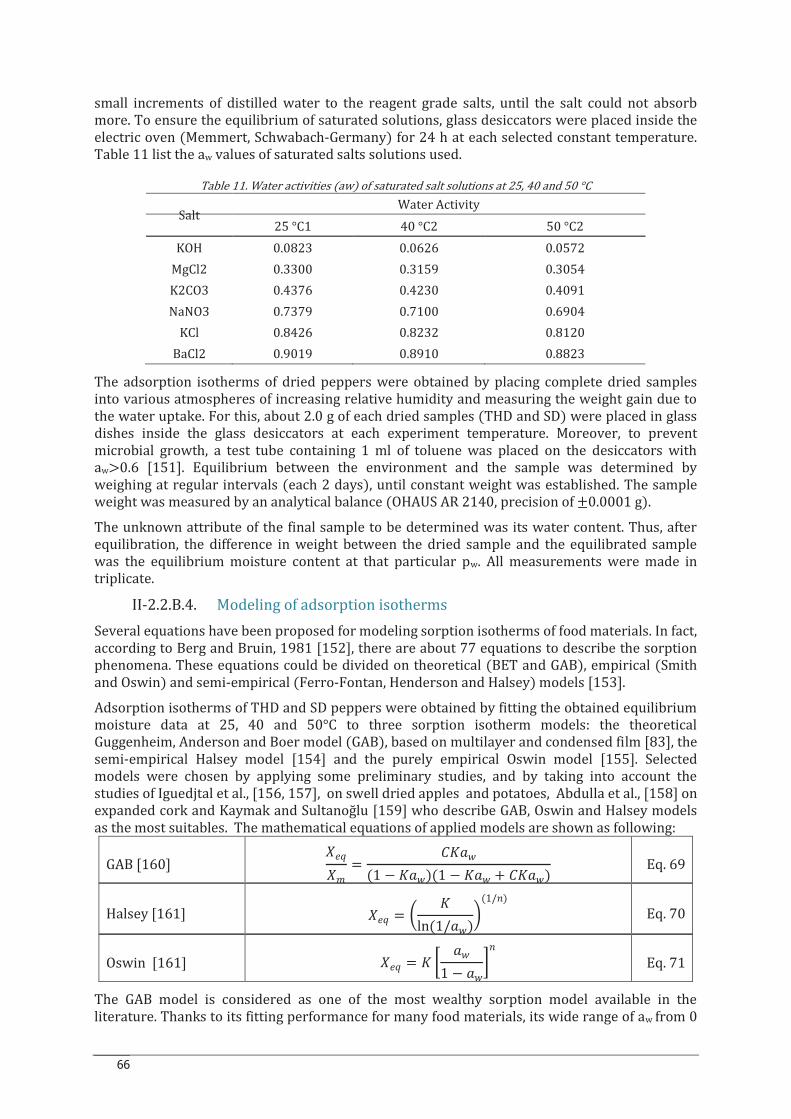
66
small increments of distilled water to the reagent grade salts, until the salt could not absorb more. To ensure the equilibrium of saturated solutions, glass desiccators were placed inside the electric oven (Memmert, Schwabach-Germany) for 24 h at each selected constant temperature. Table 11 list the aw values of saturated salts solutions used.
Table 11. Water activities (aw) of saturated salt solutions at 25, 40 and 50 °C
Salt Water Activity
25 °C1 40 °C2 50 °C2
KOH 0.0823 0.0626 0.0572
MgCl2 0.3300 0.3159 0.3054
K2CO3 0.4376 0.4230 0.4091
NaNO3 0.7379 0.7100 0.6904
KCl 0.8426 0.8232 0.8120
BaCl2 0.9019 0.8910 0.8823
The adsorption isotherms of dried peppers were obtained by placing complete dried samples into various atmospheres of increasing relative humidity and measuring the weight gain due to the water uptake. For this, about 2.0 g of each dried samples (THD and SD) were placed in glass dishes inside the glass desiccators at each experiment temperature. Moreover, to prevent microbial growth, a test tube containing 1 ml of toluene was placed on the desiccators with aw>0.6 [151]. Equilibrium between the environment and the sample was determined by weighing at regular intervals (each 2 days), until constant weight was established. The sample weight was measured by an analytical balance (OHAUS AR 2140, precision of ±0.0001 g).
The unknown attribute of the final sample to be determined was its water content. Thus, after equilibration, the difference in weight between the dried sample and the equilibrated sample was the equilibrium moisture content at that particular pw. All measurements were made in triplicate.
II-2.2.B.4. Modeling of adsorption isotherms
Several equations have been proposed for modeling sorption isotherms of food materials. In fact, according to Berg and Bruin, 1981 [152], there are about 77 equations to describe the sorption phenomena. These equations could be divided on theoretical (BET and GAB), empirical (Smith and Oswin) and semi-empirical (Ferro-Fontan, Henderson and Halsey) models [153].
Adsorption isotherms of THD and SD peppers were obtained by fitting the obtained equilibrium moisture data at 25, 40 and 50°C to three sorption isotherm models: the theoretical Guggenheim, Anderson and Boer model (GAB), based on multilayer and condensed film [83], the semi-empirical Halsey model [154] and the purely empirical Oswin model [155]. Selected models were chosen by applying some preliminary studies, and by taking into account the studies of Iguedjtal et al., [156, 157], on swell dried apples and potatoes, Abdulla et al., [158] on expanded cork and Kaymak and Sultanoğlu [159] who describe GAB, Oswin and Halsey models as the most suitables. The mathematical equations of applied models are shown as following:
GAB [160] ±>!±% = Ñ/;:(1 − /;:)(1 − /;: + Ñ/;:) Eq. 69
Halsey [161] ±>! = � /ln (1/;:)�(1/´) Eq. 70
Oswin [161] ±>! = / È ;:1 − ;:É´ Eq. 71
The GAB model is considered as one of the most wealthy sorption model available in the literature. Thanks to its fitting performance for many food materials, its wide range of aw from 0
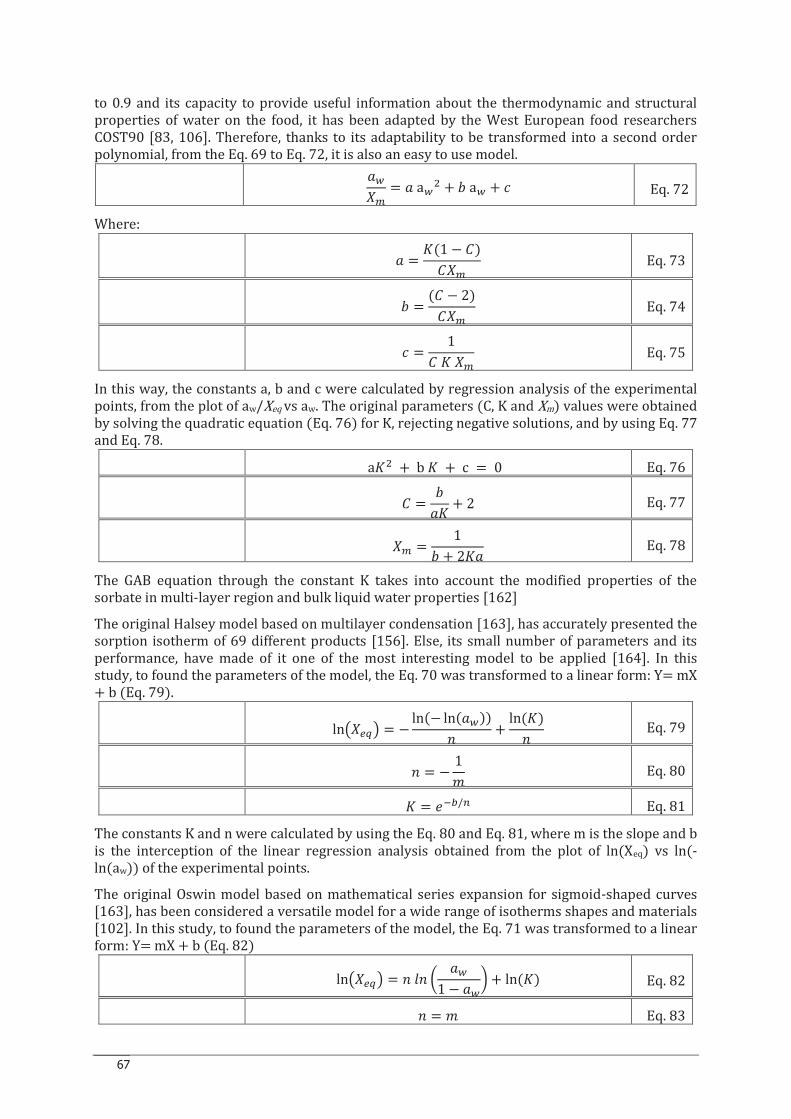
67
to 0.9 and its capacity to provide useful information about the thermodynamic and structural properties of water on the food, it has been adapted by the West European food researchers COST90 [83, 106]. Therefore, thanks to its adaptability to be transformed into a second order polynomial, from the Eq. 69 to Eq. 72, it is also an easy to use model.
;`±Ó = ; a`- + 5 a` + � Eq. 72
Where:
; = /(1 − Ñ)Ñ±Ó Eq. 73
5 = (Ñ − 2)Ñ±Ó Eq. 74
� = 1Ñ / ±Ó Eq. 75
In this way, the constants a, b and c were calculated by regression analysis of the experimental points, from the plot of aw/Xeq vs aw. The original parameters (C, K and Xm) values were obtained by solving the quadratic equation (Eq. 76) for K, rejecting negative solutions, and by using Eq. 77 and Eq. 78.
a/- + b / + c = 0 Eq. 76
Ñ = 5;/ + 2 Eq. 77
±Ó = 15 + 2/; Eq. 78
The GAB equation through the constant K takes into account the modified properties of the sorbate in multi-layer region and bulk liquid water properties [162]
The original Halsey model based on multilayer condensation [163], has accurately presented the sorption isotherm of 69 different products [156]. Else, its small number of parameters and its performance, have made of it one of the most interesting model to be applied [164]. In this study, to found the parameters of the model, the Eq. 70 was transformed to a linear form: Y= mX + b (Eq. 79).
ln�±X6� = − ln(− ln(;`))´ + ln (/)´ Eq. 79
´ = − 1% Eq. 80
/ = >+�/7 Eq. 81
The constants K and n were calculated by using the Eq. 80 and Eq. 81, where m is the slope and b is the interception of the linear regression analysis obtained from the plot of ln(Xeq) vs ln(-ln(aw)) of the experimental points.
The original Oswin model based on mathematical series expansion for sigmoid-shaped curves [163], has been considered a versatile model for a wide range of isotherms shapes and materials [102]. In this study, to found the parameters of the model, the Eq. 71 was transformed to a linear form: Y= mX + b (Eq. 82)
ln�±X6� = ´ Ç´ � ;`1 − ;`� + ln (/) Eq. 82
´ = % Eq. 83
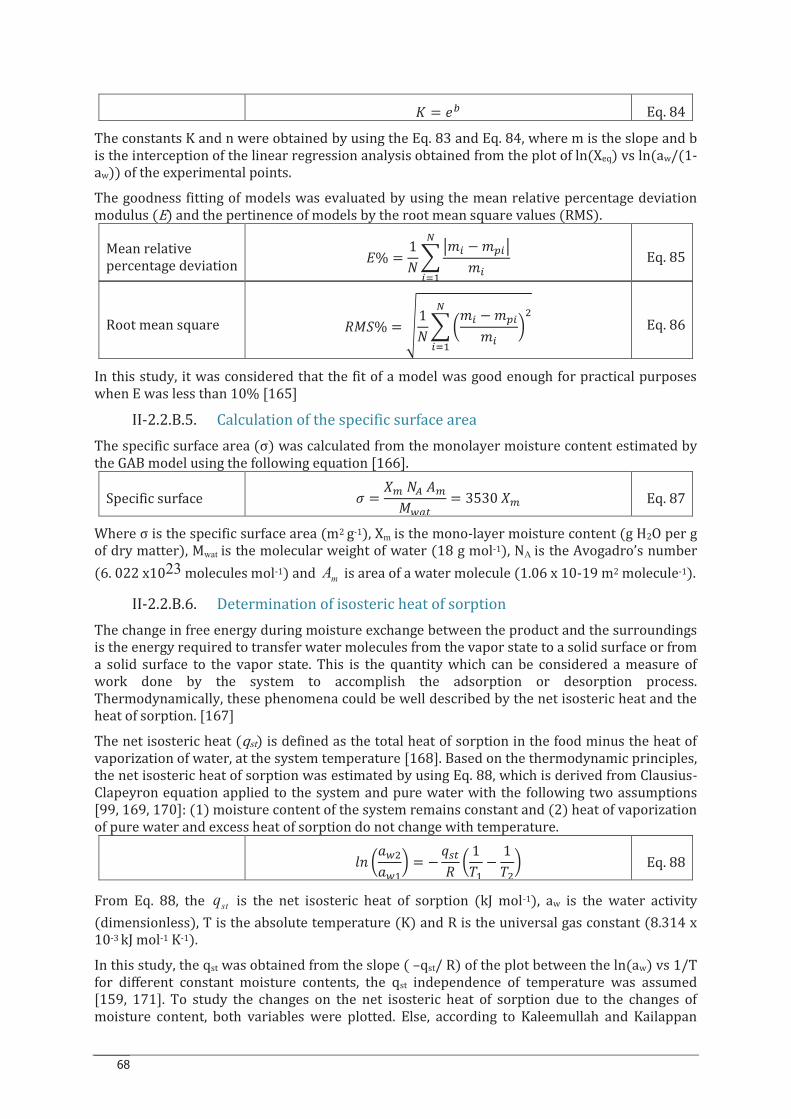
68
/ = >� Eq. 84
The constants K and n were obtained by using the Eq. 83 and Eq. 84, where m is the slope and b is the interception of the linear regression analysis obtained from the plot of ln(Xeq) vs ln(aw/(1-aw)) of the experimental points.
The goodness fitting of models was evaluated by using the mean relative percentage deviation modulus (E) and the pertinence of models by the root mean square values (RMS).
Mean relative percentage deviation 9% = 11 :%õ − %^õ:%õ
<õì3 Eq. 85
Root mean square ��=% = >11 �%õ − %^õ%õ �-<õì3 Eq. 86
In this study, it was considered that the fit of a model was good enough for practical purposes when E was less than 10% [165]
II-2.2.B.5. Calculation of the specific surface area
The specific surface area (σ) was calculated from the monolayer moisture content estimated by the GAB model using the following equation [166].
Specific surface @ = ±Ó 1A WÓ�`[² = 3530 ±Ó Eq. 87
Where σ is the specific surface area (m2 g-1), Xm is the mono-layer moisture content (g H2O per g of dry matter), Mwat is the molecular weight of water (18 g mol-1), NA is the Avogadro’s number (6. 022 x1023 molecules mol-1) and mA is area of a water molecule (1.06 x 10⁻¹⁹ m2 molecule-1).
II-2.2.B.6. Determination of isosteric heat of sorption
The change in free energy during moisture exchange between the product and the surroundings is the energy required to transfer water molecules from the vapor state to a solid surface or from a solid surface to the vapor state. This is the quantity which can be considered a measure of work done by the system to accomplish the adsorption or desorption process. Thermodynamically, these phenomena could be well described by the net isosteric heat and the heat of sorption. [167]
The net isosteric heat (qst) is defined as the total heat of sorption in the food minus the heat of vaporization of water, at the system temperature [168]. Based on the thermodynamic principles, the net isosteric heat of sorption was estimated by using Eq. 88, which is derived from Clausius-Clapeyron equation applied to the system and pure water with the following two assumptions [99, 169, 170]: (1) moisture content of the system remains constant and (2) heat of vaporization of pure water and excess heat of sorption do not change with temperature.
Ç´ �;`-;`3� = − !]²� � 1Z3 − 1Z-� Eq. 88
From Eq. 88, the stq is the net isosteric heat of sorption (kJ mol-1), aw is the water activity
(dimensionless), T is the absolute temperature (K) and R is the universal gas constant (8.314 x 10⁻³ kJ mol-1 K-1).
In this study, the qst was obtained from the slope ( –qst/ R) of the plot between the ln(aw) vs 1/T for different constant moisture contents, the qst independence of temperature was assumed [159, 171]. To study the changes on the net isosteric heat of sorption due to the changes of moisture content, both variables were plotted. Else, according to Kaleemullah and Kailappan
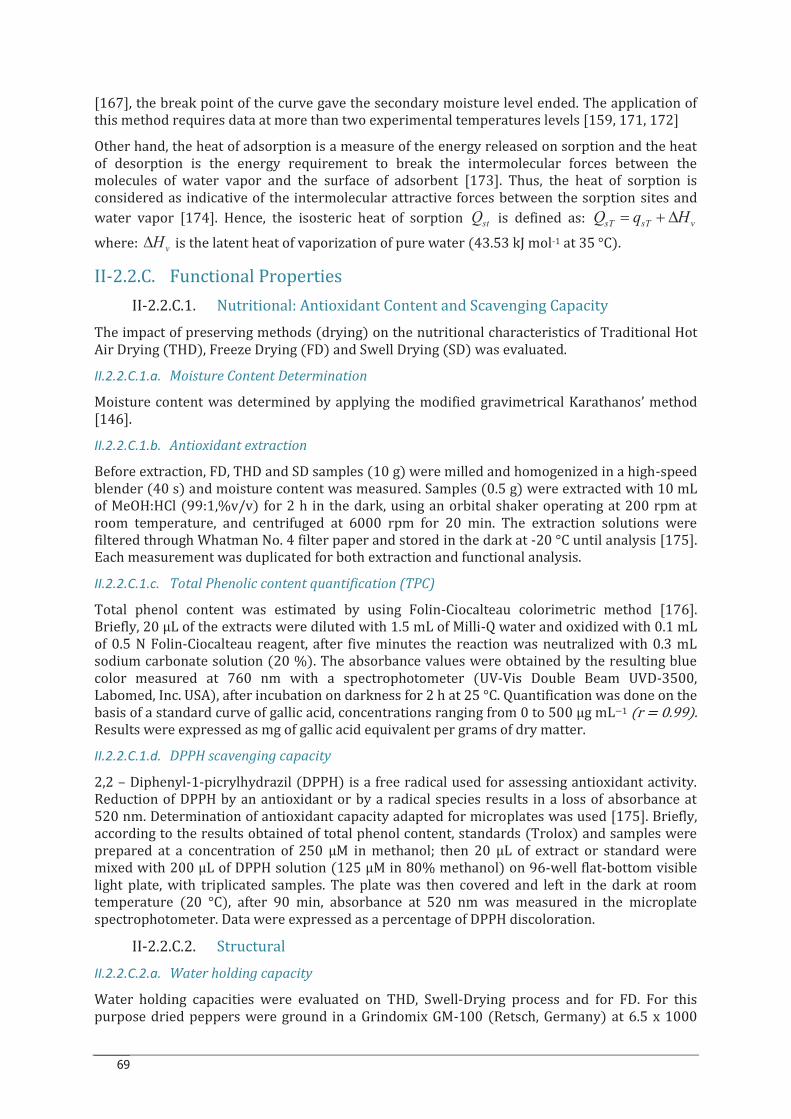
69
[167], the break point of the curve gave the secondary moisture level ended. The application of this method requires data at more than two experimental temperatures levels [159, 171, 172]
Other hand, the heat of adsorption is a measure of the energy released on sorption and the heat of desorption is the energy requirement to break the intermolecular forces between the molecules of water vapor and the surface of adsorbent [173]. Thus, the heat of sorption is considered as indicative of the intermolecular attractive forces between the sorption sites and
water vapor [174]. Hence, the isosteric heat of sorption stQ is defined as: vsTsT HqQ D+=
where: vHD is the latent heat of vaporization of pure water (43.53 kJ mol-1 at 35 °C).
II-2.2.C. Functional Properties
II-2.2.C.1. Nutritional: Antioxidant Content and Scavenging Capacity
The impact of preserving methods (drying) on the nutritional characteristics of Traditional Hot Air Drying (THD), Freeze Drying (FD) and Swell Drying (SD) was evaluated.
II.2.2.C.1.a. Moisture Content Determination
Moisture content was determined by applying the modified gravimetrical Karathanos’ method [146].
II.2.2.C.1.b. Antioxidant extraction
Before extraction, FD, THD and SD samples (10 g) were milled and homogenized in a high-speed blender (40 s) and moisture content was measured. Samples (0.5 g) were extracted with 10 mL of MeOH:HCl (99:1,%v/v) for 2 h in the dark, using an orbital shaker operating at 200 rpm at room temperature, and centrifuged at 6000 rpm for 20 min. The extraction solutions were filtered through Whatman No. 4 filter paper and stored in the dark at -20 °C until analysis [175]. Each measurement was duplicated for both extraction and functional analysis.
II.2.2.C.1.c. Total Phenolic content quantification (TPC)
Total phenol content was estimated by using Folin-Ciocalteau colorimetric method [176]. Briefly, 20 µL of the extracts were diluted with 1.5 mL of Milli-Q water and oxidized with 0.1 mL of 0.5 N Folin-Ciocalteau reagent, after five minutes the reaction was neutralized with 0.3 mL sodium carbonate solution (20 %). The absorbance values were obtained by the resulting blue color measured at 760 nm with a spectrophotometer (UV-Vis Double Beam UVD-3500, Labomed, Inc. USA), after incubation on darkness for 2 h at 25 °C. Quantification was done on the basis of a standard curve of gallic acid, concentrations ranging from 0 to 500 µg mL−1 (r = 0.99). Results were expressed as mg of gallic acid equivalent per grams of dry matter.
II.2.2.C.1.d. DPPH scavenging capacity
2,2 – Diphenyl-1-picrylhydrazil (DPPH) is a free radical used for assessing antioxidant activity. Reduction of DPPH by an antioxidant or by a radical species results in a loss of absorbance at 520 nm. Determination of antioxidant capacity adapted for microplates was used [175]. Briefly, according to the results obtained of total phenol content, standards (Trolox) and samples were prepared at a concentration of 250 µM in methanol; then 20 µL of extract or standard were mixed with 200 µL of DPPH solution (125 µM in 80% methanol) on 96-well flat-bottom visible light plate, with triplicated samples. The plate was then covered and left in the dark at room temperature (20 °C), after 90 min, absorbance at 520 nm was measured in the microplate spectrophotometer. Data were expressed as a percentage of DPPH discoloration.
II-2.2.C.2. Structural
II.2.2.C.2.a. Water holding capacity
Water holding capacities were evaluated on THD, Swell-Drying process and for FD. For this purpose dried peppers were ground in a Grindomix GM-100 (Retsch, Germany) at 6.5 x 1000
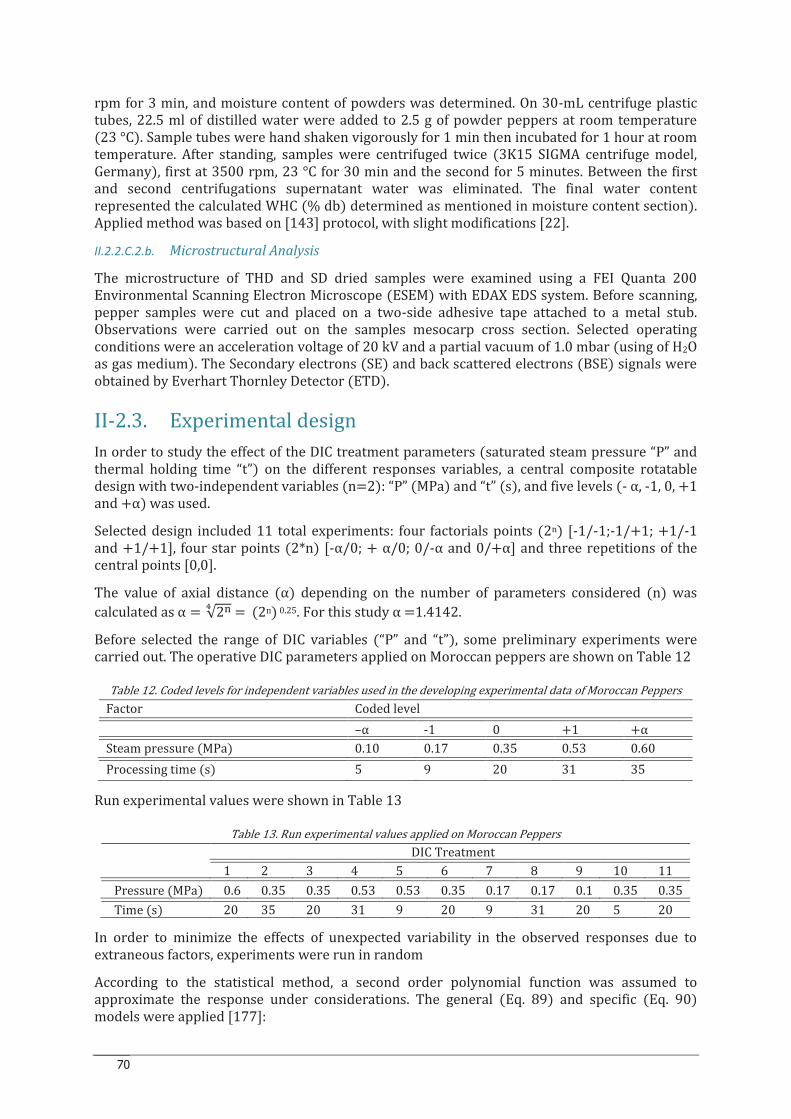
70
rpm for 3 min, and moisture content of powders was determined. On 30-mL centrifuge plastic tubes, 22.5 ml of distilled water were added to 2.5 g of powder peppers at room temperature (23 °C). Sample tubes were hand shaken vigorously for 1 min then incubated for 1 hour at room temperature. After standing, samples were centrifuged twice (3K15 SIGMA centrifuge model, Germany), first at 3500 rpm, 23 °C for 30 min and the second for 5 minutes. Between the first and second centrifugations supernatant water was eliminated. The final water content represented the calculated WHC (% db) determined as mentioned in moisture content section). Applied method was based on [143] protocol, with slight modifications [22].
II.2.2.C.2.b. Microstructural Analysis
The microstructure of THD and SD dried samples were examined using a FEI Quanta 200 Environmental Scanning Electron Microscope (ESEM) with EDAX EDS system. Before scanning, pepper samples were cut and placed on a two-side adhesive tape attached to a metal stub. Observations were carried out on the samples mesocarp cross section. Selected operating conditions were an acceleration voltage of 20 kV and a partial vacuum of 1.0 mbar (using of H2O as gas medium). The Secondary electrons (SE) and back scattered electrons (BSE) signals were obtained by Everhart Thornley Detector (ETD).
II-2.3. Experimental design
In order to study the effect of the DIC treatment parameters (saturated steam pressure “P” and thermal holding time “t”) on the different responses variables, a central composite rotatable design with two-independent variables (n=2): “P” (MPa) and “t” (s), and five levels (- α, -1, 0, +1 and +α) was used.
Selected design included 11 total experiments: four factorials points (2n) [-1/-1;-1/+1; +1/-1 and +1/+1], four star points (2*n) [-α/0; + α/0; 0/-α and 0/+α] and three repetitions of the central points [0,0].
The value of axial distance (α) depending on the number of parameters considered (n) was calculated as α = √2EF = (2n) 0.25. For this study α =1.4142. Before selected the range of DIC variables (“P” and “t”), some preliminary experiments were carried out. The operative DIC parameters applied on Moroccan peppers are shown on Table 12
Table 12. Coded levels for independent variables used in the developing experimental data of Moroccan Peppers
Factor Coded level –α -1 0 +1 +α
Steam pressure (MPa) 0.10 0.17 0.35 0.53 0.60
Processing time (s) 5 9 20 31 35
Run experimental values were shown in Table 13
Table 13. Run experimental values applied on Moroccan Peppers
DIC Treatment
1 2 3 4 5 6 7 8 9 10 11
Pressure (MPa) 0.6 0.35 0.35 0.53 0.53 0.35 0.17 0.17 0.1 0.35 0.35
Time (s) 20 35 20 31 9 20 9 31 20 5 20
In order to minimize the effects of unexpected variability in the observed responses due to extraneous factors, experiments were run in random
According to the statistical method, a second order polynomial function was assumed to approximate the response under considerations. The general (Eq. 89) and specific (Eq. 90) models were applied [177]:
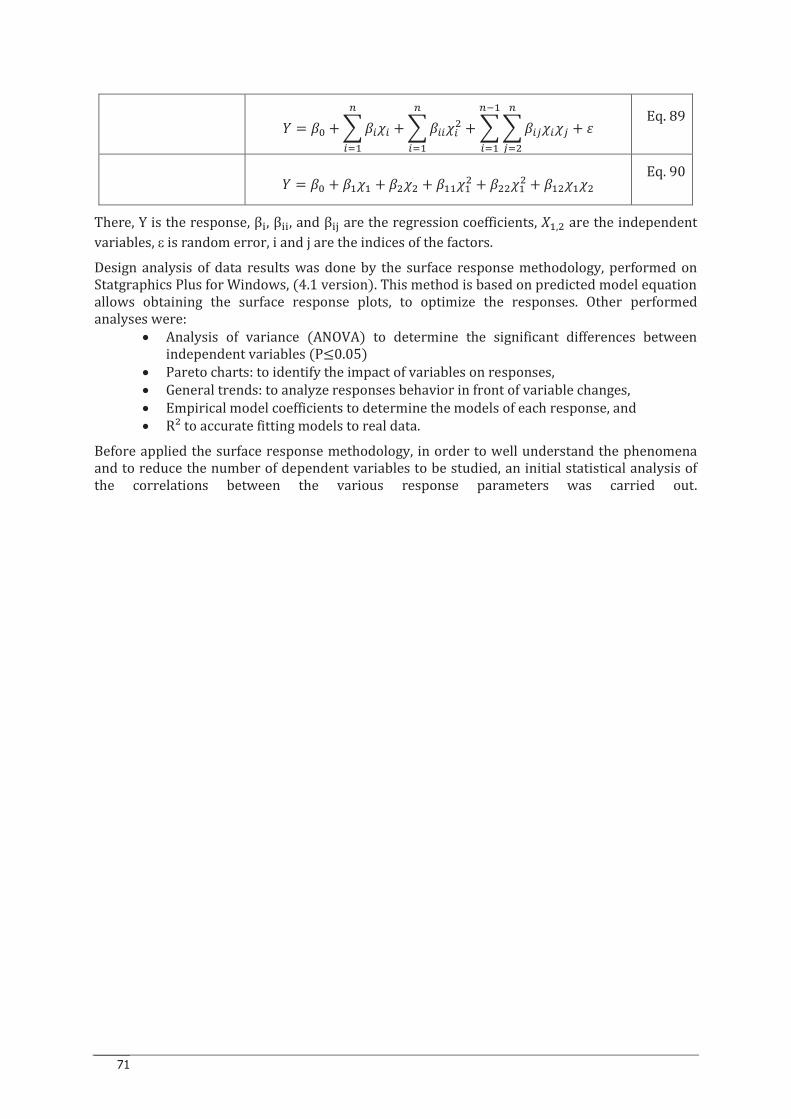
71
2 = G¯ + GõHõ7
õì3 + GõõHõ-7
õì3 + GõIHõHI7Iì-
7+3õì3 + �
Eq. 89
2 = G¯ + G3H3 + G-H- + G33H3- + G--H3- + G3-H3H-
Eq. 90
There, Y is the response, βê, βêê, and βêë are the regression coefficients, ±3,- are the independent
variables, e is random error, i and j are the indices of the factors.
Design analysis of data results was done by the surface response methodology, performed on Statgraphics Plus for Windows, (4.1 version). This method is based on predicted model equation allows obtaining the surface response plots, to optimize the responses. Other performed analyses were:
· Analysis of variance (ANOVA) to determine the significant differences between independent variables (P≤0.05) · Pareto charts: to identify the impact of variables on responses, · General trends: to analyze responses behavior in front of variable changes, · Empirical model coefficients to determine the models of each response, and · R² to accurate fitting models to real data.
Before applied the surface response methodology, in order to well understand the phenomena and to reduce the number of dependent variables to be studied, an initial statistical analysis of the correlations between the various response parameters was carried out.
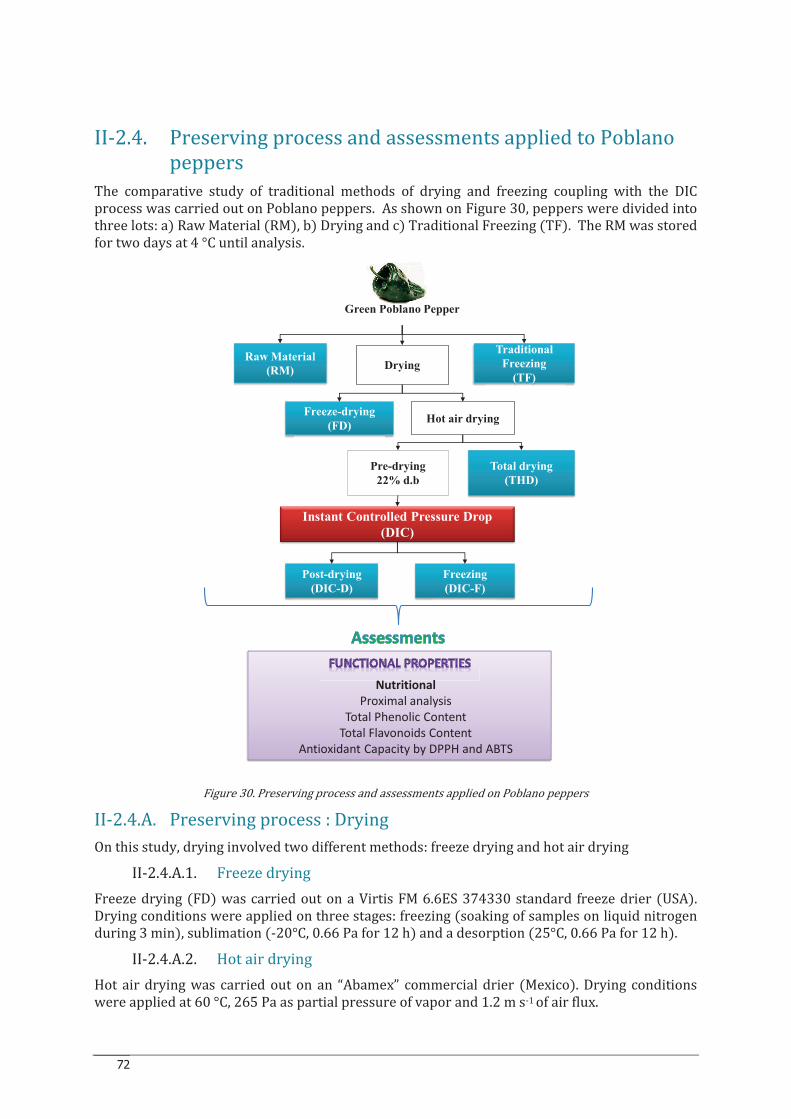
72
II-2.4. Preserving process and assessments applied to Poblano
peppers
The comparative study of traditional methods of drying and freezing coupling with the DIC process was carried out on Poblano peppers. As shown on Figure 30, peppers were divided into three lots: a) Raw Material (RM), b) Drying and c) Traditional Freezing (TF). The RM was stored for two days at 4 °C until analysis.
Figure 30. Preserving process and assessments applied on Poblano peppers
II-2.4.A. Preserving process : Drying
On this study, drying involved two different methods: freeze drying and hot air drying
II-2.4.A.1. Freeze drying
Freeze drying (FD) was carried out on a Virtis FM 6.6ES 374330 standard freeze drier (USA). Drying conditions were applied on three stages: freezing (soaking of samples on liquid nitrogen during 3 min), sublimation (-20°C, 0.66 Pa for 12 h) and a desorption (25°C, 0.66 Pa for 12 h).
II-2.4.A.2. Hot air drying
Hot air drying was carried out on an “Abamex” commercial drier (Mexico). Drying conditions were applied at 60 °C, 265 Pa as partial pressure of vapor and 1.2 m s-1 of air flux.
Green Poblano Pepper
Raw Material
(RM)Drying
Traditional
Freezing
(TF)
Freeze-drying
(FD)Hot air drying
Pre-drying
22% d.b
Total drying
(THD)
Instant Controlled Pressure Drop
(DIC)
Post-drying
(DIC-D)
Freezing
(DIC-F)
Pobl PePePe
Nutritional
Proximal analysisTotal Phenolic Content
Total Flavonoids ContentAntioxidant Capacity by DPPH and ABTS
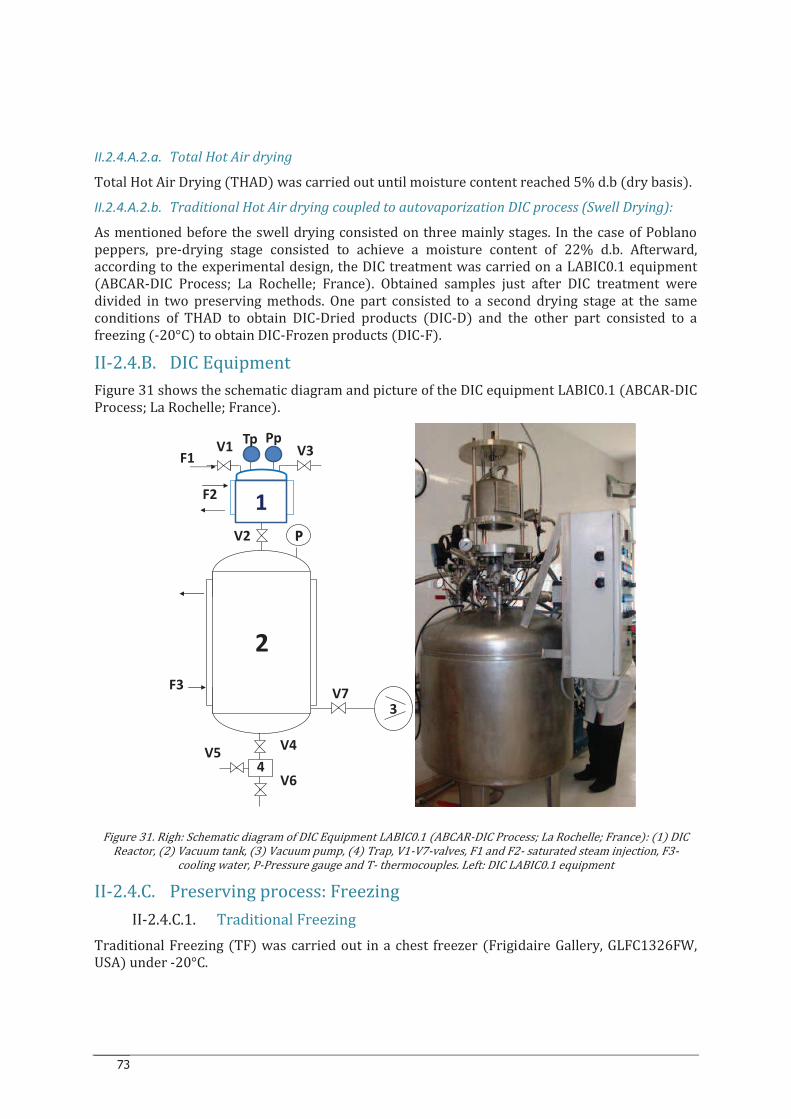
73
II.2.4.A.2.a. Total Hot Air drying
Total Hot Air Drying (THAD) was carried out until moisture content reached 5% d.b (dry basis).
II.2.4.A.2.b. Traditional Hot Air drying coupled to autovaporization DIC process (Swell Drying):
As mentioned before the swell drying consisted on three mainly stages. In the case of Poblano peppers, pre-drying stage consisted to achieve a moisture content of 22% d.b. Afterward, according to the experimental design, the DIC treatment was carried on a LABIC0.1 equipment (ABCAR-DIC Process; La Rochelle; France). Obtained samples just after DIC treatment were divided in two preserving methods. One part consisted to a second drying stage at the same conditions of THAD to obtain DIC-Dried products (DIC-D) and the other part consisted to a freezing (-20°C) to obtain DIC-Frozen products (DIC-F).
II-2.4.B. DIC Equipment
Figure 31 shows the schematic diagram and picture of the DIC equipment LABIC0.1 (ABCAR-DIC Process; La Rochelle; France).
Figure 31. Righ: Schematic diagram of DIC Equipment LABIC0.1 (ABCAR-DIC Process; La Rochelle; France): (1) DIC Reactor, (2) Vacuum tank, (3) Vacuum pump, (4) Trap, V1-V7-valves, F1 and F2- saturated steam injection, F3-
cooling water, P-Pressure gauge and T- thermocouples. Left: DIC LABIC0.1 equipment
II-2.4.C. Preserving process: Freezing
II-2.4.C.1. Traditional Freezing
Traditional Freezing (TF) was carried out in a chest freezer (Frigidaire Gallery, GLFC1326FW, USA) under -20°C.
PP
2
3V7
V4
V6
V5
F3
V3
F2
F1V1
V2
4
P
1
Tp Pp
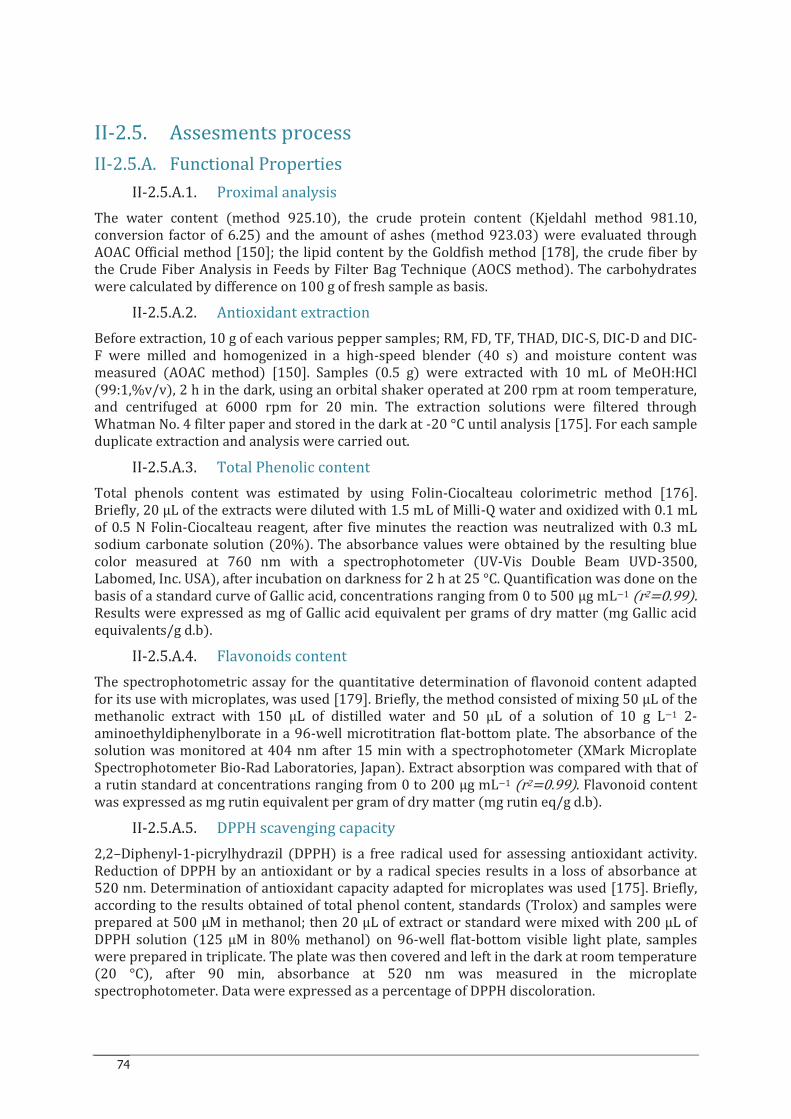
74
II-2.5. Assesments process
II-2.5.A. Functional Properties
II-2.5.A.1. Proximal analysis
The water content (method 925.10), the crude protein content (Kjeldahl method 981.10, conversion factor of 6.25) and the amount of ashes (method 923.03) were evaluated through AOAC Official method [150]; the lipid content by the Goldfish method [178], the crude fiber by the Crude Fiber Analysis in Feeds by Filter Bag Technique (AOCS method). The carbohydrates were calculated by difference on 100 g of fresh sample as basis.
II-2.5.A.2. Antioxidant extraction
Before extraction, 10 g of each various pepper samples; RM, FD, TF, THAD, DIC-S, DIC-D and DIC-F were milled and homogenized in a high-speed blender (40 s) and moisture content was measured (AOAC method) [150]. Samples (0.5 g) were extracted with 10 mL of MeOH:HCl (99:1,%v/v), 2 h in the dark, using an orbital shaker operated at 200 rpm at room temperature, and centrifuged at 6000 rpm for 20 min. The extraction solutions were filtered through Whatman No. 4 filter paper and stored in the dark at -20 °C until analysis [175]. For each sample duplicate extraction and analysis were carried out.
II-2.5.A.3. Total Phenolic content
Total phenols content was estimated by using Folin-Ciocalteau colorimetric method [176]. Briefly, 20 µL of the extracts were diluted with 1.5 mL of Milli-Q water and oxidized with 0.1 mL of 0.5 N Folin-Ciocalteau reagent, after five minutes the reaction was neutralized with 0.3 mL sodium carbonate solution (20%). The absorbance values were obtained by the resulting blue color measured at 760 nm with a spectrophotometer (UV-Vis Double Beam UVD-3500, Labomed, Inc. USA), after incubation on darkness for 2 h at 25 °C. Quantification was done on the basis of a standard curve of Gallic acid, concentrations ranging from 0 to 500 µg mL−1 (r2=0.99). Results were expressed as mg of Gallic acid equivalent per grams of dry matter (mg Gallic acid equivalents/g d.b).
II-2.5.A.4. Flavonoids content
The spectrophotometric assay for the quantitative determination of flavonoid content adapted for its use with microplates, was used [179]. Briefly, the method consisted of mixing 50 µL of the methanolic extract with 150 µL of distilled water and 50 µL of a solution of 10 g L−1 2-aminoethyldiphenylborate in a 96-well microtitration flat-bottom plate. The absorbance of the solution was monitored at 404 nm after 15 min with a spectrophotometer (XMark Microplate Spectrophotometer Bio-Rad Laboratories, Japan). Extract absorption was compared with that of a rutin standard at concentrations ranging from 0 to 200 µg mL−1 (r2=0.99). Flavonoid content was expressed as mg rutin equivalent per gram of dry matter (mg rutin eq/g d.b).
II-2.5.A.5. DPPH scavenging capacity
2,2–Diphenyl-1-picrylhydrazil (DPPH) is a free radical used for assessing antioxidant activity. Reduction of DPPH by an antioxidant or by a radical species results in a loss of absorbance at 520 nm. Determination of antioxidant capacity adapted for microplates was used [175]. Briefly, according to the results obtained of total phenol content, standards (Trolox) and samples were prepared at 500 µM in methanol; then 20 µL of extract or standard were mixed with 200 µL of DPPH solution (125 µM in 80% methanol) on 96-well flat-bottom visible light plate, samples were prepared in triplicate. The plate was then covered and left in the dark at room temperature (20 °C), after 90 min, absorbance at 520 nm was measured in the microplate spectrophotometer. Data were expressed as a percentage of DPPH discoloration.
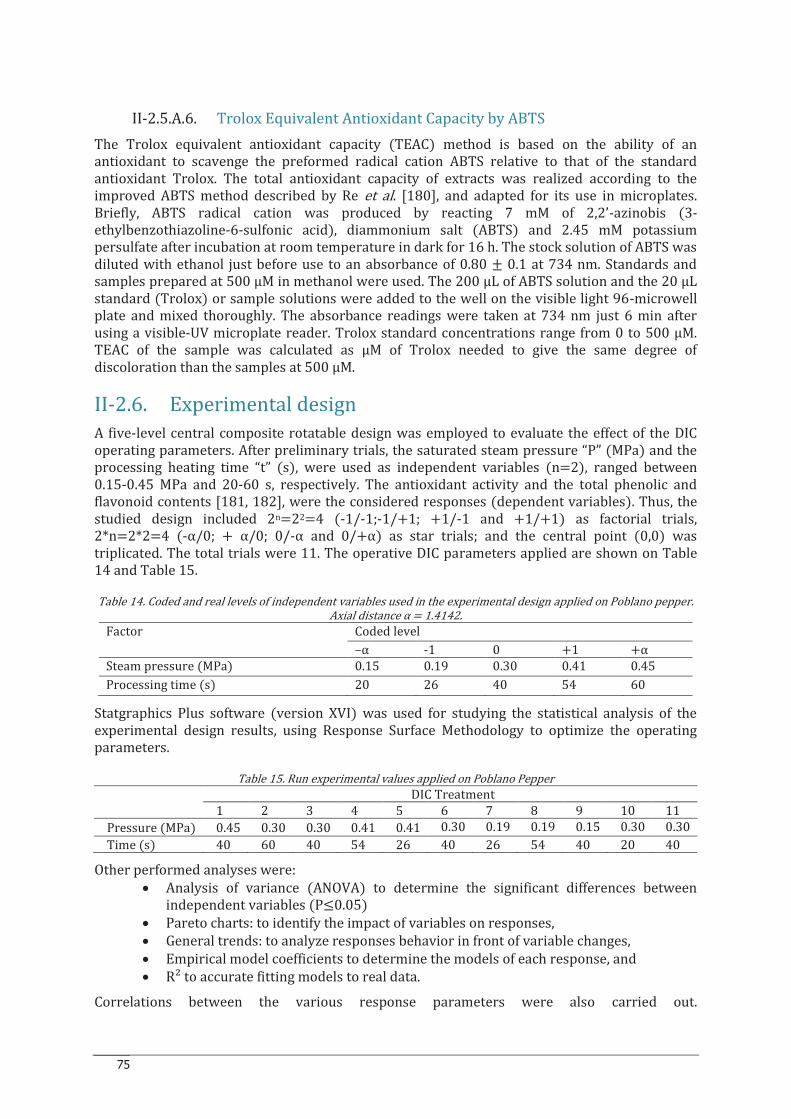
75
II-2.5.A.6. Trolox Equivalent Antioxidant Capacity by ABTS
The Trolox equivalent antioxidant capacity (TEAC) method is based on the ability of an antioxidant to scavenge the preformed radical cation ABTS relative to that of the standard antioxidant Trolox. The total antioxidant capacity of extracts was realized according to the improved ABTS method described by Re et al. [180], and adapted for its use in microplates. Briefly, ABTS radical cation was produced by reacting 7 mM of 2,2’-azinobis (3-ethylbenzothiazoline-6-sulfonic acid), diammonium salt (ABTS) and 2.45 mM potassium persulfate after incubation at room temperature in dark for 16 h. The stock solution of ABTS was diluted with ethanol just before use to an absorbance of 0.80 ± 0.1 at 734 nm. Standards and samples prepared at 500 µM in methanol were used. The 200 µL of ABTS solution and the 20 µL standard (Trolox) or sample solutions were added to the well on the visible light 96-microwell plate and mixed thoroughly. The absorbance readings were taken at 734 nm just 6 min after using a visible-UV microplate reader. Trolox standard concentrations range from 0 to 500 µM. TEAC of the sample was calculated as µM of Trolox needed to give the same degree of discoloration than the samples at 500 µM.
II-2.6. Experimental design
A five-level central composite rotatable design was employed to evaluate the effect of the DIC operating parameters. After preliminary trials, the saturated steam pressure “P” (MPa) and the processing heating time “t” (s), were used as independent variables (n=2), ranged between 0.15-0.45 MPa and 20-60 s, respectively. The antioxidant activity and the total phenolic and flavonoid contents [181, 182], were the considered responses (dependent variables). Thus, the studied design included 2n=22=4 (-1/-1;-1/+1; +1/-1 and +1/+1) as factorial trials, 2*n=2*2=4 (-α/0; + α/0; 0/-α and 0/+α) as star trials; and the central point (0,0) was triplicated. The total trials were 11. The operative DIC parameters applied are shown on Table 14 and Table 15.
Table 14. Coded and real levels of independent variables used in the experimental design applied on Poblano pepper. Axial distance α = 1.4142. Factor Coded level –α -1 0 +1 +α Steam pressure (MPa) 0.15 0.19 0.30 0.41 0.45
Processing time (s) 20 26 40 54 60
Statgraphics Plus software (version XVI) was used for studying the statistical analysis of the experimental design results, using Response Surface Methodology to optimize the operating parameters.
Table 15. Run experimental values applied on Poblano Pepper DIC Treatment 1 2 3 4 5 6 7 8 9 10 11 Pressure (MPa) 0.45 0.30 0.30 0.41 0.41 0.30 0.19 0.19 0.15 0.30 0.30 Time (s) 40 60 40 54 26 40 26 54 40 20 40
Other performed analyses were: · Analysis of variance (ANOVA) to determine the significant differences between independent variables (P≤0.05) · Pareto charts: to identify the impact of variables on responses, · General trends: to analyze responses behavior in front of variable changes, · Empirical model coefficients to determine the models of each response, and · R² to accurate fitting models to real data.
Correlations between the various response parameters were also carried out.
76
PART III
RESULTS
77
CHAPTER III-1.
IMPACT OF INSTANT CONTROLLED PRESSURE DROP
TREATMENT ON DEHYDRATION AND REHYDRATION
KINETICS OF GREEN MOROCCAN PEPPER (CAPSICUM
ANNUUM)
Engineering Procedia
Procedia Engineering 42 (2012) 1077-1101
1877-7058 © 2012 Published by Elsevier Ltd. doi:10.1016/j.proeng.2012.07.491
20th International Congress of Chemical and Process Engineering CHISA 2012 25 – 29 August 2012, Prague, Czech Republic
Impact of instant controlled pressure drop treatment on dehydration and rehydration kinetics of green moroccan
pepper (Capsicum annuum)
C. Téllez-Pérez a,c, M.M. Sabaha,b, J.G. Montejano-Gaitánc, V. Sobolika, C.A.-Martínezc and K. Allafa*
aUniversity of La Rochelle, Intensification of Transfer Phenomena on Industrial Eco-Processes, Laboratory Engineering Science for Environment
LaSIE FRE 3474 CNRS, 17042 La Rochelle, France bZagazig University, Faculty of Agriculture, Department of Food Science, Zagazig, Egypt
cInstituto Tecnológico y de Estudios Superiores de Monterrey. Campus Querétaro. Cátedra de Biotecnología Agroalimentaria. Epigmenio González
500 Fracc. San Pablo 76130 Querétaro, Qro. Mexico
Abstract
A comparative study of various drying techniques were carried out on Green Moroccan Peppers GMPs, Traditional Hot Air Drying, Swell Drying SD, and freeze drying, in order to compare the dried product’s behavior during drying and rehydration. Moreover, starting accessibility, and water effective diffusivity during drying and rehydration were studied. The water holding capacity of dried GMPs were investigated as well. The impacts of Instant Controlled Pressure Drop process (DIC) on dehydration and rehydration kinetics and functional properties (water holding capacity) were compared to Freeze Drying (FD) and Traditional Hot Air Drying processes (THD). DIC treatment was carried out on pre-dried peppers (classical hot air drying at 50 °C, 265 Pa initial partial pressure of vapor in the air flux, 1.2 m s-1) to reach a moisture content of 20% dry basis varying the saturated steam pressure (ranged from 0.1 to 0.6 MPa) and heating time (ranged from 5 to 35 s) and keeping the initial water content constant at 20% db. Drying and rehydration kinetics of DIC-textured and untreated peppers were well interpreted by a specific model coupling a starting superficial interaction with Fickian diffusion. Response parameters (dependent variables) were the dehydration and rehydration starting accessibility dWs (g H2O/g dry matter), effective diffusivity Deff (m² s-1) and drying time td0,05% (min). Response Surface Methodology RSM was employed. Compared to THD, DIC treatment dramatically increased the starting accessibility and the effective water diffusivity during hot air drying; it allowed the drying time needed to get a final water content of 0.05% db, to decrease by 1.7 times. Regarding the rehydration ability, the time needed to reach 300% db, were reduced 3.7 times under optimum DIC conditions. Fickian diffusion model could not explain FD rehydration, which appeared as a pure water/surface interaction. Water Holding Capacity of DIC dried products was higher than FD and THD. © 2012 Published by Elsevier Ltd. Selection under responsibility of the Congress Scientific Committee (Petr Kluson) Keywords: Instant Controlled Pressure Drop, capsicum; drying kinetics; rehydration kinetics; water holding capacity
* Corresponding author. Tel.: +33 546 45 87 66; fax: +33 546 45 86 16. E-mail address: [email protected].
2 C. Téllez-Pérez et al/ Procedia Engineering 42 (2012) 1077-1101
Introduction
Dehydration is one of the oldest and most widely used methods for fruit and vegetable preservation. Its main objective is to remove a main part of water to reach the level at which microbial spoilage and deterioration reactions are minimized or stopped [1-2]. Hot air drying is one of the most frequently used operations for food dehydration; nevertheless it damages structural, physical and chemical characteristics usually because of the overheating during the second stage of drying as a result of shrinkage phenomenon which is taken place in drying process. To overcome this phenomenon, a marriage of different drying process is used [3].
Many conventional methods are used in food drying including hot air drying, vacuum drying, drum drying, spray drying, freeze-drying, and so forth. Numerous emerging technologies have been developed recently as alternatives to more well-known methods (microwave drying, irradiation, ultrasounds etc.) nevertheless the high cost of some new technologies limits their application [4].
For this reasons new high-performance industrial drying technologies are needed. At this respect, new processes as the Instant Controlled Pressure Drop (DIC) could satisfy simultaneously such constraints. DIC is an innovative process, based on the thermo-mechanical effects induced by rapidly subjecting raw materials to saturated steam (from 0.1 up to 0.6 MPa), and followed by an abrupt pressure drop towards a vacuum (about 5 kPa) triggers simultaneously autovaporisation of volatile compounds and instantaneous cooling of the products which stops thermal degradation and induces swelling and possibly rupturing of the cell walls [5-6].
Peppers (genus Capsicum var.) belong to Solanaceae family; they are widely used because of their strong pungency, aroma, color and nutritional value [7-8]. Their importance gradually increased to become one of the most consumed spice crops worldwide [8]. In addition, the food industry employs them widely as coloring and flavoring agents in sauces, soups, processed meats, lunches, sweetmeats and alcoholic beverages [9]. They are commonly consumed in their dried form, nevertheless traditionally sun drying is carried out at the open air and exposed to the sunlight, which takes a lot of time (8-21 days) and decrease their quality [10-11]. Due to this extensive use, an increasing amount of research on the evaluation of dried pepper quality has concentrated on improving the preservation of this product [12-15].
This work aimed to determine the impact of DIC treatment on the dehydration and rehydration kinetics of Green Moroccan Peppers (Capsicum annum), in order to optimize the operation based on the final quality of the products. By modeling the process and evaluating its performances, we could compare the accuracy of DIC treatment to hot air traditional drying and freeze-drying. Moreover, the water holding capacity was also evaluated as an important physical property.
Nomenclature
ρw apparent density of water in the material (kg m-3)
ρm apparent density of water in the material (kg m-3)
vw absolute velocity of water flow within the porous medium (m s-1)
vm absolute velocity of solid medium (m s-1)
mi weight of the material before drying (kg)
md weight of dry matter material (kg)
W moisture content (kg water/kg dry matter)
W0 value of moisture content calculated from diffusion model extrapolated to t=0 (% db)
W equilibrium water content at a very long time t (kg water/kg dry matter)
Wi initial moisture content (kg water/kg dry matter)
Deff effective diffusivity of water within the solid medium (m2 s-1) for dehydration d or rehydration r
dp half thickness of peppers (m)
k slope of y= Ln (Moisture Ratio) as a function of time (s-1)
δWs starting accessibility of water (kg water/ kg dry matter) for dehydration d or rehydration r
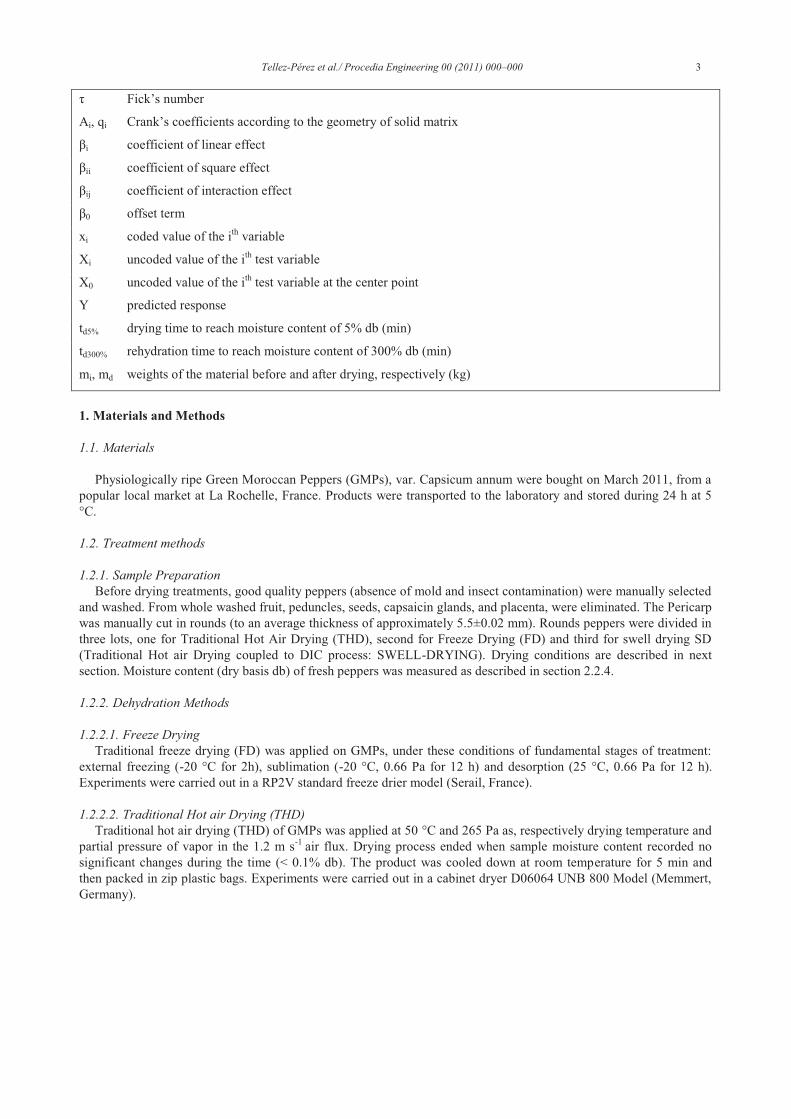
Tellez-Pérez et al./ Procedia Engineering 00 (2011) 000–000 3
τ Fick’s number
Ai, qi Crank’s coefficients according to the geometry of solid matrix
βi coefficient of linear effect
βii coefficient of square effect
βij coefficient of interaction effect
β0 offset term
xi coded value of the ith variable
Xi uncoded value of the ith test variable
X0 uncoded value of the ith test variable at the center point
Y predicted response
td5% drying time to reach moisture content of 5% db (min)
td300% rehydration time to reach moisture content of 300% db (min)
mi, md weights of the material before and after drying, respectively (kg)
1. Materials and Methods
1.1. Materials
Physiologically ripe Green Moroccan Peppers (GMPs), var. Capsicum annum were bought on March 2011, from a popular local market at La Rochelle, France. Products were transported to the laboratory and stored during 24 h at 5 °C.
1.2. Treatment methods
1.2.1. Sample Preparation
Before drying treatments, good quality peppers (absence of mold and insect contamination) were manually selected and washed. From whole washed fruit, peduncles, seeds, capsaicin glands, and placenta, were eliminated. The Pericarp was manually cut in rounds (to an average thickness of approximately 5.5±0.02 mm). Rounds peppers were divided in three lots, one for Traditional Hot Air Drying (THD), second for Freeze Drying (FD) and third for swell drying SD (Traditional Hot air Drying coupled to DIC process: SWELL-DRYING). Drying conditions are described in next section. Moisture content (dry basis db) of fresh peppers was measured as described in section 2.2.4.
1.2.2. Dehydration Methods
1.2.2.1. Freeze Drying
Traditional freeze drying (FD) was applied on GMPs, under these conditions of fundamental stages of treatment: external freezing (-20 °C for 2h), sublimation (-20 °C, 0.66 Pa for 12 h) and desorption (25 °C, 0.66 Pa for 12 h). Experiments were carried out in a RP2V standard freeze drier model (Serail, France).
1.2.2.2. Traditional Hot air Drying (THD)
Traditional hot air drying (THD) of GMPs was applied at 50 °C and 265 Pa as, respectively drying temperature and partial pressure of vapor in the 1.2 m s-1 air flux. Drying process ended when sample moisture content recorded no significant changes during the time (< 0.1% db). The product was cooled down at room temperature for 5 min and then packed in zip plastic bags. Experiments were carried out in a cabinet dryer D06064 UNB 800 Model (Memmert, Germany).
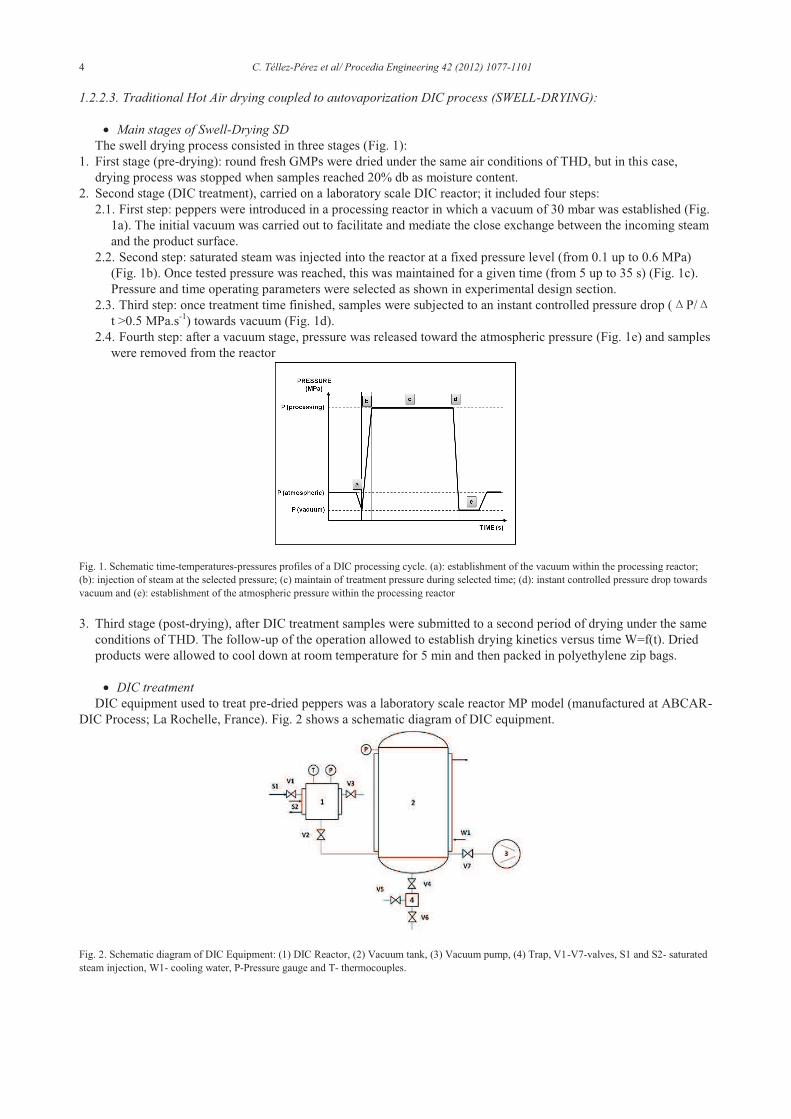
4 C. Téllez-Pérez et al/ Procedia Engineering 42 (2012) 1077-1101
1.2.2.3. Traditional Hot Air drying coupled to autovaporization DIC process (SWELL-DRYING):
· Main stages of Swell-Drying SD
The swell drying process consisted in three stages (Fig. 1): 1. First stage (pre-drying): round fresh GMPs were dried under the same air conditions of THD, but in this case,
drying process was stopped when samples reached 20% db as moisture content. 2. Second stage (DIC treatment), carried on a laboratory scale DIC reactor; it included four steps:
2.1. First step: peppers were introduced in a processing reactor in which a vacuum of 30 mbar was established (Fig. 1a). The initial vacuum was carried out to facilitate and mediate the close exchange between the incoming steam and the product surface.
2.2. Second step: saturated steam was injected into the reactor at a fixed pressure level (from 0.1 up to 0.6 MPa) (Fig. 1b). Once tested pressure was reached, this was maintained for a given time (from 5 up to 35 s) (Fig. 1c). Pressure and time operating parameters were selected as shown in experimental design section.
2.3. Third step: once treatment time finished, samples were subjected to an instant controlled pressure drop ( P/t >0.5 MPa.s-1) towards vacuum (Fig. 1d).
2.4. Fourth step: after a vacuum stage, pressure was released toward the atmospheric pressure (Fig. 1e) and samples were removed from the reactor
Fig. 1. Schematic time-temperatures-pressures profiles of a DIC processing cycle. (a): establishment of the vacuum within the processing reactor; (b): injection of steam at the selected pressure; (c) maintain of treatment pressure during selected time; (d): instant controlled pressure drop towards vacuum and (e): establishment of the atmospheric pressure within the processing reactor
3. Third stage (post-drying), after DIC treatment samples were submitted to a second period of drying under the same conditions of THD. The follow-up of the operation allowed to establish drying kinetics versus time W=f(t). Dried products were allowed to cool down at room temperature for 5 min and then packed in polyethylene zip bags.
· DIC treatment
DIC equipment used to treat pre-dried peppers was a laboratory scale reactor MP model (manufactured at ABCAR-DIC Process; La Rochelle, France). Fig. 2 shows a schematic diagram of DIC equipment.
Fig. 2. Schematic diagram of DIC Equipment: (1) DIC Reactor, (2) Vacuum tank, (3) Vacuum pump, (4) Trap, V1-V7-valves, S1 and S2- saturated steam injection, W1- cooling water, P-Pressure gauge and T- thermocouples.
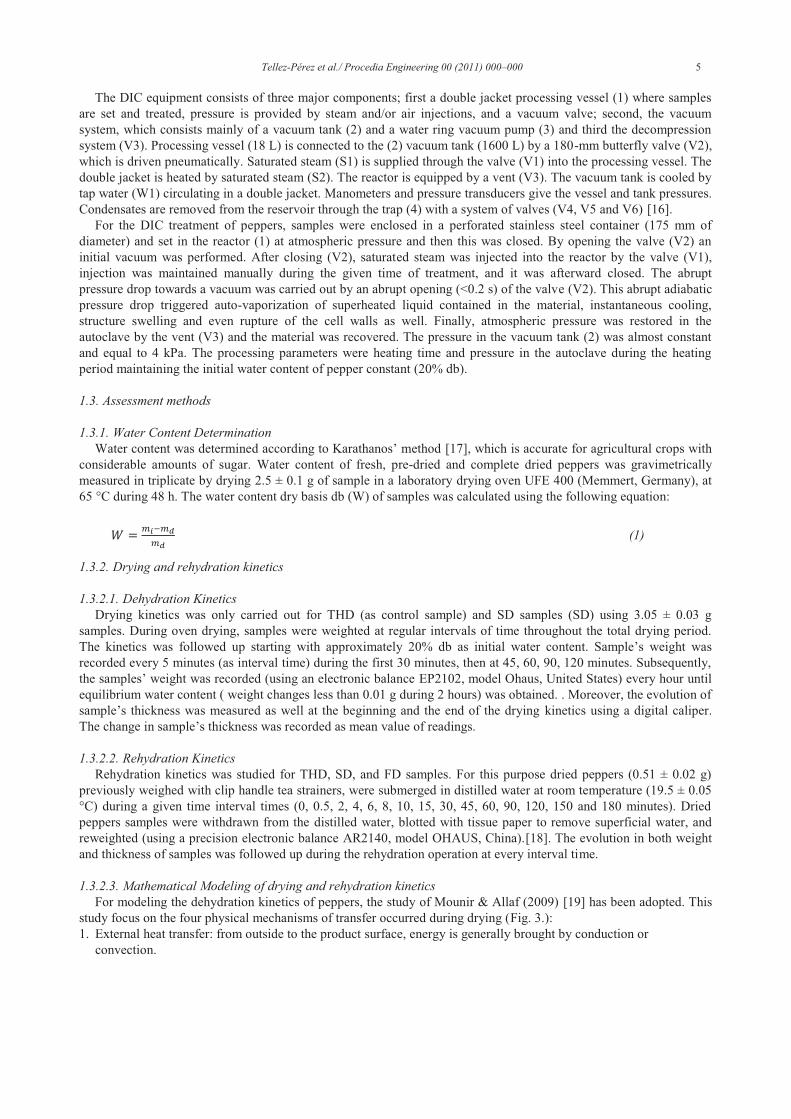
Tellez-Pérez et al./ Procedia Engineering 00 (2011) 000–000 5
The DIC equipment consists of three major components; first a double jacket processing vessel (1) where samples are set and treated, pressure is provided by steam and/or air injections, and a vacuum valve; second, the vacuum system, which consists mainly of a vacuum tank (2) and a water ring vacuum pump (3) and third the decompression system (V3). Processing vessel (18 L) is connected to the (2) vacuum tank (1600 L) by a 180-mm butterfly valve (V2), which is driven pneumatically. Saturated steam (S1) is supplied through the valve (V1) into the processing vessel. The double jacket is heated by saturated steam (S2). The reactor is equipped by a vent (V3). The vacuum tank is cooled by tap water (W1) circulating in a double jacket. Manometers and pressure transducers give the vessel and tank pressures. Condensates are removed from the reservoir through the trap (4) with a system of valves (V4, V5 and V6) [16].
For the DIC treatment of peppers, samples were enclosed in a perforated stainless steel container (175 mm of diameter) and set in the reactor (1) at atmospheric pressure and then this was closed. By opening the valve (V2) an initial vacuum was performed. After closing (V2), saturated steam was injected into the reactor by the valve (V1), injection was maintained manually during the given time of treatment, and it was afterward closed. The abrupt pressure drop towards a vacuum was carried out by an abrupt opening (<0.2 s) of the valve (V2). This abrupt adiabatic pressure drop triggered auto-vaporization of superheated liquid contained in the material, instantaneous cooling, structure swelling and even rupture of the cell walls as well. Finally, atmospheric pressure was restored in the autoclave by the vent (V3) and the material was recovered. The pressure in the vacuum tank (2) was almost constant and equal to 4 kPa. The processing parameters were heating time and pressure in the autoclave during the heating period maintaining the initial water content of pepper constant (20% db).
1.3. Assessment methods
1.3.1. Water Content Determination
Water content was determined according to Karathanos’ method [17], which is accurate for agricultural crops with considerable amounts of sugar. Water content of fresh, pre-dried and complete dried peppers was gravimetrically measured in triplicate by drying 2.5 ± 0.1 g of sample in a laboratory drying oven UFE 400 (Memmert, Germany), at 65 °C during 48 h. The water content dry basis db (W) of samples was calculated using the following equation:
(1)
1.3.2. Drying and rehydration kinetics
1.3.2.1. Dehydration Kinetics
Drying kinetics was only carried out for THD (as control sample) and SD samples (SD) using 3.05 ± 0.03 g samples. During oven drying, samples were weighted at regular intervals of time throughout the total drying period. The kinetics was followed up starting with approximately 20% db as initial water content. Sample’s weight was recorded every 5 minutes (as interval time) during the first 30 minutes, then at 45, 60, 90, 120 minutes. Subsequently, the samples’ weight was recorded (using an electronic balance EP2102, model Ohaus, United States) every hour until equilibrium water content ( weight changes less than 0.01 g during 2 hours) was obtained. . Moreover, the evolution of sample’s thickness was measured as well at the beginning and the end of the drying kinetics using a digital caliper. The change in sample’s thickness was recorded as mean value of readings.
1.3.2.2. Rehydration Kinetics
Rehydration kinetics was studied for THD, SD, and FD samples. For this purpose dried peppers (0.51 ± 0.02 g) previously weighed with clip handle tea strainers, were submerged in distilled water at room temperature (19.5 ± 0.05 °C) during a given time interval times (0, 0.5, 2, 4, 6, 8, 10, 15, 30, 45, 60, 90, 120, 150 and 180 minutes). Dried peppers samples were withdrawn from the distilled water, blotted with tissue paper to remove superficial water, and reweighted (using a precision electronic balance AR2140, model OHAUS, China).[18]. The evolution in both weight and thickness of samples was followed up during the rehydration operation at every interval time.
1.3.2.3. Mathematical Modeling of drying and rehydration kinetics
For modeling the dehydration kinetics of peppers, the study of Mounir & Allaf (2009) [19] has been adopted. This study focus on the four physical mechanisms of transfer occurred during drying (Fig. 3.): 1. External heat transfer: from outside to the product surface, energy is generally brought by conduction or
convection.
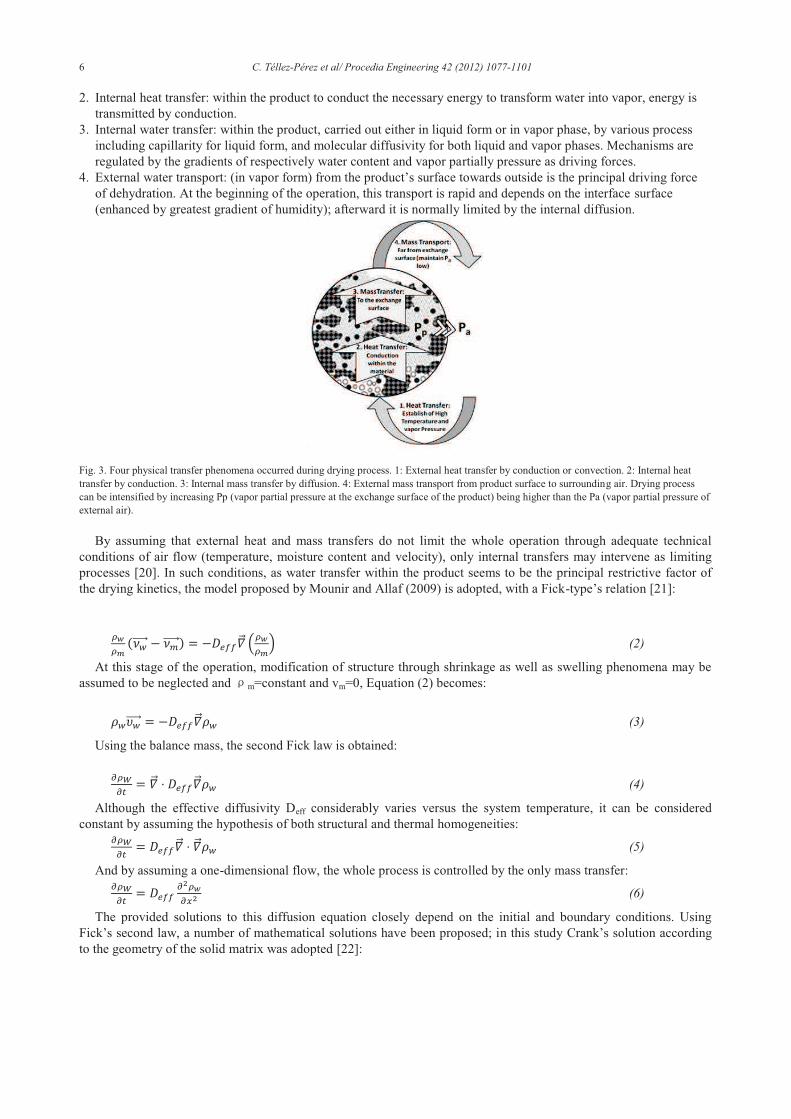
6 C. Téllez-Pérez et al/ Procedia Engineering 42 (2012) 1077-1101
2. Internal heat transfer: within the product to conduct the necessary energy to transform water into vapor, energy is transmitted by conduction.
3. Internal water transfer: within the product, carried out either in liquid form or in vapor phase, by various process including capillarity for liquid form, and molecular diffusivity for both liquid and vapor phases. Mechanisms are regulated by the gradients of respectively water content and vapor partially pressure as driving forces.
4. External water transport: (in vapor form) from the product’s surface towards outside is the principal driving force of dehydration. At the beginning of the operation, this transport is rapid and depends on the interface surface (enhanced by greatest gradient of humidity); afterward it is normally limited by the internal diffusion.
Fig. 3. Four physical transfer phenomena occurred during drying process. 1: External heat transfer by conduction or convection. 2: Internal heat transfer by conduction. 3: Internal mass transfer by diffusion. 4: External mass transport from product surface to surrounding air. Drying process can be intensified by increasing Pp (vapor partial pressure at the exchange surface of the product) being higher than the Pa (vapor partial pressure of external air).
By assuming that external heat and mass transfers do not limit the whole operation through adequate technical conditions of air flow (temperature, moisture content and velocity), only internal transfers may intervene as limiting processes [20]. In such conditions, as water transfer within the product seems to be the principal restrictive factor of the drying kinetics, the model proposed by Mounir and Allaf (2009) is adopted, with a Fick-type’s relation [21]:
(2)
At this stage of the operation, modification of structure through shrinkage as well as swelling phenomena may be assumed to be neglected and m=constant and vm=0, Equation (2) becomes:
(3)
Using the balance mass, the second Fick law is obtained:
(4)
Although the effective diffusivity Deff considerably varies versus the system temperature, it can be considered constant by assuming the hypothesis of both structural and thermal homogeneities:
(5)
And by assuming a one-dimensional flow, the whole process is controlled by the only mass transfer:
(6)
The provided solutions to this diffusion equation closely depend on the initial and boundary conditions. Using Fick’s second law, a number of mathematical solutions have been proposed; in this study Crank’s solution according to the geometry of the solid matrix was adopted [22]:
Tellez-Pérez et al./ Procedia Engineering 00 (2011) 000–000 7
(7)
where W, W and W1 are the amounts of water content (db) in the solid matrix at time t (W), at equilibrium at very long time t (W ) and at the starting diffusion time (W1), respectively. W1 is the value of W at the time t1 chosen as the beginning of the diffusion model gotten only for long time experiments. The difference between W0 (theoretical value of W gotten by extrapolating the diffusion model) and the experimental one Wi, at t=0, corresponds to the amount of water available on the surface and extracted from it in a very short time. By modifying matrix structure, improving porosity, the values of W and W0 vary depending on and characterizing DIC treatment.:
(8)
Coefficients of Crank solutions Ai and qi are given according to the matrix geometry Fick s number (τ) is defined as:
=Deff*t/dp2 (9)
where dp is the characteristic length (m). For this case an infinite plate is consider and dp is the half thickness of peppers. By limiting equation 8 to its first term, it could be expressed as:
(10)
The logarithmic representation of equation 10 as a straight line leads to determine Deff from the slope k:
(11)
Where k corresponds to:
(12)
And the effective diffusivity is:
(13)
The experimental data used for such empirical model exclude the ones concerning the points close to t=0; the extrapolation of the model thus obtained allowed the W0 to be determined as, generally, different from the initial humidity content Wi. The difference dWs between Wi and W0 reveals the humidity quickly removed from the surface independently from diffusion processes; this quantity has been defined as starting accessibility of water.
(14)
The values of drying time to get water content of 0.05% db (td0.05%), the starting accessibility (dWs,d) and the drying effective diffusivity (Deff,d) have been considered as the main response parameters characterized on drying process.
For rehydration kinetics, similar argument has been applied, evaluated response parameters were the values of rehydration time to get water content of 300% db (tr300%), the “rehydration starting accessibility” (dWs,r) and the rehydration effective diffusivity (Deff,r)
1.3.3. Water Holding Capacity
Water holding capacities were evaluated on THD, SWELL-DRYING process and for FD. For this purpose dried peppers were ground in a Grindomix GM-100 (Retsch, Germany) at 6.5 x 1000 rpm for 3 min, and moisture content of powders was determined. On 30-mL centrifuge plastic tubes, 22.5 ml of distilled water were added to 2.5 g of powder
8 C. Téllez-Pérez et al/ Procedia Engineering 42 (2012) 1077-1101
peppers at room temperature (23 °C). Sample tubes were hand shaken vigorously for 1 min then incubated for 1 hour at room temperature. After standing, samples were centrifuged twice (3K15 SIGMA centrifuge model, Germany), first at 3500 rpm, 23 °C for 30 min and the second for 5 minutes. Between the first and second centrifugations supernatant water was eliminated. The final water content represented the calculated WHC (% db) determined as mentioned in moisture content section). Applied method was based on [23] protocol, with slight modifications [22].
1.4. Experimental Design and Statistical Analysis
The different responses were considered as dependent variables and analysed through a correlation matrix and a RSM method; this last concerned: · A central composite rotatable design with two-independent variables (n=2), DIC steam pressure “P” (MPa) and the
thermal treatment time “t” (s), and five levels (- , - ,-1, 0, +1 and + ) was used, to reduce experimental points [24-25]; the . The design included 11 total experiments: ○ Factorials points (2n): 4 points (-1/- / -1; -;-1/+1; +1/-1 and +1/+1) ○ Star points (2*n): 4 points (- /0; + /0; 0/- and 0/+ )
· Three repetitions of the central points: (0,0) The value of α (axial distance) depending on the number of parameters considered (n) is calculated as =
(2n) 0.25. For this study, α =1.4142. In order to select the range values of DIC selected variables “P” and “t”, some preliminary experiments were
carried out. The operative DIC parameters applied were shown on Table 1.
Table 1. Coded levels for independent variables used in the developing experimental data
Coded level
– -1 0 +1 +α
Steam pressure (MPa) 0.10 0.17 0.35 0.53 0.60
Processing time (s) 5 9 20 31 35
Run experimental values were shown in Table 2.
Table 2. Run experimental values
DIC Treatment
1 2 3 4 5 6 7 8 9 10 11
Pressure (MPa) 0.6 0.35 0.35 0.53 0.53 0.35 0.17 0.17 0.1 0.35 0.35
Time (s) 20 35 20 31 9 20 9 31 20 5 20
The experiments were run in random in order to minimize the effects of unexpected variability in the observed responses due to extraneous factors.
According to the statistical method, a second order polynomial function was assumed to approximate the response under considerations. The general (equation 14) and specific (equation 15) models applied in this study were applied [26]:
(15)
(16)
Where Y is the response, , , and are the regression coefficients, are the independent variables, e is random error, i and j are the indices of the factors.
Design analysis of results data was done by the surface response methodology, performed on Statgraphics Plus for Windows, (4.1 version). This method is based on predicted model equation allows obtaining the surface response plots, to optimize the responses. other analysis subsequently were performed, as analysis of variance (ANOVA) to determine the significant differences between independent variables (P 0.05): · Pareto charts: to identify the impact of variables on responses, · general trends: to analyze responses behavior in front of variable changes, · empirical model coefficients to determine the models of each response, and · R² to accurate fitting models to real data.
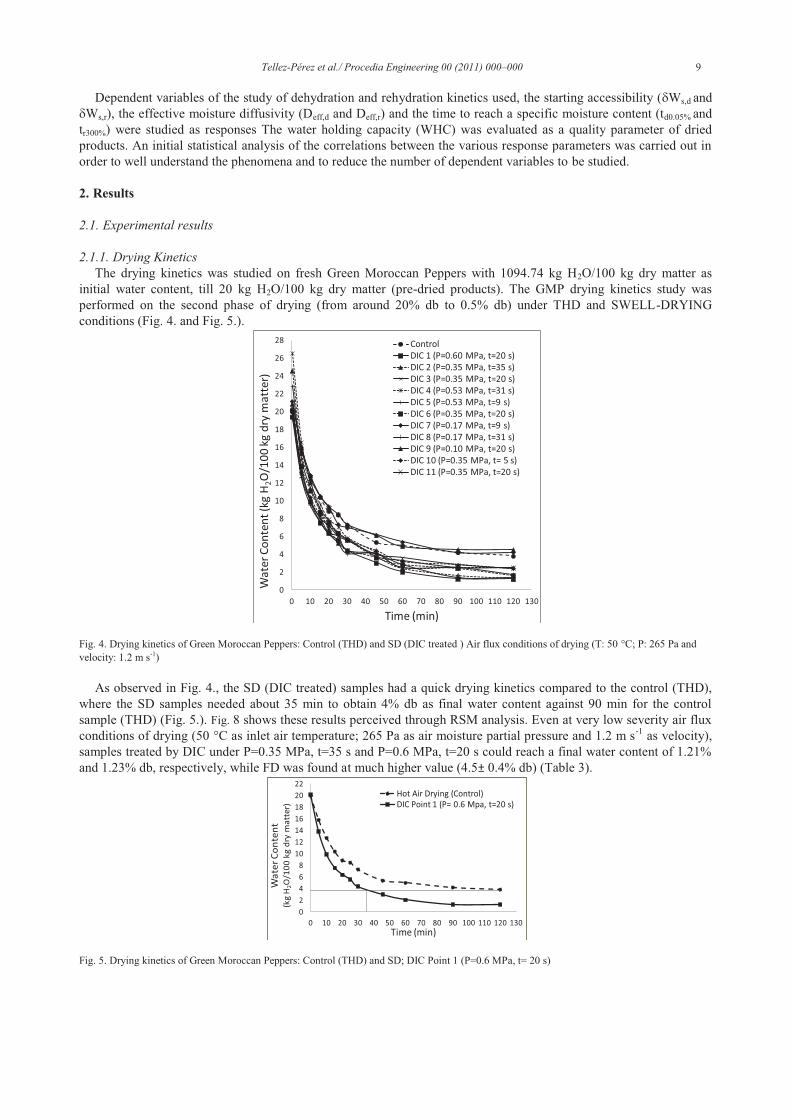
Tellez-Pérez et al./ Procedia Engineering 00 (2011) 000–000 9
Dependent variables of the study of dehydration and rehydration kinetics used, the starting accessibility (dWs,d and dWs,r), the effective moisture diffusivity (Deff,d and Deff,r) and the time to reach a specific moisture content (td0.05% and tr300%) were studied as responses The water holding capacity (WHC) was evaluated as a quality parameter of dried products. An initial statistical analysis of the correlations between the various response parameters was carried out in order to well understand the phenomena and to reduce the number of dependent variables to be studied.
2. Results
2.1. Experimental results
2.1.1. Drying Kinetics
The drying kinetics was studied on fresh Green Moroccan Peppers with 1094.74 kg H2O/100 kg dry matter as initial water content, till 20 kg H2O/100 kg dry matter (pre-dried products). The GMP drying kinetics study was performed on the second phase of drying (from around 20% db to 0.5% db) under THD and SWELL-DRYING conditions (Fig. 4. and Fig. 5.).
Fig. 4. Drying kinetics of Green Moroccan Peppers: Control (THD) and SD (DIC treated ) Air flux conditions of drying (T: 50 °C; P: 265 Pa and velocity: 1.2 m s-1)
As observed in Fig. 4., the SD (DIC treated) samples had a quick drying kinetics compared to the control (THD), where the SD samples needed about 35 min to obtain 4% db as final water content against 90 min for the control sample (THD) (Fig. 5.). Fig. 8 shows these results perceived through RSM analysis. Even at very low severity air flux conditions of drying (50 °C as inlet air temperature; 265 Pa as air moisture partial pressure and 1.2 m s-1 as velocity), samples treated by DIC under P=0.35 MPa, t=35 s and P=0.6 MPa, t=20 s could reach a final water content of 1.21% and 1.23% db, respectively, while FD was found at much higher value (4.5± 0.4% db) (Table 3).
Fig. 5. Drying kinetics of Green Moroccan Peppers: Control (THD) and SD; DIC Point 1 (P=0.6 MPa, t= 20 s)
0
2
4
6
8
10
12
14
16
18
20
22
24
26
28
0 10 20 30 40 50 60 70 80 90 100 110 120 130
Wa
ter
Co
nte
nt
(kg
H2O
/10
0 k
g d
ry m
att
er)
Time (min)
Control
DIC 1 (P=0.60 MPa, t=20 s)
DIC 2 (P=0.35 MPa, t=35 s)
DIC 3 (P=0.35 MPa, t=20 s)
DIC 4 (P=0.53 MPa, t=31 s)
DIC 5 (P=0.53 MPa, t=9 s)
DIC 6 (P=0.35 MPa, t=20 s)
DIC 7 (P=0.17 MPa, t=9 s)
DIC 8 (P=0.17 MPa, t=31 s)
DIC 9 (P=0.10 MPa, t=20 s)
DIC 10 (P=0.35 MPa, t= 5 s)
DIC 11 (P=0.35 MPa, t=20 s)
0
2
4
6
8
10
12
14
16
18
20
22
0 10 20 30 40 50 60 70 80 90 100 110 120 130
Wa
ter
Co
nte
nt
(kg
H2O
/10
0 k
g d
ry m
att
er)
Time (min)
Hot Air Drying (Control)
DIC Point 1 (P= 0.6 Mpa, t=20 s)

10 C. Téllez-Pérez et al/ Procedia Engineering 42 (2012) 1077-1101
The modeling of drying was achieved leading to determine the effective water diffusion Deff,d and the starting accessibility dWs,d, as well as the water content at 120 min (Wt= 120 min), the necessary drying time to attain 5% as final water content dry basis (td5%). These response parameters were illustrated in Table 3. As shown in Table 3, the starting accessibility and water effective diffusivity were increased by 2.5 times compared to the control sample (THD). SD samples treated by DIC under P=0.35 MPa, t=35 s had a starting accessibility and a water effective diffusivity of 12.66 % db and 24.19 x 10⁻¹⁰ m2 s-1, respectively against 5.64 % db and 10.16 x 10⁻¹⁰ m2 s-1 for the control sample (THD).
Table 3. Results of evaluated drying kinetics parameters: water content at 120 min (Wt=120 min), drying time to reach a final water content of 0.05% db (td5%), starting accessibility (dWs,d) and effective diffusivity (Deff,d). R2 is the correlation coefficient between the experimental and predicted data values of the model.
Trial no. Pressure
(MPa)
Time
(s)
Wt=120 min
(% db)
td5%
(min)
dWs,d
(% db)
Deff,d
(10-10 m2 s-1)
R2
(%)
DIC 1 0.6 20 1.23 140.53 8.09 25.00 97.85
DIC 2 0.35 35 1.21 119.97 12.66 24.19 99.50
DIC 3 0.35 20 1.31 168.53 8.90 23.53 97.76
DIC 4 0.53 31 2.49 152.66 11.83 23.42 97.58
DIC 5 0.53 9 2.45 159.48 10.12 21.91 98.08
DIC 6 0.35 20 1.62 168.53 7.39 20.63 98.95
DIC 7 0.17 9 4.20 179.99 7.14 13.15 98.17
DIC 8 0.17 31 1.68 139.94 8.76 22.11 99.54
DIC 9 0.1 20 4.51 210.98 6.54 11.50 97.88
DIC 10 0.35 5 2.39 182.25 8.18 19.19 98.10
DIC 11 0.35 20 2.39 186.20 8.39 19.92 97.08
Control - - 3.79 204.19 5.64 10.16 96.58
2.1.2. Rehydration kinetics
The inverse operation of drying is the rehydration; the capacity and rate of rehydration were investigated. Similar to drying modeling, the rehydration response parameters were studied as well; the water content dry basis at 180 min (Wt=180 min), the rehydration time to attain a final water content of 300% db (tr300%), the starting accessibility (δWs,r) and the effective diffusivity Deff (As shown in Table 4, the rehydration starting accessibility and water effective diffusivity of dried GMPs were increased by 125% and 272% respectively compared to the control sample (THD). SD samples treated by DIC under P=0.35 MPa, t=20 s had starting accessibility and water effective diffusivity of 126.39% db and 13.59 10-10 m2 s-1, respectively against 100.92% db and 4.99 10-10 m2 s-1 for the control sample (THD).
Table 4).
Fig. 6. Rehydration kinetics of Green Moroccan Peppers: Control (THD), Freeze-Dried g (FD) and SD Rehydration was evaluated using distilled water at room temperature of 19.5 ± 0.5 °C.
Fig. 6. and Fig. 7. show the rehydration kinetics (capacity and rate) of GMPs dried by various techniques (THD, FD, and SD); the SD samples showed high capacity with rapid rate of water uptake compared to control (THD). The rehydration is an important dried food characteristic normally affected by drying technique and drying conditions as
0
100
200
300
400
500
600
700
800
900
1,000
1,100
1,200
0 20 40 60 80 100 120 140 160 180 200
Wat
er C
onte
nt (g
H2O
/100
g d
ry m
atte
r)
Time (min)
ControlDIC 1 (P=0.60 MPa, t=20 s)DIC 2 (P=0.35 MPa, t=35 s)DIC 3 (P=0.35 MPa, t=20 s)DIC 4 (P=0.53 MPa, t=31 s)DIC 5 (P=0.53 MPa, t=9 s)DIC 6 (P=0.35 MPa, t=20 s)DIC 7 (P=0.17 MPa, t=9 s)DIC 8 (P=0.17 MPa, t=31 s)DIC 9 (P=0.10 MPa, t=20 s)DIC 10 (P=0.35 MPa, t= 5 s)DIC 11 (P=0.35 MPa, t=20 s)Freeze-Drying
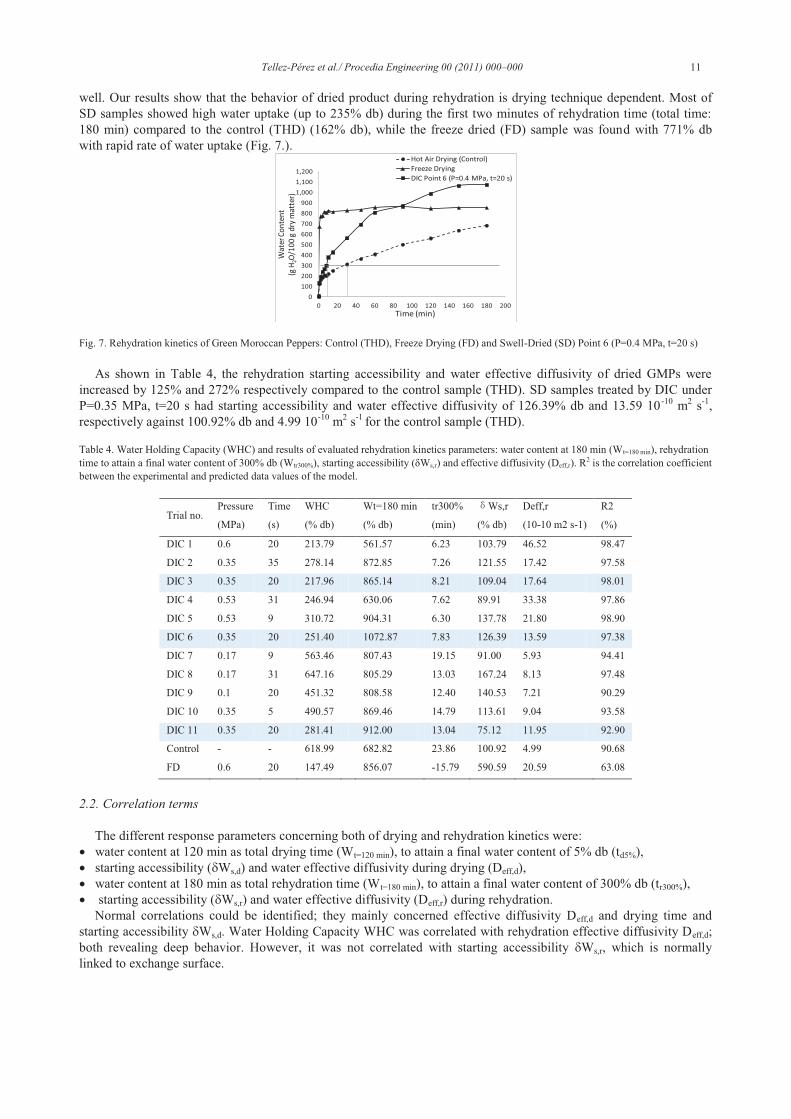
Tellez-Pérez et al./ Procedia Engineering 00 (2011) 000–000 11
well. Our results show that the behavior of dried product during rehydration is drying technique dependent. Most of SD samples showed high water uptake (up to 235% db) during the first two minutes of rehydration time (total time: 180 min) compared to the control (THD) (162% db), while the freeze dried (FD) sample was found with 771% db with rapid rate of water uptake (Fig. 7.).
Fig. 7. Rehydration kinetics of Green Moroccan Peppers: Control (THD), Freeze Drying (FD) and Swell-Dried (SD) Point 6 (P=0.4 MPa, t=20 s)
As shown in Table 4, the rehydration starting accessibility and water effective diffusivity of dried GMPs were increased by 125% and 272% respectively compared to the control sample (THD). SD samples treated by DIC under P=0.35 MPa, t=20 s had starting accessibility and water effective diffusivity of 126.39% db and 13.59 10 -10 m2 s-1, respectively against 100.92% db and 4.99 10-10 m2 s-1 for the control sample (THD).
Table 4. Water Holding Capacity (WHC) and results of evaluated rehydration kinetics parameters: water content at 180 min (Wt=180 min), rehydration time to attain a final water content of 300% db (Wtr300%), starting accessibility (δWs,r) and effective diffusivity (Deff,r). R
2 is the correlation coefficient between the experimental and predicted data values of the model.
Trial no. Pressure
(MPa)
Time
(s)
WHC
(% db)
Wt=180 min
(% db)
tr300%
(min)
Ws,r
(% db)
Deff,r
(10-10 m2 s-1)
R2
(%)
DIC 1 0.6 20 213.79 561.57 6.23 103.79 46.52 98.47
DIC 2 0.35 35 278.14 872.85 7.26 121.55 17.42 97.58
DIC 3 0.35 20 217.96 865.14 8.21 109.04 17.64 98.01
DIC 4 0.53 31 246.94 630.06 7.62 89.91 33.38 97.86
DIC 5 0.53 9 310.72 904.31 6.30 137.78 21.80 98.90
DIC 6 0.35 20 251.40 1072.87 7.83 126.39 13.59 97.38
DIC 7 0.17 9 563.46 807.43 19.15 91.00 5.93 94.41
DIC 8 0.17 31 647.16 805.29 13.03 167.24 8.13 97.48
DIC 9 0.1 20 451.32 808.58 12.40 140.53 7.21 90.29
DIC 10 0.35 5 490.57 869.46 14.79 113.61 9.04 93.58
DIC 11 0.35 20 281.41 912.00 13.04 75.12 11.95 92.90
Control - - 618.99 682.82 23.86 100.92 4.99 90.68
FD 0.6 20 147.49 856.07 -15.79 590.59 20.59 63.08
2.2. Correlation terms
The different response parameters concerning both of drying and rehydration kinetics were: · water content at 120 min as total drying time (Wt=120 min), to attain a final water content of 5% db (td5%), · starting accessibility (dWs,d) and water effective diffusivity during drying (Deff,d), · water content at 180 min as total rehydration time (Wt=180 min), to attain a final water content of 300% db (tr300%), · starting accessibility (dWs,r) and water effective diffusivity (Deff,r) during rehydration.
Normal correlations could be identified; they mainly concerned effective diffusivity Deff,d and drying time and starting accessibility dWs,d. Water Holding Capacity WHC was correlated with rehydration effective diffusivity Deff,d; both revealing deep behavior. However, it was not correlated with starting accessibility dWs,r, which is normally linked to exchange surface.
0
100
200
300
400
500
600
700
800
900
1,000
1,100
1,200
0 20 40 60 80 100 120 140 160 180 200
Wa
ter
Co
nte
nt
(g H
2O/1
00
g d
ry m
att
er)
Time (min)
Hot Air Drying (Control)
Freeze Drying
DIC Point 6 (P=0.4 MPa, t=20 s)
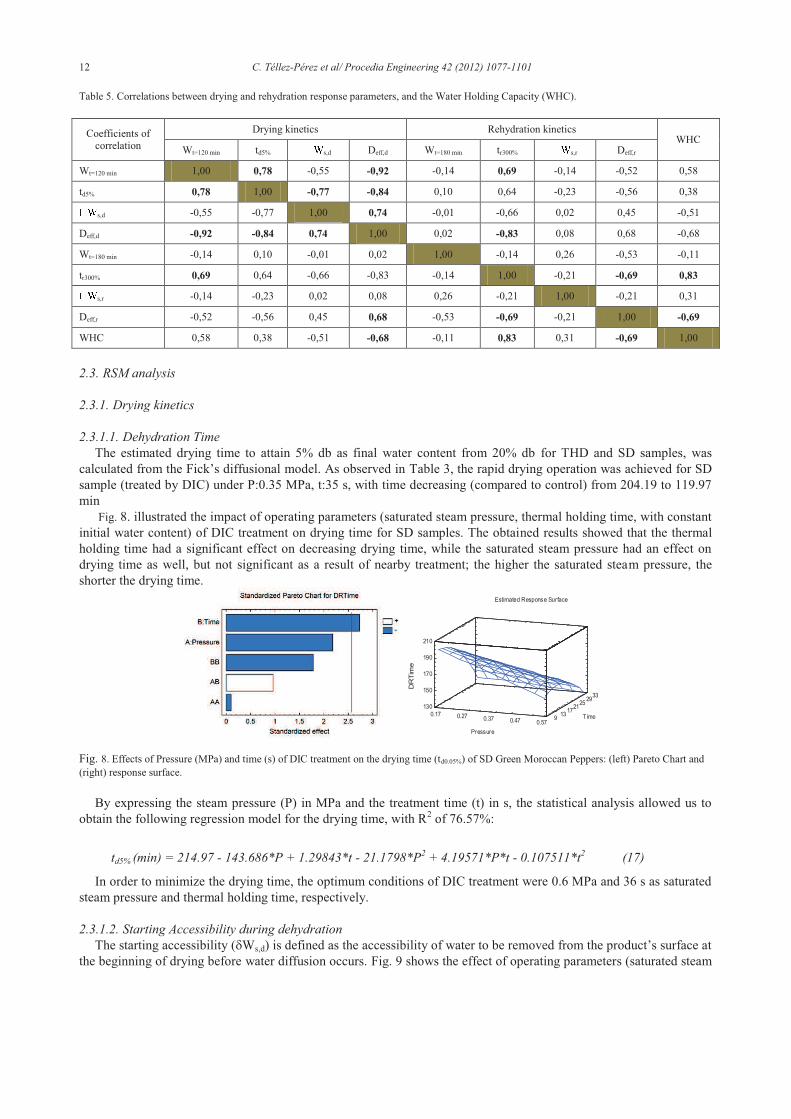
12 C. Téllez-Pérez et al/ Procedia Engineering 42 (2012) 1077-1101
Table 5. Correlations between drying and rehydration response parameters, and the Water Holding Capacity (WHC).
Coefficients of correlation
Drying kinetics Rehydration kinetics WHC
Wt=120 min td5% s,d Deff,d Wt=180 min tr300% s,r Deff,r
Wt=120 min 1,00 0,78 -0,55 -0,92 -0,14 0,69 -0,14 -0,52 0,58
td5% 0,78 1,00 -0,77 -0,84 0,10 0,64 -0,23 -0,56 0,38
s,d -0,55 -0,77 1,00 0,74 -0,01 -0,66 0,02 0,45 -0,51
Deff,d -0,92 -0,84 0,74 1,00 0,02 -0,83 0,08 0,68 -0,68
Wt=180 min -0,14 0,10 -0,01 0,02 1,00 -0,14 0,26 -0,53 -0,11
tr300% 0,69 0,64 -0,66 -0,83 -0,14 1,00 -0,21 -0,69 0,83
s,r -0,14 -0,23 0,02 0,08 0,26 -0,21 1,00 -0,21 0,31
Deff,r -0,52 -0,56 0,45 0,68 -0,53 -0,69 -0,21 1,00 -0,69
WHC 0,58 0,38 -0,51 -0,68 -0,11 0,83 0,31 -0,69 1,00
2.3. RSM analysis
2.3.1. Drying kinetics
2.3.1.1. Dehydration Time
The estimated drying time to attain 5% db as final water content from 20% db for THD and SD samples, was calculated from the Fick’s diffusional model. As observed in Table 3, the rapid drying operation was achieved for SD sample (treated by DIC) under P:0.35 MPa, t:35 s, with time decreasing (compared to control) from 204.19 to 119.97 min
Fig. 8. illustrated the impact of operating parameters (saturated steam pressure, thermal holding time, with constant initial water content) of DIC treatment on drying time for SD samples. The obtained results showed that the thermal holding time had a significant effect on decreasing drying time, while the saturated steam pressure had an effect on drying time as well, but not significant as a result of nearby treatment; the higher the saturated steam pressure, the shorter the drying time.
Fig. 8. Effects of Pressure (MPa) and time (s) of DIC treatment on the drying time (td0.05%) of SD Green Moroccan Peppers: (left) Pareto Chart and (right) response surface.
By expressing the steam pressure (P) in MPa and the treatment time (t) in s, the statistical analysis allowed us to obtain the following regression model for the drying time, with R2 of 76.57%:
td5% (min) = 214.97 - 143.686*P + 1.29843*t - 21.1798*P2 + 4.19571*P*t - 0.107511*t2 (17)
In order to minimize the drying time, the optimum conditions of DIC treatment were 0.6 MPa and 36 s as saturated steam pressure and thermal holding time, respectively.
2.3.1.2. Starting Accessibility during dehydration
The starting accessibility (dWs,d) is defined as the accessibility of water to be removed from the product’s surface at the beginning of drying before water diffusion occurs. Fig. 9 shows the effect of operating parameters (saturated steam
Estimated Response Surface
0.17 0.27 0.37 0.47 0.57
Pressure
913
1721
2529
33
Time
130
150
170
190
210
DR
Tim
e
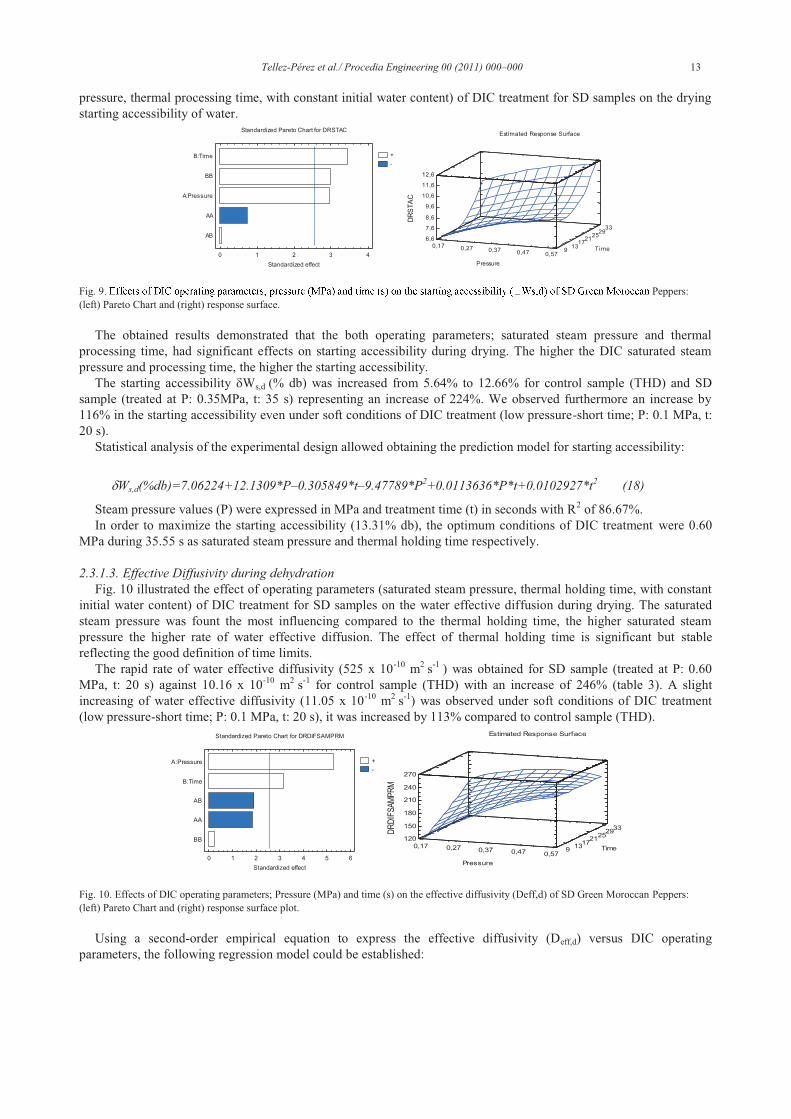
Tellez-Pérez et al./ Procedia Engineering 00 (2011) 000–000 13
pressure, thermal processing time, with constant initial water content) of DIC treatment for SD samples on the drying starting accessibility of water.
Fig. 9 Peppers: (left) Pareto Chart and (right) response surface.
The obtained results demonstrated that the both operating parameters; saturated steam pressure and thermal processing time, had significant effects on starting accessibility during drying. The higher the DIC saturated steam pressure and processing time, the higher the starting accessibility.
The starting accessibility dWs,d (% db) was increased from 5.64% to 12.66% for control sample (THD) and SD sample (treated at P: 0.35MPa, t: 35 s) representing an increase of 224%. We observed furthermore an increase by 116% in the starting accessibility even under soft conditions of DIC treatment (low pressure-short time; P: 0.1 MPa, t: 20 s).
Statistical analysis of the experimental design allowed obtaining the prediction model for starting accessibility:
dWs,d(%db)=7.06224+12.1309*P–0.305849*t–9.47789*P2+0.0113636*P*t+0.0102927*t2 (18)
Steam pressure values (P) were expressed in MPa and treatment time (t) in seconds with R2 of 86.67%. In order to maximize the starting accessibility (13.31% db), the optimum conditions of DIC treatment were 0.60
MPa during 35.55 s as saturated steam pressure and thermal holding time respectively.
2.3.1.3. Effective Diffusivity during dehydration
Fig. 10 illustrated the effect of operating parameters (saturated steam pressure, thermal holding time, with constant initial water content) of DIC treatment for SD samples on the water effective diffusion during drying. The saturated steam pressure was fount the most influencing compared to the thermal holding time, the higher saturated steam pressure the higher rate of water effective diffusion. The effect of thermal holding time is significant but stable reflecting the good definition of time limits.
The rapid rate of water effective diffusivity (525 x 10-10 m2 s-1 ) was obtained for SD sample (treated at P: 0.60 MPa, t: 20 s) against 10.16 x 10⁻¹⁰ m2 s-1 for control sample (THD) with an increase of 246% (table 3). A slight increasing of water effective diffusivity (11.05 x 10⁻¹⁰ m2 s-1) was observed under soft conditions of DIC treatment (low pressure-short time; P: 0.1 MPa, t: 20 s), it was increased by 113% compared to control sample (THD).
Fig. 10. Effects of DIC operating parameters; Pressure (MPa) and time (s) on the effective diffusivity (Deff,d) of SD Green Moroccan Peppers: (left) Pareto Chart and (right) response surface plot.
Using a second-order empirical equation to express the effective diffusivity (Deff,d) versus DIC operating parameters, the following regression model could be established:
Standardized Pareto Chart for DRSTAC
0 1 2 3 4
Standardized effect
AB
AA
A:Pressure
BB
B:Time +
-
Estimated Response Surface
0,17 0,27 0,37 0,47 0,57
Pressure
913
1721
2529
33
Time
6,6
7,6
8,6
9,6
10,6
11,6
12,6
DR
ST
AC
Standardized Pareto Chart for DRDIFSAMPRM
0 1 2 3 4 5 6
Standardized effect
BB
AA
AB
B:Time
A:Pressure +
-
Estimated Response Surface
0,17 0,27 0,37 0,47 0,57
Pressure
913
1721
2529
33
Time
120
150
180
210
240
270
DR
DIF
SA
MP
RM
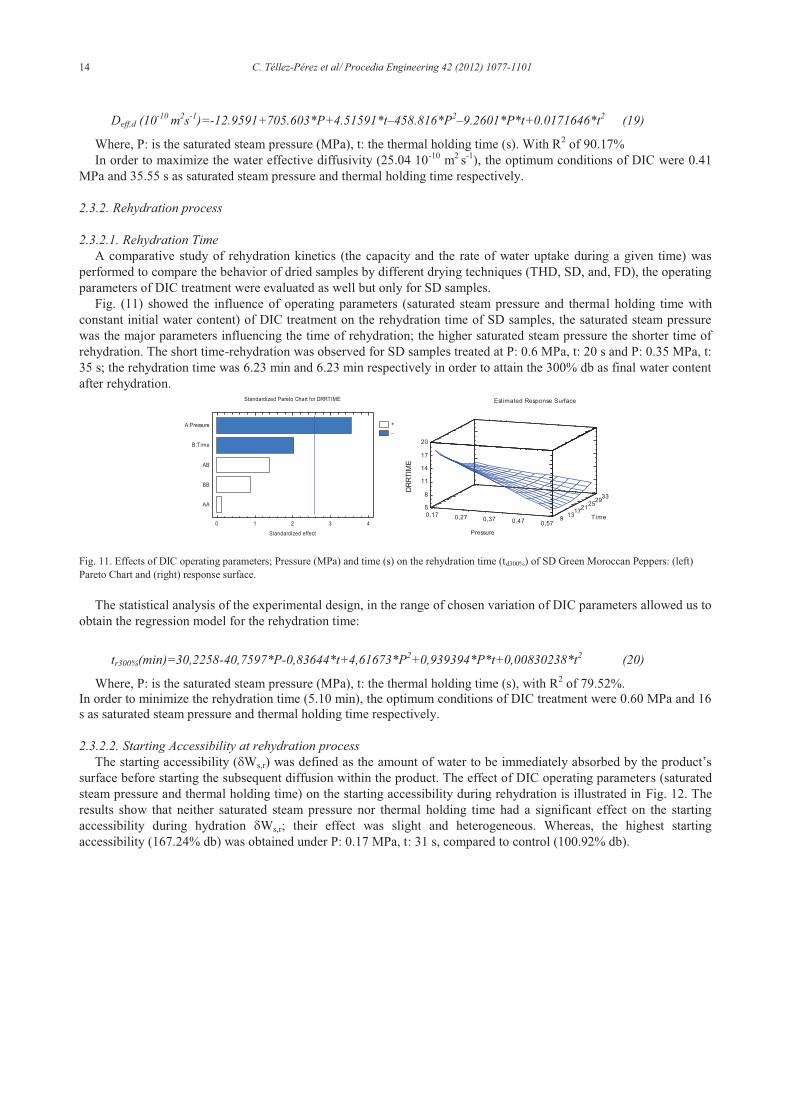
14 C. Téllez-Pérez et al/ Procedia Engineering 42 (2012) 1077-1101
Deff,d (10-10
m2s
-1)=-12.9591+705.603*P+4.51591*t–458.816*P
2–9.2601*P*t+0.0171646*t
2 (19)
Where, P: is the saturated steam pressure (MPa), t: the thermal holding time (s). With R2 of 90.17% In order to maximize the water effective diffusivity (25.04 10-10 m2 s-1), the optimum conditions of DIC were 0.41
MPa and 35.55 s as saturated steam pressure and thermal holding time respectively.
2.3.2. Rehydration process
2.3.2.1. Rehydration Time
A comparative study of rehydration kinetics (the capacity and the rate of water uptake during a given time) was performed to compare the behavior of dried samples by different drying techniques (THD, SD, and, FD), the operating parameters of DIC treatment were evaluated as well but only for SD samples.
Fig. (11) showed the influence of operating parameters (saturated steam pressure and thermal holding time with constant initial water content) of DIC treatment on the rehydration time of SD samples, the saturated steam pressure was the major parameters influencing the time of rehydration; the higher saturated steam pressure the shorter time of rehydration. The short time-rehydration was observed for SD samples treated at P: 0.6 MPa, t: 20 s and P: 0.35 MPa, t: 35 s; the rehydration time was 6.23 min and 6.23 min respectively in order to attain the 300% db as final water content after rehydration.
Fig. 11. Effects of DIC operating parameters; Pressure (MPa) and time (s) on the rehydration time (td300%) of SD Green Moroccan Peppers: (left) Pareto Chart and (right) response surface.
The statistical analysis of the experimental design, in the range of chosen variation of DIC parameters allowed us to obtain the regression model for the rehydration time:
tr300%(min)=30,2258-40,7597*P-0,83644*t+4,61673*P2+0,939394*P*t+0,00830238*t2 (20)
Where, P: is the saturated steam pressure (MPa), t: the thermal holding time (s), with R2 of 79.52%. In order to minimize the rehydration time (5.10 min), the optimum conditions of DIC treatment were 0.60 MPa and 16 s as saturated steam pressure and thermal holding time respectively.
2.3.2.2. Starting Accessibility at rehydration process
The starting accessibility (dWs,r) was defined as the amount of water to be immediately absorbed by the product’s surface before starting the subsequent diffusion within the product. The effect of DIC operating parameters (saturated steam pressure and thermal holding time) on the starting accessibility during rehydration is illustrated in Fig. 12. The results show that neither saturated steam pressure nor thermal holding time had a significant effect on the starting accessibility during hydration dWs,r; their effect was slight and heterogeneous. Whereas, the highest starting accessibility (167.24% db) was obtained under P: 0.17 MPa, t: 31 s, compared to control (100.92% db).
Standardized Pareto Chart for DRRTIME
0 1 2 3 4
Standardized effect
AA
BB
AB
B:Time
A:Pressure +
-
Estimated Response Surface
0,17 0,27 0,37 0,47 0,57
Pressure
913
1721
2529
33
Time
5
8
11
14
17
20
DR
RT
IME
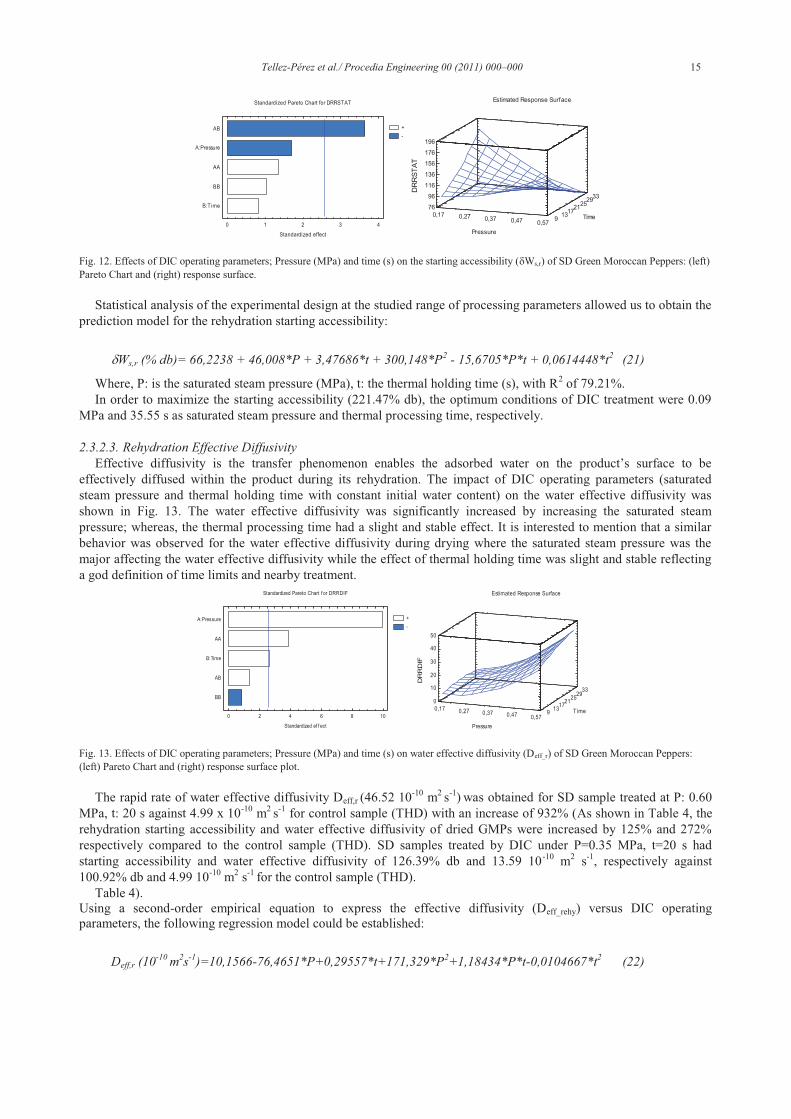
Tellez-Pérez et al./ Procedia Engineering 00 (2011) 000–000 15
Fig. 12. Effects of DIC operating parameters; Pressure (MPa) and time (s) on the starting accessibility (dWs,r) of SD Green Moroccan Peppers: (left) Pareto Chart and (right) response surface.
Statistical analysis of the experimental design at the studied range of processing parameters allowed us to obtain the prediction model for the rehydration starting accessibility:
dWs,r (% db)= 66,2238 + 46,008*P + 3,47686*t + 300,148*P2 - 15,6705*P*t + 0,0614448*t2 (21)
Where, P: is the saturated steam pressure (MPa), t: the thermal holding time (s), with R2 of 79.21%. In order to maximize the starting accessibility (221.47% db), the optimum conditions of DIC treatment were 0.09
MPa and 35.55 s as saturated steam pressure and thermal processing time, respectively.
2.3.2.3. Rehydration Effective Diffusivity
Effective diffusivity is the transfer phenomenon enables the adsorbed water on the product’s surface to be effectively diffused within the product during its rehydration. The impact of DIC operating parameters (saturated steam pressure and thermal holding time with constant initial water content) on the water effective diffusivity was shown in Fig. 13. The water effective diffusivity was significantly increased by increasing the saturated steam pressure; whereas, the thermal processing time had a slight and stable effect. It is interested to mention that a similar behavior was observed for the water effective diffusivity during drying where the saturated steam pressure was the major affecting the water effective diffusivity while the effect of thermal holding time was slight and stable reflecting a god definition of time limits and nearby treatment.
Fig. 13. Effects of DIC operating parameters; Pressure (MPa) and time (s) on water effective diffusivity (Deff_r) of SD Green Moroccan Peppers: (left) Pareto Chart and (right) response surface plot.
The rapid rate of water effective diffusivity Deff,r (46.52 10-10 m2 s-1) was obtained for SD sample treated at P: 0.60 MPa, t: 20 s against 4.99 x 10⁻¹⁰ m2 s-1 for control sample (THD) with an increase of 932% (As shown in Table 4, the rehydration starting accessibility and water effective diffusivity of dried GMPs were increased by 125% and 272% respectively compared to the control sample (THD). SD samples treated by DIC under P=0.35 MPa, t=20 s had starting accessibility and water effective diffusivity of 126.39% db and 13.59 10-10 m2 s-1, respectively against 100.92% db and 4.99 10-10 m2 s-1 for the control sample (THD).
Table 4). Using a second-order empirical equation to express the effective diffusivity (Deff_rehy) versus DIC operating parameters, the following regression model could be established:
Deff,r (10-10 m2s-1)=10,1566-76,4651*P+0,29557*t+171,329*P2+1,18434*P*t-0,0104667*t2 (22)
Standardized Pareto Chart for DRRSTAT
0 1 2 3 4
Standardized effect
B:Time
BB
AA
A:Pressure
AB +
-
Estimated Response Surface
0,17 0,27 0,37 0,47 0,57
Pressure
913
1721
2529
33
Time
76
96
116
136
156
176
196
DR
RS
TA
T
Standardized Pareto Chart f or DRRDIF
0 2 4 6 8 10
Standardized ef f ect
BB
AB
B:Time
AA
A:Pressure +
-
Estimated Response Surface
0,17 0,27 0,37 0,47 0,57
Pressure
913
1721
2529
33
Time
0
10
20
30
40
50
DR
RD
IF
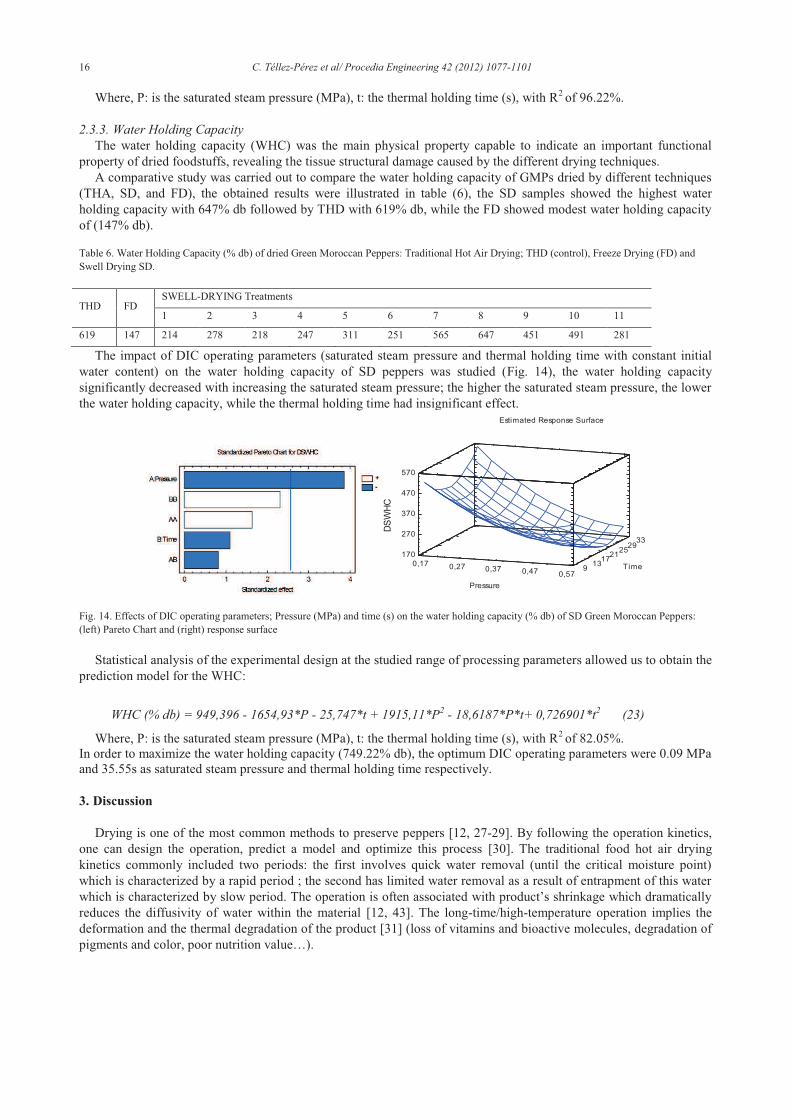
16 C. Téllez-Pérez et al/ Procedia Engineering 42 (2012) 1077-1101
Where, P: is the saturated steam pressure (MPa), t: the thermal holding time (s), with R2 of 96.22%.
2.3.3. Water Holding Capacity
The water holding capacity (WHC) was the main physical property capable to indicate an important functional property of dried foodstuffs, revealing the tissue structural damage caused by the different drying techniques.
A comparative study was carried out to compare the water holding capacity of GMPs dried by different techniques (THA, SD, and FD), the obtained results were illustrated in table (6), the SD samples showed the highest water holding capacity with 647% db followed by THD with 619% db, while the FD showed modest water holding capacity of (147% db).
Table 6. Water Holding Capacity (% db) of dried Green Moroccan Peppers: Traditional Hot Air Drying; THD (control), Freeze Drying (FD) and Swell Drying SD.
THD FD SWELL-DRYING Treatments
1 2 3 4 5 6 7 8 9 10 11
619 147 214 278 218 247 311 251 565 647 451 491 281
The impact of DIC operating parameters (saturated steam pressure and thermal holding time with constant initial water content) on the water holding capacity of SD peppers was studied (Fig. 14), the water holding capacity significantly decreased with increasing the saturated steam pressure; the higher the saturated steam pressure, the lower the water holding capacity, while the thermal holding time had insignificant effect.
Fig. 14. Effects of DIC operating parameters; Pressure (MPa) and time (s) on the water holding capacity (% db) of SD Green Moroccan Peppers: (left) Pareto Chart and (right) response surface
Statistical analysis of the experimental design at the studied range of processing parameters allowed us to obtain the prediction model for the WHC:
WHC (% db) = 949,396 - 1654,93*P - 25,747*t + 1915,11*P2 - 18,6187*P*t+ 0,726901*t2 (23)
Where, P: is the saturated steam pressure (MPa), t: the thermal holding time (s), with R2 of 82.05%. In order to maximize the water holding capacity (749.22% db), the optimum DIC operating parameters were 0.09 MPa and 35.55s as saturated steam pressure and thermal holding time respectively.
3. Discussion
Drying is one of the most common methods to preserve peppers [12, 27-29]. By following the operation kinetics, one can design the operation, predict a model and optimize this process [30]. The traditional food hot air drying kinetics commonly included two periods: the first involves quick water removal (until the critical moisture point) which is characterized by a rapid period ; the second has limited water removal as a result of entrapment of this water which is characterized by slow period. The operation is often associated with product’s shrinkage which dramatically reduces the diffusivity of water within the material [12, 43]. The long-time/high-temperature operation implies the deformation and the thermal degradation of the product [31] (loss of vitamins and bioactive molecules, degradation of pigments and color, poor nutrition value…).
Estimated Response Surface
0,17 0,27 0,37 0,47 0,57
Pressure
913
1721
2529
33
Time
170
270
370
470
570
DS
WH
C
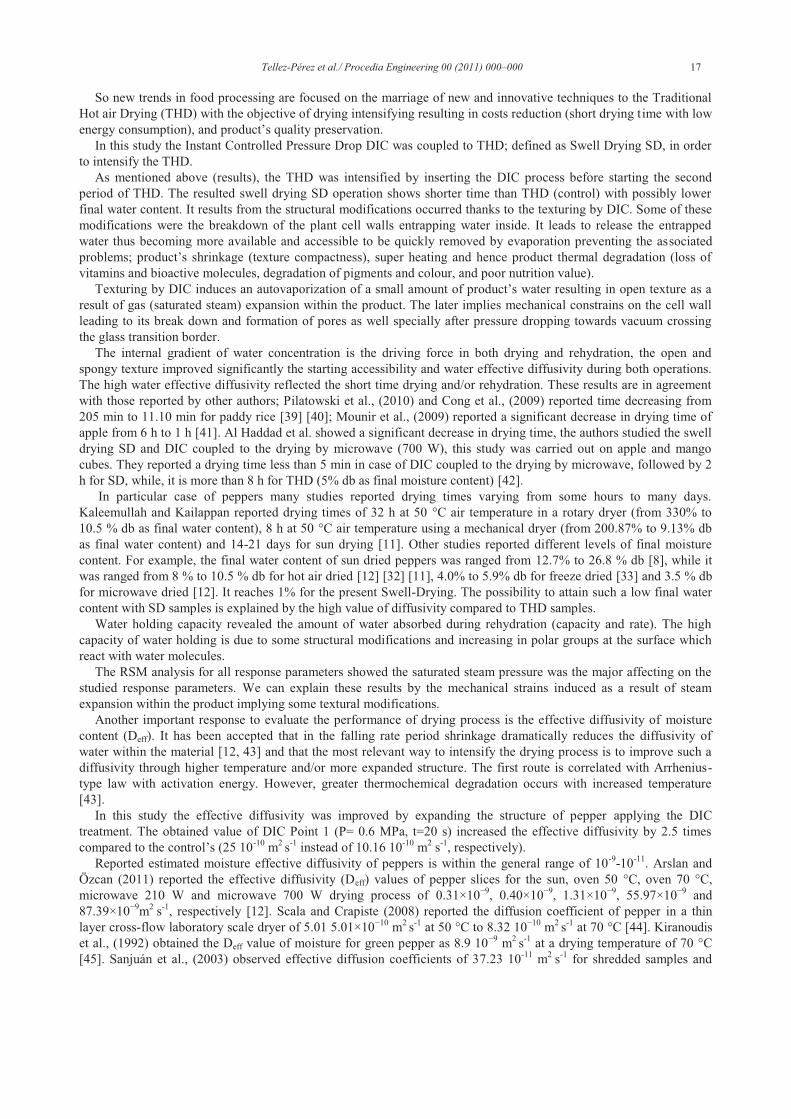
Tellez-Pérez et al./ Procedia Engineering 00 (2011) 000–000 17
So new trends in food processing are focused on the marriage of new and innovative techniques to the Traditional Hot air Drying (THD) with the objective of drying intensifying resulting in costs reduction (short drying time with low energy consumption), and product’s quality preservation.
In this study the Instant Controlled Pressure Drop DIC was coupled to THD; defined as Swell Drying SD, in order to intensify the THD.
As mentioned above (results), the THD was intensified by inserting the DIC process before starting the second period of THD. The resulted swell drying SD operation shows shorter time than THD (control) with possibly lower final water content. It results from the structural modifications occurred thanks to the texturing by DIC. Some of these modifications were the breakdown of the plant cell walls entrapping water inside. It leads to release the entrapped water thus becoming more available and accessible to be quickly removed by evaporation preventing the associated problems; product’s shrinkage (texture compactness), super heating and hence product thermal degradation (loss of vitamins and bioactive molecules, degradation of pigments and colour, and poor nutrition value).
Texturing by DIC induces an autovaporization of a small amount of product’s water resulting in open texture as a result of gas (saturated steam) expansion within the product. The later implies mechanical constrains on the cell wall leading to its break down and formation of pores as well specially after pressure dropping towards vacuum crossing the glass transition border.
The internal gradient of water concentration is the driving force in both drying and rehydration, the open and spongy texture improved significantly the starting accessibility and water effective diffusivity during both operations. The high water effective diffusivity reflected the short time drying and/or rehydration. These results are in agreement with those reported by other authors; Pilatowski et al., (2010) and Cong et al., (2009) reported time decreasing from 205 min to 11.10 min for paddy rice [39] [40]; Mounir et al., (2009) reported a significant decrease in drying time of apple from 6 h to 1 h [41]. Al Haddad et al. showed a significant decrease in drying time, the authors studied the swell drying SD and DIC coupled to the drying by microwave (700 W), this study was carried out on apple and mango cubes. They reported a drying time less than 5 min in case of DIC coupled to the drying by microwave, followed by 2 h for SD, while, it is more than 8 h for THD (5% db as final moisture content) [42].
In particular case of peppers many studies reported drying times varying from some hours to many days. Kaleemullah and Kailappan reported drying times of 32 h at 50 °C air temperature in a rotary dryer (from 330% to 10.5 % db as final water content), 8 h at 50 °C air temperature using a mechanical dryer (from 200.87% to 9.13% db as final water content) and 14-21 days for sun drying [11]. Other studies reported different levels of final moisture content. For example, the final water content of sun dried peppers was ranged from 12.7% to 26.8 % db [8], while it was ranged from 8 % to 10.5 % db for hot air dried [12] [32] [11], 4.0% to 5.9% db for freeze dried [33] and 3.5 % db for microwave dried [12]. It reaches 1% for the present Swell-Drying. The possibility to attain such a low final water content with SD samples is explained by the high value of diffusivity compared to THD samples.
Water holding capacity revealed the amount of water absorbed during rehydration (capacity and rate). The high capacity of water holding is due to some structural modifications and increasing in polar groups at the surface which react with water molecules.
The RSM analysis for all response parameters showed the saturated steam pressure was the major affecting on the studied response parameters. We can explain these results by the mechanical strains induced as a result of steam expansion within the product implying some textural modifications.
Another important response to evaluate the performance of drying process is the effective diffusivity of moisture content (Deff). It has been accepted that in the falling rate period shrinkage dramatically reduces the diffusivity of water within the material [12, 43] and that the most relevant way to intensify the drying process is to improve such a diffusivity through higher temperature and/or more expanded structure. The first route is correlated with Arrhenius-type law with activation energy. However, greater thermochemical degradation occurs with increased temperature [43].
In this study the effective diffusivity was improved by expanding the structure of pepper applying the DIC treatment. The obtained value of DIC Point 1 (P= 0.6 MPa, t=20 s) increased the effective diffusivity by 2.5 times compared to the control’s (25 10-10 m2 s-1 instead of 10.16 10-10 m2 s-1, respectively).
Reported estimated moisture effective diffusivity of peppers is within the general range of 10-9-10-11. Arslan and Özcan (2011) reported the effective diffusivity (Deff) values of pepper slices for the sun, oven 50 °C, oven 70 °C, microwave 210 W and microwave 700 W drying process of 0.31×10⁻⁹, 0.40×10⁻⁹, 1.31×10⁻⁹, 55.97×10⁻⁹ and 87.39×10⁻⁹m2 s-1, respectively [12]. Scala and Crapiste (2008) reported the diffusion coefficient of pepper in a thin layer cross-flow laboratory scale dryer of 5.01 5.01×10⁻¹⁰ m2 s-1 at 50 °C to 8.32 10−10 m2 s-1 at 70 °C [44]. Kiranoudis et al., (1992) obtained the Deff value of moisture for green pepper as 8.9 10−9 m2 s-1 at a drying temperature of 70 °C [45]. Sanjuán et al., (2003) observed effective diffusion coefficients of 37.23 10-11 m2 s-1 for shredded samples and
18 C. Téllez-Pérez et al/ Procedia Engineering 42 (2012) 1077-1101
4.38 10-11 m2 s-1 at 50 °C for whole peppers [37]. Doymaz and Pala, (2002) reported for red peppers dipped on cold aqueous alkali emulsions of ethyl oleate Deff in the range of 22.5 10−9–27.4 10−9 m2 s-1 [10]. Kaleemullah and Kailappan, (2006) reported an increase on the effective moisture diffusivity from 3.78 to 7.10 10-9 m2 s-1 as drying temperature increase from 50 to 65 °C [46]. Faustino et al., (2007) studied the interval of temperature from 30 °C to 70 °C and obtained the effective diffusivity varied between 9.0 10-10 m2 s-1 at 30 °C and 8.0 10-9 m2 s-1 at 70 °C [47] and Vega et al., (2007) found for red bell pepper at 50 °C a Deff of 3.2 10-9 m2 s-1. The variety of calculated Deff on the studies could be caused by the differences in capsicum varieties, drying equipment and other uncontrolled parameters. As observed the scale values obtained from Deff presented in this study agrees with Scala and Crapiste, (2008) and Faustino et al., (2007) studies, both based on the activation energy and analyzed at the first phase of drying, improved the Deff by increasing the temperature. Compared their results with the obtained of this study, it was found that whereas they improved Deff at first phase, the DIC treatment improved the second phase, showing higher values than reported for the first phase.
Else, obtained results of this study compared to some previous studies of the impact of DIC on the effective diffusivity (Deff) strengthen its positive effect: Setyopratomo et al., (2009) increase the Deff of cassava flour from 1.37 to 3.26 10-10 m2 s-1 (P=0.4 MPa and t=30 s) respect to the conventional drying [23]. Albitar et al., (2001) improved the Deff of onion from 1.02 to 2.09 x 10⁻¹⁰ m2 s-1 (P=0.50 MPa, t=10 s) respect to untreated samples. Pilatowski et al., (2010) and Cong et al., (2009) increased the Deff of paddy rice being the optimum 1.18 10-13 m2 s−1 (P=0.54 MPa, t= 26 s). For the last two studies and for the present one the steam pressure has been the mainly parameter affected the Deff.
Many other researchers have used DIC process coupled to hot air drying. Their various works agreed with these findings, where the treatment also triggers acceleration on the dehydration process of the products [31, 48-49, 51].
4. Conclusions
Different drying techniques were studied in terms of drying kinetics, starting accessibility and water effective diffusivity during drying. Some of physical and functional properties of dried peppers were studied as well, such as rehydration kinetics (capacity and rate), starting accessibility and water effective diffusivity during rehydration and the water holding capacity.
The obtained results show that the Swell drying SD can be used as an alternative technique to dry the foodstuffs with high quality during short time decreasing the costs of the operation. The SD is a flexible process; the operating parameters (saturated steam pressure and thermal holding time) can be optimized to meet the product’s quality attributes and the industrials needs as well.
Acknowledgements
The authors acknowledge the Consejo Nacional de Ciencia y Tecnología (CONACyT–Mexico) and the Programme de Coopération Post-Gradué Franco- Mexicain (PCP) for the financial support given to this research. Also we wish to thank ABCAR-DIC PROCESS SAS (La Rochelle, France) for providing drier equipment and pilot-scale DIC reactor.
References
[1] Iguedjtal T, Louka N, Allaf K. Sorption Isotherms of Granny Smith Apples Hot-Air Dried and Texturized by “Controlled Sudden
Decompression to the Vacuum”. Int J Food Eng 2007;3.
[2] Kristiawan M, Sobolik V, Klíma L, Allaf K. Effect of expansion by instantaneous controlled pressure drop on dielectric properties of fruits
and vegetables. J Food Eng 2011;102:361-8.
[3] Aktas T, Fujii S, Kawano Y, Yamamoto S. Effects of Pretreatments of Sliced Vegetables with Trehalose on Drying Characteristics and
Quality of Dried Products. Food Bioprod Process 2007;85:178-83.
[4] Ratti C. Advances in food dehydration; Taylor & francis books ltd (40); 2008.
[5] Besombes C, Berka-Zougali B, Allaf K. Instant controlled pressure drop extraction of lavandin essential oils: Fundamentals and
experimental studies. J Chromatogr A 2010;1217:6807-15.
[6] Rezzoug SA, Maache-Rezzoug Z, Mazoyer J, Jeannin M, Allaf K. Effect of instantaneous controlled pressure drop process on the hydration
capacity of scleroglucan: optimisation of operating conditions by response surface methodology. Carbohydr Polym 2000;42:73-84.
[7] Schweiggert U, Carle R, Schieber A. Characterization of major and minor capsaicinoids and related compounds in chili pods (Capsicum
frutescens L.) by high-performance liquid chromatography/atmospheric pressure chemical ionization mass spectrometry. Anal Chim Acta
2006;557:236-44.
Tellez-Pérez et al./ Procedia Engineering 00 (2011) 000–000 19
[8] Yaldiz G, Ozguven M, Sekeroglu N. Variation in capsaicin contents of different Capsicum species and lines by varying drying parameters.
Ind Crops Prod 2010;32:434-8.
[9] Bogusz Junior S, de Marchi Tavares de Melo A, Zini CA, Godoy HT. Optimization of the extraction conditions of the volatile compounds
from chili peppers by headspace solid phase micro-extraction. J Chromatogr A 2011;1218:3345-50.
[10] Doymaz I, Pala M. Hot-air drying characteristics of red pepper. J Food Eng 2002;55:331-5.
[11] Kaleemullah S, Kailappan R. Drying Kinetics of Red Chillies in a Rotary Dryer. Biosystems Eng 2005;92:15-23.
[12] Arslan D, Özcan MM. Dehydration of red bell-pepper (Capsicum annuum L.): Change in drying behavior, colour and antioxidant content.
Food Bioprod Process 2011;89:504-13.
[13] Castro SM, Saraiva JA, Lopes-da-Silva JA, Delgadillo I, Loey AV, Smout C et al. Effect of thermal blanching and of high pressure
treatments on sweet green and red bell pepper fruits (Capsicum annuum L.). Food Chem 2008;107:1436-49.
[14] Chuah AM, Lee YC, Yamaguchi T, Takamura H, Yin LJ, Matoba T. Effect of cooking on the antioxidant properties of coloured peppers.
Food Chem 2008;111:20-8.
[15] Collera-Zúñiga O, García Jiménez F, Meléndez Gordillo R. Comparative study of carotenoid composition in three mexican varieties of
Capsicum annuum L. Food Chem 2005;90:109-14.
[16] Kamal IM, Sobolik V, Kristiawan M, Mounir SM, Allaf K. Structure expansion of green coffee beans using instantaneous controlled
pressure drop process. Innovative Food Sci Emerg Technol 2008;9:534-41.
[17] Karathanos VT. Determination of water content of dried fruits by drying kinetics. J Food Eng 1999;39:337-44.
[18] Cunningham SE, McMinn WAM, Magee TRA, Richardson PS. Effect of processing conditions on the water absorption and texture kinetics
of potato. J Food Eng 2008;84:214-23.
[19] Mounir S, Allaf K. Study and modeling of dehydration and rehydration kinetics within porous medium. Association Française de Séchage
pour l'Industrie et l'Agriculture - AFSIA. Lyon, France2009.
[20] Al Haddad M, Mounir SM, Sobolik V, Allaf K. Fruits and Vegetables Drying Combining Hot Air, DIC Technology and Microwaves. Int J
Food Eng 2008;4.
[21] ALLAF K. Transfer phenomena and industrial applications. . Teaching book published by the Lebanese University, Faculty of Science;
1982. p. 135.
[22] Crank J. The mathematics of diffusion; 2ed. Oxford: Clarendon; 1975.
[23] Setyopratomo P, Fatmawati A, Allaf K. Texturing by Instant Controlled Pressure Drop DIC in the Production of Cassava Flour: Impact on
Dehydration Kinetics, Product Physical Properties and Microbial Decontamination. Proceedings of the World Congress on Engineering and
Computer Science. San Francisco, USA2009.
[24] Albitar N, Mounir S, Besombes C, Allaf K. Improving the Drying of Onion Using the Instant Controlled Pressure Drop Technology.
Drying Technol 2011;29:993-1001.
[25] Cong DT, Haddad MA, Rezzoug Z, Lefevre L, Allaf K. Dehydration by Successive Pressure Drops for Drying Paddy Rice Treated by
Instant Controlled Pressure Drop. Drying Technol 2008;26:443-51.
[26] Amor BB, Lamy C, Andre P, Allaf K. Effect of instant controlled pressure drop treatments on the oligosaccharides extractability and
microstructure of Tephrosia purpurea seeds. J Chromatogr A 2008;1213:118-24.
[27] Kim I-K, Abd El-Aty AM, Shin H-C, Lee HB, Kim I-S, Shim J-H. Analysis of volatile compounds in fresh healthy and diseased peppers
(Capsicum annuum L.) using solvent free solid injection coupled with gas chromatography-flame ionization detector and confirmation with mass
spectrometry. J Pharm Biomed Anal 2007;45:487-94.
[28] Condorı M, Echazú R, Saravia L. Solar drying of sweet pepper and garlic using the tunnel greenhouse drier. Renewable Energy
2001;22:447-60
[29] Daood HG, Kapitány J, Biacs P, Albrecht K. Drying temperature, endogenous antioxidants and capsaicinoids affect carotenoid stability in
paprika (red pepper spice). J Sci Food Agric 2006;86:2450-7.
[30] Vieira MGA, Rocha SCS. Mathematical Modeling of Handmade Recycled Papper Drying Kinetics and Sorption Isotherms. Braz J Chem
Eng 2008;25:299-312.
[31] Iguedjtal T, Louka N, Allaf K. Sorption isotherms of potato slices dried and texturized by controlled sudden decompression. J Food Eng
2008;85:180-90.
[32] Vega A, Fito P, Andrés A, Lemus R. Mathematical modeling of hot-air drying kinetics of red bell pepper (var. Lamuyo). J Food Eng
2007;79:1460-6.
[33] Schweiggert U, Mix K, Schieber A, Carle R. An innovative process for the production of spices through immediate thermal treatment of the
plant material. Innovative Food Sci Emerg Technol 2005;6:143-53.
[34] Córdoba, M.G., Hernández, A., Bartolomé, T. “Avances en la autentificación del Pimentón de la Vera”. En: La agricultura y la ganadería
estremeñas.Informe. Facultad de Ciencias Económicas y Empresariales y Escuela de Ingenierías Agrarias; Universidad de Extremadura; Caja de
Badajoz. 2006.
[35] Montalvo-González E, González-Espinoza NG, García-Galindo HS, Tovar-Gómez B, Mata-Montes de Oca M. Efecto del etileno exógeno
sobre la desverdización del chile 'poblano' en poscosecha. Rev Chapingo Serie Hortic 2009;2:189-97.
20 C. Téllez-Pérez et al/ Procedia Engineering 42 (2012) 1077-1101
[36] Condorí M, Echazú R, Saravia L. Solar drying of sweet pepper and garlic using the tunnel greenhouse drier. Renewable Energy
2001;22:447-60.
[37] Sanjuán N, Lozano M, García-Pascual P, Mulet A. Dehydration kinetics of red pepper (Capsicum annuum L var Jaranda). J Sci Food Agric
2003;83:697-701.
[38] Soysal Y, Ayhan Z, Eştürk O, Arıkan MF. Intermittent microwave–convective drying of red pepper: Drying kinetics, physical (colour and
texture) and sensory quality. Biosystems Eng 2009;103:455-63.
[39] Pilatowski I, Mounir S, Haddad J, Cong D, Allaf K. The Instant Controlled Pressure Drop Process as a New Post-harvesting Treatment of
Paddy Rice: Impacts on Drying Kinetics and End Product Attributes. Food Bioprocess Technol 2010;3:901-7.
[40] Cong DT, Mounir S, Pilatowski I, Haddad J, Allaf K. Definition of a new post-harvesting treatment of paddy rice; characterization of final
product. 5th International Technical Symposium on Food Processing, Monitoring Technology in Bioprocesses and Food Quality Management.
Potsdam, Germany2009.
[41] Mounir S, Besombes C, Allaf K. Study, manufacturing, and characterization of expanded granule powder of Apple. Association Française
de Séchage pour l'Industrie et l'Agriculture - AFSIA. Lyon, France2009.
[42] Al Haddad M, Mounir S, Sobolik V, Allaf K. Fruits & vegetables drying combining hot air, DIC technology and microwaves. 5th Asia-
Pacific Drying conference. Hong Kong2007.
[43] Allaf T, Mih I, Mounir S, Lefrancois V, Allaf K. Let’s combine sun and DIC, let’s Sun-DIC-dry. In: Symposium tICT, editor. Toward a
sustainable food chain: Food Process, Bioprocessing and Food Quality Management. Nantes, France2001.
[44] Scala DK, Crapiste G. Drying kinetics and quality changes during drying of red pepper. LWT - Food Sci Technol 2008;41:789-95.
[45] Kiranoudis CT, Maroulis ZB, Marinos-Kouris D. DRYING KINETICS OF ONION AND GREEN PEPPER. Drying Technol 1992;10:995-
1011.
[46] Kaleemullah S, Kailappan R. Modelling of thin-layer drying kinetics of red chillies. J Food Eng 2006;76:531-7.
[47] Faustino JMF, Barroca MJ, Guiné RPF. Study of the Drying Kinetics of Green Bell Pepper and Chemical Characterization. Food Bioprod
Process 2007;85:163-70.
[48] Haddad J, Juhel F, Louka N, Allaf K. A Study of Dehydration of Fish Using Successive Pressure Drops (DDS) and Controlled
Instantaneous Pressure Drop (DIC). Drying Technol: Int J 2004;22:457 - 78.
[49] Mounir S, Albitar N, Allaf K. The instant controlled pressure drop (DIC) technology as a manufacturing process of high quality snacks and
expanded granule powders of onion and super-fruits. 5th International Technical Symposium on Food Processing, Monitoring Technology in
Bioprocesses and Food Quality Management. Potsdam, Germany2009.
[50] Saravacos GD, Kostaropoulos AE. Engineering properties in food processing simulation. Computers & Chemical Engineering
1996;20, Supplement 1:S461-S6.
[51] Louka N, Allaf K. Expansion ratio and color improvement of dried vegetables texturized by a new process “Controlled Sudden
Decompression to the vacuum”: Application to potatoes, carrots and onions. J Food Eng 2004;65:233-43.
98
CHAPTER III-2.
EFFECT OF THE INSTANT CONTROLLED PRESSURE
DROP TREATMENT ON THE ADSORPTION ISOTHERM
OF DRIED MOROCCAN PEPPER (CAPSICUM ANNUM)
Effect of the Instant Controlled Pressure Drop treatment on
the adsorption isotherms of dried Moroccan Pepper (Capsicum
annum)
Téllez-Pérez Carmen a , b , Sobolik Vaclav a , Montejano-Gaitán José Gerardo b , Abdulla
Galal c , and Allaf Karim a
a University of La Rochelle, Intensification of Transfer Phenomena on Industrial Eco -Processes, Laboratory Engineering Science for Environment LaSIE FRE 3474 CNRS,
17042 La Rochelle, France bInstitutoTecnológico de EstudiosSuperiores de Monterrey, Campus Querétaro.
Cátedra de Investigación de Biotecnología Agroalimentaria. Epigmenio González 500, 73160 Santiago de Querétaro, Querétaro, México.
c Zagazig University, Faculty of Agriculture, Department of Food Science, Zagazig, Egypt
Key words: drying, Instant Controlled Pressure Drop, water activity, isotherm modeling, capsicum
Abstract
The impacts Total Hot air Drying (THD) and the Swell-Drying process (which is hot air
drying coupled to Instant Controlled Pressure Drop DIC Process) on the adsorption
isotherm behavior were determined in the case of Moroccan peppers. Experimental data
were obtained by using the gravimetric method at 25, 40 and 50 °C. Data were fitted to
the GAB, Halsey and Oswin models. Studied response parameters were the monolayer
moisture content (Xm), the net isosteric heat of sorption (qst), the specific surface area (s)
and the microstructure. Mean relative percentage deviation (E) and root mean square
(RMS) were used to evaluate the fitting of models.
Results showed that adsorption isotherms followed the type II isotherm curve. The
equilibrium moisture content (Xeq) was depending on the temperature and the drying
method. The GAB and Halsey models fitted well the experimental data. At selected
conditions of the DIC treatment (0.35 MPa and 5 s), the monolayer moisture content (Xm),
the specific surface area (s) and the net isosteric heat of sorption (qst) values where higher
than those of THD samples. Recommended storage conditions of aw were ranged between
0.16 and 0.28 for THD samples and 0.07 to 0.21 for swelled dried samples. This study
showed that DIC process increase the drying kinetics, and lower the aw, thus it improved
the stability and shelf life of products, thanks to its positive impacts on the adsorption
capacities of samples.
Nomenclature
Am area of water molecule (1.06×10⁻¹⁹
m2 )
aw water activity
C: kinetic constant related to the sorption in the first layer (GAB model)
% d.b dry basis (g H2O per g of dry matter)
dm/dt Drying rate: change of mass with the time (kg s-1
)
E Mean relative percentage deviation modulus (%)
k Mass transfer coefficient (kg m-2
s-1
)
K: Kinetic constant related to multilayer sorption (GAB model)
K and a sorption isotherm constants (Halsey and Oswin model)
DHv latent heat of vaporization of pure water (43.53 kJ mol-1
at 308.15 K)
mi moisture content of sample (g H2O per g of dry matter)
mpi predicted value of moisture content (g H2O per g of dry matter)
Mwat molecular weight of H2O (g mol-1
)
N number of experimental data (error equations)
NA Avogadro’s number (6.022 x 10²³ molecules mol
-1)
Pws Water vapor pressure at the surface (Pa)
Pwa Water vapor pressure at the air (Pa)
Pwp Pure water vapor pressure (Pa)
qst net isosteric heat of sorption (kJ mol-1
)
Qst isosteric heat of sorption (kJ mol-1
)
R ideal gas constant (8.314 x 10⁻³
kJ mol-1
K-1
)
RMS root mean square error
S Surface area available for drying (m2)
σ Specific surface area (m2
g-1
)
T sorption temperature (K)
Xeq equilibrium moisture content (g H2O per g of dry matter)
Xm monolayer moisture content (g H2O per g of dry matter) GAB model
I. Introduction
Pepper (genus Capsicum spp.) is an important economic and cultural agricultural crop [1].
It is one of the most consumed worldwide spice crops [2]. It belongs to Solanaceae family
and it includes more than 200 species [3]. Among all the species, C. annuum is one of the
most important and widespread cultivated [4].
Peppers are widely used because of their strong pungency, aroma, color, nutritional value
and for their physiological and pharmaceutical uses [2, 5, 6]. Food industry employs them
widely as coloring and flavoring agents in sauces, soups, processed meats, lunches,
sweetmeats, alcoholic beverages, etc. [3]. Hence, to preserve them, a number of
techniques are applied, being drying one of the most conventional mean.
The process of drying has many advantages: it improves the stability of the products (shelf
life) by the inhibition of the growth of bacteria, yeast and molds and the prevention or at
least retardation of undesirable biochemical reactions [7]. It reduces the volume and
weight of products, thus reducing the storage and transport cost [8]. It is one of the most
cheaper and accessible processes. Nevertheless, during the traditional drying processes,
as sun drying, hot air drying…, two main disadvantages are often observed: the shrinkage
and the thermal degradation of the product [9]. Else, it has been shown that both
phenomena cause physiochemical and biological changes, which affect the sensorial
(texture, taste, flavor and color) and nutritional quality of the products [10-14].
As the main objective of the drying process is to remove a part of water to reach a level at
which microbial spoilage and deterioration reactions are minimized or stopped [15, 16],
the evaluation of the moisture content during the drying process is quite important. Else,
an important factor to characterize the stability of products over storage and during
manufacture is the water activity (aw) [17]. Aw is a thermodynamic characteristic to
describe the water availability in foods [9] and it is defined as the ratio of vapor pressure
of water in a system and the vapor pressure of pure water at the same temperature [18].
The relationship between the equilibrium moisture content (Xeq) and the water activity
(aw) of the food, over a range of values, at a constant temperature and under equilibrium
conditions yields a moisture sorption isotherm [19]. The knowledge of the moisture
sorption characteristics of the products allows to specify the conditions of storage and
packaging, predict the shelf life, and understand the physicochemical changes involved in
product making processes [20].
Therefore, to improve the performances of the hot air drying process and the quality of
dried fruits and vegetables, it has been applied the Swell-drying process [21], which
consists to couple the traditional hot air drying to Instant Controlled Pressure Drop (DIC)
process.
DIC process (French for Détente Instantanée Contrôlée), is based on the thermo-
mechanical effects induced by subjecting the raw material for a short period of time to
pressured saturated steam (about 0.1–0.6 MPa according to the product), followed by an
abrupt pressure drop towards a vacuum (about 5 kPa). This abrupt pressure drop (ΔP/Δt>
0.5MPa/s) triggers simultaneously autovaporization of water, swelling, and possibly
rupture of the cell walls and instantaneous cooling of the products, which stops thermal
degradation [22, 23].
Many studies had shown that thanks to DIC expanded structure, the hot air drying
operation can be intensified. In fact, throughout the studies on swell drying of different
fruits and vegetables [24-27], it has been observed an important increase on the drying
kinetics. These results could prove that the increase of drying kinetics is strictly correlated
with higher effective diffusivity.
Otherwise, some authors suggested to determine the drying kinetics from the aw [28, 29].
On those works, it was remarked that better kinetics were obtained thanks to a higher aw
of the products. This statement is based to the fact that diffusion model between the
exchange surface area and the surrounding medium is the driving force on kinetics. This
relation establishes that drying process is controlled by the difference between the vapor
pressure of water at the surface and at the surrounding air, (equation 1).
)(dm
as PwPwkSdt
-= (1)
Since Pws depends on both temperature and water activity, it has been believed that the
higher the aw values, the better the kinetics.
)( wwaterpures aPwPw = (2)
However the variation of sorption properties closely depends on biological, structural and
chemical variations in foods [30]. Then, the objective of this study was to evaluate the
effect of the Swell-drying process on the thermodynamic water absorption properties of
dried Moroccan peppers and to answer a fundamental question about the effect of water
activity on the drying rate of products.
II. Materials and Methods
2.1 Materials
2.1.1 Chemicals
Potassium Hydroxide (KOH), Potassium carbonate (K2CO3), Sodium Nitrate (NaNO3) and
Potassium Chloride (KCl) were obtained from ACROS Organics. Barium Chloride
dehydrates (BaCl2), Magnesium Chloride anhydrous (MgCl2) and Toluene (C6H5CH3) were
obtained from Sigma Aldrich. Analysis grade chemicals were used.
2.1.2 Sample
Physiologically ripe Green Moroccan Peppers (Capsicum annum) were bought on March
2011, from a popular local market at La Rochelle, France. Products were transported to
the laboratory and stored during 24 h at 5 °C before any treatment.
2.2 Methods
2.2.1 Sample Preparation
Good quality peppers (absence of mold and insect contamination) were manually selected
and washed. From whole washed fruit the peduncles, seeds, capsaicin glands, and
placenta, were eliminated. The Pericarp was manually cut in slices to an average width of
approximately 5.5 mm. Cut peppers were divided in two lots, one for Traditional Hot Air
Drying (THD) and the second for Swell-drying process (SD).
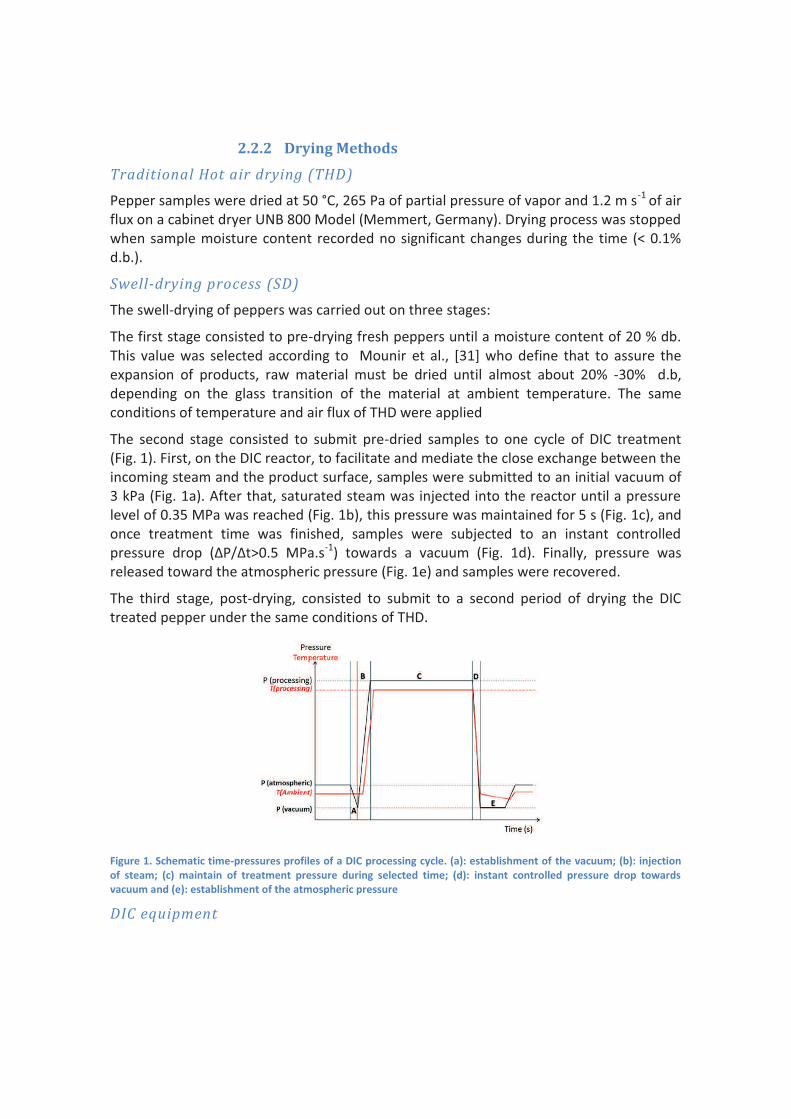
2.2.2 Drying Methods
Traditional Hot air drying (THD)
Pepper samples were dried at 50 °C, 265 Pa of partial pressure of vapor and 1.2 m s-1
of air
flux on a cabinet dryer UNB 800 Model (Memmert, Germany). Drying process was stopped
when sample moisture content recorded no significant changes during the time (< 0.1%
d.b.).
Swell-drying process (SD)
The swell-drying of peppers was carried out on three stages:
The first stage consisted to pre-drying fresh peppers until a moisture content of 20 % db.
This value was selected according to Mounir et al., [31] who define that to assure the
expansion of products, raw material must be dried until almost about 20% -30% d.b,
depending on the glass transition of the material at ambient temperature. The same
conditions of temperature and air flux of THD were applied
The second stage consisted to submit pre-dried samples to one cycle of DIC treatment
(Fig. 1). First, on the DIC reactor, to facilitate and mediate the close exchange between the
incoming steam and the product surface, samples were submitted to an initial vacuum of
3 kPa (Fig. 1a). After that, saturated steam was injected into the reactor until a pressure
level of 0.35 MPa was reached (Fig. 1b), this pressure was maintained for 5 s (Fig. 1c), and
once treatment time was finished, samples were subjected to an instant controlled
pressure drop (ΔP/Δt>0.5 MPa.s-1
) towards a vacuum (Fig. 1d). Finally, pressure was
released toward the atmospheric pressure (Fig. 1e) and samples were recovered.
The third stage, post-drying, consisted to submit to a second period of drying the DIC
treated pepper under the same conditions of THD.
Figure 1. Schematic time-pressures profiles of a DIC processing cycle. (a): establishment of the vacuum; (b): injection
of steam; (c) maintain of treatment pressure during selected time; (d): instant controlled pressure drop towards
vacuum and (e): establishment of the atmospheric pressure
DIC equipment
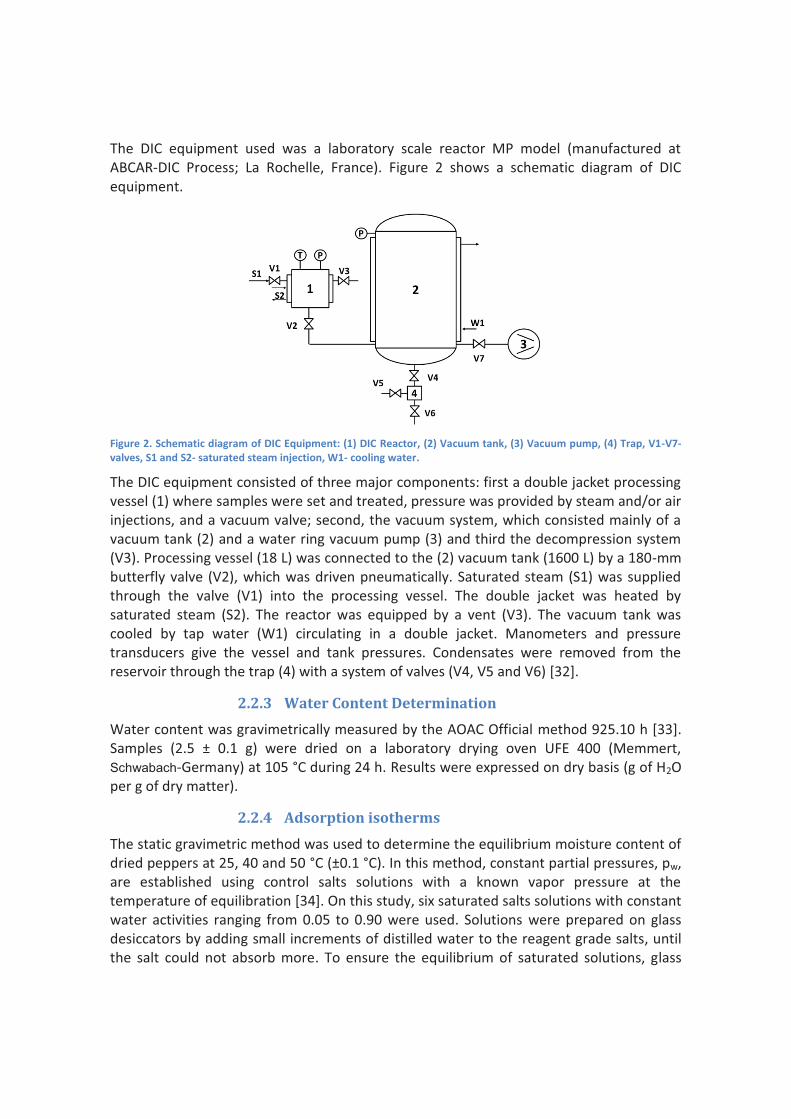
The DIC equipment used was a laboratory scale reactor MP model (manufactured at
ABCAR-DIC Process; La Rochelle, France). Figure 2 shows a schematic diagram of DIC
equipment.
Figure 2. Schematic diagram of DIC Equipment: (1) DIC Reactor, (2) Vacuum tank, (3) Vacuum pump, (4) Trap, V1-V7-
valves, S1 and S2- saturated steam injection, W1- cooling water.
The DIC equipment consisted of three major components: first a double jacket processing
vessel (1) where samples were set and treated, pressure was provided by steam and/or air
injections, and a vacuum valve; second, the vacuum system, which consisted mainly of a
vacuum tank (2) and a water ring vacuum pump (3) and third the decompression system
(V3). Processing vessel (18 L) was connected to the (2) vacuum tank (1600 L) by a 180-mm
butterfly valve (V2), which was driven pneumatically. Saturated steam (S1) was supplied
through the valve (V1) into the processing vessel. The double jacket was heated by
saturated steam (S2). The reactor was equipped by a vent (V3). The vacuum tank was
cooled by tap water (W1) circulating in a double jacket. Manometers and pressure
transducers give the vessel and tank pressures. Condensates were removed from the
reservoir through the trap (4) with a system of valves (V4, V5 and V6) [32].
2.2.3 Water Content Determination
Water content was gravimetrically measured by the AOAC Official method 925.10 h [33].
Samples (2.5 ± 0.1 g) were dried on a laboratory drying oven UFE 400 (Memmert,
Schwabach-Germany) at 105 °C during 24 h. Results were expressed on dry basis (g of H2O
per g of dry matter).
2.2.4 Adsorption isotherms
The static gravimetric method was used to determine the equilibrium moisture content of
dried peppers at 25, 40 and 50 °C (±0.1 °C). In this method, constant partial pressures, pw,
are established using control salts solutions with a known vapor pressure at the
temperature of equilibration [34]. On this study, six saturated salts solutions with constant
water activities ranging from 0.05 to 0.90 were used. Solutions were prepared on glass
desiccators by adding small increments of distilled water to the reagent grade salts, until
the salt could not absorb more. To ensure the equilibrium of saturated solutions, glass
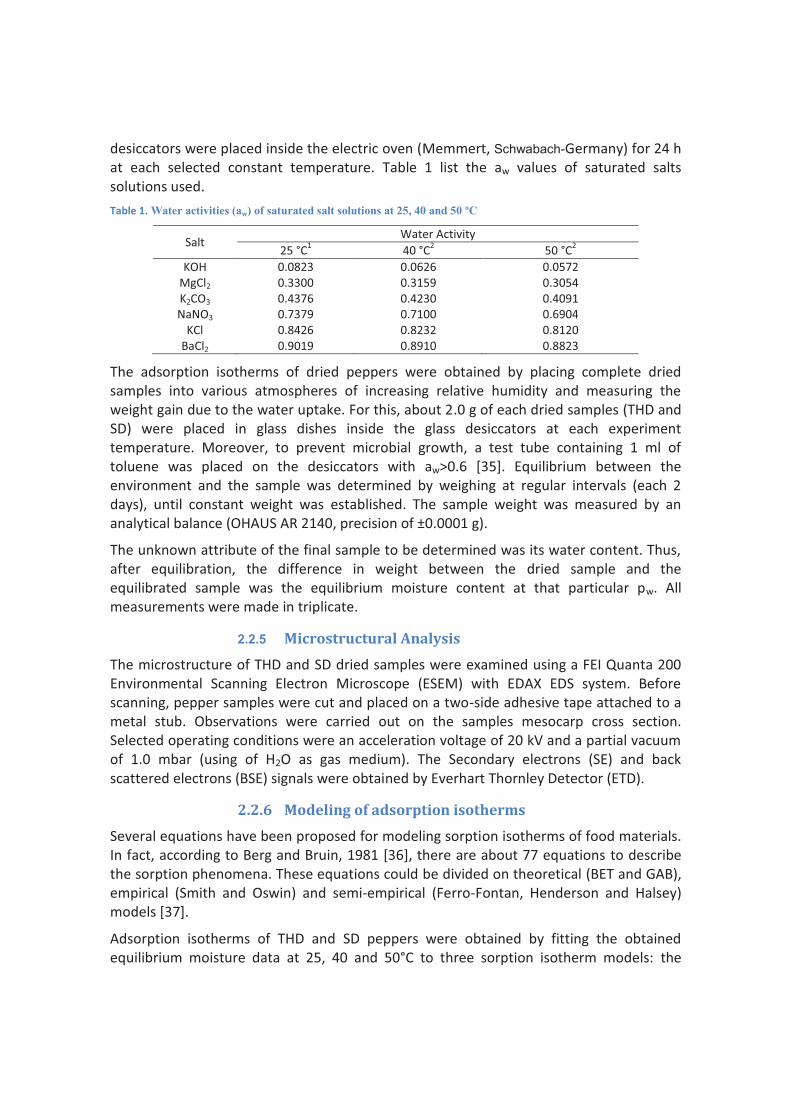
desiccators were placed inside the electric oven (Memmert, Schwabach-Germany) for 24 h
at each selected constant temperature. Table 1 list the aw values of saturated salts
solutions used.
Table 1. Water activities (aw) of saturated salt solutions at 25, 40 and 50 ºC
Salt Water Activity
25 °C1 40 °C
2 50 °C
2
KOH 0.0823 0.0626 0.0572
MgCl2 0.3300 0.3159 0.3054
K2CO3 0.4376 0.4230 0.4091
NaNO3 0.7379 0.7100 0.6904
KCl 0.8426 0.8232 0.8120
BaCl2 0.9019 0.8910 0.8823
The adsorption isotherms of dried peppers were obtained by placing complete dried
samples into various atmospheres of increasing relative humidity and measuring the
weight gain due to the water uptake. For this, about 2.0 g of each dried samples (THD and
SD) were placed in glass dishes inside the glass desiccators at each experiment
temperature. Moreover, to prevent microbial growth, a test tube containing 1 ml of
toluene was placed on the desiccators with aw>0.6 [35]. Equilibrium between the
environment and the sample was determined by weighing at regular intervals (each 2
days), until constant weight was established. The sample weight was measured by an
analytical balance (OHAUS AR 2140, precision of ±0.0001 g).
The unknown attribute of the final sample to be determined was its water content. Thus,
after equilibration, the difference in weight between the dried sample and the
equilibrated sample was the equilibrium moisture content at that particular pw. All
measurements were made in triplicate.
2.2.5 Microstructural Analysis
The microstructure of THD and SD dried samples were examined using a FEI Quanta 200
Environmental Scanning Electron Microscope (ESEM) with EDAX EDS system. Before
scanning, pepper samples were cut and placed on a two-side adhesive tape attached to a
metal stub. Observations were carried out on the samples mesocarp cross section.
Selected operating conditions were an acceleration voltage of 20 kV and a partial vacuum
of 1.0 mbar (using of H2O as gas medium). The Secondary electrons (SE) and back
scattered electrons (BSE) signals were obtained by Everhart Thornley Detector (ETD).
2.2.6 Modeling of adsorption isotherms
Several equations have been proposed for modeling sorption isotherms of food materials.
In fact, according to Berg and Bruin, 1981 [36], there are about 77 equations to describe
the sorption phenomena. These equations could be divided on theoretical (BET and GAB),
empirical (Smith and Oswin) and semi-empirical (Ferro-Fontan, Henderson and Halsey)
models [37].
Adsorption isotherms of THD and SD peppers were obtained by fitting the obtained
equilibrium moisture data at 25, 40 and 50°C to three sorption isotherm models: the
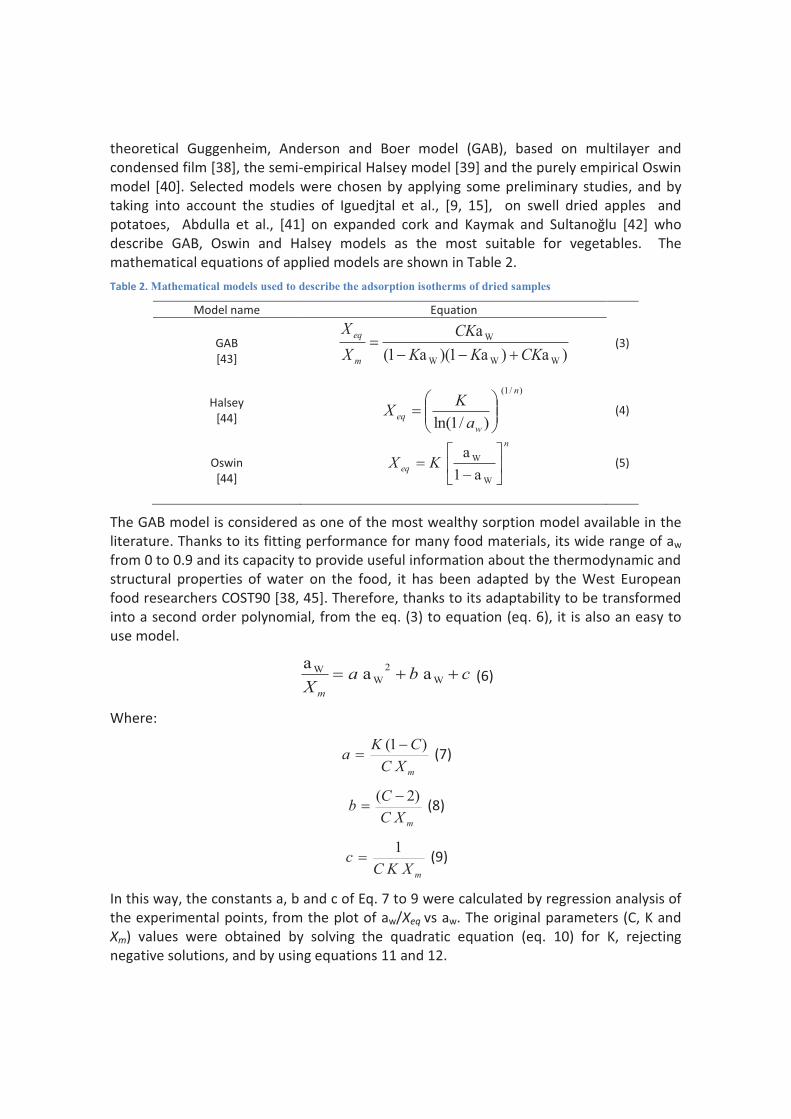
theoretical Guggenheim, Anderson and Boer model (GAB), based on multilayer and
condensed film [38], the semi-empirical Halsey model [39] and the purely empirical Oswin
model [40]. Selected models were chosen by applying some preliminary studies, and by
taking into account the studies of Iguedjtal et al., [9, 15], on swell dried apples and
potatoes, Abdulla et al., [41] on expanded cork and Kaymak and Sultanoğlu [42] who
describe GAB, Oswin and Halsey models as the most suitable for vegetables. The
mathematical equations of applied models are shown in Table 2.
Table 2. Mathematical models used to describe the adsorption isotherms of dried samples
Model name Equation
GAB
[43] )a)a1)(a1(
a
WWW
W
CKKK
CK
X
X
m
eq
+--=
(3)
Halsey
[44]
)/1(
)/1ln(
n
w
eqa
KX ÷÷
ø
öççè
æ= (4)
Oswin
[44]
n
eq KX úû
ùêë
é
-=
W
W
a1
a
(5)
The GAB model is considered as one of the most wealthy sorption model available in the
literature. Thanks to its fitting performance for many food materials, its wide range of aw
from 0 to 0.9 and its capacity to provide useful information about the thermodynamic and
structural properties of water on the food, it has been adapted by the West European
food researchers COST90 [38, 45]. Therefore, thanks to its adaptability to be transformed
into a second order polynomial, from the eq. (3) to equation (eq. 6), it is also an easy to
use model.
cbaX m
++= W
2
WW aa
a (6)
Where:
mXC
CKa
)1( -= (7)
mXC
Cb
)2( -= (8)
mXKCc
1= (9)
In this way, the constants a, b and c of Eq. 7 to 9 were calculated by regression analysis of
the experimental points, from the plot of aw/Xeq vs aw. The original parameters (C, K and
Xm) values were obtained by solving the quadratic equation (eq. 10) for K, rejecting
negative solutions, and by using equations 11 and 12.

aK2 + b K + c = 0 (10)
2+=aK
bC (11)
KabX m 2
1
+= (12)
The GAB equation through the constant K takes into account the modified properties of
the sorbate in multi-layer region and bulk liquid water properties [46]
The original Halsey model based on multilayer condensation [47], has accurately
presented the sorption isotherm of 69 different products [15]. Else, its small number of
parameters and its performance, have made of it one of the most interesting model to be
applied [48]. In this study, to found the parameters of the model, the eq. 4 was
transformed to a linear form: Y= mX + b (eq. 13)
n
K
n
aX w
eq
)ln())ln(ln()ln( +
--= (13)
mn
1-= (14)
nbeK /-= (15)
The constants K and n were calculated by using the eq. 14 and eq. 15, where m is the
slope and b is the interception of the linear regression analysis obtained from the plot of
ln(Xeq) vs ln(-ln(aw)) of the experimental points.
The original Oswin model based on mathematical series expansion for sigmoid-shaped
curves [47], has been considered a versatile model for a wide range of isotherms shapes
and materials [49]. In this study, to found the parameters of the model, the eq. 3 was
transformed to a linear form: Y= mX + b (eq. 14)
)ln(1
ln)ln( Ka
anX
w
weq +÷÷
ø
öççè
æ
-×= (16)
n= m (17)
beK = (18)
The constants K and n were obtained by using the eq. 17 and eq. 18, where m is the slope
and b is the interception of the linear regression analysis obtained from the plot of ln(Xeq)
vs ln(aw/(1-aw)) of the experimental points.
The goodness fitting of models was evaluated by using the mean relative percentage
deviation modulus (E) and the pertinence of models by the root mean square values
(RMS).
å=
-=
N
i i
pii
m
mm
NE
1
1% (19)
2
1
1% å
=÷÷ø
öççè
æ -=
N
i i
pii
m
mm
NRMS (20)
In this study, it was considered that the fit of a model was good enough for practical purposes when E was less than 10% [50]
2.2.7 Calculation of the specific surface area
The specific surface area (σ) was calculated from the monolayer moisture content
estimated by the GAB model using the following equation [51].
m
wat
mAm XM
ANX3530==s (21)
Where σ is the specific surface area (12 -gm ), Xm is the mono-layer moisture content (g
H2O per g of dry matter), Mwat is the molecular weight of water (18 g mol-1
), NA is the
Avogadro’s number (6. 022 x1023 molecules mol-1
) and mA is area of a water molecule
(1.06 x 10⁻¹⁹ m2 molecule
-1).
2.2.8 Determination of isosteric heat of sorption
The change in free energy during moisture exchange between the product and the
surroundings is the energy required to transfer water molecules from the vapor state to a
solid surface or from a solid surface to the vapor state. This is the quantity which can be
considered a measure of work done by the system to accomplish the adsorption or
desorption process. Thermodynamically, these phenomena could be well described by the
net isosteric heat and the heat of sorption. [52]
The net isosteric heat (qst) is defined as the total heat of sorption in the food minus the
heat of vaporization of water, at the system temperature [53]. Based on the
thermodynamic principles, the net isosteric heat of sorption was estimated by using eq.
13, which is derived from Clausius-Clapeyron equation applied to the system and pure
water with the following two assumptions [54-56]: (1) moisture content of the system
remains constant and (2) heat of vaporization of pure water and excess heat of sorption
do not change with temperature.
÷÷ø
öççè
æ--=÷
÷ø
öççè
æ
211W
2W 11
a
aln
TTR
qst (22)
From eq. 13, the stq is the net isosteric heat of sorption (kJ mol-1
), aw is the water activity
(dimensionless), T is the absolute temperature (K) and R is the universal gas constant
(8.314 x 10⁻³
kJ mol-1
K-1
).
In this study, the qst was obtained from the slope ( –qst/ R) of the plot between the ln(aw)
vs 1/T for different constant moisture contents, the qst independence of temperature was
assumed [42, 57]. To study the changes on the net isosteric heat of sorption due to the
changes of moisture content, both variables were plotted. Else, according to Kaleemullah
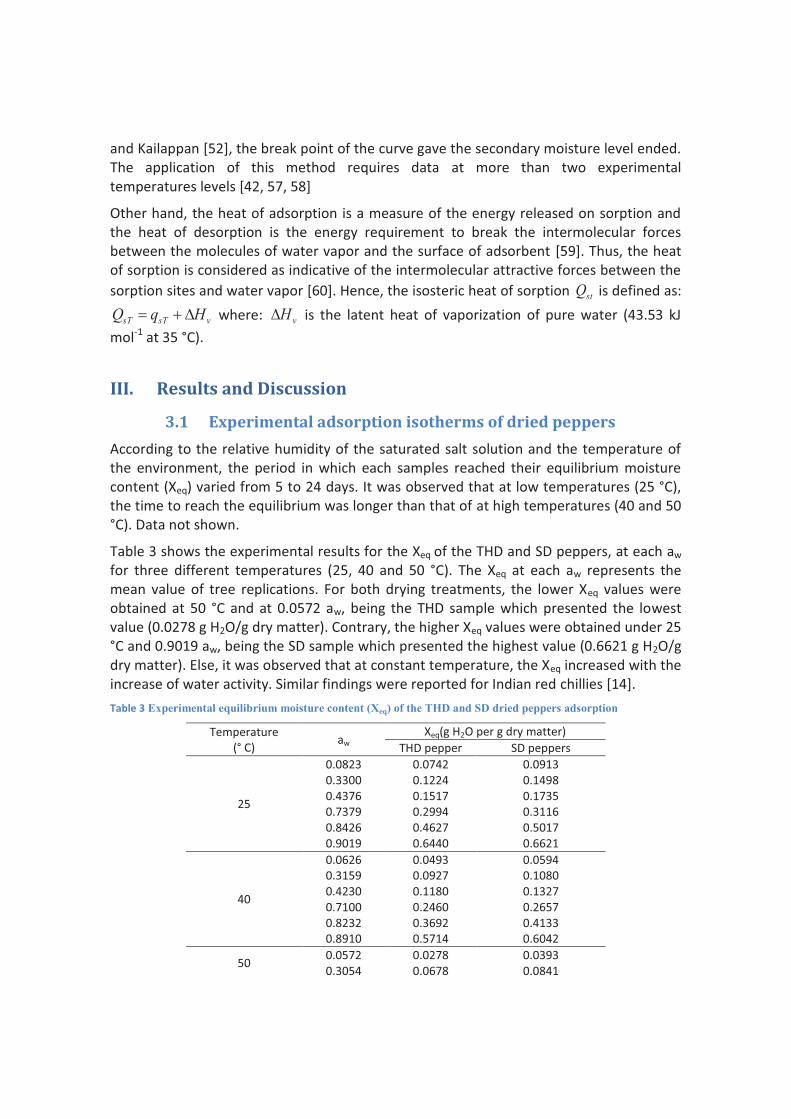
and Kailappan [52], the break point of the curve gave the secondary moisture level ended.
The application of this method requires data at more than two experimental
temperatures levels [42, 57, 58]
Other hand, the heat of adsorption is a measure of the energy released on sorption and
the heat of desorption is the energy requirement to break the intermolecular forces
between the molecules of water vapor and the surface of adsorbent [59]. Thus, the heat
of sorption is considered as indicative of the intermolecular attractive forces between the
sorption sites and water vapor [60]. Hence, the isosteric heat of sorption stQ is defined as:
vsTsT HqQ D+= where: vHD is the latent heat of vaporization of pure water (43.53 kJ
mol-1
at 35 °C).
III. Results and Discussion
3.1 Experimental adsorption isotherms of dried peppers
According to the relative humidity of the saturated salt solution and the temperature of
the environment, the period in which each samples reached their equilibrium moisture
content (Xeq) varied from 5 to 24 days. It was observed that at low temperatures (25 °C),
the time to reach the equilibrium was longer than that of at high temperatures (40 and 50
°C). Data not shown.
Table 3 shows the experimental results for the Xeq of the THD and SD peppers, at each aw
for three different temperatures (25, 40 and 50 °C). The Xeq at each aw represents the
mean value of tree replications. For both drying treatments, the lower Xeq values were
obtained at 50 °C and at 0.0572 aw, being the THD sample which presented the lowest
value (0.0278 g H2O/g dry matter). Contrary, the higher Xeq values were obtained under 25
°C and 0.9019 aw, being the SD sample which presented the highest value (0.6621 g H2O/g
dry matter). Else, it was observed that at constant temperature, the Xeq increased with the
increase of water activity. Similar findings were reported for Indian red chillies [14].
Table 3 Experimental equilibrium moisture content (Xeq) of the THD and SD dried peppers adsorption
Temperature
(° C) aw
Xeq(g H2O per g dry matter)
THD pepper SD peppers
25
0.0823 0.0742 0.0913
0.3300 0.1224 0.1498
0.4376 0.1517 0.1735
0.7379 0.2994 0.3116
0.8426 0.4627 0.5017
0.9019 0.6440 0.6621
40
0.0626 0.0493 0.0594
0.3159 0.0927 0.1080
0.4230 0.1180 0.1327
0.7100 0.2460 0.2657
0.8232 0.3692 0.4133
0.8910 0.5714 0.6042
50 0.0572 0.0278 0.0393
0.3054 0.0678 0.0841
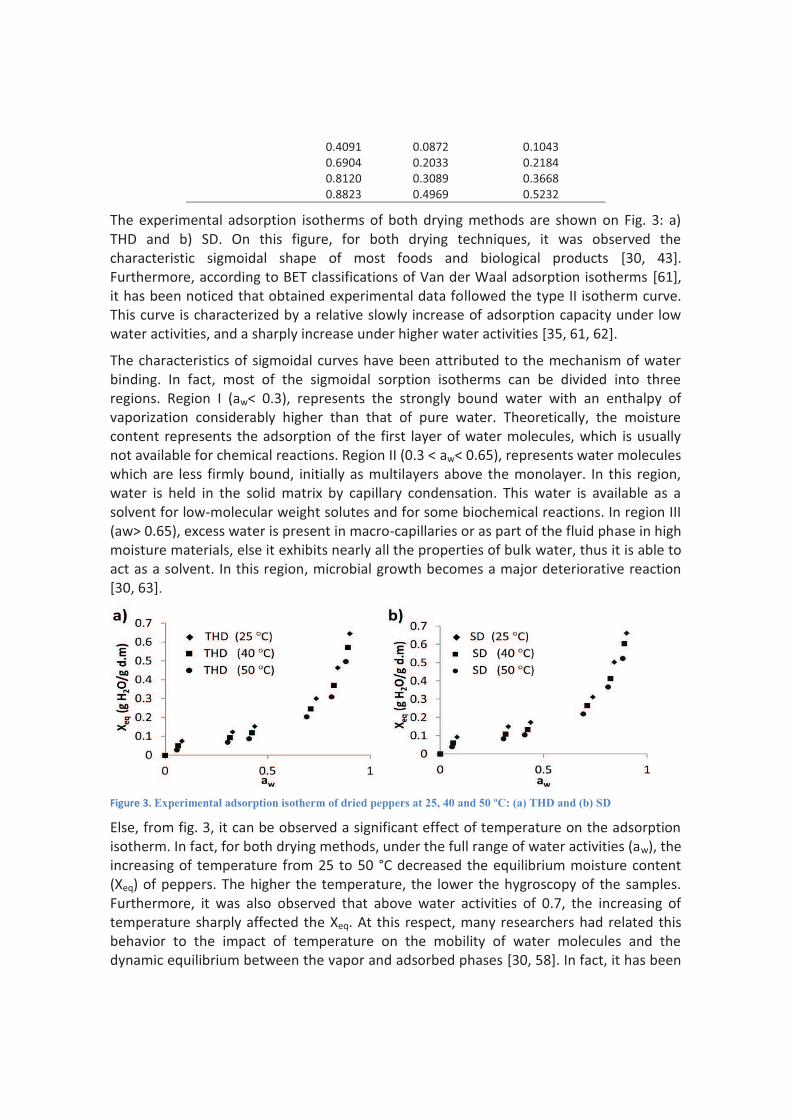
0.4091 0.0872 0.1043
0.6904 0.2033 0.2184
0.8120 0.3089 0.3668
0.8823 0.4969 0.5232
The experimental adsorption isotherms of both drying methods are shown on Fig. 3: a)
THD and b) SD. On this figure, for both drying techniques, it was observed the
characteristic sigmoidal shape of most foods and biological products [30, 43].
Furthermore, according to BET classifications of Van der Waal adsorption isotherms [61],
it has been noticed that obtained experimental data followed the type II isotherm curve.
This curve is characterized by a relative slowly increase of adsorption capacity under low
water activities, and a sharply increase under higher water activities [35, 61, 62].
The characteristics of sigmoidal curves have been attributed to the mechanism of water
binding. In fact, most of the sigmoidal sorption isotherms can be divided into three
regions. Region I (aw< 0.3), represents the strongly bound water with an enthalpy of
vaporization considerably higher than that of pure water. Theoretically, the moisture
content represents the adsorption of the first layer of water molecules, which is usually
not available for chemical reactions. Region II (0.3 < aw< 0.65), represents water molecules
which are less firmly bound, initially as multilayers above the monolayer. In this region,
water is held in the solid matrix by capillary condensation. This water is available as a
solvent for low-molecular weight solutes and for some biochemical reactions. In region III
(aw> 0.65), excess water is present in macro-capillaries or as part of the fluid phase in high
moisture materials, else it exhibits nearly all the properties of bulk water, thus it is able to
act as a solvent. In this region, microbial growth becomes a major deteriorative reaction
[30, 63].
Figure 3. Experimental adsorption isotherm of dried peppers at 25, 40 and 50 ºC: (a) THD and (b) SD
Else, from fig. 3, it can be observed a significant effect of temperature on the adsorption
isotherm. In fact, for both drying methods, under the full range of water activities (aw), the
increasing of temperature from 25 to 50 °C decreased the equilibrium moisture content
(Xeq) of peppers. The higher the temperature, the lower the hygroscopy of the samples.
Furthermore, it was also observed that above water activities of 0.7, the increasing of
temperature sharply affected the Xeq. At this respect, many researchers had related this
behavior to the impact of temperature on the mobility of water molecules and the
dynamic equilibrium between the vapor and adsorbed phases [30, 58]. In fact, it has been

suggested that at higher temperatures some water molecules are activated due to an
increase on their energy levels, causing them to break away from their binding sites, thus
decreasing the equilibrium moisture content [64, 65]. Furthermore, this behavior has
been also linked to the reduction of the total number of active sites for water binding in
the product as a result of physical and/ or chemical changes caused by high temperatures
[66].
The impact of the DIC treatment on peppers at each studied temperature is shown on fig
4. There, it was observed that for all the studied ranges of water activity and temperature
(25 to 40 and 50 °C), the SD samples presented for the same equilibrium moisture content
(Xeq) a lower aw than THD samples (figure 4). Thus, the selected conditions of DIC
treatment increased the higroscopy of products, showing that SD samples were more
stable than THD samples at the same moisture content. This behavior could be explained
by the differences between the samples microstructure.
Figure 4. Equilibrium moisture content of THD and SD dried pepper at 25, 40 and 50 °C and appearance
3.2 Microstructural Analysis
From the scanning electron micrographs of the dried samples (fig. 5), it can be observed
the impact of the different drying treatments on the microstrure of peppers. Figure 5a
showed that the THD samples presented a collapsed structure, which was characterized
by cellular damage, small and few pores and adhesion of adjacent cells. Therefore, the
reduction of the water binding capacity of THD samples during adsorption could be
attributed to the shrinkage of the structure. Similar results were founded on bitter
oranges leaves [67].
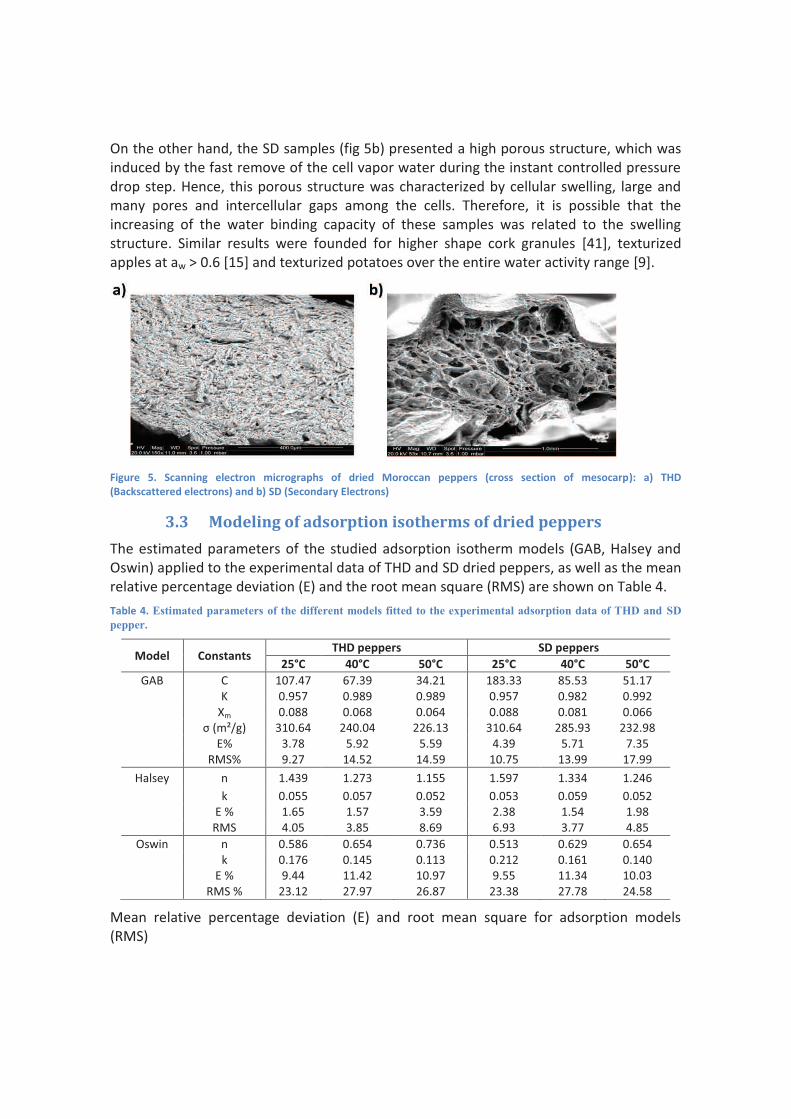
On the other hand, the SD samples (fig 5b) presented a high porous structure, which was
induced by the fast remove of the cell vapor water during the instant controlled pressure
drop step. Hence, this porous structure was characterized by cellular swelling, large and
many pores and intercellular gaps among the cells. Therefore, it is possible that the
increasing of the water binding capacity of these samples was related to the swelling
structure. Similar results were founded for higher shape cork granules [41], texturized
apples at aw > 0.6 [15] and texturized potatoes over the entire water activity range [9].
Figure 5. Scanning electron micrographs of dried Moroccan peppers (cross section of mesocarp): a) THD
(Backscattered electrons) and b) SD (Secondary Electrons)
3.3 Modeling of adsorption isotherms of dried peppers
The estimated parameters of the studied adsorption isotherm models (GAB, Halsey and
Oswin) applied to the experimental data of THD and SD dried peppers, as well as the mean
relative percentage deviation (E) and the root mean square (RMS) are shown on Table 4.
Table 4. Estimated parameters of the different models fitted to the experimental adsorption data of THD and SD
pepper.
Model Constants THD peppers SD peppers
25°C 40°C 50°C 25°C 40°C 50°C
GAB C 107.47 67.39 34.21 183.33 85.53 51.17
K 0.957 0.989 0.989 0.957 0.982 0.992
Xm 0.088 0.068 0.064 0.088 0.081 0.066
σ (m²/g) 310.64 240.04 226.13 310.64 285.93 232.98
E% 3.78 5.92 5.59 4.39 5.71 7.35
RMS% 9.27 14.52 14.59 10.75 13.99 17.99
Halsey n 1.439 1.273 1.155 1.597 1.334 1.246
k 0.055 0.057 0.052 0.053 0.059 0.052
E % 1.65 1.57 3.59 2.38 1.54 1.98
RMS 4.05 3.85 8.69 6.93 3.77 4.85
Oswin n 0.586 0.654 0.736 0.513 0.629 0.654
k 0.176 0.145 0.113 0.212 0.161 0.140
E % 9.44 11.42 10.97 9.55 11.34 10.03
RMS % 23.12 27.97 26.87 23.38 27.78 24.58
Mean relative percentage deviation (E) and root mean square for adsorption models
(RMS)
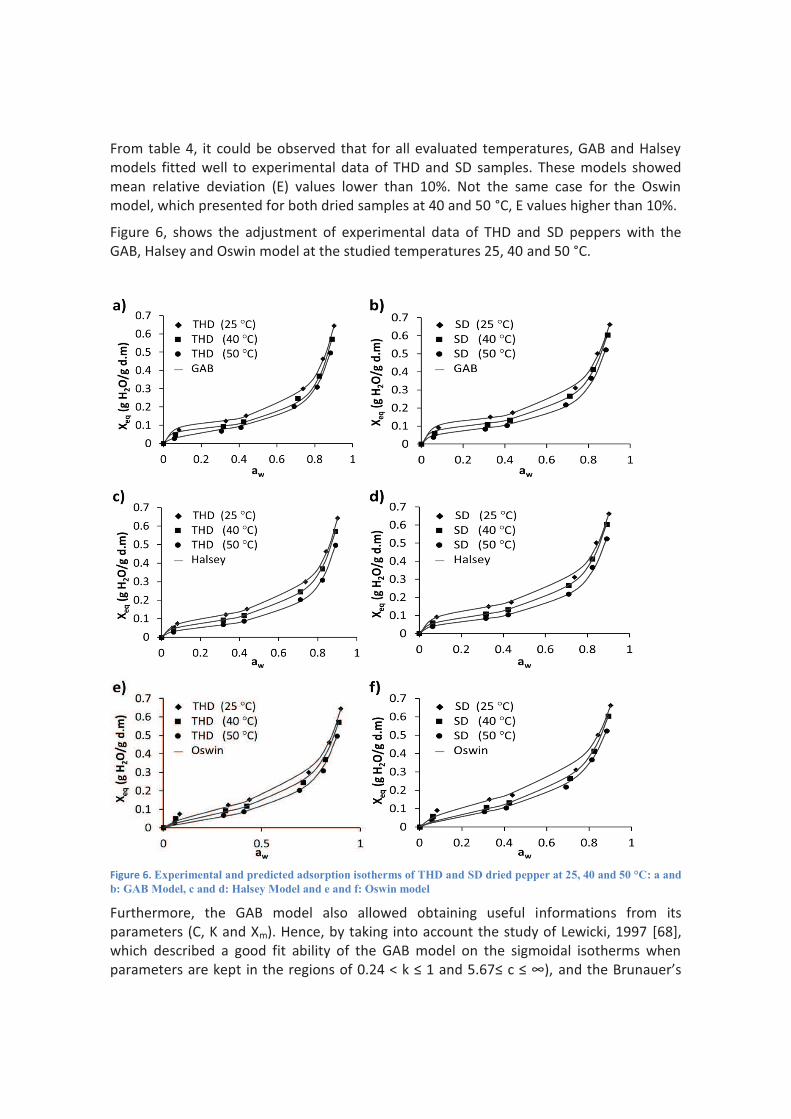
From table 4, it could be observed that for all evaluated temperatures, GAB and Halsey
models fitted well to experimental data of THD and SD samples. These models showed
mean relative deviation (E) values lower than 10%. Not the same case for the Oswin
model, which presented for both dried samples at 40 and 50 °C, E values higher than 10%.
Figure 6, shows the adjustment of experimental data of THD and SD peppers with the
GAB, Halsey and Oswin model at the studied temperatures 25, 40 and 50 °C.
Figure 6. Experimental and predicted adsorption isotherms of THD and SD dried pepper at 25, 40 and 50 °C: a and
b: GAB Model, c and d: Halsey Model and e and f: Oswin model
Furthermore, the GAB model also allowed obtaining useful informations from its
parameters (C, K and Xm). Hence, by taking into account the study of Lewicki, 1997 [68],
which described a good fit ability of the GAB model on the sigmoidal isotherms when
parameters are kept in the regions of 0.24 < k ≤ 1 and 5.67≤ c ≤ ∞), and the Brunauer’s

classification [20], which consider that C values of GAB model > 2, are presented on the
type II isotherm; it is possible to corroborate that all the obtained isotherms corresponded
to the sigmoidal type II, and that the GAB model fitted quite well the experimental data of
peppers.
Moreover, the study of Quirijns et al., 2005 [69], indicates that the C value is a measure of
the strength of water binding to the primary binding sites. In fact, it is defined as the ratio
of the partition function of the first molecule adsorbed on a site and the partition function
of molecules adsorbed beyond the first molecule in the multilayer. Thus, the larger the C,
the stronger the water bound in the monolayer. From table 4, it can be observed that C
values were different for both dried samples, indicating that the monolayer water binding
was quite affected by the drying processes. Similar results were founded by the study of
Rangel et al., which showed that C >1, indicate physical disturbance caused by drying [70].
Furthermore, it was also observed that for all the studied temperatures, the SD samples
presented C values higher than THD samples, showing that the DIC treatment improved
the monolayer water binding.
On the other hand, the obtained K values were nearly constants and equals to 1, which,
according to Quirijns, et al.,2005 [69], means that water molecules beyond the monolayer
are not structured in a multilayer and presented the same characteristics as molecules in
the bulk liquid. Therefore, SD and THD samples showed no distinction between multilayer
and liquid molecules. Similar results were reported for green and red peppers [71].
The monolayer moisture content (Xm) is a measure of the ability of active sites for water
sorption by the material; obtained results of this parameter are shown on section 3.4.
Moreover, by comparing the obtained E and RMS values of the GAB model, it had been
observed a better experimental fit of data at 25 °C than at 40 and 50 °C, indicating a GAB
model dependence on temperature. Similar results were founded for dried mango [70].
Moreover, it was also observed that the GAB model fitted better the experimental data of
THD than those of SD. It is possible that the error of this model on the SD data, was
related to its simplification on the size and shape of the sample porous [72].
The Halsey model showed the best fit of experimental data over the complete range of aw
and temperature. In fact, according to García-Pérez, et al. [48], its reduced number of
parameters simplified the calculation procedure and contributed to obtain more reliable
values. Similar results were founded for green and red peppers [71]. On the other hand, it
had been also observed that for both dried samples, the Halsey model fitted better
experimental data at 40 °C, indicating a possible model dependence on temperature.
The Oswin model for both dried peppers was inaccurate. It is possible that the model only
exhibits suitable predictive ability for certain moisture activity ranges. Poorer fits of Oswin
model were also founded on lemon peel [48], potato slices [9] and dried tomato [73].
Contrary, the study of Kaymak showed a good fit of Oswin model on the isotherms of
green and red peppers [71]. Furthermore, it had been observed that Oswin model fitted
better experimental data at 25 °C than at 40 and 50 °C, indicating also a model
dependence on temperature.
3.4 Monolayer moisture content
The monolayer moisture content (Xm) is a measure of the ability of the free polar surface
sites for water sorption [69, 74]. It represents the water molecules at primary layer that
can interact thermodynamically with other components [44]. The Xm of both studied
samples at the different temperatures, are shown on table 4. There, it can be observed
that the Xm values of green Moroccan peppers ranged from 0.064 to 0.088 g H20 per g dry
matter. Thus, in order to avoid deteriorative reactions on peppers, they should be dried to
their corresponding Xm. Obtained results were in agreement with red and green Turkey
peppers, which exposed Xm values from 0.038 to 0.101 g H2O per g dry matter [71]. No the
same results were presented for red Indian chillies [52], which exposed Xm values from
0.0384 to 0.0668 g H20 per g dry matter. It would be possible that this difference would
related to the variety of peppers and the kind of drying.
On the other hand, it was also observed a slightly increase on the Xm for all the SD samples
compared to the THD samples, to be, at 40 °C, 0.081 instead of 0.068 g H20 per g dry
matter, respectively. These results indicated that the SD samples adsorbed more water at
monolayer than the THD samples. It is possible that this behavior was related to the
increase on the free polar surface sites of SD samples, triggered by the expansion of the
DIC treatment, which provided a more porous structure and no shrinkage. Similar results
were founded on texturized apples [15].
Moreover, it had been considered that a given temperature, the safest water activity level
is that corresponding to Xm or lower [73]. Thus, the safest aw values of the samples were
calculated by using the Halsey model (table 5).
Table 5. Estimated water activity of dried peppers in function of the monolayer moisture content
Parameter THD peppers SD peppers
25°C 40°C 50°C 25°C 40°C 50°C
Xm 0.088 0.068 0.064 0.088 0.081 0.066
aw 0.1626 0.1744 0.2882 0.0765 0.1852 0.2149
As observed on table 5, the safest water activity varied according to the kind of process
and the temperature. Hence, to guarantee the product quality at the studied
temperatures, the recommended storage conditions of aw for both dried samples were on
the range of 0.16 and 0.28 for THD samples and 0.07 to 0.21 for SD samples. Else, under
the same conditions of Xm and temperature, i.e. 0.088 g H2O per g dry matter and 25 °C,
the SD compared to THD presented a lower aw, indicating that the DIC treatment
improved the stability of products, thus their shelf life.
3.5 Specific surface area
The specific water surface (σ) provides information about the solid surfaces that were
reactive under the conditions of the measurement. [75]. On this study, obtained results
(table 4) showed that the range of the specific surface values for both dried samples
varied from 226.13 to 310.64 m2 g
-1. According to the study of Labuza, 1968, these values
are outside the range for food products (100-250 m2 g
-1) [76]; nevertheless, recent studies
showed σ values over this range, i.e dried potatoes showed values from 243.5 to 374.2 m2
g-1 [9].
Furthermore, the specific surface area average of SD samples was higher than that of THD
samples, 276.51 m2g
-1 > 258.93 m
2g
-1. Showing that, the DIC treatment increased the
surface of adsorption, thus the polar sites. These results could be linked to the porous
microstructure of samples, generated by the DIC treatment. Similar results were showed
by dried apples [15].
3.6 Isosteric Heat of sorption
The heat of sorption is considered as an indicative of the intermolecular attractive forces
between the sorption sites and water vapor [30]. In this study, from table 6, it can be
observed that for all the studied range of water activity the net isosteric heat of
adsorption (qst) of dried peppers was ranged between 1.14 and 18.81 kJ mol-1
. These
results indicated that during the adsorption process, the binding energy changed in
function to the different values of water activity. Similar results were obtained on red
chilies, which presented a binding energy range of 0 kJ mol-1
(at Xeq> 53.6% d.b) to 35.62
kJ mol-1
(at Xeq of 1.5 % d.b) [52].
Table 6. Isoteric Heat of sorption of dried peppers
aw at 25°C aw at 50°C
Net isosteric
heat (qst)
(kJmol-1
)
Isosteric heat of
sorption (Qst)
(kJmol-1
)
0.0823 0.0572 18.81 62.34
0.3300 0.3054 4.01 47.54
0.4376 0.4091 3.48 47.01
0.7379 0.6904 3.44 46.97
0.8426 0.8120 1.91 45.44
0.9019 0.8823 1.14 44.67
Figure 7 represents the changes of the net isosteric heat of sorption as a function of the
equilibrium moisture content. From this figure, it can be observed a progressive decrease
on the heat of sorption when the moisture content increase. In fact, as the sorption
isotherms, this figure reflected the three fractions of bound water.
Hence, the first fraction was considered as the region where the higher values of the net
isosteric heat of sorption (qst) were presented. This region indicated that during the initial
stage of adsorption, a higher amount of energy was evolved from the highly active polar
sites on the surface of the food [73]. The initial occupation of these active sites by vapor
water molecules, to form the surface monolayer, set off a sharply decrease of the qst from
18.81 to 4.01 kJ mol-1. This behavior was explained by Iglesias and Chirife (1976), who
exposed that the moisture sorption occurred first on the most active available sites,
causing within the lower moisture content range highest interaction energy levels [77].
Thus, the break point could be considered as the moisture level where water is highly
bound to the highly active polar sites.

The second fraction was considered as the region after the break point. There, it was
observed a slowly decrease of the qst while the moisture content increased. This
phenomenon was related to the gradual filling of the less available sites [35] and to the
formation of the multilayer moisture content. Furthermore, it has been considered that
the level of moisture content at which the net isosteric heat of sorption approaches the
latent heat of vaporization of water (when qst approach to zero) is as an indication of the
amount of bound water existing in the food [71]. Thus, for both dried peppers the bound
water existed approximately at 0.66 g H2O per g dry matter at 25 °C, 0.60 g H2O per g dry
matter at 40 °C and 0.5 g H2O per g dry matter at 50 °C, being observed that the higher
temperature the lower the bound water. Similar results were obtained by red chillies,
which presented a bound water limited to a moisture content of 0.53 g H2O per g dry
matter [52]
The third fraction was considered as the region beyond the bound water. At this point,
there was no more influence of the food polar sites and water molecules. Thus water
molecules were bound the ones to the others [78].
Figure 7. Net isosteric heat of sorption of dried peppers as a function of the equilibrium moisture content: (a) THD
and (b) SD.
Figure 8 shows the impact of the different drying process on the qst. There, it can be
observed that under the same values of qst, the SD samples presented a higher Xeq. These
results corroborated that DIC treatment increased the hygroscopic properties, possibly
due to the increase of the number of sorption sites caused by the swelling.
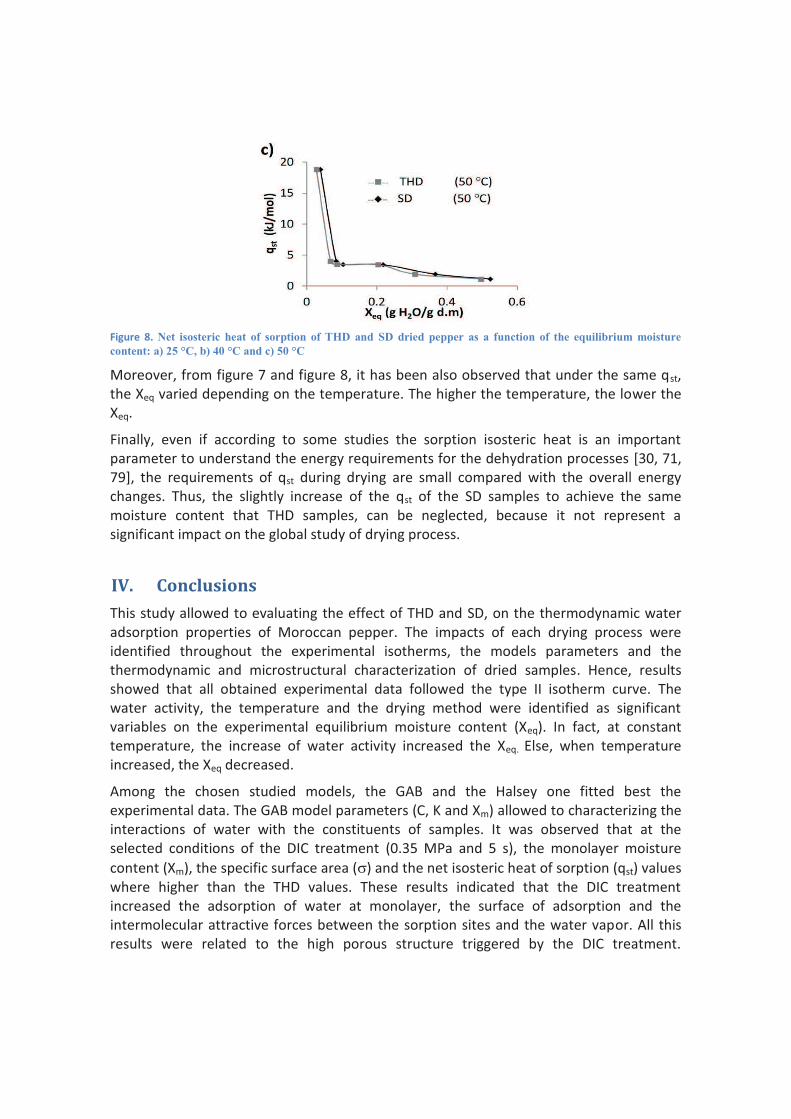
Figure 8. Net isosteric heat of sorption of THD and SD dried pepper as a function of the equilibrium moisture
content: a) 25 °C, b) 40 °C and c) 50 °C
Moreover, from figure 7 and figure 8, it has been also observed that under the same qst,
the Xeq varied depending on the temperature. The higher the temperature, the lower the
Xeq.
Finally, even if according to some studies the sorption isosteric heat is an important
parameter to understand the energy requirements for the dehydration processes [30, 71,
79], the requirements of qst during drying are small compared with the overall energy
changes. Thus, the slightly increase of the qst of the SD samples to achieve the same
moisture content that THD samples, can be neglected, because it not represent a
significant impact on the global study of drying process.
IV. Conclusions
This study allowed to evaluating the effect of THD and SD, on the thermodynamic water
adsorption properties of Moroccan pepper. The impacts of each drying process were
identified throughout the experimental isotherms, the models parameters and the
thermodynamic and microstructural characterization of dried samples. Hence, results
showed that all obtained experimental data followed the type II isotherm curve. The
water activity, the temperature and the drying method were identified as significant
variables on the experimental equilibrium moisture content (Xeq). In fact, at constant
temperature, the increase of water activity increased the Xeq. Else, when temperature
increased, the Xeq decreased.
Among the chosen studied models, the GAB and the Halsey one fitted best the
experimental data. The GAB model parameters (C, K and Xm) allowed to characterizing the
interactions of water with the constituents of samples. It was observed that at the
selected conditions of the DIC treatment (0.35 MPa and 5 s), the monolayer moisture
content (Xm), the specific surface area (s) and the net isosteric heat of sorption (qst) values
where higher than the THD values. These results indicated that the DIC treatment
increased the adsorption of water at monolayer, the surface of adsorption and the
intermolecular attractive forces between the sorption sites and the water vapor. All this
results were related to the high porous structure triggered by the DIC treatment.
Recommended storage conditions of aw for both dried samples were on the range of 0.16
and 0.28 for THD samples and 0.07 to 0.21 for SD samples
In summarize it can be emphasized that on a drying operation study, is quite important to
differentiate the kinetics and thermodynamics effects. Thus, while the Swell-drying
intensifies the drying kinetics, it improves the stability of the products. Thanks to its
possibility to improve the adsorption capacities of samples, mainly reflected on a low aw
and a high specific surface area, shelf life could be much higher.
V. ACKNOWLEDGEMENTS
The authors acknowledge the Consejo Nacional de Ciencia y Tecnología (CONACyT–
Mexico) and the Programme de Coopération Post-Gradué Franco- Mexicain (PCP) for the
financial support given to this research. Also we wish to thank ABCAR-DIC PROCESS SAS
(La Rochelle, France) for providing drier equipment and pilot-scale DIC reactor.
VI. REFERENCES
1. Serrano-Martínez, A., et al., Kinetic characterisation and thermal inactivation study of partially purified red pepper (Capsicum annuum L.) peroxidase. Food Chemistry, 2008. 107(1): p. 193-199.
2. Yaldiz, G., M. Ozguven, and N. Sekeroglu, Variation in capsaicin contents of different Capsicum species and lines by varying
drying parameters. Industrial Crops and Products, 2010. 32(3): p. 434-438.
3. Bogusz Junior, S., et al., Optimization of the extraction conditions of the volatile compounds from chili peppers by headspace
solid phase micro-extraction. Journal of Chromatography A, 2011. 1218(21): p. 3345-3350.
4. Pickersgill, B., Peppers and Chillies, in Encyclopedia of Food Sciences and Nutrition, C. Benjamin, Editor 2003, Academic Press: Oxford. p. 4460-4467.
5. Schweiggert, U., R. Carle, and A. Schieber, Characterization of major and minor capsaicinoids and related compounds in
chili pods (Capsicum frutescens L.) by high-performance liquid chromatography/atmospheric pressure chemical ionization mass spectrometry. Analytica Chimica Acta, 2006. 557(1-2): p. 236-244.
6. Cisneros-Pineda, O., et al., Capsaicinoids quantification in chili peppers cultivated in the state of Yucatan, Mexico. Food Chemistry, 2007. 104(4): p. 1755-1760.
7. Geankoplis, C.J., Transport process and unit operations. Third ed, ed. Prentice-Hall1993.
8. Aktas, T., et al., Effects of Pretreatments of Sliced Vegetables with Trehalose on Drying Characteristics and Quality of Dried
Products. Food and Bioproducts Processing, 2007. 85(3): p. 178-183.
9. Iguedjtal, T., N. Louka, and K. Allaf, Sorption isotherms of potato slices dried and texturized by controlled sudden
decompression. Journal of Food Engineering, 2008. 85(2): p. 180-190.
10. Veillet, S., J. Busch, and G. Savage, Acceptability and antioxidant properties of a semi-dried and smoked tomato product. Journal of Food Agriculture & Environment, 2009. 7(2): p. 70-75.
11. Ratti, C., et al., Drying of Garlic (Allium sativum) and Its Effect on Allicin Retention. Drying Technology, 2007. 25(2): p. 349-356.
12. Doymaz, I. and M. Pala, Hot-air drying characteristics of red pepper. Journal of Food Engineering, 2002. 55(4): p. 331-335.
13. Kaleemullah, S. and R. Kailappan, Drying Kinetics of Red Chillies in a Rotary Dryer. Biosystems Engineering, 2005. 92(1): p. 15-23.
14. Kaleemullah, S. and R. Kailappan, Moisture Sorption Isotherms of Red Chillies. Biosystems Engineering, 2004. 88(1): p. 95-104.
15. Iguedjtal, T., N. Louka, and K. Allaf, Sorption Isotherms of Granny Smith Apples Hot-Air Dried and Texturized by “Controlled Sudden Decompression to the Vacuum”. International Journal of Food Engineering, 2007. 3(5).
16. Kristiawan, M., et al., Effect of expansion by instantaneous controlled pressure drop on dielectric properties of fruits and
vegetables. Journal of Food Engineering, 2011. 102(4): p. 361-368.
17. Severini, C., et al., Use of humectants for the stabilization of pesto sauce. International Journal of Food Science & Technology, 2008. 43(6): p. 1041-1046.
18. Rahman, M.S., Handbook of Food Preservation. Food Science and Technology2007, Florida: CRC Press
19. Arslan, N. and H. Togrul, The fitting of various models to water sorption isotherms of tea stored in a chamber under
controlled temperature and humidity. Journal of Stored Products Research, 2006. 42(2): p. 112-135.
20. Farahnaky, A., S. Ansari, and M. Majzoobi, Effect of glycerol on the moisture sorption isotherms of figs. Journal of Food Engineering, 2009. 93(4): p. 468-473.
21. Mounir, S., et al., Swell Drying: Coupling Instant Controlled Pressure Drop DIC to Standard Convection Drying Processes to
Intensify Transfer Phenomena and Improve Quality—An Overview. Drying Technology, 2012. 30(14): p. 1508-1531.
22. Rezzoug, S.A., et al., Effect of instantaneous controlled pressure drop process on the hydration capacity of scleroglucan:
optimisation of operating conditions by response surface methodology. Carbohydrate Polymers, 2000. 42(1): p. 73-84.
23. Amor, B.B., et al., Effect of instant controlled pressure drop treatments on the oligosaccharides extractability and microstructure of Tephrosia purpurea seeds. Journal of Chromatography A, 2008. 1213(2): p. 118-124.
24. Al Haddad, M., et al., Fruits and Vegetables Drying Combining Hot Air, DIC Technology and Microwaves. International Journal of Food Engineering, 2008. 4(6).
25. Maritza, A.M., et al., Comparative Study of Various Drying Processes at Physical and Chemical Properties of Strawberries
(Fragariavarcamarosa). Procedia Engineering, 2012. 42(0): p. 297-312.
26. Albitar, N., et al., Improving the Drying of Onion Using the Instant Controlled Pressure Drop Technology. Drying Technology, 2011. 29(9): p. 993-1001.
27. Téllez-Pérez, C., et al., Impact of Instant Controlled Pressure Drop Treatment on Dehydration and Rehydration Kinetics of
Green Moroccan Pepper (Capsicum Annuum). Procedia Engineering, 2012. 42(0): p. 1077-1101.
28. Barcenas, M.E., et al., Modeling of mango drying kinetics: effect of initial water activity aw), temperature and rate of the
drying air, and load density, in IFT Annual Meeting 1999, IFT, Editor 1999: Chicago.
29. Calzetta Resio, A., R.J. Aguerre, and C. Suarez, THE DRYING OF AMARANTH GRAIN: MATHEMATICAL MODELING AND SIMULATION. Brazilian Journal of Chemical Engineering, 2005. 22(02): p. 303-309.
30. Al-Muhtaseb, A.H., W.A.M. McMinn, and T.R.A. Magee, Moisture Sorption Isotherm Characteristics of Food Products: A
Review. Food and Bioproducts Processing, 2002. 80(2): p. 118-128.
31. Mounir, S., et al., Study of Instant Controlled Pressure Drop DIC Treatment in Manufacturing Snack and Expanded Granule
Powder of Apple and Onion. Drying Technology, 2011. 29(3): p. 331-341.
32. Kamal, I.M., et al., Structure expansion of green coffee beans using instantaneous controlled pressure drop process. Innovative Food Science & Emerging Technologies, 2008. 9(4): p. 534-541.
33. AOAC, Official methods of analysis of AOAC (Association of Official Analytical Chemists) International (CD-ROM), 1996, AOAC International: Gaithersburg, MD.
34. Barbosa-Cánovas, G.V., et al., Water Activity in Foods: Fundamentals and Applications, ed. I. Press2008: Blackwell Publishing Ltd.
35. Al-Muhtaseb, A.a.H., et al., Moisture adsorption isotherms of microwave-baked Madeira cake. LWT - Food Science and Technology, 2010. 43(7): p. 1042-1049.
36. Berg, C.v.d. and S. Bruin, Water activity and its estimation in food systems: theoretical aspects, in Water activity: Influences
on food quality, L.B.Rockland and G.F.Stewart eds., Academic Press, New York, 1981, 2-611981.
37. Peng, G., et al., Modeling of water sorption isotherm for corn starch. Journal of Food Engineering, 2007. 80(2): p. 562-567.
38. Van den Berg, C. and S. Bruin, Water activity and its estimation in food systems, in Water activity: Influence on Food Quality, L.B. Rockland and F.G. Stewart, Editors. 1981, Academic Press New York. p. 147-177.
39. Halsey, G., Physical Adsorption on Non Uniform Surfaces Journal of Chemical Physics, 1948. 16(10): p. 931–937.
40. Oswin, C.R., The kinetics of package life. III. The isotherm. Journal of the Society of Chemical Industry, 1946. 65(12): p. 419-421.
41. Abdulla, G., A. Belghit, and K. Allaf, Impact of Instant Controlled Pressure Drop Treatment on Moisture Adsorption Isotherm of Cork Granules. Drying Technology, 2009. 27(2): p. 237-247.
42. Kaymak-Ertekin, F. and M. Sultanoğlu, Moisture sorption isotherm characteristics of peppers. Journal of Food Engineering, 2001. 47(3): p. 225-231.
43. Cassini, A.S., L.D.F. Marczak, and C.P.Z. Noreña, Water adsorption isotherms of texturized soy protein. Journal of Food Engineering, 2006. 77(1): p. 194-199.
44. Lemus, R.A., et al., Kinetic study of dehydration and desorption isotherms of red alga Gracilaria. LWT - Food Science and Technology, 2008. 41(9): p. 1592-1599.
45. Bizot, H., Using the GAB model to construct sorption isotherms, in Physical Properties of Foods, R. Jowitt, et al., Editors. 1983, Applied Science Publishers: London. p. 43-54.
46. Sablani, S.S., et al., Sorption isotherms and the state diagram for evaluating stability criteria of abalone. Food Research International, 2004. 37(10): p. 915-924.
47. Pahlevanzadeh, H. and M. Yazdani, MOISTURE ADSORPTION ISOTHERMS AND ISOSTERIC ENERGY FOR ALMOND. Journal of Food Process Engineering, 2005. 28(4): p. 331-345.
48. García-Pérez, J.V., et al., Water sorption isotherms for lemon peel at different temperatures and isosteric heats. LWT - Food Science and Technology, 2008. 41(1): p. 18-25.
49. Chirife, J. and H.A. Iglesias, Equations for fitting water sorption isotherms of foods: Part 1 — a review. International Journal of Food Science & Technology, 1978. 13(3): p. 159-174.
50. Aguerre, R.J., C. Suarez, and P.E. Viollaz, New BET type multilayer sorption isotherms. Part II: Modelling water sorption in
foods. LWT - Food Science and Technology, 1989. 22(4): p. 192-195.
51. Gregg, S.J. and K.S.W. Sing, Adsorption, surface area, and porosity. Second ed1982, London; New York: Academic Press.
52. Kaleemullah, S. and R. Kailappan, Monolayer moisture, free energy change and fractionation of bound water of red chillies. Journal of Stored Products Research, 2007. 43(2): p. 104-110.
53. Tsami, E., et al., Heat of sorption of water in dried fruits. International Journal of Food Science & Technology, 1990. 25(3): p. 350-359.
54. Iglesias, H.A. and J. Chirife, Isosteric heats of water vapor sorption on dehydrated foods. Part II. Hysteresis and heat of sorption comparison with B.E.T. theory. Lebensmittel-Wissenschaft und Technologie 1976. 9: p. 123-127.
55. Rizvi, S.S.H., Thermodynamic properties of foods in dehydration, in Engineering Properties of Foods, M.A. Rao and S.S.H. Rizvi, Editors. 1986, Marcel Dekker Inc: New York, USA. p. 223–309.
56. Basu, S., U.S. Shivhare, and A.S. Mujumdar, Models for sorption isotherms for foods: A review. Drying Technology, 2006. 24(8): p. 917-930.
57. Tsami, E., Net isosteric heat of sorption in dried fruits. Journal of Food Engineering, 1991. 14(4): p. 327-335.
58. Bahloul, N., N. Boudhrioua, and N. Kechaou, Moisture desorption–adsorption isotherms and isosteric heats of sorption of
Tunisian olive leaves (Olea europaea L.). Industrial Crops and Products, 2008. 28(2): p. 162-176.
59. Rao, M.A. and S.S.H. Rizvi, Engineering Properties of Foods1995, New York, USA: Marcel Dekker Inc.
60. Wang, N. and J.G. Brennan, Moisture sorption isotherm characteristics of potatoes at four temperatures. Journal of Food Engineering, 1991. 14(4): p. 269-287.
61. Brunauer, S., et al., On a Theory of the van der Waals Adsorption of Gases. Journal of the American Chemical Society, 1940. 62(7): p. 1723-1732.
62. Lee, J.H. and M.J. Lee, Effect of drying method on the moisture sorption isotherms for Inonotus obliquus mushroom. LWT - Food Science and Technology, 2008. 41(8): p. 1478-1484.
63. Agnieszka, C. and L. Andrzej, Rehydration and sorption properties of osmotically pretreated freeze-dried strawberries. Journal of Food Engineering, 2010. 97(2): p. 267-274.
64. Chowdhury, M.M.I., et al., Moisture sorption isotherms for mungbean (Vigna radiata L). Journal of Food Engineering, 2006. 74(4): p. 462-467.
65. Palipane, K.B. and R.H. Driscoll, Moisture sorption characteristics of in-shell macadamia nuts. Journal of Food Engineering, 1993. 18(1): p. 63-76.
66. Mazza, G. and M. Lemaguer, Dehydration of onion: some theoretical and practical considerations. International Journal of Food Science & Technology, 1980. 15(2): p. 181-194.
67. Mohamed, A., et al., Moisture sorption isotherms and heat of sorption of bitter orange leaves (Citrus aurantium). Journal of Food Engineering, 2005. 67(4): p. 491-498.
68. Lewicki, P.P., The applicability of the GAB model to food water sorption isotherms. International Journal of Food Science & Technology, 1997. 32(6): p. 553-557.
69. Quirijns, E.J., et al., Sorption isotherms, GAB parameters and isosteric heat of sorption. Journal of the Science of Food and Agriculture, 2005. 85(11): p. 1805-1814.
70. Rangel-Marrón, M., et al., Sorption isotherms of mango (Mangifera Indica L.) pulp freeze-dried, in Proceedings of the
European conference of chemical engineering, and European conference of civil engineering, and European conference of
mechanical engineering, and European conference on Control2010, World Scientific and Engineering Academy and Society (WSEAS): Tenerife, Spain. p. 114-118.
71. Kaymak-Ertekin, F. and M. Sultanoglu, Moisture sorption isotherm characteristics of peppers. Journal of Food Engineering, 2001. 47(3): p. 225-231.
72. Brunauer, S., R.S. Mikhail, and E.E. Bodor, Pore structure analysis without a pore shape model. Journal of Colloid and Interface Science, 1967. 24(4): p. 451-463.
73. Goula, A.M., et al., Water sorption isotherms and glass transition temperature of spray dried tomato pulp. Journal of Food Engineering, 2008. 85(1): p. 73-83.
74. Chung, D.S. and H.B. Pfost, Adsorption and desorption of water vapour by cereal grains and their products. Part 1. Heat and
free energy changes of adsorption and desorption. Transaction of the ASAE, 1967. 10.
75. Sokolowska, Z., J. Jamroz, and P. Banka, Apparent surface area of selected meal extrudates. International Agrophysics, 2008. 22(1): p. 75-80.
76. Labuza, T.P., Sorption phenomena in foods. Food Technology II, 1968. 22: p. 263–272.
77. Iglesias, H.A. and J. Chirife, A MODEL FOR DESCRIBING THE WATER SORPTION BEHAVIOR OF FOODS. Journal of Food Science, 1976. 41(5): p. 984-992.
78. Poyet, S. and S. Charles, Temperature dependence of the sorption isotherms of cement-based materials: Heat of sorption and Clausius–Clapeyron formula. Cement and Concrete Research, 2009. 39(11): p. 1060-1067.
79. Cortés, F.B. and F. Chejne, A rapid and novel approach for predicting water sorption isotherms and isosteric heats of
different meat types. Meat Science, 2010. 86(4): p. 921-925.
123
CHAPTER III-3.
EFFECT OF THE INSTANT CONTROLLED PRESSURE
DROP TREATMENT ON THE ANTIOXIDANT ACTIVITY
OF MOROCCAN AND POBLANO PEPPER

124
Food and Nutrition Sciences, 2013, 4, ***-***
Published Online March 2013 (http://www.scirp.org/journal/fns)
Effect of Instant Controlled Pressure Drop Process
Coupled to Drying and Freezing on Antioxidant Activity of
Green “Poblano” Pepper (Capsicum annuum L.)
Carmen Téllez-Pérez1,3
, Anaberta Cardador-Martínez1, Sabah Mounir
2,
José Gerardo Montejano-Gaitán1, Vaclav Sobolik
3, Karim Allaf
3*
1Tecnológico de Monterrey-Escuela en Ingeniería, Biotecnología y Agronomía, Querétaro, México; 2Department of Food Science, Faculty of Agriculture, Zagazig University, Zagazig, Egypt; 3LaSIE FRE 3474 CNRS, Laboratory Engineering Science for Environ-ment, University of La Rochelle, La Rochelle, France. Email: *[email protected] Received *************** 2013
ABSTRACT
Different food operations have been intensified through assisting them by instant controlled pressure drop DIC treat-ment. Such processes should be defined in order to preserve the main nutritional and sensorial contents of the raw mate-rial. The present paper is dedicated to study the evolution of the main bioactive compounds (total phenolics and flavon-oids) and functional properties such as the antioxidant activity of processed samples in the case of Green “Poblano” Pepper (Capsicum annuum L.). Results issued from DIC-assisted hot air drying, and DIC-assisted freezing, allowed to identifying the impact of DIC studied operating parameters, which were the saturated steam pressure and the processing time, and the best DIC treatment correlated with the considered operation. Keywords: Instant Controlled Pressure Drop; Capsicum; Phenols; Flavonoids; Antioxidant Activity; Drying; Freezing
1. Introduction
Pepper is derived from a Greek word originally used for black and white pepper, but subsequently applied to gen-era belonging to seven different families, all of which have pungent fruits or seeds. “Chilli” comes from one of the indigenous languages of Mexico, where Capsicum has been consumed for more than 5000 years. The bell peppers, paprikas and pimientos, together with most of the Mexican chillies, are all included in C. annuum. This is now the most widespread and economically important cultivated species of all the Capsicum [1].
The pepper (Capsicum annuum, L.) is highly appreci-ated for its flavor, color, pungency, taste, aroma, and for its physiological and pharmaceutical uses [2]. Pepper is an excellent source of phytochemicals and essential nu-trients such as ascorbic acid, capsaicinoids, flavonoids, phenolic compounds, carotenoids, etc. [3]. Recent re-searches have shown that dietary capsaicin is effective in reducing oxidant stress, rheumatism, arthritis, neuralgia, lumbago, cancer and diabetes among other diseases [4-6]. Hence, it is very important to study food processing techniques in terms of their ability to preserve the natural bioactive molecules of pepper.
Thermal treatments of a food systematically induce physical changes and chemical reactions, which in turn affect its sensory characteristics and nutritional value, either advantageously or adversely [7,8]. Antioxidants, well-known for their health properties related to the pre-vention of degenerative diseases are damaged by long thermal treatments [9-12].
Drying is one of the oldest and most effective means of preserving foods. However, some studies have shown that long periods of heating cause losses of sensorial (texture, taste, flavor, and color) and nutritional quality [9,13], such as reduction of ascorbic acid content [14]. Comparatively during the freezing process ice crystals can also cause physical, structural, chemical and nutri-tional damage [15,16].
Dehydrofreezing is a new food processing of partial dehydration prior to freezing. It has shown advantages on texture properties and energy consumption, due to the effect of diminishing the tissue damage by removing part of water from vegetable tissue prior to freezing [15,16].
Instant Controlled Pressure Drop process, well known by the French acronym “DIC” (Détente Instantanée Con-
trôlée), is based on the thermo-mechanical effects in-duced by subjecting the raw material for a short period of time to saturated steam (about 0.1 - 0.6 MPa according to *Corresponding author.
Copyright © 2013 SciRes. FNS
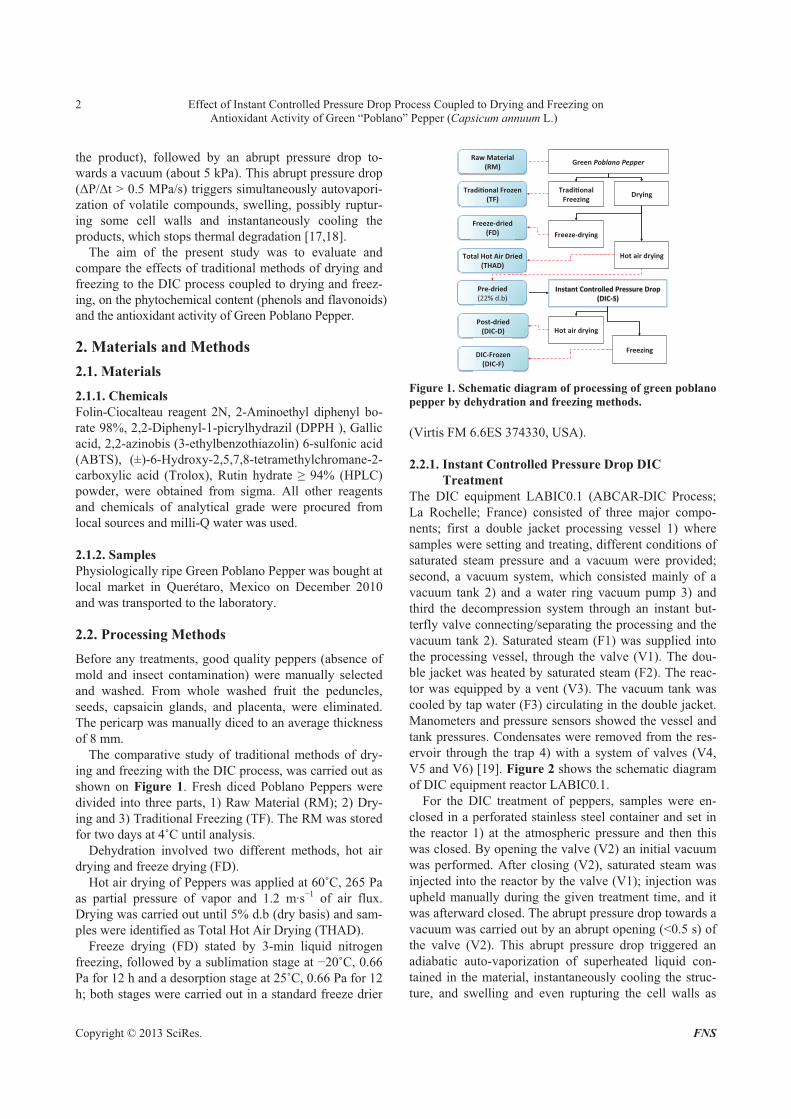
Effect of Instant Controlled Pressure Drop Process Coupled to Drying and Freezing on Antioxidant Activity of Green “Poblano” Pepper (Capsicum annuum L.)
2
the product), followed by an abrupt pressure drop to-wards a vacuum (about 5 kPa). This abrupt pressure drop (!P/!t > 0.5 MPa/s) triggers simultaneously autovapori-zation of volatile compounds, swelling, possibly ruptur-ing some cell walls and instantaneously cooling the products, which stops thermal degradation [17,18].
The aim of the present study was to evaluate and compare the effects of traditional methods of drying and freezing to the DIC process coupled to drying and freez-ing, on the phytochemical content (phenols and flavonoids) and the antioxidant activity of Green Poblano Pepper.
2. Materials and Methods
2.1. Materials
2.1.1. Chemicals
Folin-Ciocalteau reagent 2N, 2-Aminoethyl diphenyl bo-rate 98%, 2,2-Diphenyl-1-picrylhydrazil (DPPH ), Gallic acid, 2,2-azinobis (3-ethylbenzothiazolin) 6-sulfonic acid (ABTS), (±)-6-Hydroxy-2,5,7,8-tetramethylchromane-2- carboxylic acid (Trolox), Rutin hydrate " 94% (HPLC) powder, were obtained from sigma. All other reagents and chemicals of analytical grade were procured from local sources and milli-Q water was used.
2.1.2. Samples
Physiologically ripe Green Poblano Pepper was bought at local market in Querétaro, Mexico on December 2010 and was transported to the laboratory.
2.2. Processing Methods
Before any treatments, good quality peppers (absence of mold and insect contamination) were manually selected and washed. From whole washed fruit the peduncles, seeds, capsaicin glands, and placenta, were eliminated. The pericarp was manually diced to an average thickness of 8 mm.
The comparative study of traditional methods of dry-ing and freezing with the DIC process, was carried out as shown on Figure 1. Fresh diced Poblano Peppers were divided into three parts, 1) Raw Material (RM); 2) Dry-ing and 3) Traditional Freezing (TF). The RM was stored for two days at 4ûC until analysis.
Dehydration involved two different methods, hot air drying and freeze drying (FD).
Hot air drying of Peppers was applied at 60ûC, 265 Pa as partial pressure of vapor and 1.2 m·s#1 of air flux. Drying was carried out until 5% d.b (dry basis) and sam-ples were identified as Total Hot Air Drying (THAD).
Freeze drying (FD) stated by 3-min liquid nitrogen freezing, followed by a sublimation stage at #20ûC, 0.66 Pa for 12 h and a desorption stage at 25ûC, 0.66 Pa for 12 h; both stages were carried out in a standard freeze drier
Green Poblano Pepper
Tradi onal
Freezing
Hot air drying
Instant Controlled Pressure Drop
(DIC!S)
Raw Material
(RM)
Tradi onal Frozen
(TF)
Freeze!dried
(FD)
Total Hot Air Dried
(THAD)
Pre!dried
(22% d.b)
Post!dried
(DIC!D)
DIC!Frozen
(DIC!F)
Drying
Freeze!drying
Freezing
Hot air drying
Figure 1. Schematic diagram of processing of green poblano
pepper by dehydration and freezing methods.
(Virtis FM 6.6ES 374330, USA).
2.2.1. Instant Controlled Pressure Drop DIC
Treatment
The DIC equipment LABIC0.1 (ABCAR-DIC Process; La Rochelle; France) consisted of three major compo-nents; first a double jacket processing vessel 1) where samples were setting and treating, different conditions of saturated steam pressure and a vacuum were provided; second, a vacuum system, which consisted mainly of a vacuum tank 2) and a water ring vacuum pump 3) and third the decompression system through an instant but-terfly valve connecting/separating the processing and the vacuum tank 2). Saturated steam (F1) was supplied into the processing vessel, through the valve (V1). The dou-ble jacket was heated by saturated steam (F2). The reac-tor was equipped by a vent (V3). The vacuum tank was cooled by tap water (F3) circulating in the double jacket. Manometers and pressure sensors showed the vessel and tank pressures. Condensates were removed from the res-ervoir through the trap 4) with a system of valves (V4, V5 and V6) [19]. Figure 2 shows the schematic diagram of DIC equipment reactor LABIC0.1.
For the DIC treatment of peppers, samples were en-closed in a perforated stainless steel container and set in the reactor 1) at the atmospheric pressure and then this was closed. By opening the valve (V2) an initial vacuum was performed. After closing (V2), saturated steam was injected into the reactor by the valve (V1); injection was upheld manually during the given treatment time, and it was afterward closed. The abrupt pressure drop towards a vacuum was carried out by an abrupt opening (<0.5 s) of the valve (V2). This abrupt pressure drop triggered an adiabatic auto-vaporization of superheated liquid con-tained in the material, instantaneously cooling the struc-ture, and swelling and even rupturing the cell walls as
Copyright © 2013 SciRes. FNS
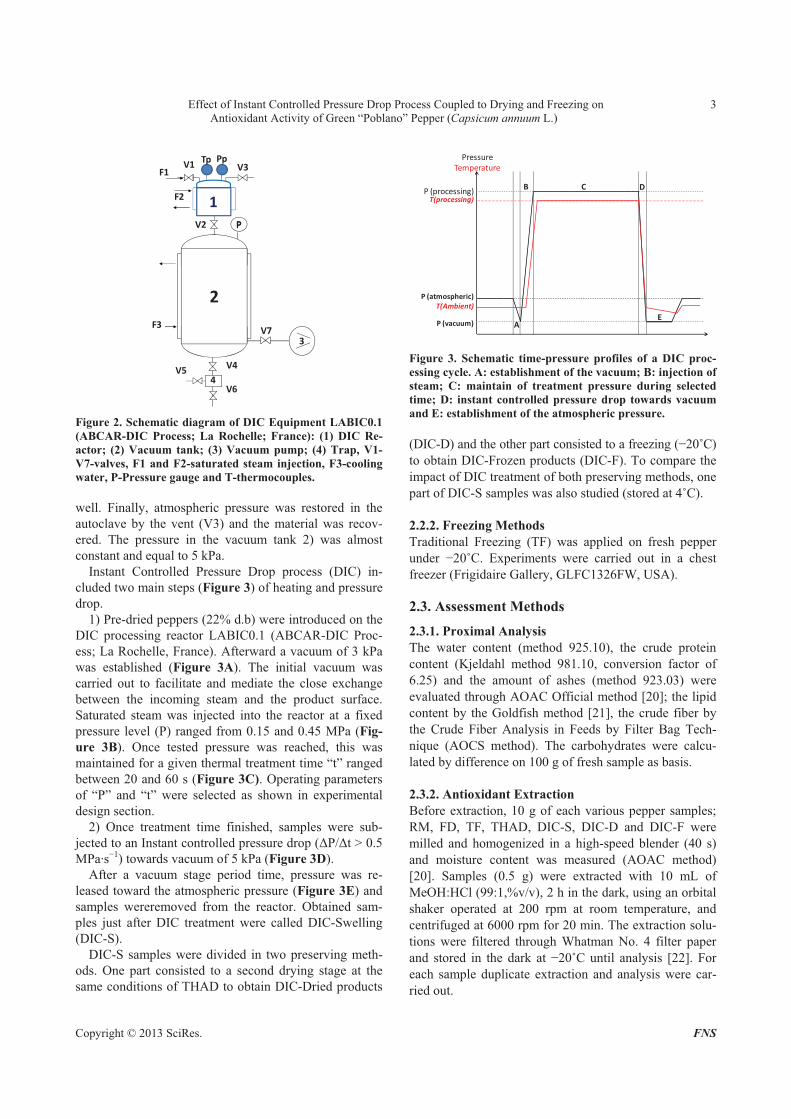
Effect of Instant Controlled Pressure Drop Process Coupled to Drying and Freezing on Antioxidant Activity of Green “Poblano” Pepper (Capsicum annuum L.)
3
PP
2
3V7
V4
V6
V5
F3
V3
F2
F1V1
V2
4
P
1
Tp Pp
Figure 2. Schematic diagram of DIC Equipment LABIC0.1
(ABCAR-DIC Process; La Rochelle; France): (1) DIC Re-
actor; (2) Vacuum tank; (3) Vacuum pump; (4) Trap, V1-
V7-valves, F1 and F2-saturated steam injection, F3-cooling
water, P-Pressure gauge and T-thermocouples.
well. Finally, atmospheric pressure was restored in the autoclave by the vent (V3) and the material was recov-ered. The pressure in the vacuum tank 2) was almost constant and equal to 5 kPa.
Instant Controlled Pressure Drop process (DIC) in-cluded two main steps (Figure 3) of heating and pressure drop.
1) Pre-dried peppers (22% d.b) were introduced on the DIC processing reactor LABIC0.1 (ABCAR-DIC Proc-ess; La Rochelle, France). Afterward a vacuum of 3 kPa was established (Figure 3A). The initial vacuum was carried out to facilitate and mediate the close exchange between the incoming steam and the product surface. Saturated steam was injected into the reactor at a fixed pressure level (P) ranged from 0.15 and 0.45 MPa (Fig-
ure 3B). Once tested pressure was reached, this was maintained for a given thermal treatment time “t” ranged between 20 and 60 s (Figure 3C). Operating parameters of “P” and “t” were selected as shown in experimental design section.
2) Once treatment time finished, samples were sub-jected to an Instant controlled pressure drop (!P/!t > 0.5 MPa·s#1) towards vacuum of 5 kPa (Figure 3D).
After a vacuum stage period time, pressure was re-leased toward the atmospheric pressure (Figure 3E) and samples wereremoved from the reactor. Obtained sam-ples just after DIC treatment were called DIC-Swelling (DIC-S).
DIC-S samples were divided in two preserving meth-ods. One part consisted to a second drying stage at the same conditions of THAD to obtain DIC-Dried products
P"(vacuum)
P"(atmospheric)
T(Ambient)
Temperature
!(processing)
Pressure
P
A
B C D
E
T(processing)
Figure 3. Schematic time-pressure profiles of a DIC proc-
essing cycle. A: establishment of the vacuum; B: injection of
steam; C: maintain of treatment pressure during selected
time; D: instant controlled pressure drop towards vacuum
and E: establishment of the atmospheric pressure.
(DIC-D) and the other part consisted to a freezing (#20ûC) to obtain DIC-Frozen products (DIC-F). To compare the impact of DIC treatment of both preserving methods, one part of DIC-S samples was also studied (stored at 4ûC).
2.2.2. Freezing Methods
Traditional Freezing (TF) was applied on fresh pepper under #20ûC. Experiments were carried out in a chest freezer (Frigidaire Gallery, GLFC1326FW, USA).
2.3. Assessment Methods
2.3.1. Proximal Analysis
The water content (method 925.10), the crude protein content (Kjeldahl method 981.10, conversion factor of 6.25) and the amount of ashes (method 923.03) were evaluated through AOAC Official method [20]; the lipid content by the Goldfish method [21], the crude fiber by the Crude Fiber Analysis in Feeds by Filter Bag Tech-nique (AOCS method). The carbohydrates were calcu-lated by difference on 100 g of fresh sample as basis.
2.3.2. Antioxidant Extraction
Before extraction, 10 g of each various pepper samples; RM, FD, TF, THAD, DIC-S, DIC-D and DIC-F were milled and homogenized in a high-speed blender (40 s) and moisture content was measured (AOAC method) [20]. Samples (0.5 g) were extracted with 10 mL of MeOH:HCl (99:1,%v/v), 2 h in the dark, using an orbital shaker operated at 200 rpm at room temperature, and centrifuged at 6000 rpm for 20 min. The extraction solu-tions were filtered through Whatman No. 4 filter paper and stored in the dark at #20ûC until analysis [22]. For each sample duplicate extraction and analysis were car-ried out.
Copyright © 2013 SciRes. FNS
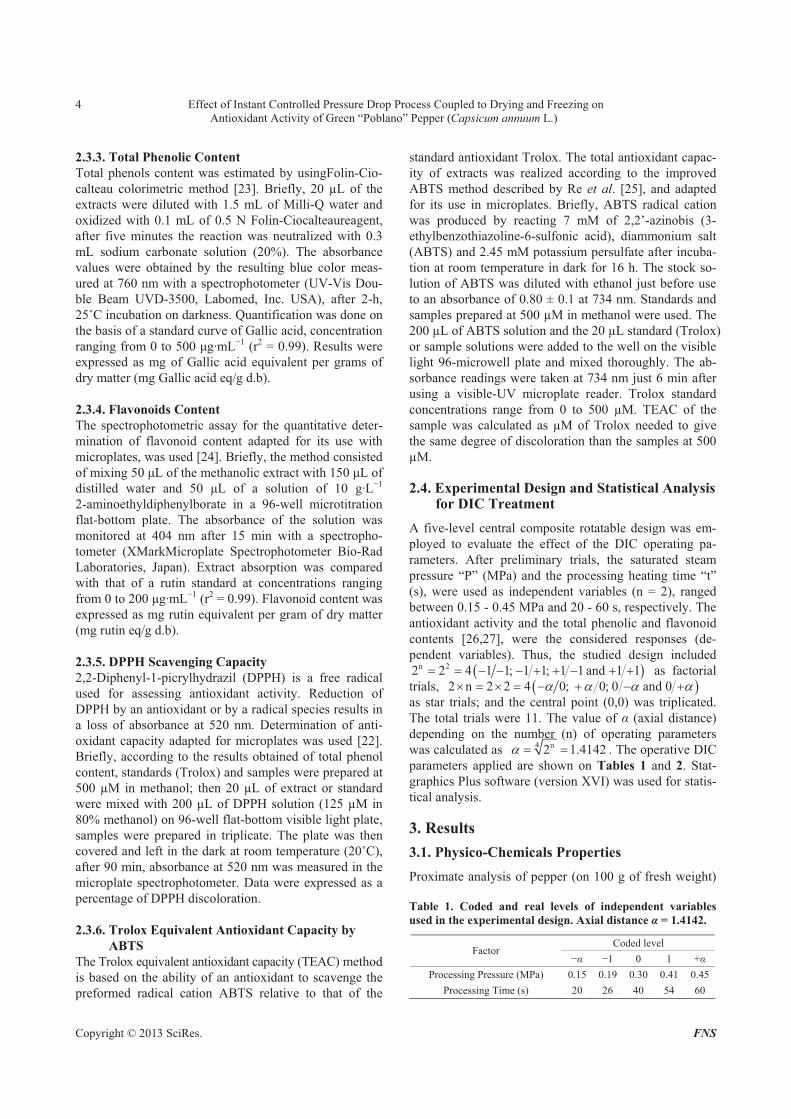
Effect of Instant Controlled Pressure Drop Process Coupled to Drying and Freezing on Antioxidant Activity of Green “Poblano” Pepper (Capsicum annuum L.)
4
2.3.3. Total Phenolic Content
Total phenols content was estimated by usingFolin-Cio- calteau colorimetric method [23]. Briefly, 20 µL of the extracts were diluted with 1.5 mL of Milli-Q water and oxidized with 0.1 mL of 0.5 N Folin-Ciocalteaureagent, after five minutes the reaction was neutralized with 0.3 mL sodium carbonate solution (20%). The absorbance values were obtained by the resulting blue color meas-ured at 760 nm with a spectrophotometer (UV-Vis Dou-ble Beam UVD-3500, Labomed, Inc. USA), after 2-h, 25ûC incubation on darkness. Quantification was done on the basis of a standard curve of Gallic acid, concentration ranging from 0 to 500 $g·mL#1 (r2 = 0.99). Results were expressed as mg of Gallic acid equivalent per grams of dry matter (mg Gallic acid eq/g d.b).
2.3.4. Flavonoids Content
The spectrophotometric assay for the quantitative deter-mination of flavonoid content adapted for its use with microplates, was used [24]. Briefly, the method consisted of mixing 50 $L of the methanolic extract with 150 $L of distilled water and 50 $L of a solution of 10 g·L#1 2-aminoethyldiphenylborate in a 96-well microtitration flat-bottom plate. The absorbance of the solution was monitored at 404 nm after 15 min with a spectropho-tometer (XMarkMicroplate Spectrophotometer Bio-Rad Laboratories, Japan). Extract absorption was compared with that of a rutin standard at concentrations ranging from 0 to 200 $g·mL#1 (r2 = 0.99). Flavonoid content was expressed as mg rutin equivalent per gram of dry matter (mg rutin eq/g d.b).
2.3.5. DPPH Scavenging Capacity
2,2-Diphenyl-1-picrylhydrazil (DPPH) is a free radical used for assessing antioxidant activity. Reduction of DPPH by an antioxidant or by a radical species results in a loss of absorbance at 520 nm. Determination of anti-oxidant capacity adapted for microplates was used [22]. Briefly, according to the results obtained of total phenol content, standards (Trolox) and samples were prepared at 500 µM in methanol; then 20 µL of extract or standard were mixed with 200 µL of DPPH solution (125 µM in 80% methanol) on 96-well flat-bottom visible light plate, samples were prepared in triplicate. The plate was then covered and left in the dark at room temperature (20ûC), after 90 min, absorbance at 520 nm was measured in the microplate spectrophotometer. Data were expressed as a percentage of DPPH discoloration.
2.3.6. Trolox Equivalent Antioxidant Capacity by
ABTS
The Trolox equivalent antioxidant capacity (TEAC) method is based on the ability of an antioxidant to scavenge the preformed radical cation ABTS relative to that of the
standard antioxidant Trolox. The total antioxidant capac-ity of extracts was realized according to the improved ABTS method described by Re et al. [25], and adapted for its use in microplates. Briefly, ABTS radical cation was produced by reacting 7 mM of 2,2’-azinobis (3- ethylbenzothiazoline-6-sulfonic acid), diammonium salt (ABTS) and 2.45 mM potassium persulfate after incuba-tion at room temperature in dark for 16 h. The stock so-lution of ABTS was diluted with ethanol just before use to an absorbance of 0.80 ± 0.1 at 734 nm. Standards and samples prepared at 500 µM in methanol were used. The 200 µL of ABTS solution and the 20 µL standard (Trolox) or sample solutions were added to the well on the visible light 96-microwell plate and mixed thoroughly. The ab-sorbance readings were taken at 734 nm just 6 min after using a visible-UV microplate reader. Trolox standard concentrations range from 0 to 500 µM. TEAC of the sample was calculated as µM of Trolox needed to give the same degree of discoloration than the samples at 500 µM.
2.4. Experimental Design and Statistical Analysis for DIC Treatment
A five-level central composite rotatable design was em-ployed to evaluate the effect of the DIC operating pa-rameters. After preliminary trials, the saturated steam pressure “P” (MPa) and the processing heating time “t” (s), were used as independent variables (n = 2), ranged between 0.15 - 0.45 MPa and 20 - 60 s, respectively. The antioxidant activity and the total phenolic and flavonoid contents [26,27], were the considered responses (de-pendent variables). Thus, the studied design included
! "n 22 2 4 1 1; 1 1; 1 1 and 1 1# # $ $ $ % % $ % % as factorial trials, ! "2 n 2 2 4 0; 0; 0 and 0& & & &' # ' # $ % $ % as star trials; and the central point (0,0) was triplicated. The total trials were 11. The value of ! (axial distance) depending on the number (n) of operating parameters was calculated as 4 n2 1.414& # # 2 . The operative DIC parameters applied are shown on Tables 1 and 2. Stat-graphics Plus software (version XVI) was used for statis-tical analysis.
3. Results
3.1. Physico-Chemicals Properties
Proximate analysis of pepper (on 100 g of fresh weight)
Table 1. Coded and real levels of independent variables
used in the experimental design. Axial distance ! = 1.4142.
Coded level Factor
#! #1 0 1 +!
Processing Pressure (MPa) 0.15 0.19 0.30 0.41 0.45
Processing Time (s) 20 26 40 54 60
Copyright © 2013 SciRes. FNS
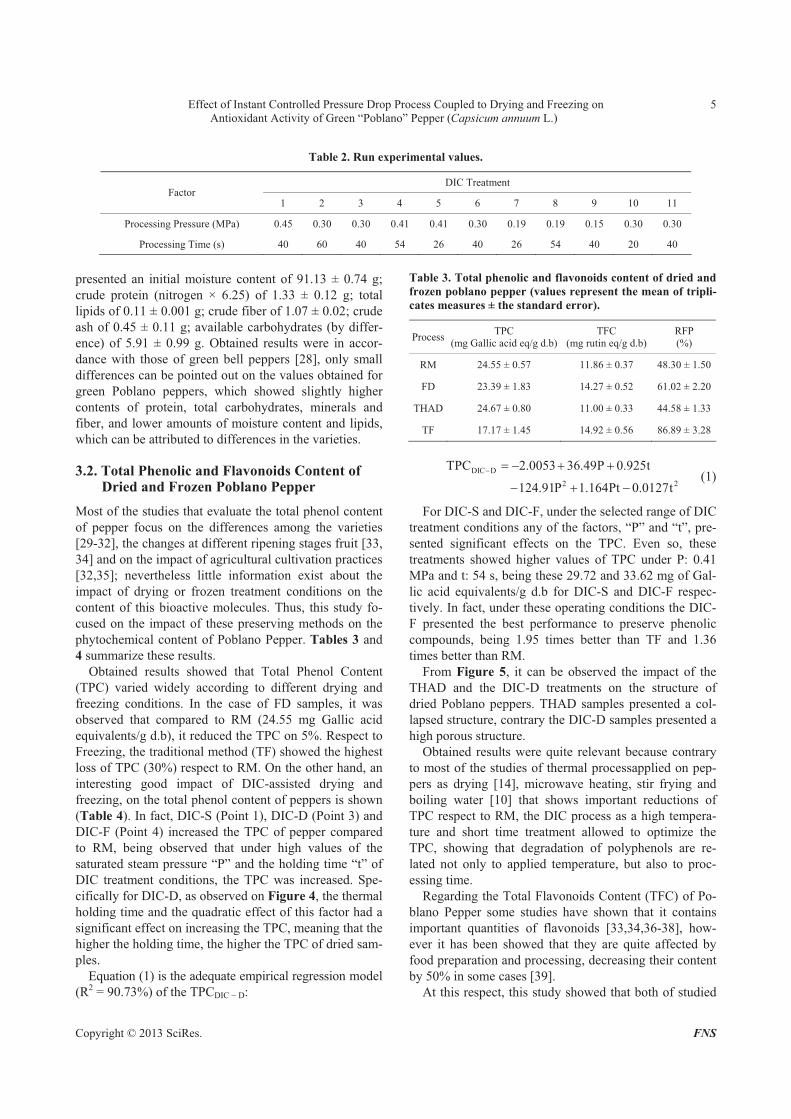
Effect of Instant Controlled Pressure Drop Process Coupled to Drying and Freezing on Antioxidant Activity of Green “Poblano” Pepper (Capsicum annuum L.)
Copyright © 2013 SciRes. FNS
5
Table 2. Run experimental values.
DIC Treatment Factor
1 2 3 4 5 6 7 8 9 10 11
Processing Pressure (MPa) 0.45 0.30 0.30 0.41 0.41 0.30 0.19 0.19 0.15 0.30 0.30
Processing Time (s) 40 60 40 54 26 40 26 54 40 20 40
Table 3. Total phenolic and flavonoids content of dried and
frozen poblano pepper (values represent the mean of tripli-
cates measures ± the standard error).
presented an initial moisture content of 91.13 ± 0.74 g; crude protein (nitrogen × 6.25) of 1.33 ± 0.12 g; total lipids of 0.11 ± 0.001 g; crude fiber of 1.07 ± 0.02; crude ash of 0.45 ± 0.11 g; available carbohydrates (by differ-ence) of 5.91 ± 0.99 g. Obtained results were in accor-dance with those of green bell peppers [28], only small differences can be pointed out on the values obtained for green Poblano peppers, which showed slightly higher contents of protein, total carbohydrates, minerals and fiber, and lower amounts of moisture content and lipids, which can be attributed to differences in the varieties.
ProcessTPC
(mg Gallic acid eq/g d.b)TFC
(mg rutin eq/g d.b) RFP (%)
RM 24.55 ± 0.57 11.86 ± 0.37 48.30 ± 1.50
FD 23.39 ± 1.83 14.27 ± 0.52 61.02 ± 2.20
THAD 24.67 ± 0.80 11.00 ± 0.33 44.58 ± 1.33
TF 17.17 ± 1.45 14.92 ± 0.56 86.89 ± 3.28
DIC D
2 2
TPC 2.0053 36.49P 0.925t
124.91P 1.164Pt 0.0127t
$ # $ % %
$ % $ (1) 3.2. Total Phenolic and Flavonoids Content of
Dried and Frozen Poblano Pepper
Most of the studies that evaluate the total phenol content of pepper focus on the differences among the varieties [29-32], the changes at different ripening stages fruit [33, 34] and on the impact of agricultural cultivation practices [32,35]; nevertheless little information exist about the impact of drying or frozen treatment conditions on the content of this bioactive molecules. Thus, this study fo-cused on the impact of these preserving methods on the phytochemical content of Poblano Pepper. Tables 3 and 4 summarize these results.
For DIC-S and DIC-F, under the selected range of DIC treatment conditions any of the factors, “P” and “t”, pre-sented significant effects on the TPC. Even so, these treatments showed higher values of TPC under P: 0.41 MPa and t: 54 s, being these 29.72 and 33.62 mg of Gal-lic acid equivalents/g d.b for DIC-S and DIC-F respec-tively. In fact, under these operating conditions the DIC- F presented the best performance to preserve phenolic compounds, being 1.95 times better than TF and 1.36 times better than RM.
From Figure 5, it can be observed the impact of the THAD and the DIC-D treatments on the structure of dried Poblano peppers. THAD samples presented a col-lapsed structure, contrary the DIC-D samples presented a high porous structure.
Obtained results showed that Total Phenol Content (TPC) varied widely according to different drying and freezing conditions. In the case of FD samples, it was observed that compared to RM (24.55 mg Gallic acid equivalents/g d.b), it reduced the TPC on 5%. Respect to Freezing, the traditional method (TF) showed the highest loss of TPC (30%) respect to RM. On the other hand, an interesting good impact of DIC-assisted drying and freezing, on the total phenol content of peppers is shown (Table 4). In fact, DIC-S (Point 1), DIC-D (Point 3) and DIC-F (Point 4) increased the TPC of pepper compared to RM, being observed that under high values of the saturated steam pressure “P” and the holding time “t” of DIC treatment conditions, the TPC was increased. Spe-cifically for DIC-D, as observed on Figure 4, the thermal holding time and the quadratic effect of this factor had a significant effect on increasing the TPC, meaning that the higher the holding time, the higher the TPC of dried sam-ples.
Obtained results were quite relevant because contrary to most of the studies of thermal processapplied on pep-pers as drying [14], microwave heating, stir frying and boiling water [10] that shows important reductions of TPC respect to RM, the DIC process as a high tempera-ture and short time treatment allowed to optimize the TPC, showing that degradation of polyphenols are re-lated not only to applied temperature, but also to proc-essing time.
Regarding the Total Flavonoids Content (TFC) of Po-blano Pepper some studies have shown that it contains important quantities of flavonoids [33,34,36-38], how-ever it has been showed that they are quite affected by food preparation and processing, decreasing their content by 50% in some cases [39]. Equation (1) is the adequate empirical regression model
(R2 = 90.73%) of the TPCDIC # D: At this respect, this study showed that both of studied
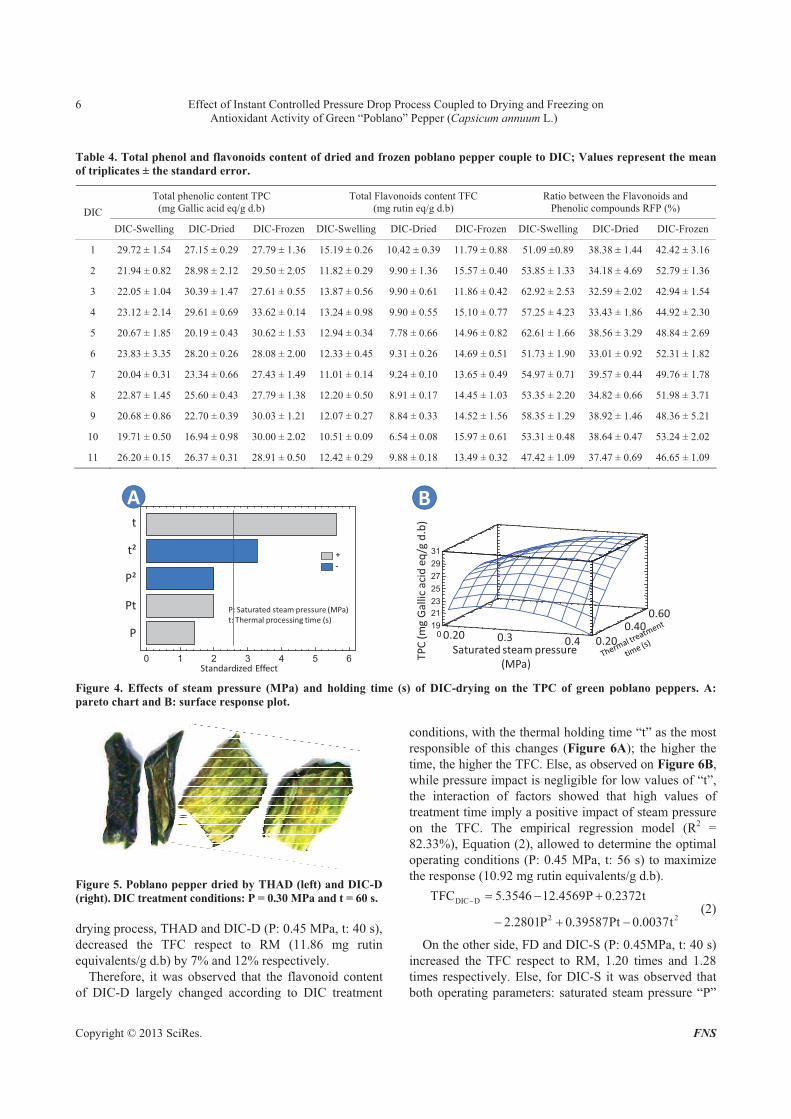
Effect of Instant Controlled Pressure Drop Process Coupled to Drying and Freezing on Antioxidant Activity of Green “Poblano” Pepper (Capsicum annuum L.)
6
Table 4. Total phenol and flavonoids content of dried and frozen poblano pepper couple to DIC; Values represent the mean
of triplicates ± the standard error.
Total phenolic content TPC (mg Gallic acid eq/g d.b)
Total Flavonoids content TFC (mg rutin eq/g d.b)
Ratio between the Flavonoids and Phenolic compounds RFP (%) DIC
DIC-Swelling DIC-Dried DIC-Frozen DIC-Swelling DIC-Dried DIC-Frozen DIC-Swelling DIC-Dried DIC-Frozen
1 29.72 ± 1.54 27.15 ± 0.29 27.79 ± 1.36 15.19 ± 0.26 10.42 ± 0.39 11.79 ± 0.88 51.09 ±0.89 38.38 ± 1.44 42.42 ± 3.16
2 21.94 ± 0.82 28.98 ± 2.12 29.50 ± 2.05 11.82 ± 0.29 9.90 ± 1.36 15.57 ± 0.40 53.85 ± 1.33 34.18 ± 4.69 52.79 ± 1.36
3 22.05 ± 1.04 30.39 ± 1.47 27.61 ± 0.55 13.87 ± 0.56 9.90 ± 0.61 11.86 ± 0.42 62.92 ± 2.53 32.59 ± 2.02 42.94 ± 1.54
4 23.12 ± 2.14 29.61 ± 0.69 33.62 ± 0.14 13.24 ± 0.98 9.90 ± 0.55 15.10 ± 0.77 57.25 ± 4.23 33.43 ± 1.86 44.92 ± 2.30
5 20.67 ± 1.85 20.19 ± 0.43 30.62 ± 1.53 12.94 ± 0.34 7.78 ± 0.66 14.96 ± 0.82 62.61 ± 1.66 38.56 ± 3.29 48.84 ± 2.69
6 23.83 ± 3.35 28.20 ± 0.26 28.08 ± 2.00 12.33 ± 0.45 9.31 ± 0.26 14.69 ± 0.51 51.73 ± 1.90 33.01 ± 0.92 52.31 ± 1.82
7 20.04 ± 0.31 23.34 ± 0.66 27.43 ± 1.49 11.01 ± 0.14 9.24 ± 0.10 13.65 ± 0.49 54.97 ± 0.71 39.57 ± 0.44 49.76 ± 1.78
8 22.87 ± 1.45 25.60 ± 0.43 27.79 ± 1.38 12.20 ± 0.50 8.91 ± 0.17 14.45 ± 1.03 53.35 ± 2.20 34.82 ± 0.66 51.98 ± 3.71
9 20.68 ± 0.86 22.70 ± 0.39 30.03 ± 1.21 12.07 ± 0.27 8.84 ± 0.33 14.52 ± 1.56 58.35 ± 1.29 38.92 ± 1.46 48.36 ± 5.21
10 19.71 ± 0.50 16.94 ± 0.98 30.00 ± 2.02 10.51 ± 0.09 6.54 ± 0.08 15.97 ± 0.61 53.31 ± 0.48 38.64 ± 0.47 53.24 ± 2.02
11 26.20 ± 0.15 26.37 ± 0.31 28.91 ± 0.50 12.42 ± 0.29 9.88 ± 0.18 13.49 ± 0.32 47.42 ± 1.09 37.47 ± 0.69 46.65 ± 1.09
0 1 2 3 4 5 6
A
t
t²
P²
Pt
P
+
-
Standardized Effect
P:!Saturated steam pressure!(MPa)
t:!Thermal!processing time!(s)
A
0.19 0 23 0 27 0 31 2631
3641
465
Ti
19
21
23
25
27
29
31
0.20
0.400.60
0.30.200.4
Saturated steam pressure!
(MPa)
TPC!(mg!Gallic!acideq/g!d.b)
B
Figure 4. Effects of steam pressure (MPa) and holding time (s) of DIC-drying on the TPC of green poblano peppers. A:
pareto chart and B: surface response plot.
Figure 5. Poblano pepper dried by THAD (left) and DIC-D
(right). DIC treatment conditions: P = 0.30 MPa and t = 60 s.
drying process, THAD and DIC-D (P: 0.45 MPa, t: 40 s), decreased the TFC respect to RM (11.86 mg rutin equivalents/g d.b) by 7% and 12% respectively.
Therefore, it was observed that the flavonoid content of DIC-D largely changed according to DIC treatment
conditions, with the thermal holding time “t” as the most responsible of this changes (Figure 6A); the higher the time, the higher the TFC. Else, as observed on Figure 6B, while pressure impact is negligible for low values of “t”, the interaction of factors showed that high values of treatment time imply a positive impact of steam pressure on the TFC. The empirical regression model (R2 = 82.33%), Equation (2), allowed to determine the optimal operating conditions (P: 0.45 MPa, t: 56 s) to maximize the response (10.92 mg rutin equivalents/g d.b).
DIC D
2 2
TFC 5.3546 12.4569P 0.2372t
2.2801P 0.39587Pt 0.0037t
$ # $ %
$ % $ (2)
On the other side, FD and DIC-S (P: 0.45MPa, t: 40 s) increased the TFC respect to RM, 1.20 times and 1.28 times respectively. Else, for DIC-S it was observed that both operating parameters: saturated steam pressure “P”
Copyright © 2013 SciRes. FNS
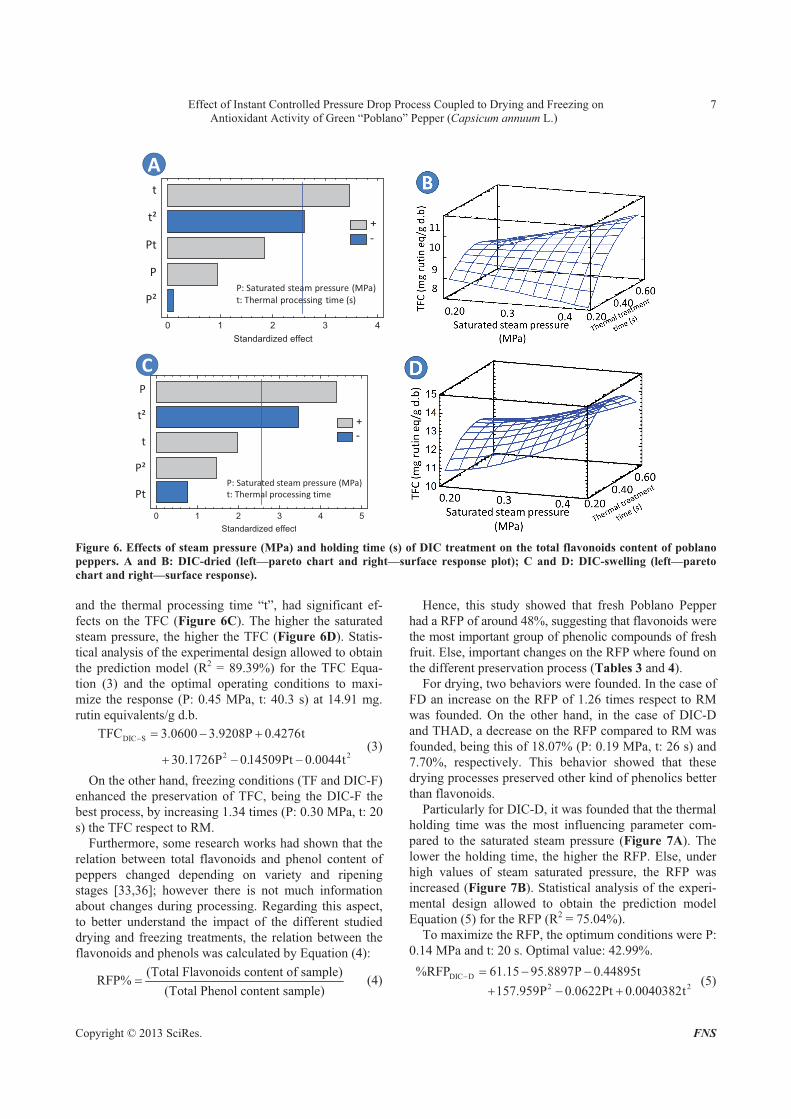
Effect of Instant Controlled Pressure Drop Process Coupled to Drying and Freezing on Antioxidant Activity of Green “Poblano” Pepper (Capsicum annuum L.)
7
0 1 2 3 4
Standardized effect
t
t²
Pt
P
P²
+
-
P:!Saturated steam pressure!(MPa)
t:!Thermal!processing time!(s)
A
0 1 2 3 4 5
Standardized effect
CP
t²
t
P²
Pt
+
-
P:!Saturated steam pressure!(MPa)
t:!Thermal!processing time
Figure 6. Effects of steam pressure (MPa) and holding time (s) of DIC treatment on the total flavonoids content of poblano
peppers. A and B: DIC-dried (left—pareto chart and right—surface response plot); C and D: DIC-swelling (left—pareto
chart and right—surface response).
and the thermal processing time “t”, had significant ef-fects on the TFC (Figure 6C). The higher the saturated steam pressure, the higher the TFC (Figure 6D). Statis-tical analysis of the experimental design allowed to obtain the prediction model (R2 = 89.39%) for the TFC Equa-tion (3) and the optimal operating conditions to maxi-mize the response (P: 0.45 MPa, t: 40.3 s) at 14.91 mg. rutin equivalents/g d.b.
DIC S
2
TFC 3.0600 3.9208P 0.4276t
30.1726P 0.14509Pt 0.0044t
$ # $ %
% $ $ 2 (3)
On the other hand, freezing conditions (TF and DIC-F) enhanced the preservation of TFC, being the DIC-F the best process, by increasing 1.34 times (P: 0.30 MPa, t: 20 s) the TFC respect to RM.
Furthermore, some research works had shown that the relation between total flavonoids and phenol content of peppers changed depending on variety and ripening stages [33,36]; however there is not much information about changes during processing. Regarding this aspect, to better understand the impact of the different studied drying and freezing treatments, the relation between the flavonoids and phenols was calculated by Equation (4):
(Total Flavonoids content of sample)RFP%
(Total Phenol content sample)# (4)
Hence, this study showed that fresh Poblano Pepper had a RFP of around 48%, suggesting that flavonoids were the most important group of phenolic compounds of fresh fruit. Else, important changes on the RFP where found on the different preservation process (Tables 3 and 4).
For drying, two behaviors were founded. In the case of FD an increase on the RFP of 1.26 times respect to RM was founded. On the other hand, in the case of DIC-D and THAD, a decrease on the RFP compared to RM was founded, being this of 18.07% (P: 0.19 MPa, t: 26 s) and 7.70%, respectively. This behavior showed that these drying processes preserved other kind of phenolics better than flavonoids.
Particularly for DIC-D, it was founded that the thermal holding time was the most influencing parameter com-pared to the saturated steam pressure (Figure 7A). The lower the holding time, the higher the RFP. Else, under high values of steam saturated pressure, the RFP was increased (Figure 7B). Statistical analysis of the experi-mental design allowed to obtain the prediction model Equation (5) for the RFP (R2 = 75.04%).
To maximize the RFP, the optimum conditions were P: 0.14 MPa and t: 20 s. Optimal value: 42.99%.
DIC D2 2
%RFP 61.15 95.8897P 0.44895t
157.959P 0.0622Pt 0.0040382t$ # $ $
% $ % (5)
Copyright © 2013 SciRes. FNS
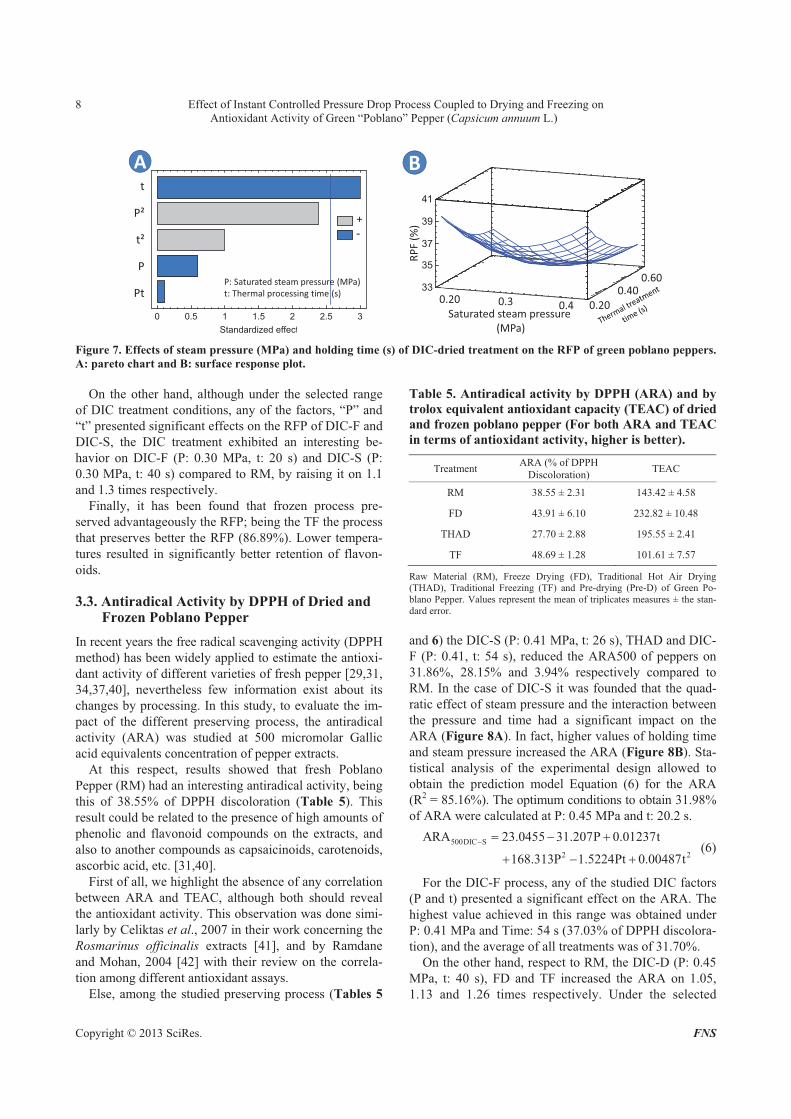
Effect of Instant Controlled Pressure Drop Process Coupled to Drying and Freezing on Antioxidant Activity of Green “Poblano” Pepper (Capsicum annuum L.)
8
0 0.5 1 1.5 2 2.5 3
Standardized effect
At
P²
t²
P
Pt
+
-
P:!Saturated steam pressure!(MPa)
t:!Thermal!processing time!(s)
0.19 0 23 0 27 0 31 0 3 2631
3641
465
Ti
33
35
37
39
41
B
0.30.20
Saturated steam pressure!
(MPa)
RPF!(%)
0.4 0.20
0.400.60
Figure 7. Effects of steam pressure (MPa) and holding time (s) of DIC-dried treatment on the RFP of green poblano peppers.
A: pareto chart and B: surface response plot.
On the other hand, although under the selected range
of DIC treatment conditions, any of the factors, “P” and “t” presented significant effects on the RFP of DIC-F and DIC-S, the DIC treatment exhibited an interesting be-havior on DIC-F (P: 0.30 MPa, t: 20 s) and DIC-S (P: 0.30 MPa, t: 40 s) compared to RM, by raising it on 1.1 and 1.3 times respectively.
Finally, it has been found that frozen process pre-served advantageously the RFP; being the TF the process that preserves better the RFP (86.89%). Lower tempera-tures resulted in significantly better retention of flavon-oids.
3.3. Antiradical Activity by DPPH of Dried and Frozen Poblano Pepper
In recent years the free radical scavenging activity (DPPH method) has been widely applied to estimate the antioxi-dant activity of different varieties of fresh pepper [29,31, 34,37,40], nevertheless few information exist about its changes by processing. In this study, to evaluate the im-pact of the different preserving process, the antiradical activity (ARA) was studied at 500 micromolar Gallic acid equivalents concentration of pepper extracts.
At this respect, results showed that fresh Poblano Pepper (RM) had an interesting antiradical activity, being this of 38.55% of DPPH discoloration (Table 5). This result could be related to the presence of high amounts of phenolic and flavonoid compounds on the extracts, and also to another compounds as capsaicinoids, carotenoids, ascorbic acid, etc. [31,40].
First of all, we highlight the absence of any correlation between ARA and TEAC, although both should reveal the antioxidant activity. This observation was done simi-larly by Celiktas et al., 2007 in their work concerning the Rosmarinus officinalis extracts [41], and by Ramdane and Mohan, 2004 [42] with their review on the correla-tion among different antioxidant assays.
Else, among the studied preserving process (Tables 5
Table 5. Antiradical activity by DPPH (ARA) and by
trolox equivalent antioxidant capacity (TEAC) of dried
and frozen poblano pepper (For both ARA and TEAC
in terms of antioxidant activity, higher is better).
Treatment ARA (% of DPPH
Discoloration) TEAC
RM 38.55 ± 2.31 143.42 ± 4.58
FD 43.91 ± 6.10 232.82 ± 10.48
THAD 27.70 ± 2.88 195.55 ± 2.41
TF 48.69 ± 1.28 101.61 ± 7.57
Raw Material (RM), Freeze Drying (FD), Traditional Hot Air Drying (THAD), Traditional Freezing (TF) and Pre-drying (Pre-D) of Green Po-blano Pepper. Values represent the mean of triplicates measures ± the stan-dard error.
and 6) the DIC-S (P: 0.41 MPa, t: 26 s), THAD and DIC- F (P: 0.41, t: 54 s), reduced the ARA500 of peppers on 31.86%, 28.15% and 3.94% respectively compared to RM. In the case of DIC-S it was founded that the quad-ratic effect of steam pressure and the interaction between the pressure and time had a significant impact on the ARA (Figure 8A). In fact, higher values of holding time and steam pressure increased the ARA (Figure 8B). Sta-tistical analysis of the experimental design allowed to obtain the prediction model Equation (6) for the ARA (R2 = 85.16%). The optimum conditions to obtain 31.98% of ARA were calculated at P: 0.45 MPa and t: 20.2 s.
500DIC S
2 2
ARA 23.0455 31.207P 0.01237t
168.313P 1.5224Pt 0.00487t
$ # $ %
% $ % (6)
For the DIC-F process, any of the studied DIC factors (P and t) presented a significant effect on the ARA. The highest value achieved in this range was obtained under P: 0.41 MPa and Time: 54 s (37.03% of DPPH discolora-tion), and the average of all treatments was of 31.70%.
On the other hand, respect to RM, the DIC-D (P: 0.45 MPa, t: 40 s), FD and TF increased the ARA on 1.05, 1.13 and 1.26 times respectively. Under the selected
Copyright © 2013 SciRes. FNS
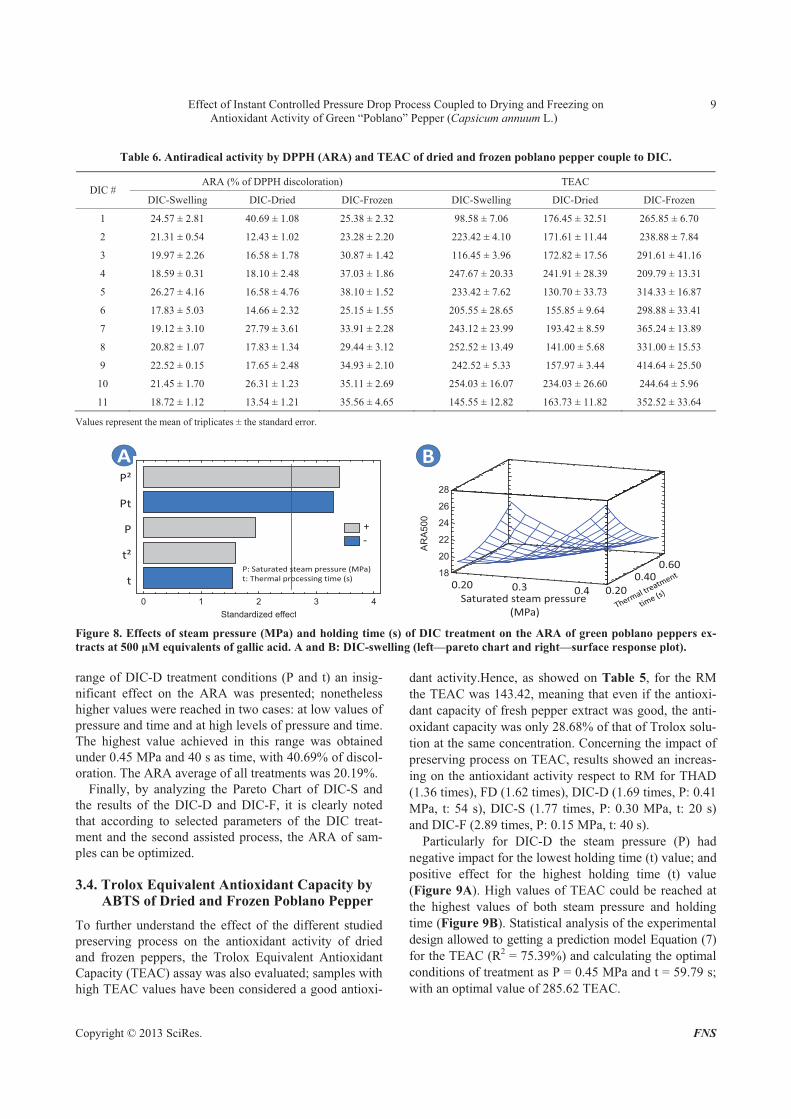
Effect of Instant Controlled Pressure Drop Process Coupled to Drying and Freezing on Antioxidant Activity of Green “Poblano” Pepper (Capsicum annuum L.)
9
Table 6. Antiradical activity by DPPH (ARA) and TEAC of dried and frozen poblano pepper couple to DIC.
ARA (% of DPPH discoloration) TEAC DIC #
DIC-Swelling DIC-Dried DIC-Frozen DIC-Swelling DIC-Dried DIC-Frozen
1 24.57 ± 2.81 40.69 ± 1.08 25.38 ± 2.32 98.58 ± 7.06 176.45 ± 32.51 265.85 ± 6.70
2 21.31 ± 0.54 12.43 ± 1.02 23.28 ± 2.20 223.42 ± 4.10 171.61 ± 11.44 238.88 ± 7.84
3 19.97 ± 2.26 16.58 ± 1.78 30.87 ± 1.42 116.45 ± 3.96 172.82 ± 17.56 291.61 ± 41.16
4 18.59 ± 0.31 18.10 ± 2.48 37.03 ± 1.86 247.67 ± 20.33 241.91 ± 28.39 209.79 ± 13.31
5 26.27 ± 4.16 16.58 ± 4.76 38.10 ± 1.52 233.42 ± 7.62 130.70 ± 33.73 314.33 ± 16.87
6 17.83 ± 5.03 14.66 ± 2.32 25.15 ± 1.55 205.55 ± 28.65 155.85 ± 9.64 298.88 ± 33.41
7 19.12 ± 3.10 27.79 ± 3.61 33.91 ± 2.28 243.12 ± 23.99 193.42 ± 8.59 365.24 ± 13.89
8 20.82 ± 1.07 17.83 ± 1.34 29.44 ± 3.12 252.52 ± 13.49 141.00 ± 5.68 331.00 ± 15.53
9 22.52 ± 0.15 17.65 ± 2.48 34.93 ± 2.10 242.52 ± 5.33 157.97 ± 3.44 414.64 ± 25.50
10 21.45 ± 1.70 26.31 ± 1.23 35.11 ± 2.69 254.03 ± 16.07 234.03 ± 26.60 244.64 ± 5.96
11 18.72 ± 1.12 13.54 ± 1.21 35.56 ± 4.65 145.55 ± 12.82 163.73 ± 11.82 352.52 ± 33.64
Values represent the mean of triplicates ± the standard error.
A
0 1 2 3 4
Standardized effect
P²
Pt
P
t²
t
+
-
P:!Saturated steam pressure!(MPa)
t:!Thermal!processing time!(s)
0.19 0 23 0 27 0 31 0 35 2631
3641
465
Ti
18
20
22
24
26
28
AR
A5
00
B
0.30.20
Saturated steam pressure!
(MPa)
0.4 0.20
0.400.60
Figure 8. Effects of steam pressure (MPa) and holding time (s) of DIC treatment on the ARA of green poblano peppers ex-
tracts at 500 µM equivalents of gallic acid. A and B: DIC-swelling (left—pareto chart and right—surface response plot).
range of DIC-D treatment conditions (P and t) an insig-nificant effect on the ARA was presented; nonetheless higher values were reached in two cases: at low values of pressure and time and at high levels of pressure and time. The highest value achieved in this range was obtained under 0.45 MPa and 40 s as time, with 40.69% of discol-oration. The ARA average of all treatments was 20.19%.
Finally, by analyzing the Pareto Chart of DIC-S and the results of the DIC-D and DIC-F, it is clearly noted that according to selected parameters of the DIC treat-ment and the second assisted process, the ARA of sam-ples can be optimized.
3.4. Trolox Equivalent Antioxidant Capacity by ABTS of Dried and Frozen Poblano Pepper
To further understand the effect of the different studied preserving process on the antioxidant activity of dried and frozen peppers, the Trolox Equivalent Antioxidant Capacity (TEAC) assay was also evaluated; samples with high TEAC values have been considered a good antioxi-
dant activity.Hence, as showed on Table 5, for the RM the TEAC was 143.42, meaning that even if the antioxi- dant capacity of fresh pepper extract was good, the anti-oxidant capacity was only 28.68% of that of Trolox solu-tion at the same concentration. Concerning the impact of preserving process on TEAC, results showed an increas-ing on the antioxidant activity respect to RM for THAD (1.36 times), FD (1.62 times), DIC-D (1.69 times, P: 0.41 MPa, t: 54 s), DIC-S (1.77 times, P: 0.30 MPa, t: 20 s) and DIC-F (2.89 times, P: 0.15 MPa, t: 40 s).
Particularly for DIC-D the steam pressure (P) had negative impact for the lowest holding time (t) value; and positive effect for the highest holding time (t) value (Figure 9A). High values of TEAC could be reached at the highest values of both steam pressure and holding time (Figure 9B). Statistical analysis of the experimental design allowed to getting a prediction model Equation (7) for the TEAC (R2 = 75.39%) and calculating the optimal conditions of treatment as P = 0.45 MPa and t = 59.79 s;
ith an optimal value of 285.62 TEAC. w
Copyright © 2013 SciRes. FNS
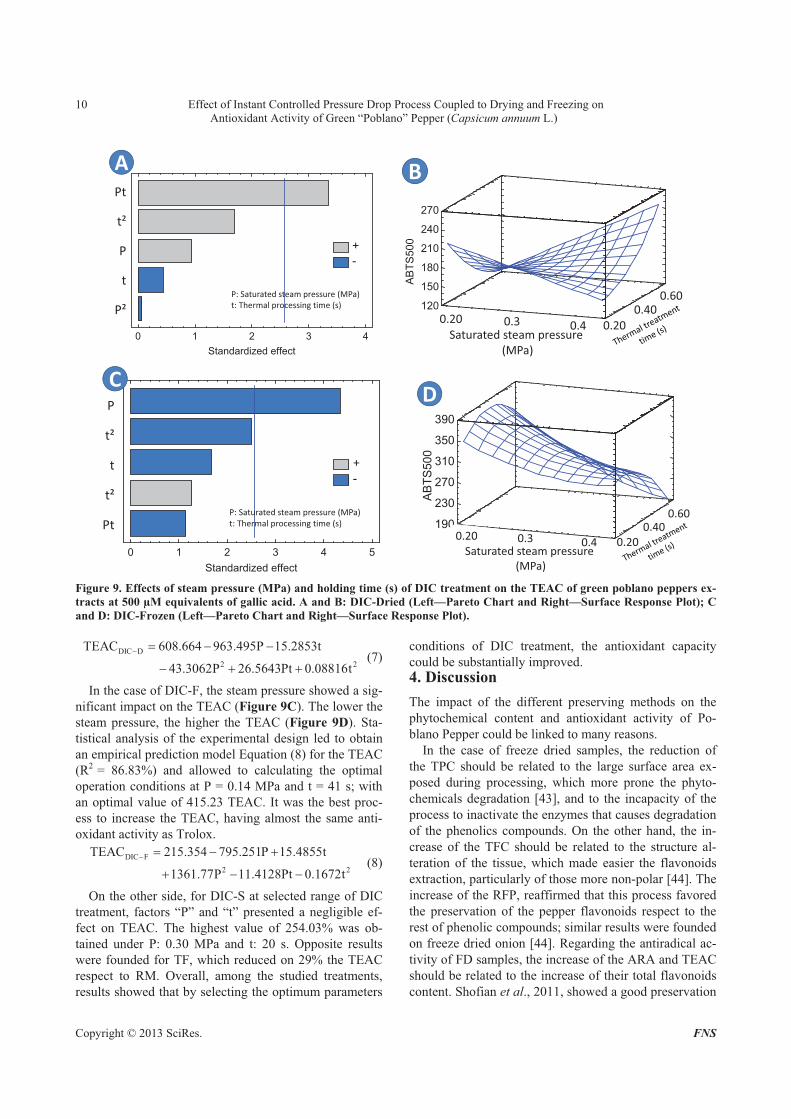
Effect of Instant Controlled Pressure Drop Process Coupled to Drying and Freezing on Antioxidant Activity of Green “Poblano” Pepper (Capsicum annuum L.)
10
0 1 2 3 4
Standardized effect
A
Pt
t²
P
t
P²
+
-
P:!Saturated steam pressure!(MPa)
t:!Thermal!processing time!(s)
0.19 0.23 0.27 0 31 0 35 0 39 0 4326
3136
4146
51
Tim
120
150
180
210
240
270
AB
TS
500
B
0.30.20
Saturated steam pressure!
(MPa)
0.4 0.20
0.400.60
0 1 2 3 4 5
Standardized effect
CP
t²
t
t²
Pt
+
-
P:!Saturated steam pressure!(MPa)
t:!Thermal!processing time!(s)
0.190.23 0 270 310 35 2631
3641
465
Tim
190
230
270
310
350
390A
BT
S5
00
D
0.30.20
Saturated steam pressure!
(MPa)
0.4 0.20
0.400.60
Figure 9. Effects of steam pressure (MPa) and holding time (s) of DIC treatment on the TEAC of green poblano peppers ex-
tracts at 500 µM equivalents of gallic acid. A and B: DIC-Dried (Left—Pareto Chart and Right—Surface Response Plot); C
and D: DIC-Frozen (Left—Pareto Chart and Right—Surface Response Plot).
DIC D
2
TEAC 608.664 963.495P 15.2853t
43.3062P 26.5643Pt 0.08816t
$ # $ $
$ % % 2
2
(7)
In the case of DIC-F, the steam pressure showed a sig-nificant impact on the TEAC (Figure 9C). The lower the steam pressure, the higher the TEAC (Figure 9D). Sta-tistical analysis of the experimental design led to obtain an empirical prediction model Equation (8) for the TEAC (R2 = 86.83%) and allowed to calculating the optimal operation conditions at P = 0.14 MPa and t = 41 s; with an optimal value of 415.23 TEAC. It was the best proc-ess to increase the TEAC, having almost the same anti-oxidant activity as Trolox.
DIC F
2
TEAC 215.354 795.251P 15.4855t
1361.77P 11.4128Pt 0.1672t
$ # $ %
% $ $ (8)
On the other side, for DIC-S at selected range of DIC treatment, factors “P” and “t” presented a negligible ef-fect on TEAC. The highest value of 254.03% was ob-tained under P: 0.30 MPa and t: 20 s. Opposite results were founded for TF, which reduced on 29% the TEAC respect to RM. Overall, among the studied treatments, results showed that by selecting the optimum parameters
conditions of DIC treatment, the antioxidant capacity could be substantially improved. 4. Discussion
The impact of the different preserving methods on the phytochemical content and antioxidant activity of Po-blano Pepper could be linked to many reasons.
In the case of freeze dried samples, the reduction of the TPC should be related to the large surface area ex-posed during processing, which more prone the phyto-chemicals degradation [43], and to the incapacity of the process to inactivate the enzymes that causes degradation of the phenolics compounds. On the other hand, the in-crease of the TFC should be related to the structure al-teration of the tissue, which made easier the flavonoids extraction, particularly of those more non-polar [44]. The increase of the RFP, reaffirmed that this process favored the preservation of the pepper flavonoids respect to the rest of phenolic compounds; similar results were founded on freeze dried onion [44]. Regarding the antiradical ac-tivity of FD samples, the increase of the ARA and TEAC should be related to the increase of their total flavonoids content. Shofian et al., 2011, showed a good preservation
Copyright © 2013 SciRes. FNS
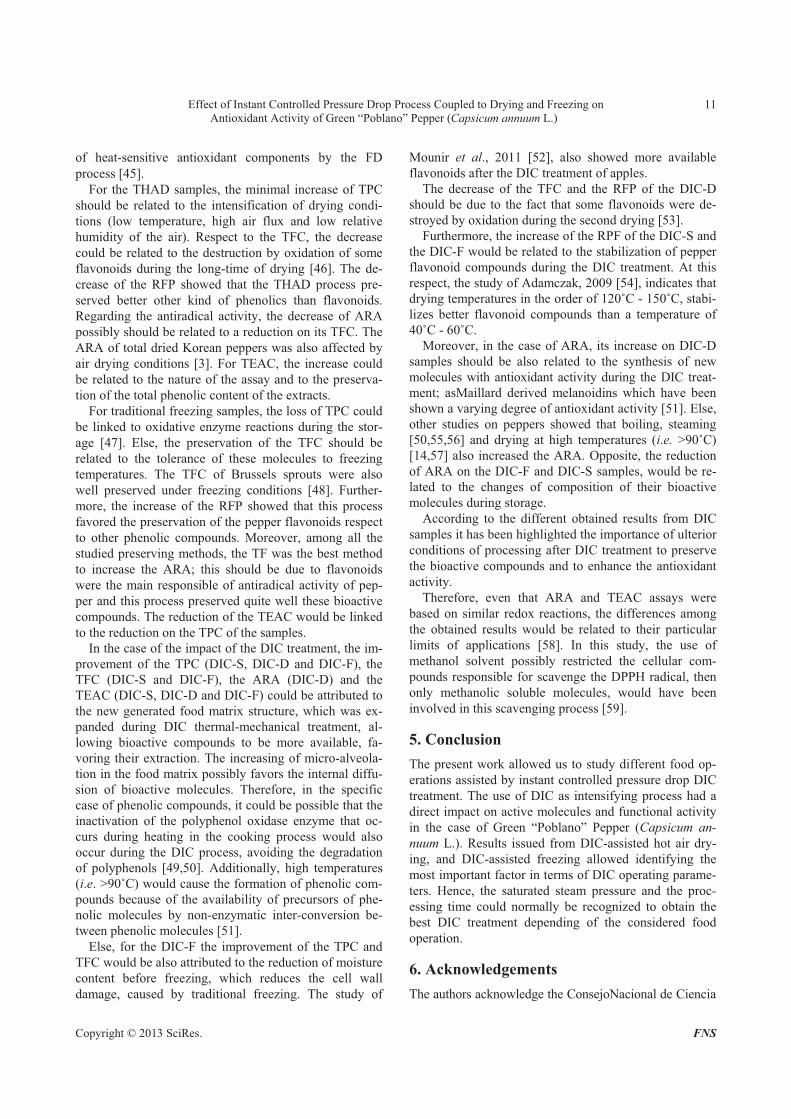
Effect of Instant Controlled Pressure Drop Process Coupled to Drying and Freezing on Antioxidant Activity of Green “Poblano” Pepper (Capsicum annuum L.)
11
of heat-sensitive antioxidant components by the FD process [45].
For the THAD samples, the minimal increase of TPC should be related to the intensification of drying condi-tions (low temperature, high air flux and low relative humidity of the air). Respect to the TFC, the decrease could be related to the destruction by oxidation of some flavonoids during the long-time of drying [46]. The de-crease of the RFP showed that the THAD process pre-served better other kind of phenolics than flavonoids. Regarding the antiradical activity, the decrease of ARA possibly should be related to a reduction on its TFC. The ARA of total dried Korean peppers was also affected by air drying conditions [3]. For TEAC, the increase could be related to the nature of the assay and to the preserva-tion of the total phenolic content of the extracts.
For traditional freezing samples, the loss of TPC could be linked to oxidative enzyme reactions during the stor-age [47]. Else, the preservation of the TFC should be related to the tolerance of these molecules to freezing temperatures. The TFC of Brussels sprouts were also well preserved under freezing conditions [48]. Further-more, the increase of the RFP showed that this process favored the preservation of the pepper flavonoids respect to other phenolic compounds. Moreover, among all the studied preserving methods, the TF was the best method to increase the ARA; this should be due to flavonoids were the main responsible of antiradical activity of pep-per and this process preserved quite well these bioactive compounds. The reduction of the TEAC would be linked to the reduction on the TPC of the samples.
In the case of the impact of the DIC treatment, the im-provement of the TPC (DIC-S, DIC-D and DIC-F), the TFC (DIC-S and DIC-F), the ARA (DIC-D) and the TEAC (DIC-S, DIC-D and DIC-F) could be attributed to the new generated food matrix structure, which was ex-panded during DIC thermal-mechanical treatment, al-lowing bioactive compounds to be more available, fa-voring their extraction. The increasing of micro-alveola- tion in the food matrix possibly favors the internal diffu-sion of bioactive molecules. Therefore, in the specific case of phenolic compounds, it could be possible that the inactivation of the polyphenol oxidase enzyme that oc-curs during heating in the cooking process would also occur during the DIC process, avoiding the degradation of polyphenols [49,50]. Additionally, high temperatures (i.e. >90ûC) would cause the formation of phenolic com-pounds because of the availability of precursors of phe-nolic molecules by non-enzymatic inter-conversion be-tween phenolic molecules [51].
Else, for the DIC-F the improvement of the TPC and TFC would be also attributed to the reduction of moisture content before freezing, which reduces the cell wall damage, caused by traditional freezing. The study of
Mounir et al., 2011 [52], also showed more available flavonoids after the DIC treatment of apples.
The decrease of the TFC and the RFP of the DIC-D should be due to the fact that some flavonoids were de-stroyed by oxidation during the second drying [53].
Furthermore, the increase of the RPF of the DIC-S and the DIC-F would be related to the stabilization of pepper flavonoid compounds during the DIC treatment. At this respect, the study of Adamczak, 2009 [54], indicates that drying temperatures in the order of 120ûC - 150ûC, stabi-lizes better flavonoid compounds than a temperature of 40ûC - 60ûC.
Moreover, in the case of ARA, its increase on DIC-D samples should be also related to the synthesis of new molecules with antioxidant activity during the DIC treat-ment; asMaillard derived melanoidins which have been shown a varying degree of antioxidant activity [51]. Else, other studies on peppers showed that boiling, steaming [50,55,56] and drying at high temperatures (i.e. >90ûC) [14,57] also increased the ARA. Opposite, the reduction of ARA on the DIC-F and DIC-S samples, would be re-lated to the changes of composition of their bioactive molecules during storage.
According to the different obtained results from DIC samples it has been highlighted the importance of ulterior conditions of processing after DIC treatment to preserve the bioactive compounds and to enhance the antioxidant activity.
Therefore, even that ARA and TEAC assays were based on similar redox reactions, the differences among the obtained results would be related to their particular limits of applications [58]. In this study, the use of methanol solvent possibly restricted the cellular com-pounds responsible for scavenge the DPPH radical, then only methanolic soluble molecules, would have been involved in this scavenging process [59].
5. Conclusion
The present work allowed us to study different food op-erations assisted by instant controlled pressure drop DIC treatment. The use of DIC as intensifying process had a direct impact on active molecules and functional activity in the case of Green “Poblano” Pepper (Capsicum an-
nuum L.). Results issued from DIC-assisted hot air dry-ing, and DIC-assisted freezing allowed identifying the most important factor in terms of DIC operating parame-ters. Hence, the saturated steam pressure and the proc-essing time could normally be recognized to obtain the best DIC treatment depending of the considered food operation.
6. Acknowledgements
The authors acknowledge the ConsejoNacional de Ciencia
Copyright © 2013 SciRes. FNS
Effect of Instant Controlled Pressure Drop Process Coupled to Drying and Freezing on Antioxidant Activity of Green “Poblano” Pepper (Capsicum annuum L.)
12
y Tecnología (CONACyT-Mexico) and the Programme de Coopération Post-Gradué Franco-Mexicain (PCP) for the financial support given to this research. Also we wish to thank ABCAR-DIC PROCESS SAS (La Rochelle, France) for providing drier equipment and pilot-scale DIC reactor.
REFERENCES
[1] B. Pickersgill, “Peppers and Chillies,” In: C. Benjamin, Ed., Encyclopedia of Food Sciences and Nutrition, Aca-demic Press, Oxford, 2003, pp. 4460-4467. doi:10.1016/B0-12-227055-X/00904-4
[2] O. Cisneros-Pineda, et al., “Capsaicinoids Quantification in Chili Peppers Cultivated in the State of Yucatan, Mex-ico,” Food Chemistry, Vol. 104, No. 4, 2007, pp. 1755- 1760. doi:10.1016/j.foodchem.2006.10.076
[3] K. Suna, et al., “Effect of Drying in Antioxidant Activity and Changes of Ascorbic Acid and Colour by Different Drying and Storage in Korean Red Pepper (Capsicum
annuum, L.),” International Journal of Food Science &
Technology, Vol. 41, No. S1, 2006, pp. 90-95. doi:10.1111/j.1365-2621.2006.01349.x
[4] M.-R. Kim, et al., “Capsaicin Prevents Ethanol-Induced Teratogenicity in Cultured Mouse Whole Embryos,” Re-
productive Toxicology, Vol. 26, No. 3-4, 2008, pp. 292- 297. doi:10.1016/j.reprotox.2008.09.006
[5] S. Malagarie-Cazenave, et al., “Capsaicin, a Component of Red Peppers, Induces Expression of Androgen Recep-tor via PI3K and MAPK Pathways in Prostate LNCaP Cells,” FEBS Letters, Vol. 583, No. 1, 2009, pp. 141-147. doi:10.1016/j.febslet.2008.11.038
[6] G. Yaldiz, M. Ozguven and N. Sekeroglu, “Variation in Capsaicin Contents of Different Capsicum Species and Lines by Varying Drying Parameters,” Industrial Crops
and Products, Vol. 32, No. 3, 2010, pp. 434-438. doi:10.1016/j.indcrop.2010.06.013
[7] B. J. Xu and S. K. C. Chang, “Effect of Soaking, Boiling, and Steaming on Total Phenolic Content and Antioxidant Activities of Cool Season Food Legumes,” Food Chemis-
try, Vol. 110, No. 1, 2008, pp. 1-13. doi:10.1016/j.foodchem.2008.01.045
[8] R. K. Toor and G. P. Savage, “Effect of Semi-Drying on the Antioxidant Components of Tomatoes,” Food Chem-
istry, Vol. 94, No. 1, 2006, pp. 90-97. doi:10.1016/j.foodchem.2004.10.054
[9] S. Veillet, J. Busch and G. Savage, “Acceptability and Antioxidant Properties of a Semi-Dried and Smoked To-mato Product,” Journal of Food Agriculture & Environ-
ment, Vol. 7, No. 2, 2009, pp. 70-75.
[10] A. M. Chuah, et al., “Effect of Cooking on the Antioxi-dant Properties of Coloured Peppers,” Food Chemistry, Vol. 111, No. 1, 2008, pp. 20-28. doi:10.1016/j.foodchem.2008.03.022
[11] J. K. Willcox, S. L. Ash and G. L. Catignani, “Antioxi-dants and Prevention of Chronic Disease,” Critical Re-
views in Food Science & Nutrition, Vol. 44, No. 4, 2004,
pp. 275-295. doi:10.1080/10408690490468489
[12] L. R. Howard and C. Hernandez-Brenes, “Antioxidant Content and Market Quality of Jalapeno Pepper Rings as Affected by Minimal Processing and Modified Atmos-phere Packaging,” Journal of Food Quality, Vol. 21, No. 4, 1998, pp. 317-327. doi:10.1111/j.1745-4557.1998.tb00525.x
[13] C. Ratti, et al., “Drying of Garlic (Allium sativum) and Its Effect on Allicin Retention,” Drying Technology, Vol. 25, No. 2, 2007, pp. 349-356. doi:10.1080/07373930601120100
[14] A. Vega-Galvez, et al., “Effect of Air-Drying Tempera-ture on Physico-Chemical Properties, Antioxidant Capac-ity, Colour and Total Phenolic Content of Red Pepper (Capsicum annuum L. var. Hungarian),” Food Chemistry, Vol. 117, No. 4, 2009, pp. 647-653. doi:10.1016/j.foodchem.2009.04.066
[15] E. K. Dermesonlouoglou, M. C. Giannakourou and P. Taoukis, “Stability of Dehydrofrozen Tomatoes Pretreated with Alternative Osmotic Solutes,” Journal of Food En-
gineering, Vol. 78, No. 1, 2007, pp. 272-280. doi:10.1016/j.jfoodeng.2005.09.026
[16] C. Ilicali and F. Icier, “Freezing Time Prediction for Par-tially Dried Papaya Puree with Infinite Cylinder Geome-try,” Journal of Food Engineering, Vol. 100, No. 4, 2010, pp. 696-704. doi:10.1016/j.jfoodeng.2010.05.022
[17] S. A. Rezzoug, et al., “Effect of Instantaneous Controlled Pressure Drop Process on the Hydration Capacity of Scleroglucan: Optimisation of Operating Conditions by Response Surface Methodology,” Carbohydrate Polymers, Vol. 42, No. 1, 2000, pp. 73-84. doi:10.1016/S0144-8617(99)00122-8
[18] B. B. Amor, et al., “Effect of Instant Controlled Pressure Drop Treatments on the Oligosaccharides Extractability and Microstructure of Tephrosia purpurea Seeds,” Jour-
nal of Chromatography A, Vol. 1213, No. 2, 2008, pp. 118-124. doi:10.1016/j.chroma.2008.10.065
[19] I. M. Kamal, et al., “Structure Expansion of Green Coffee Beans Using Instantaneous Controlled Pressure Drop Pro- cess,” Innovative Food Science & Emerging Technologies, Vol. 9, No. 4, 2008, pp. 534-541. doi:10.1016/j.ifset.2008.01.004
[20] AOAC, “Official Methods of Analysis of AOAC (Asso-ciation of Official Analytical Chemists) International (CD-ROM),” AOAC International, Gaithersburg, 1996.
[21] S. S. Nielsen, “Food Analysis Laboratory Manual,” Klu-wer Academic/Plenum Publishers, New York, 2003.
[22] A. Cardador-Martinez, G. Loarca-Pina and B. D. Oomah, “Antioxidant activity in common beans (Phaseolus vul-
garis L.),” Journal of Agricultural and Food Chemistry, Vol. 50, No. 24, 2002, pp. 6975-6980. doi:10.1021/jf020296n
[23] V. L. Singleton and J. A. Rossi Jr., “Colorimetry of Total Phenolics with Phosphomolybdic-Phosphotungstic Acid Reagents,” American Journal of Enology Viticulture, Vol. 16, No. 3, 1965, pp. 144-158.
[24] B. D. Oomah, A. Cardador-Martínez and G. Loarca-Piña,
Copyright © 2013 SciRes. FNS
Effect of Instant Controlled Pressure Drop Process Coupled to Drying and Freezing on Antioxidant Activity of Green “Poblano” Pepper (Capsicum annuum L.)
13
“Phenolics and Antioxidative Activities in Common Beans (Phaseolus vulgaris L.),” Journal of the Science of Food
and Agriculture, Vol. 85, No. 6, 2005, pp. 935-942. doi:10.1002/jsfa.2019
[25] R. Re, et al., “Antioxidant Activity Applying an Improved ABTS Radical Cation Decolorization Assay,” Free Ra- dical Biology and Medicine, Vol. 26, No. 9-10, 1999, pp. 1231-1237. doi:10.1016/S0891-5849(98)00315-3
[26] N. Albitar, et al., “Improving the Drying of Onion Using the Instant Controlled Pressure Drop Technology,” Dry-ing Technology, Vol. 29, No. 9, 2011, pp. 993-1001. doi:10.1080/07373937.2010.507912
[27] D. T. Cong, et al., “Dehydration by Successive Pressure Drops for Drying Paddy Rice Treated by Instant Con-trolled Pressure Drop,” Drying Technology, Vol. 26, No. 4, 2008, pp. 443-451. doi:10.1080/07373930801929300
[28] J. M. F. Faustino, M. J. Barroca and R. P. F. Guiné, “Study of the Drying Kinetics of Green Bell Pepper and Chemical Characterization,” Food and Bioproducts Proc-essing, Vol. 85, No. 3, 2007, pp. 163-170. doi:10.1205/fbp07009
[29] N. Deepa, et al., “Antioxidant Activity in Some Red Sweet Pepper Cultivars,” Journal of Food Composition and Analysis, Vol. 19, No. 6-7, 2006, pp. 572-578. doi:10.1016/j.jfca.2005.03.005
[30] G. F. Antonious, et al., “Antioxidants in Hot Pepper: Variation among Accessions,” Journal of Environmental Science and Health Part B: Pesticides, Food Contami-nants and Agricultural Wastes, Vol. 41, No. 7, 2006, pp. 1237-1243. doi:10.1080/03601230600857114
[31] M. Materska and I. Perucka, “Antioxidant Activity of the Main Phenolic Compounds Isolated from Hot Pepper Fruit (Capsicum annuum L.),” Journal of Agricultural and
Food Chemistry, Vol. 53, No. 5, 2005, pp. 1750-1756. doi:10.1021/jf035331k
[32] M. Serrano, et al., “Antioxidant and Nutritive Constitu-ents during Sweet Pepper Development and Ripening Are Enhanced by Nitrophenolate Treatments,” Food Chemis-
try, Vol. 118, No. 3, 2010, pp. 497-503. doi:10.1016/j.foodchem.2009.05.006
[33] L. R. Howard, et al., “Changes in Phytochemical and Antioxidant Activity of Selected Pepper Cultivars (Cap-sicum Species) As Influenced by Maturity,” Journal of
Agricultural and Food Chemistry, Vol. 48, No. 5, 2000, pp. 1713-1720. doi:10.1021/jf990916t
[34] F. Menichini, et al., “The Influence of Fruit Ripening on the Phytochemical Content and Biological Activity of Capsicum chinense Jacq. cv Habanero,” Food Chemistry, Vol. 114, No. 2, 2009, pp. 553-560. doi:10.1016/j.foodchem.2008.09.086
[35] J. M. Navarro, et al., “Changes in the Contents of Anti-oxidant Compounds in Pepper Fruits at Different Ripen-ing Stages, as Affected by Salinity,” Food Chemistry, Vol. 96, No. 1, 2006, pp. 66-73. doi:10.1016/j.foodchem.2005.01.057
[36] A. W. Chassy, et al., “Three-Year Comparison of the Content of Antioxidant Microconstituents and Several Quality Characteristics in Organic and Conventionally
Managed Tomatoes and Bell Peppers,” Journal of Agri-
cultural and Food Chemistry, Vol. 54, No. 21, 2006, pp. 8244-8252. doi:10.1021/jf060950p
[37] M. Ghasemnezhad, M. Sherafati and G. A. Payvast, “Variation in Phenolic Compounds, Ascorbic Acid and Antioxidant Activity of Five Coloured Bell Pepper (Cap-sicum annuum) Fruits at Two Different Harvest Times,” Journal of Functional Foods, Vol. 3, No. 1, 2011, pp. 44- 49. doi:10.1016/j.jff.2011.02.002
[38] M. Materska, et al., “Isolation and Structure Elucidation of Flavonoid and Phenolic Acid Glycosides from Pericarp of Hot Pepper Fruit Capsicum annuum L.,” Phytochemis-try, Vol. 63, No. 8, 2003, pp. 893-898. doi:10.1016/S0031-9422(03)00282-6
[39] J. Peterson and J. Dwyer, “Flavonoids: Dietary Occur-rence and Biochemical Activity,” Nutrition Research, Vol. 18, No. 12, 1998, pp. 1995-2018. doi:10.1016/S0271-5317(98)00169-9
[40] H. Matsufuji, et al., “Anti-Oxidant Content of Different Coloured Sweet Peppers, White, Green, Yellow, Orange and Red (Capsicum annuum L.),” International Journal of Food Science & Technology, Vol. 42, No. 12, 2007, pp. 1482-1488. doi:10.1111/j.1365-2621.2006.01368.x
[41] O. Y. Celiktas, E. Bedir and F. V. Sukan, “In Vitro Anti-oxidant Activities of Rosmarinus officinalis Extracts Treated with Supercritical Carbon Dioxide,” Food Chem-istry, Vol. 101, No. 4, 2007, pp. 1457-1464. doi:10.1016/j.foodchem.2006.03.055
[42] D. Ramdane and J. S. Mohan, “Production Practices and Quality Assessment of Food Crops 4 Volumes: Vol. 3. Quality Handling and Evaluation,” Kluwer Academic Pub-lishers, Dordrecht, 2004.
[43] S. Y. Leong and I. Oey, “Effects of Processing on An-thocyanins, Carotenoids and Vitamin C in Summer Fruits and Vegetables,” Food Chemistry, Vol. 133, No. 4, 2012, pp. 1577-1587. doi:10.1016/j.foodchem.2012.02.052
[44] M. R. Pérez-Gregorio, et al., “Changes in Antioxidant Flavonoids during Freeze-Drying of Red Onions and Sub-sequent Storage,” Food Control, Vol. 22, No. 7, 2011, pp. 1108-1113. doi:10.1016/j.foodcont.2011.01.006
[45] N. M. Shofian, et al., “Effect of Freeze-Drying on the Antioxidant Compounds and Antioxidant Activity of Se-lected Tropical Fruits,” International Journal of Molecu-
lar Sciences, Vol. 12, No. 7, 2011, pp. 4678-4692. doi:10.3390/ijms12074678
[46] C.-H. Zhou, et al., “Effects of Drying Methods on the Bioactive Components in Loquat (Eriobotrya japonica Lindl.) Flowers,” Journal of Medicinal Plants Research, Vol. 5, No. 14, 2011, pp. 3037-3041.
[47] H. S. Lee and G. A. Coates, “Vitamin C in Frozen, Fresh Squeezed, Unpasteurized, Polyethylene-Bottled Orange Juice: A Storage Study,” Food Chemistry, Vol. 65, No. 2, 1999, pp. 165-168. doi:10.1016/S0308-8146(98)00180-0
[48] D. F. Olivera, et al., “Effect of Blanching on the Quality of Brussels sprouts (Brassica oleracea L. gemmifera DC) after Frozen Storage,” Journal of Food Engineering, Vol. 84, No. 1, 2008, pp. 148-155. doi:10.1016/j.jfoodeng.2007.05.005
Copyright © 2013 SciRes. FNS
Effect of Instant Controlled Pressure Drop Process Coupled to Drying and Freezing on Antioxidant Activity of Green “Poblano” Pepper (Capsicum annuum L.)
Copyright © 2013 SciRes. FNS
14
[49] T. Yamaguchi, et al., “Influence of Polyphenol and As- corbate Oxidases during Cooking Process on the Radical- Scavenging Activity of Vegetables,” Food Science and
Technology Research, Vol. 9, No. 1, 2003, pp. 79-83. doi:10.3136/fstr.9.79
[50] N. Turkmen, F. Sari and Y. S. Velioglu, “The Effect of Cooking Methods on Total Phenolics and Antioxidant Activity of Selected Green Vegetables,” Food Chemistry, Vol. 93, No. 4, 2005, pp. 713-718. doi:10.1016/j.foodchem.2004.12.038
[51] F. Que, et al., “Comparison of Hot Air-Drying and Freeze- Drying on the Physicochemical Properties and Antioxi-dant Activities of Pumpkin (Cucurbita moschata Duch.) flours. International Journal of Food Science & Tech-
nology, Vol. 43, No. 7, 2008, pp. 1195-1201. doi:10.1111/j.1365-2621.2007.01590.x
[52] S. Mounir, et al., “Study of Instant Controlled Pressure Drop DIC Treatment in Manufacturing Snack and Ex-panded Granule Powder of Apple and Onion,” Drying
Technology, Vol. 29, No. 3, 2011, pp. 331-341. doi:10.1080/07373937.2010.491585
[53] I. Ioannou and M. Ghoul, “Biological Activities and Ef-fects of Food Processing on Flavonoids as Phenolic An-tioxidants,” In: M. Petre, Ed., Advances in Applied Bio-
technology, InTech, Rijeka, 2012.
[54] A. Adamczak, W. Buchwald and S. M. Kozlowski, “The Effect of Thermal and Freeze Drying on the Content of
Organic Acids and Flavonoids in Fruit of European Cran-berry (Oxycoccus palustris Pers.),” Herba Polonica, Vol. 55, No. 3, 2009, pp. 94-102.
[55] C. W. Rico, et al., “The Comparative Effect of Steaming and Irradiation on the Physicochemical and Microbi-ological Properties of Dried Red Pepper (Capsicum an-
num L.),” Food Chemistry, Vol. 119, No. 3, 2010, pp. 1012-1016. doi:10.1016/j.foodchem.2009.08.005
[56] S. Shobana and K. A. Naidu, “Antioxidant Activity of Selected Indian Spices,” Prostaglandins, Leukotrienes and Essential Fatty Acids, Vol. 62, No. 2, 2000, pp. 107- 110. doi:10.1054/plef.1999.0128
[57] D. Arslan and M. M. Özcan, “Dehydration of Red Bell- Pepper (Capsicum annuum L.): Change in Drying Be-havior, Colour and Antioxidant Content,” Food and Bio-
products Processing, Vol. 89, No. 4, 2011, pp. 504-513. doi:10.1016/j.fbp.2010.09.009
[58] D. Huang, B. Ou and R. L. Prior, “The Chemistry behind Antioxidant Capacity Assays,” Journal of Agricultural
and Food Chemistry, Vol. 53, No. 6, 2005, pp. 1841-1856. doi:10.1021/jf030723c
[59] K. Marxen, et al., “Determination of DPPH Radical Oxi-dation Caused by Methanolic Extracts of Some Microal-gal Species by Linear Regression Analysis of Spectro-photometric Measurements,” Sensors, Vol. 7, No. 10, 2007, pp. 2080-2095. doi:10.3390/s7102080

SWELL-DRYING OF GREEN MOROCCAN PEPPER (CAPSICUM
ANNUM): MODELING AND QUALITY PROPERTIES Téllez-Pérez Carmen
a,c, Cardador-Martínez Anaberta
a, Mounir Sabah
b, Montejano-
Gaitán José Gerardoa, Vaclav Sobolik
c and Allaf Karim
c
a. Instituto Tecnológico de Estudios Superiores de Monterrey, Campus Querétaro. Cátedra de Investigación de Biotecnología Agroalimentaria, Querétaro, México.
b. Zagazig University, Faculty of Agriculture, Department of Food Science, Zagazig, Egypt c. University of La Rochelle, Intensification of Transfer Phenomena on Industrial Eco-Processes,
Laboratory Engineering Science for Environment LaSIE FRE 3474 CNRS, 17042 La Rochelle, France
Introduction
Hot air drying is one of the processes most frequently employed for food dehydration; nevertheless it damages structural, physical and chemical characteristics, usually due to overheating. Peppers are a good source of active molecules with remarkable antioxidant activity. They are commonly consumed in their dried form, although the traditional drying conditions cause high quality losses. Therefore, the objective of this work was to study the drying performance of the Swell Drying process and its impact on the quality of Green Moroccan Peppers -GMPs- (Capsicum annuum) in terms of phenolic content and antioxidant activity.
Materials and Methods
Materials
Physiologically ripe Green Moroccan Peppers (GMPs), var. Capsicum annum were bought on March 2011, from a popular local market at La Rochelle, France.
Methods
Sample Preparation
Before drying, good quality peppers (absence of mold and insect contamination) were manually selected and washed. From whole washed fruit, peduncles, seeds, capsaicin glands, and placenta, were eliminated. The Pericarp was manually cut in rounds (to an average thickness of approximately 5.5 mm. Rounds peppers were divided in three lots, one for Traditional Hot Air Drying (THD), second for Freeze Drying (FD) and third for Swell Drying (SD).
Drying Techniques
Freeze Drying
Traditional freeze drying (FD) of peppers was applied on three stages: external freezing (-20 °C for 2h), sublimation (-20 °C, 0.66 Pa for 12 h) and desorption (25 °C, 0.66 Pa for 12 h).
Traditional Hot Air Drying
Traditional hot air drying (THD) of peppers was carried out at a drying temperature of 50 °C, at a partial pressure of vapor of 265 Pa and with an air flux of 1.2 m s-1. Drying process ended when sample moisture content recorded no significant changes during the time (< 0.1% db).
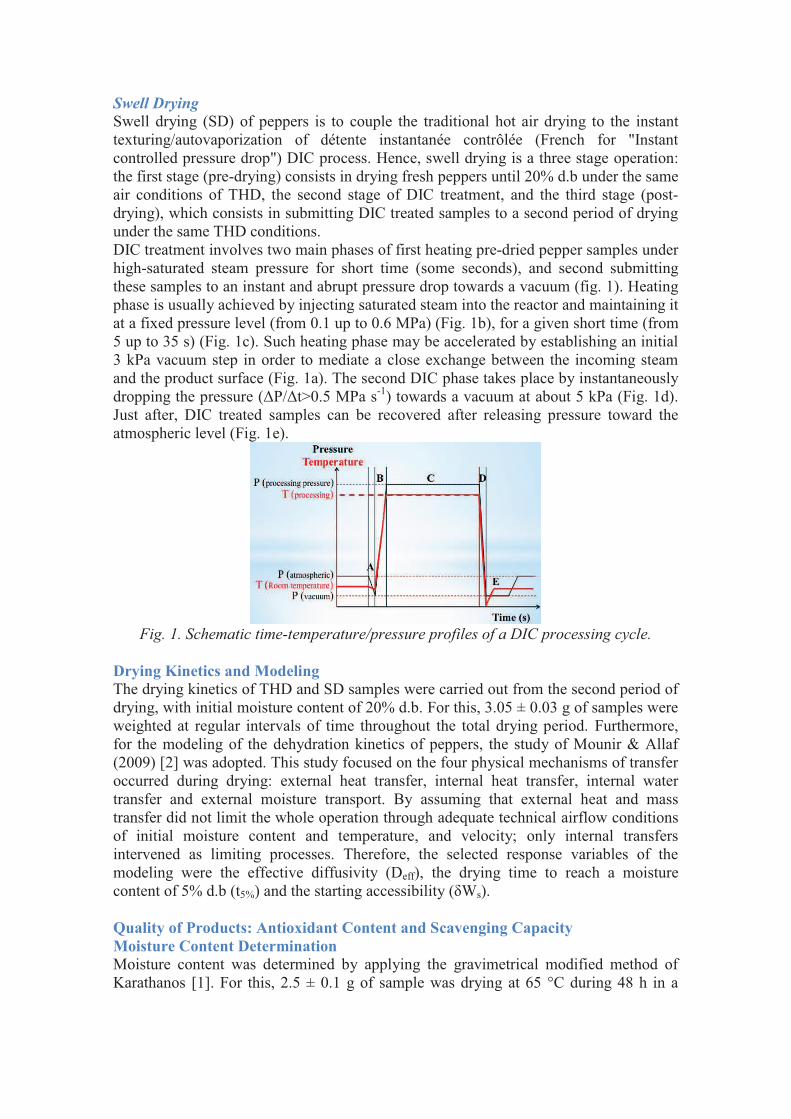
Swell Drying
Swell drying (SD) of peppers is to couple the traditional hot air drying to the instant texturing/autovaporization of détente instantanée contrôlée (French for "Instant controlled pressure drop") DIC process. Hence, swell drying is a three stage operation: the first stage (pre-drying) consists in drying fresh peppers until 20% d.b under the same air conditions of THD, the second stage of DIC treatment, and the third stage (post-drying), which consists in submitting DIC treated samples to a second period of drying under the same THD conditions. DIC treatment involves two main phases of first heating pre-dried pepper samples under high-saturated steam pressure for short time (some seconds), and second submitting these samples to an instant and abrupt pressure drop towards a vacuum (fig. 1). Heating phase is usually achieved by injecting saturated steam into the reactor and maintaining it at a fixed pressure level (from 0.1 up to 0.6 MPa) (Fig. 1b), for a given short time (from 5 up to 35 s) (Fig. 1c). Such heating phase may be accelerated by establishing an initial 3 kPa vacuum step in order to mediate a close exchange between the incoming steam and the product surface (Fig. 1a). The second DIC phase takes place by instantaneously dropping the pressure (ΔP/Δt>0.5 MPa s-1) towards a vacuum at about 5 kPa (Fig. 1d). Just after, DIC treated samples can be recovered after releasing pressure toward the atmospheric level (Fig. 1e).
Fig. 1. Schematic time-temperature/pressure profiles of a DIC processing cycle.
Drying Kinetics and Modeling
The drying kinetics of THD and SD samples were carried out from the second period of drying, with initial moisture content of 20% d.b. For this, 3.05 ± 0.03 g of samples were weighted at regular intervals of time throughout the total drying period. Furthermore, for the modeling of the dehydration kinetics of peppers, the study of Mounir & Allaf (2009) [2] was adopted. This study focused on the four physical mechanisms of transfer occurred during drying: external heat transfer, internal heat transfer, internal water transfer and external moisture transport. By assuming that external heat and mass transfer did not limit the whole operation through adequate technical airflow conditions of initial moisture content and temperature, and velocity; only internal transfers intervened as limiting processes. Therefore, the selected response variables of the modeling were the effective diffusivity (Deff), the drying time to reach a moisture content of 5% d.b (t5%) and the starting accessibility (δWs).
Quality of Products: Antioxidant Content and Scavenging Capacity
Moisture Content Determination
Moisture content was determined by applying the gravimetrical modified method of Karathanos [1]. For this, 2.5 ± 0.1 g of sample was drying at 65 °C during 48 h in a
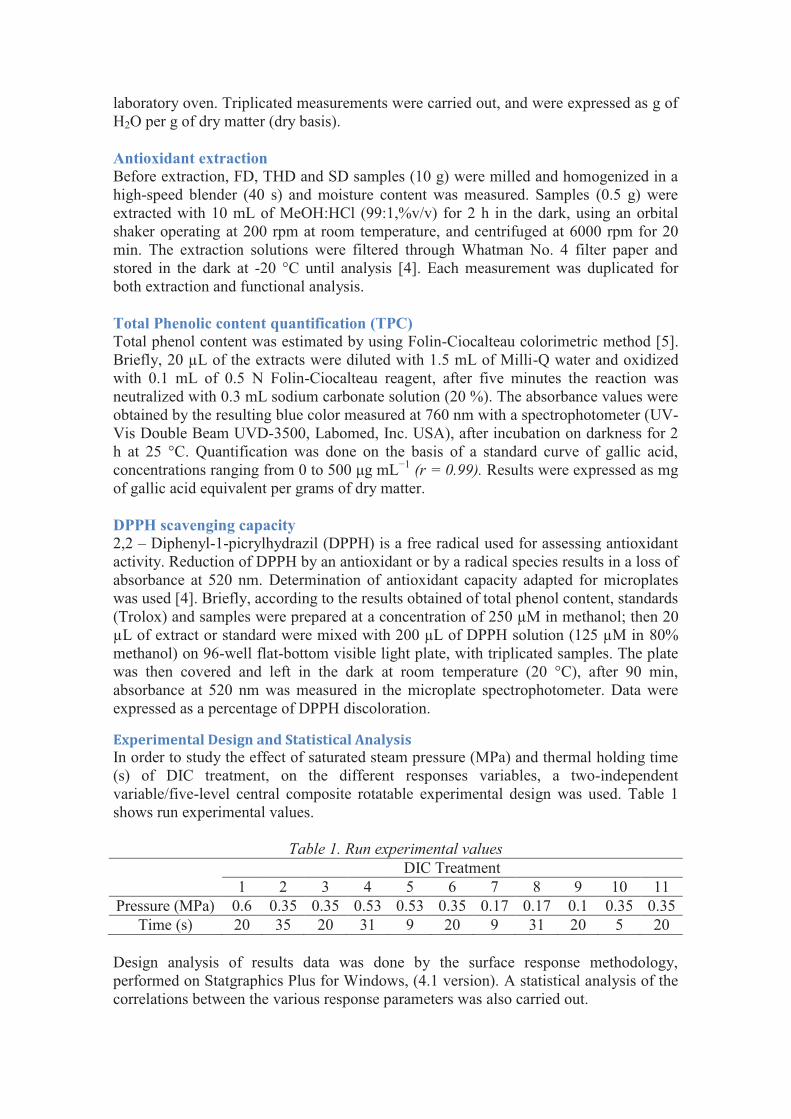
laboratory oven. Triplicated measurements were carried out, and were expressed as g of H2O per g of dry matter (dry basis).
Antioxidant extraction
Before extraction, FD, THD and SD samples (10 g) were milled and homogenized in a high-speed blender (40 s) and moisture content was measured. Samples (0.5 g) were extracted with 10 mL of MeOH:HCl (99:1,%v/v) for 2 h in the dark, using an orbital shaker operating at 200 rpm at room temperature, and centrifuged at 6000 rpm for 20 min. The extraction solutions were filtered through Whatman No. 4 filter paper and stored in the dark at -20 °C until analysis [4]. Each measurement was duplicated for both extraction and functional analysis.
Total Phenolic content quantification (TPC)
Total phenol content was estimated by using Folin-Ciocalteau colorimetric method [5]. Briefly, 20 µL of the extracts were diluted with 1.5 mL of Milli-Q water and oxidized with 0.1 mL of 0.5 N Folin-Ciocalteau reagent, after five minutes the reaction was neutralized with 0.3 mL sodium carbonate solution (20 %). The absorbance values were obtained by the resulting blue color measured at 760 nm with a spectrophotometer (UV-Vis Double Beam UVD-3500, Labomed, Inc. USA), after incubation on darkness for 2 h at 25 °C. Quantification was done on the basis of a standard curve of gallic acid, concentrations ranging from 0 to 500 μg mL
−1 (r = 0.99). Results were expressed as mg of gallic acid equivalent per grams of dry matter.
DPPH scavenging capacity
2,2 – Diphenyl-1-picrylhydrazil (DPPH) is a free radical used for assessing antioxidant activity. Reduction of DPPH by an antioxidant or by a radical species results in a loss of absorbance at 520 nm. Determination of antioxidant capacity adapted for microplates was used [4]. Briefly, according to the results obtained of total phenol content, standards (Trolox) and samples were prepared at a concentration of 250 µM in methanol; then 20 µL of extract or standard were mixed with 200 µL of DPPH solution (125 µM in 80% methanol) on 96-well flat-bottom visible light plate, with triplicated samples. The plate was then covered and left in the dark at room temperature (20 °C), after 90 min, absorbance at 520 nm was measured in the microplate spectrophotometer. Data were expressed as a percentage of DPPH discoloration.
Experimental Design and Statistical Analysis
In order to study the effect of saturated steam pressure (MPa) and thermal holding time (s) of DIC treatment, on the different responses variables, a two-independent variable/five-level central composite rotatable experimental design was used. Table 1 shows run experimental values.
Table 1. Run experimental values
DIC Treatment 1 2 3 4 5 6 7 8 9 10 11
Pressure (MPa) 0.6 0.35 0.35 0.53 0.53 0.35 0.17 0.17 0.1 0.35 0.35 Time (s) 20 35 20 31 9 20 9 31 20 5 20
Design analysis of results data was done by the surface response methodology, performed on Statgraphics Plus for Windows, (4.1 version). A statistical analysis of the correlations between the various response parameters was also carried out.
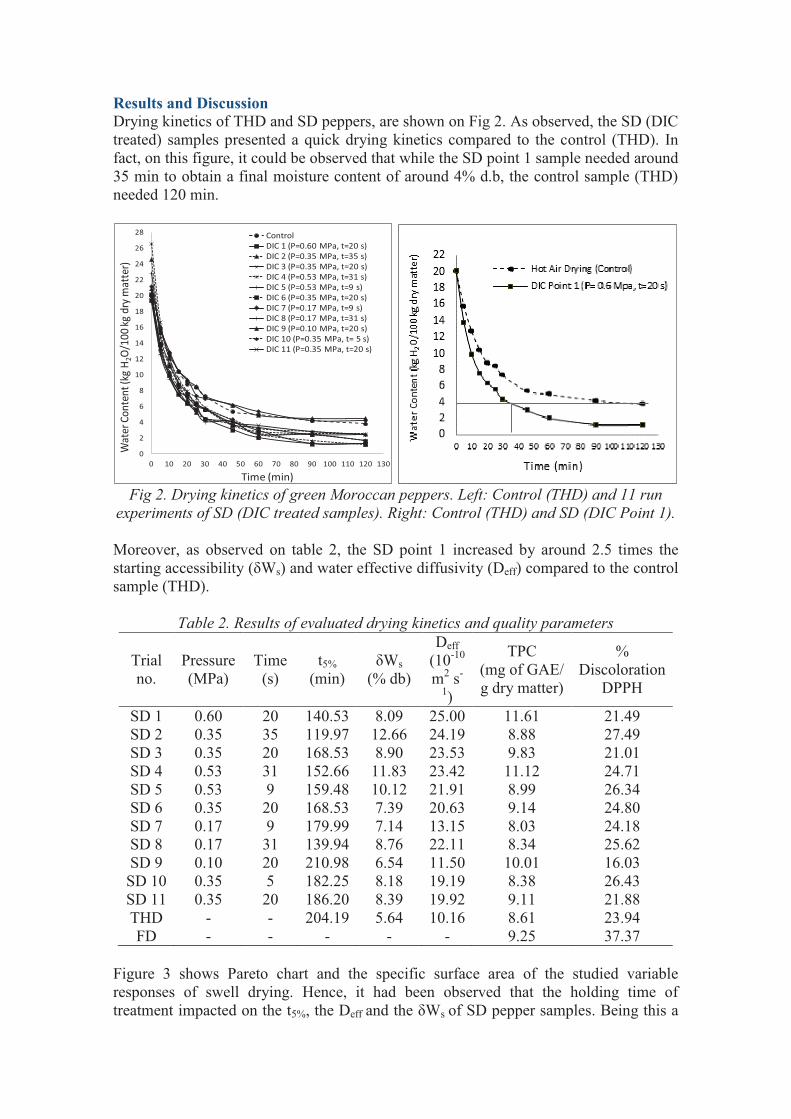
Results and Discussion
Drying kinetics of THD and SD peppers, are shown on Fig 2. As observed, the SD (DIC treated) samples presented a quick drying kinetics compared to the control (THD). In fact, on this figure, it could be observed that while the SD point 1 sample needed around 35 min to obtain a final moisture content of around 4% d.b, the control sample (THD) needed 120 min.
Fig 2. Drying kinetics of green Moroccan peppers. Left: Control (THD) and 11 run
experiments of SD (DIC treated samples). Right: Control (THD) and SD (DIC Point 1).
Moreover, as observed on table 2, the SD point 1 increased by around 2.5 times the starting accessibility (δWs) and water effective diffusivity (Deff) compared to the control sample (THD).
Table 2. Results of evaluated drying kinetics and quality parameters
Trial no.
Pressure (MPa)
Time (s)
t5% (min)
δWs (% db)
Deff (10-10 m2 s-
1)
TPC (mg of GAE/ g dry matter)
% Discoloration
DPPH
SD 1 0.60 20 140.53 8.09 25.00 11.61 21.49 SD 2 0.35 35 119.97 12.66 24.19 8.88 27.49 SD 3 0.35 20 168.53 8.90 23.53 9.83 21.01 SD 4 0.53 31 152.66 11.83 23.42 11.12 24.71 SD 5 0.53 9 159.48 10.12 21.91 8.99 26.34 SD 6 0.35 20 168.53 7.39 20.63 9.14 24.80 SD 7 0.17 9 179.99 7.14 13.15 8.03 24.18 SD 8 0.17 31 139.94 8.76 22.11 8.34 25.62 SD 9 0.10 20 210.98 6.54 11.50 10.01 16.03 SD 10 0.35 5 182.25 8.18 19.19 8.38 26.43 SD 11 0.35 20 186.20 8.39 19.92 9.11 21.88 THD - - 204.19 5.64 10.16 8.61 23.94 FD - - - - - 9.25 37.37
Figure 3 shows Pareto chart and the specific surface area of the studied variable responses of swell drying. Hence, it had been observed that the holding time of treatment impacted on the t5%, the Deff and the δWs of SD pepper samples. Being this a
0
2
4
6
8
10
12
14
16
18
20
22
24
26
28
0 10 20 30 40 50 60 70 80 90 100 110 120 130
Wa
ter
Co
nte
nt
(kg
H2O
/10
0 k
g d
ry m
att
er)
Time (min)
Control
DIC 1 (P=0.60 MPa, t=20 s)
DIC 2 (P=0.35 MPa, t=35 s)
DIC 3 (P=0.35 MPa, t=20 s)
DIC 4 (P=0.53 MPa, t=31 s)
DIC 5 (P=0.53 MPa, t=9 s)
DIC 6 (P=0.35 MPa, t=20 s)
DIC 7 (P=0.17 MPa, t=9 s)
DIC 8 (P=0.17 MPa, t=31 s)
DIC 9 (P=0.10 MPa, t=20 s)
DIC 10 (P=0.35 MPa, t= 5 s)
DIC 11 (P=0.35 MPa, t=20 s)
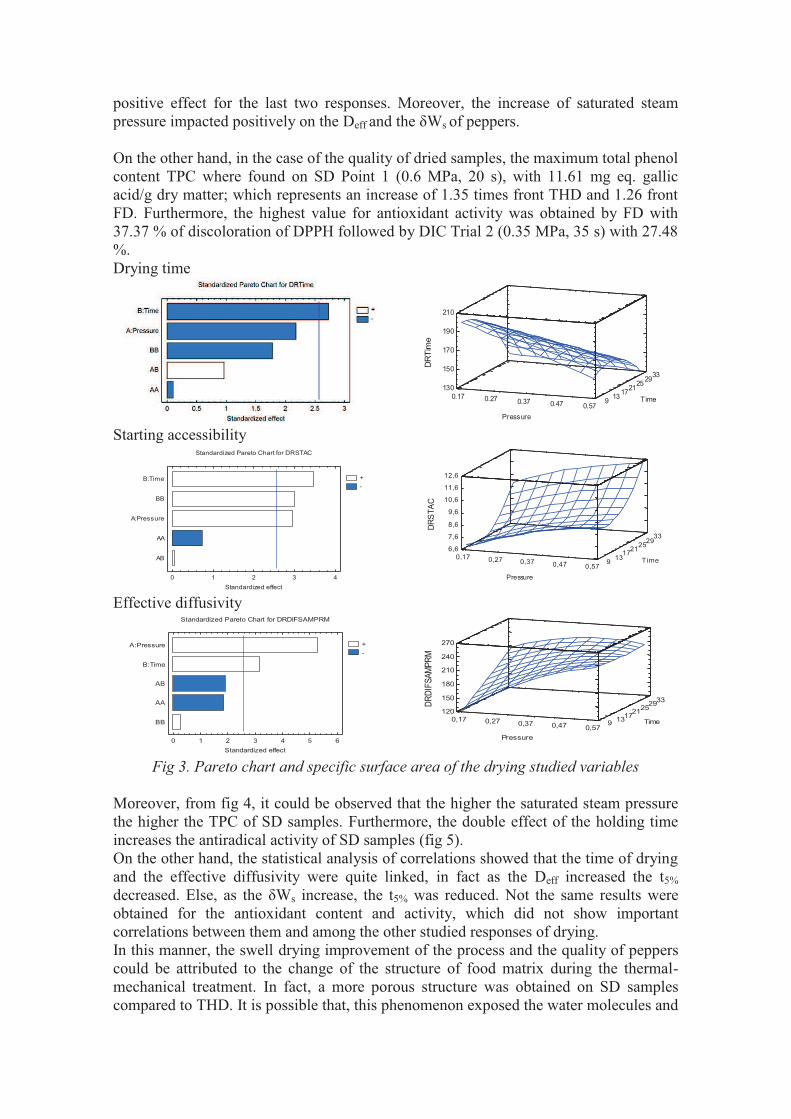
positive effect for the last two responses. Moreover, the increase of saturated steam pressure impacted positively on the Deff and the δWs of peppers. On the other hand, in the case of the quality of dried samples, the maximum total phenol content TPC where found on SD Point 1 (0.6 MPa, 20 s), with 11.61 mg eq. gallic acid/g dry matter; which represents an increase of 1.35 times front THD and 1.26 front FD. Furthermore, the highest value for antioxidant activity was obtained by FD with 37.37 % of discoloration of DPPH followed by DIC Trial 2 (0.35 MPa, 35 s) with 27.48 %.
Fig 3. Pareto chart and specific surface area of the drying studied variables
Moreover, from fig 4, it could be observed that the higher the saturated steam pressure the higher the TPC of SD samples. Furthermore, the double effect of the holding time increases the antiradical activity of SD samples (fig 5). On the other hand, the statistical analysis of correlations showed that the time of drying and the effective diffusivity were quite linked, in fact as the Deff increased the t5% decreased. Else, as the δWs increase, the t5% was reduced. Not the same results were obtained for the antioxidant content and activity, which did not show important correlations between them and among the other studied responses of drying. In this manner, the swell drying improvement of the process and the quality of peppers could be attributed to the change of the structure of food matrix during the thermal- mechanical treatment. In fact, a more porous structure was obtained on SD samples compared to THD. It is possible that, this phenomenon exposed the water molecules and
Drying time
Starting accessibility
Effective diffusivity
0.17 0.27 0.37 0.47 0.57
Pressure
913
1721
2529
33
Time
130
150
170
190
210
DR
Tim
e
Standardized Pareto Chart for DRSTAC
0 1 2 3 4
Standardized effect
AB
AA
A:Pressure
BB
B:Time +
-
0,17 0,27 0,37 0,47 0,57
Pressure
913
1721
2529
33
Time
6,6
7,6
8,6
9,6
10,6
11,6
12,6
DR
ST
AC
Standardized Pareto Chart for DRDIFSAMPRM
0 1 2 3 4 5 6
Standardized effect
BB
AA
AB
B:Time
A:Pressure +
-
0,17 0,27 0,37 0,47 0,57
Pressure
913
1721
2529
33
Time
120
150
180
210
240
270
DR
DIF
SA
MP
RM

the bioactive compounds (i.e phenolics) favoring the drying and the extraction of biomolecules. Furthermore, it is possible that inactivation of the polyphenol oxidase enzyme during heating that occurred in the cooking process also occurred in the SD process, avoiding the degradation of polyphenols.
Fig 4. Pareto chart and specific surface area of the quality studied variable responses.
Conclusion
The obtained results showed that the Swell Drying significantly improved the performance of the drying process and the quality of products. On the drying process, it reduced the time of drying and increased the effective diffusivity and the starting accessibility. On the quality aspect, it increased the extraction of phenolic compounds and enhanced the antioxidant capacity of peppers as compared to the conventional drying. Furthermore, thanks to the possibility of the SD process to the optimization of their operating parameters (saturated steam pressure and thermal holding time), the SD process can be considered as an interesting economic flexible process to improve both the dehydrated process and the quality of peppers.
References
1. Karathanos, V.T., Determination of water content of dried fruits by drying
kinetics. Journal of Food Engineering, 1999. 39(4): p. 337-344. 2. Mounir, S. and K. Allaf. Study and modeling of dehydration and rehydration
kinetics within porous medium. in Association Française de Séchage pour
l'Industrie et l'Agriculture - AFSIA. 2009. Lyon, France. 3. AOAC, Official methods of analysis of AOAC (Association of Official Analytical
Chemists) International (CD-ROM), 1996, AOAC International: Gaithersburg, MD.
4. Cardador-Martinez, A., G. Loarca-Pina, and B.D. Oomah, Antioxidant activity in
common beans (Phaseolus vulgaris L.). Journal of Agricultural and Food Chemistry, 2002. 50(24): p. 6975-6980.
5. Singleton, V.L. and J.A. Rossi, Jr., Colorimetry of Total Phenolics with
Phosphomolybdic-Phosphotungstic Acid Reagents. Am. J. Enol. Vitic., 1965. 16(3): p. 144-158.
Total Phenol Content
Antiradical Activity
0,17 0,27 0,37 0,47 0,57
Pressure
913
1721
2529
33
Time
8,3
9,3
10,3
11,3
12,3
DS
TP
H
0,17 0,27 0,37 0,47 0,57
Pressure
913
1721
2529
33
Time
20
22
24
26
28
DS
DP
PH
250
144
PART IV
CONCLUSIONS AND PERSPECTIVES
145
CONCLUSIONS After harvest, fruit and vegetable products can follow several alterations that compromise their quality characteristics. Then, the processing of food is imperative to prolong the shelf life and the principal quality characteristics of products.
Pepper (Capsicum) is an important crop; nevertheless it is highly perishable because of their high moisture content (300–900% d.b). Therefore, the application of preserving process on pepper is highly important.
The present research work had as main objective to contribute to the comprehension, development and improvement of the traditional drying and freezing process applied to peppers.
In the case of drying operation, this study was dived on five mains parts: the fundamental study approach of the drying operation in order to find the limiting processes, the analysis of the main stages of hot air drying, the definition of the possible intensifications of limiting processes, the kinetics and thermodynamic study of the interaction of water and solids during drying and the quality evaluation of dried products.
The fundamental approach of drying operation, allowed to identify the main transfer phenomena occurred during hot air drying: external transfers (heat transfer from the exterior environment to the exchange surface and mass transfer of vapor water from the surface of the product to the environment) and internal transfers (heat transfer at the interior of the product and mass transfer liquid and/or vapor, from the interior of the product to its surface) were defined.
Furthermore, it was remarked that even if there exist simultaneity of the four processes of heat and mass transfer, the whole process take place in causality series. Therefore, it has been highlighted that once the external transfer has been intensified (air flux in terms of temperature, relative humidity and air velocity), the drying operation is mainly controlled by the internal transfers of heat and mass, which are highly difficult to modify and intensify.
Respect to the analysis of the main stages of hygroscopic porous media hot air drying, three stages were considered: the removing surface water, the water diffusion in the porous hygroscopic medium and the paradoxical drying. Then, the study of each stage, allowed defining the possible intensification of each one.
For the removing surface water stage, the intensification was done by increasing the air flux velocity and by bringing down its relative humidity. Even if studies has shown that increasing temperature drying operation, the surface water can be removed fast, in this work to avoid thermal damage, drying temperature was maintained constant at ~65 °C.
For the water diffusion stage, the intensification was done by coupling the DIC autovaporization process. As water diffusivity (liquid and vapor) directly depend on the degree of porosity and pore distribution, and as during drying this value decrease due to shrinkage, the expansion of the porous structure enhanced water diffusivity.
For intensify the paradoxical drying stage, it has been proposed to generate a total pressure inside the product higher than at the surface. To achieve this objective, literature showed three solutions: heating by microwave drying, superheated steam, and drying by successive vacuum pressure drops (DDS).
The fundamental study of the kinetic and thermodynamic interaction of the water and solids during the drying operation of peppers showed that the DIC autovaporization treatment intensified the drying kinetics and improved the shelf life of the dried products.
The impact of the expansion by DIC on the pepper drying kinetic, can be observed on the increasing values of starting accessibility δWs (in g H2O/100 g dry matter) which reflected that

146
trough out the increasing of the surface exchange, the removing surface water stage was intensified. Moreover, the effective diffusivity of water, Deff, was also increased thanks to new expanded structure. Finally, as the water effective diffusivity was more important, the drying time to achieve a specific final moisture content was lower than for traditional hot air drying.
On the other hand, the impact of the DIC treatment on the aw, showed that the expansion of products improved the adsorption capacities of samples, mainly reflected on a lower aw and a higher specific surface area, compared to the total hot air drying.
Then, although the drying kinetics of peppers were improved and the effective diffusivities were higher, water was better linked on swell dried products. In fact, as the specific surface area increased thanks to the DIC treatment, the polar groups on the external surface also increased, thus they reacted more with water molecules. This more linked water implied reduced water availability for microorganisms and inhibits some chemical reactions, thus implies a higher shelf life.
By regarding the quality characteristics of dried products: the rehydration ability, the water holding capacity and the antioxidant content and activity of dried pepper, it could be observed that according to the selected parameters of the DIC treatment, all these responses could be improved.
In the case of rehydration kinetics, as the effective diffusivity and the starting accessibility were higher than in the case of total hot air dried products, and the time of dehydration was reduced significantly, it could be observed that DIC treatment impacted positively on the rehydration ability. Moreover, by regarding the water holding capacity, it could be observed that swelled dried peppers not only absorb more water, but also they strongly bind water. Both characteristics are quite important on further applications of dried products, as on saucing preparation.
In the case of the antioxidant content and antioxidant activity of both pepper dried products, the present work showed that the DIC treatment improved the extraction of phenolic compounds and enhanced the antioxidant capacity of peppers as compared to the conventional drying. Furthermore, thanks to the possibility of the optimization of DIC operating parameters (saturated steam pressure and thermal holding time), the availability of target bioactive molecules could be performance. The improvement of these quality characteristics has been mainly linked to the new generated porous structure.
On the other hand, by regarding the freezing preserving process, this work highlighted that the dehydrofreezing process couple to DIC treatment is as a promising way to preserve peppers. As a first approach of this process, this study showed that the antioxidant content and antioxidant activity of DIC-dehydrofrozen peppers were improved, specially, for flavonoids molecules.
Then, by selecting the optimal operating conditions of DIC process and coupling it to drying and freezing, these traditional processes could be sharply improved. In fact, the adoption of these methods on pepper transformer industries, could allow reducing fresh peppers losses, decrease operational cost, increasing the quality of transformed products and to meet international standards, reaching the goal of valorizing this product.
Finally, this work showed that with the purpose of accomplishing not only the efficiency of the processes but also the final quality of the products, the studying of the main phenomena occurred during an operation, makes possible to find the limiting processes, to intensify them and to optimize them.
147
PERSPECTIVES
Although the drying process has been used and studied for several centuries, the drying of fruit and vegetables remains a great potential for research and technological sector. Consumers demand dried exotic products that are able to satisfy both nutritional conditions, hygienic and organoleptic
qualities, but above all at affordable prices. Then, the future work in this studied area needs to be address on several aspects:
In the case of dried products, the study of the impact of the DIC process on the aw and glass transition, could give a better idea about the changes in food structure and microstructure, water mobility, crystallization, etc.
Else, a complete study of the first stage of drying by using renewable energies, as solar, followed by a coupling to DIC process, could be an interesting solution for saving cost processing and to make more affordable this preservation process to farmers. Furthermore, the fundamental analysis done in this work allows intensifying the drying process, nevertheless it has to be solved on further studies the paradoxal stage before described, for this, experimental studies focusing on this stage by using microwaves and DDS, has to be done
Moreover, a further characterization of swelled dried pepper bioactive molecules by HPLC, as carotenoids, capsaicins, vitamins, etc., and their bioavailability in vivo could increase the further application on health disorders. A control basal diet and two diets supplemented with the dried and frozen products could be prepared for mince, to assess bio-availability of bioactive molecules on adispose tissue, liver and blood plasma. Only optimum freeze-dried and DIC treated dried products, based on conservation and antioxidant activity, will be evaluated. Nutraceutical capacity of fresh and preserved samples can be assessed against cancer cells.
On the hand, by regarding the quality safety of products, the microbiological impact of the DIC treatment on dried and frozen products can be evaluated. Assessments could be carried out by analyzing the standard plate total, total coliforms, E. coli, Staphylococcus aureus, Salmonella, yeast and molds of treated samples.
Furthermore, physiochemical characterization of swelled products as, aromas, color and size of powder products could be interesting to further applications on industries. Else, texture analysis of dried and frozen products could be handling. Compression and penetration test would allow studying the impact of the different conditions of treatment on the structure of preserved samples.
In the case of dehydrofreezing process, a detailed study about: the heat and mass transfer phenomena involved during dehydrofreezing processing, the measurement and prediction of food properties during freezing such as enthalpy changes, convective heat transfer coefficients, nutrient, and quality kinetics, and the prediction of freezing and thawing rates could allow to optimize this process.
On the other hand, the development of new products with the optimal dried materials characterized by high antioxidant bioavailability and nutraceutical activity (example baby food, instant foods, etc.) can be handling to further industrial application.
Finally, the scaling up for industrial applications of DIC process by regarding the energy consumption and environmental, microeconomic and social impacts has to be done.
148
REFERENCES 1. Serrano-Martínez, A., et al., Kinetic characterisation and thermal inactivation study of partially purified
red pepper (Capsicum annuum L.) peroxidase. Food Chemistry, 2008. 107(1): p. 193-199.
2. Bogusz Junior, S., et al., Optimization of the extraction conditions of the volatile compounds from chili peppers by headspace solid phase micro-extraction. Journal of Chromatography A, 2011. 1218(21): p. 3345-3350.
3. Kothari, S.L., et al., Chilli peppers -- A review on tissue culture and transgenesis. Biotechnology Advances. 28(1): p. 35-48.
4. Pérez Hidalgo, L.F. and C. Montalvo Paquini, ESTUDIO COMPARATIVO DE LAS VARIEDADES DE CHILE POBLANO CORCEL Y REBELDE EN INVERNADERO, in Ing. en Biotecnología2007, Universidad Politécnica de Puebla: Puebla.
5. Barceloux, D.G., Pepper and Capsaicin (Capsicum and Piper Species). Disease-a-Month, 2009. 55(6): p. 380-390.
6. Yaldiz, G., M. Ozguven, and N. Sekeroglu, Variation in capsaicin contents of different Capsicum species and lines by varying drying parameters. Industrial Crops and Products, 2010. 32(3): p. 434-438.
7. Doymaz, I. and M. Pala, Hot-air drying characteristics of red pepper. Journal of Food Engineering, 2002. 55(4): p. 331-335.
8. Ornelas-Paz, J.d.J., et al., Effect of heat treatment on the content of some bioactive compounds and free radical-scavenging activity in pungent and non-pungent peppers. Food Research International. In
Press, Corrected Proof.
9. Navarro, J.M., et al., Changes in the contents of antioxidant compounds in pepper fruits at different ripening stages, as affected by salinity. Food Chemistry, 2006. 96(1): p. 66-73.
10. Sousa, E.T., et al., Multivariate optimization and HS-SPME/GC-MS analysis of VOCs in red, yellow and purple varieties of Capsicum chinense sp. peppers. Microchemical Journal, 2006. 82(2): p. 142-149.
11. Fernández-Trujillo, J.P., Extracción convencional de oleorresina de pimentón dulce y picante I. Generalidades, composición, proceso e innovaciones y aplicaciones. GRASAS Y ACEITES, 2007. 58(3): p. 252-263.
12. Prasad, B.C.N., et al., Characterization of capsaicin synthase and identification of its gene (csy1) for pungency factor capsaicin in pepper (Capsicum sp.). Proceedings of the National Academy of Sciences, 2006. 103(36): p. 13315-13320.
13. Paran, I. and E. van der Knaap, Genetic and molecular regulation of fruit and plant domestication traits in tomato and pepper. Journal of Experimental Botany, 2007. 58(14): p. 3841-3852.
14. Bravo Lozano, A.G., Galindo González Guillermo, and A.R.M. Domingo, Tecnología de Producción de Chile Seco, 2006, Instituto Nacional de Investigaciones Forestales, Agrícolas y Pecuarias. Centro de Investigación Regional Norte Centro. Campo Experimental Zacatecas: Zacatecas.
15. Macrae, R., R. Robinson, and M. Sadler, Food Technology and Nutrition (Peppers and Chillies), in Encyclopedia of Food Science1993, Academic Press Ltd.
16. Bosland, P.W., A.L. Bailey, and J. Iglesias-Olivas, Capsicum Pepper Varieties and Classification, C.o.A.a.H. Economics, Editor 1996, University of New Mexico State: New Mexico State.
17. Pickersgill, B., Peppers and Chillies, in Encyclopedia of Food Sciences and Nutrition, C. Benjamin, Editor 2003, Academic Press: Oxford. p. 4460-4467.
18. USDA. Classification for Kingdom Plantae Down to Genus Capsicum L. 2013 [cited 2013 January]; Available from: http://plants.usda.gov/java/ClassificationServlet?source=profile&symbol=CAPSI&display=31.
19. Pino, J., V. Fuentes, and O. Barrios, Volatile constituents of Cachucha peppers (Capsicum chinense Jacq.) grown in Cuba. Food Chemistry, 2011. 125(3): p. 860-864.
149
20. Contreras-Padilla, M. and E.M. Yahia, Changes in Capsaicinoids during Development, Maturation, and Senescence of Chile Peppers and Relation with Peroxidase Activity. Journal of Agricultural and Food Chemistry, 1998. 46(6): p. 2075-2079.
21. Restrepo Gallego, M., Oleorresinas de Capsicum en la Industria Alimentaria Revista Lasallista de Investigación, 2006. 3, número 002.
22. Pino, J., E. Sauri-Duch, and R. Marbot, Changes in volatile compounds of Habanero chile pepper (Capsicum chinense Jack. cv. Habanero) at two ripening stages. Food Chemistry, 2006. 94(3): p. 394-398.
23. La Favre, A. and J. La Favre, The Solanaceae, 2012, The Ohio State University.
24. Saikat Kumar, B. and D. Amit Krishna, Capsicum, in Capsicum2003, CRC Press.
25. SAGARPA-SIAP, Un panorama del cultivo del chile, S.-S.S.d.I.A.y. Pesquera), Editor 2010, Servicio de Información Agroalimentaria y Pesquera: Mexico.
26. Collera-Zúñiga, O., F. García Jiménez, and R. Meléndez Gordillo, Comparative study of carotenoid composition in three mexican varieties of Capsicum annuum L. Food Chemistry. 90(1-2): p. 109-114.
27. Tainter, D., A. Grenis, and R. Norwat, Spices and Seasonings (A Food Technology Handbook). Second edition. Food Service Technology, 2001. 1(3-4): p. 181-181.
28. Andrade Cuvi, M.J., et al., Changes in red pepper antioxidants as affected by UV-C treatments and storage at chilling temperatures. LWT - Food Science and Technology, 2011. 44(7): p. 1666-1671.
29. Adams, J.B. and H.M. Brown, Discoloration in Raw and Processed Fruits and Vegetables. Critical Reviews in Food Science & Nutrition, 2007. 47(3): p. 319-333.
30. Cui, Z.-W., S.-Y. Xu, and D.-W. Sun, Dehydration of Garlic Slices by Combined Microwave-Vacuum and Air Drying. Drying Technology, 2003. 21(7): p. 1173-1184.
31. Delgado-Vargas, F., A.R. Jiménez, and O. Paredes-López, Natural Pigments: Carotenoids, Anthocyanins, and Betalains — Characteristics, Biosynthesis, Processing, and Stability. Critical Reviews in Food Science and Nutrition, 2000. 40(3): p. 173 - 289.
32. Guiné, R.P.F. and M.J. Barroca, Effect of drying treatments on texture and color of vegetables (pumpkin and green pepper). Food and Bioproducts Processing, 2012. 90(1): p. 58-63.
33. Howard, L.R., et al., Changes in Phytochemical and Antioxidant Activity of Selected Pepper Cultivars (Capsicum Species) As Influenced by Maturity. Journal of Agricultural and Food Chemistry, 2000. 48(5): p. 1713-1720.
34. Wahua, C., B.E. Okoli, and S.M. Sam, Comparative morphological, anatomical, cytological and phytochemical studies on Capsicum frutescens Linn. And Capsicum annuum Linn. (Solanaceae1). International Journal of Scientific & Engineering Research, 2013. 4(1).
35. Yahia, E.M. and J.d.J. Ornelas-Paz, Chemistry, Stability, and Biological Actions of Carotenoids, in Fruit and Vegetable Phytochemicals2009, Wiley-Blackwell. p. 177-222.
36. Morán-Bañuelos, S.H., et al., Capsaicionoides en chiles nativos de Puebla, México. Agrociencia, 2008. 42, number 7: p. 807-816.
37. ERS. Food Availability (Per Capita) data system. 2010 [cited 2013 January, 2013]; Available from: http://www.ers.usda.gov/data-products/food-availability-(per-capita)-data-system.aspx.
38. FAOSTAT. Food and Agricultural commodities production. 2013 [cited 2013 February, 20]; Available from: http://faostat.fao.org/site/339/default.aspx.
39. SIAP. Agricultura, Producción anual por cultivo. 2009 [cited 2011 August]; Available from: http://www.siap.gob.mx/.
40. Toledo Aguilar, R., Diversidad Morfológica y Potencial Productivo de Variedades Nativas de Chile "Poblano", in Postgrado en Estrategias para el Desarrollo Agrícola Regional 2010, Colegio de Postgraduados: Puebla.
150
41. Agricultura, G.d.M.S.d., PLAN RECTOR SISTEMA PRODUCTO NACIONAL CHILE, 2005: San Luis Potosí, México.
42. Comercial, I., Comportamiento del Mercado, Sistema Producto Chile, 2009.
43. Kaleemullah, S. and R. Kailappan, Drying Kinetics of Red Chillies in a Rotary Dryer. Biosystems Engineering, 2005. 92(1): p. 15-23.
44. Singh, H.P. and A. Alam, Techno-economic study on chilli drying. Journal of agricultural engineering, 1982. 19(1): p. 27-32.
45. Rahman, M.S., Handbook of Food Preservation. Food Science and Technology2007, Florida: CRC Press
46. Barbosa-Cánovas, G., B. Altunakar, and D.J. Mejía-Lorío, Freezing of fruits and vegetables: An agribusiness alternative for rural and semi-rural areas, in FAO Agricultural Services Bulletin2005: Rome.
47. Derossi, A., et al., A Review on Acidifying Treatments for Vegetable Canned Food. Critical Reviews in Food Science and Nutrition, 2011. 51(10): p. 955-964.
48. Bosland, P.W. and E.J. Votava, Peppers : vegetable and spice capsicums2012, Cambridge, MA: CABI.
49. Saldana, G. and R. Meyer, Effects of Added Calcium on Texture and Quality of Canned Jalapeno Peppers. Journal of Food Science, 1981. 46(5): p. 1518-1520.
50. Chen, H.-H., C.E. Hernandez, and T.-C. Huang, A study of the drying effect on lemon slices using a closed-type solar dryer. Solar Energy, 2005. 78(1): p. 97-103.
51. Doymaz, I., Sun drying of figs: an experimental study. Journal of Food Engineering, 2005. 71(4): p. 403-407.
52. Hossain, M.A., B.M.A. Amer, and K. Gottschalk, Hybrid Solar Dryer for Quality Dried Tomato. Drying Technology, 2008. 26(12): p. 1591-1601.
53. Chua, K.J. and S.K. Chou, Low-cost drying methods for developing countries. Trends in Food Science & Technology, 2003. 14(12): p. 519-528.
54. Hii, C.L., et al., Solar Drying: Fundamentals, Applications and Innovation, 2012.
55. Condorí, M., R. Echazú, and L. Saravia, Solar drying of sweet pepper and garlic using the tunnel greenhouse drier. Renewable Energy, 2001. 22(4): p. 447-460.
56. Janjai, S. and B.K. Bala, Solar Drying Technology. Food Engineering Reviews, 2012. 4(1): p. 16-54.
57. Tunde-Akintunde, T.Y., EFFECT OF PRETREATMENT ON DRYING TIME AND QUALITY OF CHILLI PEPPER. Journal of Food Processing and Preservation, 2010. 34(4): p. 595-608.
58. Ojeda, M., et al., Chemical references in sensory analysis of smoke flavourings. Food Chemistry, 2002. 78(4): p. 433-442.
59. Gilbert, J. and M.E. Knowles, The chemistry of smoked foods: a review. International Journal of Food Science & Technology, 1975. 10(3): p. 245-261.
60. Córdoba Ramos, M.d.G., A. Hernández León, and T.d.J. Bartolomé García, AVANCES EN LAAUTENTIFICACIÓN DEL PIMENTÓN DE LA VERA, 2006.
61. Minguez-Mosquera, M.I., M. Jaren-Galan, and J. Garrido-Fernandez, Influence of the Industrial Drying Processes of Pepper Fruits(Capsicum annuum Cv. Bola) for Paprika on the Carotenoid Content. Journal of Agricultural and Food Chemistry, 1994. 42(5): p. 1190-1193.
62. IARC. Monographs on the evaluation of carcinogenic risks to humans, Vol 92, Lyon, France: International Agency for Reseach on Cancer. 2010 [cited 2013 January]; Available from: http://monographs.iarc.fr/ENG/Monographs/vol92/mono92.pdf.
63. Ratti, C., ADVANCES IN FOOD DEHYDRATION, ed. C.P.T. Francis2008.
64. Kudra, T. and A.S. Mujumdar, Advanced Drying Technologies, Second Edition, ed. I. Marcel Dekker2002, New York.
151
65. Allaf, T., et al. Let’s combine sun and DIC, let’s Sun-DIC-dry. in TOWARD A SUSTAINABLE FOOD CHAIN: Food Process, Bioprocessing and Food Quality Management. 2011. Nantes, France.
66. Castro, S.M., et al., Effect of thermal blanching and of high pressure treatments on sweet green and red bell pepper fruits (Capsicum annuum L.). Food Chemistry, 2008. 107(4): p. 1436-1449.
67. Allaf, K., S. Mounir, and T. Allaf, Swell-drying: séchage et texturation par DIC des végétaux. Techniques de l'Ingénieur, 2012. Référence F3005.
68. Bimbenet, J.-J. and C. Bonazzi, Séchage des produits alimentaires Principes. Techniques de l'ingénieur Opérations unitaires du génie industriel alimentaire, 2003. base documentaire : TIB430DUO(ref. article : f3000).
69. Zogzas, N.P., Z.B. Maroulis, and D. Marinos-Kouris, DENSITIES, SHRINKAGE AND POROSITY OF SOME VEGETABLES DURING AIR DRYING. Drying Technology, 1994. 12(7): p. 1653-1666.
70. Zogzas, N.P. and Z.B. Maroulis, Effective Moisture Diffusivity Estimation from Drying Data. A Comparison Between Various Methods of Analysis. Drying Technology, 1996. 14(7-8): p. 1543-1573.
71. Mujumdar, A.S. and S. Devahastin, Mujumdar’s Practical Guide to Industrial Drying2000, Montreal Exergex Corporation.
72. Molz, F.J. and G.M. Hornberger, Water Transport Through Plant Tissues in the Presence of a Diffusable Solute1. Soil Sci. Soc. Am. J., 1973. 37(6): p. 833-837.
73. Molz, F.J. and E. Ikenberry, Water Transport Through Plant Cells and Cell Walls: Theoretical Development1. Soil Sci. Soc. Am. J., 1974. 38(5): p. 699-704.
74. Molz, F.J., Water transport through plant tissue: the apoplasm and symplasm pathways. Journal of Theoretical Biology, 1976. 59(2): p. 277-292.
75. Molz, F.J., et al., A circuit analog model for studying quantitative water relations of plant tissues. Plant Physiology, 1979. 64: p. 712−716.
76. Toupin, C.J., M. Marcotte, and M. Le Maguer, Osmotically-induced mass transfer in plant storage tissues: A mathematical model. Part I. Journal of Food Engineering, 1989. 10(1): p. 13-38.
77. Allaf, K., ed. Transfer phenomena and industrial applications. . Teaching book published by the Lebanese University, Faculty of Science1982. 135.
78. Al Haddad, M., et al., Fruits and Vegetables Drying Combining Hot Air, DIC Technology and Microwaves. International Journal of Food Engineering, 2008. 4(6).
79. Mounir, S. and K. Allaf, Three-Stage Spray Drying: New Process Involving Instant Controlled Pressure Drop. Drying Technology, 2008. 26(4): p. 452-463.
80. ALBITAR, N., Etude comparative des procédés de séchage couplés à la texturation par Détente Instantanée Contrôlée DIC, en termes de cinétique et de qualité nutritionnelle. Applications à la valorisation des déchets agro-industriels., in Génie des Procédés Industriels2010, UNIVERSITÉ DE LA ROCHELLE: LA ROCHELLE.
81. Rahman, M.S., Food Properties Handbook. Second ed2009, Florida: CRC Press.
82. Scott, W.J., Water relations of food spoilage microorganisms. Advances in Food Research, 1957. 7: p. 83-127.
83. Van den Berg, C. and S. Bruin, Water activity and its estimation in food systems, in Water activity: Influence on Food Quality, L.B. Rockland and F.G. Stewart, Editors. 1981, Academic Press New York. p. 147-177.
84. El-Amin, M., Advanced Topics in Mass Transfer, ed. InTech2011.
85. Kinsella, J.E., P.F. Fox, and L.B. Rockland, Water sorption by proteins: Milk and whey proteins. C R C Critical Reviews in Food Science and Nutrition, 1986. 24(2): p. 91-139.
86. Bimbenet, J.J., Le Séchage dans les industries agricoles et alimentaires1978: SEPAIC.

152
87. Allaf, K. and P. Vidal, Feasibility study of a new process of drying/swelling by instantaneous decompression toward vacuum of in pieces vegetables in view of a rapid rehydration. Gradient Activity Plotting University of Technology of Compiegne UTC N° CR/89/103, industrial SILVA-LAON partner., 1988.
88. Labuza, T.P. Properties of water as related to the keeping quality of foods. . in SOS symposium on physical and chemical properties of foods. 1970.
89. Labuza, T.P., S.R. Tannenbaum, and M. Karel, Water content and stability of low-moisture and intermediate-moisture foods. Food Technology 1970. 24(5).
90. Sherwin, C. and T.P. Labuza. Beyond water activity and glass transition: A broad perspective on the manner by which moisture can influence reaction rates in food. in Proceedings ISOPOW 9. 2006. Buenos
Aires, Argentina.
91. Labuza, T.P. and L.R. Dugan, Kinetics of lipid oxidation in foods. C R C Critical Reviews in Food Technology, 1971. 2(3): p. 355-405.
92. Barbosa-Cánovas, G.V., et al., Water Activity in Foods: Fundamentals and Applications, ed. I. Press2008: Blackwell Publishing Ltd.
93. Rahman, M.S., Food Stability Beyond Water Activity and Glass Transtion: Macro-Micro Region Concept in the State Diagram. International Journal of Food Properties, 2009. 12(4): p. 726-740.
94. Brunauer, S., et al., On a Theory of the van der Waals Adsorption of Gases. Journal of the American Chemical Society, 1940. 62(7): p. 1723-1732.
95. Rahman, S., Food Properties Handbook1995, New York, USA: CRC Press, Inc.
96. Iglesias, H. and J. Chirife, BET monolayer values in dehydrated foods and food components. Lebensmittel-Wissenschaft+ Technologie, 1976. 9(2): p. 107-113.
97. Kapsalis, J.G., Moisture sorption hysteresis, in Water activity: influences on food quality, L.B. Rockland and G.F. Stewart, Editors. 1981, Academic Press: New York.
98. Labuza, T.P., Sorption phenomena in foods. Food Technology II, 1968. 22: p. 263–272.
99. Iglesias, H.A. and J. Chirife, Isosteric heats of water vapor sorption on dehydrated foods. Part II. Hysteresis and heat of sorption comparison with B.E.T. theory. Lebensmittel-Wissenschaft und Technologie 1976. 9: p. 123-127.
100. Labuza, T.P., Moisture Sorption: Practical Aspects of Isotherm Measurement and Use. . , ed. A.A.o.C. Chemists1984, St. Paul, Minnesota.: AACC International Publishing.
101. Glasstone, S. and D. Lewis, Elements of Physical Chemistry1960, Princeton, NJ: Van Nostrand Co., Inc.
102. Chirife, J. and H.A. Iglesias, Equations for fitting water sorption isotherms of foods: Part 1 — a review. International Journal of Food Science & Technology, 1978. 13(3): p. 159-174.
103. Langmuir, I., The adsorption of gases on plane surfaces of glass, mica and platium. Journal of the American Chemical Society, 1918. 40(9): p. 1361−1403.
104. Nguyen, T.A., MODELLING OF MOISTURE TRANSPORT IN PEAR TISSUE, in Agro-Engineering and Economics2005, Universiteit Leuven: Leuven, Belgium.
105. Brunauer, S., P.H. Emmett, and E. Teller, Adsorption of Gases in Multimolecular Layers. Journal of the American Chemical Society, 1938. 60(2): p. 309-319.
106. Bizot, H., Using the GAB model to construct sorption isotherms, in Physical Properties of Foods, R. Jowitt, et al., Editors. 1983, Applied Science Publishers: London. p. 43-54.
107. Mounir, S., et al., Swell Drying: Coupling Instant Controlled Pressure Drop DIC to Standard Convection Drying Processes to Intensify Transfer Phenomena and Improve Quality—An Overview. Drying Technology, 2012. 30(14): p. 1508-1531.

153
108. Rakotozafy, H., et al., DRYING OF BAKER'S YEAST BY A NEW METHOD: DEHYDRATION BY SUCCESSIVE PRESSURE DROPS (DDS). EFFECT ON CELL SURVIVAL AND ENZYMATIC ACTIVITIES. Drying Technology, 2000. 18(10): p. 2253-2271.
109. Delgado, A.E. and D.-W. Sun, Heat and mass transfer models for predicting freezing processes – a review. Journal of Food Engineering, 2001. 47(3): p. 157-174.
110. Sahagian, M.E. and H.D. Goff, Effect of freezing rate on the thermal, mechanical and physical aging properties of the glassy state in frozen sucrose solutions. Thermochimica Acta, 1994. 246(2): p. 271-283.
111. IIR, Recommendations of the Processing and Handling of Frozen Foods. International Institute of Refrigeration., 1986: Paris.
112. Mallett, C.P., Frozen Food Technology1993: Blackie.
113. Li, B. and D.-W. Sun, Novel methods for rapid freezing and thawing of foods – a review. Journal of Food Engineering, 2002. 54(3): p. 175-182.
114. Daood, H.G., et al., Drying temperature, endogenous antioxidants and capsaicinoids affect carotenoid stability in paprika (red pepper spice). Journal of the Science of Food and Agriculture, 2006. 86(14): p. 2450-2457.
115. Halliwell, B., et al., The characterization of antioxidants. Food and Chemical Toxicology, 1995. 33(7): p. 601-617.
116. Pokorný, J., Natural antioxidants for food use. Trends in Food Science & Technology, 1991. 2: p. 223-227.
117. García-Alonso, M., et al., Evaluation of the antioxidant properties of fruits. Food Chemistry, 2004. 84(1): p. 13-18.
118. Antonious, G.F., et al., Antioxidants in hot pepper: Variation among accessions. Journal of Environmental Science and Health Part B-Pesticides Food Contaminants and Agricultural Wastes, 2006. 41(7): p. 1237-1243.
119. Zitnanova, I., et al., Antioxidative activity of selected fruits and vegetables. Biologia, 2006. 61(3): p. 279-284.
120. Giardi, M.T., G. Rea, and B. Berra, Bio-Farms for Nutraceuticals: Functional Food and Safety Control by Biosensors, ed. Springer. Vol. 1. 2010: LANDES BioScience.
121. Goodwin, T.W., Biochemistry of the Carotenoids. Vol. 1: Plants, ed. C.a. Hall1980, New York.
122. Chen, J.P., C.Y. Tai, and B.H. Chen, Effects of different drying treatments on the stability of carotenoids in Taiwanese mango (Mangifera indica L.). Food Chemistry, 2007. 100(3): p. 1005-1010.
123. Navarro, J.M., et al., Analysis of the changes in quality in mandarin fruit, produced by deficit irrigation treatments. Food Chemistry, 2010. 119(4): p. 1591-1596.
124. Vernin, G., et al., Thermal decomposition of ascorbic acid. Carbohydrate Research, 1997. 305(1): p. 1-15.
125. Kiokias, S., T. Varzakas, and V. Oreopoulou, In Vitro Activity of Vitamins, Flavonoids, and Natural Phenolic Antioxidants Against the Oxidative Deterioration of Oil-Based Systems. Critical Reviews in Food Science & Nutrition, 2008. 48(1): p. 78-93.
126. Pénicaud, C., et al., Ascorbic acid in food: Development of a rapid analysis technique and application to diffusivity determination. Food Research International, 2010. 43(3): p. 838-847.
127. Deepa, N., et al., Antioxidant activity in some red sweet pepper cultivars. Journal of Food Composition and Analysis, 2006. 19(6-7): p. 572-578.
128. Nakamura, T., et al., Structures of the radical (DPPH) oxidation products of dihydrocapsaicin. Tetrahedron Letters, 2002. 43(45): p. 8181-8183.
129. Jun, H.-S., et al., Capsaicin induced apoptosis of B16-F10 melanoma cells through down-regulation of Bcl-2. Food and Chemical Toxicology, 2007. 45(5): p. 708-715.

154
130. Thurnham, D.I., Antioxidants in Food: Practical Applications. Jan Pokorny, Nedyalka Yanishlieva and Michael Gordon (editors). 2001. Cambridge: CRC Press, Woodhead Publishing Ltd. £115 ISBN 1 85573 463 X. CRC Press. $180 ISBN 0-8493-1221-1. British Journal of Nutrition, 2002. 87(04): p. 391-391.
131. Frankel, E.N. and J.W. Finley, How To Standardize the Multiplicity of Methods To Evaluate Natural Antioxidants. Journal of Agricultural and Food Chemistry, 2008. 56(13): p. 4901-4908.
132. Huang, D., B. Ou, and R.L. Prior, The Chemistry behind Antioxidant Capacity Assays. Journal of Agricultural and Food Chemistry, 2005. 53(6): p. 1841-1856.
133. Stevanato, R., S. Fabris, and F. Momo, New Enzymatic Method for the Determination of Total Phenolic Content in Tea and Wine. Journal of Agricultural and Food Chemistry, 2004. 52(20): p. 6287-6293.
134. Suja, K.P., A. Jayalekshmy, and C. Arumughan, Free Radical Scavenging Behavior of Antioxidant Compounds of Sesame (Sesamum indicum L.) in DPPH• System. Journal of Agricultural and Food Chemistry, 2004. 52(4): p. 912-915.
135. Favell, D.J., A comparison of the vitamin C content of fresh and frozen vegetables. Food Chemistry, 1998. 62(1): p. 59-64.
136. Xu, B. and S.K.C. Chang, Effect of soaking, boiling, and steaming on total phenolic contentand antioxidant activities of cool season food legumes. Food Chemistry, 2008. 110(1): p. 1-13.
137. Akpapunam, M.A., Effects of wilting, blanching and storage temperatures on ascorbic acid and total carotenoids content of some Nigerian fresh vegetables. Plant Foods for Human Nutrition (Formerly Qualitas Plantarum), 1984. 34(3): p. 177-180.
138. Yadav, S.K. and S. Sehgal, Effect of home processing on ascorbic acid and β-carotene content of spinach (Spinacia oleracia) and amaranth (Amaranthus tricolor) leaves. Plant Foods for Human Nutrition (Formerly Qualitas Plantarum), 1995. 47(2): p. 125-131.
139. Gayathri, G.N., et al., Influence of antioxidant spices on the retention of [beta]-carotene in vegetables during domestic cooking processes. Food Chemistry, 2004. 84(1): p. 35-43.
140. RAO, M.A., et al., A Kinetic Study of the Loss of Vitamin C, Color, and Firmness During Thermal Processing of Canned Peas. Journal of Food Science, 1981. 46(2): p. 636-637.
141. HOWARD, L.R., et al., Provitamin A and Ascorbic Acid Content of Fresh Pepper Cultivars (<i>Capsicum annuum</i>) and Processed Jalapeños. Journal of Food Science, 1994. 59(2): p. 362-365.
142. Marques, L.G., M.C. Ferreira, and J.T. Freire, Freeze-drying of acerola (Malpighia glabra L.). Chemical Engineering and Processing: Process Intensification, 2007. 46(5): p. 451-457.
143. Setyopratomo, P., A. Fatmawati, and K. Allaf. Texturing by Instant Controlled Pressure Drop DIC in the Production of Cassava Flour: Impact on Dehydration Kinetics, Product Physical Properties and Microbial Decontamination. in Proceedings of the World Congress on Engineering and Computer Science. 2009. San Francisco, USA.
144. Mounir, S., et al., Study of Instant Controlled Pressure Drop DIC Treatment in Manufacturing Snack and Expanded Granule Powder of Apple and Onion. Drying Technology, 2011. 29(3): p. 331-341.
145. Kamal, I.M., et al., Structure expansion of green coffee beans using instantaneous controlled pressure drop process. Innovative Food Science & Emerging Technologies, 2008. 9(4): p. 534-541.
146. Karathanos, V.T., Determination of water content of dried fruits by drying kinetics. Journal of Food Engineering, 1999. 39(4): p. 337-344.
147. Cunningham, S.E., et al., Effect of processing conditions on the water absorption and texture kinetics of potato. Journal of Food Engineering, 2008. 84(2): p. 214-223.
148. Mounir, S. and K. Allaf. Study and modeling of dehydration and rehydration kinetics within porous medium. in Association Française de Séchage pour l'Industrie et l'Agriculture - AFSIA. 2009. Lyon, France.
149. Crank, J., The Mathematics of Diffusion. Oxford University Press1975.

155
150. AOAC, Official methods of analysis of AOAC (Association of Official Analytical Chemists) International (CD-ROM), 1996, AOAC International: Gaithersburg, MD.
151. Al-Muhtaseb, A.a.H., et al., Moisture adsorption isotherms of microwave-baked Madeira cake. LWT - Food Science and Technology, 2010. 43(7): p. 1042-1049.
152. Berg, C.v.d. and S. Bruin, Water activity and its estimation in food systems: theoretical aspects, in Water activity: Influences on food quality, L.B.Rockland and G.F.Stewart eds., Academic Press, New York, 1981, 2-611981.
153. Peng, G., et al., Modeling of water sorption isotherm for corn starch. Journal of Food Engineering, 2007. 80(2): p. 562-567.
154. Halsey, G., Physical Adsorption on Non-Uniform Surfaces Journal of Chemical Physics, 1948. 16(10): p. 931–937.
155. Oswin, C.R., The kinetics of package life. III. The isotherm. Journal of the Society of Chemical Industry, 1946. 65(12): p. 419-421.
156. Iguedjtal, T., N. Louka, and K. Allaf, Sorption Isotherms of Granny Smith Apples Hot-Air Dried and Texturized by “Controlled Sudden Decompression to the Vacuum”. International Journal of Food Engineering, 2007. 3(5).
157. Iguedjtal, T., N. Louka, and K. Allaf, Sorption isotherms of potato slices dried and texturized by controlled sudden decompression. Journal of Food Engineering, 2008. 85(2): p. 180-190.
158. Abdulla, G., A. Belghit, and K. Allaf, Impact of Instant Controlled Pressure Drop Treatment on Moisture Adsorption Isotherm of Cork Granules. Drying Technology, 2009. 27(2): p. 237-247.
159. Kaymak-Ertekin, F. and M. Sultanoğlu, Moisture sorption isotherm characteristics of peppers. Journal of Food Engineering, 2001. 47(3): p. 225-231.
160. Cassini, A.S., L.D.F. Marczak, and C.P.Z. Noreña, Water adsorption isotherms of texturized soy protein. Journal of Food Engineering, 2006. 77(1): p. 194-199.
161. Lemus, R.A., et al., Kinetic study of dehydration and desorption isotherms of red alga Gracilaria. LWT - Food Science and Technology, 2008. 41(9): p. 1592-1599.
162. Sablani, S.S., et al., Sorption isotherms and the state diagram for evaluating stability criteria of abalone. Food Research International, 2004. 37(10): p. 915-924.
163. Pahlevanzadeh, H. and M. Yazdani, MOISTURE ADSORPTION ISOTHERMS AND ISOSTERIC ENERGY FOR ALMOND. Journal of Food Process Engineering, 2005. 28(4): p. 331-345.
164. García-Pérez, J.V., et al., Water sorption isotherms for lemon peel at different temperatures and isosteric heats. LWT - Food Science and Technology, 2008. 41(1): p. 18-25.
165. Aguerre, R.J., C. Suarez, and P.E. Viollaz, New BET type multilayer sorption isotherms. Part II: Modelling water sorption in foods. LWT - Food Science and Technology, 1989. 22(4): p. 192-195.
166. Gregg, S.J. and K.S.W. Sing, Adsorption, surface area, and porosity. Second ed1982, London; New York: Academic Press.
167. Kaleemullah, S. and R. Kailappan, Monolayer moisture, free energy change and fractionation of bound water of red chillies. Journal of Stored Products Research, 2007. 43(2): p. 104-110.
168. Tsami, E., et al., Heat of sorption of water in dried fruits. International Journal of Food Science & Technology, 1990. 25(3): p. 350-359.
169. Rizvi, S.S.H., Thermodynamic properties of foods in dehydration, in Engineering Properties of Foods, M.A. Rao and S.S.H. Rizvi, Editors. 1986, Marcel Dekker Inc: New York, USA. p. 223–309.
170. Basu, S., U.S. Shivhare, and A.S. Mujumdar, Models for sorption isotherms for foods: A review. Drying Technology, 2006. 24(8): p. 917-930.
171. Tsami, E., Net isosteric heat of sorption in dried fruits. Journal of Food Engineering, 1991. 14(4): p. 327-335.

156
172. Bahloul, N., N. Boudhrioua, and N. Kechaou, Moisture desorption–adsorption isotherms and isosteric heats of sorption of Tunisian olive leaves (Olea europaea L.). Industrial Crops and Products, 2008. 28(2): p. 162-176.
173. Rao, M.A. and S.S.H. Rizvi, Engineering Properties of Foods1995, New York, USA: Marcel Dekker Inc.
174. Wang, N. and J.G. Brennan, Moisture sorption isotherm characteristics of potatoes at four temperatures. Journal of Food Engineering, 1991. 14(4): p. 269-287.
175. Cardador-Martinez, A., G. Loarca-Pina, and B.D. Oomah, Antioxidant activity in common beans (Phaseolus vulgaris L.). Journal of Agricultural and Food Chemistry, 2002. 50(24): p. 6975-6980.
176. Singleton, V.L. and J.A. Rossi, Jr., Colorimetry of Total Phenolics with Phosphomolybdic-Phosphotungstic Acid Reagents. Am. J. Enol. Vitic., 1965. 16(3): p. 144-158.
177. Amor, B.B., et al., Effect of instant controlled pressure drop treatments on the oligosaccharides extractability and microstructure of Tephrosia purpurea seeds. Journal of Chromatography A, 2008. 1213(2): p. 118-124.
178. Nielsen, S.S., Food analysis laboratory manual, ed. F.S.T. Series2003, New York Kluwer Academic/Plenum Publishers.
179. Oomah, B.D., A. Cardador-Martínez, and G. Loarca-Piña, Phenolics and antioxidative activities in common beans (Phaseolus vulgaris L). Journal of the Science of Food and Agriculture, 2005. 85(6): p. 935-942.
180. Re, R., et al., Antioxidant activity applying an improved ABTS radical cation decolorization assay. Free Radical Biology and Medicine, 1999. 26(9-10): p. 1231-1237.
181. Albitar, N., et al., Improving the Drying of Onion Using the Instant Controlled Pressure Drop Technology. Drying Technology, 2011. 29(9): p. 993-1001.
182. Cong, D.T., et al., Dehydration by Successive Pressure Drops for Drying Paddy Rice Treated by Instant Controlled Pressure Drop. Drying Technology, 2008. 26(4): p. 443-451.
Copyright © 2022 FDOKUMEN