A biorefinery from Nannochloropsis sp. microalga – Energy and CO 2 emission and economic analyses
10
A biorefinery from Nannochloropsis sp. microalga – Energy and CO 2 emission and economic analyses Ana F. Ferreira a,⇑ , Lauro A. Ribeiro b,c , Ana P. Batista d , Paula A.S.S. Marques d , Beatriz P. Nobre d,e , António M.F. Palavra e , Patrícia Pereira da Silva b , Luísa Gouveia d , Carla Silva a a IDMEC – Instituto Superior Técnico, Universidade Técnica de Lisboa, Av. Rovisco Pais, 1, 1049-001 Lisbon, Portugal b INESCC, R. Antero de Quental, 199, 3000-033 Coimbra, Portugal c School of Sciences and Technology, University of Coimbra, Rua Sílvio Lima, Pólo II, 3030-790 Coimbra, Portugal d LNEG – Energy and Geology National Laboratory, Bioenergy Unit, Estrada do Paço do Lumiar 22, 1649-038 Lisbon, Portugal e IST – Centro de Química Estrutural, Instituto Superior Técnico, DEQB, Av. Rovisco Pais, 1, 1049-001 Lisbon, Portugal highlights Oil obtained by SE has the lowest energy and CO 2 values per MJ prod . Oil obtained by SFE proved to be more economically viable, with a cost of 365 €/kg oil . Biorefinery 2 (biodiesel SFE + bioH 2 ) has the best energy/CO 2 /economy compromise. The bioH 2 as co-product may be advantageous in terms of product yield or profit. High-value pigments can be produced by SFE which is a clean technology. article info Article history: Received 1 March 2013 Received in revised form 20 March 2013 Accepted 24 March 2013 Available online 1 April 2013 Keywords: Microalga biorefinery CO 2 Energy Economical evaluation Life cycle abstract Are microalgae a potential energy source for biofuel production? This paper presents the laboratory results from a Nannochloropsis sp. microalga biorefinery for the production of oil, high-value pigments, and biohydrogen (bioH 2 ). The energy consumption and CO 2 emissions involved in the whole process (microalgae cultivation, harvest, dewater, mill, extraction and leftover biomass fermentation) were eval- uated. An economic evaluation was also performed. Oil was obtained by soxhlet (SE) and supercritical fluid extraction (SFE). The bioH 2 was produced by fermentation of the leftover biomass. The oil produc- tion pathway by SE shows the lowest value of energy consumption, 177-245 MJ/MJ prod, and CO 2 emis- sions, 13–15 kgCO 2 /MJ prod . Despite consuming and emitting c.a. 20% more than the SE pathway, the oil obtained by SFE, proved to be more economically viable, with a cost of 365€/kg oil produced and simulta- neously extracting high-value pigments. The bioH 2 as co-product may be advantageous in terms of prod- uct yield or profit. Ó 2013 Elsevier Ltd. All rights reserved. 1. Introduction Microalgal biomass has the potential to provide renewable en- ergy (e.g. biodiesel, bioethanol, biohydrogen and biogas) through the production of different energy vectors. In addition, they also have the capacity to synthesize bioactive molecules, such as carotenoids, fatty acids, antioxidants, anti-inflammatory and other valuable organic compounds, which can be used in food, feed, cos- metic, biomaterials, nanostructures and pharmaceutical industries (Marques et al., 2011). A systemic approach to the culture and refinery of microalgae is therefore essential and should integrate the production of biofuels and co-products. The biorefinery approach consists in the production of a wide range of biofuels and chemicals from biomass and it assists in making biofuel pro- duction economically feasible (Gouveia, 2011). Without competing with food cultures, arable land, potable water and having a higher productivity and the possibility of daily harvesting, the microalgae potential for biofuel production is huge. However, the current implementation of microalga-based systems has been economically constrained by their still poor volumetric efficiencies, which still lead to excessively high costs compared to petroleum prices. Moreover, technological drawbacks are also present, namely the maximum biomass concentration attainable in the available photobioreactors, the biomass productivity, the efficiency of harvesting and the relatively low microalga intrinsic lipid content (Amaro et al., 2011). Therefore a careful assessment of the life cycle energy balances – including actual environmental 0960-8524/$ - see front matter Ó 2013 Elsevier Ltd. All rights reserved. http://dx.doi.org/10.1016/j.biortech.2013.03.168 ⇑ Corresponding author. Tel.: +351 218419554. E-mail address: fi[email protected] (A.F. Ferreira). Bioresource Technology 138 (2013) 235–244 Contents lists available at SciVerse ScienceDirect Bioresource Technology journal homepage: www.elsevier.com/locate/biortech
Transcript of A biorefinery from Nannochloropsis sp. microalga – Energy and CO 2 emission and economic analyses
Bioresource Technology 138 (2013) 235–244
Contents lists available at SciVerse ScienceDirect
Bioresource Technology
journal homepage: www.elsevier .com/locate /bior tech
A biorefinery from Nannochloropsis sp. microalga – Energy and CO2
emission and economic analyses
0960-8524/$ - see front matter � 2013 Elsevier Ltd. All rights reserved.http://dx.doi.org/10.1016/j.biortech.2013.03.168
⇑ Corresponding author. Tel.: +351 218419554.E-mail address: [email protected] (A.F. Ferreira).
Ana F. Ferreira a,⇑, Lauro A. Ribeiro b,c, Ana P. Batista d, Paula A.S.S. Marques d, Beatriz P. Nobre d,e,António M.F. Palavra e, Patrícia Pereira da Silva b, Luísa Gouveia d, Carla Silva a
a IDMEC – Instituto Superior Técnico, Universidade Técnica de Lisboa, Av. Rovisco Pais, 1, 1049-001 Lisbon, Portugalb INESCC, R. Antero de Quental, 199, 3000-033 Coimbra, Portugalc School of Sciences and Technology, University of Coimbra, Rua Sílvio Lima, Pólo II, 3030-790 Coimbra, Portugald LNEG – Energy and Geology National Laboratory, Bioenergy Unit, Estrada do Paço do Lumiar 22, 1649-038 Lisbon, Portugale IST – Centro de Química Estrutural, Instituto Superior Técnico, DEQB, Av. Rovisco Pais, 1, 1049-001 Lisbon, Portugal
h i g h l i g h t s
� Oil obtained by SE has the lowest energy and CO2 values per MJprod.� Oil obtained by SFE proved to be more economically viable, with a cost of 365 €/kgoil.� Biorefinery 2 (biodiesel SFE + bioH2) has the best energy/CO2/economy compromise.� The bioH2 as co-product may be advantageous in terms of product yield or profit.� High-value pigments can be produced by SFE which is a clean technology.
a r t i c l e i n f o
Article history:Received 1 March 2013Received in revised form 20 March 2013Accepted 24 March 2013Available online 1 April 2013
Keywords:Microalga biorefineryCO2
EnergyEconomical evaluationLife cycle
a b s t r a c t
Are microalgae a potential energy source for biofuel production? This paper presents the laboratoryresults from a Nannochloropsis sp. microalga biorefinery for the production of oil, high-value pigments,and biohydrogen (bioH2). The energy consumption and CO2 emissions involved in the whole process(microalgae cultivation, harvest, dewater, mill, extraction and leftover biomass fermentation) were eval-uated. An economic evaluation was also performed. Oil was obtained by soxhlet (SE) and supercriticalfluid extraction (SFE). The bioH2 was produced by fermentation of the leftover biomass. The oil produc-tion pathway by SE shows the lowest value of energy consumption, 177-245 MJ/MJprod, and CO2 emis-sions, 13–15 kgCO2/MJprod. Despite consuming and emitting c.a. 20% more than the SE pathway, the oilobtained by SFE, proved to be more economically viable, with a cost of 365€/kgoil produced and simulta-neously extracting high-value pigments. The bioH2 as co-product may be advantageous in terms of prod-uct yield or profit.
� 2013 Elsevier Ltd. All rights reserved.
1. Introduction
Microalgal biomass has the potential to provide renewable en-ergy (e.g. biodiesel, bioethanol, biohydrogen and biogas) throughthe production of different energy vectors. In addition, they alsohave the capacity to synthesize bioactive molecules, such ascarotenoids, fatty acids, antioxidants, anti-inflammatory and othervaluable organic compounds, which can be used in food, feed, cos-metic, biomaterials, nanostructures and pharmaceutical industries(Marques et al., 2011). A systemic approach to the culture andrefinery of microalgae is therefore essential and should integratethe production of biofuels and co-products. The biorefinery
approach consists in the production of a wide range of biofuelsand chemicals from biomass and it assists in making biofuel pro-duction economically feasible (Gouveia, 2011).
Without competing with food cultures, arable land, potablewater and having a higher productivity and the possibility of dailyharvesting, the microalgae potential for biofuel production is huge.However, the current implementation of microalga-based systemshas been economically constrained by their still poor volumetricefficiencies, which still lead to excessively high costs comparedto petroleum prices. Moreover, technological drawbacks are alsopresent, namely the maximum biomass concentration attainablein the available photobioreactors, the biomass productivity, theefficiency of harvesting and the relatively low microalga intrinsiclipid content (Amaro et al., 2011). Therefore a careful assessmentof the life cycle energy balances – including actual environmental
236 A.F. Ferreira et al. / Bioresource Technology 138 (2013) 235–244
impacts and economic evaluation – should be addressed prior tothe process being implemented on an industrial scale. Further-more, when considering the microalgal biomass growth and lipidsynthesis, it is essential to be aware of the impacts of downstreamprocessing on the energy balance.
Exhaustive work has been done by other authors on the produc-tion of biofuels through various biological methods with differentfeedstocks, however most recently, studies of biofuel productionby microalgae, such as biodiesel, are being widely developed interms of energy and CO2 assessment, including an assessment oftheir costs (Campbell et al., 2010; Soratana and Landis, 2011; Xuet al., 2011). Other studies covering the life cycle of biodiesel pro-duction (Stephenson et al., 2010; Lardon et al., 2009; Khoo et al.,2011) showing values in the range of 2.8–5.4 MJ/MJBD and0.2–0.9 kgCO2/MJBD. The values presented in these studies wereobtained from the optimized processes with high productivitiesand used open ponds for algae production. An alternative solutionto reduce the excessive energy that is required in microalgaegrowth is presented in a Lam et al. (2012) study, where the carboncapturing was carried out with CO2 bio-fixation. Aiming to analyzethe energy and environmental impacts in a photobioreactor pilotplant, Itoiz et al. (2012) achieved a total energy input for marinemicroalgae of 923 MJ/kg for indoor culture conditions. There areEuropean and US databases for fuel life cycle inventories (LCIs),including energy, CO2 emissions and cost evaluations which wereproduced by CONCAWE (CONCAWE, 2008) and Greet (Franket al., 2011), respectively. A new version of the Greet model (Franket al., 2011) includes new algae pathways but only to produce bio-oil, including the algae growth, dewatering and oil extractionstages.
The industrial viability of microalgae-based biofuels dependsupon the economical aspects which are fundamental to the pro-cess. Furthermore, whatever advances might arise in terms of tech-nological innovations, the market will not exhibit an enthusiasmfor funding capital-intensive energy projects unless the risk–returnratio is acceptable (Singh and Gu, 2010).
The global cost of biodiesel production by microalgae may besplit into the partial costs associated with the biomass growth,the harvesting (including the concentration of the biomass to asuitable level for further processing and dewatering), the oilextraction and the oil transesterification (conventional biodiesel).
Thurmond (2009) highlighted the several strategic steps re-quired for successful microalgal biofuel production and that theycan be consubstantiated in the following five keywords: ‘fatter’,‘faster’, ‘cheaper’, ‘easier’ and ‘fraction’. The first two, i.e. ‘fatter’and ‘faster’, are the primary strategic needs for microalgal biodieseltrade and they mean that species which are richer in oil are easierto extract and therefore are to be preferentially sought. If produc-ers can use fatter microalgae (e.g. with at least 60% oil content) thatgrow faster, then they can reduce both the size and footprint of thebiofuel plant by as much as a half, which may lead to a significantreduction in capital and operating costs (Singh and Gu, 2010). Inview of this, ‘cheaper’ and ‘easier’ processes are to be pursued.Based on several available reports (Thurmond, 2009), the currentestimated costs for the production of microalgal biodiesel lie be-tween 1.84€ and 5.12€ per liter in ponds and within the range of3.07–8.19€ in photobioreactors. Since microalga production sys-tems are a rather complex combination of several sub-processes(i.e. cultivation, harvesting, drying and extraction), reducing theassociated number of steps is thus crucial to lower the costs. Thecompany Algae to Energy LLC has accordingly been exploiting aprocess patented by Missing Link Technology, to extract oil frommicroalgae at the price of 0.02–0.06€ per liter (depending on thespecies used) which compares with other methods that typicallyrange from 0.41€ to 2.46€ per liter. Another example is the uniqueharvesting technology from Algae Venture Systems, which costs,
less than 0.06€ per liter, and is thus much more profitable than tra-ditional centrifugation that can cost up to 0.20€ or more per liter(Singh and Gu, 2010). Finally, co-production of ‘fractions’ that pos-sess an even higher added value, compared to bulk or fine chemi-cals, is also important towards overall commercial feasibility. Notethat even when microalgal species possess 50% of oil, an additional50% of biomass remains – which contains valuable proteins forlivestock, poultry and fish feed, which are currently valued from620€ to 1937€ per ton (Singh and Gu, 2010). Therefore the recy-cling of the spent biomass and unused nutrients, after downstreamprocessing, for reuse in the installation of microalgae culture willhelp to reduce the costs incurred in providing nitrogen fertilizer(Scott et al., 2010). Moreover, the microalgal residues resultingfrom the lipid extraction have higher effective sugar concentration(fermentable compounds). The Nannochloropsis sp. used in thisstudy contains approximately 17% w/w dry weight of total sugars(Nobre et al., 2013). Bellou and Aggelis (2012) reported a valueof 17.5–20.5% w/w dry weight of total sugars for Nannochloropsissalina. Therefore, lipid extracted microalgal residues can furtherbe converted into other energy vectors, such as bioethanol (fer-mentation), bioH2 (fermentation) or biogas (anaerobic digestion),with potential energetic and economical advantages.
This work deals with the evaluation of the energy consumed,CO2 emitted and the economic impact of a Nannochloropsis sp.microalga biorefinery that corresponds to a laboratory-scale studydeveloped recently by Nobre et al. (2013). The combined lipid andhigh-value pigment extraction and fractionation were conducted,and from the leftover biomass, bioH2 was produced by dark fer-mentation. The overall economic evaluation was performedincluding biodiesel and carotenoid production costs and benefits,as well as bioH2 production from the leftover biomass. Despitebeing a laboratory experiment the authors aim to identify the pro-cesses that have high energy, emissions and cost requirements inorder to optimize these items in futures works, not only small scaleexperiments but also pilot and industrial level biorefineries.Accordingly, the authors took into consideration the allocationsfor the amount/volume of samples used and not the maximumequipment capacities.
2. Methodology
2.1. Life cycle inventory of the biorefinery
The life cycle inventory (LCI) is a very important tool to quantifyinputs and outputs of a system. At this stage, all emissions are re-ported on a volume or mass basis (e.g. kg of CO2). The LCI is a phaseof the life cycle assessment (LCA) which is a tool that analyzes aproduct during its lifetime from its production, to its utilizationand end-of-life, including its recycling process. It is an importanttool to estimate the energy balance and environmental impact ofa system. It can also be used to compare different energy systemsincluding vehicle technologies and production systems (e.g. biofuelproduction) (Ferreira et al., 2011). The LCA was performed accord-ing to the principles of ISO 14040 (ISO, 1997). This analysis is cru-cial to verify if the processes and technologies used areenvironmentally friendly and sufficiently efficient. If not, it is pos-sible to identify the bottlenecks and apply improvements on theenergy and CO2 emission chain.
2.1.1. Units and characterization of the main processes, inputs andoutputs
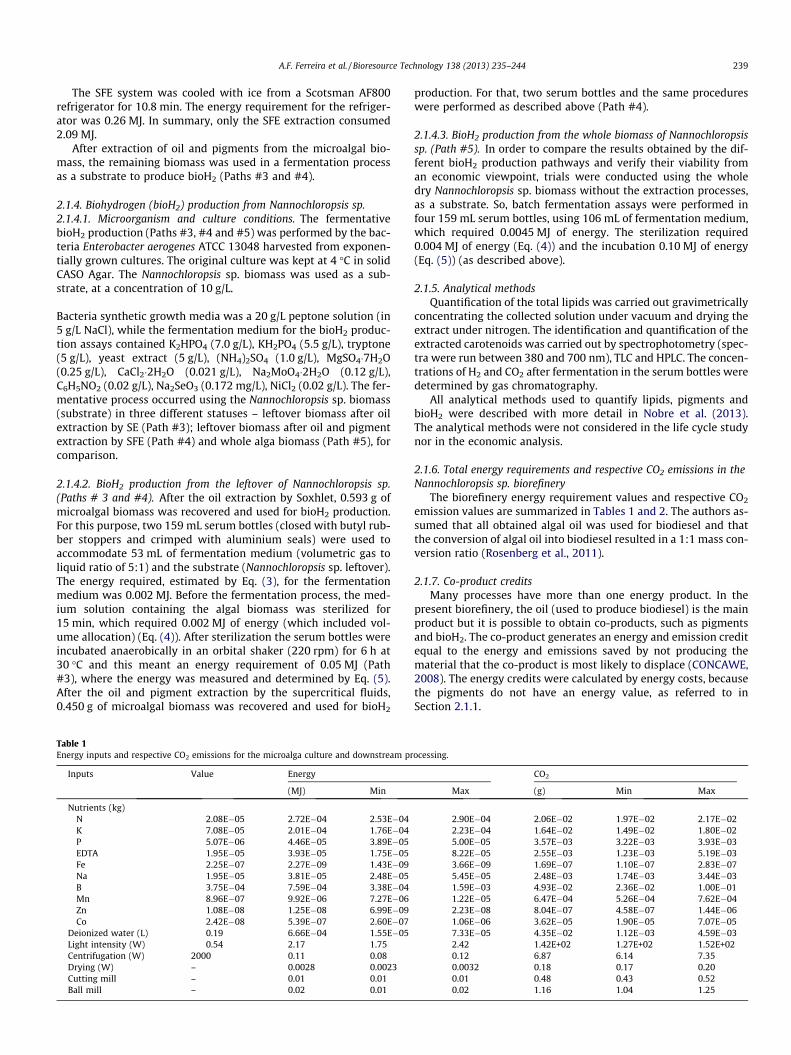
The LCI covers the fundamental processes concerning the biore-finery: microalgae cultivation, harvesting, dewatering, milling,lipid and pigment extraction and leftover biomass to bioH2 produc-tion. The overall LCI system boundary and all the processes consid-
A.F. Ferreira et al. / Bioresource Technology 138 (2013) 235–244 237
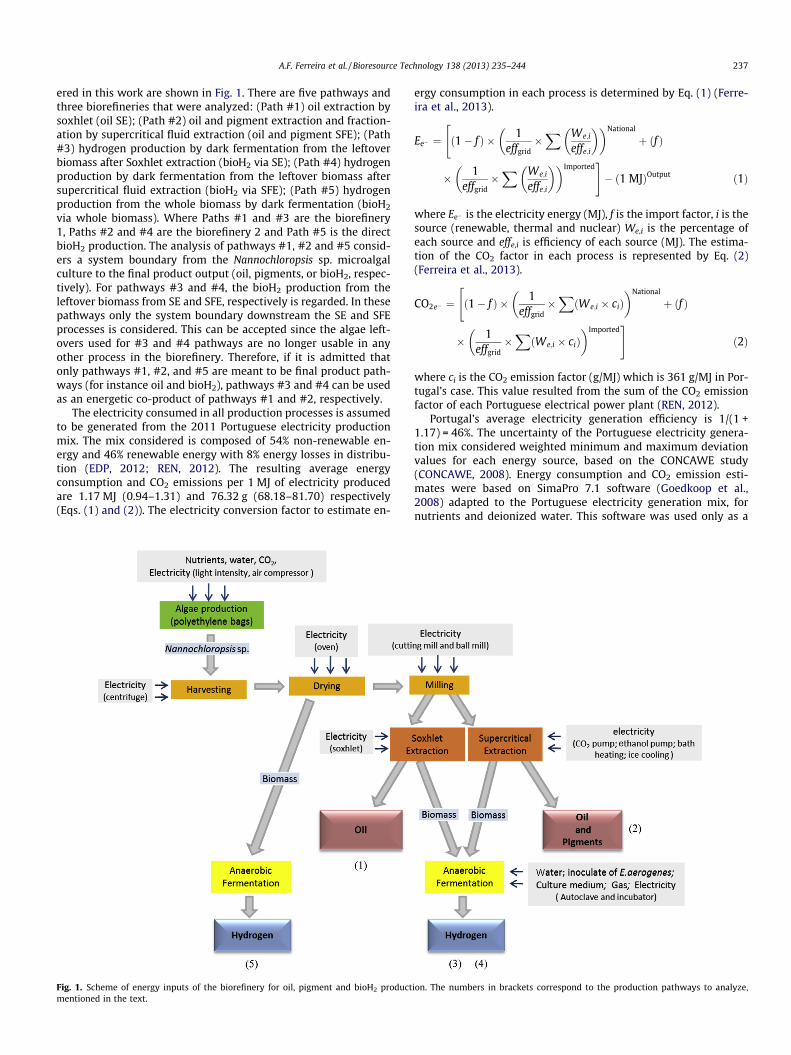
ered in this work are shown in Fig. 1. There are five pathways andthree biorefineries that were analyzed: (Path #1) oil extraction bysoxhlet (oil SE); (Path #2) oil and pigment extraction and fraction-ation by supercritical fluid extraction (oil and pigment SFE); (Path#3) hydrogen production by dark fermentation from the leftoverbiomass after Soxhlet extraction (bioH2 via SE); (Path #4) hydrogenproduction by dark fermentation from the leftover biomass aftersupercritical fluid extraction (bioH2 via SFE); (Path #5) hydrogenproduction from the whole biomass by dark fermentation (bioH2
via whole biomass). Where Paths #1 and #3 are the biorefinery1, Paths #2 and #4 are the biorefinery 2 and Path #5 is the directbioH2 production. The analysis of pathways #1, #2 and #5 consid-ers a system boundary from the Nannochloropsis sp. microalgalculture to the final product output (oil, pigments, or bioH2, respec-tively). For pathways #3 and #4, the bioH2 production from theleftover biomass from SE and SFE, respectively is regarded. In thesepathways only the system boundary downstream the SE and SFEprocesses is considered. This can be accepted since the algae left-overs used for #3 and #4 pathways are no longer usable in anyother process in the biorefinery. Therefore, if it is admitted thatonly pathways #1, #2, and #5 are meant to be final product path-ways (for instance oil and bioH2), pathways #3 and #4 can be usedas an energetic co-product of pathways #1 and #2, respectively.
The electricity consumed in all production processes is assumedto be generated from the 2011 Portuguese electricity productionmix. The mix considered is composed of 54% non-renewable en-ergy and 46% renewable energy with 8% energy losses in distribu-tion (EDP, 2012; REN, 2012). The resulting average energyconsumption and CO2 emissions per 1 MJ of electricity producedare 1.17 MJ (0.94–1.31) and 76.32 g (68.18–81.70) respectively(Eqs. (1) and (2)). The electricity conversion factor to estimate en-
Fig. 1. Scheme of energy inputs of the biorefinery for oil, pigment and bioH2 productmentioned in the text.
ergy consumption in each process is determined by Eq. (1) (Ferre-ira et al., 2013).
Ee� ¼ ð1� f Þ � 1effgrid
�X We;i
effe;i
� �� �National
þ ðf Þ"
� 1effgrid
�X We;i
effe;i
� �� �Imported#� ð1 MJÞOutput ð1Þ
where Ee� is the electricity energy (MJ), f is the import factor, i is thesource (renewable, thermal and nuclear) We,i is the percentage ofeach source and effe,i is efficiency of each source (MJ). The estima-tion of the CO2 factor in each process is represented by Eq. (2)(Ferreira et al., 2013).
CO2e� ¼ ð1� f Þ � 1effgrid
�XðWe;i � ciÞ
� �National
þ ðf Þ"
� 1effgrid
�XðWe;i � ciÞ
� �Imported#
ð2Þ
where ci is the CO2 emission factor (g/MJ) which is 361 g/MJ in Por-tugal’s case. This value resulted from the sum of the CO2 emissionfactor of each Portuguese electrical power plant (REN, 2012).
Portugal’s average electricity generation efficiency is 1/(1 +1.17) = 46%. The uncertainty of the Portuguese electricity genera-tion mix considered weighted minimum and maximum deviationvalues for each energy source, based on the CONCAWE study(CONCAWE, 2008). Energy consumption and CO2 emission esti-mates were based on SimaPro 7.1 software (Goedkoop et al.,2008) adapted to the Portuguese electricity generation mix, fornutrients and deionized water. This software was used only as a
ion. The numbers in brackets correspond to the production pathways to analyze,
238 A.F. Ferreira et al. / Bioresource Technology 138 (2013) 235–244
database source. The remaining energy inputs, from the equipment/lighting used, were derived from the device specifications and work-ing hours (Ferreira et al., 2012). The functional unit of energy con-sumption and CO2 emissions are defined as MJ/MJBD produced andg/MJBD produced, respectively.
In this study we used all the energy requirements that resultedfrom the experimental data. Only operational processes were ac-counted, i.e. equipment production and storage were not included.Following the methodology used in all pathways, the Portugueseelectricity, Ee� , and CO2 emission factors, which have a resultingassociated uncertainty, are regarded as mentioned below (Ferreiraet al., 2013).
Enutrients; water; gases ðMJÞ ¼ ESimaPro � Ee� ð3Þ
Eequipestimated ðMJÞ ¼ Pequipment � Dt � cf � Ee� ð4Þ
where P is power (W), Dt is working time (h) and cf is the capacityfactor (mL) of the equipment if –0. Eq. (4) was used to estimate theenergy consumption of centrifugation and sterilization equipment.All the other equipments’ energies were measured through Eq. (5).
Eequipmeasurement ðMJÞ ¼ eA � V � Dt � ð1� 10�06Þ � cf � Ee� ð5Þ
where eA is alternate electric current (A), V is electric tension (V) andDt is working time (s).
Rough energy requirements may be summarized by Eq. (6).
MJexpended
MJprod¼
Xi
MJkgprod
� �i
h iLHV
ð6Þ
LHV stands for the biodiesel a low heating value of 37.3 MJ/kgand for bioH2 a low heating value of 120 MJ/kg (Heywood, 1988).Biodiesel and hydrogen density is assumed to be 0.88 kg/L and0.084 kg/m3, respectively (EERE, 2001) and CO2 density is assumedto be 1.848 kg/m3 (Linde, 2012). Pigments do not have energeticvalue and therefore it is not possible to determine energy require-ment in MJ/MJ unit.
2.1.2. Biomass cultureThe microalgal biomass was produced in polyethylene bags
having a 10 L capacity (PBR). Ten g of dried biomass was obtainedin one PBR, but in this study 1 g was used as a calculation basis forthe energy and CO2 balances for each pathway analyzed in the LCI.Therefore, for each process the calculations are made taking intoaccount the energy/CO2 required for handling this amount of bio-mass, which in some cases (bioH2 production) means repeatingoperations due to the limited capacity of the laboratory equipmentused.
The GPM microalga culture medium composed of KNO3
(0.200 g/L), K2HPO4 (0.038 g/L), H3BO3 (0.034 g/L), Na2EDTA(0.030 g/L), MnCl2�4H2O (4.30 mg/L), FeCl3�6H2O (1.45 mg/L), ZnCl2
(0.30 mg/L) and CoCl2�6H2O (0.13 mg/L) in 75% filtered seawater:25% de-ionized water, was used for Nannochloropsis sp. growth.
The microalga was cultured under continuous light provided byfluorescence lamps (Philips TL-D 36W/54-765) with a luminanceaverage of 0.95 lux, for 40 days. The power requirement to produce1 g of biomass was 2.17 MJ. This value was obtained by Eq. (4) mul-tiplying the light energy allocated by the number of hours of illu-mination and energy mix factor according to Eq. (2). The lightintensity was allocated, considering only the intensity of light fo-cused on the bioreactor, i.e. only 15% of the total intensity of thelamp was regarded.
The PBR was agitated by bubbling air with a flow of 0.2 vvm(L/L min). The air compressor had a capacity of 230 L/min whileconsuming 2.2 kW, but for the microalga culture the equipment
was not at the maximum power and flow. The energy requirementin this case was 0.0019 W, which corresponds to 0.001 MJ.
After growth, the microalgal biomass was harvested by centri-fugation of 0.75 L of culture in an Avanti J-25 series centrifugefor 10 min at 10,000 rpm (2000 W of motor power). The final esti-mated energy (Eq. (4)) used in centrifugation was 0.11 MJ.
Subsequently, the biomass was dried in an oven at 70 �C for12 h, calculated by direct measurement (Eq. (5)), of 0.0028 MJ ofenergy and resulting in 1 g of dried algal biomass.
2.1.3. Oil and pigment extractionMilling of the dry alga was needed for the oil and pigment
extraction (Paths #1 and #2, respectively). For this purpose, twotypes of mill equipment were used: a commercial cutting milland a ball mill Retsch� model MM400. To guarantee an efficientgrinding of the algae, a maximum of a 1 g sample loading was usedin the cutting and ball mills. In the first sample, milling was neededfor 1 min, requiring in total 0.01 MJ of energy. In the second one,the process lasted 3.5 min, using eight stainless steel balls(10 mm £) and a speed of 25 s�1, requiring a total of 0.02 MJ of en-ergy. The alga oil was extracted by two methods: Soxhlet extrac-tion (Path #1) and supercritical fluid extraction (Path #2).
2.1.3.1. Soxhlet extraction (SE). The Soxhlet method was used to ex-tract the oil from the alga. This extraction was carried out using 1 gof milled microalga with n-hexane for 6 h in a P-select Soxhlet withsix mantles. The energy required was obtained by multiplying thedirect current measurement (Eq. (5)) of one mantle of the Soxhletequipment, because only one mantle was used, by the voltage,time work (seconds) and by the energy mix factor. The energy con-sumed was 0.76 MJ. The resulting oil extracts were evaporated in aBüch Vacuum controller V-800 for 30 min. The energy consump-tion was 0.25 MJ.
2.1.3.2. Supercritical fluid extraction (SFE). Using the supercriticalfluid extraction process, two products were obtained, oil and pig-ments (Path #2) in two different fractions. The SFE apparatus usedin this study was described by Mendes et al. (2003) in detail, andmodified to include a co-solvent addition system (Nobre et al.,2013). The extraction was carried out using 1 g of milled microalga,firstly with pure supercritical CO2 as a solvent (extract 1), followedby extraction with supercritical CO2 modified with ethanol (20%wt.) (Extract 2). For the purpose of the energy consumed, the CO2
emitted and the economic impact of the SFE process, it was consid-ered that the extraction ended at extract 2 (Nobre et al., 2013),since further extraction (extracts 3 and 4) would only slightly in-crease the amount of oil and pigment recovered. The SFE apparatuscontained a CO2 pump, an ethanol (EtOH) pump, and bath heatingand cooling systems. The energy consumed in all steps was deter-mined by direct current measurements (Eq. (5)). This extractionwas carried out one time using a 5 cm2 extraction vessel filled with1 g of biomass. The LDC/Milton Roy CO2 pump was used for 2.58 hrequiring 0.95 MJ of energy. The Gilson 308 EtOH pump was usedfor 50 min to extract the pigment, requiring 0.28 MJ of energy.
The bath heating was performed by a Julabo thermostat at amaximum temperature of 40 �C and the three-way valve washeated at the same temperature by a rheostat Selecta model with300 W of electrical power. The energy consumed in the thermostatwas 0.48 MJ and was determined by direct current measurementsin the thermostat during the heating process. The rheostat wasused for about 20 min at 40 �C only to maintain the temperature,operating at 15–25% of the total electrical power consuming0.008 MJ of energy. In the agitation procedure, the total electricalpower used was 0.02 MJ. That is, in total the bath heating con-sumed 0.59 MJ of energy, including the electric generation mix.
A.F. Ferreira et al. / Bioresource Technology 138 (2013) 235–244 239
The SFE system was cooled with ice from a Scotsman AF800refrigerator for 10.8 min. The energy requirement for the refriger-ator was 0.26 MJ. In summary, only the SFE extraction consumed2.09 MJ.
After extraction of oil and pigments from the microalgal bio-mass, the remaining biomass was used in a fermentation processas a substrate to produce bioH2 (Paths #3 and #4).
2.1.4. Biohydrogen (bioH2) production from Nannochloropsis sp.2.1.4.1. Microorganism and culture conditions. The fermentativebioH2 production (Paths #3, #4 and #5) was performed by the bac-teria Enterobacter aerogenes ATCC 13048 harvested from exponen-tially grown cultures. The original culture was kept at 4 �C in solidCASO Agar. The Nannochloropsis sp. biomass was used as a sub-strate, at a concentration of 10 g/L.
Bacteria synthetic growth media was a 20 g/L peptone solution (in5 g/L NaCl), while the fermentation medium for the bioH2 produc-tion assays contained K2HPO4 (7.0 g/L), KH2PO4 (5.5 g/L), tryptone(5 g/L), yeast extract (5 g/L), (NH4)2SO4 (1.0 g/L), MgSO4�7H2O(0.25 g/L), CaCl2�2H2O (0.021 g/L), Na2MoO4�2H2O (0.12 g/L),C6H5NO2 (0.02 g/L), Na2SeO3 (0.172 mg/L), NiCl2 (0.02 g/L). The fer-mentative process occurred using the Nannochloropsis sp. biomass(substrate) in three different statuses – leftover biomass after oilextraction by SE (Path #3); leftover biomass after oil and pigmentextraction by SFE (Path #4) and whole alga biomass (Path #5), forcomparison.
2.1.4.2. BioH2 production from the leftover of Nannochloropsis sp.(Paths # 3 and #4). After the oil extraction by Soxhlet, 0.593 g ofmicroalgal biomass was recovered and used for bioH2 production.For this purpose, two 159 mL serum bottles (closed with butyl rub-ber stoppers and crimped with aluminium seals) were used toaccommodate 53 mL of fermentation medium (volumetric gas toliquid ratio of 5:1) and the substrate (Nannochloropsis sp. leftover).The energy required, estimated by Eq. (3), for the fermentationmedium was 0.002 MJ. Before the fermentation process, the med-ium solution containing the algal biomass was sterilized for15 min, which required 0.002 MJ of energy (which included vol-ume allocation) (Eq. (4)). After sterilization the serum bottles wereincubated anaerobically in an orbital shaker (220 rpm) for 6 h at30 �C and this meant an energy requirement of 0.05 MJ (Path#3), where the energy was measured and determined by Eq. (5).After the oil and pigment extraction by the supercritical fluids,0.450 g of microalgal biomass was recovered and used for bioH2
Table 1Energy inputs and respective CO2 emissions for the microalga culture and downstream pr
Inputs Value Energy
(MJ) Min
Nutrients (kg)N 2.08E�05 2.72E�04 2.53E�04K 7.08E�05 2.01E�04 1.76E�04P 5.07E�06 4.46E�05 3.89E�05EDTA 1.95E�05 3.93E�05 1.75E�05Fe 2.25E�07 2.27E�09 1.43E�09Na 1.95E�05 3.81E�05 2.48E�05B 3.75E�04 7.59E�04 3.38E�04Mn 8.96E�07 9.92E�06 7.27E�06Zn 1.08E�08 1.25E�08 6.99E�09Co 2.42E�08 5.39E�07 2.60E�07
Deionized water (L) 0.19 6.66E�04 1.55E�05Light intensity (W) 0.54 2.17 1.75Centrifugation (W) 2000 0.11 0.08Drying (W) – 0.0028 0.0023Cutting mill – 0.01 0.01Ball mill – 0.02 0.01
production. For that, two serum bottles and the same procedureswere performed as described above (Path #4).
2.1.4.3. BioH2 production from the whole biomass of Nannochloropsissp. (Path #5). In order to compare the results obtained by the dif-ferent bioH2 production pathways and verify their viability froman economic viewpoint, trials were conducted using the wholedry Nannochloropsis sp. biomass without the extraction processes,as a substrate. So, batch fermentation assays were performed infour 159 mL serum bottles, using 106 mL of fermentation medium,which required 0.0045 MJ of energy. The sterilization required0.004 MJ of energy (Eq. (4)) and the incubation 0.10 MJ of energy(Eq. (5)) (as described above).
2.1.5. Analytical methodsQuantification of the total lipids was carried out gravimetrically
concentrating the collected solution under vacuum and drying theextract under nitrogen. The identification and quantification of theextracted carotenoids was carried out by spectrophotometry (spec-tra were run between 380 and 700 nm), TLC and HPLC. The concen-trations of H2 and CO2 after fermentation in the serum bottles weredetermined by gas chromatography.
All analytical methods used to quantify lipids, pigments andbioH2 were described with more detail in Nobre et al. (2013).The analytical methods were not considered in the life cycle studynor in the economic analysis.
2.1.6. Total energy requirements and respective CO2 emissions in theNannochloropsis sp. biorefinery
The biorefinery energy requirement values and respective CO2
emission values are summarized in Tables 1 and 2. The authors as-sumed that all obtained algal oil was used for biodiesel and thatthe conversion of algal oil into biodiesel resulted in a 1:1 mass con-version ratio (Rosenberg et al., 2011).
2.1.7. Co-product creditsMany processes have more than one energy product. In the
present biorefinery, the oil (used to produce biodiesel) is the mainproduct but it is possible to obtain co-products, such as pigmentsand bioH2. The co-product generates an energy and emission creditequal to the energy and emissions saved by not producing thematerial that the co-product is most likely to displace (CONCAWE,2008). The energy credits were calculated by energy costs, becausethe pigments do not have an energy value, as referred to inSection 2.1.1.
ocessing.
CO2
Max (g) Min Max
2.90E�04 2.06E�02 1.97E�02 2.17E�022.23E�04 1.64E�02 1.49E�02 1.80E�025.00E�05 3.57E�03 3.22E�03 3.93E�038.22E�05 2.55E�03 1.23E�03 5.19E�033.66E�09 1.69E�07 1.10E�07 2.83E�075.45E�05 2.48E�03 1.74E�03 3.44E�031.59E�03 4.93E�02 2.36E�02 1.00E�011.22E�05 6.47E�04 5.26E�04 7.62E�042.23E�08 8.04E�07 4.58E�07 1.44E�061.06E�06 3.62E�05 1.90E�05 7.07E�057.33E�05 4.35E�02 1.12E�03 4.59E�032.42 1.42E+02 1.27E+02 1.52E+020.12 6.87 6.14 7.350.0032 0.18 0.17 0.200.01 0.48 0.43 0.520.02 1.16 1.04 1.25
Tabl
e2
Ener
gyin
put
and
CO2
emis
sion
indi
ffer
ent
proc
esse
sin
the
bior
efine
ry.
Oil
SE(P
ath
#1)
Oil
and
pigm
ent
SFE
(Pat
h#
2)B
ioH
2vi
aSE
(Pat
h#
3)B
ioH
2vi
aSF
E(P
ath
#4)
Bio
H2
via
dire
ctbi
omas
s(P
ath
#5)
Soxh
let
Evap
orat
ion
CO
2
pum
pEt
OH
pum
pB
ath
hea
tin
gC
ooli
ng
Ferm
enta
tion
med
ium
Ster
iliz
atio
nFe
rmen
tati
on(i
ncu
bati
on)
Ferm
enta
tion
med
ium
Ster
iliz
atio
nFe
rmen
tati
on(i
ncu
bati
on)
Ferm
enta
tion
med
ium
Ster
iliz
atio
nFe
rmen
tati
on(i
ncu
bati
on)
Ener
gy(M
J)0.
760
0.25
20.
947
0.28
50.
594
0.25
90.
002
0.00
20.
050
0.00
20.
002
0.05
00.
004
0.00
40.
100
Min
0.61
20.
203
0.76
30.
230
0.45
30.
209
0.00
190.
001
0.04
00.
0019
0.00
10.
040
0.00
400.
003
0.08
1M
ax0.
847
0.28
11.
056
0.31
80.
636
0.28
90.
0023
0.00
20.
056
0.00
230.
002
0.05
60.
0051
0.00
40.
112
CO
2(g
)49
.616
.461
.818
.638
.816
.90.
160.
123.
260.
160.
123.
260.
330.
246.
53M
in44
.314
.755
.216
.632
.715
.10.
150.
112.
920.
150.
112.
920.
310.
225.
83M
ax53
.117
.666
.119
.939
.918
.10.
180.
133.
490.
180.
133.
490.
350.
266.
99
Table 3Electricity and fuel commercial cost in Portugal (euro per kWh of fuel).
Cost €/kWh References
Electricity 0.0535 EDP (2012)Diesel 0.0083 ERSE (2012)Heavy oil 0.0033 ERSE (2012)Coal 0.0006 ERSE (2012)Natural gas 0.0290 ERSE (2012)
240 A.F. Ferreira et al. / Bioresource Technology 138 (2013) 235–244
Eq. (7) was used to calculate energy costs:
X ðMJi=3:6Þgprod
� €
kWh¼ €
gprodð7Þ
The MJi can be seen in Tables 1 and 2 and €/kWh can be seen inTable 3.
Credits were determined by Eq. (8).
€
goil� €
gco-product¼ total cost in biorefinery ð8Þ
Tables 3 and 4 show the energy prices considered in Eqs. (7)and (8).
2.2. Economic assumptions
Before analyzing the production costs of the microalgal oil ofthis study, it is important to take into account the followingaspects:
- all the laboratory procedures were made aiming to fulfill thebiological efficiency of the system; saving money or electricitywere never the main goals;
- the calculations were made based on a laboratory productionscale;
- only the costs of electricity and inputs were taken intoaccount. Labor, equipment, land investments or indirect costswere not considered in this study.
All production costs were estimated based on the current mar-ket prices (see Table 4). For the electricity costs, the unit used waseuro per kWh, while for CO2, H2, and nutrients, the unit was europer kg. The nutrients required and their costs are listed in Table 4.The salt water used in the processes was considered free ofcharge. The price of CO2 used in the process was based on retailprices. No other source of CO2 was considered (i.e. a power sta-tion, flue gas). The Portugal Electricity fare in very high tensionand long utilization mode without additional taxes was used(0.0535 €/kWh).
An oil fraction containing different pigments (e.g. 50% of pig-ments were a mixture of astaxanthin, canthaxanthin, lutein andbeta-carotene) was extracted from Nannochloropsis sp. Since notall pigments have established market prices, an average hypo-thetical value of 450 €/kg was considered from market pricesfound of known pigments (Oilgae, 2013). With all input data,electricity used, volume of oil and H2 obtained and prices, itwas possible to calculate the cost of the different processes andevaluate diverse possibilities of production. Finally, a retail valueof the algal oil was established aiming to achieve a financial breakeven, where all the costs studied were covered if the oil could besold at this price.
The possibility to use the bioH2 generated to provide all theelectricity of the system was also assessed from an economicalpoint of view. For this purpose, how much it would be necessaryto spend on Paths #3, #4 or #5 was calculated in order to producethe bioH2 needed. Electricity costs for all processes were
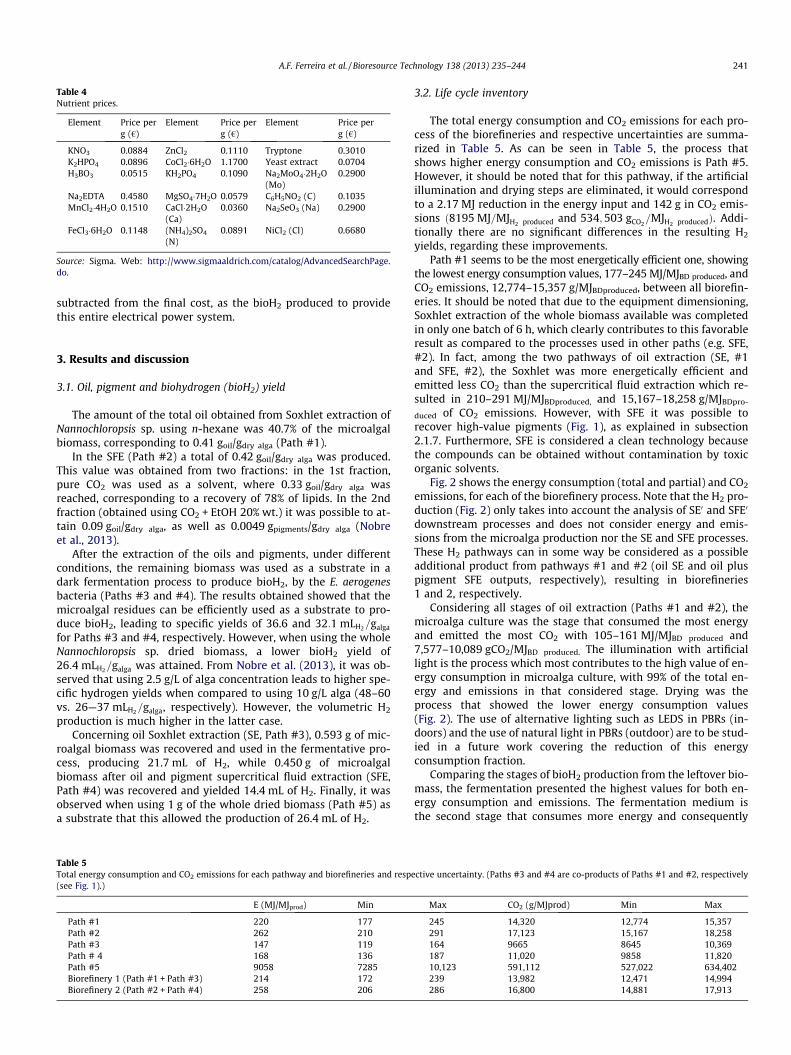
Table 4Nutrient prices.
Element Price perg (€)
Element Price perg (€)
Element Price perg (€)
KNO3 0.0884 ZnCl2 0.1110 Tryptone 0.3010K2HPO4 0.0896 CoCl2�6H2O 1.1700 Yeast extract 0.0704H3BO3 0.0515 KH2PO4 0.1090 Na2MoO4�2H2O
(Mo)0.2900
Na2EDTA 0.4580 MgSO4�7H2O 0.0579 C6H5NO2 (C) 0.1035MnCl2�4H2O 0.1510 CaCl�2H2O
(Ca)0.0360 Na2SeO3 (Na) 0.2900
FeCl3�6H2O 0.1148 (NH4)2SO4
(N)0.0891 NiCl2 (Cl) 0.6680
Source: Sigma. Web: http://www.sigmaaldrich.com/catalog/AdvancedSearchPage.do.
A.F. Ferreira et al. / Bioresource Technology 138 (2013) 235–244 241
subtracted from the final cost, as the bioH2 produced to providethis entire electrical power system.
3. Results and discussion
3.1. Oil, pigment and biohydrogen (bioH2) yield
The amount of the total oil obtained from Soxhlet extraction ofNannochloropsis sp. using n-hexane was 40.7% of the microalgalbiomass, corresponding to 0.41 goil/gdry alga (Path #1).
In the SFE (Path #2) a total of 0.42 goil/gdry alga was produced.This value was obtained from two fractions: in the 1st fraction,pure CO2 was used as a solvent, where 0.33 goil/gdry alga wasreached, corresponding to a recovery of 78% of lipids. In the 2ndfraction (obtained using CO2 + EtOH 20% wt.) it was possible to at-tain 0.09 goil/gdry alga, as well as 0.0049 gpigments/gdry alga (Nobreet al., 2013).
After the extraction of the oils and pigments, under differentconditions, the remaining biomass was used as a substrate in adark fermentation process to produce bioH2, by the E. aerogenesbacteria (Paths #3 and #4). The results obtained showed that themicroalgal residues can be efficiently used as a substrate to pro-duce bioH2, leading to specific yields of 36.6 and 32:1 mLH2=galga
for Paths #3 and #4, respectively. However, when using the wholeNannochloropsis sp. dried biomass, a lower bioH2 yield of26:4 mLH2=galga was attained. From Nobre et al. (2013), it was ob-served that using 2.5 g/L of alga concentration leads to higher spe-cific hydrogen yields when compared to using 10 g/L alga (48–60vs. 26—37 mLH2=galga, respectively). However, the volumetric H2
production is much higher in the latter case.Concerning oil Soxhlet extraction (SE, Path #3), 0.593 g of mic-
roalgal biomass was recovered and used in the fermentative pro-cess, producing 21.7 mL of H2, while 0.450 g of microalgalbiomass after oil and pigment supercritical fluid extraction (SFE,Path #4) was recovered and yielded 14.4 mL of H2. Finally, it wasobserved when using 1 g of the whole dried biomass (Path #5) asa substrate that this allowed the production of 26.4 mL of H2.
Table 5Total energy consumption and CO2 emissions for each pathway and biorefineries and resp(see Fig. 1).)
E (MJ/MJprod) Min
Path #1 220 177Path #2 262 210Path #3 147 119Path # 4 168 136Path #5 9058 7285Biorefinery 1 (Path #1 + Path #3) 214 172Biorefinery 2 (Path #2 + Path #4) 258 206
3.2. Life cycle inventory
The total energy consumption and CO2 emissions for each pro-cess of the biorefineries and respective uncertainties are summa-rized in Table 5. As can be seen in Table 5, the process thatshows higher energy consumption and CO2 emissions is Path #5.However, it should be noted that for this pathway, if the artificialillumination and drying steps are eliminated, it would correspondto a 2.17 MJ reduction in the energy input and 142 g in CO2 emis-sions ð8195 MJ=MJH2 produced and 534;503 gCO2
=MJH2 producedÞ. Addi-tionally there are no significant differences in the resulting H2
yields, regarding these improvements.Path #1 seems to be the most energetically efficient one, showing
the lowest energy consumption values, 177–245 MJ/MJBD produced, andCO2 emissions, 12,774–15,357 g/MJBDproduced, between all biorefin-eries. It should be noted that due to the equipment dimensioning,Soxhlet extraction of the whole biomass available was completedin only one batch of 6 h, which clearly contributes to this favorableresult as compared to the processes used in other paths (e.g. SFE,#2). In fact, among the two pathways of oil extraction (SE, #1and SFE, #2), the Soxhlet was more energetically efficient andemitted less CO2 than the supercritical fluid extraction which re-sulted in 210–291 MJ/MJBDproduced, and 15,167–18,258 g/MJBDpro-
duced of CO2 emissions. However, with SFE it was possible torecover high-value pigments (Fig. 1), as explained in subsection2.1.7. Furthermore, SFE is considered a clean technology becausethe compounds can be obtained without contamination by toxicorganic solvents.
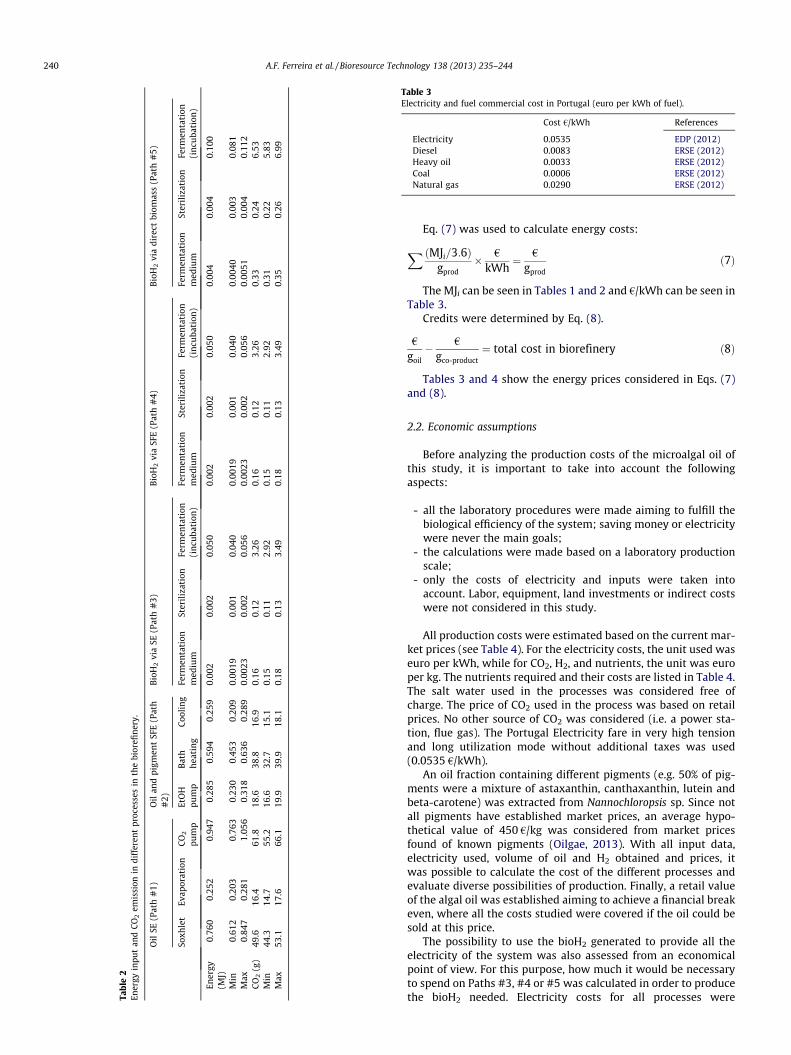
Fig. 2 shows the energy consumption (total and partial) and CO2
emissions, for each of the biorefinery process. Note that the H2 pro-duction (Fig. 2) only takes into account the analysis of SE0 and SFE0
downstream processes and does not consider energy and emis-sions from the microalga production nor the SE and SFE processes.These H2 pathways can in some way be considered as a possibleadditional product from pathways #1 and #2 (oil SE and oil pluspigment SFE outputs, respectively), resulting in biorefineries1 and 2, respectively.
Considering all stages of oil extraction (Paths #1 and #2), themicroalga culture was the stage that consumed the most energyand emitted the most CO2 with 105–161 MJ/MJBD produced and7,577–10,089 gCO2/MJBD produced. The illumination with artificiallight is the process which most contributes to the high value of en-ergy consumption in microalga culture, with 99% of the total en-ergy and emissions in that considered stage. Drying was theprocess that showed the lower energy consumption values(Fig. 2). The use of alternative lighting such as LEDS in PBRs (in-doors) and the use of natural light in PBRs (outdoor) are to be stud-ied in a future work covering the reduction of this energyconsumption fraction.
Comparing the stages of bioH2 production from the leftover bio-mass, the fermentation presented the highest values for both en-ergy consumption and emissions. The fermentation medium isthe second stage that consumes more energy and consequently
ective uncertainty. (Paths #3 and #4 are co-products of Paths #1 and #2, respectively
Max CO2 (g/MJprod) Min Max
245 14,320 12,774 15,357291 17,123 15,167 18,258164 9665 8645 10,369187 11,020 9858 11,82010,123 591,112 527,022 634,402239 13,982 12,471 14,994286 16,800 14,881 17,913
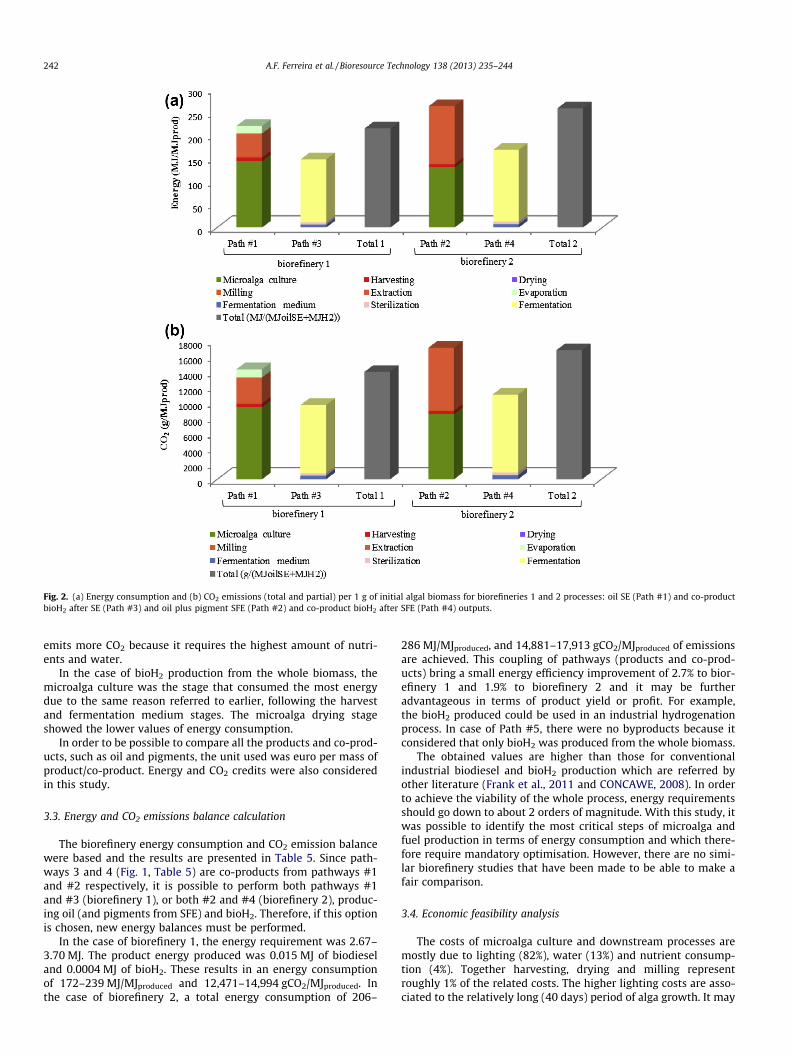
Fig. 2. (a) Energy consumption and (b) CO2 emissions (total and partial) per 1 g of initial algal biomass for biorefineries 1 and 2 processes: oil SE (Path #1) and co-productbioH2 after SE (Path #3) and oil plus pigment SFE (Path #2) and co-product bioH2 after SFE (Path #4) outputs.
242 A.F. Ferreira et al. / Bioresource Technology 138 (2013) 235–244
emits more CO2 because it requires the highest amount of nutri-ents and water.
In the case of bioH2 production from the whole biomass, themicroalga culture was the stage that consumed the most energydue to the same reason referred to earlier, following the harvestand fermentation medium stages. The microalga drying stageshowed the lower values of energy consumption.
In order to be possible to compare all the products and co-prod-ucts, such as oil and pigments, the unit used was euro per mass ofproduct/co-product. Energy and CO2 credits were also consideredin this study.
3.3. Energy and CO2 emissions balance calculation
The biorefinery energy consumption and CO2 emission balancewere based and the results are presented in Table 5. Since path-ways 3 and 4 (Fig. 1, Table 5) are co-products from pathways #1and #2 respectively, it is possible to perform both pathways #1and #3 (biorefinery 1), or both #2 and #4 (biorefinery 2), produc-ing oil (and pigments from SFE) and bioH2. Therefore, if this optionis chosen, new energy balances must be performed.
In the case of biorefinery 1, the energy requirement was 2.67–3.70 MJ. The product energy produced was 0.015 MJ of biodieseland 0.0004 MJ of bioH2. These results in an energy consumptionof 172–239 MJ/MJproduced and 12,471–14,994 gCO2/MJproduced. Inthe case of biorefinery 2, a total energy consumption of 206–
286 MJ/MJproduced, and 14,881–17,913 gCO2/MJproduced of emissionsare achieved. This coupling of pathways (products and co-prod-ucts) bring a small energy efficiency improvement of 2.7% to bior-efinery 1 and 1.9% to biorefinery 2 and it may be furtheradvantageous in terms of product yield or profit. For example,the bioH2 produced could be used in an industrial hydrogenationprocess. In case of Path #5, there were no byproducts because itconsidered that only bioH2 was produced from the whole biomass.
The obtained values are higher than those for conventionalindustrial biodiesel and bioH2 production which are referred byother literature (Frank et al., 2011 and CONCAWE, 2008). In orderto achieve the viability of the whole process, energy requirementsshould go down to about 2 orders of magnitude. With this study, itwas possible to identify the most critical steps of microalga andfuel production in terms of energy consumption and which there-fore require mandatory optimisation. However, there are no simi-lar biorefinery studies that have been made to be able to make afair comparison.
3.4. Economic feasibility analysis
The costs of microalga culture and downstream processes aremostly due to lighting (82%), water (13%) and nutrient consump-tion (4%). Together harvesting, drying and milling representroughly 1% of the related costs. The higher lighting costs are asso-ciated to the relatively long (40 days) period of alga growth. It may
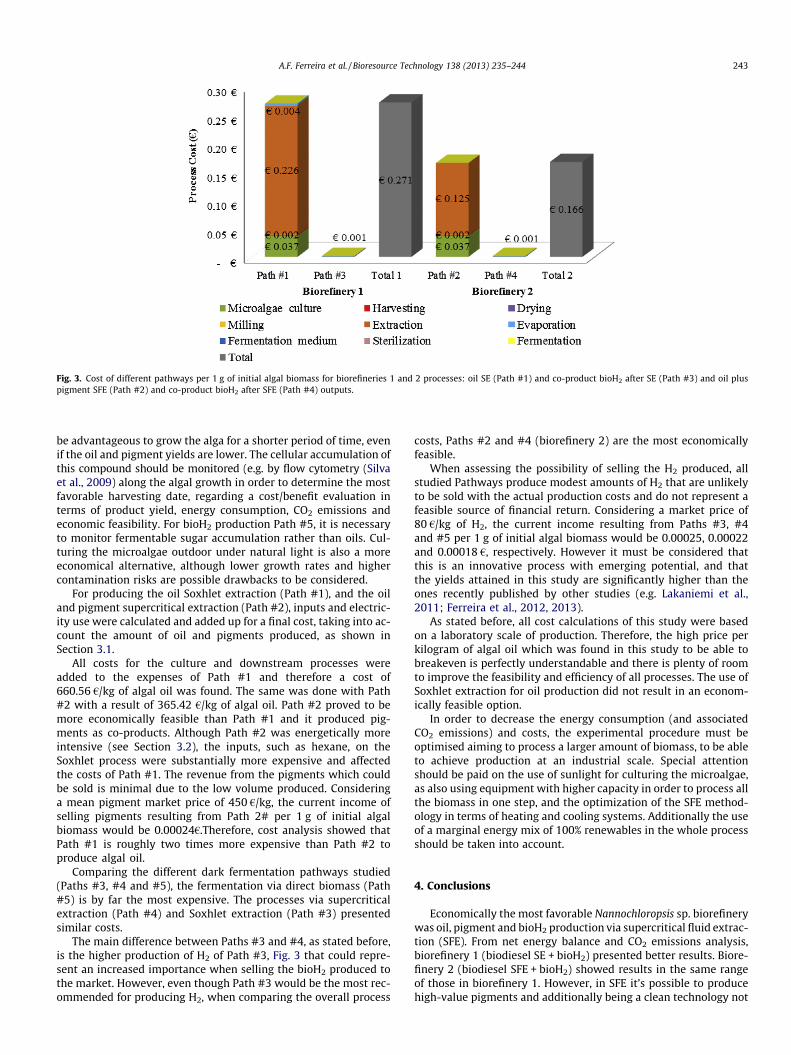
Fig. 3. Cost of different pathways per 1 g of initial algal biomass for biorefineries 1 and 2 processes: oil SE (Path #1) and co-product bioH2 after SE (Path #3) and oil pluspigment SFE (Path #2) and co-product bioH2 after SFE (Path #4) outputs.
A.F. Ferreira et al. / Bioresource Technology 138 (2013) 235–244 243
be advantageous to grow the alga for a shorter period of time, evenif the oil and pigment yields are lower. The cellular accumulation ofthis compound should be monitored (e.g. by flow cytometry (Silvaet al., 2009) along the algal growth in order to determine the mostfavorable harvesting date, regarding a cost/benefit evaluation interms of product yield, energy consumption, CO2 emissions andeconomic feasibility. For bioH2 production Path #5, it is necessaryto monitor fermentable sugar accumulation rather than oils. Cul-turing the microalgae outdoor under natural light is also a moreeconomical alternative, although lower growth rates and highercontamination risks are possible drawbacks to be considered.
For producing the oil Soxhlet extraction (Path #1), and the oiland pigment supercritical extraction (Path #2), inputs and electric-ity use were calculated and added up for a final cost, taking into ac-count the amount of oil and pigments produced, as shown inSection 3.1.
All costs for the culture and downstream processes wereadded to the expenses of Path #1 and therefore a cost of660.56 €/kg of algal oil was found. The same was done with Path#2 with a result of 365.42 €/kg of algal oil. Path #2 proved to bemore economically feasible than Path #1 and it produced pig-ments as co-products. Although Path #2 was energetically moreintensive (see Section 3.2), the inputs, such as hexane, on theSoxhlet process were substantially more expensive and affectedthe costs of Path #1. The revenue from the pigments which couldbe sold is minimal due to the low volume produced. Consideringa mean pigment market price of 450 €/kg, the current income ofselling pigments resulting from Path 2# per 1 g of initial algalbiomass would be 0.00024€.Therefore, cost analysis showed thatPath #1 is roughly two times more expensive than Path #2 toproduce algal oil.
Comparing the different dark fermentation pathways studied(Paths #3, #4 and #5), the fermentation via direct biomass (Path#5) is by far the most expensive. The processes via supercriticalextraction (Path #4) and Soxhlet extraction (Path #3) presentedsimilar costs.
The main difference between Paths #3 and #4, as stated before,is the higher production of H2 of Path #3, Fig. 3 that could repre-sent an increased importance when selling the bioH2 produced tothe market. However, even though Path #3 would be the most rec-ommended for producing H2, when comparing the overall process
costs, Paths #2 and #4 (biorefinery 2) are the most economicallyfeasible.
When assessing the possibility of selling the H2 produced, allstudied Pathways produce modest amounts of H2 that are unlikelyto be sold with the actual production costs and do not represent afeasible source of financial return. Considering a market price of80 €/kg of H2, the current income resulting from Paths #3, #4and #5 per 1 g of initial algal biomass would be 0.00025, 0.00022and 0.00018 €, respectively. However it must be considered thatthis is an innovative process with emerging potential, and thatthe yields attained in this study are significantly higher than theones recently published by other studies (e.g. Lakaniemi et al.,2011; Ferreira et al., 2012, 2013).
As stated before, all cost calculations of this study were basedon a laboratory scale of production. Therefore, the high price perkilogram of algal oil which was found in this study to be able tobreakeven is perfectly understandable and there is plenty of roomto improve the feasibility and efficiency of all processes. The use ofSoxhlet extraction for oil production did not result in an econom-ically feasible option.
In order to decrease the energy consumption (and associatedCO2 emissions) and costs, the experimental procedure must beoptimised aiming to process a larger amount of biomass, to be ableto achieve production at an industrial scale. Special attentionshould be paid on the use of sunlight for culturing the microalgae,as also using equipment with higher capacity in order to process allthe biomass in one step, and the optimization of the SFE method-ology in terms of heating and cooling systems. Additionally the useof a marginal energy mix of 100% renewables in the whole processshould be taken into account.
4. Conclusions
Economically the most favorable Nannochloropsis sp. biorefinerywas oil, pigment and bioH2 production via supercritical fluid extrac-tion (SFE). From net energy balance and CO2 emissions analysis,biorefinery 1 (biodiesel SE + bioH2) presented better results. Biore-finery 2 (biodiesel SFE + bioH2) showed results in the same rangeof those in biorefinery 1. However, in SFE it’s possible to producehigh-value pigments and additionally being a clean technology not
244 A.F. Ferreira et al. / Bioresource Technology 138 (2013) 235–244
using toxic organic solvents. Biorefinery 2 is the best energy/CO2/economy compromise.
Pilot studies should complement this work in order to achievean economically beneficial and feasible process at an industrialscale.
Acknowledgements
The authors would like to acknowledge the Fundação para aCiência e Tecnologia for the financial support of Ana Ferreira PhDGrant (SFRH/BD/60373/2009), Beatriz P. Nobre Post-Doc grant(SFRH/BPD/42004/2007) and for the following national Projects:‘‘Power demand estimation and power system impacts resultingof fleet penetration of electric/plug-in vehicles’’ (MIT-Pt/SES-GI/0008/2008) and ‘‘Microalgae as a sustainable raw material for bio-fuels production (biodiesel, bioethanol, bioH2 and biogas)’’ (PTDC/AAC-AMB/100354/2008); the Brazilian National Council for theImprovement of Higher Education (CAPES) for the financial supportof Lauro Ribeiro PhD grant. This work has been partially supportedby the FCT under the project grant PEst-C/EEI/UI0308/2011 and hasbeen framed under the Energy for Sustainability Initiative of theUniversity of Coimbra and supported by the R&D Project EMSUREEnergy and Mobility for Sustainable Regions (CENTRO 07 0224FEDER 002004). The authors also thank Stephanie Seddon-Brownfor English proof reading of this manuscript.
References
Amaro, H.M., Guedes, A.C., Malcata, F.X., 2011. Advances and perspectives in usingmicroalgae to produce biodiesel. Applied Energy 88, 3402–3410.
Bellou, S., Aggelis, G., 2012. Biochemical activities in Chlorella sp. andNannochloropsis salina during lipid and sugar synthesis in a lab-scale openpond simulating reactor. Journal of Biotechnology 164, 318–329.
Campbell, P., Beer, T., Batten, D., 2010. Life cycle assessment of biodiesel productionfrom microalgae in ponds. Bioresource Technology 102, 50–56.
Concawe, 2008. Well-to-wheels analysis of future automotive fuels andpowertrains in the European context. Well-to-wheels Report. <http://ies.jrc.ec.europa.eu> (accessed 18.06.2012).
EDP, Energia de Portugal S.A., 2012. Resultados 2010. <www.edp.pt> (accessed18.06.2012).
EERE, Energy Efficiency & Renewable Energy, 2001. Hydrogen Fuel Cell engines andrelated Technologies Course Manual, 2001. U.S. Department of Energy, http://www1.eere.energy.gov/hydrogenandfuelcells.
ERSE, Entidade Reguladora dos Serviços Energéticos, 2012. <http://www.erse.pt/pt/gasnatural/tarifaseprecos/0711_0612/Documents/Despacho%20ERSE%208-2011%20_Tarifas%20GN%202011-2012.pdf> (accessed 6/07/2012).
Ferreira, A.F., Ribau, J.P., Silva, C.M., 2011. Energy consumption and CO2 emissions ofpotato peel and sugarcane biohydrogen production pathways, applied toPortuguese road transportation. International Journal of Hydrogen Energy 36,13547–13558.
Ferreira, A.F., Marques, A.C., Batista, A.P., Marques, P.A.S.S., Gouveia, L., Silva, C.M.,2012. Biological hydrogen production by Anabaena sp. – yield, energy and CO2
analysis including fermentative biomass recovery. International Journal ofHydrogen Energy 37, 179–190.
Ferreira, A.F., Ortigueira, J., Alves, L., Gouveia, L., Moura, P., Silva, C.M., 2013. Energyrequirement and CO2 emissions of BioH2 production from microalgal biomass.Biomass and Bioenergy 49, 249–259.
Frank, E.D., Han, J., Palou-Rivera, I., Elgowainy, A., Wang, M.Q., 2011. Life CycleAnalysis of Algal Lipid Fuels with the GREET Model. Energy System Division,Argonne National Laboratory.
Goedkoop, M., De Schryver, A., Oele, M., 2008. Introduction to LCA with SimaPro 7.Pre-Consultants.
Gouveia, L., 2011. Microalgae as a Feedstock for Biofuels. Springer Briefs inMicrobiology. Springer, Heidelberg, Germany.
Heywood, J.B., 1988. Internal Combustion Engine Fundamentals. McGraw-Hill.ISO 14040, 1997. Environmental management – life cycle assessment – principles
and framework. International Organisation for Standardisation, Geneva.Itoiz, E.S., Fuentes-Grünewald, C., Gasol, C.M., Garcés, E., Alacid, E., Rossi, S.,
Rieradevall, J., 2012. Energy balance and environmental impact analysis of
marine microalgal biomass production for biodiesel generation in aphotobioreactor pilot plant. Biomass and Bioenergy 39, 324–335.
Khoo, H.H., Sharratt, P.N., Das, P., Balasubramanian, R.K., Naraharisetti, P.K., Shaik, S.,2011. Life cycle energy and CO2 analysis of microalgae-to-biodiesel:preliminary results and comparisons. Bioresource Technology 102, 5800–5807.
Lakaniemi, A.M., Hulatt, C.J., Thomas, D.N., Tuovinen, O.H., Puhakka, J.A., 2011.Biogenic hydrogen and methane production from Chlorella vulgaris andDunaliella tertiolecta. Biotechnology for Biofuels 4, 34.
Lam, M.L., Lee, K.T., Mohamed, A.R., 2012. Current status and challenges onmicroalgae-based carbon capture. International Journal of Greenhouse GasControl 10, 456–469.
Lardon, L., Helias, A., Sialve, B., Steyer, J.P., Bernard, O., 2009. Life-cycle assessmentof biodiesel production from microalgae. Environmental Science andTechnology 43, 6475–6481.
Linde Sogás, Lda, 2012. <http://www.linde-gas.com/en/index.html> (accessed18.06.2012).
Marques, A., Miranda, J., Batista, A.P., Gouveia, L., 2011. Microalgae biotechnologicalapplications: nutrition, health and environment. In: Johansen, M.N. (Ed.),Microalgae: Biotechnology, Microbiology and Energy. Nova Science PublishersInc., pp. 1–60.
Mendes, R.L., Nobre, B.P., Cardoso, M.T., Pereira, A.P., Palavra, A.F., 2003.Supercritical carbon dioxide extraction of compounds with pharmaceuticalimportance from microalgae. Inorganica Chimica Acta 356, 328–334.
Nobre, B.P., Villalobos, F., Barragán, B.E., Oliveira, A.C., Batista, A.P., Marques, P.A.S.S.,Mendes, R.L., Sovová, H., Palavra, A.F., Gouveia, L., 2013. Biorefinery fromNannochloropsis sp. microalga – extraction of microalgal oils and pigments andbiohydrogen production from biomass leftover. Bioresource Technology 135,128–136.
Oilgae. <http://www.oilgae.com> (accessed 10.01.2013).REN, Rede Eléctrica Nacional, Sistema informação mensal, sistema electroprodutor,
2012. <http://www.ren.pt> (accessed 18.06.2012).Rosenberg, J.N., Mathias, A., Korth, K., Betenbaugh, M.J., Oyler, G.A., 2011. Microalgal
biomass production and carbon dioxide sequestration from an integratedethanol biorefinery in Iowa: a technical appraisal and economic feasibilityevaluation. Biomass and Bioenergy 35, 3865–3876.
Scott, S.A., Davey, M.P., Dennis, J.S., Horst, I., Howe, C.J., Lea-Smith, D.J., 2010.Biodiesel from algae: challenges and prospects. Current Opinion inBiotechnology 21, 277–286.
Silva, T.L., Reis, A., Medeiros, R., Oliveira, A.C., Gouveia, L., 2009. Oil productiontowards biofuel from autotrophic microalgae semicontinuous cultivationsmonitorized by flow cytometry. Applied Biochemistry and Biotechnology 159,568–578.
Singh, J., Gu, S., 2010. Commercialization potential of microalgae for biofuelsproduction. Renewable and Sustainable Energy Reviews 14, 2596–2610.
Soratana, K., Landis, A.E., 2011. Evaluating industrial symbiosis and algae cultivationfrom a life cycle perspective. Bioresource Technology 102, 6892–6901.
Stephenson, A.L., Kazamia, E., Dennis, J.S., Howe, C.J., Scott, S.A., Smith, A.G., 2010.Life cycle assessment of potential algal biodiesel production in the UnitedKingdom: a comparison of raceways and air-lift tubular bioreactors. EnergyFuels 24, 4062–4077.
Thurmond, W., 2009. Algae 2020: Advanced Biofuel Markets and CommercializationOutlook, first ed., p. 460.
Xu, L., Brilman, D.W.F., Withag, J.A.M., Brem, G., Kersten, S., 2011. Assessment of adry and a wet route for the production of biodiesel from microalgae: energybalance analysis. Bioresource Technology 102, 5113–5122.
Glossary
BioH2: biohydrogenBD: biodieselCASO: CAsein-peptone SOymeal-peptoneEDTA: ethylenediaminetetraacetic acidEtOH: ethanolGHG: greenhouse gasGPM: general purpose mediaHPLC: high performance liquid chromatographyLCA: life cycle assessmentLCI: life cycle inventoryLHV: low heating valueMJexpended: energy expended in a process excluding fuel final energyPBR: PhotoBioReactorTCD: thermal conductivity detectorTLC: thin layer chromatography