Hydrogen in N-Methylacetamide: Positions and dynamics of the hydrogen atoms using neutron scattering
10
Hydrogen in N-Methylacetamide: Positions and Dynamics of the Hydrogen Atoms Using Neutron Scattering Heloisa N. Bordallo,* ,²,‡ Dimitri N. Argyriou, ² Mariette Barthe ` s, § Walter Kalceff, | Stephane Rols, ‡,§ Kenneth W. Herwig, ⊥ Carlos Fehr, ² Fanni Juranyi, ∇,# and Tilo Seydel ‡ Hahn-Meitner-Institut, Glienicker Strasse, 100 14109 Berlin, Germany, Institut Laue-LangeVin, BP 156, 38042 Grenoble Cedex 9, France, UniVersite ´ Montpellier II, cc 26, 34095 Montpellier Cedex 05, France, Department of Physics and AdVanced Materials, UniVersity of Technology Sydney, NSW 2007, Australia, Spallation Neutron Source, Oak Ridge National Laboratory, Tennessee 37831, Physical Chemistry, Saarland UniVersity, 66123 Saarbrucken, Germany, and Laboratory for Neutron Scattering, Paul Scherrer Institut, 5232 Villigen, Switzerland ReceiVed: December 12, 2006; In Final Form: May 3, 2007 This work reports neutron diffraction and incoherent neutron scattering experiments on N-methylacetamide (NMA), which can be considered the model building block for the peptide linkage of polypeptides and proteins. Using the neutron data, we have been able to associate the onset of a striking negative thermal expansion (NTE) along the a-axis with a dynamical transition around 230 K, consistent with our calorimetric experiments. Observation of the NTE raises the question of possible proton transfer in NMA, which, from our data alone, still cannot be settled. We can only speculate that intermolecular repulsive forces increase as the O‚‚‚H distance decreases upon cooling, and that around 230 K the lattice relaxes without observation of an actual proton transfer. However, the existence of a nonharmonic potential, reflected by the behavior of the phonon vibrations together with the observation of NTE, could be justified by the “vibrational” polaron theory in which a dynamic localization of the vibrational energy is created by coupling an internal molecular mode to a lattice phonon. More generally, this work shows that neutron powder diffraction techniques can be very powerful for investigating structural deformations in small peptide systems. Introduction Hydrogen bonds (HB) are partially covalent interactions between a hydrogen atom bound to an electronegative atom and an electronegative acceptor atom. 1 As they play an important role in defining the structure and function of biological macromolecular systems, understanding hydrogen-bonding en- ergetics is a key factor for an accurate modeling of such interactions. However, a comparison with several molecular mechanics force fields widely used in molecular dynamics simulations of proteins, nucleic acids, and small molecules reveals systematic deviations from electronic structure calcula- tions and protein structure statistics. 2,3 These results point toward the importance of understanding the anharmonic mode coupling of the amide group, present in the HB found in protein side chains and main chains. As these systems are so large and have a very intricate energy landscape, we need to model smaller prototypical systems in order to understand these interactions. One of the longstanding building block models of the repeated peptide linkage of polypeptides and proteins is N-methylaceta- mide (CH 3 CONHCH 3 , hereafter referred to as NMA), a single amide containing methyl groups at both extremities. Structure and vibrational studies of NMA have been the subject of a number of experimental and theoretical investigations. 4-7 Of particular interest in these studies are the possible relationships between vibrational signatures of amide modes of this model peptide and those of secondary structures of peptides and proteins. NMA, which is highly hygroscopic, melts just above room temperature (301 K). The structure of crystalline NMA has an almost planar symmetry, with the NH group of one molecule bonded to the CO group of the neighboring one. Single-crystal neutron diffraction data below and above the known structural phase transition around 8 T′ ) 274 K indicates that the high- temperature phase crystallizes in the noncentrosymmetric space group Pn2 1 m. On the other hand, and in agreement with X-ray structural determination, 9 the lower temperature phase shows methyl groups slightly rotated out of the y ) 0 plane and a Pn2 1 a structure. A schematic view of the structure is shown in Figure 1. 13 C NMR studies 10 exhibit the coexistence of typical broad lines with very narrow bands, indicating that dynamic disorder is present at temperatures well below that of the structural transition. This suggests an averaging of quadrupolar interactions of the N-atom by rapid motion of a disordered state in the solid phase. The dynamic disorder evident in the 13 C NMR data is also reflected in unusually large thermal parameters of the carbon atoms derived from diffraction data collected at 250 K. 4 Furthermore, recent structural information has suggested the possibility of a glassy-type disorder 11 below T′, as well as the occurrence of a second phase transition 4 in the vicinity of 230-240 K. Small but significant differences are found in protein struc- tures measured at cryogenic temperatures when compared with ones obtained at room temperature. 12 With this application to * Corresponding author. Telephone: +49 (0)30 8062 2924. Fax: +49 (0)30 8062 2781. E-mail: [email protected]. ² Hahn-Meitner-Institut. ‡ Institut Laue-Langevin. § Universite ´ Montpellier II. | University of Technology Sydney. ⊥ Oak Ridge National Laboratory. ∇ Saarland University. # Paul Scherrer Institut. 7725 J. Phys. Chem. B 2007, 111, 7725-7734 10.1021/jp068528z CCC: $37.00 © 2007 American Chemical Society Published on Web 06/16/2007
-
Upload
independent -
Category
Documents
-
view
3 -
download
0
Transcript of Hydrogen in N-Methylacetamide: Positions and dynamics of the hydrogen atoms using neutron scattering
Hydrogen in N-Methylacetamide: Positions and Dynamics of the Hydrogen Atoms UsingNeutron Scattering
Heloisa N. Bordallo,*,†,‡ Dimitri N. Argyriou, † Mariette Barthes,§ Walter Kalceff, |
Stephane Rols,‡,§ Kenneth W. Herwig,⊥ Carlos Fehr,† Fanni Juranyi,∇,# and Tilo Seydel‡
Hahn-Meitner-Institut, Glienicker Strasse, 100 14109 Berlin, Germany, Institut Laue-LangeVin, BP 156,38042 Grenoble Cedex 9, France, UniVersiteMontpellier II, cc 26, 34095 Montpellier Cedex 05, France,Department of Physics and AdVanced Materials, UniVersity of Technology Sydney, NSW 2007, Australia,Spallation Neutron Source, Oak Ridge National Laboratory, Tennessee 37831, Physical Chemistry, SaarlandUniVersity, 66123 Saarbrucken, Germany, and Laboratory for Neutron Scattering, Paul Scherrer Institut,5232 Villigen, Switzerland
ReceiVed: December 12, 2006; In Final Form: May 3, 2007
This work reports neutron diffraction and incoherent neutron scattering experiments onN-methylacetamide(NMA), which can be considered the model building block for the peptide linkage of polypeptides and proteins.Using the neutron data, we have been able to associate the onset of a striking negative thermal expansion(NTE) along thea-axis with a dynamical transition around 230 K, consistent with our calorimetric experiments.Observation of the NTE raises the question of possible proton transfer in NMA, which, from our data alone,still cannot be settled. We can only speculate that intermolecular repulsive forces increase as the O‚‚‚H distancedecreases upon cooling, and that around 230 K the lattice relaxes without observation of an actual protontransfer. However, the existence of a nonharmonic potential, reflected by the behavior of the phonon vibrationstogether with the observation of NTE, could be justified by the “vibrational” polaron theory in which a dynamiclocalization of the vibrational energy is created by coupling an internal molecular mode to a lattice phonon.More generally, this work shows that neutron powder diffraction techniques can be very powerful forinvestigating structural deformations in small peptide systems.
Introduction
Hydrogen bonds (HB) are partially covalent interactionsbetween a hydrogen atom bound to an electronegative atom andan electronegative acceptor atom.1 As they play an importantrole in defining the structure and function of biologicalmacromolecular systems, understanding hydrogen-bonding en-ergetics is a key factor for an accurate modeling of suchinteractions. However, a comparison with several molecularmechanics force fields widely used in molecular dynamicssimulations of proteins, nucleic acids, and small moleculesreveals systematic deviations from electronic structure calcula-tions and protein structure statistics.2,3 These results point towardthe importance of understanding the anharmonic mode couplingof the amide group, present in the HB found in protein sidechains and main chains. As these systems are so large and havea very intricate energy landscape, we need to model smallerprototypical systems in order to understand these interactions.One of the longstanding building block models of the repeatedpeptide linkage of polypeptides and proteins isN-methylaceta-mide (CH3CONHCH3, hereafter referred to as NMA), a singleamide containing methyl groups at both extremities. Structureand vibrational studies of NMA have been the subject of a
number of experimental and theoretical investigations.4-7 Ofparticular interest in these studies are the possible relationshipsbetween vibrational signatures of amide modes of this modelpeptide and those of secondary structures of peptides andproteins.
NMA, which is highly hygroscopic, melts just above roomtemperature (301 K). The structure of crystalline NMA has analmost planar symmetry, with the NH group of one moleculebonded to the CO group of the neighboring one. Single-crystalneutron diffraction data below and above the known structuralphase transition around8 T′ ) 274 K indicates that the high-temperature phase crystallizes in the noncentrosymmetric spacegroupPn21m. On the other hand, and in agreement with X-raystructural determination,9 the lower temperature phase showsmethyl groups slightly rotated out of they ) 0 plane and aPn21a structure. A schematic view of the structure is shown inFigure 1.13C NMR studies10 exhibit the coexistence of typicalbroad lines with very narrow bands, indicating that dynamicdisorder is present at temperatures well below that of thestructural transition. This suggests an averaging of quadrupolarinteractions of the N-atom by rapid motion of a disordered statein the solid phase. The dynamic disorder evident in the13C NMRdata is also reflected in unusually large thermal parameters ofthe carbon atoms derived from diffraction data collected at 250K.4 Furthermore, recent structural information has suggestedthe possibility of a glassy-type disorder11 below T′, as well asthe occurrence of a second phase transition4 in the vicinity of230-240 K.
Small but significant differences are found in protein struc-tures measured at cryogenic temperatures when compared withones obtained at room temperature.12 With this application to
* Corresponding author. Telephone:+49 (0)30 8062 2924. Fax:+49(0)30 8062 2781. E-mail: [email protected].
† Hahn-Meitner-Institut.‡ Institut Laue-Langevin.§ UniversiteMontpellier II.| University of Technology Sydney.⊥ Oak Ridge National Laboratory.∇ Saarland University.# Paul Scherrer Institut.
7725J. Phys. Chem. B2007,111,7725-7734
10.1021/jp068528z CCC: $37.00 © 2007 American Chemical SocietyPublished on Web 06/16/2007
real biological systems, it is very important to reinvestigate thecrystal structure of the model NMA as a function of temperature,paying special attention to the effect of cooling rate on the solid-state transition. A full understanding of the origin of thesestructural transitions depends on probing the relationshipbetween local dynamics of the methyl groups13 and themolecular structure of NMA. In this paper we present anextensive neutron scattering study of the methyl motion in awide dynamical range of time, as well as neutron diffractionmeasurements on fully deuterated NMA. We find that in NMAthe dynamical rotational motion of the methyl groups is activatedaround 100 K. Moreover, using the Fine Resolution PowderDiffractometer E9 at the Hahn-Meitner-Institut (HMI) and theHigh Resolution Powder Diffractomer (HRPD) at ISIS, we showthat a second structural transition occurs around 230 K, whichis characterized by the onset of a clear negative thermalexpansion (NTE) of thea lattice parameter. We interpret thatthe NTE is a result of anharmonicity of the interatomic potentialthat is reflected in the unusual lattice dynamical features of theamide groups in NMA.14
Experimental Section
A. Materials and Methods. Considering that the intensityof the vibrational spectra obtained by means of neutronscattering is simply given by the product of the amplitude ofthe motion with the known scattering cross section of a nucleus,summed over all atoms of the system, it is of particularsignificance in the present work that the scattering cross sectionsof hydrogen (H) and deuterium (D) differ by a factor of 20. Inthis context isotopic replacements cause significant changes ofthe observed intensities, and can thus be employed to differenti-ate the motion of a specific H-atom (or group of atoms).Therefore, to shed light on the dynamics of the differentH-groups in NMA, quasi-elastic neutron scattering (QNS) datawere obtained on CH3CONHCD3, CD3NHCOCH3, CH3-NDCOCH3, and CD3NDCOCD3. To minimize the effects ofmultiple scattering during the QNS measurements, a sample ofthickness corresponding to a transmission value of about 0.9was used.
Neutron powder diffraction (NPD), with its ability to directlyreveal the position of light atoms by virtue of their differentscattering lengths, offers a great potential for investigating the
geometry of hydrogen-bonding systems. Unfortunately, its useon protonated samples frequently faces a specific technicaldifficulty: the large incoherent scattering of H results inbackground scattering that greatly reduces the signal-to-noiseratio of the data, making it difficult to detect coherent Braggscattering from the sample. In our work these difficulties wereovercome by the use of a fully deuterated sample. We presenthere diffraction data obtained on 2 g of CD3NDCOCD3
synthesized by CDN Isotopes (Vandreuil, Quebec) with puritygreater than 99%. The samples were loaded into their containersin a glovebag flooded with helium. To avoid the inclusion ofdisorder in the structure, instead of pulverizing the sample asdescribed in ref 5, we chose for the E9 experiments to quenchit down to 20 K and perform the measurement in steps of 20 Kon heating until just below the melting point, i.e., 280 K.However, due to the fast recrystallization of NMA andconsequent formation of various crystallites with differentpreferential orientations, the data collection was carried out byrotating the sample about its axis (using three different orienta-tions), and the analysis was performed on the averaged data. Adifferent approach was followed for the HRPD experimentsmeasured only at 140 K: the sample was loaded into a sampleholder containing small pieces of fiberglass, providing for a largenumber of nucleation centers and ensuring that the recrystalli-zation of NMA occurred with a large number of randomlyoriented grains, giving the powder data a high degree ofaveraging.
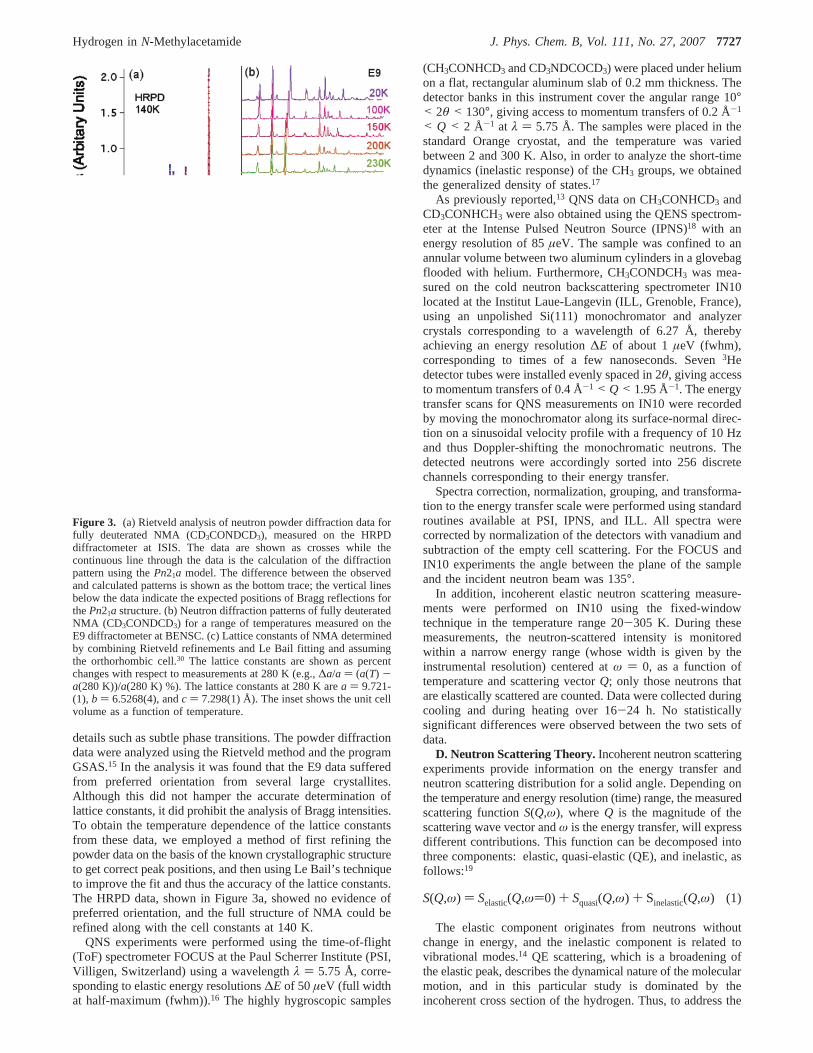
B. Calorimetric Results. Differential scanning calorimetry(DSC) measurements obtained on heating at+15°/min are givenin Figure 2. We can observe that, in agreement with earlierwork,4 besides the first-order transition that takes place atT′ )274 K, a very weak anomaly around 220 K (∼ -50 °C)indicates that a second structural transition may occur.
C. Neutron Scattering Measurements.NPD experimentswere carried out over a wide temperature range, from 20 to300 K on a fully deuterated sample, CD3CONDCD3, using thededicated fine-resolution powder diffractometer E9 at the Hahn-Meitner Institut (Berlin, Germany). This instrument providesgood efficiency by virtue of its 643He detectors distributed overa 160° range in scattering angle, while good resolution (∆d/d∼ 2 × 10⁻³) derives from a multicollimator of 10 ft horizontalacceptance. Data are collected by step-scanning the 2.5° intervalfrom one collimator to the next. Further experiments at 140 Kwere performed using HRPD, the High Resolution PowderDiffractometer at ISIS (Didcot, U.K.). The HRPD resolutionin the main backscattering detector bank, with∆d/d ∼ 4 × 10⁻⁴
(which is effectively constant over the wided-spacing rangeavailable) gives a unique capacity for the study of structural
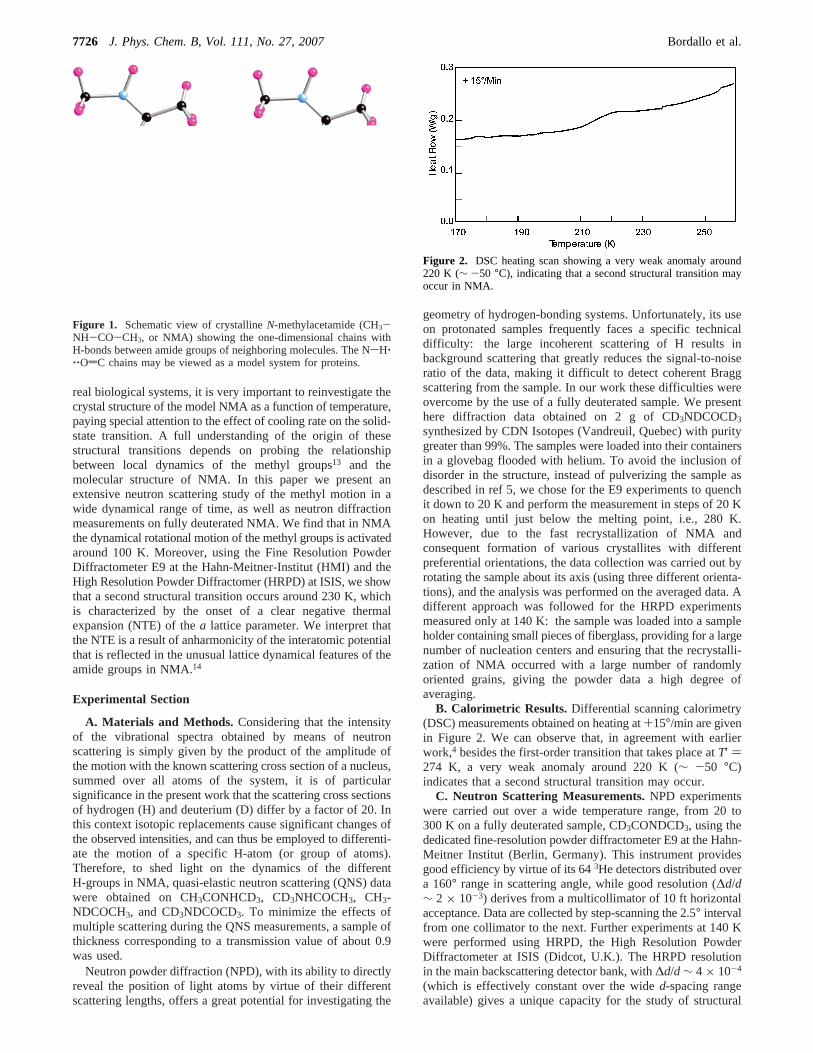
Figure 1. Schematic view of crystallineN-methylacetamide (CH3-NH-CO-CH3, or NMA) showing the one-dimensional chains withH-bonds between amide groups of neighboring molecules. The NsH‚‚‚OdC chains may be viewed as a model system for proteins.
Figure 2. DSC heating scan showing a very weak anomaly around220 K (∼ -50 °C), indicating that a second structural transition mayoccur in NMA.
7726 J. Phys. Chem. B, Vol. 111, No. 27, 2007 Bordallo et al.
details such as subtle phase transitions. The powder diffractiondata were analyzed using the Rietveld method and the programGSAS.15 In the analysis it was found that the E9 data sufferedfrom preferred orientation from several large crystallites.Although this did not hamper the accurate determination oflattice constants, it did prohibit the analysis of Bragg intensities.To obtain the temperature dependence of the lattice constantsfrom these data, we employed a method of first refining thepowder data on the basis of the known crystallographic structureto get correct peak positions, and then using Le Bail’s techniqueto improve the fit and thus the accuracy of the lattice constants.The HRPD data, shown in Figure 3a, showed no evidence ofpreferred orientation, and the full structure of NMA could berefined along with the cell constants at 140 K.
QNS experiments were performed using the time-of-flight(ToF) spectrometer FOCUS at the Paul Scherrer Institute (PSI,Villigen, Switzerland) using a wavelengthλ ) 5.75 Å, corre-sponding to elastic energy resolutions∆E of 50µeV (full widthat half-maximum (fwhm)).16 The highly hygroscopic samples
(CH3CONHCD3 and CD3NDCOCD3) were placed under heliumon a flat, rectangular aluminum slab of 0.2 mm thickness. Thedetector banks in this instrument cover the angular range 10°< 2θ < 130°, giving access to momentum transfers of 0.2 Å-1
< Q < 2 Å-1 at λ ) 5.75 Å. The samples were placed in thestandard Orange cryostat, and the temperature was variedbetween 2 and 300 K. Also, in order to analyze the short-timedynamics (inelastic response) of the CH3 groups, we obtainedthe generalized density of states.17
As previously reported,13 QNS data on CH3CONHCD3 andCD3CONHCH3 were also obtained using the QENS spectrom-eter at the Intense Pulsed Neutron Source (IPNS)18 with anenergy resolution of 85µeV. The sample was confined to anannular volume between two aluminum cylinders in a glovebagflooded with helium. Furthermore, CH3CONDCH3 was mea-sured on the cold neutron backscattering spectrometer IN10located at the Institut Laue-Langevin (ILL, Grenoble, France),using an unpolished Si(111) monochromator and analyzercrystals corresponding to a wavelength of 6.27 Å, therebyachieving an energy resolution∆E of about 1µeV (fwhm),corresponding to times of a few nanoseconds. Seven3Hedetector tubes were installed evenly spaced in 2θ, giving accessto momentum transfers of 0.4 Å-1 < Q < 1.95 Å-1. The energytransfer scans for QNS measurements on IN10 were recordedby moving the monochromator along its surface-normal direc-tion on a sinusoidal velocity profile with a frequency of 10 Hzand thus Doppler-shifting the monochromatic neutrons. Thedetected neutrons were accordingly sorted into 256 discretechannels corresponding to their energy transfer.
Spectra correction, normalization, grouping, and transforma-tion to the energy transfer scale were performed using standardroutines available at PSI, IPNS, and ILL. All spectra werecorrected by normalization of the detectors with vanadium andsubtraction of the empty cell scattering. For the FOCUS andIN10 experiments the angle between the plane of the sampleand the incident neutron beam was 135°.
In addition, incoherent elastic neutron scattering measure-ments were performed on IN10 using the fixed-windowtechnique in the temperature range 20-305 K. During thesemeasurements, the neutron-scattered intensity is monitoredwithin a narrow energy range (whose width is given by theinstrumental resolution) centered atω ) 0, as a function oftemperature and scattering vectorQ; only those neutrons thatare elastically scattered are counted. Data were collected duringcooling and during heating over 16-24 h. No statisticallysignificant differences were observed between the two sets ofdata.
D. Neutron Scattering Theory.Incoherent neutron scatteringexperiments provide information on the energy transfer andneutron scattering distribution for a solid angle. Depending onthe temperature and energy resolution (time) range, the measuredscattering functionS(Q,ω), whereQ is the magnitude of thescattering wave vector andω is the energy transfer, will expressdifferent contributions. This function can be decomposed intothree components: elastic, quasi-elastic (QE), and inelastic, asfollows:19
The elastic component originates from neutrons withoutchange in energy, and the inelastic component is related tovibrational modes.14 QE scattering, which is a broadening ofthe elastic peak, describes the dynamical nature of the molecularmotion, and in this particular study is dominated by theincoherent cross section of the hydrogen. Thus, to address the
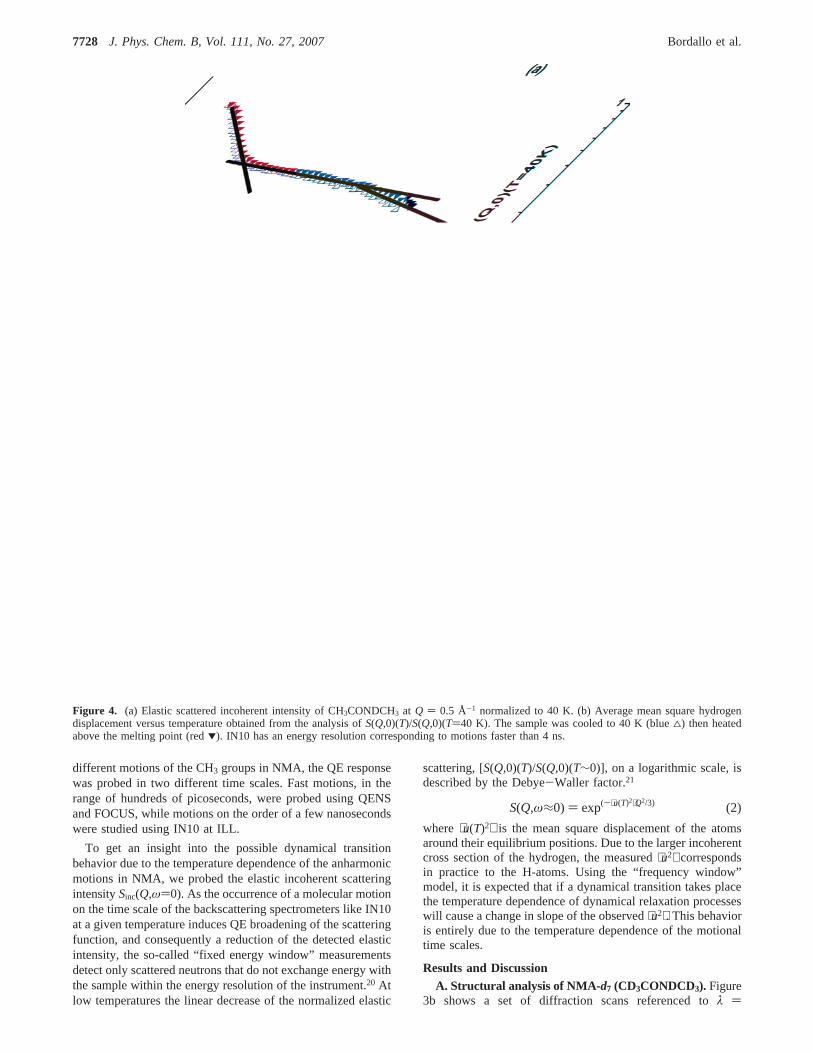
Figure 3. (a) Rietveld analysis of neutron powder diffraction data forfully deuterated NMA (CD3CONDCD3), measured on the HRPDdiffractometer at ISIS. The data are shown as crosses while thecontinuous line through the data is the calculation of the diffractionpattern using thePn21a model. The difference between the observedand calculated patterns is shown as the bottom trace; the vertical linesbelow the data indicate the expected positions of Bragg reflections forthePn21a structure. (b) Neutron diffraction patterns of fully deuteratedNMA (CD3CONDCD3) for a range of temperatures measured on theE9 diffractometer at BENSC. (c) Lattice constants of NMA determinedby combining Rietveld refinements and Le Bail fitting and assumingthe orthorhombic cell.30 The lattice constants are shown as percentchanges with respect to measurements at 280 K (e.g.,∆a/a ) (a(T) -a(280 K))/a(280 K) %). The lattice constants at 280 K area ) 9.721-(1), b ) 6.5268(4), andc ) 7.298(1) Å). The inset shows the unit cellvolume as a function of temperature.
S(Q,ω) ) Selastic(Q,ω)0) + Squasi(Q,ω) + Sinelastic(Q,ω) (1)
Hydrogen inN-Methylacetamide J. Phys. Chem. B, Vol. 111, No. 27, 20077727
different motions of the CH3 groups in NMA, the QE responsewas probed in two different time scales. Fast motions, in therange of hundreds of picoseconds, were probed using QENSand FOCUS, while motions on the order of a few nanosecondswere studied using IN10 at ILL.
To get an insight into the possible dynamical transitionbehavior due to the temperature dependence of the anharmonicmotions in NMA, we probed the elastic incoherent scatteringintensitySinc(Q,ω)0). As the occurrence of a molecular motionon the time scale of the backscattering spectrometers like IN10at a given temperature induces QE broadening of the scatteringfunction, and consequently a reduction of the detected elasticintensity, the so-called “fixed energy window” measurementsdetect only scattered neutrons that do not exchange energy withthe sample within the energy resolution of the instrument.20 Atlow temperatures the linear decrease of the normalized elastic
scattering, [S(Q,0)(T)/S(Q,0)(T∼0)], on a logarithmic scale, isdescribed by the Debye-Waller factor.21
where ⟨u(T)2⟩ is the mean square displacement of the atomsaround their equilibrium positions. Due to the larger incoherentcross section of the hydrogen, the measured⟨u2⟩ correspondsin practice to the H-atoms. Using the “frequency window”model, it is expected that if a dynamical transition takes placethe temperature dependence of dynamical relaxation processeswill cause a change in slope of the observed⟨u2⟩. This behavioris entirely due to the temperature dependence of the motionaltime scales.
Results and DiscussionA. Structural analysis of NMA-d7 (CD3CONDCD3). Figure
3b shows a set of diffraction scans referenced toλ )
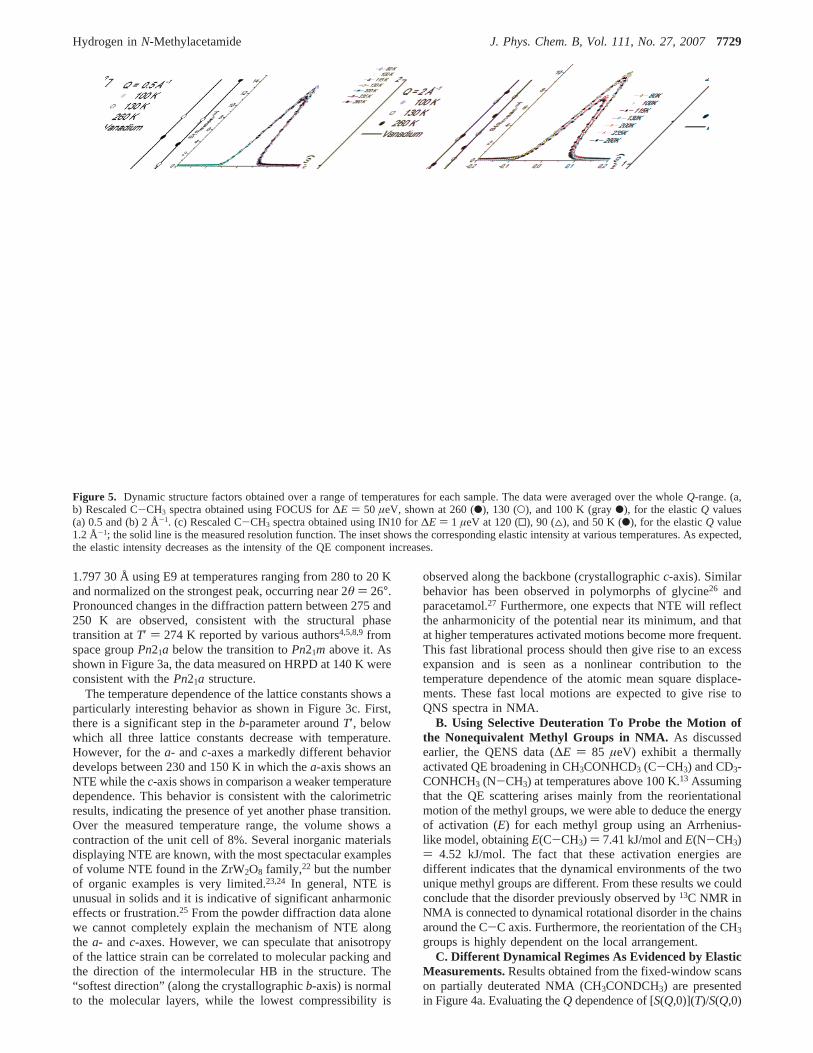
Figure 4. (a) Elastic scattered incoherent intensity of CH3CONDCH3 at Q ) 0.5 Å-1 normalized to 40 K. (b) Average mean square hydrogendisplacement versus temperature obtained from the analysis ofS(Q,0)(T)/S(Q,0)(T)40 K). The sample was cooled to 40 K (blue4) then heatedabove the melting point (red1). IN10 has an energy resolution corresponding to motions faster than 4 ns.
S(Q,ω≈0) ) exp(-⟨u(T)2⟩Q2/3) (2)
7728 J. Phys. Chem. B, Vol. 111, No. 27, 2007 Bordallo et al.
1.797 30 Å using E9 at temperatures ranging from 280 to 20 Kand normalized on the strongest peak, occurring near 2θ ) 26°.Pronounced changes in the diffraction pattern between 275 and250 K are observed, consistent with the structural phasetransition atT′ ) 274 K reported by various authors4,5,8,9fromspace groupPn21a below the transition toPn21m above it. Asshown in Figure 3a, the data measured on HRPD at 140 K wereconsistent with thePn21a structure.
The temperature dependence of the lattice constants shows aparticularly interesting behavior as shown in Figure 3c. First,there is a significant step in theb-parameter aroundT′, belowwhich all three lattice constants decrease with temperature.However, for thea- andc-axes a markedly different behaviordevelops between 230 and 150 K in which thea-axis shows anNTE while thec-axis shows in comparison a weaker temperaturedependence. This behavior is consistent with the calorimetricresults, indicating the presence of yet another phase transition.Over the measured temperature range, the volume shows acontraction of the unit cell of 8%. Several inorganic materialsdisplaying NTE are known, with the most spectacular examplesof volume NTE found in the ZrW2O8 family,22 but the numberof organic examples is very limited.23,24 In general, NTE isunusual in solids and it is indicative of significant anharmoniceffects or frustration.25 From the powder diffraction data alonewe cannot completely explain the mechanism of NTE alongthe a- andc-axes. However, we can speculate that anisotropyof the lattice strain can be correlated to molecular packing andthe direction of the intermolecular HB in the structure. The“softest direction” (along the crystallographicb-axis) is normalto the molecular layers, while the lowest compressibility is
observed along the backbone (crystallographicc-axis). Similarbehavior has been observed in polymorphs of glycine26 andparacetamol.27 Furthermore, one expects that NTE will reflectthe anharmonicity of the potential near its minimum, and thatat higher temperatures activated motions become more frequent.This fast librational process should then give rise to an excessexpansion and is seen as a nonlinear contribution to thetemperature dependence of the atomic mean square displace-ments. These fast local motions are expected to give rise toQNS spectra in NMA.
B. Using Selective Deuteration To Probe the Motion ofthe Nonequivalent Methyl Groups in NMA. As discussedearlier, the QENS data (∆E ) 85 µeV) exhibit a thermallyactivated QE broadening in CH3CONHCD3 (C-CH3) and CD3-CONHCH3 (N-CH3) at temperatures above 100 K.13 Assumingthat the QE scattering arises mainly from the reorientationalmotion of the methyl groups, we were able to deduce the energyof activation (E) for each methyl group using an Arrhenius-like model, obtainingE(C-CH3) ) 7.41 kJ/mol andE(N-CH3)) 4.52 kJ/mol. The fact that these activation energies aredifferent indicates that the dynamical environments of the twounique methyl groups are different. From these results we couldconclude that the disorder previously observed by13C NMR inNMA is connected to dynamical rotational disorder in the chainsaround the C-C axis. Furthermore, the reorientation of the CH3
groups is highly dependent on the local arrangement.C. Different Dynamical Regimes As Evidenced by Elastic
Measurements.Results obtained from the fixed-window scanson partially deuterated NMA (CH3CONDCH3) are presentedin Figure 4a. Evaluating theQ dependence of [S(Q,0)](T)/S(Q,0)
Figure 5. Dynamic structure factors obtained over a range of temperatures for each sample. The data were averaged over the wholeQ-range. (a,b) Rescaled C-CH3 spectra obtained using FOCUS for∆E ) 50 µeV, shown at 260 (b), 130 (O), and 100 K (grayb), for the elasticQ values(a) 0.5 and (b) 2 Å-1. (c) Rescaled C-CH3 spectra obtained using IN10 for∆E ) 1 µeV at 120 (0), 90 (4), and 50 K (b), for the elasticQ value1.2 Å-1; the solid line is the measured resolution function. The inset shows the corresponding elastic intensity at various temperatures. As expected,the elastic intensity decreases as the intensity of the QE component increases.
Hydrogen inN-Methylacetamide J. Phys. Chem. B, Vol. 111, No. 27, 20077729
at T ) 40 K, we calculate the⟨u2⟩ shown in Figure 4a,b. InFigure 4a,b, two inflection points are clearly observed: one near100 K and the second in the vicinity of 230-240 K. By takinginto account the large temperature interval separating thechanges in the slope of⟨u2⟩, it appears that differences in thecharacteristic times of the two motions are genuine.28 Indeed,as seen in Figure 5a,b, the QE spectra of CH3CONHCD3
obtained using∆E ) 50 µeV, show the following:(i) As expected, the effect of CH3 rotation dynamics is clearly
observed in the higher-Q spectra in this time range. Also, heatingthe sample leads to a concomitant increase in both the QEintensity and broadening, thus confirming that the CH3 motionsare activated around 80 K.
(ii) On the other hand, the existence of a slow dynamicprocess appears as an elastic component superimposed on thequasi-elastic broadening related to CH3 orientational motions(see inset of Figure 5). This contribution is represented by thepurely elastic term (δ(ω) in eq 3, below) and can be related tomotions occurring on a longer time scale compared to theinstrumental resolution. It is worth noting that the slow dynamicsis better observed at highQ-values and lower temperatures.
In order to check whether the apparent elastic peak observedin the FOCUS experiment contains a narrow QE componentrelated to slow CH3 motions, we carried out high-resolution
measurements with the backscattering spectrometer IN10 at theILL. As shown in Figure 5c, the IN10 spectra obtained for CH3-CONDCH3 indeed reveal the existence of a slow dynamicprocess. It can be seen that QE broadening is clearly evidentonly between 120 and 90 K, indicating that the slower motion“moves out” of the experimental frequency window. Thisqualitative effect is perhaps an indication that the lowesttransition is basically activated and involves an energy-barriercrossing.29
(i) Analysis of the Methyl Rotational Motion in NMA.Toobtain a qualitative description of the hydrogen motions in CH3-CONHCD3, the FOCUS+ IN10 spectra were fitted assumingan approximated Dirac function and a single Lorentzian linewidth to describe the elastic and QE signals, as follows:
whereF is a scaling factor,A0 represents the elastic incoherentstructure factor,Li(∆i,ω) are Lorentzian functions describingthe QE component, with a half-width at half-maximum (hwhm)∆i, andR(ω) is the experimental resolution function.R(ω) isdescribed by either the vanadium run (FOCUS) or by the spectraat 2 K (IN10).B is a flat background term.
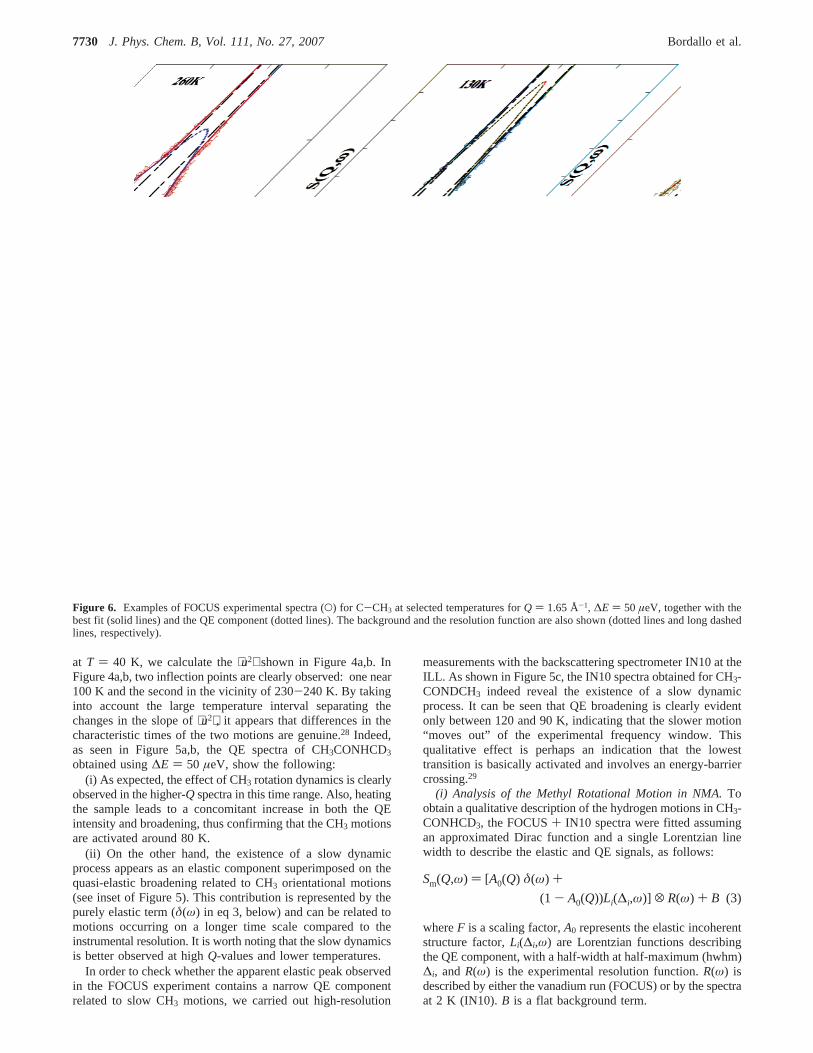
Figure 6. Examples of FOCUS experimental spectra (O) for C-CH3 at selected temperatures forQ ) 1.65 Å-1, ∆E ) 50 µeV, together with thebest fit (solid lines) and the QE component (dotted lines). The background and the resolution function are also shown (dotted lines and long dashedlines, respectively).
Sm(Q,ω) ) [A0(Q) δ(ω) +(1 - A0(Q))Li(∆i,ω)] X R(ω) + B (3)
7730 J. Phys. Chem. B, Vol. 111, No. 27, 2007 Bordallo et al.
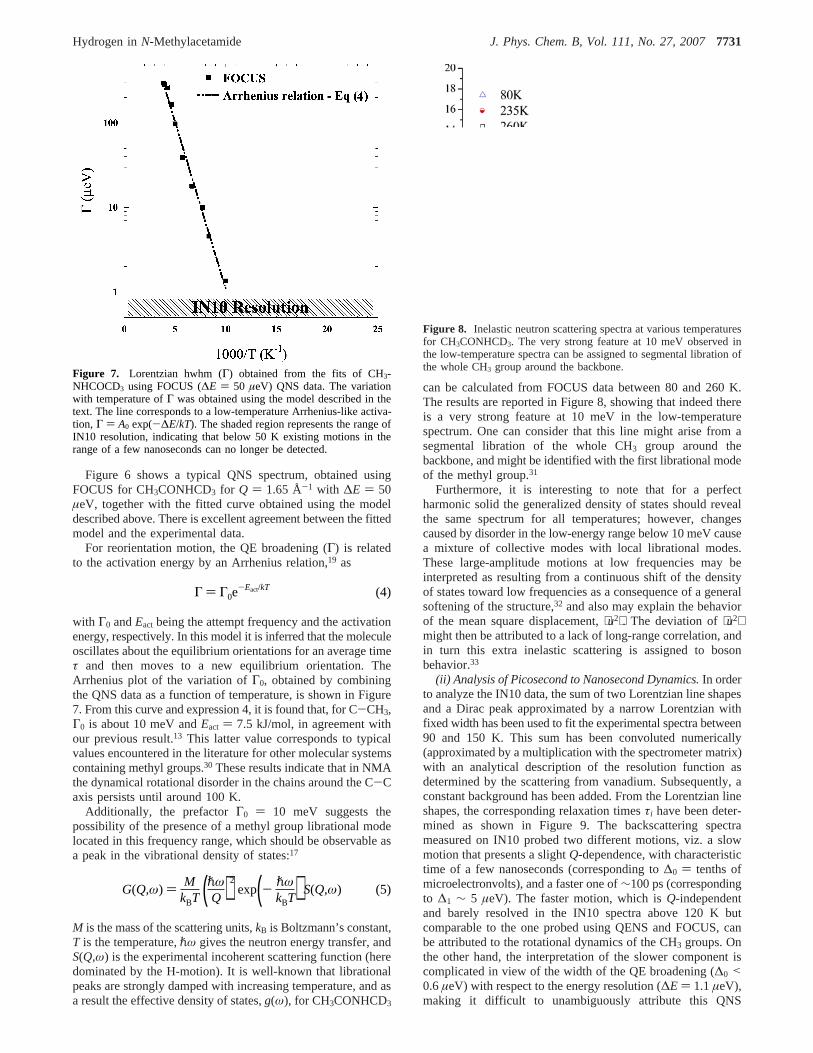
Figure 6 shows a typical QNS spectrum, obtained usingFOCUS for CH3CONHCD3 for Q ) 1.65 Å-1 with ∆E ) 50µeV, together with the fitted curve obtained using the modeldescribed above. There is excellent agreement between the fittedmodel and the experimental data.
For reorientation motion, the QE broadening (Γ) is relatedto the activation energy by an Arrhenius relation,19 as
with Γ0 andEact being the attempt frequency and the activationenergy, respectively. In this model it is inferred that the moleculeoscillates about the equilibrium orientations for an average timeτ and then moves to a new equilibrium orientation. TheArrhenius plot of the variation ofΓ0, obtained by combiningthe QNS data as a function of temperature, is shown in Figure7. From this curve and expression 4, it is found that, for C-CH3,Γ0 is about 10 meV andEact ) 7.5 kJ/mol, in agreement withour previous result.13 This latter value corresponds to typicalvalues encountered in the literature for other molecular systemscontaining methyl groups.30 These results indicate that in NMAthe dynamical rotational disorder in the chains around the C-Caxis persists until around 100 K.
Additionally, the prefactorΓ0 ) 10 meV suggests thepossibility of the presence of a methyl group librational modelocated in this frequency range, which should be observable asa peak in the vibrational density of states:17
M is the mass of the scattering units,kB is Boltzmann’s constant,T is the temperature,pω gives the neutron energy transfer, andS(Q,ω) is the experimental incoherent scattering function (heredominated by the H-motion). It is well-known that librationalpeaks are strongly damped with increasing temperature, and asa result the effective density of states,g(ω), for CH3CONHCD3
can be calculated from FOCUS data between 80 and 260 K.The results are reported in Figure 8, showing that indeed thereis a very strong feature at 10 meV in the low-temperaturespectrum. One can consider that this line might arise from asegmental libration of the whole CH3 group around thebackbone, and might be identified with the first librational modeof the methyl group.31
Furthermore, it is interesting to note that for a perfectharmonic solid the generalized density of states should revealthe same spectrum for all temperatures; however, changescaused by disorder in the low-energy range below 10 meV causea mixture of collective modes with local librational modes.These large-amplitude motions at low frequencies may beinterpreted as resulting from a continuous shift of the densityof states toward low frequencies as a consequence of a generalsoftening of the structure,32 and also may explain the behaviorof the mean square displacement,⟨u2⟩. The deviation of⟨u2⟩might then be attributed to a lack of long-range correlation, andin turn this extra inelastic scattering is assigned to bosonbehavior.33
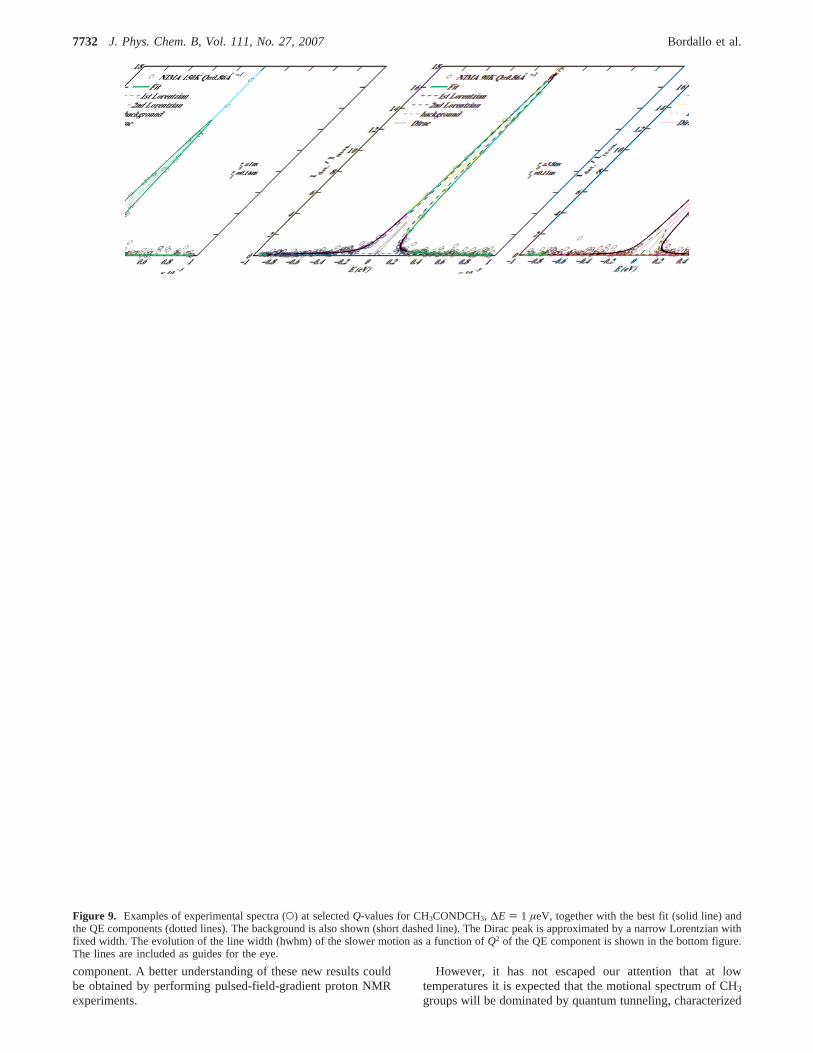
(ii) Analysis of Picosecond to Nanosecond Dynamics.In orderto analyze the IN10 data, the sum of two Lorentzian line shapesand a Dirac peak approximated by a narrow Lorentzian withfixed width has been used to fit the experimental spectra between90 and 150 K. This sum has been convoluted numerically(approximated by a multiplication with the spectrometer matrix)with an analytical description of the resolution function asdetermined by the scattering from vanadium. Subsequently, aconstant background has been added. From the Lorentzian lineshapes, the corresponding relaxation timesτi have been deter-mined as shown in Figure 9. The backscattering spectrameasured on IN10 probed two different motions, viz. a slowmotion that presents a slightQ-dependence, with characteristictime of a few nanoseconds (corresponding to∆0 ) tenths ofmicroelectronvolts), and a faster one of∼100 ps (correspondingto ∆1 ∼ 5 µeV). The faster motion, which isQ-independentand barely resolved in the IN10 spectra above 120 K butcomparable to the one probed using QENS and FOCUS, canbe attributed to the rotational dynamics of the CH3 groups. Onthe other hand, the interpretation of the slower component iscomplicated in view of the width of the QE broadening (∆0 <0.6µeV) with respect to the energy resolution (∆E ) 1.1µeV),making it difficult to unambiguously attribute this QNS
Figure 7. Lorentzian hwhm (Γ) obtained from the fits of CH3-NHCOCD3 using FOCUS (∆E ) 50 µeV) QNS data. The variationwith temperature ofΓ was obtained using the model described in thetext. The line corresponds to a low-temperature Arrhenius-like activa-tion, Γ ) A0 exp(-∆E/kT). The shaded region represents the range ofIN10 resolution, indicating that below 50 K existing motions in therange of a few nanoseconds can no longer be detected.
Γ ) Γ0e-Eact/kT (4)
G(Q,ω) ) MkBT (pω
Q )2exp(- pω
kBT) S(Q,ω) (5)
Figure 8. Inelastic neutron scattering spectra at various temperaturesfor CH3CONHCD3. The very strong feature at 10 meV observed inthe low-temperature spectra can be assigned to segmental libration ofthe whole CH3 group around the backbone.
Hydrogen inN-Methylacetamide J. Phys. Chem. B, Vol. 111, No. 27, 20077731
component. A better understanding of these new results couldbe obtained by performing pulsed-field-gradient proton NMRexperiments.
However, it has not escaped our attention that at lowtemperatures it is expected that the motional spectrum of CH3
groups will be dominated by quantum tunneling, characterized
Figure 9. Examples of experimental spectra (O) at selectedQ-values for CH3CONDCH3, ∆E ) 1 µeV, together with the best fit (solid line) andthe QE components (dotted lines). The background is also shown (short dashed line). The Dirac peak is approximated by a narrow Lorentzian withfixed width. The evolution of the line width (hwhm) of the slower motion as a function ofQ2 of the QE component is shown in the bottom figure.The lines are included as guides for the eye.
7732 J. Phys. Chem. B, Vol. 111, No. 27, 2007 Bordallo et al.
by a narrow, well-defined inelastic peak with a typical tunnelingfrequency,τt. There is strong evidence for the existence of auniversal law for methyl dynamics, suggesting that tunnelingfrequency depends exponentially on the height of the rotationbarrier. Systematic studies of barrier heights and tunnelingfrequencies of CH3 groups in the series CH3-(CH3)n-CO-(CH2)m-CH3 have shown that methyl groups next to carboxylgroups have low barrier heights.34 Thus, it may be that in NMAthe tunneling lines are as low in energy as those in 2-butadone,34
methyl acetate,35 and acetanilide36 observed up to 0.8µeV, butunfortunately are resolution-limited in this experiment. As aresult, as shown in Figure 7, below 100 K the tunneling motionwould dominate but be resolution limited, while above 100 K,once the structure of the tunneling lines has disappeared, therotational motion of the methyl groups would become moreimportant.
Conclusion
This work aims at a better understanding of the fundamentalaspects of peptide and HB, and the methyl groups in NMA. Ofthe many factors that govern the structure, stability, andfunctionality of proteins, interactions involving peptide and HBoften play a very important role. Peptide bonds hold togetherthe amino acid residues in proteins, covalently linking themtogether, while HB are present at the substrate binding sites(among others) of enzymes. Simplistically, HB can be explainedby the electrostatic attraction between the partial charges onthe atoms involved.
The present work indicates that NMA has to be consideredas a crystal that presents positional disorder undergoing dynami-cal transitions. Apart from the evolution of thea latticeparameter, which in fact reflects changes of the averaged HBdirection, the question of proton transfer between proton donorand acceptor remains unresolved. From our data alone we cannotascribe in a straightforward way the origin of the couplingbehavior of the amide modes to methyl torsions of the NMA.Supposing that some negative charge density is bound to theproton, it is possible to argue that repulsive forces increase asthe O‚‚‚H distance decreases upon cooling and that around 230K the lattice relaxes without an actual proton transfer. However,the existence of a nonharmonic potential, reflected by thebehavior of the generalized density of states and the observationof negative thermal expansion, could be justified by the“vibrational” polaron theory37,38in which a dynamic localizationof the vibrational energy is created by coupling an internal modeto a lattice phonon.
Using inelastic and quasi-elastic neutron scattering andselectively deuterated samples has made it possible to distinguishcontributions arising from different parts of the molecules.Indeed, as discussed in section B under Results and Discussion,activation energy values for the methyl groups show that thedynamical environment of each methyl group is unique.Moreover, combining results from three different spectrometersallowed an extended time and dynamical range to be covered(thus showing that in NMA dynamical disorder persists untilaround 100 K) and observation of the librational peak asdemonstrated in section C of the Results and Discussion section.
Most hydrated proteins undergo a dynamic transition29,39 inthe temperature range of about 200-230 K which is related toan increase in the mean square displacement⟨u2⟩, showing abehavior very similar to the one observed in the model NMAsystem. In the case of proteins, this dynamic transition correlateswith the appearance of measurable biochemical activity. Manyexperimental and computational studies point to solvent dynam-
ics as controlling the dynamic transition in proteins. However,one cannot ignore that a similar transition is also observed inthe methyl groups of side chains.30,40 Doster et al.21 hassuggested that the mechanism underlying such transitions is tosome extent an intrinsic property of the constituent elements.Our observation of a very similar dynamical transition in thismodel system in the absence of any hydration water lendssupport to this suggestion.
Finally, we note that the ensemble of our results can be takenas an indication that it may be possible using neutron scatteringin small-molecule organic crystals, in the absence of solventmolecules, to pursue further studies for understanding thedynamics and kinetics of packing and conformation of systemsthat form HB patterns, such as amino acids, carboxylic acids,and primary and secondary amides.41 Such observations arenecessary to assess theoretical interaction models used to predictcrystal morphology and polymorphism,42 and are of paramountimportance in fields such as pharmacology, solid-state chemistry,and material science.
Acknowledgment. H.N.B. gratefully acknowledges Prof.Elena Boldyreva for her insight on the possibilities of theextension of this work to the study of correlated-structureproperties of organic solids that can be used as new materialsand devices, including pharmaceutical drugs; and B. Frick foruseful discussions. We are grateful to S. Janssen and U. Filges(PSI, Switzerland), Richard M. Ibberson (ISIS, U.K.), and D.Tobbens (HMI, Berlin) for their assistance during the FOCUS,HRPD, and E9 experiments, respectively. The work performedat the Swiss Spallation Neutron Source SINQ, Paul ScherrerInstitut (PSI), Villigen, Switzerland, on FOCUS was partiallyfunded by the BMBF program under Project No. 03-HE4SA2-2and ff. The experiments performed on E9 benefited from theuse of the BENSC at HMI and those on IN10 benefited fromthe use of the ILL neutron facilities. ISIS is a partner in theEU-supported network of European neutron facilitiesstheNeutron and Muon Integrated Infrastructure Initiative (NMI3).Work performed at IPNS was funded by the U.S Departmentof Energy, BES-Materials Science, under Contract No. W-31-109-ENG-38.
References and Notes
(1) Scheiner, S. InHydrogen Bonding: A Theoretical PerspectiVe;Oxford University Press: Oxford, 1997.
(2) Cheatham, T. E., III; Kollman, P. A.Annu. ReV. Phys. Chem.2000,51, 435.
(3) Gumbart, J.; Wang, Y.; Aksimentiev, A.; Tajkhorshid, E.; Schulten,K. Curr. Opin. Struct. Biol.2005, 15, 423.
(4) Eckert, J.; Barthe`s, M.; Klooster, Wim, T.; Albinati, A.; Aznar,R.; Koetzle, T.J. Phys. Chem. B2001, 105, 19.
(5) Kearley, G. J.; Johnson, M. R.; Plazanet, M.; Suard, E.J. Chem.Phys.2001, 115, 2614.
(6) Mirkin, N. G.; Krimmin, S. J.J. Mol. Struct.1995, 334, 3.(7) Trabelsi, S.; Nasr, S.; Bahri, M.; Bellissent-Funel, M.-C.J. Phys.
Chem. B2006, 110, 25021.(8) Katz, J. L.; Post, B.Acta Crystallogr.1960, 13, 624.(9) Hamazaoui, F.; Baert, F.Acta Crystallogr.1994, C50, 757.
(10) Barthes, M.; G. de Nunzio, G.; Ribet, M.Synth. Met.1994, 76,337.
(11) Kearley, J. G.; Johnson, M. R.; Plazanet, M.; Suard, E.J. Chem.Phys.2001, 115, 2614.
(12) Dunlop, K. V.; Irvin, R. T.; Hazes, B.Acta Crystallogr., Sect. D2005, 61, 80.
(13) Rols, S.; Bordallo, H. N.; Herwig, K. W.; Barthe`s, M. Physica B2004, 350, e-587.
(14) Barthes, M.; Bordallo, H. N.; Eckert, J.; Maurus, O.; de Nunzio,G.; Leon, J.J. Phys. Chem. B1998, 102, 6177.
(15) Larson, A. C.; Von Dreele, R. B. InGeneral Structure AnalysisSystem (GSAS); Los Alamos National Laboratory Report LAUR 86-748;1994.
Hydrogen inN-Methylacetamide J. Phys. Chem. B, Vol. 111, No. 27, 20077733
(16) Janssen, S.; Mesot, J.; Holitzner, L.; Furrer, A.; Hempelmann, R.Physica B1997, 234, 1174.
(17) Squires, G. L. InIntroduction to the Theory of Thermal NeutronScattering; Dover Publications, Inc.: New York, 1996.
(18) Bradley, K. F.; Chen, S.-H.; Brun, T. O.; Kleb, R.; Loomis, W.A.; Newsam, J. M.Nucl. Instrum. Methods A1988, 270, 78.
(19) Bee, M. In Quasielastic Neutron Scattering: Principles andApplications in Solid State Chemistry, Biology and Materials Science; AdamHilger: Bristol, 1988.
(20) Frick, B.; Magerl, A.; Blanc, Y.; Rebesco, R.Physica B1990, 234-236, 1177.
(21) Doster, W.; Cusak, S.; Petry, W.Nature1989, 337, 754.(22) Evans, J. S. O.; Hu, Z.; Jorgensen, J. D.; Argyriou, D. N.; Short,
S.; Sleight, A. W.Science1997, 61, 275.(23) Aasmundtveit, K. E.; Samuelsen, E. J.; Hoffmann, K.; Bakken, E.;
Carlsen, P. H. J.Synth. Met.2000, 113, 7.(24) Birkedal, H.; Schwarzenbach, D.; Pattison, P.Angew. Chem., Int.
Ed. 2002, 41, 754.(25) Barrera, G. D.; Bruno, J. A. O.; Barron, T. H. K.; Allan, N. L.J.
Phys.: Condens. Matter2005, 17, R217.(26) Boldyreva, E. V.; Drebushchak, T. N.; Shutova, E. S.Z. Kristallogr.
2003, 218, 366.(27) Drebushchak, T. N.; Boldyreva, E. V.Z. Kristallogr. 2004, 219,
506.(28) It is always possible to write the dependence of the elastic intensity
as a function of the temperature as follows:I(T) ) I(0) exp(-Q2[u(T)2]),where u(T) is the mean square displacement of the scattering nuclei.Therefore, once the elastic intensity has been experimentally obtained, onecan get hold of the variation ofu(T).
(29) Daniel, R. M.; Finney, J. L.; Re´at, V.; Dunn, R.; Ferrand, M.; Smith,J. C.Biophys J.1999, 77, 2184.
(30) Djurado, D.; Combet, J.; Be´e, M.; Rannou, P.; Dufour, B.; Pron,A.; Travers, J. P.Phys. ReV. B 2002, 65, 184202.
(31) Frick, B.; Williams, J.; Trevifio, S.; Erwin, R.Physica B1995,213-214, 506.
(32) Chumakov, A. V.; Sergueev, I.; van Bu¨rck, U.; Schirmacher, W.;Asthalterr, T.; Ru¨ffer, R.; Leupold, O.; Petry, W.Phys. ReV. Lett. 2001,92, 245508.
(33) Taraskin, S. N.; Loh, Y. L.; Natarajan, G.; Elliott, S. R.Phys. ReV.Lett. 2001, 86, 1255.
(34) Green, R. M.; Horsewill, A. J.Mol. Phys.1996, 57, 887.(35) Neumann, M. A.; Johnson, M. R.; Aibou, A.; Horsewill, A. J.Chem.
Phys.1998, 229, 245.(36) Johnson, M. R.; Prager, M.; Grimm, H.; Neumann, M. A.; Kearley,
G. J.; Wilson, C. C.Chem. Phys.1999, 244, 49.(37) Scott, A. C. InNonlinear Science; Oxford University Press: Oxford,
1999.(38) Scott, A. C.; Bigio, I.; Johnston, C.Phys. ReV. B 1989, 39, 12883.(39) Caliskan, G.; Briber, R. M.; Thirumalai, D.; Garcia-Sakai, V.;
Woodson, S. A.; Sokolov, A. P.J. Am. Chem. Soc.2006, 128, 32.(40) Frick, B.; Fetters, L. J.Macromolecules1994, 27, 974.(41) Weissbuch, I.; Leiserowitz, J.; Lahav, M. InCrystallization
Technology Handbook; Mersmann, A., Ed.; Marcel Dekker: New York,1995. Crystal polymorphism embodies the ability of molecules to formdiverse packing arrangements displaying different physical and chemicalcharacteristics.
(42) Bernstein, J. InPolymorphism in Organic Crystals; Clarendon:Oxford, 2002.
7734 J. Phys. Chem. B, Vol. 111, No. 27, 2007 Bordallo et al.