Electrostatic Tuning of Permeation and Selectivity in Aquaporin Water Channels
Upload
independentCategory
view
8download
0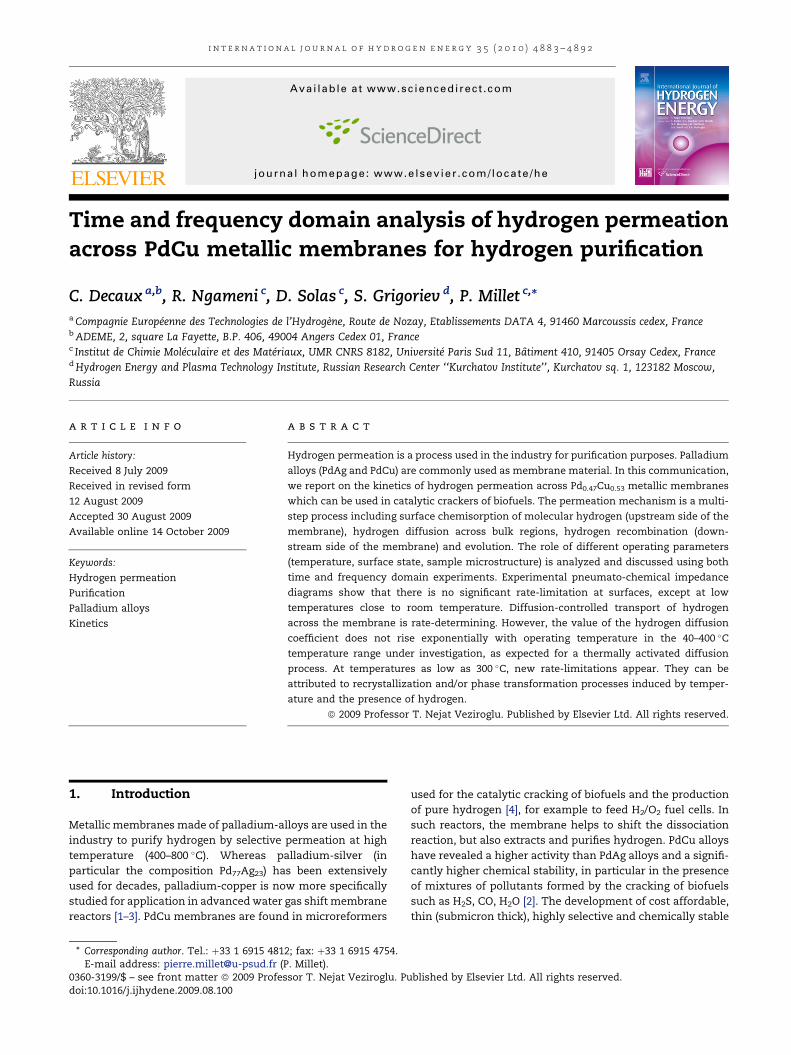
i n t e r n a t i o n a l j o u r n a l o f h y d r o g e n e n e r g y 3 5 ( 2 0 1 0 ) 4 8 8 3 – 4 8 9 2
Avai lab le a t www.sc iencedi rec t .com
j ourna l homepage : www.e lsev ier . com/ loca te /he
Time and frequency domain analysis of hydrogen permeationacross PdCu metallic membranes for hydrogen purification
C. Decaux a,b, R. Ngameni c, D. Solas c, S. Grigoriev d, P. Millet c,*a Compagnie Europeenne des Technologies de l’Hydrogene, Route de Nozay, Etablissements DATA 4, 91460 Marcoussis cedex, Franceb ADEME, 2, square La Fayette, B.P. 406, 49004 Angers Cedex 01, Francec Institut de Chimie Moleculaire et des Materiaux, UMR CNRS 8182, Universite Paris Sud 11, Batiment 410, 91405 Orsay Cedex, Franced Hydrogen Energy and Plasma Technology Institute, Russian Research Center ‘‘Kurchatov Institute’’, Kurchatov sq. 1, 123182 Moscow,
Russia
a r t i c l e i n f o
Article history:
Received 8 July 2009
Received in revised form
12 August 2009
Accepted 30 August 2009
Available online 14 October 2009
Keywords:
Hydrogen permeation
Purification
Palladium alloys
Kinetics
* Corresponding author. Tel.: þ33 1 6915 481E-mail address: [email protected] (P
0360-3199/$ – see front matter ª 2009 Profesdoi:10.1016/j.ijhydene.2009.08.100
a b s t r a c t
Hydrogen permeation is a process used in the industry for purification purposes. Palladium
alloys (PdAg and PdCu) are commonly used as membrane material. In this communication,
we report on the kinetics of hydrogen permeation across Pd0.47Cu0.53 metallic membranes
which can be used in catalytic crackers of biofuels. The permeation mechanism is a multi-
step process including surface chemisorption of molecular hydrogen (upstream side of the
membrane), hydrogen diffusion across bulk regions, hydrogen recombination (down-
stream side of the membrane) and evolution. The role of different operating parameters
(temperature, surface state, sample microstructure) is analyzed and discussed using both
time and frequency domain experiments. Experimental pneumato-chemical impedance
diagrams show that there is no significant rate-limitation at surfaces, except at low
temperatures close to room temperature. Diffusion-controlled transport of hydrogen
across the membrane is rate-determining. However, the value of the hydrogen diffusion
coefficient does not rise exponentially with operating temperature in the 40–400 �C
temperature range under investigation, as expected for a thermally activated diffusion
process. At temperatures as low as 300 �C, new rate-limitations appear. They can be
attributed to recrystallization and/or phase transformation processes induced by temper-
ature and the presence of hydrogen.
ª 2009 Professor T. Nejat Veziroglu. Published by Elsevier Ltd. All rights reserved.
1. Introduction used for the catalytic cracking of biofuels and the production
Metallic membranes made of palladium-alloys are used in the
industry to purify hydrogen by selective permeation at high
temperature (400–800 �C). Whereas palladium-silver (in
particular the composition Pd77Ag23) has been extensively
used for decades, palladium-copper is now more specifically
studied for application in advanced water gas shift membrane
reactors [1–3]. PdCu membranes are found in microreformers
2; fax: þ33 1 6915 4754.. Millet).sor T. Nejat Veziroglu. Pu
of pure hydrogen [4], for example to feed H2/O2 fuel cells. In
such reactors, the membrane helps to shift the dissociation
reaction, but also extracts and purifies hydrogen. PdCu alloys
have revealed a higher activity than PdAg alloys and a signifi-
cantly higher chemical stability, in particular in the presence
of mixtures of pollutants formed by the cracking of biofuels
such as H2S, CO, H2O [2]. The development of cost affordable,
thin (submicron thick), highly selective and chemically stable
blished by Elsevier Ltd. All rights reserved.
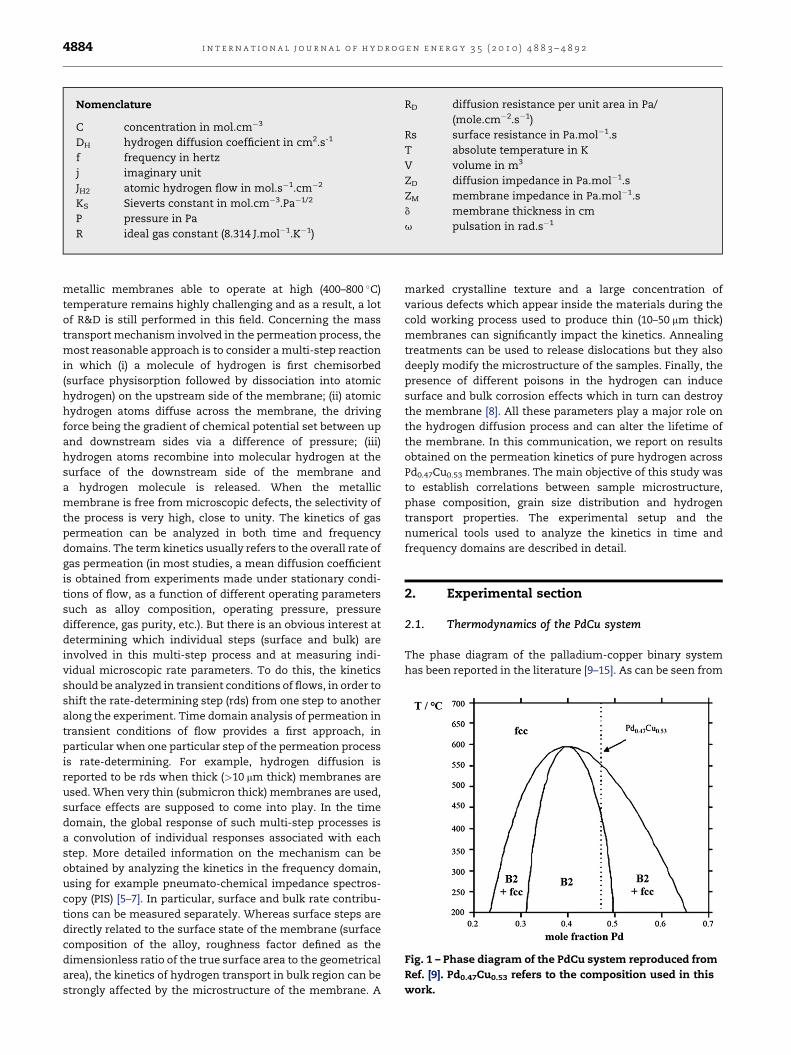
Fig. 1 – Phase diagram of the PdCu system reproduced from
Ref. [9]. Pd0.47Cu0.53 refers to the composition used in this
work.
Nomenclature
C concentration in mol.cm�3
DH hydrogen diffusion coefficient in cm2.s-1
f frequency in hertz
j imaginary unit
JH2 atomic hydrogen flow in mol.s�1.cm�2
KS Sieverts constant in mol.cm�3.Pa�1/2
P pressure in Pa
R ideal gas constant (8.314 J.mol�1.K�1)
RD diffusion resistance per unit area in Pa/
(mole.cm�2.s�1)
Rs surface resistance in Pa.mol�1.s
T absolute temperature in K
V volume in m3
ZD diffusion impedance in Pa.mol�1.s
ZM membrane impedance in Pa.mol�1.s
d membrane thickness in cm
u pulsation in rad.s�1
i n t e r n a t i o n a l j o u r n a l o f h y d r o g e n e n e r g y 3 5 ( 2 0 1 0 ) 4 8 8 3 – 4 8 9 24884
metallic membranes able to operate at high (400–800 �C)
temperature remains highly challenging and as a result, a lot
of R&D is still performed in this field. Concerning the mass
transport mechanism involved in the permeation process, the
most reasonable approach is to consider a multi-step reaction
in which (i) a molecule of hydrogen is first chemisorbed
(surface physisorption followed by dissociation into atomic
hydrogen) on the upstream side of the membrane; (ii) atomic
hydrogen atoms diffuse across the membrane, the driving
force being the gradient of chemical potential set between up
and downstream sides via a difference of pressure; (iii)
hydrogen atoms recombine into molecular hydrogen at the
surface of the downstream side of the membrane and
a hydrogen molecule is released. When the metallic
membrane is free from microscopic defects, the selectivity of
the process is very high, close to unity. The kinetics of gas
permeation can be analyzed in both time and frequency
domains. The term kinetics usually refers to the overall rate of
gas permeation (in most studies, a mean diffusion coefficient
is obtained from experiments made under stationary condi-
tions of flow, as a function of different operating parameters
such as alloy composition, operating pressure, pressure
difference, gas purity, etc.). But there is an obvious interest at
determining which individual steps (surface and bulk) are
involved in this multi-step process and at measuring indi-
vidual microscopic rate parameters. To do this, the kinetics
should be analyzed in transient conditions of flows, in order to
shift the rate-determining step (rds) from one step to another
along the experiment. Time domain analysis of permeation in
transient conditions of flow provides a first approach, in
particular when one particular step of the permeation process
is rate-determining. For example, hydrogen diffusion is
reported to be rds when thick (>10 mm thick) membranes are
used. When very thin (submicron thick) membranes are used,
surface effects are supposed to come into play. In the time
domain, the global response of such multi-step processes is
a convolution of individual responses associated with each
step. More detailed information on the mechanism can be
obtained by analyzing the kinetics in the frequency domain,
using for example pneumato-chemical impedance spectros-
copy (PIS) [5–7]. In particular, surface and bulk rate contribu-
tions can be measured separately. Whereas surface steps are
directly related to the surface state of the membrane (surface
composition of the alloy, roughness factor defined as the
dimensionless ratio of the true surface area to the geometrical
area), the kinetics of hydrogen transport in bulk region can be
strongly affected by the microstructure of the membrane. A
marked crystalline texture and a large concentration of
various defects which appear inside the materials during the
cold working process used to produce thin (10–50 mm thick)
membranes can significantly impact the kinetics. Annealing
treatments can be used to release dislocations but they also
deeply modify the microstructure of the samples. Finally, the
presence of different poisons in the hydrogen can induce
surface and bulk corrosion effects which in turn can destroy
the membrane [8]. All these parameters play a major role on
the hydrogen diffusion process and can alter the lifetime of
the membrane. In this communication, we report on results
obtained on the permeation kinetics of pure hydrogen across
Pd0.47Cu0.53 membranes. The main objective of this study was
to establish correlations between sample microstructure,
phase composition, grain size distribution and hydrogen
transport properties. The experimental setup and the
numerical tools used to analyze the kinetics in time and
frequency domains are described in detail.
2. Experimental section
2.1. Thermodynamics of the PdCu system
The phase diagram of the palladium-copper binary system
has been reported in the literature [9–15]. As can be seen from
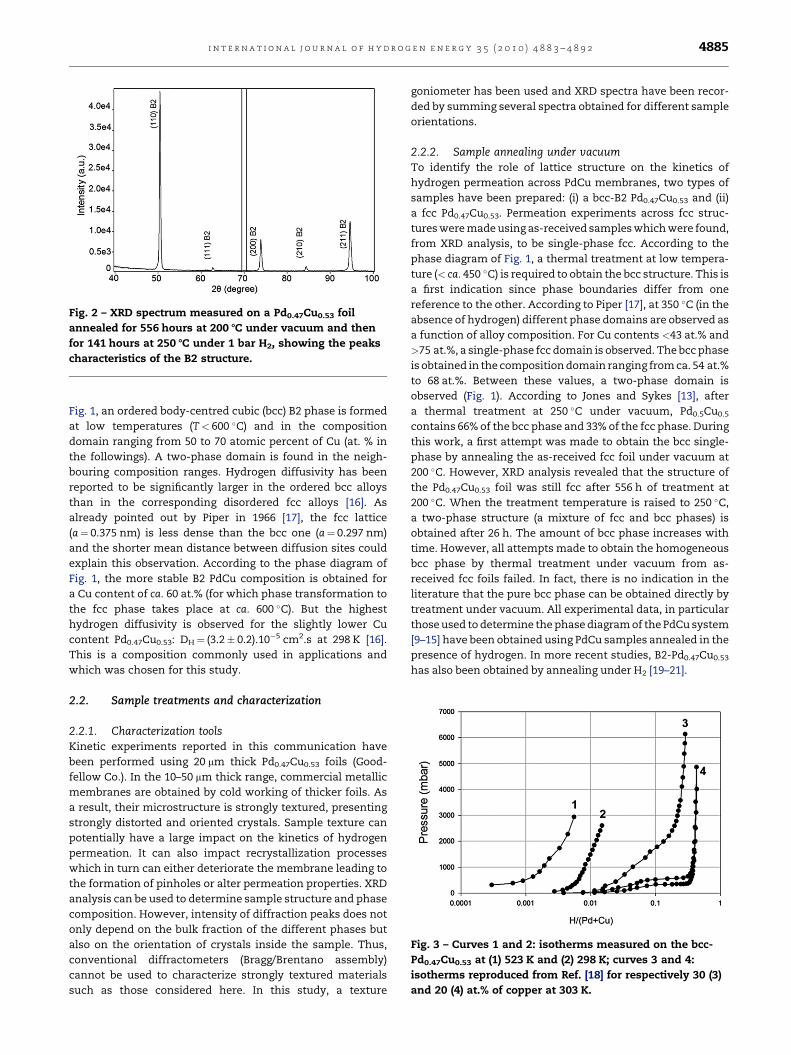
Fig. 2 – XRD spectrum measured on a Pd0.47Cu0.53 foil
annealed for 556 hours at 200 8C under vacuum and then
for 141 hours at 250 8C under 1 bar H2, showing the peaks
characteristics of the B2 structure.
Fig. 3 – Curves 1 and 2: isotherms measured on the bcc-
Pd0.47Cu0.53 at (1) 523 K and (2) 298 K; curves 3 and 4:
isotherms reproduced from Ref. [18] for respectively 30 (3)
and 20 (4) at.% of copper at 303 K.
i n t e r n a t i o n a l j o u r n a l o f h y d r o g e n e n e r g y 3 5 ( 2 0 1 0 ) 4 8 8 3 – 4 8 9 2 4885
Fig. 1, an ordered body-centred cubic (bcc) B2 phase is formed
at low temperatures (T< 600 �C) and in the composition
domain ranging from 50 to 70 atomic percent of Cu (at. % in
the followings). A two-phase domain is found in the neigh-
bouring composition ranges. Hydrogen diffusivity has been
reported to be significantly larger in the ordered bcc alloys
than in the corresponding disordered fcc alloys [16]. As
already pointed out by Piper in 1966 [17], the fcc lattice
(a¼ 0.375 nm) is less dense than the bcc one (a¼ 0.297 nm)
and the shorter mean distance between diffusion sites could
explain this observation. According to the phase diagram of
Fig. 1, the more stable B2 PdCu composition is obtained for
a Cu content of ca. 60 at.% (for which phase transformation to
the fcc phase takes place at ca. 600 �C). But the highest
hydrogen diffusivity is observed for the slightly lower Cu
content Pd0.47Cu0.53: DH¼ (3.2� 0.2).10�5 cm2.s at 298 K [16].
This is a composition commonly used in applications and
which was chosen for this study.
2.2. Sample treatments and characterization
2.2.1. Characterization toolsKinetic experiments reported in this communication have
been performed using 20 mm thick Pd0.47Cu0.53 foils (Good-
fellow Co.). In the 10–50 mm thick range, commercial metallic
membranes are obtained by cold working of thicker foils. As
a result, their microstructure is strongly textured, presenting
strongly distorted and oriented crystals. Sample texture can
potentially have a large impact on the kinetics of hydrogen
permeation. It can also impact recrystallization processes
which in turn can either deteriorate the membrane leading to
the formation of pinholes or alter permeation properties. XRD
analysis can be used to determine sample structure and phase
composition. However, intensity of diffraction peaks does not
only depend on the bulk fraction of the different phases but
also on the orientation of crystals inside the sample. Thus,
conventional diffractometers (Bragg/Brentano assembly)
cannot be used to characterize strongly textured materials
such as those considered here. In this study, a texture
goniometer has been used and XRD spectra have been recor-
ded by summing several spectra obtained for different sample
orientations.
2.2.2. Sample annealing under vacuumTo identify the role of lattice structure on the kinetics of
hydrogen permeation across PdCu membranes, two types of
samples have been prepared: (i) a bcc-B2 Pd0.47Cu0.53 and (ii)
a fcc Pd0.47Cu0.53. Permeation experiments across fcc struc-
tures were made using as-received samples which were found,
from XRD analysis, to be single-phase fcc. According to the
phase diagram of Fig. 1, a thermal treatment at low tempera-
ture (< ca. 450 �C) is required to obtain the bcc structure. This is
a first indication since phase boundaries differ from one
reference to the other. According to Piper [17], at 350 �C (in the
absence of hydrogen) different phase domains are observed as
a function of alloy composition. For Cu contents <43 at.% and
>75 at.%, a single-phase fcc domain is observed. The bcc phase
is obtained in the composition domain ranging from ca. 54 at.%
to 68 at.%. Between these values, a two-phase domain is
observed (Fig. 1). According to Jones and Sykes [13], after
a thermal treatment at 250 �C under vacuum, Pd0.5Cu0.5
contains 66% of the bcc phase and 33% of the fcc phase. During
this work, a first attempt was made to obtain the bcc single-
phase by annealing the as-received fcc foil under vacuum at
200 �C. However, XRD analysis revealed that the structure of
the Pd0.47Cu0.53 foil was still fcc after 556 h of treatment at
200 �C. When the treatment temperature is raised to 250 �C,
a two-phase structure (a mixture of fcc and bcc phases) is
obtained after 26 h. The amount of bcc phase increases with
time. However, all attempts made to obtain the homogeneous
bcc phase by thermal treatment under vacuum from as-
received fcc foils failed. In fact, there is no indication in the
literature that the pure bcc phase can be obtained directly by
treatment under vacuum. All experimental data, in particular
those used to determine the phase diagram of the PdCu system
[9–15] have been obtained using PdCu samples annealed in the
presence of hydrogen. In more recent studies, B2-Pd0.47Cu0.53
has also been obtained by annealing under H2 [19–21].
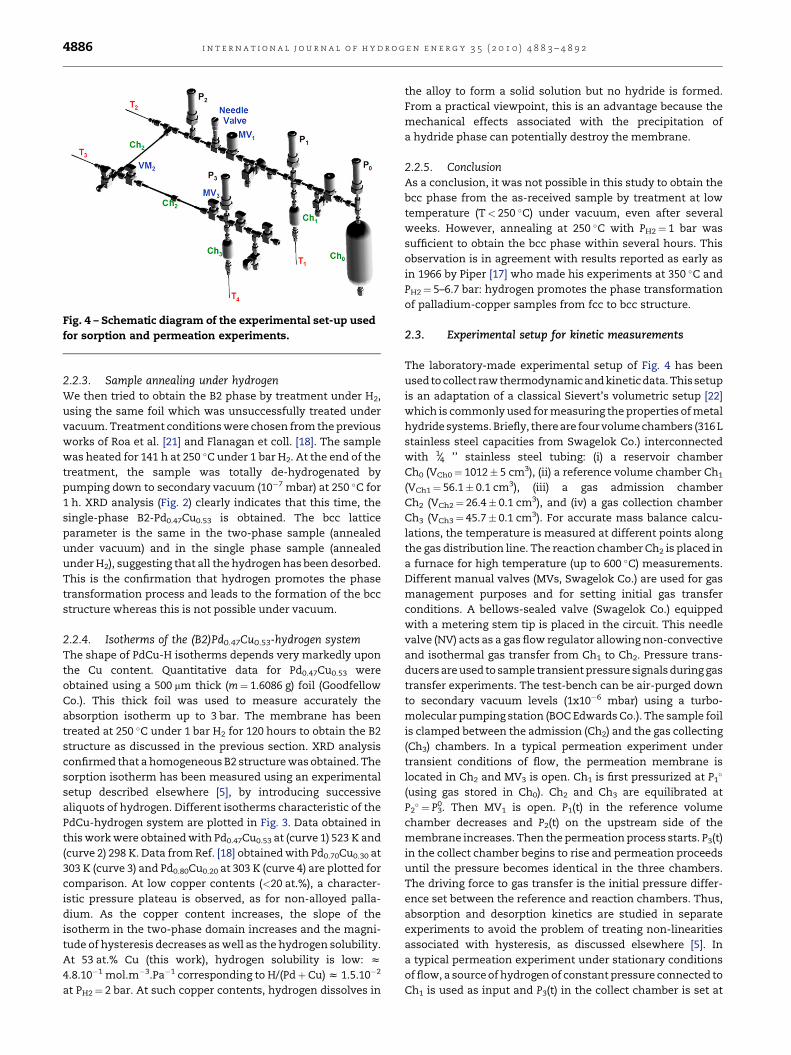
Fig. 4 – Schematic diagram of the experimental set-up used
for sorption and permeation experiments.
i n t e r n a t i o n a l j o u r n a l o f h y d r o g e n e n e r g y 3 5 ( 2 0 1 0 ) 4 8 8 3 – 4 8 9 24886
2.2.3. Sample annealing under hydrogenWe then tried to obtain the B2 phase by treatment under H2,
using the same foil which was unsuccessfully treated under
vacuum. Treatment conditions were chosen from the previous
works of Roa et al. [21] and Flanagan et coll. [18]. The sample
was heated for 141 h at 250 �C under 1 bar H2. At the end of the
treatment, the sample was totally de-hydrogenated by
pumping down to secondary vacuum (10�7 mbar) at 250 �C for
1 h. XRD analysis (Fig. 2) clearly indicates that this time, the
single-phase B2-Pd0.47Cu0.53 is obtained. The bcc lattice
parameter is the same in the two-phase sample (annealed
under vacuum) and in the single phase sample (annealed
under H2), suggesting that all the hydrogen has been desorbed.
This is the confirmation that hydrogen promotes the phase
transformation process and leads to the formation of the bcc
structure whereas this is not possible under vacuum.
2.2.4. Isotherms of the (B2)Pd0.47Cu0.53-hydrogen systemThe shape of PdCu-H isotherms depends very markedly upon
the Cu content. Quantitative data for Pd0.47Cu0.53 were
obtained using a 500 mm thick (m¼ 1.6086 g) foil (Goodfellow
Co.). This thick foil was used to measure accurately the
absorption isotherm up to 3 bar. The membrane has been
treated at 250 �C under 1 bar H2 for 120 hours to obtain the B2
structure as discussed in the previous section. XRD analysis
confirmed that a homogeneous B2 structure was obtained. The
sorption isotherm has been measured using an experimental
setup described elsewhere [5], by introducing successive
aliquots of hydrogen. Different isotherms characteristic of the
PdCu-hydrogen system are plotted in Fig. 3. Data obtained in
this work were obtained with Pd0.47Cu0.53 at (curve 1) 523 K and
(curve 2) 298 K. Data from Ref. [18] obtained with Pd0.70Cu0.30 at
303 K (curve 3) and Pd0.80Cu0.20 at 303 K (curve 4) are plotted for
comparison. At low copper contents (<20 at.%), a character-
istic pressure plateau is observed, as for non-alloyed palla-
dium. As the copper content increases, the slope of the
isotherm in the two-phase domain increases and the magni-
tude of hysteresis decreases as well as the hydrogen solubility.
At 53 at.% Cu (this work), hydrogen solubility is low: z
4.8.10�1 mol.m�3.Pa�1 corresponding to H/(PdþCu) z 1.5.10�2
at PH2¼ 2 bar. At such copper contents, hydrogen dissolves in
the alloy to form a solid solution but no hydride is formed.
From a practical viewpoint, this is an advantage because the
mechanical effects associated with the precipitation of
a hydride phase can potentially destroy the membrane.
2.2.5. ConclusionAs a conclusion, it was not possible in this study to obtain the
bcc phase from the as-received sample by treatment at low
temperature (T< 250 �C) under vacuum, even after several
weeks. However, annealing at 250 �C with PH2¼ 1 bar was
sufficient to obtain the bcc phase within several hours. This
observation is in agreement with results reported as early as
in 1966 by Piper [17] who made his experiments at 350 �C and
PH2¼ 5–6.7 bar: hydrogen promotes the phase transformation
of palladium-copper samples from fcc to bcc structure.
2.3. Experimental setup for kinetic measurements
The laboratory-made experimental setup of Fig. 4 has been
used to collect raw thermodynamic and kineticdata. Thissetup
is an adaptation of a classical Sievert’s volumetric setup [22]
which is commonly used for measuring the properties of metal
hydride systems. Briefly, there are four volume chambers (316 L
stainless steel capacities from Swagelok Co.) interconnected
with 1⁄4 ’’ stainless steel tubing: (i) a reservoir chamber
Ch0 (VCh0¼ 1012� 5 cm3), (ii) a reference volume chamber Ch1
(VCh1¼ 56.1� 0.1 cm3), (iii) a gas admission chamber
Ch2 (VCh2¼ 26.4� 0.1 cm3), and (iv) a gas collection chamber
Ch3 (VCh3¼ 45.7� 0.1 cm3). For accurate mass balance calcu-
lations, the temperature is measured at different points along
the gas distribution line. The reaction chamber Ch2 is placed in
a furnace for high temperature (up to 600 �C) measurements.
Different manual valves (MVs, Swagelok Co.) are used for gas
management purposes and for setting initial gas transfer
conditions. A bellows-sealed valve (Swagelok Co.) equipped
with a metering stem tip is placed in the circuit. This needle
valve (NV) acts as a gas flow regulator allowing non-convective
and isothermal gas transfer from Ch1 to Ch2. Pressure trans-
ducers are used to sample transient pressure signals during gas
transfer experiments. The test-bench can be air-purged down
to secondary vacuum levels (1x10�6 mbar) using a turbo-
molecular pumping station (BOC Edwards Co.). The sample foil
is clamped between the admission (Ch2) and the gas collecting
(Ch3) chambers. In a typical permeation experiment under
transient conditions of flow, the permeation membrane is
located in Ch2 and MV3 is open. Ch1 is first pressurized at P1�
(using gas stored in Ch0). Ch2 and Ch3 are equilibrated at
P2� ¼ P3
0. Then MV1 is open. P1(t) in the reference volume
chamber decreases and P2(t) on the upstream side of the
membrane increases. Then the permeation process starts. P3(t)
in the collect chamber begins to rise and permeation proceeds
until the pressure becomes identical in the three chambers.
The driving force to gas transfer is the initial pressure differ-
ence set between the reference and reaction chambers. Thus,
absorption and desorption kinetics are studied in separate
experiments to avoid the problem of treating non-linearities
associated with hysteresis, as discussed elsewhere [5]. In
a typical permeation experiment under stationary conditions
of flow, a source of hydrogen of constant pressure connected to
Ch1 is used as input and P3(t) in the collect chamber is set at
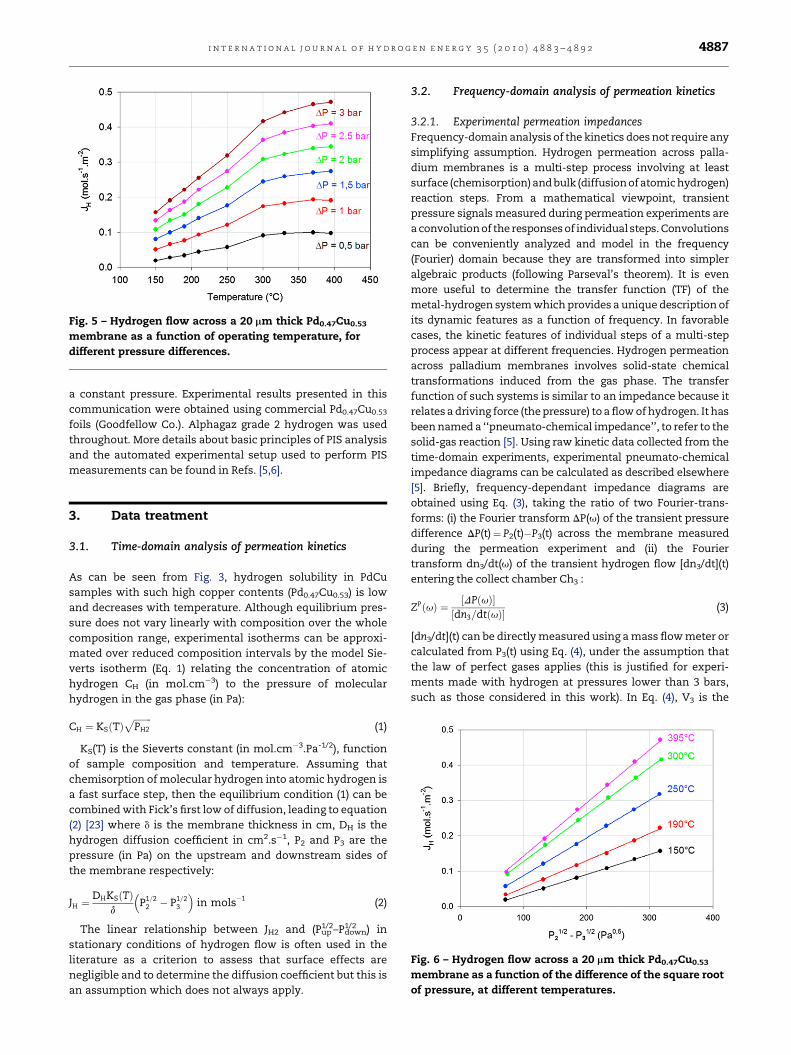
Fig. 5 – Hydrogen flow across a 20 mm thick Pd0.47Cu0.53
membrane as a function of operating temperature, for
different pressure differences.
i n t e r n a t i o n a l j o u r n a l o f h y d r o g e n e n e r g y 3 5 ( 2 0 1 0 ) 4 8 8 3 – 4 8 9 2 4887
a constant pressure. Experimental results presented in this
communication were obtained using commercial Pd0.47Cu0.53
foils (Goodfellow Co.). Alphagaz grade 2 hydrogen was used
throughout. More details about basic principles of PIS analysis
and the automated experimental setup used to perform PIS
measurements can be found in Refs. [5,6].
Fig. 6 – Hydrogen flow across a 20 mm thick Pd0.47Cu0.53
membrane as a function of the difference of the square root
of pressure, at different temperatures.
3. Data treatment
3.1. Time-domain analysis of permeation kinetics
As can be seen from Fig. 3, hydrogen solubility in PdCu
samples with such high copper contents (Pd0.47Cu0.53) is low
and decreases with temperature. Although equilibrium pres-
sure does not vary linearly with composition over the whole
composition range, experimental isotherms can be approxi-
mated over reduced composition intervals by the model Sie-
verts isotherm (Eq. 1) relating the concentration of atomic
hydrogen CH (in mol.cm�3) to the pressure of molecular
hydrogen in the gas phase (in Pa):
CH ¼ KSðTÞffiffiffiffiffiffiffiffiPH2
p(1)
KS(T) is the Sieverts constant (in mol.cm�3.Pa-1/2), function
of sample composition and temperature. Assuming that
chemisorption of molecular hydrogen into atomic hydrogen is
a fast surface step, then the equilibrium condition (1) can be
combined with Fick’s first low of diffusion, leading to equation
(2) [23] where d is the membrane thickness in cm, DH is the
hydrogen diffusion coefficient in cm2.s�1, P2 and P3 are the
pressure (in Pa) on the upstream and downstream sides of
the membrane respectively:
JH ¼DHKSðTÞ
d
�P1=2
2 � P1=23
�in mols�1 (2)
The linear relationship between JH2 and (Pup1/2–Pdown
1/2 ) in
stationary conditions of hydrogen flow is often used in the
literature as a criterion to assess that surface effects are
negligible and to determine the diffusion coefficient but this is
an assumption which does not always apply.
3.2. Frequency-domain analysis of permeation kinetics
3.2.1. Experimental permeation impedancesFrequency-domain analysis of the kinetics does not require any
simplifying assumption. Hydrogen permeation across palla-
dium membranes is a multi-step process involving at least
surface (chemisorption) and bulk (diffusion of atomic hydrogen)
reaction steps. From a mathematical viewpoint, transient
pressure signals measured during permeation experiments are
a convolution of the responses of individual steps. Convolutions
can be conveniently analyzed and model in the frequency
(Fourier) domain because they are transformed into simpler
algebraic products (following Parseval’s theorem). It is even
more useful to determine the transfer function (TF) of the
metal-hydrogen system which provides a unique description of
its dynamic features as a function of frequency. In favorable
cases, the kinetic features of individual steps of a multi-step
process appear at different frequencies. Hydrogen permeation
across palladium membranes involves solid-state chemical
transformations induced from the gas phase. The transfer
function of such systems is similar to an impedance because it
relates a driving force (the pressure) to a flow of hydrogen. It has
been named a ‘‘pneumato-chemical impedance’’, to refer to the
solid-gas reaction [5]. Using raw kinetic data collected from the
time-domain experiments, experimental pneumato-chemical
impedance diagrams can be calculated as described elsewhere
[5]. Briefly, frequency-dependant impedance diagrams are
obtained using Eq. (3), taking the ratio of two Fourier-trans-
forms: (i) the Fourier transform DP(u) of the transient pressure
difference DP(t)¼ P2(t)�P3(t) across the membrane measured
during the permeation experiment and (ii) the Fourier
transform dn3/dt(u) of the transient hydrogen flow [dn3/dt](t)
entering the collect chamber Ch3 :
ZPðuÞ ¼ ½DPðuÞ�½dn3=dtðuÞ� (3)
[dn3/dt](t) can be directly measured using a mass flow meter or
calculated from P3(t) using Eq. (4), under the assumption that
the law of perfect gases applies (this is justified for experi-
ments made with hydrogen at pressures lower than 3 bars,
such as those considered in this work). In Eq. (4), V3 is the
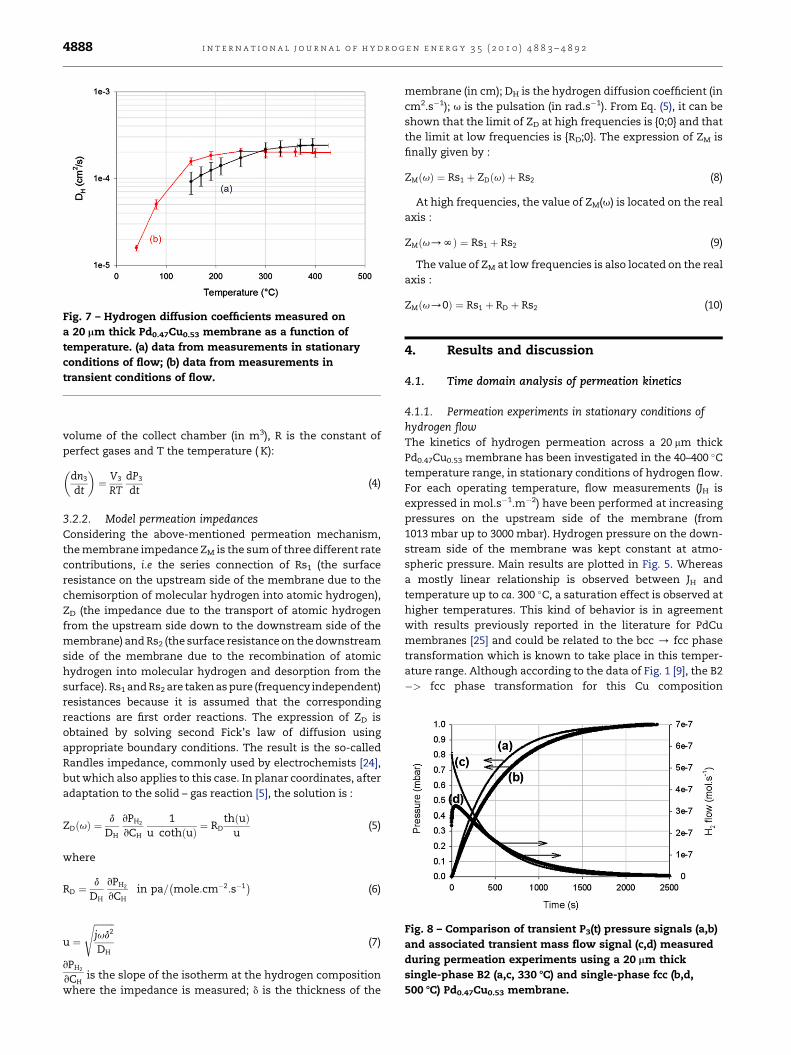
Fig. 7 – Hydrogen diffusion coefficients measured on
a 20 mm thick Pd0.47Cu0.53 membrane as a function of
temperature. (a) data from measurements in stationary
conditions of flow; (b) data from measurements in
transient conditions of flow.
Fig. 8 – Comparison of transient P3(t) pressure signals (a,b)
and associated transient mass flow signal (c,d) measured
during permeation experiments using a 20 mm thick
single-phase B2 (a,c, 330 8C) and single-phase fcc (b,d,
500 8C) Pd0.47Cu0.53 membrane.
i n t e r n a t i o n a l j o u r n a l o f h y d r o g e n e n e r g y 3 5 ( 2 0 1 0 ) 4 8 8 3 – 4 8 9 24888
volume of the collect chamber (in m3), R is the constant of
perfect gases and T the temperature ( K):
�dn3
dt
�¼ V3
RTdP3
dt(4)
3.2.2. Model permeation impedancesConsidering the above-mentioned permeation mechanism,
the membrane impedance ZM is the sum of three different rate
contributions, i.e the series connection of Rs1 (the surface
resistance on the upstream side of the membrane due to the
chemisorption of molecular hydrogen into atomic hydrogen),
ZD (the impedance due to the transport of atomic hydrogen
from the upstream side down to the downstream side of the
membrane) and Rs2 (the surface resistance on the downstream
side of the membrane due to the recombination of atomic
hydrogen into molecular hydrogen and desorption from the
surface). Rs1 and Rs2 are taken as pure (frequency independent)
resistances because it is assumed that the corresponding
reactions are first order reactions. The expression of ZD is
obtained by solving second Fick’s law of diffusion using
appropriate boundary conditions. The result is the so-called
Randles impedance, commonly used by electrochemists [24],
but which also applies to this case. In planar coordinates, after
adaptation to the solid – gas reaction [5], the solution is :
ZDðuÞ ¼d
DH
vPH2
vCH
1u cothðuÞ ¼ RD
thðuÞu
(5)
where
RD ¼d
DH
vPH2
vCHin pa=
�mole:cm�2:s�1
�(6)
u ¼
ffiffiffiffiffiffiffiffiffijud2
DH
s(7)
vPH2
vCHis the slope of the isotherm at the hydrogen composition
where the impedance is measured; d is the thickness of the
membrane (in cm); DH is the hydrogen diffusion coefficient (in
cm2.s�1); u is the pulsation (in rad.s�1). From Eq. (5), it can be
shown that the limit of ZD at high frequencies is {0;0} and that
the limit at low frequencies is {RD;0}. The expression of ZM is
finally given by :
ZMðuÞ ¼ Rs1 þ ZDðuÞ þ Rs2 (8)
At high frequencies, the value of ZM(u) is located on the real
axis :
ZMðu/NÞ ¼ Rs1 þ Rs2 (9)
The value of ZM at low frequencies is also located on the real
axis :
ZMðu/0Þ ¼ Rs1 þ RD þ Rs2 (10)
4. Results and discussion
4.1. Time domain analysis of permeation kinetics
4.1.1. Permeation experiments in stationary conditions ofhydrogen flowThe kinetics of hydrogen permeation across a 20 mm thick
Pd0.47Cu0.53 membrane has been investigated in the 40–400 �C
temperature range, in stationary conditions of hydrogen flow.
For each operating temperature, flow measurements (JH is
expressed in mol.s�1.m�2) have been performed at increasing
pressures on the upstream side of the membrane (from
1013 mbar up to 3000 mbar). Hydrogen pressure on the down-
stream side of the membrane was kept constant at atmo-
spheric pressure. Main results are plotted in Fig. 5. Whereas
a mostly linear relationship is observed between JH and
temperature up to ca. 300 �C, a saturation effect is observed at
higher temperatures. This kind of behavior is in agreement
with results previously reported in the literature for PdCu
membranes [25] and could be related to the bcc / fcc phase
transformation which is known to take place in this temper-
ature range. Although according to the data of Fig. 1 [9], the B2
�> fcc phase transformation for this Cu composition
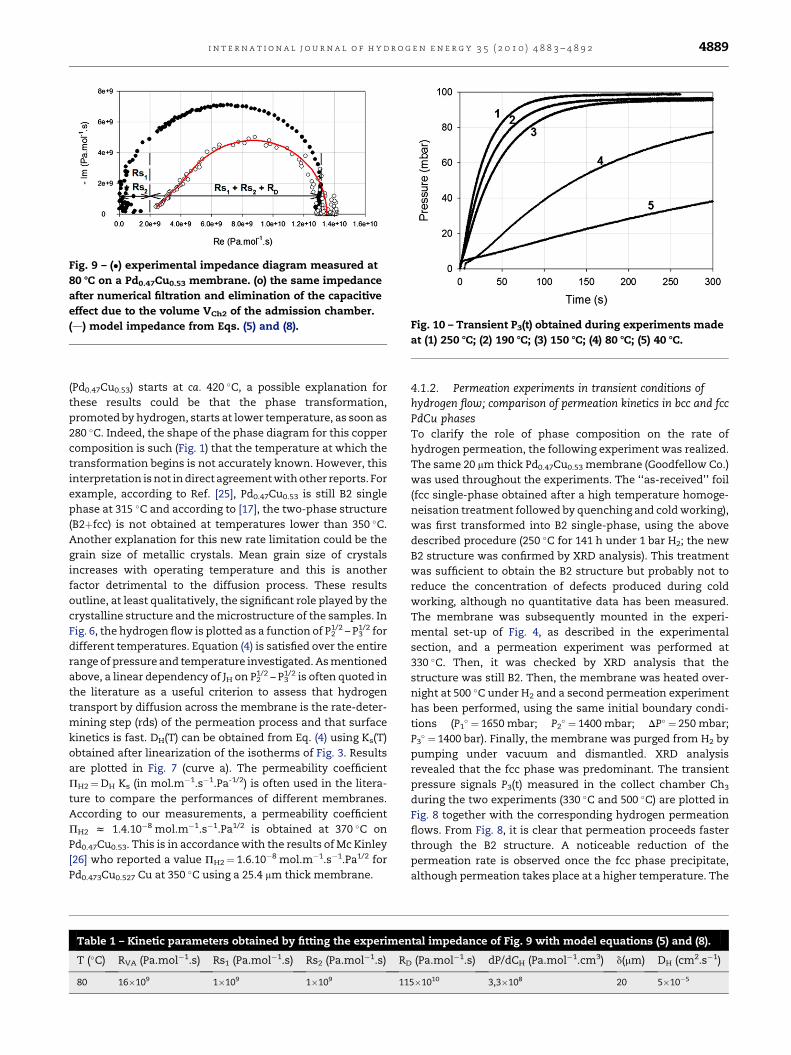
Fig. 9 – (�) experimental impedance diagram measured at
80 8C on a Pd0.47Cu0.53 membrane. (o) the same impedance
after numerical filtration and elimination of the capacitive
effect due to the volume VCh2 of the admission chamber.
(d) model impedance from Eqs. (5) and (8). Fig. 10 – Transient P3(t) obtained during experiments made
at (1) 250 8C; (2) 190 8C; (3) 150 8C; (4) 80 8C; (5) 40 8C.
i n t e r n a t i o n a l j o u r n a l o f h y d r o g e n e n e r g y 3 5 ( 2 0 1 0 ) 4 8 8 3 – 4 8 9 2 4889
(Pd0.47Cu0.53) starts at ca. 420 �C, a possible explanation for
these results could be that the phase transformation,
promoted by hydrogen, starts at lower temperature, as soon as
280 �C. Indeed, the shape of the phase diagram for this copper
composition is such (Fig. 1) that the temperature at which the
transformation begins is not accurately known. However, this
interpretation is not in direct agreement with other reports. For
example, according to Ref. [25], Pd0.47Cu0.53 is still B2 single
phase at 315 �C and according to [17], the two-phase structure
(B2þfcc) is not obtained at temperatures lower than 350 �C.
Another explanation for this new rate limitation could be the
grain size of metallic crystals. Mean grain size of crystals
increases with operating temperature and this is another
factor detrimental to the diffusion process. These results
outline, at least qualitatively, the significant role played by the
crystalline structure and the microstructure of the samples. In
Fig. 6, the hydrogen flow is plotted as a function of P21/2 – P3
1/2 for
different temperatures. Equation (4) is satisfied over the entire
range of pressure and temperature investigated. As mentioned
above, a linear dependency of JH on P21/2 – P3
1/2 is often quoted in
the literature as a useful criterion to assess that hydrogen
transport by diffusion across the membrane is the rate-deter-
mining step (rds) of the permeation process and that surface
kinetics is fast. DH(T) can be obtained from Eq. (4) using Ks(T)
obtained after linearization of the isotherms of Fig. 3. Results
are plotted in Fig. 7 (curve a). The permeability coefficient
PH2¼DH Ks (in mol.m�1.s�1.Pa-1/2) is often used in the litera-
ture to compare the performances of different membranes.
According to our measurements, a permeability coefficient
PH2 z 1.4.10�8 mol.m�1.s�1.Pa1/2 is obtained at 370 �C on
Pd0.47Cu0.53. This is in accordance with the results of Mc Kinley
[26] who reported a value PH2¼ 1.6.10�8 mol.m�1.s�1.Pa1/2 for
Pd0.473Cu0.527 Cu at 350 �C using a 25.4 mm thick membrane.
Table 1 – Kinetic parameters obtained by fitting the experimen
T (�C) RVA (Pa.mol�1.s) Rs1 (Pa.mol�1.s) Rs2 (Pa.mol�1.s) RD
80 16�109 1�109 1�109 11
4.1.2. Permeation experiments in transient conditions ofhydrogen flow; comparison of permeation kinetics in bcc and fccPdCu phasesTo clarify the role of phase composition on the rate of
hydrogen permeation, the following experiment was realized.
The same 20 mm thick Pd0.47Cu0.53 membrane (Goodfellow Co.)
was used throughout the experiments. The ‘‘as-received’’ foil
(fcc single-phase obtained after a high temperature homoge-
neisation treatment followed by quenching and cold working),
was first transformed into B2 single-phase, using the above
described procedure (250 �C for 141 h under 1 bar H2; the new
B2 structure was confirmed by XRD analysis). This treatment
was sufficient to obtain the B2 structure but probably not to
reduce the concentration of defects produced during cold
working, although no quantitative data has been measured.
The membrane was subsequently mounted in the experi-
mental set-up of Fig. 4, as described in the experimental
section, and a permeation experiment was performed at
330 �C. Then, it was checked by XRD analysis that the
structure was still B2. Then, the membrane was heated over-
night at 500 �C under H2 and a second permeation experiment
has been performed, using the same initial boundary condi-
tions (P1� ¼ 1650 mbar; P2
� ¼ 1400 mbar; DP� ¼ 250 mbar;
P3� ¼ 1400 bar). Finally, the membrane was purged from H2 by
pumping under vacuum and dismantled. XRD analysis
revealed that the fcc phase was predominant. The transient
pressure signals P3(t) measured in the collect chamber Ch3
during the two experiments (330 �C and 500 �C) are plotted in
Fig. 8 together with the corresponding hydrogen permeation
flows. From Fig. 8, it is clear that permeation proceeds faster
through the B2 structure. A noticeable reduction of the
permeation rate is observed once the fcc phase precipitate,
although permeation takes place at a higher temperature. The
tal impedance of Fig. 9 with model equations (5) and (8).
(Pa.mol�1.s) dP/dCH (Pa.mol�1.cm3) d(mm) DH (cm2.s�1)
5�1010 3,3�108 20 5�10�5
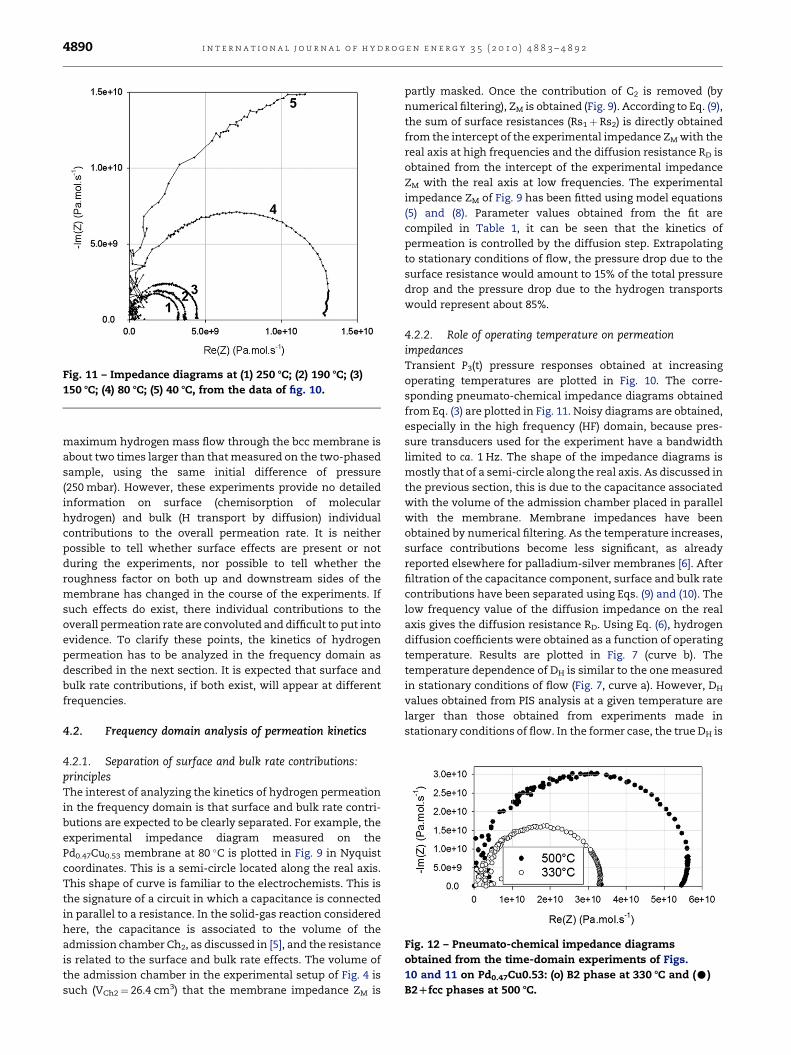
Fig. 11 – Impedance diagrams at (1) 250 8C; (2) 190 8C; (3)
150 8C; (4) 80 8C; (5) 40 8C, from the data of fig. 10.
Fig. 12 – Pneumato-chemical impedance diagrams
obtained from the time-domain experiments of Figs.
10 and 11 on Pd0.47Cu0.53: (o) B2 phase at 330 8C and (C)
B2Dfcc phases at 500 8C.
i n t e r n a t i o n a l j o u r n a l o f h y d r o g e n e n e r g y 3 5 ( 2 0 1 0 ) 4 8 8 3 – 4 8 9 24890
maximum hydrogen mass flow through the bcc membrane is
about two times larger than that measured on the two-phased
sample, using the same initial difference of pressure
(250 mbar). However, these experiments provide no detailed
information on surface (chemisorption of molecular
hydrogen) and bulk (H transport by diffusion) individual
contributions to the overall permeation rate. It is neither
possible to tell whether surface effects are present or not
during the experiments, nor possible to tell whether the
roughness factor on both up and downstream sides of the
membrane has changed in the course of the experiments. If
such effects do exist, there individual contributions to the
overall permeation rate are convoluted and difficult to put into
evidence. To clarify these points, the kinetics of hydrogen
permeation has to be analyzed in the frequency domain as
described in the next section. It is expected that surface and
bulk rate contributions, if both exist, will appear at different
frequencies.
4.2. Frequency domain analysis of permeation kinetics
4.2.1. Separation of surface and bulk rate contributions:principlesThe interest of analyzing the kinetics of hydrogen permeation
in the frequency domain is that surface and bulk rate contri-
butions are expected to be clearly separated. For example, the
experimental impedance diagram measured on the
Pd0.47Cu0.53 membrane at 80 �C is plotted in Fig. 9 in Nyquist
coordinates. This is a semi-circle located along the real axis.
This shape of curve is familiar to the electrochemists. This is
the signature of a circuit in which a capacitance is connected
in parallel to a resistance. In the solid-gas reaction considered
here, the capacitance is associated to the volume of the
admission chamber Ch2, as discussed in [5], and the resistance
is related to the surface and bulk rate effects. The volume of
the admission chamber in the experimental setup of Fig. 4 is
such (VCh2¼ 26.4 cm3) that the membrane impedance ZM is
partly masked. Once the contribution of C2 is removed (by
numerical filtering), ZM is obtained (Fig. 9). According to Eq. (9),
the sum of surface resistances (Rs1þ Rs2) is directly obtained
from the intercept of the experimental impedance ZM with the
real axis at high frequencies and the diffusion resistance RD is
obtained from the intercept of the experimental impedance
ZM with the real axis at low frequencies. The experimental
impedance ZM of Fig. 9 has been fitted using model equations
(5) and (8). Parameter values obtained from the fit are
compiled in Table 1, it can be seen that the kinetics of
permeation is controlled by the diffusion step. Extrapolating
to stationary conditions of flow, the pressure drop due to the
surface resistance would amount to 15% of the total pressure
drop and the pressure drop due to the hydrogen transports
would represent about 85%.
4.2.2. Role of operating temperature on permeationimpedancesTransient P3(t) pressure responses obtained at increasing
operating temperatures are plotted in Fig. 10. The corre-
sponding pneumato-chemical impedance diagrams obtained
from Eq. (3) are plotted in Fig. 11. Noisy diagrams are obtained,
especially in the high frequency (HF) domain, because pres-
sure transducers used for the experiment have a bandwidth
limited to ca. 1 Hz. The shape of the impedance diagrams is
mostly that of a semi-circle along the real axis. As discussed in
the previous section, this is due to the capacitance associated
with the volume of the admission chamber placed in parallel
with the membrane. Membrane impedances have been
obtained by numerical filtering. As the temperature increases,
surface contributions become less significant, as already
reported elsewhere for palladium-silver membranes [6]. After
filtration of the capacitance component, surface and bulk rate
contributions have been separated using Eqs. (9) and (10). The
low frequency value of the diffusion impedance on the real
axis gives the diffusion resistance RD. Using Eq. (6), hydrogen
diffusion coefficients were obtained as a function of operating
temperature. Results are plotted in Fig. 7 (curve b). The
temperature dependence of DH is similar to the one measured
in stationary conditions of flow (Fig. 7, curve a). However, DH
values obtained from PIS analysis at a given temperature are
larger than those obtained from experiments made in
stationary conditions of flow. In the former case, the true DH is
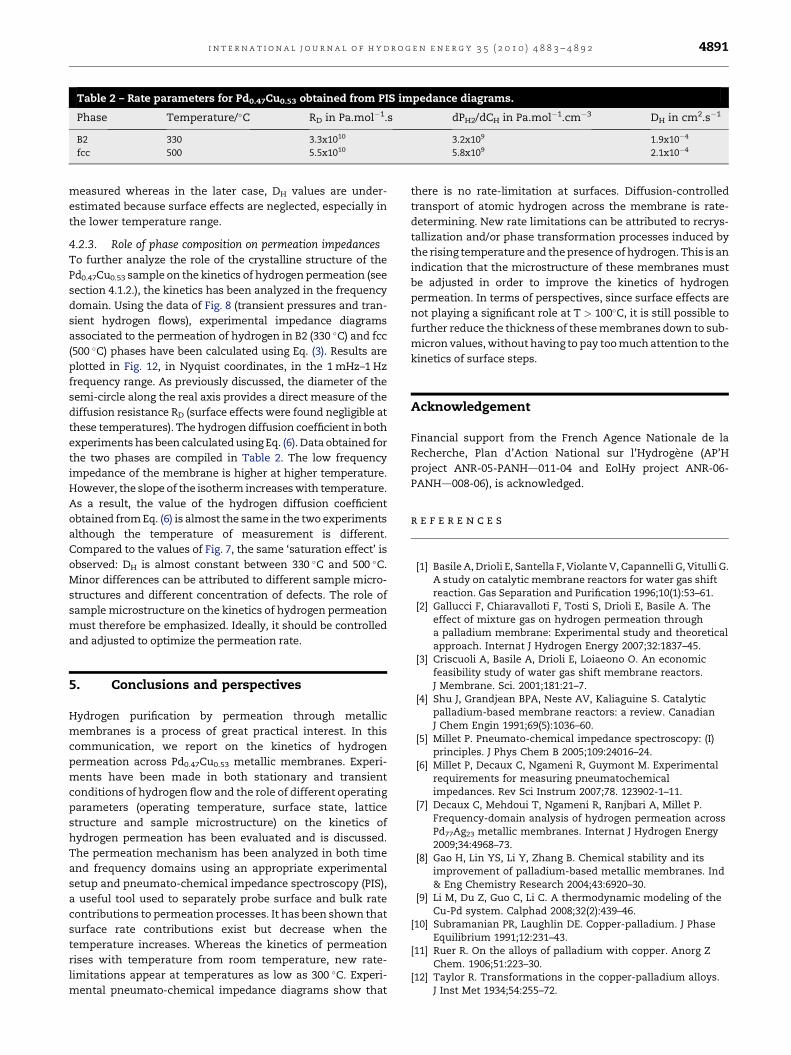
Table 2 – Rate parameters for Pd0.47Cu0.53 obtained from PIS impedance diagrams.
Phase Temperature/�C RD in Pa.mol�1.s dPH2/dCH in Pa.mol�1.cm�3 DH in cm2.s�1
B2 330 3.3x10¹⁰ 3.2x10⁹ 1.9x10�4
fcc 500 5.5x10¹⁰ 5.8x10⁹ 2.1x10�4
i n t e r n a t i o n a l j o u r n a l o f h y d r o g e n e n e r g y 3 5 ( 2 0 1 0 ) 4 8 8 3 – 4 8 9 2 4891
measured whereas in the later case, DH values are under-
estimated because surface effects are neglected, especially in
the lower temperature range.
4.2.3. Role of phase composition on permeation impedancesTo further analyze the role of the crystalline structure of the
Pd0.47Cu0.53 sample on the kinetics of hydrogen permeation (see
section 4.1.2.), the kinetics has been analyzed in the frequency
domain. Using the data of Fig. 8 (transient pressures and tran-
sient hydrogen flows), experimental impedance diagrams
associated to the permeation of hydrogen in B2 (330 �C) and fcc
(500 �C) phases have been calculated using Eq. (3). Results are
plotted in Fig. 12, in Nyquist coordinates, in the 1 mHz–1 Hz
frequency range. As previously discussed, the diameter of the
semi-circle along the real axis provides a direct measure of the
diffusion resistance RD (surface effects were found negligible at
these temperatures). The hydrogen diffusion coefficient in both
experiments has been calculated using Eq. (6). Data obtained for
the two phases are compiled in Table 2. The low frequency
impedance of the membrane is higher at higher temperature.
However, the slope of the isotherm increases with temperature.
As a result, the value of the hydrogen diffusion coefficient
obtained from Eq. (6) is almost the same in the two experiments
although the temperature of measurement is different.
Compared to the values of Fig. 7, the same ‘saturation effect’ is
observed: DH is almost constant between 330 �C and 500 �C.
Minor differences can be attributed to different sample micro-
structures and different concentration of defects. The role of
sample microstructure on the kinetics of hydrogen permeation
must therefore be emphasized. Ideally, it should be controlled
and adjusted to optimize the permeation rate.
5. Conclusions and perspectives
Hydrogen purification by permeation through metallic
membranes is a process of great practical interest. In this
communication, we report on the kinetics of hydrogen
permeation across Pd0.47Cu0.53 metallic membranes. Experi-
ments have been made in both stationary and transient
conditions of hydrogen flow and the role of different operating
parameters (operating temperature, surface state, lattice
structure and sample microstructure) on the kinetics of
hydrogen permeation has been evaluated and is discussed.
The permeation mechanism has been analyzed in both time
and frequency domains using an appropriate experimental
setup and pneumato-chemical impedance spectroscopy (PIS),
a useful tool used to separately probe surface and bulk rate
contributions to permeation processes. It has been shown that
surface rate contributions exist but decrease when the
temperature increases. Whereas the kinetics of permeation
rises with temperature from room temperature, new rate-
limitations appear at temperatures as low as 300 �C. Experi-
mental pneumato-chemical impedance diagrams show that
there is no rate-limitation at surfaces. Diffusion-controlled
transport of atomic hydrogen across the membrane is rate-
determining. New rate limitations can be attributed to recrys-
tallization and/or phase transformation processes induced by
the rising temperature and the presence of hydrogen. This is an
indication that the microstructure of these membranes must
be adjusted in order to improve the kinetics of hydrogen
permeation. In terms of perspectives, since surface effects are
not playing a significant role at T > 100�C, it is still possible to
further reduce the thickness of these membranes down to sub-
micron values, without having to pay too much attention to the
kinetics of surface steps.
Acknowledgement
Financial support from the French Agence Nationale de la
Recherche, Plan d’Action National sur l’Hydrogene (AP’H
project ANR-05-PANHd011-04 and EolHy project ANR-06-
PANHd008-06), is acknowledged.
r e f e r e n c e s
[1] Basile A, Drioli E, Santella F, Violante V, Capannelli G, Vitulli G.A study on catalytic membrane reactors for water gas shiftreaction. Gas Separation and Purification 1996;10(1):53–61.
[2] Gallucci F, Chiaravalloti F, Tosti S, Drioli E, Basile A. Theeffect of mixture gas on hydrogen permeation througha palladium membrane: Experimental study and theoreticalapproach. Internat J Hydrogen Energy 2007;32:1837–45.
[3] Criscuoli A, Basile A, Drioli E, Loiaeono O. An economicfeasibility study of water gas shift membrane reactors.J Membrane. Sci. 2001;181:21–7.
[4] Shu J, Grandjean BPA, Neste AV, Kaliaguine S. Catalyticpalladium-based membrane reactors: a review. CanadianJ Chem Engin 1991;69(5):1036–60.
[5] Millet P. Pneumato-chemical impedance spectroscopy: (I)principles. J Phys Chem B 2005;109:24016–24.
[6] Millet P, Decaux C, Ngameni R, Guymont M. Experimentalrequirements for measuring pneumatochemicalimpedances. Rev Sci Instrum 2007;78. 123902-1–11.
[7] Decaux C, Mehdoui T, Ngameni R, Ranjbari A, Millet P.Frequency-domain analysis of hydrogen permeation acrossPd77Ag23 metallic membranes. Internat J Hydrogen Energy2009;34:4968–73.
[8] Gao H, Lin YS, Li Y, Zhang B. Chemical stability and itsimprovement of palladium-based metallic membranes. Ind& Eng Chemistry Research 2004;43:6920–30.
[9] Li M, Du Z, Guo C, Li C. A thermodynamic modeling of theCu-Pd system. Calphad 2008;32(2):439–46.
[10] Subramanian PR, Laughlin DE. Copper-palladium. J PhaseEquilibrium 1991;12:231–43.
[11] Ruer R. On the alloys of palladium with copper. Anorg ZChem. 1906;51:223–30.
[12] Taylor R. Transformations in the copper-palladium alloys.J Inst Met 1934;54:255–72.
i n t e r n a t i o n a l j o u r n a l o f h y d r o g e n e n e r g y 3 5 ( 2 0 1 0 ) 4 8 8 3 – 4 8 9 24892
[13] Jones FW, Sykes C. The transformations of the copper-palladium alloys. J Inst Met 1939;65:419–33.
[14] Nemilov VA, Rudnitskii AA, Polyakova RS. Alloys ofpalladium with copper. Izv Sektora Platiny 1949;24:26–34.
[15] Jaumot FE, Sawatzky A. An isothermal anneal study ofquenched and cold-worked copper-palladium alloys. ActaMetallurgica 1956;4:118–26.
[16] Volkl J, Alefeld G. In: Alefeld G, Volkl J, editors. Hydrogen inmetals, col. I. Topics in applied physics, vol. 28. Berlin:Springer Verlag; 1978. p. 321–48.
[17] Piper J. Diffusion of hydrogen in copper-palladium alloys.J Applied Phys. 1966;37:715–21.
[18] Clewley J, Curran T, Flanagan T, Oates W. Thermodynamicproperties of hydrogen and deuterium dissolved inpalladium at low concentrations over a wide temperaturerange. J Chem Soc Faraday Trans I 1973;69:449–58.
[19] Yuan L, Goldbach A, Xu H. Segregation and H transport ratecontrol in body-centered cubic PdCu membranes. J PhysChem B 2007;111(37):10952–8.
[20] Kamakoti P, Morreale BD, Ciocco MV, Howard BH,Killmeyer RP, Cugini AV, Sholl DS. Prediction of HydrogenFlux Through Sulfur-Tolerant Binary Alloy Membranes.Science 2005;307:569–73.
[21] Roa F, Block MJ, Way JD. The influence of alloy compositionon the H2 flux of composite Pd-Cu membranes. Desalination2002;147:411–6.
[22] Sieverts A. Die Aufnahme von Gasen durch Metalle.Zeitschrift fur Mettallkunde 1929;21:37–46.
[23] Lewis FA. The palladium-hydrogen system. London:Academic Press; 1967.
[24] Randles JE. Kinetics of rapid electrode reactions. Discuss.Faraday Soc. 1947;1:11.
[25] Howard BH, Killmeyer RP, Rothenberger KS, Cugini AV,Morreale BD, Enick RM, Bustamante F. Hydrogen permeance ofpalladium–copper alloy membranes over a wide range oftemperatures and pressures. J Membrane Sci. 2004;241:207–18.
[26] McKinley DL. Method for hydrogen separation andpurification. US Patent 3,439,474, 1969.
Copyright © 2022 FDOKUMEN