Mechanochemical synthesis of hydrogen-storage materials ...
133
Graduate eses and Dissertations Iowa State University Capstones, eses and Dissertations 2015 Mechanochemical synthesis of hydrogen-storage materials based on aluminum, magnesium and their compounds Ihor Z. Hlova Iowa State University Follow this and additional works at: hps://lib.dr.iastate.edu/etd Part of the Materials Science and Engineering Commons , Mechanics of Materials Commons , and the Oil, Gas, and Energy Commons is Dissertation is brought to you for free and open access by the Iowa State University Capstones, eses and Dissertations at Iowa State University Digital Repository. It has been accepted for inclusion in Graduate eses and Dissertations by an authorized administrator of Iowa State University Digital Repository. For more information, please contact [email protected]. Recommended Citation Hlova, Ihor Z., "Mechanochemical synthesis of hydrogen-storage materials based on aluminum, magnesium and their compounds" (2015). Graduate eses and Dissertations. 14573. hps://lib.dr.iastate.edu/etd/14573
-
Upload
khangminh22 -
Category
Documents
-
view
3 -
download
0
Transcript of Mechanochemical synthesis of hydrogen-storage materials ...

Graduate Theses and Dissertations Iowa State University Capstones, Theses andDissertations
2015
Mechanochemical synthesis of hydrogen-storagematerials based on aluminum, magnesium andtheir compoundsIhor Z. HlovaIowa State University
Follow this and additional works at: https://lib.dr.iastate.edu/etd
Part of the Materials Science and Engineering Commons, Mechanics of Materials Commons, andthe Oil, Gas, and Energy Commons
This Dissertation is brought to you for free and open access by the Iowa State University Capstones, Theses and Dissertations at Iowa State UniversityDigital Repository. It has been accepted for inclusion in Graduate Theses and Dissertations by an authorized administrator of Iowa State UniversityDigital Repository. For more information, please contact [email protected].
Recommended CitationHlova, Ihor Z., "Mechanochemical synthesis of hydrogen-storage materials based on aluminum, magnesium and their compounds"(2015). Graduate Theses and Dissertations. 14573.https://lib.dr.iastate.edu/etd/14573
Mechanochemical synthesis of hydrogen-storage materials based on
aluminum, magnesium and their compounds
by
Ihor Z. Hlova
A dissertation submitted to the graduate faculty
in partial fulfillment of the requirements for the degree of
DOCTOR OF PHILOSOPHY
Major: Materials Science and Engineering
Program of Study committee:
Vitalij K. Pecharsky, Major Professor
Karl A. Gschneidner, Jr.
Marek Pruski
Duane Johnson
Scott Chumbley
Iowa State University
Ames, Iowa
2015
Copyright © Ihor Z. Hlova, 2015. All rights reserved.
ii
TABLE OF CONTENTS
Page
LIST OF TABLES ................................................................................................... vi
LIST OF FIGURES ................................................................................................. vii
LIST OF SYMBOLS AND ABBREVIATIONS ................................................... xi
ACKNOWLEDGMENTS ....................................................................................... xii
ABSTRACT .............................................................................................................. xiii
CHAPTER 1. INTRODUCTION......................................................................... 1
1.1 Hydrogen as synthetic fuel of future ............................................................ 1
1.2 Hydrogen storage ......................................................................................... 3
1.2.1 Gaseous hydrogen ............................................................................... 5
1.2.2 Liquid hydrogen .................................................................................. 6
1.2.3 Solid hydrogen .................................................................................... 8
1.2.3.1 Hydrogen storage materials based on physisorption of
molecular hydrogen .............................................................................. 9
1.2.3.1 Hydrogen storage materials based on hydrogen bond
formation ............................................................................................... 11
1.2.3.2.1 Simple hydrides ............................................................. 11
1.2.3.2.1.1 Aluminum hydride ................................................ 11
1.2.3.2.1.2 Magnesium hydride .............................................. 12
1.2.3.2.2 Intermetallic hydrides .................................................... 13
1.2.3.2.3 Complex hydrides .......................................................... 14
1.2.3.2.3.1 Alanates................................................................. 14
1.2.3.2.3.2 Borohydrides ......................................................... 15
1.2.3.2.3.3 Amides/imides ...................................................... 16
iii
CHAPTER 2. EXPERIMENTAL PROCEDURES ........................................... 17
2.1 Sample preparation ...................................................................................... 17
2.2 Sample characterization ............................................................................... 18
2.2.1 Powder XRD ....................................................................................... 18
2.2.2 Solid-state NMR ................................................................................. 18
2.2.3 Volumetric Analysis ........................................................................... 19
CHAPTER 3. MECHANOCHEMICAL SYNTHESIS OF MAGNESIUM
BOROHYDRIDE ..................................................................................................... 20
3.1 Introduction ................................................................................................. 20
3.2 Results and discussion .................................................................................. 20
3.3 Conclusions ................................................................................................... 25
CHAPTER 4. MECHANOCHEMICAL SYNTHESIS OF ALANE FROM
LITHIUM HYDRIDE AND ALUMINUM CHLORIDE ..................................... 26
4.1 Introduction ................................................................................................. 26
4.2 Results and discussion .................................................................................. 28
4.2.1 Determination of the initial reaction conditions .................................. 28
4.2.2 The 9:1 reaction of LiH and AlCl3 ....................................................... 30
4.2.3 Further addition of AlCl3 (4:1 cumulative LiH:AlCl3 ratio) ................ 33
4.2.4 Final addition of AlCl3 (3:1 cumulative LiH:AlCl3 ratio) ................... 35
4.2.5 Summary of the overall reaction scheme ............................................. 36
4.2.6 Temperature-programmed desorption (TPD) analysis ........................ 37
4.2.7 Reaction mechanisms........................................................................... 39
4.3 Conclusions ................................................................................................... 43
CHAPTER 5. MECHANOCHEMICAL SYNTHESIS OF ALANE FROM
LITHIUM ALUMINUM HYDRIDE AND ALUMINUM CHLORIDE ............ 45
5.1 Introduction ................................................................................................. 46
5.2 Experimental section ..................................................................................... 50
5.2.1 Materials and mechanochemical processing ........................................ 50
iv
5.2.2 X-ray powder diffraction analysis ....................................................... 51
5.2.3 Solid-state NMR spectroscopy ............................................................ 51
5.2.4 Temperature programmed desorption .................................................. 52
5.3 Results and discussion .................................................................................. 53
5.3.1 Mechanochemical synthesis................................................................. 53
5.3.2 Determination of pc .............................................................................. 55
5.3.3 Identification of intermediates ............................................................. 55
5.3.4 Mechanistic pathway ........................................................................... 60
5.3.5 Effect of milling energy on pc .............................................................. 67
5.3.6 Effect of gas type ................................................................................. 69
5.3.7 Existence of pc ..................................................................................... 71
5.3.8 Towards identifying the atomistic mechanism .................................... 72
5.3 Conclusions ................................................................................................... 73
5.4 Acknowledgements ....................................................................................... 74
CHAPTER 6. MECHANOCHEMICAL SYNTHESIS OF ALANE FROM
SODIUM HYDRIDE AND ALUMINUM CHLORIDE ...................................... 75
6.1 Introduction ................................................................................................. 75
6.2 Results and discussion .................................................................................. 76
6.2.1 The 9:1 reaction of NaH and AlCl3 (stage 1) ....................................... 78
6.2.2 The 5:1 reaction of NaH and AlCl3 (stage 2) ....................................... 81
6.2.3 The 9:1 reaction of NaH and AlCl3 (stage 3) ....................................... 83
6.2.4 Summary of the overall reaction scheme ............................................. 84
6.2.5 Temperature-programmed desorption (TPD) analysis ........................ 84
6.2.6 Reaction mechanisms........................................................................... 87
6.3 Conclusions ................................................................................................... 88
CHAPTER 7. MECHANOCHEMICAL SYNTHESIS OF ALANE FROM
SODIUM ALUMINUM HYDRIDE AND ALUMINUM CHLORIDE .............. 89
7.1 Introduction ................................................................................................. 89

v
7.2 Results and discussion .................................................................................. 90
7.2.1 Synthesis and characterization ............................................................. 90
7.2.2 Hydrogen desorption analysis .............................................................. 97
7.3 Conclusions ................................................................................................... 100
CHAPTER 8. OVERVIEW AND SUGGESTIONS FOR FUTURE
RESEARCH ......................................................................................................... 101
REFERENCES ......................................................................................................... 107

vi
LIST OF TABLES
Page
Table 1.1 US DOE Onboard hydrogen storage system targets .......................... 4
Table 1.2 The most important families of hydride-forming intermetallic
compounds ............................................................................................................ 13
vii
LIST OF FIGURES
Page
Figure 1.1 Correlation between global annual average temperatures and carbon
dioxide (CO2) concentrations ..................................................................................... 1
Figure 2.1 Custom-built high pressure vial designed to operate at maximum
pressure of 350 bar in a Fritsch P7 planetary ball mill .............................................. 17
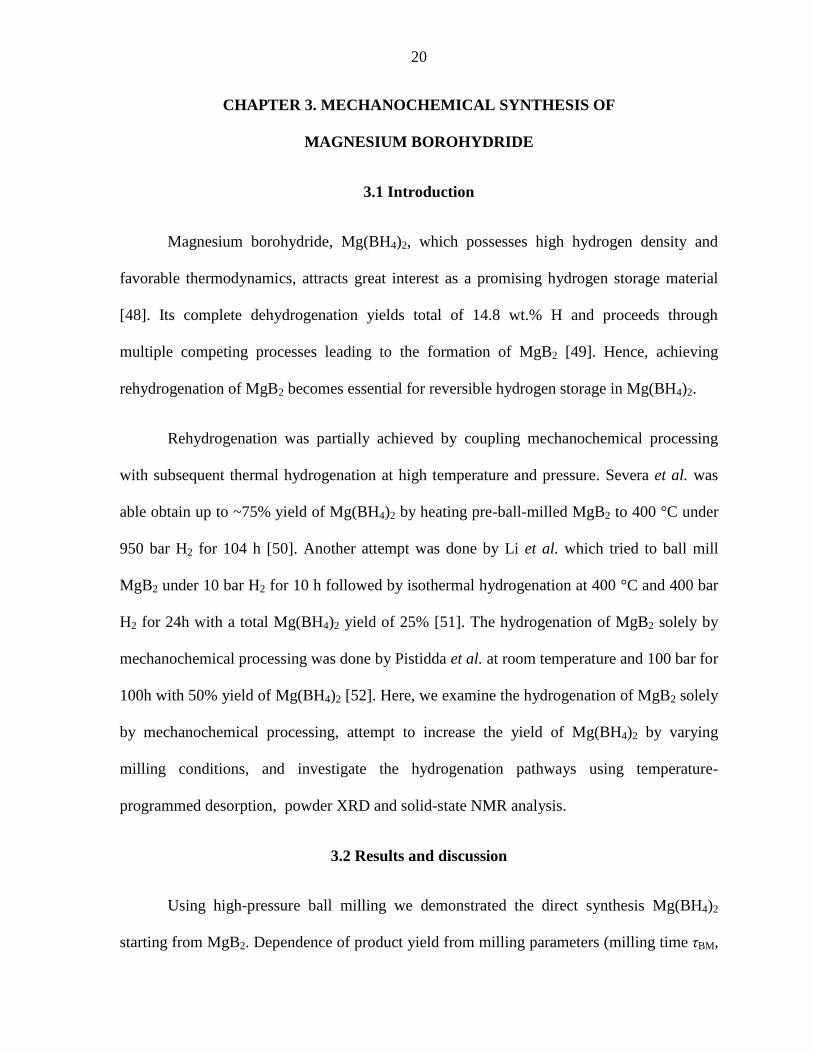
Figure 3.1 11
B DPMAS spectra of MgB2 hydrogenated in ball mill using: (a)
pH = 350 bar and τBM = 3.5, 7, 15 and 30 h; and (b) τBM = 15 h and pH = 50, 100,
150, 250 and 350 bar. ................................................................................................. 21
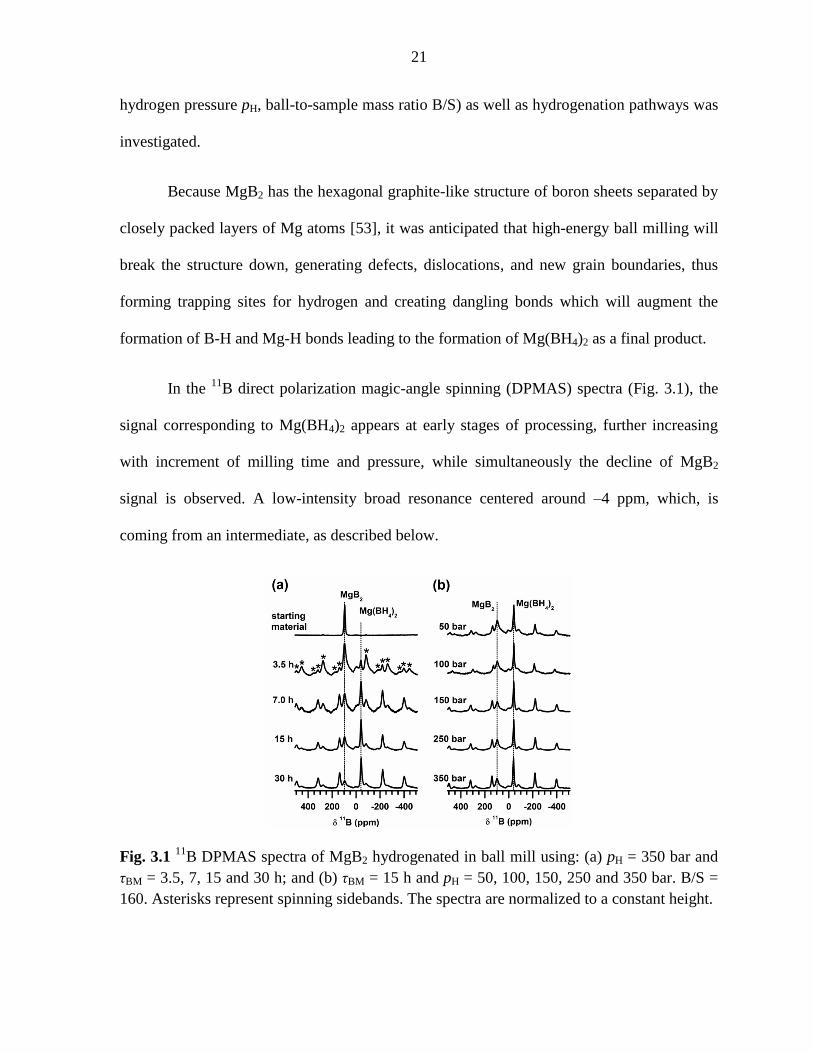
Figure 3.2 11
B DPMAS (solid) and 11
B{1H} CPMAS (dotted) spectra of MgB2
hydrogenated in ball mill using pH = 350 bar, τBM = 7 h and B/S = 40, 80 and 160 .. 22
Figure 3.3 Thermal dehydrogenation of mechanochemically hydrogenated
MgB2 measured by temperature programmed desorption. ........................................ 23
Figure 3.4 Dehydrogenation and subsequent rehydrogenation: (a–c) 11
B DPMAS (solid) and CPMAS (dotted) spectra and (d, e) XRD patterns of
samples (a, d) dehydrogenated at 300 °C, (b, e) dehydrogenated at 390 °C, and (c)
rehydrogenated. .......................................................................................................... 24
Figure 4.1 X-ray diffraction patterns corresponding to as-milled samples with
LiH:AlCl3 starting ratios of a) 3:1, b) 6:1, c) 9:1, and d) 12:1 after ball milling for
48 min under 350 bar H2 with a milling speed of 300 rpm and a B/S of ~140. ........ 29
Figure 4.2 X-ray diffraction patterns (a-c) and solid-state NMR (27
Al DPMAS
and 27
Al{1H} CPMAS) spectra (d-e) obtained for samples of the 9:1 LiH:AlCl3
reaction mass after ball milling for the indicated time under 350 bar H2 with a
milling speed of 300 rpm and a B/S of ~140. ............................................................ 30
Figure 4.3 X-ray diffraction patterns (a-b) and solid-state NMR (27
Al DPMAS
and 27
Al{1H} CPMAS) spectra (c-d) obtained for samples of the 4:1 LiH:AlCl3
reaction mass after ball milling for the indicated time under 350 bar H2 with a
milling speed of 300 rpm and a B/S of ~140. ............................................................ 33
Figure 4.4 X-ray diffraction patterns (a-b) and solid-state NMR (27
Al DPMAS
and 27
Al{1H} CPMAS) spectra (c-d) obtained for samples of the 3:1 LiH:AlCl3
reaction mass after ball milling for the indicated time under 350 bar H2 with a
milling speed of 300 rpm and a B/S of ~140. ............................................................ 35

viii
Figure 4.5 TPD curves obtained for samples of the reaction mixtures resulting
from LiH:AlCl3 starting ratios of (a) 9:1, (b) 4:1, and (c) 3:1 after 48 min of ball
milling under 350 bar H2 with a milling speed of 300 rpm and a B/S of ~140. ...... 38
Figure 4.6 X-ray diffraction patterns of products obtained after complete
desorption (see Fig. 4.5) of as-synthesized samples with (a) 9:1, (b) 4:1 and
(c) 3:1 molar ratio of LiH and AlCl3. ......................................................................... 39
Figure 4.7 X-ray diffraction patterns showing the comparison of progress of
reaction in 3:1(left) and 9:1 (right) LiH:AlCl3 ratios during the initial 18 min
of milling. ............................................................................................................ 40
Figure 4.8 Solid-state NMR (27
Al DPMAS and 27
Al{1H} CPMAS) spectra
obtained for a sample having the starting ratio of 3:1 LiH:AlCl3 after ball milling
for 20 h under 350 bar H2 at 150 rpm with a B/S of ~140. ........................................ 41
Figure 5.1 (a) X-ray diffraction patterns of the products obtained after
mechanochemical processing of 3LiAlH4+1AlCl3 up to 60 min at H2 pressures
between 100 and 250 bar are shown. ......................................................................... 54
Figure 5.2 X-ray diffraction patterns of the starting mixture (3LiAlH4:1AlCl3)
and the products obtained after milling of this mixture for 10, 20, and 30 min.. ...... 56
Figure 5.3 (a) 27
Al DP and (b) 27
Al-1H CPMAS spectra of the 3LiAlH4+1AlCl3
mixture ball-milled for various times. ....................................................................... 58
Figure 5.4 3QMAS spectra of (a) 250H2-10m, (b) 250H2-60m and (c) the
horizontal projection of b. .......................................................................................... 59
Figure 5.5 X-ray diffraction patterns of products obtained from milling of
xLiAlH4:1AlCl3 mixtures (x = 0.1–1.25) in SPEX mill under near ambient argon
pressure for 60 min. .................................................................................................. 62
Figure 5.6 27
Al DPMAS spectra (black) obtained for samples xLiAlH4–AlCl3
(x = 0.25, 0.33 and 0.5) shown together with their respective 273
Al{1H} CPMAS
spectra (blue). ............................................................................................................ 63
Figure 5.7 X-ray diffraction patterns of the products obtained a) after milling
products obtained from reaction a with LiAlH4 with final composition of
3LiAlH4:1AlCl3 and b) milling the pre-formed LiAlCl4 with LiAlH4 (final
composition 3:1 according to reaction c carried out above and below the critical
pressure. ............................................................................................................ 67

ix
Figure 5.8 X-ray diffraction patterns of the products obtained by milling
3LiAlH4:1AlCl3 at 150 rpm (B/S~160:1) under 1 bar H2 after time intervals as
indicated. ............................................................................................................ 68
Figure 5.9 (a) 27
Al DP and (b) 27
Al-1H CPMAS spectra of 3LiAlD4:1AlCl3
(250H2-60m). The dotted lines represent the corresponding spectra of
3LiAlH4:1AlCl3(250H2-60m). The spectra show absolute height. B0 = 9.4 T. ......... 69
Figure 5.10 X-ray diffraction patterns of products from 3LiAlH4:1AlCl3 milled
under various He and Ar pressure. ............................................................................. 71
Figure 6.1 X-ray diffraction patterns corresponding to as-milled samples with
NaH:AlCl3 starting ratios of a) 3:1, b) 6:1 and c) 9:1 after ball milling for 60 min
under 350 bar H2 with a milling speed of 300 rpm and a B/S of ~140. ..................... 77
Figure 6.2 X-ray diffraction patterns (a-f) of samples obtained from the 9:1
mixture of NaH and AlCl3 after ball-milling for the indicated time under 350 bar
H2 with a milling speed of 300 rpm and a B/S of ~140. ............................................ 79
Figure 6.3 23
Na (a) and 27
Al (b) DPMAS spectra of samples obtained after
each stage of processing described in 6.2.1, 6.2.2 and 6.2.3. .................................... 80
Figure 6.4 X-ray diffraction patterns (a-f) samples obtained from the 5:1
mixture of NaH and AlCl3 after ball-milling for the indicated time under 350 bar
H2 with a milling speed of 300 rpm and a B/S of ~140. ............................................ 82
Figure 6.5 X-ray diffraction patterns (a-f) samples obtained from the 3:1
mixture of NaH and AlCl3 after ball-milling for the indicated time under 350 bar
H2 with a milling speed of 300 rpm and a B/S of ~140. ............................................ 84
Figure 6.6 TPD curves obtained for samples of the reaction mixtures resulting
from NaH:AlCl3 starting ratios of (a) 9:1, (b) 4:1, and (c) 3:1 after 60 min of ball
milling under 350 bar H2 with a milling speed of 300 rpm and a B/S of ~140. ........ 86
Figure 6.7 X-ray diffraction patterns of products obtained after complete
desorption (see Fig. 6.6) of as-synthesized samples with (a) 9:1, (b) 4:1 and
(c) 3:1 molar ratio of NaH and AlCl3. ........................................................................ 87
Figure 7.1 X-ray diffraction patterns of the products obtained after mechanical
milling of (a) 3NaAlH4+1AlCl3, (b) 3NaAlH4+1AlBr3 and (c) 3NaAlH4+1AlI3 for
60 min under various H2 pressure. ............................................................................. 92
Figure 7.2 X-ray diffraction patterns of the starting compounds NaAlH4 and
AlCl3, and the products obtained from after mechanical milling of 3:1 mixture
after 10, 20, 30, and 60 min at 250 bar H2 pressure. .................................................. 94
x
Figure 7.3 (a) 23
Na DP, (b) 27
Al DP and (c) 27
Al-1H CPMAS spectra of the
3NaAlH4:1AlCl3 mixture ball-milled for various time. ............................................. 95
Figure 7.4 X-ray diffraction patterns of xNaAlH4-AlCl3 (x = 0.5, 0.75, 0.87, 1
and 1.25) mixtures milled for 60 min in SPEX mill under argon. ............................. 96
Figure 7.5 X-ray diffraction patterns of 1:1 molar mixtures of NaAlH4 and
AlX3 (X = Cl, Br and I) milled for 60 min under argon in SPEX mill. ..................... 97
Figure 7.6 Temperature-programmed desorption curves obtained for 3:1 molar
mixtures of NaAlH4 and AlX3 (X = Cl, Br and I) milled for 60 min in a planetary
ball mill under various hydrogen pressure. ................................................................ 98
Figure 7.7 Temperature-programmed desorption curves obtained for 1:1 molar
mixtures of NaAlH4 and AlX3 (X = Cl, Br and I) milled for 60 min in SPEX mill
under slight argon overpressure. ................................................................................ 99

xi
LIST OF SYMBOLS AND ABBREVIATIONS
XRD X-ray diffraction
NMR Nuclear magnetic resonance
DOE Department of Energy
PEM Proton exchange membrane
HGMs Hollow glass microspheres
LH2 Liquid hydrogen
MOFs Metal-organic frameworks
MAS Magic angle spinning
DPMAS Direct polarization magic-angle spinning
CPMAS Cross-polarization magic-angle spinning
TPD Temperature-programmed desorption
Td Desorption onset temperature
BM Ball-milling time
pc Critical pressure
pH2 Hydrogen pressure
νRF Frequency of radio wave
xii
ACKNOWLEDGMENTS
First and foremost, I wish to express my utmost gratitude to Vitalij Pecharsky as my
major professor and committee chair for the great opportunity to join his group at Ames
Laboratory and study under his supervision. His keen insight, encouragement and motivation
helped me to focus on my goals and successfully graduate with a doctoral degree in Materials
Science and Engineering.
Grateful acknowledgment goes to my fellow colleague Dr. Shalabh Gupta, who
provided me with practical guidance and advice throughout my doctoral studies. With his
supervision and support, my research went much more smoothly and fruitful.
Without a doubt, I would like to thank my committee members: Karl A. Gschneidner,
Marek Pruski, Duane Johnson and Scott Chumbley, who took the time to make this defense
possible.
Additionally, I want to acknowledge the support and friendship of all the coworkers
and group members both present and past. Special thanks go to Prof. Pruski's group for their
contribution to this study.
Finally, and most importantly, I am grateful to my lovely wife for her unwavering
support and countless sacrifices she has made to help me reach my goal. I must also thank
my parents who gave me a gift of life and supported me through this long journey. And I
can't forget to mention my little son Eric, who stayed up next to my desk every weekend
constantly reminding to take a break.

xiii
ABSTRACT
Over the last few decades, interest in hydrogen-storage materials as an alternative
high-efficiency and safe, green energy carriers is steadily increasing. Among numerous
hydrides scrutinized for the purpose over the past 10-15 years, aluminum- and magnesium-
based systems attract continued attention, mainly because of their high gravimetric capacity
and low cost. However, difficulties associated with facile synthesis and hence the
reversibility, relatively high desorption temperatures, and sluggish kinetics in many of these
systems are still of great concern and hold them back from broad, large-scale applications,
e.g. in automotive industry.
Our research was devoted to studies of mechanochemical activation and synthesis of
nanostructured hydride systems of aluminum and magnesium by solid-state mechanical
milling techniques. The structural and desorption properties of milled powders were
examined by powder X-ray diffraction (XRD), solid-state nuclear magnetic resonance
(NMR) spectroscopy and desorption analysis in a Sieverts-type apparatus.
The primary focus of this study was to investigate a number of aluminum-based
hydride systems to develop advanced synthesis procedures for AlH3 (alane) using solvent-
free solid-state mechanical milling under moderate hydrogen pressures at room temperature.
The findings reported in this dissertation, may provide the much needed basic scientific
insight necessary for the development of an approach for direct mechanochemical
hydrogenation of metallic aluminum which still remains elusive despite numerous efforts
worldwide. Here, we have demonstrated a mechanochemical approach for synthesis of alane
via metathesis reactions between hydride sources and aluminum halides. Reaction pathways

xiv
and parameters controlling the reactions were investigated. Additionally, the possibility of
mechanochemical hydrogenation of magnesium boride (MgB2) was also studied.
1
CHAPTER 1. INTRODUCTION
1.1 Hydrogen as synthetic fuel of future
With the rapidly growing world population, and improving living standards, our fossil
fuel reserves are quickly falling and thereby threatening a sustainable energy supply in the
future. The major problem lies in the fact that fossils are non-renewable resources, with some
forecasts predicting the supplies would last only for another four decades or so [1].
Equally concerning are the effects of greenhouse gasses emitted during combustion of
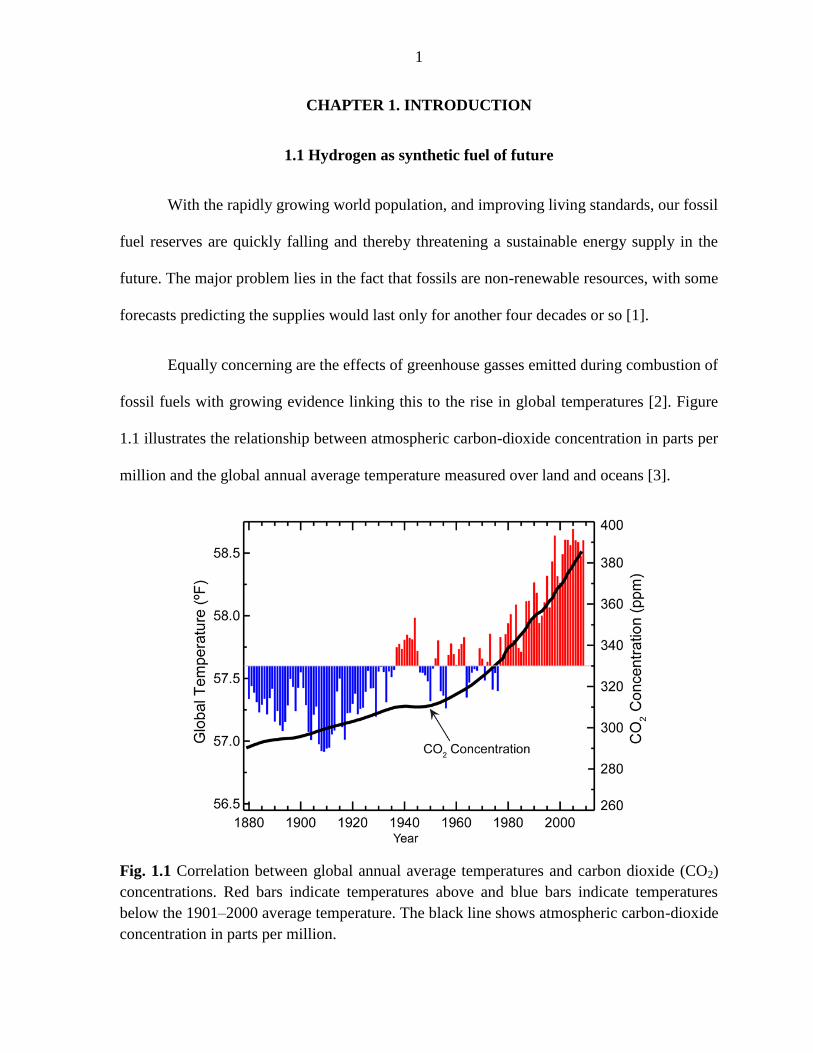
fossil fuels with growing evidence linking this to the rise in global temperatures [2]. Figure
1.1 illustrates the relationship between atmospheric carbon-dioxide concentration in parts per
million and the global annual average temperature measured over land and oceans [3].
Fig. 1.1 Correlation between global annual average temperatures and carbon dioxide (CO2)
concentrations. Red bars indicate temperatures above and blue bars indicate temperatures
below the 1901–2000 average temperature. The black line shows atmospheric carbon-dioxide
concentration in parts per million.

2
Approximately 98% of the CO2 on Earth is dissolved in the water of the oceans and
its solubility decreases as water temperature increases by approximately 3% per °C.
Accordingly, as the average global temperature rises, the equilibrium of carbon dioxide
concentration will shift towards the atmosphere and this will lead to an even higher
atmospheric CO2 concentration that will further exacerbate the problem [4].
Taking the above mentioned facts into account, there is an urgent need to develop
strategies to harness and utilize alternative energy sources that are abundant and benign.
Among others [140], hydrogen as a distributed energy carrier is considered a possible near
term solution. It is interesting to note that, historically even the use of fossil fuels is trending
from carbon-rich towards hydrogen-rich fuels:
C (coal) –CH2– (oil) CH4 (natural gas)
There are a few additional reasons why hydrogen may become a synthetic fuel, or in
other words, an energy carrier, of the future [4, 5]. First of all, it is one of the most abundant
elements on Earth. Also, it has the highest energy density per unit mass (142 MJ·kg-1
) that is
nearly three times larger than traditional fossil fuels. And, perhaps the most significant
advantage of hydrogen is that the only by-product of its oxidation is environmentally benign
water. Nonetheless, hydrogen is not a primary energy source that can be mined, and hence
must be produced from water and other sources, e.g. biomass, that requires energy input.
Other issues, such as development of infrastructure for safe and efficient storage and
distribution of hydrogen must also be addressed.
Currently, hydrogen is mainly produced from either fossil fuels, or by reduction of the
organic materials, or by using electricity in the electrolysis of water. And, it should be

3
emphasized that the majority of these processes still emit carbon dioxide into the atmosphere,
unless solar, wind, hydroelectric, or nuclear energy is used to generate electricity, hence the
effects of global warming will not be diminished. Importantly, once produced, hydrogen as a
fuel is benign to nature, and generates only water as the combustion product.
Because the major focus of hydrogen applications has centered on the automobile
industry, another challenge in hydrogen economy is associated with storage and distribution
of hydrogen, which remains gaseous down to 20 K.
1.2 Hydrogen storage
The hydrogen-storage problem has sparked intense scientific interest in material
science communities during the past few decades, largely reflecting a wide variety of
techniques being pursued to reach the goal. As a result, three principle forms of hydrogen
storage have been established: (1) compressed gas, (2) cryogenic liquid, and (3) solid.
In 2003, the US Department of Energy (DOE) announced a $1.2-billion Hydrogen
Initiative to develop production and storage of hydrogen as a fuel for hydrogen powered
vehicles by the year 2020. Centers of Excellence were established in multidisciplinary areas,
which included partnerships among academia, industry, and national laboratories.
The targets set forth by the US DOE that an on-board hydrogen fuel source must meet
are presented in Table 1.1 [6]. In order to be competitive with current day gasoline powered
engines, a hydrogen powered vehicle must travel a distance of at least 300 miles before
refueling. Thus, major criteria for on-board hydrogen fuel are its gravimetric and volumetric
hydrogen capacity. Based on the current fuel-cell vehicle fleet baseline performance, the year

4
Table 1.1: US DOE Onboard hydrogen storage system targets.
Storage Parameter Units 2010 2020 Ultimate
System Gravimetric Capacity:
Usable, specific-energy from H2 (net useful
energy/max system mass)
kWh/kg
(kg H2/kg
system)
1.5
(0.045)
1.8
(0.055)
2.5
(0.075)
System Volumetric Capacity:
Usable energy density from H2 (net useful
energy/max system volume)
kWh/L
(kg H2/m3
system)
0.9
(28)
1.3
(40)
2.3
(70)
Storage System Cost
Fuel Cost
$/kWh net
($/kg H2 stored)
$/gge at pump
-
-
3–7
10
333
2–4
8
266
2–4
Durability/Operability:
Operating ambient temperature °C –30/50
(sun)
–40/60
(sun)
–40/60
(sun)
Min/max delivery temperature °C –40/85 –40/85 –40/85
Operational cycle life (1/4 tank to full) Cycles 1000 1500 1500
Min delivery pressure from storage system bar (abs) 5 5 3
Max delivery pressure from storage system bar (abs) - 12 12
Onboard Efficiency % - 90 90
“Well” to Powerplant Efficiency % - 60 60
Charging/discharging Rates:
System fill time (for 5 kg H2) min
(kg H2/min)
4.2
(1.2)
3.3
(1.5)
2.5
(2.0)
Environmental Health & Safety:
Permeation & leakage, toxicity, safety - Meets or exceeds applicable
standards
Loss of useable H2 (g/h)/kg H2 stored 0.1 0.05 0.05
Fuel Quality (H2 from storage) % H2 99.97% dry basis
5
2020 targets for gravimetric and volumetric capacities are 5.5 wt.% H and 40 kg H2/m3
respectively. However, these are system level targets, that take into account the weight of the
fuel-tank, distribution lines and other associated auxiliary equipment. Hence, an ideal
hydrogen-storage candidate material must possess 1.2–2 times the hydrogen capacity of the
system targets.
Other important parameters, particularly for material based storage, are desorption
temperature and kinetics of hydrogen discharge and uptake. The hydrogen should be released
at an appropriate temperature (preferably below 100 °C) and a significant but controlled rate
to provide performance comparable to gasoline vehicles. The optimal delivery temperature is
suggested to be 85 °C in order to use waste heat generated by proton exchange membrane
(PEM) fuel cells.
1.2.1 Gaseous hydrogen
The most common method to store hydrogen as a gas is in steel cylinders, which can
hold about 200 bar hydrogen on average. For storage at higher pressures (350–700 bar)
lightweight composite tanks type III and IV have been designed and manufactured: both
types of tanks are constructed from composite carbon fiber and laminate external wrap with
internal metal (aluminum, Cr-alloys) liner, and plastic (high molecular-weight polymer) liner
respectively [7]. A typical tank filled with hydrogen at 700 bar, reaches the gravimetric
storage capacity of ca. 6 wt.% and the volumetric storage density is around 30 kg H2/m3.
However there are imminent safety issues, such as a potential for a rapture or explosion of a
fully filled tank that may occur in an accident. Other disadvantages of storing hydrogen in
gaseous form include (1) a large physical volume of the tank in order to meet the driving
6
range targets, (2) a rigid cylindrical shape that makes it difficult to integrate storage into
available space, and (3) a high cost of production and maintenance of such specialized tanks
[8].
A novel method to store hydrogen as a gas at high pressures involves using hollow
glass microspheres (HGMs) [9]. This method is based on the large temperature dependence
of diffusivity of hydrogen through the glass: as temperature rises, hydrogen diffusivity
increases, allowing hydrogen gas to diffuse into the glass shells relatively quickly, then, at
room temperature, the diffusivity is reduced by several orders of magnitude, effectively
trapping hydrogen gas inside the HGMs until they are reheated for controlled hydrogen
release when needed. Due to their small diameters (10–300 μm) HGMs can effectively
withstand 1,500 bar of hydrogen pressure, with corresponding gravimetric capacity as high as
21 wt.% H. In addition to this, HGMs are non-explosive, relatively cheap and non-toxic.
Thus, in the future, HGMs may become a feasible alternative to high pressure hydrogen
cylinders. However, the significant drawback that hinders commercial application of HGMs
is the relatively high temperature required for filling and outgassing of hydrogen through the
glass walls. The current temperatures for hydrogen loading/unloading are usually above 300
°C, which significantly increases operating cost in automotive applications. Another
disadvantage is a high percent of breakage during routine use, which decreases the hydrogen
capacity.
1.2.2 Liquid hydrogen
The most common way to store hydrogen in a liquid state ( LH2) is to cool it down to
cryogenic temperatures (20 K, or –253 °C), which allows the volumetric density to increase

7
to 70.8 kg H2/m3 and gravimetric density to 10 wt.% H (taking mass of the tank into account)
[10]. However, it is important to note that about 30–40% of energy stored in LH2 has to be
invested in producing LH2 [11]. Other disadvantages include: a high boil-off rate (currently
~1 %/day) and a high cost and complexity of super-insulated cryogenic containers.
Alternative options include storing hydrogen as a constituent in other liquids such as
rechargeable organic liquids and water solutions of hydrides.
The basic concept of hydrogen storage in a liquid form using organic compounds can
be summarized in the following three steps: (1) organic liquid is dehydrogenated onboard, (2)
the spent products are transported to central processing plant where they are rehydrogenated,
and (3) the fresh hydrogen-rich liquid is pumped back into the tank. One example of a
rechargeable organic liquid is hydrogenation and dehydrogenation of toluene (C7H8) and
methylcyclohexane (C7H14), respectively:
C7H14 (l) ↔ C7H8 (l) + 3H2 (g) (Td = 300–400 °C)
This reaction affords a gravimetric and volumetric hydrogen energy storage density of 6.1
wt.% H and 43 kg H2/m3, respectively. However, there are a few disadvantages, not only
associated with a high desorption temperature, but also with toxicity and flammability.
Another potential alternative for hydrogen storage as liquids are the slurries/water
solutions of hydrides. One such example is catalytic hydrolysis of sodium borohydride
(NaBH4) in water shown as follows [12, 13]:
NaBH4 + 2H2O NaBO2 + 4H2

8
This system possesses high hydrogen content (7.5 wt.% H in 35 wt.% NaBH4 water
solution), stability of the solution and controllable hydrolysis rate. However, the drawback is
that the reaction product NaBO2 must be regenerated back to NaBH4, which currently is quite
an expensive process.
Another example of a water based solution of complex hydride that was extensively
investigated is ammonia borane (NH3BH3) [14, 15]. The reason for high interest in this
system is mainly because NH3BH3 is stable in neutral water and can be stored at room
temperature for a long time. In addition, it also produces a large amount of hydrogen (8.96
wt.% H) at a fast rate using a suitable catalyst according to the following equation:
NH3BH3 + 2H2O NH4BO2 + 3H2
However, like in previous case, regeneration of spent ammonia borane remains an expensive
proposition.
1.2.3 Solid hydrogen
In-spite of lack in major breakthrough in the past decade, storing hydrogen in a solid
material has the greatest potential to become a safe, environmentally benign and efficient
way to store energy. There are fundamentally two major groups of suitable materials for this
purpose: (1) based on physisorption of molecular hydrogen (e.g. Metal Organic Frameworks,
zeolites and carbon-based materials) and (2) based on chemisorption of hydrogen via metal-
hydrogen bond formation (e.g. simple and complex metal hydrides and chemical hydrides).
9
1.2.3.1 Hydrogen storage materials based on physisorption of molecular hydrogen
The origin of hydrogen physisorption comes from attractive dispersion forces called
London interactions (4–10 kJ/mol) [16]. The interaction being relatively weak, physisorption
is observed in significant amounts only at cryogenic temperatures. At higher temperatures
(more than critical temperature of hydrogen 33.25 K) physisorption results in a formation of
a monolayer on the adsorbent surface [17]. Hence, the amount of hydrogen is typically
proportional to the sorbent’s surface area (Chahine’s rule). That is why porous lightweight
materials with high surface area are most attractive for physical hydrogen storage at
cryogenic temperatures. Based on their structures and composition there are three groups of
such materials: (1) carbon-based materials, (2) metal-organic frameworks and (3) zeolites.
Carbon-based materials, such as carbon nanotubes, have received a lot of attention in
1990s mainly because initial studies reported high hydrogen capacities up to 10 wt.% H at
ambient conditions [18, 19]. Unfortunately, the reproduction of these results by other groups
failed. Instead, uptake capacities of only 1 wt.% H were achieved at 80 bar and 25 °C in later
studies [20]. Züttel et al. investigated over 60 different nanostructured carbon samples,
including single and multiwall nanotubes, and depending on the specific surface area of
carbon materials, the reversible storage capacity at room temperature ranged from 0.04–0.46
wt.% H [21]. Besides, the projected maximum discharge capacity of a carbon sample was
determined to be 2 wt.% H, which is far below the DOE targets. The only possible strategy to
increase the hydrogen uptake is either to decrease the adsorption temperature to about 80 K
and/or to increase hydrogen pressure.
10
Metal-organic frameworks (MOFs) are another promising class of hydrogen storage
material, mainly because of their high microporosity and very high specific surface areas. In
these materials, inorganic building blocks (metal ions or clusters) are connected via organic
linkers to form 3D network. One of the most prominent members (MOF-177 with a structure
consisting of zinc acetate units linked by 1,3,5-benzenetribenzoate) possesses 7.5 wt.%
hydrogen capacity at 70 bar and 77 K [22]. It should be noted that not only does the surface
area and nature of organic linkers/inorganic units influence the storage capacity of MOFs, but
the micropores size and shape also play an important role [23]. Doping with small quantities
of hydrogen dissociation catalysts (Pd or Pt), along with a carbon-based bridging, helped to
create a “spillover” of atomic hydrogen into the sorbent which gave the possibility to
reversibly store up to 4 wt.% H at 100 bar and room temperature [24]. However, there are
still a few drawbacks: MOFs so far don’t meet all of the DOE targets, in addition they are
very sensitive to moisture and quite expensive to synthesize [25].
Other high-surface materials that show some potential for hydrogen storage are
zeolites. Their crystal structure is defined by channels and interconnected cavities, which
form a pore system large enough for diffusion of hydrogen molecules. The uptake of
hydrogen is below 0.5 wt.% at ambient conditions, and below 2 wt.% at elevated pressures
and 77 K. However, the geometric constraints, such as available volume and framework
flexibility, restrict the hydrogen storage capacities of zeolites to 2.86 wt.% H, which makes
them unfavorable hydrogen storage materials [26].
11
1.2.3.2 Hydrogen storage materials based on hydrogen bond formation
Chemical bonding with hydrogen can range from very covalent to very ionic as well
as multi-centered and metallic bonding. Various hydrides are currently being studied for
hydrogen storage applications in batteries and fuel cell-powered electric cars. These materials
can be classified into three main categories according to the type of bonding: (1) simple
hydrides, (2) intermetallic hydrides and (3) complex hydrides.
1.2.3.2.1 Simple hydrides
Simple hydrides include both ionic (e.g. LiH) and covalent (e.g. AlH3) character in
the Me-H bonding. However, for hydrogen storage applications only hydrides with low
decomposition temperatures and high capacities are attractive, and hence aluminum and
magnesium hydrides are the most investigated examples.
1.2.3.2.1.1 Aluminum hydride
Aluminum hydride, AlH3 (alane), is considered to be one of the perspective hydrogen
storage materials mainly because of its high gravimetric and volumetric hydrogen capacity of
10.1 wt.% and 148 kg/m3, respectively [27]. Alane also exhibits low heat of reaction
(~7 kJ/mol H2) and possesses quite low desorption temperature (<100 °C), which would
enable the use of waste heat of a PEM fuel cells to trigger the hydrogen release. In addition,
alane decomposes into elemental aluminum and hydrogen in a single step with no side
reactions.
Previous studies have shown that alane exists in seven different polymorphs, which
were identified as α, α′, β, γ, δ, ε and ζ [28]. Among them the most intensively studied are the
12
α, α′, β and γ forms, mainly because other polymorphs (δ, ε and ζ) have not been isolated in
pure forms, and no reproducible synthesis methods have been established. Although alane
decomposes cleanly to the elements, only the α polymorph does so in one step process, while
β and γ polymorphs first transform into α-AlH3, and only then decompose into the elements.
In general, the decomposition studies of alane demonstrate that alane is a promising
hydrogen storage material, as it is safe and desorbs hydrogen at temperatures low enough to
satisfy the requirements for PEM fuel cells. The main problem that is being intensively
investigated is the possibility to regenerate AlH3 from elemental aluminum by its direct
reaction with gaseous hydrogen at reasonable temperature and pressure, thus making the
dehydrogenation process reversible.
1.2.3.2.1.2 Magnesium hydride
Magnesium hydride, MgH2, is considered as another feasible option for reversible
storage of hydrogen, mostly due to its high gravimetric storage capacity of 7.6 wt.% H, good
reversibility, low-cost and abundantly available magnesium [29].
Almost 50 years ago, first by Stampfer et al. [30] and then by Kennelly et al. [31] and
Vigeholm et al. [32, 33], hydrogen-absorption/desorption studies of magnesium were
conducted. In general, it was concluded that to completely convert Mg into MgH2 the
absorption temperature has to be higher than 400 °C and the hydrogen pressure of 20–25 bar
is needed. The complete decomposition also required high temperatures above 390 °C and
hydrogen pressure below 1 bar. More recently, a few other groups, including Bogdanović et
al. [34], carried out detailed thermodynamics studies. Several promising methods have been
developed in order to overcome high absorption/desorption temperatures and sluggish

13
rehydrogenation kinetics: among these reducing the particle size by means of ball milling and
doping/alloying magnesium with catalysts has yielded most promising results. Nevertheless,
magnesium hydride still does not meet DOE requirements for on-board hydrogen storage
material.
1.2.3.2.2 Intermetallic hydrides
Intermetallic hydrides are characterized by a homogenous composition of metal
components and well-defined crystal structure. A prototype intermetallic hydride is
composed of two elements: a strong hydriding element A combined with a weak hydriding
element B to create a compound with the desired intermediate thermodynamic affinity for
hydrogen. The A element is usually a rare-earth or an alkaline earth metal, while the B
element is often a transition metal. Some of intermetallic hydrides of interest for hydrogen
storage are listed in Table 1.2 [4].
Table 1.2: The most important families of hydride-forming intermetallic compounds.
Most of intermetallic hydrides absorb and desorb hydrogen at ambient temperatures
and near the atmospheric pressure, and their volumetric density is extremely high. However,
Intermetallic compound Prototype Hydrides
AB5
AB2
AB3
A2B7
A6B23
AB
A2B
LaNi5
ZrV2, ZrMn2, TiMn2
CeNi3, YFe3
Y2Ni7, Th2Fe7
Y6Fe23
TiFe
Mg2Ni, Ti2Ni
LaNi5H6
ZrV2H5.5
CeNi3H4
Y2Ni7H3
Ho6Fe23H12
TiFeH2
Mg2NiH4
14
because many consist of heavy metals, the gravimetric hydrogen capacity is limited to less
than 3 wt.% H [17].
The most investigated member of this family of hydrides is the LaNi5, which shows
excellent cycle life, kinetics and low desorption temperatures [35]. Again, the main drawback
is the low gravimetric hydrogen capacity of 1.4 wt.% H, and hence such hydrides are
currently not being considered for automotive applications.
1.2.3.2.3 Complex hydrides
The term “complex hydride” is generally applied to hydrides composed of an anionic
metal-hydrogen complex or nonmetal-hydrogen complex bonded to cationic metal [36]. In
the past 10 years complex hydrides have become a hot topic of research, mainly because of
their very high gravimetric and volumetric hydrogen capacities combined with relatively low
desorption temperature range. There are three major groups of complex hydrides: (1)
alanates, (2) borohydrides and (3) amides.
1.2.3.2.3.1 Alanates
Alanates (complex aluminum hydrides) became one of the first extensively
researched complex hydrides after Bogdanović et al. showed that dehydrogenation of
NaAlH4 can be reversed upon doping with titanium [37,38]. Since then, lithium and sodium
alanates (LiAlH4 and NaAlH4) have received most attention, due to their modest
decomposition temperatures and remarkable reversibility (in case of NaAlH4).
LiAlH4 was first prepared from the exchange reaction between LiH and AlCl3 [39].
Later, salt metathesis reaction between NaAlH4 and LiCl in diethyl ether (Et2O) was utilized

15
[40]. Synthesis of NaAlH4 can be accomplished even from elements under high hydrogen
pressure and temperature [41]. Another direct synthesis method is ball milling NaH-Al
mixtures under moderate hydrogen pressure in conjunction with a doping agent TiCl3 [42].
Most of the complex aluminum hydrides decompose in a three-step process through a
metastable intermediate product as shown for decomposition of LiAlH4 [43]:
3LiAlH4 → Li3AlH6 + 2Al + 3H2
Li3AlH6 → 3LiH + Al + 1.5H2
3LiH → 3Li + 1.5H2
For LiAlH4 first two steps have low enough desorption temperature to be applicable.
In case of NaAlH4 only the first step of the decomposition can be used. However, this
reduces the usable hydrogen content to 7.9 and 3.7 wt.% H for LiAlH4 and NaAlH4
respectively.
1.2.3.2.3.2 Borohydrides
Complex borohydrides became the next group of hydrogen storage materials that
received considerable attention within science community. The main motivation was the
extremely high hydrogen contents, e.g. lithium borohydride (LiBH4) contains 18.5 wt.% H
[44]. However, most of borohydrides show unfavorable thermodynamic properties that
negatively affect the reversibility, kinetics and desorption temperatures. Unfortunately, they
are probably the most difficult of all complex hydrides for implementing modifications that
could bring their hydrogen storage properties closer to the established requirements.
16
One of the outstanding members of this group is considered to be magnesium
borohydride (Mg(BH4)2) mainly because of its moderate desorption temperature and no
diborane release.
1.2.3.2.3.3 Amides/imides
Another interesting complex hydrides group are amides and imides, especially the
light-weight Li-N-H system containing lithium amide/imide and lithium hydride which has
the theoretical capacity of more than 10 wt.% H [45]:
Li3N + 2H2 ↔ Li2NH + LiH + H2 ↔ LiNH2 + 2LiH
In practice, 9.3 wt.% H can be obtained at moderate temperatures up to 250 °C,
however the equilibrium pressure of this material is too low for this temperature range.
Lately, it has been shown that the composition of the mixture can be varied over a wide range
of elements and weight percentage of components, which gives quite promising prospects for
future research.
17
2. EXPERIMENTAL PROCEDURES
2.1 Sample preparation
All starting materials were purchased from commercial suppliers and used without
further purification. Due to the oxygen and water vapor sensitivity of both reactants and
products, all manipulations were carried out under continuously purified and monitored
atmosphere in a glove box filled with ultra-high purity argon. It was ensured that O2 and H2O
concentrations in the box stayed below 5 ppm, with typical readings being below 1 ppm. As
and when required, samples were stored at –35°C in a glove box freezer.
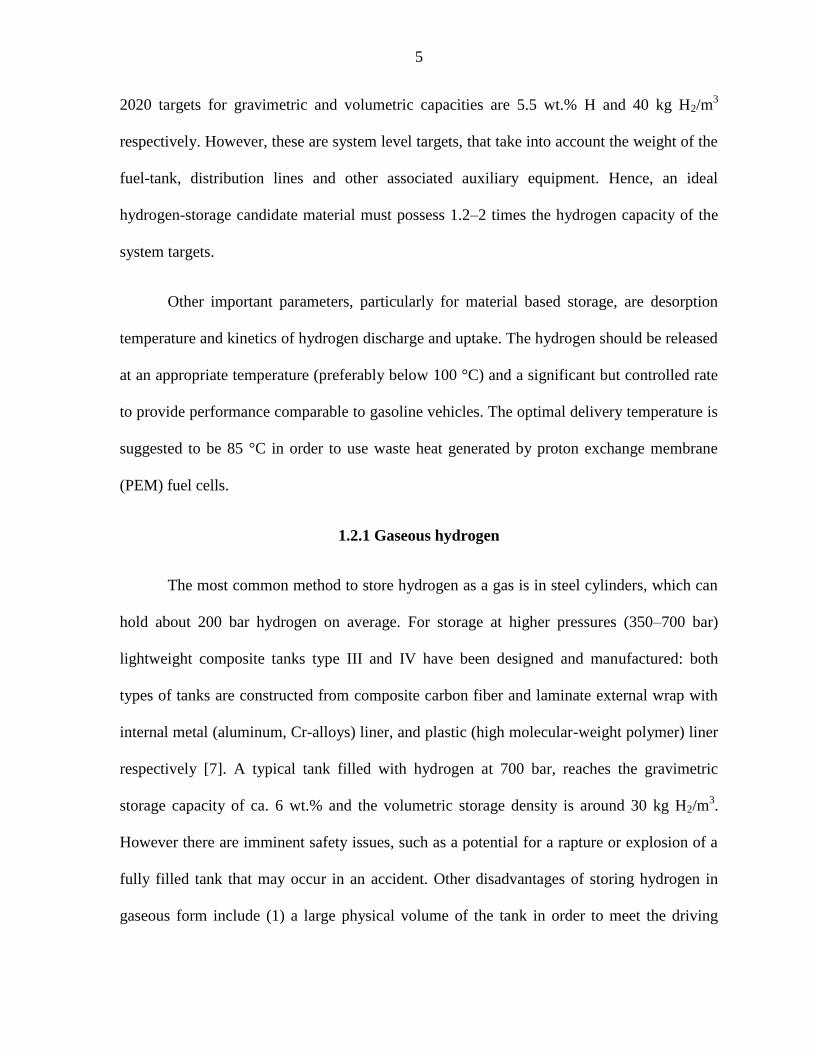
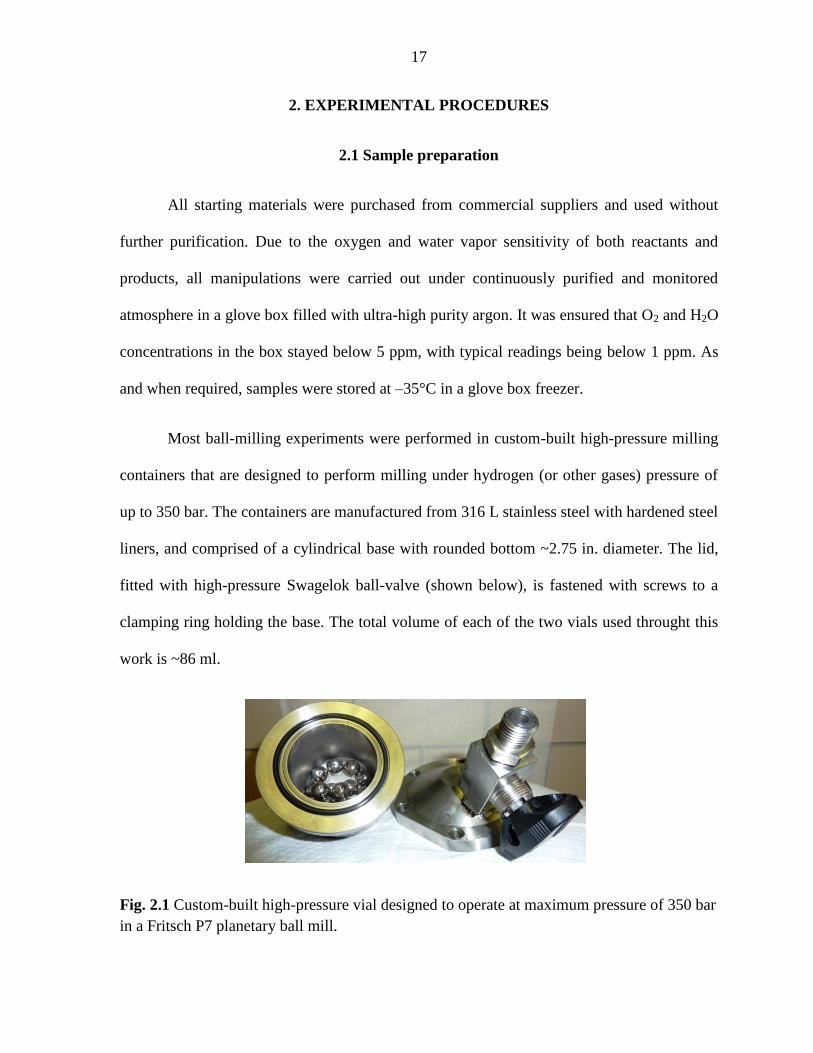
Most ball-milling experiments were performed in custom-built high-pressure milling
containers that are designed to perform milling under hydrogen (or other gases) pressure of
up to 350 bar. The containers are manufactured from 316 L stainless steel with hardened steel
liners, and comprised of a cylindrical base with rounded bottom ~2.75 in. diameter. The lid,
fitted with high-pressure Swagelok ball-valve (shown below), is fastened with screws to a
clamping ring holding the base. The total volume of each of the two vials used throught this
work is ~86 ml.
Fig. 2.1 Custom-built high-pressure vial designed to operate at maximum pressure of 350 bar
in a Fritsch P7 planetary ball mill.
18
In a typical milling experiment using the Fritsch mill, containers are filled with 20–25
stainless-steel balls (~1/3rd
of the vial volume) along with the mixture to be milled. With this
configuration, the ball to powder ratio is usually between 120:1 and 160:1. As per the
requirement of a particular experiment, the ball to powder ratio can be varied along with
other milling parameters such as milling time and rotation speed. The exact experimental
conditions are described in details in individual sections.
2.2 Sample characterization
The chemical and physical characterization of as-synthesized samples was performed
using both the powder X-ray diffraction (XRD) and solid-state nuclear magnetic resonance
(NMR) techniques. The hydrogen desorption and uptake was studied using a commercially
built fully automated Sievert’s type apparatus.
2.2.1 Powder XRD
The powder XRD data obtained from the products of the solid-state reactions were
collected at room temperature using Cu Kα1 radiation on a PANalytical X’pert Pro
diffractometer with a 0.02° step in the 2θ range of 10–80°. During measurements, a
polyimide (Kapton) film was used to protect the samples from air. The use of film resulted in
an amorphous like background in the XRD patterns in the 2θ range of 13–20°.
2.2.2 Solid-state NMR
The 11
B and 27
Al solid-state NMR experiments were performed at 9.4 T on a
Chemagnetics Infinity 400 spectrometers, equipped with a 3.2 mm magic angle spinning
(MAS) probes and operated at 400.0 MHz for 1H, 128.4 MHz for
11B and 104.3 MHz for
19
27Al. The samples were packed in MAS zirconia rotors in a glove box under argon
atmosphere and sealed with a double O-ring cap to minimize the possibility of oxygen and
moisture contamination. The NMR spectra were acquired using a single pulse excitation, the
radio frequency magnetic field of approximately 120 kHz for 11
B and 27
Al, a small flip angle
of 15 for quantitative accuracy [46], and 1H TPPM decoupling [47] during acquisition.
2.2.3 Volumetric Analysis
The thermal decomposition behavior and hydrogen capacity of the synthesized
samples were studied in a Sieverts-type apparatus (PCTPro-2000 system manufactured by
Hy Energy LLC, now marketed and supported by Setaram). In a typical experiment,
powdered samples were pressed into ~6 mm diameter pellets (~0.15 g) and placed into a
PCTPro autoclave inside the glove box. The autoclave was then sealed and transferred to the
apparatus. After the initial evacuation, volume calibration was performed at room
temperature prior to each measurement. During the thermal decomposition of the samples,
pressure was continuously monitored while heating the sample from room temperature to the
desired temperature at the rate of 4–5 °C per minute. The qualitative analysis of gases
released during the measurement was carried out using the Residual Gas Analyzer (RGA,
RGAPro-2500, Hy-Energy LLC), connected to the PCTPro autoclave.
20
CHAPTER 3. MECHANOCHEMICAL SYNTHESIS OF
MAGNESIUM BOROHYDRIDE
3.1 Introduction
Magnesium borohydride, Mg(BH4)2, which possesses high hydrogen density and
favorable thermodynamics, attracts great interest as a promising hydrogen storage material
[48]. Its complete dehydrogenation yields total of 14.8 wt.% H and proceeds through
multiple competing processes leading to the formation of MgB2 [49]. Hence, achieving
rehydrogenation of MgB2 becomes essential for reversible hydrogen storage in Mg(BH4)2.
Rehydrogenation was partially achieved by coupling mechanochemical processing
with subsequent thermal hydrogenation at high temperature and pressure. Severa et al. was
able obtain up to ~75% yield of Mg(BH4)2 by heating pre-ball-milled MgB2 to 400 °C under
950 bar H2 for 104 h [50]. Another attempt was done by Li et al. which tried to ball mill
MgB2 under 10 bar H2 for 10 h followed by isothermal hydrogenation at 400 °C and 400 bar
H2 for 24h with a total Mg(BH4)2 yield of 25% [51]. The hydrogenation of MgB2 solely by
mechanochemical processing was done by Pistidda et al. at room temperature and 100 bar for
100h with 50% yield of Mg(BH4)2 [52]. Here, we examine the hydrogenation of MgB2 solely
by mechanochemical processing, attempt to increase the yield of Mg(BH4)2 by varying
milling conditions, and investigate the hydrogenation pathways using temperature-
programmed desorption, powder XRD and solid-state NMR analysis.
3.2 Results and discussion
Using high-pressure ball milling we demonstrated the direct synthesis Mg(BH4)2
starting from MgB2. Dependence of product yield from milling parameters (milling time τBM,
21
hydrogen pressure pH, ball-to-sample mass ratio B/S) as well as hydrogenation pathways was
investigated.
Because MgB2 has the hexagonal graphite-like structure of boron sheets separated by
closely packed layers of Mg atoms [53], it was anticipated that high-energy ball milling will
break the structure down, generating defects, dislocations, and new grain boundaries, thus
forming trapping sites for hydrogen and creating dangling bonds which will augment the
formation of B-H and Mg-H bonds leading to the formation of Mg(BH4)2 as a final product.
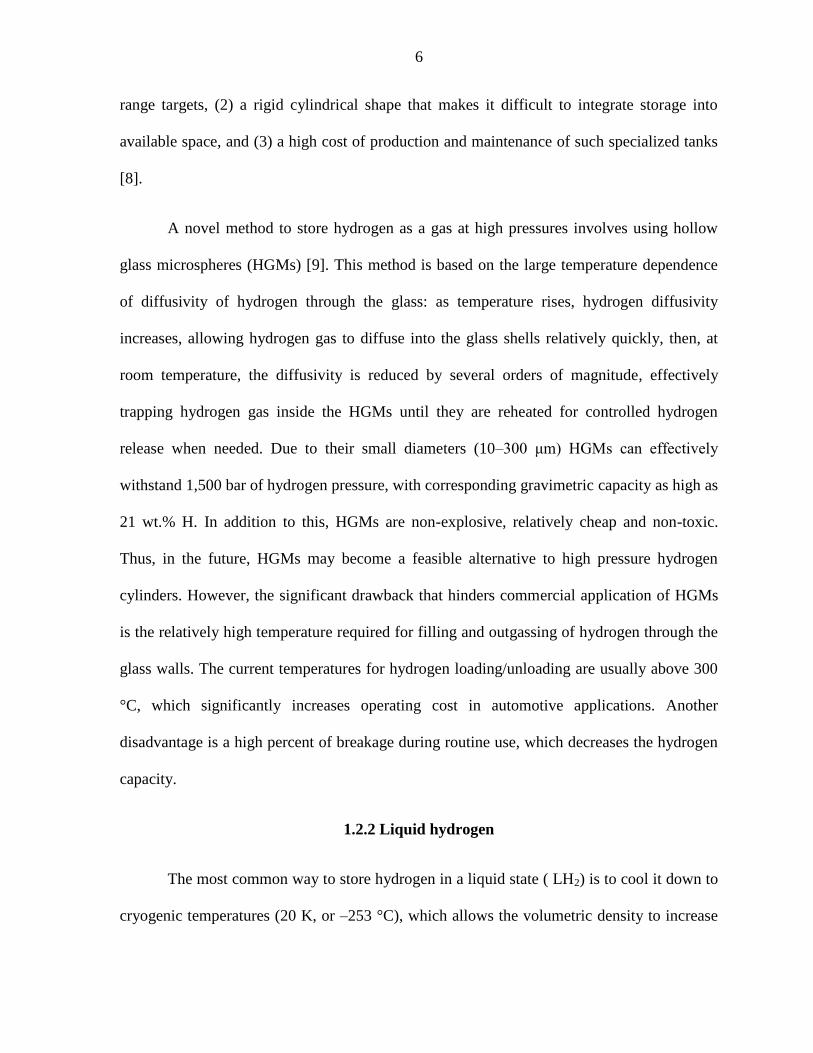
In the 11
B direct polarization magic-angle spinning (DPMAS) spectra (Fig. 3.1), the
signal corresponding to Mg(BH4)2 appears at early stages of processing, further increasing
with increment of milling time and pressure, while simultaneously the decline of MgB2
signal is observed. A low-intensity broad resonance centered around –4 ppm, which, is
coming from an intermediate, as described below.
Fig. 3.1 11
B DPMAS spectra of MgB2 hydrogenated in ball mill using: (a) pH = 350 bar and
τBM = 3.5, 7, 15 and 30 h; and (b) τBM = 15 h and pH = 50, 100, 150, 250 and 350 bar. B/S =
160. Asterisks represent spinning sidebands. The spectra are normalized to a constant height.
22
Figure 3.2 shows the 11
B DPMAS spectra of samples processed at different ball-to-sample
mass ratios. Notably, larger B/S ratios having higher milling energies increase the Mg(BH4)2
yield. For B/S = 40 and 80, the broad resonance centered at –4 ppm appears stronger than
that of Mg(BH4)2, further declining with increasing B/S ratio. Additionally, the presence of
intermediate is confirmed by the 11
B{1H} cross-polarization (CP) MAS NMR (Fig. 3.2
dotted line), however the signal is shifted to around –15 ppm, which suggests that it results
from group of various complex anion intermediates, described as [BxHy]n–
[54]. In particular,
a large contribution can be assigned to [B12H12]2–
species [55]. The formation of polyhedral
borane anions suggests that some of the B-B bonds present in MgB2 are retained, and new
ones are created as well.
Fig. 3.2 11
B DPMAS (solid) and 11
B{1H} CPMAS (dotted) spectra of MgB2 hydrogenated in
ball mill using pH = 350 bar, τBM = 7 h and B/S = 40, 80 and 160. Asterisks represent
spinning sidebands. The spectra are normalized to a constant height.
The hydrogen capacity of the samples increases up to 3.1 wt.% with milling time,
reaching the plateau of 3.9 wt.% of H2 at τBM = 45 h (Fig. 3.3a). Similarly, it increases with
hydrogen pressure, before leveling of at pH = 300 bar (Fig. 3.3b). The hydrogen desorption

23
from the sample ball-milled under 350 bar of H2 for 15 h (Fig. 3.3c) shows the two step
dehydrogenation, with peaks observed at 300 and 355 °C.
Fig. 3.3 Thermal dehydrogenation of mechanochemically hydrogenated MgB2 measured by
temperature programmed desorption. (a) H2 desorption from samples hydrogenated for
variable τBM (pH = 350 bar). (b) H2 desorption from samples ball-milled at variable pH (τBM =
15 h). (c) H2 desorption curves for the sample ball-milled at pH = 350 bar for 15 h with B/S =
160.
After dehydrogenation at 300 °C, the sample shows a significantly increased
concentration of MgB2 and a diminished Mg(BH4)2, accompanied by the appearance of
[BxHy]n–
anions (including [B12H12]2–
) (compare Fig 3.4a and 3.1a, τBM = 15 h). Further
treatment at 390 °C results in a complete conversion of Mg(BH4)2 to dehydrogenated
products (as evidenced by the lack of 11
B{1H} CPMAS signal in Fig. 3.4b), with MgB2 being
the major product. The minor signal centered at 6 ppm (Fig. 3.4b) is characteristic of
amorphous boron [56]. Apart from MgB2, the XRD analyses reveal the formation of MgH2
and Mg in the samples dehydrogenated at 300 and 390 °C, respectively (Fig. 3.4d and e).
These results suggest the following dehydrogenation pathways in Mg(BH4)2 synthesized by
reactive ball milling:
Mg(BH4)2 → MgB2 + 4H2 (3.1)
Mg(BH4)2 → MgB12H12 + MgH2 + H2 (3.2a)

24
MgB12H12 → Mg (MgH2) + 12B + 6H2 (5H2) (3.2b)
MgH2 → Mg + H2 (3.2c)
The hydrogen desorption at around 300 °C (Fig. 3.3c) is attributed to Eq. (3.1) and
(3.2a), while the desorption at around 355 °C is described by Eq. (3.2b) and (3.2c).
Fig. 3.4 Dehydrogenation and subsequent rehydrogenation: (a–c) 11
B DPMAS (solid) and
CPMAS (dotted) spectra and (d, e) XRD patterns of samples (a, d) dehydrogenated at 300
°C, (b, e) dehydrogenated at 390 °C, and (c) rehydrogenated. The hydrogenation and
rehydrogenation were carried out at room temperature using pH = 350 bar, τBM = 15 h and
B/S = 160. Asterisks represent spinning sidebands. The spectra are normalized to a constant
height.
After desorption the product was again hydrogenated by ball milling at pH = 350 bar,
τBM = 15 h and B/S = 160. The 11
B DPMAS spectrum of the obtained sample (Fig. 3.4c)
indicates that most of MgB2 and polyhedral boron species were transformed back to
Mg(BH4)2. Compared to the first desorption, nearly 90% of the hydrogen capacity was
recovered after the second mechanochemical hydrogenation cycle. The 10% loss of storage
capacity may be attributed to the formation of elemental boron that remains unreacted in the

25
rehydrogenated product, and in part to the additional iron impurity introduced upon
successive milling. Further cycling experiments have not been performed due to the
difficulties in collecting the dehydrogenated product in quantities sufficient for adequate
milling.
3.3 Conclusions
We have demonstrated purely mechanochemical rehydrogenation of MgB2 to
Mg(BH4)2 by high-energy reactive ball milling under moderate hydrogen pressures.
Dependence of product yield from milling parameters (milling time τBM, hydrogen pressure
pH, ball-to-sample mass ratio B/S) as well as hydrogenation pathways was investigated.
The maximum hydrogen capacity of samples prepared under 350 bar H2 pressure
reached ~4wt% H at 390 °C. The solid-state NMR revealed the formation of Mg(BH4)2 as the
final product through [BxHy]n–
intermediates, in particular, large contribution was assigned to
[B12H12]2–
species. Subsequent thermal dehydrogenation resulted in complete decomposition
of synthesized products and recovery of MgB2 below 390 °C. Obtained product could be
rehydrogenated up to nearly 90% of the initial capacity.
26
CHAPTER 4. MECHANOCHEMICAL SYNTHESIS OF ALANE FROM
LITHIUM HYDRIDE AND ALUMINUM CHLORIDE
4.1 Introduction
Aluminum hydride, AlH3 (alane), is considered to be one of the prospective
hydrogen-storage materials mainly because of its high gravimetric and volumetric hydrogen
capacity of 10.1 wt.% and 148 g/l, respectively [27]. Both of these parameters exceed the US
Department of Energy (DOE) system targets of 5.5 wt.% and 40 g/l to be achieved by 2020
[6]. In addition, alane exhibits low heat of reaction (7 kJ/mol H2), decomposes into elemental
aluminum and hydrogen with no side reactions and possesses a quite favorable desorption
temperature (<100°C), which opens the way to use of exhaust heat of PEM fuel cells to
trigger the hydrogen release. However, despite all its benefits and advantages alane has not
become widely utilized as hydrogen-storage material primarily due to the difficulties with its
bulk production. Hence, the major problem now intensively investigated is the development
of simple straightforward method to synthesize AlH3.
One of the earliest published reports on the synthesis of alane appeared in 1942,
however the product yield was poor and AlH3 was in an amine complex [27]. Later Finholt et
al. prepared ethereal solution of AlH3 by exchange reaction between LiH and AlCl3 [39]. A
non-solvated form of alane was initially prepared by Chizinsky et al. [60] and subsequently
by Brower et al. [28] via organometallic route at the Dow Chemical Company. It was also
discovered that AlH3 could be synthesized from the hydrides or tetrahydroaluminates of
alkali and alkaline earth metals via wet chemical processes [61–64], which usually involve
the formation of alane-ether complexes, such as those shown below [39]:
27
3LiH + AlCl3 + nEt2O → AlH3·nEt2O + 3LiCl
3LiAlH4 + AlCl3 + nEt2O → 4AlH3·nEt2O + 3LiCl
However, it should be noted that the wet chemical processes are very sensitive to both
temperature and time and large-scale production via these methods is difficult to implement.
On the other hand, mechanochemical solid-state synthesis methods that have been performed
previously [65–68] show promising results and can be much easier utilized for mass
production.
Presently, a range of AlH3 organic adducts have been found to be reversible under
mild hydrogen pressures [69]. And in the past few years several novel techniques have been
applied to synthesize alane, including electrochemical charging [70] and supercritical fluid
hydrogenation [71]. The formation of AlH3 has also been undertaken in solid state using
extreme hydrogen pressures (~2.5 GPa) [72]. As well there have been attempts to synthesize
alane in a ball mill [65, 66] – the synthesis was carried out through metathesis reaction
between LiAlH4 and AlCl3 in molar ratio of 3:1. The reaction was mechanically initiated and
progressed only at cryogenic temperature as follows:
3LiAlH4 + AlCl3 → 4AlH3 + 3LiCl
It was concluded that room-temperature synthesis was inefficient due to the high milling
energies that, at room temperature, caused decomposition of AlH3 to metallic aluminum and
hydrogen, hence, the yields of desired product were insignificant. Another attempt [68] to
synthesize alane in a ball mill at room temperature starting from LiH or LiAlH4 and AlCl3 in
stoichiometric ratio was performed at low hydrogen pressure and confirmed the formation of
small quantities of AlH3 at room temperature.
28
Here, we have developed a simple mechanochemical approach to synthesize alane via
solid-state metathesis reaction between LiH and AlCl3 mechanochemically under moderate
conditions.
4.2 Results and discussion
Using high-pressure ball milling we synthesized alane from commercially available
LiH and AlCl3. Dependence of product yield from milling time, energy and stoichiometry of
starting reactants was investigated. The samples were prepared by high-pressure ball milling
in Fritsch Pulverisette P7 planetary micro mill at 300 rpm and 350 bar of hydrogen pressure.
The composition of obtained samples was determined by means of powder XRD and solid-
state NMR. The weight capacity of hydrogen was examined by desorption test in a Sieverts-
type apparatus.
To optimize the synthetic conditions we have analyzed single-step reactions for
different LiH:AlCl3 ratios (3:1, 4:1, 6:1, 9:1 and 12:1) with hydrogen pressures between
1 and 350 bar. The lowest LiH:AlCl3 ratio that did not result in accumulation of metallic
Al (9:1) was then used to produce a series of samples for detailed spectroscopic
examination and subsequent mechanochemical processing with additional AlCl3 to yield
AlH3 and LiCl as final products.
4.2.1 Determination of the initial reaction conditions
Based on the reported ethereal reaction between LiH and AlCl3 [39], a 3:1 molar
mixture of LiH and AlCl3 was prepared and processed mechanochemically under dry
conditions (i.e., in the absence of diethyl ether). After 48 min of processing at 300 rpm

29
under 350 bar of H2 pressure only metallic Al and LiCl were obtained as major products.
The XRD pattern for corresponding reaction is shown in Fig. 4.1a.
We next hypothesized that the presence of a larger excess of hydride source in the
starting mixture may prevent the formation of unstable intermediates that decompose to
metallic Al. Indeed, when an arbitrarily chosen reaction mixture containing LiH and
AlCl3 in a molar ratio of 12:1 is processed under the same high hydrogen pressure, the
reaction proceeds without the formation of metallic Al (Fig. 4.1d). Instead, lithium
aluminum hexahydride (Li3AlH6), LiCl and unreacted LiH were obtained as the major
products (BM = 48–60 min). Encouraged by these results, we set out to systematically
explore the optimal composition of the starting mixture, and determined it to be
9LiH:1AlCl3 under the milling parameters used (Fig. 4.1c). All reactions carried out
using LiH content less than this optimum resulted in metallic Al along with unreacted
LiH, as shown in Fig. 4.1b for the starting mixture of 6:1.
Fig. 4.1 X-ray diffraction patterns corresponding to as-milled samples with LiH:AlCl3
starting ratios of a) 3:1, b) 6:1, c) 9:1, and d) 12:1 after ball milling for 48 min under 350 bar
H2 with a milling speed of 300 rpm and a B/S of ~140.
30
4.2.2 The 9:1 reaction of LiH and AlCl3
To investigate further the results observed at the starting ratio of 9:1, the reaction
mixture was sampled as a function of ball-milling time and the resulting products and
intermediates were analyzed by powder XRD in Fig. 4.2 (left panel) and solid-state NMR
(right panel) – both of which provided clear and consistent mechanistic insight into the
progression of the 9:1 reaction, as discussed below.
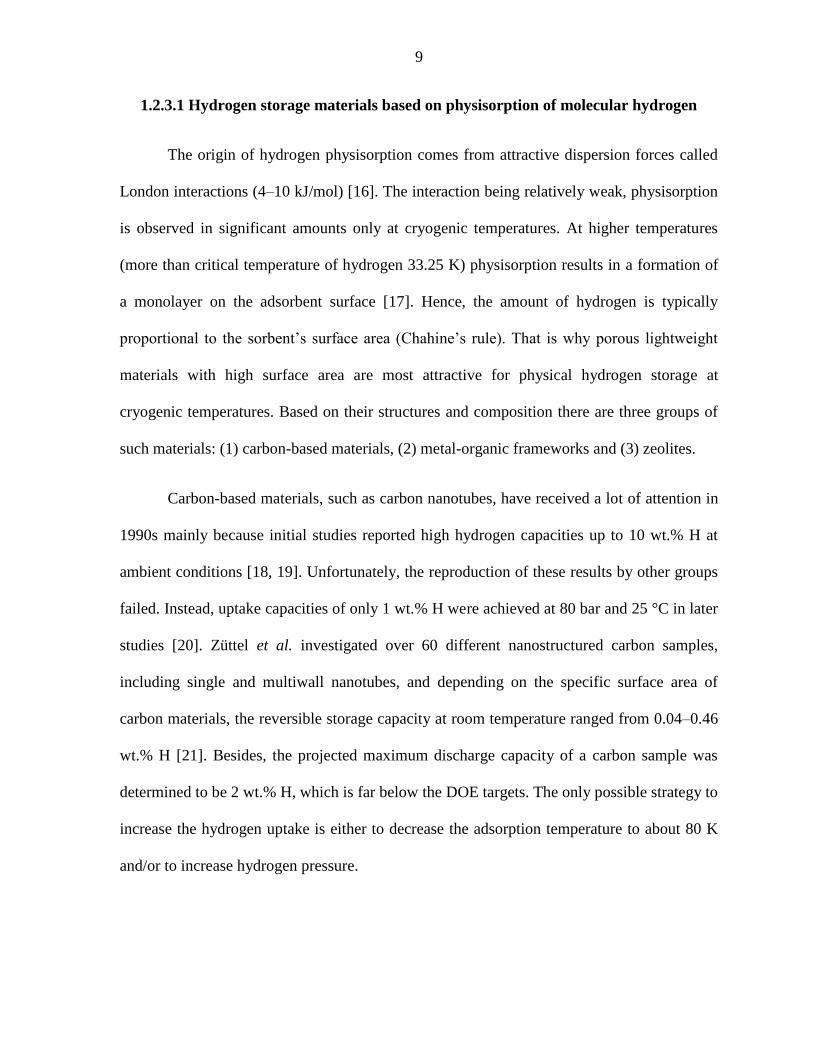
According to the XRD data obtained for BM = 16 min (pattern a), there exist three
sets of Bragg peaks, including those from the reaction products, LiCl (the most intense
peaks are at 2θ ≈ 30, 35, and 50°) [73]
and the monoclinic LiAlCl4
(two sets of clearly
identifiable Bragg peaks are at 2θ ≈ 15–20° and 27–32°) [74, 75], as well as the unreacted
LiH (2θ ≈ 38 and 44°) [76].
Fig. 4.2 X-ray diffraction patterns (a-c) and solid-state NMR (27
Al DPMAS and 27
Al{1H}
CPMAS) spectra (d-e) obtained for samples of the 9:1 LiH:AlCl3 reaction mass after ball
milling for the indicated time under 350 bar H2 with a milling speed of 300 rpm and a B/S of
~140. Note that this reaction corresponds to the first stage of the stepwise mechanochemical
synthesis of alane, as described in section 4.2.2. In the bottom two spectra of (e), ‘ssb’ is used
to label a spinning sideband, which arises from the Li3AlH6 species.

31
Solid-state NMR measurements revealed the presence of five Al-containing
species at BM = 16 min. These include a small amount (SDP 9%) of unreacted AlCl3,
represented in the 27
Al DPMAS spectrum by a broad peak centered on –2 ppm. The
dominant spectral band between 80 and 105 ppm (SDP 84%) consists of two
superimposed patterns ascribed to LiAlH4 and LiAlCl4. However, their relative
contributions are difficult to quantify due to severe spectral overlap. Another hydride
observed at this stage is Li3AlH6, represented by a peak near –35 ppm, which comprises
only a minor fraction (SDP 2%) of the quantitative DPMAS intensity but is featured
quite prominently in the CPMAS spectrum. Finally, the broad, low-lying resonance at
~13 ppm in the DPMAS and CPMAS spectra presents a strong case for the presence of a
small fraction (SDP 5%) of six-coordinated AlVI
in AlH3 and/or chloride-substituted
AlCl3-xHx-type species that form at even earlier times [77, 78]. Indeed, it is quite possible
that AlH3 forms via the following reaction at early ball-milling times:
LiH + AlCl3 → LiAlCl4 + AlH3
The above equation supports the formation of LiAlCl4, which, according to both
solid-state NMR and powder XRD analyses, also appears to be prominent at short milling
times. Moreover, because the AlVI
hydrides are not observed near 13 ppm in later samples
obtained for stage 1, they appear to exist only as transient intermediates, which quickly
vanish upon further processing. One plausible explanation for the disappearance of these
AlVI
intermediate hydrides is based on their transformation into LiAlH4, as shown for
alane in the following reaction [79]:
AlH3 + LiH → LiAlH4

32
At BM = 24 min, the XRD pattern clearly shows the formation of LiAlH4 [80] and
Li3AlH6 [81] with a concomitant increase in LiCl and disappearance of the LiAlCl4 phase
(Fig. 4.2b). The corresponding DPMAS and CPMAS spectra (Fig. 4.2 d and e) confirm
the presence of LiAlH4/LiAlCl4 (SDP 73%). The peak centered at 95 ppm has now a line
shape that appears more characteristic of LiAlH4, suggesting that this species is largely
responsible for the observed intensity at BM = 24 min. Accordingly, LiAlCl4 is suspected
to exist as only a minor component at 24 min. Also confirmed in the solid-state NMR
spectra is the formation of Li3AlH6 (SDP 24%) and the presence of unreacted AlCl3 (SDP
3%). Note that there is no indication of the aforementioned transient hydride species at
13 ppm. At this point, the relative abundance of Li3AlH6 can be explained by the
following well-known transformation [82]:
LiAlH4 + 2LiH → Li3AlH6
At BM = 48 min, the species detected by XRD were Li3AlH6, LiCl and unreacted
LiH (Fig. 4.2c). The corresponding solid-state NMR experiments revealed, as expected,
an intense resonance from Li3AlH6 (SDP 90%), and the apparent complete loss of
LiAlH4. The minor resonance around 95 ppm (SDP 10%) is assigned exclusively to
LiAlCl4, as suggested by the absence of a CP signal.
With the exception of a few minor differences resulting mainly from the
sensitivity of XRD only to the crystalline phases, and the detection of both crystalline and
amorphous phases by solid-state NMR, both techniques provided consistent and
complementary results describing in detail the overall mechanochemical transformation
sequence for the reaction of 9LiH:1AlCl3 carried out at 350 bar H2 pressure.
33
4.2.3 Further addition of AlCl3 (4:1 cumulative LiH:AlCl3 ratio)
Thereafter, 2 molar equivalents of AlCl3 were added to the product mixture of the
9:1 reaction of LiH and AlCl3 (Li3AlH6, LiCl and LiH at τBM = 48 min) to reach the
desired LiH:AlCl3 ratio of 3:1. When the resulting mixture was processed under 350 bar
of H2 pressure, a dark grey powder was obtained after 15–20 min of ball milling,
indicating the formation of metallic Al, which was later confirmed by XRD analysis (not
shown). However, when the amount of AlCl3 added during this first attempt was slightly
reduced to 1.25 molar equivalents instead of 2 (resulting in an overall LiH:AlCl3 ratio of
4:1 rather than 3:1), the reaction proceeded without the formation of metallic Al. Again,
the progress of the reaction was monitored using powder XRD and solid-state NMR, the
results of which are shown in Fig. 4.3 and described below.
Fig. 4.3 X-ray diffraction patterns (a-b) and solid-state NMR (27
Al DPMAS and 27
Al{1H}
CPMAS) spectra (c-d) obtained for samples of the 4:1 LiH:AlCl3 reaction mass after ball
milling for the indicated time under 350 bar H2 with a milling speed of 300 rpm and a B/S of
~140. Note that this starting composition (obtained by adding 1.25 moles of AlCl3 to the as-
milled 9:1 product shown in Fig. 4.2c) corresponds to the second stage of the stepwise
mechanochemical synthesis of alane, as described in section 4.2.3.

34
For BM = 8 min, the XRD pattern shows only LiAlCl4 and LiCl as the crystalline
phases present in the sample. However, the 27
Al DPMAS spectrum of this sample shows
signals at ~95, 13, –2, and –35 ppm representing LiAlH4/LiAlCl4 (SDP 66%), six-
coordinated AlVI
(SDP 8%), AlCl3 (SDP 8%), and Li3AlH6 (SDP 17%), respectively
(Fig. 4.3, c-d for BM = 8). Although the relative contributions of LiAlH4 and LiAlCl4 are
difficult to quantify, the line shape of the superposition signal at 95 ppm is strikingly
similar to that observed at BM = 8 min during 9:1 reaction of LiH and AlCl3 described
above, suggesting that the reactions occurring in each case are initiated by a similar
mechanism, despite their overall stoichiometric differences. In addition, in both stages
the spectra contain a similarly small, yet conspicuous, signal arising from AlVI
species
around 13 ppm, which is absent at later processing times. Further still, these spectra also
contain similar amounts of unreacted AlCl3 at –2 ppm. In fact, apart from all of the
similarities mentioned above, these spectra essentially differ only in the concentration of
Li3AlH6.
After BM = 48 min, the resonance observed at ~95 ppm dominates both the
DPMAS (SDP ≈ 97%) and CPMAS spectra. The line shape of this peak in the DPMAS
spectrum indicates a larger contribution from LiAlH4, which is supported by a similar
increase observed in the corresponding CPMAS signal. The only other species observed
after 48 min of milling is Li3AlH6, although it constitutes only ~3% of the overall
DPMAS intensity. Thus, notwithstanding this and some relatively small fraction of
LiAlCl4, the major product observed upon completion of this stage of processing is
LiAlH4, which is in well accordance given the 4:1 is the ratio of LiH:AlCl3 in the
mixture.
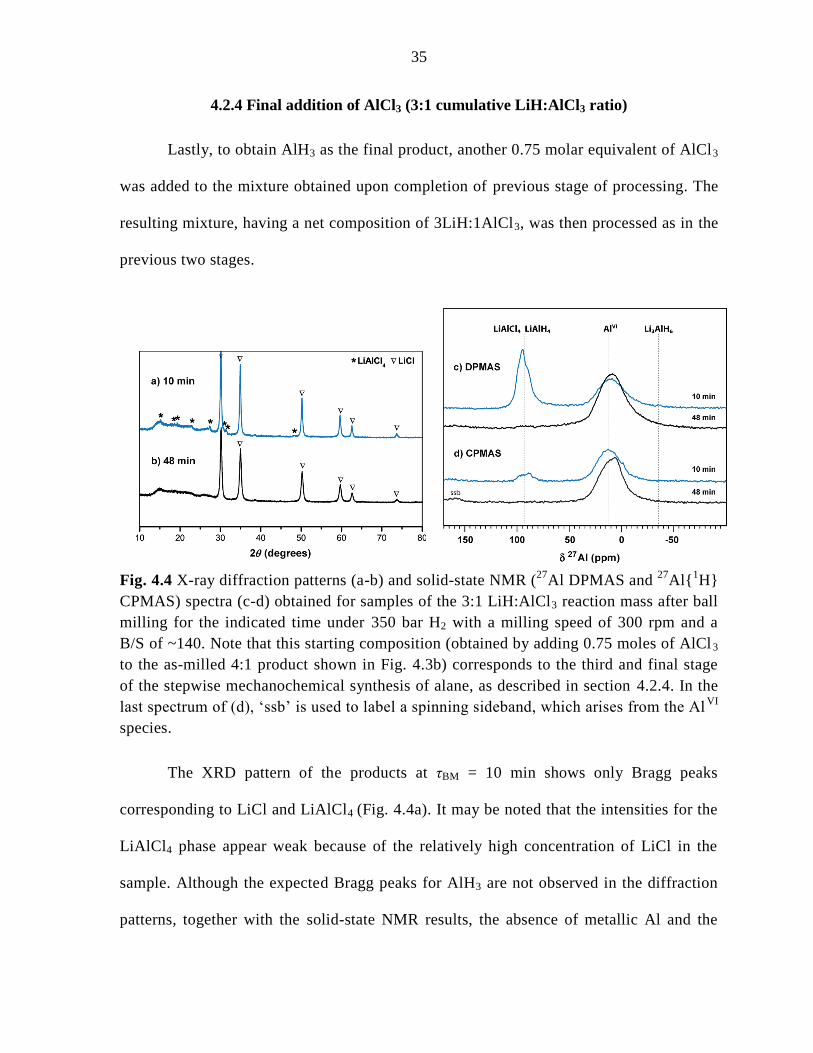
35
4.2.4 Final addition of AlCl3 (3:1 cumulative LiH:AlCl3 ratio)
Lastly, to obtain AlH3 as the final product, another 0.75 molar equivalent of AlCl3
was added to the mixture obtained upon completion of previous stage of processing. The
resulting mixture, having a net composition of 3LiH:1AlCl3, was then processed as in the
previous two stages.
Fig. 4.4 X-ray diffraction patterns (a-b) and solid-state NMR (27
Al DPMAS and 27
Al{1H}
CPMAS) spectra (c-d) obtained for samples of the 3:1 LiH:AlCl3 reaction mass after ball
milling for the indicated time under 350 bar H2 with a milling speed of 300 rpm and a
B/S of ~140. Note that this starting composition (obtained by adding 0.75 moles of AlCl3
to the as-milled 4:1 product shown in Fig. 4.3b) corresponds to the third and final stage
of the stepwise mechanochemical synthesis of alane, as described in section 4.2.4. In the
last spectrum of (d), ‘ssb’ is used to label a spinning sideband, which arises from the AlVI
species.
The XRD pattern of the products at τBM = 10 min shows only Bragg peaks
corresponding to LiCl and LiAlCl4 (Fig. 4.4a). It may be noted that the intensities for the
LiAlCl4 phase appear weak because of the relatively high concentration of LiCl in the
sample. Although the expected Bragg peaks for AlH3 are not observed in the diffraction
patterns, together with the solid-state NMR results, the absence of metallic Al and the

36
starting components indicates that the reaction proceeded as intended. Considering that
the corresponding DPMAS spectrum exhibits a pronounced increase in the intensity of
the signal at ~13 ppm assigned to the AlVI
species (SDP ≈ 55%), the absence of Bragg
peaks attributable to AlH3 likely reflects the amorphous or nanocrystalline nature of the
resulting aluminum trihydride. In addition to the resonance assigned to AlVI
, there is yet a
substantial contribution from the signal occurring at ~95 ppm after 10 min, which
includes the remaining 45% of the total DPMAS intensity. Interestingly, the line shape of
this signal again closely resembles that observed at early points in the previous two
stages of processing. As such, it appears that comparable amounts of LiAlCl4 and LiAlH4
exist with the latter likely making a somewhat larger contribution. Regardless, it is
quantitatively clear from the DPMAS spectrum that after 10 min of milling most of the
aluminum species in the reaction mixture are now present as AlVI
hydrides.
At τBM = 48 min, only the Bragg peaks corresponding to LiCl are observed by
XRD. The corresponding solid-state NMR spectra now show only one resonance band
centered around 13 ppm suggesting that all available Al has transformed to the
hydrogenated AlVI
species. Note, however, that the line shape of the AlVI
signal in this
sample differs slightly between the DPMAS and CPMAS experiments, suggesting that
the final product may contain several polymorphic forms of AlH3 or other structurally
related species, most likely Cl-containing derivatives of AlH3, such as AlClH2 [77,78],
though only in relatively small proportions.
4.2.5 Summary of the overall reaction scheme
Based on powder XRD and solid-state NMR results, reaction progress may be
summarized as follows:
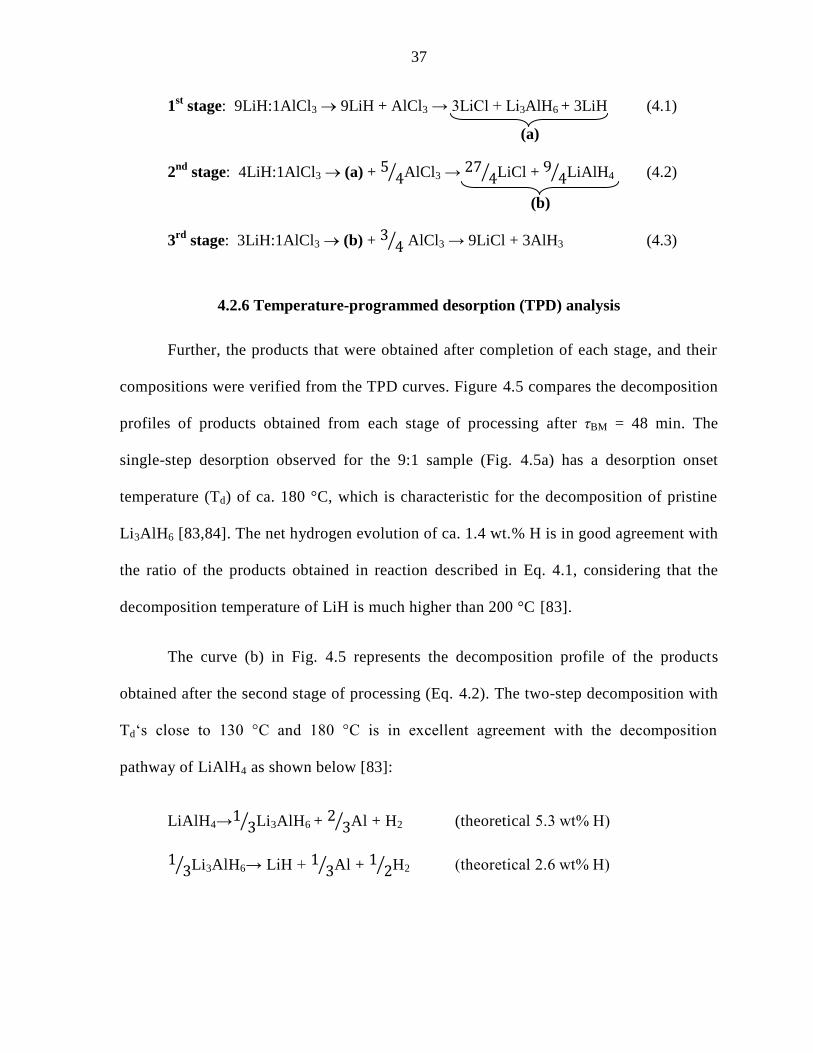
37
1st stage: 9LiH:1AlCl3 9LiH + AlCl3 → 3LiCl + Li3AlH6 + 3LiH (4.1)
2nd
stage: 4LiH:1AlCl3 (a) + AlCl3 → LiCl + LiAlH4 (4.2)
3rd
stage: 3LiH:1AlCl3 (b) + AlCl3 → 9LiCl + 3AlH3 (4.3)
4.2.6 Temperature-programmed desorption (TPD) analysis
Further, the products that were obtained after completion of each stage, and their
compositions were verified from the TPD curves. Figure 4.5 compares the decomposition
profiles of products obtained from each stage of processing after τBM = 48 min. The
single-step desorption observed for the 9:1 sample (Fig. 4.5a) has a desorption onset
temperature (Td) of ca. 180 °C, which is characteristic for the decomposition of pristine
Li3AlH6 [83,84]. The net hydrogen evolution of ca. 1.4 wt.% H is in good agreement with
the ratio of the products obtained in reaction described in Eq. 4.1, considering that the
decomposition temperature of LiH is much higher than 200 °C [83].
The curve (b) in Fig. 4.5 represents the decomposition profile of the products
obtained after the second stage of processing (Eq. 4.2). The two-step decomposition with
Td‘s close to 130 °C and 180 °C is in excellent agreement with the decomposition
pathway of LiAlH4 as shown below [83]:
LiAlH4→ Li3AlH6 + Al + H2 (theoretical 5.3 wt% H)
Li3AlH6→ LiH + Al + H2 (theoretical 2.6 wt% H)
(a)
(b)
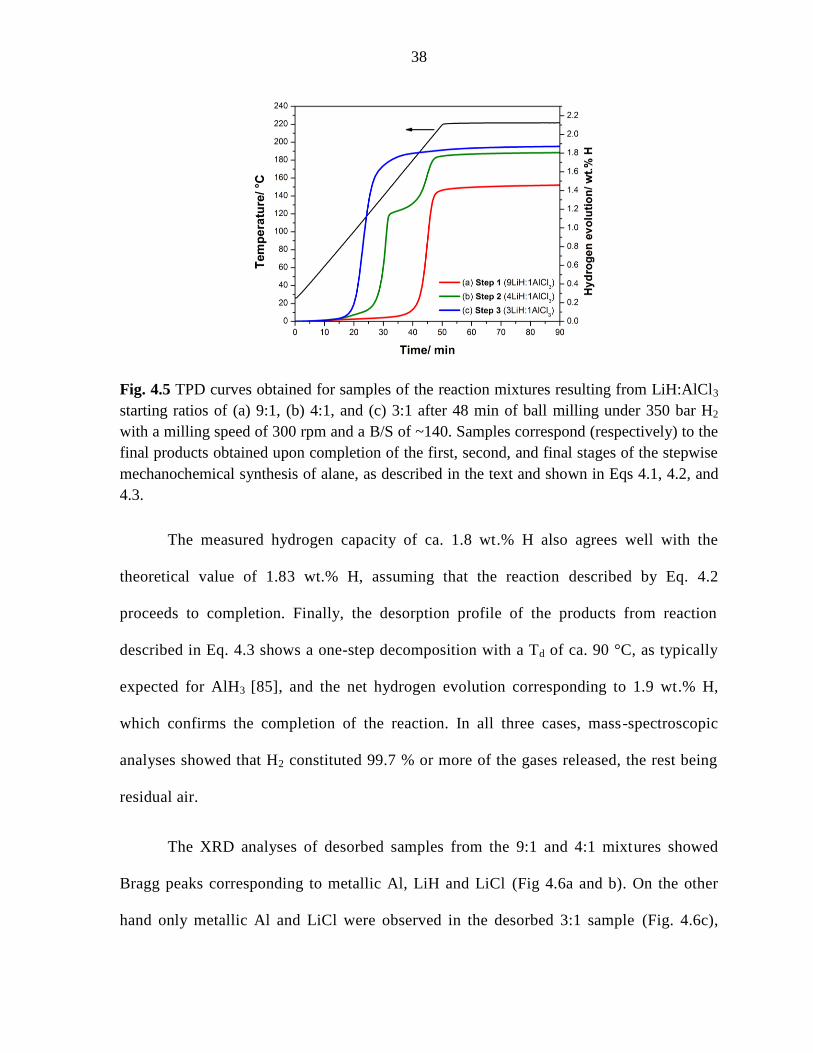
38
Fig. 4.5 TPD curves obtained for samples of the reaction mixtures resulting from LiH:AlCl3
starting ratios of (a) 9:1, (b) 4:1, and (c) 3:1 after 48 min of ball milling under 350 bar H2
with a milling speed of 300 rpm and a B/S of ~140. Samples correspond (respectively) to the
final products obtained upon completion of the first, second, and final stages of the stepwise
mechanochemical synthesis of alane, as described in the text and shown in Eqs 4.1, 4.2, and
4.3.
The measured hydrogen capacity of ca. 1.8 wt.% H also agrees well with the
theoretical value of 1.83 wt.% H, assuming that the reaction described by Eq. 4.2
proceeds to completion. Finally, the desorption profile of the products from reaction
described in Eq. 4.3 shows a one-step decomposition with a Td of ca. 90 °C, as typically
expected for AlH3 [85], and the net hydrogen evolution corresponding to 1.9 wt.% H,
which confirms the completion of the reaction. In all three cases, mass-spectroscopic
analyses showed that H2 constituted 99.7 % or more of the gases released, the rest being
residual air.
The XRD analyses of desorbed samples from the 9:1 and 4:1 mixtures showed
Bragg peaks corresponding to metallic Al, LiH and LiCl (Fig 4.6a and b). On the other
hand only metallic Al and LiCl were observed in the desorbed 3:1 sample (Fig. 4.6c),
39
which suggests that LiH was completely consumed during the mechanochemical
processing and that all of the alanates formed as intermediates during the first two stages
were transformed into alane.
Fig. 4.6 X-ray diffraction patterns of products obtained after complete desorption (see
Fig. 4.5) of as-synthesized samples with (a) 9:1, (b) 4:1 and (c) 3:1 molar ratio of LiH
and AlCl3.
4.2.7 Reaction mechanisms
To explain why the reaction between LiH and AlCl3 in a 3:1 molar ratio leads to
metallic Al even under hydrogen pressure, products from this reaction were analyzed for
different BM = 6, 12 and 18 min. It was observed that the 3:1 reaction does not yield
metallic Al right away, but rather proceeds to form a small amount of LiAlCl4 at BM = 18
min, a pathway similar to that of the 9:1 reaction. However, in contrast to 9:1 reaction
after 18 min, a significant amount of unreacted AlCl3 was also noticed in the 3:1 mixture,
which suggests that the 3:1 reaction is slower under similar milling conditions. A
comparison of the progress of 3:1 and 9:1 reactions within the first 18 min of milling is
shown in Fig 4.7.

40
Fig. 4.7 X-ray diffraction patterns showing the comparison of progress of reaction in 3:1
(left) and 9:1 (right) LiH:AlCl3 ratios during the initial 18 min of milling. All samples were
milled under 350 bar H2 at 300 rpm and a B/S of ~140.
Whereas the formation of Li3AlH6 is already evident in the 9:1 mixture for BM =
24 min (Fig. 4.2), no alanate peaks are observed in the 3:1 reaction. Thus, one may infer
that in the presence of excess LiH in the mixture, the formed intermediates (likely a
mixture of AlCl2H and AlClH2) are readily transformed to alanate before decomposing
into metallic Al. In parallel to the observations made by Mikheeva et al. during their
studies of the reaction between LiH and AlCl3 (in ether), the following argument may
explain to some extent the failure of the stoichiometric 3:1 and 4:1 reactions [86].
Because of its relatively low volume fraction in these mixtures compared to 9:1, LiH may
not be sufficiently dispersed, leading to high local AlCl3/LiH ratios. Lack of dispersion in
turn may lead to the decomposition of unstable chlorine-containing derivatives, such as
AlCl2H and AlClH2 (or AlH3AlCl3), into metallic Al with evolution of hydrogen, rather
than the formation of alanate. Mikheeva et al. noticed that slow addition of an ethereal
41
solution of AlCl3 improved the yield of LiAlH4, which is akin to the required sequential
addition of AlCl3 in the present case.
To obtain further insight, another reaction was performed in which the
3LiH:1AlCl3 reaction mixture was processed at half the milling speed (150 rpm) and, as
before, at 350 bar H2 pressure. The reaction progresses without the formation of metallic
Al, albeit at a very slow pace, so much that it was incomplete even after 20 h of milling,
as shown by solid-state NMR results (Fig 4.8).
Fig. 4.8 Solid-state NMR (27
Al DPMAS and 27
Al{1H} CPMAS) spectra obtained for a
sample having the starting ratio of 3:1 LiH:AlCl3 after ball milling for 20 h under 350 bar H2
at 150 rpm with a B/S of ~140.
More interestingly, this latter reaction could also be performed at a relatively low
H2 pressure of less than 10 bar, although the reaction time remained unaffected.
However, when this reaction was performed under argon at a pressure slightly over 1 bar
(i.e., glove box pressure), metallic Al was obtained within 60 min of milling. Based on
these results one may conclude that at low milling speeds the local temperature spikes are
insignificant when compared to those at high milling speeds, which prevents the
decomposition of AlH3. However there may be two caveats to this view. First, it is well
42
known that AlH3 is kinetically metastable at room temperature with equilibrium pressure
of more than 0.7 GPa (7,000 bar). It is quite unlikely in this scenario that a moderate gas
pressure of 350 bar could prevent the decomposition of nascent AlH3. Second, this view
does not support the formation of metallic Al in the 4:1 mixture since it would only lead
to LiAlH4 as a final product:
4LiH + AlCl3 → LiAlH4 + 3LiCl,
which is known to be stable under milling unless carried out in the presence of a catalyst ,
such as titanium [87].
Although the role of pressure during processing is not clearly understood, it is
postulated that the gas under pressure acts as a fluid medium that may assist in the long-
range solid-state diffusion of ions that is essential for preventing the destabilizat ion of
Al-H bonds. Alternatively, it is also likely that the high-pressure gas may serve as an
effective heat transport medium and hence alter the mechanochemical reaction pathway.
It is also clear that manipulation of the gas pressure alone may not be sufficient to
avoid the formation of metallic Al. Indeed, the minimum required pressure for the 9:1
reaction is 300 bar, whereas the minimum for the 3:1 reaction (if any) is higher (likely, much
higher) than 350 bar. Thus, the presence of excess LiH in the mixture appears to be essential
for the preservation of the newly formed Al-H bonds via the formation of intermediate,
thermodynamically stable alanates.
43
4.3 Conclusions
A solvent-free mechanochemical route has been developed for the preparation of
alane starting from LiH and AlCl3 at room temperature. Although this reaction has been
known to occur in solvents, such as diethyl ether, it is important to discover methods that are
simple to carry out on a large scale. In contrast to the wet-chemical route however, the direct
solvent-free mechanochemical reaction of LiH and AlCl3 at a ratio of 3:1 or 4:1 fails to yield
AlH3 or LiAlH4, respectively. Instead, the use of excess LiH in the starting mixture leads to
conditions that favor the formation of Al-H bonds resulting in the intermediate alanates.
The results described in this work establish this mechanochemical route as a versatile
and very useful alternative to solution-based methods, which reduces or eliminates the use of
potentially hazardous solvents. We note, however, that in addition to non-solvated alane, the
resulting material contains about 80% of dead weight in the form of a LiCl by-product, which
reduces the net gravimetric hydrogen density by the same amount. The separation of alane
from LiCl is thus critical for realizing its full potential as a hydrogen storage material.
Although different solubilities of alane and LiCl in various organic solvents have been
employed with varying success to achieve the separation, future research must focus on
finding a suitable solvent, or a combination of solvents, that are both inexpensive and benign.
It is also demonstrated that the mechanochemical reaction pathway can be altered by
adjusting the applied gas pressure. In the present case, this was demonstrated by
manipulating the H2 pressure such that the reaction pathway leading to metallic Al was
completely avoided. Although the exact role of the gas pressure could not be clearly
elucidated, it is postulated that the gas under high pressure acts as a fluid medium, which
44
may have significant effects on the underlying solid-state diffusion processes. Alternatively,
the high-pressure gas may serve as an effective heat transfer medium, which may alter the
local temperature profile and thereby affect the reaction pathway.
A better understanding of the mechanistic pathway for the synthesis of alane is
expected to provide the much needed basic scientific insight necessary for the development
of more refined approaches not only toward the production of AlH3, but also its reversibility,
including the direct mechanochemical hydrogenation of metallic Al, which remains elusive
to this day.
45
CHAPTER 5. MECHANOCHEMICAL SYNTHESIS OF ALANE FROM
LITHIUM ALUMINUM HYDRIDE AND ALUMINUM CHLORIDE
Title: Solvent-free Mechanochemical Synthesis of Alane, AlH3:
Effect of Pressure on the Reaction Pathway
S. Gupta, T. Kobayashi, I.Z. Hlova, J.F. Goldston, M. Pruski, and V.K. Pecharsky
Abstract
Nearly quantitative mechanochemical synthesis of non-solvated AlH3 from lithium
aluminum hydride (LiAlH4) and aluminum chloride (AlCl3) has been achieved at room
temperature under reasonably low pressure of hydrogen (210 bar) or inert gas (125 bar for He
or 90 bar for Ar). X-ray diffraction, solid-state 27
Al NMR spectroscopy, and temperature
programmed desorption analysis of as-milled materials reveal a nearly complete conversion
of a 3:1 (molar) mixture of LiAlH4 and AlCl3 to a 4:3 (molar) mixture of AlH3 and LiCl in
ca. 30 min. By applying pressure of 210 bar or less (depending on the gas: hydrogen, helium,
or argon), competing reactions leading to formation of metallic aluminum can be completely
suppressed. X-ray diffraction and NMR analyses of products extracted at various stages of
the mechanochemical reaction between LiAlH4 and AlCl3 reveal, for the first time, that the
solid-state transformation proceeds with LiAlCl4 as an intermediate. Evidently, the critical
pressure required to suppress the formation of metallic aluminum depends on the rate at
which mechanical energy is supplied during milling. For example, the critical pressure is
reduced from 210 bar to 1 bar of hydrogen when the milling speed of a standard planetary
mill is reduced from 300 rpm to 150 rpm, although at the expense of sluggish kinetics and
much longer reaction time.

46
5.1 Introduction
Realization of declining natural reserves of easily accessible carbon-based energy
sources, and the deleterious environmental impact of their indiscriminate use to meet
skyrocketing energy demands have led to sustained efforts to transition to environmentally
benign and sustainable energy sources [112]. Hydrogen is considered an ideal energy carrier
as it has large gravimetric energy density (~142 MJ kg–1
), is abundant in the form of H2O,
and produces no harmful emissions when utilized in PEM fuel cells and other energy
conversion devices [5, 90, 112, 113]. Besides its high energy value and clean oxidation,
hydrogen may be sustainably produced by electrolysis of water using zero-carbon wind, off-
peak hydroelectric and solar power, among other practical methods [114].
In order to enable distributed fuel-cell technologies based on chemically stored
hydrogen, materials exceeding 8–10 wt.% hydrogen capacity, and capable of releasing
hydrogen at a high rate below 100 °C are required [115]. Such stringent restraints severely
limit the choice of materials currently available for practical hydrogen storage. In this regard,
AlH3 (aluminum trihydride or alane) is extremely promising since it combines high
gravimetric and volumetric hydrogen capacities of 10.1 wt % and 149 kg m–3
, respectively,
and delivers uncontaminated H2 in a single step around 100 °C or less depending upon the
method of preparation [27]. Despite these impressive figures, strong sensitivity of AlH3 to
oxidation and hydrolysis, and its flammability are challenging safety issues that need to be
addressed during storage and use in transportation applications. Suitable and safe methods
for use of AlH3 as a fuel, such as formulation as a slurry, have been suggested [116].
Moreover, AlH3 is kinetically metastable at room temperature and releases hydrogen in an
endothermic process, which provides inherent stability to the system by self-limiting the
47
hydrogen release reaction [117]. The enormous potential offered by AlH3 is, however, much
reduced by the lack of a simple and direct method for its synthesis in a pure form, given its
thermodynamic instability (ΔG°f ≈ 46 kJ·mol–1
) [118]. The most preferred route to synthesize
AlH3 would be to directly combine elemental Al and gaseous hydrogen according to
following reaction:
Al + 3/2 H2 → AlH3
However, according to the p,T state diagram of AlH3, direct hydrogenation of elemental Al
by gaseous H2 is possible only at pressures exceeding 2.5 GPa (25,000 bar) and temperature
close to 300 °C, or 0.7 GPa (7,000 bar) at room temperature, which is impractical on an
industrial scale [72, 141]. Alternatively, AlH3 can be obtained under much milder conditions
by the reaction of LiAlH4 and AlCl3 in diethyl ether (Et2O), commonly known as the
Schlesinger reaction [39]:
3LiAlH4 + AlCl3 + nEt2O → 4AlH3.nEt2O + 3LiCl (5.1)
The reaction, first reported in 1947, leads to an ether adduct of AlH3; however, removal of
ether by heating usually leads to decomposition of a significant fraction of the prepared
alane. Subsequently, several methods of producing non-solvated AlH3 from its ether adduct
were proposed with limited success and reproducibility [60]. As described in US patents by
the Dow Chemical Co. (1974) and by Bower et al. (1976), AlH3 can be obtained in a non-
solvated form by desolvation of the AlH3-ether adduct in the presence of excess LiAlH4 and
LiBH4 that help reduce the temperature of desolvation, and hence minimize the
decomposition of AlH3 [28]. However, this method of production of AlH3 is quite sensitive to
heating conditions, and often lacks good reproducibility. Thus, a method of performing this

48
conversion in a solvent-free environment for a direct yield of non-solvated AlH3 is highly
desirable. A recent report demonstrated that a low-temperature (75 °C), thermochemical
transformation in the solid state is feasible due to the favorable change in the Gibbs free
energy [88]:
3LiAlH4 + AlCl3 → 4AlH3 + 3LiCl (5.2)
with ΔrG298K= −191 kJ·mol-1
and ΔrG77K= −158 kJ·mol-1
. To carry out this thermochemical
transformation at a reasonable conversion rate, however, necessitates pre-mixing of reactants,
followed by compaction or continuous mixing during the heat treatment. Also, in a thermal
reaction, one may encounter problems with local overheating, formation of low melting
eutectics, and very rapid, nearly explosive decomposition to metallic Al and hydrogen [89].
Apart from the aforementioned methods of synthesis of AlH3, more convenient, one-
step solvent-free mechanochemical syntheses have also been investigated to accomplish the
transformation shown in Eq. 5.2 [65,66]. For example, synthesis of AlD3 was accomplished
by ball milling LiAlD4 and AlCl3 taken in 3:1 molar ratio in a planetary mill, both at room
temperature and at −196 °C [66]. Milling at room temperature results in a mixture of α and
α'-AlD3 and LiCl along with metallic Al. Brinks et al. suggested that large temperature
spike(s) during mechanochemical processing may have caused the decomposition of AlH3
(about 60 % of the stoichiometric amount) to metallic Al. As indicated by the free energy
change for Eq. 5.2, the solid-state reaction is also feasible at −196 °C, and this was
successfully employed by Brinks et al. to suppress the formation of metallic Al [66].
Although the mechanochemical reaction to synthesize AlH3 at −196 °C significantly reduces
the formation of metallic Al, cooling of the system to cryogenic temperatures may pose

49
procedural and technical challenges that could be detrimental to large-scale production of
AlH3 using this method.
As search for efficient and cost-effective methods to synthesize metal hydrides
continues, mechanochemical synthesis in the presence of reactive gases has been the method
of choice for selected classes of hydrides [90, 91]. This entails mechanochemical processing
of solids under reactive gases such as hydrogen, diborane and other, to form hydrides [92,
93]. Apart from serving as one of the reactants, the high pressure gaseous environment may
also affect the milling intensity thereby influencing the reaction pathway.
Recently, we developed capability to carry out mechanochemical reactions under gas
pressure as high as 350 bar and reported solid-state synthesis of AlH3 from LiH and AlCl3
[94]. However, stoichiometric (3:1 molar LiH:AlCl3) reaction carried out under our highest
working pressure of hydrogen yields mostly metallic Al. Nearly quantitative yield of AlH3
has been achieved when mechanochemical processing was carried out in three steps starting
from a LiH-rich composition gradually adjusting it to match the ideal 3:1 LiH:AlCl3
stoichiometry [94]. Such multistep process is relatively complex, and simpler synthetic
routes are highly desirable. In this work we describe a simple, efficient, one-step synthesis of
AlH3 that leads, for the first time, to a complete suppression of the parasitic formation of
metallic Al during room-temperature execution of the solid-state mechanochemical reaction
between LiAlH4 and AlCl3. We also uncover the mechanistic pathway of this
mechanochemical solid-state reaction, and elucidate the effect of gas pressure and milling
intensity. Heretofore unreported, control of this reaction pathway by the application of gas
pressure may open new avenues for facile mechanochemical synthesis of otherwise
metastable advanced functional materials.
50
5.2 Experimental section
5.2.1 Materials and mechanochemical processing
Starting materials – LiAlH4 (Aldrich, 98%), and AlCl3 (Aldrich, 99.99%) – were used
as-received. All manipulations, including sample loading and extraction, were carried out in
an argon-filled glove box with the oxygen and moisture levels controlled at less than 5 ppm
(v/v). In a typical mechanochemical reaction for synthesis of AlH3, an approximately 1 g
mixture of LiAlH4 and AlCl3 in the molar ratio of 3:1 was weighed and transferred to
custom-built high-pressure milling containers. The containers with an internal volume of
5.62 in3 (~95 ml) have been fabricated from 316L grade stainless steel and lined with 440C
hardened stainless steel in order to minimize wear and related sample contamination during
milling. Twenty chrome steel balls (AISI E52100, ρ~7.83 g cm-3
) weighing 8.3 g each were
added to the containers, which were then sealed under argon. The containers were then
evacuated and filled with either zero-grade H2 (Linweld, 99.999%) or He (Matheson,
99.999%) or high-purity Ar (99.996%) to the desired pressure ranging between 1 and 250
bar. A two-station horizontal planetary mill (Fritsch, Pulverisette 7) was employed for
milling. As the standard condition, milling was carried out at 300 rpm with ball-to-powder
mass ratio (b:p) of ~160:1. The milling sequence alternated between forward and reverse
directions for 2 min each with an intermittent pause of 1 min to keep the average temperature
in the vial as close to room temperature as possible. Unless otherwise noted, this milling
condition was used throughout this study. The samples are denoted to indicate the gas
pressure, gas type and milling time. For example, a 3:1 molar mixture of LiAlH4 and AlCl3
milled under 250 bar of hydrogen pressure (pH2) for 60 min is referred to as 250H2-60m.
Considering the high b:p ratio employed, potential contamination with the milling media
51
(steel) was verified by measuring magnetic properties of the product obtained after milling
for 60 min. The absence of a ferromagnetic signal down to 2 K indicates that there were no
detectable wear of the media and, therefore, no contamination of the samples. Also, to
elucidate the mechanistic pathway, several experiments were performed in a SPEX 8000M
mixer mill using a stainless steel container and milling media. Here, milling was carried out
under argon atmosphere (pAr = 1 bar) for 60 min with a b:p of ~20:1. It may be noted that the
SPEX mill affords relatively high-energy milling, and the containers utilized in this process
were not pressurized.
5.2.3 X-ray powder diffraction analysis
The obtained products were characterized by powder X-ray diffraction (PXRD)
analysis at room temperature on a PANalytical X’PERT diffractometer using Cu-Kα1
radiation with a 0.02° 2θ step, in the 2θ range from 10° to 80°. During the measurements, a
polyimide (Kapton) film was used to protect the samples from moisture and oxygen, which
resulted in an amorphous-like background in the PXRD patterns in the range 13° ≤ 2θ ≤ 20°.
5.2.4 Solid-state NMR spectroscopy
The 27
Al solid-state (SS)NMR experiments were performed at 14.1 T on a Varian
VNMRS 600 spectrometer and at 9.4 T on a Chemagnetics Infinity 400 spectrometer. Both
instruments were equipped with 3.2-mm magic angle spinning (MAS) probes operated at a
MAS rate of 16 kHz. The samples were packed in MAS zirconia rotors in a glove box under
argon atmosphere and were tightly capped to minimize the possibility of oxygen and
moisture contamination. The one-dimensional 27
Al spectra were acquired using direct
polarization with a single pulse (DP)MAS or via 1H
27Al cross-polarization (
27Al{
1H}

52
CPMAS). For quantitative accuracy, the DPMAS spectra were acquired using a small flip
angle of ~10° [46, 119]. The CPMAS spectra represent 27
Al nuclei in dipolar contact with the
protons located one to two bond distances away. High-power heteronuclear 1H decoupling
was achieved using the two-pulse phase-modulation (TPPM) method [47]. To provide high-
resolution 27
Al spectra of selected samples, two-dimensional triple-quantum (3Q)MAS
spectra were measured using the standard Z-filter method [120, 121]. Detailed experimental
conditions are given in the figure captions using the following symbols: B0 is the static
magnetic field, νRFX is the radio frequency (RF) magnetic field applied to X nuclei, τCP is the
cross-polarization time, Δt1 is the increment of t1 during two-dimensional acquisition, and τRD
is the recycle delay. The 27
Al shifts were referenced to 1.0-M aqueous solutions of Al(NO3)3
at 0 ppm.
5.2.5 Temperature Programmed Desorption (TPD)
For thermal desorption experiments, ca. 200 mg of as-prepared powder samples were
loaded in a custom-built autoclave designed to work with an automatic volumetric Sievert's
type gas sorption analyzer (PCTPro-2000 by Setaram) coupled to a residual gas analyzer
(RGA100). This was followed by volume calibration of the free sample space, which
consisted of three helium absorption-desorption cycles over a period of 30–40 min. In a
typical desorption experiment, samples were heated at the rate of 4 °C/min up to 200 °C and
soaked at that temperature until saturation was achieved.
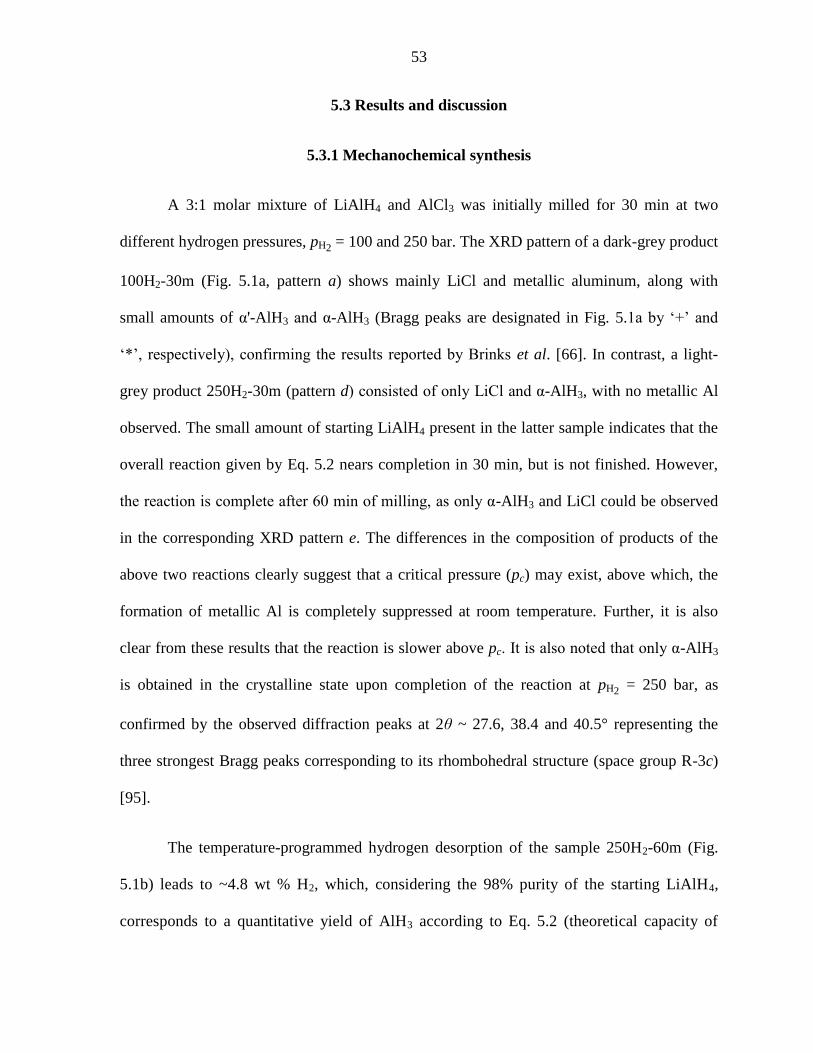
53
5.3 Results and discussion
5.3.1 Mechanochemical synthesis
A 3:1 molar mixture of LiAlH4 and AlCl3 was initially milled for 30 min at two
different hydrogen pressures, pH2 = 100 and 250 bar. The XRD pattern of a dark-grey product
100H2-30m (Fig. 5.1a, pattern a) shows mainly LiCl and metallic aluminum, along with
small amounts of α'-AlH3 and α-AlH3 (Bragg peaks are designated in Fig. 5.1a by ‘+’ and
‘*’, respectively), confirming the results reported by Brinks et al. [66]. In contrast, a light-
grey product 250H2-30m (pattern d) consisted of only LiCl and α-AlH3, with no metallic Al
observed. The small amount of starting LiAlH4 present in the latter sample indicates that the
overall reaction given by Eq. 5.2 nears completion in 30 min, but is not finished. However,
the reaction is complete after 60 min of milling, as only α-AlH3 and LiCl could be observed
in the corresponding XRD pattern e. The differences in the composition of products of the
above two reactions clearly suggest that a critical pressure (pc) may exist, above which, the
formation of metallic Al is completely suppressed at room temperature. Further, it is also
clear from these results that the reaction is slower above pc. It is also noted that only α-AlH3
is obtained in the crystalline state upon completion of the reaction at pH2 = 250 bar, as
confirmed by the observed diffraction peaks at 2θ ~ 27.6, 38.4 and 40.5° representing the
three strongest Bragg peaks corresponding to its rhombohedral structure (space group R-3c)
[95].
The temperature-programmed hydrogen desorption of the sample 250H2-60m (Fig.
5.1b) leads to ~4.8 wt % H2, which, considering the 98% purity of the starting LiAlH4,
corresponds to a quantitative yield of AlH3 according to Eq. 5.2 (theoretical capacity of
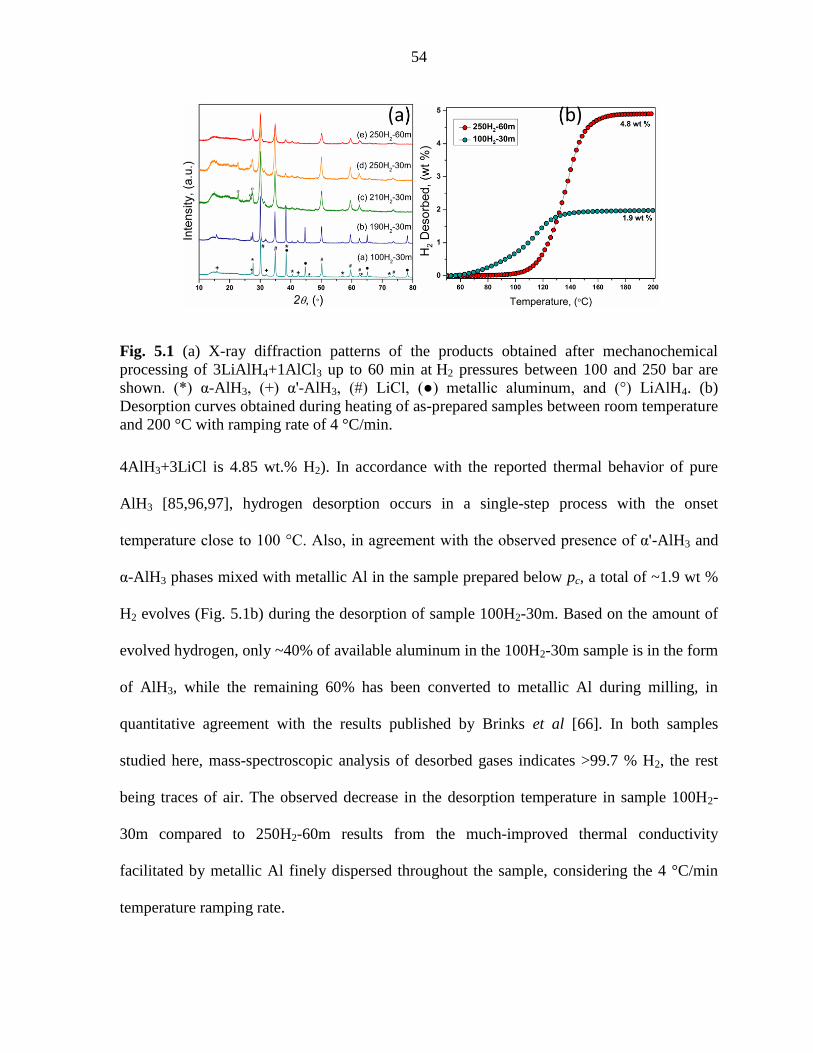
54
Fig. 5.1 (a) X-ray diffraction patterns of the products obtained after mechanochemical
processing of 3LiAlH4+1AlCl3 up to 60 min at H2 pressures between 100 and 250 bar are
shown. (*) α-AlH3, (+) α'-AlH3, (#) LiCl, (●) metallic aluminum, and (°) LiAlH4. (b)
Desorption curves obtained during heating of as-prepared samples between room temperature
and 200 °C with ramping rate of 4 °C/min.
4AlH3+3LiCl is 4.85 wt.% H2). In accordance with the reported thermal behavior of pure
AlH3 [85,96,97], hydrogen desorption occurs in a single-step process with the onset
temperature close to 100 °C. Also, in agreement with the observed presence of α'-AlH3 and
α-AlH3 phases mixed with metallic Al in the sample prepared below pc, a total of ~1.9 wt %
H2 evolves (Fig. 5.1b) during the desorption of sample 100H2-30m. Based on the amount of
evolved hydrogen, only ~40% of available aluminum in the 100H2-30m sample is in the form
of AlH3, while the remaining 60% has been converted to metallic Al during milling, in
quantitative agreement with the results published by Brinks et al [66]. In both samples
studied here, mass-spectroscopic analysis of desorbed gases indicates >99.7 % H2, the rest
being traces of air. The observed decrease in the desorption temperature in sample 100H2-
30m compared to 250H2-60m results from the much-improved thermal conductivity
facilitated by metallic Al finely dispersed throughout the sample, considering the 4 °C/min
temperature ramping rate.
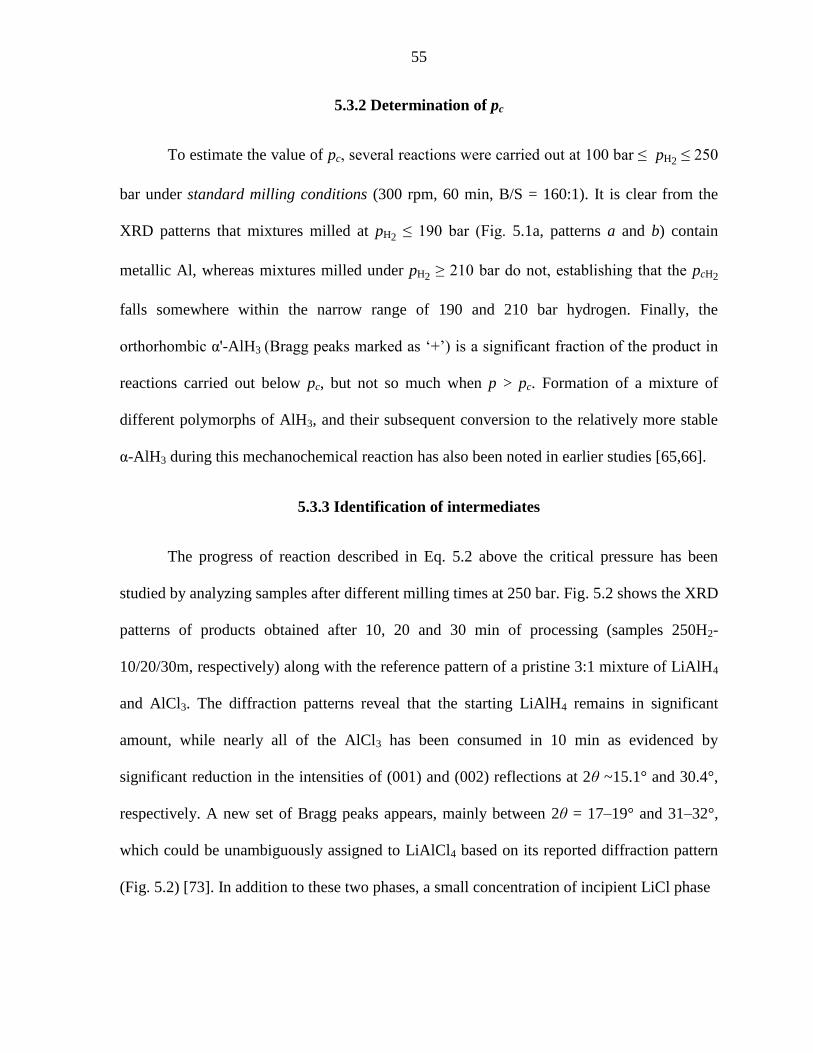
55
5.3.2 Determination of pc
To estimate the value of pc, several reactions were carried out at 100 bar ≤ pH2 ≤ 250
bar under standard milling conditions (300 rpm, 60 min, B/S = 160:1). It is clear from the
XRD patterns that mixtures milled at pH2 ≤ 190 bar (Fig. 5.1a, patterns a and b) contain
metallic Al, whereas mixtures milled under pH2 ≥ 210 bar do not, establishing that the pcH2
falls somewhere within the narrow range of 190 and 210 bar hydrogen. Finally, the
orthorhombic α'-AlH3 (Bragg peaks marked as ‘+’) is a significant fraction of the product in
reactions carried out below pc, but not so much when p > pc. Formation of a mixture of
different polymorphs of AlH3, and their subsequent conversion to the relatively more stable
α-AlH3 during this mechanochemical reaction has also been noted in earlier studies [65,66].
5.3.3 Identification of intermediates
The progress of reaction described in Eq. 5.2 above the critical pressure has been
studied by analyzing samples after different milling times at 250 bar. Fig. 5.2 shows the XRD
patterns of products obtained after 10, 20 and 30 min of processing (samples 250H2-
10/20/30m, respectively) along with the reference pattern of a pristine 3:1 mixture of LiAlH4
and AlCl3. The diffraction patterns reveal that the starting LiAlH4 remains in significant
amount, while nearly all of the AlCl3 has been consumed in 10 min as evidenced by
significant reduction in the intensities of (001) and (002) reflections at 2θ ~15.1° and 30.4°,
respectively. A new set of Bragg peaks appears, mainly between 2θ = 17–19° and 31–32°,
which could be unambiguously assigned to LiAlCl4 based on its reported diffraction pattern
(Fig. 5.2) [73]. In addition to these two phases, a small concentration of incipient LiCl phase

56
is also seen in the sample 250H2-10m. Upon milling for an additional 10 min (sample 250H2-
20m), the intensities of Bragg peaks corresponding to LiAlH4 and the LiAlCl4 intermediate
are reduced, while those corresponding to LiCl are enhanced. Only minor amounts of LiAlH4
and LiAlCl4 remain in sample 250H2-30m. The formation of AlH3 could not be discerned in
samples 250H2-10m and 250H2-20m because of the overlap of its Bragg peaks with those
from LiAlH4 and LiAlCl4 in the 2θ region between 27–28°; however, the presence of AlH3 is
clearly evident in sample 250H2-30m.
Fig. 5.2 X-ray diffraction patterns of the starting mixture (3LiAlH4:1AlCl3) and the products
obtained after milling of this mixture for 10, 20, and 30 min. Also included is the calculated
pattern for LiAlCl4 for comparison. All reactions were carried out at 250 bar H2 pressure.
(*) α-AlH3, (#) LiCl, and (°) LiAlH4. (inset) expanded 2θ region between 20–40°. As-
received AlCl3 is strongly textured, but the texturing is greatly reduced after ball milling.
Therefore, intensities of Bragg peaks corresponding to AlCl3 in the physical mixture of
3LiAlH4:1AlCl3 are not representative. X-ray diffraction pattern of ball-milled (untextured)
AlCl3 is in Fig. 5.5.
The sequence of events during the mechanochemical process was also monitored by
solid-state NMR spectroscopy. The 27
Al DPMAS and 27
Al{1H} CPMAS spectra of the
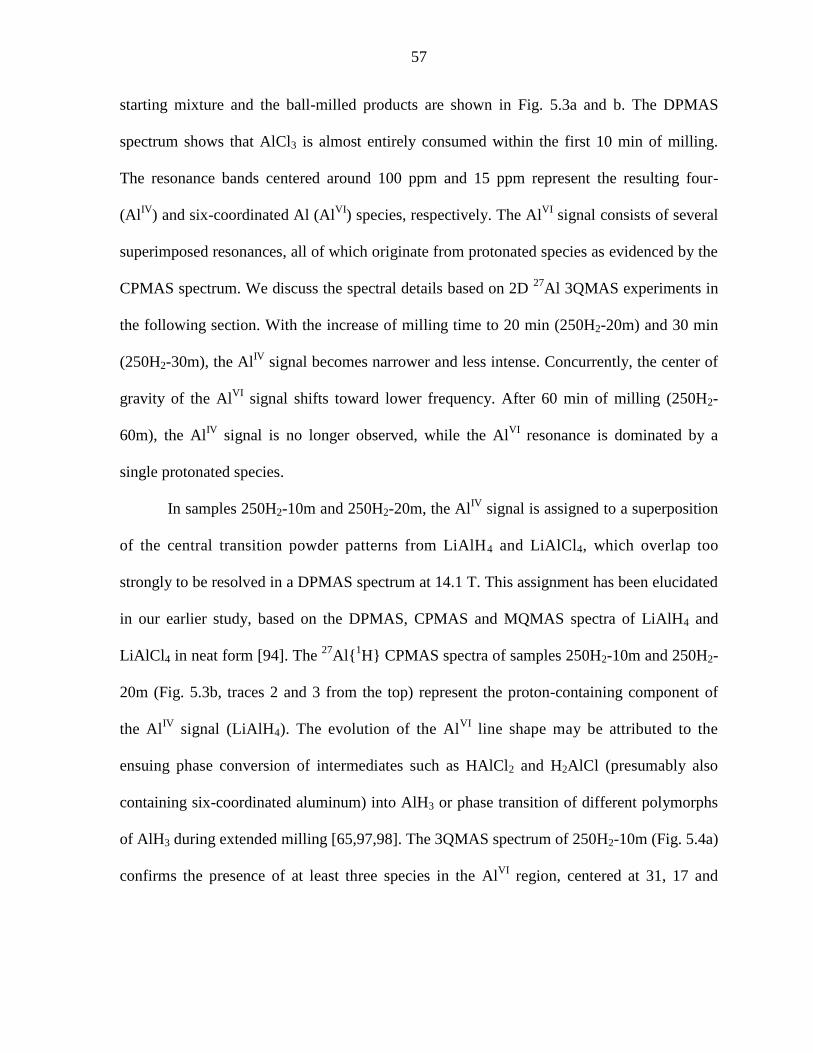
57
starting mixture and the ball-milled products are shown in Fig. 5.3a and b. The DPMAS
spectrum shows that AlCl3 is almost entirely consumed within the first 10 min of milling.
The resonance bands centered around 100 ppm and 15 ppm represent the resulting four-
(AlIV
) and six-coordinated Al (AlVI
) species, respectively. The AlVI
signal consists of several
superimposed resonances, all of which originate from protonated species as evidenced by the
CPMAS spectrum. We discuss the spectral details based on 2D 27
Al 3QMAS experiments in
the following section. With the increase of milling time to 20 min (250H2-20m) and 30 min
(250H2-30m), the AlIV
signal becomes narrower and less intense. Concurrently, the center of
gravity of the AlVI
signal shifts toward lower frequency. After 60 min of milling (250H2-
60m), the AlIV
signal is no longer observed, while the AlVI
resonance is dominated by a
single protonated species.
In samples 250H2-10m and 250H2-20m, the AlIV
signal is assigned to a superposition
of the central transition powder patterns from LiAlH4 and LiAlCl4, which overlap too
strongly to be resolved in a DPMAS spectrum at 14.1 T. This assignment has been elucidated
in our earlier study, based on the DPMAS, CPMAS and MQMAS spectra of LiAlH4 and
LiAlCl4 in neat form [94]. The 27
Al{1H} CPMAS spectra of samples 250H2-10m and 250H2-
20m (Fig. 5.3b, traces 2 and 3 from the top) represent the proton-containing component of
the AlIV
signal (LiAlH4). The evolution of the AlVI
line shape may be attributed to the
ensuing phase conversion of intermediates such as HAlCl2 and H2AlCl (presumably also
containing six-coordinated aluminum) into AlH3 or phase transition of different polymorphs
of AlH3 during extended milling [65,97,98]. The 3QMAS spectrum of 250H2-10m (Fig. 5.4a)
confirms the presence of at least three species in the AlVI
region, centered at 31, 17 and
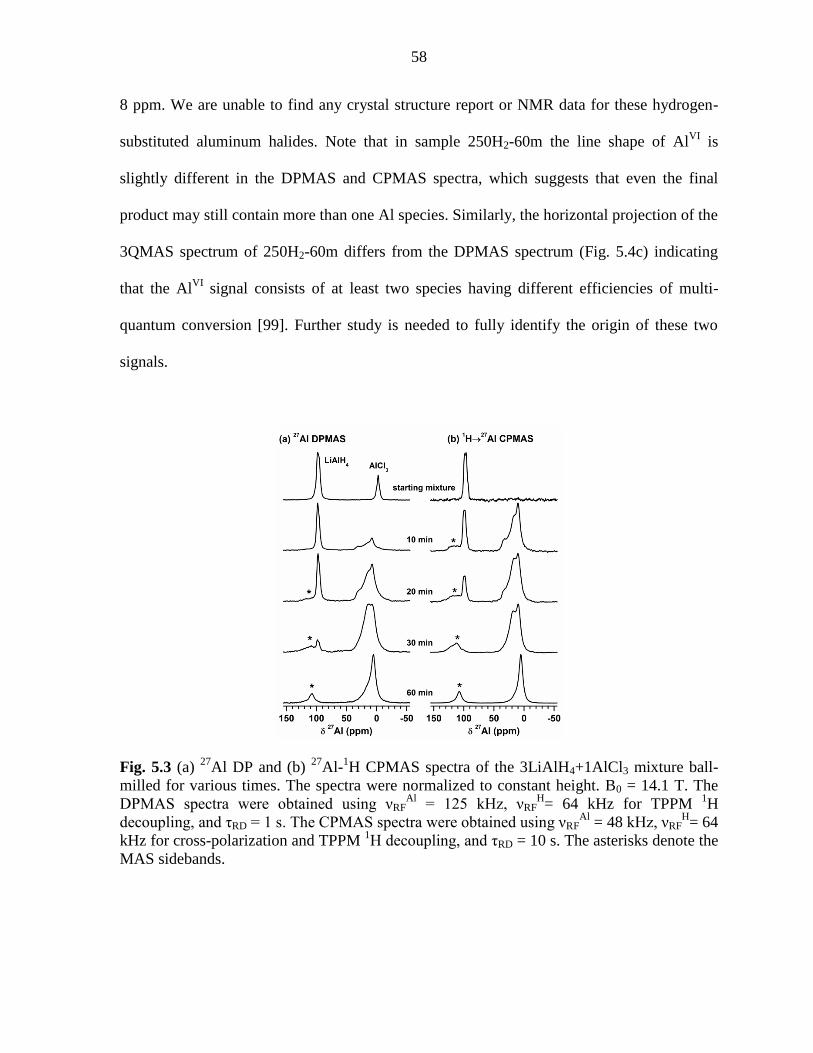
58
8 ppm. We are unable to find any crystal structure report or NMR data for these hydrogen-
substituted aluminum halides. Note that in sample 250H2-60m the line shape of AlVI
is
slightly different in the DPMAS and CPMAS spectra, which suggests that even the final
product may still contain more than one Al species. Similarly, the horizontal projection of the
3QMAS spectrum of 250H2-60m differs from the DPMAS spectrum (Fig. 5.4c) indicating
that the AlVI
signal consists of at least two species having different efficiencies of multi-
quantum conversion [99]. Further study is needed to fully identify the origin of these two
signals.
Fig. 5.3 (a) 27
Al DP and (b) 27
Al-1H CPMAS spectra of the 3LiAlH4+1AlCl3 mixture ball-
milled for various times. The spectra were normalized to constant height. B0 = 14.1 T. The
DPMAS spectra were obtained using νRFAl
= 125 kHz, νRFH= 64 kHz for TPPM
1H
decoupling, and τRD = 1 s. The CPMAS spectra were obtained using νRFAl
= 48 kHz, νRFH= 64
kHz for cross-polarization and TPPM 1H decoupling, and τRD = 10 s. The asterisks denote the
MAS sidebands.

59
Fig. 5.4 3QMAS spectra of (a) 250H2-10m, (b) 250H2-60m and (c) the horizontal projection
of b. The spectra were obtained at B0 = 14.1 T using νRFAl
= 125 kHz and 15 kHz for hard
and soft (Z-filter) pulses, respectively, and νRFH= 64 kHz for TPPM
1H decoupling. The data
were acquired in 128 rows with Δt1 = 15.6 μs, and τRD = 10 s.
These above results might suggest that pc pertains to the suppression of the
decomposition of nascent AlH3 to metallic Al under the mechanochemical conditions used in
these reactions (for example, due to momentary local temperature rise that may become quite
large in a high-energy ball mill). This argument, however, is weak because the equilibrium
pressure (7,000–25,000 bar) for synthesis of AlH3 directly from elemental Al and gaseous
hydrogen [72] is orders of magnitude higher than pressures used in our experiments (ca. 200
bar). Also, local temperature increases are generally transient (lasting on the order of
milliseconds [100]) and the average temperature rise of the entire vial is negligible, compared
to the onset of thermal decomposition of AlH3 (see Fig. 5.1b). Considering that
thermodynamically unstable AlH3 is kinetically stable at room temperature, millisecond-long
temperature spikes should not lead to a measurable decomposition of AlH3. Furthermore, an
uninterrupted milling sequence, in which the vials did not have time to dissipate heat
between milling cycles, thereby possibly raising the average temperature in the vials by a few
degrees (although the vials were barely warm to the touch immediately after the mill was
stopped), does not yield any metallic Al after 60 min of continuous milling at 250 bar. More
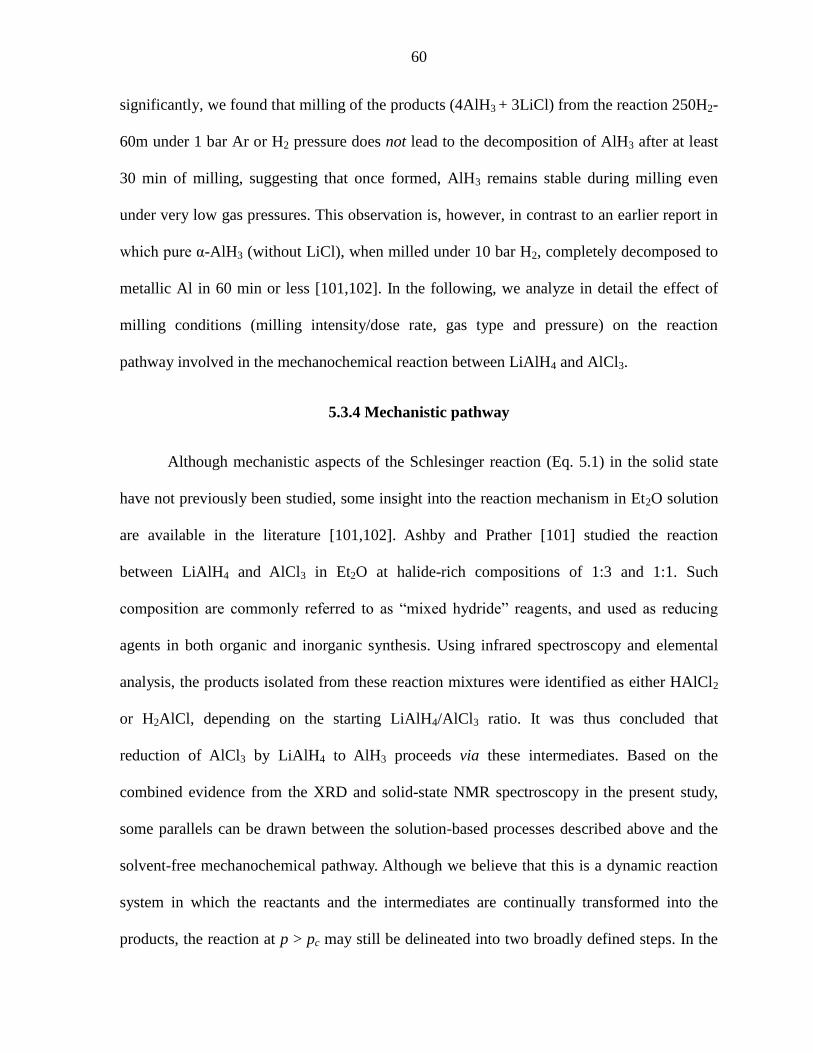
60
significantly, we found that milling of the products (4AlH3 + 3LiCl) from the reaction 250H2-
60m under 1 bar Ar or H2 pressure does not lead to the decomposition of AlH3 after at least
30 min of milling, suggesting that once formed, AlH3 remains stable during milling even
under very low gas pressures. This observation is, however, in contrast to an earlier report in
which pure α-AlH3 (without LiCl), when milled under 10 bar H2, completely decomposed to
metallic Al in 60 min or less [101,102]. In the following, we analyze in detail the effect of
milling conditions (milling intensity/dose rate, gas type and pressure) on the reaction
pathway involved in the mechanochemical reaction between LiAlH4 and AlCl3.
5.3.4 Mechanistic pathway
Although mechanistic aspects of the Schlesinger reaction (Eq. 5.1) in the solid state
have not previously been studied, some insight into the reaction mechanism in Et2O solution
are available in the literature [101,102]. Ashby and Prather [101] studied the reaction
between LiAlH4 and AlCl3 in Et2O at halide-rich compositions of 1:3 and 1:1. Such
composition are commonly referred to as “mixed hydride” reagents, and used as reducing
agents in both organic and inorganic synthesis. Using infrared spectroscopy and elemental
analysis, the products isolated from these reaction mixtures were identified as either HAlCl2
or H2AlCl, depending on the starting LiAlH4/AlCl3 ratio. It was thus concluded that
reduction of AlCl3 by LiAlH4 to AlH3 proceeds via these intermediates. Based on the
combined evidence from the XRD and solid-state NMR spectroscopy in the present study,
some parallels can be drawn between the solution-based processes described above and the
solvent-free mechanochemical pathway. Although we believe that this is a dynamic reaction
system in which the reactants and the intermediates are continually transformed into the
products, the reaction at p > pc may still be delineated into two broadly defined steps. In the

61
first step, some of the LiAlH4 reacts with all of AlCl3 to form a mixture of LiAlCl4,
hydrogen-substituted aluminum chlorides, and/or aluminum trihydride according to the
following reaction:
xLiAlH4 + AlCl3 → xLiAlCl4 + AlCl3–4xH4x, (5.3a)
in which, x can be (HAlCl2), H2AlCl or (AlH3) in a weighted proportion such
that the total values of Al, Cl and H are 1, 3–4x and 4x, respectively. In the second step, the
so-formed LiAlCl4 and the mixture of AlCl3–4xH4x react with the remaining LiAlH4:
xLiAlCl4 + AlCl3–4xH4x + 3–xLiAlH4 → 4AlH3 + 3LiCl, (5.3b)
yielding the overall reaction shown in Eq. 5.2.
To elucidate the dependence of the reaction course on the applied pressure, we
examined reactions 5.3a and 5.3b separately in two different experiments. In the first
experiment, LiAlH4 and AlCl3 were processed in the molar ratio of :1 (for x = ) in a
high-energy SPEX mill under ambient argon pressure. The value of x was chosen according
to the following model reaction:
LiAlH4 + AlCl3 → LiAlCl4 + AlH3 (5.4a)
After 1 h of milling, the XRD pattern (Fig. 5.5g) indicates the formation of the
LiAlCl4 phase without the presence of any detectable amounts of metallic Al. It thus
becomes clear that pressure dependence of this mechanochemical reaction pathway is not
linked to the first step (reaction 5.3a), but to the second step (reaction 5.3b), as confirmed
below. It also implies that reaction 5.3a is a common pathway irrespective of the applied
pressure regimes, which in turn explains the formation of a small amount of aluminum
hydride even below pc, as observed by the release of hydrogen from the sample 100H2-30m.
The LiAlH4:1AlCl3 mixture after the mechanochemical reaction is complete, reveals the
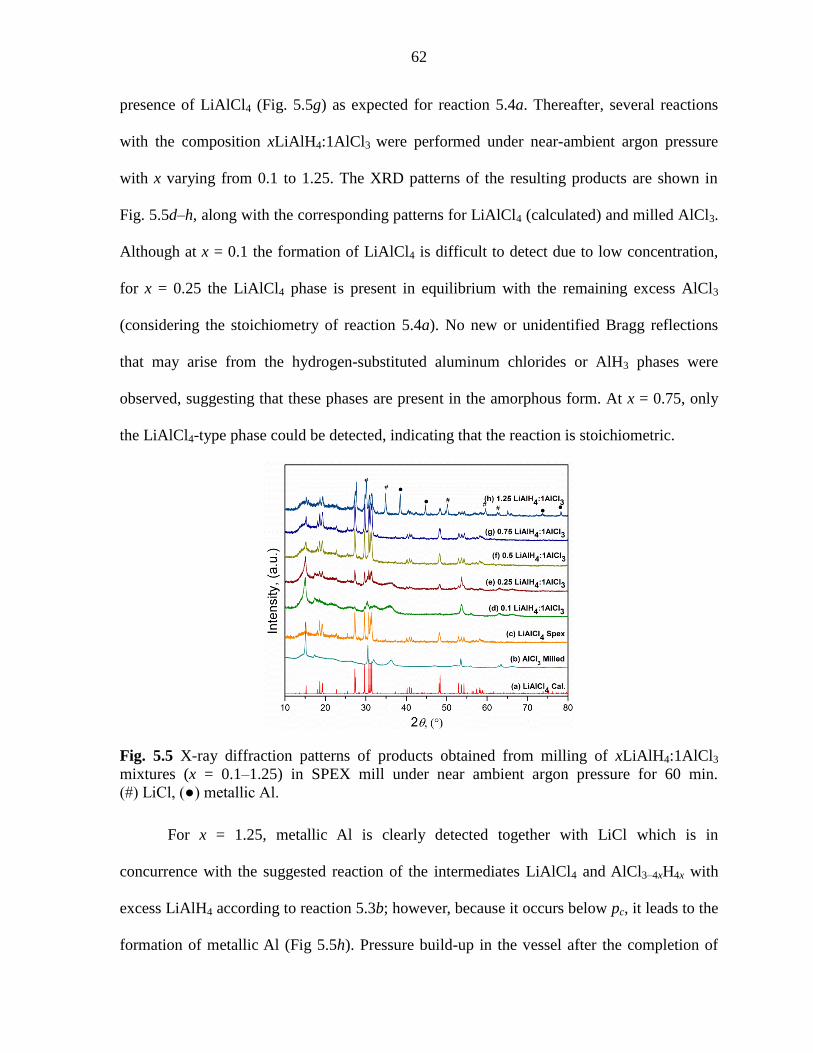
62
presence of LiAlCl4 (Fig. 5.5g) as expected for reaction 5.4a. Thereafter, several reactions
with the composition xLiAlH4:1AlCl3 were performed under near-ambient argon pressure
with x varying from 0.1 to 1.25. The XRD patterns of the resulting products are shown in
Fig. 5.5d–h, along with the corresponding patterns for LiAlCl4 (calculated) and milled AlCl3.
Although at x = 0.1 the formation of LiAlCl4 is difficult to detect due to low concentration,
for x = 0.25 the LiAlCl4 phase is present in equilibrium with the remaining excess AlCl3
(considering the stoichiometry of reaction 5.4a). No new or unidentified Bragg reflections
that may arise from the hydrogen-substituted aluminum chlorides or AlH3 phases were
observed, suggesting that these phases are present in the amorphous form. At x = 0.75, only
the LiAlCl4-type phase could be detected, indicating that the reaction is stoichiometric.
Fig. 5.5 X-ray diffraction patterns of products obtained from milling of xLiAlH4:1AlCl3
mixtures (x = 0.1–1.25) in SPEX mill under near ambient argon pressure for 60 min.
(#) LiCl, (●) metallic Al.
For x = 1.25, metallic Al is clearly detected together with LiCl which is in
concurrence with the suggested reaction of the intermediates LiAlCl4 and AlCl3–4xH4x with
excess LiAlH4 according to reaction 5.3b; however, because it occurs below pc, it leads to the
formation of metallic Al (Fig 5.5h). Pressure build-up in the vessel after the completion of
63
the reaction was accordingly observed for x = 1.25, but not for the other examined
stoichiometries.
The 27
Al solid-state NMR data were collected for samples with fractional
compositions (x = 0.25, 0.33 and 0.5) in order to be able to identify and distinguish species
such as H2AlCl and HAlCl2, but the signals, while clearly suggesting the presence of multiple
species, could not be unambiguously deconvoluted (Fig 5.6).
Fig 5.6 27
Al DPMAS spectra (black) obtained for samples xLiAlH4–AlCl3 (x = 0.25, 0.33 and
0.5) shown together with their respective 273
Al{1H} CPMAS spectra (blue). Shift positions of
the relevant reference compounds are indicated by short, color-coded lines given along the
baseline of each spectrum, while those given in black at the top of the figure correspond to
the approximate shift observed for the samples of interest. A percentage represents the
integrated area of the DPMAS signal. Note also, that an absolute intensity scale has been
maintained within the set of DPMAS spectra, as well as within the set of CPMAS spectra.
The 27
Al spectra were obtained using a 400-MHz Agilent DD2 spectrometer equipped with a
3.2-mm Otsuka double resonance probe at a frequency of 104.2 MHz and a 1H frequency of
400.0 MHz. For 27
Al DPMAS: νRF(27
Al) = 125 kHz during excitation (used in conjunction
with a flip angle of 11°); νRF(1H) = 64 kHz during TPPM decoupling; τRD = 1 s; NS = 256;
νR = 16 kHz. For 27
Al{1H} CPMAS: νRF(
1H) = 100 kHz during excitation and 64 kHz during
CP and TPPM decoupling; νRF(27
Al) = 48 kHz during CP; τCP = 0.2 ms; τRD = 60 s; NS = 512;
νR = 16 kHz. All the reactions were performed in a SPEX ball mill under Ar for 60 minutes.
64
In the 27
Al DPMAS spectra (Fig. 5.6, black), at least three different 27
Al sites are
observed: i) the high-frequency peak centered at ca. 96 ppm, ii) the broad signal centered at
ca.10 ppm, and iii) the narrow peak occurring at approximately –1 ppm. The latter appears to
correspond with AlCl3 based on its highly symmetrical line shape and a previously obtained
reference spectrum. The broad resonance corresponds to AlVI
species, which, based on the
Gaussian-like peak shape, is subjected to a highly disordered environment. The high-
frequency peak (ca. 96 ppm) in the DPMAS spectra may arise either from LiAlH4, LiAlCl4,
or a mixture of the two since there is only a very small shift difference between these species.
However, from the CPMAS spectra (blue line) it is clear that the observed signal arise from
LiAlCl4 since there is no evidence of a proton-containing species. Other features to note from
the CPMAS data are: i) the difference in the region of the AlVI
signal observed in the 0.25:1
sample relative those in the 0.33:1 and 0.5:1 spectra; it is quite evident from the peak shape
that the former shows at least two AlVI
sites, ii) the small left-shift in the CPMAS spectrum
of the 0.33:1 sample associated with the AlVI
resonance, which is consistent with there being
more than one AlVI
environment. Also, the appearance of a small signal near –50 ppm (~1%
of spectral area) in the 0.33:1 DPMAS spectrum is noted. As this signal is not observed in the
0.25:1 or 0.5:1 samples, this small peak suggests the presence of an additional, though minor,
species in the 0.33:1 sample.
The TPD of the product from the x = 0.75 reaction (not shown) is typical of the
thermal decomposition of AlH3; the total yield of 1.8 wt% hydrogen is in good agreement
with the expected theoretical capacity of 1.85 wt%, suggesting that i) the reaction 5.4a is
quantitative, and ii) all of the hydrogen is retained in the system, and is associated with AlVI
after the milling.
65
Reaction 5.3b in the proposed pathway, and the dependence of its final products on
applied pressure, was also confirmed independently of the first step via two different
approaches.
Approach 1: In the first case, the product obtained from reaction 5.4a
( LiAlH4:1AlCl3 in SPEX mill) was mixed with additional mole eq. of LiAlH4, i.e. by
adding LiAlH4 in a stoichiometric amount corresponding to a 3LiAlH4:1AlCl3 overall
reaction. This mixture was then processed in a Fritsch mill under hydrogen pressure using the
standard milling conditions. As expected, the reaction carried out at 250 bar H2 yields only α-
AlH3 and LiCl, whereas the reaction at 100 bar H2 predominantly yields metallic Al and
LiCl, as shown below in Eqs. 5.4b and 5.4c, respectively (assuming 60/40 overall conversion
into Al/AlH3; see above and [60]), and in Fig. 5.7a.
LiAlH4 + AlCl3
LiAlCl4 + AlH3 (5.4a)
4AlH3 + 3LiCl (5.4b)
2.4Al + 1.6AlH3 + 3LiCl + 3.6H2 (5.4c)
As discussed above, once formed, AlH3 is stable during the mechanochemical
processing. Therefore, the mechanochemical reaction between 1 mole eq. of LiAlCl4 and
3 mole eq. of LiAlH4 at pressures below pc leads to the conversion of 0.8 mole eq. of Al to
AlH3, while the remaining 3.2 mole eq. of Al available in both LiAlCl4 and LiAlH4 is
converted into metallic Al. Appearance of small amounts of both α-AlH3 and α'-AlH3 phases
in the reaction completed at 100 bar H2 is in line with the products obtained from the 3:1
LiAlH4:AlCl3 reactions carried out at p < pc (Fig. 5.7a, pattern 5b). Desorption characteristics
SPEX, Ar
LiAlCl4 + AlH3 + LiAlH4
250bar H2
100bar H2
Approach 1
66
of the sample prepared by utilizing reaction 5.4a followed by processing at 250 bar (reaction
5.4b) is typical of pure AlH3 yielding 4.8 wt % H2, which is in excellent agreement with the
net reaction 5.2 with nearly quantitative yield.
Approach 2: In this approach, pure LiAlCl4 was first prepared by reacting 1:1 molar
mixture of LiCl and AlCl3 in a SPEX mill (reaction 5.5a). After 60 min of milling, X-ray
pure LiAlCl4 was obtained (Fig. 5.7b, pattern 6a), which was then milled with LiAlH4 in a
Fritsch mill under standard milling conditions at 250 bar H2 (reaction 5.5b) and 100 bar H2
(reaction 5.5c) with an overall composition of 1:3 (reaction 5.5c below is written assuming
the same rate of conversion of the four-coordinated aluminum into metallic Al and AlH3 as
reaction 5.4c).
LiCl + AlCl3 LiAlCl4 (5.5a)
4AlH3 + 4LiCl (5.5b)
3.2Al + 0.8AlH3 + 4LiCl + 4.8H2 (5.5c)
Fig. 5.7b also shows the XRD patterns of samples prepared by the two reactions
carried out above and below pc. As expected, the reaction at 250 bar yields α-AlH3 and LiCl,
whereas the reaction at 100 bar yields metallic Al and LiCl, and only a minor fraction of
mixture of α-AlH3 and α'-AlH3. The relative intensities of Bragg peaks in Fig. 5.7 are
consistent with the higher concentrations of AlH3 in reactions 5.4b and 5.4c, compared to
reactions 5.5b and 5.5c.
SPEX, Ar
LiAlCl4 + 3LiAlH4
250bar H2
100bar H2
Approach 2
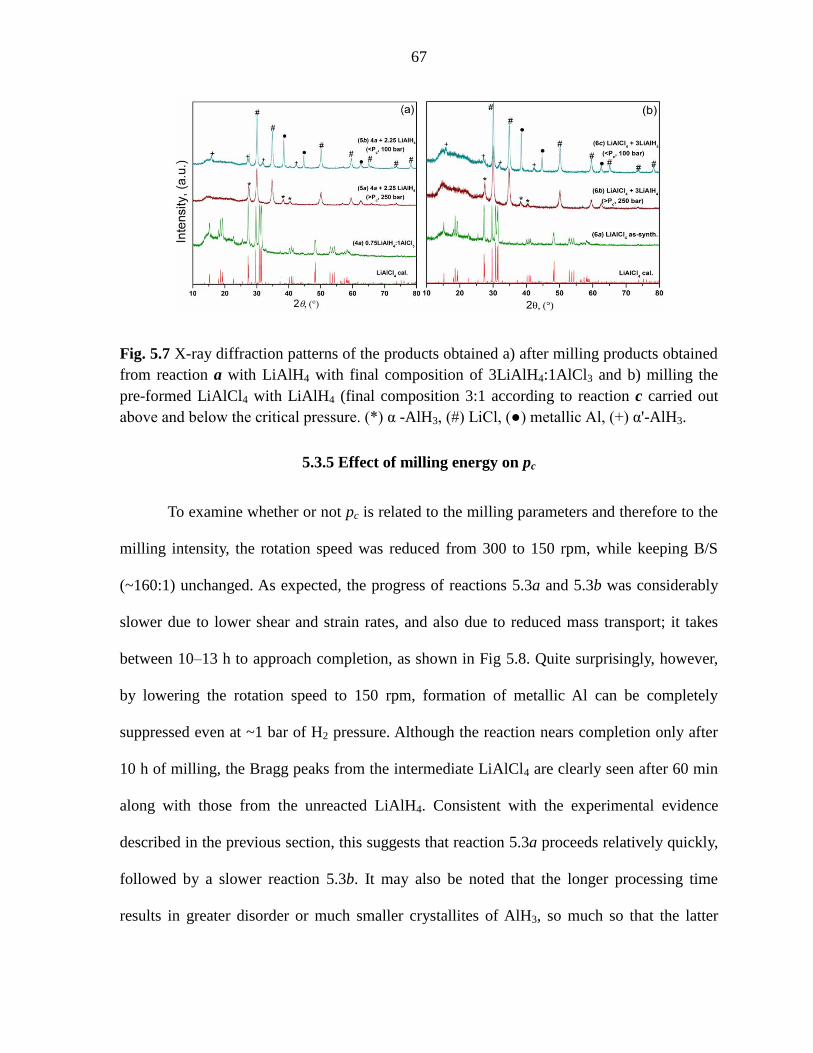
67
Fig. 5.7 X-ray diffraction patterns of the products obtained a) after milling products obtained
from reaction a with LiAlH4 with final composition of 3LiAlH4:1AlCl3 and b) milling the
pre-formed LiAlCl4 with LiAlH4 (final composition 3:1 according to reaction c carried out
above and below the critical pressure. (*) α -AlH3, (#) LiCl, (●) metallic Al, (+) α'-AlH3.
5.3.5 Effect of milling energy on pc
To examine whether or not pc is related to the milling parameters and therefore to the
milling intensity, the rotation speed was reduced from 300 to 150 rpm, while keeping B/S
(~160:1) unchanged. As expected, the progress of reactions 5.3a and 5.3b was considerably
slower due to lower shear and strain rates, and also due to reduced mass transport; it takes
between 10–13 h to approach completion, as shown in Fig 5.8. Quite surprisingly, however,
by lowering the rotation speed to 150 rpm, formation of metallic Al can be completely
suppressed even at ~1 bar of H2 pressure. Although the reaction nears completion only after
10 h of milling, the Bragg peaks from the intermediate LiAlCl4 are clearly seen after 60 min
along with those from the unreacted LiAlH4. Consistent with the experimental evidence
described in the previous section, this suggests that reaction 5.3a proceeds relatively quickly,
followed by a slower reaction 5.3b. It may also be noted that the longer processing time
results in greater disorder or much smaller crystallites of AlH3, so much so that the latter
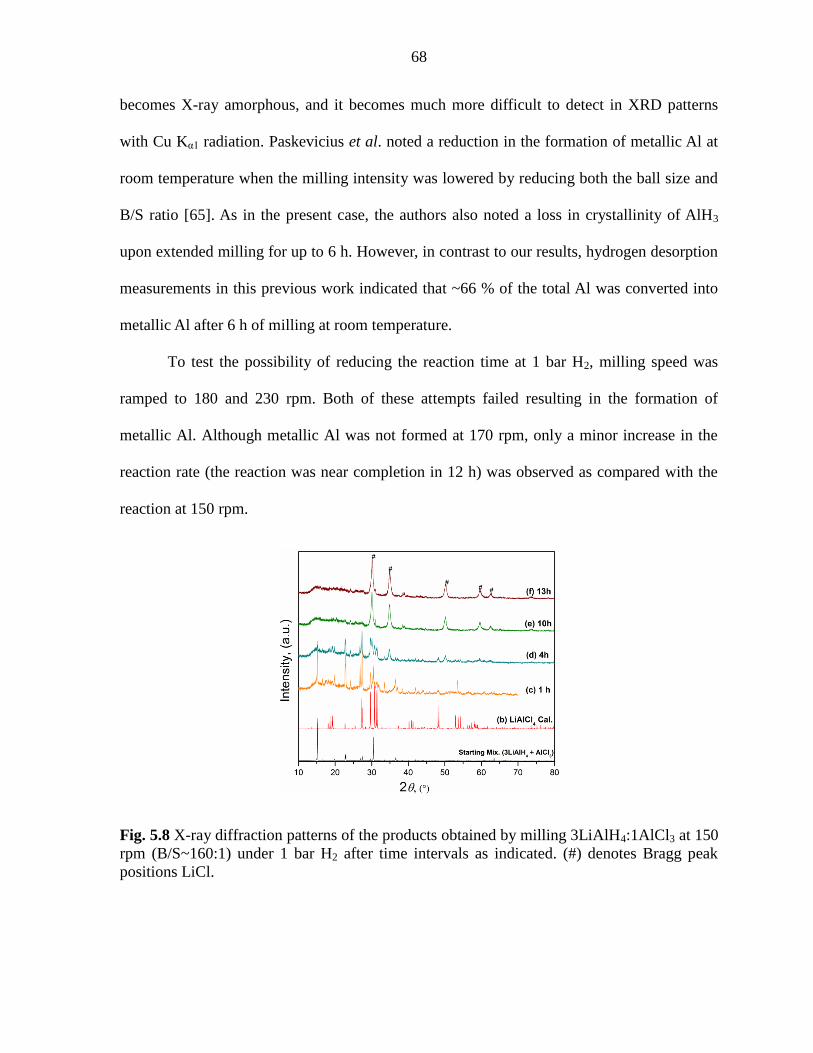
68
becomes X-ray amorphous, and it becomes much more difficult to detect in XRD patterns
with Cu Kα1 radiation. Paskevicius et al. noted a reduction in the formation of metallic Al at
room temperature when the milling intensity was lowered by reducing both the ball size and
B/S ratio [65]. As in the present case, the authors also noted a loss in crystallinity of AlH3
upon extended milling for up to 6 h. However, in contrast to our results, hydrogen desorption
measurements in this previous work indicated that ~66 % of the total Al was converted into
metallic Al after 6 h of milling at room temperature.
To test the possibility of reducing the reaction time at 1 bar H2, milling speed was
ramped to 180 and 230 rpm. Both of these attempts failed resulting in the formation of
metallic Al. Although metallic Al was not formed at 170 rpm, only a minor increase in the
reaction rate (the reaction was near completion in 12 h) was observed as compared with the
reaction at 150 rpm.
Fig. 5.8 X-ray diffraction patterns of the products obtained by milling 3LiAlH4:1AlCl3 at 150
rpm (B/S~160:1) under 1 bar H2 after time intervals as indicated. (#) denotes Bragg peak
positions LiCl.
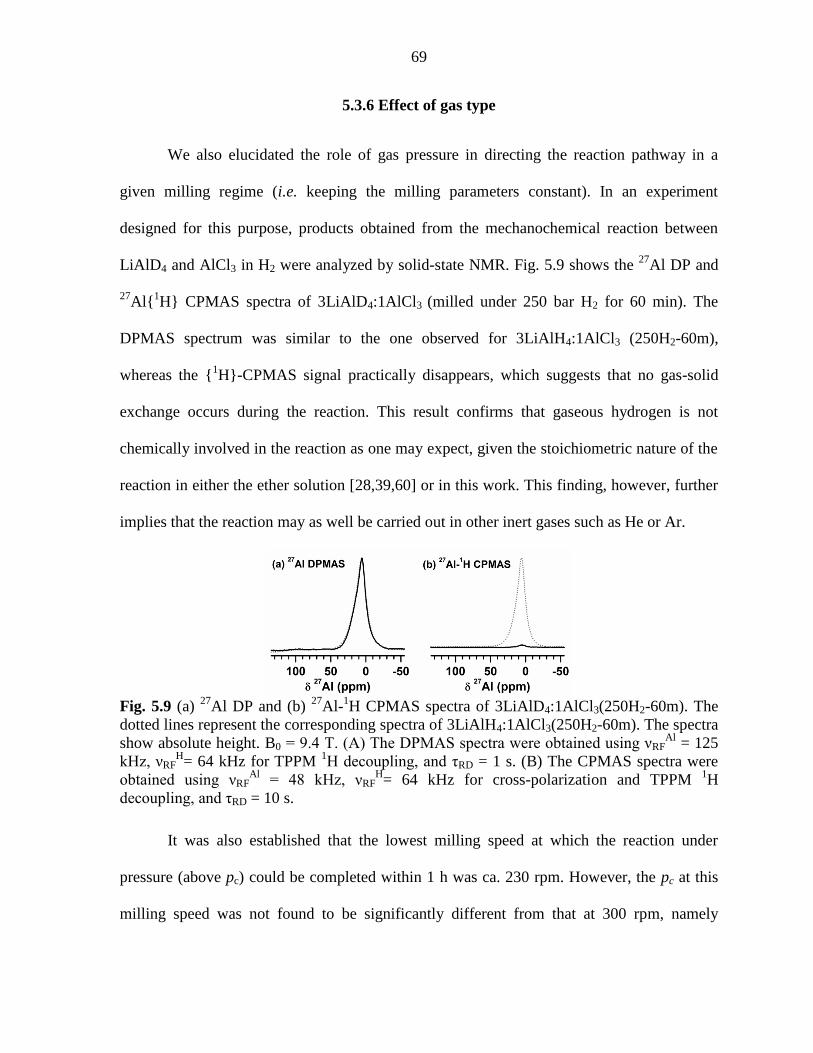
69
5.3.6 Effect of gas type
We also elucidated the role of gas pressure in directing the reaction pathway in a
given milling regime (i.e. keeping the milling parameters constant). In an experiment
designed for this purpose, products obtained from the mechanochemical reaction between
LiAlD4 and AlCl3 in H2 were analyzed by solid-state NMR. Fig. 5.9 shows the 27
Al DP and
27Al{
1H} CPMAS spectra of 3LiAlD4:1AlCl3 (milled under 250 bar H2 for 60 min). The
DPMAS spectrum was similar to the one observed for 3LiAlH4:1AlCl3 (250H2-60m),
whereas the {1H}-CPMAS signal practically disappears, which suggests that no gas-solid
exchange occurs during the reaction. This result confirms that gaseous hydrogen is not
chemically involved in the reaction as one may expect, given the stoichiometric nature of the
reaction in either the ether solution [28,39,60] or in this work. This finding, however, further
implies that the reaction may as well be carried out in other inert gases such as He or Ar.
Fig. 5.9 (a)
27Al DP and (b)
27Al-
1H CPMAS spectra of 3LiAlD4:1AlCl3(250H2-60m). The
dotted lines represent the corresponding spectra of 3LiAlH4:1AlCl3(250H2-60m). The spectra
show absolute height. B0 = 9.4 T. (A) The DPMAS spectra were obtained using νRFAl
= 125
kHz, νRFH= 64 kHz for TPPM
1H decoupling, and τRD = 1 s. (B) The CPMAS spectra were
obtained using νRFAl
= 48 kHz, νRFH= 64 kHz for cross-polarization and TPPM
1H
decoupling, and τRD = 10 s.
It was also established that the lowest milling speed at which the reaction under
pressure (above pc) could be completed within 1 h was ca. 230 rpm. However, the pc at this
milling speed was not found to be significantly different from that at 300 rpm, namely

70
between 180–210 bar. This indicates that there is a cut-off speed/rate above which the
application of pressure becomes essential. Based on these experiments, we conclude that i)
there is a threshold mechanical energy delivery rate (controlled by rpm at constant B/S) that
requires introduction of gas pressures exceeding pc in order to suppress reactions 5.4c and
5.5c, and ii) once the threshold is reached and exceeded, the reaction kinetics is not changed
since all of the reactions are finished within 1 h, and is invariant of the applied pressure.
We therefore examined this mechanochemical reaction under He and Ar pressures.
The XRD patterns of products milled under pHe and pAr are shown in Fig. 5.10 patterns b and
c, and patterns d, e and f, respectively. Under standard milling conditions, in contrast to the
reactions under H2, metallic Al was detected only in the samples that were milled under
pHe < 150 bar and pAr < 90 bar. Thus, in general pc drops when a gas with higher molecular
weight is used, which demonstrates that pc is affected by the physical properties of the
ambient atmosphere, i.e. by the simple presence of high-pressure gas as a processing
medium. Although pc is lowered in a He atmosphere when compared to H2, the reaction is
still complete within 60 min (150He-60m). This serves as evidence that the drop in pc is not
necessarily a manifestation of a lower reaction rate but is rather controlled by the mechanical
energy dose rate. In Ar, reaction kinetics is slower as noted by the presence of unreacted
LiAlH4 after 60 min (90Ar-60m), perhaps due to a more severe obstruction of the motion of
the balls by the denser gaseous medium.
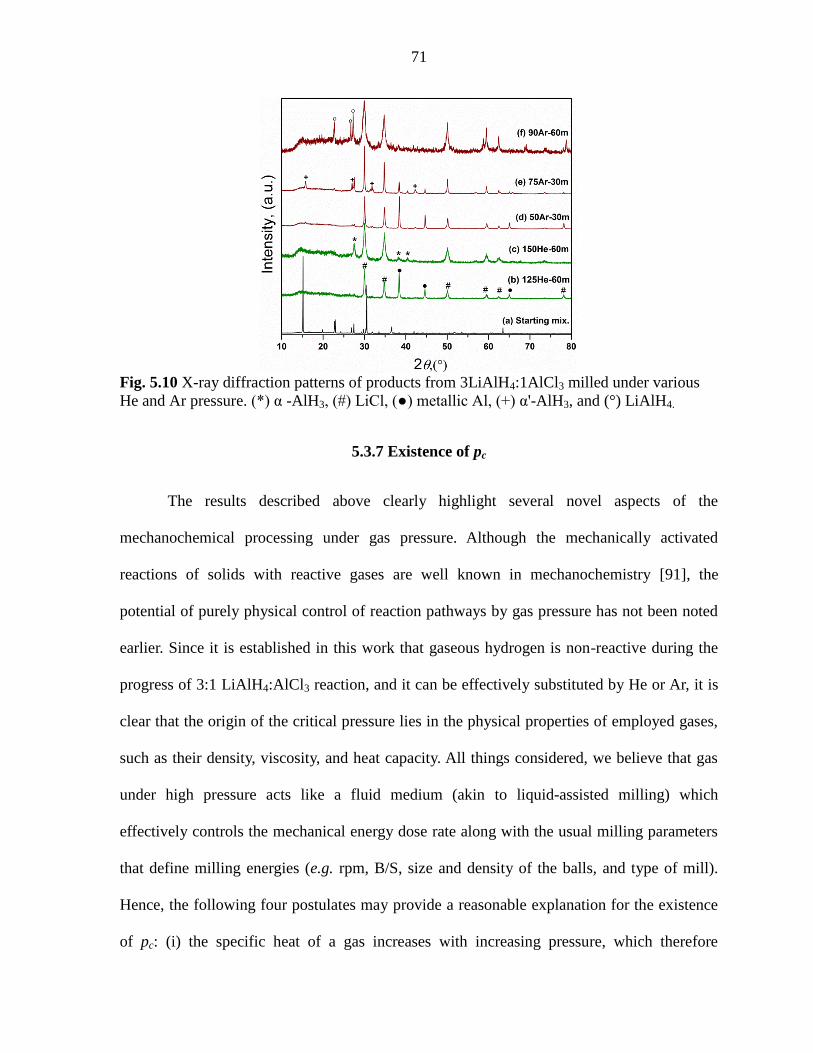
71
Fig. 5.10 X-ray diffraction patterns of products from 3LiAlH4:1AlCl3 milled under various
He and Ar pressure. (*) α -AlH3, (#) LiCl, (●) metallic Al, (+) α'-AlH3, and (°) LiAlH4.
5.3.7 Existence of pc
The results described above clearly highlight several novel aspects of the
mechanochemical processing under gas pressure. Although the mechanically activated
reactions of solids with reactive gases are well known in mechanochemistry [91], the
potential of purely physical control of reaction pathways by gas pressure has not been noted
earlier. Since it is established in this work that gaseous hydrogen is non-reactive during the
progress of 3:1 LiAlH4:AlCl3 reaction, and it can be effectively substituted by He or Ar, it is
clear that the origin of the critical pressure lies in the physical properties of employed gases,
such as their density, viscosity, and heat capacity. All things considered, we believe that gas
under high pressure acts like a fluid medium (akin to liquid-assisted milling) which
effectively controls the mechanical energy dose rate along with the usual milling parameters
that define milling energies (e.g. rpm, B/S, size and density of the balls, and type of mill).
Hence, the following four postulates may provide a reasonable explanation for the existence
of pc: (i) the specific heat of a gas increases with increasing pressure, which therefore
72
provides faster and more effective removal of heat generated during the milling; (ii) the
viscosity of a gas increases with increasing pressure, leading to a proportional reduction of
the kinetic energy of the balls, thus lowering the mechanical energy dose rate delivered to the
reactants, intermediates and products; (iii) since the starting materials, intermediates, and
products are soft, their compressibilities are high, and therefore, diffusivity of ions should be
strongly affected by the increasing pressure, in turn affecting the reaction pathway(s); and
(iv) any change in the applied pressure may alter the microstructural evolution and hence
change the reaction pathway(s), which partly explains why other systems (e.g. 3NaAlH4-
AlCl3) show much different pc values when processed under identical conditions [89].
Experimental evidence also suggests that metallic Al that forms at p < pc is not likely
to result from the decomposition of nascent AlH3 due to heat generated during milling (see
reaction 5.3a and relevant discussion). Although milling under cryogenic temperature
suppresses the formation of metallic Al [66], it is unclear whether prevention of AlH3
decomposition or an effect similar to that caused by the elevated gaseous medium pressure,
i.e. effective reduction of the mechanical energy dose rate, is responsible. It is worth
mentioning here that the piston-driven SPEX-freezer mill used for cryomilling in Ref. 66 is a
relatively low-energy mill.
5.3.8 Towards identifying the atomistic mechanism
Although the mechanochemical pathway of this reaction is unequivocally established
by the results described above, the actual atomistic mechanism of any and all of the reactions
5.3a – 5.5c remains elusive. What appears to be clear is that initially at least a part of the six-
coordinated aluminum in AlCl3 is converted into the four-coordinated aluminum in LiAlCl4,
which is followed by its retransformation into the six-coordinated aluminum in alane.
73
Although the formation of LiAlCl4, which has not been identified as an intermediate in the
Schlesinger reaction, is established beyond doubt, its actual role during the reaction remains
unclear. In a most likely scenario, the multiple signals from AlIV
and AlVI
species (all of
which are hydrogenated after 10 min, see Fig. 5.3) may result from replacing Cl in LiAlCl4
(AlCl3) with hydrogen or vice versa in LiAlH4 (AlH3), leading to formation of LiAlCl4-xHx
(x = 1, 2, 3) and/or AlCl3-xHx (x = 1, 2) species [101]. The former have not been reported nor
identified in the past. The latter, which have been isolated in pure form [101] or as
coordination complexes [102], are known to exist but their crystal or molecular structures
have not been reported. Further, it is likely that LiAlCl4-xHx intermediate species are highly
unstable; therefore, their identification outside the ball milling vial may be impossible. Yet,
considering that all of the Al atoms in the final product are coordinated by six hydrogen
atoms, formation of such species, which are likely short lived, seems inevitable. Regardless
of difficulties with experimental identification and characterization of these and perhaps
other highly transient species, recent advancements in density functional theory may prove
useful in estimating their structures, stability and energetics. Such efforts are underway, and
their results will be reported when they become available.
5.4 Conclusions
A quick and an efficient mechanochemical method for synthesis of AlH3 from a
3LiAlH4-1AlCl3 mixture at room temperature has been developed, and the reaction pathway
has been studied. With the application of various gases (H2, He or Ar), side reactions that
lead to the formation of metallic Al are entirely suppressed, and a nearly complete
conversion of all available Al into AlH3 is achieved between 30–60 minutes. The ability to
successfully synthesize alane via mechanochemistry at room temperature eliminates the need

74
for large amount of solvents or cryogenic cooling to suppress the formation of metallic Al. It
is determined that LiAlCl4 is formed as an intermediate during the first step of the reaction,
which then reacts further with LiAlH4 to form alane and LiCl. We also demonstrated for the
first time that control of mechanical energy dose rate is critical for controlling the reaction
pathway, and that it could be influenced by the applied gas pressure during processing.
Considering the ease of carrying out the reaction under ambient temperature and pressure, the
process can be readily scaled up for industrial production. Moreover, the soft nature of the
precursors leads to a very clean milling process with minimal contamination from the milling
tools. Although the dry mechanochemical process proposed here for the synthesis of AlH3
results in a non-solvated product, obtaining pure AlH3 would of course require removal of
the lithium chloride byproduct.
5.5 Acknowledgements
Research supported by the U.S. Department of Energy, Office of Basic Energy
Sciences, Division of Materials Sciences and Engineering. Ames Laboratory is operated for
the U.S. Department of Energy by Iowa State University under Contract No. DE-AC02-
07CH11358.
75
CHAPTER 6. MECHANOCHEMICAL SYNTHESIS OF ALANE FROM
SODIUM HYDRIDE AND ALUMINUM CHLORIDE
6.1 Introduction
Alane (AlH3) is one of the prospective hydrogen storage materials valued for its high
volumetric and gravimetric hydrogen capacity, as well as favorable thermodynamics and low
desorption temperature. However, the traditional methods for synthesis of AlH3 not only
involve environmentally hazardous organic solvents but also relatively expensive lithium-
containing reactants [28, 39, 60]. Despite lithium is the 33rd
most abundant element in the
Earth crust [107], it is deemed critical due to the rapidly increasing demand by the
explosively growing rechargeable lithium battery industry, and it does not occur in pure form
due to its high reactivity, thereby requiring expensive mining and extraction processes.
Hence, it will be beneficial to develop reactions and processes to synthesize alane using
cheaper, more abundant, and noncritical resources. The most likely substitutes are the
sodium-based precursors, sodium being several orders of magnitude more abundant than
lithium; large quantities of sodium are produced through the electrolysis of molten sodium
chloride that is readily available from seawater, brine, or crystalline NaCl [108].
Therefore, work has been done in past to replace LiH/LiAlH4 with other lithium-free
hydrides, and to develop more economically feasible synthesis routes for alane. For example,
preparation of AlH3 via NaAlH4-AlCl3 reaction in ether-toluene mixture was successful
according to the following equation [109]:
3NaAlH4 +AlCl3 4AlH3 + 3NaCl,
76
which proved to be a lower-cost process and also much faster synthesis method in
comparison to traditional LiAlH4-AlCl3 route by Schlesinger [39]. Another technique uses
highly active NaAlH4 together with AlCl3 in a lower alkyl-dialkyl ether solution [110].
However, despite being less expensive these methods involve use of large amounts of
organic solvents that are environmentally harmful.
In the previous chapters we have described synthesis of alane by a solvent-free
method in a ball-mill using LiH or LiAlH4 and AlCl3 [94, 111]. Here, we describe the
extension of this novel process to 3NaH-AlCl3 system to synthesize adduct-free alane at
room temperature.
6.2 Results and discussion
Using ball milling under hydrogen pressure, we demonstrated synthesis of alane from
commercially available NaH and AlCl3. Dependence of product yield on milling time,
intensity and stoichiometry of starting reactants was investigated. The samples were prepared
by ball milling in Fritsch Pulverisette P7 planetary mill at 300 rpm and 350 bar of hydrogen
pressure. The phase composition of obtained samples was determined by means of powder
XRD and solid-state NMR as described previously for the LiH/LiAlH4-AlCl3 systems. The
total hydrogen content of the milled product was determined by temperature programmed
desorption tests in a Sieverts-type apparatus.
Based on the experience gained from previously investigated LiH-AlCl3 system,
we have analyzed single-step reactions for different NaH:AlCl3 ratios (3:1, 4:1, 6:1 and
9:1). A 3:1 molar mixture of NaH and AlCl3 was prepared and processed
mechanochemically at 300 rpm under 350 bar of H2 pressure. After 60 min of milling

77
Fig. 6.1 X-ray diffraction patterns corresponding to as-milled samples with NaH:AlCl3
starting ratios of a) 3:1, b) 6:1 and c) 9:1 after ball milling for 60 min under 350 bar H2 at the
milling speed of 300 rpm and B/S of ~140.
only metallic Al and NaCl were obtained as major products, which is in agreement with
the 3:1 reaction between LiH and AlCl3. The XRD pattern for the corresponding reaction
is shown in Fig. 6.1 (a). As in case of the LiH-AlCl3 system, it was then rationalized that
a larger excess of hydride source in the starting mixture would help to prevent the likely
formation of unstable intermediates that decompose to metallic Al. Thus, varying ratios
of NaH and AlCl3 (large excess of NaH compared to the stoichiometric 3:1) were
examined and once again, it was observed that, the optimum composition of the starting
mixture, that did not result in metallic Al is 9NaH:1AlCl3 (Fig 6.1, pattern c). All
reactions carried out using NaH content less than this optimum resulted in metallic Al
along with unreacted NaH, as shown in Fig. 6.1 (b) for the starting mixture of 6:1 ratio.
Thereafter, the sample with 9:1 ratio was examined at various stages of milling and the

78
product obtained after 60 min of milling was subsequently used for further
mechanochemical processing with additional AlCl3 to yield AlH3 and NaCl as final
products.
6.2.1 The 9:1 reaction of NaH and AlCl3 (stage 1)
To further investigate the results observed at the starting ratio of 9:1, the reaction
mixture was sampled as a function of milling time and the resulting products and
intermediates were analyzed by XRD (Fig. 6.2), which provided clear and consistent
mechanistic insight into the progression of the 9:1 reaction, as discussed below.
According to the XRD data obtained for BM = 4 min (Fig. 6.2, pattern a), four sets of
Bragg peaks are identified that correspond to the products NaCl (the two most intense peaks
are at 2θ ≈ 32 and 46°) [122], the orthorhombic NaAlCl4 (two sets of clearly identifiable
Bragg peaks are at 2θ ≈ 16–19° and 28–32°) [123, 124], as well as the unreacted NaH (major
Bragg peaks at 2θ ≈ 37 and 53°) [125] and AlCl3 (the most intense Bragg peak is at 2θ ≈ 15°)
[126]. On further milling (BM = 7 min), the peak intensities of NaH decrease and those of
AlCl3 completely disappear. At BM = 10 and 15 min, the XRD patterns clearly show the
formation of NaAlH4 [127] and Na3AlH6 [128] with a concomitant increase in NaCl and
decrease in the NaAlCl4 phase (Fig. 6.2, patterns c and d). At this point, the presence of
NaAlH4 and Na3AlH6 can be explained by the following two well-known transformations
[129]:
NaH + AlH3 → NaAlH4 (6.1a)
2NaH + NaAlH4 → Na3AlH6 (6.1b)

79
Fig. 6.2 X-ray diffraction patterns (a-f) of samples obtained from the 9:1 mixture of NaH and
AlCl3 after ball-milling for the indicated time intervals under 350 bar H2 with a milling speed
of 300 rpm and a B/S of ~140. Note that this reaction corresponds to the first stage of the
stepwise mechanochemical synthesis of alane, as described in section 6.2.1.
At later stages of milling (BM = 30 and 60 min), the phases detected by XRD are
Na3AlH6, NaCl and unreacted NaH (Fig. 6.2, patterns e and f). The complete consumption of
NaAlH4 formed early in the reaction, can likewise be understood on the basis of Eq. 6.1b,
marking the end of stage 1.
Solid-state NMR measurements were carried out to ascertain that no additional
intermediate phase(s) is present in the sample that is amorphous and hence remain undetected
by diffraction analysis (CuKα1 radiation). The 23
Na DPMAS spectrum of the 9:1 sample at
BM = 60 min, revealed the presence of three different Na-containing species (Fig. 6.3a, stage
1). These include the unreacted NaH represented by peak centered around 19 ppm, signal
coming from NaCl centered around 8 ppm and two weak resonances at 23 and –10 ppm
corresponding to two 23
Na sites of newly formed Na3AlH6 species. Similarly, the 27
Al
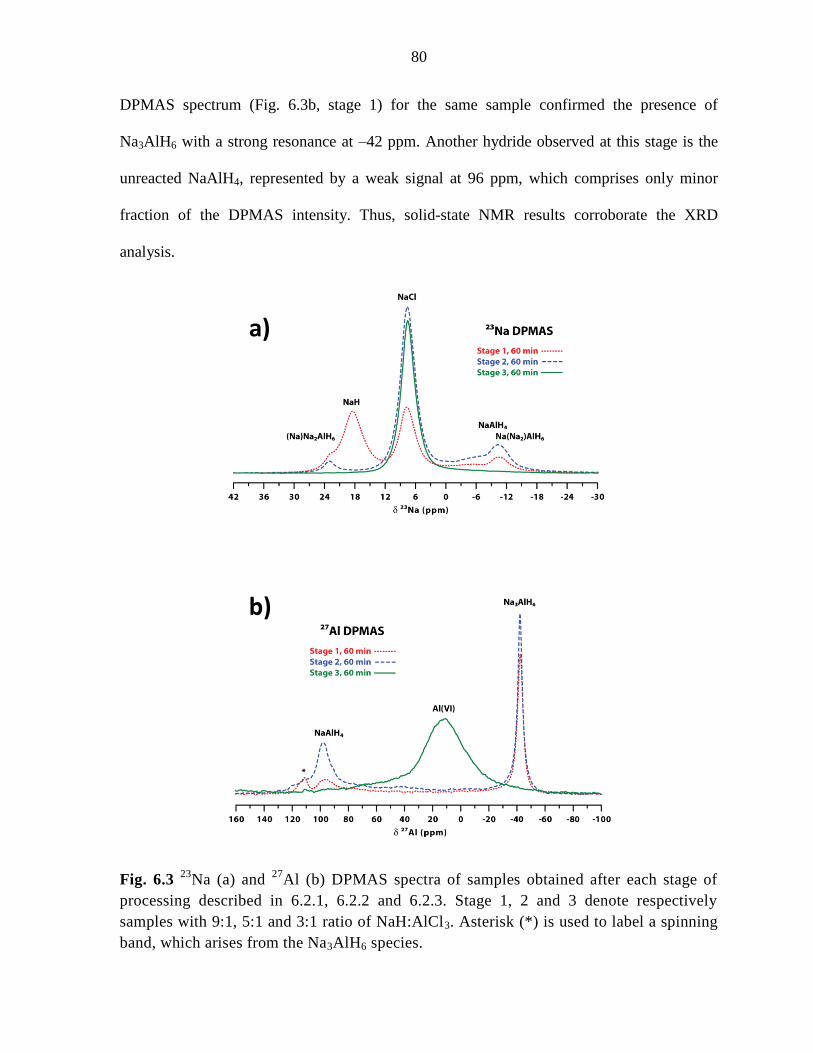
80
DPMAS spectrum (Fig. 6.3b, stage 1) for the same sample confirmed the presence of
Na3AlH6 with a strong resonance at –42 ppm. Another hydride observed at this stage is the
unreacted NaAlH4, represented by a weak signal at 96 ppm, which comprises only minor
fraction of the DPMAS intensity. Thus, solid-state NMR results corroborate the XRD
analysis.
Fig. 6.3 23
Na (a) and 27
Al (b) DPMAS spectra of samples obtained after each stage of
processing described in 6.2.1, 6.2.2 and 6.2.3. Stage 1, 2 and 3 denote respectively
samples with 9:1, 5:1 and 3:1 ratio of NaH:AlCl3. Asterisk (*) is used to label a spinning
band, which arises from the Na3AlH6 species.
a)
b)

81
6.2.2 The 5:1 reaction of NaH and AlCl3 (stage 2)
Thereafter, 2 molar equivalents of AlCl3 were added to the product mixture of the
9:1 reaction of NaH and AlCl3 (Na3AlH6, NaCl and NaH at τBM = 60 min) to reach the
desired NaH:AlCl3 ratio of 3:1. When the resulting mixture was processed under 350 bar
of H2 pressure, a dark grey powder was obtained after ~30 min of ball-milling, indicating
the formation of metallic Al, which was confirmed by XRD analysis (not shown). Based
on the previous experience with the LiH-AlCl3 system, the amount of additional AlCl3
was reduced to 1.25 molar equivalents instead of 2 (resulting in an overall NaH:AlCl 3
ratio of 4:1 rather than 3:1). However, contrary to the LiH-AlCl3 system this still did not
produce anticipated results, and instead led to metallic Al. Only when the amount of
AlCl3 added was reduced to 0.8 molar equivalents (resulting in an overall NaH:AlCl3
ratio of 5:1), the reaction proceeded without the formation of metallic Al. The progress of
the reaction was similarly monitored at same time points using XRD, the results of which
are shown in Fig. 6.4 and described below.
For BM = 4 min, the XRD pattern (Fig. 6.4, pattern a) shows Bragg peaks from
unreacted NaH and AlCl3 together with previously present NaCl and Na3AlH6, and
freshly obtained NaAlCl4 and NaAlH4 products. On further milling (BM = 7–30 min),
during the early period the peaks of AlCl3 disappear, while peaks of NaH keep decreasing
with concomitant increase of NaAlH4. At a later period (BM = 60 min), the phases
detected by powder XRD are NaAlH4, Na3AlH6 and NaCl (Fig. 6.4, pattern f). According
to the XRD pattern, NaH is completely consumed to produce Na3AlH6 in agreement with
Eq. 6.1b. A small portion of NaAlH4 is left in the sample as the amount of NaH is now
limited compared with the 9:1 reaction.
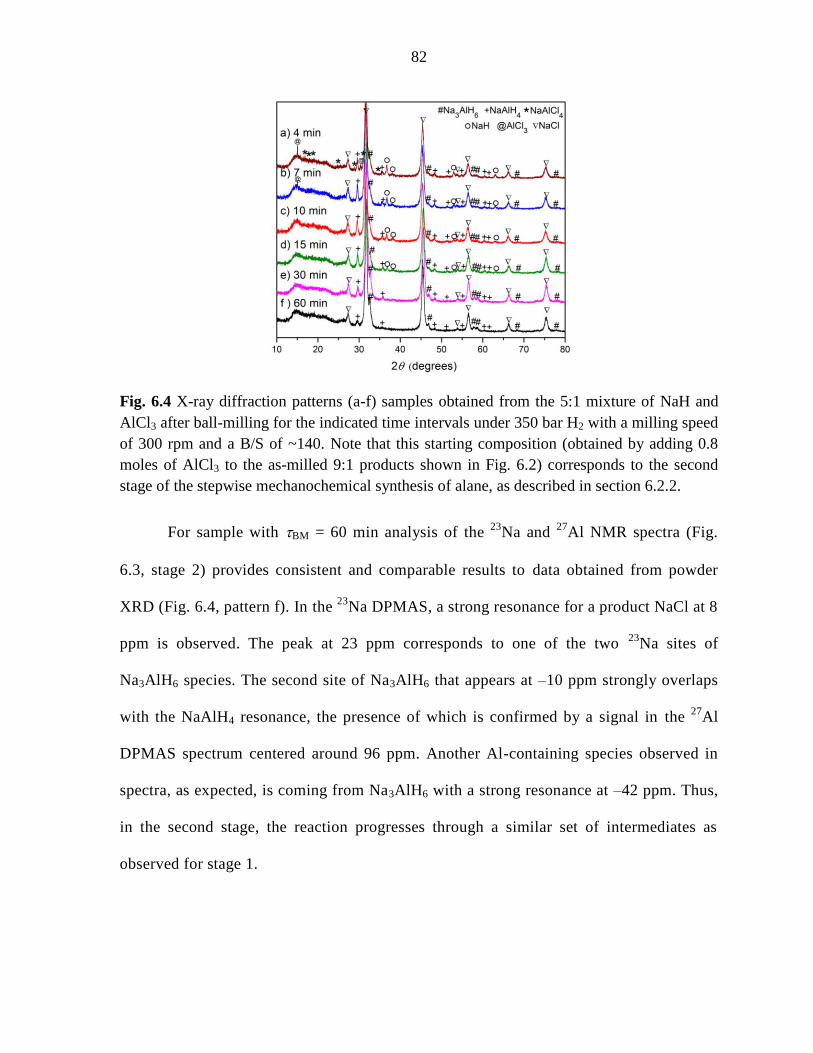
82
Fig. 6.4 X-ray diffraction patterns (a-f) samples obtained from the 5:1 mixture of NaH and
AlCl3 after ball-milling for the indicated time intervals under 350 bar H2 with a milling speed
of 300 rpm and a B/S of ~140. Note that this starting composition (obtained by adding 0.8
moles of AlCl3 to the as-milled 9:1 products shown in Fig. 6.2) corresponds to the second
stage of the stepwise mechanochemical synthesis of alane, as described in section 6.2.2.
For sample with BM = 60 min analysis of the 23
Na and 27
Al NMR spectra (Fig.
6.3, stage 2) provides consistent and comparable results to data obtained from powder
XRD (Fig. 6.4, pattern f). In the 23
Na DPMAS, a strong resonance for a product NaCl at 8
ppm is observed. The peak at 23 ppm corresponds to one of the two 23
Na sites of
Na3AlH6 species. The second site of Na3AlH6 that appears at –10 ppm strongly overlaps
with the NaAlH4 resonance, the presence of which is confirmed by a signal in the 27
Al
DPMAS spectrum centered around 96 ppm. Another Al-containing species observed in
spectra, as expected, is coming from Na3AlH6 with a strong resonance at –42 ppm. Thus,
in the second stage, the reaction progresses through a similar set of intermediates as
observed for stage 1.
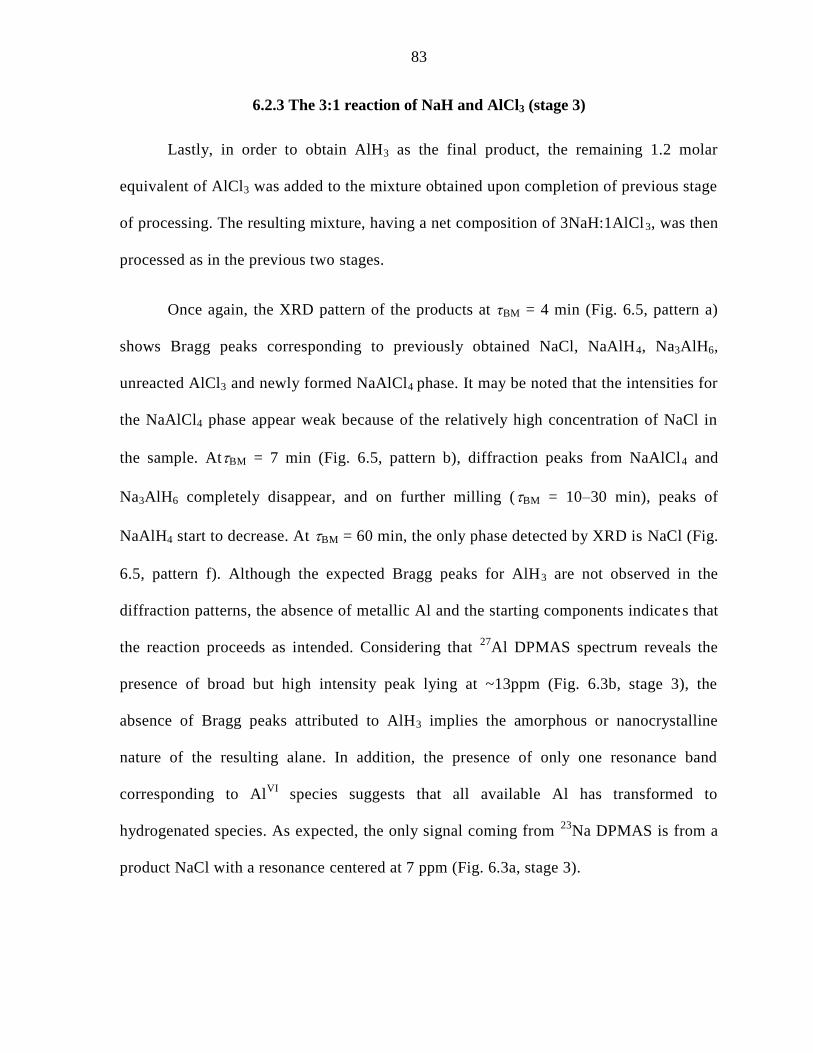
83
6.2.3 The 3:1 reaction of NaH and AlCl3 (stage 3)
Lastly, in order to obtain AlH3 as the final product, the remaining 1.2 molar
equivalent of AlCl3 was added to the mixture obtained upon completion of previous stage
of processing. The resulting mixture, having a net composition of 3NaH:1AlCl3, was then
processed as in the previous two stages.
Once again, the XRD pattern of the products at τBM = 4 min (Fig. 6.5, pattern a)
shows Bragg peaks corresponding to previously obtained NaCl, NaAlH4, Na3AlH6,
unreacted AlCl3 and newly formed NaAlCl4 phase. It may be noted that the intensities for
the NaAlCl4 phase appear weak because of the relatively high concentration of NaCl in
the sample. AtBM = 7 min (Fig. 6.5, pattern b), diffraction peaks from NaAlCl4 and
Na3AlH6 completely disappear, and on further milling (BM = 10–30 min), peaks of
NaAlH4 start to decrease. At BM = 60 min, the only phase detected by XRD is NaCl (Fig.
6.5, pattern f). Although the expected Bragg peaks for AlH3 are not observed in the
diffraction patterns, the absence of metallic Al and the starting components indicates that
the reaction proceeds as intended. Considering that 27
Al DPMAS spectrum reveals the
presence of broad but high intensity peak lying at ~13ppm (Fig. 6.3b, stage 3), the
absence of Bragg peaks attributed to AlH3 implies the amorphous or nanocrystalline
nature of the resulting alane. In addition, the presence of only one resonance band
corresponding to AlVI
species suggests that all available Al has transformed to
hydrogenated species. As expected, the only signal coming from 23
Na DPMAS is from a
product NaCl with a resonance centered at 7 ppm (Fig. 6.3a, stage 3).
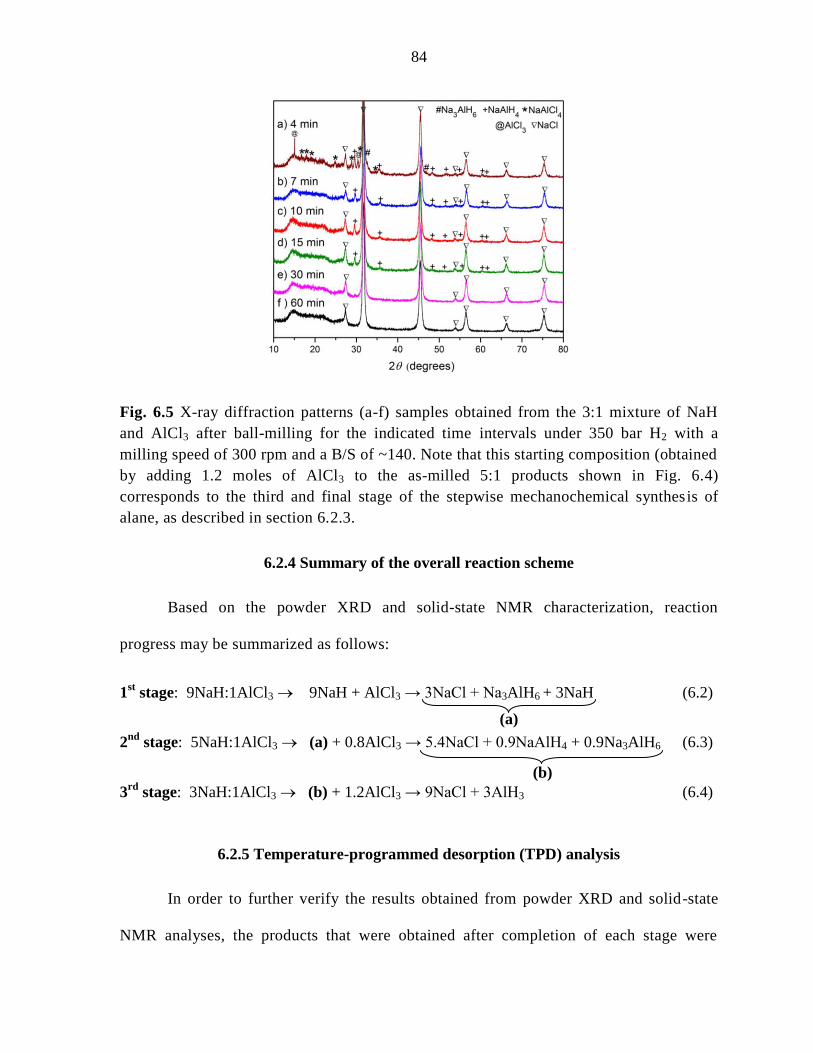
84
Fig. 6.5 X-ray diffraction patterns (a-f) samples obtained from the 3:1 mixture of NaH
and AlCl3 after ball-milling for the indicated time intervals under 350 bar H2 with a
milling speed of 300 rpm and a B/S of ~140. Note that this starting composition (obtained
by adding 1.2 moles of AlCl3 to the as-milled 5:1 products shown in Fig. 6.4)
corresponds to the third and final stage of the stepwise mechanochemical synthesis of
alane, as described in section 6.2.3.
6.2.4 Summary of the overall reaction scheme
Based on the powder XRD and solid-state NMR characterization, reaction
progress may be summarized as follows:
1st stage: 9NaH:1AlCl3 9NaH + AlCl3 → 3NaCl + Na3AlH6 + 3NaH (6.2)
2nd
stage: 5NaH:1AlCl3 (a) + 0.8AlCl3 → 5.4NaCl + 0.9NaAlH4 + 0.9Na3AlH6 (6.3)
3rd
stage: 3NaH:1AlCl3 (b) + 1.2AlCl3 → 9NaCl + 3AlH3 (6.4)
6.2.5 Temperature-programmed desorption (TPD) analysis
In order to further verify the results obtained from powder XRD and solid-state
NMR analyses, the products that were obtained after completion of each stage were
(a)
(b)

85
analyzed using temperature-programmed desorption. Figure 6.6 compares the
decomposition profiles of samples obtained after each stage of processing at τBM = 60
min.
For the 9:1 sample obtained after first stage the single-step decomposition curve
has an onset desorption temperature Td ≈ 225 °C, which is in an excellent accordance
with Td reported for pristine Na3AlH6 [130]. The measured hydrogen capacity of ca. 0.81
wt.% H agrees well with the ratio of the products obtained in reaction described in Eq.
6.2 (3NaCl + Na3AlH6 + 3NaH), considering that the decomposition of NaH can only
occur at temperature exceeding 450 °C [131].
The decomposition profile of the products obtained after the second stage of
processing represented by Eq. 6.3 (Fig 6.6b) has a two-step decomposition profile with
Td‘s close to 200 °C and 230 °C respectively. This is also in an excellent agreement with
the decomposition pathway of NaAlH4 which proceeds as a two-step reaction below
400 °C [132]:
NaAlH4 → Na3AlH6 + Al + H2 (Td ≈ 190 °C)
Na3AlH6 → NaH + Al + H2 (Td ≈ 225 °C)
NaH → Na + H2 (Td > 450 °C)
The net hydrogen evolution of 1.14 wt.% H also appears to be in good agreement with
calculated theoretical value of 1.19 wt.% H, assuming that the reaction described by Eq.
6.3 proceeds to completion (5.4NaCl + 0.9NaAlH4 + 0.9Na3AlH6). It should be noted that
the first dehydrogenation step is not as distinctly visible mainly due to sluggish
desorption kinetics of NaAlH4 [130].
86
Fig. 6.6 TPD curves obtained for samples of the reaction mixtures resulting from NaH:AlCl3
starting ratios of (a) 9:1, (b) 4:1, and (c) 3:1 after 60 min of ball milling under 350 bar H2
with a milling speed of 300 rpm and a B/S of ~140. Samples correspond (respectively) to the
final products obtained upon completion of the first, second, and final stages of the stepwise
mechanochemical synthesis of alane, as described in the text and shown in Eqs 6.2, 6.3, and
6.4.
Finally, the curve (c) in Fig. 6.6 represents the decomposition profile of the
products from reaction described in Eq. 6.4. The one-step decomposition with a Td of ca.
90 °C is as typically expected for AlH3 [85], and the measured hydrogen capacity
corresponding to 1.39 wt.% H is quantitative for the 3:1 molar mixture of NaCl and AlH3,
which confirms the complete conversion of all available aluminum to alane. In all three
cases, mass-spectroscopic analyses showed that H2 constituted 99.7 % or more of the
gases released, the rest being residual air.
The powder XRD analyses of desorbed samples from first and second stages of
processing showed Bragg peaks corresponding to metallic Al, NaH and NaCl (Fig 6.7,

87
patterns a and b). However, the final stage sample after desorption shows only metallic
Al and NaCl (Fig. 6.7, pattern c), which suggests that NaH was completely consumed
during the mechanochemical processing and that all of the alanates formed as
intermediates during the first two stages were transformed into alane.
Fig. 6.7 X-ray diffraction patterns of products obtained after complete desorption (see
Fig. 6.6) of as-synthesized samples with (a) 9:1, (b) 4:1 and (c) 3:1 molar ratio of NaH
and AlCl3.
6.2.6 Reaction mechanisms
Apparently, the presence of excess hydride source in starting mixture can prevent
decomposition to metallic Al and facilitate the formation of desired products. Similar
observations were made by Mikheeva et al. during their studies of the reaction between LiH
and AlCl3 in ethereal solution – it was noticed that slow addition of AlCl3 prevented
decomposition of newly formed alane and improved the yield of LiAlH4 [86]. Hence, similar
to previously described LiH-AlCl3 system [94], the possible explanation of why the reaction
between NaH and AlCl3 in a 3:1 molar ratio leads to metallic Al is because of the relatively
88
low fraction of hydride source in the 3:1 mixture (compared to 9:1), which may not be
sufficiently dispersed, leading to high local AlCl3:NaH ratios. This in turn may cause the
decomposition of unstable chlorine-containing derivatives, such as AlCl2H and AlClH2 or
others that are not known, into metallic Al with evolution of hydrogen, rather than formation
of intermediate alanates NaAlH4 and Na3AlH6.
6.3 Conclusions
An efficient solvent-free mechanochemical method for preparation of alane from
NaH and AlCl3 at room temperature has been developed. The reaction pathway could be
altered by use of excess hydride source, completely suppressing the decomposition to
metallic Al and favoring the formation of the desired product AlH3 through intermediate
alanates. The ability to successfully synthesize alane starting with NaH and AlCl3 eliminates
the need for expensive Li-containing reactants. Although this reaction can be carried out in
organic solvents such as ether-toluene mixtures, the mechanochemical approach opens the
way to a straightforward room-temperature large-scale production with no need of
environmentally hazardous solvents. It should be noted, however, that in addition to the
obtained alane, NaCl is formed as a by-product, which reduces the net gravimetric hydrogen
capacity by ~85%. Development of a cost effective and facile separation of alane from NaCl
is thus critical for commercial viability of such methods.
89
CHAPTER 7. MECHANOCHEMICAL SYNTHESIS OF ALANE FROM
SODIUM ALUMINUM HYDRIDE AND ALUMINUM CHLORIDE
7.1 Introduction
Depletion of fossil-fuel reserves, rising crude oil prices and escalating green-house
gas emissions, have led to rapid transition to clean and renewable energy technologies such
as electrification of vehicles. As a result, most car manufacturers including, U.S. car makers,
Toyota, Honda, and BMW have committed to development of hydrogen powered vehicles in
near future. This provides an impetus for intensive research on fully reversible solid-state
hydrogen storage material(s) required to power proton exchange membrane (PEM) fuel cells.
However, stringent gravimetric and volumetric hydrogen capacity requirements, along with
high cost and safety considerations of PEM fuel cells, severely limit the list of potentially
suitable materials for hydrogen storage applications. Fortunately, there are still a few
compounds available that may address these fundamental materials challenges facing the
PEM fuel-cell vehicle technologies, and hence foster a smooth transition to hydrogen as a
mainstream energy carrier. According to recommendations of the Hydrogen Storage
Engineering Center of Excellence, alane (AlH3) is considered as one of the most perspective
candidates [133]. AlH3 has garnered much interest because of its remarkable gravimetric and
volumetric capacities of ~10 wt.% H and ~150 g H/l respectively, in addition to low
desorption onset temperature close to 100 °C and favorable and tunable kinetics at this
temperature. Unfortunately, the highly favorable Gibbs free energy of the decomposition
reaction (Eq. 7.1) leads to equilibrium pressure of more than 0.7 GPa [27, 72, 141], and
prohibits application of direct regeneration from its constituent elements.
AlH3 → Al + 1.5H2, with ΔrG298K ≈ −46 kJ·mol–1
(7.1)

90
Thus to date, wet-chemical routes, in which sodium or lithium tetrahydroaluminates undergo
an exchange reaction with aluminum halides to yield alane, remain the best known methods
of syntheses and production. This reaction, generally known as Schlesinger reaction, is
represented in Eq. 7.2 [39, 109, 110]:
3MAlH4 + AlX3 → 4AlH3 + 3MX (M = Li, Na; X = Cl, Br, I) (7.2)
Unfortunately, these synthesis methods lead to the formation of alane-etherate complex or
solvated alane that require further heating in vacuo to obtain unsolvated alane. Large
volumes of solvents such as toluene or benzene have to be employed to affect successful
removal of complexed ether by distillation, which leads to generation of organic solvent
waste and makes the process expensive.
To overcome such synthesis difficulties, a solvent-free mechanochemical synthesis of
alane at room temperature have been developed earlier [94, 111]. As mentioned elsewhere in
this dissertation, it is highly desirable to be able to carry out such transformation using Na
based precursors such as NaAlH4 since Li – a critical element – is likely to be in short supply
in the near future and is currently more expensive than Na metal.
7.2 Results and discussion
7.2.1 Synthesis and characterization
Similar to the previously investigated 3LiAlH4-AlCl3 system [111], alane has been
synthesized by milling NaAlH4 and AlCl3 in 3:1 ratio in a planetary ball mill. As before,
progress of reaction was monitored with respect to ball-milling time. In contrast to the
3LiAlH4-AlCl3 system, the X-ray analysis of product from 3NaAlH4-AlCl3 mixture milled
91
for 30 min under 250 bar H2 pressure reveals that along with newly formed NaCl, significant
amount of unreacted NaAlH4 is still present in the sample (Fig. 7.1a). This suggests that the
reaction proceeds at slower rate at similar milling intensity than for the 3LiAlH4-AlCl3
system in which case reaction was nearly complete at this point. On extending the reaction
time to 60 min, close to complete conversion was achieved as indicated by highly diminished
signals from NaAlH4. Along with NaCl and unreacted NaAlH4, the formation of α-AlH3
[134] is also clearly seen after τBM = 60 min. It should be noted that, the broadening of the
peak close to 2θ = 27.6° is caused by an overlapping peak from NaCl and α-AlH3 phases.
Once the reaction time was optimized, several ball-millings were carried out at H2 pressures
between 50–250 bar to determine pc. In contrast to LiAlH4, for NaAlH4 it was found that pc
was nearly half the one found in case of LiAlH4 [111] lying in a range of 100–110 bar.
Although both LiAlH4 and NaAlH4 reactions proceed through formation of a ternary chloride
salts, the crystallographic structures of LiAlCl4 and NaAlCl4 are quite different [135], and
hence the heat of reactions may vary considerably, leading to the observed difference in the
pc between the two systems. Thus it may be argued that the dependence of pc on the nature of
the starting alanate is most likely inherent in the mechanistic pathway of the reaction. It is
further noted that, in contrast to LiAlH4, formation of α'-AlH3 was not observed in case of
NaAlH4 even when reaction was carried below the pc (i.e. 100 bar).
In our studies, mechanochemical metathesis reactions of NaAlH4 were also extended
to bromide (AlBr3) and iodide (AlI3) salts. While in case of AlBr3 the pc was determined to
be close to 100 bar, reactions with AlI3 were successful at pressures as low as 75 bar at room
temperature. The X-ray diffraction patterns for both these systems are shown in Fig. 7.1 (b
and c).
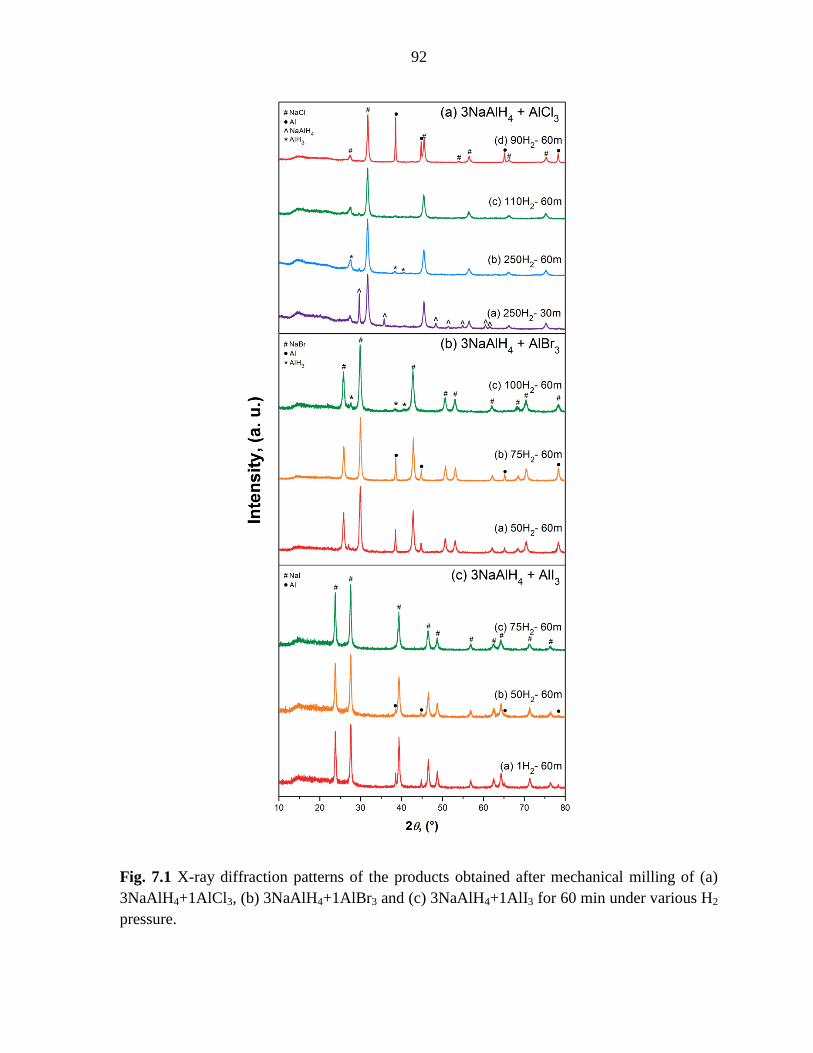
92
Fig. 7.1 X-ray diffraction patterns of the products obtained after mechanical milling of (a)
3NaAlH4+1AlCl3, (b) 3NaAlH4+1AlBr3 and (c) 3NaAlH4+1AlI3 for 60 min under various H2
pressure.
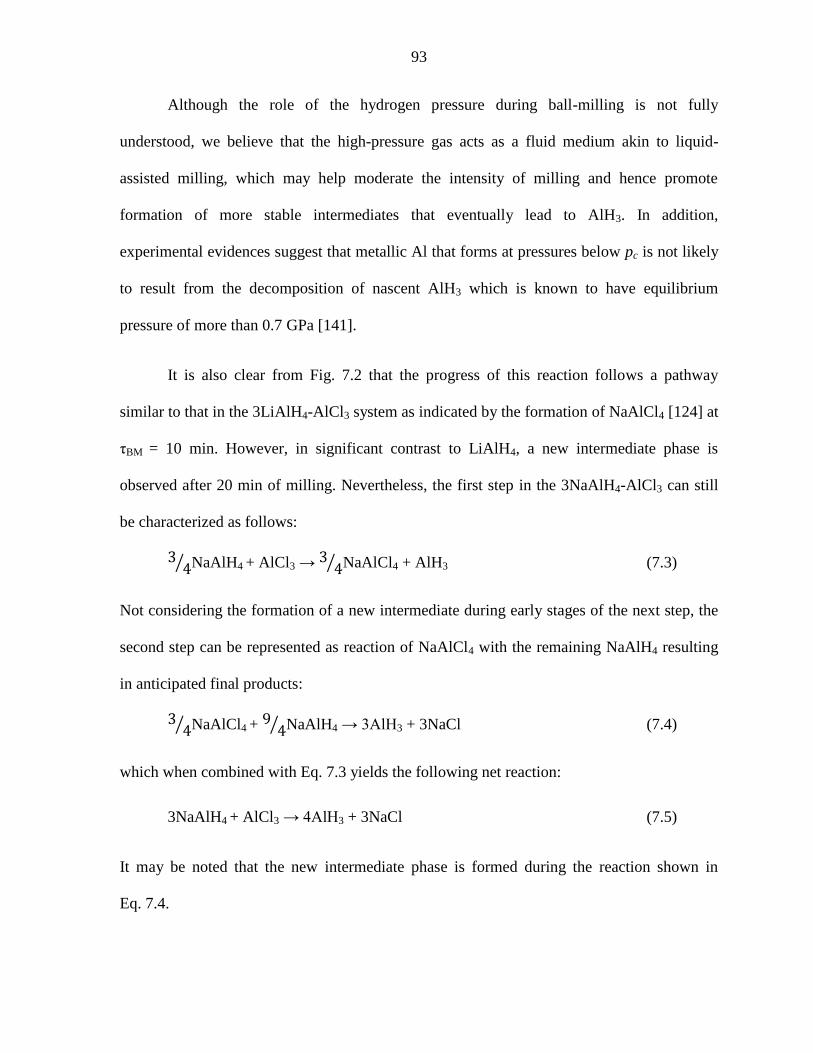
93
Although the role of the hydrogen pressure during ball-milling is not fully
understood, we believe that the high-pressure gas acts as a fluid medium akin to liquid-
assisted milling, which may help moderate the intensity of milling and hence promote
formation of more stable intermediates that eventually lead to AlH3. In addition,
experimental evidences suggest that metallic Al that forms at pressures below pc is not likely
to result from the decomposition of nascent AlH3 which is known to have equilibrium
pressure of more than 0.7 GPa [141].
It is also clear from Fig. 7.2 that the progress of this reaction follows a pathway
similar to that in the 3LiAlH4-AlCl3 system as indicated by the formation of NaAlCl4 [124] at
τBM = 10 min. However, in significant contrast to LiAlH4, a new intermediate phase is
observed after 20 min of milling. Nevertheless, the first step in the 3NaAlH4-AlCl3 can still
be characterized as follows:
NaAlH4 + AlCl3 → NaAlCl4 + AlH3 (7.3)
Not considering the formation of a new intermediate during early stages of the next step, the
second step can be represented as reaction of NaAlCl4 with the remaining NaAlH4 resulting
in anticipated final products:
NaAlCl4 + NaAlH4 → 3AlH3 + 3NaCl (7.4)
which when combined with Eq. 7.3 yields the following net reaction:
3NaAlH4 + AlCl3 → 4AlH3 + 3NaCl (7.5)
It may be noted that the new intermediate phase is formed during the reaction shown in
Eq. 7.4.
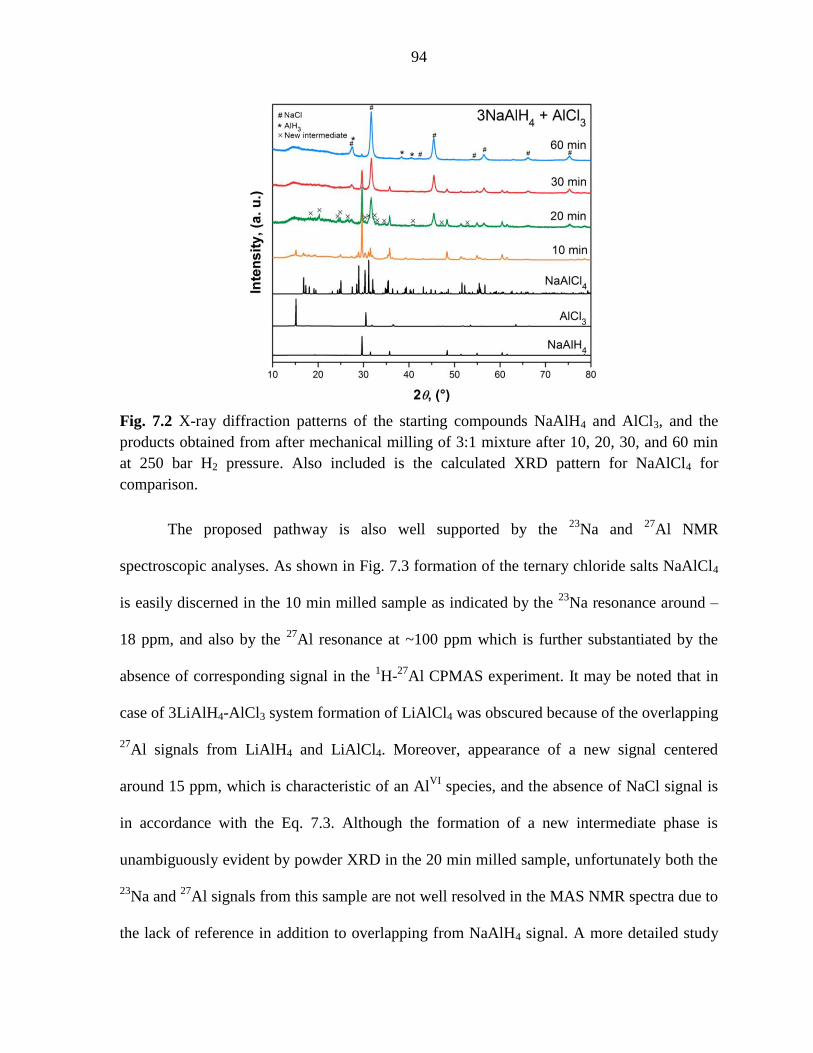
94
Fig. 7.2 X-ray diffraction patterns of the starting compounds NaAlH4 and AlCl3, and the
products obtained from after mechanical milling of 3:1 mixture after 10, 20, 30, and 60 min
at 250 bar H2 pressure. Also included is the calculated XRD pattern for NaAlCl4 for
comparison.
The proposed pathway is also well supported by the 23
Na and 27
Al NMR
spectroscopic analyses. As shown in Fig. 7.3 formation of the ternary chloride salts NaAlCl4
is easily discerned in the 10 min milled sample as indicated by the 23
Na resonance around –
18 ppm, and also by the 27
Al resonance at ~100 ppm which is further substantiated by the
absence of corresponding signal in the 1H-
27Al CPMAS experiment. It may be noted that in
case of 3LiAlH4-AlCl3 system formation of LiAlCl4 was obscured because of the overlapping
27Al signals from LiAlH4 and LiAlCl4. Moreover, appearance of a new signal centered
around 15 ppm, which is characteristic of an AlVI
species, and the absence of NaCl signal is
in accordance with the Eq. 7.3. Although the formation of a new intermediate phase is
unambiguously evident by powder XRD in the 20 min milled sample, unfortunately both the
23Na and
27Al signals from this sample are not well resolved in the MAS NMR spectra due to
the lack of reference in addition to overlapping from NaAlH4 signal. A more detailed study

95
directed towards deconvolution of these resonance signals and quantitative identification of
chemical species is in progress.
Fig. 7.3 (a) 23
Na DP, (b) 27
Al DP and (c) 27
Al-1H CPMAS spectra of the 3NaAlH4:1AlCl3
mixture ball-milled for various time intervals. The spectra were normalized to constant
height.
The composition of the newly observed intermediate was estimated using a series of
reactions (xNaAlH4 + AlCl3) in which the stoichiometric ratio of NaAlH4 and AlCl3 was
varied systematically between 0.5 and 1.25 (Fig. 7.4).
The individual mixtures were mixed in agate mortar and then milled for 60 min in a
SPEX mill under slight argon overpressure. The X-ray diffraction analyses of the obtained
products reveal that mixtures with ratios between 0.5 and 0.87 predominantly contain
NaAlCl4 [124] as the major crystalline product. On the other hand, at 1:1 molar ratio, the
observed Bragg peaks are in excellent match to those obtained for the 3:1 mixture after 20
min of milling. Furthermore, at the super-stoichiometric ratio of 1.25, the new phase was
obtained in equilibrium with significant amounts of metallic aluminum indicating that the
(a) (b) (c)
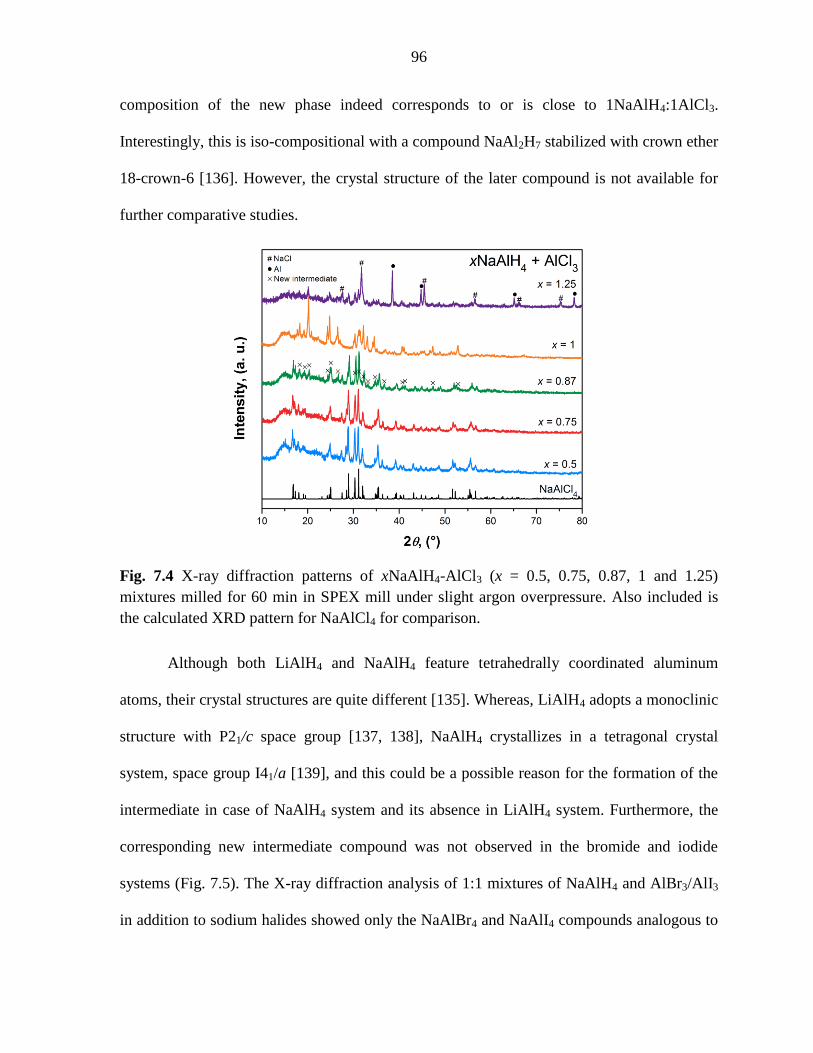
96
composition of the new phase indeed corresponds to or is close to 1NaAlH4:1AlCl3.
Interestingly, this is iso-compositional with a compound NaAl2H7 stabilized with crown ether
18-crown-6 [136]. However, the crystal structure of the later compound is not available for
further comparative studies.
Fig. 7.4 X-ray diffraction patterns of xNaAlH4-AlCl3 (x = 0.5, 0.75, 0.87, 1 and 1.25)
mixtures milled for 60 min in SPEX mill under slight argon overpressure. Also included is
the calculated XRD pattern for NaAlCl4 for comparison.
Although both LiAlH4 and NaAlH4 feature tetrahedrally coordinated aluminum
atoms, their crystal structures are quite different [135]. Whereas, LiAlH4 adopts a monoclinic
structure with P21/c space group [137, 138], NaAlH4 crystallizes in a tetragonal crystal
system, space group I41/a [139], and this could be a possible reason for the formation of the
intermediate in case of NaAlH4 system and its absence in LiAlH4 system. Furthermore, the
corresponding new intermediate compound was not observed in the bromide and iodide
systems (Fig. 7.5). The X-ray diffraction analysis of 1:1 mixtures of NaAlH4 and AlBr3/AlI3
in addition to sodium halides showed only the NaAlBr4 and NaAlI4 compounds analogous to
97
NaAlCl4 formed early in the 3NaAlH4-AlCl3 system. Since the formation of a second
intermediate compound is not observed by X-ray diffraction in bromide and iodide systems,
it may be argued that this intermediate is not necessary for driving the reaction towards
formation of alane. On the contrary, it is also possible that the second intermediate does
form, but is short lived and hence not detected. More work is needed to verify these
arguments.
Fig. 7.5 X-ray diffraction patterns of 1:1 molar mixtures of NaAlH4 and AlX3 (X = Cl, Br
and I) milled for 60 min in SPEX mill under slight argon overpressure.
7.2.2 Hydrogen desorption analysis
To confirm the results obtained by X-ray diffraction analyses, the samples prepared
by ball-milling of 3:1 mixtures of NaAlH4 and aluminum halide salts were analyzed for their
hydrogen desorption behavior. As shown in Fig. 7.6, all three systems yield quantitative
amount of H2 that corresponds to the 4:3 molar mixtures of AlH3 and the respective sodium

98
halide, which confirms that the transformation is complete according to Eq. 7.5. The
desorption onset temperature in all three cases is close to 100 °C and shows a one-step
decomposition that is consistent with the formation of AlH3. A slight variation in desorption
kinetics, as adjudged by slope of the plots, is observed for the bromide system which is
believed to result from subtle morphological differences in the sample that is not fully
explored.
Fig. 7.6 Temperature-programmed desorption curves obtained for 3:1 molar mixtures of
NaAlH4 and AlX3 (X = Cl, Br and I) milled for 60 min in a planetary ball mill under various
hydrogen pressures.
To further characterize the sample that produced the new intermediate as a major
phase (1:1 mixtures of NaAlH4 and aluminum chloride) and to ascertain whether the total
amount of hydrogen is preserved, desorption profiles were obtained for each specimen
described in Fig. 7.5. Only the chloride containing sample showed the net hydrogen capacity

99
close to theoretical value of 2.15 wt.% H, while for the bromide and iodide systems it was far
below the expected 1.26 and 0.87 wt.% H respectively (Fig. 7.7) indicating loss of hydrogen
during milling in the latter two systems. On the other hand, the desorption onset temperatures
for the bromide and iodide systems are in good agreement with previously obtained data for
3:1 mixtures (compare Fig. 7.6 and Fig. 7.7), which implies that the small amount of alane is
formed in addition to metallic Al. On the contrary, the single-step desorption observed for
chloride containing system with onset Td of ca. 120 °C is over 30 °C higher than expected for
alane (compare Fig. 7.6 and Fig. 7.7). These findings together with XRD results obtained for
1NaAlH4-1AlCl3 sample imply that the unknown intermediate does contain hydrogen and
preserves its full capacity. In all cases, the mass-spectroscopic analyses showed that H2
constituted 99.8 % or more of the gases released, the rest being residual air.
Fig. 7.7 Temperature-programmed desorption curves obtained for 1:1 molar mixtures of
NaAlH4 and AlX3 (X = Cl, Br and I) milled for 60 min in SPEX mill under slight argon
overpressure.

100
7.3 Conclusions
We have developed a solvent-free mechanochemical synthesis route for preparation
of AlH3 from readily available NaAlH4 and AlCl3, which eliminates the need for expensive
Li-containing reactants previously utilized [94, 111]. Although this reaction can be carried
out using a wet chemical approach, the synthesis in solid state via straightforward ball-
milling techniques opens the way to inexpensive, scalable, and environmentally benign
production of alane at room temperature.
Similar to the 3LiAlH4-AlCl3 system [111], the reaction had to be carried out under
hydrogen pressure to suppress formation of metallic Al, however, for NaAlH4 it was found
that pc was nearly half of that when using LiAlH4. Although the exact role of the gas pressure
could not be clarified, the observed differences in the pc with varying precursors milled under
identical conditions suggest that formation of metallic Al may not result from the
decomposition of AlH3 and it depends mainly on the energy of milling.
As expected, the reaction proceeded through formation of complex salt NaAlCl4,
however, in contrast to the 3LiAlH4-AlCl3 system, a new intermediate with a characteristic
XRD powder pattern was observed after 20 min of milling. Even though reaction proceeded
at slower pace than for the LiAlH4-AlCl3 system, the desired product was obtained after 60
min of processing. However, it should be emphasized that in addition to alane, the NaCl by-
product is formed, which reduces the net gravimetric hydrogen capacity by ~80%. Hence, it
is crucial to develop an efficient procedure for separation of AlH3 from the side-product in
order to realize its full hydrogen storage potential.
101
CHAPTER 8. OVERVIEW AND SUGGESTIONS FOR
FUTURE RESEARCH
The main objective of this dissertation was to gain a better understanding of the
mechanistic pathways for the synthesis of AlH3, which may provide the much needed basic
scientific insight necessary for the development of novel approaches for direct
mechanochemical hydrogenation of metallic Al. The development of reversible alane may
become a crucial turning point in making the hydrogen economy a reality. Another aspect
discussed in this study is a possibility of mechanochemical hydrogenation of MgB2 to
Mg(BH4)2, which also has a potential to become a reversible hydrogen storage material in the
near future.
Chapter 3 summarizes our attempts on synthesis of Mg(BH4)2 using a direct
mechanochemical approach at room temperature and moderate H2 pressure between 50 and
350 bar. It was established that magnesium diboride can be hydrogenated simply by milling
in hydrogen atmosphere. As expected from prior literature, conversion of MgB2 into
Mg(BH4)2 proceeds through various closo-borane [BxHy]n–
type intermediates with a large
contribution coming from [B12H12]2–
species. Thermal decomposition of the obtained product
resulted in recovery of MgB2 which could be subsequently rehydrogenated up to 90% of the
initial capacity. Unfortunately, we could not reach the complete conversion for
mechanochemical reaction and this study should be continued.
To increase the yield of Mg(BH4)2, it may be beneficial to couple mechanical
milling/activation with subsequent thermal hydrogenation. Alternatively, one can incorporate
multiple cations, which may lead to mixed borohydrides or composite systems that could
102
achieve much improved kinetics and potentially a single step dehydrogenation process.
Various titanium-based additives may also help to reach full reversibility of this system.
Furthermore, Saldan et. al. reported the enhanced hydrogen uptake/release in 2LiH-
MgB2 composite with titanium additives [57]. The LiH-MgB2-TiO2 system reached a storage
of about 7.6 wt.% H2 in ~1.8 h for absorption and 2.7 h for desorption which were carried out
under 50 and 5 bar of H2 at 330 and 380 °C respectively. Based on this report, the
hydrogenation of 2LiH-MgB2 composite with and without titanium additives may be
attempted by ball milling in hydrogen atmosphere.
Another interesting report regarding LiAlH4-MgH2-LiBH4 ternary hydride system
doped with TiF3 [58] showed existence of a mutual destabilization among the three hydrides.
It was found that TiF3 plays a catalytic role, further improving the dehydrogenation and
hydrogenation properties of this system. Therefore, it may be beneficial to investigate
possible hydrogenation of LiH-MgB2-Al and/or LiAlH4-MgB2 systems by means of high-
pressure ball milling with and without titanium additives.
Chlopek at. al. reported a direct wet chemical synthesis method to yield the alpha
phase of Mg(BH4)2 [59]. Hence, it may be beneficial to implement a mechanochemical
synthetic route using a ball mill via metathesis reaction between LiBH4 and MgCl2 and
investigate for existence of other possible species, for example LixMgy(BH4)x+2y.
The next four chapters of this dissertation explore mechanochemical synthesis of
alane via metathesis reactions between hydride sources and aluminum halides. In all cases we
did succeed by adjusting the gas pressure or stoichiometry of precursors in the way the
103
reaction pathway could be altered such that the desired product (alane) was obtained in
quantitative yields.
Chapters 4 and 6 describe mechanochemical solid-state reaction between AlCl3 and
LiH, and AlCl3 and NaH, respectively. In both cases, the excess of hydrogenation source in
the starting mixture leads to conditions that favor the formation of Al-H bonds resulting in
the intermediate alanates and finally the desired product AlH3. This method may prove to be
a promising alternative to traditional solution-based methods, and hence can reduce or
eliminate the use of potentially hazardous organic solvents. However, it should be noted that
in addition to alane, the resulting samples contain the salt by-product in the form of alkali-
metal halide, which reduces the net hydrogen gravimetric capacity of the system, and
therefore, methods for efficient separation of alane from alkali metal halides must be
developed in the future (some ideas are described later in this section).
Chapters 5 and 7 discuss the role of pressure in mechanochemical synthesis of alane
starting from AlCl3 and LiAlH4, and AlCl3 and NaAlH4, respectively. Although, it is not fully
understood how the change in gas pressure modifies the reaction pathway, it is suggested that
formation of metallic Al may not result from the decomposition of AlH3 and rather depends
mainly on the energy/intensity of milling. Here, gas under pressure acts like a fluid medium
that may effectively reduce the mechanical energy dose rate, as well as assist in the long
range solid-state diffusion of ions, and may have a stabilizing effect on newly formed
intermediates.
Even though both 3LiAlH4-AlCl3 and 3NaAlH4-AlCl3 systems result in quantitative
formation of alane and alkali halide, there are several differences that have to be noted. In

104
contrast to LiAlH4, for NaAlH4 it was determined that critical milling pressure (pc) was
nearly half the one found in case of LiAlH4. Additionally, apart from the expected ternary
alkali-metal aluminum halide (NaAlCl4), a new unknown intermediate with a distinctive
XRD powder pattern was observed in case of NaAlH4-AlCl3 system. Hence, there are still
several unresolved issues that need additional attention.
In order to investigate the composition and structure of unknown intermediate formed
in the 3NaAlH4-AlCl3 system, several additional experiments are needed. Firstly, 23
Na and
27Al DP and CPMAS NMR measurements of 1NaAlH4:1AlCl3 processed mixture may shed
some light on the co-ordination of the aluminum and sodium atoms in the new intermediate.
In addition, NMR analysis may help to determine if there are any other aluminum or sodium
containing species present. Secondly, several reactions with varying stoichiometry of NaCl
and AlCl3 can be examined by XRD to check if the characteristic powder pattern of new
intermediate appears for the synthesized samples. Based on these results the composition of
the unknown phase may be confirmed. Additionally, for obtained XRD pattern for
1NaAlH4:1AlCl3 structural predictions can be made for the new intermediate phase by
prototype electrostatic ground state (PEGS) method. With all of the above information, it is
likely that full structure determination by powder X-ray diffraction may be successful.
Reaction pathway may also be controlled by several other factors. Preliminary results
on ball-milling alkali-metal alanate and aluminum halide precursors in inert organic liquids
such as hexane, cyclohexane and heptane demonstrate that even small quantities of liquids
can prevent the formation of metallic Al at room temperature. This process would eliminate
the need to carry out processing under high gas pressures, which can be restrictive and
uneconomical at large scale. This study may benefit further by introducing green solvents
105
like ionic liquids (e.g., EMIM-Cl AlCl3 or 4-methylmorpholine). Another parameter that
influences pc is stoichiometry of precursors. Several preliminary experiments for the
xLiAlH4-AlCl3 system proved that the excess alanate (x > 3) may decrease the required
pressure and reaction may be carried out even without pressure. Additionally, as determined
for 3NaAlH4-AlX3 (X = Cl, Br, I) system, pc is also dependent on the nature of aluminum
halide. These results also may be confirmed for LiAlH4. Hence, the proposed study can
provide a better understanding of the reasons why pressure above pc is essential for the
formation of alane.
The removal of inevitable alkali-metal halide salt by-product in the reaction mixture
is another major challenge that needs to be addressed. The previously mentioned ionic liquid
(EMIM-Cl AlCl3) not only may take part in the reaction but also help to dissolve the
undesired side-product. From the other side, reaction carried out in presence of 4-
methylmorpholine may promote the formation of soluble alane adduct that can be desolvated
at the end simply by washing with toluene. This method is more attractive than previously
used wet-chemical processes mainly because desolvation procedure takes place at room
temperature. Separation based on different densities of products may be another approach
that can be utilized. For this purpose non-polar solvents with different densities may be
employed, relying on the difference of densities of alkali metal chlorides and alane rather that
attempting to partially dissolve one of the components. Future research must focus on finding
a suitable solvent, or a combination of solvents, that are both inexpensive and benign.
A synthesis of LiH directly from the elements via ball milling at room temperature
with subsequent addition of AlCl3 to obtain the desired product AlH3 may become another
route for alane production. To overcome the anticipated cold welding of ductile Li metal
106
during initial stages of milling, some quantity of LiH will be added to the starting mixture as
processing or seeding agent.
Based on obtained results, it may be beneficial to attempt direct synthesis of alane
starting from decomposition product (i.e., metallic Al). Several investigations on synthesis of
LiAlH4 from Al and LiH have been reported. However, in each case organic solvents and
elevated temperatures were used to obtain the desired product [103-105]. In a study by
Koiwai [106], it was confirmed that Li3AlH6 can be obtained by ball milling of commercially
available LiH and Al. Hence, a simple direct synthesis of alane from metallic Al and LiH
with subsequent addition of AlCl3 may be achieved utilizing ball milling at room temperature
under hydrogen pressure or in the presence of small quantities of inert liquid process control
agent, e.g. hexane.

107
REFERENCES
1. Shafiee, S., & Topal, E. (2009). When will fossil fuel reserves be diminished? Energy
Policy, 37(1), 181-189.
2. Karl, T. R., & Trenberth, K. E. (2003). Modern global climate change. Science, 302(5651),
1719-1723.
3. Global climate change indicators: http://www.ncdc.noaa.gov/indicators
4. Züttel, A. (2004). Hydrogen storage methods. Naturwissenschaften, 91(4), 157-172.
5. Schlapbach, L., & Züttel, A. (2001). Hydrogen-storage materials for mobile applications.
Nature, 414(6861), 353-358.
6. http://energy.gov/sites/prod/files/2015/01/f19/fcto_myrdd_table_onboard_h2_storage_
systems_doe_targets_ldv.pdf
7. Galassi, M. C., Acosta-Iborra, B., Baraldi, D., Bonato, C., Harskamp, F., Frischauf, N., &
Moretto, P. (2012). Onboard Compressed Hydrogen Storage: Fast Filling Experiments and
Simulations. Energy Procedia, 29, 192-200.
8. Hua, T. Q., Ahluwalia, R. K., Peng, J. K., Kromer, M., Lasher, S., McKenney, K., Law,
K., & Sinha, J. (2011). Technical assessment of compressed hydrogen storage tank systems
for automotive applications. International Journal of Hydrogen Energy, 36(4), 3037-3049.
9. Kohli, D. K., Khardekr, R. K., Singh, R., & Gupta, P. K. (2008). Glass micro-container
based hydrogen storage scheme. International Journal of Hydrogen Energy, 33(1), 417-422.
10. Ross, D. K. (2006). Hydrogen storage: the major technological barrier to the development
of hydrogen fuel cell cars. Vacuum, 80(10), 1084-1089.
11. Bossel, U., Eliason, B., Taylor, G. (2003). The Future of the Hydrogen Economy: Bright
or Bleak?: http://www.evworld.com/library/h2economyFinalReport.pdf
12. Amendola, S.C., Onnerud, P., Kelly, M.T., Petillo, P.J., Sharp-Goldman, S.L., Binder, M.
(2000). An ultrasafe hydrogen generator: aqueous, alkaline borohydride solutions and Ru
catalyst. Journal of Power Sources, 85 , 186-189
13. Liu, B. H., & Li, Z. P. (2009). A review: hydrogen generation from borohydride
hydrolysis reaction. Journal of Power Sources, 187(2), 527-534.
108
14. Kelly, H. C., & Marriott, V. B. (1979). Reexamination of the mechanism of acid-
catalyzed amine-borane hydrolysis. The hydrolysis of ammonia-borane. Inorganic
Chemistry, 18(10), 2875-2878.
15. Chandra, M., & Xu, Q. (2006). Dissociation and hydrolysis of ammonia-borane with
solid acids and carbon dioxide: an efficient hydrogen generation system. Journal of power
sources, 159(2), 855-860.
16. Thomas, K. M. (2007). Hydrogen adsorption and storage on porous materials. Catalysis
Today, 120(3), 389-398.
17. Zhou, L. (2005). Progress and problems in hydrogen storage methods. Renewable and
Sustainable Energy Reviews, 9(4), 395-408.
18. Dillon, A., Jones, K. M., Bekkedahl, T. A., Kiang, C. H., Bethune, D. S., & Heben, M. J.
(1997). Storage of hydrogen in single-walled carbon nanotubes. Nature, 386(6623), 377-379.
19. Ahn, C. C., Ye, Y., Ratnakumar, B. V., Witham, C., Bowman, R. C., & Fultz, B. (1998).
Hydrogen desorption and adsorption measurements on graphite nanofibers. Applied Physics
Letters, 73(23), 3378-3380.
20. Becher, M., Haluska, M., Hirscher, M., Quintel, A., Skakalova, V., Dettlaff-
Weglikovska, U., Chen, X., Hulman, M., Choi, Y., Roth, S., Meregalli, V., Parinello, Strobel,
R., Jorissen, L., Kappes, M. M., Fink, J., Züttel, A., Stepanek, I., & Bernier, P. (2003).
Hydrogen storage in carbon nanotubes. Comptes Rendus Physique, 4(9), 1055-1062.
21. Züttel, A., Sudan, P., Mauron, P., Kiyobayashi, T., Emmenegger, C., & Schlapbach, L.
(2002). Hydrogen storage in carbon nanostructures. International Journal of Hydrogen
Energy, 27(2), 203-212.
22. Wong-Foy, A. G., Matzger, A. J., & Yaghi, O. M. (2006). Exceptional H2 saturation
uptake in microporous metal-organic frameworks. Journal of the American Chemical
Society, 128(11), 3494-3495.
23. Wang, X. S., Ma, S., Forster, P. M., Yuan, D., Eckert, J., López, J. J., Murphy, B. J.,
Parise, J. B., & Zhou, H. C. (2008). Enhancing H2 Uptake by “Close‐Packing” Alignment of
Open Copper Sites in Metal–Organic Frameworks. Angewandte Chemie International
Edition, 47(38), 7263-7266.
24. Li, Y., & Yang, R. T. (2006). Hydrogen storage in metal-organic frameworks by bridged
hydrogen spillover. Journal of the American Chemical Society, 128(25), 8136-8137.
109
25. Saha, D., & Deng, S. (2010). Hydrogen adsorption on metal-organic framework MOF-
177. Tsinghua Science & Technology, 15(4), 363-376.
26. Vitillo, J. G., Ricchiardi, G., Spoto, G., & Zecchina, A. (2005). Theoretical maximal
storage of hydrogen in zeolitic frameworks. Physical Chemistry Chemical Physics, 7(23),
3948-3954.
27. Graetz, J., Reilly, J. J., Yartys, V. A., Maehlen, J. P., Bulychev, B. M., Antonov, V. E.,
Tarasov, B. P., & Gabis, I. E. (2011). Aluminum hydride as a hydrogen and energy storage
material: past, present and future. Journal of Alloys and Compounds, 509, S517-S528.
28. Brower, F. M., Matzek, N. E., Reigler, P. F., Rinn, H. W., Roberts, C. B., Schmidt, D. L.,
Snover, J. A., & Terada, K. (1976). Preparation and properties of aluminum hydride. Journal
of the American Chemical Society, 98(9), 2450-2453.
29. Imamura, H., Masanari, K., Kusuhara, M., Katsumoto, H., Sumi, T., & Sakata, Y. (2005).
High hydrogen storage capacity of nanosized magnesium synthesized by high energy ball-
milling. Journal of alloys and compounds, 386(1), 211-216.
30. Stampfer Jr, J. F., Holley Jr, C. E., & Suttle, J. F. (1960). The Magnesium-Hydrogen
System1-3. Journal of the American Chemical Society, 82(14), 3504-3508.
31. Kennelley, J.A., Varwig, J.W., Myers, H.W. (1960) Magnesium-hydrogen relationships.
Journal of the American Chemical Society, 64, 703-704.
32. Vigeholm, B., Kjøller, J., Larsen, B., & Pedersen, A. S. (1983). Formation and
decomposition of magnesium hydride. Journal of the Less Common Metals, 89(1), 135-144.
33. Pedersen, A. S., Kjøller, J., Larsen, B., & Vigeholm, B. (1983). Magnesium for hydrogen
storage. International Journal of Hydrogen Energy, 8(3), 205-211.
34. Bogdanović, B., Bohmhammel, K., Christ, B., Reiser, A., Schlichte, K., Vehlen, R., &
Wolf, U. (1999). Thermodynamic investigation of the magnesium–hydrogen system. Journal
of Alloys and compounds, 282(1), 84-92.
35. Laurencelle, F., Dehouche, Z., & Goyette, J. (2006). Hydrogen sorption cycling
performance of LaNi4.8Sn0.2. Journal of alloys and compounds, 424(1), 266-271.
36. Bogdanović, B., G. Sandrock, G. (2002). Catalyzed complex metal hydrides. MRS Bull.,
27(9), 712-716.

110
37. Bogdanović, B., & Schwickardi, M. (1997). Ti-doped alkali metal aluminium hydrides as
potential novel reversible hydrogen storage materials. Journal of Alloys and Compounds,
253, 1-9.
38. Bogdanović, B., Brand, R. A., Marjanović, A., Schwickardi, M., & Tölle, J. (2000).
Metal-doped sodium aluminium hydrides as potential new hydrogen storage materials.
Journal of alloys and compounds, 302(1), 36-58.
39. Finholt, A. E., Bond Jr, A. C., & Schlesinger, H. I. (1947). Lithium Aluminum Hydride,
Aluminum Hydride and Lithium Gallium Hydride, and Some of their Applications in
Organic and Inorganic Chemistry1. Journal of the American Chemical Society, 69(5), 1199-
1203.
40. Bragdou, R. W. (1964). U.S. Patent No. 3,162,508. Washington, DC: U.S. Patent and
Trademark Office.
41. Rittmeyer, P., & Wietelmann, U. (1996). Hydrides in: Ullmann’s Encyclopedia of
industrial Chemistry, Bohnet M.
42. von Colbe, J. M. B., Felderhoff, M., Bogdanović, B., Schüth, F., & Weidenthaler, C.
(2005). One-step direct synthesis of a Ti-doped sodium alanate hydrogen storage material.
Chemical Communications, (37), 4732-4734.
43. Felderhoff, M., Weidenthaler, C., von Helmolt, R., & Eberle, U. (2007). Hydrogen
storage: the remaining scientific and technological challenges. Physical Chemistry Chemical
Physics, 9(21), 2643-2653.
44. Rude, L. H., Nielsen, T. K., Ravnsbaek, D. B., Bösenberg, U., Ley, M. B., Richter, B.,
Arnbjerg L. M., Dornheim, M., Filinchuk, Y., Besenbacher, F., & Jensen, T. R. (2011).
Tailoring properties of borohydrides for hydrogen storage: a review. physica status solidi (a),
208(8), 1754-1773.
45. Chen, P., Xiong, Z., Luo, J., Lin, J., & Tan, K. L. (2002). Interaction of hydrogen with
metal nitrides and imides. Nature, 420(6913), 302-304.
46. Wiench, J. W., Balema, V. P., Pecharsky, V. K., & Pruski, M. (2004). Solid-state 27
Al
NMR investigation of thermal decomposition of LiAlH4. Journal of Solid State Chemistry,
177(3), 648-653.
47. Bennett, A. E., Rienstra, C. M., Auger, M., Lakshmi, K. V., & Griffin, R. G. (1995).
Heteronuclear decoupling in rotating solids. The Journal of chemical physics, 103, 6951.
111
48. Nakamori, Y., Miwa, K., Ninomiya, A., Li, H., Ohba, N., Towata, S. I., Züttel, A., &
Orimo, S. I. (2006). Correlation between thermodynamical stabilities of metal borohydrides
and cation electronegativites: First-principles calculations and experiments. Physical Review
B, 74(4), 045126.
49. Li, H. W., Kikuchi, K., Nakamori, Y., Ohba, N., Miwa, K., Towata, S., & Orimo, S.
(2008). Dehydriding and rehydriding processes of well-crystallized Mg(BH4)2 accompanying
with formation of intermediate compounds. Acta Materialia, 56(6), 1342-1347.
50. Severa, G., Rönnebro, E., & Jensen, C. M. (2010). Direct hydrogenation of magnesium
boride to magnesium borohydride: demonstration of > 11 weight percent reversible hydrogen
storage. Chemical Communications, 46(3), 421-423.
51. Li, H. W., Matsunaga, T., Yan, Y., Maekawa, H., Ishikiriyama, M., & Orimo, S. I.
(2010). Nanostructure-induced hydrogenation of layered compound MgB2. Journal of Alloys
and Compounds, 505(2), 654-656.
52. Pistidda, C., Garroni, S., Dolci, F., Bardají, E. G., Khandelwal, A., Nolis, P., Dornheim,
M., Gosalawit, R., Jensen, T., Cerenius, Y., Suriñach, S., Baró, M. D., Lohstroh, W., &
Fichtner, M. (2010). Synthesis of amorphous Mg(BH4)2 from MgB2 and H2 at room
temperature. Journal of Alloys and Compounds, 508(1), 212-215.
53. Jones, M. E., & Marsh, R. E. (1954). The preparation and structure of magnesium boride,
MgB2. Journal of the American Chemical Society, 76(5), 1434-1436.
54. Yan, Y., Li, H. W., Maekawa, H., Aoki, M., Noritake, T., Matsumoto, M., Miwa, K.,
Towata, S., & Orimo, S. I. (2011). Formation Process of[B12H12]2-
from[BH4]- during the
Dehydrogenation Reaction of Mg(BH4)2. Materials transactions, 52(7), 1443-1446.
55. Soloveichik, G. L., Gao, Y., Rijssenbeek, J., Andrus, M., Kniajanski, S., Bowman, R. C.,
Hwang, S.-J., & Zhao, J. C. (2009). Magnesium borohydride as a hydrogen storage material:
Properties and dehydrogenation pathway of unsolvated Mg(BH4)2. International Journal of
Hydrogen Energy, 34(2), 916-928.
56. Zhao, J. C., Knight, D. A., Brown, G. M., Kim, C., Hwang, S. J., Reiter, J. W., Bowman,
R. C., Zan, J. A., & Kulleck, J. G. (2008). Study of Aluminoborane Compound AlB4H11 for
Hydrogen Storage. The Journal of Physical Chemistry C, 113(1), 2-11.
57. Saldan, I., Campesi, R., Zavorotynska, O., Spoto, G., Baricco, M., Arendarska, A.,
Taube, K., & Dornheim, M. (2012). Enhanced hydrogen uptake/release in 2LiH–MgB2
composite with titanium additives. International Journal of Hydrogen Energy, 37(2), 1604-
1612.
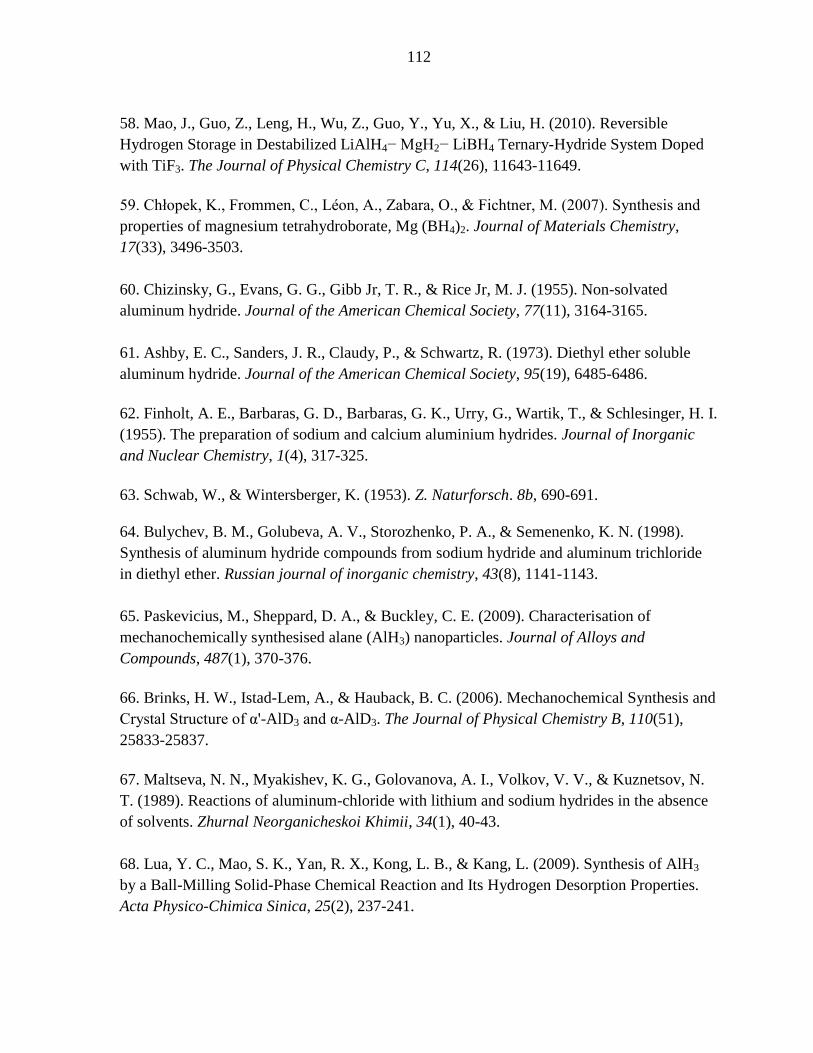
112
58. Mao, J., Guo, Z., Leng, H., Wu, Z., Guo, Y., Yu, X., & Liu, H. (2010). Reversible
Hydrogen Storage in Destabilized LiAlH4− MgH2− LiBH4 Ternary-Hydride System Doped
with TiF3. The Journal of Physical Chemistry C, 114(26), 11643-11649.
59. Chłopek, K., Frommen, C., Léon, A., Zabara, O., & Fichtner, M. (2007). Synthesis and
properties of magnesium tetrahydroborate, Mg (BH4)2. Journal of Materials Chemistry,
17(33), 3496-3503.
60. Chizinsky, G., Evans, G. G., Gibb Jr, T. R., & Rice Jr, M. J. (1955). Non-solvated
aluminum hydride. Journal of the American Chemical Society, 77(11), 3164-3165.
61. Ashby, E. C., Sanders, J. R., Claudy, P., & Schwartz, R. (1973). Diethyl ether soluble
aluminum hydride. Journal of the American Chemical Society, 95(19), 6485-6486.
62. Finholt, A. E., Barbaras, G. D., Barbaras, G. K., Urry, G., Wartik, T., & Schlesinger, H. I.
(1955). The preparation of sodium and calcium aluminium hydrides. Journal of Inorganic
and Nuclear Chemistry, 1(4), 317-325.
63. Schwab, W., & Wintersberger, K. (1953). Z. Naturforsch. 8b, 690-691.
64. Bulychev, B. M., Golubeva, A. V., Storozhenko, P. A., & Semenenko, K. N. (1998).
Synthesis of aluminum hydride compounds from sodium hydride and aluminum trichloride
in diethyl ether. Russian journal of inorganic chemistry, 43(8), 1141-1143.
65. Paskevicius, M., Sheppard, D. A., & Buckley, C. E. (2009). Characterisation of
mechanochemically synthesised alane (AlH3) nanoparticles. Journal of Alloys and
Compounds, 487(1), 370-376.
66. Brinks, H. W., Istad-Lem, A., & Hauback, B. C. (2006). Mechanochemical Synthesis and
Crystal Structure of α'-AlD3 and α-AlD3. The Journal of Physical Chemistry B, 110(51),
25833-25837.
67. Maltseva, N. N., Myakishev, K. G., Golovanova, A. I., Volkov, V. V., & Kuznetsov, N.
T. (1989). Reactions of aluminum-chloride with lithium and sodium hydrides in the absence
of solvents. Zhurnal Neorganicheskoi Khimii, 34(1), 40-43.
68. Lua, Y. C., Mao, S. K., Yan, R. X., Kong, L. B., & Kang, L. (2009). Synthesis of AlH3
by a Ball-Milling Solid-Phase Chemical Reaction and Its Hydrogen Desorption Properties.
Acta Physico-Chimica Sinica, 25(2), 237-241.
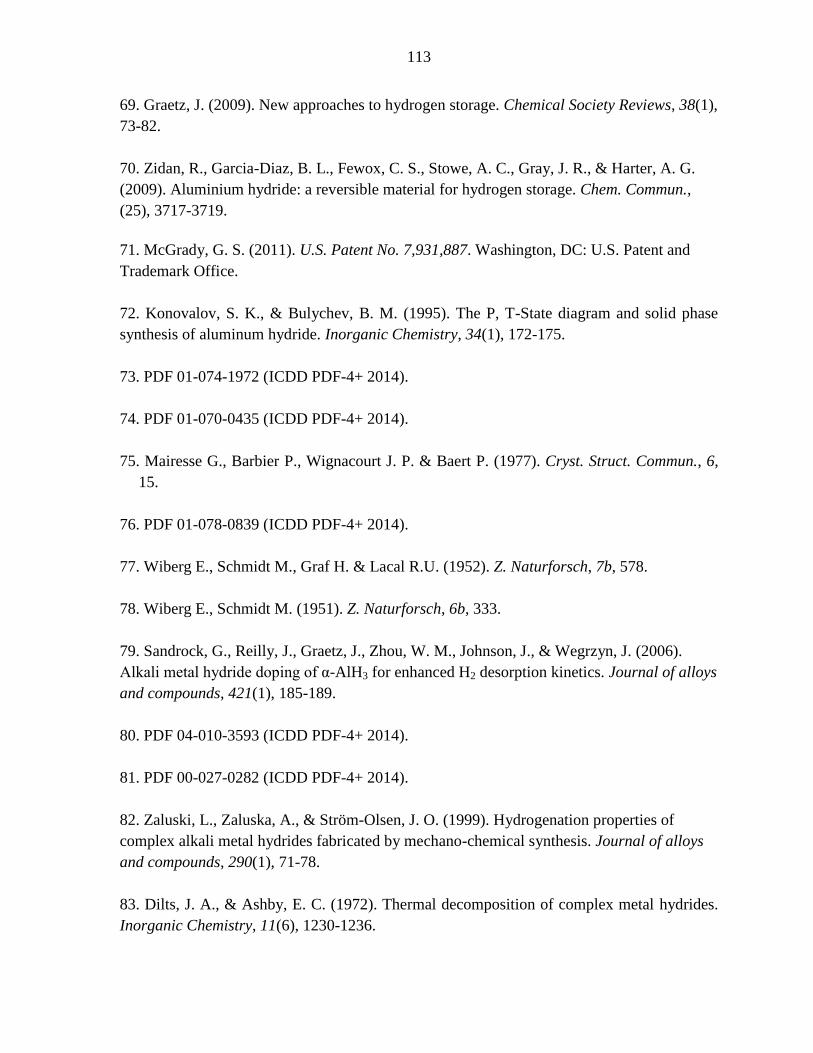
113
69. Graetz, J. (2009). New approaches to hydrogen storage. Chemical Society Reviews, 38(1),
73-82.
70. Zidan, R., Garcia-Diaz, B. L., Fewox, C. S., Stowe, A. C., Gray, J. R., & Harter, A. G.
(2009). Aluminium hydride: a reversible material for hydrogen storage. Chem. Commun.,
(25), 3717-3719.
71. McGrady, G. S. (2011). U.S. Patent No. 7,931,887. Washington, DC: U.S. Patent and
Trademark Office.
72. Konovalov, S. K., & Bulychev, B. M. (1995). The P, T-State diagram and solid phase
synthesis of aluminum hydride. Inorganic Chemistry, 34(1), 172-175.
73. PDF 01-074-1972 (ICDD PDF-4+ 2014).
74. PDF 01-070-0435 (ICDD PDF-4+ 2014).
75. Mairesse G., Barbier P., Wignacourt J. P. & Baert P. (1977). Cryst. Struct. Commun., 6,
15.
76. PDF 01-078-0839 (ICDD PDF-4+ 2014).
77. Wiberg E., Schmidt M., Graf H. & Lacal R.U. (1952). Z. Naturforsch, 7b, 578.
78. Wiberg E., Schmidt M. (1951). Z. Naturforsch, 6b, 333.
79. Sandrock, G., Reilly, J., Graetz, J., Zhou, W. M., Johnson, J., & Wegrzyn, J. (2006).
Alkali metal hydride doping of α-AlH3 for enhanced H2 desorption kinetics. Journal of alloys
and compounds, 421(1), 185-189.
80. PDF 04-010-3593 (ICDD PDF-4+ 2014).
81. PDF 00-027-0282 (ICDD PDF-4+ 2014).
82. Zaluski, L., Zaluska, A., & Ström-Olsen, J. O. (1999). Hydrogenation properties of
complex alkali metal hydrides fabricated by mechano-chemical synthesis. Journal of alloys
and compounds, 290(1), 71-78.
83. Dilts, J. A., & Ashby, E. C. (1972). Thermal decomposition of complex metal hydrides.
Inorganic Chemistry, 11(6), 1230-1236.
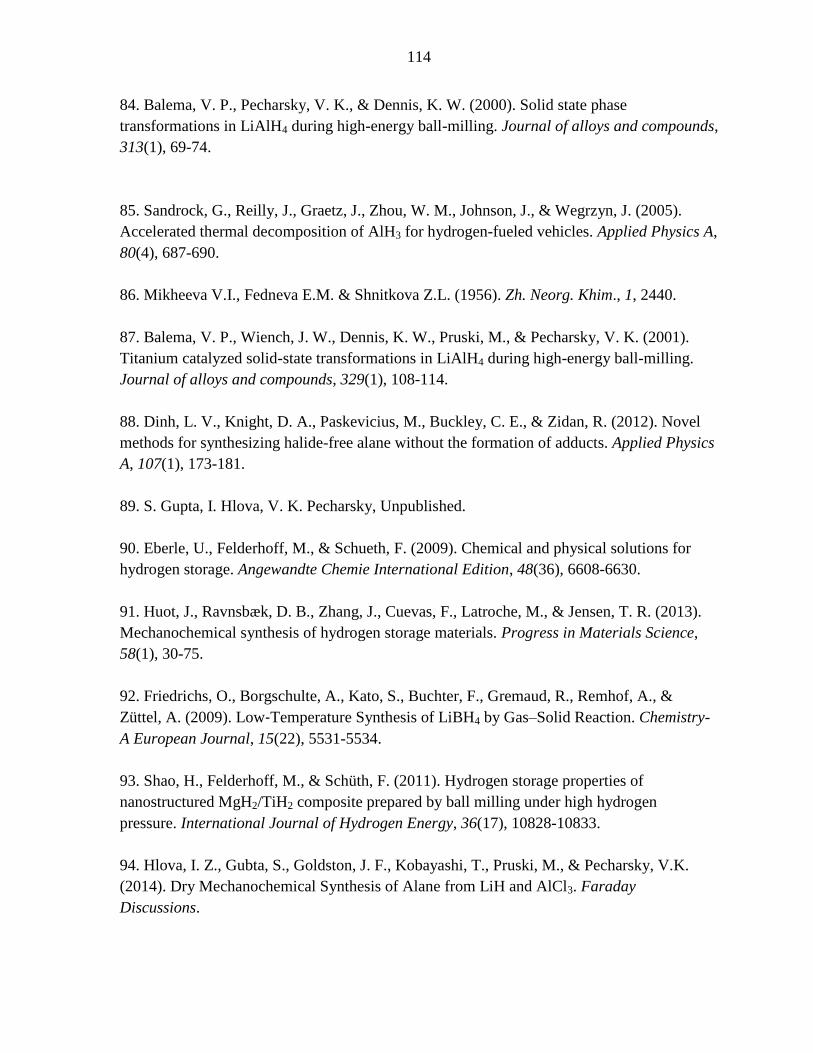
114
84. Balema, V. P., Pecharsky, V. K., & Dennis, K. W. (2000). Solid state phase
transformations in LiAlH4 during high-energy ball-milling. Journal of alloys and compounds,
313(1), 69-74.
85. Sandrock, G., Reilly, J., Graetz, J., Zhou, W. M., Johnson, J., & Wegrzyn, J. (2005).
Accelerated thermal decomposition of AlH3 for hydrogen-fueled vehicles. Applied Physics A,
80(4), 687-690.
86. Mikheeva V.I., Fedneva E.M. & Shnitkova Z.L. (1956). Zh. Neorg. Khim., 1, 2440.
87. Balema, V. P., Wiench, J. W., Dennis, K. W., Pruski, M., & Pecharsky, V. K. (2001).
Titanium catalyzed solid-state transformations in LiAlH4 during high-energy ball-milling.
Journal of alloys and compounds, 329(1), 108-114.
88. Dinh, L. V., Knight, D. A., Paskevicius, M., Buckley, C. E., & Zidan, R. (2012). Novel
methods for synthesizing halide-free alane without the formation of adducts. Applied Physics
A, 107(1), 173-181.
89. S. Gupta, I. Hlova, V. K. Pecharsky, Unpublished.
90. Eberle, U., Felderhoff, M., & Schueth, F. (2009). Chemical and physical solutions for
hydrogen storage. Angewandte Chemie International Edition, 48(36), 6608-6630.
91. Huot, J., Ravnsbæk, D. B., Zhang, J., Cuevas, F., Latroche, M., & Jensen, T. R. (2013).
Mechanochemical synthesis of hydrogen storage materials. Progress in Materials Science,
58(1), 30-75.
92. Friedrichs, O., Borgschulte, A., Kato, S., Buchter, F., Gremaud, R., Remhof, A., &
Züttel, A. (2009). Low‐Temperature Synthesis of LiBH4 by Gas–Solid Reaction. Chemistry-
A European Journal, 15(22), 5531-5534.
93. Shao, H., Felderhoff, M., & Schüth, F. (2011). Hydrogen storage properties of
nanostructured MgH2/TiH2 composite prepared by ball milling under high hydrogen
pressure. International Journal of Hydrogen Energy, 36(17), 10828-10833.
94. Hlova, I. Z., Gubta, S., Goldston, J. F., Kobayashi, T., Pruski, M., & Pecharsky, V.K.
(2014). Dry Mechanochemical Synthesis of Alane from LiH and AlCl3. Faraday
Discussions.

115
95. Turley, J. W., & Rinn, H. W. (1969). Crystal structure of aluminum hydride. Inorganic
Chemistry, 8(1), 18-22.
96. Graetz, J., & Reilly, J. J. (2005). Decomposition kinetics of the AlH3 polymorphs. The
Journal of Physical Chemistry B, 109(47), 22181-22185.
97. Orimo, S., Nakamori, Y., Kato, T., Brown, C., & Jensen, C. M. (2006). Intrinsic and
mechanically modified thermal stabilities of α-, β-and γ-aluminum trihydrides AlH3. Applied
Physics A, 83(1), 5-8.
98. Hwang, S. J., Bowman Jr, R. C., Graetz, J., Reilly, J. J., Langley, W., & Jensen, C. M.
(2007). NMR studies of the aluminum hydride phases and their stabilities. Journal of Alloys
and Compounds, 446, 290-295.
99. Pruski, M., Bailly, A., Lang, D. P., Amoureux, J. P., & Fernandez, C. (1999). Studies of
heteronuclear dipolar interactions between spin-1/2 and quadrupolar nuclei by using REDOR
during multiple quantum evolution. Chemical physics letters, 307(1), 35-40.
100. Schwarz, R. B., & Koch, C. C. (1986). Formation of amorphous alloys by the
mechanical alloying of crystalline powders of pure metals and powders of intermetallics.
Applied physics letters, 49(3), 146-148.
101. Ashby, E. C., & Prather, J. (1966). The composition of “mixed hydride” reagents. A
study of the Schlesinger reaction. Journal of the American Chemical Society, 88(4), 729-733.
102. Wiberg E., Mödritzer K. & Lacal R.U. (1954). Rev. Acad. Cienc. Exactas, Fis, Quim.
Nat., 9, 91.
103. Ashby, E. C., Brendel, G. J., & Redman, H. E. (1963). Direct synthesis of complex
metal hydrides. Inorganic Chemistry, 2(3), 499-504.
104. Wang, J., Ebner, A. D., & Ritter, J. A. (2006). Physiochemical pathway for cyclic
dehydrogenation and rehydrogenation of LiAlH4. Journal of the American Chemical Society,
128(17), 5949-5954.
105. Liu, X., Langmi, H. W., Beattie, S. D., Azenwi, F. F., McGrady, G. S., & Jensen, C. M.
(2011). Ti-doped LiAlH4 for hydrogen storage: synthesis, catalyst loading and cycling
performance. Journal of the American Chemical Society, 133(39), 15593-15597.

116
106. Kojima, Y., Kawai, Y., Haga, T., Matsumoto, M., & Koiwai, A. (2007). Direct
formation of LiAlH4 by a mechanochemical reaction. Journal of alloys and compounds,
441(1), 189-191.
107. http://en.wikipedia.org/wiki/Abundance_of_elements_in_Earth%27s_crust
108. Klemm, A., Hartmann, G., & Lange, L. (2012). Sodium and sodium alloys. Ullmann's
Encyclopedia of Industrial Chemistry.
109. Kraus, T., & Scardera, M. (1974). U.S. Patent No. 3,857,930. Washington, DC: U.S.
Patent and Trademark Office.
110. Ashby, E., Taylor, W., & Winkler, D. (1974). U.S. Patent No. 3,829,390. Washington,
DC: U.S. Patent and Trademark Office.
111. Gupta, S., Kobayashi, T., Hlova, I. Z., Goldston, J. F., Pruski, M., & Pecharsky, V. K.
(2014). Solvent-free mechanochemical synthesis of alane, AlH3: effect of pressure on the
reaction pathway. Green Chemistry, 16(9), 4378-4388.
112. J.O. Keller, L.E. Klebanoff, S. Schoenung, M. Gillie, in Hydrogen Storage Technology:
Materials and Applications (Ed: L.E. Klebanoff.), Taylor and Francis, Boca Raton, USA,
2012, Ch. 1.
113. Alternative Fuels Data Center, U.S. Department of Energy, Energy Efficiency &
Renewable Energy, http://www.afdc.energy.gov/fuels/hydrogen_basics.html, accessed:
April, 2014.
114. Bičáková, O., & Straka, P. (2012). Production of hydrogen from renewable resources
and its effectiveness. International Journal of Hydrogen Energy, 37(16), 11563-11578.
115. D. A. Anton, T. Motyka, T. US DOE Hydrogen Program Annual Merit Review
Proceedings, Arlington (VA);
http://www.hydrogen.energy.gov/pdfs/review12/st004_anton_2012_o.pdf, accessed: April,
2014; Pasini, J. M., Corgnale, C., van Hassel, B. A., Motyka, T., Kumar, S., & Simmons, K.
L. (2013). Metal hydride material requirements for automotive hydrogen storage systems.
International Journal of Hydrogen Energy, 38(23), 9755-9765.
116. Ahluwalia, R. K., Hua, T. Q., & Peng, J. K. (2012). On-board and off-board
performance of hydrogen storage options for light-duty vehicles. International journal of
hydrogen energy, 37(3), 2891-2910.

117
117. Aardahl, C. L., & Rassat, S. D. (2009). Overview of systems considerations for on-
board chemical hydrogen storage. International Journal of Hydrogen Energy, 34(16), 6676-
6683.
118. Sinke, G. C., Walker, L. C., Oetting, F. L., & Stull, D. R. (1967). Thermodynamic
properties of aluminum hydride. The Journal of Chemical Physics, 47(8), 2759-2761.;
Graetz, J., & Reilly, J. J. (2006). Thermodynamics of the alpha, beta and gamma polymorphs
of AlH3. Journal of Alloys and Compounds, 424(1), 262-265.
119. Freude, D., & Haase, J. (1993). Quadrupole effects in solid-state nuclear magnetic
resonance. NMR Basic Principles Progr., 1993, 29, 1-90.
120. Frydman, L., & Harwood, J. S. (1995). Isotropic spectra of half-integer quadrupolar
spins from bidimensional magic-angle spinning NMR. Journal of the American Chemical
Society, 117(19), 5367-5368.
121. Amoureux, J. P., Fernandez, C., & Steuernagel, S. (1996). ZFiltering in MQMAS NMR.
Journal of Magnetic Resonance, Series A, 123(1), 116-118.
122. PDF 00-005-0628 (ICDD PDF-4+ 2014).
123. PDF 00-023-0649 (ICDD PDF-4+ 2014).
124. Baenziger, N. C. (1951). The crystal structure of NaAlCl4. Acta Crystallographica, 4(3),
216-219.
125. PDF 00-054-0409 (ICDD PDF-4+ 2014).
126. PDF 00-022-0010 (ICDD PDF-4+ 2014).
127. PDF 00-022-1337 (ICDD PDF-4+ 2014).
128. PDF 00-042-0786 (ICDD PDF-4+ 2014).
129. Huot, J., Boily, S., Güther, V., & Schulz, R. (1999). Synthesis of Na3AlH6 and
Na2LiAlH6 by mechanical alloying. Journal of alloys and compounds, 283(1-2), 304-306.
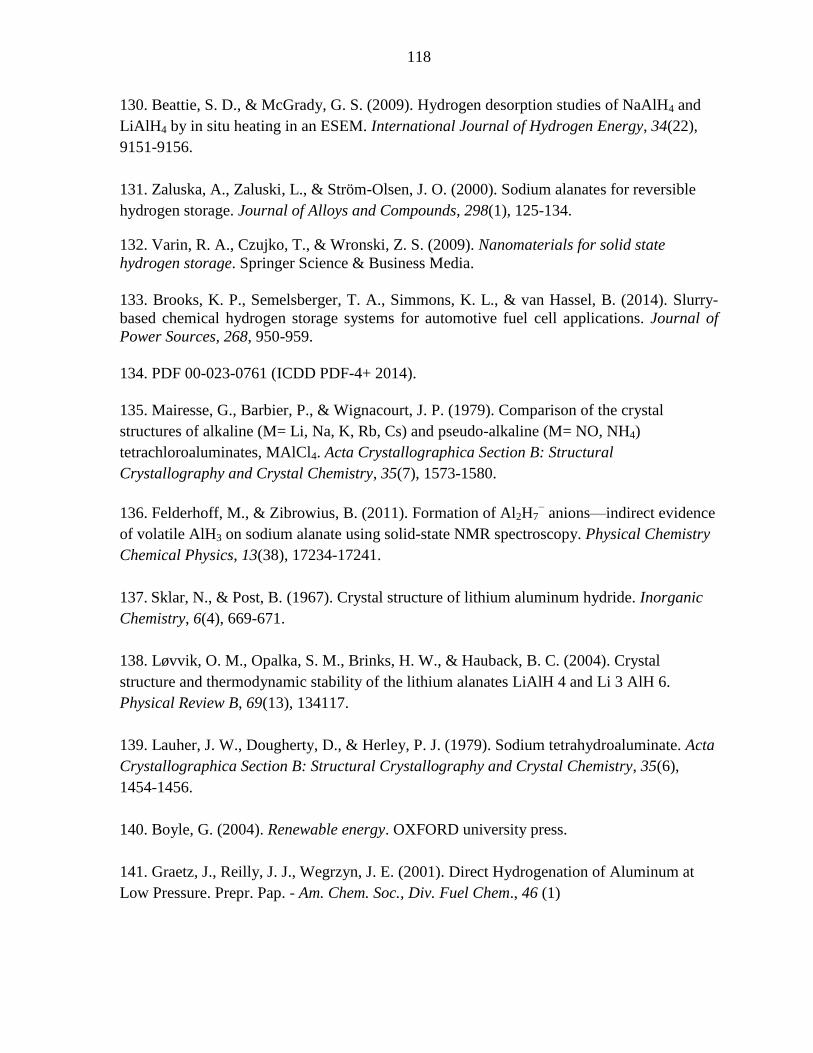
118
130. Beattie, S. D., & McGrady, G. S. (2009). Hydrogen desorption studies of NaAlH4 and
LiAlH4 by in situ heating in an ESEM. International Journal of Hydrogen Energy, 34(22),
9151-9156.
131. Zaluska, A., Zaluski, L., & Ström-Olsen, J. O. (2000). Sodium alanates for reversible
hydrogen storage. Journal of Alloys and Compounds, 298(1), 125-134.
132. Varin, R. A., Czujko, T., & Wronski, Z. S. (2009). Nanomaterials for solid state
hydrogen storage. Springer Science & Business Media.
133. Brooks, K. P., Semelsberger, T. A., Simmons, K. L., & van Hassel, B. (2014). Slurry-
based chemical hydrogen storage systems for automotive fuel cell applications. Journal of
Power Sources, 268, 950-959.
134. PDF 00-023-0761 (ICDD PDF-4+ 2014).
135. Mairesse, G., Barbier, P., & Wignacourt, J. P. (1979). Comparison of the crystal
structures of alkaline (M= Li, Na, K, Rb, Cs) and pseudo-alkaline (M= NO, NH4)
tetrachloroaluminates, MAlCl4. Acta Crystallographica Section B: Structural
Crystallography and Crystal Chemistry, 35(7), 1573-1580.
136. Felderhoff, M., & Zibrowius, B. (2011). Formation of Al2H7− anions—indirect evidence
of volatile AlH3 on sodium alanate using solid-state NMR spectroscopy. Physical Chemistry
Chemical Physics, 13(38), 17234-17241.
137. Sklar, N., & Post, B. (1967). Crystal structure of lithium aluminum hydride. Inorganic
Chemistry, 6(4), 669-671.
138. Løvvik, O. M., Opalka, S. M., Brinks, H. W., & Hauback, B. C. (2004). Crystal
structure and thermodynamic stability of the lithium alanates LiAlH 4 and Li 3 AlH 6.
Physical Review B, 69(13), 134117.
139. Lauher, J. W., Dougherty, D., & Herley, P. J. (1979). Sodium tetrahydroaluminate. Acta
Crystallographica Section B: Structural Crystallography and Crystal Chemistry, 35(6),
1454-1456.
140. Boyle, G. (2004). Renewable energy. OXFORD university press.
141. Graetz, J., Reilly, J. J., Wegrzyn, J. E. (2001). Direct Hydrogenation of Aluminum at
Low Pressure. Prepr. Pap. - Am. Chem. Soc., Div. Fuel Chem., 46 (1)