Hydrogen Storage Capacity Loss in a LiBH 4 –Al Composite
10
Hydrogen Storage Capacity Loss in a LiBH 4 −Al Composite Bjarne R. S. Hansen, † Dorthe B. Ravnsbæk, †,‡ Daniel Reed, § David Book, § Carsten Gundlach, ∥ Jørgen Skibsted, ⊥ and Torben R. Jensen* ,† † Center for Materials Crystallography, Interdisciplinary Nanoscience Center (iNANO), and Department of Chemistry, Aarhus University, Langelandsgade 140, DK-8000 Aarhus C, Denmark ‡ Department of Materials Science and Engineering, Massachusetts Institute of Technology, 77 Massachusetts Avenue, Cambridge, Massachusetts 02139, United States § School of Metallurgy and Materials, University of Birmingham, Birmingham, B15 2TT, United Kingdom ∥ MAX-II Laboratory, Lund University, Ole Rö mers vä g 1, 223 63, S-22100 Lund, Sweden ⊥ Instrument Centre for Solid-State NMR Spectroscopy, Department of Chemistry, and Interdisciplinary Nanoscience Center (iNANO), Aarhus University, Langelandsgade 140, DK-8000 Aarhus C, Denmark * S Supporting Information ABSTRACT: A detailed investigation of the decomposition reactions and decay in the hydrogen storage capacity during repeated hydrogen release and uptake cycles for the reactive composite LiBH 4 −Al (2:3) is presented. Furthermore, the influence of a titanium boride, TiB 2 , additive is investigated. The study combines information from multiple techniques: in situ synchrotron radiation powder X-ray diffraction, Sieverts measurements, simulta- neous thermogravimetric analysis, differential scanning calorimetry and mass spectroscopy, solid-state magic-angle spinning nuclear magnetic resonance (MAS NMR), and Raman spectroscopy. The decomposition of LiBH 4 −Al results in the formation of LiAl, AlB 2 , and Li 2 B 12 H 12 via several reactions and intermediate compounds. The TiB 2 additive appears to have a limited effect on the decomposition pathway of the samples, but seems to facilitate formation of intermediate species at lower temperatures compared to the sample without additive. Solid solutions of Li x Al 1−x B 2 or Al 1−x B 2 are observed during decomposition and from Rietveld refinement the composition of the solid solution is estimated to be Li 0.22 Al 0.78 B 2 . The intercalation of Li in the AlB 2 structure is further investigated by 11 B and 27 Al MAS NMR spectra of the LiH-AlB 2 and AlB 2 samples (presented in Supporting Information). Hydrogen release and uptake for LiBH 4 −Al reveals a significant loss in the hydrogen storage capacity, that is, after four cycles a capacity of about 45% remains, and after 10 cycles, the capacity is degraded to approximately 15% of the theoretically available hydrogen content. This capacity loss may be due to the formation of Li 2 B 12 H 12 , as observed by 11 B MAS NMR and Raman spectroscopy. Formation of Li 2 B 12 H 12 has previously been observed during the decomposition of LiBH 4 , but it has not been reported earlier in the LiBH 4 −Al (2:3) system. 1. INTRODUCTION Renewable energy sources like wind, solar, and hydropower are environmentally friendly and inexhaustible alternatives to fossil fuels. However, the utilization of these sources is hampered by their fluctuation in time and nonuniform geographical distribution. A solution to this problem would be a safe, efficient, cheap, and clean method to store the harvested energy. The supply of clean and sustainable energy is among the most important scientific and technical challenges facing humanity in the 21st century. Hydrogen is suggested as a future energy carrier of renewable energy, however, safe, compact, and efficient storage is challenging. 1−3 Metal borohydrides, alanates, and amides fulfill some of the requirements for successful hydrogen storage, and these materials have therefore been subject to much scientific attention. 4−8 Lithium borohydride, LiBH 4 , has a high gravimetric hydro- gen capacity of 18.5 wt % H 2 and has therefore received significant interest. 9−12 However, its relatively poor thermody- namic and kinetic properties have hampered its utilization in technological applications. At ambient temperature, LiBH 4 exists as an orthorhombic polymorph denoted o-LiBH 4 and transforms to a hexagonal polymorph, h-LiBH 4 at 110 °C. h- LiBH 4 melts at 275 °C and decomposes at temperatures above 375 °C, partly due to the large enthalpy change (ΔH = −74 kJ/ mol H 2 ) associated with the following reaction, 10−12 → + + LiBH (l) LiH(s) B(s) 3/2H (g) 4 2 (1) Even at these conditions only three-quarters of the hydrogen content is available as indicated by eq 1, that is, ρ m = 13.9 wt % H 2 . Furthermore, elevated temperatures above 600 °C and Received: December 18, 2012 Revised: March 4, 2013 Published: March 12, 2013 Article pubs.acs.org/JPCC © 2013 American Chemical Society 7423 dx.doi.org/10.1021/jp312480h | J. Phys. Chem. C 2013, 117, 7423−7432
-
Upload
independent -
Category
Documents
-
view
0 -
download
0
Transcript of Hydrogen Storage Capacity Loss in a LiBH 4 –Al Composite

Hydrogen Storage Capacity Loss in a LiBH4−Al CompositeBjarne R. S. Hansen,† Dorthe B. Ravnsbæk,†,‡ Daniel Reed,§ David Book,§ Carsten Gundlach,∥
Jørgen Skibsted,⊥ and Torben R. Jensen*,†
†Center for Materials Crystallography, Interdisciplinary Nanoscience Center (iNANO), and Department of Chemistry, AarhusUniversity, Langelandsgade 140, DK-8000 Aarhus C, Denmark‡Department of Materials Science and Engineering, Massachusetts Institute of Technology, 77 Massachusetts Avenue, Cambridge,Massachusetts 02139, United States§School of Metallurgy and Materials, University of Birmingham, Birmingham, B15 2TT, United Kingdom∥MAX-II Laboratory, Lund University, Ole Romers vag 1, 223 63, S-22100 Lund, Sweden⊥Instrument Centre for Solid-State NMR Spectroscopy, Department of Chemistry, and Interdisciplinary Nanoscience Center(iNANO), Aarhus University, Langelandsgade 140, DK-8000 Aarhus C, Denmark
*S Supporting Information
ABSTRACT: A detailed investigation of the decompositionreactions and decay in the hydrogen storage capacity duringrepeated hydrogen release and uptake cycles for the reactivecomposite LiBH4−Al (2:3) is presented. Furthermore, the influenceof a titanium boride, TiB2, additive is investigated. The studycombines information from multiple techniques: in situ synchrotronradiation powder X-ray diffraction, Sieverts measurements, simulta-neous thermogravimetric analysis, differential scanning calorimetryand mass spectroscopy, solid-state magic-angle spinning nuclearmagnetic resonance (MAS NMR), and Raman spectroscopy. Thedecomposition of LiBH4−Al results in the formation of LiAl, AlB2, and Li2B12H12 via several reactions and intermediatecompounds. The TiB2 additive appears to have a limited effect on the decomposition pathway of the samples, but seems tofacilitate formation of intermediate species at lower temperatures compared to the sample without additive. Solid solutions ofLixAl1−xB2 or Al1−xB2 are observed during decomposition and from Rietveld refinement the composition of the solid solution isestimated to be Li0.22Al0.78B2. The intercalation of Li in the AlB2 structure is further investigated by 11B and 27Al MAS NMRspectra of the LiH-AlB2 and AlB2 samples (presented in Supporting Information). Hydrogen release and uptake for LiBH4−Alreveals a significant loss in the hydrogen storage capacity, that is, after four cycles a capacity of about 45% remains, and after 10cycles, the capacity is degraded to approximately 15% of the theoretically available hydrogen content. This capacity loss may bedue to the formation of Li2B12H12, as observed by 11B MAS NMR and Raman spectroscopy. Formation of Li2B12H12 haspreviously been observed during the decomposition of LiBH4, but it has not been reported earlier in the LiBH4−Al (2:3) system.
1. INTRODUCTION
Renewable energy sources like wind, solar, and hydropower areenvironmentally friendly and inexhaustible alternatives to fossilfuels. However, the utilization of these sources is hampered bytheir fluctuation in time and nonuniform geographicaldistribution. A solution to this problem would be a safe,efficient, cheap, and clean method to store the harvestedenergy. The supply of clean and sustainable energy is amongthe most important scientific and technical challenges facinghumanity in the 21st century. Hydrogen is suggested as a futureenergy carrier of renewable energy, however, safe, compact, andefficient storage is challenging.1−3 Metal borohydrides, alanates,and amides fulfill some of the requirements for successfulhydrogen storage, and these materials have therefore beensubject to much scientific attention.4−8
Lithium borohydride, LiBH4, has a high gravimetric hydro-gen capacity of 18.5 wt % H2 and has therefore received
significant interest.9−12 However, its relatively poor thermody-namic and kinetic properties have hampered its utilization intechnological applications. At ambient temperature, LiBH4exists as an orthorhombic polymorph denoted o-LiBH4 andtransforms to a hexagonal polymorph, h-LiBH4 at 110 °C. h-LiBH4 melts at 275 °C and decomposes at temperatures above375 °C, partly due to the large enthalpy change (ΔH = −74 kJ/mol H2) associated with the following reaction,10−12
→ + +LiBH (l) LiH(s) B(s) 3/2H (g)4 2 (1)
Even at these conditions only three-quarters of the hydrogencontent is available as indicated by eq 1, that is, ρm = 13.9 wt %H2. Furthermore, elevated temperatures above 600 °C and
Received: December 18, 2012Revised: March 4, 2013Published: March 12, 2013
Article
pubs.acs.org/JPCC
© 2013 American Chemical Society 7423 dx.doi.org/10.1021/jp312480h | J. Phys. Chem. C 2013, 117, 7423−7432
pressures above 155 bar H2 are required for reversal of eq 1.12
This may be due to formation of stable intermediate speciessuch as amorphous boron or lithium dodecahydro-closo-dodecaborate, Li2B12H12.
13−17
One approach, which leads to more energetically favorabledecomposition pathways, is the utilization of reactive hydridecomposites (RHC).18−34 This has been demonstrated forseveral compounds, for example, LiBH4−MgH2 composites,where full dehydrogenation and rehydrogenation is achieved byformation of MgB2 and LiMg alloys.18−22,33 It has beensuggested that MgB2 promotes the reformation of the BH4complex, which is otherwise difficult to obtain from hydro-genation of the decomposition products. Similarly, theconditions for decomposition and the reversible formation ofLiBH4 can be significantly improved by the addition ofaluminum, which results in formation of more favorabledecomposition products, that is, AlB2 and LiAl. The LiBH4−Al composite releases hydrogen in two steps as shown in eqs 2and 3 below. Furthermore, addition of a Ti-additive issuggested to promote the formation of LiAl in LiBH4−Al(2:1).31
+ → + +2LiBH (l) Al(s) AlB (s) 2LiH(s) 3H (g)4 2 2 (2)
+ → +2LiH(s) 2Al(s) 2LiAl(s) H (g)2 (3)
The enthalpy change for eq 2 has been calculated to ΔH =−59.3 kJ/mol H2,
12 which is significantly lower than theenthalpy change of the decomposition of pristine LiBH4according to eq 1. In addition, eq 3 indicates that the full H2capacity of LiBH4 is available in the LiBH4−Al (2:3) composite.A further advantage is that the rehydrogenation of the LiBH4−Al composite can be achieved using more moderate conditionsthan for pristine LiBH4, that is, T = 400 °C and p(H2) = 100bar.23,27,28 However, it should be noted, that the addition of 1.5mol equiv of Al relative to LiBH4 lowers the gravimetric H2capacity to ρm = 6.4 wt % H2.A recent study reveals a more complex decomposition of the
LiBH4−Al composite than previously anticipated, which occursvia an unknown intermediate compound.31 Furthermore,repeated hydrogen release and uptake has shown that theLiBH4−Al composite suffers from a loss in hydrogen storagecapacity. Previous studies suggest loss of diborane gas from thesystem or formation of Li2B12H12 or amorphous boron.12,35−37
Hence, the mechanism of hydrogen release and uptakereactions including analysis of the capacity loss needs to befurther investigated. Additionally, titanium additives such asTiCl3 have been shown to improve the Alanate-systemsignificantly. However, TiCl3 reacts with LiBH4 and formsLiCl prompting the use of more inert additives such as TiB2,
38
which was already shown to improve hydrogen storageproperties for the composite LiBH4−Al (2:1).31The present investigation focuses on the detailed mechanism
for hydrogen release and uptake and the decay in storagecapacity during multiple cycles of hydrogen release and uptakefor the LiBH4−Al (2:3) composite. This investigation utilizescomplementary methods, that is, in situ synchrotron radiationpowder X-ray diffraction (SR-PXD), simultaneous thermalanalysis and mass spectroscopy (TGA/DSC-MS), Raman andsolid-state 11B magic-angle spinning (MAS) NMR spectrosco-py, and Sieverts method measured over 10 cycles of hydrogenrelease and uptake.
2. EXPERIMENTAL DETAILS2.1. Sample Preparation. Lithiumborohydride, LiBH4
(Aldrich, ≥95%), aluminum, Al (Strem Chemicals, 99.7%),and titanium diboride, TiB2 (Aldrich), were purchasedcommercially and used without further purification. LiBH4and Al powders were mixed in a relative molar ratio of 2:3(S1 and S2). Additionally, 4.5 mol % TiB2 with respect toLiBH4 was added to sample S2 (see Table 1). All handling was
conducted under an argon atmosphere in a glovebox with acirculation purifier (p(O2, H2O) < 1 ppm). All samples weremechanically milled using a Fritsch Pulverisette No. 4, 80 mL oftungsten carbide (WC) vials, and 10 mm WC balls with a ball-to-powder mass ratio of approximately 35:1. All samples weremilled for 120 min at a milling rate of 400 rpm under an argonatmosphere. Furthermore, samples of AlB2 and LiH−AlB2 wereprepared and heated to 500 °C for 5 h under inert conditions,as described in Supporting Information.
2.2. Synchrotron Radiation Powder X-ray Diffraction(SR-PXD). In situ time-resolved SR-PXD data was collected atbeamline I711 at the synchrotron MAX-II, Lund, Sweden, inthe research laboratory MAX-Lab with a MAR165 CCDdetector system.39 The selected wavelengths were 1.10205 Å(S1) and 0.98922 Å (S2). The used sample cell was speciallydeveloped for studies of gas/solid reactions and allows variablepressures and temperatures to be applied.40 The powderedsamples were mounted in a sapphire single-crystal tube (Al2O3,outer diameter 1.09 mm, inner diameter 0.79 mm) in an argon-filled glovebox (p(O2, H2O) < 1 ppm). The sampletemperature was controlled with a thermocouple placed inthe sapphire tube approximately 1 mm from the sample. A gassupply system was attached to the sample cell, which allowed achange in gas and pressure via a vacuum pump during the X-rayexperiment. The system was flushed with argon and evacuatedthree times before the valve to the sample was opened and theX-ray experiment began. During desorption measurements thesamples were heated to 500 °C (ΔT/Δt = 10 °C/min) atdynamic vacuum with the samples connected to a vacuumpump. The temperature was kept at 500 °C for 15 min beforethe samples were cooled to room temperature (RT). Duringabsorption measurements the samples were heated to 400 °C(ΔT/Δt = 15 °C/min) under a pressure of p(H2) = 100 barand then kept at a constant temperature for 1 h before coolingto RT. The FIT2D program was used to remove diffractionspots originating from the single-crystal sapphire tubes andsubsequently to transform raw data to powder patterns.41
Rietveld refinement was performed on selected PXD data usingthe program Fullprof.42 The background scattering wasdescribed by linear interpolation between selected points,while pseudo-Voigt profile functions were used to fit thediffraction peaks. In general, the unit cell parameters, zero shift,profile parameters, and the overall temperature factors, Bov,were refined. In some cases, preferred orientation correctionswere included in the refinements.
Table 1. Composition of the LiBH4−Al Samples and TheirTheoretical Gravimetric H2 Contents, ρm (wt% H2)
composition (mol %)
samples LiBH4 Al TiB2 ρm (wt% H2)
S1 40.0 60.0 6.4S2 39.3 58.9 1.8 6.1
The Journal of Physical Chemistry C Article
dx.doi.org/10.1021/jp312480h | J. Phys. Chem. C 2013, 117, 7423−74327424
The solid solution, LixAl1−xB2, was modeled by introducingLi on the Al position in the structure of AlB2 and the sum of Liand Al occupancies were constrained to one and refined.Analysis of the sample compositions during hydrogen releaseand uptake is challenging because several compounds areisostructural and have similar unit cell parameters, that is, Aland LiH crystallize in space group Fm-3m and AlB2 and TiB2 inP6/mmm (see Table 2).
2.3. In-House Powder X-ray Diffraction. In-house PXDmeasurement was performed in Debye−Scherrer transmissiongeometry using a STOE Stadi P diffractometer equipped with acurved Ge(111) monochromator (Cu Kα1 radiation) and acurved position sensitive detector. Data was collected at RTbetween 4 and 127° 2θ with a counting time of 180 s per step.The samples were mounted in 0.5 mm special glass No. 0140or 0.7 mm quartz capillaries sealed with glue under argonatmosphere.2.4. Thermal Analysis and Mass Spectroscopy (TGA/
DSC-MS). Thermogravimetric analysis (TGA) and differentialscanning calorimetry (DSC) was measured using a PerkinElmerSTA 6000 connected to a mass spectrometer (MS; HidenAnalytical HPR-20 QMS sampling system). Samples of S1 andS2 were transferred to Al2O3 crucibles under argon atmosphere.The samples were heated from 40 to 550 °C (ΔT/Δt = 5 °C/min) with an argon purge rate of 65 mL/min. The outletgaseous species H2 and B2H6 were monitored using massspectroscopy.2.5. Sieverts Measurement. The samples were transferred
to a stainless steel high-temperature autoclave, sealed underargon and attached to the Sieverts apparatus (Hy-EnergyPCTPro-2000).43 During desorption measurements the samplewas heated to 300 °C (ΔT/Δt = 10 °C/min) and then slowlyfrom 300 to 500 °C (ΔT/Δt = 1 °C/min) at p(H2) = 10−2 bar.This temperature was maintained for 2.5 h followed by naturalcooling to RT. During hydrogen absorption measurements thesample was heated to 400 °C (ΔT/Δt = 5 °C/min) at p(H2) =100 bar, kept at a constant temperature, 400 °C, for 2 h andthen allowed to cool naturally to RT. After the first de- andabsorption measurements the samples were characterized withPXD without exposure to air. After 10 desorptions and nineabsorptions the samples were denoted DS1 and DS2, and after10 desorptions and 10 absorptions, they were denoted AS1 andAS2 (see Table 3)2.6. 11B MAS NMR. 11B MAS NMR spectra were obtained
for samples AS1 and AS2 on a Varian Direct-Drive VNMRS-600 spectrometer (14.1 T) using a home-built CP/MAS NMRprobe for 4 mm outer diameter rotors. The experimentsemployed a spinning speed of νR = 13.0 kHz, a 0.5 μs excitationpulse for a 11B rf field strength of γB1/2π ≈ 60 kHz, a 4 s
relaxation delay, and 1H decoupling (γB2/2π ≈ 50 kHz) duringacquisition. The experiments were performed at ambienttemperature using airtight end-capped zirconia rotors packedwith the samples in an argon-filled glovebox. Isotropic chemicalshifts are relative to neat F3B·O(CH2CH3)2, employing a 0.1 MH3BO3 aqueous solution (δiso = 19.6 ppm) as a secondary,external standard sample.
2.7. Raman Spectroscopy. Raman spectra were obtainedfor samples DS1 and DS2 using a Renishaw inVia RamanMicroscope with a 488 nm excitation laser (2 mW power). Amicroscope objective was used to focus the laser beam onto thesample with a spot-diameter of about 50 μm. Samples weremeasured under 1.0 bar flowing Ar, using an Instec HCS621Vsample cell stage.
3. RESULTS AND DISCUSSION3.1. In Situ Synchrotron Radiation Powder X-ray
Diffraction Measurements. The in situ SR-PXD desorptionmeasurements for S1 are presented in Figure 1 and the Rietveldrefinement of the pattern at RT in Figure S1. At T ≈ 100 °C, o-LiBH4 undergoes a transformation to the hexagonal high-
Table 2. Crystallographic Data for Compounds Observed inthe LiBH4−Al System
compound space group a (Å) b (Å) c (Å) ref
o-LiBH4 Pnma 7.179 4.437 6.803 10
h-LiBH4 P63mc 4.276 6.948 10
LiH Fm-3m 4.083 55
Al Fm-3m 4.049 56
TiB2 P6/mmm 3.028 3.228 57
AlB2 P6/mmm 3.006 3.247 58
LiAl Fd-3m 6.376 59
WC P6-m2 2.907 2.837 60
Table 3. Overview of the Notation Used for the DifferentSamples in This Study and the Performed Measurementsa
nameSR-PXD Raman NMR description
S1 X ball-milled LiBH4−Al (2:3)S2 X ball-milled LiBH4−Al−TiB2 (2:3, 4.5 wt %
TiB2)DS1 X S1 after 10 desorption and 9 absorption
experimentsDS2 X S2 after 10 desorption and 9 absorption
experimentsAS1 X S1 after 10 desorption and 10 absorption
experimentsAS2 X S2 after 10 desorption and 10 absorption
experimentsaAdditionally, all samples are investigated by PXD. Samples in adehydrogenated (desorbed) state or a hydrogenated (absorbed) stateare denoted DS or AS, respectively.
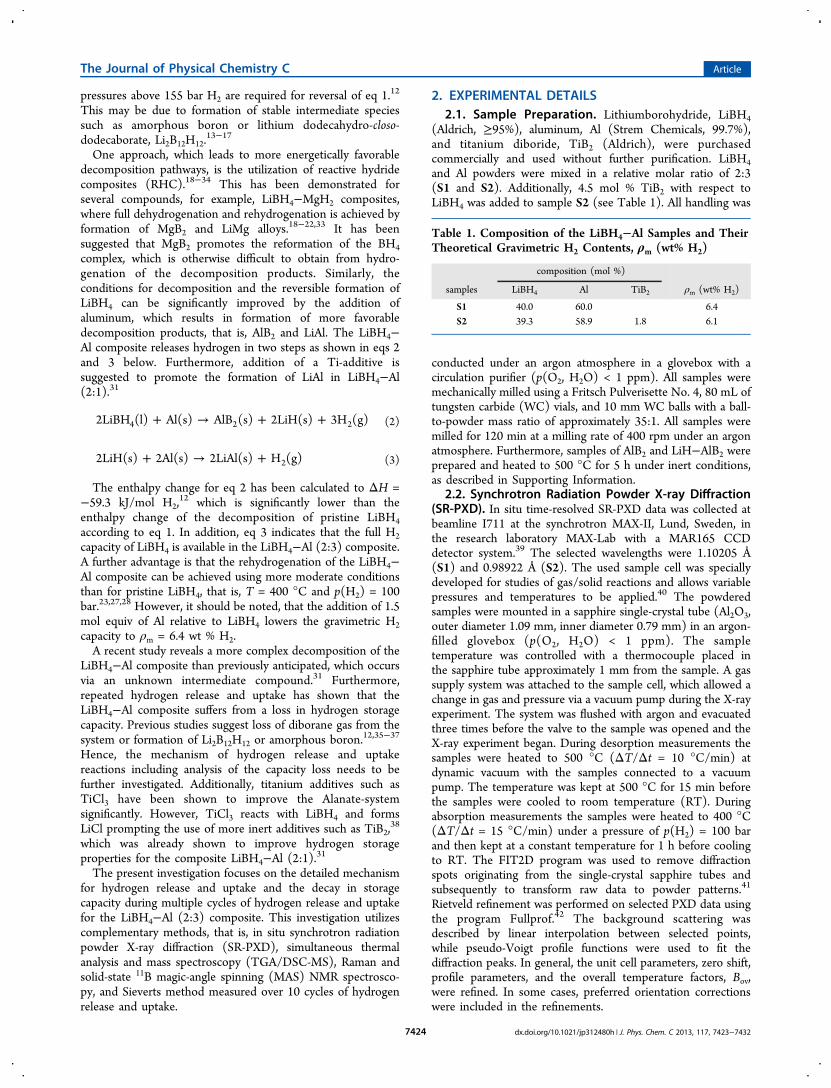
Figure 1. In situ SR-PXD desorption measurement for LiBH4−Al (S1,2:3) in the temperature range from RT to 500 °C, at p(H2) = 10−2 bar(ΔT/Δt = 10 °C/min, λ = 1.10205 Å). The temperature wasmaintained at 500 °C for 15 min. Symbols: (open square) o-LiBH4,(gray square) h-LiBH4, (star) WC, (black square) Al and LiH, (blackcircle) 1, (gray circle) 2, (open triangle) LixAl1−xB2, (open circle) LiAl,(gray diamond) 3.
The Journal of Physical Chemistry C Article
dx.doi.org/10.1021/jp312480h | J. Phys. Chem. C 2013, 117, 7423−74327425
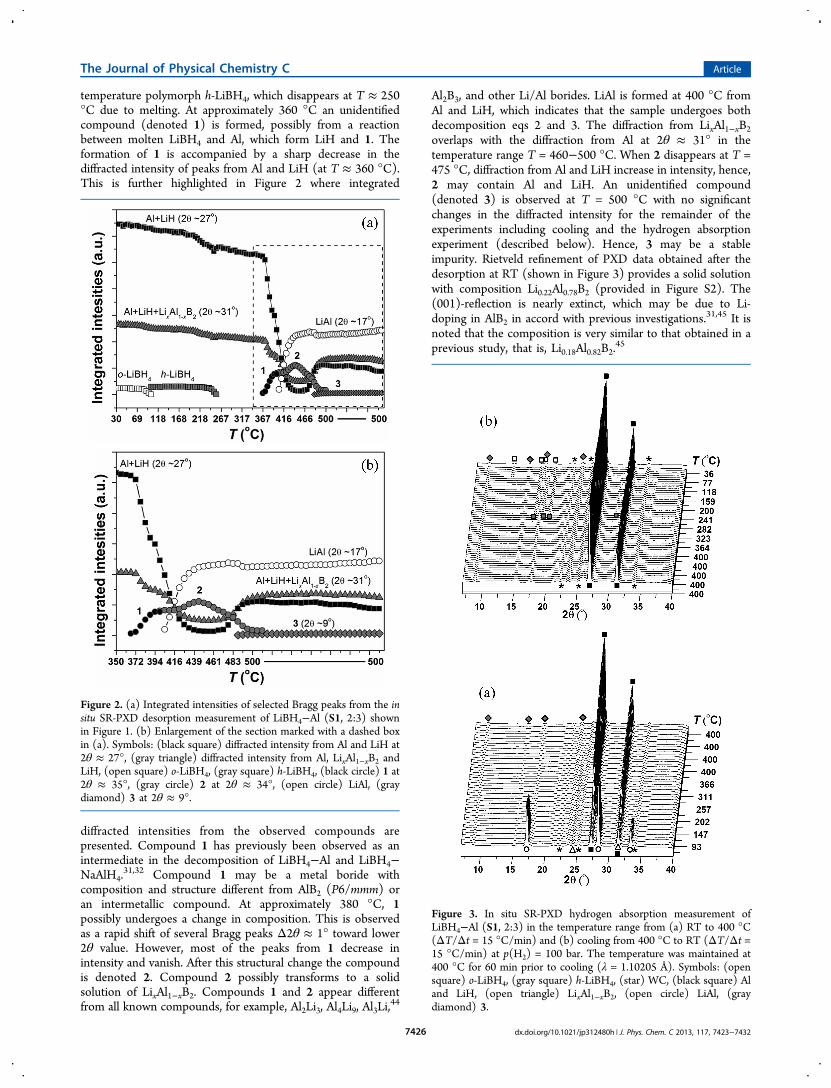
temperature polymorph h-LiBH4, which disappears at T ≈ 250°C due to melting. At approximately 360 °C an unidentifiedcompound (denoted 1) is formed, possibly from a reactionbetween molten LiBH4 and Al, which form LiH and 1. Theformation of 1 is accompanied by a sharp decrease in thediffracted intensity of peaks from Al and LiH (at T ≈ 360 °C).This is further highlighted in Figure 2 where integrated
diffracted intensities from the observed compounds arepresented. Compound 1 has previously been observed as anintermediate in the decomposition of LiBH4−Al and LiBH4−NaAlH4.
31,32 Compound 1 may be a metal boride withcomposition and structure different from AlB2 (P6/mmm) oran intermetallic compound. At approximately 380 °C, 1possibly undergoes a change in composition. This is observedas a rapid shift of several Bragg peaks Δ2θ ≈ 1° toward lower2θ value. However, most of the peaks from 1 decrease inintensity and vanish. After this structural change the compoundis denoted 2. Compound 2 possibly transforms to a solidsolution of LixAl1−xB2. Compounds 1 and 2 appear differentfrom all known compounds, for example, Al2Li3, Al4Li9, Al3Li,
44
Al2B3, and other Li/Al borides. LiAl is formed at 400 °C fromAl and LiH, which indicates that the sample undergoes bothdecomposition eqs 2 and 3. The diffraction from LixAl1−xB2overlaps with the diffraction from Al at 2θ ≈ 31° in thetemperature range T = 460−500 °C. When 2 disappears at T =475 °C, diffraction from Al and LiH increase in intensity, hence,2 may contain Al and LiH. An unidentified compound(denoted 3) is observed at T = 500 °C with no significantchanges in the diffracted intensity for the remainder of theexperiments including cooling and the hydrogen absorptionexperiment (described below). Hence, 3 may be a stableimpurity. Rietveld refinement of PXD data obtained after thedesorption at RT (shown in Figure 3) provides a solid solutionwith composition Li0.22Al0.78B2 (provided in Figure S2). The(001)-reflection is nearly extinct, which may be due to Li-doping in AlB2 in accord with previous investigations.31,45 It isnoted that the composition is very similar to that obtained in aprevious study, that is, Li0.18Al0.82B2.
45
Figure 2. (a) Integrated intensities of selected Bragg peaks from the insitu SR-PXD desorption measurement of LiBH4−Al (S1, 2:3) shownin Figure 1. (b) Enlargement of the section marked with a dashed boxin (a). Symbols: (black square) diffracted intensity from Al and LiH at2θ ≈ 27°, (gray triangle) diffracted intensity from Al, LixAl1−xB2 andLiH, (open square) o-LiBH4, (gray square) h-LiBH4, (black circle) 1 at2θ ≈ 35°, (gray circle) 2 at 2θ ≈ 34°, (open circle) LiAl, (graydiamond) 3 at 2θ ≈ 9°.
Figure 3. In situ SR-PXD hydrogen absorption measurement ofLiBH4−Al (S1, 2:3) in the temperature range from (a) RT to 400 °C(ΔT/Δt = 15 °C/min) and (b) cooling from 400 °C to RT (ΔT/Δt =15 °C/min) at p(H2) = 100 bar. The temperature was maintained at400 °C for 60 min prior to cooling (λ = 1.10205 Å). Symbols: (opensquare) o-LiBH4, (gray square) h-LiBH4, (star) WC, (black square) Aland LiH, (open triangle) LixAl1−xB2, (open circle) LiAl, (graydiamond) 3.
The Journal of Physical Chemistry C Article
dx.doi.org/10.1021/jp312480h | J. Phys. Chem. C 2013, 117, 7423−74327426

The hydrogen absorption measurement of S1 during heatingto 400 °C is presented in Figure 3a. Peaks from LiAl disappearat approximately T = 200 °C simultaneously with theappearance of diffracted intensity from Al and LiH. Thesample is kept at 400 °C for 1 h, and during the subsequentcooling, shown in Figure 3b, Bragg peaks from h-LiBH4crystallize from the melt at T = 240 °C. The phasetransformation of h- to o-LiBH4 is observed at T ≈ 100 °C.Hereby it is shown that LiBH4−Al (S1, 2:3) can berehydrogenated under relatively mild physical conditions.Rietveld refinement was performed for the first diffractogramobtained before the desorption measurement (see Figure S1)and on the last diffractogram measured after the absorptionexperiment (see Figure S3), providing the sample compositionspresented in Table 4. The sample composition before the
desorption corresponds well with the anticipated as-milledLiBH4−Al (S1, 2:3) composite, whereas the sample composi-tion after hydrogen absorption shows that approximately 67%of the LiBH4 is reformed.The in situ SR-PXD data for LiBH4−Al−TiB2 (S2, 2:3, 4.5
mol %) is shown in Figure 4. At T ≈ 100 °C, o-LiBH4transforms to h-LiBH4 and melts at T ≈ 250 °C. Compound 1is observed at T ≈ 290 °C, which transforms to 2 at T = 380°C, and at T = 390 °C, the intermetallic compound LiAl isformed. The integrated intensities presented in Figure 5 reveal
decomposition in several steps, as diffraction from Al and LiHdecreases simultaneously with the formation of 1 and LiAl. TheBragg peak at 2θ ≈ 31° from 1 shifts abruptly to 2θ ≈ 30° at T≈ 380 °C due to formation of 2. Formation of LixAl1−xB2expected when 2 disappears is not clearly visible in Figure 4.Increasing diffracted intensity from Al and LiH is observedwhen 2 disappears, which is similar to the observations forsample S1. However, at T = 500 °C, the diffraction from Al at2θ ≈ 24° is decreasing, while diffraction from both Al andLixAl1−xB2 at 2θ ≈ 28° is constant. This indicates insertion ofexcess aluminum in LixAl1−xB2, which becomes more Al-richdue to extraction of lithium and formation of LiAl.The TiB2 additive does not seem to impact the
decomposition of LiBH4−Al (S2, 2:3, 4.5 mol %) to thesame extent as previously observed for LiBH4−Al (2:1, 2.0 mol% TiB2).
31 However, a notable difference is the formationtemperature of the intermediates. Compound 1 appears at T ≈290 °C in S2, which is approximately 80 °C, lower thanobserved in S1 (T ≈ 370 °C). Likewise, compound 2 is formedat approximately 400 and 350 °C in S1 and S2, respectively.Accurate determination of quantitative sample compositionsand formation temperatures, for example, for LixAl1−xB2, ishampered by multiple overlapping Bragg diffraction peaks (seeTable 2). Apparently, LixAl1−xB2 forms at 470 and 440 °C in S1and S2, respectively, which may be an additive effect from TiB2causing formation of intermediates at lower temperatures in S2.In both samples LiAl is formed at ∼400 °C.Samples of LiH−AlB2 (1:2) have been investigated by PXD
and MAS NMR before and after heat treatment at 500 °C for 5h (see Supporting Information). PXD and NMR revealformation of LiAl in LiH−AlB2 during heating, partly due toa reaction between LiH and an Al impurity in AlB2, in accordwith a recent study of the Al−LiBH4 system.
35 The 11B MASNMR spectra of AlB2, AlB2 after heating, and the ground LiH−AlB2 sample are identical and contain a centerband resonanceat −4.7 ppm from AlB2, with indications of the two singularitiesfor a second-order quadrupolar line shape (Figure S5a).However, for the heated LiH−AlB2 sample, the
11B centerbandresonance is shifted to higher frequency and exhibits a slightly
Table 4. Fractional Composition of LiBH4−Al (S1, 2:3)before Desorption and after Absorption Extracted byRietveld Refinement of SR-PXD Data Measured at RT (seeFigures 1 and 3, Diffraction from 3 is Neglected)
before desorption after absorption
compound wt% mol % wt% mol %
LiBH4 31.49 36.43 20.86 24.65Al 68.00 63.51 78.95 75.32WC 0.51 0.07 0.19 0.02
Figure 4. In situ SR-PXD desorption measurement of sample LiBH4−Al−TiB2 (S2, 2:3, 4.5 mol %) in the temperature range from RT to500 °C, at p(H2) = 10−2 bar (ΔT/Δt = 10 °C/min, λ = 0.98922 Å).The sample was kept at a constant temperature of 500 °C for 15 min.Symbols: (open square) o-LiBH4, (gray square) h-LiBH4, (star) WC,(black square) Al and LiH, (black triangle) TiB2, (black circle) 1, (graycircle) 2, (gray inverted triangle) LixAl1−xB2 and TiB2, (open circle)LiAl.
Figure 5. Integrated intensities for selected Bragg peaks from the insitu SR-PXD desorption measurement of LiBH4−Al−TiB2 (S2, 2:3,4.5 mol %). Symbols: (black square) contribution from Al and LiH (at2θ ≈ 24°), (gray inverted triangle) contribution from Al, LixAl1−xB2,LiH, and TiB2 (at 2θ ≈ 28°), (open square) o-LiBH4, (gray square) h-LiBH4, (black circle) 1 at 2θ ≈ 31°, (gray circle) 2 at 2θ ≈ 30°, (opencircle) LiAl.
The Journal of Physical Chemistry C Article
dx.doi.org/10.1021/jp312480h | J. Phys. Chem. C 2013, 117, 7423−74327427
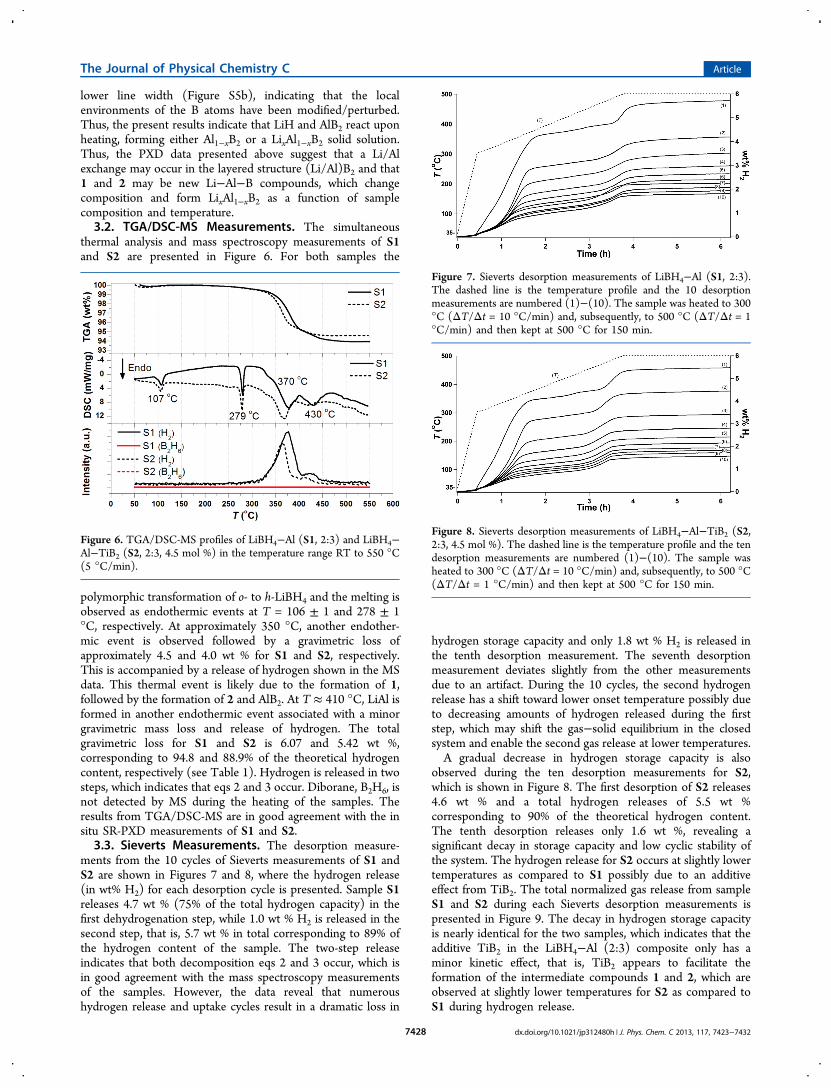
lower line width (Figure S5b), indicating that the localenvironments of the B atoms have been modified/perturbed.Thus, the present results indicate that LiH and AlB2 react uponheating, forming either Al1−xB2 or a LixAl1−xB2 solid solution.Thus, the PXD data presented above suggest that a Li/Alexchange may occur in the layered structure (Li/Al)B2 and that1 and 2 may be new Li−Al−B compounds, which changecomposition and form LixAl1−xB2 as a function of samplecomposition and temperature.3.2. TGA/DSC-MS Measurements. The simultaneous
thermal analysis and mass spectroscopy measurements of S1and S2 are presented in Figure 6. For both samples the
polymorphic transformation of o- to h-LiBH4 and the melting isobserved as endothermic events at T = 106 ± 1 and 278 ± 1°C, respectively. At approximately 350 °C, another endother-mic event is observed followed by a gravimetric loss ofapproximately 4.5 and 4.0 wt % for S1 and S2, respectively.This is accompanied by a release of hydrogen shown in the MSdata. This thermal event is likely due to the formation of 1,followed by the formation of 2 and AlB2. At T ≈ 410 °C, LiAl isformed in another endothermic event associated with a minorgravimetric mass loss and release of hydrogen. The totalgravimetric loss for S1 and S2 is 6.07 and 5.42 wt %,corresponding to 94.8 and 88.9% of the theoretical hydrogencontent, respectively (see Table 1). Hydrogen is released in twosteps, which indicates that eqs 2 and 3 occur. Diborane, B2H6, isnot detected by MS during the heating of the samples. Theresults from TGA/DSC-MS are in good agreement with the insitu SR-PXD measurements of S1 and S2.3.3. Sieverts Measurements. The desorption measure-
ments from the 10 cycles of Sieverts measurements of S1 andS2 are shown in Figures 7 and 8, where the hydrogen release(in wt% H2) for each desorption cycle is presented. Sample S1releases 4.7 wt % (75% of the total hydrogen capacity) in thefirst dehydrogenation step, while 1.0 wt % H2 is released in thesecond step, that is, 5.7 wt % in total corresponding to 89% ofthe hydrogen content of the sample. The two-step releaseindicates that both decomposition eqs 2 and 3 occur, which isin good agreement with the mass spectroscopy measurementsof the samples. However, the data reveal that numeroushydrogen release and uptake cycles result in a dramatic loss in
hydrogen storage capacity and only 1.8 wt % H2 is released inthe tenth desorption measurement. The seventh desorptionmeasurement deviates slightly from the other measurementsdue to an artifact. During the 10 cycles, the second hydrogenrelease has a shift toward lower onset temperature possibly dueto decreasing amounts of hydrogen released during the firststep, which may shift the gas−solid equilibrium in the closedsystem and enable the second gas release at lower temperatures.A gradual decrease in hydrogen storage capacity is also
observed during the ten desorption measurements for S2,which is shown in Figure 8. The first desorption of S2 releases4.6 wt % and a total hydrogen releases of 5.5 wt %corresponding to 90% of the theoretical hydrogen content.The tenth desorption releases only 1.6 wt %, revealing asignificant decay in storage capacity and low cyclic stability ofthe system. The hydrogen release for S2 occurs at slightly lowertemperatures as compared to S1 possibly due to an additiveeffect from TiB2. The total normalized gas release from sampleS1 and S2 during each Sieverts desorption measurements ispresented in Figure 9. The decay in hydrogen storage capacityis nearly identical for the two samples, which indicates that theadditive TiB2 in the LiBH4−Al (2:3) composite only has aminor kinetic effect, that is, TiB2 appears to facilitate theformation of the intermediate compounds 1 and 2, which areobserved at slightly lower temperatures for S2 as compared toS1 during hydrogen release.
Figure 6. TGA/DSC-MS profiles of LiBH4−Al (S1, 2:3) and LiBH4−Al−TiB2 (S2, 2:3, 4.5 mol %) in the temperature range RT to 550 °C(5 °C/min).
Figure 7. Sieverts desorption measurements of LiBH4−Al (S1, 2:3).The dashed line is the temperature profile and the 10 desorptionmeasurements are numbered (1)−(10). The sample was heated to 300°C (ΔT/Δt = 10 °C/min) and, subsequently, to 500 °C (ΔT/Δt = 1°C/min) and then kept at 500 °C for 150 min.
Figure 8. Sieverts desorption measurements of LiBH4−Al−TiB2 (S2,2:3, 4.5 mol %). The dashed line is the temperature profile and the tendesorption measurements are numbered (1)−(10). The sample washeated to 300 °C (ΔT/Δt = 10 °C/min) and, subsequently, to 500 °C(ΔT/Δt = 1 °C/min) and then kept at 500 °C for 150 min.
The Journal of Physical Chemistry C Article
dx.doi.org/10.1021/jp312480h | J. Phys. Chem. C 2013, 117, 7423−74327428
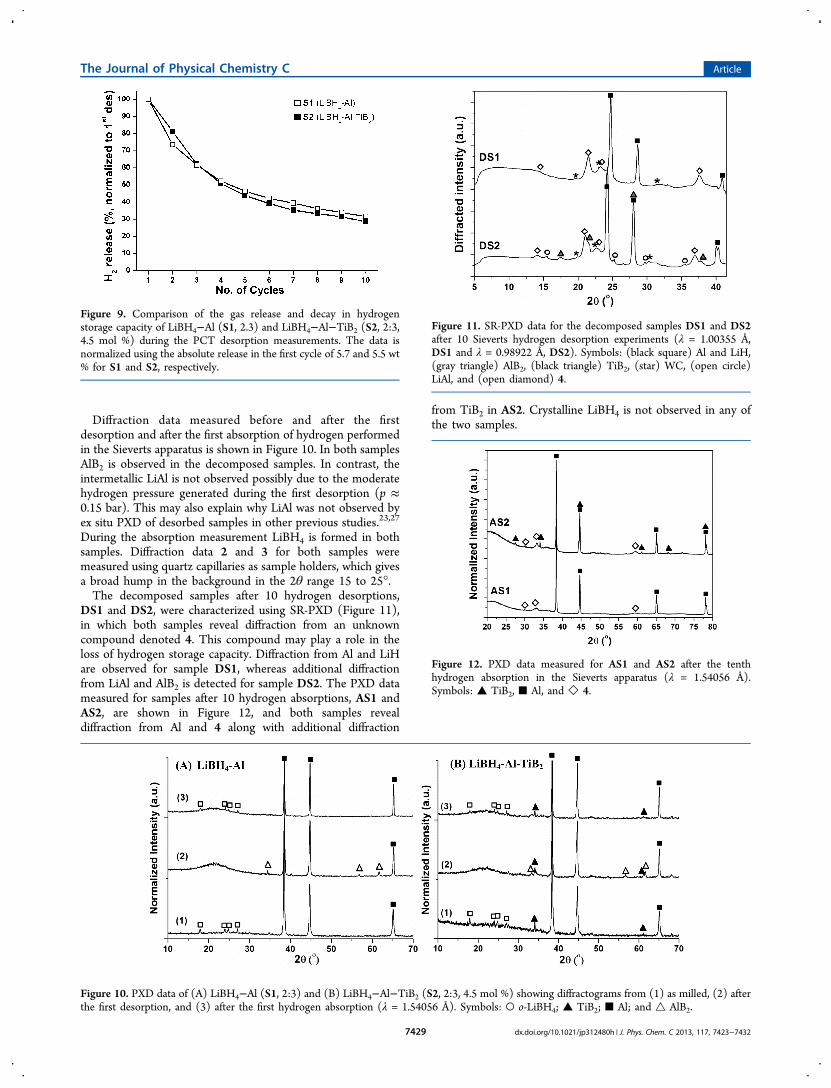
Diffraction data measured before and after the firstdesorption and after the first absorption of hydrogen performedin the Sieverts apparatus is shown in Figure 10. In both samplesAlB2 is observed in the decomposed samples. In contrast, theintermetallic LiAl is not observed possibly due to the moderatehydrogen pressure generated during the first desorption (p ≈0.15 bar). This may also explain why LiAl was not observed byex situ PXD of desorbed samples in other previous studies.23,27
During the absorption measurement LiBH4 is formed in bothsamples. Diffraction data 2 and 3 for both samples weremeasured using quartz capillaries as sample holders, which givesa broad hump in the background in the 2θ range 15 to 25°.The decomposed samples after 10 hydrogen desorptions,
DS1 and DS2, were characterized using SR-PXD (Figure 11),in which both samples reveal diffraction from an unknowncompound denoted 4. This compound may play a role in theloss of hydrogen storage capacity. Diffraction from Al and LiHare observed for sample DS1, whereas additional diffractionfrom LiAl and AlB2 is detected for sample DS2. The PXD datameasured for samples after 10 hydrogen absorptions, AS1 andAS2, are shown in Figure 12, and both samples revealdiffraction from Al and 4 along with additional diffraction
from TiB2 in AS2. Crystalline LiBH4 is not observed in any ofthe two samples.
Figure 9. Comparison of the gas release and decay in hydrogenstorage capacity of LiBH4−Al (S1, 2.3) and LiBH4−Al−TiB2 (S2, 2:3,4.5 mol %) during the PCT desorption measurements. The data isnormalized using the absolute release in the first cycle of 5.7 and 5.5 wt% for S1 and S2, respectively.
Figure 10. PXD data of (A) LiBH4−Al (S1, 2:3) and (B) LiBH4−Al−TiB2 (S2, 2:3, 4.5 mol %) showing diffractograms from (1) as milled, (2) afterthe first desorption, and (3) after the first hydrogen absorption (λ = 1.54056 Å). Symbols: ○ o-LiBH4; ▲ TiB2; ■ Al; and △ AlB2.
Figure 11. SR-PXD data for the decomposed samples DS1 and DS2after 10 Sieverts hydrogen desorption experiments (λ = 1.00355 Å,DS1 and λ = 0.98922 Å, DS2). Symbols: (black square) Al and LiH,(gray triangle) AlB2, (black triangle) TiB2, (star) WC, (open circle)LiAl, and (open diamond) 4.
Figure 12. PXD data measured for AS1 and AS2 after the tenthhydrogen absorption in the Sieverts apparatus (λ = 1.54056 Å).Symbols: ▲ TiB2, ■ Al, and ◇ 4.
The Journal of Physical Chemistry C Article
dx.doi.org/10.1021/jp312480h | J. Phys. Chem. C 2013, 117, 7423−74327429
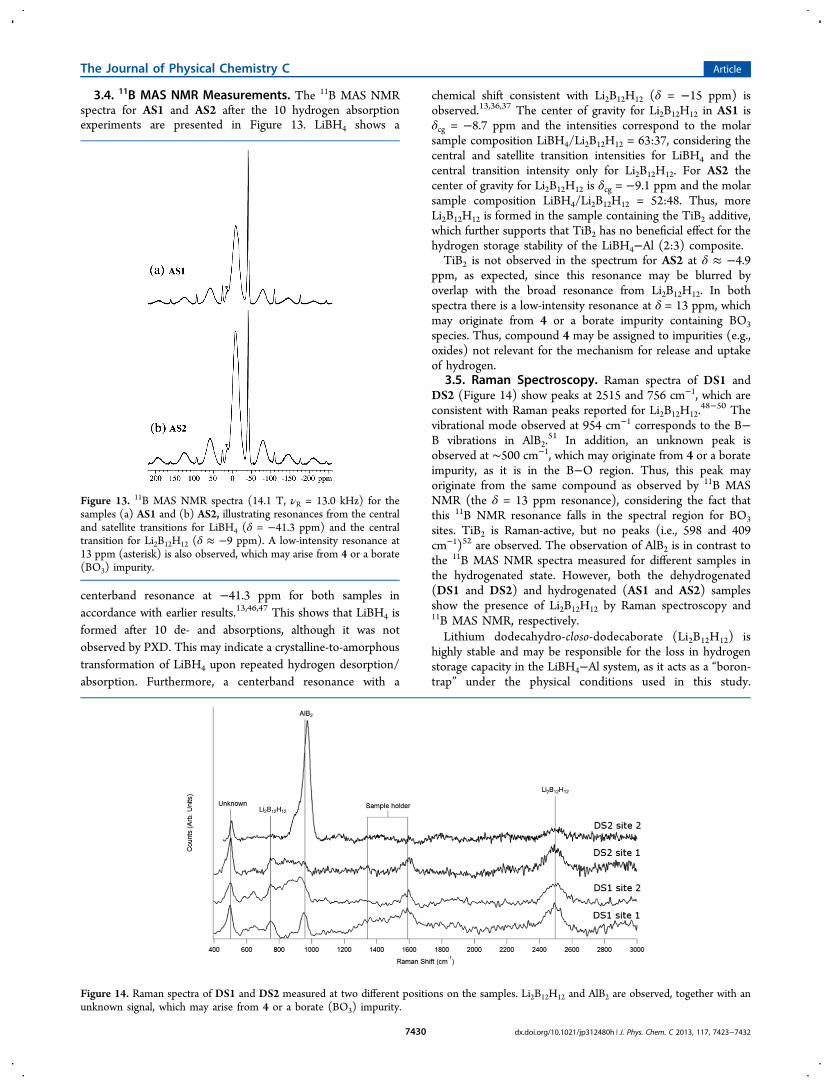
3.4. 11B MAS NMR Measurements. The 11B MAS NMRspectra for AS1 and AS2 after the 10 hydrogen absorptionexperiments are presented in Figure 13. LiBH4 shows a
centerband resonance at −41.3 ppm for both samples inaccordance with earlier results.13,46,47 This shows that LiBH4 isformed after 10 de- and absorptions, although it was notobserved by PXD. This may indicate a crystalline-to-amorphoustransformation of LiBH4 upon repeated hydrogen desorption/absorption. Furthermore, a centerband resonance with a
chemical shift consistent with Li2B12H12 (δ = −15 ppm) isobserved.13,36,37 The center of gravity for Li2B12H12 in AS1 isδcg = −8.7 ppm and the intensities correspond to the molarsample composition LiBH4/Li2B12H12 = 63:37, considering thecentral and satellite transition intensities for LiBH4 and thecentral transition intensity only for Li2B12H12. For AS2 thecenter of gravity for Li2B12H12 is δcg = −9.1 ppm and the molarsample composition LiBH4/Li2B12H12 = 52:48. Thus, moreLi2B12H12 is formed in the sample containing the TiB2 additive,which further supports that TiB2 has no beneficial effect for thehydrogen storage stability of the LiBH4−Al (2:3) composite.TiB2 is not observed in the spectrum for AS2 at δ ≈ −4.9
ppm, as expected, since this resonance may be blurred byoverlap with the broad resonance from Li2B12H12. In bothspectra there is a low-intensity resonance at δ = 13 ppm, whichmay originate from 4 or a borate impurity containing BO3
species. Thus, compound 4 may be assigned to impurities (e.g.,oxides) not relevant for the mechanism for release and uptakeof hydrogen.
3.5. Raman Spectroscopy. Raman spectra of DS1 andDS2 (Figure 14) show peaks at 2515 and 756 cm−1, which areconsistent with Raman peaks reported for Li2B12H12.
48−50 Thevibrational mode observed at 954 cm−1 corresponds to the B−B vibrations in AlB2.
51 In addition, an unknown peak isobserved at ∼500 cm−1, which may originate from 4 or a borateimpurity, as it is in the B−O region. Thus, this peak mayoriginate from the same compound as observed by 11B MASNMR (the δ = 13 ppm resonance), considering the fact thatthis 11B NMR resonance falls in the spectral region for BO3
sites. TiB2 is Raman-active, but no peaks (i.e., 598 and 409cm−1)52 are observed. The observation of AlB2 is in contrast tothe 11B MAS NMR spectra measured for different samples inthe hydrogenated state. However, both the dehydrogenated(DS1 and DS2) and hydrogenated (AS1 and AS2) samplesshow the presence of Li2B12H12 by Raman spectroscopy and11B MAS NMR, respectively.Lithium dodecahydro-closo-dodecaborate (Li2B12H12) is
highly stable and may be responsible for the loss in hydrogenstorage capacity in the LiBH4−Al system, as it acts as a “boron-trap” under the physical conditions used in this study.
Figure 13. 11B MAS NMR spectra (14.1 T, νR = 13.0 kHz) for thesamples (a) AS1 and (b) AS2, illustrating resonances from the centraland satellite transitions for LiBH4 (δ = −41.3 ppm) and the centraltransition for Li2B12H12 (δ ≈ −9 ppm). A low-intensity resonance at13 ppm (asterisk) is also observed, which may arise from 4 or a borate(BO3) impurity.
Figure 14. Raman spectra of DS1 and DS2 measured at two different positions on the samples. Li2B12H12 and AlB2 are observed, together with anunknown signal, which may arise from 4 or a borate (BO3) impurity.
The Journal of Physical Chemistry C Article
dx.doi.org/10.1021/jp312480h | J. Phys. Chem. C 2013, 117, 7423−74327430

Furthermore, Raman spectra measured at different locationswithin the same sample are different, which could indicateinhomogeneity and phase separation during cycling ofhydrogen release and uptake, as proposed earlier.29 Thepresence of amorphous boron has previously been proposedto be responsible for the hydrogen capacity loss, however, it isnot detected by either Raman or 11B MAS NMR spectroscopyin this study. Formation of Li2B12H12 has earlier been observedduring the decomposition of pristine LiBH4,
53,54 but is herereported in the LiBH4−Al (2:3) system for the first time. Theselected physical conditions appear to suppress release ofdiborane, but may facilitate formation of the more stable closo-borane, Li2B12H12, which clearly hampers hydrogen uptake.Further research within efficient catalytic additives may solvethis problem or the use of sufficiently high hydrogen backpressure during decomposition of the composite. The presentwork reveals the importance of full control of possible sidereactions, which may occur during release and uptake ofhydrogen and may lead to decreasing storage capacity.
4. CONCLUSIONS
The hydrogen storage capacity loss for a LiBH4−Al (2:3)composite has been investigated during 10 hydrogen releaseand uptake cycles. The hydrogen storage capacity decreasesfrom 6.4 to ∼1 wt %, possibly due to the formation of relativelystable closo-borane, Li2B12H12, as observed by 11B MAS NMRand Raman spectroscopy. The samples of LiBH4−Al (2:3) withand without TiB2 additive show a similar decrease in hydrogenstorage capacity after each cycle, that is, addition of TiB2 offersno improvement to the system. The capacity loss is largest inthe first four cycles after which only about 45% hydrogenstorage capacity remains. The decomposition mechanisms forthe LiBH4−Al composite have been studied using in situ SR-PXD and TGA/DSC-MS, which clearly shows that thedecomposition occurs via several chemical reactions, in whichonly hydrogen is released. The decomposition occurs via theintermediate compounds denoted 1 and 2 below temperaturesof 500 °C, which may be new Li−Al−B compounds.Furthermore, a minor kinetic effect from the additive TiB2appears to facilitate the formation of the intermediatecompounds 1 and 2 at slightly lower temperatures. Addition-ally, Rietveld refinement reveals solid solutions of Li0.22Al0.78B2or Al0.78B2. This work shows that detailed knowledge of thereaction mechanisms for hydrogen release and uptake isessential and may be tailored by the physical conditions, suchas temperature, pressure, and sample compositions and possiblyalso influenced by additives.
■ ASSOCIATED CONTENT
*S Supporting InformationRietveld refinement plots as well as synthesis and character-ization using PXD and solid-state 11B MAS NMR of a sample ofLiH−AlB2. This material is available free of charge via theInternet at http://pubs.acs.org.
■ AUTHOR INFORMATION
Corresponding Author*E-mail: [email protected].
NotesThe authors declare no competing financial interest.
■ ACKNOWLEDGMENTS
The work was supported by the Danish National ResearchFoundation (DNRF93), Center for Materials Crystallography,the Danish Strategic Research Council (The research projectHyFillFast), the Carlsberg Foundation and by the DanishResearch Council for Nature and Universe (Danscatt). Theaccess to beam time at the MAX-II synchrotron, Lund, Sweden,in the research laboratory MAX-lab is gratefully acknowledged.The use of the facilities at the Instrument Centre for Solid-StateNMR Spectroscopy, Department of Chemistry, AarhusUniversity, sponsored by the Danish Natural Science ResearchCouncils and the Carlsberg Foundation, is acknowledged. Weare also grateful for funding from the European Community’sSeventh Framework Program, The Fuel Cells and HydrogenJoint Undertaking (FCH JU), Project BOR4STORE (303428).
■ REFERENCES(1) Schlapbach, L.; Zuttel, A. Nature 2001, 414, 353−358.(2) Schlapbach, L. Nature 2009, 460, 809−811.(3) Eberle, U.; Felderhoff, M.; Schuth, F. Angew. Chem., Int. Ed. 2009,48, 6608−6630.(4) Ravnsbæk, D. B.; Filinchuk, Y.; Cerny, R.; Jensen, T. R. Z.Kristallogr. 2010, 225, 557−569.(5) Rude, L. H.; Nielsen, T. K.; Ravnsbæk, D. B.; Bosenberg, U.; Ley,M. B.; Richter, B.; Arnbjerg, L. M.; Dornheim, M.; Filinchuk, Y.;Besenbacher, F.; et al. Phys. Status Solidi A 2011, 208, 1754−1773.(6) Orimo, S.; Nakamori, Y.; Eliseo, J. R.; Zuttel, A.; Jensen, C. M.Chem. Rev. 2007, 107, 4111−4132.(7) Pinkerton, F. E.; Meisner, G. P.; Meyer, M. S.; Balogh, M. P.;Kundrat, M. D. J. Phys. Chem. B 2005, 109, 6−8.(8) Mao, J.; Guo, Z.; Leng, H.; Wu, Z.; Guo, Y.; Yu, X.; Liu, H. J.Phys. Chem. C 2010, 114, 11643−11649.(9) Li, C.; Peng, P.; Zhou, D. W.; Wan, L. Int. J. Hydrogen Energy2011, 36, 14512−14526.(10) Soulie, J.-P.; Renaudin, G.; Cerny, R.; Yvon, K. J. Alloys Comp.2002, 346, 200−205.(11) Zuttel, A.; Rentsch, S.; Fischer, P.; Wenger, P.; Sudan, P.;Mauron, P.; Emmenegger, C. J. Alloys Comp. 2003, 356−357, 515−520.(12) Remhof, A.; Friedrichs, O.; Buchter, F.; Mauron, P.; Kim, J. W.;Oh, K. H.; Buchsteiner, A.; Wallacher, D.; Zuttel, A. J. Alloys Comp.2009, 484, 654−659.(13) Hwang, S.-J.; Bowman, R. C.; Reiter, J. W.; Rijssenbeek;Soloveichik, G. L.; Zhao, J.-C.; Kabbour, H.; Ahn, C. C. J. Phys. Chem.C 2008, 112, 3164−3169.(14) Orimo, S.-I.; Nakamori, Y.; Ohba, N.; Miwa, K.; Aoki, M.;Towata, S.; Zuttel, A. Appl. Phys. Lett. 2006, 89, 021920−021920−3.(15) Ohba, N.; Miwa, K.; Aoki, M.; Noritake, T.; Towata, S.;Nakamori, Y.; Orimo, S.; Zuttel, A. Phys. Rev. B 2006, 74, 075110.(16) Friedrichs, O.; Remhof, A.; Hwang, S.-J.; Zuttel, A. Chem. Mater.2010, 22, 3265−3268.(17) Ozolins, V.; Majzoub, E. H.; Wolverton, C. J. Am. Chem. Soc.2009, 131, 230−237.(18) Bosenberg, U.; Ravnsbæk, D. B.; Hagemann, H.; D’Anna, V.;Minella, C. B.; Pistidda, C.; Van Beek, W.; Jensen, T. R.; Bormann, R.;Dornheim, M. J. Phys. Chem. C 2010, 114, 15212−15217.(19) Bosenberg, U.; Doppiu, S.; Mosegaard, L.; Barkhordarian, G.;Eigen, N.; Borgschulte, A.; Jensen, T. R.; Cerenius, Y.; Gutfleisch, O.;Klassen, T.; et al. Acta Mater. 2007, 55, 3951−3958.(20) Bosenberg, U.; Kim, J. W.; Gosslar, D.; Eigen, N.; Jensen, T. R.;Von Colbe, J. M. B.; Zhou, Y.; Dahms, M.; Kim, D. H.; Gunther, R.;et al. Acta Mater. 2010, 58, 3381−3389.(21) Price, T. E. C.; Grant, D. M.; Legrand, V.; Walker, G. S. Int. J.Hydrogen Energy 2010, 35, 4154−4161.(22) Sridechprasat, P.; Suttisawat, Y.; Rangsunvigit, P.; Kitiyanan, B.;Kulprathipanja, S. Int. J. Hydrogen Energy 2011, 36, 1200−1205.
The Journal of Physical Chemistry C Article
dx.doi.org/10.1021/jp312480h | J. Phys. Chem. C 2013, 117, 7423−74327431
(23) Yang, J.; Sudik, A.; Wolverton, C. J. Phys. Chem. C 2007, 111,19134−19140.(24) Gosalawit−Utke, R.; Nielsen, T. K.; Pranzas, K.; Saldan, I.;Pistidda, C.; Karimi, F.; Laipple, D.; Skibsted, J.; Jensen, T. R.; et al. J.Phys. Chem. C 2012, 116, 1526−1534.(25) Blanchard, D.; Shi, Q.; Boothroyd, C. B.; Vegge, T. J. Phys.Chem. C 2009, 113, 14059−14066.(26) Friedrichs, O.; Kim, J. W.; Remhof, A.; Buchter, F.; Borgschulte,A.; Wallacher, D.; Cho, Y. W.; Fichtner, M.; Oh, K. H.; Zuttel, A. Phys.Chem. Chem. Phys. 2009, 11, 1515−1520.(27) Jin, S.-A.; Shim, J.-H.; Cho, Y. W.; Yi, K.-W.; Zabara, O.;Fichtner, M. Scr. Mater. 2008, 58, 963−965.(28) Kang, X.-D.; Wang, P.; Ma, L.-P.; Cheng, H.-M. Appl. Phys. A:Mater. Sci. Process. 2007, 89, 963−966.(29) Kim, J. W.; Friedrichs, O.; Ahn, J.-P.; Kim, D. H.; Kim, S. C.;Remhof, A.; Chung, H.-S.; Lee, J.; Shim, J.-H.; Cho, Y. W.; et al. Scr.Mater. 2009, 60, 1089−1092.(30) Li, H.-W.; Yan, Y.; Orimo, S.; Zuttel, A.; Jensen, C. M. Energies2011, 4, 185−214.(31) Ravnsbæk, D. B.; Jensen, T. R. J. Appl. Phys. 2012, 111,112621−112621−9.(32) Ravnsbæk, D. B.; Jensen, T. R. J. Phys. Chem. Solids 2010, 71,1144−1149.(33) Price, T. E. C.; Grant, D. M.; Weston, D.; Hansen, T.; Arnbjerg,L. M.; Ravnsbæk, D. B.; Jensen, T. R.; Walker, G. S. J. Am. Chem. Soc.2011, 133, 13534−13538.(34) Meggouh, M.; Grant, D. M.; Walker, G. S. J. Phys. Chem. C2011, 115, 22054−22061.(35) Choi, Y. J.; Lu, J.; Sohn, H. Y.; Fang, Z. Z.; Kim, C.; Bowman, R.C.; Hwang, S.-J. J. Phys. Chem. C 2011, 115, 6048−6056.(36) Kostka, J.; Lohstroh, W.; Fichtner, M.; Hahn, H. J. Phys. Chem.C 2007, 111, 14026−14029.(37) Friedrichs, O.; Borgschulte, A.; Kato, S.; Buchter, F.; Gremaud,R.; Remhof, A.; Zuttel, A. Chem.Eur. J. 2009, 15, 5531−5534.(38) Mosegaard, L.; Møller, B.; Jorgensen, J.-E.; Filinchuk, Y.;Cerenius, Y.; Hanson, J. C.; Dimasi, E.; Besenbacher, F.; Jensen, T. R.J. Phys. Chem. C 2008, 112, 1299−1303.(39) Cerenius, Y.; Stahl, K.; Svensson, L. A.; Ursby, T.; Oskarsson, a;Albertsson, J.; Liljas, A. J. Synchrotron Radiat. 2000, 7, 203−208.(40) Jensen, T. R.; Nielsen, T. K.; Filinchuk, Y.; Jørgensen, J.-E.;Cerenius, Y.; Gray, E. M.; Webb, C. J. J. Appl. Crystallogr. 2010, 43,1456−1463.(41) Hammersley, A. P.; Svensson, S. O.; Hanfland, M.; Fitch, A. N.;Hausermann, D. High Pressure Res. 1996, 14, 235−248.(42) Rodríguez-Carvajal, J. Phys. B (Amsterdam, Neth.) 1993, 192,55−69.(43) Lee, Y.-W.; Clemens, B. M.; Gross, K. J. J. Alloys Comp. 2008,452, 410−413.(44) Guo, X.-Q.; Podloucky, R.; Freeman, A. J. Phys. Rev. B 1990, 42,10912−10923.(45) Sun, T.; Zhao, Y. G.; Fan, R.; Zhang, X. P.; Liu, B. G.; Xiong, Y.H.; Li, P. J. J. Supercond. 2004, 17, 473−480.(46) Arnbjerg, L. M.; Ravnsbæk, D. B.; Filinchuk, Y.; Vang, R. T.;Cerenius, Y.; Besenbacher, F.; Jørgensen, J.-E.; Jakobsen, H. J.; Jensen,T. R. Chem. Mater. 2009, 21, 5772−5782.(47) Hartman, M. R.; Rush, J. J.; Udovic, T. J.; Bowman, R. C., Jr.;Hwang, S.-J. J. Solid State Chem. 2007, 180, 1298−1305.(48) Yan, Y.; Remhof, A.; Hwang, S.-J.; Li, H.-W.; Mauron, P.;Orimo, S.; Zuttel, A. Phys. Chem. Chem. Phys. 2012, 14, 6514−6519.(49) Her, J.-H.; Yousufuddin, M.; Zhou, W.; Jalisatgi, S. S.; Kulleck, J.G.; Zan, J. A.; Hwang, S.-J.; Bowman, R. C.; Udovic, T. J. Inorg. Chem.2008, 47, 9757−9759.(50) Muetterties, E. L.; Merrifield, R. E.; Miller, H. C.; Knoth, W. H.;Downing, J. R. J. Am. Chem. Soc. 1962, 84, 2506−2508.(51) Loa, I.; Kunc, K.; Syassen, K.; Bouvier, P. Phys. Rev. B 2002, 66,134101−134110.(52) Baca, L.; Stelzer, N. J. Eur. Ceram. Soc. 2008, 28, 907−911.(53) Reed, D.; Book, D. Mater. Res. Soc. Symp. Proc. 2010, 1216.
(54) Reed, D.; Book, D. Curr. Opin. Solid State Mater. Sci. 2011, 15,62−72.(55) Staritzky, E. Anal. Chem. 1956, 28, 1055.(56) Jette, E. R.; Foote, F. J. Chem. Phys. 1935, 3, 605−616.(57) Baroch, C.; Evans, T. E. J. Met. 1955, 7, 908.(58) Hofmann, W.; Janiche, W. Naturwissenschaften 1935, 23, 851.(59) Levine, E. D.; Rapperport, E. J. Trans. Metall. Soc. AIME 1963,227, 1204−1208.(60) Garaycochea, I.; Cid-Dresdner, H. Acta Crystallogr. 1961, 14,200−201.
The Journal of Physical Chemistry C Article
dx.doi.org/10.1021/jp312480h | J. Phys. Chem. C 2013, 117, 7423−74327432


![[Composite Cultures] - CORE](https://static.fdokumen.com/doc/165x107/6325e67de491bcb36c0a86c0/composite-cultures-core.jpg)