
Validazione e analisi dei gas di fissione in combustibili MOX ...
172
Inserire logo o denominazione del cobeneficiario Validazione e analisi dei gas di fissione in combustibili MOX ad elevato burnup D. Rozzia, N. Forgione, A. Ardizzone, A. Del Nevo Report RdS/2013/023 Agenzia nazionale per le nuove tecnologie, l’energia e lo sviluppo economico sostenibile MINISTERO DELLO SVILUPPO ECONOMICO
-
Upload
khangminh22 -
Category
Documents
-
view
0 -
download
0
Transcript of Validazione e analisi dei gas di fissione in combustibili MOX ...

Inserire logo o denominazione del cobeneficiario
Validazione e analisi dei gas di fissione in combustibili MOX ad elevato burnup
D. Rozzia, N. Forgione, A. Ardizzone, A. Del Nevo
Report RdS/2013/023
Agenzia nazionale per le nuove tecnologie, l’energia e lo sviluppo economico sostenibile MINISTERO DELLO SVILUPPO ECONOMICO

VALIDAZIONE E ANALISI DEI GAS DI FISSIONE IN COMBUSTIBILI MOX AD ELEVATO BURNUP D. Rozzia, N. Forgione (UNIPI), A. Ardizzone (POLITO), A. Del Nevo (ENEA) Settembre 2013
Report Ricerca di Sistema Elettrico Accordo di Programma Ministero dello Sviluppo Economico -‐ ENEA Piano Annuale di Realizzazione 2012 Area: Produzione di energia elettrica e protezione dell'ambiente Progetto: Sviluppo competenze scientifiche nel campo della sicurezza nucleare e collaborazione ai programmi internazionali per il nucleare di IV Generazione Obiettivo: Sviluppo competenze scientifiche nel campo della sicurezza nucleare Responsabile del Progetto: Mariano Tarantino, ENEA Il presente documento descrive le attività di ricerca svolte all’interno dell’Accordo di collaborazione “Sviluppo competenze scientifiche nel campo della sicurezza nucleare e collaborazione ai programmi internazionali per il nucleare di IV generazione” Responsabile scientifico ENEA: Mariano Tarantino Responsabile scientifico CIRTEN: Giuseppe Forasassi


Ricerca Sistema Elettrico
Sigla di identificazione
ADPFISS – LP2 – 041
Rev.
0
Distrib.
L
Pag. di
2 170
(This page has been intentionally left blank)

Ricerca Sistema Elettrico
Sigla di identificazione
ADPFISS – LP2 – 041
Rev.
0
Distrib.
L
Pag. di
3 170
Abstract
The present document constitutes the contribution LP2.a.3_b to the task A.3 of ADP-2012. The aim of
this report is the assessment of TRANSURANUS code version 2012 in simulating MOX fuel behavior
with particular reference to the FGR phenomenon. This type of fuel has been selected as fuel for both
GEN-IV systems as ALFRED or ASTRID and advanced thermal reactors as EPR. Since fuel pin
mechanics codes are usually based on empirical correlations obtained from experiments, their
applicability to new designs should be demonstrated by verification and validation processes. This
complex task requires the large use of experimental databases. Due to the un-availability of public
databases on FR fuel, the first step, is verification and validation of fuel pin mechanic codes against
thermal reactor public databases. The International Fuel Pin performance Experimental database
(IFPE) aims to provide in the public domain, a comprehensive and well-qualified database on Zr clad
UO2 – MOX fuel for model development and validation. Two experimental databases in the burn-up
range from 25 - 30MWd/kgMOX have been selected from the IFPE to fulfil the objective: the PRIMO
experiment (1 rod) and IFA-597 experiment (2 rods). They have been released for benchmarking
purpose.
The PWR Reference Irradiation of MOX Fuels (PRIMO) program sought to investigate the MOX fuel
behavior under steady-state and transient conditions. It started in 1986. The aims were to investigate
the capability of MOX to sustain normal operation conditions typical of commercial PWR, to study
thermal and irradiation induced phenomena occurring in fuel and to obtain thermo-mechanical data
under power ramp conditions. The PRIMO program included sixteen MOX fuel rods manufactured
through different fabrication processes and ramp-tested at different burn-up levels between 20 and 60
MWd/kgHM. The irradiation history and the experimental data of one fuel rod named BD8 from the
PRIMO program was included in the International Fuel Performance Experimental Database and
released for benchmarking purpose. It was base-irradiated in the BR2 Pressurized Water cooled
Reactor (PWR) at an average linear power of 18.5 kW/m up to a burn-up of about 30 MWd/kgHM.
The fuel rod then underwent a ramp test in the Osiris PWR up to a peak linear power of 39.5 kW/m.
Post irradiation examinations were carried out to investigate rod behavior such as fission gas release
(FGR), clad creep, clad and fuel elongations.
The Instrumented Fuel Assembly 597 (IFA-597) experiment was carried out in the Halden Boiling
Heavy water Reactor under the auspices of the Halden Reactor Project. The experiment aimed to
study the thermal and fission gas release behavior of MOX fuel, and to explore differences in
performance between solid and hollow pellets. Two MOX rods (labeled 10 and 11) were instrumented
with a fuel center thermocouple and a pressure bellow transducer and irradiated in the Halden
Reactor. The experiment consisted of four power cycles up to 33 MWd/kgMOX. The linear power was
in the range 15-35 kW/m. Details of the fabrication data as well as irradiation data up to a burn-up of
26 MWd/kgMOX (reached at the end of the third cycle) were released with the aim of code
benchmarking. The in-pile data on fuel temperature, rod inner pressure and results of the gas
puncturing and mass spectrometry of the extracted gas were also released. The datasets of this
experiment are included in the International Fuel Performance Experimental database.

Ricerca Sistema Elettrico
Sigla di identificazione
ADPFISS – LP2 – 041
Rev.
0
Distrib.
L
Pag. di
4 170
This document consists of eight main sections and two attached appendixes. Section one points out the
objective and the framework of the activity. In the second section, the MOX fuel is described and the
main differences between MOX and UO2 are briefly discussed giving emphasis on modeling issues.
PRIMO and IFA-597 experiments are described in section three. Section four includes the procedure
adopted to develop the TRANSURANUS reference input decks. The main capabilities of
TRANSURANUS in treating the FGR phenomenon and its connected parameters and processes are
described in section five. Sections sis and seven constitute the core of this report. They aim to validate
TRANSURANUS code against PRIMO and IFA-597 experiments exploring its capabilities by
systematic comparison between simulated and measured trends and by extensive sensitivity analysis.
The section includes the comparison with the related benchmarks. Conclusions are finally given in
section eight. Appendix A and B report detailed figures in support to the sensitivity analyses.

Ricerca Sistema Elettrico
Sigla di identificazione
ADPFISS – LP2 – 041
Rev.
0
Distrib.
L
Pag. di
5 170
CONTENTS
ABSTRACT ..................................................................................................................... 3
ABBREVIATIONS ............................................................................................................ 9
LIST OF FIGURES ......................................................................................................... 11
LIST OF TABLES ........................................................................................................... 15
1 INTRODUCTION ..................................................................................................... 17
1.1 Background ................................................................................................. 17
1.2 Objective of the activity .............................................................................. 18
1.3 Validation domains ..................................................................................... 19
2 THE MOX FUEL ................................................................................................... 23
2.1 Fabrication processes .................................................................................. 23
2.1.1 Fabrication of oxide powder .......................................................................................... 23
2.1.1.1 Precipitation of plutonium oxalate ............................................................................ 23 2.1.1.2 Thermal de-nitration methods ................................................................................... 24
2.1.2 MOX fuel fabrication ..................................................................................................... 24
2.1.2.1 Conventional process ................................................................................................. 24 2.1.2.2 COCA process ........................................................................................................... 26
2.1.2.3 MIMAS and OCOM processes.................................................................................. 26
2.1.2.4 SBR process ............................................................................................................... 26
2.2 Current MOX use in NPP ........................................................................... 27
2.3 UO2 – MOX fuels main differences ............................................................ 28
2.3.1 Melting temperature ....................................................................................................... 28 2.3.2 Thermal Conductivity .................................................................................................... 29 2.3.3 Radial power and burn-up profile .................................................................................. 30 2.3.4 Densification .................................................................................................................. 31
2.3.5 Swelling ......................................................................................................................... 32 2.3.6 Fission gas release.......................................................................................................... 33 2.3.7 Helium generation and release ....................................................................................... 34
3 DESCRIPTION OF THE EXPERIMENTS ................................................................... 35
3.1 The PRIMO program .................................................................................. 35
3.1.1 The BR3 reactor ............................................................................................................. 36
3.1.2 The OSIRIS reactor........................................................................................................ 36 3.1.3 BD8 rod design .............................................................................................................. 38 3.1.4 Base irradiation .............................................................................................................. 42 3.1.5 Power ramp irradiation .................................................................................................. 43 3.1.6 Main Achievement from the Experiment ...................................................................... 44
3.1.6.1 Non-destructive examination ..................................................................................... 45

Ricerca Sistema Elettrico
Sigla di identificazione
ADPFISS – LP2 – 041
Rev.
0
Distrib.
L
Pag. di
6 170
3.1.6.2 Destructive examination ............................................................................................ 46
3.2 The IFA-597 experiment ............................................................................. 46
3.2.1 The Halden BHWR ........................................................................................................ 47 3.2.2 Rods design .................................................................................................................... 50 3.2.3 Irradiation history........................................................................................................... 51 3.2.4 Main Achievement from the Experiment ...................................................................... 55
4 DEVELOPMENT AND SETUP OF THE TRANSURANUS MODELS ........................ 61
4.1 TRANSURANUS code............................................................................... 61
4.2 Description of the PRIMO input deck ........................................................ 62
4.2.1 Selection of the boundary conditions ............................................................................. 62
4.3 Description of the IFA-597 input deck ....................................................... 64
4.3.1 Selection of the boundary conditions ............................................................................. 65
5 THE FGR PHENOMENON AND ITS MODELING IN TU CODE ................................. 67
5.1 The FGR phenomenon ................................................................................ 67
5.1.1 FGR models ................................................................................................................... 68 5.1.2 Main parameters and processes that affect the simulation of FGR ............................... 69
5.2 Modeling of FGR in TU code ..................................................................... 70
5.2.1 FGR models ................................................................................................................... 70
5.2.2 Fuel conductivity correlations ........................................................................................ 71 5.2.3 Modeling of fuel relocation ........................................................................................... 73 5.2.4 Modeling of fuel swelling .............................................................................................. 75
5.2.5 Modeling of fuel densification ....................................................................................... 79
5.2.6 Modeling of fuel grain growth ....................................................................................... 79 5.2.7 Modeling of gap conductance ........................................................................................ 80 5.2.8 Modeling of cladding creep ........................................................................................... 81
5.2.9 Modeling of Helium release........................................................................................... 81
5.3 Summary of the reference models .............................................................. 82
6 VALIDATION OF TU CODE AGAINST PRIMO EXPERIMENT ................................ 85
6.1 Reference results ......................................................................................... 85
6.1.1 Burn-up analysis ............................................................................................................ 85 6.1.2 FGR analysis .................................................................................................................. 85 6.1.3 Grain size analysis ......................................................................................................... 86
6.1.4 Deformation analysis at the end of the BI ..................................................................... 86 6.1.5 Parametrical determination of the failure threshold....................................................... 87
6.2 Sensitivity analysis ...................................................................................... 95
6.2.1 Assessment of FGR models (runs M1) .......................................................................... 97 6.2.2 Assessment on fuel conductivity correlations (runs C1) ............................................. 100 6.2.3 Assessment on relocation models (runs M2) ............................................................... 101 6.2.4 Assessment on fuel swelling correlations (runs C2) .................................................... 104 6.2.5 Assessment on fuel densification models (runs M3) ................................................... 106

Ricerca Sistema Elettrico
Sigla di identificazione
ADPFISS – LP2 – 041
Rev.
0
Distrib.
L
Pag. di
7 170
6.2.6 Assessment on fabrication density (runs D1) .............................................................. 108 6.2.7 Assessment on grain size (runs D2) ............................................................................. 109 6.2.8 Assessment on initial gap width (runs D3) .................................................................. 109
6.3 Code to code comparison .......................................................................... 110
7 VALIDATION OF TU CODE AGAINST IFA-597 EXPERIMENT ............................. 113
7.1 Reference results ....................................................................................... 113
7.1.1 Burn-up analysis .......................................................................................................... 113 7.1.2 Fuel temperature analysis ............................................................................................ 113 7.1.3 Rod inner pressure analysis ......................................................................................... 114 7.1.4 FGR analysis ................................................................................................................ 114
7.2 Sensitivity analysis .................................................................................... 121
7.2.1 Assessment of FGR models (runs M1) ........................................................................ 122 7.2.2 Assessment on fuel conductivity correlations (runs C1) ............................................. 127 7.2.3 Assessment on relocation models (runs M2) ............................................................... 128
7.2.4 Assessment on fuel swelling correlations (runs C2) .................................................... 129 7.2.5 Assessment on fuel densification models (runs M3) ................................................... 131
7.2.6 Assessment on Helium release model (runs M4) ........................................................ 132 7.2.7 Assessment on fabricated density (runs D1) ................................................................ 133 7.2.8 Assessment on grain size (runs D2) ............................................................................. 133
7.2.9 Assessment on initial gap width (runs D3) .................................................................. 134 7.2.10 Assessment on initial free volume (runs D4) ............................................................... 135
8 CONCLUSIONS .................................................................................................... 137
REFERENCES ........................................................................................................ 141
APPENDIX A: PRIMO, SENSITIVITY ANALYSES .................................................. 146
APPENDIX B: IFA-597, SENSITIVITY ANALYSES .................................................. 157

Ricerca Sistema Elettrico
Sigla di identificazione
ADPFISS – LP2 – 041
Rev.
0
Distrib.
L
Pag. di
8 170

Ricerca Sistema Elettrico
Sigla di identificazione
ADPFISS – LP2 – 041
Rev.
0
Distrib.
L
Pag. di
9 170
Abbreviations
ADS Accelerator Driven System
ADP Accordo Di Programma
ALFRED Advanced Lead cooled Fast Reactor
Am Americium
AR After Ramp
ASTRID Advanced Sodium Test Reactor for Industrial Demostration
BI Base Irradiation
BN Belgonucleaire
BNFL British Nuclear Fuels plc (UK)
BOL Beginning Of Life
CEA Commissariat à l’Energie Atomique
CIRTEN Consorzio Interuniversitario per la Ricerca Tecnologica Nucleare
CL Conditioning Level
COCA Cobroyage (co-milling) Cadarache
CRP Coordinate Research Program
Cu Curium
DIMNP Dipartimento di Ingegneria Meccanica Nucleare e della Produzione
ENEA Agenzia nazionale per le nuove tecnologie, l'energia e lo sviluppo economico
sostenibile
EOL End of Life
EPMA Electron Probe Micro Analysis
F Failed
FBFC Franco Belge de Fabrication de Combustible
FBR Fast Breeder Reactor
FGR Fission Gas Release
FP Fission Product
FR Fast Reactor
FRAPCON-3 “Steady state fuel rod performance code”
FUMEX Fuel Modeling at Extended Burn-up
Gd Gadolinium
GEN-IV GENeration - IV
HBS High burn-up Structure
He Helium
HBWR Halden Boyling Water Reactor
HRP Halden Reactor Project
IAEA International Atomic Energy Agency
IFA Instrumented Fuel Assembly
IFE Institute For Energetik
ITU Institute for Transuranium Elements
IFPE International Fuel Performance
JNC Japan Nuclear Cycle development institute
JRC Joint Research Centre
KAERI Korean Atomic Energy Research Institute
Kr Kripton
LFR Lead cooled Fast Reactor
LHR Linear Heat Rate

Ricerca Sistema Elettrico
Sigla di identificazione
ADPFISS – LP2 – 041
Rev.
0
Distrib.
L
Pag. di
10 170
LVDT Linear Variable Differential Transducer
LWR Light Water Reactor
MA Minor Actinide
MHI Mitsubishi Heavy Industries
MHYRRA Multi-purpose HYbrid Research Reactor
MIMAS Micronized MASter blend
MLI Mean Linear Intercept
MOX Mixed OXide (fuel)
MTR Material Testing Reactor
NEA Nuclear Energy Agency
NF Non Failed
NFF Neutron Fast Flux
NITROX de-nitration process for PuO2 production (France)
NNL National Nuclear Laboratory (UK)
NPP Nuclear Power Plant
NSC Nuclear Science Committee
OECD Organization for Economic Co-operation and Development
O/M Oxygen to Metal ratio
PCI Pellet-Cladding Interaction
PCMI Pellet-Cladding Mechanical Interaction
PIE Post Irradiation Examination
PRIMO PWR Reference Irradiation of MOX fuels program
PTI Prior To Irradiation
PTR Prior To Ramp
Pu Plutonium
PWR Pressurized Water Reactor
SFR Sodium cooled Fast Reactor
RTL Ramp Terminal Level
RR Ramp Rate
SCC Stress Corrosion Cracking
SCK•CEN Studiecentrumvoor Kernenergie Centre d’Études de l’Énergie Nucléaire
TD Theoretical Density
TDN Thermal De-Nitration
TU TRANSURANUS
TWCA The Wah Chang Albany
U Uranium
UNIPI Università di Pisa
UO2 Uranium Oxide
Xe Xenon
XRF X-ray Fluorescence
Zr-4 Zircaloy-4

Ricerca Sistema Elettrico
Sigla di identificazione
ADPFISS – LP2 – 041
Rev.
0
Distrib.
L
Pag. di
11 170
List of figures
Fig. 1 – Precipitation of plutonium oxalate. ......................................................................................................... 24
Fig. 2 – Conventional MOX fuel fabrication process adopted applied by JNC in PFPF. .................................... 25
Fig. 3 –MOX fuel fabrication processes. ............................................................................................................... 27
Fig. 4 – Melting temperature of UO2 and MOX fuels as a function of burn-up according to Adamson at
al. ...................................................................................................................................................... 29
Fig. 5 – Thermal conductivity as a function of temperature at different burn-ups for UO2 and MOX fuel
according to the correlation of Lanning at al. .................................................................................. 30
Fig. 6 – Thermal conductivity as a function of burn-up at different temperatures for UO2 and MOX fuel
according to the correlation of Lanning at al. .................................................................................. 30
Fig. 7 – Sinter-able porosity correlation. .............................................................................................................. 32
Fig. 8 – Fission gas release fraction as a function of burn-up for UO2 and MOX fuel rods measured in
PWRs (Blanpain et al., 2000 and IAEA, 2003). ................................................................................ 34
Fig. 9 – OSIRIS reactor core layout. ..................................................................................................................... 38
Fig. 10 – PRIMO Program, general layout of rod BD8. ....................................................................................... 41
Fig. 11 – PRIMO Program, rod BD8, hold down spring and spacer tube. .......................................................... 41
Fig. 12 – PRIMO Program, rod BD8, linear heat rate at the peak point during base irradiation. ...................... 42
Fig. 13 – PRIMO Program, rod BD8, relative axial power profile, BR3-4D1 and BR3-4D2 cycle. .................... 43
Fig. 14 – PRIMO Program, rod BD8, linear heat rate at the peak point during power ramp test. ...................... 44
Fig. 15 – PRIMO Program, rod BD8, relative axial power profile of the OSIRIS Reactor.................................. 44
Fig. 16 – HBWR, scheme and main operational data. .......................................................................................... 49
Fig. 17 – HBWR, core plan view of reactor top lid and main data. ...................................................................... 49
Fig. 18 – IFA-597, rod 10 and rod 11, LHR at the thermocouple position ........................................................... 53
Fig. 19 – IFA-597, power axial profile. ................................................................................................................ 54
Fig. 20 – IFA-597, rod 10 and rod 11, fuel temperature and linear power history. ............................................. 57
Fig. 21 – IFA-597, rod 10 and rod 11, pressure measurements. .......................................................................... 58
Fig. 22 – IFA-597, rod 10 and rod 11, pressure measurements in IFA-597.6, pressure bursts. .......................... 59
Fig. 23 – PRIMO Program, rod BD8,cladding and coolant temperatures during base irradiation. ................... 63
Fig. 24 – PRIMO Program, rod BD8, neutron fast flux during base irradiation. ................................................ 64
Fig. 25 – PRIMO Program, rod BD8, BD8 rod axial mesh. ................................................................................. 64
Fig. 26 – IFA-597, rod 10 and rod 11, LHR at thermocouple position. ............................................................... 66
Fig. 27 – IFA-597, rod 10 and rod 11, neutron fast flux at thermocouple position. ............................................. 66
Fig.28 – PRIMO Program, rod BD8, burn-up analysis. ....................................................................................... 90
Fig.29 – PRIMO Program, rod BD8, fission gas release analysis, base irradiation. .......................................... 90
Fig. 30 – PRIMO Program, rod BD8, linear power and gap width in peak axial position, base
irradiation. ........................................................................................................................................ 91
Fig.31 – PRIMO Program, rod BD8, fission gas release analysis, power ramp. ................................................. 91

Ricerca Sistema Elettrico
Sigla di identificazione
ADPFISS – LP2 – 041
Rev.
0
Distrib.
L
Pag. di
12 170
Fig.32 – PRIMO Program, rod BD8, linear power and gap width in peak axial position, power ramp. ............. 92
Fig.33 – PRIMO Program, rod BD8, grain growth analysis. ............................................................................... 92
Fig.34 – PRIMO Program, rod BD8, fuel and cladding axial deformation (before ramp) analysis. ................... 93
Fig.35 – PRIMO Program, rod BD8, fuel and cladding radial deformation (before ramp) analysis. ................. 93
Fig.36 –PCI-SCC failure threshold, comparison with similar ramp tests. ........................................................... 94
Fig. 37 – PRIMO Program, intra-granular diffusion coefficients as function of temperature. ............................ 99
Fig. 38 – PRIMO Program, rod BD8, sensitivity analysis on FGR models, gas saturation concentration to
release gas from grain boundaries as function of temperature. ....................................................... 99
Fig. 39 – PRIMO Program, rod BD8, sensitivity analysis on FGR models, FGR, base irradiation. ................. 100
Fig. 40 – PRIMO Program, rod BD8, sensitivity analysis on FGR models, FGR, power ramp. ........................ 100
Fig. 41 – PRIMO Program, rod BD8, sensitivity analysis on relocation models, gap width in peak axial
position, base irradiation. ............................................................................................................... 103
Fig. 42 – PRIMO Program, rod BD8, sensitivity analysis on relocation models, gap width in peak axial
position, power ramp. ..................................................................................................................... 103
Fig. 43 – PRIMO Program, rod BD8, sensitivity analysis on fuel swelling correlations, gap width in peak
axial position, base irradiation. ...................................................................................................... 105
Fig. 44 – PRIMO Program, rod BD8, sensitivity analysis on fuel swelling correlations, gap width in peak
axial position, power ramp. ........................................................................................................... 106
Fig. 45 – PRIMO Program, rod BD8, sensitivity analysis on densification models, gap width in peak
axial position, base irradiation. ...................................................................................................... 107
Fig. 46 – PRIMO Program, rod BD8, sensitivity analysis on densification models, gap width in peak
axial position, power ramp. ............................................................................................................ 108
Fig. 47 – PRIMO Program, rod BD8, code-to-code comparison, fuel temperature, base irradiation. .............. 111
Fig. 48 – PRIMO Program, rod BD8, code-to-code comparison, FGR, base irradiation. ................................. 111
Fig. 49 – PRIMO Program, rod BD8, code-to-code comparison, fuel temperature, power ramp. .................... 112
Fig. 50 – PRIMO Program, rod BD8, code-to-code comparison, FGR, power ramp. ....................................... 112
Fig. 51 – IFA-597, rod 10, burn-up analysis. ..................................................................................................... 117
Fig.52 – IFA-597,rod 11, burn-up analysis. ....................................................................................................... 117
Fig.53 – IFA-597,rod 10, fuel temperature analysis ........................................................................................... 118
Fig. 54 – IFA-597,rod 11, fuel temperature analysis. ......................................................................................... 118
Fig.55 – IFA-597,rod 10, inner pressure analysis. ............................................................................................. 119
Fig.56 – IFA-597,rod 11, inner pressure analysis. ............................................................................................. 119
Fig.57 – IFA-597,rod 10, FGR analysis.............................................................................................................. 120
Fig.58 – IFA-597,rod 11, FGR analysis.............................................................................................................. 120
Fig. 59 – IFA-597, sensitivity analysis on FGR, intra-granular diffusion coefficients. ...................................... 125
Fig. 60 – IFA-597, sensitivity analysis on FGR models, gas saturation concentration to release from
grain boundaries. ............................................................................................................................ 126
Fig. 61 – IFA-597, rod 10 and rod 11, sensitivity analysis on FGR, final results. ............................................. 126
Fig. 62 – IFA-597, rod 10 and rod 11, sensitivity analysis on pin pressure, final results. ................................. 127

Ricerca Sistema Elettrico
Sigla di identificazione
ADPFISS – LP2 – 041
Rev.
0
Distrib.
L
Pag. di
13 170
Fig. A. 1 - PRIMO Program, rod BD8, sensitivity analysis on FGR models, FGRMOD4, BI ........................... 147
Fig. A. 2 - PRIMO Program, rod BD8, sensitivity analysis on FGR models, FGRMOD4, PR. ......................... 147
Fig. A. 3 - PRIMO Program, rod BD8, sensitivity analysis on FGR models, FGRMOD6, BI. .......................... 148
Fig. A. 4 - PRIMO Program, rod BD8, sensitivity analysis on FGR models, FGRMOD6, PR. ......................... 148
Fig. A. 5 - PRIMO Program, rod BD8, sensitivity analysis on FGR models, FGRMOD9, BI. .......................... 149
Fig. A. 6 - PRIMO Program, rod BD8, sensitivity analysis on FGR models, FGRMOD9, PR. ......................... 149
Fig. A. 7 - PRIMO Program, rod BD8, sensitivity analysis on fuel conductivity, rod centerline
temperature in peak axial position and FGR, base irradiation. ..................................................... 150
Fig. A. 8 - PRIMO Program, rod BD8, sensitivity analysis on fuel conductivity, rod centerline
temperature in peak axial position and FGR, power ramp. ........................................................... 150
Fig. A. 9 - PRIMO Program, rod BD8, sensitivity analysis on fuel relocation models, FGR and fuel
temperature in peak axial position, base irradiation. ..................................................................... 151
Fig. A. 10 - PRIMO Program, rod BD8, sensitivity analysis on fuel relocation models, FGR and fuel
temperature in peak axial position, power ramp. ........................................................................... 151
Fig. A. 11 - PRIMO Program, rod BD8, sensitivity analysis on fuel swelling correlations, FGR and fuel
temperature in peak axial position, base irradiation. ..................................................................... 152
Fig. A. 12 - PRIMO Program, rod BD8, sensitivity analysis on fuel swelling correlations, FGR and fuel
temperature in peak axial position, power ramp. ........................................................................... 152
Fig. A. 13 - PRIMO Program, rod BD8, sensitivity analysis on densification models, FGR and fuel
temperature in peak axial position, base irradiation. ..................................................................... 153
Fig. A. 14 - PRIMO Program, rod BD8, sensitivity analysis on densification models, FGR and fuel
temperature in peak axial position, power ramp. ........................................................................... 153
Fig. A. 15 - PRIMO Program, rod BD8, sensitivity analysis on fuel density, FGR and fuel temperature in
peak axial position, base irradiation. ............................................................................................. 154
Fig. A. 16 - PRIMO Program, rod BD8, sensitivity analysis on fuel density, FGR and fuel temperature in
peak axial position, power ramp. .................................................................................................... 154
Fig. A. 17 - PRIMO Program, rod BD8, sensitivity analysis on fuel average grain size, FGR and fuel
temperature in peak axial position, base irradiation. ..................................................................... 155
Fig. A. 18 - PRIMO Program, rod BD8, sensitivity analysis on fuel average grain size, FGR and fuel
temperature in peak axial position, power ramp. ........................................................................... 155
Fig. A. 19 - PRIMO Program, rod BD8, sensitivity analysis on fuel gap initial size, FGR and fuel
temperature in peak axial position, base irradiation. ..................................................................... 156
Fig. A. 20 - PRIMO Program, rod BD8, sensitivity analysis on fuel gap initial size, FGR and fuel
temperature in peak axial position, power ramp. ........................................................................... 156
Fig. B. 1 - IFA-597,rod 10 and rod 11, sensitivity analysis on FGR models, FGRMOD4. ............................... 158
Fig. B. 2 - IFA-597,rod 10 and rod 11, sensitivity analysis on FGR models, FGRMOD6. ............................... 159
Fig. B. 3 - IFA-597, rod 10 and rod 11, sensitivity analysis on FGR models, FGRMOD9. .............................. 160
Fig. B. 4 - IFA-597, rod 10 and rod 11, sensitivity analysis on fuel conductivity correlations. ........................ 161
Fig. B. 5 - IFA-597, rod 10 and rod 11, sensitivity analysis fuel relocation models. ........................................ 162
Fig. B. 6 - IFA-597, rod 10 and rod 11, sensitivity analysis on fuel swelling correlations. .............................. 163
Fig. B. 7 - IFA-597, rod 10 and rod 11, sensitivity analysis on fuel densification models. ............................... 164

Ricerca Sistema Elettrico
Sigla di identificazione
ADPFISS – LP2 – 041
Rev.
0
Distrib.
L
Pag. di
14 170
Fig. B. 8 - IFA-597, rod 10 and rod 11, sensitivity analysis on Helium release models. ................................... 165
Fig. B. 9 - IFA-597, rod 10 and rod 11, sensitivity analysis fuel initial density. ............................................... 166
Fig. B. 10 - IFA-597, rod 10 and rod 11, sensitivity analysis on fuel grain size................................................ 167
Fig. B. 11 - IFA-597, rod 10 and rod 11, sensitivity analysis on initial gap width. ........................................... 168
Fig. B. 12 - IFA-597, rod 10 and rod 11, sensitivity analysis on plenum length. .............................................. 169
Ricerca Sistema Elettrico
Sigla di identificazione
ADPFISS – LP2 – 041
Rev.
0
Distrib.
L
Pag. di
15 170
List of tables
Tab. 1 – PRIMO Experiment validation domain of TU v1m1j12. ......................................................................... 20
Tab. 2 – IFA-597, validation domain of TU v1m1j12. .......................................................................................... 21
Tab. 3 – BR-3 Reactor, main characteristics. ....................................................................................................... 36
Tab. 4 – OSIRIS Reactor main characteristics. .................................................................................................... 37
Tab. 5 – PRIMO Program, rod BD8, fuel pellets characteristics. ........................................................................ 39
Tab. 6 – PRIMO Program, rod BD8, depleted uranium pellets characteristics. .................................................. 39
Tab. 7 – PRIMO Program, rod BD8, cladding tube characteristics. .................................................................... 40
Tab. 8 – PRIMO Program, rod BD8, fuel pin characteristics. ............................................................................. 40
Tab. 9 – PRIMO Program, rod BD8, experimental data obtained from PIE performed PTR. ............................. 46
Tab. 10 – PRIMO Program, rod BD8, FGR measurements.................................................................................. 46
Tab. 11 – Summary of the driver fuel main data. .................................................................................................. 48
Tab. 12 – IFA-597, rod 10 and rod 11 design data. .............................................................................................. 51
Tab. 13 – IFA-597, rod 10 and rod 11, PIE, results of gas puncturing. ............................................................... 56
Tab. 14 – Main parameters and processes that affect the simulation of FGR. ..................................................... 69
Tab. 15 – PRIMO Program & IFA-597, summary of models and correlations assumed in the reference
that may impact on the FGR simulation. .......................................................................................... 83
Tab. 16 – PRIMO Program, summary of reference analysis. ............................................................................... 89
Tab. 17 – PRIMO Program, rod BD8, sensitivity analysis on RTL and failure threshold, results and
relative errors. .................................................................................................................................. 89
Tab. 18 – PRIMO Program, rod BD8, list of sensitivity analysis. ........................................................................ 96
Tab. 19 – PRIMO Program, rod BD8, sensitivity analysis on FGR models ,results and relative errors. ............ 98
Tab. 20 – PRIMO Program, rod BD8, sensitivity analysis on fuel thermal conductivity, results and
relative errors. ................................................................................................................................ 101
Tab. 21 – PRIMO Program, rod BD8, sensitivity analysis on relocation models, results and relative
errors. ............................................................................................................................................. 102
Tab. 22 – PRIMO Program, rod BD8, sensitivity analysis on swelling model, results and relative errors. ...... 105
Tab. 23 – PRIMO Program, rod BD8, sensitivity analysis on densification models, results and relative
errors. ............................................................................................................................................. 107
Tab. 24 – PRIMO Program, rod BD8, sensitivity analysis on fuel initial density, results and relative
errors. ............................................................................................................................................. 108
Tab. 25 – PRIMO Program, rod BD8, sensitivity analysis on grain size, results and relative errors. ............... 109
Tab. 26 – PRIMO Program, rod BD8, sensitivity analysis on gap width results and relative errors................. 110
Tab. 27 – IFA-597, rod 10, summary of reference analysis. ............................................................................... 116
Tab. 28 – IFA-597, rod 11, summary of reference analysis. ............................................................................... 116
Tab. 29 – IFA-597 list of sensitivity analysis. ..................................................................................................... 122
Tab. 30 – IFA-597, rod 10, sensitivity analysis on FGR models ,results and relative errors. ............................ 124
Tab. 31 – IFA-597, rod 11, sensitivity analysis on FGR models ,results and relative errors. ............................ 125

Ricerca Sistema Elettrico
Sigla di identificazione
ADPFISS – LP2 – 041
Rev.
0
Distrib.
L
Pag. di
16 170
Tab. 32 – IFA-597, rod 10, sensitivity analysis on fuel conductivity correlations ,results and relative
errors. ............................................................................................................................................. 128
Tab. 33 – IFA-597, rod 11 sensitivity analysis on fuel conductivity correlations ,results and relative
errors. ............................................................................................................................................. 128
Tab. 34 – IFA-597, rod 10, sensitivity analysis on relocation models, results and relative errors. ................... 129
Tab. 35 – IFA-597, rod 1, sensitivity analysis on relocation models, results and relative errors. ..................... 129
Tab. 36 – IFA-597, rod 10, sensitivity analysis on swelling model, results and relative errors. ........................ 131
Tab. 37 – IFA-597, rod 11, sensitivity analysis on swelling model, results and relative errors. ........................ 131
Tab. 38 – IFA-597, rod 10, sensitivity analysis on densification model, results and relative errors. ................. 131
Tab. 39 – IFA-597, rod 11, sensitivity analysis on densification model, results and relative errors. ................. 132
Tab. 40 – IFA-597, rod 10, sensitivity analysis on Helium release model, results and relative errors. ............. 132
Tab. 41 – IFA-597, rod 11, sensitivity analysis on Helium release model, results and relative errors. ............. 132
Tab. 42 – IFA-597, rod 10, sensitivity analysis on initial porosity, results and relative errors. ........................ 133
Tab. 43 – IFA-597, rod 11, sensitivity analysis on initial porosity, results and relative errors. ........................ 133
Tab. 44 – IFA-597, rod 10, sensitivity analysis on average grain size, results and relative errors. ................... 134
Tab. 45 – IFA-597, rod 11, sensitivity analysis on average grain size, results and relative errors. ................... 134
Tab. 46 – IFA-597, rod 10, sensitivity analysis on gap width, results and relative errors. ................................ 135
Tab. 47 – IFA-597, rod 10, sensitivity analysis on gap width, results and relative errors. ................................ 135
Tab. 48 – IFA-597, rod 10, sensitivity analysis on free volume, results and relative errors. ............................. 135
Tab. 49 – IFA-597, rod 11, sensitivity analysis on free volume, results and relative errors. ............................. 135

Ricerca Sistema Elettrico
Sigla di identificazione
ADPFISS – LP2 – 041
Rev.
0
Distrib.
L
Pag. di
17 170
1 Introduction
1.1 Background
In the last decades two main trends have been identified in the nuclear technology. The first one deals
with the continuous increase of the discharge burn-up. In this framework, new cladding materials
capable to sustain higher burn-ups have been developed and new experiments have been executed to
better understand high burn-ups phenomena (i.e. the HBS formation, the in cladding hydrogen pick-up,
the delayed hydride cladding failure mechanism etc…), to check the new materials performance and to
check the existing safety criteria (that were defined at lower burn-ups and for old materials)[1][2]
.
The second deals with the introduction of commercial MOX fuel. Three temporal phases in the
management of plutonium arising from nuclear power generation (civil plutonium) are identified[3]
.
The first phase has seen a gradual introduction of the recycling of mixed oxide fuel up to an
industrial scale in light water reactors in several countries, is currently well established. MOX
usage in LWRs is a well understood and mature technology and MOX can be managed in a
very similar way to uranium fuel. The current inventory of separated civil plutonium is safely
stored and has still to be recycled. The necessary safeguards arrangements have kept pace with
these developments wherever plutonium is handled, fabricated, stored, transported and
irradiated.
The second phase (up to, say, 2030) is beginning at the time of writing. It is characterized by an
ongoing but irregular expansion of MOX recycling in which other countries will acquire MOX
technology and additional nuclear plants will be licensed for MOX fuel. It could then be
expected that the stockpiles of separated plutonium (both civil and weapons surplus) will begin
to diminish and move to significantly lower levels during this phase. As well as extending the
number of power plants loading MOX fuel, the technology now needs to be developed for
advanced reactors such as the GEN-IV Fast Reactor (i.e. LFR or SFR) or Accelerator Driven
Systems (i.e. MHYRRA). Additionally, more environmentally friendly reprocessing methods
with reduced emissions will be needed to prepare for the third and long term phase of
plutonium recycle and management.
In this preparation for the third phase of development, emphasis must be placed on both
achieving greater public acceptance for plutonium fuel technology as well as making the power
producing utilities more attractive economically. These same utilities will be the ultimate
source of the financing needed to establish the stable development of nuclear power based on
uranium and, over the longer term, plutonium fuels. A fuel that is more expensive than others
or which may limit reactor operation is unacceptable for the power producers. If the economic
and performance targets cannot be reached and negative public attitudes persist, there will be
no third phase of plutonium recycle. However, if such a development can be realized, the third
phase should see the progressive introduction of advanced thermal reactors as well as fast
reactors, alongside new technologies specifically designed for MOX fuel. The aim will be to
manage the production and use of plutonium effectively to avoid major stockpiling.
The fission process not only generates heat in the nuclear fuel pellets, it also produces a broad
spectrum of fission products, most of which are radioactive and should not be released to the
environment. In the defense in depth concept, the fuel matrix and the cladding constitute the first two
barriers against the release of radio nuclides from a nuclear power plant[1]
. In thermal reactors, it is
generally accepted that MOX fuel behaves similar to UOx fuel and should therefore wind stand the
same safety requirements. Compared to UOx, MOX fuel mainly differentiate by[4],[5]
: lower
conductivity, lower melting point, higher creep rate, higher FGR, lower gaseous swelling and
production / release of He coming from alpha decay of heavy MA[4][5]
. In general, the differences

Ricerca Sistema Elettrico
Sigla di identificazione
ADPFISS – LP2 – 041
Rev.
0
Distrib.
L
Pag. di
18 170
depend on the fabrication process and on the PuO2 content. Since the experimental databases on MOX
fuel are not so extended as for UOx, there is a growing interest in understanding the MOX fuel
behavior both for the application in commercial LWR fuels with high burn-ups performance and next
generation FRs. The exact description of all the physical phenomena occurring in fuel rods during
irradiation is a complex task since it involves a wide range of disciplines ranging from chemistry,
nuclear and solid-state physics, metallurgy, thermal-hydraulics, ceramics and applied mechanics. In
particular, the characterization of MOX fuel for FR application is of great importance to develop
advanced fuel design since FR MOX fuel has unique features: it contains larger quantities of PuO2
than LWR, it is operated at higher temperature and in harder neutron spectrum. Developing computer
codes that allow the description of the general MOX fuel behavior is mandatory to support the
development of safer and more effective fuels.
1.2 Objective of the activity
The Fission Gas Release (FGR) phenomenon is of primary interest since it is considered as one
possible mechanism that limits the discharge burn-up of nuclear fuel rods. Gaseous fission products, in
fact, either remain in the pellets and contribute to the swelling, or are released from the pellets to the
pin free volume. The fuel swelling promotes the pellet-cladding interaction while the release of fission
gases leads to two other undesirable effects: the increase of fuel rod’s internal pressure and the
degradation of the gap conductivity. In addition, the use of MOX fuel implies the release of a non-
negligible amount of He (that can be neglected in UO2 fuel) coming from the alpha decay of Pu238
,
Cm242
, Cm244
, and from ternary fissions. Deeper understanding of the fission gas release phenomenon,
along with better modeling capabilities is the only way to move to best estimate predictions.
The aim of this report is the assessment of TRANSURANUS[6],[7],[8]
code version 2012 in simulating
MOX fuel behavior with particular reference to the FGR phenomenon. This type of fuel has been
selected as fuel for both GEN-IV systems as ALFRED or ASTRID and advanced thermal reactors as
EPR. Since fuel pin mechanics codes are usually based on empirical correlations obtained from
experiments, their applicability to new designs should be demonstrated by verification and validation
processes. This complex task requires the large use of experimental databases.
Due to the un-availability of public databases on FR fuel, the first un-avoidable step, is verification
and validation of fuel pin mechanic codes against thermal reactor public databases. The International
Fuel Pin performance Experimental database (IFPE)[9]
aims to provide in the public domain, a
comprehensive and well-qualified database on Zr clad UO2 – MOX fuel for model development and
code validation. The data encompasses both normal and off-normal operation and include prototypic
commercial irradiations as well as experiments performed in Material Testing Reactors. This work is
carried out in close co-operation and co-ordination between the NEA, the IAEA and the IFE/OECD
Halden Reactor Project. The database is restricted to thermal reactor fuel performance, principally with
standard product Zircaloy clad UO2 fuel, although the addition of advanced products with fuel and
clad variants is not ruled out. Emphasis has been placed on including well-qualified data that illustrate
specific aspects of fuel performance. Of particular interest to fuel modellers are data on: fuel
temperatures, fission gas release (FGR), fuel swelling, clad deformation (e.g. creep-down, ridging) and
mechanical interactions. Data on these issues are of great value if measured in-pile by dedicated
instrumentation and, in this respect, the IFPE Database is fortunate in having access to several diverse
experiments. In addition to direct in-pile measurement, every effort is made to include PIE information
on clad diameters, oxide thickness, hydrogen content, fuel grain size, porosity, Electron Probe Micro
Analysis (EPMA) and X-ray Fluorescence (XRF) measurements on caesium, xenon, other fission
product and actinides.

Ricerca Sistema Elettrico
Sigla di identificazione
ADPFISS – LP2 – 041
Rev.
0
Distrib.
L
Pag. di
19 170
Two databases on MOX fuel included in the IFPE and released for benchmarking purpose have been
modeled by means of TRANSURANUS code: PRIMO[10]
experiment and IFA-597[11],[12]
.
1.3 Validation domains
TRANSURANUS is a computer program for the thermal and mechanical analysis of fuel rods in
nuclear reactors[6][7][8]
developed at ITU. It consists of a clearly defined mechanical–mathematical
framework into which physical models can easily be incorporated. The mechanical–mathematical
concept consists of a superposition of a one-dimensional radial and axial description (the so called
quasi two-dimensional or 1½-D model). The code was specifically designed for the analysis of a whole
rod. Besides its flexibility for fuel rod design, the TRANSURANUS code can deal with a wide range
of different situations, as given in experiments, under normal, off-normal and accident conditions. The
time scale of the problems to be treated may range from milliseconds to years. The code has a
comprehensive material data bank for oxide, mixed oxide, carbide and nitride fuels, Zircaloy and steel
claddings and several different coolants. It can be employed in two different versions: as a
deterministic and as a statistical code.
The validation of TRANSURANUS code is performed against the PRIMO Experiment (1 rod) and
IFA-597 (2 rods).
The PWR Reference Irradiation of MOX fuels (PRIMO) program sought to investigate the MOX fuel
behavior under steady-state and transient conditions[10]
. It started in 1986. The aims were to investigate
the capability of MOX to sustain normal operation conditions typical of commercial PWR, to study
thermal and irradiation induced phenomena occurring in fuel and to obtain thermo-mechanical data
under power ramp conditions. The PRIMO program included sixteen MOX fuel rods manufactured
through different fabrication processes and ramp-tested at different burn-up levels between 20 and 60
MWd/kgHM. The irradiation history and the experimental data of one fuel rod named BD8 from the
PRIMO program was included in the International Fuel Performance Experimental Database and
released for benchmarking purpose. It was base-irradiated in the BR2 Pressurized Water cooled
Reactor (PWR) at an average linear power of 18.5 kW/m up to a burn-up of about 30 MWd/kgHM.
The fuel rod then underwent a ramp test in the Osiris PWR up to a peak linear power of 39.5 kW/m.
Post irradiation examinations were carried out to investigate rod behavior such as fission gas release
(FGR), clad creep, clad and fuel elongations.
The Instrumented Fuel Assembly 597 (IFA-597) experiment was carried out in the Halden Boiling
heavy Water Reactor (HBWR)[11],[12]
. The experiment aimed to study the thermal and FGR behavior of
MOX fuel, and to explore differences in performance between solid and hollow pellets. Two MOX
rods (labeled 10 and 11) were instrumented with a fuel center thermocouple and a pressure bellow
transducer and irradiated in the Halden Reactor. The experiment consisted of four power cycles up to
33 MWd/kgMOX. The linear power was in the range 15-35 kW/m. Details of the fabrication data as
well as irradiation data up to a burn-up of 26 MWd/kgMOX (reached at the end of the third cycle)
were released with the aim of code benchmarking. The in-pile data on fuel temperature, rod inner
pressure and results of the gas puncturing and mass spectrometry of the extracted gas were also
released.
The validation domains are reported in Tab. 1 and Tab. 2. They include:
the version of the code used for the independent assessment;
the main objective of the independent assessment;
the range of parameters for which the assessment is performed;
the parameters, part of the experimental database, which are suitable for the comparisons;

Ricerca Sistema Elettrico
Sigla di identificazione
ADPFISS – LP2 – 041
Rev.
0
Distrib.
L
Pag. di
20 170
the parameters adopted for the comparison between the experimental data and the code results.
VALIDATION DOMAIN
Main phenomena Experiment No.
rods
Thermal
modules
Mechanical
modules
FGR
modules
Burn-up
modules Notes
PCI/SCC
FGR
PRIMO MOX
ROD BD8 1 X X X X Version 2012
Range (parameters) of validity Parameters for validation
Parameter Unit Descript. # Rod BD8 TU
simulation
Pellet material -- MOX Burn-up ● X
Cladding material -- Zr-4 Cladding creep down in BI
1
(avg. and max) ● X
EnrichmentU235
%HM 5.246 Cladding expansion AR
2
(avg. and max) ● X
Enrichment Pu %HM 7.630 Grain size AR2 (pellet
centre/periphery) ○ X
Pellet outer diameter mm 8.041
Diametral gap size µm 200 FGR BI1 and AR
2 ● X
Clad outer diameter mm 9.5 Elongation AR2 ● X
Active length mm 1004.7 Ridges height (avg. and
max) in BI1
● --$
Initial avg. grain size§ µm 5 Ridges height (avg. and
max) AR2
● --$
He filling pressure MPa 2.0 Clad ovality after BI1 ● --
$
Average burn-up MWd/kgHM 30 Failure / Not Failure, AR
2 ● X
Operative pressure MPa 15.0
Average LHR3 (BI
1) kW/m 18.5
Average NFF4 (BI, 4D1-4D2
cycles) n/cm
2s 4*10
12
Ramp rate kW/mh 462 ● suitable for code assessment
○ limited suitability
─ not suitable
RTL5 kW/m 39.5
LHR3 change kW/m 20.6
Holding time at RTL5 hrs 20
1 BI: Base Irradiation
2 AR: After Ramp
3 LHR: Linear Heat Rate 4 NFF: Neutron Fast Flux (>1 MeV)
5 RTL: Ramp Terminal Level $ Not predictable by 1½D code (outside TU code capabilities)
§ Mean intercept length
Tab. 1 – PRIMO Experiment validation domain of TU v1m1j12.

Ricerca Sistema Elettrico
Sigla di identificazione
ADPFISS – LP2 – 041
Rev.
0
Distrib.
L
Pag. di
21 170
VALIDATION DOMAIN
Main phenomena Experiment No. rods Thermal
modules
Mechanical
modules
FGR
modules
Burn-up
modules Notes
FGR IFA-597 2 X X X X
Range (parameters) of validity Parameters for validation
Parameter Unit Descript. # rod 10,
rod 11.
TU
simulation
Pellet material -- MOX Burn-up ● X
Cladding material -- Zr-4
EnrichmentU235
%HM 0.22
Fuel temperature ● X Enrichment Pu %HM 6.07
Pellet outer diameter mm 8.04
Diametral gap size µm 180 Rod internal pressure ● X
Clad outer diameter mm 9.5
Active length mm 220 – 224
FGR ● X Initial avg. grain size3 µm 5.45
He filling pressure MPa 0.5
Average burn-up MWd/kgMOX 27 ● suitable for code assessment
○ limited suitability
─ not suitable
Operative pressure MPa 3.36
Average LHR1 kW/m 16
Average NFF2 n/cm
2s 1.9*10
12
1 LHR: Linear Heat Rate
2 NFF: Neutron Fast Flux (>1 MeV) 3 Mean intercept length
Tab. 2 – IFA-597, validation domain of TU v1m1j12.

Ricerca Sistema Elettrico
Sigla di identificazione
ADPFISS – LP2 – 041
Rev.
0
Distrib.
L
Pag. di
22 170

Ricerca Sistema Elettrico
Sigla di identificazione
ADPFISS – LP2 – 041
Rev.
0
Distrib.
L
Pag. di
23 170
2 The MOX fuel
In every nuclear reactor there is both fission of isotopes such as 235
U, and the formation of new,
heavier isotopes due to neutron capture, primarily by 238
U. Most of the fuel mass in a thermal reactor is 238
U. Part of this isotope transmutes to 239
Pu (see reactions below) and by successive neutron capture
to 240
Pu, 241
Pu and 242
Pu as well as other transuranic isotopes. The plutonium (and uranium) created in
the fuel can be recovered through reprocessing. The plutonium could then be used to produce mixed
oxide (MOX) nuclear fuel. Today there is a significant amount of separated uranium and plutonium
which may be recycled, including from ex-military sources.
Eq. 1
Plutonium reprocessed in LWR fuel contains five principal isotopes, namely, 238
Pu, 239
Pu, 240
Pu, 241
Pu
and 242
Pu. These isotopes have roughly the same probability of fission in FRs, however, in LWRs only 239
Pu and 241
Pu experience fission and hence contribute to energy production[5]
.
2.1 Fabrication processes
2.1.1 Fabrication of oxide powder
Numerous methods have been used, and others are being developed, to obtain plutonium dioxide in a
suitable form for MOX fuel fabrication. The methods deriving plutonium dioxide from the nitrate
widely used followed by the processes to convert plutonium metal to oxide powder. Precipitation of
plutonium oxalate and thermal de-nitration methods are briefly recalled in the following. Co-
precipitation methods, gel precipitation methods and methods of conversion of plutonium metal to
oxide are not discussed in this section, we recommend Ref. [3] for a more detailed description of these
methods.
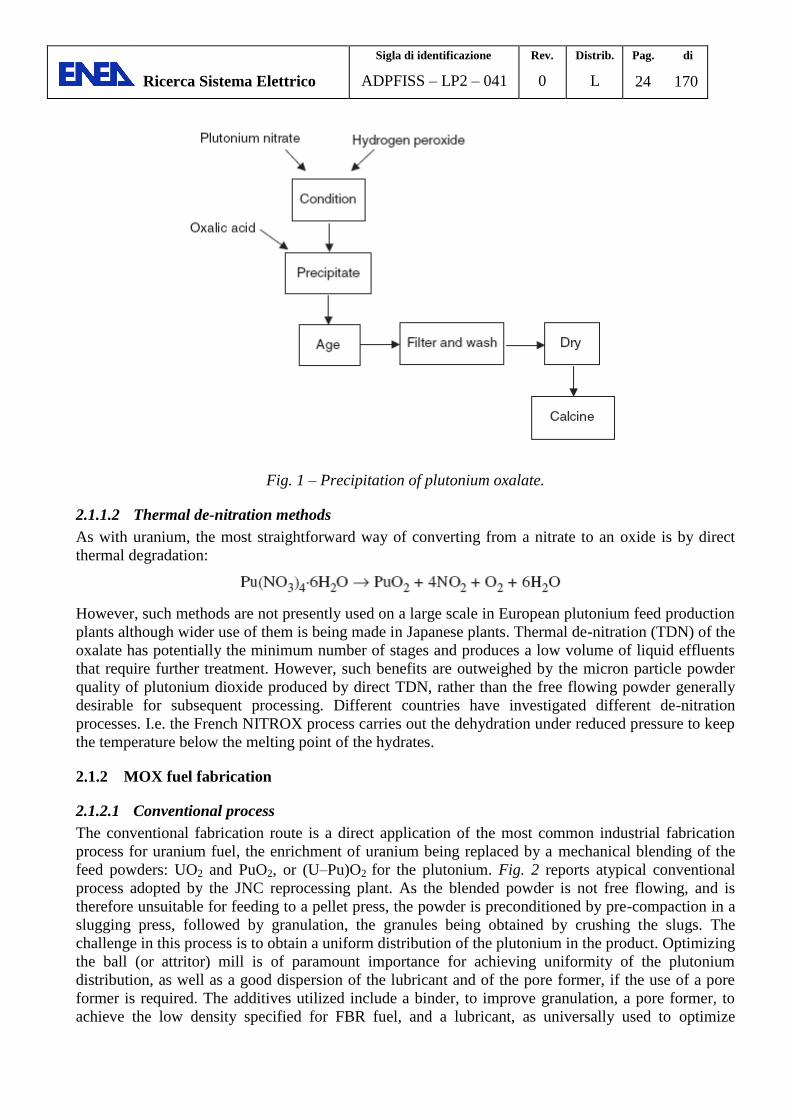
2.1.1.1 Precipitation of plutonium oxalate
This precipitation method is the most widely used commercial method of converting plutonium nitrate
solution to dioxide. The plutonium stream is concentrated in evaporators and conditioned to Pu (IV)
with hydrogen peroxide before precipitation, Fig. 1. An excess of oxalic acid is used to reduce the
solubility of the product. The oxalate is decomposed to oxide, which is suitable for ceramic fuel
fabrication. The particle size and structure of the oxide are governed by the initial precipitation and, in
turn, by the temperature and by concentrations of plutonium, nitric acid and oxalic acid.
Ricerca Sistema Elettrico
Sigla di identificazione
ADPFISS – LP2 – 041
Rev.
0
Distrib.
L
Pag. di
24 170
Fig. 1 – Precipitation of plutonium oxalate.
2.1.1.2 Thermal de-nitration methods
As with uranium, the most straightforward way of converting from a nitrate to an oxide is by direct
thermal degradation:
However, such methods are not presently used on a large scale in European plutonium feed production
plants although wider use of them is being made in Japanese plants. Thermal de-nitration (TDN) of the
oxalate has potentially the minimum number of stages and produces a low volume of liquid effluents
that require further treatment. However, such benefits are outweighed by the micron particle powder
quality of plutonium dioxide produced by direct TDN, rather than the free flowing powder generally
desirable for subsequent processing. Different countries have investigated different de-nitration
processes. I.e. the French NITROX process carries out the dehydration under reduced pressure to keep
the temperature below the melting point of the hydrates.
2.1.2 MOX fuel fabrication
2.1.2.1 Conventional process
The conventional fabrication route is a direct application of the most common industrial fabrication
process for uranium fuel, the enrichment of uranium being replaced by a mechanical blending of the
feed powders: UO2 and PuO2, or (U–Pu)O2 for the plutonium. Fig. 2 reports atypical conventional
process adopted by the JNC reprocessing plant. As the blended powder is not free flowing, and is
therefore unsuitable for feeding to a pellet press, the powder is preconditioned by pre-compaction in a
slugging press, followed by granulation, the granules being obtained by crushing the slugs. The
challenge in this process is to obtain a uniform distribution of the plutonium in the product. Optimizing
the ball (or attritor) mill is of paramount importance for achieving uniformity of the plutonium
distribution, as well as a good dispersion of the lubricant and of the pore former, if the use of a pore
former is required. The additives utilized include a binder, to improve granulation, a pore former, to
achieve the low density specified for FBR fuel, and a lubricant, as universally used to optimize

Ricerca Sistema Elettrico
Sigla di identificazione
ADPFISS – LP2 – 041
Rev.
0
Distrib.
L
Pag. di
25 170
pelletizing. In such processes, de-waxing of the green pellets is required prior to sintering. Excellent
quality fuel can be fabricated by such a process.
Fig. 2 – Conventional MOX fuel fabrication process adopted applied by JNC in PFPF.

Ricerca Sistema Elettrico
Sigla di identificazione
ADPFISS – LP2 – 041
Rev.
0
Distrib.
L
Pag. di
26 170
2.1.2.2 COCA process
A simplification of the conventional feed powder processing route (which is to MOX fuel what the
enrichment operation is to uranium fuel) was developed in the1970s by CEA and applied in the
Cadarache fabrication plant under the name COCA, an acronym for Cobroyage (co-milling)
Cadarache. It is based on the use of an optimized ball mill acting as a blender and of a forced extrusion
of the lubricated micronized powder through a sieve, resulting in free flowing granules adequate for
feeding the pellet press, Fig. 3. This process, originally developed for FBR fuel, has been adapted for
LWR fuel and used from 1989 to 1994 for manufacturing MOX fuel for EDF’s PWRs.
2.1.2.3 MIMAS and OCOM processes
The MIMAS process, invented by Belgonucleaire in the early 1980s, is an adaptation of the reference
fabrication process developed earlier and applied commercially in the 1970s at the Dessel plant. The
reference process consisted of a single blending of PuO2 powder with free flowing UO2 powder,
resulting in a blend of adequate flow-ability to feed the pellet press. However, when the re-processors
decided that even un-irradiated MOX fuel had to be almost completely soluble in a pure nitric acid
solution, the reference fuel was deemed to be no longer acceptable. To meet this new specification, the
earlier single blending step was replaced by a two step blending approach: in the first step, the pure
PuO2 feed and some UO2 are co-micronized resulting in a master mix of UO2–(typically) 30% PuO2,
which is the fundamental principle of the MIMAS process (Fig. 3); in the second step, the master mix
is blended down with free flowing AUC (Ammonium Uranyl Carbonate) or ADU (Ammonium Di-
Uranate) UO2 to the specified plutonium content of the MOX fuel. The very close contact between the
micronized UO2 and PuO2 particles provides for adequate inter-diffusion during sintering and
therefore the required solubility. The final product is a fuel pellet in which Pu-rich particles are
distributed in a UO2 matrix which is similar to ex-AUC UO2 microstructure regarding grain size and
pore size distribution (average grain size is 7 to 10 μm and average pore diameter 2 to 4 μm). Thus the
characteristic size in the MOX fuel can be the plutonium agglomerate (particle) size. These
agglomerates are nearly spherical and contain most of the plutonium isotopes. There are very few
published data on the details of these agglomerates, which may influence the retention and/or release
of fission product gases during irradiation, and also other properties of the fuel, which will be
discussed in this report. Lippens[16]
and co-workers in a paper on MIMAS fuel note that plutonium is
spatially distributed homogeneously on the pellet scale (millimetres), but is heterogeneous when is
observed on the micron scale. According to Lippens et al. typical Pu particle size, determined by α-
autoradiography, ranges from less than 1 μm to 100 μm with a frequency distribution centred at about
15 μm and an average size around 30 μm; and a much reduced population above 50 μm.
In parallel, Alkem (subsequently part of Siemens) had developed and applied commercially the sibling
Optimized Co-milling (OCOM) process, with a similar success in fabric ability and improved fuel
behavior. The main differences between MIMAS and OCOM were in the ball milling and powder
conditioning steps. Integral fissile Pu content is in the range of 2.0 to 3.5 wt% with a density of 10.32
to 10.45 g/cm3. However, observations using Electron Probe Micro Analyser (EPMA) indicate areas
enriched in Pu of dimensions 50 to 100 μm equivalent diameters.
2.1.2.4 SBR process
The SBR (Short Binderless Route), developed and produced by British Nuclear Fuels plc (BNFL), is a
way for blending and conditioning of the MOX powder before pressing and sintering, Fig. 3.
Homogenization is attained by means of a high energy attritor mill, which blends the oxide powders
and a spherodizer in order to condition the powder to granules prior to pressing and sintering. At the
milling stage, lubricant and Conpore pore former are added in order to control the pellet density and
obtain similar characteristics as those of the UO2 pellets produced by BNFL from IDR (Integrated Dry
Route) UO2 powder. The MOX produced by SBR has a mean grain size of about 7.4 μm with a

Ricerca Sistema Elettrico
Sigla di identificazione
ADPFISS – LP2 – 041
Rev.
0
Distrib.
L
Pag. di
27 170
standard deviation of 0.6 μm, and for pores with a diameter ≥ 5 μm the median pore size has never
been observed to exceed 15.4 μm during the production. The homogeneity of the fuel with respect to
plutonium agglomerates is excellent when measured by α-radiography, which is a coarse scale.
Fig. 3 –MOX fuel fabrication processes.
2.2 Current MOX use in NPP
MOX fuel was first used in a thermal reactor in 1963, but did not come into commercial use until the
1980s. So far, about 2000 t of MOX fuel has been fabricated and loaded into power reactors. In 2006
about 180 t of MOX fuel was loaded into over 30 reactors (mostly PWR) in Europe[3]
. Currently, about
40 reactors in Europe (in Belgium, Switzerland, Germany and France) are licensed to use MOX, and
over 30 are doing so. France aims to have all its 900 MWe series of reactors running with at least one
third of the core composed by MOX. Some advanced reactor will accept up to 50% MOX assemblies.
Other advanced PWR such as the EPR or AP1000 are able to accept 100% fuel loadings of MOX if
required. In Japan, about ten reactors are licensed to use it and several do so. These reactors are
generally loaded with a mixed core where MOX fuel content is about one third.
An advantage of MOX is that the fissile concentration of the fuel can be increased easily by adding a
bit more plutonium, whereas enriching uranium to higher levels of U-235
is relatively expensive. As
reactor operators seek to burn fuel harder and longer, increasing burn-up from around 30 MWd/kg a
few years ago to over 50 MWd/kg now, makes the use of MOX more attractive[13]
. MOX fuel is
designed to satisfy the same operational and safety criteria as uranium fuel under equivalent
conditions. This is reflected in the parallel development of design codes to accommodate the specific
characteristics of MOX fuel. MOX fuel assembly design has been universally based on uranium fuel
design with only minor modifications relating to the neutronic and thermo-mechanical properties of
the MOX fuel itself[14]
.

Ricerca Sistema Elettrico
Sigla di identificazione
ADPFISS – LP2 – 041
Rev.
0
Distrib.
L
Pag. di
28 170
The main concerns for MOX fuel rod behavior are as follows[3]
:
fuel center line temperature
fission gas release
in-pile densification and swelling
helium gas accumulation and release
pellet–cladding mechanical interaction (PCMI) under power ramping.
However, since the plutonium concentration of MOX fuel for LWRs is low and these differences from
uranium fuel are relatively small, it is recognized that MOX fuel rod behavior is very similar to that of
standard uranium fuel. No additional problems are apparent with the possible exception of higher gas
release and hence an increase of rod internal pressure at high burn-up.
Because of the neutronic properties of the plutonium isotopes in MOX fuel, the reactivity decreases
less rapidly with burn-up than in uranium fuel and thus MOX fuel dissipates more power later in its
life, releasing more fission gas. In addition, the thermal conductivity of MOX is known to be lower
than that of uranium by a few percent, which may give rise to higher fuel temperatures and thus higher
fission gas release. Design changes, such as lowering the initial helium pressure and/or increasing the
plenum volume in the rod, are sometimes applied to accommodate this higher gas release. With these
exception, the fuel rod and assembly design are essentially unchanged from that of an equivalent
uranium assembly. Generally, if a modification is applied to uranium fuel, then the same change will
be incorporated in MOX fuel after, due evaluation of the experience with uranium fuel.
National and international programs to evaluate the performance of MOX fuel compared with that of
uranium fuel have been carried out over a period of 35 years. These programs, which are still ongoing,
are providing the data necessary to compare MOX fuel behavior with that of uranium, to develop
specific MOX fuel performance models and to verify design codes. A wide range of variables has been
investigated in these experiments, for example fabrication processes, cladding materials, fuel rod
geometries and operating conditions. Post-irradiation examination (PIE) of commercial MOX fuel has
also added a lot of data on performance and reliability. It has been concluded from both experimental
and commercial irradiations that the reliability of MOX fuel remains as good as that of uranium fuel.
2.3 UO2 – MOX fuels main differences
Because of the extremely large uranium fuel performance database and the corresponding well
validated codes, it is important to define differences in structure and performance of MOX and
uranium fuels. In this section, we briefly review the thermo-physical properties of MOX fuel and
compare them with those of UO2 fuel.
2.3.1 Melting temperature
Solidus and liquidus temperatures of uranium/plutonium dioxide data and correlations have been
recently reviewed by Carbajo et al[4]
. The Introduction of PuO2 in UO2 reduces the melting
temperature of fuel being the melting temperature reduction an increasing function of the PuO2
content. The burn-up and/or the deviation from stoichiometry lowers the melting temperature too. In
addition, since the stoichiometry of the fuel changes/redistributes depending on the burn-up these
contributions are interrelated. An empirical correlation, based on curve fitting of the data introduced
by Adamson et al.[15]
, is recommended for applications. These curves are reported in Fig. 4 for
standard LWR fuels between 0 and 70 MWd/kgHM. The MOX melting temperature is about 50°C
lower respect to the UO2.

Ricerca Sistema Elettrico
Sigla di identificazione
ADPFISS – LP2 – 041
Rev.
0
Distrib.
L
Pag. di
29 170
Fig. 4 – Melting temperature of UO2 and MOX fuels as a function of burn-up according to Adamson at
al.
2.3.2 Thermal Conductivity
The thermal conductivity of oxide fuels is a function of temperature, composition, density, oxygen
content (oxygen-to-metal ratio, O/M) or the deviation from stoichiometry, and the fuel burn-up. The
thermal conductivities of both UO2 and MOX are reduced with temperature up to around 2000 K and
then rise with temperature. The addition of PuO2 into the UO2 matrix reduces the thermal conductivity
because of fuel heterogeneity. Moreover, the deviation of O/M from stoichiometry reduces the thermal
conductivity. The fuel burn-up reduces the fuel conductivity due to the creation of FP with lower
conductivity and due to the creation of new porosity. Furthermore, at high burn-ups (locally exceeding
75 MWd/kgU), the formation of the High Burn-up Structure at pellet rim locally degrades the
conductivity.
There is a large amount of data and correlations for the thermal conductivity of fuel. The data are not
so extensive for MOX fuel as they are for UO2 fuel. Since 1980, theoretical research and new
measurements have led to improvements in equations for thermal conductivity of un-irradiated UO2.
Recent reviews of the thermal conductivity of MOX fuel[16],[17]
conclude that the presence of small
quantities of PuO2 in UO2 slightly decreases the thermal conductivity. For example, KAERI[18]
describes this degradation as a two phase material with different thermal conductivities in the matrix
and in the plutonium-rich agglomerates (the reduction of thermal conductivity ranges from 7 to 10%).
BNFL[19]
applies a uniform degradation of 8%, while Framatome and Belgie-Nucleaire apply a linear
degradation with the plutonium content[20],[21]
. In-pile measurements of the centerline temperature of
MOX fuel clearly indicate the slight degradation of thermal conductivity of fresh fuel[22],[23]
.
Measurement of the fuel center temperature of MOX irradiated to 50 MW·d/(kg HM) showed that the
thermal conductivity degradation with burn-up in MOX is the approximately same as that in uranium
fuel[20]
, Fig. 5 and Fig. 6.

Ricerca Sistema Elettrico
Sigla di identificazione
ADPFISS – LP2 – 041
Rev.
0
Distrib.
L
Pag. di
30 170
Fig. 5 – Thermal conductivity as a function of temperature at different burn-ups for UO2 and MOX
fuel according to the correlation of Lanning at al.
Fig. 6 – Thermal conductivity as a function of burn-up at different temperatures for UO2 and MOX
fuel according to the correlation of Lanning at al.
2.3.3 Radial power and burn-up profile
The neutronic properties of MOX fuel are responsible for a decrease in reactivity with burn-up that is
markedly less pronounced than that in uranium fuel. This leads to higher power densities at higher
burn-ups in comparison with uranium assemblies. Moreover, the presence of plutonium in the pellet
increases the thermal flux depression towards the centre, due to the large absorption of thermal

Ricerca Sistema Elettrico
Sigla di identificazione
ADPFISS – LP2 – 041
Rev.
0
Distrib.
L
Pag. di
31 170
neutrons by the plutonium isotopes. At the beginning of the MOX fuel life, the radial power profile is
therefore more depressed than that in uranium fuel, whereas at end of life the higher residual
plutonium content at the fuel center leads to higher local powers[20]
.
2.3.4 Densification
Oxide ceramic fuels like UO2 and MOX are subjected to densification during the early stages of
reactor irradiation. This phenomenon causes disappearance of submicron pores that led to a general
fuel column lengthening, gap opening and pellet density increase. At a given burn-up, this process end.
Furthermore, swelling and relocation oppose to its effects. Modeling fuel pellet relocation, swelling
and densification is essential for the prediction of the thermal-mechanical behavior of fuel rod during
irradiation.
The maximum fuel densification is reached at low burn-up (below 10 MWd/kg) and causes high fuel
temperatures due to the gap thickness increase. The densification is therefore an important process to
take in account for fuel safety evaluation. It is known that the irradiation induced densification of UO2
sintered fuel pellet is dependent on a combination of grain size, mean pore size and pore size
distribution[24][25]
. In particular, investigation on UO2 fuel showed that the stable fuel types (with low
densifications) were characterized by grain sizes greater than 10 μm and median volume pores larger
than 1 μm. The same general behavior was observed in MOX fuel, i.e., fuels with grain sizes greater
than 10 μm and median pores larger than 6 μm were highly stable[24][25]
. Moreover, in MOX fuel,
because of the presence of Pu agglomerates one expects that Pu-rich zones give rise to high local
fission rates and temperatures that affect fuel densification. In spite of the expected differences
between UO2 and MOX fuel, the comprehensive study made by Freshley et al.[24][25]
on a variety of
MOX fuels indicated that:
The in-reactor densification of MOX fuel, as in UO2, is correlated to the density changes that
occur under ex-reactor isothermal re-sintering tests, for a given fabrication process.
Generally, the densification behavior of MOX fuel is comparable with that of UO2 fuel, i.e., the
Pu-rich agglomerates have no apparent effect on the densification.
The effects of fission rate and temperature on densification of MOX fuel are similar to those
observed on UO2 fuel.
The majority of models used to describe in-reactor densification in fuel performance codes are
empirically based, correlating the change in density ρD to fuel burn-up by a simple relation, for
example:
ρD = pD (1 - exp(-bu / buD)) Eq. 2
where pD is the maximum densification (or unstable porosity) and bu is the burn-up and buD is a
densification-related burn-up constant (burn-up at which densification end). We observe that at lower
temperatures and lower fission rates, the densification is considerably smaller for both UO2 and MOX.
These effects are taken in account changing the values of the constants in the equations. The maximum
porosity reduction is related to the grain size as shown in the following equation based on
experimental data of UO2 and MOX fuels[26],[27]
:
pD =p0 (2.23 / d) Eq. 3
where p0 is the initial porosity and d is the average fuel grain size. However, Fig. 7 shows that the
deviations from this general behavior can be rather large especially in small grains fuels.

Ricerca Sistema Elettrico
Sigla di identificazione
ADPFISS – LP2 – 041
Rev.
0
Distrib.
L
Pag. di
32 170
Fig. 7 – Sinter-able porosity correlation.
2.3.5 Swelling
The swelling of fuel has two components: solid fission product swelling and gaseous swelling. The
former is commonly taken to be an increasing linear function of burn-up, i.e,
ρs = c (bu) Eq. 4
where ρs is the change in fuel density due to solid swelling and c is a parameter in the range 0.6 to 1.0
% / 10MWd/kgHM[5]
. These considerations apply both to UO2 and MOX.
The gaseous swelling is more complex depending on temperature and fission product gas inventory in
fuel pellet. The gaseous swelling kinetics may be different in MOX fuel than in UO2 because of the
difference in fission gas release of the two fuels. A more precise kinetic model for densification and
swelling should account for both fuel macrostructure (median pore size, grain size, and Pu
agglomerate size) and external fields (temperature and local fission rate).
Ricerca Sistema Elettrico
Sigla di identificazione
ADPFISS – LP2 – 041
Rev.
0
Distrib.
L
Pag. di
33 170
2.3.6 Fission gas release
Several physical processes contribute to FGR in UO2 as well as in MOX fuels. They are usually
separated into a-thermal and thermal release mechanisms. A-thermal release takes place by recoil and
knockout of fission gas atoms by energetic fission fragments. Since these mechanisms generally result
in release of less than 1%, a-thermal release alone has to date not been considered a potential problem
for excessive fuel rod pressure build-up. However, there is concern that the restructuring of UO2 at
high burn-up, the so called rim zone formation (HBS), could enhance a-thermal FGR in high burn-up
fuel. FGR process in MOX fuel is to a certain extent similar to that of UO2. However, there are certain
particular structural differences between the two kinds of fuel, which makes MOX fuel release
different in certain conditions; notwithstanding the fact that post irradiation examinations of fuel rods
irradiated in LWR indicate that gas release from MOX fuel is higher than from UO2 fuel under similar
operating conditions (Fig. 8).
The complexity of MOX fuel microstructure, both before and during irradiation, and the higher
centerline temperature of MOX fuel in comparison with uranium fuel makes it difficult to get a simple
view of FGR from these fuels for the whole range of heat rates, burn-ups and fabrication technologies.
In experimental programs carried out in the Halden reactor, in-pile pressure measurements performed
at different burn-ups showed that the empirical threshold for significant fission gas release (>1%)
derived by Vitanza[7]
for uranium fuel also applies to MOX fuel[28],[29]
. However, the fission gas
release of MOX fuels with can be expected to differ from that of uranium fuel because of the
concentration of burn-up and fission products in the plutonium rich agglomerates. In fact, due to the
limited range of fission fragments, there could be large regions of the fuel which are effectively un-
irradiated. Fission gas release would then depend on the diffusion of gas through un-irradiated regions
in which inter-linked micro-structures were absent. Experimental results[30]
revealed examples of FGR
continuing during low power/temperature holds (seepage effect). It suggests that the inter-linkage of
MOX fuel occurs with the same temperature-burn-up characteristics as UO2 fuel, suggesting that the
fission gas diffusion coefficients are similar. However, there are possible indications that the post-
inter-linkage release proceeds more rapidly[28],[31]
. These phenomena, however, require further
clarifications.
However, it should be noticed that the difference in fission gas release between MOX fuel and
uranium fuel decreases when the homogeneity of the plutonium distribution is improved. This has also
been confirmed by the low fission gas release from irradiated MOX fuels with good homogeneity of
the plutonium distribution[3]
. The use of existing uranium fuel fission gas release models for MOX fuel
applications has been reported to give satisfactory results for fission gas release and rod pressure
evaluations[20]
.

Ricerca Sistema Elettrico
Sigla di identificazione
ADPFISS – LP2 – 041
Rev.
0
Distrib.
L
Pag. di
34 170
Fig. 8 – Fission gas release fraction as a function of burn-up for UO2 and MOX fuel rods measured in
PWRs (Blanpain et al., 2000 and IAEA, 2003).
2.3.7 Helium generation and release
Helium is generated in fuel matrices by alpha decay of transuranic nuclides and ternary fission, the
former being the major source. Therefore, helium accumulation in the matrices, especially in MOX
fuels (about four times that in uranium fuels), increases exponentially with burn-up. Studies of helium
behavior showed that the helium diffusion coefficient in UO2 is about three orders of magnitude larger
than that of fission gases and also that helium is highly soluble in UO2[3]
. Helium is not released from
the fuel as long as its content does not exceed the solubility limit, which depends on the helium partial
pressure in the rod. Hence, no helium release is observed in pre-pressurized MOX rods (>20 bar) over
a broad range of burn-ups and operating conditions. However, significant helium release is observed in
low pre-pressurized BWR MOX fuel rods[32]
.
Since in the standard diffusion theory of fission gas release, the release fraction is proportional to the
square root of diffusivity, one expects that in both MOX and UO2 fuels the helium release rate should
be about 30 times larger than that of xenon. However, the concentration of helium in fuel is small
relative to the concentration of the remaining gaseous fission product, helium atoms do not form their
own gas bubbles. Instead the generated helium atoms diffuse to grain boundary and get trapped into
the inter-granular fission products gas bubbles. These bubbles eventually grow and interlink; and the
tunnel through the fuel structure is formed and transfers gas to the free volume of the pin. The analysis
conducted by Kamimura et al.’s[32]
indicates that the similarity between the helium release fraction of
MOX fuel and UO2 implies that in both fuels the released helium volume is strongly proportional to
their production. The proportion of helium production to the FP gas production is about 0.1 for MOX
fuel and 0.025 for UO2. This difference between MOX and UO2 fuel justifies greater consequence of
helium release in MOX fuel[32]
.

Ricerca Sistema Elettrico
Sigla di identificazione
ADPFISS – LP2 – 041
Rev.
0
Distrib.
L
Pag. di
35 170
3 Description of the experiments
3.1 The PRIMO program
The PWR Reference Irradiation of MOX Fuels (PRIMO) program started in October 1986[10]
. It was
jointly organized by the Studiecentrumvoor Kernenergie Centre d’Études de l’Énergie Nucléaire
(SCK•CEN) and Belgonucléaire (BN) and was co-sponsored by ten participants including fuel
vendors, utilities, nuclear centers and national authorities. The PRIMO program sought to investigate
MOX fuel, with the following major objectives:
Irradiation of MOX fuel rods at different burn-up stages and following power histories
representative of those of PWR power plants to determine their behavior under irradiation. The
data obtained have been used for the following purposes:
- To demonstrate the ability of the MOX fuel rods to sustain irradiation conditions
comparable to uranium dioxide fuel.
- To better understand the influence of the fabrication process on the fuel behavior.
- To benchmark the thermo-mechanical codes for MOX fuel calculations.
To investigate the following phenomena:
- Mechanical behavior under steady-state operation: pellet-cladding interaction, ridging
effects, fuel swelling and creep.
- Thermal behavior: fission gas release, grain growth, fuel diffusion effects.
- Nuclear behavior: burn-up radial profiles and U/Pu isotopic effects, versus burn-up.
To carry out a ramp test programme, to find out the failure threshold of MOX fuel rods and to
obtain mechanical and thermal data under ramp conditions. The ramp tests were carried out on
selected fuel types, at various burn-up levels. The ramp conditions (ramp rate, terminal power
and hold time) were chosen such that the results can be compared to existing results on UO2
fuel.
These objectives were met through extensive post-irradiation examinations (PIE) in hot cells.
The experiment included the irradiation of sixteen PWR MOX fueled rods. They can be grouped in
four main types groups, which differ in the fabrication process as follows:
Four rods, named “R”, are manufactured by BN with UO2-PuO2 powder mechanical blending
process (reference process). Among these rods, three have been taken from the old BR3/A4
fabrication campaign (1975), (designated as “RA” rods); and, the last one, is taken from the
more recent BR3/4D campaign (1983, designated as “RD” rod).
Eight rods, named “BN”, are manufactured by BN with the MIMAS process. Among these
rods, six are from the first BR3/4D MIMAS fabrication campaign (1983), (named “BD” rods),
and the remaining two are from a more recent BR3/4E fabrication campaign (1985, named
“BE” rods).
Three rods, named “ME” are manufactured at BN (Dessel plant) for Mitsubishi Heavy
Industries (MHI), using the MIMAS process as well. They differ from BD and BE rods in the
design specifications (i.e. pellet size, cladding properties, gap size).
One rod, named “SL” is manufactured at BN (Dessel plant) for FRAGEMA, using the MIMAS
process. It differs from the previous rods in the design specifications.
These rods were base-irradiated in the BR-3 reactor (Mol, Belgium) up to an average burn-up ranging
between 20 - 60 MWd/tHM. Non-destructive PIE were performed after the base irradiation and then
eight selected rods were delivered to the OSIRIS reactor (Saclay, France) where they experienced

Ricerca Sistema Elettrico
Sigla di identificazione
ADPFISS – LP2 – 041
Rev.
0
Distrib.
L
Pag. di
36 170
power ramp tests up to a peak linear power of 35.0- 47.5 kW/m. After the power ramp, non-destructive
and selective destructive PIE were executed. The non-failed rods were punctured for FGR
measurement. Ceramography, density, thermal diffusivity, EPMA and SIMS measurement were
carried out.
Among these rods, the data provided in this report concern the BD8 fuel rod manufactured at
Belgonucleaire using the MIMAS (Micronized Master Blend) process (1983). Rod BD8 was irradiated
in the BR-3 SCK•CEN reactor during cycles 4D1 and 4D2 up to a peak burn-up of 30.1 GWd/tHM
prior to being transferred to the ISOBELLE 1 loop for ramping in OSIRIS. During the base irradiation,
the BR-3 reactor nominal power was 40.9 MWth (11.4 MWe). The primary circuit operating pressure
was 140 atm.
BN and SCK•CEN provided the data (fabrication and irradiation) of rod BD8 to the OECD-NEA
Expert Group[10]
. This group was established by OECD/NEA Nuclear Science Committee (NSC) with
the aim to deal with the status and trends of reactor physics, nuclear fuel performance and fuel cycle
issues related to the disposition of weapons-grade plutonium as mixed-oxide (MOX) fuel. Among the
tasks of this group, fuel pin mechanics code benchmarking activities were performed based on rod
BD-8. The datasets of this rod are also included in the International Fuel Pin performance
Experimental database (IFPE[9]
).
3.1.1 The BR3 reactor
BR3 was the first PWR installed in Europe with a capacity of 11 MWe (40.9 MW th), Tab. 3. It was
operated from 1962 to 1987 at Mol, Belgium[33]
. It is currently under decommissioning. Its main
utilization focused on operators training for the Belgian utilities and on the testing of new fuels on
behalf of research centers and nuclear fuel suppliers. The BR-3 driver fuel and test fuels were similar
to PWR fuels, made of UO2 or UO2/PuO2(MOX) with stainless steel and later Zircaloy cladding. The
exotic character of the fuels stayed in the large variety of enrichments used (up to 8.6 % 235
U and 10%
fissile Pu), and in the specifications of the fuel and cladding materials.
Characteristic Unit Value
Average reactor thermal power MWth 40.9
Coolant temperature at core inlet °C 252-257
Coolant temperature at core outlet °C 264-269
Mass flow rate kg/s 9.4
Average system pressure MPa 14
Active length of core m 1
Tab. 3 – BR-3 Reactor, main characteristics.
3.1.2 The OSIRIS reactor
OSIRIS is an experimental reactor with a thermal power of 70 MW[34]
, Tab. 4. It is a LWR, open-core,
pool type reactor located at Saclay (France). The main aim of OSIRIS is to carry out tests and irradiate
fuel elements and structural materials of nuclear power stations under an high flux of neutrons, and to
produce radio-isotopes for medical purposes. The open-core, pool-type reactor allows to directly
access the core. The reactor core is depicted in Fig. 9. It is capable to house up to 16 experimental
devices in 4 different positions. The fast neutron flux (E>1MeV) reaches 2.2*1014
n cm-2
s-1
in the
experimental position 64[35]
. Structures are also provided outside the core, on 3 faces of the vessel,
making it possible to install up to 27 experimental devices on the first periphery, where the maximum
fast neutron flux is 10 times weaker than in the core. Many others facilities can be placed on the
second and third peripheries. Among these position, power ramping can be experienced in ISABELLE

Ricerca Sistema Elettrico
Sigla di identificazione
ADPFISS – LP2 – 041
Rev.
0
Distrib.
L
Pag. di
37 170
1 and ISABELLE 4 loops. ISABELLE 1 was used for the power ramp test of the rod BD8. The
experimental load consists of a short fuel rod, either new or re-manufactured. The power that can be
evacuated by the loop is 60 kW and the maximum linear power on the fuel element is 620 W cm-1
with
a maximum ramp speed of 700 W.cm-1
min-1
.The design of the ISABELLE 1 loop and its positioning
on the periphery of the core enable irradiation and withdrawal with the reactor in operation. The loop
is placed on mobile supports, the displacement of which, in relation to the core of the reactor, is used
either to adjust the power of the fuel element, or to automatically control the power ramps or the cycles
at variable speeds. The power released by the experimental load during irradiation is measured in real
time by a heat balance produced by means of the flux, pressure and temperature sensors, as well as by
a neutron balance. The ISABELLE 1 loop is also equipped with a LVDT type elongation
measurements sensor to continuously monitor the lengthening of the fuel element during variations in
power.
Characteristic Unit Value
Thermal power MWth 70
Moderator -- H2O
Reflector -- H2O
In core Thermal flux n/(cm2s) 3*10
14
In core Fast flux n/(cm2s); (E>0.1MeV) 4.5*10
12
Core dimensions m 0.57x0.57x0.60
Number of fuel el. -- 38
Number of control el. -- 6
Control el. material -- Hafnium
Fuel -- U3SI2Al
Fuel enrichment % 19.75
Core inlet temperature °C 38
Core outlet temperature °C 47
Pool average temperature °C 35
Primary Core flow rate m3/h (upward) 5600
Pool flow rate m3/h (downward) 500
Tab. 4 – OSIRIS Reactor main characteristics.

Ricerca Sistema Elettrico
Sigla di identificazione
ADPFISS – LP2 – 041
Rev.
0
Distrib.
L
Pag. di
38 170
Fig. 9 – OSIRIS reactor core layout.
3.1.3 BD8 rod design
Fuel rod BD8 was manufactured at BN in 1983, the industrial process adopted was the MIMAS
process (Micronized Master Blend, widely used for the fabrication of LWR MOX fuel pellets). The
size of initial agglomerates and U-Pu inter diffusion phenomena during the sintering process influence
the local enrichment of fissile elements. As result, the presence of Pu-rich particles, up to 30% of
PuO2, is observed in the fresh fuel[10]
.
The overall length of the BD8 rod is 1136mm with an active length, occupied by MOX fuel pellets, of
1005 mm, Fig. 10 and Fig. 11. All the MOX fuel pellets were manufactured by BN in its Dessel plant
(sintering conditions: 1700°C, 1 h under Ar+5%H2). Three UO2 blanket pellets were loaded at the
bottom end of the mixed-oxide fuel stacks. The UO2-depleted fuel pellets were manufactured by
Franco Belge de Fabrication de Combustible (FBFC) in its Dessel plant. The summary of the fuel main
data is given in Tab. 5 and Tab. 6. The cladding tube is seamless Zircaloy 4 manufactured by
Mannesmann Röhrenwerke (Germany) from an ingot provided by TWCA, Oregon (USA), Tab. 7,
Tab. 8. The tube was stress-relieved at 460°C during 2.5 hours. A spring made of stainless steel was
placed in the upper plenum free space, in order to avoid the formation of inter-pellet gaps during the
rod handling. A 20 mm long spacer ring made of Zy4 was inserted in the fuel rod between the spring
and the top fuel pellet.

Ricerca Sistema Elettrico
Sigla di identificazione
ADPFISS – LP2 – 041
Rev.
0
Distrib.
L
Pag. di
39 170
Pellet characteristic Unit Value
Fabrication lot -- BN lot IL 123
Diameter* mm 8.034, 8.041, 8.046
Length* mm 8.591, 9.222, 9.667
Shoulder* (side 1) mm 0.811, 0.864, 0.903
Shoulder* (side 2) mm 0.830, 0.883, 0.934
Dish volume* (side 1) % 0.947, 1.011, 1.095
Dish volume* (side2) % 0.903, 0.961, 1.051
Chamfer width* (side 1) mm 0.274, 0.293, 0.324
Chamfer width* (side 2) mm 0.297, 0.323, 0.344
Chamfer height* (side 1) mm 0.102, 0.135, 0.166
Chamfer height* (side 2) mm 0.132, 0.149, 0.170
O/M -- 1.991 238
U concentration** % HM 84.68 235
U concentration** % HM 5.24 239
Pu concentration** % HM 7.63 240
Pu concentration** % HM 2.10 241
Pu concentration** % HM 0.28 242
Pu concentration** % HM 0.07
Mean UO2 grain size*** μm 5
Mean PuO2-rich particle size μm 21.3
Max. PuO2-rich particle size μm 214
Pellet surface roughness μm 2
Density % TD 94.64 * minimum, average, maximum value
** isotopic composition in October 1983
*** mean linear intercept
Tab. 5 – PRIMO Program, rod BD8, fuel pellets characteristics.
Pellet characteristic Unit Value Fabrication lot -- BN lot 6303
Diameter mm 8.044
Length mm 1.994
Chamfer width (both sides) mm 0.5
Chamfer height (both sides) mm 0.5
O/M -- 1.994 238
U concentration* % HM 99.65 235
U concentration* % HM 0.35
Mean UO2 grain size**
μm 14
Density
% TD 95.40
* isotopic composition in October 1983
** mean linear intercept
Tab. 6 – PRIMO Program, rod BD8, depleted uranium pellets characteristics.

Ricerca Sistema Elettrico
Sigla di identificazione
ADPFISS – LP2 – 041
Rev.
0
Distrib.
L
Pag. di
40 170
Cladding characteristic Unit Value
Outer diameter* mm 9.492, 9.510
Inner diameter* mm 8.232, 8.250
Minimum wall thickness mm 0.58
Inner surface transversal roughness μm 3.2
Outer surface transversal roughness μm 2.8
Tensile test temperature °C 400
Ultimate strength kg/mm2
39.3
Yield strength kg/mm2 31.4
Elongation % 17.8
Hydride orientation (Fn)* -- 0.04, 0.15
Grain size μm 10
Hydrogen content ppm 11
Oxygen content ppm 1170
Vickers Hardness (HV200)* -- 205-214
* minimum and maximum value
Tab. 7 – PRIMO Program, rod BD8, cladding tube characteristics.
Rod characteristic Unit Value
Diametric gap μm 200
Pre-pressurization (He) kg/cm2
20
Uranium weight* g 412.6
Plutonium weight g 46.4
(U,Pu)O2 weight g 521.1
UO2 weight g 19.4
Fuel length mm 1004.7
DU pellets length mm 36.5
Plenum length** mm 40.0
Total rod length mm 1136.2
Rod free volume*** cm3
5.7
*In MOX fuel column only.
** Spacer tube excluded.
*** Including: upper plenum, gap, dishes, chamfers, free volume in upper plug. Open porosity not included.
Tab. 8 – PRIMO Program, rod BD8, fuel pin characteristics.

Ricerca Sistema Elettrico
Sigla di identificazione
ADPFISS – LP2 – 041
Rev.
0
Distrib.
L
Pag. di
41 170
1– lower plug; 2 – lower plenum spring; 3 – cladding tube; 4 – spacer tube; 5 – MOX fuel pellets; 6 – depleted Uranium
pellets; 7 – upper plug.
Fig. 10 – PRIMO Program, general layout of rod BD8.
Fig. 11 – PRIMO Program, rod BD8, hold down spring and spacer tube.

Ricerca Sistema Elettrico
Sigla di identificazione
ADPFISS – LP2 – 041
Rev.
0
Distrib.
L
Pag. di
42 170
3.1.4 Base irradiation
Rod BD8 was base irradiated in the BR3 reactor of SCK•CEN. During cycle 4D1 (413 days, from
13/07/1984 until 11/11/1985), the rod accumulated an average burn-up of 18.0 MWd/kgHM. During
cycle 4D2 (333 days, from 03/07/1986 until 30/06/1987), the average rod burn-up reached 30.1
MWd/kgHM[10]
.
The average temperature of the coolant was maintained at 262.5°C; power changes were compensated
by adapting the mass flow rate. Coolant inlet temperature was 255°C, and the mean outlet temperature
at nominal power reached 270°C. The PRIMO MOX fuel rods were loaded in special dismountable
assembly in the BR3 reactor; this assembly was designed “ad hoc” for the BR3 – core 4 with the
17x17 configuration. The mean flow area for the 17 × 17 assembly was 42.65 cm2 and the mass flow
rate passing through the assembly was 9.4 kg/s (specific flow rate 220 g/cm2s); the hydraulic diameter
in cold conditions is 14.93 m.
The linear power has been calculated by means of the 2-D diffusion code CONDOR[10]
. The
geometrical X-Y model covered the entire core for cycles 4D1 and 4D2. An R-Z model was used in
order to obtain information on the axial behavior. Nuclear constants were obtained from the cell code
PANTHER[10]
. The axial effects such as variation of water density, variation of xenon density are
taken into account in the results. For the rod power calculations, the actual reactor power history of
each cycle has been subdivided into constant power time steps (i.e. histogram format). The step
lengths have been made small enough to ensure that the power does not vary more than a few percent
around the given mean values. The base irradiation power history at peak axial position and the axial
power shapes in the two cycles are shown, respectively, in Fig. 12 and Fig. 13.
Fig. 12 – PRIMO Program, rod BD8, linear heat rate at the peak point during base irradiation.

Ricerca Sistema Elettrico
Sigla di identificazione
ADPFISS – LP2 – 041
Rev.
0
Distrib.
L
Pag. di
43 170
Fig. 13 – PRIMO Program, rod BD8, relative axial power profile, BR3-4D1 and BR3-4D2 cycle.
3.1.5 Power ramp irradiation
After the base irradiation, the BD8 rod was transported to CEA-Saclay for irradiation in the OSIRIS
reactor. The irradiation device used for the PRIMO ramps was the ISABELLE 1 loop. The BD8 fuel
rod placed in a sample holder was contained in a tube pressurized at 150 bars and cooled with light
water flowing at a 200 g/s. The outer cladding temperature was kept at 342 ±5°C. The power ramp
consisted of:
Conditioning process at a peak power level of 18.9 kW/cm held for 27 hours.
Power ramping with a Ramp Rate (RR) of 462 kW/(m-h), up to a Ramp Terminal peak power
Level (RTL) of 39.5 kW/m.
Holding at RTL for 20 hours or until the cladding failure.
The ramp test power history is shown in Fig. 14 and Fig. 15.

Ricerca Sistema Elettrico
Sigla di identificazione
ADPFISS – LP2 – 041
Rev.
0
Distrib.
L
Pag. di
44 170
Fig. 14 – PRIMO Program, rod BD8, linear heat rate at the peak point during power ramp test.
Fig. 15 – PRIMO Program, rod BD8, relative axial power profile of the OSIRIS Reactor.
3.1.6 Main Achievement from the Experiment
Post irradiation examinations were performer prior to ramping and at the end of the experiment. Both
non-destructive and destructive measurements were carried out.

Ricerca Sistema Elettrico
Sigla di identificazione
ADPFISS – LP2 – 041
Rev.
0
Distrib.
L
Pag. di
45 170
3.1.6.1 Non-destructive examination
Non-destructive data for BD8 rod were extracted from the Final Report of the PRIMO program; they
were used to characterize the fuel rod evolution on three points:
the cladding creep, irradiation growth and integrity;
the fuel integrity;
the pellet-cladding mechanical interaction.
Five non-destructive tests were included in the non-destructive examination programmed:
visual examination of the cladding;
dimensional controls (diameter and rod length measurements);
neutron radiography;
gamma scanning (spectrometry, burnothèque);
eddy current test.
The cladding soundness was inspected through visual examination and eddy current test. Visual
examinations showed a uniform dark-grey aspect, with scarce scratches resulting from rod
manipulations. No anomaly was observed. Eddy current tests were performed in order to detect
cladding abrupt defects such as incipient cracks as well as longer and more gradual defects. Neither
primary defects nor ridging could be observed on rod BD8. The cladding outer diameter was measured
at CEA-Saclay. Two measurements were performed on two diameters at 90° (with an accuracy of ±5
micron) with the aim to determine the diameter changes and the cladding ovality. Measurements were
done at 20 axial positions along the fuel column length. The rod BD8 showed cladding creep, without
any sign of pellet-cladding mechanical interaction[10]
. From the diameter records, the cladding
diameter change or hoop strain (εθ) and the ovalisation (∆) can be computed by means of the following
expressions:
εθ (%) = (Da – D0)/D0*100 Eq. 5
∆ = Dmax – Dmin Eq. 6
Where
Dmin is the minimum-recorded diameter;
Dmax is the maximum-recorded diameter;
D0 is the reference diameter (mean diameter at or close to the plenum level);
Da = (Dmax + Dmin) / 2.
In order to determine the Zircaloy irradiation growth, rod length measurements were performed using
neutron radiography examination. The accuracy on the results is estimated at 1 mm. The rod
elongation εz for rod BD8 is defined as follows:
εz(%) = (L1 – L0)/LF*100 Eq. 7
Where
L0 is the fuel column length before irradiation;
L1 is the fuel column length after irradiation;
LF is the fuel column length.
The fuel column length change was measured with the same technique (and accuracy). The main
results obtained prior to ramping from geometrical PIE are summarized in Tab. 9. “Burnothèque”
examination was performed in order to determine the maximum and mean burn-up by means of non-

Ricerca Sistema Elettrico
Sigla di identificazione
ADPFISS – LP2 – 041
Rev.
0
Distrib.
L
Pag. di
46 170
destructive gamma spectrometry on 137
Cs. The measured rod burn-up of rod BD8 was 30.1 GWd/tHM
whereas the peak pellet burn-up was 39.7 GWd/tHM. The uncertainty on the experimental burn-up
values is estimated to be less than 6%. These values are in good agreement with the calculated burn-
up, according to which the average rod burn-up reaches 32.2 GWd/tHM and the peak pellet burn-up
38.0 GWd/tHM. The transient test allowed the following observations:
There was no significant cladding mean diameter change.
There was the appearance of a ridging effect in the high power zone, ranging between 10 and
17μ (diametric).
There was a beginning of dish filling observable on the neutron radiography as a result of
gaseous swelling and fuel plasticity during ramp.
There was Cesium migration towards the coolest zones of the pellets.
There was a sound aspect of the cladding and the fuel column, with no anomaly.
3.1.6.2 Destructive examination
During destructive examination, the parameters related to FGR were measured, they are summarized
in Tab. 10. The fission gas release (FGR) fraction is calculated assuming a gas (Xe + Kr) generation
rate of 30 cm3STP/MWd. The FGR prior to ramping has been estimated on the basis of the FGR of a
sibling non-ramped rod, i.e. rod BD10[10]
. Ceramographic examination after the ramp revealed that
grain growth occurred in the central part of the pellets (until r/R pellet = 0.4). The mean grain size
reached about 10 μm (mean linear intercept) in that region.
Measured quantity Unit Value
Mean fast fluence (E>1 MeV) 1021
n/cm2
2.93
Peak fast fluence (E>1 MeV) 1021
n/cm2
3.69
Mean cladding hoop strain % -0.24
Maximum cladding hoop strain (at fast fluence peak) % -0.32
Mean cladding ovalisation μm 13.00
Maximum cladding ovalisation (at fast fluence peak) μm 18.00
Rod elongation (Cladding irradiation growth) % +0.21
Fuel column length change % -0.13
Tab. 9 – PRIMO Program, rod BD8, experimental data obtained from PIE performed PTR.
Measured quantity Unit Value
Total collected gas cm3
at 0°C, 1 bar 171.3
Volume of Xe + Kr cm3
at 0°C, 1 bar 46.9
Gas composition He (% vol.)
Xe (% vol.)
Kr (% vol.)
72.62
25.71
1.67
Xe/Kr volume ratio -- 15.4
Total Fission Gas Release % 11.24
Estimated Xe + Kr release prior to ramp % 0.47
Estimated Xe + Kr release after ramp % 10.77
Tab. 10 – PRIMO Program, rod BD8, FGR measurements.
3.2 The IFA-597 experiment
The Instrumented Fuel Assembly 597 (IFA-597) experiment took place between July 1997[11],[12],[36]
and January 2002. It was carried out in the joint program of the Halden Reactor Project. The

Ricerca Sistema Elettrico
Sigla di identificazione
ADPFISS – LP2 – 041
Rev.
0
Distrib.
L
Pag. di
47 170
experimental operation of the Halden Boiling Water Reactor and the Man-Machine Systems
laboratories and associated research programs are sponsored through an international agreement
including fuel vendors, utilities, nuclear centers and national authorities.
The experiment aimed to study the thermal and fission gas release behavior of MOX fuel, and to
explore differences in performance between solid and hollow pellets. One of the rods had mainly solid
pellets while the other contained only hollow pellets. The two rods were instrumented with a fuel
center thermocouple and a pressure bellow transducer and irradiated in the Halden Reactor. The
experiment consisted of four power cycles labeled as IFA-597.4/.5/.6/.7. The experiment was planned
to irradiate the two rods up to around 60 MWd/kgMOX but, because of excessive inner pressure build-
up caused by high FGR, it was interrupted at 33 MWd/kgMOX. The rods were subjected to PIE after
the end of irradiation.
The in-pile data on fuel temperature, rod inner pressure and results of the gas puncturing and mass
spectrometry of the extracted gas were released with the purpose of code benchmarking. Details of the
fabrication data as well as information about the provided irradiation data up to a burn-up of 26
MWd/kgMOX (for a period of 626 irradiation days) are provided by T. Tverberg in 2007.
HRP provided the data of rods 10 and 11 from IFA-597 test to the OECD-NEA Expert Group[12]
. This
group was established by OECD/NEA Nuclear Science Committee with the aim to deal with the status
and trends of reactor physics, nuclear fuel performance and fuel cycle issues related to the disposition
of weapons-grade plutonium as mixed-oxide (MOX) fuel. Among the tasks of this group, fuel pin
mechanics code benchmarking activities were performed based on IFA-597 experiment. The datasets
of this rod are also included in the International Fuel Pin performance Experimental database (IFPE[9]
).
3.2.1 The Halden BHWR
The Halden Boiling Water Reactor[37][38]
(HBWR) is currently operated at 18 to 20 MW. It is situated
inconspicuously within the rock on the outskirts of the town of Halden in southern Norway. The
reactor has operated since 1959 and was initiated to investigate nuclear capability as a supplier of
steam to the wood pulp industry. Since that time, the reactor facilities have been updated progressively
and, through a series of innovative techniques, the system has become one of the most versatile in the
world. Over the course of this development, some 300 in-pile experiments have been performed. These
ranged in complexity from rudimentary non-instrumented rod bundles to some of the most integrated
and complex in-reactor tests ever designed.
The HBWR is a natural circulation boiling heavy water reactor, Fig. 16. The maximum power is 25
MW (thermal), and the water temperature is 240°C, corresponding to an operating pressure of 33.3
bar. The reactor vessel primary circuit system is inside a 30-60 m thick rock cavern with a net volume
of 4500 m3, it is cylindrical with a rounded bottom. It is made of carbon steel and the bottom and the
cylindrical portion are clad with stainless steel. The flat reactor lid has individual penetrations for fuel
assemblies, control stations and experimental equipment. 14 tons of heavy water act as coolant and
moderator. A mixture of steam and water flows upwards by natural circulation inside the shroud tubes
which surround the fuel rods. Steam is collected in the space above the water while water flows
downwards through the moderator and enters the fuel assemblies through the holes in the lower ends
of the shroud. The steam flows to two steam transformers where heat is transferred to the light water
secondary circuit. Condensate from the steam transformers returns to the reactor by gravity. An
external sub-cooler loop is installed to provide experimental variation of void fraction in the fuel
assemblies and the moderator, and is also used for heating and cooling purposes. In the secondary
circuit, two circulation pumps pass the water through the steam transformers, a steam drum and a
steam generator where steam is produced in the tertiary circuit. The tertiary steam is normally
delivered as process steam to the nearby paper mill, but may also be dumped to the river. There is
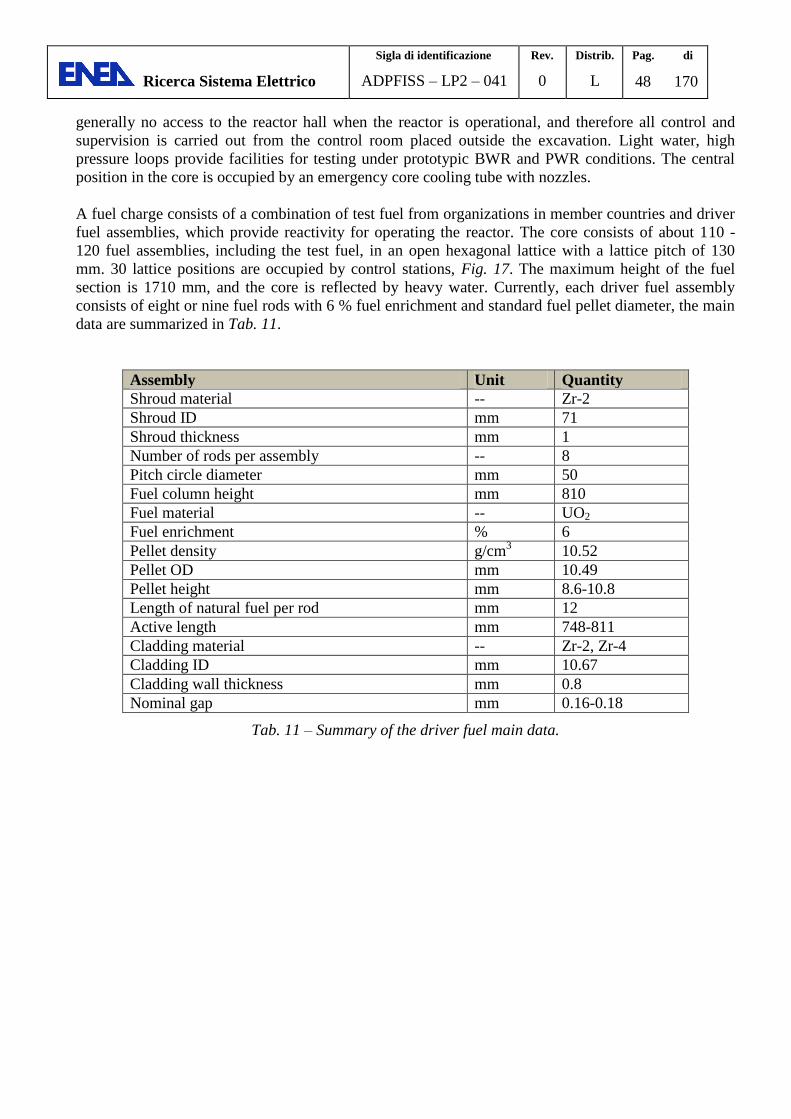
Ricerca Sistema Elettrico
Sigla di identificazione
ADPFISS – LP2 – 041
Rev.
0
Distrib.
L
Pag. di
48 170
generally no access to the reactor hall when the reactor is operational, and therefore all control and
supervision is carried out from the control room placed outside the excavation. Light water, high
pressure loops provide facilities for testing under prototypic BWR and PWR conditions. The central
position in the core is occupied by an emergency core cooling tube with nozzles.
A fuel charge consists of a combination of test fuel from organizations in member countries and driver
fuel assemblies, which provide reactivity for operating the reactor. The core consists of about 110 -
120 fuel assemblies, including the test fuel, in an open hexagonal lattice with a lattice pitch of 130
mm. 30 lattice positions are occupied by control stations, Fig. 17. The maximum height of the fuel
section is 1710 mm, and the core is reflected by heavy water. Currently, each driver fuel assembly
consists of eight or nine fuel rods with 6 % fuel enrichment and standard fuel pellet diameter, the main
data are summarized in Tab. 11.
Assembly Unit Quantity
Shroud material -- Zr-2
Shroud ID mm 71
Shroud thickness mm 1
Number of rods per assembly -- 8
Pitch circle diameter mm 50
Fuel column height mm 810
Fuel material -- UO2
Fuel enrichment % 6
Pellet density g/cm3 10.52
Pellet OD mm 10.49
Pellet height mm 8.6-10.8
Length of natural fuel per rod mm 12
Active length mm 748-811
Cladding material -- Zr-2, Zr-4
Cladding ID mm 10.67
Cladding wall thickness mm 0.8
Nominal gap mm 0.16-0.18
Tab. 11 – Summary of the driver fuel main data.

Ricerca Sistema Elettrico
Sigla di identificazione
ADPFISS – LP2 – 041
Rev.
0
Distrib.
L
Pag. di
49 170
Fig. 16 – HBWR, scheme and main operational data.
Fig. 17 – HBWR, core plan view of reactor top lid and main data.

Ricerca Sistema Elettrico
Sigla di identificazione
ADPFISS – LP2 – 041
Rev.
0
Distrib.
L
Pag. di
50 170
3.2.2 Rods design
The MOX fuel rods, named rod 10 and rod 11, both started their irradiation with fresh fuel pellets with
initial Pu-fissile enrichment or 6.07%[12]
. The fresh fuel had a Pu-total enrichment of 8.44% which was
measured by potentiometric titrations. Pu isotopic composition was measured by mass spectrometry in
order to determine the initial Pu-enrichment. PuO2 spot size was determined from alpha
autoradiography. The pellets were fabricated trough the MIMAS process. All the fabrication data are
summarized in Tab. 12. Rod 10 has an active length of 224 mm and is made of 17 solid fuel pellets
and 4 hollow pellets to allow for the insertion of a fuel thermocouple. In rod 11, all 21 pellets are
hollow and the active length is 220 mm (the above numbers do not include end pellets). The fuel
pellets had an initial outer diameter of 8.04 mm and each hollow pellet has a central hole of diameter
1.8 mm. The cladding outer diameter is 9.5 mm and the initial diametrical fuel cladding gap was 180
µm in both rods. The rods are fitted at the top with a fuel center thermocouple of the W5Re/W24Re
type and at the bottom with a pressure bellows transducers[11],[12]
,[36]
. The pressure transducers are
equipped with internal bellows pressurized to 4 bar (at 20°C), while the rods themselves were
pressurized to 5 bar (at 20°C) with Helium before loading into IFA-597.4. Four UO2 fuel rods, named
rods 1, 2, 3 and 5, are approximately 500 mm long and are positioned to cover the whole axial region
of the MOX fuel rods. They had been irradiated up to 12.7 MWd/kgUO2, in IFA-597.1 before loading
into IFA-597.5. The initial U235
enrichment of the pellets in IFA-597.1 was 4.95%. These rods can be
placed or removed from IFA-597 to achieve respectively, low or high powers (temperatures).

Ricerca Sistema Elettrico
Sigla di identificazione
ADPFISS – LP2 – 041
Rev.
0
Distrib.
L
Pag. di
51 170
Pellet characteristic Unit Rod 10 Rod 11 Fuel type -- MIMAS-MOX
Active length mm 224 220
Fuel mass kg 0.1179 0.1106
Instrumentation, upper end mm TF1 TF2
Instrumentation, lower end mm PF1 Pf2
Fuel density g/cm3 10.54
Fuel density %TD 95.86
Initial enrichment Pu(f) 6.07
Fuel pellet diameter mm 8.04
Initial gap width mm 0.9
Pellet length mm 10.7 10.5
Pellet form -- 17 solid, 4
hollow
21 hollow
Drilled center hole diameter mm 1.8
Dishing -- Both ends
Dishing depth mm 0.26
Land mm 5.30
Chamfer -- Both ends
Chamfer Height mm 0.15
Chamfer Width mm 0.30
Cladding material -- Zr-4
Filler gas pressure bar 5 (He)
Cladding outer diameter mm 9.50
Cladding thickness mm 0.64
Free volume mm3 2600 2800
Grain size μm 4.3 – 6.6 (m.l.i.)
Mean - max PuO2-rich particle size μm 5.1 – 231.4
Pellet surface roughness μm 1.4
Cladding surface roughness μm 0.15
Neutron fast flux n/cm s 1.6E11*LHR
Heavy metal composition
U
%
80.568
Pu 7.424
Am 0.040
Plutonium isotopic composition
238Pu
%
0.914 239
Pu 65.340 240
Pu 23.675 241
Pu 6.570 242
Pu 3.494 241
Am 0.595
Uranium isotopic composition
234U
%
0.002 235
U 0.252 236
U 0.001 238
U 99.745
Pore size distribution μm 1.9 to 3
Oxygen to metal ratio -- 1.999
Re-sintering test
Duration h 24
Temperature °C 1700
Avg. densification % TD 0.455
Tab. 12 – IFA-597, rod 10 and rod 11 design data.
3.2.3 Irradiation history
The rig operated under Halden BWR conditions. The experiment consisted of four power cycles
labeled as IFA-597.4/.5/.6/.7. IFA-597.4 was originally placed in position 6-33 to keep the power level
within the range of 20-35 kW/m. The rig remained in this position until it was moved outwards to

Ricerca Sistema Elettrico
Sigla di identificazione
ADPFISS – LP2 – 041
Rev.
0
Distrib.
L
Pag. di
52 170
position 7.37 for the second half of IFA-597.5 (march 1999)[12]
. At the beginning of IFA-597.6, the rig
was moved inwards to position 5-15 in order to obtain sufficient power for FGR investigations. IFA-
597.7 was moved outwards to position 6-24 to suppress the power in order to avoid significant FGR.
Typical axial neutron flux profiles during operation are shown in Fig. 18, Fig. 19. Because the neutron
detector ND1 is outside the range of the MOX rods, the real axial shape is actually defined using
measurements at one axial location (ND2, 3, 4). Considering the length of the MOX rods, however, it
is evident that the profile over the MOX rods has been rather flat, the difference between maximum
and minimum thermal neutron flux over the rod length being within 3-5%.
The total rig power and linear heat rates (LHRs) are determined using a power conversion factor (KG)
and a depletion factor (CD) relating the rod power to the neutron detector signal (ND)[12]
. The KG is
usually obtained from early-in-life thermal-hydraulic calibration tests. However, the calibration was
not performed for this test rig, partly due to the small mass of fuel in the rig (230 g). Instead of
performing a power calibration measurement, the KG was obtained from comparison of the fuel
temperature versus LHR relation with another test with identical fuel, which had a KG obtained from
ordinary power calibration measurement and HELIOS calculations for each loading. To correctly
determine the local LHR in the hollow part of the solid MOX rod (rod 10), the loss of fissionable
material as well as the changes in thermal flux depression due to the hollow pellets have been
considered. The increasing rod pressure causes creep of the pressure bellows transducers. It results in a
slight drift in the measurement, which has been eliminated by using a standard drift correction method
utilizing data in cooling down periods (coolant temperature ramps).
The linear heat rate histories for both rods are shown in Fig. 18 as LHR at the thermocouple positions
versus the average fuel burn-up. Due to the flat axial power profile, local LHR at the thermocouples
are essentially the same as the average LHRs in both rods. The plan for the test series was to operate
the fuel at a relatively low power and to experience power uprating roughly every 10 MWd/kgMOX in
order to study the FGR behavior. To promote FGR in IFA-567.4 and IFA-567.6, the LHRs were
considerably higher than in IFA-597.5 and IFA-597.7. Which were irradiated in order to accumulate
fission gas in the fuel matrix.
The first test, IFA-597.4, was operated within the range 30-35 KW/m for the first half and 27-30
kW/m for the second half of the test. In this loading, the power ramp, which can be observed as steps
at about 10-11 MWd/kgMOX, was conducted successfully in order to study FGR behavior of MOX
fuel. The power resulted occasionally in temperature high enough to cause gas release in both MOX
rods. For IFA-597.5, four UO2 rods were added to the rig in order to suppress the LHR in the MOX
rods and to avoid FGR. Consequently, LHRs remained low (8-20 kW/m) and no significant FGR
occurred during this loading. The aim of IFA-597.6 was achieve sufficiently high temperatures to
cause FGR, and hence it was operated within the range 23-27 kW/m. Again, appreciable gas release
was observed in both MOX rods. During IFA-597.7, three UO2 rods were added to the rig as in IFA-
567.5 and essentially no FGR was observed in this loading.
The average LHR in rod 10 (solid pellets) was lower than in rod 11 (hollow pellets) in IFA-597.4 and
at the beginning of IFA-597.5. After that, both rods had almost the same power throughout the
irradiation. This can be explained by the redistribution of the rig power due to the change of core
position.
The axial neutron flux profile was almost flat over the MOX fuel stacks, and the maximum local LHR
always occurred in the middle region of the rod. For rod 11, the LHR was almost uniform along the
active length (less than 2% variation respect to average value). For rod 10, the local LHRs varied

Ricerca Sistema Elettrico
Sigla di identificazione
ADPFISS – LP2 – 041
Rev.
0
Distrib.
L
Pag. di
53 170
within 7%, despite, the fact that the LHR at the top of fuel stack was lower than the average due to the
presence of hollow pellets[12]
.
Fig. 18 – IFA-597, rod 10 and rod 11, LHR at the thermocouple position

Ricerca Sistema Elettrico
Sigla di identificazione
ADPFISS – LP2 – 041
Rev.
0
Distrib.
L
Pag. di
54 170
Fig. 19 – IFA-597, power axial profile.

Ricerca Sistema Elettrico
Sigla di identificazione
ADPFISS – LP2 – 041
Rev.
0
Distrib.
L
Pag. di
55 170
3.2.4 Main Achievement from the Experiment
The fuel center temperature was measured during the irradiation by means of the thermocouples
accommodated in the central hole in the upper part of both MOX rods, Fig. 20. The results indicate
that the measured temperatures change is in good agreement to the linear power change.
The estimated fuel peak temperature and the measured thermocouple temperature histories are shown
in Fig. 20 along with average linear heat rates. The peak temperature was estimated by FTEMP3 code
calculations. The peak temperatures in rod 10 with solid pellets are ~100-200°C higher than measured
temperature and increase with linear power. On the contrary, in rod 11 with (due to the hollow pellets),
the peak temperature is similar to the thermocouple data because of the flat axial profile. in rod 10, the
Vitanza threshold (shown in Fig. 20); is exceeded in the peak axial position (solid pellet in the rod
middle); however significant gas release is observed in both rods.
The rod pressurization is measured by means of pressure bellows transducers. Inner pressure histories
are provided in Fig. 21. The internal pressure reached 28 bar in and 24 bar respectively, in rod 10 and
rod 11: this was due to significant gas release occurred in both the rods. These pressures are close to
the mechanical limit pressure of the bellows[12]
and caused the interruption of the experiments.
The main objective of this test series was to compare FGR behavior of MOX fuel with that of UO2
fuels. The gas release performance in MOX fuels are different from UO2 due to the presence of
plutonium. This MA promotes the generation (and hence the release) of a considerable amount of
Helium . Helium contributes to the rod pressurization and could favor the release of Xe and Kr by
keeping open the bubbles tunnel network at grain boundaries. Hence, it is a significant factor that
should be accounted to assess the MOX fuel performance. Furthermore, the local plutonium
enrichments causes non-uniform Pu distribution in the fuel matrix which may results in local high
burn-ups and fission product concentrations zones within the matrix[12]
.
The estimation of FGR is made under the assumption of a generation rate of 33.4 cc/MWd. The fission
gas generated is mainly Xenon. Helium is generated by:
alpha decay of Curium (Cm242
);
ternary fissions;
n-α of Oxygen.
In the experiment, it is assumed that Helium contributes to 10% of the total gas generation rate. The
total gas generation is therefore assumed to be 36 cc/MWd. The calculated FGR is simply based on the
rod pressure data and rod free volume estimation during the irradiation.
During IFA-597.4, significant gas release is observed since 6 MWd/kgMOX in both rods[12]
. Around
that time the fuel temperature approaches the Vitanza gas release threshold. The FGR increases further
until the end of IFA-597.4. During the low power cycle IFA-597.5, no pressure increase is observed; it
suggests no FGR occurs in this phase of the experiment. At the beginning of IFA-597.6 a fast increase
of gas release is observed. FGR is higher in rod 10 than in rod 11 due to the considerably higher
temperature achieved in former rod. However, although fuel temperature was the lowest, at the end of
IFA-597.5, the FGR resulted higher in rod 11 . During IFA-597.7 no additional gas release occurs.
However, gas release rate in rod 10 decreases more than expected. It could be explained by the fact
that internal pressure for this rod is close to the mechanical limit of the pressure bellow which might
have measured lower values of the pressure. The estimated EOL total gas release is 33% and 24% for
rod 10 and rod 11 respectively[12]
.
Fig. 22 shows the operating history in IFA-597.6 and the pressure dependence on the linear power and
fuel temperature. During this phase, three pressure burst are observed. The first pressure burst

Ricerca Sistema Elettrico
Sigla di identificazione
ADPFISS – LP2 – 041
Rev.
0
Distrib.
L
Pag. di
56 170
indicates that gas release occurs throughout the corresponding power ramps (Fig. 22). This behavior is
not observed in UO2 fueled rods while there is similar earlier experience in MOX fuel rods[39]
. This
might be caused by the Helium which is released by diffusion at lower temperature than noble
gases[12]
. It provides an early grain boundaries inter-linkage and enhances further gas release. The
second and third bursts seen in power ramp down indicate the typical delayed FGR detection[40]
(the
gap is closed and the pressure transducer is not able to record data until the gap re-open again in the
ramp-down).
The two MOX rods were subjected to PIE after the end of irradiation. The results of the gas puncturing
and mass spectrometry of the extracted gas are summarized in Tab. 13. The total created gas is
estimated by means of HELIOS code simulations[12]
.
Measured quantity Unit Rod 10 Rod 11
Total Kr released
mg
5.66 4.55
Total Xe released 106.14 85.96
Total Kr + Xe released 111.80 90.51
Total Kr generated 24.35 23.51
Total Xe generated 620.91 601.49
Total Kr + Xe generated 645.32 625
Fraction Kr + Xe released -- 0.1732 0.1448
Tab. 13 – IFA-597, rod 10 and rod 11, PIE, results of gas puncturing.

Ricerca Sistema Elettrico
Sigla di identificazione
ADPFISS – LP2 – 041
Rev.
0
Distrib.
L
Pag. di
57 170
Fig. 20 – IFA-597, rod 10 and rod 11, fuel temperature and linear power history.

Ricerca Sistema Elettrico
Sigla di identificazione
ADPFISS – LP2 – 041
Rev.
0
Distrib.
L
Pag. di
58 170
Fig. 21 – IFA-597, rod 10 and rod 11, pressure measurements.

Ricerca Sistema Elettrico
Sigla di identificazione
ADPFISS – LP2 – 041
Rev.
0
Distrib.
L
Pag. di
59 170
Fig. 22 – IFA-597, rod 10 and rod 11, pressure measurements in IFA-597.6, pressure bursts.

Ricerca Sistema Elettrico
Sigla di identificazione
ADPFISS – LP2 – 041
Rev.
0
Distrib.
L
Pag. di
60 170

Ricerca Sistema Elettrico
Sigla di identificazione
ADPFISS – LP2 – 041
Rev.
0
Distrib.
L
Pag. di
61 170
4 Development and setup of the TRANSURANUS models
4.1 TRANSURANUS code
TRANSURANUS is a computer program for the thermal and mechanical analysis of fuel rods in
nuclear reactors [6][7][8]
. It was developed at the Institute for Trans-uranium Elements (ITU). The
TRANSURANUS code relies on a clearly defined mechanical–mathematical framework into which
physical models can easily be incorporated. The mechanical–mathematical concept consists of a
superposition of a one-dimensional radial and axial description (the so called quasi two-dimensional or
1 ½ D model), the code was specifically designed for the analysis of a whole rod. TRANSURANUS
code incorporates physical models of thermal and radiation densification of the fuel, models of fuel
swelling, fuel cracking and relocation, a model of generation of fission gases, a model of redistribution
of oxygen and plutonium, and some other physical models. Mainly research institutions, industries and
license authorities exploit the code.
Besides its flexibility for fuel rod design, the TRANSURANUS code can deal with a wide range of
different situations, as given in experiments, under normal, off-normal and accident conditions. The
time scale of the problems to be treated may range from milliseconds up to years. The code has a
comprehensive material data bank for oxide, mixed oxide, carbide and nitride fuels, Zircaloy and steel
claddings and several different coolants. It can be employed in two different versions: as a
deterministic and as a statistical code.
The input file of the code contains complete data needed for computation. It determines the type of
reactor, cladding, coolant, fuel geometry and dimensions, surface roughness, coefficients of heat
transfer, initial concentrations of uranium and plutonium isotopes, the course of power loading and the
length (period) of computation. The output data are provided by subroutine that generates data files for
single times, distances or locations at the fuel pin. Optionally, the output data include the pellet radius,
pressure in the gap, contact pressure between the pellet and cladding, concentrations of fissionable
isotopes U-235
, Pu-239
to Pu-242
, concentrations of fission gases, temperatures of the fuel, cladding and
gases in the gap and other parameters.
The uncertainties to be considered may be grouped into three categories.
The first category deals with the prescribed quantities. The fuel rod performance code requires
on input the fuel fabrication parameters (rod geometry, composition, etc.) and irradiation
parameters (reactor type, coolant conditions, irradiation history, etc.).
The second category of uncertainties is the material properties, such as the fuel thermal
conductivity or the fission gas diffusion coefficients.
The third and last category of uncertainties is the so called model uncertainties.
The capabilities of the TRANSURANUS code can be summarized as follows:
Analysis of all fuel rod types under normal, off-normal and accident conditions (deterministic
and probabilistic) is in principle possible.
Consistent steady-state and transient analysis.
Clearly defined mechanical-mathematical framework into which physical models can easily be
incorporated.
Fast and reliable.
Database, models and code extensively verified.

Ricerca Sistema Elettrico
Sigla di identificazione
ADPFISS – LP2 – 041
Rev.
0
Distrib.
L
Pag. di
62 170
Applied by different groups and different licensing authorities.
4.2 Description of the PRIMO input deck
The activity is performed using TRANSURANUS code, version “v1m1j12”, with the deterministic
option, steady state thermal and mechanical analysis[6]
. The version of the manual is “v1m1j12”. The
boundary conditions are prepared using a program written in PERL language.
Suitable physical models are chosen for the simulation of MOX fuel behavior subjected to standard
power ramp condition. In particular, the fission gas intra-granular diffusion equation is solved by the
URGAS algorithm[41]
, the gas diffusion coefficient is modeled according to Matzke[42]
for the thermal
part and to Dowling for the a-thermal part[43]
. The inter-granular behavior is modeled according to the
modified Koo model[44]
. The thermal conductivity is according to the standard MOX correlation
developed by Van Uffelen and Schubert.
Only the active part of the fuel is accounted for the simulation. It has been divided into 12 axial slices
according to the experimental data available at different elevations. The slice analysis is selected
(islice = 1). The nominal design values are used if available; the measured values are considered when
nominal values are not specified.
4.2.1 Selection of the boundary conditions
The boundary conditions implemented for the analysis are:
Linear heat rate at 12 axial position;
Cladding waterside temperature;
Fast neutron flux (>1 MeV), Fig. 24;
Coolant pressure.
The axial mesh is shown in Fig. 25. The linear power history is specified in form of histogram at each
of the 12 axial positions. The rate of change between two constant values is fixed to 6kW/m-h
according to ITU recommendations. The base irradiation implemented is reported in Fig. 12.
The conditioning phase and the power ramp have been modeled in agreement with the experimental
specifications reported in section 3.1.5. The power rate to reach the conditioning level is assumed 6
kW/m-h, Fig. 14.
During the ramp test, the water-side cladding temperature is given as boundary condition whereas, in
the base irradiation, only the coolant temperature at core inlet and outlet are specified. A simple
method based on power balance is adopted to obtain an approximation of the temperature axial profile
starting from the data available in the base irradiation. The temperature difference between two
subsequent axial nodes is obtained as shown below.
∆Ti+1=(li (ql,i + ql,i+1)/2) / (W cp) Eq. 8
Where
∆Ti is the temperature difference between node i and node i+1;
li is the distance between node between node i and node i+1;
ql,i is the linear power at node i;
ql,i+1 is the linear power at node i+1;
W is the mass flow rate;
cp is the water specific heat (assumed constant).

Ricerca Sistema Elettrico
Sigla di identificazione
ADPFISS – LP2 – 041
Rev.
0
Distrib.
L
Pag. di
63 170
TU code is capable to model the heat exchange between the coolant and the cladding outer surface
(taking the coolant temperature at each axial node and the mass flow rate as boundary conditions) or to
implement the cladding water side temperature directly as boundary condition. Nevertheless, it is not
able to use both the options into the same calculation. In order to develop a suitable input deck, a first
simulation of the base irradiation is carried out without considering the ramp to get the coolant-side
cladding temperature history in the base irradiation and to develop the reference model that includes
the power ramp and assumes as boundary condition the clad waterside temperature.
The fast neutron flux is given only in the base irradiation at 12 axial positions. A peak value of
4.5*1012
n/(cm2s) obtained from the OSIRIS Reactor data is assumed in the ramp simulation, its axial
shape is assumed equal to the linear power shape. The error associated with this approximation is
expected to be negligible since the main physical effects of fast neutron flux is associated to long time
exposures.
The coolant pressure is known and matches the operational pressure of the two reactors in which the
experiment took place: respectively 140 bar, 150 bar for BR-3 and OSIRIS.
Fig. 23 – PRIMO Program, rod BD8,cladding and coolant temperatures during base irradiation.

Ricerca Sistema Elettrico
Sigla di identificazione
ADPFISS – LP2 – 041
Rev.
0
Distrib.
L
Pag. di
64 170
Fig. 24 – PRIMO Program, rod BD8, neutron fast flux during base irradiation.
Fig. 25 – PRIMO Program, rod BD8, BD8 rod axial mesh.
4.3 Description of the IFA-597 input deck
The simulation of the two rods from the IFA-597 experiment is performed using TRANSURANUS
code, version “v1m1j12”, with the deterministic option, steady state thermal and mechanical
analysis[6]
. The version of the manual is “v1m1j12”. The boundary conditions are prepared using a
program written in PERL language.
Suitable physical models are chosen for the simulation of MOX fuel behavior subjected to standard
power ramp condition. In particular, the fission gas intra-granular diffusion equation is solved by the
URGAS algorithm[41]
, the gas diffusion coefficient is modeled according to Matzke[42]
for the thermal
part and to Dowling for the a-thermal part[43]
. The inter-granular behavior is modeled according to the

Ricerca Sistema Elettrico
Sigla di identificazione
ADPFISS – LP2 – 041
Rev.
0
Distrib.
L
Pag. di
65 170
modified Koo model[44]
. The thermal conductivity is according to the standard MOX correlation
developed by Van Uffelen and Schubert.
Only the active part of the fuel is accounted for the simulation. It has been divided into 3 axial slices
according to the experimental data available at different elevations. The sectional analysis is selected
(islice = 0). The nominal design values are used if available; the measured values are considered when
nominal values are not specified.
4.3.1 Selection of the boundary conditions
The boundary conditions implemented for the analysis are:
Linear heat rate at 4 axial positions (sectional analysis);
Fast neutron flux (>1 MeV) at 4 axial positions (sectional analysis);
Coolant pressure and temperature (axially constant).
The rate of change between two constant values is fixed to 6kW/(m h) according to ITU
recommendations. The power history is modeled according to the condensed data available in the form
of txt files available in “Mixed-oxide (MOX) Fuel Performance Benchmark”[11],[12]
. The irradiation
data (condensed data) were provided in plain text format as local rod power (in kW/m) for each rod as
a function of irradiation time comprising a total of ~626 irradiation day (until the end of IFA-597.6).
The linear heat rates for each fuel rod were given for three axial locations of the rod: bottom, middle
and top. In addition, the local heat rate at the axial elevation of the fuel centerline thermocouple (TF)
tip were provided (denoted LHRTF). The LHR histories for the two rods are shown in Fig. 26.
The local fast neutron flux is shown in Fig. 27. It is given as a function of local linear power[11],[12]
:
NFF = 1.6 * 1011
* LHR [n/cm2s] Eq. 9
As stated in the benchmark specifications[12]
, coolant pressure and temperatures are assumed constant.
The coolant conditions are 33.6 bar, 240°C during the whole experiment. The heat transfer between
coolant and cladding is computed by the code (ialpha = 0).

Ricerca Sistema Elettrico
Sigla di identificazione
ADPFISS – LP2 – 041
Rev.
0
Distrib.
L
Pag. di
66 170
Fig. 26 – IFA-597, rod 10 and rod 11, LHR at thermocouple position.
Fig. 27 – IFA-597, rod 10 and rod 11, neutron fast flux at thermocouple position.

Ricerca Sistema Elettrico
Sigla di identificazione
ADPFISS – LP2 – 041
Rev.
0
Distrib.
L
Pag. di
67 170
5 The FGR phenomenon and its modeling in TU code
5.1 The FGR phenomenon
Inert fission gas atoms have a very low solubility in the UO2 matrix causing two important life-
limiting phenomena in the fuel rod: either they remain in the pellets and contribute to the swelling, or
they are released from the pellets to the pin free volume. The relevance of FGR in nuclear technology
is connected with the assessment of gaseous source term in case of accident as well as the investigation
of the rod performance under steady state and transient conditions. The FGR affects the rod
performances as briefly recalled in the following[8]
.
Xenon and Krypton (the main released species) degrade the thermal conductivity of the pin free
volume (initially filled with Helium), and thus enhance the fuel temperature. Enhanced fuel
temperature increases FGR and may initiate an unstable process called “thermal feedback”.
The release of fission gases increases the inner pin pressure, limiting the lifetime of a fuel rod
since the inner pressure should not exceed the coolant pressure[7]
.
The swelling due to gaseous fission products may lead to enhanced pellet–cladding mechanical
interaction (PCMI), especially in transient conditions.
The release of radioactive gases (and of volatile solids) from the UO2 matrix to the free volume
decreases the safety margin of a nuclear plant.
Gaseous isotopes tend to diffuse inside the grain (intra-granular processes) and to cumulate at grain
boundaries in form of bubbles and structures of connected bubbles (inter-granular processes). From the
grain boundaries they may reach the pin free volume basically by inter-linkage of bubbles and
subsequent venting of the grain boundary inventory[6]
.
The first step is single gas atom diffusion in the lattice[1]
. This mechanism includes different
contributions that may be classified as temperature depended and a-thermal[45]
. The thermal activated
processes are assumed to dominate the diffusion above 1400°C being an increasing function of the
temperature itself. The fission fragments contribute to the diffusion process too by means of their
associated irradiation damage cascades. This last process dominates the diffusion process at
temperatures below 1000°C and is practically a-thermal. In the range 1000-1400°C both the processes
described above contribute to diffusion. Deviations from stoichiometry, additives (e.g. Cr, Nb), and
burn-up affect the diffusion coefficient too because of their influence on the lattice structure[46]
. Either
natural or radiation produced imperfections in the solid matrix reduce the amount of fission products
available for diffusion by trapping the migrating atoms into bubbles. A fraction of the gas atoms
trapped in bubbles can be re-dissolved in the surrounding matrix through the interaction of a fission
fragment with the bubble[47]
. The experiments show that gas atom trapping in the grains in form of
intra-granular bubbles may be a predominant effect under given conditions[48]
. The trapping rate
depends on the size of the intra-granular bubbles, hence on temperature, fission rate and burn-up. A
second important effect of trapping occurs at grain boundaries (inter-granular process). When gas
reaches grain boundaries, it precipitates on grain faces to form lenticular bubbles. Part of the gas inside
these bubbles is transported back to the grain by fission spikes. When the saturation concentration is
reached on the grain face, fission gas accumulates on the grain edge. If the gas at grain edges has also
saturated, inter-linkage occurs forming a so-called tunnel network through which the gas can be
released, especially in the case of transients[6]
. In fact, during abrupt power (temperature) variations, a
sudden interconnection or opening of grain face bubbles due to micro-cracking along grain boundaries
takes place. Cracking causes instantaneous venting of the gas cumulated in the structure. This process
Ricerca Sistema Elettrico
Sigla di identificazione
ADPFISS – LP2 – 041
Rev.
0
Distrib.
L
Pag. di
68 170
is connected to the burn-up (i.e. it occurs close to 1400 °C at 5 MWd/kgU and at 1050 °C at 60
MWd/kgU)[6]
.
Two additional mechanisms can affect the FGR in the high temperature range. The first one occurs
above 1600°C: grains grow (that results in intra-granular trapping increase) causing grain boundary
sweeping[48]
. The second one occurs above 1800-2000 °C and involves diffusion of intra-granular
bubbles in the grain matrix causing large columnar grain increase.
Finally, a small amount of gases may be released as consequence of a-thermal processes. Recoil and
knock-out[1]
are phenomena in which gas atoms that are close to the pellet outer surface are released
basically by their collision with a fission fragment (recoil) or its induced irradiation cascade (knock-
out).
5.1.1 FGR models
According to the Booth model[49]
, the intra-granular gas behavior is described by the following
equations under the hypothesis of spherical grain of constant radius that contains immobile bubbles.
∂Cs/∂t = D∙[∂2Cs/∂r
2 + (2/r)∙∂Cs/∂r] – g*Cs + b*Cb + β Eq. 10
∂Cb/∂t = g*Cs – b*Cb Eq. 11
Ctot = Cs + Cb Eq. 12
Where:
D(t) is the single gas atom diffusion coefficient;
Cs(r,t) is the local concentrations of gas in solution in the fuel matrix;
Cb(r,t) is the local concentrations of gas in solution in bubbles;
g is the probability per unit time of gas atoms in solution being captured by a bubble;
b is the probability per unit time of gas atom in bubble being re-dissolved to the matrix;
β(t) is the rate at which gas is produced.
Under the assumption of equilibrium between trapping and resolution inside each bubble:
∂Cb/∂t = 0 Eq. 13
Assuming the effective diffusion coefficient as:
Deff = D*b/(b+g) Eq. 14
The formulation of Speight[50]
is obtained (instead of Eqs. 6-7):
∂Ctot/∂t = Deff*∙[∂2Cs/∂r
2 + (2/r)∙∂Cs/∂r] + β Eq. 15
Gas that reaches the grain boundaries may precipitate on grain faces or may be transported back to the
grain by fission spikes. The simplest concept to describe the inter-granular fission gas behavior is that
of grain boundary saturation. It is assumed that, when a specific saturation concentration Csat
gb
(number of gas atoms per unit area) is reached, a network of interconnected bubbles has formed, which
allows the release of gas atoms from the grain boundaries. Normally, it is further assumed that gas
released from grain boundaries is also released from the fuel to the pin free volume. A standard model
for grain boundary saturation has been developed by Dowling, White and Tucker[43]
:

Ricerca Sistema Elettrico
Sigla di identificazione
ADPFISS – LP2 – 041
Rev.
0
Distrib.
L
Pag. di
69 170
Csat
gb = [4r*f(θ)*fc/(3k*Tsin2Θ)] *(2γ/r + Pext) Eq. 16
Csat
gb is the number of gas atoms per unit area of grain boundary;
r is the bubble radius;
f(θ) is a factor that considers that the bubbles are lenticular-shape and not spherical;
fc represents the fraction of grain face area occupied by bubbles;
k is the Boltzmann constant;
T is temperature;
2∙Θ is the angle under which the lenticular bubble meets the grain boundary;
Pext is the external pressure.
5.1.2 Main parameters and processes that affect the simulation of FGR
The FGR phenomenon is mainly a thermal phenomenon and, therefore, it is influenced by all the
factors that influence the fuel temperature. These factors can be divided in three main groups: the first
group consists of the fuel irradiation conditions and includes the reactor type, the operational
conditions and the fuel burn-up (BOL or EOL). The second consists of the design parameter that
affects the fuel thermal conductivity and the gap conductance (in terms of gas conductivity and gap
width). In addition, the fuel grain size impacts on FGR because it influences the mean free path of
fission gas atoms before being released and the grain boundaries saturation concentration. The third
group, consists of all the processes that occur inside the fuel rod and cause temporary or permanent
fuel and/or cladding deformations i.e. densification, swelling etc. Tab. 14 summarizes the main
parameters and phenomena.
Main parameters affecting FGR
a) Irradiation conditions 1. Reactor type Power excursions caused by control system
2. Power transients Cause fuel micro-cracking
3. Linear power Directly affects gas intra-grains diffusion trough fuel
temperature
4. Burn-up Affects fuel thermal conductivity
b) Design parameters 1. Gap gas mixture composition Affects gap thermal resistance (conductance)
2. Pin total free volume Affects gap thermal resistance (conductance)
3. Gap initial width between fuel and cladding Affects gap thermal resistance (width)
4. Oxygen to metal ratio Affects fuel thermal conductivity
5. Fuel additives (Gd) Affects fuel thermal conductivity
6. Fuel porosity Affects fuel thermal conductivity
7. Fuel grain size Affects gas intra-grain diffusion mean free path and grain
boundaries storage capability.
8. Fuel densification Affects fuel thermal conductivity and gap width
9. High burn-up structure formation Affects fuel microstructure at pellet periphery
c) Phenomena occurring in the fuel 1. Cladding swelling and creep down Affects gap thermal resistance (width)
2. Fuel swelling Affects gap thermal resistance (width)
3. Fuel cracking and relocation Affects gap thermal resistance (width)
4. Fuel densification Affects fuel thermal conductivity and gap width
5. High burn-up structure formation Affects fuel microstructure at pellet periphery
Tab. 14 – Main parameters and processes that affect the simulation of FGR.

Ricerca Sistema Elettrico
Sigla di identificazione
ADPFISS – LP2 – 041
Rev.
0
Distrib.
L
Pag. di
70 170
5.2 Modeling of FGR in TU code
The following sub-sections describe the capabilities of TRANSURANUS code to exploit the FGR
phenomenon and the processes that impact on its modeling.
5.2.1 FGR models
The thermal FGR is computed by solving Eq.15 coupled with an inter-granular model based on Eq.16.
Two different algorithms are available: the URGAS[41]
and the FORMAS[51]
models. Both the models
require Deff to solve the intra-granular gas behavior.
For each algorithm, three options are available and they differ in the effective diffusion coefficient. In
general, it is given as:
Deff = D*b/(b+g) = Dthermal + Dathermal Eq. 17
Option 1, keyword FGRMOD 4. It is according to the diffusion coefficients of Hj. Matzke[42]
(thermal) and a-thermal diffusion coefficient according to R. White[52]
.
Dthermal = 5*10-8
e – 40262/T
Eq. 18
Da-thermal = 1.086*10-15
e – 16506/T
Eq. 19
Option 2, keyword FGRMOD 6. It is the recommended TRANSURANUS model, it is
assumed as Reference. It is according with the diffusion coefficients of Hj. Matzke (thermal)
and an a-thermal diffusion coefficient according to ITU data[8]
obtained as:
Deff ≥ 1*10-25
Eq. 20
Option 3, keyword FGRMOD 9. It is according to the diffusion coefficients of Turnbull[53]
. It
provides the single gas atom diffusion coefficient D as the sum of three contributors. D1(T) is
the intrinsic high-temperature component, D2(R,T) is an irradiation enhanced thermal
component (where R is the rating in W/gU), and D3(R) is the a-thermal term.
D = D1 + D2 + D3 Eq. 21
D1 = 7.6*10-10
e – 35000/T
Eq. 22
D2 = 3.22*10-16
*√R e – 13800/T
Eq. 23
D3 = 6*10-23
*R Eq. 24
The intra-granular model should be coupled with the inter-granular model to treat the accumulation
and net release from the grains. Three options are available to simulate the inter-granular behavior of
the fission gases derived from Eq.16.
Option 1, keyword IGRBDM 1. It is according to a simple approximation. It assumes the
saturation concentration at grain boundaries which causes the release of the surplus of gas that
reaches the grain boundaries as constant[54]
: [1-4]*10-4
μmol/mm2 for [FGRMOD4 or 6 –
FGRMOD9] respectively. It is the recommended option in normal operation.
Option 2, keyword IGRBDM 2. It assumes that the saturation concentration at grain boundaries
which causes the release of the surplus of gas takes the form[8]
:

Ricerca Sistema Elettrico
Sigla di identificazione
ADPFISS – LP2 – 041
Rev.
0
Distrib.
L
Pag. di
71 170
Csat
gb = a/T Eq. 25
Where a is 0.1773 μmol/mm2 or 0.7092 μmol/mm
2 depending on the intra-granular modeling,
FGRMOD4 or 6 and FGRMOD9 respectively.
Option 3, keyword IGRBDM 3. It is assumed as Reference. It is according to a modification of
the Koo model[44]
that has been developed to consider the additional release that occurs during
transients like power ramps. This model consists of two contributions: micro-cracking in case
of power increase or reduction, and gas transport from the grain to the grain boundaries[55]
. The
entire fission gas inventory stored at the grain boundaries is released if the power excursion is
greater than 3.5 kW/m and the local temperature T overpasses a local burn-up (buloc) dependent
limit (Eq.22). If the limits are not met the grain boundaries are treated according to the standard
formulation (option 1). This model should be invoked in transient conditions.
T > 1500 (1 – buloc / 80) Eq. 26
The a-thermal contribution to FGR due to knock-out and recoil is modeled according to Turnbull[55]
:
ga-thermal
= 6.1705*10-8
*bu * gcreated
Eq. 27
where bu is the burn-up.
The FGR is obtained by integration in time, axis and radius of the above mentioned terms and is
expressed as % of total gases released at a given time to the total amount of gas generated. The code
has the capability to discriminate between the Xe and the Kr contributions.
5.2.2 Fuel conductivity correlations
The fuel conductivity affects the fuel radial temperature profile. Since this last parameter is crucial in
the determination of the intra-granular thermal diffusion coefficient it is expected that the fuel
conductivity influences the FGR. In general, the fuel conductivity correlations have two temperature
dependent main contributions:
Conduction through lattice vibrations (phononic term): λphonon=1/(a+bT) where a, b are constant
and T is temperature [K]. It is the dominant contribute at lower temperatures.
Conduction through free electrons: λelectronic= c*T3 where c is a constant or λelectronic=(c1/T
2)*e
d/T
where c1 and d are constants. It contributes at high temperatures.
Beside the dependence on the temperature, the thermal conductivity depends on the fuel porosity (P),
the oxygen to metal ratio O/M (stoichiometry), the burn-able absorbers concentration and the burn-up.
Porosity in a ceramic material invariably decreases the thermal conductivity. In general the
effect of porosity is taken into account by a corrective factor (fp): λ(P) = λ100*fp. In which λ100 is
intended conductivity at 100% dense material.
Hypo- and hyper-stoichiometric fuel has a lower thermal conductivity than stoichiometric fuel.
This is generally taken into account as a corrective factor proportional to the deviation x to the
stoichiometric value 2 in the form: axx where ax is a constant.
The introduction of solid FPs and the formation of fission gas bubbles decrease the thermal
conductivity λ so the burn-up effect is degradation of fuel conductivity proportional to the burn-
up.

Ricerca Sistema Elettrico
Sigla di identificazione
ADPFISS – LP2 – 041
Rev.
0
Distrib.
L
Pag. di
72 170
Several models are available in TRANSURANUS to account for conductivity of UOX, MOX, UN and
UC fuels. Those correlations specifically developed for MOX fuels are listed and briefly described in
the following.
Option 1, keyword MatProp_fuel (l, 6) = 31. It is assumed as reference correlation; it gives
the thermal conductivity of MOX fuel (best estimate) according to Van Uffelen and Schubert.
The correlation is based on experimental data obtained by Duriez et al.[56]
for fresh MOX fuel
and laser flash measurements of irradiated MOX fuel at ITU. It is extended by an ambipolar
term recommended by Ronchi et al.[57]
. The thermal conductivity λ0 of 100 percent dense
material is given by:
λ0=1 / (a + a1 bu + b T + b1 bu Tp) + c / T2 exp(- d / T) Eq. 28
[W/mK]
where:
a, a1, b, b1, c, d are constants;
bu is the local burn-up [MWd/kgU];
T is the local absolute temperature [K];
Tp is defined as min (1923,T).
A porosity correction is applied:
λp = λ0 (1 - P)2.5
Eq. 29
Option 2, keyword MatProp_fuel (l, 6) = 32. It computes the thermal conductivity of MOX
fuel according to Carbajo et al.[58]
. The thermal conductivity λ0 of 100 percent dense material
is given by:
λ0 = 1.158 {1/[a0+a1x+(b0+b1x) tk+ c/tk2.5
exp(-d/tk)]} FD(bu,T) FP(bu,T) FR(T) Eq. 30
[W/mK]
ω = 1.09 buat3.265
+ 0.643 (T/ buat)1/2
FD(buat,T) = ω arctg(1/ω)
FP(buat,T) = (1 + 0.019 buat) / [(3 - 0.019 buat) (1 + exp – (T -1200)/*100
)]
FR(T) = 1 – 0.2/(1 + exp – (T -900)/*80
)
where:
a0, a1, b0, b1, c, d are constants;
T is the local absolute temperature [K];
x is the stoichiometry deviation;
tk is T/1000;
buat is the burn-up in at%
FD(buat,T) is the factor that represents the effect of dissolved fission products;
FP(buat,T) is the factor that accounts for the precipitated fission products;
FR(T) is the factor that accounts for the radiation effect.
The porosity correction is:

Ricerca Sistema Elettrico
Sigla di identificazione
ADPFISS – LP2 – 041
Rev.
0
Distrib.
L
Pag. di
73 170
λp = λ0 (1-P)/(1+2P) Eq. 31
where P is the porosity.
Option 3, keyword MatProp_fuel (l, 6) = 33. It computes the thermal conductivity of MOX fuel
according to Lanning and Beyer[59]
. The thermal conductivity λ95 of 95% dense material, based
on the model of Duriez[56]
, is given by:
λ95 = 1/[A(x)+B(x) T+f(BU)+(1-0.9 e-0.004BU
)+g(BU)+h(T)]+ C/T2 exp(-D/T) Eq. 32
where:
C, D are constants;
T is the local absolute temperature [K];
x is the stoichiometry deviation;
A, B, f, g, h are simple functions depending on the parameters in brackets.
The porosity correction is according to Lucuta [60]
:
λp =1.079 λ95 {d / [1+0.5 (1-d)]} Eq. 33
where d is the fractional density.
Option 4, keyword MatProp_fuel (l, 6) = 34. It computes the heat conductivity according to the
Wiesenack[61]
correlation for UO2, reduced by a factor of 0.92[62]
. The thermal conductivity λ95
of 95% dense material is given by:
λo =0.92 [1/(Ao+A1bu +B1 min(1650, θ)+ B2* min{1650, θ }) + (C) eDθ
] Eq. 34
λp = λo(1-P)2.5
Eq. 35
where:
Ao, A1, B1, B2, C and D are constants;
θ is the temperature in °C;
bu is the local burn-up [MWd/kgUO2].
In this correlation no recommendation for the porosity correction is given. Since the correlation
is based upon the MATPRO-11 correlation.
λp = λ95 (1-β P)/(1- 0.05 β) Eq. 36
where β is a constant and P is the porosity.
Option 5, keyword MatProp_fuel (l, 6) = 35. It gives the thermal conductivity of MOX fuel
according to Van Uffelen and Schubert (conservative). This correlation is identical with the
‘best estimate’ described by eq.24. The only difference is the value of the constant a1. This
correlation is more conservative because gives a more important conductivity degradation with
increasing burn-up.
5.2.3 Modeling of fuel relocation
Pellet cracking and relocation can be separated into two mechanisms [8][63]
:

Ricerca Sistema Elettrico
Sigla di identificazione
ADPFISS – LP2 – 041
Rev.
0
Distrib.
L
Pag. di
74 170
Mechanism1: the elastic strain prior to cracking is redistributed, i.e. the pellet volume increases
and the stress level in the pellet are reduced.
Mechanism2: depending on the geometrical details of the rod, e.g. the gap size, relocation (i.e. a
gross movement of fuel fragments), occurs.
Detailed models based on first principles in mechanics are available for mechanism1, whereas the
mechanism2 by its nature can be treated only empirically. Unfortunately, in most situations, the second
mechanism is by far the most important and this is the reason of the big uncertainties encountered in
simulating relocation. The most important models correlate the radial relocation with the as fabricated
gap size go and the linear power q. In some cases, burn-up dependence is also considered. There are six
relocation models for LWRs available in TU[8]
: IRELOC 2, 3, 4, 5, 6, 8. The ITU recommended
models are IRELOC 8 and IRELOC 5.
Option 1, keyword IRELOC = 5. It is the modified KWU-LWR model, ITU calibration 1997.
This model calculates relocation increment according with the simple FEMAXI correlation[63]
:
urel
= 0.3* go/ ro Eq. 37
where:
go is the as fabricated gap size normalized to the as fabricated pellet outer radius;
ro is the as fabricated fuel pellet outer radius;
urel
is the radial deformation at outer surface of the fuel due to radial relocation.
This model applies once at the beginning of the calculation, the axial relocation is also
considered as dependent by the ratio free volume/total pellet volume, the axial forces and the
radial relocation. This option is strictly correlated with the number of cracks (NCRACK input
variable); as usual, this number range between 4-6 (recommended range).
Option 2, keyword IRELOC = 2. It is the original KWU-LWR model (calibration 1976) [8][63]
.
This model relies on the following equation:
urel
= 0.35* go/ro Eq. 38
The model is similar to IRELOC 5.
Option 3, keyword IRELOC = 3. It is the GAPCON-THERMAL-3 model. This model calculates
the radial deformation due to relocation urel only. It implements the GAPCON-
THERMALIII[8][63]
correlation:
urel
= (42*b/(1+b) + 0.274q + 3) * go /100/ro
b = e(-4+bu^0.25)
Eq. 39
where:
go is the as fabricated gap size normalized to the as fabricated pellet outer radius;
q is the linear power [kW/m],
bu is the local burn-up [MWd/kgU].
This model applies only when gap is open and does not consider axial relocation.

Ricerca Sistema Elettrico
Sigla di identificazione
ADPFISS – LP2 – 041
Rev.
0
Distrib.
L
Pag. di
75 170
Option 4, keyword IRELOC = 4. This is the “Operational relocation model according to Eberle
and Stackmann”, (calibration 1997). It differs from the others: it takes into account the actual
value of the gap without relocation according to the KWU equation [8][63]
:
urel
= a[1 – e-S/Df*a] Eq. 40
where:
S is the difference between the actual cladding inner diameter dc (thermal expansion,
elastic and creep strains included) and the un-cracked pellet diameter Df (allowing the
thermal expansion, swelling and densification);
a is equal to 0.0234 / 0.0164 for UO2 and UO2/PuO2 respectively (constant that takes into
account Pu).
Relocation is considered also in the axial direction as a factor applied to radial relocation.
Option 5, keyword IRELOC = 6. It is the operational relocation model according to Eberle and
Stackmann, implicit formulation of model number 4.
Option 6, keyword IRELOC = 8. It is assumed as reference. It is the modified FRAPCON-3
model. This model considers as fabricated gap, linear power and burn-up. The model applies
only if gap is open and does not consider relocation in the axial direction. It is based on these
equations:
urel
= 30+pfactor1+(10+pfactor2)*fbu Eq. 41
Pfactor1 = (q-20)*0.1
Pfactor2 = (q-20)*0.4
fbu = bu*0.2 if bu <5MWd/kgU
fbu = 12 if bu ≥5MWd/kgU
where:
bu is the burn-up [MWd/kgU];
q is the linear power.
5.2.4 Modeling of fuel swelling
Swelling is defined as the fractional increase in the volume of the solid with respect to the initial
volume Vo of the as-fabricated fuel [8]
, or by:
[ΔV/V](t) = (V(t) – Vo)/Vo Eq. 42
Fuel swelling takes into account of two terms: solid swelling and gaseous swelling:
ΔV/V = (ΔV/V)sol
+ (ΔV/V)gas
Eq. 43
the fractional increase in the volume due to swelling is expressed via swelling strains εswe,i (i = r, t, a =
radial, tangential, axial):
εswe,i(t) = εswe,i(t0) + Δεswe,itot Eq. 44
Δεswe,itot
= f[Δ(ΔV/V)] Eq. 45

Ricerca Sistema Elettrico
Sigla di identificazione
ADPFISS – LP2 – 041
Rev.
0
Distrib.
L
Pag. di
76 170
With f = 1/3 if the swelling rate can be considered isotropic.
TRANSURANUS code includes several correlations to considering the UOX fuel swelling in LWRs
and the MOX fuel swelling in FBR. The first are correlations 18, 19, 20 (recommended), 21. The
second are correlations 3, 11, 12 and 13. They are selected by mean of the option MODFUEL(j=4).
Option 1, keyword MODFUEL(j=4) = 20. It is assumed as reference. It is the standard
correlation for UOX fuel swelling in LWRs developed by K. Lassmann [8]
from correlation 19
in which gaseous swelling contribute was modified and integrated from this steady state
equation:
(ΔV/V)gas
= c*a(T)/k *(1-e-k*bu
) Eq. 46
where:
(ΔV/V)gas
fractional gaseous swelling;
c, a(T), k are model parameters (c depends on stress, a from temperature).
Integration of previous equation is done in this manner:
Δ(ΔV/V)gas
= Δ(ΔV/V)gas
max * (1-eΔt/τ
) Eq. 47
where:
Δ(ΔV/V)gas
increment of fractional increase in volume due to gaseous FPs in a time step
with a burn-up increment Δbu;
Δ(ΔV/V)gas
max is defined as Δ(ΔV/V)gas
max = (ΔV/V)gas
n+1 - (ΔV/V)gas
n;
n,n+1 are related respectively to time tn and time tn+1;
τ is the time constant = 1/D;
D is the diffusion coefficient.
Solid swelling was considered as follow:
Δ(ΔV/V)sol
= B*Δbu Eq. 48
where:
Δbu is the burn-up increment during time step Δt = tn+1
- tn;
Δ(ΔV/V)sol
is the increment of fractional increase in volume due to solid FPs in a time step
with a burn-up increment Δbu;
B is a model parameter.
Option 2, keyword MODFUEL(j=4) = 18. This simple correlation gives the total swelling rate
for UOX fuel in LWRs including matrix swelling due to solid and gaseous fission products[8]
.
The increment of the fractional volume increase is expressed as rate equation:
Δ(ΔV/V) = S*Δbu Eq. 49
where:
S is equal to 7*10-7
[tonU/MWd], it is the swelling constant rate.
This equation takes into account only for solid swelling therefore it is recommended for normal
operation.

Ricerca Sistema Elettrico
Sigla di identificazione
ADPFISS – LP2 – 041
Rev.
0
Distrib.
L
Pag. di
77 170
Option 3, keyword MODFUEL(j=4) = 19. It is the original MATPRO swelling model for UOX
fuel in LWRs[8]
. The swelling due to solid fission products is simply proportional to the burn-
up while the gaseous swelling correlation is more complicated and depends on burn-up, burn-
up increment (burn-up during a given time step) and temperature T:
Δ(ΔV/V)sol
= b*Δbu
Δ(ΔV/V)gas
= a(T)*e-k*bu
*Δbu
Eq. 50
where:
a, b, k are models parameters.
Option 4, keyword MODFUEL(j=4) = 21. It is the implicit formulation of correlation 20.
Option 5, keyword MODFUEL(j=4) = 3. This correlation was proposed by Dienst et al[64]
specifically for FBR MOX fuel design purposes. The increment of the fractional volume
increase is expressed by:
Δ(ΔV/V) = S*Δbu Eq. 51
where:
S is the swelling rate related to the burn-up increase;
Bu burn-up increment during current time step;
The total increment of the swelling strain Δε in radial, tangential and axial direction is
computed as:
Δε = S*Δbu/3 Eq. 52
S=0.012 (open gap)
S=0.0065 (closed gap)
The gaseous swelling is nil if gap is closed, its contribution is computed as:
Δ(ΔV/V)gas
= (S-0.0065) * Δbu Eq. 53
Option 6, keyword MODFUEL(j=4) = 11. This correlation is given by Pesl et al.[65]
for FBR
MOX fuel. The increment of the fractional volume increase is expressed by:
Δ(ΔV/V) = S*Δbu Eq. 54
where:
S is the swelling rate related to the burn-up increase;
Bu burn-up increment during current time step.
The total increment of the swelling strain Δε in radial, tangential and axial direction is
computed as:
Δε = S*Δbu/3 Eq. 55

Ricerca Sistema Elettrico
Sigla di identificazione
ADPFISS – LP2 – 041
Rev.
0
Distrib.
L
Pag. di
78 170
S=0.020 (open gap)
S=0.0065 (closed gap)
The gaseous swelling is nil if gap is closed, its contribution is computed as:
Δ(ΔV/V)gas
= (S-0.0065) * Δbu Eq. 56
Option 7, keyword MODFUEL(j=4) = 12. This correlation is based on the work of
Zimmermann[66]
and of Dienst et al.[64]
and was developed by K. Lassmann. The increment of
the fractional volume increase in FBR MOX fuel is expressed by:
Δ(ΔV/V) = S*Δbu Eq. 57
where:
S is the swelling rate related to the burn-up increase;
Bu burn-up increment during current time step.
The total increment of the swelling strain Δε in radial, tangential and axial direction is
computed as:
Δε = S*Δbu/3 Eq. 58
S=0.0065 if T<926.85°C,
S=9.67000E-04*exp(2.05727E-03) if 926.85<T<1600°C,
S=9.70024E-04*exp(4.93355E-03) if 1600<T<2000°C,
S=0.187 if T>2000,
if the gap is open;
S=0.0065
if the gap is closed.
The gaseous swelling is nil if gap is closed, its contribution is computed as
Δ(ΔV/V)gas
= (S-0.0065) * Δbu Eq. 59
Option 8, keyword MODFUEL(j=4) = 13. This correlation is based on the work of Dienst et
al.[64]
and was suggested by Preußer for FBR MOX fuel. The increment of the fractional
volume increase is expressed by:
Δ(ΔV/V) = S*Δbu Eq. 60
where:
S is the swelling rate related to the burn-up increase;
Bu burn-up increment during current time step.
The total increment of the swelling strain Δε in radial, tangential and axial direction is
computed as:
Δε = S*Δbu/3 Eq. 61

Ricerca Sistema Elettrico
Sigla di identificazione
ADPFISS – LP2 – 041
Rev.
0
Distrib.
L
Pag. di
79 170
S=0.020
if bu < 1 at.% and if the gap is open,
S=0.012
if bu > 1 at.% and if the gap is open,
S=0.0065
if the gap is closed.
The gaseous is nil if gap is closed, its swelling contribution is computed as:
Δ(ΔV/V)gas
= (S-0.0065) * Δbu Eq. 62
5.2.5 Modeling of fuel densification
There are several options available in TU to account for densification[8]
. They are selected by the
keyword IDENSI. The models applicable to LWR are:
Option 1 keyword IDENSI 2: empirical model for LWR and FBR. This model needs:
o the input of the minimum porosity DENPOR at the end of thermal irradiation induced
densification and
o the time constant DENBUP (burn-up in MWd/tU, at which irradiation induced
densification is terminated).
Option 2 keyword IDENSI 3: Assmann-Stehle model[67]
for UO2 in a LWR. This model needs
several input data:
o PFEIN (initial porosity of fine pores),
o PGRO1 (fabrication porosity of coarse pores, Class 1),
o PGRO2 (fabrication porosity of coarse pores, Class 2),
o PGRO3 (fabrication porosity of coarse pores, Class 3),
o RGRO1 (fabrication radius of the coarse pores, Class 1 [mm]),
o RGRO2 (fabrication radius of the coarse pores, Class 2 [mm]),
o RGRO3 (fabrication radius of the coarse pores, Class 3 [mm]) and
o DENPOR.
Option 3 keyword IDENSI 7: MATPRO LWR models FUDENS/FHOTPS. This model needs
the input of the minimum porosity DENPOR at the end of thermal and irradiation induced
densification. According with the TU manual this model option is not yet fully tested.
Reference model implemented The reference model implemented is IDENSI 2 in which densification is treated according with this
empirical correlation[8]
:
P(bu) = P∞ + (P0 - P∞)* e-(5bu/bu0)
Eq. 63
where:
P(bu) is the sinter porosity;
P∞ represents the minimum porosity (input data DENPOR);
P0 is the fabrication porosity (input data POR000);
bu is the average burn-up in a section or slice;
bu0 is the burn-up at which densification ends (input data DENBUP).
5.2.6 Modeling of fuel grain growth
In this activity grain growth is considered, the model is developed according to Ainscough equation:

Ricerca Sistema Elettrico
Sigla di identificazione
ADPFISS – LP2 – 041
Rev.
0
Distrib.
L
Pag. di
80 170
dGRgr/dt = k[(1/GRgr ) +(1/GRMAX)] Eq. 64
At fixed temperature the maximum grain size is fixed to:
GR max = 2.23*e-7620/T
Eq. 65
Grain growth between two times is treated as:
GR tn+1 = {GR tn + [6.192*1013*Δt*e-min(46524/T,60)
]/(4*GR tn) } Eq. 66
where:
Δt time step width (tn+1 - tn);
GR grain size;
T [K] temperature;
tn time n;
tn+1 time n+1.
The grain growth phenomenon affects the fission gas release in three ways. First of all, grain boundary
sweeping provides another mechanism for the collection of the fission gas at these internal surfaces
from which release can occur. This effect is taken into account by adding a supplementary fractional
release term (f) from the matrix to the grain boundaries that is equal to the volume fraction of the fuel
swept by the moving boundaries:
f = (rn+13
– rn3)/ rn
3 Eq. 67
Secondly, the diffusion distance for the fission gas atoms created in the grains increases. Unlike the
first consequence this tends to reduce the release rate. Thirdly, the grain growth also reduces the
capacity of the grain boundaries for storing fission gas as their total surface-to-volume ratio is
decreasing.
5.2.7 Modeling of gap conductance
The fuel-cladding temperature difference Δθf,cl is defined by:
Δθf,cl = q''f,cl /h Eq. 68
where:
q''f,cl is the heat flux density between fuel and cladding, it is defined as q''f,cl = = q'/2*π*rf0;
q' is the linear power;
rf0 is the outer fuel radius;
h represents the heat transfer coefficient between fuel and cladding (gap conductance).
The heat transfer coefficient h depends on:
gap width or contact pressure between fuel and cladding;
gas pressure and composition;
surface characteristics of cladding and fuel;
The gap conductance model incorporated in the TRANSURANUS code is the well-documented
URGAP model. The original URGAP model from 1979 was revised and recalibrated in 1986 using an
extended database consisting of approximately 1000 data. Four options are available in TU to simulate
gap conductance [8]
they are labeled as IHGAP:

Ricerca Sistema Elettrico
Sigla di identificazione
ADPFISS – LP2 – 041
Rev.
0
Distrib.
L
Pag. di
81 170
Option 1 keyword IHGAP 0: standard Option gas Bonding thermal conductivity of mixture
according to Lindsay and Bromley. Accommodation coefficients are taken into account;
Option 2 keyword IHGAP 1: gap conductance is prescribed; no call of URGAP-Model;
Option 3 keyword IHGAP 3: as standard option but without considers accommodation
coefficients;
Option 4 keyword IHGAP 4: specific model gas bonding, thermal conductivity of mixture
according to Tondon and Saxena. Accommodation coefficients are taken into account;
Option 5 keyword IHGAP 5: as option 4, accommodation coefficients are not taken into
account.
Reference model implemented In 1991, the TRANSURANUS standard LWR thermal conductivities of the fuel and the cladding were
modified[8]
. The new correlation for Zircaloy gives approximately 10% higher values, whereas the
thermal conductivity of the fuel has not changed significantly. Nevertheless, it was felt that the
extremely sensitive gap conductance model, which depends on these material properties, should be
refitted. All four model options, i.e. IHGAP = 0, 3, 4 and 5 were fitted individually and finally the
URGAS model option IHGAP = 0 was chosen as recommended.
5.2.8 Modeling of cladding creep
Creep causes a radial contraction of the cladding due to the external pressure. This affects the gap size
evolution and therefore the maximum fuel temperature. The standard option (no other models are
available in the code) for Zircaloy cladding creep is assumed in the reference calculations. This
correlation calculates the effective creep rate according to the Lassmann-Moreno model[8]
. It considers
two components of steady state creep as thermal creep and dislocation climb:
ε•eff = ε
•th + ε
•climb Eq. 69
ε•th = 1.083∙10
5∙e
(-1700/T) sinh(σeff/60) Eq. 70
ε•climb = 1.0885∙10
-28∙σeff 4∙Φ + 4.2466∙10
-23∙σeff∙Φ Eq. 71
where
ε•eff is the effective strain rate [1/h];
ε•th is the thermal strain rate [1/h];
ε•climb is the strain rate due to irradiation enhances dislocation climb creep [1/h];
σeff is the effective stress [MPa];
T is the temperature [K];
Φ is the fast neutron flux [n/(cm2∙s)].
The thermal component is depending on the clad temperature and the effective stress while, the climb
component, depends upon the neutron fast flux and the effective stress.
5.2.9 Modeling of Helium release
In order to simulate the behavior of He in the fuel, both an intra-granular and an inter-granular
transport model have been implemented in TU-code. Three different models can be selected to
compute the Helium diffusion inside grains. The option iHe = 1 should be used standard, it is based on
the fit of the diffusion coefficients reported in the review of Federici et al.[68]
. The option iHe = 2 is a

Ricerca Sistema Elettrico
Sigla di identificazione
ADPFISS – LP2 – 041
Rev.
0
Distrib.
L
Pag. di
82 170
lower limit of the data of Federici et al., while iHe = 3 is the correlation proposed by Ronchi and
Hiernaut[69]
.
The inter-granular He model depends on the inter-granular behavior of fission gases and has thus been
included in the fission gas grain boundary models (Grbdm1, Grbdm2 and Grbdm3). The model
considers that if the temperature is higher than 800°C, Helium reaching the grain boundary is
instantaneously released. If the temperature is lower than 800°C, He is trapped at the grain boundary
until the saturation concentration of fission gases is reached.
The main assumption of the intra-granular module is the treatment of the trapping and resolution in
equilibrium (i.e., adopting an effective diffusion coefficient) and the grain boundary as a perfect sink
(i.e., same assumptions of Federici et al. (2007) and TU fission gas release model). The intra-granular
behavior is then modeled by a diffusion equation inside a spherical grain and considering an effective
diffusion coefficient (Deff, m2/s). The approach is the same of ordinary fission gas diffusion.
∂CHe/∂t = Deff∙[∂2CHe/∂r
2 + (2/r)∙∂CHe/∂r] + He Eq. 72
CHe (ts, r=a) = 0 Eq. 73
where r is the radial coordinate, CHe (mol/m3), the concentration of helium inside the grain, He
(mol/m3s) the helium production rate and ts (s) the time.
The three options available provide different values of Deff that are reported below:
iHe = 1: Deff∙= 8.887*10-14
* exp(-17505.9/T) Eq. 74
iHe = 2: Deff∙= 1.405*10-12
* exp(-17505.9/T) Eq. 75
iHe = 3: Deff∙= 8.000*10-7
* exp(-23163.5/T) Eq. 76
However, the last one is an atomic diffusion coefficient derived from the interpretation of the
experimental data by means of a more complex model, which takes into account trapping and
resolution separately. Furthermore it is representative of a 238
Pu MOX doped fuel, where the self-
irradiation is expected to have a role in the enhancement of the diffusion coefficient. For these reasons
it should be used only as a conservative test case.
5.3 Summary of the reference models
The main models and correlations that may impact on the simulation of the FGR assumed to develop
the reference input deck are reported in Tab. 15 distinguishing among the correlation model related to
fuel pellet, gap, cladding and fission gas release. The criteria adopted in devolving the reference input
decks are:
choice of models or correlations recommended in the TU handbook version 2012 (when
indicated);
choice of models or correlations implemented as usual (if no recommendation are given in the
handbook).

Ricerca Sistema Elettrico
Sigla di identificazione
ADPFISS – LP2 – 041
Rev.
0
Distrib.
L
Pag. di
83 170
PRIMO & IFA-597 Reference input decks
Parameter
Reference
Option Description Other
options
Fuel
conductivity
Correlation 31
(recommended)
Van Uffelen and Schubert best estimate, it takes into account the fuel temperature, burn-up, the High Burn-up
Structure (HBS) and the porosity.
32, 33, 34,
35.
Fuel swelling Correlation 20
(recommended)
Developed by K. Lassmann from correlation 19. The
gaseous swelling contribute was modified and integrated
from this steady state equation considering the local contribute of the burn-up, the temperature, the stress and
the diffusion coefficient.
18, 19, 21, 3,
11, 12, 13
Pellet
fragment
relocation
Model ireloc 8 Modified FRAPCON-3 model. It considers the as
fabricated gap size, the burn-up and the linear heat rate.
2, 3, 4,
5, 6
Fuel grain
growth
Model igrnsz 1
(recommended)
Grain growth model of Ainscough and Olsen. It computes
the grain radius increase as function of the fuel local temperature assuming a maximum grain radius for each
temperature.
--
Fuel
densification
Model idensi 2
(recommended)
Empirical model for LWR and FBR. This model needs the input of the minimum porosity DENPOR at the end of
thermal and irradiation induced densification and the time
constant DENBUP (burn-up in MWd/tU, at which irradiation induced densification is terminated).
3, 7
Gap
conductivity
Model ihgap 0
(recommended)
Standard Option: gas Bonding thermal conductivity of
mixture according to Lindsay and Bromley.
Accommodation coefficients are taken into account
1, 3, 4, 5
Cladding
creep
Correlation 20
(recommended) Effective creep rate according to the Lassmann-Moreno --
Fission gas
release
Models: fgrmod6
(recommended),
igrbdm3,Idifsolv0
FGRMOD 6: URGAS algorithm with the diffusion coefficients of Hj. Matzke (thermal) and a constant
athermal diffusion coefficient.
IGRBDM 3: New model developed according to modified Koo model for ramps simulations
IDIFSOLV 0: Diffusion equation is solved by the URGAS-
algorithm
Fgrmod: 4,9
Igrbdm: 0, 1, 2
Idifsov:
1, 2, 3 4,5,6
Helium
release
iHe = 0 Helium release not computed. iHe: 1, 2, 3
Tab. 15 – PRIMO Program & IFA-597, summary of models and correlations assumed in the reference
that may impact on the FGR simulation.

Ricerca Sistema Elettrico
Sigla di identificazione
ADPFISS – LP2 – 041
Rev.
0
Distrib.
L
Pag. di
84 170

Ricerca Sistema Elettrico
Sigla di identificazione
ADPFISS – LP2 – 041
Rev.
0
Distrib.
L
Pag. di
85 170
6 Validation of TU code against PRIMO experiment
6.1 Reference results
The assessment of TU code in simulating rod BD8 is discussed in the following subsections. The
analysis deals with the comparison between measured and predicted trends (burn-up, FGR, grain size,
dimensional changes and clad integrity). The main results are presented from Fig.28 to Fig.36 and are
summarized in Tab. 16.
6.1.1 Burn-up analysis
In order to demonstrate the consistency of any calculation, it is essential to predict the burn-up in a
correct way. In fact, this first step implies to demonstrate that the fuel rod is analyzed under conditions
that represent its state at the end of the experiment. In addition, part of the models of any fuel pin
mechanic code are dependent upon the burn-up and therefore it should be verified that those models
are taking into account the burn-up effects according to the experimental conditions achieved.
The measured burn-up at the end of the experiment is available in the database[10]
including its
uncertainty (±6%). TU code models the burn-up according to the “TRANSURANUS-LWR burn-up
model”[70]
. Fig.28 and Tab. 16 summarize the results. The final value of the burn-up is well captured.
6.1.2 FGR analysis
The experimental FGR after the power ramp is estimated assuming a gas (Xe + Kr) generation rate of
30 cm3
(STP)/MWd. The fraction of the gas released after the base irradiation is estimated on the basis
of the FGR of the sibling rod BD10. The measurement uncertainty is assumed 2% after base
irradiation and 10% after the power ramp.
The reference calculation solves the intra-granular diffusion equation by means of the URGAS
algorithm with the diffusion coefficient modeled according to Matzke plus a constant to simulate it’s
a-thermal part. For the inter-granular fission gas behavior, the modified Koo model developed for
power ramps is applied; all these models are described in detail in section 5.1.
The simulated trends are depicted in Fig.29 and Fig.31 for the base irradiation and the power ramp,
respectively. Each figure reports:
The simulated FGR trend,
The measured FGR at the end of the BI or AR with their uncertainties,
The simulated fuel centerline temperature in the peak axial position,
The Vitanza threshold[71]
for 1% of gas release,
The thresholds above which equiaxed and columnar grain growth are effective,
The thresholds for a-thermal and thermal intra-granular gas diffusion.
Fig. 30 and Fig.32 highlight the linear heat rate and the fuel-cladding gap size. Both these parameters
are strictly related to the fuel temperature and therefore are essential asses the fission gas release.
The base irradiation can be divided into two main phases. In the first phase (0 - 6000 h), the fuel rod
experiences the highest linear power (see Fig. 30). In addition, due to the influence of densification
phenomena and relatively low contribution of relocation and swelling, the pellet to cladding gap
remains large leading to the highest fuel central temperature experienced in the base irradiation (see
Fig.29 and Fig. 30). Nevertheless, even in the power peak, it remains below or close to the Vitanza
temperature threshold causing a relatively low fractional fission gas release up to 0.51 %, Fig.29. In
Ricerca Sistema Elettrico
Sigla di identificazione
ADPFISS – LP2 – 041
Rev.
0
Distrib.
L
Pag. di
86 170
the second phase, the linear heat rate tends to decrease and the gap tends to reduce (because of the end
of densification and the increase of relocation and swelling contributes). Due to these facts, the fuel
temperature decreases and the rod undergoes steady-state operation for about 12000 h. The FGR value
slightly increases and stabilizes around its final value of 0.57 %. Even if the simulated FGR results
overestimated (0.47% was measured in the experiment), the Vitanza threshold is never exceeded and
the contribution to fission gas diffusion is mainly due to a-thermal processes (that dominates around
and below 1000°C). In conclusion, the steady state operation can be considered as well captured, Tab.
16.
The ramping phase can be divided into two phases: the preconditioning and the power ramp. In the
preconditioning phase a peak LHR of 18.9 kW/m is achieved and kept constant for 20 hours. In this
phase, the fission gas release does not occur and the gap is opened, Fig.31 and Fig.32. When the ramp
starts, the peak linear power reaches 39.5 kW/m with a fast rate of increase (462 kW/m h) and the fuel
central temperature grows rapidly above the Vitanza threshold, up to 1800°C. According to the
modified Koo inter-granular model, during this last phase, the conditions for the complete “venting” of
the fission gas trapped at the grain boundaries are met (fast power transient and high fuel temperature,
as explained in section 5.2). Furthermore, the high temperature enhances the thermal intra-granular
diffusion mechanism, which is more effective than a-thermal diffusion and causes fast growth of the
gas fraction that reaches the grain boundaries. The experimental value measured during PIE was 11.24
%. The final value provided by the simulation is 7.64 %. Although the result is underestimated it can
be considered acceptable. Tab. 16 summarizes the results.
6.1.3 Grain size analysis
The grain dimension is subjected to increase with the fuel temperature. In particular, the
recrystallization temperature represents the limit between equal-axial grain increase and columnar
grain increase. This last phenomenon produces large deformation within the pellet center
(restructuring). The assessment of this parameter is connected with the simulation of the fuel centerline
temperature during the ramping phase.
No precise experimental data on metallographic examinations were included in the database. Only the
radius at which the grain growth phenomenon is observed during PIE (40% of fuel pellets radius) and
the mean grain size in that region (axial and radial average value) is given.
TU code models the grain growth according to Ainscough and Olsen[8]
(see section 5.2.6). As shown
in Fig.31, during the power ramp, the fuel central temperature exceeds the first of these thresholds.
Thus, grain growth in the central fuel region is observed (Fig.33), the simulations qualitatively fit the
experimental trends, Tab. 16.
6.1.4 Deformation analysis at the end of the BI
Cladding and fuel column length change and cladding diameter creep down were measured after base
irradiation.
The fuel elongation depends upon the burn-up, the fuel densification, the swelling, and the relocation.
During the initial phase, the fuel pellets are predicted to shrink because of densification that occurs
between 0 and 5000 hours, Fig.34 and Tab. 16. Beyond 5000 hours the length of the fuel column
grows because of solid and gaseous swelling. The overall effect at the end of base irradiation is a fuel
column shrinkage. As shown in Fig.34, TU code over-predicts the fuel shortening (-2.58 mm whereas
the experimental value is -1.34 mm).

Ricerca Sistema Elettrico
Sigla di identificazione
ADPFISS – LP2 – 041
Rev.
0
Distrib.
L
Pag. di
87 170
Cladding irradiation growth occurs because of cladding swelling and creep under a given neutron fast
fluence. TRANSURANUS code calculates the contribution to axial swelling due to fast neutrons
according to the Duncombe model (1970). The Duncombe model calculates the strain due to swelling
in three direction on the basis of an exponential function with different fitting constant (depending on
the direction). The measured axial growth is 2.10 mm; the code underestimates this phenomenon and
predicts a cladding lengthening of 1.39 mm. The comparison between simulated and experimental data
is shown in Fig.34 and Tab. 16.
Creep is defined as a time dependent change in dimension of any material (in this case, of the cladding
component) under a prolonged stress that is below the yield stress. Thermal and irradiation creep lead
to cladding diametric shrinkage (due to coolant pressure that exceeds inner rod pressure). The cladding
diameter decrease (referred as “creep-down”) provides a partial geometrical characterization of the gap
status during the base irradiation (for the complete characterization, the pellet expansion is necessary).
Cladding diametric shrinkage due to creep down is computed according to the Lassmann-Moreno
model[72]
. The experimental cladding diameter reduction at the linear power peak after BI is 30.3 μm
while the code predicts 37.1. The axially averaged cladding creep down was 15.2µm according to the
experimental measurement while the code predicted 17.7µm. Both the results obtained through the
simulation are consistent with the experimental data and their value fall within the measurement
uncertainty. The comparison between simulated and experimental data is shown in and Tab. 16
According to the code simulation, the pellet-cladding gap remains open during the base irradiation.
This result is in accordance with the observation of the BD8 rod after base irradiation. In fact no pellet-
cladding mechanical interaction was observed.
6.1.5 Parametrical determination of the failure threshold
In LWR with self standing cladding, the compressive stress experienced by the cladding due to the
primary fluid pressure, is reversed to a tensile stress induced by continuing fuel thermal expansion,
relocation and swelling, when the fuel cladding gap has closed. The increase of the cladding stress,
especially in the region of the pellet ridges, and in presence of aggressive fission products (e.g.
cesium-iodine), may lead to stress corrosion induced cladding failure in the case of power ramps. The
cladding failure due to crack propagation, so-called PCI/SCC phenomena, leads to an unwanted
contamination of the primary water. The PCI is thus a complex phenomenon, which depends on many
parameters and mechanisms connected with the design of the fuel rod and the operative conditions
experienced during the irradiation, including the power ramp occurrence[73][74]
.
1. The design parameters involve: the rod geometry, the oxygen to metal ratio, the pellet and
cladding fabrication processes, the pellet mechanical treatments (i.e. chamfering), the gas
plenum geometry, the fuel grain size, the cladding heat treatment and inner coating.
2. The effects of the irradiation on the fuel rod can be distinguished as following:
a. the fuel pin behavior is affected by the gaseous and solid fission products formation and
swelling, the evolution of the fuel thermal conductivity, the pellet cracking and
fragment relocation, the grain growth, the pellet creep, the thermal expansion and hot-
pressing, the densification, the burn-up and the fission gas release (FGR).
b. the cladding behavior is influenced by: the swelling due to neutron fluence in the high-
energy spectrum, the creep parameters, the oxidation, the hydridation and the
susceptibility to change its thermo-mechanical properties under prolonged irradiation.
c. the fuel pin-cladding gap is dependent, besides the modifications above, by the actual
size and conductance, the pressurization, and the gas composition (OECD/CSNI).
3. Finally, the transient perturbation induced by ramps mainly affects the rod integrity. The power
terminal level and excursion as well as the power rate of increase, the coolant temperature at

Ricerca Sistema Elettrico
Sigla di identificazione
ADPFISS – LP2 – 041
Rev.
0
Distrib.
L
Pag. di
88 170
which the transient occurs and its duration determine the rod mechanical performance of a
given type of rod (design) subjected to a given irradiation history.
According to the PRIMO experiment final report[10]
the rod BD8 remained intact at a RTL of 39.5
kW/m; nor it is predicted to fail in the simulations. In this analysis the failure threshold is obtained by
fictitious change of the ramp terminal level. This value is progressively increased until the code detects
the fuel rod rupture: 47.4 kW/m. The results are reported in Tab. 17. The failure threshold seems
consistent with similar ramp test experiments conducted on LWR UO2 and MOX fueled rods, Fig.36.

Ricerca Sistema Elettrico
Sigla di identificazione
ADPFISS – LP2 – 041
Rev.
0
Distrib.
L
Pag. di
89 170
PRIMO MOX
Design data
Parameter Unit Quantity
Rod Id -- BD8
Fuel – clad material -- MOX – Zr-4
U235
enrichment %HM 5.246
Pu239
enrichment %HM 7.630
Fuel average grain size μm (3D) 7.8
Rod outer diameter mm 9.500
Gap width mm 0.100
Pellet outer diameter mm 8.041
Active length mm 1004.7
He filling pressure bar 20
Ramp test data
Parameter Unit Quantity
Conditioning level kW/m 18.9
Ramp terminal level kW/m 39.5
Ramp rate kW/m-h 462
Holding time hrs 20
Reference analysis
Parameter Uncertainty Exp TU calc Error % Acceptability
range
Burn-up (MWd/kgHM) ±6% 30.1 29.81 -0.1 ±10%
FGR after BI ±2% 0.47% 0.51% +8.5 +100% / -50%
Fuel elongation after BI ±0.5 mm -1.34 mm -1.39 mm -3.6 ±0.5 mm
Clad elongation after BI ±0.5 mm 2.10 mm 2.59 mm +18.9 ±0.5 mm
Clad creep down after BI at
axial peak (radial) ±5 µm 30.3 µm 37.4 µm +25.8 ±5 µm
Clad creep down after
BI,average (radial) ±5 µm 15.5 µm 17.7 µm +14.2 ±5 µm
FGR after ramp ±10% 11.24% 7.64% -4.6 +100% / -50%
Grain size analysis AR -- -- -- -- --
Clad integrity AR -- NF NF -- --
Tab. 16 – PRIMO Program, summary of reference analysis.
RUN RTL F/NF End of PR
FGR % Error %
Ref. RTL 39.5 NF 7.64 -31.8
RTL +5% 41.5 NF 11.16 -3.6
RTL +10% 43.5 NF 13.49 +20.4
RTL +15% 45.4 NF 15.53 +38.7
RTL +20% 47.4 F 17.53 +56.5
Tab. 17 – PRIMO Program, rod BD8, sensitivity analysis on RTL and failure threshold, results and
relative errors.

Ricerca Sistema Elettrico
Sigla di identificazione
ADPFISS – LP2 – 041
Rev.
0
Distrib.
L
Pag. di
90 170
Fig.28 – PRIMO Program, rod BD8, burn-up analysis.
Fig.29 – PRIMO Program, rod BD8, fission gas release analysis, base irradiation.

Ricerca Sistema Elettrico
Sigla di identificazione
ADPFISS – LP2 – 041
Rev.
0
Distrib.
L
Pag. di
91 170
Fig. 30 – PRIMO Program, rod BD8, linear power and gap width in peak axial position, base
irradiation.
Fig.31 – PRIMO Program, rod BD8, fission gas release analysis, power ramp.

Ricerca Sistema Elettrico
Sigla di identificazione
ADPFISS – LP2 – 041
Rev.
0
Distrib.
L
Pag. di
92 170
Fig.32 – PRIMO Program, rod BD8, linear power and gap width in peak axial position, power ramp.
Fig.33 – PRIMO Program, rod BD8, grain growth analysis.

Ricerca Sistema Elettrico
Sigla di identificazione
ADPFISS – LP2 – 041
Rev.
0
Distrib.
L
Pag. di
93 170
Fig.34 – PRIMO Program, rod BD8, fuel and cladding axial deformation (before ramp) analysis.
Fig.35 – PRIMO Program, rod BD8, fuel and cladding radial deformation (before ramp) analysis.

Ricerca Sistema Elettrico
Sigla di identificazione
ADPFISS – LP2 – 041
Rev.
0
Distrib.
L
Pag. di
94 170
Fig.36 –PCI-SCC failure threshold, comparison with similar ramp tests.
0
10
20
30
40
50
60
70
0 5 10 15 20 25 30 35 40 45 50
Ra
mp
ter
min
al
lev
el [
kW
/m]
Burn-up [MWd/kg]
PWR-SR-exp-NF PWR-SR-exp-F BWR-IR-exp-NFBWR-IR-exp-F BWR-SR-exp-NF BWR-SR-exp-FPWR-SRX-exp-NF PWR-SRX-exp-F CNEA-MOX-exp-NFCNEA-MOX-exp-F Rod BD8-PRIMO MOX F -CALC

Ricerca Sistema Elettrico
Sigla di identificazione
ADPFISS – LP2 – 041
Rev.
0
Distrib.
L
Pag. di
95 170
6.2 Sensitivity analysis
The sensitivity analysis is a fundamental step for the assessment of the code capabilities. Different
objectives shall be fulfilled such as to demonstrate the robustness of the calculation, to characterize the
reasons for possible discrepancies between measured and calculated trends or values observed in the
reference calculation, to optimize code results and user option choices, to improve the knowledge of
the code by the user.
The investigation of the effect of the parameters, models and processes identified in section 5.1.2 on
the code result is carried out in this section. Tab. 18 lists the sensitivity analyses and their objectives.
They are divided into three groups: the investigations on models (labeled as M), the investigation on
correlations (labeled as C), and the investigation on the initial design conditions (labeled as D). This
list is not exhaustive since other model options might affect the code results (i.e. the gap conductance
model), as well as the uncertainties on the boundary conditions (i.e. the linear heat rate during the base
irradiation and the power ramp phase, the ramp rate, the extension of holding time of ramp terminal
level, the O/M etc..).
The development of the different sensitivities is hereafter reported in separate subsections
distinguishing between the different groups of homogeneous selections.

Ricerca Sistema Elettrico
Sigla di identificazione
ADPFISS – LP2 – 041
Rev.
0
Distrib.
L
Pag. di
96 170
Case Run Modification Objective
Fission gas
release
M1.1 Igrbdm 1 Investigate the impact of inter-granular models on fuel temperature and FGR.
Correlation according to the standard model
M1.2 Igrbdm 2 Investigate the impact of intergranular models on fuel temperature and FGR.
Correlation according to the temperature dependent model
M1.3 Igrbdm 1
FGRmod 4
Investigate the impact of intra-granular and inter-granular models on fuel temperature
and FGR. Inter-granular model according to the standard model and intra-granular
model of Matzke and White Tucker.
M1.4 Igrbdm 2
FGRmod 4
Investigate the impact of intra-granular and inter-granular models on fuel temperature
and FGR. Inter-granular model according to the temperature dependent model and
intra-granular model of Matzke and White Tucker.
M1.5 Igrbdm 3
FGRmod 4
Investigate the impact of intra-granular and inter-granular models on fuel temperature
and FGR. Inter-granular model according to the modified Koo model and intra-
granular model of Matzke and White Tucker.
M1.6 Igrbdm 1
FGRmod 9
Investigate the impact of intra-granular and inter-granular models on fuel temperature
and FGR. Inter-granular model according to the standard model and intra-granular
model of Turnbull.
M1.7 Igrbdm 2
FGRmod 9
Investigate the impact of intra-granular and inter-granular models on fuel temperature
and FGR. Inter-granular model according to the temperature dependent model and
intra-granular model of Turnbull.
M1.8 Igrbdm 3
FGRmod 9
Investigate the impact of intra-granular and inter-granular models on fuel temperature
and FGR. Inter-granular model according to the modified Koo model and intra-
granular model of Turnbull.
Fuel
conductivity
C1.1 Modfuel(j=6)=32 Investigate the impact of fuel conductivity on fuel temperature and FGR considering
O/M effects. Correlation according to Carbajo et al..
C1.2 Modfuel(j=6)=33 Investigate the impact of fuel conductivity on fuel temperature and FGR considering
O/M effects . Correlation according to Lanning and Beyer.
C1.3 Modfuel(j=6)=34 Investigate the impact of fuel conductivity on fuel temperature and FGR. Correlation
according to Wiesenack.
C1.4 Modfuel(j=6)=35 Investigate the impact of fuel conductivity on fuel temperature and FGR. Correlation
according to Van Uffelen and Schubert (conservative).
Pellet
fragment
relocation
M2.1 Ireloc 2 Investigate the impact of fuel relocation on fuel temperature, dimensional changes, gap
size and FGR. Original KWU-LWR model based on initial gap size only.
M2.2 Ireloc 3 Investigate the impact of fuel relocation on fuel temperature, dimensional changes, gap
size and FGR. GAPCON-THERMAL-3 based on initial gap size, LHR and burn-up.
M2.3 Ireloc 5 Investigate the impact of fuel relocation on fuel temperature, dimensional changes, gap
size and FGR. Modified KWU-LWR model based on initial gap size only.
Fuel swelling
C2.1 Modfuel(j4)=18 Investigate the impact of fuel swelling on fuel temperature, gap size, fuel elongation
and FGR. Simple correlation applied: swelling proportional to burn-up.
C2.2 Modfuel(j4)=19 Investigate the impact of fuel swelling on fuel temperature, fuel elongation and FGR.
Original MATPRO swelling model considering separate contributions of the solid and
gaseous fission products
C2.3 Modfuel(j4)=21 Investigate the impact of fuel swelling on fuel temperature, fuel elongation, gap size
and FGR. Implicit formulation of the reference correlation.
Fuel
densification M3.1 Idensi 7
Investigate the impact on FGR, fuel temperature, fuel elongation and gap width.
Original MATPRO densification model.
Fuel
density
D1.1 Density +1% TD Assess the impact on FGR and fuel centerline temperature of lower initial fuel porosity
corresponding to an increase of 1% TD of the initial fuel density.
D1.2 Density -1% TD Assess the impact on FGR and fuel centerline temperature of higher initial fuel porosity
corresponding to a decrease of 1% TD of the initial fuel density.
Grain size D2.1 1.25 Graindesign Assess the impact of 25% increased grains on FGR and fuel centerline temperature
D2.2 0.75 Graindesign Assess the impact of 25% decreased grains on FGR and fuel centerline temperature
Gap size
D3.1 Gap size 108μm Test the impact of increased gap width at the beginning of irradiation on fuel
temperature and FGR. Initial value obtained assuming maximum cladding and
minimum fuel radii according to design uncertainties.
D3.2 Gap size 93μm Test the impact of decreased gap width at the beginning of irradiation on fuel
temperature and FGR. Initial value obtained assuming minimum cladding and
maximum fuel radii according to design uncertainties
Tab. 18 – PRIMO Program, rod BD8, list of sensitivity analysis.

Ricerca Sistema Elettrico
Sigla di identificazione
ADPFISS – LP2 – 041
Rev.
0
Distrib.
L
Pag. di
97 170
6.2.1 Assessment of FGR models (runs M1)
This sensitivity analysis aims to assess the FGR models described in 5.2.1. Each intra-granular model
is associated with the inter-granular models to assess all the combinations[75]
. The results are
summarized in Tab. 19.
As explained in section 5.2.1, and Tab. 18, the intra-granular thermal diffusion model according to
Matzke and a-thermal diffusion according to White and Tucker is referred as FGRMOD4. The
reference thermal intra-granular diffusion model according to Matzke and a-thermal diffusion
according to ITU data is labeled as FGRMOD6 and; the thermal and a-thermal intra-granular diffusion
model according to Turnbull is referred as FGRMOD9.
The inter-granular models according to the standard model, the temperature dependent model and the
reference power ramp model derived from the Koo model are labeled, respectively, IGRBDM 1, 2 and
3.
It should be mentioned that, below 1200°C, the reference intra-granular diffusion coefficient
(FGRMOD6) is lower than FGRMOD4 and FGRMOD9 while above 1200°C, it becomes equal to
FGRMOD4. Assuming a power rating of 35W/g, above 1320°C, FGRMOD6 overpasses FGRMOD9.
This last coefficient is the highest up to 1320°C, Fig. 37.
Whatever is the model (both intra-granular and inter-granular), the simulations highlight no major
differences among the fuel centerline temperatures in the peak axial position. In particular, during the
main part of the base irradiation, the fuel maximum temperature remains below 1200°C (see Fig.29)
and therefore: FGRMOD6 < FGRMOD4 < FGRMOD 9, Fig. 37. Minor parts of the base irradiation
(at the beginning) experience 1200°C < T < 1320 °C (FGRMOD 4 = FGRMOD 6 < FGRMOD9) or T
> 1320 °C (FGRMOD 4 = FGRMOD 6 > FGRMOD 9). In conclusion, during the base irradiation,
FGRMOD9 predicts the maximum diffusion coefficient while FGRMOD 6 predicts the minimum
diffusion coefficient. On the other hands (see Fig.31), excepts for the conditioning phase and the initial
phase of the ramp test (in which FGRMOD6 ≤ FGRMOD4 < FGRMOD 9), the intra-granular
diffusion coefficient FGRMOD9 is the lowest one and FGRMOD6 = FGRMOD4, (Fig. 37).
The inter-granular models are presented in Fig. 38. During the base irradiation, the saturation
concentrations at grain boundaries to achieve FGR are: IGRBDM1 (FGRMOD 4-6) < IGRBDM2
(FGRMOD 4-6) < IGRBDM1 (FGRMOD 9) < IGRBDM2 (FGRMOD 9). Therefore, IGRBDM2
(FGRMOD 9) highlights the maximum grain boundaries concentration to achieve FGR while
IGRBDM1 (FGRMOD 4-6) highlight the minimum. The models IGRBDM 3 is equal to IGRBDM 1
since ramp conditions does not activates. Grain boundaries venting occurs in the ramp phase since
ramp conditions are achieved. IGRBDM 1 tends to overpass IGRBDM 2 because the fuel temperature
reaches 1800 °C.
FGRMOD4 is analyzed in Tab. 19 and in APPENDIX A (Fig. A. 1 and Fig. A. 2 base irradiation and
power ramp respectively). The inter-granular models IGRBDM1, 2 and 3 are compared to the
reference simulation. During the base irradiation there is no activation of the grain boundary venting
model, Fig. A. 1. This implies that IGRBDM1 (standard model) and IGRBDM3 (modified Koo model)
are coincident and they over-predict the FGR. Both the models apply constant saturation concentration
(1*10-4
μmol/mm2) to estimate the surplus of gas that reaches the grain boundaries. IGRBDM2 model
simulates lower FGR. This is because of the highest saturation concentration, Fig. 38. During the
power ramp, the Koo model (IGRBDM3) activates and FGR tends to increase with respect to the other
models, Fig. A. 2. IGRBDM1 and IGRBDM2 are not specifically developed for power transient
conditions and they under-predict the release due to the ramp. Should be noted that, compared to the

Ricerca Sistema Elettrico
Sigla di identificazione
ADPFISS – LP2 – 041
Rev.
0
Distrib.
L
Pag. di
98 170
base irradiation, the difference between IGRBDM1 and IGRBDM 2 reduces (it means that IGRBDM 2
releases more gas than IGRBDM 1 during the power ramp), because of inverted saturation
concentration, Fig. 38. In general, compared to the reference simulation, the intra-granular diffusion
coefficient FGRMOD4 is higher than FGRMOD6 (Fig. 37), and causes additional FGR, Tab. 19.
The reference model FGRMOD6 is assessed in Fig. A. 3 (base irradiation), Fig. A. 4 (power ramp) and
Tab. 19. The general considerations reported for FGRMOD4 applies to FGRMOD6 too excepts the
absolute values of the FGR that tends to reduce compared to FGRMOD4 because of lower intra-
granular diffusion coefficient, Tab. 19.
FGRMOD9 is analyzed in Fig. A. 5 and Fig. A. 6 (reported in APPENDIX A), and Tab. 19. During the
base irradiation, this model predicts the lowest FGR. This is connected to the highest saturation limits
that reduces the FGR (4*10-4
and 0.7092 mol/m2 respectively), Fig. 38. However, it should be noted
that the FGR evolution along the BI is different from the ones obtained with FGRMOD4 and
FGRMOD6. In particular, the trend is monotonically increasing while, in previous cases, it was related
to the LHR and the fuel temperature. The simulation of the power ramp highlights two different trends:
IGRBDM1 and IGRBDM2 still predict the lowest FGR while, on the other hand, IGRBDM3 (Koo
ramps model) predicts the highest fraction of fission gas released among the simulations, Tab. 19. This
is due to the irradiation enhanced thermal component of the diffusion coefficient that promotes large
accumulation of FG at the grain boundaries during the base irradiation and the initial part of the power
ramp test coupled with the cyclic deactivation of the saturation concentration limit (see section 5.2.1).
In the second part of the ramp, the diffusion coefficient of Turnbull becomes lower than that of Matzke
and the trend of FGR increases slower, Fig. A. 6. It can be concluded that FGRMOD9 intra-granular
model is not suitable for the simulation of power ramps.
The values at the end of the base irradiation and at the end of the power ramp predicted by the nine
different combinations of diffusion models are shown in Fig. 39 and Fig. 40 respectively.
PRIMO MOX Sensitivity analysis M1: FGR models
RUN End of BI
FGR % Error %
End of PR
FGR % Error %
Exp. FGR 0.47 -- 11.23 --
Ref. FGRMOD6, IGRBDM3 0.51 +7.84 7.64 -31.97 FGRMOD4, IGRBDM1 1.04 +54.59 7.46 -33.57 FGRMOD4, IGRBDM2 0.57 +16.96 7.24 -35.53 FGRMOD4, IGRBDM3 1.04 +54.59 9.86 -12.20 FGRMOD6, IGRBDM1 0.57 +17.40 6.99 -37.76 FGRMOD6, IGRBDM2 0.34 -36.63 6.83 -39.18 FGRMOD9, IGRBDM1 0.31 -50.16 4.04 -64.02 FGRMOD9, IGRBDM2 0.20 -57.44 3.99 -64.47 FGRMOD9, IGRBDM3 0.31 -50.16 15.98 +42.30
Tab. 19 – PRIMO Program, rod BD8, sensitivity analysis on FGR models ,results and relative errors.

Ricerca Sistema Elettrico
Sigla di identificazione
ADPFISS – LP2 – 041
Rev.
0
Distrib.
L
Pag. di
99 170
Fig. 37 – PRIMO Program, intra-granular diffusion coefficients as function of temperature.
Fig. 38 – PRIMO Program, rod BD8, sensitivity analysis on FGR models, gas saturation
concentration to release gas from grain boundaries as function of temperature.
0.E+00
1.E-04
2.E-04
3.E-04
4.E-04
5.E-04
6.E-04
7.E-04
8.E-04
9.E-04
1.E-03
1.E-03
1.E-03
1.E-03
1.E-03
2.E-03
Sa
tura
tio
n c
on
cen
tra
tio
n [
μm
ol/
mm
^2
]
Temperature [K]
igrbdm 1-FGRMOD 4-6
igrbdm2 - FGRMOD 4-6
igrbdm 1 - FGRMOD 9
igrbdm2 - FGRMOD 9

Ricerca Sistema Elettrico
Sigla di identificazione
ADPFISS – LP2 – 041
Rev.
0
Distrib.
L
Pag. di
100 170
Fig. 39 – PRIMO Program, rod BD8, sensitivity analysis on FGR models, FGR, base irradiation.
Fig. 40 – PRIMO Program, rod BD8, sensitivity analysis on FGR models, FGR, power ramp.
6.2.2 Assessment on fuel conductivity correlations (runs C1)
The thermal conductivity correlations addressed in this sensitivity analysis are described in section
5.2.2. The reference correlation assumed in the simulation is the Van Uffelen and Schubert (best
+100%
+100%
-50%
-50%

Ricerca Sistema Elettrico
Sigla di identificazione
ADPFISS – LP2 – 041
Rev.
0
Distrib.
L
Pag. di
101 170
estimate), LAMBDA 31 that accounts for the influence of the local temperature, the local burn-up, the
local porosity and the HBS formation. According to section 5.2.2 and Tab. 18, it is assumed that:
The correlation according to Carbajo et al is labeled as LAMBDA 32 (it accounts for the local
temperature, the local burn-up, the local porosity and the HBS formation, the O/M, the
dissolved and precipitated FPs and the radiation effects).
The correlation of Lanning and Beyer is named LAMBDA 33 (it accounts for the local
temperature, the local burn-up, the local porosity and the O/M).
The correlation according to Wiesenack is labeled as LAMBDA 34 and (it was developed for
UOx fuel and was reduced by a constant factor of 0.92 to accounts MA and FP effects in quasi
spent fuel).
The correlation of Van Uffelen and Schubert (conservative) is named LAMBDA 35 (it is
identical to the reference correlation excepts for one fitting constant).
These correlations have been developed specifically for MOX fuel. The analysis of the results
highlight that they impact on the fuel temperature at the axial peak up to 100°C during base irradiation
and up to 200°C during power ramp, as shown in Fig. A. 7 and Fig. A. 8 (APPENDIX A). This is
reflected in the calculated fission gas release. In general, the results are similar to the reference
simulation except for LAMBDA 34, and LAMBDA 35. This last correlations predict the lowest and
the highest fuel temperature respectively. LAMBDA 34 was developed for UO2 and corrected with a
constant factor to account for high burn-up MA and FP effects in quasi-spent fuel. This is the cause of
the low FGR. Van Uffelen and Schubert correlation (LAMBDA 35) in its conservative form gives
results similar to the other correlations at the end of the base irradiation and highlights the highest FGR
at the end of the power ramp while. The correlations LAMBDA 32 and 33 are similar to the Van
Uffelen and Schubert “best estimate” correlation which was chosen as reference. The main results are
summarized in Tab. 20.
PRIMO MOX
Sensitivity analysis C1: fuel conductivity correlations
RUN End of BI End of PR
FGR % Error % FGR % Error %
Exp. FGR 0.47 -- 11.23 --
Reference TU COND31 0.51 8.51 7.64 -31.97
COND32 0.78 +65.96 7.90 -29.65
COND33 0.79 +68.09 7.89 -29.74
COND34 0.36 -23.40 4.56 -59.39
COND35 0.75 +59.57 10.4 -7.39
Tab. 20 – PRIMO Program, rod BD8, sensitivity analysis on fuel thermal conductivity, results and
relative errors.
6.2.3 Assessment on relocation models (runs M2)
The choice of the relocation model (see section 5.2.3) mainly influences the gap width between fuel
pellet and cladding during the irradiation. The fuel temperature is consequently affected by the
relocation model and, therefore, different FGR trends are observed. The reference model is the
modified FRAPCON-3 model referred as IRELOC 8. It accounts for the tangential strain due to
relocation depending on the as fabricated gap, the burn-up (two simple functions below and beyond 5
MWd/kgU), the linear heat rate (a simple function that applies in the range 20 kW/m < LHR
<40kW/m). It does not consider the axial strain and it does not apply when gap is closed. According to
section 5.2.3 and Tab. 18, it is assumed that:

Ricerca Sistema Elettrico
Sigla di identificazione
ADPFISS – LP2 – 041
Rev.
0
Distrib.
L
Pag. di
102 170
The original KWU-LWR model is labeled as IRELOC 2. It accounts only for the as fabricated
gap, it accounts for axial strain and it applies also when gap is closed.
The GAPCON-THERMAL-3 model is referred as IRELOC 3. It accounts for the tangential
strain due to relocation depending on the as fabricated gap, the burn-up (exponential function
that saturates at 5MWd/kgU), the linear heat rate (a simple function). It does not consider the
axial strain and it applies also when gap is closed.
The modified KWU-LWR model is labeled as IRELOC 5. It accounts only for the as fabricated
gap, it accounts for tangential and axial strain and it applies also when gap is closed.
The thinnest gap is predicted by model IRELOC3 during BI, Fig. 41. IRELOC 2 behaves similar to the
reference model. IRELOC 5 predicts a larger gap compared to the reference model. During the
ramping phase (Fig. 42) the gap is predicted to close. IRELOC 5 predicts plastic deformation of the
pellet that definitively close the gap. This is connected with its activation also when gap is closed.
During the base irradiation (APPENDIX A, Fig. A. 9, Fig. A. 10 and Tab. 21), the FGR is in
agreement with the gap size predicted by the relocation model: the larger is the gap, the larger is the
centerline fuel temperature. Therefore, the FGR ranks in this way: IRELOC5 > IRELOC 2 >
REFERENCE > IRELOC 3.
During the ramping phase, relocation occurs only for IRELOC 2, IRELOC 3 and IRELOC 5 and it is
reversed by the cladding. This interacts with the fuel transient swelling model (see section 5.2.4) that
causes undue increase of gaseous porosity during the ramp down phase and, therefore, it affects the
fuel conductivity causing fuel temperature increase during power decrease, Fig. A. 10. Nevertheless,
no major differences are evidenced between the reference model and those that have been investigated,
Tab. 21.
PRIMO MOX
Sensitivity analysis M2: fuel relocation models
RUN End of BI End of PR
FGR % Error % FGR % Error %
EXP FGR 0.47 -- 11.23 --
Ref. IRELOC8 0.51 +8.51 7.64 -31.97
IRELOC2 0.62 +31.91 8.62 -23.24
IRELOC3 0.54 +14.89 8.48 -24.49
IRELOC5 0.36 -23.40 7.43 -33.84
Tab. 21 – PRIMO Program, rod BD8, sensitivity analysis on relocation models, results and relative
errors.

Ricerca Sistema Elettrico
Sigla di identificazione
ADPFISS – LP2 – 041
Rev.
0
Distrib.
L
Pag. di
103 170
Fig. 41 – PRIMO Program, rod BD8, sensitivity analysis on relocation models, gap width in peak
axial position, base irradiation.
Fig. 42 – PRIMO Program, rod BD8, sensitivity analysis on relocation models, gap width in peak
axial position, power ramp.

Ricerca Sistema Elettrico
Sigla di identificazione
ADPFISS – LP2 – 041
Rev.
0
Distrib.
L
Pag. di
104 170
6.2.4 Assessment on fuel swelling correlations (runs C2)
The solid fission products are theoretically predicted to contribute to fuel swelling on the average by
0.032% per MWd/kgU. The contribution of gaseous fission products to fuel swelling includes rare
gases such as krypton and xenon in solid solution and the volume change arising from the formation of
fission gas filled bubbles. For the gases in solid solution and the small intra-granular gas bubbles, it is
estimated that they furnish about 0.056% per MWd/kgU to matrix swelling rate. The inter-granular gas
bubbles can make the largest contribution to volume change depending on temperature and their
amount. Early studies indicated large bubbles of diameter around few microns on grain faces and also
along grain edges. At high exposures and temperatures the bubbles interlink forming a tunnel network
which concurrently leads to gaseous swelling and gas release.
Therefore, the choice of the swelling correlation directly affects the FGR, the fuel to cladding gap, and
the fuel conductivity. The reference correlation adopted in the simulations was developed by
Lassmann from the original MATPRO swelling correlation. It accounts for solid swelling as a linear
function of the local burn-up and for gaseous swelling as function of local temperature, burn-up, stress
and diffusion coefficient. The correlations available in TRANSURANUS are described in details in
5.2.4. According to this section and Tab. 18, it is assumed that:
The simple correlation that gives the total swelling rate for UO2 fuel due to solid FP is labeled
as SWELOC 18. It is a linear function of the local burn-up.
The original MATPRO swelling model for UO2 fuel is referred as SWELOC 19. It accounts for
solid swelling as a linear function of the local burn-up and for gaseous swelling as function of
local temperature and burn-up.
The implicit formulation of the reference correlation is labeled as SWELL 21.
The correlation proposed by Dienst et al. for FBR MOX fuel is referred as SWELOC 3. It
accounts for solid and gaseous swelling as two linear functions of the local burn-up. Gaseous
swelling is zero if the gap is closed.
The correlation proposed by by Pesl et al. for FBR MOX fuel is referred as SWELOC 11. It
accounts for solid and gaseous swelling as two linear functions of the local burn-up. Gaseous
swelling is zero if the gap is closed.
The correlation by Dienst et al. recommended for FBR MOX fuel is labeled as SWELOC 13. It
accounts for solid and gaseous swelling as two linear functions of the local burn-up. Gaseous
swelling is zero if the gap is closed.
Only SWELOC18, SWELOC19, SWELOC21 are here discussed since SWELOC3, SWELOC11,
SWELOC12 and SWELOC13 are developed to model swelling in FBR and resulted not suitable for
the simulation of the PRIMO experiment over predicting the swelling contribute and causing early gap
closure.
The thinnest gap is predicted by the reference correlation SWELOC20 in the first 5000 hours.
SWELOC18 predicts largest gap at the beginning of the irradiation while predicts the same gap width
of SWELOC19 at the end of BI, Fig. 43.
During the power ramp, all the fuel swelling correlations predict gap closure, therefore these
correlations, mainly influence the FGR during the base irradiation.
In general the FGR at the end of the base irradiation obtained in these simulations is related to the gap
width in the first 5000 hrs of the simulation, when the linear power is high and most of the gas release
occurs, Fig. A. 11 and Fig. A. 12 (APPENDIX A). Correlation SWELOC18 predicts the highest FGR
while the lowest is predicted by SWELOC19. However the difference between these models and the
reference simulation is negligible (less then ±0.2 %), Tab. 22. Correlation 21 is not shown in the
figures because it does not differ with the reference model 20.

Ricerca Sistema Elettrico
Sigla di identificazione
ADPFISS – LP2 – 041
Rev.
0
Distrib.
L
Pag. di
105 170
PRIMO MOX Sensitivity analysis C2: fuel swelling correlations
RUN End of BI End of PR
FGR % Error % FGR % Error %
Exp. FGR 0.47 -- 11.23 --
Reference SWELOC20 0.51 +8.51 7.64 -31.97
SWELOC18 0.59 +25.53 7.38 -34.28
SWELOC19 0.51 +8.51 7.74 -31.08
SWELOC21 0.51 +8.51 7.64 -31.97
Tab. 22 – PRIMO Program, rod BD8, sensitivity analysis on swelling model, results and relative
errors.
Fig. 43 – PRIMO Program, rod BD8, sensitivity analysis on fuel swelling correlations, gap width in
peak axial position, base irradiation.

Ricerca Sistema Elettrico
Sigla di identificazione
ADPFISS – LP2 – 041
Rev.
0
Distrib.
L
Pag. di
106 170
Fig. 44 – PRIMO Program, rod BD8, sensitivity analysis on fuel swelling correlations, gap width in
peak axial position, power ramp.
6.2.5 Assessment on fuel densification models (runs M3)
Densification process occurs at the beginning of the fuel irradiation; it leads to the destruction of
fabricated porosity.
The IDENSI2 model is a simple empirical model suitable for both LWR and FBR; it is the standard
TRANSURANUS densification model. The IDENSI7 model is the original MATPRO model and
considers both densification and hot pressing phenomena[76]
. However, as said in TU manual[8]
the
IDENSI7 model is not fully tested.
As shown in Fig. 45, IDENSI7 predicts a fast decrease of the gap width between fuel and cladding. It
explains the lower fuel temperature and lower FGR than IDENSI2 during the base irradiation, Fig. A.
13, APPENDIX A.
During the power ramp, opposite behavior is observed: both fuel temperature and FGR are predicted
higher by IDENSI7 respect to reference model IDENSI2, Fig. 46, and Fig. A. 14 (APPENDIX A).
This result can be explained considering the combination of gap width and fuel porosity. During the
base irradiation, the temperature is mainly influenced by the different gap width between fuel and
cladding while the fuel porosity has a minor influence because fuel temperature is relatively low. On
the other hand, during the power ramp the linear power is high and only the fuel conductivity affects
the fuel temperature since the gap is closed for both reference and IDENSI7 simulations. This explains
the higher FGR achieved at the end of the power ramp with the option IDENSI7 Fig. A. 14, Tab. 23.

Ricerca Sistema Elettrico
Sigla di identificazione
ADPFISS – LP2 – 041
Rev.
0
Distrib.
L
Pag. di
107 170
PRIMO MOX Sensitivity analysis M3: fuel densification models
RUN End of BI End of PR
FGR % Error % FGR % Error %
Exp. FGR 0.47 -- 11.23 --
Reference IDENSI2 0.51 +8.51 7.64 -31.97
IEDNSI 7 0.34 -27.66 9.06 -19.32
Tab. 23 – PRIMO Program, rod BD8, sensitivity analysis on densification models, results and relative
errors.
Fig. 45 – PRIMO Program, rod BD8, sensitivity analysis on densification models, gap width in peak
axial position, base irradiation.

Ricerca Sistema Elettrico
Sigla di identificazione
ADPFISS – LP2 – 041
Rev.
0
Distrib.
L
Pag. di
108 170
Fig. 46 – PRIMO Program, rod BD8, sensitivity analysis on densification models, gap width in peak
axial position, power ramp.
6.2.6 Assessment on fabrication density (runs D1)
The fuel density indirectly affects the FGR since it influences the fuel conductivity and therefore the
fuel temperature profile. The database reports the nominal density without its tolerance. It has been
assumed as +/- 1% TD. Density maximization generally increases the fuel conductivity and therefore it
reduces the FGR. Opposite conclusions can be drawn for density minimization. The FGR trends for
maximum and minimum density are compared with the reference density in Fig. A. 15 and Fig. A. 16
(APPENDIX A). The results are summarized in Tab. 24. Since the temperatures remain relatively low
and the densification takes place during in the first 10000 MWd/kgHM, the effect of the initial density
is more pronounced in the base irradiation. In the power ramp, the effect is negligible because the
densification has ended and the fuel temperature remains well beyond the threshold temperature for
the activation of the Koo model.
PRIMO MOX Sensitivity analysis D1: fuel density
RUN End of BI End of PR
FGR % Error % FGR % Error %
Exp. FGR 0.47 -- 11.23 --
Reference density 0.51 8.51 7.64 -31.97
TU calc. +1% TD 0.89 89.36 8.33 -25.82
TU calc. -1% TD 0.35 -25.53 7.07 -37.04
Tab. 24 – PRIMO Program, rod BD8, sensitivity analysis on fuel initial density, results and relative
errors.

Ricerca Sistema Elettrico
Sigla di identificazione
ADPFISS – LP2 – 041
Rev.
0
Distrib.
L
Pag. di
109 170
6.2.7 Assessment on grain size (runs D2)
As porosity at the end of the sintering, grain size is usually an uncertain parameter since it is usually
given as average value. This means that the data are representative of the ideal situation in which the
grain size is uniform in the pellet volume and do not account for local deviations that are dependent
from the fabrication process. Grain size has two main effects. Firstly, the larger is the grain, the larger
is the diffusion distance for the fission gas atoms created in the grains. This tends to reduce the release
rate. Secondly, the larger is the grain, the lower is the capacity of the grain boundaries to store fission
gas as their total surface-to-volume ratio is decreasing. In despite of this, for steady state conditions
FGR is low (1-2%) and dominated by the process to saturate the grain boundaries, and therefore it can
be concluded that FGR cannot be strongly dependent on the grain size. On the other hand, during
power ramps, these opposite contributions may impact on the FGR together with micro-cracking of the
grain boundaries that is more or less a stochastic phenomenon. Even after 50 years of testing the
contribution of these three mechanisms to FGR during power ramp is still controversial: some of the
experiments highlight largest release from small grains and some other highlight opposite results.
Rod BD8 has standard initial grain size (7.8 µm). The investigations assume that the average grain size
is obtained from the contribution due to grains of dimension within +/- 25% its average value. The
results are shown in Fig. A. 17, Fig. A. 18 (APPENDIX A) and Tab. 25.
As expected, in base irradiation, no significant influence of the grain size on FGR is detected. Fuel
temperature is, in general, low and thermal diffusion processes are not significant; most of the gas
remains trapped inside grains. Similar trend is observed in the ramping phase too. In general, smaller
grains lead to higher FGR and vice versa.
PRIMO MOX Sensitivity analysis D2: fuel grain size
RUN End of BI End of PR
FGR % Error % FGR % Error %
Exp. FGR 0.47 +0.00 11.23 +0.00
TU Reference GS 0.51 +8.51 7.64 -31.97
TU GS +25% 0.31 -34.04 7.24 -35.62
TU GS -25% 0.89 +89.36 7.68 -31.61
Tab. 25 – PRIMO Program, rod BD8, sensitivity analysis on grain size, results and relative errors.
6.2.8 Assessment on initial gap width (runs D3)
The gap size affects its thermal resistance and, consequently, it influences the temperature drop across
the gas zone and the maximum temperature in the fuel. The higher is the gap size, the higher is the fuel
temperature. High fuel temperature has two effects: it promotes FGR that further reduces the gap
conductance (since Xe and Kr have lower conductivity that He) and it promotes gap closure because of
enhanced gaseous swelling and fragment relocation.
In this analysis the effect of the gap initial size has been assessed. Since the gap tolerances are not
given in the documents it has been assumed (based on Tab. 5 and Tab. 6) in the range [93-108] μm.
Gap maximization generally increases the FGR and the pin pressurization. Opposite conclusions can
be drawn for gap minimization. The trend are reported in APPENDIX A: Fig. A. 19 and Fig. A. 20
respectively. Tab. 26 summarizes the results of the analysis. The main effects are observed during the
base irradiation since during the power ramp test the gap closes.
PRIMO MOX

Ricerca Sistema Elettrico
Sigla di identificazione
ADPFISS – LP2 – 041
Rev.
0
Distrib.
L
Pag. di
110 170
Sensitivity analysis D3: gap width between fuel and cladding
RUN End of BI End of PR
FGR % Error % FGR % Error %
Exp. FGR 0.47 -- 11.23 --
TU Reference gap 0.51 +8.51 7.64 -31.97
TU calc. max gap 0.72 +53.19 7.69 -31.52
TU calc. min gap 0.46 -2.13 7.71 -31.34
Tab. 26 – PRIMO Program, rod BD8, sensitivity analysis on gap width results and relative errors.
6.3 Code to code comparison
In this section, the reference simulation (here labeled as TU-v1m1j12-ENEA) is compared to the
results obtained by means of other codes employed in the benchmark[10]
. The following fuel pin
mechanic computer code were benchmarked:
COSMOS, developed at KAERI, South Korea[77]
,
FRED, developed at Kurchatov Institute, Russian Federation[78]
,
ENIGMA, developed at NNL, UK[79]
,
FRACPON-3, sponsored by the U.S. Nuclear Regulatory Commission (NRC) for evaluating
light water reactor (LWR) fuel performance and maintained by Pacific Northwest National
Laboratory (PNNL)[80]
,
TRANSURANUS version 2004,
FALCON, developed at ANATECH, San Diego, California[81]
.
FEMAXI, developed at JAERI, Japan[82]
and
START-3, developed at JSC-VNIINM, Russian Federation[83]
.
As stated in the final report of the PRIMO benchmark, there is excellent agreement on the computed
burn-up with all the participant simulations, the SCK-CEN experimental analyses (with CONDOR
code), and the PIE results. Basically, the calculated rod average burn-ups indicate that all benchmark
participants modeled the heating histories (including the axial power distribution) correctly.
The calculated fuel centerline temperatures (prior to the ramp) are illustrated in Fig. 47. Through 6000
h of irradiation, all the codes agree within a range of ~125°C; after that time, the Russian codes (FRED
and START-3) yield results that are higher and diverge from the remaining codes (whose results are
within a ~100°C). The TU-v1m1j12-ENEA simulation predicts a fuel temperature that is consistent
with the most part of the codes. The older TU simulation (carried out by means of the 2004 version)
predicts significantly higher temperatures; the difference between the two versions exceeds 120°C at
the beginning of the simulation and progressively reduces; the fuel temperatures are almost coincident
at 18000 h (end of BI). The FGR trends obtained by the benchmark participants are shown in Fig. 48.
Most of the simulations (including TU-v1m1j12-ENEA) predict a FGR prior to ramp less than 0.8%,
which is in agreement with the measured trend (0.47%). FRED, START-3 and PSI-FALCON predict
higher FGR in accordance to the higher fuel temperatures.
The peak fuel temperatures during the ramp phase of the test are given in Fig. 49; except for the
START-3 prediction (the highest one) and ENIGMA and TU-v1m1j12-ENEA prediction (lower ones),
the predictions are within a range of about 200°C. The FGR trends during the power ramp are shown
in Fig. 50. The START-3 and FALCON predict the highest values of FGR at the end of the power
ramp (15.4 to 16.2% respectively); the lowest prediction is that of TU-v1m1j04 at 4.7%. ENIGMA
predicts 7.2% while the other code are within the range from 9.1 to 13.7%. The TU-v1m1j12-ENEA

Ricerca Sistema Elettrico
Sigla di identificazione
ADPFISS – LP2 – 041
Rev.
0
Distrib.
L
Pag. di
111 170
simulation predicts 7.7% which improves the old result. Even though the higher fuel peak temperature
is predicted by TRANSURANUS older version, TU-v1m1j12-ENEA simulates higher FGR because of
the selection of the ramp release model (IGRBDM 3, modified Koo model). This model was not
available at the time of TU-v1m1j04 simulation; the reference inter-granular model of White and
Tucker (IGRBDM 1) was selected.
Fig. 47 – PRIMO Program, rod BD8, code-to-code comparison, fuel temperature, base irradiation.
Fig. 48 – PRIMO Program, rod BD8, code-to-code comparison, FGR, base irradiation.

Ricerca Sistema Elettrico
Sigla di identificazione
ADPFISS – LP2 – 041
Rev.
0
Distrib.
L
Pag. di
112 170
Fig. 49 – PRIMO Program, rod BD8, code-to-code comparison, fuel temperature, power ramp.
Fig. 50 – PRIMO Program, rod BD8, code-to-code comparison, FGR, power ramp.

Ricerca Sistema Elettrico
Sigla di identificazione
ADPFISS – LP2 – 041
Rev.
0
Distrib.
L
Pag. di
113 170
7 Validation of TU code against IFA-597 experiment
7.1 Reference results
The assessment of TU code in simulating rods 10 and 11 from IFA-597 experiment is discussed in the
following subsections. The analysis deals with the comparison between measured and predicted trends
(burn-up, fuel temperature, inner pin pressure, FGR). The main results are presented from Fig. 51 to
Fig.58 and they are summarized in Tab. 16 and Tab. 28.
7.1.1 Burn-up analysis
In order to demonstrate the consistency of any calculation, it is essential to predict the burn-up in a
correct way. In fact, this first step implies to demonstrate that the fuel rod is analyzed under conditions
that represent its state at the end of the experiment. In addition, part of the models of any fuel pin
mechanic code are dependent upon the burn-up and therefore it should be verified that those models
are taking into account the burn-up effects according to the experimental conditions achieved.
The final burn-ups for the two rods are 27 MWd/kgMOX and 27.9 MWd/kgMOX respectively for rod
10 and 11. TU code models the burn-up according to the “TRANSURANUS-LWR burn-up model”[70]
.
As evidenced in Fig. 51, Fig.52 and Tab. 16 the burn-ups of these rods are well captured.
7.1.2 Fuel temperature analysis
The measured fuel temperatures of rods10 and rod 11 are given in the benchmark document[12]
as
function of time. They are shown in Fig.53 and Fig. 54 (rod 10 and rod 11, respectively). The graphs
also provide:
the computed fuel temperature at the thermocouple positions;
the peak fuel temperature for rod 10 with solid pellets (it is not plotted for rod 11 with hollow
pellets because it is substantially equal to the measured temperature);
the Vitanza temperature threshold[7]
for gas release onset;
the computed gap width between fuel and cladding.
Rod 10: during IFA-597.4 and .5, the fuel temperature is in good accordance with the measured values
being the error always below 40°C with a slight overestimation at the end of IFA-597.4 and at the end
of IFA-597.5. During IFA-597.6, the fuel temperature is overestimated of about ~200°C. This
overestimation can be explained considering the gap width trend. As stated in the benchmark
document[12]
, the low fuel temperature and high inner pressure suggest that the gap is closed during
this power cycle. On the contrary, as shown in Fig.53, TU code predicts the gap opened. Therefore, the
fuel peak temperature in rod 10 is computed about 200°C higher than the measured temperature.
Rod 11: the comparison between measured and computed temperatures is shown in Fig. 54: three
different trends are evidenced. The first one deals with the first high power cycle IFA-597.4 in which
the fuel temperature is underestimated of about 60°C. On the other hands, during the low power period
IFA-597.5, it is good accordance with measurements. Finally, during IFA-597.6, the fuel temperature
is overestimated (~200°C) probably due to the same reasons provided for rod 10. As stated before, fuel
peak temperature is substantially equal to the measured one; the same result is observed comparing
simulated temperatures; therefore the peak temperature is not reported in Fig. 54.

Ricerca Sistema Elettrico
Sigla di identificazione
ADPFISS – LP2 – 041
Rev.
0
Distrib.
L
Pag. di
114 170
7.1.3 Rod inner pressure analysis
The measured time dependent inner pressure histories are given in the benchmark document[12]
. The
comparison with the computed trends are provided in Fig.55 and Fig.56. The two graphs also report
the computed total free volume on the secondary axis.
Rod 10: as shown in Fig.55, during the first part of the experiment, the pressure is in good agreement
with the experimental data . The initial value is overestimated of about 0.03 MPa; it suggests that the
initial rod free volume given in the benchmark specifications[12]
is slightly lower than the real one.
During the first 2000 hrs of irradiation a pressure decrease is observable while the free volume is
increasing of about 110 mm3 because of the effect of fuel densification. This behavior is observed both
in the simulation and in the experimental data. TU code is in good accordance with the experiment up
to the end of IFA-597.4 while it underestimates the next two phases mainly because of the under-
prediction of FGR. In the low power cycle the underestimation is about 0.8 bar, however, the pressure
main trend is qualitatively captured. In IFA-597.6, the underestimation is about 7.5 bar mainly due to
the underestimation of the initial pressure spike magnitude. After this pressure increase, the code
predicts a further pressure increase trend which is consistent with the experimental data. In fact, the
subsequent two pressure bursts are observed because of delayed FGR detection (caused by closed gap)
and should be interpreted as a continuous increase as predicted by the code.
Rod 11: the inner pressure of this hollow pellets rod is provided in Fig.56. The initial value of inner
pressure is not consistent with the experiment. It suggests that the total pin free volume given in the
benchmark document[12]
is smaller than the real one. The effect of fuel densification is observed also
for this rod and the computed trend is consistent with the experimental data. The measurements
underlined a pressure increase during the initial high power cycle IFA-597.4 due to high FGR. TU
code under-predicts this pressure increase because it does not capture the FGR during this phase. The
simulated pressure results underestimated of about 2.5 bar during IFA-597.5. In IFA-597.6 behaves
similar to rod 10, with an high pressure burst at the beginning of the power cycle. The simulation
predicts a 3.1 bar pressure increase while the measurements underlined a 6.9 bar burst. After the burst,
the computed pressure increase is still smaller respect to the experiment. The pressure underestimation
is due to the FGR underestimation that occurs during the whole irradiation time. For a detailed FGR
analysis, see 7.1.4.
7.1.4 FGR analysis
FGR data were provided on the HRP IFA-597 report[11],[12]
. They were obtained by pressure
measurements and pin free volume estimation. The comparison between experimentally estimated
trends and TU code results is reported in Fig.57 and Fig.58 for rod 10 and rod 11 respectively. The
figures include the fuel measured temperature and the Vitanza threshold.
Rod 10: the FGR reached 7% at the end of IFA-597.4, and exceeded 20% at the end of IFA-597.6 as
can be seen in Fig.57. The code predicts correctly the onset of FGR at 2100 hrs. It suggests that the
grain boundaries saturation is modeled according to the experiment. The experimental FGR increases
during IFA-597.4 up to 7%. The code underestimates the FGR at the end of this period (it is predicted
about 4%). The modified Koo model are activates twice: the first occurs at the power spike around
4100 hrs; the second occurs at the power down ramp at the end of IFA-597.4.
During IFA-597.5 both the experimental and computed FGR decrease due to the lower power and fuel
temperature that inhibits the fission gas thermal diffusion. At the end of IFA-597.5, the experimental
FGR is about 4% while the TU code predicts about 3%. FGR burst is observed during the power
increase at the beginning of IFA-597.6. Large and unexpected FGR increase was evidenced in the
experiment: from 4% up to 16% due to the burst. TU code under-predicts the magnitude of this
phenomenon (it predicts an increase from 3% to 5.5%). affecting the simulation of the rod inner

Ricerca Sistema Elettrico
Sigla di identificazione
ADPFISS – LP2 – 041
Rev.
0
Distrib.
L
Pag. di
115 170
pressure described in 7.1.3. FGR increases further after the bursts, of about 5%. A similar
increase(4.5%) is highlighted also in the simulation. Therefore, the final FGR is underestimated with
an error of about 50%, mainly due to the FGR burst, at the beginning of IFA-597.6.
Rod 11: the FGR analysis is provided in Fig.58. Even if lower peak temperatures were achieved
compared to the solid pellet rod 10, during IFA-597.4, the gas release was more relevant than in rod 10
and, in particular, it exceeded 10%. This behavior can be explained by the higher linear power in the
first 5000 hrs of irradiation (Fig. 18). After that time, the linear power was substantially equal for the
two rods. As in rod 10, FGR decreases during IFA-597.5 and a big FGR burst occurred at the
beginning of IFA-597.6; the final experimental FGR is about 16%. The simulation under-predicts the
FGR along the whole simulation. The simulated FGR never reach 1% before the beginning of IFA-
597.6 when the Koo model for power ramps activates. However, the simulated FGR step is
significantly smaller than the measured one and reaches 2%. The final value predicted by TU code is
slightly below 4% with an error of about 75%.
According to the simulation results, rod 10 is characterized by fuel temperatures high enough to
exceed the Vitanza threshold both in the second half of IFA-597.4 and during IFA-597.6 (Fig.53). It
explains the relevant FGR obtained in the simulations. On the other hand, rod 11 fuel temperature only
approaches the Vitanza threshold during the power spike in IFA-597.4 and exceeds it for some hours
during IFA-597.6; the resulting FGR is therefore lower. In addition, since the code predicts open gap
in IFA-597.6, the effect of gap poisoning has to be considered. In rod 10, the high FGR (6%), causes a
thermal positive feedback that contributes to further gas release. In rod 11 the thermal feedback is not
relevant because of very low values of FGR (2%) at the beginning of IFA-597.6. In conclusion, the
experiment evidenced high FGR for both rods. TU code under-predicts this phenomenon, particularly
for rod 11.

Ricerca Sistema Elettrico
Sigla di identificazione
ADPFISS – LP2 – 041
Rev.
0
Distrib.
L
Pag. di
116 170
IFA-597 rod 10 Design parameters
Parameter Unit Quantity
Rod Id -- Rod 10
Fuel – clad material -- MOX – Zr-4
U235
enrichment %HM 0.22
Pu239
enrichment %HM 6.07
Fuel average grain size μm 5.45
Rod outer diameter mm 9.50
Gap width mm 0.09
Pellet outer diameter mm 8.04
Pellet central hole mm 0.00
Active length mm 224
He filling pressure bar 5
Reference analysis
Parameter Uncertainty Exp TU
calc
Error
%
Acceptability
band
Burn-up (MWd/kgHM) ±6% 27.0 26.8 -0.7 ±10%
FGR ±10% 20.75 9.91 -52.24 +100% / -50%
Pin pressure 2.77 2.07 -25.27
Tab. 27 – IFA-597, rod 10, summary of reference analysis.
IFA-597 rod 11 Design parameters
Parameter Unit Quantity
Rod Id -- Rod 10
Fuel – clad material -- MOX – Zr-4
U235
enrichment %HM 0.22
Pu239
enrichment %HM 6.07
Fuel average grain size μm 5.45
Rod outer diameter mm 9.50
Gap width mm 0.09
Pellet outer diameter mm 8.04
Pellet central hole mm 0.90
Active length mm 224
He filling pressure bar 5
Reference analysis
Parameter Uncertainty Exp TU
calc
Error
%
Acceptability
band
Burn-up (MWd/kgHM) ±6% 27.5 27.4 -0.36 ±10%
FGR ±10% 15.82 3.40 -78.50 +100% / -50%
Pin pressure 2.26 1.50 -33.62
Tab. 28 – IFA-597, rod 11, summary of reference analysis.
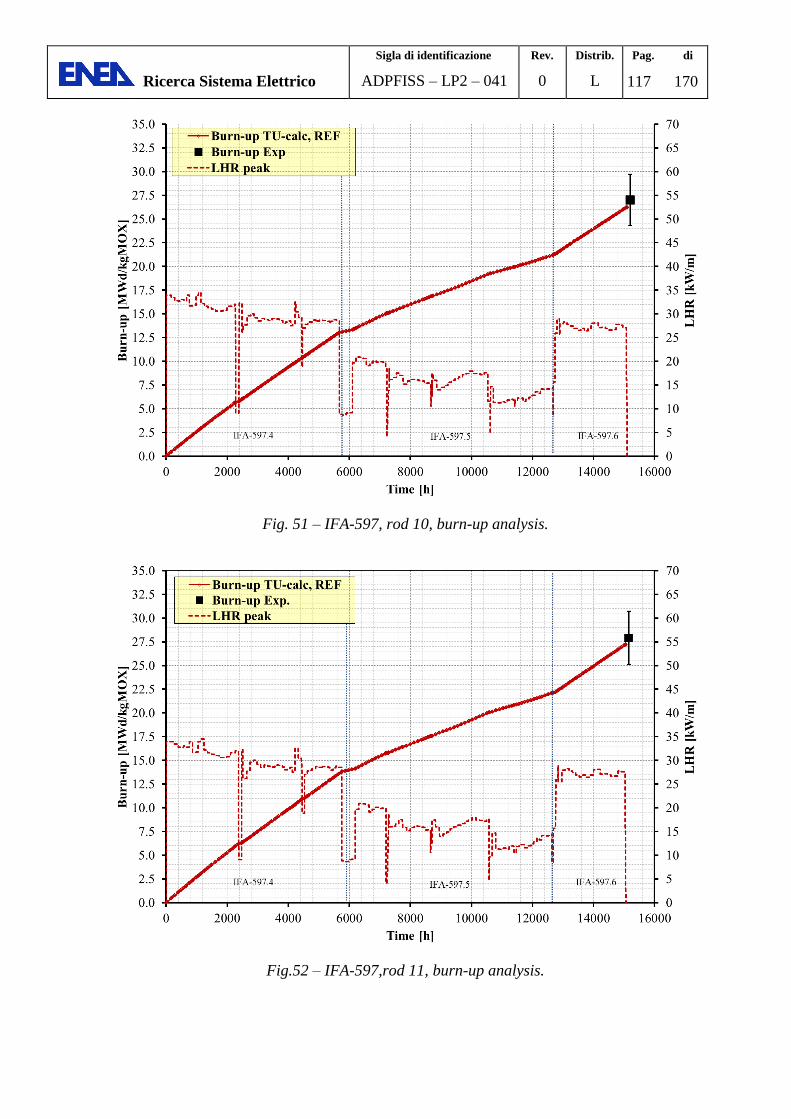
Ricerca Sistema Elettrico
Sigla di identificazione
ADPFISS – LP2 – 041
Rev.
0
Distrib.
L
Pag. di
117 170
Fig. 51 – IFA-597, rod 10, burn-up analysis.
Fig.52 – IFA-597,rod 11, burn-up analysis.

Ricerca Sistema Elettrico
Sigla di identificazione
ADPFISS – LP2 – 041
Rev.
0
Distrib.
L
Pag. di
118 170
Fig.53 – IFA-597,rod 10, fuel temperature analysis
Fig. 54 – IFA-597,rod 11, fuel temperature analysis.

Ricerca Sistema Elettrico
Sigla di identificazione
ADPFISS – LP2 – 041
Rev.
0
Distrib.
L
Pag. di
119 170
Fig.55 – IFA-597,rod 10, inner pressure analysis.
Fig.56 – IFA-597,rod 11, inner pressure analysis.

Ricerca Sistema Elettrico
Sigla di identificazione
ADPFISS – LP2 – 041
Rev.
0
Distrib.
L
Pag. di
120 170
Fig.57 – IFA-597,rod 10, FGR analysis.
Fig.58 – IFA-597,rod 11, FGR analysis.

Ricerca Sistema Elettrico
Sigla di identificazione
ADPFISS – LP2 – 041
Rev.
0
Distrib.
L
Pag. di
121 170
7.2 Sensitivity analysis
The sensitivity analysis is a fundamental step for the assessment of the code capabilities. Different
objectives shall be fulfilled such as to demonstrate the robustness of the calculations, to characterize
the reasons for possible discrepancies between measured and calculated trends or values observed in
the reference calculation, to optimize code results and user option choices, to improve the knowledge
of the code by the user.
The investigation of the effect of the parameters, models and processes identified in section 5.1.2 on
the code result is carried out in this section. Tab. 29 lists the sensitivity analyses and their objectives.
They are divided into three groups: the investigations on models (labeled as M), the investigation on
correlations (labeled as C), and the investigation on the initial design conditions (labeled as D). This
list is not exhaustive since other model options might affect the code results, such as the uncertainties
on the boundary conditions (i.e. the linear heat rate during the base irradiation and the power ramp
phase, the ramp rate, the extension of holding time of ramp terminal level, etc..).
The development of the different sensitivities is hereafter reported in separate subsections
distinguishing between the different groups of homogeneous selections.
Case Run Modification Objective
Fission gas
release
M1.1 Igrbdm 1 Investigate the impact of inter-granular models on fuel temperature, pin
pressure and FGR. Correlation according to the standard model
M1.2 Igrbdm 2
Investigate the impact of intergranular models on fuel temperature, pin
pressure and FGR. Correlation according to the temperature dependent
model
M1.3 Igrbdm 1
FGRmod 4
Investigate the impact of intra-granular and inter-granular models on fuel
temperature, pin pressure and FGR. Inter-granular model according to
the standard model and intra-granular model of Matzke and White
Tucker.
M1.4 Igrbdm 2
FGRmod 4
Investigate the impact of intra-granular and inter-granular models on fuel
temperature, pin pressure and FGR. Inter-granular model according to
the temperature dependent model and intra-granular model of Matzke
and White Tucker.
M1.5 Igrbdm 3
FGRmod 4
Investigate the impact of intra-granular and inter-granular models on fuel
temperature, pin pressure and FGR. Inter-granular model according to
the modified Koo model and intra-granular model of Matzke and White
Tucker.
M1.6 Igrbdm 1
FGRmod 9
Investigate the impact of intra-granular and inter-granular models on fuel
temperature, pin pressure and FGR. Inter-granular model according to
the standard model and intra-granular model of Turnbull.
M1.7 Igrbdm 2
FGRmod 9
Investigate the impact of intra-granular and inter-granular models on fuel
temperature, pin pressure and FGR. Inter-granular model according to
the temperature dependent model and intra-granular model of Turnbull.
M1.8 Igrbdm 3
FGRmod 9
Investigate the impact of intra-granular and inter-granular models on fuel
temperature, pin pressure and FGR. Inter-granular model according to
the modified Koo model and intra-granular model of Turnbull.
Fuel conductivity
C1.1 Modfuel(j=6)=32
Investigate the impact of fuel conductivity on fuel temperature, pin
pressure and FGR considering O/M effects. Correlation according to
Carbajo et al..
C1.2 Modfuel(j=6)=33
Investigate the impact of fuel conductivity on fuel temperature, pin
pressure and FGR considering O/M effects . Correlation according to
Lanning and Beyer.
C1.3 Modfuel(j=6)=34 Investigate the impact of fuel conductivity on fuel temperature and FGR.
Correlation according to Wiesenack.
C1.4 Modfuel(j=6)=35 Investigate the impact of fuel conductivity on fuel temperature, pin
pressure and FGR. Correlation according to Van Uffelen and Schubert

Ricerca Sistema Elettrico
Sigla di identificazione
ADPFISS – LP2 – 041
Rev.
0
Distrib.
L
Pag. di
122 170
(conservative).
Pellet fragment
relocation
M2.1 Ireloc 2
Investigate the impact of fuel relocation on fuel temperature, pin pressure
gap size and FGR. Original KWU-LWR model based on initial gap size
only.
M2.2 Ireloc 3
Investigate the impact of fuel relocation on fuel temperature, pin pressure,
gap size and FGR. GAPCON-THERMAL-3 based on initial gap size, LHR
and burn-up.
M2.3 Ireloc 5
Investigate the impact of fuel relocation on fuel temperature, pin pressure,
gap size and FGR. Modified KWU-LWR model based on initial gap size
only.
Fuel swelling
C2.1 Modfuel(j4)=18
Investigate the impact of fuel swelling on fuel temperature, gap size, fuel
elongation and FGR. Simple correlation applied: swelling proportional to
burn-up.
C2.2 Modfuel(j4)=19
Investigate the impact of fuel swelling on fuel temperature, pin pressure
and FGR. Original MATPRO swelling model considering separate
contributions of the solid and gaseous fission products
C2.3 Modfuel(j4)=21 Investigate the impact of fuel swelling on fuel temperature, pin pressure,
gap size and FGR. Implicit formulation of the reference correlation.
densification M3.1 Idensi 7 Investigate the impact on FGR, fuel temperature, pin pressure and gap
width. Original MATPRO densification model.
Fuel
density
D1.1 Density +1% TD
Assess the impact on FGR and fuel centerline temperature of lower initial
fuel porosity corresponding to an increase of 1% TD of the initial fuel
density.
D1.2 Density -1% TD
Assess the impact on FGR and fuel centerline temperature of higher
initial fuel porosity corresponding to a decrease of 1% TD of the initial
fuel density.
Grain size
D2.1 1.25 Graindesign Assess the impact of 25% increased grains on FGR and fuel centerline
temperature
D2.2 0.75 Graindesign Assess the impact of 25% decreased grains on FGR and fuel centerline
temperature
Gap size
D3.1 Gap size 108μm
Test the impact of increased gap width at the beginning of irradiation on
fuel temperature and FGR. Initial value obtained assuming maximum
cladding and minimum fuel radii according to design uncertainties.
D3.2 Gap size 93μm
Test the impact of decreased gap width at the beginning of irradiation on
fuel temperature and FGR. Initial value obtained assuming minimum
cladding and maximum fuel radii according to design uncertainties
Tab. 29 – IFA-597 list of sensitivity analysis.
7.2.1 Assessment of FGR models (runs M1)
This sensitivity analysis aims to assess the FGR models described in section 5.1.1. Each intra-granular
model is associated with the inter-granular models to assess all the combinations[75]
. Tab. 30 and Tab.
31 summarize the results.
According to section 5.1.1 and Tab. 29, the intra-granular thermal diffusion model according to
Matzke and a-thermal diffusion according to White and Tucker is referred as FGRMOD 4. The
reference thermal intra-granular diffusion model according to Matzke and a-thermal diffusion
according to ITU data is labeled as FGRMOD 6 and; the thermal and a-thermal intra-granular
diffusion model according to Turnbull is referred as FGRMOD 9.
The inter-granular models according to the standard model, the temperature dependent model and the
reference power ramp model derived from the Koo model are labeled, respectively, IGRBDM 1, 2 and
3.
It should be mentioned that, below 1200°C, the reference intra-granular diffusion coefficient
(FGRMOD 6) is lower than FGRMOD 4 and FGRMOD 9 while above 1200°C, it becomes equal to

Ricerca Sistema Elettrico
Sigla di identificazione
ADPFISS – LP2 – 041
Rev.
0
Distrib.
L
Pag. di
123 170
FGRMOD 4. Assuming a power rating of 35W/g, above 1320°C, FGRMOD 6 overpasses FGRMOD
9. This last coefficient is the highest up to 1320°C, Fig. 59.
Rod 10 with solid MOX pellets: the fuel peak temperature is about 200°C higher than the
measurements. Therefore, the peak fuel temperature ranges from 1300 to 1450°C during high power
periods and from 800 to 1000°C during low power periods. According to Fig. 59, the diffusion
coefficients during IFA-597.4 / .6 rank in the following manner: FGRMOD 9 < FGRMOD 4 =
FGRMOD 6. During the low power cycle IFA-597.5, the they rank in a different way due to the lower
fuel temperature: FGRMOD 6 < FGRMOD 4 < FGRMOD 9.
Rod 11 with hollow pellets: the fuel peak temperature is lower than rod 10. The measured temperature
is close to the fuel peak temperature. During IFA-597.4 and .6 (high power) the fuel peak temperature
is mainly in the range 1100-1200°C; the diffusion coefficient rank as follows: FGRMOD 4 ~
FGRMOD 6 < FGRMOD 9. During IFA-597.5, the low temperature (600-900°C) gives the following
ranking: FGRMOD 4 < FGRMOD 6 < FGRMOD 9.
The inter-granular models are presented in Fig. 60. During the high power (and high temperature)
cycle, the grain boundaries saturation concentrations for rod 10 are IGRBDM 1 (FGRMOD 4-6) <
IGRBDM 2 (FGRMOD 4-6) < IGRBDM 1 (FGRMOD 9) < IGRBDM 2 (FGRMOD 9). Although
hollow pellets rod highlights lower temperatures, the ranking of GB saturation concentrations remains
the same of rod 10. However, at lower temperature, the distance between different models is larger.
IGRBDM 3 model is not discussed because it is equal to IGRBDM 1 excepts in power ramp
conditions. The results of the sensitivity analysis on FGR models are provided in section B.1
(Appendix B).
FGRMOD 4 is analyzed in Fig. B. 1 (Appendix B) and Tab. 30, Tab. 31. The figures include the
reference simulations and the FGRMOD 4 simulations combined with the three grain boundary
models. IGRBDM 2 computes the lowest FGR during the whole experiment; the final FGR value is
still lower than the reference simulation even with a higher diffusion coefficient, Fig. B. 1 a) and b).
IGRBDM 2 exceeds the reference FGR during IFA-597.6 mainly because of the effect of the diffusion
coefficient that, at low temperature, is higher than FGRMOD 6. The gas diffusion is then more
effective in the pellet periphery where temperatures are lower. FGRMOD 4 in combination with
IGRBDM1 and IGRBDM 3 provide higher FGR than the reference simulation mainly because of the
more effective diffusion being IGRBDM 3 associated to the highest FGR due to the activation of the
power ramp conditions. Similar behavior is observed in both rods even if the values of FGR are
different and remain underestimated compared to the experimental estimated FGR. The fuel
temperatures highlight minor deviations from the reference calculation (only IFA-597.6 is slightly
dependent upon the model due to the thermal feedback effects), Fig. B. 1 c) and d) while the pin
pressure is driven by the FGR: Fig. B. 1 e) and f).
The reference model FGRMOD6 is assessed in Fig. B. 2 a), b), c), d), e) and f) (Appendix B), and Tab.
30. The general considerations reported for FGRMOD4 applies to FGRMOD6 too excepts the absolute
values of the FGR that tends to reduce compared to FGRMOD4 because of lower intra-granular
diffusion coefficient. The coupling of FGRMOD6 with IGRBDM 3 (reference selection) provides
highest FGR due to several activations of the modified Koo model for power ramps during IFA-597.4
and at the beginning of IFA-597.6.
FGRMOD9 is analyzed in Fig. B. 3 (Appendix B) ), and Tab. 30, Tab. 31. Among the intra-granular
models, the model of Turnbull (FGRMOD9) associated with IGRBDM 1 or 2 compute the lowest
FGR, Fig. B. 3 a) and b). This is connected to the highest saturation limits that reduce the FGR (4*10-4

Ricerca Sistema Elettrico
Sigla di identificazione
ADPFISS – LP2 – 041
Rev.
0
Distrib.
L
Pag. di
124 170
and 0.7092/T mol/m2
respectively). The simulation of the power ramp up, at the beginning of IFA-
597.6, highlights two different trends: IGRBDM1 and IGRBDM2 still predict the lowest FGR while,
on the other hand, IGRBDM3 (Koo ramps model) predicts the highest one. However, the combination
FGRMOD 9 – IGRBDM 3 provides a final FGR that is lower than the reference simulation because,
even at high temperature, grain boundaries take longer time to saturate and FGR decreases after the
initial burst. Again, the same considerations apply for both rods except for the absolute values of FGR
. Due to thermal feedback effects, the fuel centerline temperature is affected by the grain boundary
model being those of IGRBDM3 similar to the reference one and higher than the remaining models,
Fig. B. 3 c) and d). The pin pressure is driven by the FGR: Fig. B. 3 e) and f).
The summary of the FGR analysis is shown in Fig. 61 and Fig. 62 for rod 10 and rod 11 respectively.
Both the rods are underestimated. Rod 10 is captured within the common acceptability band for FGR
analysis while rod 11 is under-predicted.
IFA-597 rod 10
Sensitivity analysis M1: FGR models
RUN FGR % Error % IP [MPa] Error %
Experimental 20.75 -- 2.77 --
Ref. FGRMOD6, IGRBDM3 9.91 -52.24 2.07 -25.27
FGRMOD4, IGRBDM1 10.43 -49.73 1.91 -25.27
FGRMOD4, IGRBDM2 8.73 -57.93 2.19 -31.05
FGRMOD4, IGRBDM3 11.67 -43.76 1.91 -20.94
FGRMOD6, IGRBDM1 8.72 -57.98 1.77 -31.05
FGRMOD6, IGRBDM2 7.33 -64.67 2.77 -36.10
FGRMOD9, IGRBDM1 2.46 -88.14 1.30 -53.07
FGRMOD9, IGRBDM2 1.48 -92.87 1.20 -56.68
FGRMOD9, IGRBDM3 8.51 -58.99 1.89 -31.77
Tab. 30 – IFA-597, rod 10, sensitivity analysis on FGR models ,results and relative errors.

Ricerca Sistema Elettrico
Sigla di identificazione
ADPFISS – LP2 – 041
Rev.
0
Distrib.
L
Pag. di
125 170
IFA-597 rod 11 Sensitivity analysis M1: FGR models
RUN FGR % Error % IP [bar] Error %
Experimental 15.82 -- 2.26 --
Ref. FGRMOD6, IGRBDM3 3.40 -78.51 1.50 -27.44
FGRMOD4, IGRBDM1 4.55 -71.24 1.61 -55.96
FGRMOD4, IGRBDM2 2.85 -81.98 6.16 -59.21
FGRMOD4, IGRBDM3 5.32 -66.37 7.13 -23.47
FGRMOD6, IGRBDM1 2.80 -82.30 1.44 -29.60
FGRMOD6, IGRBDM2 1.78 -88.75 1.35 -32.85
FGRMOD9, IGRBDM1 5.92 -80.91 1.23 -37.18
FGRMOD9, IGRBDM2 1.92 -87.86 1.19 -38.63
FGRMOD9, IGRBDM3 3.02 -62.58 1.47 -28.52
Tab. 31 – IFA-597, rod 11, sensitivity analysis on FGR models ,results and relative errors.
Fig. 59 – IFA-597, sensitivity analysis on FGR, intra-granular diffusion coefficients.

Ricerca Sistema Elettrico
Sigla di identificazione
ADPFISS – LP2 – 041
Rev.
0
Distrib.
L
Pag. di
126 170
Fig. 60 – IFA-597, sensitivity analysis on FGR models, gas saturation concentration to release from
grain boundaries.
Fig. 61 – IFA-597, rod 10 and rod 11, sensitivity analysis on FGR, final results.
0%
5%
10%
15%
20%
25%
0% 5% 10% 15% 20% 25%
Co
mp
ute
d F
GR
Experimental FGR
rod 10 Ref. FGRMOD6, IGRBDM3 EXP = TU calc.
rod 10 FGRMOD4, IGRBDM1 rod 10 FGRMOD4, IGRBDM2
rod 10 FGRMOD4, IGRBDM3 rod 10 FGRMOD6, IGRBDM1
rod 10 FGRMOD6, IGRBDM2 rod 10 FGRMOD9, IGRBDM1
rod 10 FGRMOD9, IGRBDM2 rod 10 FGRMOD9, IGRBDM3
rod 11 Ref. FGRMOD6, IGRBDM3 rod 11 FGRMOD4, IGRBDM1
rod 11 FGRMOD4, IGRBDM2 rod 11 FGRMOD4, IGRBDM3
rod 11 FGRMOD6, IGRBDM1 rod 11 FGRMOD6, IGRBDM2
rod 11 FGRMOD9, IGRBDM1 rod 11 FGRMOD9, IGRBDM2
rod 11 FGRMOD9, IGRBDM3

Ricerca Sistema Elettrico
Sigla di identificazione
ADPFISS – LP2 – 041
Rev.
0
Distrib.
L
Pag. di
127 170
Fig. 62 – IFA-597, rod 10 and rod 11, sensitivity analysis on pin pressure, final results.
7.2.2 Assessment on fuel conductivity correlations (runs C1)
The thermal conductivity correlations addressed in this sensitivity analysis are described in section
5.2.2. The reference correlation assumed in the simulation is the Van Uffelen and Schubert (best
estimate), LAMBDA 31 that accounts for the influence of the local temperature, the local burn-up, the
local porosity and the HBS formation. According to section 5.2.2 and Tab. 29, it is assumed that:
The correlation according to Carbajo et al is labeled as LAMBDA 32 (it accounts for the local
temperature, the local burn-up, the local porosity and the HBS formation, the O/M, the
dissolved and precipitated FPs and the radiation effects).
The correlation of Lanning and Beyer is named LAMBDA 33 (it accounts for the local
temperature, the local burn-up, the local porosity and the O/M).
The correlation according to Wiesenack is labeled as LAMBDA 34 and (it was developed for
UOx fuel and was reduced by a constant factor of 0.92 to accounts MA and FP effects in quasi
spent fuel).
The correlation of Van Uffelen and Schubert (conservative) is named LAMBDA 35 (it is
identical to the reference correlation except for one fitting constant).
These correlations have been developed specifically for MOX fuel.
The results are reported in Fig. B. 4 (Appendix B) and summarized in Tab. 32 and Tab. 33.
The analysis of the results highlight that the conductivity correlation impacts on the fuel temperature
up to 100°C for rod 10 and 150°C for rod 11, Fig. B. 4 c) and d). In particular, the deviations increases
at higher burn-ups and the main difference is observed during IFA-597.6. The highest temperature is
predicted by LAMBDA 35 correlation (conservative formulation of the reference simulation
LAMBDA 31). The lowest fuel temperature is predicted by LAMBDA34 correlation that was
developed for UO2 and corrected with a constant factor. The remaining correlations are close to the
0.00
0.50
1.00
1.50
2.00
2.50
3.00
0.00 0.50 1.00 1.50 2.00 2.50 3.00
Co
mp
ute
d p
in p
ress
ure
Experimental pin pressure
rod 10 Ref. FGRMOD6, IGRBDM3 EXP = TU calc.
rod 10 FGRMOD4, IGRBDM1 rod 10 FGRMOD4, IGRBDM2
rod 10 FGRMOD4, IGRBDM3 rod 10 FGRMOD6, IGRBDM1
rod 10 FGRMOD6, IGRBDM2 rod 10 FGRMOD9, IGRBDM1
rod 10 FGRMOD9, IGRBDM2 rod 10 FGRMOD9, IGRBDM3
rod 11 Ref. FGRMOD6, IGRBDM3 rod 11 FGRMOD4, IGRBDM1
rod 11 FGRMOD4, IGRBDM2 rod 11 FGRMOD4, IGRBDM3
rod 11 FGRMOD6, IGRBDM1 rod 11 FGRMOD6, IGRBDM2
rod 11 FGRMOD9, IGRBDM1 rod 11 FGRMOD9, IGRBDM2
rod 11 FGRMOD9, IGRBDM3

Ricerca Sistema Elettrico
Sigla di identificazione
ADPFISS – LP2 – 041
Rev.
0
Distrib.
L
Pag. di
128 170
reference analysis. The difference in temperature is reflected in the computed FGR and pin inner
pressure accordingly, Fig. B. 4 a), b), e) and f). The temperature difference impacts on the FGR of
about +2/-4% in rod 10, -3/+3.5% in rod 11. The gap width is influenced by the fuel temperature
mainly because of different fuel thermal expansion, Fig. B. 4 c) and d). LAMBDA 35 predicts the
thinnest gap while LAMBDA 34, the thickest one.
IFA-597 rod 10
Sensitivity analysis C1 conductivity correlations
RUN FGR % Error % IP [MPa] Error %
Experimental 20.75 -- 2.77 --
Ref. LAMBDA 31 9.91 -52.24 2.07 -25.27
LAMBDA 32 8.32 -59.90 1.87 -32.49
LAMBDA 33 10.01 -51.76 2.03 -26.71
LAMBDA 34 5.71 -72.48 1.60 -42.24
LAMBDA 35 12.9 -37.83 2.28 -17.69
Tab. 32 – IFA-597, rod 10, sensitivity analysis on fuel conductivity correlations ,results and relative
errors.
IFA-597 rod 11 Sensitivity analysis C1 conductivity correlations
RUN FGR % Error % IP [bar] Error %
Experimental 15.82 -- 2.26 --
Ref. LAMBDA 31 3.40 -78.51 1.50 -27.44
LAMBDA 32 2.59 -83.82 1.42 -37.17
LAMBDA 33 3.68 -76.93 1.53 -32.30
LAMBDA 34 8.65 -45.51 1.24 -45.13
LAMBDA 35 7.51 -52.72 1.92 -15.04
Tab. 33 – IFA-597, rod 11 sensitivity analysis on fuel conductivity correlations ,results and relative
errors.
7.2.3 Assessment on relocation models (runs M2)
The choice of the relocation model (see section 5.2.3) mainly influences the gap width between fuel
pellet and cladding during the irradiation. The fuel temperature is consequently affected by the
relocation model and, therefore, different FGR trends are observed. The reference model is the
modified FRAPCON-3 model referred as IRELOC 8. It accounts for the tangential strain due to
relocation depending on the as fabricated gap, the burn-up (two simple functions below and beyond 5
MWd/kgU), the linear heat rate (a simple function that applies in the range 20 kW/m < LHR
<40kW/m). It does not consider the axial strain and it does not apply when gap is closed. According to
section 5.2.3 and Tab. 29, it is assumed that:
The model according to the original KWU-LWR is labeled as IRELOC 2. It accounts only for
the as fabricated gap, it accounts for axial strain and it applies also when gap is closed.
The model according to GAPCON-THERMAL-3 is referred as IRELOC 3. It accounts for the
tangential strain due to relocation depending on the as fabricated gap, the burn-up (exponential
function that saturates at 5MWd/kgU), the linear heat rate (a simple function). It does not
consider the axial strain and it applies also when gap is closed.

Ricerca Sistema Elettrico
Sigla di identificazione
ADPFISS – LP2 – 041
Rev.
0
Distrib.
L
Pag. di
129 170
The modified KWU-LWR is labeled as IRELOC 5. It accounts only for the as fabricated gap, it
accounts for tangential and axial strain and it applies also when gap is closed.
The results are reported in Fig. B. 5 (Appendix B) and summarized in Tab. 34 and Tab. 35.
The thinnest gap is predicted by model IRELOC3, Fig. B. 5 b) and c). IRELOC 2 behaves similar to
the reference model while IRELOC 5 predicts the largest gap. Not any model predicts the gap closure
occurred during IFA-597.6. The predicted FGR is in agreement with the gap size: the larger is the gap,
the larger is the centerline fuel temperature. Therefore, the FGR ranks in this way: IRELOC5 >
IRELOC 2 > IRELOC 8 (ref.) > IRELOC 3 being IRELOC 5 close to the experimental FGR. On the
other hands, this last model over-predicts the fuel temperature.
IFA-597 rod 10
Sensitivity analysis M2: fuel relocation models
RUN FGR % Error % IP [MPa] Error %
Experimental 20.75 -- 2.77 --
Ref. IRELOC 8 9.91 -52.24 2.07 -25.27
IRELOC 2 11.10 -46.51 2.14 -22.74
IRELOC 3 5.13 -75.28 1.54 -44.40
IRELOC 5 15.71 -24.29 2.59 -6.50
Tab. 34 – IFA-597, rod 10, sensitivity analysis on relocation models, results and relative errors.
IFA-597 rod 11 Sensitivity analysis M2: fuel relocation models
RUN FGR % Error % IP [bar] Error %
Experimental 15.82 -- 2.26 --
Ref. IRELOC 8 3.40 -78.51 1.50 -27.44
IRELOC 2 4.57 -71.30 1.65 -26.99
IRELOC 3 1.51 -90.64 1.27 -43.81
IRELOC 5 11.11 -29.96 2.33 3.10
Tab. 35 – IFA-597, rod 1, sensitivity analysis on relocation models, results and relative errors.
7.2.4 Assessment on fuel swelling correlations (runs C2)
The solid fission products are theoretically predicted to contribute to fuel swelling on the average by
0.032% per MWd/kgU. The contribution of gaseous fission products to fuel swelling includes rare
gases such as krypton and xenon in solid solution and the volume change arising from the formation of
fission gas filled bubbles. For the gases in solid solution and the small intra-granular gas bubbles, it is
estimated that they furnish about 0.056% per MWd/kgU to matrix swelling rate. The inter-granular gas
bubbles can make the largest contribution to volume change depending on temperature and their
amount. Early studies indicated large bubbles of diameter around few microns on grain faces and also
along grain edges. At high exposures and temperatures the bubbles interlink forming a tunnel network
which concurrently leads to gaseous swelling and gas release.
Therefore, the choice of the swelling correlation directly affects the FGR, the fuel to cladding gap, and
the fuel conductivity. The reference correlation adopted in the simulations was developed by
Lassmann from the original MATPRO swelling correlation. It accounts for solid swelling as a linear
function of the local burn-up and for gaseous swelling as function of local temperature, burn-up, pellet
Ricerca Sistema Elettrico
Sigla di identificazione
ADPFISS – LP2 – 041
Rev.
0
Distrib.
L
Pag. di
130 170
local stress and diffusion coefficient. The correlations available in TRANSURANUS are described in
details in 5.2.4. According to this section and Tab. 29, it is assumed that:
The simple correlation gives the total swelling rate for UO2 fuel including matrix swelling due
to solid FP is labeled as SWELOC 18. It is a linear function of the local burn-up.
The original MATPRO swelling model for UO2 fuel is referred as SWELOC 19. It accounts for
solid swelling as a linear function of the local burn-up and for gaseous swelling as function of
local temperature and burn-up.
The correlation proposed by Dienst et al. for FBR MOX fuel is referred as SWELOC 3. It
accounts for solid and gaseous swelling as two linear functions of the local burn-up. Gaseous
swelling is zero if the gap is closed.
The correlation proposed by by Pesl et al. for FBR MOX fuel is referred as SWELOC 11. It
accounts for solid and gaseous swelling as two linear functions of the local burn-up. Gaseous
swelling is zero if the gap is closed.
The correlation by Dienst et al. recommended for FBR MOX fuel is labeled as SWELOC 13. It
accounts for solid and gaseous swelling as two linear functions of the local burn-up. Gaseous
swelling is zero if the gap is closed.
SWELOC 21 is the implicit formulation of the reference correlation.
Only SWELOC18, SWELOC19, SWELOC21 are here discussed; SWELOC3, SWELOC11,
SWELOC12 and SWELOC13 are developed to model swelling in FBR and are not suitable for this
simulation. The results are reported in Fig. B. 6 (Appendix B) and summarized in Tab. 36 and Tab. 37.
In the simulation of rod 10, SWELOC 19 predicts the thinnest gap during IFA-597.4 and IFA-597.5,
Fig. B. 6 c) and d). During IFA-597.6, the thinnest gap is predicted by the reference correlation
SWELOC20. SWELOC 18 the largest gap size, it is close to SWELOC 19. SWELOC 18
overestimates the fuel temperature due to the large gap computed in the first 6000 hrs causing high
FGR. After that time, the larger FGR achieved influences the rest of the simulation through a thermal
positive feedback process. At the end of the simulation, the FGR predicted by this model is the highest
and it is close the experimental value, Fig. B. 6 a) and b). SWELOC 19 predicts fuel temperatures very
close to the reference case for most of the simulation while predicts higher temperature during IFA-
597.6. It results in high FGR; the final value is similar to the experimental FGR. The pressure varies
according to FGR; highest pin inner pressurization is predicted by SWELOC 18 and SWELOC 19,
Fig. B. 6 e) and f). SWELOC 21 is equal to the reference correlation.
The selection of the fuel swelling correlation has negligible impact on the simulation of rod 11.

Ricerca Sistema Elettrico
Sigla di identificazione
ADPFISS – LP2 – 041
Rev.
0
Distrib.
L
Pag. di
131 170
IFA-597 rod 10
Sensitivity analysis C2: fuel swelling correlations
RUN FGR % Error % IP [MPa] Error %
Experimental 20.75 -- 2.77 --
Ref. SWELOC 20 9.91 -52.24 2.07 -25.27
SWELOC18 20.91 +0.72 3.06 +10.47
SWELOC19 16.32 -21.35 2.60 -6.14
SWELOC21 9.42 -54.60 1.97 -28.88
Tab. 36 – IFA-597, rod 10, sensitivity analysis on swelling model, results and relative errors.
IFA-597 rod 11 Sensitivity analysis C2: fuel swelling correlations
RUN FGR % Error % IP [bar] Error %
Experimental 15.82 -- 2.26 --
Ref. SWELOC 20 3.40 -78.51 1.50 -27.44 SWELOC18 3.43 -78.32 1.50 -33.63
SWELOC19 3.21 -79.71 1.48 -34.51
SWELOC21 3.39 -78.57 1.50 -33.63
Tab. 37 – IFA-597, rod 11, sensitivity analysis on swelling model, results and relative errors.
7.2.5 Assessment on fuel densification models (runs M3)
Densification process occurs at the beginning of the fuel irradiation; it leads to the destruction of
fabricated porosity.
The IDENSI2 model is a simple empirical model suitable for both LWR and FBR; it is the standard
TRANSURANUS densification model. The IDENSI7 model is the original MATPRO model and
considers both densification and hot pressing phenomena[76]
. However, as said in the TU manual[8]
IDENSI7 is not fully tested and its results should be taken with care.
The results are reported in Fig. B. 7 (Appendix B), and summarized in Tab. 38 and Tab. 39. As shown
in Fig. B. 7 c) and d) IDENSI7 predicts the thinnest gap width between fuel and cladding during the
whole simulations. It explains the lower fuel temperature and lower FGR / pin pressurization, Fig. B. 7
a), b), e) and f). In the sensitivity analysis, rod 10 experiences gap closure during IFA-597.6.
Therefore, the fuel temperature is well captured during IFA-597.6 (even if it is underestimated in the
other phases and the associated FGR is further underestimated).
IFA-597 rod 10
Sensitivity analysis M3: densification models
RUN FGR % Error % IP [MPa] Error %
Experimental 20.75 -- 2.77 --
Ref. IDENSI 2 9.91 -52.24 2.07 -25.27
IDENSI 7 2.60 -87.47 1.28 -53.79
Tab. 38 – IFA-597, rod 10, sensitivity analysis on densification model, results and relative errors.

Ricerca Sistema Elettrico
Sigla di identificazione
ADPFISS – LP2 – 041
Rev.
0
Distrib.
L
Pag. di
132 170
IFA-597 rod 11 Sensitivity analysis M3: densification models
RUN FGR % Error % IP [bar] Error %
Experimental 15.82 -- 2.26 --
Ref. IDENSI 2 3.40 -78.51 1.50 -27.44
IDENSI 7 0.5 -96.84 1.23 -45.58
Tab. 39 – IFA-597, rod 11, sensitivity analysis on densification model, results and relative errors.
7.2.6 Assessment on Helium release model (runs M4)
Helium generation and release from the fuel matrix is a peculiar characteristic of the MOX fuel. It
contributes to inner pin pressurization but, on the other hand, mitigates the effect of gap poisoning.
TU-code can compute the Helium diffusion and release similarly to ordinary FGR. Three different
diffusion coefficients are available: iHe = 1 and iHe = 2 according to Federici et al. (data fit and lower
limit respectively) and iHe = 3 according to Ronchi at al. A detailed description of Helium diffusion
and release models in TU-code is reported in chapter 5.2.9.
This analysis aims to assess the impact of Helium release models on fuel temperature, inner pin
pressure and FGR. The results are reported in Fig. B. 8, (Appendix B) and Tab. 40 and Tab. 41. The
selection of the Helium release models doesn’t affect pin pressurization and FGR in both rods. This is
due to the state of development of the Helium release model which is still not connected to pin
pressurization and total gas release. The Ronchi et al. model (iHe = 3) predicts the highest Helium
release (~55%). The Federici standard model (iHe = 1) predicts similar release (~50%). The lowest
release (~30%) is computed by the Federici lower limit model (iHe = 2).
IFA-597 rod 10
Sensitivity analysis M4: Helium release model
RUN FGR % Error % IP [MPa] Error %
Experimental 20.75 -- 2.77 --
Ref. iHe = 0 9.91 -52.24 2.07 -25.27
iHe = 1 9.91 -52.24 2.07 -25.27
iHe = 2 9.90 -52.35 2.07 -25.27
iHe = 3 9.90 -52.35 2.07 -25.27
Tab. 40 – IFA-597, rod 10, sensitivity analysis on Helium release model, results and relative errors.
IFA-597 rod 11 Sensitivity analysis M4: Helium release model
RUN FGR % Error % IP [bar] Error %
Experimental 15.82 -- 2.26 --
Ref. iHe = 0 3.40 -78.51 1.50 -27.44
iHe = 1 3.40 -78.51 1.50 -27.44
iHe = 2 3.40 -78.51 1.50 -27.44
iHe = 3 3.40 -78.51 1.50 -27.44
Tab. 41 – IFA-597, rod 11, sensitivity analysis on Helium release model, results and relative errors.

Ricerca Sistema Elettrico
Sigla di identificazione
ADPFISS – LP2 – 041
Rev.
0
Distrib.
L
Pag. di
133 170
7.2.7 Assessment on fabricated density (runs D1)
The fuel density indirectly affects the FGR since it influences the fuel conductivity and, therefore, the
fuel temperature profile. The database reports the nominal density without its tolerance. It has been
assumed as +/- 1% TD.
Density maximization generally increases the fuel conductivity and therefore it reduces the FGR.
Opposite conclusions can be drawn for density minimization. The FGR trends for maximum and
minimum density are compared with the reference density in Fig. B. 9 (Appendix B). FGR and inner
pin pressure are summarized in Tab. 42 and Tab. 43.
Significant effect of the porosity is observable in the fuel temperature trends, Fig. B. 9 c) and d). The
high porosity at the beginning of the simulation favors high fuel temperature causing FGR. At the end
of the densification process, even if the fabrication porosity is reduced, the thermal feedback induced
by FGR in combination with relocation and swelling (that affects the gap width) influence the fuel
temperature increasing or decreasing the amount of gas released. This considerations apply both for
rod 10 and rod 11.
IFA-597 rod 10
Sensitivity analysis D1: fabrication density
RUN FGR % Error % IP [MPa] Error %
Experimental 20.75 -- 2.77 --
Ref. POR000 = 0.0414 9.91 -52.24 2.07 -25.27
POR000 = 0.0314 4.90 -76.39 1.49 -46.21
POR000 = 0.0514 14.23 -30.99 2.46 -11.19
Tab. 42 – IFA-597, rod 10, sensitivity analysis on initial porosity, results and relative errors.
IFA-597 rod 11 Sensitivity analysis D1: fabrication density
RUN FGR % Error % IP [bar] Error %
Experimental 15.82 -- 2.26 --
Ref. POR000 = 0.0414 3.40 -78.51 1.50 -27.44
POR000 = 0.0314 0.96 -93.99 1.28 -43.36
POR000 = 0.0514 9.69 -38.57 2.11 -6.64
Tab. 43 – IFA-597, rod 11, sensitivity analysis on initial porosity, results and relative errors.
7.2.8 Assessment on grain size (runs D2)
As porosity at the end of the sintering, grain size is usually an uncertain parameter since it is usually
given as average value. This means that the data are representative of the ideal situation in which the
grain size is uniform in the pellet volume and do not account for local deviations that are dependent
from the fabrication process. Grain size has two main effects. Firstly, the larger is the grain, the larger
is the diffusion distance for the fission gas atoms created in the grains. This tends to reduce the release
rate. Secondly, the larger is the grain, the lower is the capacity of the grain boundaries to store fission
gas as their total surface-to-volume ratio is decreasing. In despite of this, for steady state conditions
FGR is low (1-2%) and dominated by the process to saturate the grain boundaries, and therefore, it can
be concluded that FGR cannot be strongly dependent on the grain size. On the other hand, during
power ramps, these opposite contributions may affect the FGR together with micro-cracking of the
grain boundaries that is more or less a stochastic phenomenon. Even after 50 years of testing the
contribution of these three mechanisms to FGR during power ramp is still controversial: some of the
experiments highlight largest release from small grains and some other highlight opposite results.

Ricerca Sistema Elettrico
Sigla di identificazione
ADPFISS – LP2 – 041
Rev.
0
Distrib.
L
Pag. di
134 170
Rods 10 and 11 have small initial grain size (5.5 µm m.l.i.). According to the benchmark
specifications, it has been assumed a maximum grain size is of 6.6 µm and a minimum of 4.3 µm. The
results are shown in Fig. B. 10 (Appendix B) and summarized in Tab. 44 and Tab. 45. Smaller grains
lead to higher FGR and vice versa; this behavior is observed in both rods Fig. B. 10 a), b), e) and f).
While grain size minimization has a big impact on FGR and inner pin pressure, grain maximization
provides results close to the reference analysis. Minimizing the grain size, the fuel temperature is over
predicted, Fig. B. 10 c), d).
IFA-597 rod 10
Sensitivity analysis D2: grain size
RUN FGR % Error % IP [MPa] Error %
Experimental 20.75 -- 2.77 --
Ref. DKORN = 5.5 9.91 -52.24 2.07 -25.27
DKORN = 6.6 6.31 -69.59 1.67 -39.71
DKORN = 4.3 16.02 -22.80 2.58 -6.86
Tab. 44 – IFA-597, rod 10, sensitivity analysis on average grain size, results and relative errors.
IFA-597 rod 11 Sensitivity analysis D2: grain size
RUN FGR % Error % IP [bar] Error %
Experimental 15.82 -- 2.26 --
Ref. DKORN = 5.5 3.40 -78.51 1.50 -27.44
DKORN = 6.6 1.50 -90.52 1.31 -42.04
DKORN = 4.3 10.31 -34.83 2.23 -1.33
Tab. 45 – IFA-597, rod 11, sensitivity analysis on average grain size, results and relative errors.
7.2.9 Assessment on initial gap width (runs D3)
The gap size affects its conductance and, consequently, it influences the temperature drop across the
gas zone and the maximum temperature in the fuel. The higher is the gap size, the higher is the fuel
temperature. High fuel temperature has two effects: it promotes FGR that further reduces the gap
conductance (since Xe and Kr have lower conductivity that He) and it promotes gap closure because of
enhanced gaseous swelling and fragment relocation.
In this analysis the effect of the gap initial size has been assessed. The gap tolerances are not given in
the benchmark specifications; it has been assumed a ±0.01 mm; the gap initial width is varied in the
range [0.08-0.10 mm].
Gap maximization generally increases the FGR and the pin pressurization. Opposite conclusions can
be drawn for gap minimization. The computed trends are reported in Fig. B. 11 (Appendix B) and Tab.
46, Tab. 47. In rod 10 the initial gap width impacts the FGR for about ±3% respect to the reference
simulation. In rod 11, if thinner gap is assumed, FGR is predicted below 1% while if larger gap is
assumed, the FGR is significant during IFA-597.6; the thermal feedback due to gas poisoning causes
high fuel temperatures and the gap reduces even below the simulation with minimum initial gap
because of differential thermal expansion between fuel pellets and cladding.

Ricerca Sistema Elettrico
Sigla di identificazione
ADPFISS – LP2 – 041
Rev.
0
Distrib.
L
Pag. di
135 170
IFA-597 rod 10
Sensitivity analysis D3: gap width
RUN FGR % Error % IP [MPa] Error %
Experimental 20.75 -- 2.77 --
Ref. gap = 0.09 mm 9.91 -52.24 2.07 -25.27
gap = 0.08 mm 6.26 -69.83 2.34 -15.52
gap = 0.10 mm 13.05 -37.11 1.65 -40.43
Tab. 46 – IFA-597, rod 10, sensitivity analysis on gap width, results and relative errors.
IFA-597 rod 11 Sensitivity analysis D3: gap width
RUN FGR % Error % IP [bar] Error %
Experimental 15.82 -- 2.26 --
Ref. gap = 0.09 mm 3.40 -78.51 1.50 -27.44
gap = 0.08 mm 1.17 -92.60 1.88 -16.81
gap = 0.10 mm 6.71 -57.59 1.28 -43.36
Tab. 47 – IFA-597, rod 10, sensitivity analysis on gap width, results and relative errors.
7.2.10 Assessment on initial free volume (runs D4)
The total pin free volume mainly affects the gas composition in the gap between fuel and cladding;
large volumes mitigate the positive feedback effect of FGR. In addition, when FGR occurs, higher free
volume damps the pressure increase and vice versa. The free volume maximization and minimization
are obtained increasing and decreasing the upper plenum length by 10 mm. Free volume maximization
generally decreases the FGR and the pin pressurization. Opposite conclusions can be drawn for its
minimization. The computed trends are reported in Fig. B. 12. The final results are summarized in Tab.
48 and Tab. 49 for rod 10 and 11 respectively. The main effect is observed in rod 10 where the FGR
varies of 2% respect to the reference result. In rod 11 the impact on FGR is negligible because of the
presence of the central void.
IFA-597 rod 10
Sensitivity analysis D4: free volume
RUN FGR % Error % IP [MPa] Error %
Experimental 20.75 -- 2.77 --
Ref. free volume = 2.6 ccm 9.91 -52.24 2.07 -25.27
Free volume = 2.1 ccm 12.1 -41.69 2.68 -3.25
Free volume = 3.1 ccm 8.55 -58.80 1.67 -39.71
Tab. 48 – IFA-597, rod 10, sensitivity analysis on free volume, results and relative errors.
IFA-597 rod 11
Sensitivity analysis D4: free volume
RUN FGR % Error % IP [bar] Error %
Experimental 15.82 -- 2.26 --
Ref. free volume = 2.8 ccm 3.40 -78.51 1.50 -27.44
Free volume = 2.3 ccm 4.33 -72.63 1.86 -17.70
Free volume = 3.3 ccm 2.94 -81.42 1.33 -41.15
Tab. 49 – IFA-597, rod 11, sensitivity analysis on free volume, results and relative errors.

Ricerca Sistema Elettrico
Sigla di identificazione
ADPFISS – LP2 – 041
Rev.
0
Distrib.
L
Pag. di
136 170

Ricerca Sistema Elettrico
Sigla di identificazione
ADPFISS – LP2 – 041
Rev.
0
Distrib.
L
Pag. di
137 170
8 Conclusions
The aim of this activity is to assess the capabilities of TRANSURANUS code version 2012 in
simulating MOX fuel rods subjected normal operation and power ramp with particular focus on the
FGR phenomenon. The datasets adopted for the calculation consist of rod BD8 from the PRIMO MOX
Experimental Program and IFA-597. These databases are included in the IFPE database and have been
released by the OECD-NEA in the framework of MOX fuel performance benchmarking activities.
In the following, separated conclusions are reported for each database distinguishing between the
reference calculation and the sensitivity analysis. The reference calculations model the gas intra-
granular diffusion coefficient according to Matzke for the thermal part and to a constant for the a-
thermal part. The inter-granular behavior is modeled according to the modified Koo model specifically
developed for fast power ramps.
PRIMO Experiment rod BD8
The experiment consists of a base irradiation in the BR-3 reactor up to 30 MWd/kgHM with average
linear power of 19 kW/m and a power ramp test in the OSIRIS reactor characterized by ramp rate of
460 kW/m-h and ramp terminal level at axial peak of 39.5 kW/m.
The reference analysis brings to the following conclusions:
Burn-up analysis: the simulations highlight excellent agreement with the experimental trends:
no significant error is observed. It suggests that power-history and power axial shape are
correctly modeled.
FGR analysis: the simulation can be divided in base irradiation and power ramp phases.
o During the base irradiation the FGR remains low and the final value is in good
agreement with respect to the experimental data. This suggests that the fuel temperature
is correctly estimated even if the fuel temperature during the experiment was not
measured (rod BD8 was not instrumented).
o The ramp phase is characterized by high fuel temperatures (in the order of 2000°C) and
considerable FGR is expected to occur. High temperature enhances gas diffusion inside
grains and the fast power increase at the beginning of the ramp test can cause micro-
cracking that also favors FGR. The reference simulation predicts 7.65% that is 30%
under-estimated compared to the PIE measurement (11.23%). Nevertheless, this result
is well within the acceptability lower band (-50%).
Grain size analysis: only the radius at which the grain growth phenomenon is observed and the
mean grain size in that region are given in the database. The simulations qualitatively fit the
experimental trends.
Deformation analysis: cladding and fuel column length change and cladding diameter creep
down were measured after base irradiation. TU code over-predicts the fuel shortening and
slightly underestimates the cladding elongation. Nevertheless, these measured quantities are
affected by large uncertainties. The cladding creep down is in good agreement with the
experiment.
Extensive sensitivity analysis has been conducted to assess the code capabilities, the main results can
be summarized as follows:

Ricerca Sistema Elettrico
Sigla di identificazione
ADPFISS – LP2 – 041
Rev.
0
Distrib.
L
Pag. di
138 170
If the standard and the temperature dependent inter-granular models are applied (assuming the
reference intra-granular model), the FGR is further underestimated. This is connected to the
fact that no “step” release is possible with those models.
The intra-granular thermal diffusion according to Matzke and a-thermal diffusion according to
White and Tucker generally predicts higher FGR. Nevertheless, it remains under-predicted if
the standard and the temperature dependent inter-granular models are applied and it becomes
over-predicted if the Koo model is selected.
The intra-granular thermal diffusion according to Turnbull has two distinct effects. It tends to
reduce the FGR if the standard and the temperature dependent inter-granular models are
applied (because of the huge grain boundaries capacity respect to other models) and it becomes
largely over-predicted if the Koo model is selected (if ramp conditions are met, all the gas
stored in grain boundaries is released).
Fuel conductivity correlations affect the FGR. Among the correlations available for MOX fuel,
the reference correlation according to ITU fitted to experimental data by Duriez at al. causes
FGR under-prediction. The same correlation in its conservative form provides FGR in excellent
accordance to measured value.
Swelling and relocation models mainly affect gap width and doesn’t have strong influence on
FGR because most of the release occurs during the power ramp when the gap between fuel
pellets and cladding is closed.
The MATPRO densification model impacts on FGR because it affects both the gap size and
fuel porosity. High fuel porosity causes a decrease in fuel conductivity and cause higher fuel
temperature and gas release. The MATPRO model predicts higher porosity at the end of the
base irradiation; it enhances fuel temperature during the power ramp increasing the FGR.
Fuel fabrication porosity and gap size (modeled according their design tolerances), impact on
FGR mainly in the base irradiation and has a minor in the influence during the power ramp.
Grain size analysis revealed slight influence on FGR of this parameter within ±25% its average
value: FGR increase is observed with small grains and vice versa.
IFA-597
This dataset consists of two rods, labeled rod 10 (equipped mainly with solid pellets), and rod 11
(equipped with hollow pellets only). The experiment consists of four cycles of irradiation named IFA-
597.4, .5 , 6, 7. They took place in the Halden HBWR. The linear power was in the range 15 – 35
kW/m. The final burn-up was about 35 MWd/kgMOX. The power histories are given only for the first
three power cycles.
The reference analysis brings to the following conclusions:
Burn-up analysis: the simulations highlight excellent agreement with the experimental trends:
no significant error is observed. It suggests that rods’ geometry, power-history and power axial
shape are correctly modeled.
Fuel temperature analysis: the fuel temperature was measured during the experiment by means
of thermocouples inserted in the pellets hole at the top of both rods.
o Rod 10: fuel temperature is correctly predicted by the code until the end of IFA-597.5.
During IFA-597.6, the experimental data suggest that gap closure occurred while the
code predicts open gap. The fuel temperature is therefore overestimated.
o Rod 11: fuel temperature is underestimated during the first cycle IFA-597.4 of about
50°C. During IFA-597.5 the code prediction is in good accordance with the
measurements while in the last cycle IFA-597.6 it is overestimated of about 150°C due
to the same reason reported for rod 10.

Ricerca Sistema Elettrico
Sigla di identificazione
ADPFISS – LP2 – 041
Rev.
0
Distrib.
L
Pag. di
139 170
Inner rod pressure analysis: rods’ internal pressure was measured by means of bellow type
pressure transducers. They were accommodated in the lower plenum of both the rods and
provided pressure measurements during the whole irradiation time.
o Rod 10: pin pressure is well captured during IFA-597.4 and slightly underestimated
during IFA-597.5. Because of the 50% under-prediction of the FGR, pressure is
underestimated during the last cycle. The under-estimation is mainly due to the pressure
burst that occurred at 12000 hrs caused by a large gas release; the code doesn’t predicts
a so large burst even if the modified Koo model is selected.
o Rod 11: rod inner pressure is overestimated at the beginning of the simulation. It
suggests that the initial free volume is not exactly consistent with the real design. The
measurements show fission gas pressurization of the pin since the end of IFA-597.4
while the simulation doesn’t predict any significant release until the beginning of IFA-
597.6. The pressure burst is observed similarly to rod 10 and underestimated.
FGR analysis: the fractional gas release is computed based on pressure measurements in
combination with free volume estimation during the experiment. The final values of FGR are
obtained correcting the estimation on the basis on PIE.
o Rod 10: TU code underestimates the FGR of about 50%. The estimated FGR is 21 %
while the simulation provides 9.9%.
o Rod 11: The simulation predicts FGR in the order of 4% while the estimated FGR is
four times greater.
Extensive sensitivity analysis has been conducted to assess the code capabilities, the main results can
be summarized as follows:
If the standard and the temperature dependent inter-granular models are applied (assuming the
reference intra-granular model), no main difference is observed in the fuel temperature
behavior. FGR and pin pressure are similar to the reference simulations for both rods.
The intra-granular thermal diffusion according to Matzke and a-thermal diffusion according to
White and Tucker predicts slightly higher FGR than the reference model.
The intra-granular thermal diffusion according to Turnbull underestimates the FGR.
Fuel conductivity correlations affect the fuel temperature. Among the correlations available for
MOX fuel, the reference correlation according to ITU fitted to experimental data by Duriez at
al. predicts the fuel temperature correctly except in the last part of the simulation and cause
FGR under-prediction. The same correlation in its conservative form provides higher FGR, but,
on the other hand, it over-predicts fuel temperature. Other correlations tested are consistent
with the reference one.
Swelling and relocation models mainly affect gap width. Only rod 10 is sensitive to the
selection of fuel swelling and relocation models. Models that predicts larger gaps, provide
higher fuel temperature, FGR and pin pressurization and vice versa.
The MATPRO densification model impacts on fuel temperature and FGR because it affects
mainly the gap size. It predicts smaller gap and therefore, lower fuel temperature and FGR
respect to the reference simulations.
Helium release models have no influence on fuel temperature, pin pressure and FGR in the
simulations, this is due to code limits.
Fuel fabrication porosity impacts on FGR because it affects fuel temperature through
increasing or decreasing the conductivity. Higher porosity causes a significant temperature
increase and vice-versa. FGR varies accordingly.
The gap initial size influences the thermal resistance of the gap. Its increase causes temperature
increase and vice-versa. Fuel temperature has a feedback effect on FGR and therefore on pin

Ricerca Sistema Elettrico
Sigla di identificazione
ADPFISS – LP2 – 041
Rev.
0
Distrib.
L
Pag. di
140 170
internal pressure. Larger gap simulations provide results on FGR that are in good agreement
with experimental evidence; however they cause fuel temperature overestimation in both rods.
Grain size analysis is based on the design uncertainty on this parameter. It revealed that smaller
grains retain less fission gas than bigger ones. It is reflected on the simulations where good
agreement with the experimental data is observed in both rods, if smaller grains are assumed.
However, the FGR thermal feedback leads to fuel temperatures overestimation.
In conclusion, the TRANSURANUS code version 2012 highlights good capability to simulate rod
BD8 from the PRIMO Experiment. The FGR phenomenon, its connected processes and phenomena
and the dimensional change are captured well within their acceptability margin.
The simulation of rod 10 from the IFA-597 Experiment is considered sufficiently satisfactory since the
code captures the fuel temperature trend for the main part of the irradiation and under predicts the FGR
with an error that matches the acceptability lower band (-50%). The code has limited capability to
simulate the hollow pellet rod 11: the fuel temperature is well captured excepts in the last phase of the
experiment while, the FGR and consequently the pressurization, are largely underestimated. Should be
mentioned that IFA-597 was planned to irradiate the two rods up to around 60 MWd/kgMOX but, due
of excessive inner pressure build-up caused by high un-expected FGR, it was interrupted at 33
MWd/kgMOX.

Ricerca Sistema Elettrico
Sigla di identificazione
ADPFISS – LP2 – 041
Rev.
0
Distrib.
L
Pag. di
141 170
REFERENCES
[1] OECD NEA/CSNI/R, Fuel Safety Criteria in Member Countries: Compilation of
Responses Received from NEA Member Countries. Paris, July 2003.
[2] P. Van Uffelen, Contribution to the Modeling of Fission Gas Release in Light Water
Reactor Fuel. PhD Thesis, Nuclear engineering, University of Liege, 2002.
[3] IAEA Status and Advances in MOX Fuel Technology. technical report number 415, Vienna
2003.
[4] Carbajo, J.J., Yoder, et al. A review of thermo-physical properties of MOX and UO2 fuel.
Oak Ridge National Laboratory, ORNL/TM/351, 2000.
[5] Massih, Ali R. Models for MOX fuel behavior, a selective review. SKI Report 2006,10,
January 2006.
[6] Lassmann K., TRANSURANUS: a fuel rod analysis code ready for use, Journal of Nuclear
Material 188 (1992) 295-302.
[7] Van Uffelen P., Modeling of Nuclear Fuel Behavior, Publications Office, JRC
Publications, Report EUR 22321 EN, European Commission, 2006.
[8] Lassmann K., A. Schubert, P. Van Uffelen, Cs. Gyory, J. van de Laar, Transuranus
Handbook Version “v1m1j06”, EC, JRC, ITU, July 2012.
[9] OECD/NEA, The Public Domain Database on Nuclear Fuel Performance Experiments
for the Purpose of Code Development and Validation, International Fuel Performance
Experiments (IFPE). http://www.nea.fr/html/science/fuel/ifpelst.html.
[10] L.J. Ott, Mixed-oxide (MOX) fuel performance benchmark - summary of the results for
the PRIMO MOX rod BD8, OECD, 2009.
[11] Tolonen, P., Pihlatie, M., Fujii, H. The MOX fuel behavior test IFA597-4/5/6;Thermal
and gas release data to a burn-up of 25 MWd/kgMOX. HWR-652, OECD Halden Reactor
Project, February 2001.
[12] Tverberg, T. Mixed-oxide (MOX) Fuel Performance Benchmark, Summary of the
Results for the HRP MOX rods. OECD Halden Reactor Project.
[13] World Nuclear Association Mixed Oxide (MOX) Fuel. http://www.world-nuclear.org
[14] Provost, J.L., Schrader, M., Nomura, S. MOX fuel fabrication and utilization in LWRs
worldwide. ibid., pp. 29–37.
[15] Adamson, M.G., Aitken, E.A., Caputi, R.W. Experimental and thermodynamic evaluation
of the melting behavior of irradiated oxide fuels. Journal of Nuclear Materials, Vol.130,
1985.
[16] Lippens M., et al. Comparative thermal behavior of MOX and UO2 fuels. Thermal
Performance of High Burn-up LWR Fuel (Proc. Sem. Cadarache, 1998), OECD, Paris (1998).
[17] Duriez, C., Alessandri, J.P., Servais, T., Philipponneau, Y. Thermal conductivity of
hypostoichiometric low Pu content (U, Pu)O2–x mixed oxide. J. Nucl. Mater. Vol. 277
(2000) pp. 143–158.
[18] Krebs, W.D., Goll, W. Operational performance of MOX fuel in light water reactors.
paper presented at ANS Winter Mtg, Albuquerque, 1997.

Ricerca Sistema Elettrico
Sigla di identificazione
ADPFISS – LP2 – 041
Rev.
0
Distrib.
L
Pag. di
142 170
[19] Rossiter, G.D., Cook, P.M.A., Weston, R. Isotopic modelling using the ENIGMA-B fuel
performance code. ibid., pp. 227–238.
[20] Lippens, M., Maldague, T., Basselier, J., Boulanger, D., Mertens, L. Highlights on R&D
work related to the achievement of high burnup with MOX fuel in commercial reactors.
MOX Fuel Cycle Technologies for Medium and Long Term Deployment (Proc. Symp.
Vienna, 1999), C&S Papers Series No. 3/P, IAEA, Vienna (2000) 220–232.
[21] Bernard, L.C., Blanpain, P. Overall models and experimental database for UO2 and
MOX fuel increasing performance. ibid., pp. 291–304.
[22] Caillot, L., Delette, G., Piron, J.P., Lemaignan, C. Analytical studies of the behaviour of
MOX fuel,. Light Water Reactor Fuel Performance (Proc. ANS Int. Top. Mtg Portland,
1997), American Nuclear Society, La Grange Park, IL (1997) 62–69.
[23] Wiesenack, W., Mcgrath, M. Performance of MOX fuel: an overview of the experimental
programme of the OECD Halden Reactor Project and review of selected results. MOX
Fuel Cycle Technologies for Medium and Long Term Deployment (Proc. Symp. Vienna,
1999), C&S Papers Series No. 3/P, IAEA, Vienna (2000) 253–262
[24] Freshley, M.D., Brite, D.W., Daniel, J.L., Hart, P.E. Irradiation-induced densification of
UO2 pellet fuel. Journal of Nuclear Materials, 62, pp 138-166, 1976.
[25] Freshley, M.D., Brite, D.W., Daniel, J.L, Hart, P.E. Irradiation-induced densification and
PuO2 particle behavior in mixed-oxide fuel. Journal of Nuclear Materials, 81, pp 63-92,
1979.
[26] Schubert, A., Györi, C., Elenkov, D., Lassmann, K., van de Laar, J. Analysis of Fuel Centre
Temperatures with the TRANSURANUS Code. International Conference on Nuclear Fuel
for Today and Tomorrow – Experiences and Outlook, Würzburg (Germany), 16-19 March
2003.
[27] Weston, R., Palmer, I.D., Wright, G.M., Rossiter, G.D., Corcoran, R.C., Gilmour, T.C.,
Walker, C.T., Bremier, S. Progress on SBR MOX Fuel Development. ENS International
Topical Meeting - Nuclear Fuel: Development to Meet the Challenge of a Changing Market,
Stockholm, 27-30 May, 2001.
[28] Wiesenack, W. Assessment of UO2 Conductivity Degradation Based on In-pile
Temperature Data. Proceedings of the 1997 International Topical Meeting on LWR Fuel
Performance, Portland, Oregon, March 2-6 (1997), p. 507.
[29] Stratton, R.W. Closing statement. MOX Fuel Cycle Technologies for Medium and Long
Term Deployment (Proc. Symp. Vienna, 1999), C&S Papers Series No. 3/P, IAEA, Vienna
(2000) 531–534.
[30] White, R.J. Fission gas release. HWR-632, OECD Halden reactor Project, 2000.
[31] Wiesenack, W. McGrath, M. Performance of MOX fuel: an overview of the experimental
programme of the OECD Halden Reactor Project and review of selected results. IAEA-
SM-358/18, Symposium on MOX fuel cycle technologies for medium and long term
deployment, Vienna, Austria, 1999, CSP-3/P, pp. 253-262.
[32] Kamimura, K., Kobayashi, Y., Nomata, T. Helium generation and release in MOX fuels.
MOX Fuel Cycle Technologies for Medium and Long Term Deployment (Proc. Symp.
Vienna, 1999), C&S Papers Series No. 3/P, IAEA, Vienna (2000) 263–270.
[33] S. Djurle, et al., The Super-Ramp Project, Final report of the Super-Ramp project,
STIR-32, Studsvik AB Atomenergi, Studsvik, Sweden, 1984.

Ricerca Sistema Elettrico
Sigla di identificazione
ADPFISS – LP2 – 041
Rev.
0
Distrib.
L
Pag. di
143 170
[34] CEA, Material Testing Reactors / The OSIRIS Reactor http://www.emtr.eu/osiris.html
[35] Nuclear Energy Directorate, OSIRIS nuclear reactors and service department, Division
for Nuclear Activities Saclay.
[36] Takayki Nakano, The MOX fuel behavior test IFA-597.4.5.6.7. Thermal and Gas Release
Data, OECD HRP, June 2002.
[37] IFE, OECD-HRP Halden Boiling Water Reactor. Institutt for energiteknikk, Halden
January 2003.
[38] Turnbull, J.A. Fuel Behavior Data Available from IFE-OCDE Halden Project for
Development and Validation of Computer Codes. Review of Nuclear Fuel Experimental
Data. OECD-NEA, 1995.
[39] Mertens L., Lippens M., Alvis J., The FIGARO programme: the behavior of irradiated
MOX fuel tested in IFA-606 experiment. description of the results and comparison with
COMETHE calculation, Paper presented in EHPG meeting, Lillehammer, Norway, HPR-349,
paper 30, March 2008.
[40] Cayet, N. Investigation of Delayed Fission Gas Release. HWR-488, May 1996.
[41] P.T. Elton, K. Lassmann, Calculational methods for diffusional gas. J. Nucl. Mater. 101
(1987) 259-265.
[42] Hj. Matzke, Gas release mechanisms in UO2-a critical overview. Radiation Effects, 1980,
Vol. 53, pp. 219-242.
[43] D.M. Dowling, R.J. White and M.O. Tucker, The effect of irradiation-induced resolution
on fission gas release. J. Nucl. Mater. 110 (1982) 37-46.
[44] P. Van Uffelen, A. Schubert, J. van de Laar, C. Győri, Development of a transient fission
gas release model for TRANSURANUS. Water Reactor Fuel Performance Meeting,
October 19-23, Seoul, Korea, 2008.
[45] D. R. Olander, Fundamental Aspects of Nuclear Reactors Fuel Elements. Department of
Nuclear Engineering University of California, Berkeley, 1976.
[46] H. Bailly, D. Menessier, C. Prunier, The Nuclear Fuel of Pressurized Water Reactors and
Fast Neutron Reactors. Collection du Commissariat a l'Energie Atomique, Lavoisier Pub.,
Intercept, Paris, Andover, 1999.
[47] R. J. White, The reduction of fission gas swelling through irradiation induced resolution.
OECD/NEA, pellet clad interaction in water reactor fuels, Seminar Proc., Aix-en-Provence,
France, 2004.
[48] OECD/NEA, Scientific Issues in Fuel Behavior. Nuclear Science Committee, 1995.
[49] A.H. Booth, A Method of Calculating Fission Gas Diffusion from UO2 Fuel and its
Application to the X-2-f Loop Test. CRDC-721 (1957).
[50] M.V. Speight, A calculation on the migration of fission gas in material exhibiting
precipitation and resolution of gas atoms under irradiation. Nucl. Science and
Engineering 37 (1969) 180-185.
[51] K. Forsberg, A.R. Massih, Diffusion theory of fission gas migration in irradiated nuclear
fuel. J. Nucl. Mater. 135 (1985)140-148.

Ricerca Sistema Elettrico
Sigla di identificazione
ADPFISS – LP2 – 041
Rev.
0
Distrib.
L
Pag. di
144 170
[52] R.J. White, A new mechanistic model for the calculation of fission gas release.
Proceedings of the 1994 International Topical Meeting on Light Water Reactor Fuel
Performance, West Palm Beach, Florida (1994) 196-202.
[53] J.A. Turnbull et al., The diffusion coefficients of gaseous and volatile species during the
irradiation of uranium dioxide. J. Nucl. Mater. 107 (1982) 168-184.
[54] R. Manzel, F. Sontheimer, H. Stehle, Fission gas release of PWR fuel under steady and
transient conditions up to high burn-ups. Light Water Reactor Fuel Performance, Orlando,
Florida (1985), DOE/NE/34130-1, Volume 2, p. 4-33.
[55] J.A. Turnbull, Presentation at the IAEA Research Coordination Meeting on Fuel
Modeling at Extended Burn-up (FUMEX). 1-5 April 1996, Bombay, India.
[56] C. Duriez, J. P. Alessandri, T. Gervais, Y. Philipponneau, Thermal conductivity of
hypostoichio-metric low Pu content (U,Pu)O2-x mixed oxide, Journal of Nuclear Materials
277 (2000) 143-158.
[57] C. Ronchi, Annual Report of the European Institute for Transuranium Elements
Commission of the European Communities EUR 18715 EN (1998) .
[58] J.J. Carbajo, G.L. Yoder, S.G. Popov, V.K. Ivanov, A review of the thermophysical
properties of MOX and UO2 fuels, Journal of Nuclear Materials 299 (2001) 181-198.
[59] D.D. Lanning, C.E. Beyer, Proposed FRAPCON-3 MOX fuel thermal conductivity model
compared to Halden fuel temperature data, Enlarged Halden Programme Group Meeting
on High Burn-up Fuel Performance, Safety and Reliability, StorefjellResort Hotel, Gol,
Norway, 8-13 September 2002.
[60] P.G. Lucuta et al., Journal of Nuclear Materials 232 (1996) 166-180.
[61] W. Wiesenack, Assessment of UO2 Conductivity Degradation Based on In-pile
Temperature Data, Proceedings of the 1997 International Topical Meeting on LWR Fuel
Performance, Portland, Oregon, March 2-6 (1997), p. 507.
[62] W. Wiesenack, M. McGrath, Performance of MOX fuel: an overview of the experimental
programme of the OECD Halden Reactor Project and review of selected results (IAEA-
SM-358/18), Symposium on MOX fuel cycle technologies for medium and long term
deployment, Vienna, Austria, 1999, CSP-3/P, pp. 253-262.
[63] Lassmann, H Blank, Modeling of fuel rod behavior and recent advances of TU code,
Nuclear Engineering and design 106(1988) 291-313 North-Holland, Amsterdam.
[64] W. Dienst, I. Müller-Lyda, H. Zimmermann, Swelling, Densification and Creep of Oxide
and Carbide Fuels under Irradiation, Proc. Int. Conf. on Fast Breeder Reactor Fuel
Performance, Monterey, California, March 5-8 (1979) 166.
[65] R.Pesl et al., SATURN-S: Ein Programmsystem zur Beschreibung des
thermomechanischen Verhaltens von Kernreaktorbrennstäben unter Bestrahlung,
Kernforschungszentrum Karlsruhe, KfK 4272 (1987) 58.
[66] H. Zimmermann, Investigations on Swelling and Fission Gas Behavior in Uranium
Dioxide Journal of Nuclear Materials 75 (1978) 154-161.
[67] H. Assmann, H. Stehle, Thermal and In-reactor Densification of UO2: Mechanisms and
Experimental Results, Nucl. Eng. Des., 48 (1978), 49-67

Ricerca Sistema Elettrico
Sigla di identificazione
ADPFISS – LP2 – 041
Rev.
0
Distrib.
L
Pag. di
145 170
[68] Federici, E., Courcelle, A., Blanpain, P., Cognon, H. Helium production and behavior in
nuclear fuelsduring irrdiation in LWR. International LWR Fuel Performance Meeting, San
Francisco, California, USA, September 30 - October 3 2007.
[69] Ronchi, C., Hiernaut, J. P. Helium Diffusion in Uranium and Plutonium Oxides. Journal
of Nuclear Materials, Vol. 325, pp. 1-12, 2004.
[70] K. Lassmann, C. O'Carroll, J. van de Laar, C.T. Walker, The radial distribution of
plutonium in high burn-up UO2 fuels. J. Nucl. Mater. 208 (1994) p. 223.
[71] D. G. Cacuci, Handbook of Nuclear Engineering, Vol. 3
[72] K. Lassmann, A. Moreno The Light-Water-Reactor Version of the URANUS Integral
Fuel –Rod Code; Atomkernenergie (ATKE) Bd. 30 (1977) p. 207-215.
[73] Rozzia D., M. Adorni, A. Del Nevo, F. D'. Auria, Capabilities of TRANSURANUS Code in
Simulating Power Ramp Tests from the IFPE Database, Nucl. Eng. and Des. Issue, Vol.
241 pp. 1078–1086, 2011. Expanded paper from Int. Conf. of Nuclear Energy for New
Europe (NENE) 2009.
[74] Rozzia D., A. Del Nevo, M. Adorni, F. D'. Auria, Modeling of BWR Inter-Ramp Project
Experiments by means of TRANSURANUS Code, Annals of Nuclear Energy (2012) - Vol.
50 (2012) pp. 238–250.
[75] Rozzia D., A. Del Nevo, M. Adorni, F. D'. Auria, Assessment of FGR in LWR Fuels
Subjected to Power Ramps by TRANSURANUS Code, From the IFPE Database,
Proceeding of Int. Conf. of NENE 2011, September, 12-15, 2011, Bovec, Slovenia. Paper n°-
903.
[76] MATPRO-Version 11 (Revision 2), A Handbook of Material Properties for Use in the
Analysis of Light Water Reactor Fuel Rod Behavior, NUREG/CR-0497 TREE-1280, Rev.
2, 1981.
[77] Lee, B., et al., Improvement of Fuel Performance Code COSMOS with Recent In-pile
Data for MOX and UO2 Fuels, Nuclear Technology, Vol. 157, pp. 53-64, 2007.
[78] Mikityuk, K., A. Shestopalov and P. Fomichenko, Calculational Model for Fuel Rod
Behavior Under Accident Conditions, Preprint IAE-6144/5, Moscow, 1999.
[79] White, R., et al., Capabilities and Validation of the ENIGMA Fuel Performance Code,
International Topical Meeting on LWR Fuel Performance, Avignon, France, Vol. 2, p. 919,
1991.
[80] Lanning, D., C. Beyer and C. Painter, FRAPCON-3: Modifications to Fuel Rod Material
Properties and Performance Models for High-burn-up Application, NUREG/CR-6534,
October 1997.
[81] Rashid, Y., R. Dunham and R. Montgomery, FALCON MOD01: Fuel Analysis and
Licensing Code, Volume 1: Theoretical and Numerical Bases, ANA-04-0666 Report,
EPRI, Palto Alto, CA, and ANATECH Corp., San Diego, CA, 2004.
[82] Suzuki, M., Light Water Reactor Fuel Analysis Code FEMAXI-V (ver. 1), JAERI-
Data/Code 2000.
[83] Medvedev, A., S. Bogatyr and V. Kuznetsov, Code START-3: Initial Results of Blind
Prediction of MOX Fuel Performance on Data Provided by the Halden Project, Task
Force on Reactor-based Plutonium Disposition, OECD/NEA, Paris, France, 2001.

Ricerca Sistema Elettrico
Sigla di identificazione
ADPFISS – LP2 – 041
Rev.
0
Distrib.
L
Pag. di
146 170
APPENDIX A: PRIMO, Sensitivity analyses

Ricerca Sistema Elettrico
Sigla di identificazione
ADPFISS – LP2 – 041
Rev.
0
Distrib.
L
Pag. di
147 170
A.1 Assessment of the impact of FGR models on FGR (runs M1)
Fig. A. 1 - PRIMO Program, rod BD8, sensitivity analysis on FGR models, FGRMOD4, BI
Fig. A. 2 - PRIMO Program, rod BD8, sensitivity analysis on FGR models, FGRMOD4, PR.

Ricerca Sistema Elettrico
Sigla di identificazione
ADPFISS – LP2 – 041
Rev.
0
Distrib.
L
Pag. di
148 170
Fig. A. 3 - PRIMO Program, rod BD8, sensitivity analysis on FGR models, FGRMOD6, BI.
Fig. A. 4 - PRIMO Program, rod BD8, sensitivity analysis on FGR models, FGRMOD6, PR.

Ricerca Sistema Elettrico
Sigla di identificazione
ADPFISS – LP2 – 041
Rev.
0
Distrib.
L
Pag. di
149 170
Fig. A. 5 - PRIMO Program, rod BD8, sensitivity analysis on FGR models, FGRMOD9, BI.
Fig. A. 6 - PRIMO Program, rod BD8, sensitivity analysis on FGR models, FGRMOD9, PR.

Ricerca Sistema Elettrico
Sigla di identificazione
ADPFISS – LP2 – 041
Rev.
0
Distrib.
L
Pag. di
150 170
A.2 Assessment of the impact of fuel conductivity on FGR (runs C1)
Fig. A. 7 - PRIMO Program, rod BD8, sensitivity analysis on fuel conductivity, rod centerline
temperature in peak axial position and FGR, base irradiation.
Fig. A. 8 - PRIMO Program, rod BD8, sensitivity analysis on fuel conductivity, rod centerline
temperature in peak axial position and FGR, power ramp.

Ricerca Sistema Elettrico
Sigla di identificazione
ADPFISS – LP2 – 041
Rev.
0
Distrib.
L
Pag. di
151 170
A.3 Assessment of the impact of fuel relocation on FGR (runs M2)
Fig. A. 9 - PRIMO Program, rod BD8, sensitivity analysis on fuel relocation models, FGR and fuel
temperature in peak axial position, base irradiation.
Fig. A. 10 - PRIMO Program, rod BD8, sensitivity analysis on fuel relocation models, FGR and fuel
temperature in peak axial position, power ramp.

Ricerca Sistema Elettrico
Sigla di identificazione
ADPFISS – LP2 – 041
Rev.
0
Distrib.
L
Pag. di
152 170
A.4 Assessment of the impact of fuel swelling correlations on FGR (runs C2)
Fig. A. 11 - PRIMO Program, rod BD8, sensitivity analysis on fuel swelling correlations, FGR and
fuel temperature in peak axial position, base irradiation.
Fig. A. 12 - PRIMO Program, rod BD8, sensitivity analysis on fuel swelling correlations, FGR and
fuel temperature in peak axial position, power ramp.

Ricerca Sistema Elettrico
Sigla di identificazione
ADPFISS – LP2 – 041
Rev.
0
Distrib.
L
Pag. di
153 170
A.5 Assessment of the impact of fuel densification models on FGR (runs M3)
Fig. A. 13 - PRIMO Program, rod BD8, sensitivity analysis on densification models, FGR and fuel
temperature in peak axial position, base irradiation.
Fig. A. 14 - PRIMO Program, rod BD8, sensitivity analysis on densification models, FGR and fuel
temperature in peak axial position, power ramp.

Ricerca Sistema Elettrico
Sigla di identificazione
ADPFISS – LP2 – 041
Rev.
0
Distrib.
L
Pag. di
154 170
A.6 Assessment of the impact of fuel density on FGR (runs D1)
Fig. A. 15 - PRIMO Program, rod BD8, sensitivity analysis on fuel density, FGR and fuel temperature
in peak axial position, base irradiation.
Fig. A. 16 - PRIMO Program, rod BD8, sensitivity analysis on fuel density, FGR and fuel temperature
in peak axial position, power ramp.

Ricerca Sistema Elettrico
Sigla di identificazione
ADPFISS – LP2 – 041
Rev.
0
Distrib.
L
Pag. di
155 170
A.7 Assessment of the impact of fuel average grain size on FGR (runs D2)
Fig. A. 17 - PRIMO Program, rod BD8, sensitivity analysis on fuel average grain size, FGR and fuel
temperature in peak axial position, base irradiation.
Fig. A. 18 - PRIMO Program, rod BD8, sensitivity analysis on fuel average grain size, FGR and fuel
temperature in peak axial position, power ramp.

Ricerca Sistema Elettrico
Sigla di identificazione
ADPFISS – LP2 – 041
Rev.
0
Distrib.
L
Pag. di
156 170
A.8 Assessment of the impact of initial gap size on FGR (runs D3)
Fig. A. 19 - PRIMO Program, rod BD8, sensitivity analysis on fuel gap initial size, FGR and fuel
temperature in peak axial position, base irradiation.
Fig. A. 20 - PRIMO Program, rod BD8, sensitivity analysis on fuel gap initial size, FGR and fuel
temperature in peak axial position, power ramp.

Ricerca Sistema Elettrico
Sigla di identificazione
ADPFISS – LP2 – 041
Rev.
0
Distrib.
L
Pag. di
157 170
APPENDIX B: IFA-597, Sensitivity analyses

Ricerca Sistema Elettrico
Sigla di identificazione
ADPFISS – LP2 – 041
Rev.
0
Distrib.
L
Pag. di
158 170
B.1 Assessment of the impact of FGR models on FGR (runs M1)
(a) Rod 10, FGR (b) Rod 11, FGR
(c) Rod 10, temperature (d) Rod 11, temperature
(e) Rod 10, pin pressure (f) Rod 11, pin pressure
Fig. B. 1 - IFA-597,rod 10 and rod 11, sensitivity analysis on FGR models, FGRMOD4.

Ricerca Sistema Elettrico
Sigla di identificazione
ADPFISS – LP2 – 041
Rev.
0
Distrib.
L
Pag. di
159 170
(a) Rod 10, FGR (b) Rod 11, FGR
(c) Rod 10, temperature (d) Rod 11, temperature
(e) Rod 10, pin pressure (f) Rod 11, pin pressure
Fig. B. 2 - IFA-597,rod 10 and rod 11, sensitivity analysis on FGR models, FGRMOD6.

Ricerca Sistema Elettrico
Sigla di identificazione
ADPFISS – LP2 – 041
Rev.
0
Distrib.
L
Pag. di
160 170
(a) Rod 10, FGR (b) Rod 11, FGR
(c) Rod 10, temperature (d) Rod 11, temperature
(e) Rod 10, pin pressure (f) Rod 11, pin pressure
Fig. B. 3 - IFA-597, rod 10 and rod 11, sensitivity analysis on FGR models, FGRMOD9.

Ricerca Sistema Elettrico
Sigla di identificazione
ADPFISS – LP2 – 041
Rev.
0
Distrib.
L
Pag. di
161 170
B.2 Assessment of the impact of fuel conductivity correlation (runs C1)
(a) Rod 10, FGR (b) Rod 11, FGR
(c) Rod 10, temperature (d) Rod 11, temperature
(e) Rod 10, pin pressure (f) Rod 11, pin pressure
Fig. B. 4 - IFA-597, rod 10 and rod 11, sensitivity analysis on fuel conductivity correlations.

Ricerca Sistema Elettrico
Sigla di identificazione
ADPFISS – LP2 – 041
Rev.
0
Distrib.
L
Pag. di
162 170
B.3 Assessment of the impact of fuel relocation model (runs M2)
(a) Rod 10, FGR (b) Rod 11, FGR
(c) Rod 10, temperature (d) Rod 11, temperature
(e) Rod 10, pin pressure (f) Rod 11, pin pressure
Fig. B. 5 - IFA-597, rod 10 and rod 11, sensitivity analysis fuel relocation models.

Ricerca Sistema Elettrico
Sigla di identificazione
ADPFISS – LP2 – 041
Rev.
0
Distrib.
L
Pag. di
163 170
B.4 Assessment of the impact of fuel swelling correlation (runs C1)
(a) Rod 10, FGR (b) Rod 11, FGR
(c) Rod 10, temperature (d) Rod 11, temperature
(e) Rod 10, pin pressure (f) Rod 11, pin pressure
Fig. B. 6 - IFA-597, rod 10 and rod 11, sensitivity analysis on fuel swelling correlations.

Ricerca Sistema Elettrico
Sigla di identificazione
ADPFISS – LP2 – 041
Rev.
0
Distrib.
L
Pag. di
164 170
B.5 Assessment of the impact of fuel densification model (runs C1)
(a) Rod 10, FGR (b) Rod 11, FGR
(c) Rod 10, temperature (d) Rod 11, temperature
(e) Rod 10, pin pressure (f) Rod 11, pin pressure
Fig. B. 7 - IFA-597, rod 10 and rod 11, sensitivity analysis on fuel densification models.

Ricerca Sistema Elettrico
Sigla di identificazione
ADPFISS – LP2 – 041
Rev.
0
Distrib.
L
Pag. di
165 170
B.6 Assessment of the impact of Helium release model (runs M2)
(a) Rod 10, FGR (b) Rod 11, FGR
(c) Rod 10, temperature (d) Rod 11, temperature
(e) Rod 10, pin pressure (f) Rod 11, pin pressure
Fig. B. 8 - IFA-597, rod 10 and rod 11, sensitivity analysis on Helium release models.

Ricerca Sistema Elettrico
Sigla di identificazione
ADPFISS – LP2 – 041
Rev.
0
Distrib.
L
Pag. di
166 170
B.7 Assessment of the impact of fuel density (runs D1)
(a) Rod 10, FGR (b) Rod 11, FGR
(c) Rod 10, temperature (d) Rod 11, temperature
(e) Rod 10, pin pressure (f) Rod 11, pin pressure
Fig. B. 9 - IFA-597, rod 10 and rod 11, sensitivity analysis fuel initial density.

Ricerca Sistema Elettrico
Sigla di identificazione
ADPFISS – LP2 – 041
Rev.
0
Distrib.
L
Pag. di
167 170
B.8 Assessment of the impact of grain size(runs D2)
(a) Rod 10, FGR (b) Rod 11, FGR
(c) Rod 10, temperature (d) Rod 11, temperature
(e) Rod 10, pin pressure (f) Rod 11, pin pressure
Fig. B. 10 - IFA-597, rod 10 and rod 11, sensitivity analysis on fuel grain size.

Ricerca Sistema Elettrico
Sigla di identificazione
ADPFISS – LP2 – 041
Rev.
0
Distrib.
L
Pag. di
168 170
B.9 Assessment of the impact of gap width (runs D3)
(a) Rod 10, FGR (b) Rod 11, FGR
(c) Rod 10, temperature (d) Rod 11, temperature
(e) Rod 10, pin pressure (f) Rod 11, pin pressure
Fig. B. 11 - IFA-597, rod 10 and rod 11, sensitivity analysis on initial gap width.

Ricerca Sistema Elettrico
Sigla di identificazione
ADPFISS – LP2 – 041
Rev.
0
Distrib.
L
Pag. di
169 170
B.10 Assessment of the impact of plenum length (runs D4)
(a) Rod 10, FGR (b) Rod 11, FGR
(c) Rod 10, temperature (d) Rod 11, temperature
(e) Rod 10, pin pressure (f) Rod 11, pin pressure
Fig. B. 12 - IFA-597, rod 10 and rod 11, sensitivity analysis on plenum length.

Ricerca Sistema Elettrico
Sigla di identificazione
ADPFISS – LP2 – 041
Rev.
0
Distrib.
L
Pag. di
170 170