UrbLog - Prototype 3: Joint System Concept Proposal
104
UNIVERSIDADE DA BEIRA INTERIOR Engenharia UrbLog - Prototype 3: Joint System Concept Proposal A 3D printing application João Pedro Silva Santos Dissertação para obtenção do Grau de Mestre em Engenharia Aeronáutica (ciclo de estudos integrado) Orientador: Prof. Doutor Jorge Miguel dos Reis Silva Co-orientador: Prof. Doutor Pedro Vieira Gamboa Covilhã, abril de 2017
-
Upload
khangminh22 -
Category
Documents
-
view
1 -
download
0
Transcript of UrbLog - Prototype 3: Joint System Concept Proposal

UNIVERSIDADE DA BEIRA INTERIOR Engenharia
UrbLog - Prototype 3: Joint System
Concept Proposal A 3D printing application
João Pedro Silva Santos
Dissertação para obtenção do Grau de Mestre em
Engenharia Aeronáutica (ciclo de estudos integrado)
Orientador: Prof. Doutor Jorge Miguel dos Reis Silva Co-orientador: Prof. Doutor Pedro Vieira Gamboa
Covilhã, abril de 2017

ii

iii
Dedication
To my parents, to whom I owe everything.

iv

v
Acknoledgements
I would like now to express my gratitude to several people who had an important role in the
development of this dissertation, and also during this almost six years of formation at
Universidade da Beira Interior.
In first place to my parents José e Ana, they are the main reason why I was able to conclude
this work. I ow you everything.
To my family, my grandparents, Custódia, Francisco, Maria and José, to my uncle, Henrique,
for all the love and support.
To my supervisor, Professor Jorge Silva, for all the transmitted knowledge, for the provided
guidance, and for ensuring the existence of all the necessary conditions to develop the
presented work.
To my co-supervisor, Professor Pedro Gamboa, for all the transmitted knowledge, for the all
the advices, and for the availability.
To João Neves, for all the help, support, advices and ideas.
To Professors Rosário Macário and Vasco Reis, for the time and for the participation in this
work.
To all the professors and staff of the department, for the transmitted knowledge and support
over this six years.
To my true friends Luís Trindade, Nuno Santos and Pedro Carrola, for everything, for all the
help and support, for your friendships, and for all the memories forever present in my heart.

vi
vii
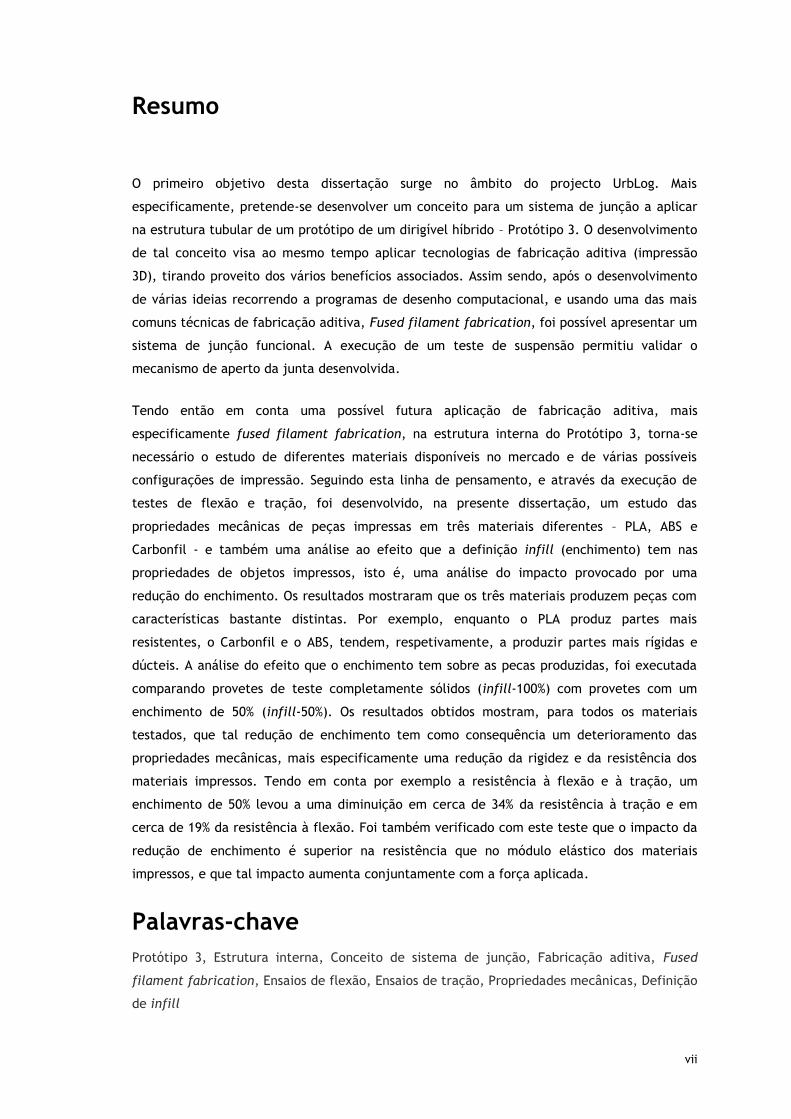
Resumo
O primeiro objetivo desta dissertação surge no âmbito do projecto UrbLog. Mais
especificamente, pretende-se desenvolver um conceito para um sistema de junção a aplicar
na estrutura tubular de um protótipo de um dirigível híbrido – Protótipo 3. O desenvolvimento
de tal conceito visa ao mesmo tempo aplicar tecnologias de fabricação aditiva (impressão
3D), tirando proveito dos vários benefícios associados. Assim sendo, após o desenvolvimento
de várias ideias recorrendo a programas de desenho computacional, e usando uma das mais
comuns técnicas de fabricação aditiva, Fused filament fabrication, foi possível apresentar um
sistema de junção funcional. A execução de um teste de suspensão permitiu validar o
mecanismo de aperto da junta desenvolvida.
Tendo então em conta uma possível futura aplicação de fabricação aditiva, mais
especificamente fused filament fabrication, na estrutura interna do Protótipo 3, torna-se
necessário o estudo de diferentes materiais disponíveis no mercado e de várias possíveis
configurações de impressão. Seguindo esta linha de pensamento, e através da execução de
testes de flexão e tração, foi desenvolvido, na presente dissertação, um estudo das
propriedades mecânicas de peças impressas em três materiais diferentes – PLA, ABS e
Carbonfil - e também uma análise ao efeito que a definição infill (enchimento) tem nas
propriedades de objetos impressos, isto é, uma análise do impacto provocado por uma
redução do enchimento. Os resultados mostraram que os três materiais produzem peças com
características bastante distintas. Por exemplo, enquanto o PLA produz partes mais
resistentes, o Carbonfil e o ABS, tendem, respetivamente, a produzir partes mais rígidas e
dúcteis. A análise do efeito que o enchimento tem sobre as pecas produzidas, foi executada
comparando provetes de teste completamente sólidos (infill-100%) com provetes com um
enchimento de 50% (infill-50%). Os resultados obtidos mostram, para todos os materiais
testados, que tal redução de enchimento tem como consequência um deterioramento das
propriedades mecânicas, mais especificamente uma redução da rigidez e da resistência dos
materiais impressos. Tendo em conta por exemplo a resistência à flexão e à tração, um
enchimento de 50% levou a uma diminuição em cerca de 34% da resistência à tração e em
cerca de 19% da resistência à flexão. Foi também verificado com este teste que o impacto da
redução de enchimento é superior na resistência que no módulo elástico dos materiais
impressos, e que tal impacto aumenta conjuntamente com a força aplicada.
Palavras-chave
Protótipo 3, Estrutura interna, Conceito de sistema de junção, Fabricação aditiva, Fused
filament fabrication, Ensaios de flexão, Ensaios de tração, Propriedades mecânicas, Definição
de infill

viii

ix
Abstract
Within UrbLog project, this dissertation first goal involves the development of a joint system
concept to apply on the tubular internal structure of a hybrid airship prototype – Prototype 3.
Such concept aims the application of additive manufacturing technologies, taking advantage
of all benefits associated to this type of fabrication. Resorting then to the fused filament
fabrication (one of the most common type of additive manufacturing technology), and after
the development of several ideas using computer aided design software, a functional joint
system concept was presented. The clamping mechanism capacity of the developed joint was
validated by means of a suspension test.
Taking into account a possible application of additive manufacturing technology, more
specifically the fused filament fabrication, on Prototype 3 structure, it is necessary to
conduct studies on the commercially available materials and on the different printing
settings. Therefore, the following dissertation also aimed the execution of flexural and
tensile trials to analyse both the mechanical properties of parts printed with three different
materials – PLA, ABS, and Carbonfil-, and the impact of the infill printing setting (or in other
words evaluate the impact of an internal mass reduction). The obtained results showed that
all three materials produce parts with quite distinct characteristics. While PLA parts present
the highest strength values, Carbonfil and ABS printed samples are respectively the stiffer
and the most ductile. The internal mass reduction study was performed by comparing the
mechanical properties of test samples with 100% and 50% infill percentages. For all materials,
such reduction led to a decrease on both the stiffness and strength of the printed parts.
Regarding, for example the tensile and flexural strength, 50% infill parts showed a reduction
of respectively 34% and 19% when comparing with the completely solid samples. It was also
observed within this trial, that the infill impact on parts strength is superior comparing with
the specific modulus, and that such impact increases along the applied load.
Keywords
Prototype 3, Internal structure, Joint system concept, Additive manufacturing, Fused filament
fabrication, Flexural trials, Tensile Trials, Mechanical Properties, Infill setting

x

xi
List of Contents
1. Introduction ............................................................................................... 1
1.1. Motivation ........................................................................................... 1
1.2. Objectives .......................................................................................... 2
1.3. Dissertation Structure ............................................................................ 3
2. State of the Art .......................................................................................... 4
2.1. Introduction ........................................................................................ 4
2.2. Airships .............................................................................................. 4
2.2.1. General Information ........................................................................ 4
2.2.2. Conventional Airships ....................................................................... 4
2.2.2.1. Non-rigid Airships ................................................................... 4
2.2.2.2. Semi-rigid Airships .................................................................. 5
2.2.2.3. Rigid Airships ......................................................................... 6
2.2.3. Unconventional airships – hybrid airships ............................................... 7
2.3. Additive manufacturing........................................................................... 9
2.3.1. An Overview .................................................................................. 9
2.3.2. AM process logic ........................................................................... 10
2.3.3. AM advantages and limitations – comparison with TM .............................. 11
2.3.4. AM processes ............................................................................... 13
2.3.5. AM feedstock materials ................................................................... 14
2.3.6. Fused Filament Fabrication .............................................................. 15
2.4. Mechanical properties of materials .......................................................... 18
2.4.1. General concepts – Stress and Strain .................................................. 18
2.4.2. Tensile and flexural tests ................................................................ 19
2.4.2.1. Tensile test ......................................................................... 19
2.4.2.2. Flexural test ........................................................................ 21
2.5. Conclusion ........................................................................................ 22
3. Joint system concept proposal ...................................................................... 23
3.1. Introduction ...................................................................................... 23
3.2. Lattice Structure................................................................................. 23
3.3. New Proposal ..................................................................................... 24
3.3.1. Concept Development .................................................................... 24
3.3.2. Clamping mechanism validation ........................................................ 31
3.3.3. Assembly test .............................................................................. 33
3.3.3.1. Components nomenclature ...................................................... 33
3.3.3.2. Components production and assembly ........................................ 36
3.4. Conclusion ........................................................................................ 36
4. Mechanical Tests ....................................................................................... 38

xii
4.1. Introduction ...................................................................................... 38
4.2. Methodology ...................................................................................... 38
4.3. Flexural Tests .................................................................................... 39
4.3.1. ASTM D790 – 15 standard ................................................................. 39
4.3.2. Equipment .................................................................................. 40
4.3.3. Test Specimen ............................................................................. 40
4.3.4. Printing set up ............................................................................. 41
4.3.5. Data to be determined ................................................................... 42
4.3.6. Test procedure ............................................................................. 42
4.3.7. Calculations processing ................................................................... 43
4.3.8. Results ....................................................................................... 44
4.3.8.1. ABS ................................................................................... 44
4.3.8.2. PLA ................................................................................... 46
4.3.8.3. Carbonfil ............................................................................ 48
4.4. Tensile Tests ..................................................................................... 50
4.4.1. ASTM D638 - 10 standard ................................................................. 50
4.4.2. Equipment .................................................................................. 50
4.4.3. Test specimen .............................................................................. 51
4.4.4. Printing Set-up ............................................................................. 52
4.4.5. Data to be determined ................................................................... 52
4.4.6. Test procedure ............................................................................. 53
4.4.7. Calculations Processing ................................................................... 54
4.4.8. Results ....................................................................................... 55
4.4.8.1. ABS ................................................................................... 55
4.4.8.2. PLA ................................................................................... 57
4.4.8.3. Carbonfil ............................................................................ 59
4.5. Results analysis .................................................................................. 61
4.5.1. Elasticity modulus ......................................................................... 61
4.5.2. Flexural and Tensile Strength ........................................................... 62
4.5.3. Yield Flexural Strength and Ductility .................................................. 63
4.6. Conclusion ........................................................................................ 65
5. Conclusion .............................................................................................. 66
5.1. Dissertation synthesis ........................................................................... 66
5.2. Final Considerations ............................................................................ 66
5.3. Future works ..................................................................................... 67
References .................................................................................................... 68
Annex - Flexural and Tensile trials – graphs ............................................................ 71

xiii
List of figures
Figure 1 – Conceptual design of UrbLog Airship – adapted from [1]. ................................. 2 Figure 2 – Different types of conventional airships [8]. ................................................. 5 Figure 3 – Aeroscraft internal structure [13]. ............................................................. 6 Figure 4 – Hybrid airship logic [7]. .......................................................................... 7 Figure 5 – Hybrid lift composition [16]. .................................................................... 8 Figure 6 – Lockheed Martin P-791 hybrid airship [17]. .................................................. 8 Figure 7 – General Electric 3D printed fuel nozzle [25]. .............................................. 10 Figure 8 – AM process logic [19]. .......................................................................... 11 Figure 9 – Fused Filament Process [26] . ................................................................ 15 Figure 10 – Aurora Flight Sciences and Stratasys developed 3D printed jet-powered UAV [29]. .................................................................................................................. 18 Figure 11 – Part under tensile stress [32]. ............................................................... 18 Figure 12 – Typical stress-strain curve [31]. ............................................................ 19 Figure 13 – Three/four-point bending tests and respective bending moment diagrams[31]. .. 21 Figure 14 – Three-point flexural test [33]. .............................................................. 22 Figure 15 - Prototype 3’s internal structure proposal [2]. ........................................... 23 Figure 16 – Assembly test of a Prototype 3’s section [2]. ............................................ 24 Figure 17 – Adapted Prototype 3 internal structure scheme. ........................................ 25 Figure 18 – Propeller adapter mechanism [38]. ........................................................ 26 Figure 19 – First idea - joint system components. ..................................................... 26 Figure 20 – First idea - joint system fully assembled .................................................. 26 Figure 21 – First idea – 3D printed joint system. ....................................................... 27 Figure 22 – Collet mechanism used in drilling devices [39]. ......................................... 28 Figure 23 - Second idea – joint system. .................................................................. 29 Figure 24 – Collet piece technical drawings. ............................................................ 29 Figure 25 – Cap piece technical drawings. .............................................................. 30 Figure 26 - Second idea – 3D printed clamping mechanism. ......................................... 30 Figure 27 – Different tested PVC tubes. ................................................................. 31 Figure 28 – Suspension test. ................................................................................ 32 Figure 29 – Numbering order of Prototype’ 3 frames. ................................................. 33 Figure 30 – Joints numeration. ............................................................................ 34 Figure 31 - Joints nomenclature – example. ............................................................ 34 Figure 32 - Tubes nomenclature – example. ............................................................ 35 Figure 33 - Tubes nomenclature – example. ............................................................ 35 Figure 34 – Assembly test – F3J1 joint CAD Model and 3D printing result. ........................ 36 Figure 35 – Test batches. ................................................................................... 39 Figure 36 – Dimensions of the flexural test samples. .................................................. 40 Figure 37 – Printing deposition direction of all specimens. .......................................... 41 Figure 38 – Flexural test sample ready to be tested. ................................................. 43 Figure 39 – ABS flexural test samples. ................................................................... 44 Figure 40 – Flexural Stress vs Flexural Strain for ABS-100% infill-specimen 3. .................... 45 Figure 41 - Flexural Stress vs Flexural Strain for ABS-50% infill-specimen 3. ..................... 46 Figure 42 - PLA flexural test samples. ................................................................... 46 Figure 43 - Flexural Stress vs Flexural Strain for PLA-100% infill-specimen 3. .................... 47 Figure 44 - Flexural Stress vs Flexural Strain for PLA-50% infill-specimen 3. ..................... 48 Figure 45 - Carbonfil flexural test samples. ............................................................ 48 Figure 46 - Flexural Stress vs Flexural Strain for Carbonfil-100% infill-specimen 3. ............. 49 Figure 47 - Flexural Stress vs Flexural Strain for Carbonfil-50% infill-specimen 3. .............. 50 Figure 48 – Dimensions of the tensile test samples. ................................................... 51 Figure 49 – Tensile test sample ready to be tested. ................................................... 53 Figure 50 - ABS tensile test samples...................................................................... 55 Figure 51 – Tensile Stress vs Stroke Strain for ABS-100% infill- specimen 3. ...................... 56 Figure 52 - Tensile Stress vs Stroke Strain for ABS-50% infill- specimen 3. ........................ 57 Figure 53 - PLA tensile test samples. .................................................................... 57

xiv
Figure 54 - Tensile Stress vs Stroke Strain for PLA-100% infill- specimen 3. ...................... 58 Figure 55 - Tensile Stress vs Stroke Strain for PLA-50% infill- specimen 3. ....................... 59 Figure 56 - Carbonfil tensile test samples. .............................................................. 59 Figure 57 - Tensile Stress vs Stroke Strain for Carbonfil-100% infill- specimen 3. ............... 60 Figure 58 - Tensile Stress vs Stroke Strain for Carbonfil-50% infill- specimen 3. ................. 61

xv
List of tables
Table 1 – AM technologies and associated feedstock materials [20], [22]. ........................ 14 Table 2 – Important FFF parameters [27]. ............................................................... 16 Table 3 – Suspension tests results. ........................................................................ 32 Table 4 – Printing set up definitions. ..................................................................... 41 Table 5 – Data to be determined on the flexural trials. .............................................. 42 Table 6 –Printing temperature conditions of ABS flexural test samples. .......................... 44 Table 7 – Mass of 50 and 100% infill ABS flexural samples. ........................................... 45 Table 8 – Obtained data from ABS flexural tests. ...................................................... 45 Table 9 - Printing temperature conditions of PLA flexural test samples. ......................... 46 Table 10 - Mass of 50 and 100% infill PLA flexural samples. ......................................... 47 Table 11 - Obtained data from PLA flexural tests. .................................................... 47 Table 12 - Printing temperature conditions of Carbonfil flexural test samples. ................. 48 Table 13 - Mass of 50 and 100% infill Carbonfil flexural samples. .................................. 49 Table 14 - Obtained data from Carbonfil flexural tests............................................... 49 Table 15 – Printing set up definitions. ................................................................... 52 Table 16 – Data to be determined in the tensile trials. ............................................... 52 Table 17 - Printing temperature conditions of ABS tensile test samples. ......................... 55 Table 18 - Mass of 50 and 100% infill ABS tensile samples. ........................................... 55 Table 19 - Obtained data from ABS tensile tests. ...................................................... 56 Table 20 - Printing temperature conditions of PLA tensile test samples. ......................... 57 Table 21 - Mass of 50 and 100% infill PLA tensile samples............................................ 58 Table 22 - Obtained data from PLA tensile tests. ...................................................... 58 Table 23 - Printing temperature conditions of Carbonfil tensile test samples. .................. 59 Table 24 - Mass of 50 and 100% infill Carbonfil tensile samples. .................................... 60 Table 25 - Obtained data from Carbonfil tensile tests. ............................................... 60

xvi

xvii
List of graphs
Graph 1 - Flexural elastic modulus results comparison ............................................... 62 Graph 2 - Tensile elastic modulus results comparison ................................................ 62 Graph 3 - Flexural strength results comparison ........................................................ 63 Graph 4 - Tensile strength results comparison ......................................................... 63 Graph 5 - Flexural yield strength results comparison ................................................. 64

xviii

xix
List of acronyms
ABS Acrylonitrile Butadiene Styrene
AM Additive Manufacturing
ASTM American Society for Testing and Materials
CAD Computer Aided Design
FDM Fused Deposition Modelling
FFF Fused Filament Fabrication
GE General Electric
HTA Heavier-Than-Air
LTA Lighter-Than-Air
PC Polycarbonate
PLA Polylactic Acid
PVC Polyvinyl Chloride
SI Système International d’unités
STL Standard Tessellation Language
STOL Short Take-Off and Landing
TM Traditional Manufacturing
UAV Unmanned Aerial Vehicle
VTOL Vertical Take-Off and Landing

xx

1
1. Introduction
1.1. Motivation
The current dissertation arose within the UrbLog project. This project consists in the
development of a multifunctional system of air transport, and it has already been submitted
to an invention patent request [1] required by the Instituto Superior Técnico and Universidade
da Beira Interior. The involved inventors are:
Maria do Rosário Maurício Ribeiro Macário, Instituto Superior Técnico;
Vasco Domingo Moreira Lopes Miranda dos Reis, Instituto Superior Técnico;
Jorge Miguel Dos Reis Silva, Universidade da Beira Interior;
Pedro Vieira Gamboa, Universidade da Beira Interior;
João Alexandre Justino Infante do Nascimento Neves, Universidade da Beira
Interior.
This project, intends to be an answer to the nearly exclusive use of road transportation by
the urban logistic services, aiming to improve those services, contributing with a higher
efficiency and with a solution to the current problems, such as, the pollution levels, the fast
infrastructures degradation and the misuse of public spaces [1].
Briefly, the multifunctional system of air transport consists of three parts: a modular hybrid
airship, a landing tower, and the respective mooring mechanism. The airship (Figure 1) is
characterized by a rigid hull with a variable length, able to be composed with different
numbers of modules depending of the weight to be transported. This hull is endowed with an
aerodynamic shape, suited to generate dynamic lift. The airship is equipped with two wing
pairs capable of incidence variation, one in the front and the other in the back module. Also,
each one of this wings contains a lifting rotor with variable pitch blades. Vertical stabilizers
and a propulsive rotor are installed on the rear module. Attached to the hull, a multi modular
cabin will accommodate the systems, the cargo or passengers (depending on the flight
purpose), and also, the pilot section. A more detailed description of the project can be found
in [1].
Within this project, several tasks have been performed, each one studying and evaluating
different operational and engineering aspects. This current dissertation stands as
continuation of the work developed on the following MSc dissertations: “Internal Structure of
Hybrid Airships: Airships Design and Structural Analyses” [2] and also “Manufacturing
Techniques of a Hybrid Airship Prototype” [3]. Both dissertations analysed the application of a
structural proposal on the UrbLog airship. These investigations were performed within the
development of an UrbLog prototype, designated as Prototype 3. During the studies, several
problems were noticed and, consequently, the obtained results were not the expected. Such

2
drawbacks (which will be latter detailed on this work) stood as the starting point for the
current dissertation, which, of course, aims to present different solutions for Prototype 3
internal structure.
Even though this project was developed aiming the urban logistic services, in [1] several other
possible applications are enunciated. As such, recently the project gained a new direction
towards the aerial surveillance and also the collection of ground information for cartographic
purposes. Currently, the development of the previously mentioned Prototype 3, is now
targeting this type of missions.
1.2. Objectives
The outlined objectives for this dissertation are:
• To develop a joint system concept for Prototype 3 tubular structure, employing
additive manufacturing (AM) technology:
◦ To validate the joint working mechanism;
◦ To validate the suitability of the joint system by means of an assembly test.
• To determine, analyse and compare the mechanical properties of 3D printed parts
using different fused filament fabrication (FFF) materials available on the market, in
view of a possible application on the joint system;
• To study the effect of internal material reduction on the mechanical properties of
3D printed objects, aiming a possible weight reduction of the joint system.
Figure 1 – Conceptual design of UrbLog Airship – adapted from [1].

3
1.3. Dissertation Structure
This dissertation is organized in five chapters. Listing in order: Introduction, State of the Art,
Joint system concept proposal development, FFF materials – Mechanical Tests, and by last,
the Conclusion chapter. The Introduction will describe to the motivation behind this work,
the outlined objectives and also the dissertation structure. The second chapter, the State of
the Art, will cover the information retained from the literature, considered adequate to
support the developed work throughout this dissertation. In the third chapter the first defined
objective will be addressed, covering the whole process involving the development of the
joint system concept proposal and also the referred validation tests. The forth chapter, in
turn, includes both the study on the mechanical properties of different FFF materials, and on
the effect of the internal material reduction on the properties of produced objects. Finally, a
dissertation synthesis, final remarks about the developed work, and several future work
topics will be presented in the conclusion chapter.

4
2. State of the Art
2.1. Introduction
In this second chapter, the state of the art, it is intended to review the different matters
composing this dissertation. The chapter begins with a clarification on the airships concept,
also addressing the existent hull configurations and the non-conventional hybrid design. On a
second stage, an additive manufacturing overview is presented, covering its evolution, the
different applications, and the different technologies and feedstock materials. Due to its
importance throughout this work, a special emphasis will be placed on the fused filament
fabrication technology. By last, a brief review of the concepts behind tensile and flexural
tests will also be performed.
2.2. Airships
2.2.1. General Information
An airship is a lighter than-air vehicle (LTA), which, unlike the heavier than air (HVA) (fixed
wing and rotary wing aircraft) vehicles that create their lift through the motion of a wing
through the air, uses the buoyancy forces created by a lifting gas (normally helium) enclosed
in the airship envelope as main source of lift [4], [5], [6]. Also, an airship must be provided
with propulsion and control systems [5], [6].
There are several ways to classify airships. As mentioned in [5], a classification can be made
based on the hull configuration, that is, if the airship is rigid, semi-rigid, or non-rigid; based
on the way of producing vertical force, if it is by LTA means only, or using both LTA and HVA
capabilities (hybrid design); based on the payload range, heavy or medium lift, or even if the
airship is considered as conventional or unconventional. It can be understood as an
unconventional airship, a subject with a significant difference when compared with a
conventional one, regarding for example, the shape, the lift method, the payload capacity
and the power source.
2.2.2. Conventional Airships
2.2.2.1. Non-rigid Airships
Non-rigid airships, also known as blimps, are airships with no skeletal frame, and their
structural integrity and shape are maintained by a pressure differential between the lifting
gas used in the hull and the atmosphere [4], [5], [7]. The envelope acquires a residual tension
becoming stiff enough and capable to withstand bending effects and to support all structural
features [7]. In this type of configuration the gondola, engine and fins are the only rigid
components [4].

5
As can be seen in Figure 2 (at the top left, corresponding to the non-rigid airship) an envelope
actuates as a gas containment barrier, and includes both the lifting gas and the ballonets [5].
The ballonets are inflated with air by blowers, and so, through this mechanism they are used
to control the pressure levels, which vary according to altitude and temperature changes, and
also the airship pitch. Attached to the envelope there is an adjustable catenary cable system
which supports the vertical portion of the gondola load. The longitudinal load is transferred
to the envelope by means of an external suspension system.
This type of configuration is structurally simple, and therefore, such vehicles have an easier
design, construction, maintenance and storability [4], [5]. For all these reasons, the non-rigid
airship is nowadays the most common type of airship [4].
2.2.2.2. Semi-rigid Airships
Semi-rigid airships present characteristics from both rigid and non-rigid airships [7], [5].
Despite of not having an internal structure to support their envelopes, they are constituted by
a rigid keel, which runs along the bottom surface of the airship and allows the attachment of
the fins and engine units [4], [5], [7]. The normal configuration of a semi-rigid airship is
represented at the top right of Figure 2.
The mutual action between the keel and envelope is favourable since they act together to
provide structural integrity during flight, carrying the effects of the bending moments and
maintaining the shape of the airship [4], [7]. Despite the shape of the hull being mainly
maintained by the internal pressure from the lifting gas, localized framework at the nose and
tail also contribute to the outer shape [4]. In this type of airships the keel equally distributes
the gondola weight over the entire length of the airship, therefore the catenary cable system
mentioned in the previous configuration has a much reduced importance [5].
Although in the times that followed the 1930’s semi-rigid airships fell into disuse, in the
recent years, and thanks to the development of the Zeppelin NTs, the interest in this type of
airship has been revived [4]. [8]
Figure 2 – Different types of conventional airships [8].

6
2.2.2.3. Rigid Airships
Rigid airships (bottom of Figure 2), unlike the two structural types previously mentioned, do
not maintain their shape due to the internal pressure of the lifting gases, but through a
lightweight structural framework on which the envelope is connected [4], [5]. This structural
shell, normally composed of circular frames and longitudinal girders, supports all the external
loads applied on the airship and also all other structural features and systems [5], [7]. Once
there is no need to apply large suspension systems on the envelopes of rigid airships, such
envelopes have lower strength requirements comparing with the ones for non-rigid airships
[5]. The application of an internal framework allows the construction of airships with superior
strength, and thanks to that, airships of much larger dimensions, since the chance of hull
bending, due to the aerodynamic forces and applied moments, no longer exist[4], [5]. Also, a
rigid structure helps prevent the occurrence of nose crash during high speed conditions [5].
Inside the skeletal structure of rigid airships, between the circular frames, many gas cells
holding the lifting gas are placed [4], [5], [7]. In, this way when one of the gas cells is
damaged, sudden loss of lift is avoided, increasing the safety of the airship and minimizing
the chances of disaster [4], [5].
The construction of big rigid airships suffered a big reduction after the Hinderburg disaster in
1937 and the second great war [9]. Now, seventy years later a new rigid airships enters on the
stage [10]. The Aeroscraft prototype developed by Aeros Corporation aims to demonstrate its
lightweight rigid structure technology, showing that such structure can be at the same time
light and strong, capable of withstanding air loads without failing [5].
Likewise the Zeppelins developed at the beginning of the 20th century [11], the Aeroscraft
also uses transverse frames connected by longitudinal girders employing a truss system
(Aeroscraft structure is composed by approximately two hundred trusses) (Figure 3) [12]. The
materials used on the structure are ultra-light aluminium and carbon fiber [12]. [13]
Figure 3 – Aeroscraft internal structure [13].
7
Despite all the benefits of the rigid airships, there are always downsides. The inherent
superior weight, the high cost of tooling and manufacturing, and the complicated assembly of
the different structural components, are all aspects to put under consideration [5].
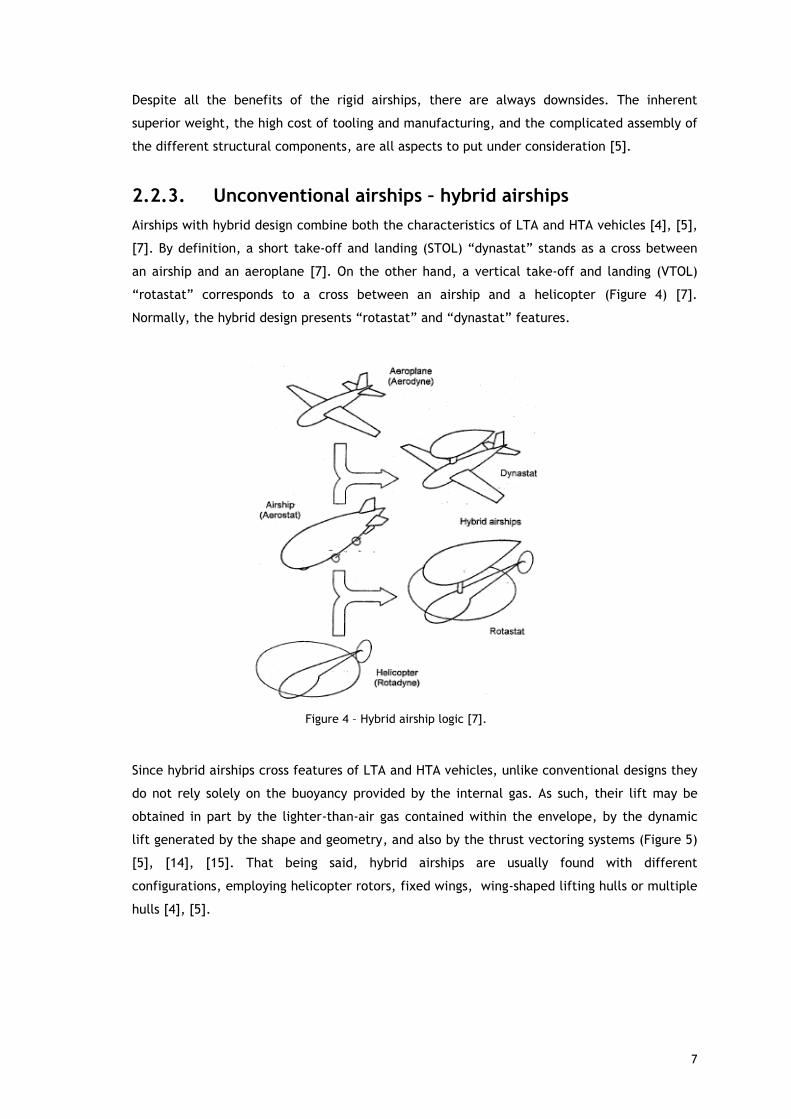
2.2.3. Unconventional airships – hybrid airships
Airships with hybrid design combine both the characteristics of LTA and HTA vehicles [4], [5],
[7]. By definition, a short take-off and landing (STOL) “dynastat” stands as a cross between
an airship and an aeroplane [7]. On the other hand, a vertical take-off and landing (VTOL)
“rotastat” corresponds to a cross between an airship and a helicopter (Figure 4) [7].
Normally, the hybrid design presents “rotastat” and “dynastat” features.
Since hybrid airships cross features of LTA and HTA vehicles, unlike conventional designs they
do not rely solely on the buoyancy provided by the internal gas. As such, their lift may be
obtained in part by the lighter-than-air gas contained within the envelope, by the dynamic
lift generated by the shape and geometry, and also by the thrust vectoring systems (Figure 5)
[5], [14], [15]. That being said, hybrid airships are usually found with different
configurations, employing helicopter rotors, fixed wings, wing-shaped lifting hulls or multiple
hulls [4], [5]. [16]
Figure 4 – Hybrid airship logic [7].

8
Figure 5 – Hybrid lift composition [16].
The combination of the different forms of lift allows the airship to climb and descend in a
heavier-than-air way, which is a very important characteristic for a greater payload range
[15]. This stands as a solution to the struggle that the buoyancy control gave to the engineers
over the years, in what concerns designing airships for cargo lift.
The maximization of the payload capacity, the optimization of the fuel efficiency, the STOL
and VTOL capacities, set for hybrid airships a potential of efficient transportation of a large
range of payload, offering advantages to the distribution network [15]. This type of vehicle
turns to be more economic to operate than the heavier-than-air and do no need the
expensive infrastructures required for the air and sea transportation. At the same time,
unlike the conventional transportation ways, the hybrid airship has the advantage of avoiding
port operations, managing to deliver in a direct way the transported cargo. [17]
In figure 6, it is presented an example of a hybrid airship, the Lockheed Martin P-791.
The hybrid airship has been a vehicle subjected to study and research throughout airship
history [5]. However, and despite the several examples that have been built and flown in
order to further improve the study and to verify the inherent technology, still no subject has
been developed aiming commercial production purposes [4].
Figure 6 – Lockheed Martin P-791 hybrid airship [17].

9
2.3. Additive manufacturing
2.3.1. An Overview
Addictive manufacturing, also very commonly called 3D printing, as defined by the American
Society for Testing and Materials (ASTM) Standard Terminology for Additive Manufacturing
Technologies (F2792-12a) [18] (p. 2), is a “process of joining material to make objects from
3D model data, usually layer upon layer, as opposed to subtractive manufacturing
methodologies”.
This new technology, with the concept of adding material instead of removing it, is being
considered as a revolution in the actual industry model. In fact, as is stated in Strategic
Foresight Report of Atlantic Council [19] (p. 1): “Now another new technology is gaining
traction that may change the world. 3D Printing/Additive Manufacturing (AM) is a
revolutionary emerging technology that could up-end the last two centuries of approaches to
design and manufacturing with profound geopolitical, economic, social demographic,
environmental, and security implications”. Also, in the same report, it is referred that the
impact of AM technology may become comparable to the impact that the PC and Internet
achieved in the world. For a better understanding of these points of view, the advantages and
also limitations of AM when comparing with traditional manufacturing (TM) will be later
described in this chapter. In any case, the known fact is that AM is definitely ready to bring a
huge change in the way products are designed, manufactured and distributed to end users
[20].
For more than thirty years, since the 1980’s decade, we have witnessed a AM continuous
growth, and so, as result, several different processes and technologies have been developed
and also commercialized [21], [22]. The year of 1986 was marked with the creation of 3D
Systems, Inc., which stands as the first company to commercialize AM technology with the
stereolithography process [22]. However, this was just the beginning. Still in 1986 more AM
patents appeared, resulting in three more companies, Helisys, Cubital and DTM, each one
respectively with the laminated object manufacture, solid ground curing and selective laser
sintering [23]. Later in 1989, Scott Crump patented the Fused Deposition Modelling (FDM)
creating Stratasys Company [23] . Also, in the same year MIT group patented 3D printing [23].
These last two technologies are being massively used nowadays, making a special reference
to the success achieved by the FDM variants (the so called FFF technology) [23].
One very important aspect which should most definitely be mentioned is the fact that AM
technology only became possible due to the development of a variety of other supporting
technologies [23], [24]. Specifying, the development of the computer and its features
(processing power, graphic capacity, machine control, etc.), which made possible the so
necessary computer aided design (CAD), the development of the laser and printing

10
technologies, the development of Programmable Logic Controllers, and also off course, the
constant research on materials [23], [24].
A clear division can be made on the development timeline of AM technology. In fact, in the
1990’s decade, AM technology was mainly used as a fast prototyping method, providing, for
example, conceptual models of new products for evaluation and presentation purposes [19],
[22]. However, not too much time after, since the late 1990’s the policy started to change,
and the prototyping gradually became end-part fabrication [19], [22] This was, of course, a
clear consequence, as mentioned in [19], of the improvement of the material properties and
of the process repeatability.
Additive manufacturing applications may be found in different fields [19], [21], [22]. For
example, regarding the aerospace industry, several companies are now aiming to apply this
type of fabrication in the production of components for unmanned aircraft, satellites, jet
engines, etc. [21], [22]. A well-known example is the case of the 3D printed fuel nozzle
produced by General Electric (GE) (Figure 7). Using selective laser melting technology, GE
managed not only to avoid assembly necessities, but also to create a component 25% lighter
and five times stronger than the predecessor [25]. This 3D printed part is applied in the next
generation of GE Leading Edge Aviation Propulsion engines [25]. Still regarding the aerospace
industry, AM technologies are also employed in the execution of engine repairs [21]. The
automotive industry is likewise already using AM technologies in the production of different
parts, such as, gearboxes, suspension systems and engine parts [19], [21].
2.3.2. AM process logic
A simple explanation can be made about the general process of additive manufacturing
(Figure 8). In order to create a specific object, firstly, and making use of a CAD program, it is
Figure 7 – General Electric 3D printed fuel nozzle [25].

11
necessary to obtain a 3D model and saving it as a Standard Tessellation Language (STL)
extension file. Previously, with the help of a proper software, the model file is sliced into
several individual cross-sectional layers, and a toolpath is defined. With this process, a
computer file corresponding to the instructions that must be sent to the AM machine in order
to initiate the process is created. After being given the instructions, the 3D printer will then
add consecutive layers of material until the desired object is formed.
2.3.3. AM advantages and limitations – comparison with TM
To better understand the impact that AM technology may bring, it is important to establish a
comparison between this new technology and the more traditional manufacturing practices,
such as casting, injection moulding, machining, stamping, etc.
AM advantages based on [19], [20], [21], [22]:
Part Complexity – One of the most obvious advantages of the layer by layer
deposition systems is the possibility of creating objects with a complex
geometry, not possible with other technologies;
Waste reduction – As mentioned previously, AM stands as a layer by layer
system, and so, the manufacturing consists in adding only the necessary
material. This way, unlike subtractive technologies, there is no material
waste, making AM manufacturing an efficient and “green” process;
Process simplicity and economic viability – Unlike most traditional
manufacturing techniques, AM technologies do not require start up tooling.
That being said, for the production of small batches of a given part, AM may
Figure 8 – AM process logic [19].

12
be a more cost effective solution than the traditional manufacturing methods,
usually characterized by the high start-up costs;
Instant and on-demand Production – The tooling free characteristic of AM
technology enables a faster manufacturing of a given product, allowing,
consequently a faster entry in the market with an on-demand service;
Prototyping ideal – In AM, regardless of the part to be manufactured, the
process is always simple and instant. However, when the technique involved
in the fabrication is, for example, metal casting or injection moulding, the
production of a different object is synonym of new moulds, additional costs,
and of course delays in the project development.
AM limitations based on [19], [20], [21], [22]:
Mass Production – AM, unlike traditional manufacturing that by means of
technologies like injection moulding is capable of producing a large number of
units in a short period of time (and with that amortize the high start-up
costs), is not appropriate for mass production. In fact, the literature states
that even though AM process speed increases it is not expected to be as fast
as moulding technologies;
Range of materials – Again, comparing with traditional manufacturing, the AM
technology does not comprise, at least yet, a large variety of materials. AM
printers use a small range of polymers, metals, ceramics and composites.
Another problem related to the AM materials is that many of the used
polymeric, property of several companies, are not properly characterized;
Producing large parts – AM systems have limitations related to the dimensions
of the objects to be printed, such problems are due to the available envelope
sizes. That being said, traditional manufacturing is preferred for building
large parts;
Strength uniformity – Due to the layer by layer process, in some AM
technologies the built objects are weaker in the direction of material
deposition;
Repeatability – The lack of consistency on printed parts makes the
repeatability an aspect to be improved on AM technology.

13
2.3.4. AM processes
As was previously explained, for more than thirty years that AM suffers a continuous growth,
and so, during this time, several different printing technologies have been appearing, always
keeping up with the technological progress on the different supporting fields.
For organization purposes, the ASTM developed a form of categorization which consists in
grouping the different technologies according to the underlying technology. That is intended
to clearly verify resemblances (processes with similar machine architecture and material
transformation physics) between different machine types [18], [23]. Specifying, ASTM defines
7 distinct process types: binder jetting, directed energy deposition, material extrusion,
material jetting, powder bed fusion, sheet lamination and vat photopolymerization. Next, the
ASTM definitions (from F2792-12a standard) for the different process types will be presented,
and based on references [18], [20], [22], an association will also be done between those
process types and the correspondent existing AM technologies.
• Binder jetting – “an additive manufacturing process in which a liquid bonding agent
is selectively deposited to join powder materials.”[18] (p. 1):
◦ Powder bed and inkjet head;
◦ Plaster-based 3D printing.
• Directed energy deposition – “an addictive manufacturing process in which focused
thermal energy is used to fuse materials by melting as they are being
deposited.”[18] (p. 1):
◦ Laser metal deposition.
• Material extrusion – “an additive manufacturing process in which material is
selectively dispensed through a nozzle or orifice.”[18] (p. 1):
◦ Fused filament fabrication.
• Material jetting – “an addictive manufacturing process in which droplets of building
materials are selectively deposited.”[18] (p. 1):
◦ Multi-jet modelling.
• Powder bed fusion – “an addictive manufacturing process in which thermal energy
selectively fuses regions of a powder bed.”[18] (p. 1):
◦ Electron beam melting;
◦ Selective laser sintering;
◦ Direct metal laser sintering;
◦ Selective heat sintering;
◦ Selective laser melting.

14
• Sheet lamination – “an additive manufacturing process in which sheets of material
are bonded to form an object.”[18] (p. 1):
◦ Laminated object manufacturing;
◦ Ultrasonic consolidation.
• Vat Photopolymerization – “an additive manufacturing process in which liquid
photopolymer in a vat is selectively cured by light-activated polymerization.”[18]
(p. 1):
◦ Stereolithgraphy;
◦ Digital light processing.
2.3.5. AM feedstock materials
Researches and investigations in the field of materials are an important factor in the
development of 3D printing. In the early stages of AM, its development was subjected to the
available materials, not conceived to apply in this new technology. It was verified that the
use of such materials stood as source of multiple problems in the printed parts [23]. Also, at
the beginning, AM was mainly applied in building prototypes with plastics and, as a result, the
development of this technology was mainly centralized around this type of material [21].
Over time and thanks to intense investigation efforts, materials were developed to better suit
AM processes, bringing higher quality levels to the produced parts. AM technology gradually
became able to produce complex and functional parts with several different types of
materials, like metals, ceramics and composites [21], [23]. The typically used materials in
each AM technology are listed on Table 1.
Table 1 – AM technologies and associated feedstock materials [20], [22].
Technology AM Process Typical Materials
Stereolithograhy Vat
polymerization
Liquid photopolymer, composites
Digital light processing Vat
polymerization
Liquid photopolymer
Multi-jet-modeling Material
jetting
Photopolymers, wax
Fused deposition
modeling
Material
Extrusion
Thermoplastics
Electron Beam melting Powder bed
fusion
Titanium powder, cobalt chrome
Selective laser sintering Powder bed
fusion
Paper, plastic, metal, glass, ceramic
composites

15
Technology AM Process Typical Materials
Selective heat sintering Powder bed
fusion
Thermoplastic powder
Direct metal laser
sintering
Powder bed
fusion
Stainless steel, cobalt chrome,
nickel alloy
Selective laser melting Powder bed
fusion
Stainless steel, cobalt chromium and
titanium
Powder bed and inkjet
head printing
Binder jetting Ceramics powders, metal laminates,
acrylic, sand, composites
Plaster-based 3D printing Binder jetting Bonded plaster, plaster composites
Laminated object
manufacturing
Sheet
lamination
Paper, plastic, metal laminates,
ceramics, composites
Ultrasonic consolidation Sheet
lamination
Metal and metal alloys
Laser metal deposition Direct energy
deposition
Metal and metal alloys
2.3.6. Fused Filament Fabrication
The FFF or FDM (term used to refer Stratasys, inc machines) is, as defined in [18] (p. 2), “a
material extrusion process used to make thermoplastics parts through heated extrusion and
deposition of material layer by layer”. Summarily detailing the process (Figure 9), a filament
of thermoplastic material is guided into a liquefier which will heat the material to a
temperature beyond the fusion point. Then, the molten material will be extruded through a
nozzle into a substrate (printing bed) where it will cool down and solidify forming a layer of
material. When the first layer is completed, a second one, with the movement of the bed or
the print head, will be added over the first. This process will continue until the object is
concluded. During the printing process, depending of the model geometry (parts with holes or
cavities), it may be required the addition of support material. [26]
Figure 9 – Fused Filament Process [26] .

16
Previously in this chapter it was explained the overall process of AM technologies. After
obtaining the 3D model of the object to be built, it is necessary to save it as a STL file and,
with the adequate software, proceed to the slicing and toolpath creation. Specifying now the
FFF technology, during these steps and until the printing phase, there are several parameters
that can be defined and will affect the printing process and the final result. Such parameters
may differ depending on the used hardware and software. In [27] it was conducted a study
which lists the more important and commonly adjusted FFF parameters – Table 2. This study
is based on experiences with low-cost 3D printing systems and common feedstock materials.
Table 2 – Important FFF parameters [27].
Parameter Description Typical Value
Tetrahedralization
Max. linear deviation
Maximum distance between tetrahedral surface and original model.
0.03-0.1 mm
Max. angular deviation
Maximum angle between normal vectors of adjacent facets.
5-30º
Slicing
Layer thickness Thickness of each layer of the FFF part. 0.05-0.3mm
Extrusion width Width of the plastic extrusion from the nozzle. Different widths may be specified for infill and
perimeters
0.1-0.4mm
Infill density Relative density from 0(totally hollow object) to 1 (completely solid object).
0-1
Infill orientation Orientation of the infill pattern relative to the x-axis of the 3D printer.
0-90º
Infill pattern Pattern by which infill is produced. Rectilinear and hexagonal grids are most common.
-
Perimeter loop number
The number of perimeter loops produced 1-4
Perimeter loop ordering
Binary decision to print perimeters from innermost to outermost, or vice-versa.
-
Support density The relative density of the support material (again from 0/none to 1/solid).
0-0.3
Support orientation
Orientation of the support material relative to the x-axis of the 3D printer.
0-90º
Support pattern Pattern by which infill is produced. Rectilinear grids are most common.
-
Printing
Movement velocity
Rate at which to move the extruder head during plastic deposition. Separate rates may be specified for
different extrusion types.
25-100 mm/s
Extruder temperature
Temperature of the extrusion process. 190-250 ºC
Build plate temperature
Temperature of build surface. 0-140 ºC
Cooling power Power applied to the cooling fans in order to solidify the extrusion.
0-100%
So, as may be seen in Table 2, there are several parameters that define a 3D printing job in
FFF. One immediate consequence regarding the existence of a plurality of parameters and
17
the possibility of defining them, is the creation of printed objects with distinct characteristics
depending on the wishes of the designer or producer.
When printing a given object, if the mechanical characteristics are not a concern, the
definition of the printing set up does not stand as a priority. However, when the object to be
printed must fulfil a specific mission, where higher values of strength, or reduced values of
weight or even a compromise between the two is required, a careful approach must be taken
in order to define the printing parameters in a proper way. In fact, parameters like the layer
thickness, infill density, deposition orientation, among others, are very important, and
different settings on different printing operations will translate in distinct mechanical
characteristics.
Despite the efforts that have been made to apply ceramics, composites and metal pastes in
material extrusion technology, as was already indicated in Table 1, the FFF material extrusion
process uses thermoplastics as typical source of input materials [20], [21]. Several examples
of materials used in this technology are: acrylonitrile butadiene styrene (ABS) (Stratasys
developed several ABS based materials), polylactic acid (PLA), polycarbonate (PC),
polyethyelene terephthalate, polyphenysulfone, PC-ISO (medical grade of PC) and also blends
between ABS and PC [24], [27], [28]. Generally, FFF materials not only ensure the production
of capable parts for prototyping and testing purposes, but also, and very importantly, they
allow the manufacture of parts to direct end-use [28]. As mentioned in [27], it is necessary to
be aware that the properties of a given material may vary according several variables, such
as, the manufacturer and the application of additives and colorants.
ABS and PLA stand among the most commonly used materials in lower-cost FFF 3D printers
[27]. Between the two, PLA is considered to be the easiest to print and it may not even
require a heated print bed. On the other hand, printing ABS is a harder task due to the
contraction occurring during the cooling which can cause the entire printing part to detach
before the printing is completed. As a solution, a print bed heated to a temperature between
100–140ºC is required. PLA produced objects normally tend to present a better surface
finishing, however, when it comes to part durability ABS stands as the best option.
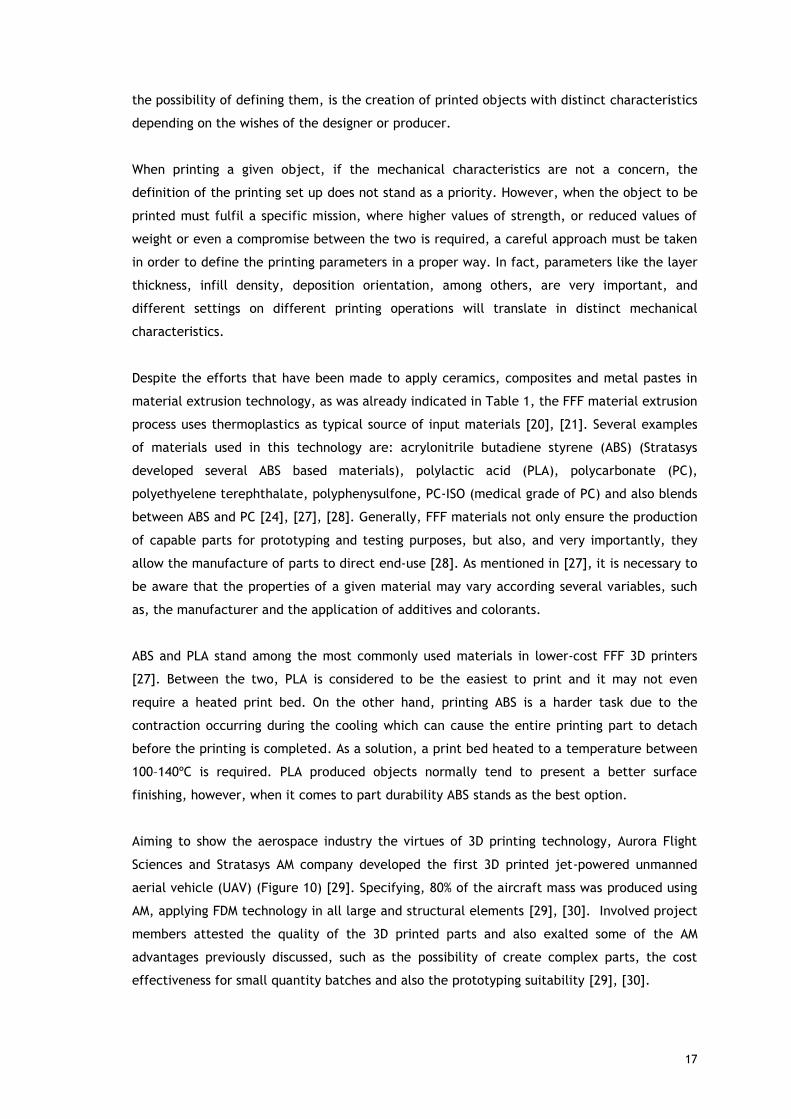
Aiming to show the aerospace industry the virtues of 3D printing technology, Aurora Flight
Sciences and Stratasys AM company developed the first 3D printed jet-powered unmanned
aerial vehicle (UAV) (Figure 10) [29]. Specifying, 80% of the aircraft mass was produced using
AM, applying FDM technology in all large and structural elements [29], [30]. Involved project
members attested the quality of the 3D printed parts and also exalted some of the AM
advantages previously discussed, such as the possibility of create complex parts, the cost
effectiveness for small quantity batches and also the prototyping suitability [29], [30].

18
2.4. Mechanical properties of materials
2.4.1. General concepts – Stress and Strain
Stress is the ratio of force to the area on which the force is applied. The SI unit of this
physical quantity is the pascal (Pa). When, for example, a given specimen is under tensile
stress, the applied force causes the specimen to elongate in the pull direction. The change in
dimension per unit length corresponds to the strain, usually expressed in cm/cm, mm/mm or
even in percentage terms (%). Also, an elongation or shortening (in the case of applying a
compressive force) of a given specimen in the direction of the applied force will induce a
decrease or an increase of material in the transverse directions (Figure 11) [31]. This
phenomenon is designated as the Poisson’s effect. [32]
Then again, considering a given specimen under tensile or compressive stress, the resulting
strain is considered to be elastic, if it occurs in the immediate moment the stress is applied,
if it remains during the whole application period and, if the material completely recovers
once the stress is removed [33]. Inversely, a plastic strain occurs when the material does not
return to its original shape, being created a permanent deformation. For most cases, stress
Figure 11 – Part under tensile stress [32].
Figure 10 – Aurora Flight Sciences and Stratasys developed 3D printed jet-powered UAV [29].

19
and elastic strain are linearly related and, in a stress-strain diagram this linear part
corresponds to the Modulus of Elasticity (E) of a given material.
2.4.2. Tensile and flexural tests
2.4.2.1. Tensile test
The tensile test stand as the most common test type for the determination of mechanical
characteristics of materials, being used in the selection of the best options for specific
applications, to ensure quality levels, and to characterize new materials [31], [33], [34].
Standards, normally from International Organization for Standardization or ASTM, serve as
guideline in the execution of such tests, providing the rules and procedures that should be
followed.
The tensile test starts with the placement of the specimen in a specialized machine, normally
a universal tester, then, the specimen is subjected to a tensile force, which is recorded as
function of the gage section elongation. Once the data is collected, the force - elongation
plot is transformed in an engineering stress-strain relation (stress-strain curve).
𝐸𝑛𝑔𝑖𝑛𝑒𝑒𝑟𝑖𝑛𝑔 𝑠𝑡𝑟𝑒𝑠𝑠 = 𝜎 =
𝑃
𝐴0
(1)
𝐸𝑛𝑔𝑖𝑛𝑒𝑒𝑟𝑖𝑛𝑔 𝑠𝑡𝑟𝑎𝑖𝑛 = 𝑒 =
𝛥𝑙
𝑙0
(2)
Where, P is the applied load, A0 the original cross-sectional area of the test specimen before
the beginning of the test, l0 the original gage length, and 𝛥l the variation in the gage length
with the application of the tensile force.
Figure 12 – Typical stress-strain curve [31].
20
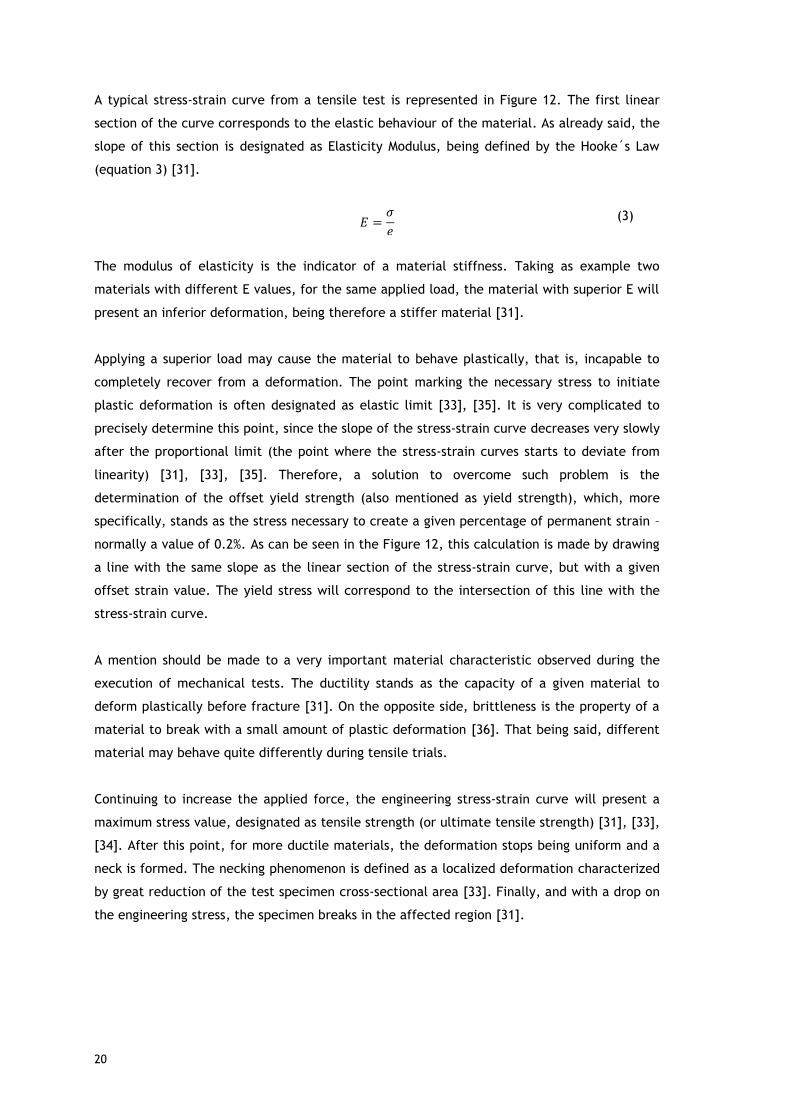
A typical stress-strain curve from a tensile test is represented in Figure 12. The first linear
section of the curve corresponds to the elastic behaviour of the material. As already said, the
slope of this section is designated as Elasticity Modulus, being defined by the Hooke´s Law
(equation 3) [31].
𝐸 =𝜎
𝑒
(3)
The modulus of elasticity is the indicator of a material stiffness. Taking as example two
materials with different E values, for the same applied load, the material with superior E will
present an inferior deformation, being therefore a stiffer material [31].
Applying a superior load may cause the material to behave plastically, that is, incapable to
completely recover from a deformation. The point marking the necessary stress to initiate
plastic deformation is often designated as elastic limit [33], [35]. It is very complicated to
precisely determine this point, since the slope of the stress-strain curve decreases very slowly
after the proportional limit (the point where the stress-strain curves starts to deviate from
linearity) [31], [33], [35]. Therefore, a solution to overcome such problem is the
determination of the offset yield strength (also mentioned as yield strength), which, more
specifically, stands as the stress necessary to create a given percentage of permanent strain –
normally a value of 0.2%. As can be seen in the Figure 12, this calculation is made by drawing
a line with the same slope as the linear section of the stress-strain curve, but with a given
offset strain value. The yield stress will correspond to the intersection of this line with the
stress-strain curve.
A mention should be made to a very important material characteristic observed during the
execution of mechanical tests. The ductility stands as the capacity of a given material to
deform plastically before fracture [31]. On the opposite side, brittleness is the property of a
material to break with a small amount of plastic deformation [36]. That being said, different
material may behave quite differently during tensile trials.
Continuing to increase the applied force, the engineering stress-strain curve will present a
maximum stress value, designated as tensile strength (or ultimate tensile strength) [31], [33],
[34]. After this point, for more ductile materials, the deformation stops being uniform and a
neck is formed. The necking phenomenon is defined as a localized deformation characterized
by great reduction of the test specimen cross-sectional area [33]. Finally, and with a drop on
the engineering stress, the specimen breaks in the affected region [31].

21
2.4.2.2. Flexural test
As explained in [31] and [33], the flexural test consists in the application of a vertical load on
a specimen with rectangular section. This specimen is doubly supported and can be loaded by
a mechanism of one or two points – three-point (Figure 13 – (a)) or four-point bending tests
(Figure 13 – (b)). During the execution of this type of tests, the resulting longitudinal stresses
on the specimen´s top and bottom surfaces will be, respectively, of compressive and flexural
nature [31]. Also, whereas for a three-point flexural test the maximum bending moment will
occur on the centre of the specimen, for a four-point test it will occur between the two
loading points.
Regarding Figure 14, a three-point bending test, F represents a force applied at the midpoint
of a specimen, L the distance between the two supporting points, h and w, respectively the
height and the width of the specimen, and finally, δ, corresponds to the deflection in the
centre due to the applied force F. Taking as basis the Bernoulli-Euler beam theory [37], also
mentioned as classical beam theory, the equations for the calculation of the flexural
strength, flexural strain, and flexural elastic modulus, are presented next. It is important to
refer that, theoretically, both the stress and strain caused by the application of the force F,
will have maximum values at the outer surface of the specimen.
The equation for the flexural stress at the outer surface at the specimen midpoint, is given
by:
𝜎𝑏𝑒𝑛𝑑 =
3𝐹𝐿
2𝑤ℎ2
(4)
For the flexural strain, also at the outer surface at mid-span:
𝑒𝑏𝑒𝑛𝑑 =
6𝛿ℎ
𝐿2
(5)
Figure 13 – Three/four-point bending tests and respective bending moment diagrams[31].

22
And finally, the equation for the flexural elastic modulus:
𝐸𝑏𝑒𝑛𝑑 =
𝐿3𝐹
4𝑤ℎ3𝛿
(6)
2.5. Conclusion
The existence of different hull configurations allows the construction of airships with distinct
characteristics. For example, while non-rigid airships may be simpler to construct and to
maintain, they do not present the structural strength of rigid airships and therefore are not
capable to withstand the same flight conditions.
The typical structural model for rigid airships did not suffer big changes comparing with the
20th century Zeppelins, and still usually resorts to the concept of transverse frames connected
by girders employing a truss system.
There is no doubt that the hybrid concept took the airship vehicle to a different level. Many
key improvements, like the overcoming of the buoyance control problem, the superior
payload capacity and the increase of fuel and speed efficiencies, boosted the hybrid airship in
the aeronautical world.
Additive manufacturing is regarded as a revolutionary technology, capable of deep changes in
the actual industry. In fact, in recent years the world has witnessed a huge development and
massification of several AM technologies, currently being used to produce fully functional
parts in a wide variety of fields – aerospace industry included. Among AM main attributes, the
freedom to create complex parts, the process simplicity, and the instant production are
exalted.
The FFF technologies stand as one of the most widely used 3D printing methods, relying
almost exclusively on thermoplastics to create the proposed models. Being on the same page
as other AM technologies, the FFF is also able to address the production of functional and
quality end-use parts.
Figure 14 – Three-point flexural test [33].
23
3. Joint system concept proposal
3.1. Introduction
One of the main objectives of this dissertation will be addressed in this chapter. Next, the
work performed in the development of a joint system concept proposal to be applied in
Prototype 3´s tubular internal structure will be presented. From the inspiration source, to the
technical drawings and also the production method, all steps will be covered throughout this
chapter. Also, several validation activities of the concept will be undertaken. Both the
clamping mechanism and the suitability of the joint system in terms of assembly, will be put
under test. It is important to clarify that the following pages only cover a concept
development of what it is believed to be a plausible option. Nonetheless, should the obtained
results be positive, this work stands as a first stage and a starting point of a development
project.
3.2. Lattice Structure
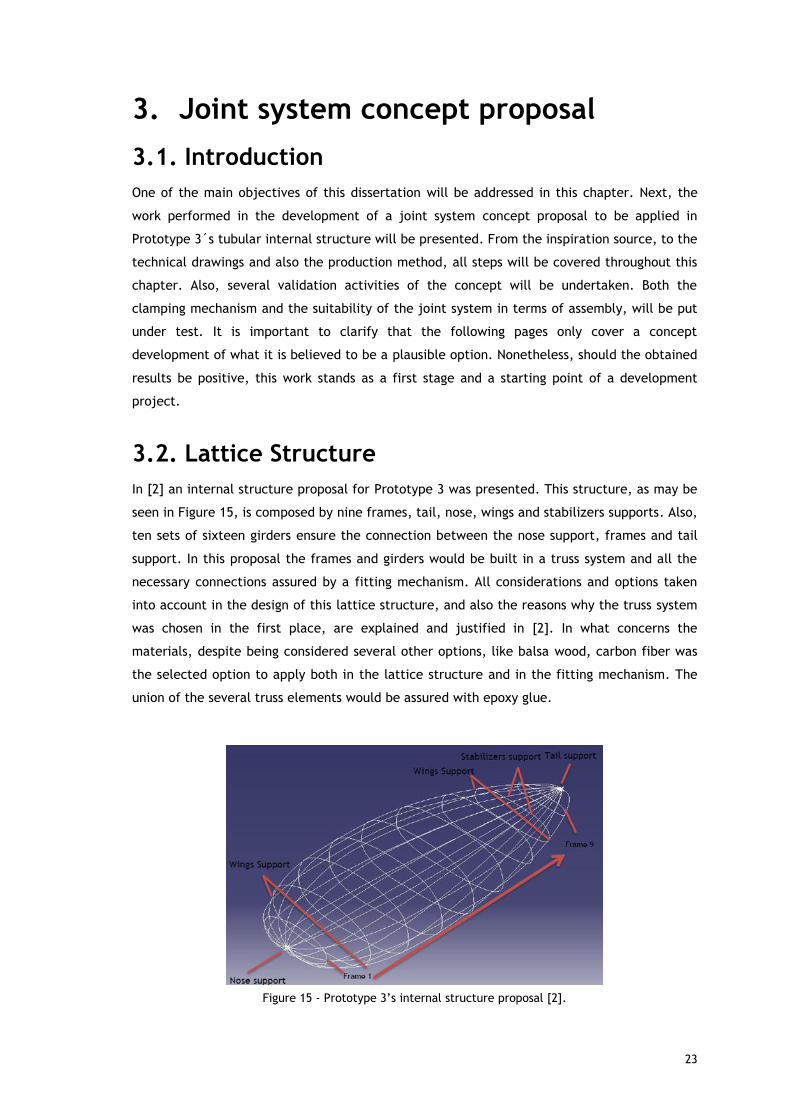
In [2] an internal structure proposal for Prototype 3 was presented. This structure, as may be
seen in Figure 15, is composed by nine frames, tail, nose, wings and stabilizers supports. Also,
ten sets of sixteen girders ensure the connection between the nose support, frames and tail
support. In this proposal the frames and girders would be built in a truss system and all the
necessary connections assured by a fitting mechanism. All considerations and options taken
into account in the design of this lattice structure, and also the reasons why the truss system
was chosen in the first place, are explained and justified in [2]. In what concerns the
materials, despite being considered several other options, like balsa wood, carbon fiber was
the selected option to apply both in the lattice structure and in the fitting mechanism. The
union of the several truss elements would be assured with epoxy glue.
Figure 15 - Prototype 3’s internal structure proposal [2].

24
Despite all benefits that in theory this structure could bring, it was verified in [2] and [3]
during several practical tests, that the creation of a lattice structure in a non-specialized
environment is a very difficult process and consequently the obtained results were not the
desired ones. In [3] it is described how lengthy and complex the manufacturing process of
lattice parts is, referring the gluing of the web elements and the required precision as the
main difficulties. Actually in [2], it is also mentioned the influence of the gluing and
precision, and the failure that can occur due to the detachment of web elements when the
trusses are under stress. Other problematic issues, mainly regarding the fitting mechanism,
were also noticed during an assembly test of a Prototype 3’s section (Figure 16). That being
said and due the all the mentioned problems, it is concluded that with the available
conditions the construction of a lattice structure is not a feasible task, and therefore a
different solution must be found.
3.3. New Proposal
So, as explained previously it is necessary to find alternatives to the lattice structure. Those
alternatives must be feasible with the existing conditions, namely, limited means in terms of
human resources, machinery and space. In other words the objective is to find a simple and
practical structural solution to Prototype 3’s internal structure; a solution with a simpler
construction process which will automatically reflect in a decrease of the construction
defects and of the process duration; a solution which allows an easy assembly and
disassembly of the whole structure and therefore an easier maintenance process.
3.3.1. Concept Development
Proposing a joint system concept to apply in the connections of Prototype 3’s tubular
structure stands as necessity referred in the objectives section. This idea of replacing
Figure 16 – Assembly test of a Prototype 3’s section [2].
25
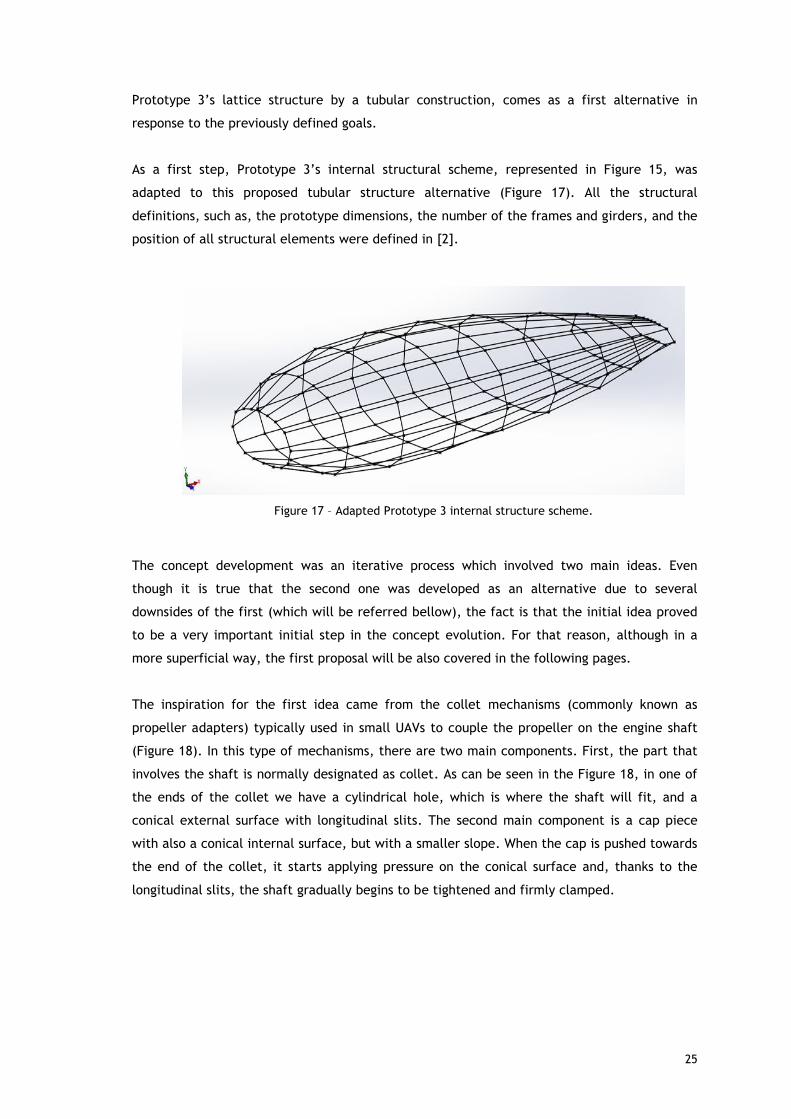
Prototype 3’s lattice structure by a tubular construction, comes as a first alternative in
response to the previously defined goals.
As a first step, Prototype 3’s internal structural scheme, represented in Figure 15, was
adapted to this proposed tubular structure alternative (Figure 17). All the structural
definitions, such as, the prototype dimensions, the number of the frames and girders, and the
position of all structural elements were defined in [2].
The concept development was an iterative process which involved two main ideas. Even
though it is true that the second one was developed as an alternative due to several
downsides of the first (which will be referred bellow), the fact is that the initial idea proved
to be a very important initial step in the concept evolution. For that reason, although in a
more superficial way, the first proposal will be also covered in the following pages.
The inspiration for the first idea came from the collet mechanisms (commonly known as
propeller adapters) typically used in small UAVs to couple the propeller on the engine shaft
(Figure 18). In this type of mechanisms, there are two main components. First, the part that
involves the shaft is normally designated as collet. As can be seen in the Figure 18, in one of
the ends of the collet we have a cylindrical hole, which is where the shaft will fit, and a
conical external surface with longitudinal slits. The second main component is a cap piece
with also a conical internal surface, but with a smaller slope. When the cap is pushed towards
the end of the collet, it starts applying pressure on the conical surface and, thanks to the
longitudinal slits, the shaft gradually begins to be tightened and firmly clamped. [38]
Figure 17 – Adapted Prototype 3 internal structure scheme.

26
So, the idea consists in applying a similar collet mechanism in the Prototype 3 tubular
structure. As can be seen in Figure 17, each knot connects four tubes, all of them with
different directional coordinates. That being said a joint system would be composed with two
main parts, first the collet mechanism and in second a centrepiece that would connect the
four required collets, each one with the respective direction. With the help of the following
images, representing the performed sketching work (Figures 19 and 20), the concept should
be more easily perceived.
Figure 19 – First idea - joint system components.
Figure 18 – Propeller adapter mechanism [38].
Figure 20 – First idea - joint system fully assembled

27
Likewise in the previous example, a cap piece will apply pressure or loose the collet trough
the motion of a thread system. Also, the connection between the four collets and the
centrepiece is assured with a left-hand thread.
An essential issue that followed this work right from the beginning, was the method to be
used in the production of such parts. The solution for this question would not be easy to find,
since there is a set of parameters that need to be carefully balanced. Firstly, there can be
always limitations in terms of available equipment, costs and time. Those limitations will
automatically reflect in the options range. The type of materials to be used, is of course
another crucial factor. Like in most of the structural designs the goal is to use materials that
present high values of specific strength. Other very important parameters to have in
consideration are the degree of complexity of the part to be produced and also the number of
times it will be produced.
So, taking into consideration all the existing factors it was decided to resort to the additive
manufacturing processes, more specifically to the Fused Filament Fabrication. This option is
justified by the following facts. First, as referred in section 2.3.3, this method is ideal for the
creation of objects with a complex geometry, which is the case. Also, the use of FFF
technology is relatively cheap when compared with other methods like machining or injection
moulding. This last could be a viable option in a situation of mass production, but since that
is not the case FFF stand as the most logical option. Another justification for this choice is the
easy access to the equipment, in fact, just as stated in section 2.3.1, this technology is being
massively used nowadays. This specific type of AM process is limited to the use of several
thermoplastics as feedstock, taking into account the maximum mass limit for the structure,
about 9 kg [2], the use of such materials stands as a plausible option.
Figure 21 – First idea – 3D printed joint system.

28
Above, in Figure 21, we have a printed job of the first idea. Having a produced joint allows a
better understanding of the developed work. It was observed that the tolerance values
defined for the components allowed a correct fitting of the threaded parts, and consequently
it was possible to successfully assemble the joint. A correct functioning of the clamping
mechanism was also verified. However, as previously said, due to several downsides, this first
proposal was put aside. The motives which led to this decision were mainly related with two
factors. First, the assembly and disassembly of the three constituent parts did not prove to be
practical. Also, the required division in three parts to allow the assembly of the cap piece,
may contribute to debilitate the structural integrity of the joint. As an example, even in
assembly/disassembly process, an overtightening error of the threaded system may easily
induce the occurrence of localized fractures.
An alternative proposal started to be developed. Despite the issues around the first idea, the
use of a collet mechanism for tube clapping was considered an interesting and plausible
option, and therefore, it was not discarded. Taking into account the problems related to the
assembly/disassembly practicality and the necessary division of the joint in three parts, a
collet mechanism typically used in drilling devices (Figure 22) may be the solution. The
working logic stands the same, however, unlike the previous case, in this mechanism the cap
piece will act on the collet in the opposite direction. [39]
So, applying this mechanism and after a large number of iterations, a new joint system
concept proposal is presented in Figure 23. As may be observed, the problem related with the
division of the joint is now solved. The joint system is composed by a centrepiece which
agglomerates four collets in four different directions, and also by the necessary cap pieces.
Figure 22 – Collet mechanism used in drilling devices [39].

29
The technical drawings corresponding to the last iteration of the collet piece are shown in
Figure 24. This part was designed to be applied in tubes with 11.9 and 9.5 mm of external and
internal diameter, respectively. The tube will fit between an inner and an external circular
wall. The internal circular wall was designed with the purpose of improving the fitting with a
centred placement of the tube. The distance between the walls is defined by the nominal
thickness of the tube plus tolerance of 0.3 mm. This definition resulted in a proper fitting of
the tube during several iterations. For the coupling of the cap piece, a 2 mm pitch thread was
selected. A finer pitch could be chosen, however, that would increase the complexity level of
the part and therefore the difficulty of the printing process. In order to allow the clamping of
the tube, the external wall was divided with eight longitudinal slits. Comparing with the first
idea where the collet presented four slits (Figure 20), in this case it was decided to create
more divisions in order to reduce the rigidity and therefore the fragility of the clamping
section. Also, in the external wall, at a carefully defined distance, a 1 mm protrusion was
created. It is at this point that the cap piece will act with a clamping force, gradually
tightening the tube. The remaining of the defined dimensions and geometric characteristics
were gradually defined during the iterative process, always aiming at a better working of the
mechanism.
Figure 24 – Collet piece technical drawings.
Figure 23 - Second idea – joint system.

30
The technical drawings corresponding to the cap piece final iteration are presented in Figure
25. One very important aspect in the development of this mechanism, was the coupling of the
both parts. Using PLA in the printing process, a cap piece with an internal diameter of 21.2
mm showed a proper fit with the collet. Nonetheless, it was verified that changes in the
printing material may require adjustments in the external part diameter. The conical surface
of the cap piece was designed to create interference with the previously mentioned collet
protrusion. Such interference will be responsible for the acting clamping force. The clamping
capacity, the goal of this mechanism, was put under test and is detailed in the next section.
The 3D printed last version of the clamping mechanism is presented below, in Figure 26.
Figure 25 – Cap piece technical drawings.
Figure 26 - Second idea – 3D printed clamping mechanism.

31
3.3.2. Clamping mechanism validation
Aiming to validate the clamping mechanism of the developed concept proposal, it was
decided to perform a suspension test. This trial (Figure 28) consisted in using the previously
designed parts in the clamping of a Polyvinyl chloride (PVC) tube, and then, after connecting
the tube to proper container, weights are gradually deposited until the tube slips or the
mechanism breaks. Unfortunately, by the time of the suspension test execution, the last
version of the collet mechanism (both the collet itself and the cap piece) was not available.
Due to that, it was necessary to resort to the previous version. Nonetheless, it important to
mention, that the difference between those iterations does not involve issues around the
clamping mechanism, but small modifications aiming to simplifying the 3D printing process.
That being said, it is not believed that the use of the latest version would result in different
outcomes.
PVC tubes are very smooth, and therefore, when clamped, the inherent low friction causes
the tube to slide out of the clamping mechanism. Taking this fact into account it was decided
to add a testing variable to the suspension trial. More specifically, the PVC tube to be
clamped on the collet mechanism was tested in three different ways. First, with no surface
alteration (Figure 27 - a), secondly, with a superficial treatment which increased the
roughness (Figure 27 – b), and by last, adding a layer of painter´s tape (figure 27 – c).
a) b) c)
Figure 27 – Different tested PVC tubes.

32
Table 3 – Suspension tests results.
The results obtained from the suspension tests are presented in Table 3. All three different
trials ended with slippage of the tube, without breaking the clamping mechanism. Only one
trial for each type of PVC tube was executed. Such fact is due to the wear verified on the
clamping mechanism after supporting 23.980 kg. As may be observed, the influence of the
friction between the collet and the tube is quite relevant, resulting in very distinct results.
Should this concept or a similar one be used in the future, and depending of the tubing
materials (superficial treatments would weaken the mechanical properties of tubes made of
carbon fiber or other similar materials), similar friction enhancing strategies may be used.
Taking into account the obtained results and the Prototype 3’s internal structure mass limit of
about 9 kg [2], the clamping capacity of the developed mechanism is also validated.
PVC tube: Supported mass (kg)
Without treatment 2.950
With treatment 6.480
With painter´s tape 23.950
Figure 28 – Suspension test.

33
3.3.3. Assembly test
In order to ascertain the suitability of the developed concept in the assembly of large
structures, it was decided to proceed to an assembly test. More specifically, and as
performed in [2] and [3] regarding the lattice structure proposal, the goal is to build a section
of Prototype 3’s internal structure.
3.3.3.1. Components nomenclature
Aiming to simplify the assembly test of a Prototype 3’s section, a code which identifies each
necessary component was developed. The following code was created also with the purpose
of facilitating future Prototype 3 assemblies, either using the presented proposal or a similar
one.
As previously described, Prototype 3’s internal structure consists of nine frames, each one
attached to the other with sixteen girders. For this assembly test, the frames and girders are
built with PVC tubes connected by a system of 3D printed joints. It should be clarified, that
the PVC tubes are only used to perform the assemble trial.
Before presenting the classification method it is necessary to present the numbering order
given to Prototype 3’s frames – Figure 29.
Joints nomenclature
The code defined for the joints identification is given by:
𝐹𝑥𝐽𝑦
where,
x, represents the number of the frame (1 to 9) where joint is located, according to
Figure 29;
y, represents the number of the joint (1 to 16).
Figure 29 – Numbering order of Prototype’ 3 frames.

34
The joints numbering was set to be as shown in Figure 30. As may be seen, the numbering
starts in number one, following the reverse clockwise direction.
Thus, taking Figure 31 as an example, the code representing the red marked joint located on
the 3rd frame is:
𝐹3𝐽4
Tubes nomenclature - frames
For the code definition of the tubes composing the frames, a similar reasoning was followed.
So, and taking into account the numbering orders established in the Figures 29 and 30, we
have:
𝐹𝑥𝐽𝑦/𝑧
where,
x, represents the number of the frame where the tube is located (1 to 9), according
to Figure 29;
y and z, represent the numbers of the joints (1 to 16) among which the tube is
placed, according to Figure 30.
For example, a tube located on the 3rd frame, between joints 2 and 3, like the one
represented in Figure 32, has the following code:
𝐹3𝐽2/3
Figure 30 – Joints numeration.
Figure 31 - Joints nomenclature – example.
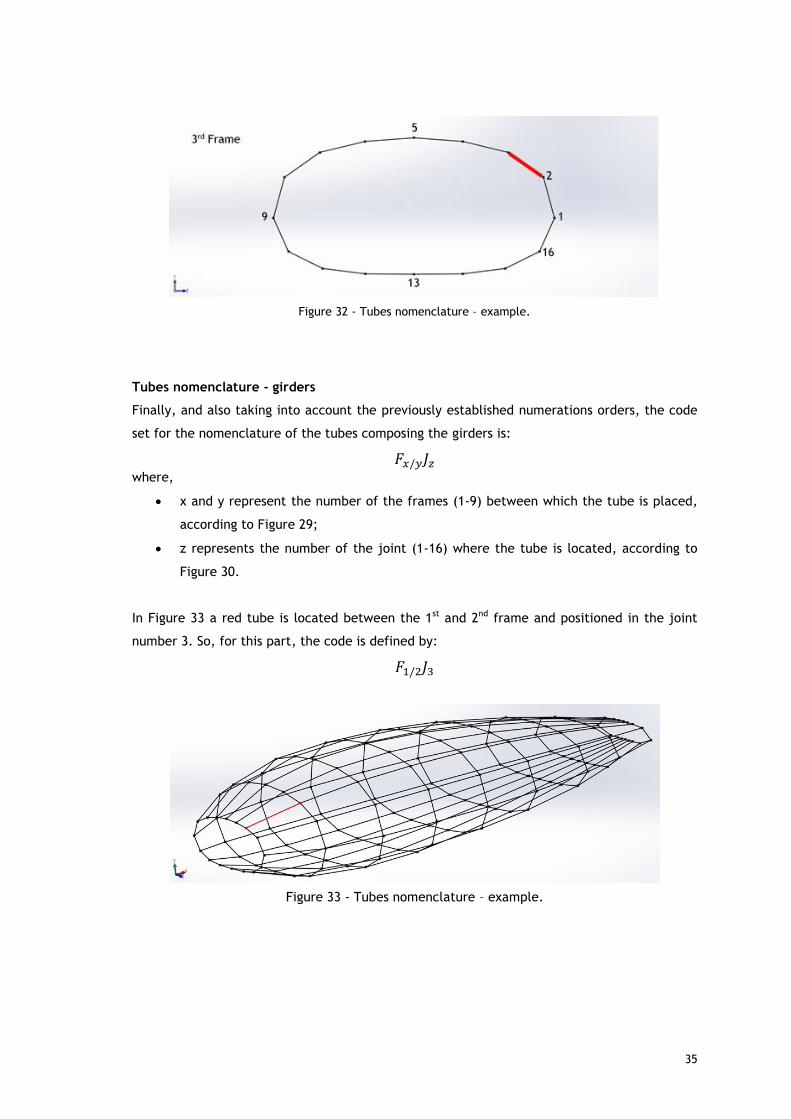
35
Tubes nomenclature - girders
Finally, and also taking into account the previously established numerations orders, the code
set for the nomenclature of the tubes composing the girders is:
𝐹𝑥/𝑦𝐽𝑧
where,
x and y represent the number of the frames (1-9) between which the tube is placed,
according to Figure 29;
z represents the number of the joint (1-16) where the tube is located, according to
Figure 30.
In Figure 33 a red tube is located between the 1st and 2nd frame and positioned in the joint
number 3. So, for this part, the code is defined by:
𝐹1/2𝐽3
Figure 32 - Tubes nomenclature – example.
Figure 33 - Tubes nomenclature – example.

36
3.3.3.2. Components production and assembly
The section between the 3rd and 4th frame, likewise in [2] and [3], stands as the section
chosen to perform the assembly test. So, and making use of the previously defined
components nomenclature, this task involves the following steps:
Creation of thirty two joints computational models;
3D printing the thirty two models and ninety six cap pieces (Figure 34);
To cut the PVC tubes to be used both in the frames and girders, with the respective
dimensions;
Proceed with the section assembly.
Unfortunately, it was not possible to 3D print all the necessary joints and cap pieces in useful
time. Consequently, and under penalty of not complying with the dissertation delivery
deadline, the execution of the assembly test had to be postponed. Nonetheless, the section
construction will be performed to validate the concept, and the results will be made
available in the future.
3.4. Conclusion
One of the main conclusions that may be drawn from this third chapter, is the fact that
additive manufacturing, as referred in the State of the Art, really brings to the table a new
set of advantages beyond the reach of any TM technique. Making use of one of the most
common AM technologies, the FFF, and thanks to the inherent process simplicity, design
Figure 34 – Assembly test – F3J1 joint CAD Model and 3D printing result.

37
freedom and prototyping ideal characteristics, it was possible to develop and present a
functional joint system concept.
Unfortunately, due to the impossibility of 3D printing all the necessary joints and cap pieces
in useful time, it was not possible to execute the assembly test and therefore to ascertain the
suitability of the developed joint in the assembly of large structures – one of the chapter
goals.
Should this concept or a similar one be used in Prototype 3’s internal structure, upon the
execution of the necessary structural analysis, it is necessary to design the joint system to
withstand the worst case scenario, that is, tensile loads applied in the direction of material
deposition.
38
4. Mechanical Tests
4.1. Introduction
Complying with the objectives section, in this chapter it is intended, firstly to determine,
analyse and compare the mechanical properties of parts printed in different FFF materials
available on the market, and secondly to study the effect of the infill 3D printing setting. In
order to accomplish such goals, flexural and tensile tests were executed under the guidance
of the corresponding ASTM standards. All the important information regarding the applied
methodology, the tests preparation and execution, and the analysis of the obtained results
will be addressed throughout this chapter.
4.2. Methodology
The chosen 3D printing materials are ABS, PLA and Carbonfil. Due to time limitations and to
the inherent high work volume, the number of different FFF materials to be tested had to be
restricted to three. Both ABS and PLA were chosen due to their popularity among the FFF
users. The Carbonfil, as described by the developer FormFutura, is a material based on a
modified polyethylene terephthalate glycol-modified compound reinforced with carbon fibers
[40]. Being a not so common filament and with the always interesting use of carbon fiber, it
was decided to also test and analyse this material. Summing up, in order to perform the
comparative study, test batches of three completely solid (infill: 100%) samples for each
material in each type of trial (flexural and tensile tests), were tested (Figure 35).
Since Prototype 3 structural weight may eventually become a concerning point, it was
decided to put under test the infill printing setting, verifying the impact of an internal
material reduction on the mechanical properties. This study was performed testing batches of
three 50% infill samples for each material in each type of test (Figure 35), and then making a
comparative analysis of the results with the corresponding 100% sample trials.
One very important aspect involving this test, is the fact that all the specimens must have the
same geometric characteristics, with exception for the infill difference between the 100% and
50% samples. Also, for each type material all samples must have the same temperature
conditions. This way is ensured a correct comparison study between the three different
materials and also the existence of only one study variable: the infill. Both the geometric
characteristics and the used temperatures will be referred in specific sections throughout this
chapter.

39
4.3. Flexural Tests
4.3.1. ASTM D790 – 15 standard
The flexural tests were performed based on ASTM D790 - 15 standard [41] and there was an
attempt to follow all the rules and procedures described there as much as possible. ASTM
D790 – 15 is a standard which addresses the methodology that should be followed to
determine the flexural properties of unreinforced and reinforced plastics and electrical
insulating materials. The determination of these properties is performed by means of a three-
point loading system which applies load to a test specimen of rectangular section. This test
method is not applicable for strain values exceeding 5%.
For materials that break at relatively small strains values, procedure A which specifies a
strain rate of 0.01 mm/mm/min, should be used. This procedure is the preferred in the
execution of the flexural tests. On the other hand for materials that do not break or yield in
the outer surface of the test specimen with procedure A within the 5% strain limit, procedure
B, which consists in an increase of the strain rate to 0.10 mm/mm/min, may be resorted.
However, this method can only be used to determine the flexural strength and, since the
properties to be determined in this flexural trials are not limited to this parameter, the
utilization of this procedure does not stand as an option. Another solution for the non-
compliance of the strain limit is the use of a 4-point bending test, but unfortunately the
Test Batches
Flexural
Carbonfil Infill:100%
Infill:50%
ABS
Infill:100%
Infill:50%
PLA
Infill:100%
Infill:50%
Tensile
Carbonfil Infill:100%
Infill:50%
ABS
Infill:100%
Infill:50%
PLA
Infill:100%
Infill:50%
Figure 35 – Test batches.

40
equipment required for the execution of this type of trial is not available. So, taking into
account all that was said, in the cases where a given specimen reaches the strain limit
without breaking or yielding, the adopted solution, also described in [42] and [43], is to
report the stress at 5% as the flexural strength.
4.3.2. Equipment
In order to perform the flexural tests the use of a universal testing machine is required. A
SHIMADZU Autograph AG-IC Table Top Type AG-50kNICD with a maximum load capacity of 50
kN was used in this work. This testing machine has a load frame which comprises a fixed
member, that will hold the specimen supports, and a movable member, where the loading
nose is attached. The loading nose and supports have cylindrical surfaces with a 5.0 mm
radius as required by the standard. Also, this testing machine is composed by a drive
mechanism which confers a uniform and controlled velocity to the movable member, by a
load indicator mechanism capable of displaying the load applied on the specimen and by a
system capable of showing the position of the crosshead, allowing the measurement of the
specimen deflection. For a more accurate measurement of this deflection, a deflectometer
could be used, however such instrument is not available.
A Vernier caliper was used in the measurements of the test samples actual dimensions.
4.3.3. Test Specimen
Regarding now the size of the test specimens for the flexural trials, the previously mentioned
standard states that for molding materials (thermoplastics and thermosets) the dimensions
should be 12.7 mm wide, 3.2 mm thick, and 127 mm long (Figure 36).
Figure 36 – Dimensions of the flexural test samples.

41
4.3.4. Printing set up
Cura 2.1.3 is the slicing software associated to the used 3D printer – MALYAN Prusa i3 M150.
Cura allows the definition of a set up for a given printing process. In our case, as previously
explained it is intended to study the mechanical behaviour of parts printed in 3 different
materials and evaluate their differences. Also, it is required to understand the effect of a
reduction of the inside material in the mechanical properties of printed objects. In order to
successfully achieve that, all printing geometric characteristics must be the same for all
specimens (including the different materials and the different test types), with exception for
the infill percentage (100% and 50% infill). Also, the printing temperature conditions, more
specifically the extrusion, bed and environment temperatures, must be equal for all the
specimen batches of a given material. The set up definitions established for the printing of
the test specimens are summarized in Table 4. The printing deposition of all specimens is
made in the thickness direction (Figure 37).
Table 4 – Printing set up definitions.
Printer MALYAN Prusa i3 M150
Slicing Software Cura 2.1.3
Quality Layer height 0.2 mm
Line width 0.4 mm
Shell Wall thickness 0.8 mm
Top/Bottom thickness 0.8 mm
Top/Bottom pattern Lines
Infill Infill 50% and 100%
Infill pattern Lines
Figure 37 – Printing deposition direction of all
specimens.
42
4.3.5. Data to be determined
The determination of the elastic modulus allows to evaluate and compare the stiffness
between the specimens produced in different materials and infill configurations. In turn,
obtaining the yield and flexural strength values allows respectively, to understand the stress
necessary to apply in order to initiate plastic deformation and also the maximum flexural
stress capacity of the different produced specimens.
Table 5 – Data to be determined on the flexural trials.
Property Unit
Modulus of elasticity MPa
Offset yield strength (0.2%) MPa
Flexural strength MPa
4.3.6. Test procedure
For each trial an untested sample was used. Firstly, the centre of each specimen was marked
with a transversal line, and then with the help of a Vernier caliper the actual thickness and
width in that position were verified. Those dimensions allow the calculation of the support
span and of the rate of crosshead motion. As referred in the adopted standard the support
span has to be sixteen times the thick of the specimen (7). The rate of the cross head motion
is calculated using equation (8). After obtaining the support span this measure was marked in
the test specimen by means of two other lines.
𝐿 = 16 × 𝑇 (7)
where, L is the support span, and T the beam thickness.
𝑅 =
𝑍 × 𝐿2
6 × 𝑇
(8)
where, R is the rate of the crosshead motion, L the support span, T the beam thickness, and Z
the outer fiber straining rate.
Following this calculations, the alignment of the universal tester loading nose and supports
was verified in order to ensure that the axes of all cylindrical surfaces are parallel. Also, the
supports were positioned according to the previously calculated support span. This setting
was performed with the help of a graduated scale that is inscribed under the supports. The
loading nose is, of course, in the central 0 position. After these procedures, the specimen,
with the help of the marked transversal lines, was placed correctly in the supports, ensuring
that its longitudinal axis is perpendicular to the axes of the cylindrical surfaces, and that its

43
central transversal line is in the same plane as the axis of the loading nose cylindrical face.
Finally, it was necessary to gently place the loading nose, not in contact, but as close as
possible to the test specimen surface. With this last action, all the settings necessary in the
universal tester were completed (Figure 38).
In order to execute a trial in the universal tester, first it is necessary to create a method file
which guides the execution of each test. This file is created in TRAPEZIUM 1.3.0, the software
associated to the testing machine. The creation of the file consists of seven steps, and the
process is similar for both flexural and tensile trials. Summing up, the first step is the System,
here the test mode and test type are selected. In this case a single test mode and a 3 point
bending test are chosen. The units to be used in the sensor values, charts and obtained
results, and the number of significant figures for each determined property are also chosen in
this section. The second step, Sensor, is where the most appropriate force sensor scale and
stroke limit for the tests in question are defined. In the third step, Testing, the test velocity,
the displacement origin and the end settings are specified. Continuing, in the fourth step,
Specimen, the type of material, the shape and the dimensions of the test samples, and also
the support span to be used are defined. The fifth step of this procedure, the Data
Processing, corresponds to the definition of the data to be determined in the trial. In the
sixth step, Chart, both the axes and the window size of the test charts are set. By last, the
seventh step, Report, is where the desired template for the test report is created.
Finally, having all the universal tester settings completed and with the method file created,
the flexural trial may be performed.
4.3.7. Calculations processing
According to the Trapezium Data Processing Reference Manual [44], the required calculations
in the execution of the flexural tests are performed using the following equations:
Figure 38 – Flexural test sample ready to be tested.

44
𝐹𝑙𝑒𝑥𝑢𝑟𝑎𝑙 𝑆𝑡𝑟𝑒𝑠𝑠 =
3
2×
𝐿 × 𝐹
𝑊 × 𝑇2
(9)
𝐹𝑙𝑒𝑥𝑢𝑟𝑎𝑙 𝑆𝑡𝑟𝑎𝑖𝑛 =
6 × 𝑇
𝐿2× 𝛥𝑙
(10)
𝐹𝑙𝑒𝑥𝑢𝑟𝑎𝑙 𝐸𝑙𝑎𝑠𝑡𝑖𝑐 𝑀𝑜𝑑𝑢𝑙𝑢𝑠 =
𝐿3
4𝑊𝑇3× 𝑆𝑙𝑜𝑝𝑒
(11)
where, L is the support span, F the applied load, W the beam width, T the beam thickness,
and 𝛥l the bending deflection at the beam centre.
In equation 11, the expression slope refers to the initial section of the test force - bending
deflection curve. This slope is calculated with the data between two pre-defined points, using
the least squares method.
4.3.8. Results
4.3.8.1. ABS
The results (Table 8 and Figures 40 and 41) of the trials performed on ABS 100% and 50% infill
samples (Figure 39), along with the printing temperature conditions (Table 6) and the
specimens mass values (Table 7), are presented in this sub-section.
Table 6 –Printing temperature conditions of ABS flexural test samples.
Temperature Conditions (°C)
Extrusion temperature 240
Bed Temperature 100
Environment Temperature 50
Figure 39 – ABS flexural test samples.

45
Table 7 – Mass of 50 and 100% infill ABS flexural samples.
Specimens Mass (g)
Infill – 100% Infill – 50%
Specimen 1 5.180 Specimen 1 4.390
Specimen 2 5.180 Specimen 2 4.390
Specimen 3 5.170 Specimen 3 4.400
Average mass 5.177 Average mass 4.393
Mass reduction(%) 15.144
Table 8 – Obtained data from ABS flexural tests.
Specimen
Flexural Elastic
Modulus (MPa)
Flexural Yield Strength
(0.2% offset) (MPa)
Strain at Flexural Yield Strength (%)
Flexural Strength
(MPa)
Strain at Flexural
Strength (%)
1 – 100% 2442.510 60.615 2.663 71.515 5.000
2 – 100% 2502.540 59.074 2.546 71.281 5.000
3 – 100% 2405.360 58.262 2.617 70.546 5.000
Average values 2450.137 59.317 2.609 71.114 5.000
1 – 50% 2169.290 55.401 2.769 61.544 5.000
2 – 50% 2214.790 56.924 2.752 62.940 5.000
3 – 50% 2242.810 55.587 2.685 61.183 4.943
Average values 2208.963 55.971 2.735 61.889 4.981
Figure 40 – Flexural Stress vs Flexural Strain for ABS-100% infill-specimen 3.

46
The red linear line represents the initial slope of the flexural stress-flexural strain graphic
and therefore the elastic modulus. In turn, and explained in the sub-section 2.4.2.1 the blue
line is an auxiliary line used in the determination of the offset yield strength.
4.3.8.2. PLA
Results (Table 11 and Figures 43 and 44) from PLA 100% and 50% infill samples (Figure 42),
along with the printing temperature conditions (Table 9) and specimens mass values (Table
10), are presented in this sub-section.
Table 9 - Printing temperature conditions of PLA flexural test samples.
Temperature Conditions (°C)
Extrusion temperature 210
Bed Temperature 60
Environment Temperature 24, 25
Figure 42 - PLA flexural test samples.
Figure 41 - Flexural Stress vs Flexural Strain for ABS-50% infill-specimen 3.

47
Table 10 - Mass of 50 and 100% infill PLA flexural samples.
Specimens Mass(g)
Infill – 100% Infill – 50%
Specimen 1 5.510 Specimen 1 -
Specimen 2 5.550 Specimen 2 4.350
Specimen 3 5.570 Specimen 3 4.420
Average mass 5.543 Average mass 4.385
Mass reduction(%) 20.891
Table 11 - Obtained data from PLA flexural tests.
Specimen
Flexural Elastic
Modulus (MPa)
Flexural Yield Strength
(0.2% offset) (MPa)
Strain at Flexural Yield Strength (%)
Flexural Strength
(MPa)
Strain at Flexural
Strength (%)
1 – 100% 3262.630 80.152 2.658 95.863 4.331
2 – 100% 3646.660 84.795 2.522 102.909 4.574
3 – 100% 3498.390 79.724 2.482 97.940 4.340
Average values 3469.227 81.557 2.554 98.904 4.415
2 – 50% 2887.200 58.220 2.221 68.779 3.686
3 – 50% 2856.960 58.628 2.261 69.329 3.934
Average values 2872.080 58.424 2.241 69.054 3.810
Figure 43 - Flexural Stress vs Flexural Strain for PLA-100% infill-specimen 3.

48
The existence of only two trials of PLA 50% infill is due to several invalid tests. During such
tests, the specimens broke in the internal layers instead of breaking in the external surface.
This occurrence may be due to the anisotropy of the tests samples.
4.3.8.3. Carbonfil
The results (Table 14 and Figures 46 and 47) of the trials performed on Carbonfil 100% and
50% infill samples (Figure 45), along with the printing temperature conditions (Table 12) and
the specimens mass values (Table 13), are presented in this sub-section.
Table 12 - Printing temperature conditions of Carbonfil flexural test samples.
Temperature Conditions(°C)
Printing temperature 235
Bed Temperature 60
Environment Temperature 30
Figure 45 - Carbonfil flexural test samples.
Figure 44 - Flexural Stress vs Flexural Strain for PLA-50% infill-specimen 3.

49
Table 13 - Mass of 50 and 100% infill Carbonfil flexural samples.
Specimens Mass(g)
Infill – 100% Infill – 50%
Specimen 1 5.710 Specimen 1 4.380
Specimen 2 5.590 Specimen 2 4.920
Specimen 3 5.730 Specimen 3 4.850
Average mass 5.677 Average mass 4.717
Mass reduction 16.910
Table 14 - Obtained data from Carbonfil flexural tests.
Specimen
Flexural Elastic
Modulus (MPa)
Flexural Yield Strength
(0.2% offset) (MPa)
Strain at Flexural Yield Strength (%)
Flexural Strength
(MPa)
Strain at Flexural
Strength (%)
1 – 100% 4906.040 62.475 1.462 86.871 2.884
2 – 100% 4776.670 60.750 1.456 86.079 3.017
3 – 100% 4848.500 61.071 1.445 85.104 2.816
Average values 4843.737 61.432 1.454 86.018 2.906
1 – 50% 3919.980 50.669 1.479 66.641 2.553
2 – 50% 4265.980 67.821 1.781 79.624 2.610
3 – 50% 4228.930 62.966 1.687 76.450 2.664
Average values 4138.297 60.485 1.649 74.238 2.609
Figure 46 - Flexural Stress vs Flexural Strain for Carbonfil-100% infill-specimen 3.

50
4.4. Tensile Tests
4.4.1. ASTM D638 - 10 standard
The execution of the tensile tests was based on the ASTM D638-10 standard [45], and likewise
the flexural tests, an attempt was made in order to follow the procedures described there as
much as possible. This standard covers the methodology that should be followed in order to
perform tensile tests, and with that, determining the tensile properties of unreinforced and
reinforced plastic materials. During this trials, standardized dumbbell shaped test samples
will suffer a controlled tensile force under pre-specified conditions.
4.4.2. Equipment
Similarly to bending trials, the same universal tester - SHIMADZU Autograph AG-IC Table Top
Type AG-50kNICD – was used. In this case, in order to execute the tensile tests, both the fixed
and movable members of the machine were coupled with grips.
MFA 2 Hand clamped extensometer was used for the measurement of the specimen elongation
during test. This extensometer has a measuring path of 2 mm, and as such, is not indicated
for the measurement of large displacements nor should be used until fracture, under the risk
of damage due to the break shock.
Figure 47 - Flexural Stress vs Flexural Strain for Carbonfil-50% infill-specimen 3.

51
The reason why an extensometer must be used for the measurement of the elongation,
instead of simply using the distance between grips (the crosshead movement) is, as stated in
[46], essentially due to the following facts:
The shape of the specimens is not uniform, and thanks to the width variations the
strain rate will differ throughout the sample. In the narrower section the strain will
be superior;
There is always an inevitable movement of the sample in the claws while these are
still seating firmly to hold the specimen.
Such factors will insert an error in the measurement of the specimen elongation, making the
distance between grips an inappropriate tool in the study of the stress-strain behaviour in
tensile tests.
A Vernier Calliper was used for the measurement of the actual dimensions of the test
samples.
4.4.3. Test specimen
The geometry and dimensions (Figure 48) of the specimens used in the tensile trials are
defined by the test standard and specified in the section: Test Specimens - Sheet, Plate, and
Molded Plastics - Rigid and Semirigid Plastics.
Figure 48 – Dimensions of the tensile test samples.

52
4.4.4. Printing Set-up
Then again, and following the logic described in the methodology subchapter, the printing set
up definitions for the tensile tests stand the same as for the flexural trials – Table 15. The
printing deposition of all specimens is made in the thickness direction.
Table 15 – Printing set up definitions.
Printer MALYAN Prusa i3 M150
Slicing Software Cura 2.1.3
Quality Layer height 0.2 mm
Line width 0.4 mm
Shell Wall thickness 0.8 mm
Top/Bottom thickness 0.8 mm
Top/Bottom pattern Lines
Infill Infill 50% and 100%
Infill pattern Lines
4.4.5. Data to be determined
The extensometer to be used in the tensile tests has a small measurement path and as
consequence, it cannot be used until fracture is reached due the risk of damaging the device.
Furthermore, as was also previously explained, the use of the distance between grips is not a
reliable method to obtain accurate elongation data.
The found solution consists in using the extensometer during just the required elongation to
determine the elastic modulus and then removing it. The rest of the test is plotted with the
force as a function of the crosshead movement. Despite this solution allowing a correct
determination of the elastic modulus, part of the test is performed with inaccurate data. Due
to such fact nor the offset yield strength, nor correct strain points can be calculated.
Table 16 – Data to be determined in the tensile trials.
Property Unit
Modulus of elasticity MPa
Tensile strength MPa

53
4.4.6. Test procedure
The tensile trials were executed using the following procedure. Firstly, as in the flexural
tests, auxiliary marks were made on the specimens. Each sample was marked in the centre of
its length, and from this centre position both the gage length – 50 mm- and the distance
between the grips -115 mm- were marked with lines perpendicular to the specimen
longitudinal axis. Aiming a correct alignment of the sample on the universal tester,
longitudinal centred lines were also marked on the test sample. Next, and with the help of a
Vernier caliper, the actual thickness and width in the centre and ends of the specimen gage
length were measured.
Continuing, the test piece was then placed on the test machine. This step should be
performed with special care, since it is very important to verify a correct placement of the
sample. That being said, the lines drawn in the specimen representing the distance between
the grips, should be coincident with the clamping edges, and the longitudinal centred lines
coincident with central mark engraved on the grips. After that, the claws are tightened,
avoiding slippage of the sample during the test execution. With this process it is guaranteed,
as much as possible, that the longitudinal axis of the specimen is aligned with the longitudinal
axis of the grips and therefore with the pull direction.
With the test piece placed on the universal tester, it is time to set the extensometer. The
knife edges of the measuring device must be coincident with the specimen gage length marks.
This marks not only help in the location of the clamping, but also ensure a straight
positioning. The clamping process should be done in a way that the bottom edge contacts the
test sample first. With a correct placement of the extensometer all the necessary settings in
the universal tester were completed (Figure 49).
Figure 49 – Tensile test sample ready to be tested.

54
The creation of the method file for the execution of the tensile tests, follows the same steps
as for the flexural trials. In this file we again specify, among other definitions (section 4.3.6),
the test type, the most appropriate stroke limit and force sensor scale, the test velocity (5
mm/min as stated in the standard), the type of material and required dimensions, and all the
data to be determined. The main difference in the creation of a tensile method file is related
to the addition of an extensometer. In this case, in the step Sensor it is also necessary to
specify the full scale of the device, the extensometer reading limit and the gauge length.
During the test, when the extensometer reaches its reading limit, the testing machine is
paused and the extensometer is removed. Then, the trial can be safely resumed without the
risk of damaging the device.
4.4.7. Calculations Processing
Then again, according to [44], the required calculations in the execution of the tensile tests
are performed using the following equations:
𝑇𝑒𝑛𝑠𝑖𝑙𝑒 𝑆𝑡𝑟𝑒𝑠𝑠 =
𝑇𝑒𝑠𝑡 𝐹𝑜𝑟𝑐𝑒
𝑇 × 𝑊
(12)
𝑇𝑒𝑛𝑠𝑖𝑙𝑒 𝑆𝑡𝑟𝑎𝑖𝑛 =
𝐷𝑖𝑠𝑝𝑙𝑎𝑐𝑒𝑚𝑒𝑛𝑡
𝐺𝑎𝑔𝑒 𝐿𝑒𝑛𝑔ℎ𝑡
(13)
𝑇𝑒𝑛𝑠𝑖𝑙𝑒 𝐸𝑙𝑎𝑠𝑡𝑖𝑐 𝑀𝑜𝑑𝑢𝑙𝑢𝑠 = 𝑆𝑙𝑜𝑝𝑒 ×
𝐺𝑎𝑔𝑒 𝐿𝑒𝑛𝑔ℎ𝑡
𝑇 × 𝑊
(14)
where, T is the specimen thickness, and W the specimen with.
The expression slope, in the equation 14, refers to the slope of the initial section of the test
force - displacement curve. Likewise equation 11, this slope is calculated with the data
between two pre-defined points using the least squares method.

55
4.4.8. Results
4.4.8.1. ABS
The results (Table 19 and Figures 51 and 52) of the trials performed on ABS 100% and 50%
infill samples (Figure 50), along with the printing temperature conditions (Table 17) and the
specimens mass values (Table 18), are presented in this sub-section.
Table 17 - Printing temperature conditions of ABS tensile test samples.
Temperature Conditions (°C)
Extrusion temperature 240
Bed Temperature 100
Environment Temperature 50
Table 18 - Mass of 50 and 100% infill ABS tensile samples.
Specimens Mass(g)
Infill – 100% Infill – 50%
Specimen 1 8.480 Specimen 1 7.090
Specimen 2 8.470 Specimen 2 7.050
Specimen 3 8.490 Specimen 3 7.080
Average mass 8.480 Average mass 7.073
Mass reduction(%) 16.592
Figure 50 - ABS tensile test samples.

56
Table 19 - Obtained data from ABS tensile tests.
Specimen Tensile Elastic Modulus (MPa)
Tensile Strength (MPa)
Stroke Strain at Tensile
Strength (%)
1 – 100% 2797.440 44.110 2.332
2 – 100% 2696.690 43.543 2.303
3 – 100% 2782.270 44.091 2.370
Average values 2758.800 43.915 2.335
1 – 50% 1978.370 31.540 2.275
2 – 50% 1992.520 31.853 2.279
3 – 50% 2064.200 32.781 2.367
Average values 2011.697 32.058 2.307
Figure 51 – Tensile Stress vs Stroke Strain for ABS-100% infill- specimen 3.

57
4.4.8.2. PLA
Results (Table 22 and Figures 54 and 55) from PLA 100% and 50% infill samples (Figure 53),
along with the printing temperature conditions (Table 20) and specimens mass values (Table
21), are presented in this sub-section.
Table 20 - Printing temperature conditions of PLA tensile test samples.
Temperature Conditions (°C)
Extrusion temperature 210
Bed Temperature 60
Environment Temperature 24
Figure 53 - PLA tensile test samples.
Figure 52 - Tensile Stress vs Stroke Strain for ABS-50% infill- specimen 3.

58
Table 21 - Mass of 50 and 100% infill PLA tensile samples.
Specimens Mass(g)
Infill – 100% Infill – 50%
Specimen 1 8.890 Specimen 1 6.870
Specimen 2 9.070 Specimen 2 7.090
Specimen 3 9.000 Specimen 3 7.210
Average mass 8.987 Average mass 7.057
Mass reduction(%) 21.475
Table 22 - Obtained data from PLA tensile tests.
Specimen
Tensile Elastic
Modulus (MPa)
Tensile Strength
(MPa)
Stroke Strain at Tensile
Strength (%)
1 – 100% 3847.890 59.894 2.306
2 – 100% 3812.750 58.153 2.277
3 – 100% 3714.550 58.484 2.250
Average values 3791.730 58.844 2.278
1 – 50% 2329.620 31.911 1.975
2 – 50% 2467.500 36.176 2.143
3 – 50% 2549.370 35.405 2.140
Average values 2448.830 34.497 2.086
Figure 54 - Tensile Stress vs Stroke Strain for PLA-100% infill- specimen 3.

59
4.4.8.3. Carbonfil
The results (Table 25 and Figures 57 and 58) of the trials performed on Carbonfil 100% and
50% infill samples (Figure 56), along with the printing temperature conditions (Table 23) and
the specimens mass values (table 24), are presented in this sub-section.
Table 23 - Printing temperature conditions of Carbonfil tensile test samples.
Temperature Conditions(°C)
Extrusion temperature 235
Bed Temperature 60
Environment Temperature 30
Figure 56 - Carbonfil tensile test samples.
Figure 55 - Tensile Stress vs Stroke Strain for PLA-50% infill- specimen 3.

60
Table 24 - Mass of 50 and 100% infill Carbonfil tensile samples.
Specimens Mass(g)
Infill – 100% Infill – 50%
Specimen 1 9.570 Specimen 1 7.810
Specimen 2 9.560 Specimen 2 7.780
Specimen 3 9.440 Specimen 3 7.800
Average mass 9.523 Average mass 7.797
Mass reduction(%) 18.125
Table 25 - Obtained data from Carbonfil tensile tests.
Specimen
Tensile Elastic
Modulus (MPa)
Tensile Strength
(MPa)
Stroke Strain at Tensile
Strength (%)
1 – 100% 4219.930 44.761 2.263
2 – 100% 4166.660 44.715 2.241
3 – 100% 4099.290 43.588 2.231
Average values 4161.960 44.355 2.245
1 – 50% 2891.970 28.874 2.072
2 – 50% 3066.620 31.119 2.238
3 – 50% 2905.130 28.538 2.095
Average values 2954.573 29.510 2.135
Figure 57 - Tensile Stress vs Stroke Strain for Carbonfil-100% infill- specimen 3.

61
4.5. Results analysis
In this sub-chapter it is intended to analyse the results obtained from the mechanical tests,
and as already may have been perceived, all materials produce parts with quite distinct
properties.
Aiming to facilitate the data study, comparative graphs will be also presented. The charts,
together with the data and stress-strain curves from section 4.4.8 stand as the basis of the
following analysis.
4.5.1. Elasticity modulus
Both flexural and tensile tests, as may be observed in graphics 1 and 2, show Carbonfil as the
material producing parts with higher modulus of elasticity, which means of course, higher
stiffness. In other words, for Carbonfil parts a given amount of elastic deformation requires a
greater applied load when comparing with PLA and ABS. This last one, the ABS, has on the
other hand, the produced parts with the smallest E value measured by the two test types,
being consequently the less stiff.
Parts with a 50% internal material reduction present, also for both flexural and tensile tests,
a decrease of the E value. Considering all three materials, for the flexural trials the elasticity
modulus decreased on average 14%, and for the tensile tests about 31%. It is possible to verify
that a superior decrease of the elasticity modulus occurred in the tensile trials.
Figure 58 - Tensile Stress vs Stroke Strain for Carbonfil-50% infill- specimen 3.

62
4.5.2. Flexural and Tensile Strength
Resorting now to graphs 3 and 4, and comparing the obtained results, it is clear that PLA
printed parts have both superior tensile and flexural strength. Specifying, such parts present
flexural strength values 28% and 13% superior to the ones produced by ABS and Carbonfil,
respectively. Regarding the tensile trials, PLA produced parts show a 25% superior strength
comparing with the two other studied materials, both, of course, presenting similar results.
Likewise the previous elastic modulus analysis, a 50% infill reduction led to a decrease of both
flexural and tensile strength values of the printed parts. Considering all three materials, the
flexural and tensile trials showed an average decrease of respectively 19% and 34%. A
justification for such disparity between the two trials types may be due to the nature of the
2450
3469
4844
2209
2872
4138
ABS PLA CARBONFIL
Fle
xura
l Ela
stic
Mo
du
lus
(MP
a)
Flexural Elastic Modulus
Infil: 100% Infil: 50%
2759
3792 4162
2012 2449
2955
ABS PLA CARBONFIL
Ten
sile
Ela
stic
Mo
du
lus
(MP
a)
Tensile Elastic Modulus
Infil: 100% Infil: 50%
Graph 1 - Flexural elastic modulus results comparison.
Graph 2 - Tensile elastic modulus results comparison.

63
flexural tests. In this type of trials the maximum stress occurs, theoretically, on the outer
surface of the tests sample, and since the specimens shell is always completely solid, the
effect of the infill change on the flexural properties is reduced.
4.5.3. Yield Flexural Strength and Ductility
The yield strength determination is a very important parameter when the aim is to choose
materials capable of withstanding the maximum applied stress without yielding (which is the
case of most structural applications). Unfortunately, and for reasons already explained, in
what concerns the current work it was only possible to determine the yield strength during
the execution of flexural tests.
71
99 86
62 69
74
ABS PLA CARBONFIL
Fle
xura
l Str
en
gth
(M
Pa)
Flexural Strength
Infil: 100% Infil: 50%
44
59
44
32 34 30
ABS PLA CARBONFIL
Ten
sile
Str
en
gth
(M
Pa)
Tensile Strength
Infil: 100% Infil: 50%
Graph 3 - Flexural strength results comparison.
Graph 4 - Tensile strength results comparison.

64
According to graph 5, among the three studied materials, flexural trials point out that parts
produced in PLA require the highest value of applied stress in order to induce plastic
deformation. Parts printed in ABS and Carbonfil present similar yield strength results.
Comparing the yield and flexural strength results (respectively graphics 17 and 15), it is
possible to verify that the difference between the 100% and 50% test samples increases along
the applied stress. In fact, with exception for the PLA, graphic 17 shows that both infill
settings present very close yield strength results. It would be interesting to analyse if such
behaviour also occurs during tensile trials.
Distinct materials may present different behaviours once the elastic limit is reached.
According to the test charts from sections 4.3.8, 4.4.8 and Annex, and comparing the three
studied materials, it is possible to observe that while ABS test samples proved to be more
ductile, capable of larger plastic deformations before fracture, PLA and specially Carbonfil
specimens, presented on the other hand a more brittle behaviour, breaking after
comparatively small deformations.
59
82
61 56 58 60
ABS PLA CARBONFIL
Fle
xura
l Yie
ld S
tre
ngt
h (
MP
a)
Flexural Yield Strength
Infil: 100% Infil: 50%
Graph 5 - Flexural yield strength results comparison.
65
4.6. Conclusion
As outlined for this chapter, tensile and flexural tests were performed aiming to study the
mechanical characteristics of parts printed in three different FFF materials, and to analyse
the effect of the infill 3D printing setting. As result, it was verified that the three materials
produce parts with quite distinct properties. PLA printed parts present the highest values of
yield, flexural and tensile strength. In turn Carbonfil specimens are the stiffer showing both
superior tensile and flexural elasticity modulus. By last, ABS parts stand as the more ductile,
capable of large plastic deformations before breaking.
Regarding now the 50% infill reduction test, it was verified that a decrease in the internal
material leads to a decrease of the printed parts stiffness and strength. It also was verified a
variation of the infill impact depending of the executed test type. For example, while for
flexural trials, the flexural strength presented a 19% reduction from 100% to 50% samples, for
the tensile tests, the tensile strength presented a 34% decrease. Finally, after comparing the
results from yield and flexural strength charts, it was observed that the infill impact increases
along with the applied stress.
It should also be mentioned, within the 50% infill reduction trial, that comparing the specific
modulus and strengths it is observed a superior infill impact on the strength results. While
Flexural and Tensile elastic modulus show a reduction of 14% and 31% respectively, the
Flexural and Tensile Strengths present in turn a decrease of 19% and 34%.
Resorting to the literature, it is indeed verified, that different printing settings translate
automatically in different mechanical properties. For example in [47], ABS trials present
much lower strength values, more specifically 19 MPa for the flexural strength and about 17
MPa for the tensile strength. Such values may be due to the fact that the material deposition
is made in the direction of the samples longitudinal axis. However, since [47] does not fully
specifies the printing settings it is not possible to ascertain more precise conclusions. In [48],
PLA test samples with similar characteristics to the ones used in this dissertation, show, of
course, more approximate values. Such work presents for a 45º raster orientation, values of
64 and 91 MPa for the tensile and flexural strength respectively and also a tensile and flexural
elastic modulus of respectively 3600 and 2985 MPa.

66
5. Conclusion
5.1. Dissertation synthesis
An objective way of synthesizing a given work is made by addressing the defined goals. Taking
a look at chapter 3, the search of ideas from ordinary mechanical components, the performed
CAD work, and the introduction of AM technology, led to the development of a functional
joint system, whose clamping mechanism was successfully tested by means of a suspension
test. Unfortunately, it was not possible to execute an assembly test and therefore evaluate
the suitability of the developed joint. AM is, undoubtedly, the innovative aspect introduced in
the developed concept, allowing the production of highly complex parts in an instant manner
and in a simpler way.
The remaining dissertation goals are covered in chapter 3. The execution of tensile and
flexural tests showed that all three studied materials – ABS, PLA and Carbonfil - produce parts
with distinct properties, and each may be more adequate for a given application. For
example, while Carbonfil origins more stiffer parts, PLA presents superior strength results and
ABS a higher ductile capacity. Regarding now the internal mass reduction trials, it was
verified, for all materials, that a decrease in the infill of a given part leads to a reduction of
its stiffness and strength. Care should be taken in order to verify that the gains in terms of
mass reduction justify the losses on the mechanical characteristics. A great discrepancy of
the infill impact between tensile and flexural trials was also verified. While flexural tests
presented a 19% flexural strength decrease, tensile tests showed a 34% reduction on the
tensile strength. Lastly, it was observed that the infill impact increases along with the
applied load, and that such impact is superior in the strength results comparing with the
specific modulus ones.
5.2. Final Considerations
It was the opinion of several persons involved on UrbLog project to explore the benefits
brought by AM technologies. This dissertation proved the applicability of such technologies by
developing a functional joint system concept. Nonetheless, we still have to go a long way for
the concept to become a structural solution to Prototype 3 internal structure.
The use of AM in a structural project, makes it crucial to develop analysis on different
available materials and on different printing settings and conditions. This dissertation aimed
to present a starting point for such studies, by analysing three different commercially
available FFF materials, and by evaluating the effect of the infill setting.

67
5.3. Future works
Regarding the possible application of 3D printing technology on Prototype 3 internal
structure, and aiming therefore to optimize the use of such technique, it is necessary:
To understand how forces actuate on the structure and the expected magnitude of
such loads;
To analyse further FFF commercially available materials;
To study the effect of other different 3D printing parameters on the mechanical
properties of printed objects;
To perform studies aiming to evaluate how weaker are parts in the direction of the
deposition comparing with other axis.
The last three mentioned topics already have some developed work in the literature,
nonetheless it is important to continue to perform fully characterized 3D printing studies.

68
References
[1] M. Macário, V. Reis, J. Silva, P. Gamboa, and J. Neves, “Sistema de transporte aéreo
multifuncional,” PT 108532 A, 2016.
[2] T. Santos, “Internal Structure of Hybrid Airships Airship Design and Structural
Analyses,” Universidade da Beira Interior, 2015.
[3] S. Claro, “Manufacturing Techniques of a Hybrid Airship Prototype,” Universidade da
Beira Interior, 2015.
[4] C. Stockbridge, A. Ceruti, and P. Marzocca, “Airship research and development in the
areas of design, structures, dynamics and energy systems,” Int. J. Aeronaut. Sp. Sci.,
vol. 13, no. 2, pp. 170–187, 2012.
[5] L. Liao and I. Pasternak, “A review of airship structural research and development,”
Prog. Aerosp. Sci., vol. 45, no. 4–5, pp. 83–96, 2009.
[6] Y. Li, M. Nahon, and I. Sharf, “Airship dynamics modeling: A literature review,” Prog.
Aerosp. Sci., vol. 47, no. 3, pp. 217–239, 2011.
[7] G. A. Khoury and J. D. Gillet, Eds., Airship Technology. Press Syndicate of the
University of Cambridge, 1999.
[8] PROGRAM ON AIRSHIP DESIGN AND DEVELOPMENT, “Airships.” [Online]. Available:
https://www.aero.iitb.ac.in/~ltasys/airships1.html. [Accessed: 28-Mar-2017].
[9] Zeppelin History, “History of Zeppelins and Rigid Airships.” [Online]. Available:
http://www.zeppelinhistory.com/rigid-airships-history/history-of-rigid-airships/.
[Accessed: 19-Apr-2017].
[10] NEW ATLAS, “Aeroscraft begins flight testing following FAA certification,” 2013.
[Online]. Available: http://newatlas.com/aeros-gets-faa-approval-for-testing/28970/.
[Accessed: 19-Apr-2017].
[11] AIRSHIPS.NET, “The First Zeppelins: LZ-1 through LZ-4.” [Online]. Available:
http://www.airships.net/zeppelins/. [Accessed: 19-Apr-2017].
[12] Aeros, “KEY TECHNOLOGY.” [Online]. Available:
http://aeroscraft.com/technology/4575865632. [Accessed: 19-Apr-2017].
[13] Aeros, “KEY TECHNOLOGY.” [Online]. Available: http://aeroscraft.com/technology-
copy/4580412172. [Accessed: 19-Apr-2017].
[14] CONGRESSIONAL BUDGET OFFICE, “Recent Development Efforts for Military Airships,”
2011.
[15] Z. B. Jiron, “Hybrid Airships for Lift: A New Paradigm,” ARMY SUSTAINMENT
MAGAZINE, pp. 40–45, 2012.
[16] Stavros Androulakakis, “Lockheed Martin Lighter-Than-Air Programs Lockheed Martin
69
Lighter-Than-Air Technologies,” 2013.
[17] Iteknowledgies, “HYBRID AIR VEHICLE (P-791),” 2010. [Online]. Available:
https://aerospaceblog.wordpress.com/2010/09/01/hybrid-air-vehicle-p-791/.
[Accessed: 28-Mar-2017].
[18] ASTM International, “F2792-12a - Standard Terminology for Additive Manufacturing
Technologies,” 2012.
[19] ATLANTIC COUNCIL, “Could 3D Printing Change the World? Technologies, Potential,
and Implications of Additive Manufacturing,” 2011.
[20] W. Gao, Y. Zhang, D. Ramanujan, K. Ramani, Y. Chen, C. B. Williams, C. C. L. Wang,
Y. C. Shin, S. Zhang, and P. D. Zavattieri, “The status, challenges, and future of
additive manufacturing in engineering,” Comput. Des., vol. 69, pp. 65–89, 2015.
[21] N. Guo and M. C. Leu, “Additive manufacturing: Technology, applications and research
needs,” Frontiers of Mechanical Engineering, vol. 8, no. 3. pp. 215–243, 2013.
[22] M. Cotteleer, J. Holdowsky, and M. Mahto, “The 3D opportunity primer: The basics of
additive manufacturing,” 2013.
[23] I. Gibson, D. Rosen, and B. Stucker, Additive Manufacturing Technologies: 3D Printing,
Rapid Prototyping, and Direct Digital Manufacturing, Second Edi. Springer, 2010.
[24] K. V. Wong and A. Hernandez, “A Review of Additive Manufacturing,” ISRN Mech. Eng.,
vol. 2012, pp. 1–10, 2012.
[25] S. Grunewald, “GE is Using 3D Printing and Their New Smart Factory to Revolutionize
Large-Scale Manufacturing,” 2016. [Online]. Available:
https://3dprint.com/127906/ge-smart-factory/. [Accessed: 26-Mar-2017].
[26] “Fused filament fabrication.” [Online]. Available: http://reprap.org/wiki/FFF.
[Accessed: 25-Mar-2017].
[27] J. Steuben, D. L. Van Bossuyt, and C. Turner, “Design for Fused Filament Fabrication
Additive Manufacturing,” Vol. 4 20th Des. Manuf. Life Cycle Conf. 9th Int. Conf.
Micro- Nanosyst., no. August, 2015.
[28] L. Novakova-Marcincinova and I. Kuric, “Basic and Advanced Materials for Fused
Deposition Modeling Rapid Prototyping Technology,” Manuf. Ind. Eng., 2012.
[29] sUAS News - The Business of Drones, “Aurora Flight Sciences 3D printed wing.”
[Online]. Available: https://www.suasnews.com/2015/11/aurora-flight-sciences-3d-
printed-wing/. [Accessed: 26-Mar-2017].
[30] Stratasys, “Watch World’s First Jet-Powered, 3D Printed UAV Top 150 Mph!,” 2015.
[Online]. Available: https://www.youtube.com/watch?v=8e--
5u2LpHU&feature=youtu.be. [Accessed: 26-Mar-2017].
[31] S. Kalpakjian and S. R. Schmid, Manufacturing Engineering and Technology, Sixth Edit.

70
.
[32] MATHalino.com, “Shearing Deformation.” [Online]. Available:
http://www.mathalino.com/reviewer/mechanics-and-strength-of-materials/shearing-
deformation. [Accessed: 19-Mar-2017].
[33] D. Askeland, P. Fulay, and W. Wright, THE SCIENCE AND ENGINEERING OF MATERIALS,
Sixth Edit. Cengage Learning, 2010.
[34] J. R. Davis and Davis & Associates, Eds., Tensile Testing, Second Edi. 2004.
[35] D. Roylance, Mechanical Properties of Materials. 2008.
[36] U. K. Singh and M. Dwivedi, MANUFACTURING PROCESSES, Second Edi. NEW AGE
INTERNATIONAL PUBLISHERS, 2009.
[37] University of Colorado Boulder, “Beam Deflections: Second-Order Method.”
[38] MARK TWAIN HOBBY CENTER, “PROP ADAPTER 6MM SHAFT.” [Online]. Available:
http://www.hobby1.com/PROP-ADAPTER-6MM-SHAFT.html. [Accessed: 07-Apr-2017].
[39] DHgate.com, “DC 6-12V Electric Motor Drill Press with 0.5-3mm Small Brass Drill Chuck
Collets and 10pc 0.5-3mm Micro Twist Drill Bits.” [Online]. Available:
http://www.dhgate.com/store/product/dc-6-12v-electric-motor-drill-press-
with/377509487.html. [Accessed: 08-Apr-2017].
[40] FORMFUTURA, “Technical Data Sheet: CarbonFil,” 2015.
[41] ASTM International, “D790-15 - Standard Test Methods for Flexural Properties of
Unreinforced and Reinforced Plastics and Electrical Insulating Materials,” 2016.
[42] M. Kutz and Myer Kutz Associates, Eds., HANDBOOK OF MATERIALS SELECTION. JOHN
WILEY & SONS, INC., 2002.
[43] D. V. Rosato, N. R. Schott, D. V. Rosato, and M. G. Rosato, Eds., PLASTICS
ENGINEERING MANUFACTURING AND DATA HANDBOOK, vol. 2. Kluwer Academic
Publishers, 2001.
[44] Shimadzu Corporation, TRAPEZIUM X: Data Processing Reference Manual. 2007.
[45] ASTM International, “D638-10 - Standard Test Method for Tensile Properties of
Plastics,” 2010.
[46] S. B. Driscoll, Ed., The Basics of Testing Plastics: MECHANICAL PROPERTIES, FLAME
EXPOSURE, AND GENERAL GUIDELINES. AMERICAN SOCIETY FOR TESTING AND
MATERIALS, 1998.
[47] A. Debaie, “Processing-Property Relationships in 3D Printed Acrylonitrile Butadiene
Styrene,” 2016.
[48] T. Letcher and M. Waytashek, “Material Property Testing of 3D-Printed Specimen in
PLA on an Entry-Level 3D Printer,” Vol. 2A Adv. Manuf., no. DECEMBER 2014, 2014.

71
Annex - Flexural and Tensile trials – graphs

72

73
ABS – flexural tests
Flexural Stress vs Flexural Strain for ABS-100% infill-specimen 1.
Flexural Stress vs Flexural Strain for ABS-100% infill-specimen 2.

74
Flexural Stress vs Flexural Strain for ABS-50% infill-specimen 2.
Flexural Stress vs Flexural Strain for ABS-50% infill-specimen 1.

75
PLA – flexural tests
Flexural Stress vs Flexural Strain for PLA-100% infill-specimen 1.
Flexural Stress vs Flexural Strain for PLA-100% infill-specimen 2.

76
Carbonfil – flexural tests
Flexural Stress vs Flexural Strain for PLA-50% infill-specimen 2.
Flexural Stress vs Flexural Strain for Carbonfil-100% infill-specimen 1.

77
Flexural Stress vs Flexural Strain for Carbonfil-100% infill-specimen 2.
Flexural Stress vs Flexural Strain for Carbonfil-50% infill-specimen 1.

78
ABS – tensile tests
Flexural Stress vs Flexural Strain for Carbonfil-50% infill-specimen 2.
Tensile Stress vs Stroke Strain for ABS-100% infill-specimen 1.

79
Tensile Stress vs Stroke Strain for ABS-100% infill-specimen 2.
Tensile Stress vs Stroke Strain for ABS-50% infill-specimen 1.

80
PLA – tensile tests
Tensile Stress vs Stroke Strain for ABS-50% infill-specimen 2.
Tensile Stress vs Stroke Strain for PLA-100% infill-specimen 1.

81
Tensile Stress vs Stroke Strain for PLA-100% infill-specimen 2.
Tensile Stress vs Stroke Strain for PLA-50% infill-specimen 1.

82
Carbonfil – tensile tests
Tensile Stress vs Stroke Strain for PLA-50% infill-specimen 2.
Tensile Stress vs Stroke Strain for Carbonfil-100% infill-specimen 1.

83
Tensile Stress vs Stroke Strain for Carbonfil-100% infill-specimen 2.
Tensile Stress vs Stroke Strain for Carbonfil-50% infill-specimen 1.

84
Tensile Stress vs Stroke Strain for Carbonfil-50% infill-specimen 2.