University of Redlands - InSPIRe @ Redlands
91
University of Redlands VGI and Twitter for Event Feedback; A Case Study for the Arts Council for Long Beach A Major Individual Project submitted in partial satisfaction of the requirements for the degree of Master of Science in Geographic Information Systems by Numa Gremling Ruijin Ma, Ph.D., Committee Chair Mark Kumler, Ph.D. December 2013
-
Upload
khangminh22 -
Category
Documents
-
view
2 -
download
0
Transcript of University of Redlands - InSPIRe @ Redlands

University of Redlands
VGI and Twitter for Event Feedback;
A Case Study for the Arts Council for Long Beach
A Major Individual Project submitted in partial satisfaction of the requirements
for the degree of Master of Science in Geographic Information Systems
by
Numa Gremling
Ruijin Ma, Ph.D., Committee Chair
Mark Kumler, Ph.D.
December 2013

VGI and Twitter for Event Feedback;
A Case Study for the Arts Council for Long Beach
Copyright © 2013
by
Numa Gremling


v
Acknowledgements
This project is dedicated to mom, dad, brother, grandma, the four turtles, as well as the endless
blue in the Southern California skies.
Robbyn Abbitt, my number one reason for being in GIS. Without you I would never have realized
how amazing this field is.
My cohort, the past cohort, and the new cohort. I will not list my favorites here; you know who
you are :-)
Brandon, Pon, Vani, Sean, Lisa, who have given me great advice, or helped me to some extent or
another with this project. Thank you for pushing me, Ruijin; it was needed and it taught me a lot
about not giving in. Getting these birds to tweet was doable, indeed.
My best friends from Luxembourg: Tatiana, Béa, Tom, Yves.
My best friends from Ohio: Brett and his family, Lisa, JaMalle, Logan, Fern, Mike & Sam, Liz,
Matt, Emma, Mary, Molly, Natalia, Amy, Ana, Clancy.
The faculty for sharing so much great data, information, knowledge, and sometimes even
wisdom. An especially big thank you to Mark Kumler. You are one of the best teachers I have
ever had. Your passion, dedication, and support were incredibly inspiring and a major reason why
I was able to finish this program successfully.
Marco from the Arts Council. Vielen Dank für Deine Geduld und Unterstützung.
The Grateful Dead, Cream, The Doors (R.I.P. Ray), Bruce Springsteen, The E Street Band, The
Beach Boys, Leonard Cohen, Neil Young, Judas Priest, Pink Floyd, John Lee Hooker, Led
Zeppelin, Beethoven, The Velvet Underground & Nico (R.I.P. Lou), Paul Butterfield Blues Band,
Kris Kristofferson, Hank Williams, JJ Cale (R.I.P. JJ), David Gilmour, Wilson Pickett, Jeff Beck,
Air.
The many authors whose books I have read or read again at the pool, in my apartment, or on the
road during two fantastic breaks: Jack Kerouac, Ira Levin, Hunter S. Thompson, Arthur
Robinson, John Steinbeck, Arthur Clarke, Max Frisch, Goethe, and Ernest Hemingway. This
project seemed like the marlin in the Old Man and the Sea, me being the old man, obviously. I am
glad to call this degree mine now. I am glad I was able to catch it.
The West Coast in general for its incredible nature, cities, burgers, and insane amount of excellent
breweries. Grab an IPA and understand the API, it works!
Oh, and let’s not forget about RollerCoaster Tycoon 2, the only game I really had time to play.
Leaves are fallin' all around, time I was on my way
Thanks to you, I'm much obliged for such a pleasant stay
but now it's time for me to go, the autumn moon lights my way
Led Zeppelin – Ramble On

vi

vii
Abstract
VGI and Twitter for Event Feedback;
A Case Study for the Arts Council for Long Beach
by
Numa Gremling
Social networking platforms such as Twitter are playing an increasingly important role in
understanding the public’s involvement of social activities. Along with GIS and the
volunteered geographic information movement, these technologies have great potential in
shaping how urban planning can be conducted. This report will provide details about how
an interactive web GIS application was used to connect the public with the Arts Council
of Long Beach (ACLB), a non-profit organization. The web application provides the
ACLB an effective way to evaluate public responses concerning their A LOT Initiative, a
project which aims at reviving neighborhoods by hosting events on vacant urban lots.
These events draw crowds and stimulate interaction among neighbors.


ix
Table of Contents
Chapter 1 – Introduction ................................................................................................... 19
1.1 Client ...................................................................................................................................................... 19
1.2 Problem Statement .......................................................................................................................... 19
1.3 Proposed Solution ............................................................................................................................ 20
1.3.1 Goals and Objectives .................................................................................................................. 20
1.3.2 Scope ................................................................................................................................................. 20
1.3.3 Methods ........................................................................................................................................... 21
1.4 Audience ............................................................................................................................................... 22
1.5 Overview of the Rest of this Report .......................................................................................... 22
Chapter 2 – Background and Literature Review ...................................................... 23
2.1 Vacant Land ......................................................................................................................................... 23
2.1.1 Previously Undeveloped Land ............................................................................................... 23
2.1.2 Previously Developed Land ..................................................................................................... 23
2.1.3 The Issue of Vacant Land in America Cities ...................................................................... 24
2.2 Cultural Projects as Revitalization............................................................................................. 24
2.3 Volunteered GIS ................................................................................................................................. 25
2.3.1 Web 2.0 ............................................................................................................................................ 25
2.3.2 Public Participation GIS and Volunteered Geographic Information ...................... 25
2.4 Summary .............................................................................................................................................. 26
Chapter 3 – Systems Analysis and Design ................................................................... 28
3.1 Problem Statement .......................................................................................................................... 28
3.2 Requirements Analysis ................................................................................................................... 28
3.2.1 Functional Requirements ......................................................................................................... 28

x
3.2.2 Non-Functional Requirements .............................................................................................. 29
3.3 System Design ..................................................................................................................... 30
3.3.1 Geodatabase .................................................................................................................................. 31
3.3.2 Services ............................................................................................................................................ 31
3.3.3 Web Application .......................................................................................................................... 32
3.3.4 Twitter Search Tool .................................................................................................................... 32
3.4 Project Plan ......................................................................................................................................... 32
3.5 Summary .............................................................................................................................................. 33
Chapter 4 – Database Design ....................................................................................................... 35
4.1 Conceptual Data Model .................................................................................................................. 35
4.2 Logical Data Model ........................................................................................................................... 36
4.3 Data Sources ....................................................................................................................................... 38
4.4 Data Collection Methods ................................................................................................................ 39
4.5 Data Loading ....................................................................................................................................... 40
4.6 Summary .............................................................................................................................................. 40
Chapter 5 – Implementation ............................................................................................ 41
5.1 Configuring the Database .............................................................................................................. 41
5.2 Publishing Services .......................................................................................................................... 43
5.3 Developing the Web Application ................................................................................................ 44
5.3.1 Technologies Used ...................................................................................................................... 44
5.3.2 Asynchronous Module Definition ......................................................................................... 45
5.3.3 Application Interface ................................................................................................................. 45
5.4 Developing the Twitter Search Tool ......................................................................................... 47
5.4.1 Technologies Used ...................................................................................................................... 47

xi
5.4.2 Limitations of the Twitter Search API................................................................................. 48
5.4.3 Development of the Tool .......................................................................................................... 48
5.4.4 Tool Interface ................................................................................................................................ 50
5.5 Summary .............................................................................................................................................. 51
Chapter 6 – Use Cases ......................................................................................................... 53
6.1 Web Application ................................................................................................................................ 53
6.1.1 Basic Functionality ...................................................................................................................... 53
6.1.2 Submitting to the Database ..................................................................................................... 56
6.1.3 Querying the Database .............................................................................................................. 58
6.2 Twitter Search Tool ......................................................................................................................... 59
6.3 Summary .............................................................................................................................................. 61
Chapter 7 – Conclusions and Future Work ................................................................. 63
Works Cited .............................................................................................................................. 65
Appendix A. Web Application Code ................................................................................ 67
Appendix B. Twitter Search Tool Code .......................................................................... 87


xiii
Table of Figures
Figure 1-1: Empty Lot ............................................................................................... 19 Figure 1-2: Map of Study Area and A LOT Initiative Lots ....................................... 21
Figure 2-1: Abandoned Store Front ........................................................................... 24 Figure 3-1: System Design......................................................................................... 31 Figure 4-1: Conceptual Model ................................................................................... 35 Figure 4-2: Logical Data Model ................................................................................ 37 Figure 4-3: City of Long Beach GIS Data Catalog.................................................... 39
Figure 4-4: Inconsistencies between Imagery and Parcels ........................................ 39 Figure 5-1: Initial and Final Database ....................................................................... 41 Figure 5-2: Choosing a Primary Key ......................................................................... 42
Figure 5-3: The ArcGIS Rest Services Directory ...................................................... 44 Figure 5-4: Graphical User Interface of Web Application ........................................ 46 Figure 5-5: Flowchart of the Twitter Search Tool ..................................................... 49 Figure 5-6: Extracting Coordinates ............................................................................ 50
Figure 5-7: Graphical User Interface of Twitter Search Tool.................................... 51 Figure 6-1: Elements of the Application .................................................................... 54
Figure 6-2: The Schedule Pane for the Central Lot ................................................... 55 Figure 6-3: Submit Information Dialog ..................................................................... 57 Figure 6-4: Query Options ......................................................................................... 58
Figure 6-5: Query Results for Carlos Ramirez .......................................................... 59 Figure 6-6: Twitter Search Tool ................................................................................ 60
Figure 6-7: Heat Map Result from Searching “Thanksgiving” ................................. 61


xv
List of Tables
Table 3-1: Functional Requirements .......................................................................... 34 Table 3-2: Non-Functional Requirements ................................................................. 35
Table 3-3: Project Timeline ....................................................................................... 39 Table 5-1: Maximum Field Values in Table .............................................................. 51 Table 5-2: Summary of Relationship Class ............................................................... 52 Table 5-3: Technologies Behind the Web Application.............................................. 55
Table 5-4: Technologies Behind the Twitter Search Tool ......................................... 59
Table 6-1: Accuracy of Geolocation Methods ........................................................... 71


xvii
List of Acronyms and Definitions
ACLB Arts Council for Long Beach
API Application Programming Interface
CSS Cascading Style Sheets
GUI Graphical User Interface
HTML HyperText Markup Language
IIS Internet Information Services
NEA National Endowment for the Arts
VGI Volunteered Geographic Information


19
Chapter 1 – Introduction
This project assisted the Arts Council for Long Beach in developing two ways to track
the success of its A LOT Initiative, a project that looks at the issue of vacant urban lots in
the city of Long Beach. This chapter provides a broad overview of the project by
introducing the client and stating the problem, as well as the solution to it. The solution is
broken down into specific categories such as the goals and objectives, the scope, and the
methods needed for completion of the project. Finally, this chapter introduces the
audience this report is addressed to.
1.1 Client
The client for this project was the Arts Council for Long Beach (ACLB), a non-profit
organization based in Long Beach, California. The ACLB’s mission is the support of
artists, as well as the promotion of the arts in local communities. The ACLB is
recognized by numerous departments of the city, and it has strong ties to these
departments, as well as to diverse corporations, foundations, and members of the Long
Beach community. Dr. Marco Schindelmann and Shay Thornton were the main contact
people who contributed to the successful completion of this project. Dr. Schindelmann
helped defining the functionalities and the design of the application and Mrs. Thornton
provided the necessary contacts at the ACLB who helped with the technicalities when
developing the application.
1.2 Problem Statement
The ACLB was engaged in a project, the A LOT Initiative. The A LOT Initiative is an
attempt to find a solution to the broader issue of empty urban lots in the city of Long
Beach. Figure 1-1 shows a typical empty lot.
Figure 1-1: Empty Lot

20
Three specific empty lots in the city were identified to host events (e.g., concert, theater,
comedy) that would attract a wide variety of visitors, ideally stimulating interactions
among the visitors and, in the long term, improving conditions in the neighborhood (e.g.,
reduced crime rates, redevelopment). The project was supported by a $150,000 grant
from the National Endowment for the Arts (NEA), a grant which only nine cities across
the United States had received in 2012. Because of the importance of receiving the grant,
the ACLB needed an effective way to track the success of the A LOT Initiative. It was
crucial that the effects of the A LOT Initiative could be evaluated so the ACLB could
draw conclusions for future projects.
1.3 Proposed Solution
To track the effects of the A LOT Initiative, this project proposed two tools. First, an
interactive web GIS application to provide the public an opportunity to express its
opinion about specific events and submit or retrieve information from a variety of
sources, such as YouTube, the press, or blogs. Second, a tool that queries Twitter
databases based upon specific keywords and then maps out the resulting tweets. The
number of tweets regarding a specific event was used as an indication of the event’s
impact.
1.3.1 Goals and Objectives
The main goal of this project was to find a way for the ACLB to apply GIS to evaluate
the A LOT Initiative. To achieve this goal, an interactive web application that lets users
submit and retrieve information about the A LOT Initiative was proposed. More
specifically, users could post feedback about the A LOT Initiative so the ACLB would
have information that can be analyzed and used in further decision making. In addition to
the public application, a tool that searches Twitter databases was proposed. The tool
should detect what visitors of an event were saying regarding the event.
1.3.2 Scope
This project had a three-tiered scope: geographic, temporal, and technological.
Geographically, this project was confined to the city of Long Beach, California (Figure
1.1). Although the three parcels in the ACLB’s A LOT Initiative take up a minimal
geographic area, their implications can potentially be felt across the city, so the entire city
was considered in the analysis. The temporal scope refers to the time span that the web
application will be used. The A LOT Initiative is a two-year project which started in
September 2013, requiring that the developed application be running until September
2015. Technologically, the main deliverable of this project was restricted to the online
environment. Users will, in most cases, only come in contact with the application and its
results via the internet. Although the datasets are stored in a database hosted on a server,
most users will not ever see that. The second part of the technological scope was that
users become an interactive part of the project, meaning that users can input information
regarding ACLB-supported events. The technological scope of the second deliverable
was desktop-based. The tool can only be run by the ACLB and its results are not meant to
be shared in the online application.

21
Figure 1-2: Map of Study Area and A LOT Initiative Lots
1.3.3 Methods
The application provides ways for users to submit information about A LOT Initiative
events. Information that can be submitted are personal reviews and ratings, links to blogs,
links to newspaper articles, and links to YouTube videos. These pieces of information
were written to an esri multiuser geodatabase, with each piece pertaining to a specific
parcel and performance. After the information was written to the database, users were
able to retrieve that information using predefined queries. The second part of the analysis
uses Twitter to geolocate tweets specific to an A LOT Initiative event. Searching
keywords and specifying a temporal scale detects relevant tweets. If available, the
locations of these tweets can be mapped and used in a kernel density analysis. This
provides a way to quickly visualize patterns and shows which areas of the city are most
influenced by performances. JavaScript was used for all of the coding behind the web
application and Python was used to develop the Twitter tool.

22
1.4 Audience
This report was written mainly to help the ACLB understand the technology behind the
application, as well as to explore research areas that might be helpful in future projects.
However, anyone who uses the website might potentially be interested in reading this
document. Therefore this document is addressed to city departments, city officials from
other cities, users of the application, or anyone who is curious if the A LOT Initiative has
had an effect on the empty lot issue. The report is also addressed to software and web
developers who might be interested in creating similar applications.
1.5 Overview of the Rest of this Report
The rest of this report provides the reader with additional information about the project.
Chapter Two presents the literature review that lead to the decisions that were undertaken
to build the application, Chapter Three elaborates on the design of the system, and
Chapter Four explains the design of the database. Chapter Five shows how the elements
from previous chapters have been used to build the actual applications. Chapter Six lays
out a scenario, showing how a typical user would use the applications. The last chapter
concludes this project and suggests what could have been done differently or what can be
added to it in the future.

23
Chapter 2 – Background and Literature Review
This section presents the academic research that was important in understanding the issue
of this project. This chapter is divided into three parts, each part belonging to a specific
topic. Section 2.1 defines empty lots and presents the issue of empty lots in American
cities, Section 2.2 shows how the arts can be used in urban revitalization, and Section 2.3
elaborates on the technologies and the movements whose understanding was essential
when building the application.
2.1 Vacant Land
The main factor driving the A LOT Initiative is the empty lot issue, which has affected
many cities across the United States. The following subsections will differentiate the two
main categories of empty lots – previously undeveloped and previously developed lots –
and then elaborate on the issue of vacant land in American cities.
2.1.1 Previously Undeveloped Land
Northam (1971) distinguished five types of vacant urban land: remnant parcels, parcels
held for speculation, tracts, corporate reserves, and institutional reserves. This project
focused on remnant parcels and parcels held for speculation. Remnant parcels are
generally defined to be between a few hundred to a few thousand square feet in size, and
characterized by an often irregular shape. Because of their inconvenient shape as well as
their limited size, such parcels are often not favored for development and remain empty
over time. Parcels held for speculation are parcels that will not be developed until the
owner sees a clear benefit in doing so (e.g., the surroundings become popular). Northam
emphasized that vacant parcels were parcels that have never been developed.
2.1.2 Previously Developed Land
One type of vacant urban land, greyfields, is often cited in urban planning literature.
Greyfields, as coined in 1998 by the Congress for the New Urbanism, a non-profit
organization, “can be used to describe any redevelopment project that is not significantly
contaminated” (McKay, 2007, p.2). Although the term is usually used to describe larger
areas, such as parcels occupied by shopping malls, it is also used to describe smaller
parcels of land, such as a parcel that was occupied by a neighborhood store which has
closed.
The broken windows theory, as laid out by Kelling and Wilson (1982), emphasizes
that certain factors – such as the condition of a building – greatly influence citizen
behavior and crime rates. Figure 2-2 is an example of an abandoned building that has not
been taken care of and is likely to make the passerby feel uneasy. In the long term, such
buildings could increase crime rates, especially if the number of similar buildings
multiplies in a neighborhood. The A LOT Initiative is an attempt to have neighborhoods
come together. Over time this interaction can stimulate people to invest into their
neighborhoods (e.g., repainting facades and planting flowers in front yards) and change
their neighborhood’s appearance.

24
Figure 2-1: Abandoned Store Front
2.1.3 The Issue of Vacant Land in America Cities
Pagano and Bowman (2000) found that on average 15% of land in American cities was
considered vacant. These findings, however, should be considered with care as they only
surveyed 70 cities. Kunstler (2008) cited the American system of property taxes as the
main reason why there was an abundance of vacant lots in most American cities.
Buildings are taxed more heavily than the land that they are built upon, meaning that a
piece of land does not become expensive until a building has been built on it. This leads
to the fact that land is often held in speculation. Economically it is cheaper to build on the
outskirts of a city rather than to develop existing land in the center of a city, leading to
the decay of city centers while at the same time increasing urban sprawl. Kunstler
suggested alternative ways that could potentially reverse the issue. One of them was the
option that land should be taxed much heavier. Others argue that developing infill can
confront many of a city’s problems, including neighborhood revitalization (Steinacker,
2003).
2.2 Cultural Projects as Revitalization
Through different approaches artists were able to turn dilapidated areas into flourishing
places that attracted investors (Stanziola, 1999). Strom (2002) argues that cultural
projects had become a popular way of revitalizing urban areas. Ideally, cultural projects
benefit the city by creating jobs and revenue, and by putting a city or a neighborhood
back on the map. One major benefit of cultural developments is that they are often driven
by non-profit organizations and therefore draw little or no opposition, as opposed to large
scale projects undertaken by the city and relying on the taxpayer’s money. Small
organizations were viewed as more efficient and less expensive than the public sector and

25
they had progressively gained influence in urban decision-making (Elwood & Leitner,
2003). Strom also noted that measuring the success of revitalization projects usually
became complicated as it was hard to pin down exact variables. Most notably,
determining what terms like “impact” and “community” mean was commonly cited as the
root of the problem (Guetzkow, 2002).
Markusen and Gadwa (2010) concluded that the use of arts in planning was often
hindered by unclear goals, little input from the public, or the omission of project
evaluation. Furthermore, their study suggested that higher equity could be obtained by
using certain methods, such as surveys, to determine which piece of art or performance
went into which neighborhood. To avoid these two common issues, the ACLB suggested
an interactive web application to track the success of their A LOT Initiative. The web
application would allow the ACLB to see if the A LOT Initiative is a success among the
public.
2.3 Volunteered GIS
The reason the application could be built and how it accepts user input goes back to two
concepts: Web 2.0 and volunteered geographic information. Both phenomena have led to
the success of many well-known websites.
2.3.1 Web 2.0
As pointed out by Fu and Sun (2011), Web 2.0 enabled users to interact with a website in
a way that they can submit their own content, which is different from Web 1.0 that
provided exclusively read-only content. The term Web 2.0 was coined by Darcy DiNucci
in 1999, but it has since become associated with the O’Reilly Media Web 2.0
Conference, which took place in San Francisco in October 2004 (O'Reilly, 2007). Many
influential websites are a result of Web 2.0. For instance, reviews on Amazon, articles on
Wikipedia, or products on eBay are all provided by people who were not initially
engaged in designing the respective websites. Web 2.0 is also the underlying process that
drives the web application developed for the A LOT Initiative. The application is entirely
dependent on users who collect data and submit data to the website.
2.3.2 Public Participation GIS and Volunteered Geographic Information
Sieber (2006) pointed out that technological inventions and movements could greatly
engage the public in decision-making. GIS, like previous inventions such as rural
electrification and telephony, has played an important role in connecting the general
citizen to those who decide the future of communities. Although GIS is sometimes
considered another tool for the powerful to gain more control, and some would go as far
as calling it elitist and antidemocratic, it cannot be denied that GIS has opened many
doors to the public (Peng, 2001). Carver and others (2001) pointed out two important
aspects of web-based participation: the fact that meetings do not have to be tied to a strict
geographic location, and the fact that meetings can be joined at any time during the day.
Whereas a typical town hall meeting would take place at a specific location and a specific
time, most likely disabling a portion of the public to attend, the internet eliminates these
concerns. Peng (2001) added that traditional town hall meetings were often dominated by

26
individuals who had extreme views and strive towards getting their views accepted and
implemented. All in all, web-based participation has become an important player in
modern urban planning and decision-making.
With the inclusion of GIS in these processes, the term Public Participation GIS, most
often referred to as PPGIS, was coined in 1996 at various meetings of the National Center
for Geographic Information and Analysis (Sieber, 2006). Whereas the beginning years of
PPGIS focused on developing software, hardware, and training manuals, and were aimed
towards people with advanced technical skills, the field has moved towards simpler
solutions requiring the understanding of only basic concepts of geographic information
sciences (Peng, 2001). Goodchild (2007) used the term volunteered geographic
information (VGI) to describe this movement that lets people with little to no
qualifications in mapping or geographic information sciences collect and distribute data.
Tasks that for centuries had been reserved to official agencies can now be accomplished
by average citizens. Goodchild pointed out the usefulness of VGI as it is an effective way
to create data for places where it is scarce. For instance, he described the example of
cities that had been lacking digital maps until the rise of VGI. Specific websites or
projects, such as WikiMapia and OpenStreetMap, are entirely dependent on VGI. Their
datasets are frequented by millions of users each day. Although the quality can vary,
since VGI is majorly driven by people with no formal background, it can be said that
most of the datasets are appropriate and qualitatively sufficient if high precision or
accuracy is not required. This project relies on VGI because data will not be collected by
the ACLB; all of the data is provided by public who finds an interest in feeding the
application with useful information.
2.4 Summary
This chapter showed that most American cities have vacant lot issues and that there is no
clear consensus about what works to revitalize urban spaces. One school of thought
suggests that art could be the solution to many urban problems, which is the underlying
assumption of the ACLB’s A LOT Initiative. The web application that supports the
ACLB in tracking the success of its project is dependent on user-created data, which is
made possible by the concepts of Web 2.0 and VGI.

27

28
Chapter 3 – Systems Analysis and Design
This chapter introduces the major components of the final products. Section 3.1 provides
a brief overview of the problem, followed by the requirements analysis which describes
the main components of the online application and the Twitter Search tool, as well as the
software needed for developing these tools. Section 3.3 presents the system’s design, an
explanation of the physical components of the application, and the tool. Finally, Section
3.4 reviews the project plan, a timeline that was used to complete the different parts of
this project on time.
3.1 Problem Statement
The ACLB is conducting a project called the A LOT Initiative, which is attempting to
look at the issue of vacant urban lots. The ACLB organized events in three empty lots
throughout Long Beach, but lacked a way to evaluate the effects of these events. It is
essential that the effects of the A LOT Initiative are evaluated so that the ACLB can learn
how to improve future events.
3.2 Requirements Analysis
While doing research and defining the method, certain requirements were considered
necessary for the successful completion of this project. There are two kinds of
requirements: functional and non-functional. The former are the essential components
and functions of the deliverables, and the latter are the technologies necessary for using
the application and the tool.
3.2.1 Functional Requirements
Eight functional requirements were defined in this project. All of these requirements,
listed in Table 3-1, describe the necessary components of the final application and tool.

29
Table 3-1: Functional Requirements
Web Application
Requirement Description
Basemap selection Lets users change basemaps (imagery, street network)
Geocoding Lets users enter an address and finds it on the map
User Locator Zooms users to their position
Zoom to Parcel Centers map around a parcel
Schedule A calendar which displays performances per parcel
Query Parcel Information Shows information of each parcel
User Feedback
Collection
Lets users submit information (YouTube links, links
to blogs, links to press reviews, personal reviews, and
ratings) to tables in the database
Twitter Search Tool
Requirement Description
Input Fields Lets the user specify parameters to run a search
The interactive web map is the main component that a user sees and uses to interact
with the data. The map includes standard functionalities, such as panning and zooming.
On the map a user can choose from two different esri basemaps: Topo and Imagery. It
also includes geocoding functionality; when a user types in an address, it finds the
location and zooms the map to that location. To help users position themselves on the
map, locate functionality was developed. It will position the map according to the
location of a user’s device. The Zoom to Parcel widget centers the map and zooms to the
desired parcel. Schedules are used to inform users about the A LOT Initiative events
taking place. The schedules are directly connected to a server, so live updates can be
undertaken. When a parcel in the calendar is clicked, the map centers around that parcel.
Three interactive parcels, hosted as a feature service, provide an interface for users to
interact with the database. Each parcel is related to a table containing information about
events. A user has the option to submit or retrieve information for parcels and events.
3.2.2 Non-Functional Requirements
Non-functional requirements describe technological elements that are necessary to
guarantee the optimal development and functioning of the final application. Five non-
functional requirements were defined for this project as listed in Table 3-2.

30
Table 3-2: Non-Functional Requirements
Requirement Description
ArcSDE geodatabase Geodatabase that allows multiple users and editing in the
online environment
ArcGIS 10.1 The software used to prepare data before publishing
ArcGIS for Server Allows the data to be published
IIS The Microsoft web server which hosts the web services
Windows 7 or later A Windows operating system is required to run esri products
All of the data that were used in this project were stored in an esri ArcSDE
geodatabase with a multiuser configuration. ArcSDE allows the geodatabase to be set up
in a way that multiple users can write to it at the same time. This was an essential factor
in this project, as it is likely that multiple users will enter data at the same time. To
connect the datasets to the online application and to publish them to a server, ArcGIS for
Server was necessary. Datasets were prepared in ArcMap and ArcCatalog, and then were
published as feature services, a type of web service that allows editing. To install and run
these esri components, a current Windows operating system was needed. The published
datasets were hosted by Microsoft’s web server, IIS (Internet Information Services).
3.3 System Design
Three major components – a database, a web server, and the user – had to be considered
to develop the web application that was delivered to the client (Figure 3-1). These three
components are linked to each other, and the correct functioning of the final product
depends on their interaction. The web application, hosted on a server, was developed with
the ArcGIS application programming interface (API) for JavaScript, using different
languages and libraries, including HTML, CSS, JavaScript, Dojo Toolkit, and jQuery.
The basemaps in the project were from ArcGIS Online, and all of the operational layers
were stored in an esri ArcSDE geodatabase with a multi-user configuration. The
information written to the operational layers was also stored in the same geodatabase. All
of the operational layers from the geodatabase were published as a feature service via
ArcGIS for Server and can be accessed through a REST service endpoint. Using the
application, a user automatically connects to the server and the database.

31
Figure 3-1: System Design
3.3.1 Geodatabase
All of the data consumed by the application reside in a database. Esri offers three types of
geodatabases: file, personal, and ArcSDE.
ArcSDE offers crucial features that need to be considered when communicating with
an online application. Most importantly, it is the only type of database that allows editing
of features or tables when connected to a web application. The two other types of
databases can be used to publish data but will not allow users to change the data in any
way. The second important capability is the multiuser configuration. ArcSDE allows
multiple users to write to and retrieve from a database. This feature is essential when
connecting to a web application because it is likely that multiple users will write to the
same table at the same time. Instead of creating schema locks (locking tables because two
users are trying to edit them at the same time) and potentially crashing the application,
ArcSDE handles such scenarios efficiently.
3.3.2 Services
The datasets stored in the ArcSDE geodatabase were published to a web server. When
publishing data through ArcGIS, different kinds of services can be created. In this
project, two kinds of services were created. Any published document automatically adds
a map service to a REST Services Directory; depending on which options are checked
when publishing, more services can be added to the directory. A map service can be used
in various desktop and web applications but its functionality is limited. Since the
application was intended to allow editing, it was important that the services were also
32
published as a feature service, which is the only type of service that allows editing over
the Internet.
3.3.3 Web Application
The web application was designed to be used primarily in Firefox. Although its look and
functionality are similar to most common browsers, it will produce optimal results in
Firefox. The ArcGIS API for JavaScript was chosen to develop the application because of
its popularity and cross-platform characteristics. Unlike other APIs, such as those for
Silverlight or Flex, it does not require any client-side plugins. Since the application
would potentially reach a great number of people, it was recommended that it would be
best if it ran without installing any plugins. Because the application uses several different
widgets and functions, no template was readily available. It was decided to build the
application from scratch, using syntax and templates from the API reference and
documentation pages as guidance.
3.3.4 Twitter Search Tool
The Twitter Search tool was developed using Python and the Twitter Search API. Two
libraries – ArcPy and TwitterSearch – were used. Esri’s ArcPy provides ArcGIS
geoprocessing functionality to be used with Python, and TwitterSearch is an open-source
library that enables the use of the Twitter Search API in Python.
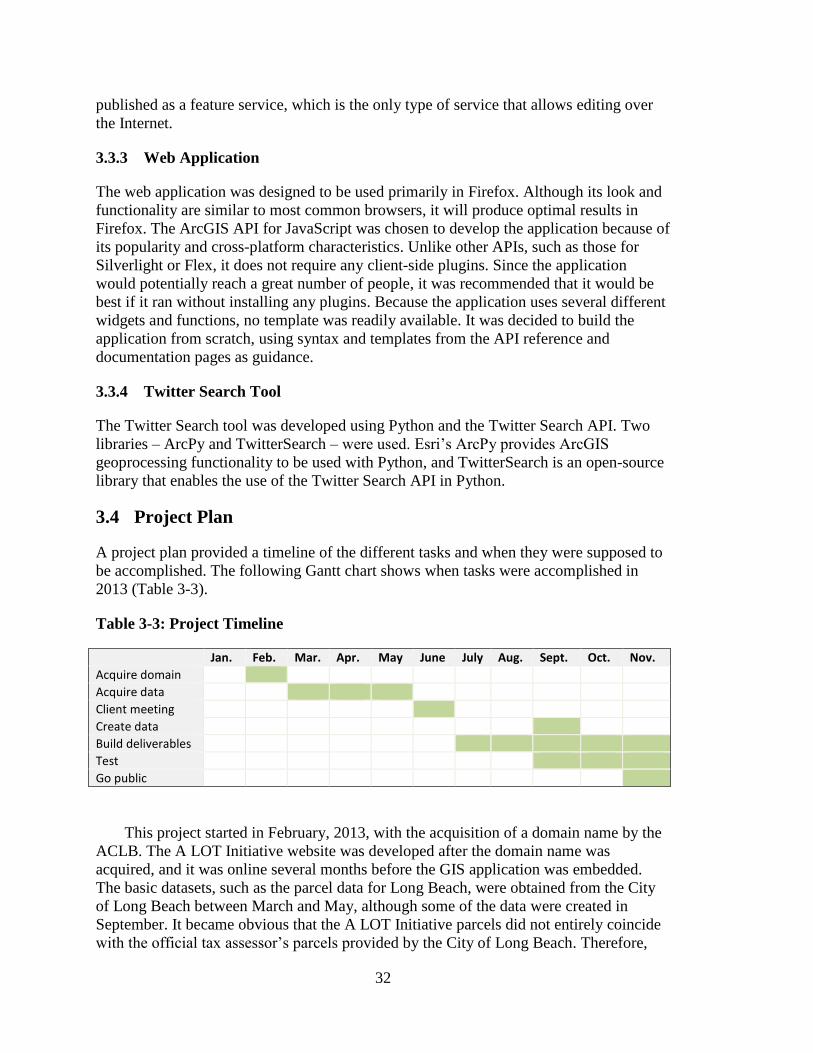
3.4 Project Plan
A project plan provided a timeline of the different tasks and when they were supposed to
be accomplished. The following Gantt chart shows when tasks were accomplished in
2013 (Table 3-3).
Table 3-3: Project Timeline
Jan. Feb. Mar. Apr. May June July Aug. Sept. Oct. Nov.
Acquire domain
Acquire data
Client meeting
Create data
Build deliverables
Test
Go public
This project started in February, 2013, with the acquisition of a domain name by the
ACLB. The A LOT Initiative website was developed after the domain name was
acquired, and it was online several months before the GIS application was embedded.
The basic datasets, such as the parcel data for Long Beach, were obtained from the City
of Long Beach between March and May, although some of the data were created in
September. It became obvious that the A LOT Initiative parcels did not entirely coincide
with the official tax assessor’s parcels provided by the City of Long Beach. Therefore,

33
the three parcels were digitized, making sure that the boundaries matched those
determined by the ACLB. Crucial to the development of the project was a client meeting
at the ACLB headquarters on June 13, 2013, where everyone involved in the A LOT
Initiative gathered and discussed ideas to design the web application. The web
application and the Twitter Search tool were built in September and October, and testing
occurred during the development, as well as in November.
3.5 Summary
This chapter described the steps that were undertaken to define what was necessary to
design the final products. A requirements analysis – defining the functional and non-
functional steps needed to build the application – was essential to the successful
completion of this project. The requirements are the basis of the system design, which
defines how the major components fit together. The following chapter elaborates on the
database behind the deliverables, followed by a chapter which lays out in detail how the
deliverables were built.


35
Chapter 4 – Database Design
This chapter presents the database that was used in this project. The database was
designed to hold geographic and tabular files from the A LOT Initiative, and it was
connected to both the web application and the Twitter Search tool.
Section 4.1 portrays the conceptual model. The logical model, a demonstration of
each feature, field, and data type in the database, is laid out in Section 4.2. Section 4.3
discusses the data sources, and Section 4.4 explains how datasets were altered to be used
in the final application.
4.1 Conceptual Data Model
The conceptual model is meant to give a broad overview of how the key elements of a
project are connected (Figure 4-1). It does not provide explicit detail about files in a
database, and it is designed to guide the thinking that leads to database creation.
Figure 4-1: Conceptual Model
Three main entities were considered in this project: lots, events, and people. A lot is
a place where an A LOT Initiative event takes place. Each lot had a known geographic
location, and therefore lots were the only inherently spatial entities in this project. Event
is an overarching term to describe three categories: performance, visual, and engagement.
Performances were concerts or dances, visual was used to describe the displaying of art,
and engagement indicated community programs. Events were temporal: they happened
at a specific point in time. An event was not spatial by itself, but because it took place in

36
a lot, it could be tied to a geographic location. The person was the component of the
model that was used to describe someone who went to or wrote about events. A person
was non-spatial in this project as its location was unknown or irrelevant. The purpose of
this project was to evaluate the A LOT Initiative, and it was decided to accomplish that
task by collecting feedback about events. In this model, that feedback is listed as
comments. Each comment was posted or collected at a specific time, but depending on
the source it could be spatial or non-spatial. For the purpose of this project a comment
was what connected a person to an event. It has to be noted that this project did not keep
track of people attending events, nor did it require event attendance: this project was
meant to collect information about events, independent of whether the source of the
information went to an event.
4.2 Logical Data Model
The logical data model presents the files that were stored in the database to implement
the conceptual model. The logical model in Figure 4-2 was used to create the database in
this project. It shows the files that were both used and generated.

37
Figure 4-2: Logical Data Model

38
This project used parcel boundaries only for reference, and all of the relevant
information the user should see was stored in a table. Because of expected complications,
the attribute tables were normalized to an extent that they did not have any information
about A LOT Initiative events. Storing all of the information submitted by users in the
same feature class would have created unreasonably long fields in the attribute table,
slowing down retrieval of information and complicating the display of it. Considering
that fields have to be defined with a specific length, it would also have led to the fact that
fields would have run out of space at some point, making the application useless.
Therefore it was decided to store all the user input in a table which would be related to
the parcels, using a relationship class. The exact steps accomplished to create a
relationship class are mentioned in Section 5.1. To capture people’s comments about
events, two approaches were used. The first approach allowed users to submit
information to a table, and the second approach used Twitter to detect what people were
saying about events.
This logical model distinguishes between three types of files: outside, temporary, and
permanent. Outside files were files that were used in the web application, but never
stored in the ACLB’s database. Temporary files were created and used to derive final
outputs. These files were automatically deleted and they were meant to be never seen by
a user. Permanent files were either stored in the database from the beginning, or created
when running the Twitter Search tool. These files were essential and they were not meant
to be deleted at any point.
The bottom part of the logical model shows detail about the most important files that
were essential when translating the conceptual model into reality. The lots were
represented using parcel polygons. The events were stored in tables that were displayed
as schedules. The comments that link people to events were stored in two separate files.
First, a table holding user-entered information about events. Second, a table holding
tweets was created each time the ACLB ran the Twitter Search tool. Running the tool
also added a new record containing the summary of each search (e.g., number of returned
tweets) to the existing Tweet Summary table.
4.3 Data Sources
Data for this project came from two sources. First, a list of A LOT Initiative events was
provided by the ACLB in Excel format. Second, all geographic datasets came from the
City of Long Beach. The City provided specific datasets for download on its website
(Figure 4-3). Assessor parcels were downloaded for this project. Any other datasets that
are consumed by the API, but not stored in the database, such as a geocoding service or
basemaps, were provided by esri.

39
Figure 4-3: City of Long Beach GIS Data Catalog
4.4 Data Collection Methods
The assessor parcel datasets that are officially available from the City of Long Beach, and
created for tax assessment purposes, were not optimally suited for this project. Although
the parcels might have been accurate, they did not line up with the imagery that was used
in this project. In the web application, the assessor parcels would potentially look
confusing or inaccurate to the user when viewed with the basemaps. Figure 4-4 shows
how the assessor parcel boundaries from the North Lot do not entirely coincide with the
boundaries on the aerial imagery. The red rectangle indicates a gap between the assessor
parcel and the adjacent sidewalk. The other two parcels had similar inconsistencies.
Figure 4-4: Inconsistencies between Imagery and Parcels

40
To avoid these issues, and because the underlying aerial imagery cannot be moved or
changed, the final boundaries were digitized on screen from the ArcGIS Online Imagery
basemap, using the assessor parcels for reference only. The basemap was also used in the
final application.
4.5 Data Loading
All of the datasets that were created or generated in this project were stored in an
ArcSDE geodatabase. In addition to these files, the database also held the relationship
class that linked the geographic and tabular datasets. More detail about these steps is
provided in Chapter 5.
4.6 Summary
This chapter described the database that was used in this project as well as the logic that
went into developing the database. Both the conceptual and the logical data models were
used to specify the initial and final schema of the database. The chapter also explained
how datasets from different sources were altered to fit the final application.

41
Chapter 5 – Implementation
This chapter explains how the final product was built. Section 5.1 describes the database
and how it was configured. Section 5.2 discusses publishing the datasets to the online
environment, and Section 5.3 talks about how the final application was developed.
5.1 Configuring the Database
A database is one of the main parts of a GIS application because it holds all of the data
that will be consumed by the application. In this project, an esri geodatabase with SDE
technology was used.
Because the final application is required to allow user editing, a special type of
database that enables editing capabilities in the online environment had to be used. Of all
the different types of geodatabases offered by esri, only one fits these requirements:
ArcSDE. ArcSDE is a multiuser database, which allows the editing of records by
multiple users at the same time. Multiuser functionality is essential when building a web
application that allows editing, because it is common that more than one user will access
and attempt to alter the data at the same time. To keep the ArcSDE database clean, the
original datasets were prepared in a file geodatabase. It helped testing options and at the
same time avoided introducing errors into the final database. Once the datasets were
ready, they were exported to the ArcSDE database (Figure 5-1).
Figure 5-1: Initial and Final Database
All three parcels from this project were stored in the same feature class. The attribute
table of the feature class was kept simple, with only the two required fields (FID and
Geometry) and one additional field: Address. The Address field was added so that a user
would be able to see the address when interacting with the web application. Field lengths
in the feature class attribute table and other tables were allocated based on the expected
maximum values a user would submit, as shown in Table 5-1. For instance, the Location
field was kept to a length of eight characters because the longest parcel name in this
project, Downtown, has eight characters. All fields for web links were kept to a
maximum length of 150 characters, as that was considered a reasonable length for a web
URL (Uniform Resource Locator). Long URL links that would slow down the web
application are thereby automatically rejected. The Review field was kept to 250
characters because that gives a user enough space to say something substantial, yet brief.

42
Table 5-1: Maximum Field Values in Table
Field Longest expected value Characters
Lot Downtown 8
Event Long Beach Playhouse 20
Date September 2+ 12
links 150
Review 250
Because adding all of the user input to existing fields in the parcel feature class is
inefficient, this project used relationship classes to solve the issue. A relationship class is
a way to link geographic and tabular datasets and is determined aSt the geodatabase level.
It is especially useful in relationships that have a cardinality other than one-to-one. An
example of such a situation would be a state that has many counties. Instead of storing
each county name in one field in the state’s attribute table, it is much more efficient to
store county names in tabular format and then link that table to the state feature. In this
project one parcel hosts many events but each event only happens on one parcel, which
establishes a one-to-many relationship. Using a relationship class is the ideal way to link
the tabular information about events to the parcel feature. To set up a relationship class, it
is essential to define a primary key in both the feature class and the table. A primary key
is a value that uniquely identifies a specific record in a database. In this case the location
was chosen as the primary key because this field is unique and exists in both datasets
(Figure 5-2). Establishing a relationship class, therefore, makes it possible to click a
parcel with a location and fetch all records from tables that are associated with that
parcel.
Figure 5-2: Choosing a Primary Key
Besides defining the primary key, it is also vital to specify the origin and destination
datasets, the type of relationship, and the cardinality. Table 5-2 summarizes which
parameters were chosen to create the relationship between the parcels and the respective
tables.

43
Table 5-2: Summary of Relationship Class
Origin: Parcel feature class
The feature that is used to trigger actions
Destination: Table
The table that will be retrieved or changed
Type of relationship: Simple
They are not dependent. If either one is deleted the
other one will not cease to exist
Primary Key: The parcel location
The field that is used to link up both datasets
Cardinality: 1:M
One-to-many: one parcel can link to many records in
the attribute table, but each record is only linked to
one parcel
5.2 Publishing Services
Consuming datasets that reside in a geodatabase first requires publishing these datasets as
web services. ArcGIS for Server provides publishing functionality. To publish services,
the datasets first had to be brought into ArcMap 10.1. For optimal results and efficient
publishing, certain considerations had to be taken into account. It was very important that
all basemaps were turned off by the time of publishing and transparency had to be
removed from all layers. Once the files had been added and formatted and the map
document was saved, it was ready for publishing. Esri offers two sharing methods:
sharing as a Map Package, and sharing as a Service. In this case the datasets were shared
as a service. When published, descriptions of services can be accessed from the REST
Services Directory (Figure 5-3).

44
Figure: 5-3: The ArcGIS Rest Services Directory
As laid out in Section 3.3.2, the data had to be shared as a feature service because the
datasets were used for editing. It was essential that the Feature Access option was
checked before publishing the service. This option enables editing to the respective
dataset that is consumed by a web application. Checking the option in the Service Editor
unlocks a new interface which provides more control over which editing capabilities the
service can be engaged in. Because ArcGIS for Server creates a map service by default,
two services can be found in the REST Services Directory although only the feature
service was used in the application. The published datasets were also registered as
versioned, which enables them to be changed client-side after they have been published.
5.3 Developing the Web Application
The core of this project was the development of a user-friendly and appealing web
application that can be used by anyone who is interested in the ACLB’s A LOT Initiative.
The following subsections discuss which languages and toolkits were used for coding,
which style of coding was used, and what functionality was added to the application.
5.3.1 Technologies Used
Building the application relied on an API, coding languages, and two open-source
libraries to facilitate coding. All of the GIS functionality was provided by the ArcGIS
API for JavaScript by esri. HyperText Markup Language (HTML) was used as the

45
markup language when building the website. Styling and certain effects were
accomplished with Cascading Style Sheets (CSS), and interactivity was provided by
JavaScript. The ArcGIS API provides the Dojo Toolkit, an open-source library which
simplifies common JavaScript tasks. This project used the Dojo Toolkit to define the very
basic division of the main page into three parts, also known as content panes. The table
that displays query results, and the interactive Accordion Pane on the left side of the
webpage, were also built using Dojo. A second open-source library, jQuery, was
imported from Google. jQuery was used to simplify mouse events, as well as the
movement of certain elements on the page, such as the parcel selection dropdown menu.
Table 5-3 summarizes the languages, the API and the libraries, as well as their respective
versions.
Table 5-3: Technologies Behind the Web Application
Languages
Markup: HTML
Styling: CSS
Programming: JavaScript
Application Programming Interface
ArcGIS API for JavaScript 3.7
Open-Source Libraries
Dojo Toolkit 1.9
jQuery 1.10.2
5.3.2 Asynchronous Module Definition
The entire application was built using Asynchronous Module Definition, also known as
AMD. AMD is a modern way of coding in JavaScript that loads modules asynchronously
by default. That means multiple modules can be loaded at the same time, which was not
the case in previous ways of coding, which were characterized by longer loading times.
Esri recently switched from Legacy mode to AMD, most notably because Dojo, one of
the major libraries the ArcGIS for JavaScript API relies on, will stop supporting Legacy
code with its next version. The release of the next version is scheduled for early 2014.
Using AMD in this project was useful because the version of Dojo could be replaced in
2014 by not requiring further translations. AMD first loads a module and then assigns it
to an element in a callback function. Each element can then be used in the script.
5.3.3 Application Interface
Fu and others (2011, p. 45) defined user experience as the “level of satisfaction a person
gets from using a product or a service” and stated that web applications should be “fast,
easy, and fun to use.” That approach guided the design and interface of this web
application Figure 5-4 shows a sketch of the GUI (graphical user interface) which was
used to guide the development of the web application.

46
Figure 5-4: Graphical User Interface of Web Application
Most users have limited technological background and their attention needs to be
caught immediately via an easy-to-use interface. Therefore, the user interface was
designed so that operations are easily recognizable by anyone who has used a major web
GIS before, such as Google Maps.
The map was centered on Long Beach. The coordinates were obtained by calculating
the centroid of the city boundary in ArcGIS 10.1. The Topo basemap from esri was
chosen as the default basemap for this project. Although the map’s name indicates a
scientific purpose, it is a hybrid of a topographic map and a street map; streets show up
when zoomed to large scales. This map was chosen because it looks appealing yet
provides all the necessary details a user needs to see. A regular street map would appear
too busy for this application’s purpose. Because many users are used to seeing satellite
imagery as well, a Change Basemap button was added which lets the user toggle between
satellite imagery and the Topo map.
Users can search addresses within Long Beach using the Geolocator widget. To
simplify the use of the tool, it was programmed to automatically add ‘Long Beach, CA’
to any user input and display a list of closest matching addresses. Although different
geocoders can be used, the standard esri World Geocoder was chosen because it is
compatible with esri’s ArcGIS products.
The Zoom button lets the user zoom in or out of an area, although that can also be
done using the mouse wheel or the touchscreen of a smartphone. The Locator button asks

47
users if they want to share their locations; if yes, the map will zoom to that location. This
function is targeted toward users who will use the application on a mobile device and
who might be attempting to find their way to a specific parcel that may not have an
address in any address database since the lot is undeveloped. The Zoom to Parcel
dropdown menu lets a user zoom to one of the three parcels hosting events. The choice of
parcels only shows up when hovering the cursor over the label.
The schedule of the A LOT Initiative was added to the page so a user does not
have to keep switching between the application and the A LOT Initiative website.
Expanding the schedule of a specific parcel displays a list of events and centers the map
around that parcel.
The table that was related to the parcels using a relationship class can be
displayed when using the Query Database tab in the accordion pane. The pane offers
different ways to query the table. A user can either chose one of the three parcels using a
radio button, or can chose a performance using a dropdown menu. The returned
information is displayed in a table on the bottom of the page. To enter new information
about events, a user can refer to the Submit Information tab in the accordion pane. The
tab guides a user through the input process by offering dropdown menus and input boxes.
5.4 Developing the Twitter Search Tool
The Twitter Search tool was developed to be used by the client only. Its purpose is to
search Twitter databases based upon specific parameters. The returned results are written
to a database in tabular and in geographic forms. The table holds the contents of all the
tweets that were returned by a search, and the geographic files show available tweets’
locations and a heat map.
5.4.1 Technologies Used
Python was used to develop the Twitter Search Tool. Among the different languages that
can interact with the Twitter API, Python was chosen because it can be integrated into the
ArcGIS environment. Python can not only be used to search Twitter databases but it can
also be used to write to a geodatabase and create geographic features. ArcPy from esri
was used to programmatically incorporate ArcGIS functionality in Python.
TwitterSearch, an open-source Python library provided by the Technische Universität
München, was used to access the Twitter Search API. The library simplifies tasks to
connect to Twitter. Table 5-4 summarizes the technologies behind the tool.

48
Table 5-4: Technologies Behind the Twitter Search Tool
Languages
Python
Application Programming Interface
Twitter Search API v 1.1
Libraries
ArcPy
TwitterSearch
5.4.2 Limitations of the Twitter Search API
Twitter allows programmers to retrieve information using the API, but it has to be
pointed out that it is not possible to search the entirety of Twitter using the API. To avoid
overburdening servers Twitter has restricted what users can query, and therefore
programmatically retrieving information from Twitter differs in many ways from a
manual search.
Connecting to Twitter requires authentication. Tokens and keys to connect to Twitter
can be obtained from the Twitter Developers site by creating a new application. When an
application is run these tokens and keys have to approved in order to connect to the
Twitter database. This allows Twitter to keep track of potential abuse.
Rate limiting refers to how often one can connect to Twitter servers. The Twitter
Search API has 15-minute rate limiting windows, meaning that one can only connect
every 15 minutes. This helps Twitter reduce traffic and avoid servers crashing.
Twitter lets programmers retrieve 100 pages of tweets, each one containing about
180 to 200 tweets. This means that the maximum number of tweets that can be returned
by a search fluctuates between 18,000 and 20,000. It is also important to know that only
indexed tweets can be returned by the API. Twitter reserves the right to decide which
tweets are indexed. This means that a manual search on Twitter might return results that
cannot be returned by the API.
Finally, the time frame of the returned information is limited. Indexed tweets are
generally made available for the API the day after they have been posted, and they are
removed a week after they have been made available. At any point the programmer is
therefore restricted to a selection of recent tweets.
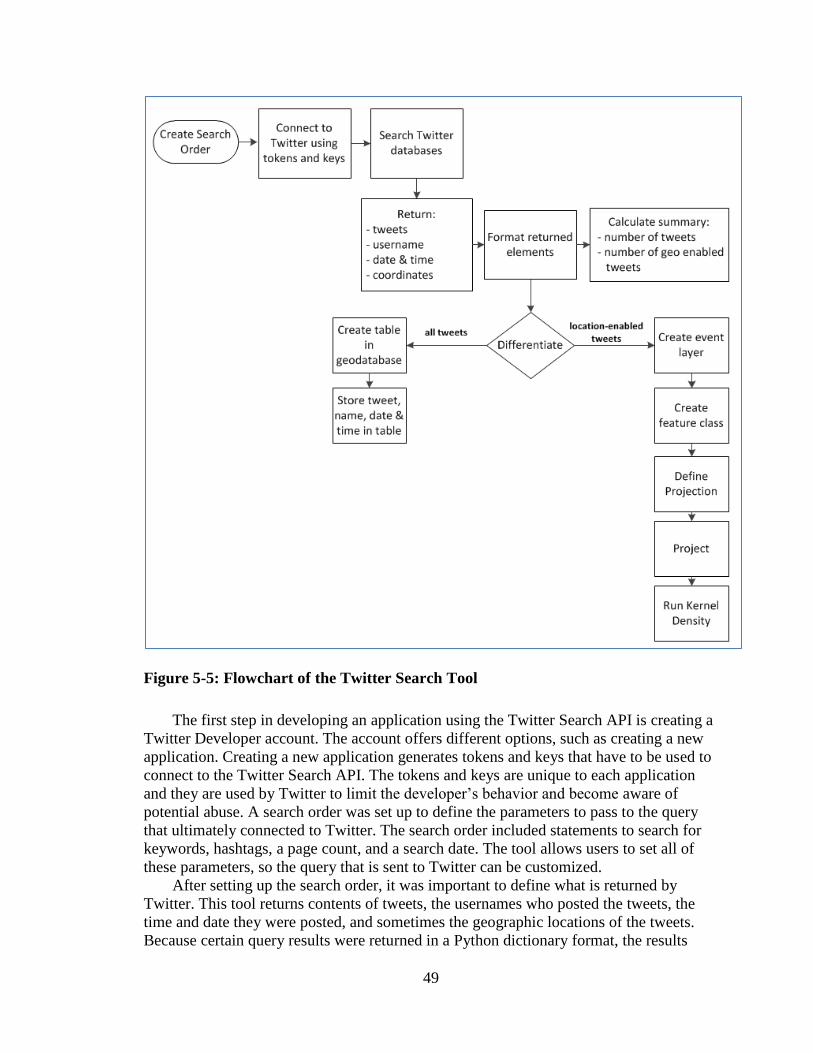
5.4.3 Development of the Tool
To extract and map out relevant tweets from the Twitter database, multiple steps had to
be accomplished. These steps are laid out in Figure 5-5 and are explained in the following
paragraphs.
49
Figure 5-5: Flowchart of the Twitter Search Tool
The first step in developing an application using the Twitter Search API is creating a
Twitter Developer account. The account offers different options, such as creating a new
application. Creating a new application generates tokens and keys that have to be used to
connect to the Twitter Search API. The tokens and keys are unique to each application
and they are used by Twitter to limit the developer’s behavior and become aware of
potential abuse. A search order was set up to define the parameters to pass to the query
that ultimately connected to Twitter. The search order included statements to search for
keywords, hashtags, a page count, and a search date. The tool allows users to set all of
these parameters, so the query that is sent to Twitter can be customized.
After setting up the search order, it was important to define what is returned by
Twitter. This tool returns contents of tweets, the usernames who posted the tweets, the
time and date they were posted, and sometimes the geographic locations of the tweets.
Because certain query results were returned in a Python dictionary format, the results

50
could not be directly written to a geodatabase and had to be formatted to fit the esri
geodatabase schema. Coordinates, for instance, are returned in a format that cannot be
understood by a geodatabase, and they also include additional information that was not
useful in this project. A combination of slicing, splitting, and indexing methods were
therefore used to extract only the latitude and longitude information (Figure 5-6).
Figure 5-6: Extracting Coordinates
To iterate through multiple tweets, the search order had to be incorporated into a
loop. Each iteration was passed to a list, which was then plugged into an insert cursor.
The insert cursor was used to write the returned information to a newly created table in
the database. To visualize the geographic aspect of the returned tweets, coordinates – if
available – were converted to an event layer, which was then saved as a point feature
class. The feature class was used to generate a kernel density raster layer. Because
providing coordinates in a tweet is optional, the script calculates the count of returned
tweets and the percentage of geo-enabled tweets. This information is also recorded in the
geodatabase. The tool interface was designed by importing the final script into a custom
toolbox in ArcCatalog.
5.4.4 Tool Interface
The tool was programmed so that a user has control over what to query from the Twitter
database. The user can define keywords to directly search the content of tweets. A
keyword is defined as any string that is contained in a Tweet, including hashtags and
links. It has to be noted that the more keywords and hashtags are entered, the fewer
results the tool will return as the Twitter API will find tweets containing all keywords.
The number of returned pages and a “search until” date can also be specified. As pointed
out in Section 5.4.2 the Twitter Search API does not allow searching by random time
frames. Furthermore, no beginning date, but only an end date, can be set. The user can
also specify the inputs and the cell size of the kernel density raster output. The Help
menu, which can be toggled, explains each input field and its limitations. Figure 5-7
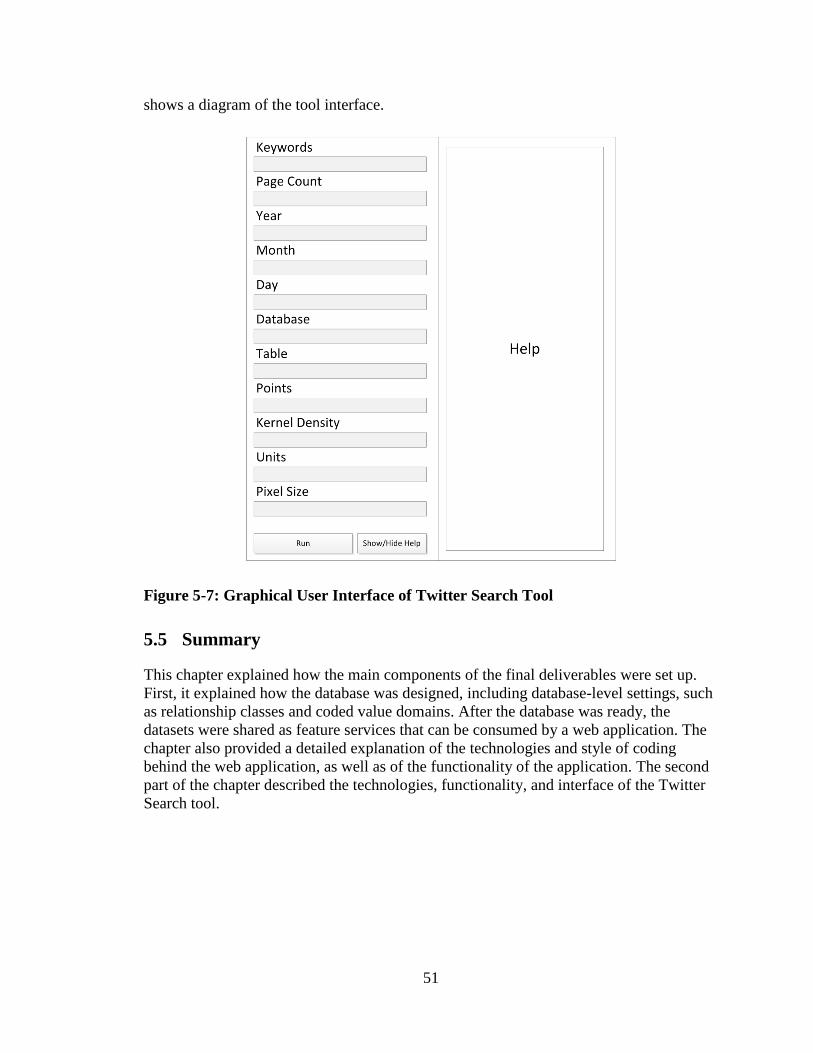
51
shows a diagram of the tool interface.
Figure 5-7: Graphical User Interface of Twitter Search Tool
5.5 Summary
This chapter explained how the main components of the final deliverables were set up.
First, it explained how the database was designed, including database-level settings, such
as relationship classes and coded value domains. After the database was ready, the
datasets were shared as feature services that can be consumed by a web application. The
chapter also provided a detailed explanation of the technologies and style of coding
behind the web application, as well as of the functionality of the application. The second
part of the chapter described the technologies, functionality, and interface of the Twitter
Search tool.

52

53
Chapter 6 – Use Cases
The two deliverables of this project have different uses. The web application has three
uses: basic navigation to familiarize oneself with the A LOT Initiative, submitting
information to the database, and retrieving data from the database. The Twitter Search
tool’s main purpose is to find people who talk about A LOT Initiative events on Twitter.
The resulting tweets can be viewed in tabular form. If coordinates are available, the tool
also creates a point layer and a heat map.
6.1 Web Application
The web application has three main purposes. It can be used to learn about when the
events of the A LOT Initiative are happening and where they are located. Or it can be
used to submit or retrieve information about events. All of these functionalities can be
accessed by the general public and the Arts Council for Long Beach (ACLB). The
following subsections will elaborate on each feature.
6.1.1 Basic Functionality
The web application offers basic functionalities that are nowadays shared by most web
GIS applications. In addition, this application also includes basic functionality that is
specifically tied to the A LOT Initiative. Figure 6-1 shows the web application and the
labels point out the features mentioned in this paragraph.

54
Figure 6-1: Elements of the Application

55
A user might use the application to get a good idea of the A LOT Initiative and the
respective events. The accordion pane on the left side of the web page includes the event
schedule for each of the three lots. A user can click on a parcel header to expand a pane
showing the event names as well as the dates the events are taking place (Figure 6-2).
When clicking inside the pane the map will automatically center on the respective lot.
Figure 6-2: The Schedule Pane for the Central Lot
If a user wants to see the location of a parcel without opening the schedule, the user
can use the Zoom to Parcel button. Once zoomed in the user might want to change the
basemap. If a user is vaguely familiar with the neighborhood, then satellite imagery
might be more helpful than a street network. A user can use a button to toggle between
the street network and the satellite imagery. The icon on the button displays the basemap
type that the user can change to when clicking. For instance, if the street network is
activated then the button will display a satellite image. A user can find out his or her
location in relation to the parcel using the Locator button. Clicking the button will zoom
to a user’s location on the map. This feature uses HTML 5 Geolocation functionality to
obtain the user’s position. The tool triggers an interface that asks for the user’s consent to
share location, and the accuracy of the location is determined by the device of the user.
For instance, the location is more accurate on a smartphone using GPS than on a desktop
computer using Wi-Fi. Table. Table 6-1 summarizes the accuracy of geolocation
methods.

56
Table 6-1: Accuracy of Geolocation Methods, adapted from Duvander (2010, p. 158)
Method Accuracy
GPS Within feet
Wi-Fi Within a block
Cell towers Within a few miles
IP address ZIP-or city-level
This feature is especially helpful when the application is used on a mobile device.
The current location can then be used in a routing application to navigate to one of the
parcels. If a user is interested in finding an address within Long Beach, the geocoder
widget can be used. When typing, an autocomplete function will compare user input to
the five closest matching addresses in the geocoding service. Because the geocoder is
meant to be used exclusively in Long Beach, it will automatically add “Long Beach, CA”
to any input address, which helps the autocomplete process. After zooming to the
location, a marker will show up. The application also supports several types of zooming
and panning: a user can use the zoom buttons, mouse, keyboard, or touchpad to zoom.
6.1.2 Submitting to the Database
A user who returns home from an A LOT Initiative event might like to share his or her
opinion about the event. Another user might have stumbled upon an article or a video
about an event, and decide to share it with the Arts Council. The application was
primarily built for data collection purposes, and it allows users to add four pieces of
information: links to news articles, links to videos, links to blogs, and personal reviews.
For each piece of information, a user can specify the event name and date.
A user can access the submission dialog by clicking on the Submit Information
tab in the accordion pane (Figure 6-3). To limit typographic errors and the submission of
nonexistent artists, dates, and locations, users are provided with a selection of predefined
values.

57
Figure 6-3: Submit Information Dialog

58
6.1.3 Querying the Database
The general public or the ACLB might be interested in retrieving the submitted
information. The Query Database tab in the accordion container can be used to search the
database and return specific sets of information. To simplify the searching process, a user
is offered a set of options to launch the query (Figure 6-4). Instead of typing information,
a user can choose to return all the information associated with a parcel by clicking one of
the three radio buttons. The user can also use the dropdown menu to return all
information related to a specific event.
Figure 6-4: Query Options
After clicking a radio button or selecting an event, the table on the bottom of the page
will populate with information retrieved from the database. Figure 6-5 shows a part of the
table that has been populated after a user has chosen to see all of the information
submitted for Carlos Ramirez.

59
Figure 6-5: Query Results for Carlos Ramirez
6.2 Twitter Search Tool
The Twitter Search tool lets the user specify a number of parameters to search Twitter
databases. The returned tweets will be written to a geodatabase and mapped out if the
location is enabled. Unlike the web application, this tool is intended to be used only by
the client.
Supposed that the ACLB wants to find out what people tweeted in reference to
Donna Sternberg’s performance, as shown in Figure 6-6, the user can specify a number of
parameters to detect tweets. In this case the user decides to search for tweets that contain
“Donna Sternberg”, “event”, “concert”, and “Long Beach”. The user also wants to check
for two hashtags: “ALOTInitiative” and “ALOTLongBeach”. The user submits 100 for
the Count field. Count refers to the number of tweet pages that will be returned, and the
default is 100, with about 200 tweets per page, or a total of approximately 20,000 tweets.
The user then specifies the cell size at which the raster will be created, as well as the area
units of the output density values. After pointing to the correct databases, the tool can be
run.

60
Figure 6-6: Twitter Search Tool
In this case the tool did not return any results. This suggests that either no one
tweeted about that event or it suggests that the user should query using different
keywords. The fewer words the user enters and the more talked-about a word is in a
given period of time, the more results will be returned. For instance, using
“Thanksgiving” as a keyword in mid-November returns over 17,900 tweets, although
only about 400 of these tweets had a location attached to them. Figure 6-7 shows the
resulting kernel density raster, brought into ArcMap and laid on top of a basemap. The
user now has a visual representation of the distribution of tweets. It suggests that
Thanksgiving is an especially popular topic to tweet about in the Northeast and the
Southwest of the United States.

61
Figure 6-7: Heat Map Result from Searching “Thanksgiving”
6.3 Summary
This chapter showed how the two deliverables of this project can be used in real-world
scenarios. Section 6.1 elaborated on the uses of the web application, which has three
main purposes: familiarizing oneself with the A LOT Initiative, submitting information,
and retrieving information. Section 6.2 showed how the Twitter tool can be used to return
and map out specific tweets from Twitter databases.


63
Chapter 7 – Conclusions and Future Work
This project was accomplished for the Arts Council for Long Beach (ACLB), a non-profit
organization based in Long Beach, California. The ACLB is involved in a cultural
project, called A LOT Initiative. The A LOT Initiative is an attempt to reverse the issue
of empty urban lots in the City of Long Beach. Over a period of two years the ACLB
hosted events in three lots across the city. This project resulted in two deliverables – a
web application and a tool to search Twitter databases – which both helped the ACLB
track the success of its A LOT Initiative.
A wealth of information about many of the A LOT Initiative events is available
on the internet. It was impossible for the ACLB, however, to gather all that information
by itself. A web application was built that lets users submit relevant information to a
database. The user was able to submit links to blogs, links to news articles, links to
YouTube videos, as well as personal reviews and ratings. Anyone who is passionate
about the A LOT Initiative can now easily look up or share valuable information with the
ACLB.
Based on specific keywords, the Twitter Search tool searches tweets from Twitter
databases. The resulting tweets are written to a database, and if locations are available,
they are mapped. The rationale behind the Twitter Search tool was that the ACLB could
query Twitter databases after an event to see what people tweeted about it. Ideally all of
the returned tweets contain geographic location, which would help the ACLB visualize
where in Long Beach specific events had an impact. It turned out that it can be difficult to
use Twitter to find such specific and local information. To make the tool useful, the
ACLB could ask visitors to share their location of events to use a specific hashtag when
tweeting about the A LOT Initiative (.e.g., #ALOTInitiativeLongBeach).
Future work could consist of combining the deliverables, such that the Twitter tool
could be accessed from the web application. By opening the tool to the public and
keeping track of the entered keywords, the ACLB would find out which events users are,
or were, most interested in. The ACLB would know which artists should be hired again,
and which areas in Long Beach should be invested in more. It would be interesting as
well to have a map that is connected to Twitter using the Twitter Streaming API.


65
Works Cited
Carver, S., Evans, A., Kingston, R., & Turton, I. (2001). Public participation, GIS, and
cyberdemocracy: evaluating on-line spatial decision support systems.
Environment and Planning B, 28(6), 907-922.
DuVander, Adam. Map Scripting One Hundred One. No Starch Press, 2010.
Elwood, S., & Leitner, H. (2003). GIS and spatial knowledge production for
neighborhood revitalization: Negotiating state priorities and neighborhood
visions. Journal of Urban Affairs, 25(2), 139-157.
Fu, P., & Sun, J. Web GIS: principles and applications. Esri Press, 2010.
Goodchild, M. F. (2007). Citizens as sensors: the world of volunteered geography.
GeoJournal, 69(4), 211-221.
Guetzkow, J. (2002). How the arts impact communities. Centre for Arts and Cultural
Policy Studies.
Kelling, G. L., & Wilson, J. Q. (1982). Broken windows. Atlantic Monthly, 249(3), 29-
38.
Kunstler, J. H. (1998). Home from nowhere: remaking our everyday world for the 21st
century. Touchstone Press.
Markusen, A., & Gadwa, A. (2010). Arts and culture in urban or regional planning: A
review and research agenda. Journal of Planning Education and Research, 29(3),
379-391.
McKay, D.A., (2007). Redeveloping Greyfields in the Greater Toronto Area [Current
Issues Paper]. Retrieved from
http://www.geog.utoronto.ca/graduate/planning/student-work/cip/2006-07-
Redeveloping-Greyfields-MCKAY.pdf
Northam, R. M. (1971). Vacant urban land in the American city. Land Economics, 47,
345-355.
O'Reilly, T. (2007). What is Web 2.0: Design patterns and business models for the next
generation of software. Communications & strategies, (1), 17.
Pagano, M. A., & Bowman, A. O. M. (2000). Vacant land in cities: An urban resource.
Brookings Institution, Center on Urban and Metropolitan Policy.

66
Peng, Z. R. (2001). Internet GIS for public participation. Environment and Planning B,
28(6), 889-906.
Sieber, R. (2006). Public participation geographic information systems: A literature
review and framework. Annals of the Association of American Geographers,
96(3), 491-507.
Stanziola, J. (1999). Arts, government and community revitalization. Brookfield, VT:
Ashgate.
Steinacker, A. (2003). Infill development and affordable housing patterns from 1996 to
2000. Urban Affairs Review, 38(4), 492-509.
Strom, E. (2002). Let's put on a show! Performing arts and urban revitalization in
Newark, New Jersey. Journal of Urban Affairs, 21(4), 423-435.

67
Appendix A. Web Application Code
<!DOCTYPE html>
<html>
<head>
<title>A LOT Initiative Map</title>
<meta http-equiv="Content-Type" content="text/html; charset=utf-8">
<meta http-equiv="X-UA-Compatible" content="IE=7, IE=9, IE=10">
<link rel="stylesheet"
href="http://js.arcgis.com/3.7/js/dojo/dojo/resources/dojo.css">
<link rel="stylesheet"
href="http://js.arcgis.com/3.7/js/dgrid/css/dgrid.css">
<link rel="stylesheet"
href="http://js.arcgis.com/3.7/js/dgrid/css/skins/claro.css">
<link rel="stylesheet"
href="http://js.arcgis.com/3.7/js/dojo/dijit/themes/claro/claro.css">
<link rel="stylesheet"
href="http://js.arcgis.com/3.7/js/esri/css/esri.css">
<style type="text/css">
/*Grid needs an explicit height by default*/
#gridDiv {
height: 15em;
}
#borderContainer {
height: 100%;
visibility: hidden;
}
.dijitBorderContainer #bottomPane {
padding: 0
}
#grid { height: 100%; }
.dgrid { border: none; }
.field-id { cursor: pointer; }
html, body, #mapDiv {
width: 100%;
height: 100%;
margin: 0;
overflow: hidden;
}
#mapDiv {border-radius: 5px;padding:0}
#title {
color: white;
font: bold 26pt Helvetica;
text-align: center;
text-decoration:none;
}
a:link {
text-decoration:none;
}

68
a:visited {
color: white;
text-decoration:none;
}/* visited link */
a:hover {
color: white;
text-decoration:underline;
}/* mouse over link */
a:active {
color: white;
font: normal 26pt Helvetica;
text-align: center;
text-decoration:none;
}/* selected link */
#header {
background-color: #EF4A4A;
border-radius: 5px;
}
#borderContainer {
width: 100%;
height: 100%;
background-color: green;
}
#leftPane {
width: 22.5%;
padding: 0;
}
#rightPane{padding: 0;border-radius: 5px;}
#accordionPane{height:685px;}
#borderContainer, #leftPane, #header {
background-color: #EF4A4A;
border-color: blue;
border-width: 0px;
}
#userLocDIV {
z-index: 2;
position: absolute;
top: 100px;
left: 20px;
}
#parcelZoomDropdownDIV{
position: absolute;
text-align: center;
z-index: 2;
right:150px;
top: 20px;

69
}
#parcelZoomDropdownDIV:hover {
cursor: pointer;
}
#addressFindDIV {
display: block;
position: absolute;
z-index: 1;
left: 0px;
top: 0px;
}
#addressFindDIV :focus {
color: #258;
}
.simpleGeocoder .esriGeocoder {
left: 80px;
top: 28px;
position: absolute;
z-index: 2;
border: 2px solid #EF4A4A;
width: 240px;
}
.simpleGeocoder .esriGeocoder input, .simpleGeocoder
.esriGeocoder input:focus {
color: #EF4A4A;
width: 180px;
}
.simpleGeocoder .esriGeocoderResults {
left: 80px;
top: 61px;
background: none repeat scroll 0 0 #000000;
border-color: #EF4A4A;
width: 240px;
opacity: 0.8;
}
.simpleGeocoder .esriGeocoderResult {
cursor: pointer;
display: block;
padding: 5px;
text-overflow: ellipsis;
white-space: nowrap;
color: #EF4A4A;
}
.esriScalebar {
position: absolute;
}
.esriScalebarLabel {
color: #EF4A4A;
font-size: 90%;

70
margin-bottom: 5px;
}
#basemapBTN {
border: solid 2px #EF4A4A;
position: absolute;
z-index: 2;
right: 20px;
top: 20px;
box-shadow: 0 0 10px #666;
height:68px;
}
#basemapBTN:hover {
box-shadow: 0 0 10px #799007;
cursor: pointer;
}
#inputQueryDIV:focus{
box-shadow: 0 0 10px #799007;
}
#inputQueryDIV{
padding: 1px;
}
#northRB:focus, #centralRB:focus, #downtownRB:focus{
box-shadow: 0 0 5px pink;
cursor: pointer;
}
#northRB:hover, #centralRB:hover, #downtownRB:hover{
box-shadow: 0 0 5px pink;
cursor: pointer;
}
.resultsGridLeft {
height:400px;
}
.resultsGridLeft .dgrid-cell {
border: none;
}
.boxInput {
margin-left:5px;
width:250px;
}
.dgrid-cell{
width:10px;
}
.dropdownInput:focus{
cursor: pointer;
}

71
.dropdownInput:hover{
cursor: pointer;
}
</style>
<script src="http://js.arcgis.com/3.7/"></script>
<script
src="http://ajax.googleapis.com/ajax/libs/jquery/1.10.2/jquery.min.js">
</script>
<script>
//-- List of modules that will be loaded --
require([
"dojo/ready",
"dgrid/OnDemandGrid",
"dgrid/Selection",
"dojo/store/Memory",
"dojo/_base/array",
"dojo/dom-style",
"dijit/registry",
"esri/map",
"esri/symbols/SimpleFillSymbol",
"esri/symbols/SimpleLineSymbol",
"esri/renderers/SimpleRenderer",
"esri/lang",
"dojo/_base/Color",
"dijit/TooltipDialog",
"dijit/popup",
"dojo/query",
"esri/layers/FeatureLayer",
"esri/dijit/Scalebar",
"esri/dijit/LocateButton",
"esri/dijit/Geocoder",
"dijit/form/Button",
"esri/layers/GraphicsLayer",
"esri/symbols/PictureMarkerSymbol",
"esri/symbols/SimpleMarkerSymbol",
"esri/InfoTemplate",
"esri/tasks/QueryTask",
"esri/tasks/query",
"dojo/_base/declare",
"dojo/number",
'dojo/_base/lang',
'dojo/parser',
"esri/graphic",
"dijit/layout/BorderContainer",
"dijit/layout/TabContainer",
"dijit/layout/ContentPane",
"esri/SpatialReference",
"dijit/form/DropDownButton",
"dijit/DropDownMenu",
"dijit/MenuItem",
"esri/toolbars/edit",
"esri/tasks/RelationshipQuery",
"esri/layers/ArcGISTiledMapServiceLayer",
"esri/dijit/editing/Editor",
"esri/dijit/editing/TemplatePicker",
"esri/config",

72
"esri/request",
"dojo/on",
"dojo/dom",
"dojo/dom-class",
"dojo/dom-construct",
"dojo/domReady!"],
//-- Anonymous callback function --
//--- it fires once all modules have loaded
//--- variable names refer to each loaded module
function(
ready,
Grid,
Selection,
Memory,
array,
domStyle,
registry,
Map,
SimpleFillSymbol,
SimpleLineSymbol,
SimpleRenderer,
esriLang,
Color,
TooltipDialog,
dijitPopup,
query,
FeatureLayer,
Scalebar,
LocateButton,
Geocoder,
Button,
GraphicsLayer,
PictureMarkerSymbol,
SimpleMarkerSymbol,
InfoTemplate,
QueryTask,
Query,
declare,
dojoNum,
lang,
parser,
Graphic,
BorderContainer,
TabContainer,
ContentPane,
SpatialReference,
DropDownButton,
DropDownMenu,
MenuItem,
Edit,
RelationshipQuery,
ArcGISTiledMapServiceLayer,
Editor,
TemplatePicker,
esriConfig,
esriRequest,
on,

73
dom,
domClass,
domConstruct) {
//-- the actual callback code begins here
ready(function(){
parser.parse();
//--use proxy page--
esriConfig.defaults.io.proxyUrl =
"http://localhost:36351/MSGIS_Numa/proxy/proxy.ashx";
//----------------
//-- Create Map --
//----------------
var mainMap = new Map("mapDiv", {
basemap : "topo",
center : [-118.161, 33.8045], // center on Long Beach
zoom : 10,
sliderStyle : "small",
});
mainMap.on("layers-add-result", initEditing);
//---------------------
//-- Change Basemaps --
//---------------------
// grab basemap button
var mapButton = query("#basemapBTN");
// create a function that changes basemaps
function changeMap() {
// grab value of current basemap
var currentMap = mainMap.getBasemap()
// change to other one
if (currentMap == "topo") {
mainMap.setBasemap("satellite");
} else if (currentMap == "satellite") {
mainMap.setBasemap("topo")
};
}
// fire function when basemap button is clicked
mapButton.on("click", changeMap);
//--------------------------------
//-- add the parcels to the map --
//--------------------------------
var parcelsAll = new FeatureLayer("http://msgis-webdev-
1.spatial.redlands.edu/arcgis/rest/services/numa_gremling/ALOT_FinalFil
es/FeatureServer/0", {
mode : FeatureLayer.MODE_ONDEMAND, //only pull data from server
when it is within the viewer's extent
outFields : ["*"],
id: "parcelsALL"
});
mainMap.addLayer(parcelsAll);
// define symbology for parcels
var parcelSymbology = new SimpleFillSymbol(
SimpleFillSymbol.STYLE_SOLID,
new SimpleLineSymbol(
SimpleLineSymbol.STYLE_SOLID,
new Color([0,0,255,1]), 3 // outline of the parcel [R,G,B,
opacity], outline width

74
),
new Color([239,74,74,0.5]) // inside of the parcel
);
// add symbology to parcels
parcelsAll.setRenderer(new SimpleRenderer(parcelSymbology));
mainMap.infoWindow.resize(245,125);
//------------------------------------------
//-- define symbology for selected parcel --
//------------------------------------------
var highlightSymbol = new SimpleFillSymbol(
SimpleFillSymbol.STYLE_SOLID,
new SimpleLineSymbol(
SimpleLineSymbol.STYLE_SOLID,
new Color([239,74,74,1]), 3 // outline of the parcel
),
new Color([0,0,255,0.5]) // inside of the parcel
);
//------------------------------------------
//-- create function to edit event table ---
//------------------------------------------
function initEditing() {
var parcelsALL = mainMap.getLayer("parcelsALL");
var relatedQuery = new RelationshipQuery();
relatedQuery.outFields = ["*"];
relatedQuery.relationshipId = 4;
parcelsALL.on("click", function (evt) {
graphicAttributes = evt.graphic.attributes;
relatedQuery.objectIds = [graphicAttributes.OBJECTID];
relatedQuery.relationshipId = 0;
parcelsALL.queryRelatedFeatures(relatedQuery, function
(relatedRecords) {
var fset = relatedRecords[graphicAttributes.OBJECTID];
});
});
}
//--------------------------------------------------------
//-- enable mouse events on parcels when map has loaded --
//--------------------------------------------------------
mainMap.on("load", function(){
mainMap.graphics.enableMouseEvents();
mainMap.graphics.on("mouse-out", closeTooltip); // when leaving
parcel call closeTooltip function
});
// create tooltip
parcelTooltip = new TooltipDialog({
id: "tooltipDialog",
style: "position: absolute; width: 250px; font: normal
normal normal 10pt Helvetica;z-index:100;"
});
parcelTooltip.startup();
// function to close tooltip
function closeTooltip() {
mainMap.graphics.clear();
dijitPopup.close(parcelTooltip);
}
// fire event when entering a parcel, and display tooltip

75
parcelsAll.on("mouse-over", function(evt){
// define text and fields shown in tooltip
var popupContent = "<b>Parcel Location:</b>
${Name}</b><hr><b>Address: ${Id} <br/></b>Oh hello<br>";
// populate the tooltip
var tooltipContent =
esriLang.substitute(evt.graphic.attributes,popupContent); // put
content into a variable
var highlightGraphic = new
Graphic(evt.graphic.geometry,highlightSymbol); // put highlight
symbology into variable
mainMap.graphics.add(highlightGraphic);
// make the feature highlight
parcelTooltip.setContent(tooltipContent);
// add content to tooltip
// make tooltip show up where the mouse cursor is
domStyle.set(parcelTooltip.domNode, "opacity", 0.85);
dijitPopup.open({
popup: parcelTooltip,
x: evt.pageX, //pageX is x position of cursor
y: evt.pageY //pageY is y position of cursor
});
});
//---------------------------------------------------------
//-- Create Bottom Grid; Set up the Query to populate it --
//---------------------------------------------------------
// Create Bottom table
window.bottomGrid = new (declare([Grid, Selection]))({
selectionMode: "single",
bufferRows: Infinity, // make sure all rows from table show up
// specify the display names
columns: {
"locationField": "Lot",
"eventField": "Event",
"dateField": "Date",
"ratingField": "Rating",
"reviewField": "Review",
"youtubeField": "YouTube",
"pressField": "Press",
"blogField": "Blog",
}
}, "bottomGridDIV");
// when map loads:
mainMap.on("load", function (evt) {
// add the bordercontainer that holds the grids
domStyle.set(registry.byId("borderContainer").domNode,
"visibility", "visible");
// fire queries to populate schedule grids
populateNorthGrid();
populateDowntownGrid();
populateCentralGrid();
});
// attach functions to user selecting a radio button
// each radio button will change the paramters of the query and
fire it
on(dom.byId("northRB"), "click", function(){

76
var userInput = "North"
queryTable(userInput);
});
on(dom.byId("centralRB"), "click", function(){
var userInput = "Central"
queryTable(userInput);
});
on(dom.byId("downtownRB"), "click", function(){
var userInput = "Downtown"
queryTable(userInput);
});
// attach function to user choosing a performance in the
dropdown
// fire query based upon chosen event
on(dom.byId("eventID"), "change", function(){
var dropdown = dom.byId("eventID");
var userInput =
dropdown.options[dropdown.selectedIndex].value;
queryTable(userInput);
});
// Put Review Table into variable and define outfields
window.parcelURL = "http://msgis-webdev-
1.spatial.redlands.edu/arcgis/rest/services/numa_gremling/ALOT_FinalFil
es/FeatureServer/4";
window.outFields = ["Lot", "Event", "Date", "Rating", "Review",
"YouTube", "Press", "Blog"];
// Create function that populates the bottom grid
function queryTable(userInput){
var parcelQueryTask = new QueryTask(window.parcelURL);
var query = new Query();
query.outFields = window.outFields;
// build query based on user input
query.where = " Lot = '" + userInput + "' OR Event = '" +
userInput + "' OR Date = '" + userInput + "' ";
// execute the query task
parcelQueryTask.execute(query, function(results) {
if(results.features.length > 0){
mainMap.graphics.clear();
}
// create object that grabs data from records
var tableData = array.map(results.features, function(feature) {
return {
// the fields in order as they are shown on the attribute
table
"locationField":
feature.attributes[window.outFields[0]],
"eventField":
feature.attributes[window.outFields[1]],
"dateField":
feature.attributes[window.outFields[2]],
"ratingField":
feature.attributes[window.outFields[3]],
"reviewField":
feature.attributes[window.outFields[4]],
"youtubeField":
feature.attributes[window.outFields[5]],

77
"pressField":
feature.attributes[window.outFields[6]],
"blogField":
feature.attributes[window.outFields[7]]
};
});
// create new memory store to hold data
// use tableData object to populate it
var memoryStore = new Memory({ data: tableData });
window.bottomGrid.set("store", memoryStore);
});
}
//----------------------------------------------------------
//-- Create Schedule Grid for each Parcel and Populate it --
//----------------------------------------------------------
// --- North Parcel ---
window.northParcelSched = "http://msgis-webdev-
1.spatial.redlands.edu/arcgis/rest/services/numa_gremling/ScheduleTable
s/MapServer/1";
function populateNorthGrid() {
// create query task
var queryTaskNorth = new QueryTask(window.northParcelSched);
// create query
var queryNorthTable = new Query();
queryNorthTable.where = "1=1"; // SQL Query: 1=1 means that
everything will be returned
queryNorthTable.outFields = ["Date", "Event", 'OBJECTID'];
queryNorthTable.spatialReference = new SpatialReference({wkid:
102100 });
// execute the query task
// create an object that holds the data from table
queryTaskNorth.execute(queryNorthTable, function(results) {
var northTableData = array.map(results.features,
function(feature) {
return {
"dateField": feature.attributes.Date,
"eventField": feature.attributes.Event,
"id":feature.attributes.OBJECTID
};
});
// create new memory store to hold data
var northMemoryStore = new Memory({ data: northTableData,
idProperty:'OBJECTID' });
// create the grid that displays the schedule
var northSchedGrid = new (declare([Grid, Selection]))({
bufferRows: Infinity, // make sure all rows from
table show up
columns: {
"dateField": "Date",
"eventField": "Event"
},
store: northMemoryStore,
class: 'resultsGridLeft',
}, "northSchedGridDIV");
northSchedGrid.startup();

78
});
}
// --- Central Parcel ---
window.northParcelSched = "http://msgis-webdev-
1.spatial.redlands.edu/arcgis/rest/services/numa_gremling/ScheduleTable
s/MapServer/3";
function populateCentralGrid() {
var queryTaskCentral = new QueryTask(window.northParcelSched);
var queryCentralTable = new Query();
queryCentralTable.where = "1=1";
queryCentralTable.outFields = ["Date", "Event", 'OBJECTID'];
queryCentralTable.spatialReference = new SpatialReference({wkid:
102100 });
queryTaskCentral.execute(queryCentralTable, function(results) {
var centralTableData = array.map(results.features,
function(feature) {
return {
"dateField": feature.attributes.Date,
"eventField": feature.attributes.Event,
"id":feature.attributes.OBJECTID
};
});
var centralMemoryStore = new Memory({ data: centralTableData,
idProperty:'OBJECTID' });
// create the grid that displays the schedule
var centralSchedGrid = new (declare([Grid, Selection]))({
bufferRows: Infinity,
columns: {
"dateField": "Date",
"eventField": "Event"
},
store: centralMemoryStore,
class: 'resultsGridLeft',
}, "centralSchedGridDIV");
centralSchedGrid.startup();
});
}
// --- Downtown Parcel ---
window.downtownParcelSched = "http://msgis-webdev-
1.spatial.redlands.edu/arcgis/rest/services/numa_gremling/ScheduleTable
s/MapServer/2";
function populateDowntownGrid() {
var queryTaskDowntown = new
QueryTask(window.downtownParcelSched);
var queryDowntownTable = new Query();
queryDowntownTable.where = "1=1";
queryDowntownTable.outFields = ["Date", "Event", 'OBJECTID'];
queryDowntownTable.spatialReference = new SpatialReference({wkid:
102100 });
queryTaskDowntown.execute(queryDowntownTable, function(results) {
var downtownTableData = array.map(results.features,
function(feature) {
return {
"dateField": feature.attributes.Date,
"eventField": feature.attributes.Event,

79
"id":feature.attributes.OBJECTID
};
});
var downtownMemoryStore = new Memory({ data: downtownTableData,
idProperty:'OBJECTID' });
// create the grid that displays the schedule
var downtownSchedGrid = new (declare([Grid, Selection]))({
bufferRows: Infinity,
columns: {
"dateField": "Date",
"eventField": "Event"
},
store: downtownMemoryStore,
class: 'resultsGridLeft',
}, "downtownSchedGridDIV");
downtownSchedGrid.startup();
});
}
//----------------------
//-- Create Scale Bar --
//----------------------
var scalebar = new Scalebar({
map : mainMap,
scalebarStyle : "line",
scalebarUnit : "dual"
});
//--------------------------
//-- Create Locate Button --
//--------------------------
var userLocation = new LocateButton({
map : mainMap
}, "userLocDIV");
userLocation.startup();
//---------------------
//-- Create Geocoder --
//---------------------
// add graphics layer to display geocoding results
mainMap.addLayer(new GraphicsLayer({
id : "results"
}));
// create geocoder
var geocoder = new Geocoder({
map : mainMap,
autoComplete : true,
arcgisGeocoder : {
suffix : " Long Beach, CA",
name : "Esri World Geocoder",
placeholder : "find address within Long Beach"
},
}, "addressFindDIV");
geocoder.startup();
// create new PictureMarkerSymbol object using a JSON object
var symbol = new PictureMarkerSymbol({
"angle" : 0,
"xoffset" : 0,
"yoffset" : 10,
"type" : "esriPMS",

80
"url" :
"http://static.arcgis.com/images/Symbols/Shapes/BluePin1LargeB.png",
"contentType" : "image/png",
"width" : 24,
"height" : 24
});
//---------------------------------------------------------
//-- Add Zooming Functionality to Schedule and Bookmarks --
//---------------------------------------------------------
// define parcel locations
var northLoc = [-118.185, 33.8748];
var centrLoc = [-118.172, 33.782];
var downLoc = [-118.192, 33.7750];
// define zoom functions for each location
function northZoom() {
mainMap.centerAndZoom(northLoc, 18);}
function centrZoom() {
mainMap.centerAndZoom(centrLoc, 18);}
function downZoom() {
mainMap.centerAndZoom(downLoc, 20);}
// grab parcel text in schedule pane
var northPrcPane = query("#northParcelPane");
var centrPrcPane = query("#centralParcelPane");
var downPrcPane = query("#downtownParcelPane");
//attach functions to onclick events for schedule
northPrcPane.on("click", northZoom);
centrPrcPane.on("click", centrZoom);
downPrcPane.on("click", downZoom);
// --- Create Bookmarks Menu ---
// create new dropdown
var parcelZoomDropdown = new DropDownMenu({ style: "display:
none;"});
// create a new menu item and attach a function to it
var menuItemNorth = new MenuItem({
label: "North Parcel",
onClick: function() {mainMap.centerAndZoom(northLoc, 18);}
});
parcelZoomDropdown.addChild(menuItemNorth);
// create a new menu item and attach a function to it
var menuItemCentral = new MenuItem({
label: "Central Parcel",
onClick: function() {mainMap.centerAndZoom(centrLoc, 18);}
});
parcelZoomDropdown.addChild(menuItemCentral);
// create a new menu item and attach a function to it
var menuItemDowntown = new MenuItem({
label: "Downtown Parcel",
onClick: function() {mainMap.centerAndZoom(downLoc, 20);}
});
parcelZoomDropdown.addChild(menuItemDowntown);
// create the button that holds the dropdown
var button = new DropDownButton({
label: "Zoom to Parcel",
dropDown: parcelZoomDropdown,
id: "parcelZoomID"

81
});
dom.byId("parcelZoomDropdownDIV").appendChild(button.domNode);
// -- Function and Require end here --
});
});
//-------------------------------------
//------------------------------------------
//-- Function that Edits the Review Table --
//------------------------------------------
function updateRelatedTable() {
require([
"esri/layers/FeatureLayer",
"dojo/on",
"dojo/dom",
], function (FeatureLayer, on, dom) {
// get value from YouTube input box
youtubeLink = document.getElementById('youtubeInputID').value;
// get value from Blog input box
blogLink = document.getElementById('blogInputID').value;
// get value from Review input box
reviewText = document.getElementById('reviewInputID').value;
// get value from Press input box
pressLink = document.getElementById('pressInputID').value;
// get value from selected Event in dropdown
var eventDropdown = dom.byId("eventInputID");
eventInput =
eventDropdown.options[eventDropdown.selectedIndex].value;
// get value from selected Parcel Location in dropdown
var locationDropdown = dom.byId("locationInputID");
locationInput =
locationDropdown.options[locationDropdown.selectedIndex].value;
// get value from selected Date in dropdown
var dateDropdown = dom.byId("dateInputID");
dateInput =
dateDropdown.options[dateDropdown.selectedIndex].value;
// get value from selected Rating in dropdown
var ratingDropdown = dom.byId("ratingInputID");
ratingInput =
ratingDropdown.options[ratingDropdown.selectedIndex].value;
// array that holds user input
alert("Updating...");
var comments = {
attributes: {
Lot: locationInput,
Event: eventInput,
Date: dateInput,
Rating: ratingInput,
Review: reviewText,
YouTube: youtubeLink,
Press: pressLink,

82
Blog: blogLink
}
};
// Insert user input into new row in related table
var eventInfoRelatedTable = new FeatureLayer("http://msgis-
webdev-
1.spatial.redlands.edu/arcgis/rest/services/numa_gremling/ALOT_FinalFil
es/FeatureServer/4");
eventInfoRelatedTable.applyEdits([comments], null, null,
function (addResults) {
alert("Updated successfully");
}, function (err) {
alert(err);
}
);
});
}
//---------------------
//-- Extra Functions --
//---------------------
// --- Erases Content of an Input Box ---
function eraseOnFocus(target){
target.value= "";
}
// --- Toggle Basemap when Clicking Button ---
// run jQuery when all elements in document are loaded
jQuery(document).ready(function($) {
// change basemap button text when clicked
$("#basemapBTN").click(function() {
var isTopo = $("#mapToggler").attr('istopo');
if(isTopo == 'true'){
var mapToggler =
$("#mapToggler").attr('src','http://www.arcgis.com/sharing/rest/content
/items/6e03e8c26aad4b9c92a87c1063ddb0e3/info/thumbnail/topo_map_2.jpg')
;
$("#mapToggler").attr('istopo','false');
}
else {
var mapToggler =
$("#mapToggler").attr('src','http://www.arcgis.com/sharing/rest/content
/items/86de95d4e0244cba80f0fa2c9403a7b2/info/thumbnail/tempimagery.jpg'
);
$("#mapToggler").attr('istopo','true');
}
});
});
</script>
<body class="claro">
<div id="borderContainer" data-dojo-type="dijit/layout/BorderContainer"
data-dojo-props="design: 'headline', gutters: true,
liveSplitters:true">
<div id="leftPane" data-dojo-type="dijit/layout/ContentPane" data-dojo-
props="splitter:true,region: 'left'">
<div id="header" data-dojo-props="region:'top'" data-dojo-
type="dijit/layout/ContentPane">

83
<div id="title">
<strong><a href="http://alotlongbeach.org/" target="_blank">A LOT
Initiative Map</a></strong>
</div>
</div>
<div id="accordionPane" data-dojo-
type="dijit/layout/AccordionContainer">
<div data-dojo-type="dijit/layout/ContentPane" data-dojo-
props="title:'<b>Welcome</b>', selected:true">
<br/><img src="https://fbcdn-profile-a.akamaihd.net/hprofile-ak-
prn1/50274_193486445315_2111537936_n.jpg" alt="ACLB Logo">
</div>
<div data-dojo-type="dijit/layout/ContentPane" id="northParcelPane"
data-dojo-props="title:'<b>North Parcel Schedule</b>'">
<div id="northSchedGridDIV"></div>
</div>
<div data-dojo-type="dijit/layout/ContentPane" id="centralParcelPane"
data-dojo-props="title:'<b>Central Parcel Schedule</b>',
selected:true">
<div id="centralSchedGridDIV"></div>
</div>
<div data-dojo-type="dijit/layout/ContentPane" id="downtownParcelPane"
data-dojo-props="title:'<b>Downtown Parcel Schedule</b>',
selected:true">
<div id="downtownSchedGridDIV"></div>
</div>
<div data-dojo-type="dijit/layout/ContentPane" data-dojo-
props="title:'<b>Query Database</b>', selected:true">
<div id="queryDIV">
Select a parcel name to launch a search:
<form>
<input id="northRB" type="radio" name="parcelCB"> North<br>
<input id="centralRB" type="radio" name="parcelCB"> Central<br>
<input id="downtownRB" type="radio" name="parcelCB"> Downtown<br>
</form>
<br>
Or select an event:
<br>
<form>
<select id="eventID" name="locationsDropDown1" class="dropdownInput">
<option value="A LOT General">A LOT General</option>
<option value="Angela Willcocks">Angela Willcocks</option>
<option value="Angkor Dance">Angkor Dance</option>
<option value="Carlos Ramirez">Carlos Ramirez</option>
<option value="Cornerstone">Cornerstone</option>
<option value="CSULB Dance">CSULB Dance</option>
<option value="Cyrus and Terry">Cyrus and Terry</option>
<option value="Donna Sternberg">Donna Sternberg</option>
<option value="JAM Session">JAM Session</option>
<option value="Jazz Angels">Jazz Angels</option>
<option value="Joshua Cain Madrid">Joshua Cain Madrid</option>
<option value="Katina Mitchell">Katina Mitchell</option>

84
<option value="Lisa Desmidt">Lisa Desmidt</option>
<option value="Long Beach Opera">Long Beach Opera</option>
<option value="Long Beach Playhouse">Long Beach Playhouse</option>
<option value="McLean Fahnestock">McLean Fahnestock</option>
<option value="P.O.P. Price">P.O.P. Price</option>
<option value="Pony Box Dance">Pony Box Dance</option>
<option value="Portable Potholes">Portable Potholes</option>
<option value="Regina">Regina</option>
<option value="Toaster Music">Toaster Music</option>
<option value="Wikigong">Wikigong</option>
<option value="Other">Other</option>
</select>
</form>
</div>
</div>
<div data-dojo-type="dijit/layout/ContentPane" data-dojo-
props="title:'<b>Submit Information</b>', selected:true">
Help us evaluate A LOT Initiative events by sharing your personal
<b>reviews</b> and <b>ratings</b>.
Or did you find a <b>video</b>, a good news <b>article</b>, or an
interesting <b>blog post</b>?
If so, please share it with us.<br /><br />
<b>Lot</b>
<form>
<select id="locationInputID" name="locationsDropDown2"
class="dropdownInput">
<option value="North">North</option>
<option value="Central">Central</option>
<option value="Downtown">Downtown</option>
</select>
</form><br>
<b>Event</b>
<form>
<select id="eventInputID" name="eventsDropDown" class="dropdownInput">
<option value="A LOT General">A LOT General</option>
<option value="Angela Willcocks">Angela Willcocks</option>
<option value="Angkor Dance">Angkor Dance</option>
<option value="Carlos Ramirez">Carlos Ramirez</option>
<option value="Cornerstone">Cornerstone</option>
<option value="CSULB Dance">CSULB Dance</option>
<option value="Cyrus and Terry">Cyrus and Terry</option>
<option value="Donna Sternberg">Donna Sternberg</option>
<option value="JAM Session">JAM Session</option>
<option value="Jazz Angels">Jazz Angels</option>
<option value="Joshua Cain Madrid">Joshua Cain Madrid</option>
<option value="Katina Mitchell">Katina Mitchell</option>
<option value="Lisa Desmidt">Lisa Desmidt</option>
<option value="Long Beach Opera">Long Beach Opera</option>
<option value="Long Beach Playhouse">Long Beach Playhouse</option>
<option value="McLean Fahnestock">McLean Fahnestock</option>
<option value="P.O.P. Price">P.O.P. Price</option>
<option value="Pony Box Dance">Pony Box Dance</option>
<option value="Portable Potholes">Portable Potholes</option>
<option value="Regina">Regina</option>
<option value="Toaster Music">Toaster Music</option>
<option value="Wikigong">Wikigong</option>
<option value="Other">Other</option>

85
</select>
</form><br>
<b>Date</b>
<form>
<select id="dateInputID" name="datesDropDown" class="dropdownInput">
<option value="September 7">September 7</option>
<option value="September 20">September 20</option>
<option value="September 21">September 21</option>
<option value="September 22">September 22</option>
<option value="September 28">September 28</option>
<option value="October 5">October 5</option>
<option value="October 12">October 12</option>
<option value="October 20">October 20</option>
<option value="October 26">October 26</option>
<option value="Other">Other</option>
</select>
</form><br>
<b>Rating</b>
<form>
<select id="ratingInputID" name="ratingDropDown" class="dropdownInput">
<option value="1">1 - Terrible</option>
<option value="2">2 - </option>
<option value="3" selected>3 - OK</option>
<option value="4">4</option>
<option value="5">5 - Amazing</option>
</select>
</form><br>
<b>Review</b><br>
<textarea name="" id="reviewInputID" class="boxInput"
onfocus="eraseOnFocus(this)">Please limit your review to 250
characters...</textarea><br><br>
<b>YouTube</b><br>
<input type="text" id="youtubeInputID" class="boxInput"
value="http://"><br><br>
<b>Press</b><br>
<input type="text" id="pressInputID" class="boxInput"
value="http://"><br><br>
<b>Blog</b><br>
<input type="text" id="blogInputID" class="boxInput"
value="http://"><br><br>
<button type="button" id="SubmitAllBTN"
onclick='updateRelatedTable()'>Submit Information</button>
</div>
</div>
</div>
<div id="rightPane" data-dojo-type="dijit/layout/ContentPane" data-
dojo-props="splitter:true,region: 'center'">
<div data-dojo-type="dijit/layout/BorderContainer">
<div id="mapDiv" data-dojo-type="dijit/layout/ContentPane" data-dojo-
props="region: 'center'">
<div id="userLocDIV"></div>
<div id="parcelZoomDropdownDIV"></div>
<div id="basemapBTN"><img id="mapToggler" istopo="true" height="68"
width="100"

86
src='http://www.arcgis.com/sharing/rest/content/items/86de95d4e0244cba8
0f0fa2c9403a7b2/info/thumbnail/tempimagery.jpg'/></div>
<div id="addressFindDIV"></div>
</div>
<div id="bottomPane" data-dojo-type="dijit/layout/ContentPane" data-
dojo-props="region:'bottom'">
<div id="bottomGridDIV"></div>
</div>
</div>
</div>
</div>
</body>
</html>

87
Appendix B. Twitter Search Tool Code
#----------------------------------------------------------------------
# The TwitterSearch Library was downloaded from GitHub
# Documentation:
https://twittersearch.readthedocs.org/en/latest/basic_usage.html
# https://dev.twitter.com/docs
#----------------------------------------------------------------------
# Import libraries
from TwitterSearch import *
import datetime
import time
import arcpy
from arcpy import env
from arcpy.sa import *
# Make sure Spatial Analyst is enabled
arcpy.CheckOutExtension("Spatial")
# Overwrite Output
arcpy.env.overwriteOutput = True
# Get date of when the script is run
runDate = str(datetime.date.today()) # get date when script was run
runTime = str(time.strftime("%H:%M:%S")) # get time when script was run
(24 hour format)
scriptRun = runDate + " " + runTime
arcpy.AddMessage("Script run on: " + str(scriptRun))
arcpy.AddMessage("-----------------")
# The parameters as specified by the user
keywords = arcpy.GetParameterAsText(0)
pageCount = arcpy.GetParameterAsText(1)
year = arcpy.GetParameterAsText(2)
month = arcpy.GetParameterAsText(3)
day = arcpy.GetParameterAsText(4)
inputDatabase = arcpy.GetParameterAsText(5)
outputTable = str(arcpy.GetParameterAsText(6))
outputPathPoints = arcpy.GetParameterAsText(7)
outputPathKernel = arcpy.GetParameterAsText(8)
kernelUnits = arcpy.GetParameterAsText(9)
kernelCell = arcpy.GetParameterAsText(10)
arcpy.AddMessage("-----------")
arcpy.AddMessage("You searched: " + str(keywords))
arcpy.AddMessage(" 1) Parameters Set")
#Create new table
newTable = arcpy.CreateTable_management(inputDatabase, outputTable)
# Add fields to the table
arcpy.AddField_management(newTable, "Username", "TEXT", 15)
arcpy.AddField_management(newTable, "Time", "TEXT", 21)
arcpy.AddField_management(newTable, "Coordinates", "TEXT", 50)

88
arcpy.AddField_management(newTable, "Latitude", "FLOAT")
arcpy.AddField_management(newTable, "Longitude", "FLOAT")
arcpy.AddField_management(newTable, "Tweet", "TEXT", 201)
arcpy.AddMessage(" 2) Table Created")
# Create a cursors to change tables
cursorTweets = arcpy.da.InsertCursor(newTable, ("Username", "Time",
"Coordinates", "Latitude", "Longitude", "Tweet"))
cursorSummary =
arcpy.da.InsertCursor("E:\Redlands\MIP\Files\Twitter.gdb\TwitterSummary
", ("RunOn", "Returns", "Keywords"))
# Initiatlize counters
tweetCount = 0
coordinatesYES = 0
coordinatesNO = 0
arcpy.AddMessage(" 3) Cursor Created")
# start an edit session
editSession = arcpy.da.Editor(inputDatabase)
# start editing
editSession.startEditing()
# start an operation
editSession.startOperation()
try:
# create a TwitterSearchOrder object
searchOrder = TwitterSearchOrder()
# enter keyword here
searchOrder.setKeywords([keywords])
# only return 2 pages
searchOrder.setCount(int(pageCount))
# and don't give all entity information
searchOrder.setIncludeEntities(False)
# set language
searchOrder.setLanguage('en')
# retrieve most recent tweets
searchOrder.setResultType('recent')
searchOrder.setUntil(datetime.date(int(year), int(month),
int(day)))
arcpy.AddMessage(" 4) Search Order Set")
# --- Create a Twitter Search API Object --- #
# each part of the TwitterSearch object is copied from a Twitter
Application account from the Twitter Developer Site
# these keys should not be shared with the public, and therefore have
been removed
ts = TwitterSearch(
consumer_key = 'REMOVED',
consumer_secret = 'REMOVED',
access_token = 'REMOVED',
access_token_secret = 'REMOVED'
)
arcpy.AddMessage(" 5) Search Object Created")
arcpy.AddMessage(" Writing tweets to database...")
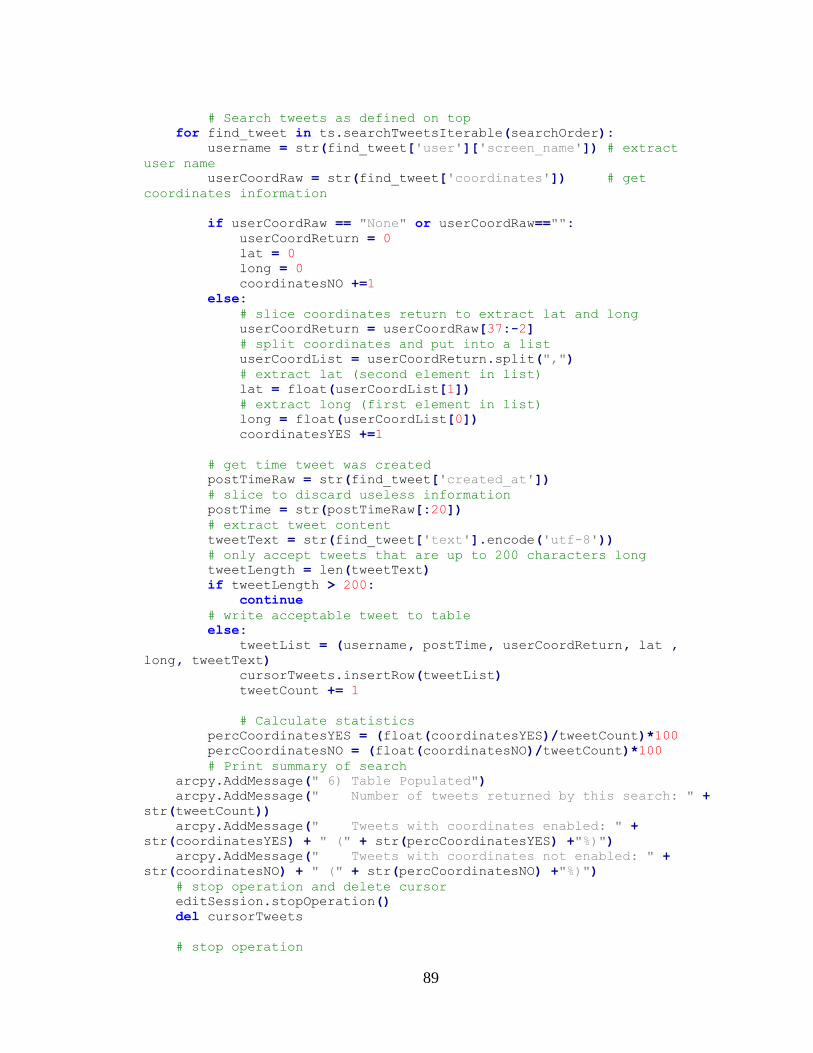
89
# Search tweets as defined on top
for find_tweet in ts.searchTweetsIterable(searchOrder):
username = str(find_tweet['user']['screen_name']) # extract
user name
userCoordRaw = str(find_tweet['coordinates']) # get
coordinates information
if userCoordRaw == "None" or userCoordRaw=="":
userCoordReturn = 0
lat = 0
long = 0
coordinatesNO +=1
else:
# slice coordinates return to extract lat and long
userCoordReturn = userCoordRaw[37:-2]
# split coordinates and put into a list
userCoordList = userCoordReturn.split(",")
# extract lat (second element in list)
lat = float(userCoordList[1])
# extract long (first element in list)
long = float(userCoordList[0])
coordinatesYES +=1
# get time tweet was created
postTimeRaw = str(find_tweet['created_at'])
# slice to discard useless information
postTime = str(postTimeRaw[:20])
# extract tweet content
tweetText = str(find_tweet['text'].encode('utf-8'))
# only accept tweets that are up to 200 characters long
tweetLength = len(tweetText)
if tweetLength > 200:
continue
# write acceptable tweet to table
else:
tweetList = (username, postTime, userCoordReturn, lat ,
long, tweetText)
cursorTweets.insertRow(tweetList)
tweetCount += 1
# Calculate statistics
percCoordinatesYES = (float(coordinatesYES)/tweetCount)*100
percCoordinatesNO = (float(coordinatesNO)/tweetCount)*100
# Print summary of search
arcpy.AddMessage(" 6) Table Populated")
arcpy.AddMessage(" Number of tweets returned by this search: " +
str(tweetCount))
arcpy.AddMessage(" Tweets with coordinates enabled: " +
str(coordinatesYES) + " (" + str(percCoordinatesYES) +"%)")
arcpy.AddMessage(" Tweets with coordinates not enabled: " +
str(coordinatesNO) + " (" + str(percCoordinatesNO) +"%)")
# stop operation and delete cursor
editSession.stopOperation()
del cursorTweets
# stop operation

90
editSession.startOperation()
# Update Summary Table
summaryList = (scriptRun, tweetCount, keywords)
cursorSummary.insertRow(summaryList)
# stop operation, delete cursor, stop editing
editSession.stopOperation()
del cursorSummary
editSession.stopEditing(True)
arcpy.AddMessage(" 7) Summary Table Updated")
# Create temporary point layer with available coordinates
# Define input parameters
inputTable = newTable
xLong = "Longitude"
yLat = "Latitude"
outputLayer = "tweet_pts"
# Create layer with above inputs
arcpy.MakeXYEventLayer_management(inputTable, xLong, yLat,
outputLayer)
arcpy.AddMessage(" 8) Event Layer Created")
# Save the event layer as a feature class
arcpy.FeatureToPoint_management(outputLayer, outputPathPoints)
newFeatureClass = outputPathPoints # put feature class into
variable to set projection
print("---------------------")
print("Feature Class Created")
arcpy.AddMessage(" 9) Point Feature Class Created")
#Define projection of point feature class
# The WKID 4326 refers to GCS_WGS_1984
spatialRefDef = arcpy.SpatialReference(4326)
arcpy.DefineProjection_management(newFeatureClass, spatialRefDef)
print("Projection Defined")
arcpy.AddMessage("10) Projection Defined")
# Project feature class
# The WKID 54030 refers to Robinson
spatialRefPrj = arcpy.SpatialReference(54030)
outFc = str(newFeatureClass) + "_prj"
outRename = newFeatureClass
prjFc = arcpy.Project_management(newFeatureClass, outFc,
spatialRefPrj)
arcpy.AddMessage("11) Projected")
# Select rows that do not have a location
# First make a temporary feature layer
arcpy.MakeFeatureLayer_management(prjFc, "tempLayer")
# Select rows using the temporary layer
# Select features with latitude and longitude of 0
arcpy.SelectLayerByAttribute_management("tempLayer","NEW_SELECTION",'"L
atitude" = 0 and "Longitude" = 0')
# Delete selected rows
if int(arcpy.GetCount_management("tempLayer").getOutput(0)) > 0:
arcpy.DeleteRows_management("tempLayer")
# Calculate Kernel Density

91
# Define input parameters
inPoints = outFc
populationField = "NONE"
cellSize = float(kernelCell)
# Run Kernel Density
tweetKernel = arcpy.sa.KernelDensity(inPoints, populationField,
cellSize, area_unit_scale_factor = str(kernelUnits))
# Save Kernel Density
tweetKernel.save(str(outputPathKernel))
print("Kernel Density Created")
arcpy.AddMessage("11) Kernel Density Created")
# Deal with exceptions
except TwitterSearchException as e:
print(e)
arcpy.AddMessage("-----------")
arcpy.AddMessage(e)
arcpy.AddMessage("-----------")
arcpy.AddMessage("Script Finished Running")
arcpy.AddMessage("-----------")