University of Groningen Computerized adaptive testing in primary ...
183
University of Groningen Computerized adaptive testing in primary care: CATja van Bebber, Jan IMPORTANT NOTE: You are advised to consult the publisher's version (publisher's PDF) if you wish to cite from it. Please check the document version below. Document Version Publisher's PDF, also known as Version of record Publication date: 2018 Link to publication in University of Groningen/UMCG research database Citation for published version (APA): van Bebber, J. (2018). Computerized adaptive testing in primary care: CATja. University of Groningen. Copyright Other than for strictly personal use, it is not permitted to download or to forward/distribute the text or part of it without the consent of the author(s) and/or copyright holder(s), unless the work is under an open content license (like Creative Commons). The publication may also be distributed here under the terms of Article 25fa of the Dutch Copyright Act, indicated by the “Taverne” license. More information can be found on the University of Groningen website: https://www.rug.nl/library/open-access/self-archiving-pure/taverne- amendment. Take-down policy If you believe that this document breaches copyright please contact us providing details, and we will remove access to the work immediately and investigate your claim. Downloaded from the University of Groningen/UMCG research database (Pure): http://www.rug.nl/research/portal. For technical reasons the number of authors shown on this cover page is limited to 10 maximum. Download date: 08-01-2022
-
Upload
khangminh22 -
Category
Documents
-
view
3 -
download
0
Transcript of University of Groningen Computerized adaptive testing in primary ...

University of Groningen
Computerized adaptive testing in primary care: CATjavan Bebber, Jan
IMPORTANT NOTE: You are advised to consult the publisher's version (publisher's PDF) if you wish to cite fromit. Please check the document version below.
Document VersionPublisher's PDF, also known as Version of record
Publication date:2018
Link to publication in University of Groningen/UMCG research database
Citation for published version (APA):van Bebber, J. (2018). Computerized adaptive testing in primary care: CATja. University of Groningen.
CopyrightOther than for strictly personal use, it is not permitted to download or to forward/distribute the text or part of it without the consent of theauthor(s) and/or copyright holder(s), unless the work is under an open content license (like Creative Commons).
The publication may also be distributed here under the terms of Article 25fa of the Dutch Copyright Act, indicated by the “Taverne” license.More information can be found on the University of Groningen website: https://www.rug.nl/library/open-access/self-archiving-pure/taverne-amendment.
Take-down policyIf you believe that this document breaches copyright please contact us providing details, and we will remove access to the work immediatelyand investigate your claim.
Downloaded from the University of Groningen/UMCG research database (Pure): http://www.rug.nl/research/portal. For technical reasons thenumber of authors shown on this cover page is limited to 10 maximum.
Download date: 08-01-2022

523226-L-bw-Bebber523226-L-bw-Bebber523226-L-bw-Bebber523226-L-bw-BebberProcessed on: 27-8-2018Processed on: 27-8-2018Processed on: 27-8-2018Processed on: 27-8-2018 PDF page: 1PDF page: 1PDF page: 1PDF page: 1
Computerized adaptive testing in primary care: CATja
Jan van Bebber

523226-L-bw-Bebber523226-L-bw-Bebber523226-L-bw-Bebber523226-L-bw-BebberProcessed on: 27-8-2018Processed on: 27-8-2018Processed on: 27-8-2018Processed on: 27-8-2018 PDF page: 2PDF page: 2PDF page: 2PDF page: 2
The research presented in this thesis was funded by the Friesland Mental Health
Services (GGZ Friesland).
All rights reserved. No part of this publication may be reproduced or transmitted
in any form by any means, without permission of the author.
ISBN: 978-94-034-0914-6 (print version)
ISBN: 978-94-034-0913-9 (electronic version)
„Ach,“ sagte die Maus, „die Welt wird enger mit jedem Tag. Zuerst war sie so breit, dass ich Angst hatte,
ich lief weiter und war glücklich, dass ich endlich rechts und links in der Ferne Mauern sah, aber diese
langen Mauern eilen so schnell aufeinander zu, dass ich schon im letzten Zimmer bin, und dort im Winkel
steht die Falle, in die ich laufe.“ – „Du musst nur die Laufrichtung ändern,“ sagte die Katze und fraß sie.
(Die Kleine Fabel, Frank Kafka)1
1 With kind permission of Elena Moreno Sobrino, Calambac Verlag. Franz Kafka: Kleine Fabel. Graphic Novel. Illustriert von Elvira Calderón nach Vorlagen von José Guadalupe Posada. Dreisprachige Ausgabe: Deutsch/Englisch/Spanisch. ISBN 978-3-943117-79-0, S. 26.

523226-L-bw-Bebber523226-L-bw-Bebber523226-L-bw-Bebber523226-L-bw-BebberProcessed on: 27-8-2018Processed on: 27-8-2018Processed on: 27-8-2018Processed on: 27-8-2018 PDF page: 3PDF page: 3PDF page: 3PDF page: 3
Computerized adaptive testing in primary care: CATja
PhD thesis
to obtain the degree of PhD at the
University of Groningen
on the authority of the
Rector Magnificus Prof. E. Sterken
and in accordance with
the decision by the College of Deans.
This thesis will be defended in public on
24 September 2018 at 09.00
by
Jan van Bebber
born on 24.03.1979
in Xanten, Germany

523226-L-bw-Bebber523226-L-bw-Bebber523226-L-bw-Bebber523226-L-bw-BebberProcessed on: 27-8-2018Processed on: 27-8-2018Processed on: 27-8-2018Processed on: 27-8-2018 PDF page: 4PDF page: 4PDF page: 4PDF page: 4
Supervisors
Promotor
Prof. dr. R. R. Meijer
Copromotores
Dr. A. Wunderink
Dr. J.T.W. Wigman
Assessment committee
Prof. Dr. M. Y. Berger
Prof. Dr. R. Schoevers
Prof. dr. B. Veldkamp

523226-L-bw-Bebber523226-L-bw-Bebber523226-L-bw-Bebber523226-L-bw-BebberProcessed on: 27-8-2018Processed on: 27-8-2018Processed on: 27-8-2018Processed on: 27-8-2018 PDF page: 5PDF page: 5PDF page: 5PDF page: 5
Musipals
Amon Adonai Santos de Araújo Tobin (aka Amon Tobin, Cujo, & Two Fingers),
Vaughn Robert Squire (aka Sixtoo),
Simon Green (aka Bonobo),
Daniel Dumile (aka MF Doom),
Rio Reiser (Ton Steine Scherben),
Jason Swinscoe (The Cinematic Orchetra),
Joshua Paul Davis (aka DJ Shadow),
Hideaki Ishi (aka DJ Krush),
Kieran Hebden (aka Four Tet),
Matt Black and Jonathan More (aka Coldcut),
Ed Kowalczyk (Live),
Smudo & Thomas D,
Mike Lévy (aka Gesaffelstein),
Eddie Vedder,
Mike Skinner (The Streets),
Jack White,
James Di Salvio (Bran van 3000),
Otis Jackson Jr. (aka Madlib),
Jimmy Hendrix,
Jon Hokins,
Crispian Mills (Kula Shaker),
Robert Plant,
Lou Rhodes (Lamb),
Leonard Cohen,
José Padilla (Café del Mar).
Keith Caputo (Life of Agony),
Lewis Allan Reed (aka Lou Reed),
Robert Del Naja (Massive Attack),

523226-L-bw-Bebber523226-L-bw-Bebber523226-L-bw-Bebber523226-L-bw-BebberProcessed on: 27-8-2018Processed on: 27-8-2018Processed on: 27-8-2018Processed on: 27-8-2018 PDF page: 6PDF page: 6PDF page: 6PDF page: 6
Sascha Ring (aka Apparat),
Andrew Carthy (aka Mr Scruff),
Mykel Paul,
Justin Sullivan (New Model Army),
Nils Petter Molvær,
Mike Patton (Faith No More),
Vadim Peare (aka DJ Vadim & One Self),
José-Manuel Thomas Arthur Chao (Manu Chao & Mano Negra),
Beth Gibbons (Portishead),
Roger Waters (Pink Floyd),
Bobby Gillespie (Primal Scream),
Tom Yorke,
Ali Friend (Red Snapper),
Rodney Hylton Smith (Roots Manuva),
Saul Stacey Williams,
Bradley Nowell (Sublime),
Jeff Keith (Tesla),
Chris Robinson (The Black Crowes),
Tom Rowlands and Ed Simons (The Chemical Brothers),
Liam Howlett (The Prodigy),
Jake Wherry & Ollie Teeba (The Herbalizer),
Billy Corgan (The Smashing Pumpkins),
Karl Hyde & Rick Smith (Underworld),
Philippe Cohen Solal (GoTan project),
and all the other ninjas out there.

523226-L-bw-Bebber523226-L-bw-Bebber523226-L-bw-Bebber523226-L-bw-BebberProcessed on: 27-8-2018Processed on: 27-8-2018Processed on: 27-8-2018Processed on: 27-8-2018 PDF page: 7PDF page: 7PDF page: 7PDF page: 7
Contents
Chapter 1 ........................................................................................................................................... 1
Introduction ....................................................................................................................................... 1
1.1 Recent developments in western mental health care ........................................................................ 1
1.2 The mental health care system in the Netherlands ............................................................................ 2
1.3 Notification, recognition of mental illnesses, and treatment outcome .............................................. 3
1.4 Rationale for this thesis and the relation to existing eHealth diagnostic tools .................................. 3
1.5 Description of the online test battery CATja ....................................................................................... 4
1.6 Technical details CATja ........................................................................................................................ 7
1.7 Outline thesis ....................................................................................................................................... 7
1.8 References ........................................................................................................................................... 8
Chapter 2 ......................................................................................................................................... 13
The Prodromal Questionnaire: a case for IRT-based adaptive testing of psychotic experiences? ......... 13
2.1 Introduction ....................................................................................................................................... 14
2.1.1 At risk for psychosis .................................................................................................................... 14
2.1.2 The Prodromal Questionnaire .................................................................................................... 15
2.1.3 Computerized Adaptive Testing (CAT) and Item Response Theory (IRT) ................................... 15
2.1.4 Aims of this study ....................................................................................................................... 16
2.2 Methods ............................................................................................................................................ 16
2.2.1 Data collection design ................................................................................................................ 16
2.2.2 The two-parameter logistic model (2-PL) and its assumptions .................................................. 18
2.2.3 Model fit 2-PL and Local Dependence (LD) ................................................................................ 19
2.2.4 Differential item functioning (DIF) ............................................................................................. 19
2.2.5 Simulation of CAT-properties based on item parameters and observed response patterns: RDS ............................................................................................................................................................. 19
2.2.6 Criterion Validity ......................................................................................................................... 20
2.2.7 Instruments ................................................................................................................................ 20
2.2.8 Predictive Validity ....................................................................................................................... 21
2.3 Results ............................................................................................................................................... 21
2.3.1 Model fit 2-PL and Local Dependence ........................................................................................ 21
2.3.2 Differential Item Functioning (DIF) ............................................................................................. 23

523226-L-bw-Bebber523226-L-bw-Bebber523226-L-bw-Bebber523226-L-bw-BebberProcessed on: 27-8-2018Processed on: 27-8-2018Processed on: 27-8-2018Processed on: 27-8-2018 PDF page: 8PDF page: 8PDF page: 8PDF page: 8
2.3.3 Real Data Simulations ................................................................................................................. 23
2.3.4 Criterion Validity ......................................................................................................................... 24
2.3.4 Predictive Validity ....................................................................................................................... 25
2.4 Discussion .......................................................................................................................................... 26
2.5 Appendix ............................................................................................................................................ 28
2.5.1 Model fit revisited ...................................................................................................................... 28
2.5.2 Settings for Real Data Simulations in Firestar ............................................................................ 28
2.5.3 Usage of IRT-scores in linear models .......................................................................................... 28
2.5.4 A brief introduction to the CAT operation procedure ................................................................ 36
2.6 References ......................................................................................................................................... 37
Chapter 3 ......................................................................................................................................... 43
Identifying levels of general distress in first line mental health services: Can GP- and eHealth clients’ scores be meaningfully compared? ................................................................................................... 43
3.1 Introduction ....................................................................................................................................... 44
3.1.1 Background ................................................................................................................................. 44
3.1.2 Aims of this study ....................................................................................................................... 45
3.2 Methods ............................................................................................................................................ 46
3.2.1 The Four-Dimensional Symptom Questionnaire (4DSQ): background information and existing research ............................................................................................................................................... 46
3.2.2. Participants ................................................................................................................................ 47
3.2.3 The Generalized Partial Credit Model (GPCM) ........................................................................... 47
3.2.4 Differential Item Functioning (DIF) and Multiple Group IRT analysis (MGIRT) .......................... 48
3.2.5 MGIRT Analyses .......................................................................................................................... 49
3.3 Results ............................................................................................................................................... 50
3.3.1 Sample Descriptives for both groups ......................................................................................... 50
3.3.2 IRT-analyses: GP clients .............................................................................................................. 51
3.3.3 IRT-analyses: EHealth clients ...................................................................................................... 53
3.3.4 Differential Item Functioning (DIF) ............................................................................................. 53
3.3.5 Summary..................................................................................................................................... 56
3.4 Discussion .......................................................................................................................................... 57
3.4.1 Main findings .............................................................................................................................. 57
3.4.2 Strengths, limitations and future research ................................................................................ 57
3.5 Appendix ............................................................................................................................................ 59

523226-L-bw-Bebber523226-L-bw-Bebber523226-L-bw-Bebber523226-L-bw-BebberProcessed on: 27-8-2018Processed on: 27-8-2018Processed on: 27-8-2018Processed on: 27-8-2018 PDF page: 9PDF page: 9PDF page: 9PDF page: 9
3.5.1 Technical information on the GPCM .......................................................................................... 60
3.5.2 Technical details DIF tests .......................................................................................................... 62
3.5.3 Detailed information on MGIRT analyses................................................................................... 62
3.6 References ......................................................................................................................................... 62
Chapter 4 ......................................................................................................................................... 67
Searching for the optimal number of response alternatives for the distress scale of the Four-Dimensional Symptom Questionnaire ............................................................................................... 67
4.1 Introduction ....................................................................................................................................... 68
4.1.1 The Four-Dimensional Symptom Questionnaire (4DSQ) ............................................................ 68
4.1.2 Optimal number of response alternatives: Existing research .................................................... 68
4.1.3 Aims of this study ....................................................................................................................... 70
4.2 Methods ............................................................................................................................................ 70
4.2.1 Participants ................................................................................................................................. 70
4.2.2 Instruments ................................................................................................................................ 71
4.2.3 Item response theory ................................................................................................................. 72
4.2.4 Statistical analyses ...................................................................................................................... 74
4.3 Results ............................................................................................................................................... 75
4.3.1 Model fit and measurement precision ....................................................................................... 75
4.3.2 Convergent and discriminant validity ......................................................................................... 76
4.3.3 Predictive validity ....................................................................................................................... 77
4.4 Discussion .......................................................................................................................................... 78
4.4.1 Main findings and conclusions ................................................................................................... 78
4.4.2 Strengths and limitations ........................................................................................................... 79
4.4.3 Directions for future research .................................................................................................... 79
4.5 Appendix ............................................................................................................................................ 80
4.6 References ......................................................................................................................................... 83
Chapter 5 .........................................................................................................................................
Application of the Patient-Reported Outcomes Measurement Information System (PROMIS) item parameters for Anxiety and Depression in the Netherlands ...............................................................
5.1 Introduction ....................................................................................................................................... 9
5.1.1 The Patient-Reported Outcomes Measurement Information System ....................................... 9
5.1.2 Aims of this study ....................................................................................................................... 9

523226-L-bw-Bebber523226-L-bw-Bebber523226-L-bw-Bebber523226-L-bw-BebberProcessed on: 27-8-2018Processed on: 27-8-2018Processed on: 27-8-2018Processed on: 27-8-2018 PDF page: 10PDF page: 10PDF page: 10PDF page: 10
5.2 Methods ............................................................................................................................................ 9
5.2.1 Participants ................................................................................................................................. 9
5.2.2 Instruments ................................................................................................................................ 9
5.2.3 Statistical analyses: Fit of item parameters ............................................................................... 9
5.2.4 Statistical analyses: Real Data Simulations ................................................................................ 9
5.2.5 The latent distributions of anxiety and depression in the Dutch general and Dutch clinical population ........................................................................................................................................... 9
5.3 Results ............................................................................................................................................... 9
5.3.1 Fit item parameters for the PROMIS Anxiety item bank ............................................................ 9
5.3.2 Fit item parameters for the PROMIS Depression item bank ...................................................... 9
5.3.3 How serious is misfit for practical decisions? Results Real Data Simulations ............................ 9
5.3.4 The latent distributions of anxiety and depression in the U.S. general population, the Dutch general population, and the Dutch clinical population ..................................................................... 10
5.4 Discussion ........................................................................................................................................ 10
5.4.1 Summary of main findings ........................................................................................................ 10
5.4.2 Practical implications and recommendations .......................................................................... 10
5.4.3 Strengths and limitations ......................................................................................................... 10
5.4.4 Directions for future research .................................................................................................. 10
5.5 Appendix .......................................................................................................................................... 10
5.6 References ....................................................................................................................................... 10
Chapter 6 ....................................................................................................................................... 11
Predicting Relapse and Outcome in First Episode Psychosis: Impact of Negative Symptoms, and Personalized Low Dose versus Maintenance Antipsychotic Treatment ............................................. 11
6.1 Introduction ..................................................................................................................................... 11
6.2 Methods .......................................................................................................................................... 11
6.2.1 Subjects .................................................................................................................................... 11
6.2.2 Assessments and definitions .................................................................................................... 11
6.2.3 Statistical analyses .................................................................................................................... 11
6.3 Results ............................................................................................................................................. 11
6.3.1 Number of relapses and functional outcome .......................................................................... 11
6.3.2 Predicting relapse ..................................................................................................................... 11
6.3.3 Predicting functional outcome ................................................................................................. 1

523226-L-bw-Bebber523226-L-bw-Bebber523226-L-bw-Bebber523226-L-bw-BebberProcessed on: 27-8-2018Processed on: 27-8-2018Processed on: 27-8-2018Processed on: 27-8-2018 PDF page: 11PDF page: 11PDF page: 11PDF page: 11
6.3.4 Disentangling the effects of baseline negative symptoms and treatment strategy on relapse risk ..................................................................................................................................................... 1
6.4 Discussion ........................................................................................................................................ 12
6.4.1 Main findings ............................................................................................................................ 12
6.4.2 Our results in the light of existing literature and implications for treatment of FEP patients. 12
6.5 References ....................................................................................................................................... 12
Chapter 7 ....................................................................................................................................... 1
The development of a smart screening device for primary health care ............................................. 1
7.1 Introduction ..................................................................................................................................... 13
7.1.1 Background ............................................................................................................................... 13
7.1.2 Aims of this study ..................................................................................................................... 13
7.2 Methods .......................................................................................................................................... 13
7.2.1 Developmental approach ......................................................................................................... 13
7.2.2 Computerized adaptive testing (CAT) ...................................................................................... 13
7.2.3 Content of the alpha version of CATja ..................................................................................... 13
7.2.4 Sample characteristics .............................................................................................................. 13
7.2.5 Statistical analyses .................................................................................................................... 13
7.3 Results ............................................................................................................................................. 13
7.4 Discussion ........................................................................................................................................ 13
7.5 Appendix .......................................................................................................................................... 13
7.6 References ....................................................................................................................................... 13
Chapter 8 ....................................................................................................................................... 1
General Discussion ......................................................................................................................... 1
8.1 Main findings of this thesis .............................................................................................................. 1
8.2 Generalizability of research findings ............................................................................................... 14
8.2.1 Measurement invariance between application modes: GP clients/paper and pencil versus eHealth clients ................................................................................................................................... 14
8.2.2 Relevance of baseline negative symptoms for relapse prevention and long-term functional outcome ............................................................................................................................................ 14
8.3 Lessons learned ............................................................................................................................... 14
8.3.1 Evaluation of model fit and Differential Item Functioning ....................................................... 14
8.3.2 Never underestimate people’s resistance to change when implementing new tools............. 14

523226-L-bw-Bebber523226-L-bw-Bebber523226-L-bw-Bebber523226-L-bw-BebberProcessed on: 27-8-2018Processed on: 27-8-2018Processed on: 27-8-2018Processed on: 27-8-2018 PDF page: 12PDF page: 12PDF page: 12PDF page: 12
8.4 Limitations ....................................................................................................................................... 14
8.5 Future Research............................................................................................................................... 14
8.5.1 The incremental value of CATja: Improved placement and recovery? .................................... 14
8.5.2 Future research and improvements 4DSQ ............................................................................... 14
8.5.3 The intercorrelations of CATja’s domains of psychopathology and constructs of positive psychology ......................................................................................................................................... 14
8.6 The future of CATja.......................................................................................................................... 14
8.7 References ....................................................................................................................................... 1
Samenvatting ................................................................................................................................. 15
Dankwoord .................................................................................................................................... 16
Curriculum Vitae ............................................................................................................................ 16

523226-L-bw-Bebber523226-L-bw-Bebber523226-L-bw-Bebber523226-L-bw-BebberProcessed on: 27-8-2018Processed on: 27-8-2018Processed on: 27-8-2018Processed on: 27-8-2018 PDF page: 13PDF page: 13PDF page: 13PDF page: 13
1
Chapter 1
Introduction
1.1 Recent developments in western mental health care In 2005, the ministers of health of the member states in the European region of the World Health
Organization signed the Declaration of Helsinki (World Health Organization, 2005), wherein they
acknowledged that mental well-being is fundamental to the functioning of communities and nations:
“There is no health without mental health” (p. 3). They further proclaimed that “(…) many people with
mental health problems do not receive the treatment and care they need, despite the development of
effective interventions” (p. 1). To improve the situation, fifteen aims, actions, and responsibilities were
formulated. Two aspects that were mentioned repeatedly in the declaration of Helsinki are of special
interest for this dissertation. First, the recommendation that the role of general practitioners (GPs) in the
identification and treatment of mental health problems should be empowered (8.vi, 10.x). The choice for
GPs is only natural, because most people, who experience health problems, whether these are physical
or mental in nature, first contact their GP for help and assistance. Of secondary interest for this
dissertation is the advice that it should be made possible to assess mental health status in a way that
enables comparisons of research, both nationally and internationally (8.x, 8.xii & 13.ii).
Matching the level of provided care to the client’s or patient’s need for care is a difficult task
because many factors have to be balanced simultaneously. To name only a few, clients are driven by the
interest to get access to the best care available, but working hours of practitioners/clinicians are limited
and the interest of society is to keep care affordable. In order to reconcile these conflicting interests,
various models of care have been proposed. Optimal care refers to the situation in which specialists
manage patients for the entire duration of treatment. Although this approach may seem ideal, it is also
expensive. Furthermore, in case expert knowledge of more than one specialization is required (i.e. a
comorbid diagnosis), it becomes unclear who is in charge of deciding which treatments are to be
prioritized.

523226-L-bw-Bebber523226-L-bw-Bebber523226-L-bw-Bebber523226-L-bw-BebberProcessed on: 27-8-2018Processed on: 27-8-2018Processed on: 27-8-2018Processed on: 27-8-2018 PDF page: 14PDF page: 14PDF page: 14PDF page: 14
2
The British National Institute for Health and Care Excellence (NICE) reviewed existing research of
best available evidence and also takes cost effectiveness explicitly into account in order to formulate
evidence-based public health guidelines. Inspired by the declaration of Helsinki, NICE formulated
guidelines for the organization of mental health care services. NICE (Pilling, Whittington, Taylor,
Kendrick, & Guideline Development Group, 2011) advised a stepped model of care, that is, a system that
is “(...) self-correcting in that, although most patients are assigned to low-intensity interventions initially,
those failing to benefit are ‘stepped up’ to higher treatment intensity” (Richards et al., 2012), p. 2).
Slightly different is the stratified model (Lipton, Stewart, Stone, Láinez, & Sawyer, 2000), where “the
initial treatment is selected based on the patient`s treatment needs”. So, under the stratified model, a
case of high urgency and/or high severity is immediately referred to the highest treatment level (e.g.
specialized mental health care services), whereas under the stepped model, such a case would be first
tried to be treated at the lowest treatment level (e.g. GP), and would be ‘stepped up’ to higher levels of
treatment intensity in case of non-recovery.
1.2 The mental health care system in the Netherlands Since the governmental agreement “Toekomst Geestelijke Gezondheidszorg 2013-2014” (Future of
Mental Health Care 2013-2014, Ministerie van Volksgezondheid, Welzijn, en Sport, 2012), the structure
of mental health care in the Netherlands most closely resembles a stratified model with three levels of
treatment intensities. The lowest level of mental health care is provided in general practices. Dutch GPs
are now supported by mental health assistants (MHAs) who have a background in psychology,
psychiatric care, or social work. MHAs are capable of treating mild and/or stable mental problems, and
they have the contacts to link clients to social welfare agencies for housing, employment, and/or debt
counseling. In order to get access to either generalist or specialist mental health care providers (the
second and third level of treatment intensities), clients need a referral from their GP. MHAs advise GPs in
whether clients should be treated in the general practice, or whether they should be referred to either
generalist (medium level) or specialized (highest level) mental health care providers. As such, GPs
facilitated by MHAs fulfill the role of gatekeepers to the mental health care system in the Netherlands.
Although the term ‘triage’ originated in the context of emergencies (Robertson-Steel, 2006), nowadays,
it is used more broadly, and we use the term in this thesis to label the decision process just described.
Note that the pursuit to empower general practices (GPs as gatekeepers facilitated by MHAs who are
capable to treat many mental health problems themselves) in the management of mental health
problems is completely in line with what has been agreed upon in the declaration of Helsinki.

523226-L-bw-Bebber523226-L-bw-Bebber523226-L-bw-Bebber523226-L-bw-BebberProcessed on: 27-8-2018Processed on: 27-8-2018Processed on: 27-8-2018Processed on: 27-8-2018 PDF page: 15PDF page: 15PDF page: 15PDF page: 15
3
1.3 Notification, recognition of mental illnesses, and treatment outcome The use of psychological tests and questionnaires in the process of establishing preliminary diagnoses by
physicians has been labeled ‘notification’ (Higgins, 1994). Most studies find that notification improves
physicians’ ability to detect psychological disorders in their patients. Depending on inclusion criteria
handled by the authors of reviews written in the early nineties, the percentage of studies that do find a
positive effect of notification on recognition varies between 66% (Higgins, 1994) and 80% (Kroenke,
Taylor-Vaisey, Dietrich, & Oxman, 2000). One interesting finding in the literature on the effect of
notification in primary health care settings is that although most studies demonstrate that notification
improves recognition of disorders (Mathias et al., 1994; Moore, Silimperi, & Bobula, 1978; Zung, Magill,
Moore, & George, 1983) notification seems to have a positive effect on clinical outcomes only for severe
cases of illness (Johnstone & Goldberg, 1976). Nevertheless, the early recognition of severe diseases may
be particularly important to prevent further development of severe sequelae, bad outcomes and
complications, and thus promote better recovery.
1.4 Rationale for this thesis and the relation to existing eHealth diagnostic tools The construction of a smart, evidence-based screening device for use in primary care settings is the
central theme of this dissertation. In the past four years, we developed the software and build a system
that can be used to administer items that relate to different psychopathology domains and domains of
positive functioning (resilience) and thereby profile test takers. This device has been labeled CATja. The
core goal of this tool is to facilitate GPs and MHAs in deciding which patients experience various forms of
mental health problems in diverging intensities, and which treatment level (general practices, generalist-
or specialist mental health care) suits their clients best. Besides the construction of CATja (CATja is
described below), we performed research that was related to the original questionnaires and the
resulting item banks that are used in CATja. This research is discussed in chapters 2 through 6.
In the past three decades, many eHealth diagnostic tools have been developed. So why reinvent
the wheel? The first reason is that many tools that have been constructed are screening tools for only
one form of psychopathology, like depression (Spitzer, Kroenke, Williams, & Patient Health
Questionnaire Primary Care Study Group, 1999), alcohol abuse and dependence (Bradley et al., 2007), or
bipolar disorder (Das et al., 2005; Hirschfeld et al., 2000). The second reason is that, with exception of
the instruments developed under the PROMIS initiative (Cella et al., 2010), most screening tools are

523226-L-bw-Bebber523226-L-bw-Bebber523226-L-bw-Bebber523226-L-bw-BebberProcessed on: 27-8-2018Processed on: 27-8-2018Processed on: 27-8-2018Processed on: 27-8-2018 PDF page: 16PDF page: 16PDF page: 16PDF page: 16
4
inefficient in the sense that they are not adaptive. In practice, this means that there is an unnecessarily
burden on clients to respond to many items with a negative (psychopathological) content than actually
required to reach sufficient measurement precision. Third, many screening tools have rather been
developed for use in the general population, such as the Four-Dimensional Questionnaire (4DSQ; Terluin
et al., 2006) and are thus not adequate to scale more severe cases. A final reason is that most devices
have been developed without including the envisioned end users in the process of development, which
often resulted in low commitment of caregivers to actually implement the new devices in daily practice.
In the development, assessment, and improvement of CATja, these end users (i.e. MHAs) were explicitly
involved.
1.5 Description of the online test battery CATja Compared to some traditional paper and pencil tests and questionnaires, CATja has the advantage of
being more efficient in a number of ways. First, though not yet available in the alfa version of the
application, instructions on the goal of the test administration and on how to respond to the items can
be given routinely as the first step during the test session. Note that this feature also has the advantage
of standardization. That is, instructions do not vary across respondents, which might induce differential
responding across respondents. Second, all answers are scored automatically and also norm scores are
computed automatically, which is convenient for care providers and also safeguards against human
error. Third, reports that summarize the test results may be generated automatically and stored for later
use. Fourth, and most important, CATja utilizes the principle of computerized adaptive testing (CAT)
(Embretson & Reise, 2013; Meijer & Nering, 1999). In CAT, items that are presented to respondents are
tailored to responses given to previous items. With each consecutive item, an updated person score is
derived, and the item that increases measurement precision maximally for this score is utilized next. This
process usually continues until a predefined measurement precision is reached. In CATs, less items are
needed to derive reliable scores compared to assessments with traditional questionnaires. For an
introduction to the topics of IRT and CAT, see Embretson and Reise (2013).
In the alfa version of CATja, five psychopathology domains are available: Anxiety and Depression,
using the PROMIS item pools (Pilkonis et al., 2011), Positive and Negative symptoms of psychosis
(Bebber et al., 2017; Loewy, Bearden, Johnson, Raine, & Cannon, 2005), and a scale comprised of
aspecific symptoms of stress (van Bebber et al., 2017; Terluin et al., 2006). Additionally, MHAs can
measure the positive psychological constructs Companionship and Emotional support, also based on
PROMIS item pools (Hahn et al., 2010). The alfa version of CATja consisted of three interfaces. These will

523226-L-bw-Bebber523226-L-bw-Bebber523226-L-bw-Bebber523226-L-bw-BebberProcessed on: 27-8-2018Processed on: 27-8-2018Processed on: 27-8-2018Processed on: 27-8-2018 PDF page: 17PDF page: 17PDF page: 17PDF page: 17
5
be described below, but interested readers may try out CATja (Dutch version) themselves using the
hyperlink https://catja.roqua.nl/. In Figure 1.1, the session management interface is displayed on the left
side, the test administration interface in the middle, and the report interface is displayed on the right
side.
The session management interface. The MHA first has to enter the client’s email address, and their own
name and email address. Note that neither the client’s name nor address are requested in order to
protect the client’s privacy. In addition, the client’s email address is only used to send the invitation and
is deleted automatically afterwards. Next, the MHA selects the domains and constructs which they
consider relevant for the client. Note that for the PROMIS item pools, validated translations for most
European languages do exist, which allows for international meta-analyses and comparisons (points 8.x,
8.xii & 13.ii of the Declaration of Helsinki). In the example depicted in Figure 1, the MHA chose to
administer Positive symptoms of psychosis and Companionship. Then, an invitation is sent to the client
by email containing a hyperlink that leads to CATja’ s test administration interface. In this email, clients
are informed that some information on their demographic background will be requested, and that their
answers will be stored anonymously for research purposes.
The test administration interface. To illustrate the administration interface, in Figure 1 we depicted one
domain with dichotomous items (yes/no response format) and one domain with polytomous items (5-
point Likert scale). Clients can change answers given to earlier presented items. In that case, the client’s
score is updated using the altered response string, and the choice for the next item to be utilized is
based on the revised score. When finished, a report is automatically generated and sent to the MHA.
The report interface. In the report interface, first, concepts that are essential for correct interpretation
of the report are explained. That is, the norm groups, quartiles, and the meaning of certain quartiles for
psychopathology domains and positive psychological constructs are explained. This is done in order to
prevent confusion, because for all psychopathology domains, low scores (Q1/2) are desirable, whereas for
the positive psychological constructs, high scores (Q3/4) are desirable. The main part of the report is the
client’s profile of strengths and weaknesses. At the end of the report all items that have been
administered are displayed together with the response options that were chosen by the client.

523226-L-bw-Bebber523226-L-bw-Bebber523226-L-bw-Bebber523226-L-bw-BebberProcessed on: 27-8-2018Processed on: 27-8-2018Processed on: 27-8-2018Processed on: 27-8-2018 PDF page: 18PDF page: 18PDF page: 18PDF page: 18
6
Fi
gure
1.1
Fro
m le
ft to
righ
t: Th
e se
ssio
n m
anag
emen
t int
erfa
ce, t
he te
st a
dmin
istra
tion
inte
rfac
e, a
nd th
e re
port
inte
rfac
e.

523226-L-bw-Bebber523226-L-bw-Bebber523226-L-bw-Bebber523226-L-bw-BebberProcessed on: 27-8-2018Processed on: 27-8-2018Processed on: 27-8-2018Processed on: 27-8-2018 PDF page: 19PDF page: 19PDF page: 19PDF page: 19
7
1.6 Technical details CATja CATja has been programmed by the Roqua team. In particular, the interfaces by Tim Rasveld and
Arnold van der Meulen. All computations necessary for adaptive testing are performed in R (R Core
Team, 2014). Karel Kroeze and Alwin Steegman wrote Shadowcat, a software package to be run in R
that utilizes functions that were originally part of the R-package MCAT that was written by Karel
Kroese (University of Twente) and Bernard Veldkamp (University of Twente). Rivka de Vries (Roqua,
University of Groningen) further optimized Shadowcat and adapted it to the structure of CATja.
We do not further elaborate the technical details of CATja in this dissertation, but provide
only the most important facts here. In the alfa version of CATja, item selection is based on maximum
Fischer information, and the expected a posteriori (EAP) estimator is used for deriving person scores.
For each domain, a minimum of four items is always utilized, and more items are utilized until the
standard error of the person estimate falls below .45, a value that corresponds to a reliability of .80.
These default values may be changed, depending on the envisioned application of the test battery.
1.7 Outline thesis As stated above, central in this thesis is the development of a screening device to be used by GPs and
MHAs for people having psychological complaints. In the chapters of this thesis different research
projects are discussed that are related to the development of this screening device. In chapter 2, the
development of computerized adaptive test (CATs) for positive and negative symptom experiences of
psychoses based on the Prodromal Questionnaire (PQ; (Loewy et al., 2005) is described. In chapter 3,
we investigate whether the response behavior of GP clients and eHealth clients on the distress scale
of the 4DSQ is comparable, and whether the relationship between raw score metric and the latent
trait of distress is equivalent for both groups of respondents. In chapter 4, we investigate how many
response alternatives are optimal for the distress scale of the 4DSQ in order to formulate an advice
on whether the current practice of collapsing the three highest response options can be defended. In
chapter 5, we examine the appropriateness of the official PROMIS item parameters pertaining to the
item banks of anxiety and depression (Pilkonis et al., 2011) for use in The Netherlands. In chapter 6,
we investigate which factors are predictive of relapse and functional outcome in a first-episode
psychoses cohort. Chapter 7 is devoted to a description of the developmental approach that we
followed when constructing CATja, where the characteristics of CATja are described in detail, and the
first results we obtained while implementing the test battery are reported. Finally, in chapter 8 the
main findings of this thesis are summarized, and the lessons we learned are discussed. Furthermore,
limitations and directions for future research are provided as well as our plans for an improved
version of CATja.

523226-L-bw-Bebber523226-L-bw-Bebber523226-L-bw-Bebber523226-L-bw-BebberProcessed on: 27-8-2018Processed on: 27-8-2018Processed on: 27-8-2018Processed on: 27-8-2018 PDF page: 20PDF page: 20PDF page: 20PDF page: 20
8
1.8 References
Bebber, J., Wigman, J. T., Meijer, R. R., Ising, H. K., Berg, D., Rietdijk, J., . . . Jonge, P. (2017). The
prodromal questionnaire: A case for IRT-based adaptive testing of psychotic experiences?
International Journal of Methods in Psychiatric Research, 26(2).
Bradley, K. A., DeBenedetti, A. F., Volk, R. J., Williams, E. C., Frank, D., & Kivlahan, D. R. (2007). AUDIT-
C as a brief screen for alcohol misuse in primary care. Alcoholism: Clinical and Experimental
Research, 31(7), 1208-1217.
Cella, D., Riley, W., Stone, A., Rothrock, N., Reeve, B., Yount, S., . . . PROMIS Cooperative Group.
(2010). The patient-reported outcomes measurement information system (PROMIS) developed
and tested its first wave of adult self-reported health outcome item banks: 2005-2008. Journal
of Clinical Epidemiology, 63(11), 1179-1194.
Das, A. K., Olfson, M., Gameroff, M. J., Pilowsky, D. J., Blanco, C., Feder, A., . . . Shea, S. (2005).
Screening for bipolar disorder in a primary care practice. JAMA, 293(8), 956-963.
Embretson, S. E., & Reise, S. P. (2013). Item response theory for psychologists Psychology Press:
Mahwah (NJ).
Hahn, E. A., DeVellis, R. F., Bode, R. K., Garcia, S. F., Castel, L. D., Eisen, S. V., . . . Cella, D. (2010).
Measuring social health in the patient-reported outcomes measurement information system
(PROMIS): Item bank development and testing. Quality of Life Research, 19(7), 1035-1044.
Higgins, E. S. (1994). A review of unrecognized mental illness in primary care. prevalence, natural
history, and efforts to change the course. Archives of Family Medicine, 3(10), 908-917.

523226-L-bw-Bebber523226-L-bw-Bebber523226-L-bw-Bebber523226-L-bw-BebberProcessed on: 27-8-2018Processed on: 27-8-2018Processed on: 27-8-2018Processed on: 27-8-2018 PDF page: 21PDF page: 21PDF page: 21PDF page: 21
9
Hirschfeld, R. M., Williams, J. B., Spitzer, R. L., Calabrese, J. R., Flynn, L., Keck Jr, P. E., . . . Rapport, D.
J. (2000). Development and validation of a screening instrument for bipolar spectrum disorder:
The mood disorder questionnaire. American Journal of Psychiatry, 157(11), 1873-1875.
Johnstone, A., & Goldberg, D. (1976). Psychiatric screening in general practice: A controlled trial. The
Lancet, 307(7960), 605-608.
Kroenke, K., Taylor-Vaisey, A., Dietrich, A. J., & Oxman, T. E. (2000). Interventions to improve
provider diagnosis and treatment of mental disorders in primary care: A critical review of the
literature. Psychosomatics, 41(1), 39-52.
Lipton, R. B., Stewart, W. F., Stone, A. M., Láinez, M. J., & Sawyer, J. P. (2000). Stratified care vs step
care strategies for migraine: The disability in strategies of care (DISC) study: A randomized trial.
JAMA, 284(20), 2599-2605.
Loewy, R. L., Bearden, C. E., Johnson, J. K., Raine, A., & Cannon, T. D. (2005). The prodromal
questionnaire (PQ): Preliminary validation of a self-report screening measure for prodromal and
psychotic syndromes. Schizophrenia Research, 79(1), 117-125.
Mathias, S. D., Fifer, S. K., Mazonson, P. D., Lubeck, D. P., Buesching, D. P., & Patrick, D. L. (1994).
Necessary but not sufficient. Journal of General Internal Medicine, 9(11), 606-615.
Meijer, R. R., & Nering, M. L. (1999). Computerized Adaptive Testing: Overview and Introduction.
Applied Psychological Measurement 23(3), 187-210.
Ministerie van Volksgezondheid, Welzijn, en Sport. (2012). Bestuurlijk akkoord toekomst GGZ 2013-
2014. Den Haag: Ministerie van VWS.
Moore, J. T., Silimperi, D. R., & Bobula, J. A. (1978). Recognition of depression by family medicine
residents: The impact of screening. The Journal of Family Practice.

523226-L-bw-Bebber523226-L-bw-Bebber523226-L-bw-Bebber523226-L-bw-BebberProcessed on: 27-8-2018Processed on: 27-8-2018Processed on: 27-8-2018Processed on: 27-8-2018 PDF page: 22PDF page: 22PDF page: 22PDF page: 22
10
Pilkonis, P. A., Choi, S. W., Reise, S. P., Stover, A. M., Riley, W. T., Cella, D., & PROMIS Cooperative
Group. (2011). Item banks for measuring emotional distress from the patient-reported
outcomes measurement information system (PROMIS(R)): Depression, anxiety, and anger.
Assessment, 18(3), 263-283.
Pilling, S., Whittington, C., Taylor, C., Kendrick, T., & Guideline Development Group. (2011).
Identification and care pathways for common mental health disorders: Summary of NICE
guidance. BMJ (Clinical Research Ed.), 342, d2868.
R Core Team. (2014). R: A language and environment for statistical computing. Vienna, Austria: R
Foundation for Statistical Computing. Retrieved from http://www.R-project.org.
Richards, D. A., Bower, P., Pagel, C., Weaver, A., Utley, M., Cape, J., . . . Leibowitz, J. (2012). Delivering
stepped care: An analysis of implementation in routine practice. Implementation Science, 7(1),
3.
Robertson-Steel, I. (2006). Evolution of triage systems. Emergency Medicine Journal : EMJ, 23(2), 154-
155.
Spitzer, R. L., Kroenke, K., Williams, J. B., & Patient Health Questionnaire Primary Care Study Group.
(1999). Validation and utility of a self-report version of PRIME-MD: The PHQ primary care study.
Jama, 282(18), 1737-1744.
Terluin, B., van Marwijk, H. W., Ader, H. J., de Vet, H. C., Penninx, B. W., Hermens, M. L., . . . Stalman,
W. A. (2006). The four-dimensional symptom questionnaire (4DSQ): A validation study of a
multidimensional self-report questionnaire to assess distress, depression, anxiety and
somatization. BMC Psychiatry, 6, 34.

523226-L-bw-Bebber523226-L-bw-Bebber523226-L-bw-Bebber523226-L-bw-BebberProcessed on: 27-8-2018Processed on: 27-8-2018Processed on: 27-8-2018Processed on: 27-8-2018 PDF page: 23PDF page: 23PDF page: 23PDF page: 23
11
van Bebber, J., Wigman, J. T. W., Wunderink, L., Tendeiro, J.N., Wichers, M., Broeksteeg, J., … &
Meijer, R.R. (2017). Identifying levels of general distress in first line mental health services: Can
GP- and eHealth clients scores be compared? BMC psychiatry, 17(1), 382.
World Health Organization. (2005). Mental health declaration for Europe: Facing the challenges,
building solutions: First WHO European ministerial conference on mental health, Helsinki,
Finland 12-15 january 2005.
Zung, W. W., Magill, M., Moore, J. T., & George, D. T. (1983). Recognition and treatment of
depression in a family medicine practice. The Journal of Clinical Psychiatry.

523226-L-bw-Bebber523226-L-bw-Bebber523226-L-bw-Bebber523226-L-bw-BebberProcessed on: 27-8-2018Processed on: 27-8-2018Processed on: 27-8-2018Processed on: 27-8-2018 PDF page: 24PDF page: 24PDF page: 24PDF page: 24
12

523226-L-bw-Bebber523226-L-bw-Bebber523226-L-bw-Bebber523226-L-bw-BebberProcessed on: 27-8-2018Processed on: 27-8-2018Processed on: 27-8-2018Processed on: 27-8-2018 PDF page: 25PDF page: 25PDF page: 25PDF page: 25
13
Chapter 2
The Prodromal Questionnaire: a case for IRT-based adaptive testing of psychotic experiences?
A version of this chapter was published as:
van Bebber, J., Wigman, J.T.W., Meijer, R.R., Ising, H.K., van den Berg, D., Rietdijk, J., Dragt, S, Klaassen, R., Niemann, D., de Jonge, P., Sytema, S., Wichers, M., Linszen, D., van der Graag, M., and Wunderink. L. (2016). The Prodromal Questionnaire: a case for IRT-based adaptive testing of psychotic experiences? International Journal of Methods in Psychiatric Research, 26(2); DOI: 10.1002/mpr.1518.
Abstract
Computerized adaptive tests (CATs) for positive and negative psychotic experiences were developed
and tested in N = 5705 help-seeking, non-psychotic young individuals. Instead of presenting all items,
CATs choose a varying number of different items during test administration depending on
respondents’ previous answers, reducing the average number of items while still obtaining accurate
person estimates. We assessed the appropriateness of two-parameter logistic models to positive and
negative symptoms of the Prodromal Questionnaire (PQ), computed measurement precision of all
items and resulting adaptive tests along psychotic dimensions by Real Data Simulations (RDS), and
computed indices for criterion and predictive validities of the CATs. For all items, mean absolute
differences between observed and expected response probabilities were smaller than .02. CAT-POS
predicted transition to psychosis and duration of hospitalization in individuals at-risk for psychosis,
and CAT-NEG was suggestively related to later functioning. Regarding psychosis risk classifications of
help-seeking individuals, CAT-POS performed less than the PQ-16. Adaptive testing based on self-
reported positive and negative symptoms in individuals at-risk for psychosis is a feasible method to
select patients for further risk classification. These promising findings need to be replicated
prospectively in a non-selective sample that also includes non-at-risk individuals.

523226-L-bw-Bebber523226-L-bw-Bebber523226-L-bw-Bebber523226-L-bw-BebberProcessed on: 27-8-2018Processed on: 27-8-2018Processed on: 27-8-2018Processed on: 27-8-2018 PDF page: 26PDF page: 26PDF page: 26PDF page: 26
14
2.1 Introduction To enable timely intervention in psychosis, its early detection is important (McGorry, Killackey, &
Yung, 2008; McGorry, Yung, & Phillips, 2003). Therefore,
effective screening tools for early expressions of psychosis that can be implemented easily at entry
into the medical care system. This study investigated the psychometric properties of the Dutch
version of the Prodromal Questionnaire (PQ-92; Loewy, Bearden, Johnson, Raine, & Cannon, 2005), a
screening instrument for psychosis, in order to explore the possibility of building computerized
adaptive tests (CATs). Adaptive tests are appealing, because they are short and a large number of
domains of psychopathology may be assessed without the need to administer hundreds of items.
2.1.1 At risk for psychosis There is increasing evidence supporting a continuous view on psychosis (Hanssen,2004; Johns & van
Os, 2001; Van Os et al., 1999; Van Os, Hanssen, Bijl, & Ravelli, 2000; Van Os, Linscott, Myin-Germeys,
Delespaul, & Krabbendam, 2009; Wigman, 2011). This continuum of psychotic severity ranges from
normality through schizotypy to full blown clinical psychotic disorder. Much research focused on the
ed the ultra-high-risk (UHR) period. Individuals at
-risk mental state (ARMS; Yung et al., 1996, 1998,
2005b) criteria: (i) attenuated positive symptoms (APS group), (ii) brief limited intermittent psychotic
relative with any psychotic disorder or having a diagnosis of schizotypy (genetic risk group). In
addition, individuals must either report persistently low levels of functioning or a recent substantial
decline in functioning (van der Gaag et al., 2012) to meet ARMS criteria (McGorry et al., 2003).
Adequate recognition of ARM
behavioral therapy (van der Gaag et al., 2012) as soon as possible, thereby delaying or even
hermore, recognizing individuals at UHR may
substantially shorten the duration of untreated psychosis (DUP) should these individuals transition to
initiation of adequate treatment (Marshall et al., 2005), and shorter DUP is associated with better
prognosis (Chang et al., 2012a, 2012b, 2013; Wunderink, Sytema, Nienhuis, & Wiersma, 2009). In
self-report inventories of psychotic symptoms and then, if they score above a cutoff, assess semi-
structured interviews that tap the same symptom dimensions more in-depth. This two-stage strategy
well between

523226-L-bw-Bebber523226-L-bw-Bebber523226-L-bw-Bebber523226-L-bw-BebberProcessed on: 27-8-2018Processed on: 27-8-2018Processed on: 27-8-2018Processed on: 27-8-2018 PDF page: 27PDF page: 27PDF page: 27PDF page: 27
15
individuals who do or do not develop psychosis according to diagnosis by psychiatrists (Loewy et al.,
2005; Miller et al., 2002; Yung et al., 2003).
2.1.2 The Prodromal Questionnaire The PQ-92 is a self- -92 items are clustered into four
domains: positive symptoms (45 items), negative symptoms (19 items), disorganized symptoms (13
items), and general symptoms (15 items). In this paper, we focus on the positive (PQ-92-POS) and
negative (PQ-92-NEG) symptom dimensions. Positive symptoms are highly predictive (Ising et al.,
2012; Loewy et al., 2005) of the differentiation between healthy and ARMS/psychosis as assessed by
structured interviews (Miller et al., 2002; Yung, et al., 2005a). Negative symptoms are predictive of
later social and vocational functioning (Lin et al., 2011; Pogue-Geile & Zubin, 1987). The PQ-16 is a
shortened version of the original questionnaire (Ising et al., 2012)
discriminate optimally between normal and ARMS/psychosis mental states according to the
comprehensive assessment of at-risk mental state (CAARMS). It contains those 16 items of the PQ-92
2.1.3 Computerized Adaptive Testing (CAT) and Item Response Theory (IRT) The aim of CAT is to obtain the same measurement precision using fewer items than the original
instrument (Wainer, 2010). In clinical applications of CAT, the intensity level of the items to be
administered is tailored to the estimated levels of psychopathological symptom experiences of
respondents. That is, in case of dichotomous items, the objective of the algorithm is to present
items for which respondents have a chance of approximately 50% of endorsing the item. An
advantage of CAT in measuring psychosis is that mainly symptoms are selected that match a patient’s
severity level, resulting in short questionnaires. Item selection is an iterative process: with each
symptom administered, an improved estimate of an individual’s symptom severity level is obtained
and the next symptom to be administered is the one that yields the most information regarding this
individual estimate. This process continues until a certain stop criterion is reached, usually a
predetermined level of accuracy, expressed as a maximum tolerable standard error (SE) for the
purpose of testing. Further illustration of the principle of adaptive testing is given in the Appendix.
Adaptive testing is usually based on item response theory (IRT) (Embretson & Reise, 2013; Reise &
Waller, 2009a), a family of probabilistic models. An IRT respondent’s level
of symptom severity and item prope tern. If the postulated mod
the observed data reasonably well, individual scores are still comparable (may be placed on the same
metric), although each respondent gets his/her own set of symptoms that is tailored to their

523226-L-bw-Bebber523226-L-bw-Bebber523226-L-bw-Bebber523226-L-bw-BebberProcessed on: 27-8-2018Processed on: 27-8-2018Processed on: 27-8-2018Processed on: 27-8-2018 PDF page: 28PDF page: 28PDF page: 28PDF page: 28
16
estimated symptom severity levels. Thus, with CAT, each tested person will complete a different set
of questions, depending on the number of questions needed to reach a preset threshold of accuracy.
An illustration of CAT can be found in the Supportive Information.
2.1.4 Aims of this study The
of the PQ-92 could be adequately represented by IRT models. The second aim was to assess how
many symptoms of each dimension are needed to reach adequate levels of measurement precision.
The third aim was to investigate how well the CAT-POS and CAT-NEG predict clinical and functional
outcome regardless of ARMS. In order to achieve the second and third aims, we utilized the principle
of real data simulations (RDS; see Methods section).
2.2 Methods
2.2.1 Data collection design
The data of three interdependent samples gathered in the Dutch Early Detection and Intervention
Evaluation (EDIE-NL) trial (van der Gaag et al., 2012) and the variety of instruments and measures
that have been used, are presented in Table 2.1.

523226-L-bw-Bebber523226-L-bw-Bebber523226-L-bw-Bebber523226-L-bw-BebberProcessed on: 27-8-2018Processed on: 27-8-2018Processed on: 27-8-2018Processed on: 27-8-2018 PDF page: 29PDF page: 29PDF page: 29PDF page: 29
17
Table 2.1 Flowchart Data Collection Design.
Sample
1. General help seeking 2. UHR + sub-threshold
levels of positive symptoms 3. UHR follow-up
Criteria ---
PQ-92-POS > 17 (N = 420) +
11 < PQ-92-POS < 18 (N =
147)
CAARMS POS
DSM axis-one/two
N 5699 567 90
Instruments
& measures PQ-92
CAARMS
SOFAS
Diagnosis
Hospitalization
SOFAS
Research
questions
Model fit
Local dependence
DIF
Properties CATs
Criterion validity Predictive validity
1 Help-seeking. Help-seeking individuals (N = 5705) were screened with the PQ-92 between February
2008 and February 2010 at four different sites in the Netherlands: N = 3666 patients at the Mental
Health Center PsyQ Haaglanden, The Hague; N = 1109 patients at the Friesland Mental Health
Services; N = 326 patients at the Mental Health Center Rivierduinen, Leiden and surrounding areas; N
= 276 at the Mental Health Center PsyQ, Amsterdam; N = 206 at the ABC (Altrecht), Utrecht; N = 116
patients at the Academic Medical Center, Amsterdam. Six of these individuals were removed from
the analyses because they had missing data on all positive symptoms. With respect to positive
symptoms, 2.2% of the total data were missing and “I believe in telepathy, psychic forces, or
fortunetelling” had the highest percentage of missing values (4.7%). With respect to negative
symptoms, 3.08% and distant” had the
highest percentage of missing values (4.7%). Mean age was 24.7 (standard deviation [SD] = 5.7, range
10-37 years), and 36.6% were male (63.2% female, 0.2% missing).

523226-L-bw-Bebber523226-L-bw-Bebber523226-L-bw-Bebber523226-L-bw-BebberProcessed on: 27-8-2018Processed on: 27-8-2018Processed on: 27-8-2018Processed on: 27-8-2018 PDF page: 30PDF page: 30PDF page: 30PDF page: 30
18
2 UHR. A subg assessed with the CAARMS and the fourth
version of the Social and Occupational Functioning Scale (SOFAS) after the intake (see below for
instrument descriptions). This subsample included all individuals that endorsed 18 or more positive
PQ-92 symptoms. To enhance the value of this sample for research purposes, six additional groups of
approximately 25 individuals were randomly selected that endorsed 12, 13, 14, 15, 16 and 17
positive symptoms, respectively. Mean age was 25.7 (SD = 5.0, range 16–35), and 31.4% were male
(68.6% female).
3 UHR follow-up. A number of those individuals (N = 90)
addition to a DSM-4 axis one (non-psychotic) or axis two diagnosis and that were willing to
participate were followed up after 18 months (van der Gaag et al., 2012). Mean age was 25.4 (SD =
5.0, range 10–37 years), and 35.6% were male (64.4% female).
2.2.2 The two-parameter logistic model (2-PL) and its assumptions In this study we used the two parameter logistic (2-PL) model (Birnbaum, 1968), a type of IRT model
appropriate to describe non-cognitive and clinical data (Reise & Waller, 2009b). In the 2-PL model,
the response probabilities of respondents to individual items are modeled by means of a logistic
discrimination parameter equals the slope of the logistic function and represents the discriminative
power of the item (i.e. how much response probab
intensity level of the item. These functions are also called item characteristic curves or item trace
lines. In order to apply the 2-PL model, the related assumptions of unidimensionality and local
local
independence means that items are essentially uncorrelated when controlling for this trait. In IRT,
persons on this latent continuum may be conceived as approximately standardized. The cutoff
advised by Ising et al. (2012) for including patients in the CAARMS interview (more than 17 positive
-value of +0.81 on the positive symptom continuum (approximately
highest 20%).

523226-L-bw-Bebber523226-L-bw-Bebber523226-L-bw-Bebber523226-L-bw-BebberProcessed on: 27-8-2018Processed on: 27-8-2018Processed on: 27-8-2018Processed on: 27-8-2018 PDF page: 31PDF page: 31PDF page: 31PDF page: 31
19
2.2.3 Model fit 2-PL and Local Dependence (LD)
the observed sum score distribution with the expected sum score distribution on the basis of the
magnitudes of the residual correlations among the positive and negative symptoms respectively after
approximately equal size according to their score level (that is, total scores without the item
targeted). These groups represent individuals with low, medium, and high levels of psychotic
symptom experiences. Observed response probabilities within these groups were compared with
model-based expected response probabilities, and mean absolute differences (MADs) were
computed for each item. In this way, the appropriateness of the item trace line (logistic function) was
evaluated for each item. All IRT-analyses were performed using the object-oriented, free available
software package MIRT (Glas, 2010). The differences between observed and expected sum score
frequencies and observed and expected response probabilities were evaluated using the Lagrange
Multipliers (LM) test (Glas, 1999), which has an asymptotic chi-square distribution. In all applications
of the LM test, absolute differences between observed and expected are more informative about
model violations than the outcomes of the test statistics, as large sample sizes quickly lead to
-seeking) was used for these analyses.
2.2.4 Differential item functioning (DIF) Because appropriateness of the item trace lines may also depend on the demographic background of
respondents, it is important to investigate whether parameter estimates based on the whole sample
are also appropriate (invariant) for subgroups. Differential item functioning (DIF) tests essentially
number of additional parameters that have to be estimated. We investigated DIF for gender and age
(adolescents versus adults). In order to check DIF for age, we split the data- to adolescents (< 18
years; N = 602) and adults (N = 5088). We decided to consider MADs in response probabilities greater
than .05 as moderate DIF and MADs greater than .10 as inadmissible for the purpose of adaptive
testing (C. Glas, personal communication, February 6, 2015).
2.2.5 Simulation of CAT-properties based on item parameters and observed response patterns: RDS RDS enable the evaluation of adaptive test properties before actually implementing the test. The
estimated item parameters are used in combination with the observed response patterns to simulate
523226-L-bw-Bebber523226-L-bw-Bebber523226-L-bw-Bebber523226-L-bw-BebberProcessed on: 27-8-2018Processed on: 27-8-2018Processed on: 27-8-2018Processed on: 27-8-2018 PDF page: 32PDF page: 32PDF page: 32PDF page: 32
20
an adaptive test (Sands, Waters, & McBride, 1997)
-values of each respondent. Based on
(i -values obtained using the CAT-scores with full-
length test- -values based on the administration of all symptoms) and (ii) investigated
measurement precision along the latent continua for CAT-POS and CAT-NEG. The program Firestar
(Choi, 2009) was used to compile syntax to be used in R (R Core Team, 2014) to run these analyses.
These simulated adaptive test scores were also used to investigate the criterion and predictive
validity of the positive and negative symptom dimensions.
2.2.6 Criterion Validity Combining structured interviews with indicators of patients’ functioning is seen as the gold standard
for the differentiation between healthy, UHR and psychotic individuals. In case of UHR, functioning
must be either low, or recently declined in addition to the result of the interview. We used the
CAARMS and the fourth version of the SOFAS for the differentiation between normal versus
UHR/ -predictive value (PPV),
negative predictive value (NPV) and the accuracy of the CAT-POS were compared with the same
indices for the PQ-16. The second sample was used for these analyses. It has to be noted that the
CAARMS-assessors were not blind to the PQ-scores of patients. That is, although assessors did not
know precisely how many positive symptoms were endorsed by the patients they interviewed, they
were sure that these patients endorsed at least 12 positive symptoms (inclusion criteria for the
second sample).
2.2.7 Instruments
CAARMS
The CAARMS is a structured interview used to assess UHR status for psychosis. Reliabilities (intra-
class correlations, ICC) for the positive symptom
UHR/psychosis status range from .79 to .89 for non-psychotic help-seeking individuals. The CAARMS
discriminates well between healthy and UHR, and within UHR-samples, patients that are CAARMS
positive are approximately 16 times more likely than CAARMS negative patients to develop a
psychotic disorder (Yung et al., 2008).

523226-L-bw-Bebber523226-L-bw-Bebber523226-L-bw-Bebber523226-L-bw-BebberProcessed on: 27-8-2018Processed on: 27-8-2018Processed on: 27-8-2018Processed on: 27-8-2018 PDF page: 33PDF page: 33PDF page: 33PDF page: 33
21
SOFAS
The SOFAS (Goldman, Skodol, & Lave, 1992) assesses functioning on a scale ranging from 0 (poor
functioning) to 100 (excellent functioning). Reliabilities (ICC or kappa) for the scale range from .55 to
.80. SOFAS-scores have been consistently found to co-vary negatively with complexity of axis-one
diagnosis and positively with other indicators of social and occupational functioning. Low functioning
was operationalized as a score lower than 50, and substantial decline was operationalized as a drop
of more than 30% from premorbid functioning (van der Gaag et al., 2012).
2.2.8 Predictive Validity To explore the capability of the PQ-92-POS, CAT-POS, PQ-92-NEG, CAT-NEG and the PQ-16 to predict
important outcome criteria, a subgroup (N = 90) of the second sample was followed-up after 18
months. Outcome measures were the development of a psychotic disorder as diagnosed by
psychiatrists, level of functioning measured by the SOFAS and the number of hospitalization days.
The third sample (UHR follow-up) was used for these analyses and again (Pearson) correlations were
computed. It should be noted that the third sample is not representative of help-seeking individuals
because only patients classified as ARMS according to the CAARMS were included. The attrition rate
for this last stage of the data collection design was equal to 13%.
2.3 Results
2.3.1 Model fit 2-PL and Local Dependence All IRT-analyses were conducted on the sample of general help-seeking individuals.
Positive symptoms
Detailed output of the analyses is given in the Appendix; here we summarize the most important
ings. Based on the LM t ences between observed and expected sum
score frequencies (LM = 80.1, p < .01). Closer inspection of these differences revealed that (i)
especially zero scores are more frequently observed than the model implies and (ii) the differences
are not systematic, in the sense that they do not show a clear pattern of deviation from the
assumption of a normally distributed latent trait. The MADs between observed and expected
response probabilities for the 45 symptoms were low, all between .00 and .01 with one of .02,
meaning that the estimated item parameters the 990
item pairs [(n * n - n)/2], nine had a residual correlation above .25, (maximum .34). The averaged

523226-L-bw-Bebber523226-L-bw-Bebber523226-L-bw-Bebber523226-L-bw-BebberProcessed on: 27-8-2018Processed on: 27-8-2018Processed on: 27-8-2018Processed on: 27-8-2018 PDF page: 34PDF page: 34PDF page: 34PDF page: 34
22
absolute residual correlation was equal to .06, showing that the magnitudes of most correlations
among positive symptoms were well reproduced by a unidimensional model.
Table 2.2 displays the SEs for 15 equally spaced intervals on the positive symptom continuum
(all 45 items). SEs at the start of the continuum (very low scores) are higher than the SEs in the area
surrounding the cutoff score for the end of the
latent continuum. This means that the 45 positive symptoms are less capable of differentiating
among individuals who experience no or only a few mild symptoms than differentiating low scorers
from those individuals that experience elevated levels of positive symptoms. Thus, we conclude that
the positive symptom dimension may be adequately represented by the 2-PL model, noting that
measurement precision is low at the beginning of the positive symptom continuum.
Table 2. 2 Number of respondents and averaged estimated standard errors (EAP) within 15 equally1
spaced intervals (0.40) on the positive symptom dimension (all 45 symptoms).
-intervalsMin -2.0 -1.6 -1.2 -.80 -.40 .00 .40 .80 1.2 1.6 2.0 2.4 2.8 3.2 3.6
Max -1.6 -1.2 -.80 -.40 .00 .40 .80 1.2 1.6 2.0 2.4 2.8 3.2 3.6 3.8
N
SE
289
.55
245
.48
366
.43
417
.39
501
.35
510
.33
507
.30
412
.29
285
.27
243
.26
135
.26
94
.25
56
.26
22
.26
4
.21 1Min( ) = -2.03, Max( ) = 3.80.
Negative symptoms
The differences between observed and expected sum score frequencies of the negative symptom
dimension were not stat r, as for
the positive symptom dimension, the frequency of zero-scores is underestimated by the model.
Again, the MADs between observed and expected response probabilities for the 19 symptoms were
quite low (< .01). Thus, negative symptoms can also be represented by the 2-PL model.
Of the 171 item pairs, three had a residual correlation above .25. The averaged absolute
residual correlation was equal to .08 (maximum .44). Table 2.3 displays the SEs for 11 equally spaced
intervals on the negative symptom continuum (all 19 items). For the negative symptom dimension,
the differences in measurement precision along the latent continuum are smaller than was the case
for the positive symptom dimension.
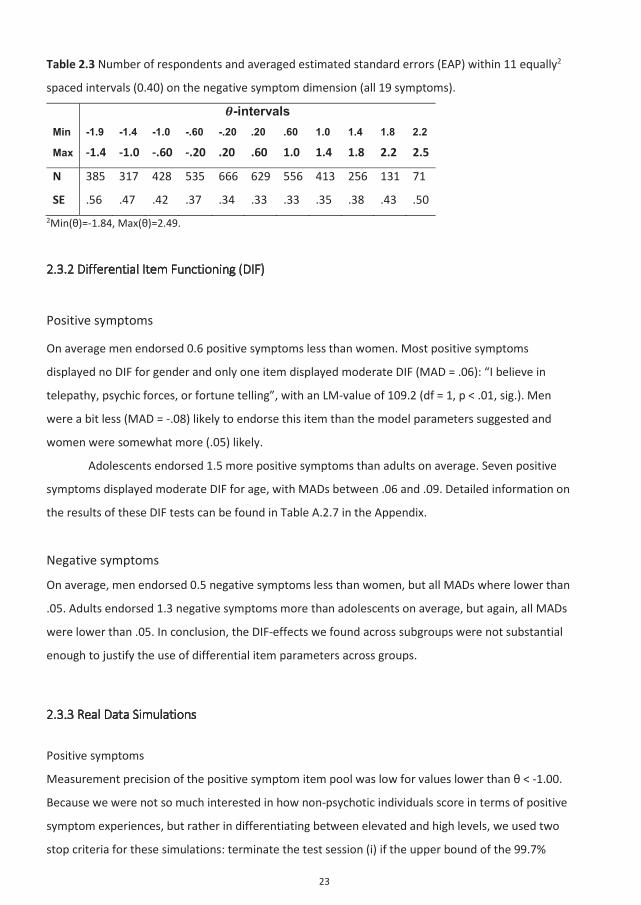
523226-L-bw-Bebber523226-L-bw-Bebber523226-L-bw-Bebber523226-L-bw-BebberProcessed on: 27-8-2018Processed on: 27-8-2018Processed on: 27-8-2018Processed on: 27-8-2018 PDF page: 35PDF page: 35PDF page: 35PDF page: 35
23
Table 2.3 Number of respondents and averaged estimated standard errors (EAP) within 11 equally2
spaced intervals (0.40) on the negative symptom dimension (all 19 symptoms).
-intervalsMin -1.9 -1.4 -1.0 -.60 -.20 .20 .60 1.0 1.4 1.8 2.2
Max -1.4 -1.0 -.60 -.20 .20 .60 1.0 1.4 1.8 2.2 2.5
N
SE
385
.56
317
.47
428
.42
535
.37
666
.34
629
.33
556
.33
413
.35
256
.38
131
.43
71
.50 2Min( )=-1.84, Max( )=2.49.
2.3.2 Differential Item Functioning (DIF)
Positive symptoms
On average men endorsed 0.6 positive symptoms less than women. Most positive symptoms
displayed no DIF for gender and only one item displayed moderate DIF (MAD = .06): “I believe in
telepathy, psychic forces, or fortune telling”, with an LM-value of 109.2 (df = 1, p < .01, sig.). Men
were a bit less (MAD = -.08) likely to endorse this item than the model parameters suggested and
women were somewhat more (.05) likely.
Adolescents endorsed 1.5 more positive symptoms than adults on average. Seven positive
symptoms displayed moderate DIF for age, with MADs between .06 and .09. Detailed information on
the results of these DIF tests can be found in Table A.2.7 in the Appendix.
Negative symptoms
On average, men endorsed 0.5 negative symptoms less than women, but all MADs where lower than
.05. Adults endorsed 1.3 negative symptoms more than adolescents on average, but again, all MADs
were lower than .05. In conclusion, the DIF-effects we found across subgroups were not substantial
enough to justify the use of differential item parameters across groups.
2.3.3 Real Data Simulations
Positive symptoms
Measurement precision of the positive symptom item pool was low for values lower than < -1.00.
Because we were not so much interested in how non-psychotic individuals score in terms of positive
symptom experiences, but rather in differentiating between elevated and high levels, we used two
stop criteria for these simulations: terminate the test session (i) if the upper bound of the 99.7%

523226-L-bw-Bebber523226-L-bw-Bebber523226-L-bw-Bebber523226-L-bw-BebberProcessed on: 27-8-2018Processed on: 27-8-2018Processed on: 27-8-2018Processed on: 27-8-2018 PDF page: 36PDF page: 36PDF page: 36PDF page: 36
24
i + 3*SE( i)) of the estimated score is lower than the corresponding cutoff score
for CAARMS inclusion (21.6% highest scores) or (ii) when 12 items have been administered. A
minimum of four items was always administered. When these boundary conditions were used, 10.1
items were utilized on average. The correlation of CAT-POS scores with full-length test scores (IRT-
based) equaled .92 (R2 = 85%), indicating that both approaches yield roughly the same information.
The average SE was equal to 0.47 (rxx = .82), a value that is still slightly above the cutoff of 0.50 (rxx =
.80) (Evers, Lucassen, Meijer, & Sijtsma, 2010).
Negative symptoms
The following stop criteria were used: terminate the test sessions (i) if the corresponding SE is lower
than 0.45 (rxx=.83), or (ii) when 12 items have been administered. In this way, 8.8 items had to be
utilized on average. The correlation with full-length test scores was 0.95 (R2 = 90%), and the SE
equaled 0.46 (rxx=.83) on average.
2.3.4 Criterion Validity
The second sample is not representative for the target population of the screening tool (help-seeking
population) because only individuals that endorsed many positive symptoms completed the
CAARMS. In contrast to Ising et al. (2012), we chose not to impute CAARMS scores for the rest of the
sample because (i) many (N = 5132) scores would have had to be imputed and (ii) we did not want to
use positive symptoms as predictors for imputing CAARMS-scores (diffusion of predictor and
criterion). Instead, we compared our results directly to those of Ising et al. (2012), using the same
approach for the CAT-POS scores and the PQ-16. The correlations between the two predictors and
the CAARMS were corrected for restriction of range in the predictor scores by Thorndike’s case-2
formula (Wiberg & Sundström, 2009). The corrected correlation of the CAT-POS scores with the
CAARMS (.38) was lower than the correlation of the PQ-16 (.47) with the CAARMS. Ising et al. (2012)
advise to use a cutoff of more than 17 positive symptoms endorsed out of the 45 positive symptoms.
Of the sample, 21.6% endorse more than 17 positive symptoms, and this percentage corresponds to
-value above +0.81 on the CAT-POS. It should be noted that the goal was to differentiate between
normal and UHR/psychosis, and not to identify individuals which are currently psychotic. The results
lue
as cutoff, are displayed in Table 2.4.

523226-L-bw-Bebber523226-L-bw-Bebber523226-L-bw-Bebber523226-L-bw-BebberProcessed on: 27-8-2018Processed on: 27-8-2018Processed on: 27-8-2018Processed on: 27-8-2018 PDF page: 37PDF page: 37PDF page: 37PDF page: 37
25
Table 2.4 Classification accuracies of the PQ-16 and four different CAT-POS cut-off scores for
CAARMS classifications (cut-off advised by Ising et al, 2014 in italics).
Instrument & cut-off used
PQ-16 CAT-POS
Si> 5 i > .99 i > .94 i > .81 i > .62
Sensitivity .93 .74 .75 .81 .84
Specificity .42 .49 .46 .39 .28
PPV .48 .45 .44 .44 .41
NPV .92 .76 .76 .78 .76
Accuracy .61 .58 .56 .54 .49
As shown in Table 2.4, the PQ-16 (second column) is superior to the CAT- i
and PPV are minimal. Because respondents in the second sample were selected by the number of
positive symptoms they endorsed, it contains much less true negatives than might be expected
“true” values for both predictors. To a lesser degree, the reverse is also true for the reported
sensitivities and PPVs of the CAT-POS and the PQ-16, because the selectiveness of the data collection
-POS cutoff score (columns 3 and 4)
he price of decreasing sensitivity. Increasing the CAT-POS
sensitivity.
2.3.4 Predictive Validity Twenty-four (26.7%) patients transitioned to a psychotic state within the follow-up period of 18
month. The mean SOFAS score at the end of the follow-up period was equal to 55.70 (SD = 14.70).
Eighty-one out of 90 patients (90%) were not hospitalized at all during the follow-up period, and the
number of hospitalization days for the nine patients that did get hospitalized ranged from three to
230 days.
The correlations between the predictors and the follow-up criteria, calculated in the UHR
follow-up sample, are displayed in Table 2.5. The CATs performed as well or even better than the
unweighted symptom totals of the PQ-92. Although the PQ-16 was superior to the CAT-POS with
rst 18 months after intake and (ii) the duration of

523226-L-bw-Bebber523226-L-bw-Bebber523226-L-bw-Bebber523226-L-bw-BebberProcessed on: 27-8-2018Processed on: 27-8-2018Processed on: 27-8-2018Processed on: 27-8-2018 PDF page: 38PDF page: 38PDF page: 38PDF page: 38
26
hospitalization. No instrument predicted social and occupational functioning as assessed by the
SOFAS, although the correlation for the CAT-NEG suggests an effect of interest, given the size of the
correlation (rxy = .20) and the low p-value (p = .058).
Table 2.5. Predictive validities of PQ-92-POS, CAT-POS, PQ-92-NEG, CAT-NEG and the PQ-16.
Diagnosis (n = 90) Hospitalization days (n = 89) SOFAS (n = 78)
PQ-92-POS .13 .14 -.08
CAT-POS .22* .24* -.06
PQ-92-NEG .10 .05 -.20
CAT-NEG .11 .04 -.20
PQ-16 .14 .17 -.09
*p<.05 (one-tailed).
2.4 Discussion
The present study showed the suitability of positive and negative symptoms of the PQ-92 for IRT-
based adaptive testing. Our results show that it is feasible to build CATs for these psychotic
experiences, utilizing many fewer items levels
of measurement precision. On average, ten and nine items were required to place individuals on the
positive and negative symptom dimensions, respectively. Although all effect sizes were small, in
ARMS individuals (according to the CAARMS), the CAT-POS predicted best which individuals make a
transition to psychosis and how long these would need to be hospitalized, and the CAT-NEG was
suggestively associated with later functioning (rxy = -.20, p = .058; N = 90). With respect to CAARMS-
-16 was superior to the CAT-POS. It should be noted that during the
RDS of the CATs, selection of those 16 items that make up the PQ-16 was rather the exception than
the rule. With respect to the CAT-POS, symptoms of the facet Unusual Thought Content & Delusional
Ideas were selected most frequently.
IRT-models to the dimensions of positive
and negative psychotic experiences. Because the symptoms were calibrated using a large sample
drawn from the help-seeking population, the item parameters could be estimated precisely. Also, we
used various different measures of validity to indicate how well the newly developed adaptive tests
function. Several limitations should also be noted. The most important limitation is the selectness of
the follow-up sample as a result of the data collection design: only individuals were included who
according to the CAARMS. Because of this, the results concerning the

523226-L-bw-Bebber523226-L-bw-Bebber523226-L-bw-Bebber523226-L-bw-BebberProcessed on: 27-8-2018Processed on: 27-8-2018Processed on: 27-8-2018Processed on: 27-8-2018 PDF page: 39PDF page: 39PDF page: 39PDF page: 39
27
predictive validity of the CATs, while promising, should be replicated in a non-selected (including
both ARMS and non-ARMS individuals) sample prospectively. This would enable a direct and fair
comparison of the CATs on the one hand and the PQ-16 combined with the CAARMS on the other
hand. With respect to the relationship between CAT-POS and number of hospitalization days, it is
important to note that the distribution of hospitalization days was very skewed and the association
that we found was based on only nine different time points. Although the RDS give an impression of
how the CATs will function in practice and the results we found are promising, it has to be noted that
the CATs were not yet applied in general practices. Furthermore, measurement precision for
individuals that experience no or only a few positive or negative symptoms is lower than for
individuals that experience elevated or high levels of
clinical scales, and the term quasi-trait has been introduced by Reise and Waller (2009) to describe
this phenomenon: “(…) the trait is unipolar (relevant in only one direction) and that variation at the
low end of the scale is less informative in both a substantive and psychometric sense.” (p. 31). As
such, neither item pool is ideal to track individual change (for example, when assessing recovery).
Adding positive and negative symptoms with higher proportions of endorsement (p > .70) to the item
pools would improve measurement precision at the low ends of the latent continua. It would be
fruitful to investigate whether these indicators can be found in other inventories that assess milder
forms of psychotic experiences.
The choice for CATs has two important advantages. First, in order to differentiate between
positive and negative symptom experiences without the need of administering many items, the
computed item parameters may be used in adaptive testing environments. We think that this
of economy is especially important in practical contexts where the aim is to assess a broad spectrum
of psychopathological and psychological domains reliably without the need of administering
hundreds of items in total, as is the case at the front door of the medical sector – that is, general
practitioners’ practices or cohort studies with a broad scope on diverse forms of psychopathology. In
specialized secondary clinical settings where the focus ogical domains,
diagnoses at in -assessors are available, this
advantage will be probably less important, and thus the PQ-16 seems to be the better choice.
Second, use of CATs offers the possibility of investigating the independent contribution of positive
and negative symptom dimensions to the future development of psychosis and functional decline,
without a priori capital CAARMS. Within the
current framework of ARMS (an important limitation of the present study), the CATs seem a
promising and feasible concept to adequately and economically assess psychotic experiences, as
CATs were associated with long-term outcomes (transition to psychosis, hospitalization and
523226-L-bw-Bebber523226-L-bw-Bebber523226-L-bw-Bebber523226-L-bw-BebberProcessed on: 27-8-2018Processed on: 27-8-2018Processed on: 27-8-2018Processed on: 27-8-2018 PDF page: 40PDF page: 40PDF page: 40PDF page: 40
28
functioning). The item parameters are provided in the Appendix and may be used for adaptive
testing and computation of various IRT-metric scores.
2.5 Appendix
2.5.1 Model fit revisited
In the present study, the Bock Aitkin Expectation Maximization (BAEM) algorithm was used for item
calibration, assuming a normally distributed prior. Using either the Empirical Histogram (EH)
approach for the BAEM-algorithm or using the generalized conditional maximum likelihood approach
(OPLM) made model fit only worse, so we stick to the BAEM algorithm for item calibration.
2.5.2 Settings for Real Data Simulations in Firestar
We used the Expected A Posteriori (EAP) approach to compute estimated individual scores and the
corresponding standard errors (posterior standard deviation). The first item was targeted at the
overall mean, and consecutive item selection was based on Maximum Fischer Information (MFI),
because this method is relatively easy to program, and the more advanced methods like Minimal
Expected Posterior Variance (MEPV) only outperform MFI when the latent continua are stacked with
many highly discriminating items, which is neither the case for the positive or the negative symptom
dimension of the PQ.
2.5.3 Usage of IRT-scores in linear models
Because IRT-scores are estimated and not observed, using point estimates to determine the
strength of relationships would lead to positively biased coefficients. Instead, repeated sampling
from the normally distributed posterior, using as mean and the corresponding standard error as
standard deviation is appropriate. The correlation coefficients reported in the paper are averaged
correlations across ten random draws. Ten draws have been shown to be sufficient in simulation
studies to approximate the ‘real’ magnitudes of coefficients (correlations as well as effect-sizes).

523226-L-bw-Bebber523226-L-bw-Bebber523226-L-bw-Bebber523226-L-bw-BebberProcessed on: 27-8-2018Processed on: 27-8-2018Processed on: 27-8-2018Processed on: 27-8-2018 PDF page: 41PDF page: 41PDF page: 41PDF page: 41
29
Table A.2.1 Item- content, code and parameters for the 45 positive symptoms of the PQ.
Symptom PQ alfa beta The passage of time feels faster or slower than usual 02 1.097 -0.047 I have difficulty organizing my thoughts or finding the right words 03 1.160 -1.150 When I look at a person, or look at myself in the mirror, I have seen the face change right before my eyes 04 1.728 3.299
I sometimes get strange feelings on or just beneath my skin, like bugs crawling 05 1.341 1.997 Familiar surroundings sometimes seem strange, confusing, threatening or unreal 07 1.456 0.847
I often seem to live through events exactly as they happened before (déjà vu) 08 1.200 0.425 I sometimes smell or taste things that other people don't notice 09 1.371 2.438 Sometimes I am sure that other people can tell what I am thinking or feeling without me telling them 12 1.303 1.748
I have heard things other people can’t hear like voices of people whispering or talking 13 1.996 3.065
I often hear unusual sounds like banging, clicking, hissing, clapping or ringing in my ears 18 1.954 2.724
I often mistake shadows for people or noises for voices 19 1.964 3.104 Things that I see appear different from the way they usually do (brighter or duller, larger or smaller, or changed in some other way) 20 1.553 3.043
Other people say that I wander off the topic or ramble on too much when I am speaking 23 1.092 -0.184
I believe in telepathy, psychic forces, or fortune telling 24 0.714 0.726 I often feel that others have it in for me 25 1.344 0.727 My sense of smell sometimes becomes unusually strong 26 1.189 2.139 I have felt that i am not in control of my own ideas or thoughts 27 1.265 0.207 I believe that I am very important or have special gifts 30 1.228 3.120 Sometimes my thoughts seem to be broadcast out loud so that other people know what I am thinking 32 1.680 2.562
I am unusually sensitive to noise 34 0.957 0.687 I am superstitious 35 0.798 1.618 I have heard my own thoughts as if they are outside of my head 36 2.262 3.469 I have many thoughts that fill my mind and compete for my attention 37 1.285 -0.872 I often feel that other people are watching me or talking about me 38 1.276 0.048 I sometimes feel that things I see on the TV or read in the newspaper have a special meaning for me 46 1.298 1.984
My thinking feels confused, muddled, or disturbed in some way 49 1.592 -0.677 Sometimes I feel suddenly distracted by distant sounds that I am not normally aware of 50 1.626 1.423
I have had the sense that some person or force is around me, even though I could not see anyone 52 1.625 2.189
At times I worry that something may be wrong with my mind 55 1.201 0.645 I have felt that I don't exist, the world does not exist, or that I am dead 56 1.520 2.077 I have been confused at times whether something I experienced was real or imaginary 57 1.460 1.436
I have experienced unusual bodily sensations such as tingling, pulling, pressure, aches, burning, cold, numbness, shooting pains vibrations or electricity
60 1.170 0.500
I hold beliefs that other people would find unusual or bizarre 61 1.464 2.058 I feel that parts of my body have changed in some way, or that parts of my body are working differently 64 1.074 1.617

523226-L-bw-Bebber523226-L-bw-Bebber523226-L-bw-Bebber523226-L-bw-BebberProcessed on: 27-8-2018Processed on: 27-8-2018Processed on: 27-8-2018Processed on: 27-8-2018 PDF page: 42PDF page: 42PDF page: 42PDF page: 42
30
My thoughts are sometimes so strong that I can almost hear them 65 1.815 1.629 I sometimes see special meanings in advertisements, shop windows, or in the way things are arranged around me 67 1.652 3.092
I often pick up hidden threats or put-downs from what people say or do 68 1.356 0.370 I sometimes use words in unusual ways 69 1.385 1.389 At times I have felt that some person or force interferes with my thinking or puts thoughts into my head 74 1.957 2.785
I have had experiences with the supernatural, astrology, seeing the future, or UFO's 75 1.150 2.865
Some people drop hints about me or say things with a double meaning 76 1.503 1.741 I am often concerned that my closest friends or co-workers are not really loyal or trustworthy 77 1.409 0.411
I have seen unusual things like flashes, flames, blinding light, or geometric figures 79 2.028 3.685
I have seen things that other people can't see or don't seem to 84 2.043 3.302 People sometimes find it hard to understand what I am saying 90 1.397 0.865

523226-L-bw-Bebber523226-L-bw-Bebber523226-L-bw-Bebber523226-L-bw-BebberProcessed on: 27-8-2018Processed on: 27-8-2018Processed on: 27-8-2018Processed on: 27-8-2018 PDF page: 43PDF page: 43PDF page: 43PDF page: 43
31
Table A.2.2 Observed and expected score frequencies for the positive symptom dimension.
Score Range1 Observed2 Expected3 0 0 163 113.5 1 1 211 206.9 2 2 258 261.4 3 3 250 288.7 4 4 316 299.3 5 5 271 303.6 6 6 284 307.7 7 7 296 307.2 8 8 291 294.3 9 9 285 271.8
10 10 257 252.7 11 11 242 246.1 12 12 246 248.1 13 13 257 246.0 14 14 205 230.0 15 15 186 200.5 16 16 192 166.6 17 17 174 139.8 18 18 147 126.3 19 19 132 124.9 20 20 102 128.8 21 21 121 129.6 22 22 130 122.4 23 23 103 106.7 24 24 78 86.3 25 25 77 66.5 26 26 63 51.7 27 27 54 43.6 28 28 52 41.4 29 29 48 42.3 30 30 32 43.0 31 31 29 41.3 32 32 35 36.5 33 33 26 29.4 34 35 34 38.2 36 37 22 22.8 38 45 30 33.2
1Scores are collapsed to create expected frequencies above 10; 2Observed score frequencies; 3Expected score frequencies.

523226-L-bw-Bebber523226-L-bw-Bebber523226-L-bw-Bebber523226-L-bw-BebberProcessed on: 27-8-2018Processed on: 27-8-2018Processed on: 27-8-2018Processed on: 27-8-2018 PDF page: 44PDF page: 44PDF page: 44PDF page: 44
32
Table A.2.3 Observed and expected (model implied) response probabilities for the low, medium and high score group, mean absolute differences (MAD’s), and Lagrange Multiplier tests (LM; df=2) for the 45 positive symptoms.
Group1 Low Medium High
Symptom Obs. Exp. Obs. Exp. Obs. Exp. MAD LM Prob. 02 .26 .26 .51 .51 .74 .74 .00 0,5 .76 03 .48 .49 .77 .75 .89 .90 .01 3,7 .16 04 .01 .01 .04 .04 .20 .20 .00 2,2 .33 05 .04 .04 .12 .12 .35 .34 .00 0,1 .94 07 .09 .10 .31 .30 .62 .62 .01 4,3 .11 08 .17 .17 .38 .39 .67 .66 .01 2,8 .25 09 .03 .02 .07 .08 .28 .27 .01 8,6 .01 12 .05 .05 .15 .15 .40 .39 .01 4,2 .12 13 .01 .01 .05 .05 .27 .28 .00 6,8 .03 18 .01 .01 .07 .07 .32 .33 .00 0,8 .67 19 .01 .01 .05 .05 .27 .27 .00 2,4 .30 20 .02 .01 .05 .05 .20 .20 .00 10,3 .01 23 .27 .29 .56 .54 .76 .76 .01 8,2 .02 24 .19 .19 .31 .32 .50 .49 .01 4,7 .09 25 .10 .12 .34 .33 .63 .63 .02 28,6 .00 26 .04 .04 .10 .11 .29 .28 .00 2,0 .37 27 .20 .20 .43 .45 .73 .72 .01 6,1 .05 30 .01 .01 .04 .04 .15 .14 .00 0,5 .78 32 .02 .02 .07 .08 .31 .30 .01 3,5 .17 34 .15 .16 .35 .33 .55 .56 .01 3,7 .16 35 .07 .08 .17 .16 .31 .31 .01 6,9 .03 36 .01 .01 .03 .04 .26 .26 .00 2,2 .33 37 .39 .40 .70 .70 .88 .88 .01 6,2 .04 38 .21 .22 .48 .48 .75 .75 .00 2,0 .37 46 .05 .04 .11 .12 .34 .34 .01 6,3 .04 49 .29 .30 .66 .65 .88 .88 .01 2,8 .25 50 .05 .05 .21 .20 .52 .53 .01 5,6 .06 52 .03 .03 .10 .11 .36 .36 .01 5,4 .07 55 .15 .14 .33 .34 .62 .61 .00 0,8 .66 56 .03 .03 .12 .12 .37 .36 .00 2,8 .24 57 .07 .06 .18 .20 .50 .49 .01 8,6 .01 60 .17 .16 .36 .37 .65 .64 .01 3,2 .21 61 .03 .03 .10 .12 .37 .35 .01 13,6 .00 64 .08 .07 .16 .17 .36 .37 .01 8,6 .01 65 .04 .04 .17 .18 .52 .52 .00 0,1 .94 67 .01 .01 .05 .05 .21 .21 .00 3,9 .14 68 .15 .16 .42 .41 .70 .70 .01 3,2 .21 69 .06 .07 .21 .20 .49 .48 .00 2,2 .33 74 .01 .01 .06 .07 .32 .32 .00 0,5 .76 75 .02 .02 .05 .05 .16 .16 .00 0,4 .84 76 .04 .04 .16 .15 .43 .43 .01 7,7 .02 77 .12 .15 .42 .40 .70 .70 .02 30,1 .00 79 .01 .00 .02 .03 .19 .19 .00 3,8 .15 84 .01 .01 .04 .04 .24 .25 .00 2,7 .26 90 .09 .10 .31 .30 .61 .61 .01 15.5 .00
1Min(Ni) = 1561, M(Ni) = 1805 & Max(Ni) = 2025.

523226-L-bw-Bebber523226-L-bw-Bebber523226-L-bw-Bebber523226-L-bw-BebberProcessed on: 27-8-2018Processed on: 27-8-2018Processed on: 27-8-2018Processed on: 27-8-2018 PDF page: 45PDF page: 45PDF page: 45PDF page: 45
33
Table A.2.4 Item- content, code and parameters for the 19 negative symptoms of the PQ.
Symptom PQ alfa beta I find that I can't express my feelings as well as I used to 14 1.202 0.169 I have lost a sense of who I am 16 1.346 0.431 I tend to be very quiet and keep in the background on social occasions 21 1.696 -0.130 I often feel that I have nothing to say or very little to say 33 1.541 0.020 I get very nervous when I have to make polite conversation 39 1.848 0.865 I find it hard to be emotionally close to other people 42 1.422 -0.219 I tend to avoid social activities with other people 43 2.184 0.301 I have been unable to enjoy things or experience pleasures I used to experience 48 1.598 -0.513
People find me aloof and distant 58 1.656 1.228 I tend to keep my feelings to myself 59 1.111 -1.052 I am not very good at returning social courtesies and gestures 66 1.759 1.790 I have felt like I am looking at myself as in a movie, or that I am a spectator in my own life 71 0.917 1.114
I have little interest in getting to know other people 78 1.769 0.906 I get extremely anxious when meeting people for the first time 80 1.717 1.406 I have felt like I am at a distance from myself, as if I am outside my own body or that a part of my body did not belong to me 81 0.999 1.963
I find that when something sad happens, I am no longer able to feel sadness, or when something happy happens, I can no longer feel happy 82 1.470 0.886
I feel unable to carry out everyday tasks because of fatigue or lack of "get up and go" 85 1.262 -0.919
I often avoid going to places where there will be many people because I will get anxious 87 1.615 0.882
I feel uninterested in the things I used to enjoy 89 1.675 0.013

523226-L-bw-Bebber523226-L-bw-Bebber523226-L-bw-Bebber523226-L-bw-BebberProcessed on: 27-8-2018Processed on: 27-8-2018Processed on: 27-8-2018Processed on: 27-8-2018 PDF page: 46PDF page: 46PDF page: 46PDF page: 46
34
Table A.2.5 Observed and expected score frequencies for the negative symptom dimension.
Score Range Observed1 Expected2 0 0 257 210.1 1 1 332 336.2 2 2 361 385.8 3 3 380 398.5 4 4 375 403.2 5 5 367 403.1 6 6 402 388.4 7 7 380 368.0 8 8 386 360.8 9 9 362 363.2
10 10 372 351.1 11 11 324 319.7 12 12 299 285.5 13 13 262 262.1 14 14 240 241.5 15 15 206 210.5 16 16 170 170.4 17 17 110 128.0 18 18 71 80.7 19 19 42 31.3
1 Observed score frequencies; 2Expected score frequencies.

523226-L-bw-Bebber523226-L-bw-Bebber523226-L-bw-Bebber523226-L-bw-BebberProcessed on: 27-8-2018Processed on: 27-8-2018Processed on: 27-8-2018Processed on: 27-8-2018 PDF page: 47PDF page: 47PDF page: 47PDF page: 47
35
Table A.2.6 Observed and expected (model implied) response probabilities for the low, medium and high score group, mean absolute differences (MAD’s), and Lagrange Multiplier tests (LM; df=2) for the 19 negative symptoms.
Group1 Low Medium High
Symptom Obs. Exp. Obs. Exp. Obs. Exp. MAD LM Prob. 14 .24 .24 .49 .49 .71 .71 .00 0.3 .87 16 .17 .19 .45 .43 .68 .68 .01 12.0 .00 21 .25 .24 .55 .57 .82 .82 .01 4.7 .10 33 .23 .23 .54 .53 .78 .79 .01 5.2 .07 39 .12 .10 .34 .34 .66 .67 .01 24.8 .00 42 .29 .29 .59 .58 .81 .81 .00 0.9 .63 43 .15 .14 .47 .48 .80 .81 .01 13.1 .00 48 .27 .28 .63 .62 .86 .86 .01 3.9 .14 58 .08 .08 .26 .26 .56 .57 .00 2.0 .36 59 .52 .52 .76 .76 .88 .88 .00 1.1 .58 66 .04 .05 .20 .19 .50 .51 .01 3.9 .15 71 .12 .13 .29 .28 .47 .47 .01 7.2 .03 78 .10 .10 .35 .33 .65 .66 .01 4.3 .12 80 .07 .07 .26 .25 .57 .58 .01 17.0 .00 81 .05 .06 .14 .14 .31 .30 .01 13.4 .00 82 .11 .12 .33 .32 .62 .61 .01 17.3 .00 85 .42 .42 .72 .71 .88 .88 .00 1.0 .62 87 .12 .11 .32 .33 .63 .63 .01 10.8 .00 89 .22 .22 .54 .53 .80 .80 .00 0.6 .74
1Min(Ni)=1514, M(Ni)=1754 & Max(Ni)=1932.

523226-L-bw-Bebber523226-L-bw-Bebber523226-L-bw-Bebber523226-L-bw-BebberProcessed on: 27-8-2018Processed on: 27-8-2018Processed on: 27-8-2018Processed on: 27-8-2018 PDF page: 48PDF page: 48PDF page: 48PDF page: 48
36
Table A.2.7 Detailed information results DIF-analyses.
Item Content LM MAD -/+* My thinking feels confused, muddled, or disturbed in some way. 100.2 .09 - I am unusually sensitive to noise. 75.7 .08 - I have difficulty organizing my thoughts or finding the right words. 56.8 .07 - At times I worry that something may be wrong with my mind. 49.2 .06 - Other people say that I wander off the topic or ramble on too much when I am speaking. 35.6 .06 -
I have heard things other people can’t hear like voices of people whispering or talking. 89.4 .07 +
I have been confused at times whether something I experienced was real or imaginary. 50.9 .07 +
* -: Adolescents have lower observed response probabilities than expected; +: Adolescents have higher observed response probabilities than expected.
2.5.4 A brief introduction to the CAT operation procedure
Computerized adaptive testing (CAT) is a type of computer-based testing where each person who
completes a questionnaire (respondent) gets his own set of items. Because each individual item is
informative about the relative standing of the respondent on the trait or dimension that is assessed
by the questionnaire, the respondent’s position is re-estimated with each item administered. This
allows for selection of those questions that are most informative regarding the respondent’s score
estimate, and skip items that are nearly uninformative. The purpose of this algorithm is to maximize
the efficiency of the assessment process.
An example
Adaptive testing is an iterative process. Let’s illustrate this using an imaginary example with positive
psychotic symptoms where respondents have to indicate whether certain positive symptoms are
either present (Yes) or absent (No). This questionnaire contains both milder (many or most
respondents indicate the presence of this symptom) and more severe (not many or only a few
respondents indicate the presence of this symptom) symptoms. For example, a ‘milder’ psychotic
symptom might be: “I feel that people are not what they seem to be” and a more ‘severe’ symptom
might be: “I hear voices talking to each other”.
When no symptoms have been administered yet, the best guess about the actual score of a
respondent (representing his position on the underlying psychosis dimension) would be the average
score of the group. Therefore, the first symptom is identical for each respondent and it is of
intermediate severity – it provides maximum information with regard to the mean-value. If a
respondent indicates the presence ‘Yes’ of this symptom of intermediate severity, the next symptom
to be presented is a more severe symptom. On the other hand, if the respondent indicates absence

523226-L-bw-Bebber523226-L-bw-Bebber523226-L-bw-Bebber523226-L-bw-BebberProcessed on: 27-8-2018Processed on: 27-8-2018Processed on: 27-8-2018Processed on: 27-8-2018 PDF page: 49PDF page: 49PDF page: 49PDF page: 49
37
(‘No’) of this symptom of intermediate severity, then the next symptom will be a milder symptom.
This process usually continues until the respondent’s test score is estimated with sufficient precision,
that is a level of reliability that is determined on beforehand. For individuals with varying levels of
severity, often a varying number of symptoms is required to reach the same level of measurement
precision. In this way, only ‘relevant’ symptoms are administered, that is only symptoms that match
the respondent’s severity level. In a way, one could say that CAT’s mimic the behavior of an
experienced interviewer, adapting subsequent items to the answers given to previous items. Because
of this, adaptive testing requires many fewer items than traditional (linear) testing where each
respondent gets the same set of items.
Illustration CAT principle
2.6 References
Birnbaum, A. (1968). Some latent trait models. In F. M. Lord, & M. R. Novick (Eds.), Statistical theories
of mental test scores. Reading, MA: Addison-Wesley.
Chang, W., Hui, C., Tang, J., Wong, G., Chan, S., Lee, E., & Chen, E. (2013). Impacts of duration of
untreated psychosis on cognition and negative symptoms in first-episode schizophrenia: A 3-
year prospective follow-up study. Psychological Medicine, 43(09), 1883-1893.

523226-L-bw-Bebber523226-L-bw-Bebber523226-L-bw-Bebber523226-L-bw-BebberProcessed on: 27-8-2018Processed on: 27-8-2018Processed on: 27-8-2018Processed on: 27-8-2018 PDF page: 50PDF page: 50PDF page: 50PDF page: 50
38
Chang, W. C., Tang, J. Y. M., Hui, C. L. M., Lam, M. M. L., Wong, G. H. Y., Chan, S. K. W., . . . Tso, S.
(2012a). Duration of untreated psychosis: Relationship with baseline characteristics and three-
year outcome in first-episode psychosis. Psychiatry Research, 198(3), 360-365.
Chang, W. C., Tang, J. Y., Hui, C. L., Lam, M. M., Chan, S. K., Wong, G. H., . . . Chen, E. Y. (2012b).
Prediction of remission and recovery in young people presenting with first-episode psychosis in
hong kong: A 3-year follow-up study. The Australian and New Zealand Journal of Psychiatry,
46(2), 100-108.
Choi, S. W. (2009). Firestar: Computerized adaptive testing simulation program for polytomous item
response theory models. Applied Psychological Measurement, 33(8), 644.
Embretson, S. E., & Reise, S. P. (2013). Item response theory for psychologists Psychology Press.
Evers, A., Lucassen, W., Meijer, R., & Sijtsma, K. (2010). COTAN beoordelingssysteem voor de kwaliteit
van tests. Amsterdam: Nederlands Instituut van Psychologen.
Glas, C. A. W. (2010). Preliminary manual of the software program multidimensional item response
theory (MIRT).
Glas, C. A. (1999). Modification indices for the 2-PL and the nominal response model. Psychometrika,
64(3), 273-294.
Goldman, H. H., Skodol, A. E., & Lave, T. R. (1992). Revising axis V for DSM-IV: A review of measures
of social functioning. Am J Psychiatry, 149(9), 1148-1156.
Hanssen, M. S. S. (2004). A continuous psychosis phenotype: From description to prediction (Doctoral
Dissertation).

523226-L-bw-Bebber523226-L-bw-Bebber523226-L-bw-Bebber523226-L-bw-BebberProcessed on: 27-8-2018Processed on: 27-8-2018Processed on: 27-8-2018Processed on: 27-8-2018 PDF page: 51PDF page: 51PDF page: 51PDF page: 51
39
Ising, H. K., Veling, W., Loewy, R. L., Rietveld, M. W., Rietdijk, J., Dragt, S., . . . van der Gaag, M.
(2012). The validity of the 16-item version of the prodromal questionnaire (PQ-16) to screen for
ultra high risk of developing psychosis in the general help-seeking population. Schizophrenia
Bulletin, 38(6).
Johns, L. C., & van Os, J. (2001). The continuity of psychotic experiences in the general population.
Clinical Psychology Review, 21(8), 1125-1141.
Lin, A., Wood, S., Nelson, B., Brewer, W., Spiliotacopoulos, D., Bruxner, A., . . . Yung, A. (2011).
Neurocognitive predictors of functional outcome two to 13 years after identification as ultra-
high risk for psychosis. Schizophrenia Research, 132(1), 1-7.
Loewy, R. L., Bearden, C. E., Johnson, J. K., Raine, A., & Cannon, T. D. (2005). The prodromal
questionnaire (PQ): Preliminary validation of a self-report screening measure for prodromal and
psychotic syndromes. Schizophrenia Research, 79(1), 117-125.
Marshall, M., Lewis, S., Lockwood, A., Drake, R., Jones, P., & Croudace, T. (2005). Association
between duration of untreated psychosis and outcome in cohorts of first-episode patients: A
systematic review. Archives of General Psychiatry, 62(9), 975-983.
McGorry, P. D., Killackey, E., & Yung, A. (2008). Early intervention in psychosis: Concepts, evidence
and future directions. World Psychiatry : Official Journal of the World Psychiatric Association
(WPA), 7(3), 148-156.
McGorry, P. D., Yung, A. R., & Phillips, L. J. (2003). The "close-in" or ultra high-risk model: A safe and
effective strategy for research and clinical intervention in prepsychotic mental disorder.
Schizophrenia Bulletin, 29(4), 771-790.

523226-L-bw-Bebber523226-L-bw-Bebber523226-L-bw-Bebber523226-L-bw-BebberProcessed on: 27-8-2018Processed on: 27-8-2018Processed on: 27-8-2018Processed on: 27-8-2018 PDF page: 52PDF page: 52PDF page: 52PDF page: 52
40
Miller, T. J., McGlashan, T. H., Rosen, J. L., Somjee, L., Markovich, P. J., Stein, K., & Woods, S. W.
(2002). Prospective diagnosis of the initial prodrome for schizophrenia based on the structured
interview for prodromal syndromes: Preliminary evidence of interrater reliability and predictive
validity. American Journal of Psychiatry, 159(5), 863-865.
Pogue-Geile, M. F., & Zubin, J. (1987). Negative symptomatology and schizophrenia: A conceptual
and empirical review. International Journal of Mental Health, 3-45.
R Core Team. (2014). R: A language and environment for statistical computing. Vienna, Austria: R
Foundation for Statistical Computing.
Reise, S. P., & Waller, N. G. (2009a). Item response theory and clinical measurement. Annual Review
of Clinical Psychology, 5, 27-48.
Reise, S. P., & Waller, N. G. (2009b). Item response theory and clinical measurement. Annual Review
of Clinical Psychology, 5, 27-48.
Sands, W. A., Waters, B. K., & McBride, J. R. (1997). Computerized adaptive testing: From inquiry to
operation. American Psychological Association.
van der Gaag, M., Nieman, D. H., Rietdijk, J., Dragt, S., Ising, H. K., Klaassen, R. M., . . . Linszen, D. H.
(2012). Cognitive behavioral therapy for subjects at ultrahigh risk for developing psychosis: A
randomized controlled clinical trial. Schizophrenia Bulletin, 38(6), 1180-1188.
Van Os, J., Verdoux, H., Maurice-Tison, S., Gay, B., Liraud, F., Salamon, R., & Bourgeois, M. (1999).
Self-reported psychosis-like symptoms and the continuum of psychosis. Social Psychiatry and
Psychiatric Epidemiology, 34(9), 459-463.
Van Os, J., Hanssen, M., Bijl, R. V., & Ravelli, A. (2000). Strauss (1969) revisited: A psychosis
continuum in the general population? Schizophrenia Research, 45(1), 11-20.

523226-L-bw-Bebber523226-L-bw-Bebber523226-L-bw-Bebber523226-L-bw-BebberProcessed on: 27-8-2018Processed on: 27-8-2018Processed on: 27-8-2018Processed on: 27-8-2018 PDF page: 53PDF page: 53PDF page: 53PDF page: 53
41
Van Os, J., Linscott, R. J., Myin-Germeys, I., Delespaul, P., & Krabbendam, L. (2009). A systematic
review and meta-analysis of the psychosis continuum: Evidence for a psychosis proneness–
persistence–impairment model of psychotic disorder. Psychological Medicine, 39(02), 179-195.
Wainer, H. (2010). Computerized adaptive testing: A primer (Second edition ed.). New York:
Routledge.
Wiberg, M., & Sundström, A. (2009). A comparison of two approaches to correction of restriction of
range in correlation analysis. Practical Assessment, Research & Evaluation, 14(5), 2.
Wigman, J. T. W. (2011). Persistance of the extended psychosis phenotype: Link between vulnerability
and clinical need (Doctoral Dissertation).
Wunderink, L., Sytema, S., Nienhuis, F. J., & Wiersma, D. (2009). Clinical recovery in first-episode
psychosis. Schizophrenia Bulletin, 35(2), 362-369.
Yung, A. R., Nelson, B., Stanford, C., Simmons, M. B., Cosgrave, E. M., Killackey, E., . . . McGorry, P. D.
(2008). Validation of “prodromal” criteria to detect individuals at ultra high risk of psychosis: 2
year follow-up. Schizophrenia Research, 105(1), 10-17.
Yung, A. R., Phillips, L. J., McGorry, P. D., McFarlane, C. A., Francey, S., Harrigan, S., . . . Jackson, H. J.
(1998). Prediction of psychosis: A step towards indicated prevention of schizophrenia. The
British Journal of Psychiatry.
Yung, A. R., Phillips, L. J., Yuen, H. P., Francey, S. M., McFarlane, C. A., Hallgren, M., & McGorry, P. D.
(2003). Psychosis prediction: 12-month follow up of a high-risk (“prodromal”) group.
Schizophrenia Research, 60(1), 21-32.

523226-L-bw-Bebber523226-L-bw-Bebber523226-L-bw-Bebber523226-L-bw-BebberProcessed on: 27-8-2018Processed on: 27-8-2018Processed on: 27-8-2018Processed on: 27-8-2018 PDF page: 54PDF page: 54PDF page: 54PDF page: 54
42
Yung, A. R., Yuen, H. P., McGorry, P. D., Phillips, L. J., Kelly, D., Dell'Olio, M., . . . Stanford, C. (2005a).
Mapping the onset of psychosis: The comprehensive assessment of At-Risk mental states.
Australian and New Zealand Journal of Psychiatry, 39(11-12), 964-971.
Yung, A. R., Yuen, H. P., McGorry, P. D., Phillips, L. J., Kelly, D., Dell'Olio, M., . . . Stanford, C. (2005b).
Mapping the onset of psychosis: The comprehensive assessment of At-Risk mental states.
Australian and New Zealand Journal of Psychiatry, 39(11-12), 964-971.
Yung, A. R., McGorry, P. D., McFarlane, C. A., Jackson, H. J., Patton, G. C., & Rakkar, A. (1996).
Monitoring and care of young people at incipient risk of psychosis. Schizophrenia Bulletin, 22(2),
283-303.

523226-L-bw-Bebber523226-L-bw-Bebber523226-L-bw-Bebber523226-L-bw-BebberProcessed on: 27-8-2018Processed on: 27-8-2018Processed on: 27-8-2018Processed on: 27-8-2018 PDF page: 55PDF page: 55PDF page: 55PDF page: 55
43
Chapter 3
Identifying levels of general distress in first line mental health services: Can GP- and eHealth clients’
scores be meaningfully compared?
A version of this chapter was published as: van Bebber, J., Wigman, J. T.W., Wunderink, L., Tendeiro, J.N., Wichers, M., Broeksteeg, J., Schrieken, B., Sytema, S., and Meier, R.R. (2017). Identifying levels of general distress in first line mental health services: Can GP- and eHealth clients’ scores be meaningfully compared? BMC psychiatry, 17(1), 382; DOI: 10.1186/s12888-017-1552-3.
Abstract
The Four-Dimensional Symptom Questionnaire is a self-report questionnaire developed in the
Netherlands to distinguish non-specific general distress from depression, anxiety, and somatization.
This questionnaire is often used in different populations and settings and there is a paper-and-pencil
and computerized version. We used item response theory to investigate whether the 4DSQ measures
the same construct (structural equivalence) in the same way (scalar equivalence) in two samples
comprised of primary mental health care attendees: (i) clients who visited their General Practitioner
responded to the 4DSQ paper and pencil version, and (ii) eHealth clients responded to the 4DSQ
computerized version. Specifically, we investigated whether the distress items functioned differently
in eHealth clients compared to General Practitioners’ clients and whether these differences lead to
substantial differences at scale level. Results showed that in general structural equivalence holds for
the distress scale. This means that the distress scale measures the same construct in both General
Practitioners’ clients and eHealth clients. Furthermore, although eHealth clients have higher
observed distress scores than General Practitioners’ clients, application of a multiple group
generalized partial credit response model suggests that scalar equivalence holds. The same cutoff
scores can be used for classifying respondents as having low, moderate and high levels of distress in
both settings.

523226-L-bw-Bebber523226-L-bw-Bebber523226-L-bw-Bebber523226-L-bw-BebberProcessed on: 27-8-2018Processed on: 27-8-2018Processed on: 27-8-2018Processed on: 27-8-2018 PDF page: 56PDF page: 56PDF page: 56PDF page: 56
44
3.1 Introduction
3.1.1 Background In many European countries, including the Netherlands, consulting a General Practitioner (GP) is a
formal prerequisite for referral to specialized care providers in case of mental health problems. As
such, GPs fulfill the role of gatekeeper for mental health services and with this task comes the need
for adequate and efficient methods to screen for possible mental health problems. Many tools such
as structured interviews and questionnaires have been developed to facilitate this process, and the
latter are also incorporated in assessment batteries of various eHealth providers. The Four-
Dimensional Symptom Questionnaire (4DSQ; Terluin, 1996) is such a questionnaire. The 4DSQ is a
self-report questionnaire developed in the Netherlands to distinguish non-specific general distress
from depression, anxiety, and somatization.
As with many questionnaires, the 4DSQ is often administered in various populations in
different settings and with different mediums: A test or questionnaire may be designed for
implementation in, for example, the general population, the working population, or the population
of ambulant health care recipients. With setting, we refer to the specific situation in which the
questionnaire is applied (e.g., outpatient clinic or hospital). With medium, we refer to the way data
are collected (e.g., experiments or structured interviews). Note that a test or questionnaire applied in
practice always has a specific combination of these three factors. To keep things simple, we will use
the term application mode for the specific combination of these three factors in the remainder of
this introduction.
What can we learn from the literature regarding equivalence of application modes? With
regard to medium effects (paper and pencil versus computerized), perhaps the most important
lesson is that different ‘research designs’ lead to different conclusions. Where the study design is
experimental, data appear to be equivalent in terms of factorial structure, reliability, means and
standard deviations (Campos et al., 2011). When data are collected by different mediums in applied
settings though, especially core coefficients of score distributions diverge. That is, significant and
relevant differences in central tendency and spread appear between both conditions due to, for
example, differential social-desirability responding combined with effects of differences in
demographic backgrounds of respondents between data collection frames (Buchanan, 2002). In
many clinical settings data are not collected anonymously, and data are collected using different
mediums and from various populations. In all of these cases, there is a great need for information
about whether the test or questionnaire assesses the same construct across application modes. This

523226-L-bw-Bebber523226-L-bw-Bebber523226-L-bw-Bebber523226-L-bw-BebberProcessed on: 27-8-2018Processed on: 27-8-2018Processed on: 27-8-2018Processed on: 27-8-2018 PDF page: 57PDF page: 57PDF page: 57PDF page: 57
45
property has been labeled structural equivalence (Bolt, Hare, Vitale, & Newman, 2004; Van de Vijver
& Leung, 1997).
Furthermore, it is important to verify whether scale scores have the same meaning across
application modes. This property is referred to as scalar equivalence. That is, equal scale scores
should reflect the same levels of the underlying trait in various application modes. This is because
scalar equivalence is a prerequisite for meaningful score comparisons across application modes and
thus also for justifying the usage of, for example, the same cutoff scores for classification of
respondents. The framework of Item Response Theory (IRT) is very appealing because of its
equivalence property (Embretson & Reise, 2013). That is, differences in item functioning may be
characterized in a way that is not affected by differences in the trait distributions between
application modes.
In the research discussed in this paper, both samples consisted of individuals who seek help-
and, or assistance from primary mental health care providers. The setting was an intake procedure at
General Practitioner practices for the first sample, and an intake procedure of an eHealth provider
for the second sample. The medium was a paper and pencil administration for the first sample, and a
computerized administration for the second. Note that the eHealth setting implied online testing. We
refer to the first sample as the GP sample, and to the second sample as the eHealth sample in the
remainder of this article.
3.1.2 Aims of this study In this study, we compared the psychometric properties of the 4DSQ distress scale in two samples of
which the application modes differed with respect to the factors that have been explained above.
More specifically, we examined whether
(i) the distributions of total scores differed between samples in terms of central tendency and
spread;
(ii) a suitable IRT model would fit the data;
(iii) the distress items functioned similarly in both samples (structural equivalence);
(iv) equal total scores reflected the same levels of distress in both groups (scalar equivalence);
(v) the two samples differ in their distribution of latent scores, and
(vi) measurement precision differs between samples and along the latent distress continuum.

523226-L-bw-Bebber523226-L-bw-Bebber523226-L-bw-Bebber523226-L-bw-BebberProcessed on: 27-8-2018Processed on: 27-8-2018Processed on: 27-8-2018Processed on: 27-8-2018 PDF page: 58PDF page: 58PDF page: 58PDF page: 58
46
3.2 Methods
3.2.1 The Four-Dimensional Symptom Questionnaire (4DSQ): background information and existing research The 4DSQ is a self-report questionnaire that can be used to distinguish non-specific general distress
(16 items) from depression (6 items), anxiety (12 items), and somatization (16 items). Although
initially developed for primary care settings, its validity has also been demonstrated in working
populations (Terluin, Rhenen, Schaufeli, & De Haan, 2004) and in ambulant mental health services
(Terluin, Smits, & Miedema, 2014). Respondents have to indicate the frequency of specific symptom
experiences during the past week on a five-point scale (‘Not present’, ‘Sometimes’, ‘Regularly’,
‘Often’, and ‘Constantly present’). In practice, the three highest item scores (2-4) are recoded into a
2-score to avoid response bias caused by extreme responding (Terluin, 1996). Recoded item scores
are summed for each scale. The total score for the distress scale thus ranges from 0 to 32. In practice
(Terluin, 1996), scores lower than 11 are interpreted as representing low levels of distress, scores in
between 11 and 20 represent moderate levels of distress, and scores larger than 20 represent high
levels of distress. These cutoff values are based on clinical experience and expertise; that is,
observations that were made by clinicians in a non-systematic way (Terluin, 2016; personal
communication). Note that the same cut-off scores for classifying respondents as having low,
moderate, and high levels of distress are used in each application mode, though it has not yet been
proven that scalar equivalence holds between application modes. And prove that the same raw
scores reflect the same levels of distress in both application modes would justify using the same cut-
off values in both application modes.
Terluin (Terluin et al., 2006) found that the scores on the four scales can be described
adequately by unidimensional (common) factor models, and all four scales were found to be
invariant with respect to gender, age and educational level of respondents (Terluin, Smits, Brouwers,
& de Vet, 2016). Furthermore, the model with four factors showed a better fit than alternative
models where, for example, the items of the depression scale were allowed to load on two separate
factors (Terluin et al., 2006).
Professionals applying the 4DSQ find the distress scale most informative, and compared to
the other subscales of the instrument, it shows the strongest associations with various mental health
indicators (see next paragraph). This makes the distress scale most often used in practice. Therefore,
the focus of this study was to further investigate the psychometric characteristics of this scale.
Terluin et al. (2004, 2014) found that the reliability of the distress scale (coefficient alpha) was
approximately .90 for both primary care clients and outpatients of mental health providers.

523226-L-bw-Bebber523226-L-bw-Bebber523226-L-bw-Bebber523226-L-bw-BebberProcessed on: 27-8-2018Processed on: 27-8-2018Processed on: 27-8-2018Processed on: 27-8-2018 PDF page: 59PDF page: 59PDF page: 59PDF page: 59
47
The structure of the nomological network was in accordance with the theoretical
expectations: the distress scale correlated positively with other nonspecific measures of distress like
the General Health Questionnaire (rxy = .58) and the Maastricht Questionnaire (rxy = .46), showing
good convergent content validity. One frequently stated criticism is that the divergent content
validity of the scale is relatively weak, because the distress scale also correlated highly with various
measures of depression and anxiety, including the other 4DSQ subscales (Terluin et al., 2006).
However, this is a common phenomenon for measures of distress, depression, and anxiety (Henry &
Crawford, 2005; Terluin et al., 2016). Furthermore, regarding predictive validity, moderate positive
associations with stress-related measures such as life events (R2 = 11%) and psychosocial problems
(R2 = 30%) were found, with personality traits as Neuroticism (R2 = 45%) and Mastery (R2 = 29%), and
also moderate negative relationships with indicators of social (R2 = 31%) and occupational
functioning (R2 = 29%) were found (Terluin et al., 2006).
3.2.2. Participants 1142 clients who visited their GP in the Netherlands between 2004 and 2011 with need for mental
health care were asked to fill out the paper and pencil version of the 4DSQ at their GPs’ practices. We
selected those 1017 clients who filled out the questionnaire without omitting any item of the distress
scale for further analysis. Mean age was 40.2 (SD = 14.9, age range 11-85 years), and 63.3% were
female.
The eHealth sample comprised 1409 clients who contacted the Dutch eHealth provider
Interapy2 in 2015 with need for mental health care. These individuals completed the intake
procedure that included the online 4DSQ. Mean age in this sample was 35.7 (SD = 13.5, range 12-90),
and 73.5% were female.
3.2.3 The Generalized Partial Credit Model (GPCM) To analyze the data, we used the GPCM (Muraki, 1997). The GPCM is an IRT model for polytomous
items. In IRT, item categories (or boundaries between item categories) and persons are placed on a
common latent scale (often denoted by ). This latent scale represents a continuous construct, for
example, depression. The distribution of persons on this latent scale may be conceived as
2 Interapy® originated from the University of Amsterdam. It is a certified provider for primary- and specialized mental health care, with a special interest in research. For more than ten years, the organization has been offering evidence-based eHealth interventions for various mental health disorders. Only secured/protected websites are used for the contact between coach/therapist and health care recipient.

523226-L-bw-Bebber523226-L-bw-Bebber523226-L-bw-Bebber523226-L-bw-BebberProcessed on: 27-8-2018Processed on: 27-8-2018Processed on: 27-8-2018Processed on: 27-8-2018 PDF page: 60PDF page: 60PDF page: 60PDF page: 60
48
approximately standardized. An IRT-model specifies the way in which characteristics of items and
respondents influence (changes in) expected item scores of respondents. The GPCM is a
generalization of the Rasch model (Rasch, 1960) to polytomous items. Each item with k response
categories is characterized by a discrimination parameter (a) and a set of k-1 interception (dk-1,k)
parameters. The category interception parameters denote the locations on the latent trait at which
the probability of endorsing the two corresponding response categories is equal. The discrimination
parameter expresses how fast expected item scores change when differences between person
parameter and item category interception parameters increase. Contrary to the Rasch model, in the
GPCM items are allowed to differ in discrimination. The interested reader is referred to the appendix
for more technical information on the GPCM. The GPCM is based on the related assumptions of
unidimensionality and local stochastic independence (LSI; antonym is Local Dependence, LD).
Unidimensionality implies that the item scores can be explained by a dominant single latent variable
(in this case distress) and LSI implies that the item scores are (essentially) uncorrelated when
controlling for this latent variable. Before an IRT model is applied to empirical data, these
assumptions should be checked (for more details on IRT, see Du Toit, (2003) or Embretson & Reise
(2013).
3.2.4 Differential Item Functioning (DIF) and Multiple Group IRT analysis (MGIRT) The relationship between trait level and expected item scores may differ between groups. In the
context of IRT, this phenomenon is referred to as Differential Item Functioning (DIF). When exploring
DIF in clinical scales, one may investigate (i) whether specific symptoms are more important (i.e., are
more differentiating) for assessing a psychopathological domain in one group than in the other, and
(ii) whether specific symptoms become manifest at different levels of psychopathology between
groups. DIF of the first kind would result in different discrimination parameters between groups and
DIF of the second kind would result in different interception parameters between groups. For the
interested reader, the technical details of this procedure are given in the Appendix.
When item parameters differ between groups, expected item scores of respondents with
equal trait levels that belong to different groups differ. The accumulation of these effects at the scale
level may lead to differential test functioning (DTF). In this case, equal total scores of respondents
between groups may actually reflect different (latent) trait levels. The relationship between total
scale score metric and latent trait metric is expressed by the so-called Test Characteristic Curves
(TCC). When these curves differ substantially between groups, comparisons of individual scores
across groups should not be based on total scale scores but on latent trait levels. Consequently, using
the total scale score metric in that case would not be appropriate for defining equal cutoff scores for
respondents of both groups.

523226-L-bw-Bebber523226-L-bw-Bebber523226-L-bw-Bebber523226-L-bw-BebberProcessed on: 27-8-2018Processed on: 27-8-2018Processed on: 27-8-2018Processed on: 27-8-2018 PDF page: 61PDF page: 61PDF page: 61PDF page: 61
49
Multiple group IRT-analysis (MGIRT) offers the possibility to use data from multiple groups
for deriving item parameter estimates, while model-fit is still assessed for each group separately.
Increasing sample size leads to more precise item parameter estimates. All items and all persons may
be placed on a common latent scale, anchoring the scale by using the theta distribution in the
reference group. Furthermore, in case of more than two non-overlapping groups, differential item
functioning can be assessed for each subgroup (or ‘focal groups’) relative to a chosen reference
group.
When some items function differently between groups, it can be investigated whether DIF-
effects cancel out (or are negligible) at the scale level as expressed by equal (or nearly equal) TCCs
across groups. Even when this is not the case, latent distributions can be used for meaningful group
comparisons, because these are based on collections of items that do not exhibit DIF with respect to
the groups compared.
3.2.5 MGIRT Analyses All IRT analyses were performed on the recoded (0-2) item scores, because these are used in
practice. First, structural equivalence between the two samples (i.e. GP and eHealth clients) was
investigated. To do this, we first conducted a multiple group analysis where item parameters were
constrained to be equal across samples. In order to identify the latent distress continuum, we
decided to restrict the mean theta-value of GP clients to equal zero and the standard deviation of
theta values to equal one. The mean and standard deviation of theta-values in the sample of eHealth
clients were computed using this restriction in combination with the item parameters estimated. We
investigated model fit in both groups separately for each item, and inspected DIF effects across
samples. Because the test statistics used for both assessing model fit and assessing DIF effects are
very sensitive with large samples, we inspected the differences between observed and expected
category score frequencies for different score levels (i.e., the total score without the item targeted)
for those items that showed the worst fit (p <. 01). Instead of doing this for each score level, we
collapsed score levels in such a way as to create expected category score frequencies of at least one
hundred persons in each cell. Additionally, local independence between all item pairs was
investigated. The interested reader is again referred to the appendix for technical details.
Second, in case some items would function differently across groups, we would examine
scalar equivalence by comparing the TCCs for both groups (based on the augmented model in which
some items have group-specific parameter values). Additionally, we compared the latent distress
distributions between groups in terms of central tendency (means) and spread (standard deviations).

523226-L-bw-Bebber523226-L-bw-Bebber523226-L-bw-Bebber523226-L-bw-BebberProcessed on: 27-8-2018Processed on: 27-8-2018Processed on: 27-8-2018Processed on: 27-8-2018 PDF page: 62PDF page: 62PDF page: 62PDF page: 62
50
Third, measurement precision, a local concept within the framework of IRT, was compared
between groups. The information that individual items and sets of items provide depends on (i) the
discriminative power of the items, and, (ii) the position ( -value) of respondents on the latent scale.
The closer the positions of respondent and item are on the latent continuum, the more information
an item will provide for this specific respondent. With respect to distress, this reflects how well the
intensity-levels of symptoms match clients’ levels of distress. The more information items provide,
the lower the measurement error for individual distress scores. How much information an item
provides along the latent scale is expressed by Item Information Functions (IIFs), and these functions
may be summed to Test Information Functions (TIFs). These express how much information is
provided at the scale level. Standard errors that are conditional on the latent trait level are simple
inverse functions of the TIFs.
In order to investigate structural equivalence, we could also have used the well-known
technique of multigroup confirmatory factor analysis. Note that this technique could not have been
used to investigate the property of scalar equivalence, because with factor analytic techniques,
differences in item means between groups are typically ignored by standardizing items scores prior
to analysis. Furthermore, because measurement precision is assumed to be a global concept in the
context of factor analysis, we would not have been able to investigate whether measurement
precision varies along the latent distress continuum.
We used IRTPRO, version 3 (Cai, Du Toit, & Thissen, 2011) for deriving item- and person
parameter estimates in the MGIRT, for performing the DIF-analyses, and for generating the TCCs and
TIFs for both groups.
3.3 Results
3.3.1 Sample Descriptives for both groups The means, standard deviations, and resulting standardized differences on the 4DSQ distress scale in
both groups are displayed in Table 3.1. EHealth clients scored significantly (F = 136.09, p < .01) higher
than GP clients and the spread of the scale scores was lower for eHealth clients than for GP
attendees.

523226-L-bw-Bebber523226-L-bw-Bebber523226-L-bw-Bebber523226-L-bw-BebberProcessed on: 27-8-2018Processed on: 27-8-2018Processed on: 27-8-2018Processed on: 27-8-2018 PDF page: 63PDF page: 63PDF page: 63PDF page: 63
51
Table 3.1 Descriptive statistics 4DSQ distress scale and frequencies of category scores within the samples.
GP attendees EHealth clients D* Mean SD Mean SD Distress 19.76 8.86 23.47 6.79 -0.48 Low distress (Sx 19.8 % 5.3 %
x 27.6 % 24.6 % High distress (Sx 52.6 % 70.2 %
* Standardized difference.
The percentage of clients that reported moderate levels of distress was comparable between
groups. However, GP clients’ levels of distress fall much more often in the lowest category, whereas
eHealth clients’ levels of distress fall much more often in the highest category.
3.3.2 IRT-analyses: GP clients As discussed in the methods section, the principle of LSI is crucial for justified application of IRT
models. Two item pairs of the distress scale were expected to be problematic (violating the
assumption of local independence) due to the fact that the items of the first pair both refer to
sleeping problems and items of the second pair both to residual effects of traumatic experiences. We
decided to remove the item of each pair that was lower in discriminative power from further
analyses.
In Table 3.2, the tests of item model fit for GP clients are displayed. Items 17, 22, and 37
showed misfit according to a strict p < .01 criterion. Note that the total sample size is large, so these
tests are very powerful in detecting slight deviations from the postulated models. In order to get a
better view on how ‘bad’ things actually were, Table 3 provides expected (model-based) and
observed score frequencies in each category for item 22 (Listlessness), which was most problematic
according to the 2-test result. Differences larger than 10 are displayed bold. The last two columns
provide observed and expected mean scores for each score level.

523226-L-bw-Bebber523226-L-bw-Bebber523226-L-bw-Bebber523226-L-bw-BebberProcessed on: 27-8-2018Processed on: 27-8-2018Processed on: 27-8-2018Processed on: 27-8-2018 PDF page: 64PDF page: 64PDF page: 64PDF page: 64
52
Table 3.2 Item-wise 2-tests of model fit for GP-clients (0-2). Order Item stem (abbreviated) 2 df Probability 17 Feeling down or depressed 111.1 45 < .001 19 Worry 52.7 41 .104 20 Disturbed Sleep 68.7 51 .049 22 Listlessness 120.6 44 < .001 25 Tense 47.4 42 .260 26 Easily irritated 45.9 47 .519 29 That you just can’t do anything anymore 56.5 36 .016 31 (…) take any interest in the people and things around you 37.1 38 .513 32 That you can’t cope anymore 25.4 37 .925 36 That you can’t face it anymore 46.6 33 .059 37 No longer feel like doing anything 79.1 35 < .001 38 Have difficulty in thinking clearly 65.5 45 .024 41 Did you easily become emotional 59.8 48 .117 48 (…) to put aside thoughts about any upsetting event(s) 67.2 49 .043
As can be seen from Table 3.3, the estimated item parameters for item 22 mimic the
response behavior of GP clients quite well: For some cells, observed and expected score frequencies
differ somewhat, but mean observed and expected item scores for each score level are always quite
close to one another.
We only briefly summarize the most important findings with respect to local independence.
Item 20, Disturbed sleep, had moderate LD ( 2 = 7.5) with the other items of the distress scale. The 2-values for all other items did not exceed 5, and most were even smaller than three. Because the
standardized 2-tests for local dependence is only approximately standardized (Chen & Thissen,
1997), most researchers consider only values greater than ten as indicating relevant local
dependence.
Because even for the ‘worst’ fitting item according to significance testing, the differences
between observed and expected item score frequencies are not large, combined with the fact that
the item parameters model the covariance among items appropriately, we decided that the GPCM is
appropriate to represent the response behavior of GP clients.
Table 3.3 Observed and expected score frequencies and mean item scores for different score levels, Item 22, GP-clients, (0-2).
Cat. 0 Cat. 1 Cat. 2 Rest score level Obs. Exp. Obs. Exp. Obs. Exp. M(Obs.) M(Exp.) 0-7 117 118 41 39 12 14 0.38 0.39 8-16 84 89 120 105 103 112 1.06 1.08 17-20 13 15 44 45 117 114 1.60 1.57 21-23 3 4 12 24 132 118 1.88 1.78 24-25 10 2 14 16 195 201 1.84 1.91 26 0 0 1 4 79 82 1.99 1.95

523226-L-bw-Bebber523226-L-bw-Bebber523226-L-bw-Bebber523226-L-bw-BebberProcessed on: 27-8-2018Processed on: 27-8-2018Processed on: 27-8-2018Processed on: 27-8-2018 PDF page: 65PDF page: 65PDF page: 65PDF page: 65
53
3.3.3 IRT-analyses: EHealth clients The table with item-wise 2-tests of model fit in the group of eHealth clients can be found in the
appendix (Table A3.2); here we summarize the most important findings. Again, for three items (17,
25, 29), the 2-test indicated misfit (p < .01), of which only item 17 (Feeling down or depressed) also
showed misfit in the group of GP clients. Comparing observed and expected item scores for items 25
(Tense) and 29 (Just can’t do it anymore) did not show large discrepancies. For item 17, the observed
and expected mean scores for each score level are similar (Table A3); however, for the lowest score
level (0-14), observed and expected responses differed more substantially.
Again, we only briefly report the most important findings with respect to LD: Two items
showed moderate LD with the other items: Item 17 (Feeling down or depressed; which also was most
problematic in terms of model fit; 2 = 7.5) and item 20 (Disturbed Sleep; 2 = 7.3). Again, the 2-
values for all other items did not exceed five, and most were even smaller than three indicating that
the model accounted for most covariance among all item pairs. Thus, also with respect to eHealth
clients, we again conclude that the chosen model describes the data quite well.
3.3.4 Differential Item Functioning (DIF) Only two DIF-tests were significant (p < .001)3 Having
difficulty in thinking clearly; 2 = 18.1
r
scaling GP-clients. The DIF-tests for the interception parameters of Item 17 (Feeling down or
depressed) was significant (17, 2= 12.2, df = 2), indicating that the lowest and highest response
categories were relatively more popular among eHealth clients (d01 = -0.59, d12 = -0.22) than among
GP-clients (d01 = -0.42, d12 = -0.06). Out of 42 parameters (14*3), only four differed between GP-
clients and eHealth clients. So with respect to structural equivalence, we conclude that this
assumption holds for most of the distress items.
In order to evaluate the impact of the differences we found at the scale level, we compared
the TCCs of both groups (Figure 3.1). Because only three (discriminative power item 38 and
interception parameters item 17) out of 42 item parameters differed between groups, we did not
expect substantial differences between the TCCs of both groups.
3 A detailed description of the procedure we used to test items for DIF can be found in the appendix in the section Technical details DIF tests.

523226-L-bw-Bebber523226-L-bw-Bebber523226-L-bw-Bebber523226-L-bw-BebberProcessed on: 27-8-2018Processed on: 27-8-2018Processed on: 27-8-2018Processed on: 27-8-2018 PDF page: 66PDF page: 66PDF page: 66PDF page: 66
54
Figure 3.1 Test characteristic curves distress scale 4DSQ for GP-clients and eHealth clients.
Figure 3.1 confirms our expectation: the two graphs are nearly identical. In fact, it is difficult
to discriminate between continuous and dashed line. The maximum difference in expected scale
scores emerges at = -1.5, where the expected scale score of GP-clients is .12 points higher than that
of eHealth clients. Because the combined effect of all DIF-effects is negligible at the scale level, the
assumption of scalar equivalence holds, and we can use the same cutoff values in both groups for
classifying clients as having low, medium, and high levels of distress.
In order to link the cutoff scores (Sx x x
the total score metric to the IRT-metric, we applied equipercentile linking (Kolen & Brennan, 2004) as
follows: We took the GP-sample as reference, because this was the primary group for which the
instrument was developed. In the sample of GP clients, 19.8% have a total score of ten or lower, and
this total score (Sx = 10) corresponds to a theta vale of -0.82. 47.4% of GP clients have a total score
lower than 21, and this total score corresponds to a theta value of -0.10. Because scalar equivalence
holds, these theta values can be used as cutoff scores for classifying clients of both groups:
0
2
4
6
8
10
12
14
16
18
20
22
24
26
-3 -2 -1 0 1 2 3
Expe
cted
Sco
re
Theta
Test Characteristic Curves
Expected Score, GP-patients Expected Score, e-health clients

523226-L-bw-Bebber523226-L-bw-Bebber523226-L-bw-Bebber523226-L-bw-BebberProcessed on: 27-8-2018Processed on: 27-8-2018Processed on: 27-8-2018Processed on: 27-8-2018 PDF page: 67PDF page: 67PDF page: 67PDF page: 67
55
a) Clow/medium: -0.82
b) Cmedium/high: -0.10
Note that, according to these cut-off values, approximately 50% of all GP clients and 70% of
all eHealth clients report experiencing high levels of distress.
Figure 3.2 shows the Test Information Functions (TIFs) and corresponding standard errors for
both groups. Recall from the DIF-analyses that only three item parameters differed between groups,
so we did not expect to see substantial differences between the TIFs of both groups. Because item 38
provides more information in the sample of eHealth clients, the total information for eHealth clients
(dashed line) is somewhat higher around the mean theta-value of GP clients than the information for
GP clients (continuous line). Measurement precision of the items peaks around the mean value ( =
0.00) of GP-clients, and is much lower for extreme values. Specifically for high scores ( > 2.00), the
estimated standard errors are four times as high as those around the mean value of GP clients.
Although the authors of this paper generally strongly favor using standard errors that are conditional
on the position of the latent continuum, for convenience, we also provide marginal reliabilities that
attempt to sum up the information provided in Figure 3.2: Because (i) the spread in levels of distress
is lower for eHealth clients than for GP-clients, and (ii) the distress items provide less information for
high scoring individuals, the marginal reliability for GP clients (rxx = .89) is somewhat higher than that
for eHealth clients (rxx = .83). It should be kept in mind that the standard error functions for both
groups are anything but straight lines, a characteristic that a single number summary might imply.

523226-L-bw-Bebber523226-L-bw-Bebber523226-L-bw-Bebber523226-L-bw-BebberProcessed on: 27-8-2018Processed on: 27-8-2018Processed on: 27-8-2018Processed on: 27-8-2018 PDF page: 68PDF page: 68PDF page: 68PDF page: 68
56
Figure 3.2 Test information functions and corresponding standard errors for both groups.
Note that measurement precision is very high around the two cutoff scores that were
derived earlier for classifying respondents as having moderate (- - -.10)
levels of distress. Because the TCCs of both groups were nearly identical, we can conclude that
eHealth clients do experience higher levels of distress than GP clients (MeHealth = 0.39 & MGP = 0.00),
and that the distress levels of GP clients are more heterogeneous than the distress levels of eHealth
clients (SDeHealth = 0.76, SDGP = 1.00).
3.3.5 Summary In general, the commonly estimated item parameters model the response behavior of both GP-
clients and eHealth clients quite well. The item that showed some degree of misfit in both groups
was item 17, Feeling down or depressed. But even for this item, model fit was reasonably good in
both groups. Also, the combined effect of all DIF-effects at the scale level, although statistically
significant, was found to be negligible. That is, equal total scores represent the same levels of distress
0
2
4
6
8
10
12
14
16
18
20
22
24
26
28
-3 -2 -1 0 1 2 3
Tota
l Inf
orm
atio
n
Theta
0.0
0.1
0.2
0.3
0.4
0.5
0.6
0.7
0.8
0.9
1.0
1.1
Standard Error
Total Information Curves
Total Information, GP-patients Total Information, e-health clientsStandard Error, GP-patients Standard Error, e-health clients

523226-L-bw-Bebber523226-L-bw-Bebber523226-L-bw-Bebber523226-L-bw-BebberProcessed on: 27-8-2018Processed on: 27-8-2018Processed on: 27-8-2018Processed on: 27-8-2018 PDF page: 69PDF page: 69PDF page: 69PDF page: 69
57
in both groups and measurement precision is approximately equal for equal levels of distress in both
groups.
3.4 Discussion
3.4.1 Main findings The focus of this study was on the generalizability of 4DSQ distress scores across the two samples of
GP clients and eHealth clients. We found that the scale measures the same construct in both groups
(structural equivalence) and that scale scores in both groups reflect the same levels of distress in
both groups (scalar equivalence). Thus, (i) total scores can be used to compare individuals of both
groups in terms of their levels of distress, and (ii) the use of equal cutoff scores for classifying
members of both groups as having low, medium, and high levels of distress is appropriate. EHealth
clients experience higher levels of distress than GP clients, but the variation in distress scores is less
for eHealth clients than for GP-clients. Furthermore, measurement precision of the 4DSQ distress
scale is good (SE < .32, ~ rxx > .90) for most levels of distress (-1.50
levels of distress that are extremely high ( > 2.00).
In a recent article (Terluin et al., 2016), a bifactor model was proposed as an appropriate
representation for the distress scale. To some readers, this finding may seem incompatible with the
use of a unidimensional IRT model. We argue that this is not the case, because (i) the general factor
in the bifactor model accounted for more than 95% of the common variance among items, and (ii)
the group factor was used by Terluin et al. to model residual covariance among item pairs. Hence,
the IRT model that we used and the bifactor model presented by Terluin et al. are very similar.
3.4.2 Strengths, limitations and future research One strength of this study was that by means of MGIRT, we were able to derive item parameter
estimates based on the data of both groups combined, while fit could still be assessed in both groups
separately. Furthermore, we hope that this article encourages clinical practitioners and researchers
applying tests and questionnaires in practice to follow the MGIRT approach we used in this article to
ensure that their instruments possess the properties of structural equivalence and scalar equivalence
in cases where these properties are required.
This study has also limitations. The most prominent one was that we had to remove two out
of sixteen items prior to analyses because of local dependencies among item pairs. So, the question
is whether we may generalize our findings about equivalence to the whole scale (consisting of 16
items). However, because the items that had to be removed correlated very highly with the other

523226-L-bw-Bebber523226-L-bw-Bebber523226-L-bw-Bebber523226-L-bw-BebberProcessed on: 27-8-2018Processed on: 27-8-2018Processed on: 27-8-2018Processed on: 27-8-2018 PDF page: 70PDF page: 70PDF page: 70PDF page: 70
58
item of the pair (.80 < rxy < .90), we argue that little item-specific information is lost by removing
these two items.
Also, the two samples differed in terms of setting (intake procedure at GP practices versus
intake procedure at an EHealth provider) and medium (paper and pencil versus online). In case we
would have found substantial differences at the scale level, as expressed by either differing TCCs or
TIFs between the two samples, we would have been unable to attribute these effects to either of
these factors. Furthermore, it should also be noted that, because the current study was not a
randomized controlled trial, we cannot exclude the possibility that factors that were not
incorporated in the study caused the differences we found in mean levels of distress between
groups, or the differences we found in spread between groups. At least to a certain degree.
It should also be noted that for the item that showed misfit in both groups (item 17, Feeling
down or depressed), the Dutch and English version diverged somewhat. The term used in the original
(Dutch) version is ‘neerslachtigheid’, for which the best translation would probably be dysphoria. This
word is not frequently used in English, so probably many respondents would not be familiar with it,
which explains the choice of the author for an alternative formulation of this item for the English
version. A tentative explanation for item misfit in both groups is that individuals that experience high
levels of depression respond differently to ‘dysphoria’ than individuals that experience low levels of
depression. High-scoring individuals are perhaps already more used to their level of depression and
because of that, more willing to agree with the content than low-scoring individuals, who might find
the term ‘too heavy’. However, this is only hypothetical and further research may provide an answer
to this hypothesis.
A final limitation is that we were unable to control for the possibility of a constant bias across
all distress items. That is, in case eHealth clients over-report the frequency of all symptom
experiences the same way across all items, DIF-tests are insensitive to this kind of bias (Bolt et al.,
2004). In order to check the hypotheses of such a structural reporting bias, objective information on
the distress-status (diagnosis of burnout and sick-leave for example) of respondents in both groups
would be required.

523226-L-bw-Bebber523226-L-bw-Bebber523226-L-bw-Bebber523226-L-bw-BebberProcessed on: 27-8-2018Processed on: 27-8-2018Processed on: 27-8-2018Processed on: 27-8-2018 PDF page: 71PDF page: 71PDF page: 71PDF page: 71
59
3.5 Appendix Table A 3.1 Distress items of the Four-Dimensional symptom questionnaire (4DSQ).
Order Item 17 During the past week, did you suffer from feeling down or depressed? 19 During the past week, did you suffer from worry? 20 During the past week, did you suffer from disturbed sleep? 22 During the past week, did you suffer from listlessness? 25 During the past week, did you feel tense? 26 During the past week, did you feel easily irritated? 29 During the past week, did you feel that you just can’t do anything anymore?
31 During the past week, did you feel that you can no longer take any interest in the people and things around you?
32 During the past week, did you feel that you can’t cope anymore? 36 During the past week, did you feel that you can’t face it anymore? 37 During the past week, did you no longer feel like doing anything? 38 During the past week, did you have difficulty in thinking clearly? 39 During the past week, did you have difficulty in getting to sleep? 41 During the past week, did you easily become emotional?
47 During the past week, did you ever have fleeting images of any upsetting event(s) that you have experienced?
48 During the past week, did you ever have to do your best to put aside thoughts about any upsetting event(s)?
Table A 3.2 Item- 2-tests of model fit for eHealth clients. Order Item stem X2 df Probability 17 Feeling down or depressed 115.2 43 p <.001 19 Worry 36.8 41 .657 20 Disturbed Sleep 70.2 47 .016 22 Listlessness 54.9 41 .073 25 Tense 69.9 42 .004 26 Easily irritated 56.4 45 .118 29 That you just can’t do anything anymore 62.2 36 .004 31 (…) take any interest in the people and things around you 42.0 36 .227 32 That you can’t cope anymore 28.6 34 .730 36 That you can’t face it anymore 51.2 34 .030 37 No longer feel like doing anything 20.7 34 .964 38 Have difficulty in thinking clearly 44.5 42 .365 41 Did you easily become emotional 39.9 45 .689 48 (…) to put aside thoughts about any upsetting event(s) 46.0 44 .391

523226-L-bw-Bebber523226-L-bw-Bebber523226-L-bw-Bebber523226-L-bw-BebberProcessed on: 27-8-2018Processed on: 27-8-2018Processed on: 27-8-2018Processed on: 27-8-2018 PDF page: 72PDF page: 72PDF page: 72PDF page: 72
60
Table A 3.3 Observed and expected score frequencies and mean item scores for each score level Item 17, eHealth clients.
Cat. 0 Cat. 1 Cat. 2 Rest score level Obs. Exp. Obs. Exp. Obs. Exp. M(Obs.) M(Exp.) 0-14 69 104 146 97 64 78 0.98 0.91 15-18 20 31 78 75 137 129 1.50 1.42 19-20 13 10 25 39 119 108 1.68 1.62 21-22 12 7 23 39 172 161 1.77 1.74 23-24 7 4 20 31 227 219 1.87 1.85 25 4 1 7 10 115 114 1.88 1.90 26 0 0 4 9 147 143 1.97 1.94
3.5.1 Technical information on the GPCM From these specifications, so-called category response curves can be deduced. In Figure A3.1, the
category response curves for Item 22 (recoded into three response options) are plotted. As can be
seen, with increasing trait level, the probability of choosing the lowest response category becomes
less likely and the probability of choosing the higher response options becomes more likely. At each
point on the latent continuum, these category response probabilities sum up to one. For example, a
person who is situated at approximately = -0.70, a response in the lowest category is equally likely
as a response in the second response category, and the highest response category is very unlikely.
Item j displayed in Figure A3.1 has three response options and is characterized by the following set of
intersection parameters: bj1 = -0.70, bj2 = -0.40.

523226-L-bw-Bebber523226-L-bw-Bebber523226-L-bw-Bebber523226-L-bw-BebberProcessed on: 27-8-2018Processed on: 27-8-2018Processed on: 27-8-2018Processed on: 27-8-2018 PDF page: 73PDF page: 73PDF page: 73PDF page: 73
61
Figure A3.1 Category response curves for Item 22.
0.0
0.2
0.4
0.6
0.8
1.0
-3 -2 -1 0 1 2 3
Pro
babi
lity
Theta
Q4DKL22_rec
G1, 0
G1, 1
G1, 2G2, 0
G2, 1
G2, 2

523226-L-bw-Bebber523226-L-bw-Bebber523226-L-bw-Bebber523226-L-bw-BebberProcessed on: 27-8-2018Processed on: 27-8-2018Processed on: 27-8-2018Processed on: 27-8-2018 PDF page: 74PDF page: 74PDF page: 74PDF page: 74
62
3.5.2 Technical details DIF tests To test specific items for possible DIF, an anchor is needed, consisting of items that define the trait
reasonably well and that are known to be unbiased. These items may be chosen based on previous
research findings or theoretical considerations. In case no such previous knowledge exists, all other
items of the scale serve as a preliminary anchor when an item is tested for DIF. In either case, testing
for DIF is an iterative purification procedure, see Birnbaum (1980): step by step, items that exhibit
DIF are removed from the anchor and items that do not exhibit DIF are added to the anchor. DIF-
tests essentially evaluate whether the increase in fit by freeing parameter estimates between groups
is worth the number of additional parameters that have to be estimated. Specifically, two models are
compared. The model were item parameter estimates are constrained to be equal between groups is
called compact model and the model were item parameters are freely estimated within each group is
called augmented model. Under the null hypothesis of no DIF, the difference between -2* the log-
likelihood of each models follows a chi-square distribution with degrees of freedom equal to the
number of additional parameters.
3.5.3 Detailed information on MGIRT analyses Specifically, we assessed item-wise model fit in each group by means of sum score based X2-statistics
(S-X2) that compare the frequencies of expected (model-based) category score frequencies to
observed category score frequencies. Because these test statistics are very sensitive with large
samples, we inspected the differences between observed and expected category score frequencies
for different score levels (i.e., the total score without the item targeted) for those items that showed
the worst fit (p < .01). Instead of doing this for each score level, we collapsed score levels in such a
way as to create expected category score frequencies of at least one hundred persons in each cell.
Additionally, to check the magnitude of possible LD among item pairs, we computed marginal X2-
statistics to test whether the residual correlations for each item with all other items are actually close
to zero. Because these X2-statistics are only approximately standardized, we followed the
recommendation of Chen and Thissen (1997) to consider values larger than 10 as large, indicating
likely LD, and values between 5 and 10 as indication of moderate LD.
3.6 References
Bolt, D. M., Hare, R. D., Vitale, J. E., & Newman, J. P. (2004). A multigroup item response
theory analysis of the psychopathy checklist-revised. Psychological Assessment, 16(2),
155.

523226-L-bw-Bebber523226-L-bw-Bebber523226-L-bw-Bebber523226-L-bw-BebberProcessed on: 27-8-2018Processed on: 27-8-2018Processed on: 27-8-2018Processed on: 27-8-2018 PDF page: 75PDF page: 75PDF page: 75PDF page: 75
63
Birnbaum, A. (1968). Some latent trait models. In F. M. Lord, & M. R. Novick (Eds.), Statistical theories
of mental test scores (). Reading, MA: Addison-Wesley.
Buchanan, T. (2002). Online assessment: Desirable or dangerous? Professional Psychology:
Research and Practice, 33(2), 148.
Cai, L., Du Toit, S., & Thissen, D. (2011). IRTPRO: Flexible, multidimensional, multiple
categorical IRT modeling [computer software]. Chicago, IL: Scientific Software
International.
Campos, Juliana Alvares Duarte Bonini, Zucoloto, M. L., Bonafé, F. S. S., Jordani, P. C., &
Maroco, J. (2011). Reliability and validity of self-reported burnout in college students: A
cross randomized comparison of paper-and-pencil vs. online administration. Computers
in Human Behavior, 27(5), 1875-1883.
Chen, W., & Thissen, D. (1997). Local dependence indexes for item pairs using item response
theory. Journal of Educational and Behavioral Statistics, 22(3), 265-289.
Du Toit, M. (2003). IRT from SSI: Bilog-MG, multilog, parscale, testfact Scientific Software
International.
Embretson, S. E., & Reise, S. P. (2013). Item response theory for psychologists Psychology
Press.
Henry, J. D., & Crawford, J. R. (2005). The short-form version of the depression anxiety stress
scales (DASS-21): Construct validity and normative data in a large non-clinical sample.
British Journal of Clinical Psychology, 44(2), 227-239.

523226-L-bw-Bebber523226-L-bw-Bebber523226-L-bw-Bebber523226-L-bw-BebberProcessed on: 27-8-2018Processed on: 27-8-2018Processed on: 27-8-2018Processed on: 27-8-2018 PDF page: 76PDF page: 76PDF page: 76PDF page: 76
64
Kolen, M., & Brennan, R. (2004). Test equating, linking, and scaling: Methods and practices.
Springer-Verlag, New York.
Muraki, E. (1997). A generalized partial credit model. Handbook of modern item response
theory (pp. 153-164) Springer.
Rasch, G. (1960). Probabilistic models for some intelligence and achievement tests.
Copenhagen: Danish Institute for Educational Research.
Terluin, B., Rhenen, W. V., Schaufeli, W. B., & De Haan, M. (2004). The four-dimensional
symptom questionnaire (4DSQ): Measuring distress and other mental health problems
in a working population. Work & Stress, 18(3), 187-207.
Terluin, B. (1996). De vierdimensionale klachtenlijst (4DKL). Een Vragenlijst Voor Het Meten
Van Distress, Depressie, Angst En Somatisatie [the Four-Dimensional Symptom
Questionnaire (4DSQ).A Questionnaire to Measure Distress, Depression, Anxiety, and
Somatization].Huisarts & Wetenschap, 39(12), 538-547.
Terluin, B., Smits, N., Brouwers, E. P., & de Vet, H. C. (2016). The four-dimensional symptom
questionnaire (4DSQ) in the general population: Scale structure, reliability,
measurement invariance and normative data: A cross-sectional survey. Health and
Quality of Life Outcomes, 14(1), 130.
Terluin, B., Smits, N., & Miedema, B. (2014). The english version of the four-dimensional
symptom questionnaire (4DSQ) measures the same as the original dutch questionnaire:
A validation study. The European Journal of General Practice, 20(4), 320-326.

523226-L-bw-Bebber523226-L-bw-Bebber523226-L-bw-Bebber523226-L-bw-BebberProcessed on: 27-8-2018Processed on: 27-8-2018Processed on: 27-8-2018Processed on: 27-8-2018 PDF page: 77PDF page: 77PDF page: 77PDF page: 77
65
Terluin, B., van Marwijk, H. W., Ader, H. J., de Vet, H. C., Penninx, B. W., Hermens, M. L., . . .
Stalman, W. A. (2006). The four-dimensional symptom questionnaire (4DSQ): A
validation study of a multidimensional self-report questionnaire to assess distress,
depression, anxiety and somatization. BMC Psychiatry, 6.
Van de Vijver, F., & Leung, K. (1997). Methods and data analysis of comparative research.
Allyn & Bacon.

523226-L-bw-Bebber523226-L-bw-Bebber523226-L-bw-Bebber523226-L-bw-BebberProcessed on: 27-8-2018Processed on: 27-8-2018Processed on: 27-8-2018Processed on: 27-8-2018 PDF page: 78PDF page: 78PDF page: 78PDF page: 78
66

523226-L-bw-Bebber523226-L-bw-Bebber523226-L-bw-Bebber523226-L-bw-BebberProcessed on: 27-8-2018Processed on: 27-8-2018Processed on: 27-8-2018Processed on: 27-8-2018 PDF page: 79PDF page: 79PDF page: 79PDF page: 79
67
Chapter 4
Searching for the optimal number of response alternatives for the distress scale of the Four-
Dimensional Symptom Questionnaire
This chapter was based on the manuscript: van Bebber, J., Wigman, J. T.W., Meijer, R.R., Terluin, B.,
Sytema, S., and Wunderink, L. (submitted). Searching for the optimal number of response alternatives
for the distress scale of the Four-Dimensional Symptom Questionnaire.
Manuscript submitted for publication in BMC psychiatry.
Abstract
The Four-Dimensional Symptom Questionnaire (4DSQ) is a self-report questionnaire designed to
measure distress, depression, anxiety, and somatization. Prior to computing scale scores from the
item scores, the three highest response alternatives (‘Regularly’, ‘Often’, and ‘Very often or
constantly present’) are usually collapsed into one category to reduce the influence of extreme
responding on item- and scale scores. In this study, the usefulness of this transformation for the
distress scale is evaluated based on a variety of criteria. Specifically, by using the Graded Response
Model, we investigated the effect of this transformation on model fit, local measurement precision,
and various indicators of the scale’s validity to get an indication on whether the current practice of
recoding should be advocated or not. In particular, the effect on the convergent- (operationalized by
the General Health Questionnaire and the Maastricht Questionnaire), divergent-(operationalized by
the Neuroticism scale of the NEO-FFI), and predictive validity (operationalized as obtrusion with daily
chores and activities, the Biographical Problem list and the Utrecht Burnout Scale) of the distress
scale was investigated. Results indicate that recoding leads to (i) better model fit as indicated by
lower mean probabilities of exact test statistics assessing item fit, (ii) small (< .02) losses in the sizes
of various validity coefficients, and (iii) a decrease (DIFF(SEs) = 0.10 - 0.25) in measurement precision
for medium and high levels of distress. For clinical applications and applications in longitudinal
research, the current practice of recoding should be avoided because recoding decreases
measurement precision for medium and high levels of distress. It would be interesting to see
whether this advice also holds for the three other domains of the 4DSQ.

523226-L-bw-Bebber523226-L-bw-Bebber523226-L-bw-Bebber523226-L-bw-BebberProcessed on: 27-8-2018Processed on: 27-8-2018Processed on: 27-8-2018Processed on: 27-8-2018 PDF page: 80PDF page: 80PDF page: 80PDF page: 80
68
4.1 Introduction
4.1.1 The Four-Dimensional Symptom Questionnaire (4DSQ) The Four-Dimensional Symptom Questionnaire (4DSQ) developed by Terluin (1996) is a self-report
questionnaire developed in the Netherlands to distinguish symptoms of non-specific general distress
from depression, anxiety, and somatization. In the Netherlands, the 4DSQ is widely used in primary
(mental) health care settings, and the questionnaire has been translated into English (Terluin, Smits,
& Miedema, 2014), Polish (Czachowski, Terluin, Izdebski, & Izdebski, 2012), and Turkish (Terluin,
. Although initially developed for primary care
settings, its validity has also been demonstrated in working populations (Terluin, Rhenen, Schaufeli,
& De Haan, 2004) and ambulant mental health services (Terluin, 2014). Terluin et al. (2006) found
that the scores on the four scales can be described adequately by unidimensional (common) factor
models, and all four scales were found to be invariant with respect to gender, age, and educational
level of respondents (Terluin, Smits, Brouwers, & de Vet, 2016).
Most practitioners working with the 4DSQ found the distress scale most useful and
important. This scale comprises sixteen items that express symptoms of nonspecific psychological
distress. Respondents have to indicate the frequency of specific symptom experiences during the
past week on a five-point scale (‘Not present’, ‘Sometimes’, ‘Regularly’, ‘Often’, and ‘Constantly
present’). The reason for using five response categories is that respondents indicated a preference
for making finer distinctions than “not present”, “sometimes”, and “constantly present”. However, in
practice, the three highest item scores (2-4) are usually recoded to 2. This is done because, according
to the author of this questionnaire, this practice minimizes the influence of extreme responding on
scale scores. From a practical point of view, the question arises what the effect is of this recoding on
the quality of this scale. The aim of this paper was to investigate the effect of recoding on the
reliability and validity of the 4DSQ using item response theory (Embretson & Reise, 2013).
4.1.2 Optimal number of response alternatives: Existing research There is a large body of literature regarding the optimal number of response alternatives used in a
scale. An important contribution was provided by the review of Cox (1980). The notion of signal and
noise was central in this review. On the one hand, one may strive for maximum refinement of the
response scale enabling transmission of maximal information in terms of variation. On the other
hand, respondents must be capable of using these refinements in a proper way; otherwise more
refinements induce non-systematic variance (that is, measurement error). This trade-off between
signal and noise is probably different for various kinds of items. In addition, respondents may differ in

523226-L-bw-Bebber523226-L-bw-Bebber523226-L-bw-Bebber523226-L-bw-BebberProcessed on: 27-8-2018Processed on: 27-8-2018Processed on: 27-8-2018Processed on: 27-8-2018 PDF page: 81PDF page: 81PDF page: 81PDF page: 81
69
(i) the way they interpret and use the different alternatives and (ii) in their capacity to reliably
distinguish more alternatives. Both inter-individual differences will increase the noise component in
the response data. Although Cox stated that “(…) there is no single number of response alternatives
for a scale which is appropriate under all circumstances”, he formulated four recommendations for
applied research.
First, scales with only two or three response options are inadequate because these scales are
not capable of transmitting much information. Second, using more than nine alternatives does not
pay off. Third, an odd number of alternatives are preferable, assuming that a neutral position makes
sense; and fourth, comprehensible instructions and labeling of response alternatives are crucial.
Three other references that were noted in Cox’s review are also worth mentioning. First, Cronbach
(1950) warned that increasing the number of response alternatives in order to achieve a higher
reliability of the scale scores may actually facilitate response sets, such as extreme responding, and
thus diminishing scale validity. Second, Jacoby and Matell (1971) found that collapsing response
alternatives into two or three response categories had a small effect on the reliability and the validity
coefficients of a scale. Third, based on a high positive correlation between respondents’ use of
extreme positive and negative responses on the same attitude scale, Peabody (1962) concluded that
resulting scale scores would partially be reflective of idiosyncratic response sets (response bias) of
individuals.
More recently, Lozano, Garcia-Cueto, and Muniz (2008) found in a simulation study that both
reliability and validity (operationalized as percentage of explained variance by the first principal
component) improved with increasing numbers of response alternatives, but that the gains beyond
seven options were negligible. Maydeu-Olivares, Kramp, Garcia-Forero, Gallardo-Pujol, and Coffman
(2009) found in an experimental study that by increasing the number of response alternatives (they
used 2, 3, and 5 options) that measures of reliability increased (that is, values of alpha increased and
IRT-derived mean standard error decreased), model fit deteriorated, and that convergent validity
was not effected by utilizing more response options. In another experimental study, Hilbert et al.
(2016) found that different response formats (dichotomous, a five-point Likert scale, and a 100 mm
Visual Analogue Scale) resulted in eliciting additional dimensions not intended to be measured by
questionnaire developers. They concluded that using five-point Likert and 100mm Visual Analogue
Scale as alternatives to dichotomous scoring resulted in additional dimensions to the main dimension
found for dichotomous scores; one possible explanation for this phenomenon may be extreme
response bias. Thus, although several studies have been conducted on the influence of the number
of response alternatives, many studies focus on a limited number of psychometric indicators and
especially the influence on various types of validity is not well researched.
523226-L-bw-Bebber523226-L-bw-Bebber523226-L-bw-Bebber523226-L-bw-BebberProcessed on: 27-8-2018Processed on: 27-8-2018Processed on: 27-8-2018Processed on: 27-8-2018 PDF page: 82PDF page: 82PDF page: 82PDF page: 82
70
4.1.3 Aims of this study The current practice of recoding the item scores prior to computing scale scores on the 4DSQ is
based on clinical intuition. In this paper, we investigated whether we could find empirical support for
this practice. Thus, the aim of this study was to investigate the effect of recoding the distress items of
the 4DSQ on the following criteria:
(i) measurement precision across the distress scale;
(ii) the convergent validity of the scale, operationalized as the correlation with the General Health
Questionnaire (GHQ; Koeter & Ormel, 1991) and the Maastricht Vital Exhaustion Questionnaire
(MQ; Appels, Hoppener, & Mulder, 1987);
(iii) the discriminant validity of the scale, operationalized as the correlation of the 4DSQ distress
scores with the scores on the Neuroticism scale of the NEO Five Factor Inventory (NEO-FFI; Costa &
MacCrae, 1992), and
(iv) the predictive validity of the scale, operationalized as the correlation of the 4DSQ distress scores
with the scores on the Biographical Problem List (BPL; Hosman, 1983), feelings of work-related
exhaustion, distance and competence based on the Utrecht Burnout Scale (UBOS; Schaufeli &
Dierendock, 2000), and sick leave.
4.2 Methods
4.2.1 Participants We used data from three samples in which the 4DSQ was assessed in our analyses. The first sample
comprised 1017 clients who visited their General Practitioner (GP) in the Netherlands between 2004
and 2011 for psychological complaints. Mean age was 40.2 (SD = 14.9, age range 11-85 years), and
63.3% were female. We used this sample for calibration, assessing model fit and computing local
measurement precision, hence we refer to this sample in the remainder of this article as the
calibration sample.
The second sample comprised 55 GP clients of whom the GP suspected to have a mental
health problem. Consultations took place in GP practices in the Netherlands in 1998. The inclusion
criteria for this sample are thoroughly described in Terluin (1996). Mean age was 40.4 (SD = 10.6, age
range 17-86 years), and 52.7% were female. We used this sample for assessing the convergent
validity (CV) of the distress scale, hence we refer to this sample in the remainder of this article as CV
sample.
The third sample comprised 429 GP-clients who participated in the Effectiveness of a Minimal
Intervention for Stress-related mental disorders with Sick leave (MISS) study (Bakker et al., 2006).

523226-L-bw-Bebber523226-L-bw-Bebber523226-L-bw-Bebber523226-L-bw-BebberProcessed on: 27-8-2018Processed on: 27-8-2018Processed on: 27-8-2018Processed on: 27-8-2018 PDF page: 83PDF page: 83PDF page: 83PDF page: 83
71
Inclusion criteria were (i) having a paid job, (ii) sick leave for no longer than three month, and (iii)
elevated levels of distress. Mean age was 40.3 (SD = 9.3, age range 20-60 years), and 66.9% were
female. There were four different measurements: baseline (t0; 2003-2005), and three follow-up
measurements (2004-2006). The first follow-up measurement was after two months (t1), the second
after six months (t2) and the third after twelve months (t3). At each time point, respondents filled out
the 4DSQ and various indicators of social and occupational functioning (for further details see
below). We used this sample to access the discriminant and predictive validity of the scale and refer
to this sample in the remainder of this article as MISS sample.
4.2.2 Instruments
General Health Questionnaire (GHQ)
The GHQ (Goldberg, Williams, & Williams, 1988; Koeter & Ormel, 1991) consists of 30 nonspecific
mental health symptoms, which are rated on a 4-point Likert scale ranging from ‘Not at all’ to ‘Much
more than usual’. Similar to the 4DSQ, two types of scoring rules do exist (0-3 or 0-1). Reliability,
operationalized as coefficient alfa is approximately .90 in various populations. We decided to use the
binary coding in this study, because more than three response options could possibly trigger extreme
response bias in respondents (B. Terluin, personal communication, October 12, 2016).
Maastricht Vital Exhaustion Questionnaire (MQ)
The MQ (Appels et al., 1987) consists of 21 dichotomously scored nonspecific symptoms of mental
health that reflect cardiac dysfunctioning. Cronbach’s alpha equaled .89 and significant associations
with future angina and myocardial infection have been found (Appels, Falger, & Schouten, 1993).
Neuroticism (NEO-FFI)
The Neuroticism scale of the revised and shortened NEO (Costa & MacCrae, 1992) consists of twelve
5-point Likert items. The internal consistency (alfa) of the scale is generally above .80, the precise
value depends on the population in which it is deployed, its test-retest reliability equaled .80, and the
convergent and divergent (discriminant) validity have all been rated as good by the Dutch
commission of test affairs (Evers, van Vliet-Mulder, & Groot, 2000).
Obtrusion of daily chores and activities.
Clients who participated in the MISS study (Bakker et al., 2006) were asked whether they
experienced difficulties in performing daily chores and activities. Response options were “No

523226-L-bw-Bebber523226-L-bw-Bebber523226-L-bw-Bebber523226-L-bw-BebberProcessed on: 27-8-2018Processed on: 27-8-2018Processed on: 27-8-2018Processed on: 27-8-2018 PDF page: 84PDF page: 84PDF page: 84PDF page: 84
72
problems”, “Some problems” and “Unable to perform”. Because only ten (in the third wave) and
seven (in the fourth wave) clients choose the last category, we decided to merge this option with the
mid-category “Some problems”. For both scoring rules, we computed the proportion of explained
variance in this dichotomy, using Nagelkerke’s R-square (an adjusted measure of explained variance
for categorical variables in logistic regression).
Biographical Problem List (BPL)
The BPL (Hosman, 1983) comprises eighteen problem statements with response options “Yes” or
“No”. Instead of using one total score based on all items, we decided to (i) only use those statements
that do not refer to physical functioning, and (ii) to split the scale in a subscale consisting of six
relational problem statements (alpha = .57) and eight general problem statements (alpha = .65). This
was done in order to create two scales with relatively homogenous item content. The chosen
statements may be found in Table A4.1 in the Appendix.
Utrecht Burnout Scale (UBOS)
The UBOS (Schaufeli & Dierendock, 2000) measures three components of burnout: exhaustion,
distance and competence. Each component is operationalized by four to six symptoms, of which the
frequency of occurrence is rated by respondents on a 7-point Likert scale. Internal consistencies of
the scales range from .75 to .88, and a factor model with three factors shows acceptable fit (CFI: .93,
RMSR: .05). With respect to convergent validity, the exhaustion scale correlates with need for
recovery (rxy = .75) and sleep problems (rxy = .45), the distance scale with role conflict (rxy = .45), and
the competence scale with loss of motivation (rxy = -.37). Significant correlations (-.16 < rxy < .27) with
sick leave are indications of the predictive validity of the scales.
4.2.3 Item response theory In the clinical field, Item Response Theory (IRT) models are increasingly becoming the standard way
of evaluating the quality of measurement instruments both for linear and adaptive questionnaires
(Bebber et al., 2016; Emons, Meijer, & Denollet, 2007; Meijer & Baneke, 2004). IRT offers several
advantages over classical test theory for reliability estimation and investigating construct validity.
With respect to reliability, measurement precision can be assessed conditional on the trait value that
is being measured (that is: locally) instead of using an index like Cronbach’s alpha that provides an
overall estimate of the reliability of the scale. This overall index may be imprecise for some scale
intervals. More specifically, it is often too high for extreme values. With respect to the construct
validity of the scale, the correctness the proposed ordering of response alternatives can be evaluated

523226-L-bw-Bebber523226-L-bw-Bebber523226-L-bw-Bebber523226-L-bw-BebberProcessed on: 27-8-2018Processed on: 27-8-2018Processed on: 27-8-2018Processed on: 27-8-2018 PDF page: 85PDF page: 85PDF page: 85PDF page: 85
73
(Reise & Waller, 2009). Another advantage of IRT is that IRT scores are more spread out than simple
sum scores, especially in the tails of the distribution (Embretson & Reise, 2013). This characteristic
may prove advantageous when investigating relationships with other important variables in the
nomological network.
However, the chosen IRT model must fit the item scores reasonably well. One assumption is
that the item scores have to be uncorrelated (locally independent), once item scores are controlled
for differences among respondents on the latent trait (Embretson & Reise, 2013). In this case, the
items of the distress scale have to be essentially uncorrelated when item scores are controlled for
differences among respondents in levels of distress. Two item pairs of the distress scale showed
violation of local independence due to the fact that the items of the first pair both refer to “sleeping
problems” and items of the second pair both to ”residual effects of traumatic experiences” (Terluin
et al., 2006). We therefore decided to remove the item of each pair with the lowest loading on the
first common factor.
In this study we used the graded response model (GRM; Samejima, 1969, 1997) to compare
both scoring rules in terms of model fit of individual items, of all items combined (scale level), and in
terms of local measurement precision. The GRM is often used to analyze clinical and personality
scales. It is a generalization of the two-parameter logistic model (Embretson & Reise, 2013).
Polytomous items are treated as series of k-1 dichotomies, where k represents the number of
response options. Each logistic function (so called operating characteristic curve, OCC) models the
probability of a response in or above a certain category, conditional on the trait or characteristic that
is being measured by the scale (distress in our case). Two types of parameters define each item. The
first parameter is the slope parameter. This parameter expresses how quickly a response above a
certain category becomes more likely with increasing levels of distress. The second parameters are k-
1 category threshold parameters. These parameters denote the point on the distress continuum
where the probability of responding above a certain category becomes more likely than choosing the
given category. From the k-1 OCCs, k category response curves (CRCs) may be deduced. The CRCs
display the probability of choosing a certain response option, given a certain distress level. For each
item, these sum up to one at any point on the latent continuum.
To further illustrate this, Figure 4.1 displays the five OCCs for one example item, item 17
(Feeling down or depressed). In this figure, the x-axis represents the amount of distress that can be
experienced by respondents. This dimension may be conceived as approximately standard-
normalized. The bold line represents the information that this item provides for differentiating
respondents based on various levels of distress. Because information is additive under IRT models,
these functions may be summed to form the Test Information Functions (TIFs), from which functions
that display local standard errors of person estimates can be deduced.

523226-L-bw-Bebber523226-L-bw-Bebber523226-L-bw-Bebber523226-L-bw-BebberProcessed on: 27-8-2018Processed on: 27-8-2018Processed on: 27-8-2018Processed on: 27-8-2018 PDF page: 86PDF page: 86PDF page: 86PDF page: 86
74
Figure 4.1 Category response curves (0-4) and item information curve (straight line) Item 17, Feeling
down or depressed.
X-axis: Position on the latent distress continuum; left y-axis: Probability of endorsement; right y-axis:
Information provided by item 17.
4.2.4 Statistical analyses In order to compare various indicators of model fit of both scoring options, we (a) compared
observed with expected item score frequencies using the S-X2 item-fit statistic proposed by Orlando
and Thissen (2000), (b) compared the mean value of the exact test probabilities for each scoring rule
across items, and (c) compared the RMSEAs (with lower values indicating better model fit) of both
scoring rules.
Furthermore, in order to get an impression of the usefulness of the five response options for
each item, we investigated the spread of response categories by computing the smallest distances
between threshold parameters within items. Additionally, we used the item parameters derived from

523226-L-bw-Bebber523226-L-bw-Bebber523226-L-bw-Bebber523226-L-bw-BebberProcessed on: 27-8-2018Processed on: 27-8-2018Processed on: 27-8-2018Processed on: 27-8-2018 PDF page: 87PDF page: 87PDF page: 87PDF page: 87
75
the calibration sample to compute IRT-scores for the clients in the CV sample and in the MISS
sample. Finally, under the assumption of acceptable model fit for both scoring rules, we used the
standard error functions to compare local measurement precision. All IRT-analyses were performed
using IRTPRO 3 (Cai, Du Toit, & Thissen, 2011).
4.3 Results
4.3.1 Model fit and measurement precision The results of the tests that compare observed with expected item score frequencies can be found in
Table A4.2 (0-2) and Table A4.3 (0-4); here we summarize the most important findings. Note that
significant test results indicate poor fit. For the 0-2 scoring rule, item 22 (Listlessness) and item 37
(No longer feel like doing anything) had p-values that were smaller than .01, and item 36 (Can’t face
it anymore) had p < .05. For the 0-4 scoring rule, item 36 had p < .01, and five other items had p <
.05. It should be noted, however, that with large sample sizes, the tests of model fit for individual
items are very powerful tools to detect even slight deviations between observed and expected item
scores (van Bebber et al., 2017).
To get an impression of overall model fit, we calculated the mean value of the exact test
probabilities for each scoring rule across items (last column Table A4.2 and Table A4.3). These
indicated relatively poorer model fit for the scoring rule with five response options (.262) than for
the scoring rule with only three response options (.416). The RMSEAs of both scoring rules were
nearly identical though: .04 for the scoring rule with five response options and .05 for the scoring
rule with three response options. To conclude, in line with earlier research findings regarding the
effect of the number of response options on model fit, we found poorer model fit for the 0-4 scoring
rule compared to the 0-2 scoring rule. However, the data of both scoring options may be adequately
modelled by graded response models.
Inspecting the OCCs for all items showed that the distance between the mid-thresholds was
always smaller than the distance between the first and second threshold, or between the third and
fourth threshold. This indicated that the response option ‘Regularly’ in between ‘Sometimes’ and
‘Often’ has little practical value, and that differentiating between the two highest response
categories ‘Often’ and ‘Constantly present’ seems advisable. To illustrate this, Figure A4.1 (Appendix)
shows the OCCs of item 32. For this item, two thresholds, each differentiating two adjacent response
options were closest to one another. Specifically, the distance between the second (second versus
third category) and the third (third versus fourth category) threshold equaled 0.47. The third

523226-L-bw-Bebber523226-L-bw-Bebber523226-L-bw-Bebber523226-L-bw-BebberProcessed on: 27-8-2018Processed on: 27-8-2018Processed on: 27-8-2018Processed on: 27-8-2018 PDF page: 88PDF page: 88PDF page: 88PDF page: 88
76
response option (denoted by 2) is practically redundant for this item, because nearly all the surface
under its curve is shared with the second (1) and the fourth (3) response option.
Figure 4.2 displays the standard error functions of both scoring rules, which are nearly
identical in the range of theta = -3 to 0. For higher levels of distress, the standard errors for the
scoring rule with three response options (green line) are approximately 50% larger than the standard
errors for the scoring rule with five response options. So, for medium and high levels of distress, the
0-4 scoring resulted in higher measurement precision than the 0-2 scoring.
Figure 4.2 Standard error functions (straight lines) and distress densities (dashed lines) of both
scoring rules.
4.3.2 Convergent and discriminant validity As shown in Table 4.1, both scoring rules yield approximately the same correlation coefficients with
other nonspecific indicators of mental health. In addition, both are equally strong related to the
construct of Neuroticism. Thus, the indicators of convergent validity were slightly in favor of the 0-4
scoring rule, and with respect to discriminant validity, both scoring options performed equally well.

523226-L-bw-Bebber523226-L-bw-Bebber523226-L-bw-Bebber523226-L-bw-BebberProcessed on: 27-8-2018Processed on: 27-8-2018Processed on: 27-8-2018Processed on: 27-8-2018 PDF page: 89PDF page: 89PDF page: 89PDF page: 89
77
Table 4.1 Convergent and discriminant validity of the three- and five-point Likert scales.
MQ GHQ Neuroticism
Distress 0-2 -.642 .536 .543
Distress 0-4 -.662 .555 .550
MQ: Maastricht Vital Exhaustion Questionnaire, GHQ: General Health Questionnaire, Distress 0-2: Recoded
item scores with three response options, Distress 0-4: Original item scores with five response options.
4.3.3 Predictive validity To compare the predictive power of both scoring rules for obtrusion of daily chores and activities (No
problems versus Some problems/Unable to perform), we conducted logistic regressions with the
baseline distress scores of both scoring options as predictors. As Table 4.2 shows, for short-term
prediction, the five-point rating scale was slightly superior, but both scoring rules performed
approximately equally well for long-term prediction.
Table 4.2 Results logistic regressions for prediction of obtrusion of daily chores and activities. 2 df p Nagelkerke R2
Short term DIS0-2 10.9 1 .001 .050
DIS0-4 15.0 1 .001 .071
Long term DIS0-2 4.5 1 .035 .023
DIS0-4 3.9 1 .047 .021
Distress 0-2: Recoded item scores with three response options, Distress 0-4: Original item scores with five
response options.
As shown in Table 4.3, in terms of predicting relevant futures outcomes, both scoring rules
performed very similar. In case there was a difference, the 0-4 scoring of item scores performed
better than the 0-2 scoring. The differences in the size of Pearson correlations were equal or less
than .03 though. Interestingly, in predicting days of sick leave (computed as days from sick notice till
start of reintegration), only the five-point scoring rule resulted in a significant finding, where the
three-point scoring rule did not. Thus, the differences between the two scoring rules in predicting
relevant future outcome measures were generally quite small, although in all cases, the 0-4 scoring
rule was slightly superior to the 0-2 scoring rule.

523226-L-bw-Bebber523226-L-bw-Bebber523226-L-bw-Bebber523226-L-bw-BebberProcessed on: 27-8-2018Processed on: 27-8-2018Processed on: 27-8-2018Processed on: 27-8-2018 PDF page: 90PDF page: 90PDF page: 90PDF page: 90
78
Table 4.3 Predictive validities (Pearson correlations) distress scale for various outcome measures of social and occupational functioning.
BIOPRO-R3 BIOPRO-G4 UBOS-EXH5 UBOS-DIS6 UBOS-COM7 Sick-
leave
Short
term1
DIS0-2 .253** .305** --- --- --- ---
DIS0-4 .253** .328** --- --- --- ---
Long
term2
DIS0-2 .260** .317** .145** .074 .117* .122
DIS0-4 .259** .321** .173** .088 .138* .140* 1: Six month, 2: Twelve month, 3: Selected relational problem statements Biographical problem list, 4: Selected
general problem statements Biographical problem list, 5-7: UBOS scales Exhaustion, Distance and Competence,
** p > .01, *p > .05, Distress 0-2: Recoded item scores with three response options, Distress 0-4: Original item
scores with five response options.
4.4 Discussion
4.4.1 Main findings and conclusions Although collapsing the three highest response alternatives did improve model fit, model fit of items
with five response alternatives was still acceptable. Inspection of the spread of response alternatives
indicated that in case of the 4DSQ, it is the mid category (Sometimes) that seems to be redundant,
and not one or two of the highest response options, as is implicitly assumed by the current scoring
procedure. Furthermore, with respect to local measurement precision, the five-point Likert scale was
clearly advantageous for medium and high levels of distress. However, the gain in measurement
precision did not result in substantial gains in various indices of scale validity. The differences in
correlation coefficients that we found were less than .03. Still, for effects that are near the threshold
of significance, as prediction of days of sick leave in our study, using the original five-point Likert
response scale may reveal effects that the three-point Likert response scale does not reveal. In
addition, using the three-point Likert response scale does not lead to a higher discriminant validity of
the scale, operationalized as the correlation with Neuroticism. In conclusion, for cross-sectional
research, it does not seem to matter very much whether the item scores are recoded or not. In any
case, this study suggests that using the original five category response data is never disadvantageous.
For both, clinical applications and longitudinal research applications where the interest is in
monitoring scores of individuals over time, the response scale with five categories is preferable. This
is because in these settings, the increased measurement precision of the five-point Likert scale for
medium and high levels of distress will probably lead to a better measurement of change. For

523226-L-bw-Bebber523226-L-bw-Bebber523226-L-bw-Bebber523226-L-bw-BebberProcessed on: 27-8-2018Processed on: 27-8-2018Processed on: 27-8-2018Processed on: 27-8-2018 PDF page: 91PDF page: 91PDF page: 91PDF page: 91
79
example, between baseline- and post-treatment measures of distress. Thus, our recommendation is
that scoring should be based on the original response scales with five response options.
4.4.2 Strengths and limitations To our knowledge, this was the first study that investigated the effect of the type of response scale
on multiple indicators of various types of validity. In addition, for some indicators of predictive
validity, we compared short-term (six month) and long-term (twelve month) predictions of both
scoring rules. The main limitation of this study was that the data of the three-point Likert scale were
not obtained using three response alternatives. Another minor limitation was that we had to remove
two out of sixteen items because these violated one of the IRT assumptions However, because the
items that had to be removed correlated very highly with the other item of the pair (.80-.90), we may
argue that little item-specific information is lost by removing these two items.
4.4.3 Directions for future research In order to get an impression of whether our findings may de generalized to domains other than
distress, the analyses conducted for this article could be replicated with data gathered with the items
of the other three 4DSQ domains: anxiety, depression, and somatoform symptoms.

523226-L-bw-Bebber523226-L-bw-Bebber523226-L-bw-Bebber523226-L-bw-BebberProcessed on: 27-8-2018Processed on: 27-8-2018Processed on: 27-8-2018Processed on: 27-8-2018 PDF page: 92PDF page: 92PDF page: 92PDF page: 92
80
4.5 Appendix
Table A4.1 Chosen BIOPRO problem statements.
Facet Content Statement
Relational Parents
Relational Partner
Relational (Own) children
Relational Other relevant persons
Relational Other persons in general
Relational Loneliness
General Financial
General Housing
General Study
General Work
General Self-concept
General Living conditions
General Worrying
General Other problem not mentioned in statements

523226-L-bw-Bebber523226-L-bw-Bebber523226-L-bw-Bebber523226-L-bw-BebberProcessed on: 27-8-2018Processed on: 27-8-2018Processed on: 27-8-2018Processed on: 27-8-2018 PDF page: 93PDF page: 93PDF page: 93PDF page: 93
81
Table A4.2 Item-wise chi-square tests of model fit for GP-clients (0-2).
Order Item stem (abbreviated) X2 df Probability
17 Feeling down or depressed 53.63 46,00 0.2045
19 Worry 29.74 45,00 0.9613
20 Disturbed Sleep 53.44 51,00 0.3799
22 Listlessness 73.23 46,00 0.0065
25 Tense 39.48 43,00 0.6254
26 Easily irritated 32.59 48,00 0.9566
29 That you just can’t do anything anymore 46.59 40,00 0.2191
31 (…) take any interest in the people and things around you 41.73 38,00 0.3113
32 That you can’t cope anymore 31.59 38,00 0.7598
36 That you can’t face it anymore 52.79 34,00 0.0209
37 No longer feel like doing anything 64.36 38,00 0.0048
38 Have difficulty in thinking clearly 39.67 47,00 0.7677
41 Did you easily become emotional 46.94 48,00 0.5171
48 (…) to put aside thoughts about any upsetting event(s) 61.17 48,00 0.0958

523226-L-bw-Bebber523226-L-bw-Bebber523226-L-bw-Bebber523226-L-bw-BebberProcessed on: 27-8-2018Processed on: 27-8-2018Processed on: 27-8-2018Processed on: 27-8-2018 PDF page: 94PDF page: 94PDF page: 94PDF page: 94
82
Table A4.3 Item-wise chi-square tests of model fit for GP-clients (0-4).
Order Item stem (abbreviated) X2 df Probability
17 Feeling down or depressed 161.66 144 0.1490
19 Worry 144.45 143 0.4509
20 Disturbed Sleep 203.09 169 0.0377
22 Listlessness 177.70 145 0.0335
25 Tense 133.39 136 0.5478
26 Easily irritated 134.17 150 0.8186
29 That you just can’t do anything anymore 132.26 121 0.2278
31 (…) take any interest in the people and things around you 155.47 121 0.0189
32 That you can’t cope anymore 123.85 115 0.2696
36 That you can’t face it anymore 173.99 113 0.0002
37 No longer feel like doing anything 153.52 116 0.0112
38 Have difficulty in thinking clearly 131.36 152 0.8857
41 Did you easily become emotional 191.04 156 0.02
48 (…) to put aside thoughts about any upsetting event(s) 189.36 173 0.1870

523226-L-bw-Bebber523226-L-bw-Bebber523226-L-bw-Bebber523226-L-bw-BebberProcessed on: 27-8-2018Processed on: 27-8-2018Processed on: 27-8-2018Processed on: 27-8-2018 PDF page: 95PDF page: 95PDF page: 95PDF page: 95
83
Figure A4.1 Operating characteristic curves Item 32, That you can’t cope anymore.
4.6 References
Appels, A., Falger, P., & Schouten, E. (1993). Vital exhaustion as risk indicator for myocardial
infarction in women. Journal of Psychosomatic Research, 37(8), 881-890.
Appels, A., Hoppener, P., & Mulder, P. (1987). A questionnaire to assess premonitory
symptoms of myocardial infarction. International Journal of Cardiology, 17(1), 15-24.

523226-L-bw-Bebber523226-L-bw-Bebber523226-L-bw-Bebber523226-L-bw-BebberProcessed on: 27-8-2018Processed on: 27-8-2018Processed on: 27-8-2018Processed on: 27-8-2018 PDF page: 96PDF page: 96PDF page: 96PDF page: 96
84
Bakker, I. M., Terluin, B., van Marwijk, H. W., Gundy, C. M., Smit, J. H., van Mechelen, W., &
Stalman, W. A. (2006). Effectiveness of a minimal intervention for stress-related mental
disorders with sick leave (MISS); study protocol of a cluster randomised controlled trial
in general practice [ISRCTN43779641]. BMC Public Health, 6(1), 1.
Bebber, J., Wigman, J. T., Meijer, R. R., Ising, H. K., Berg, D., Rietdijk, J., . . . Jonge, P. (2017).
The prodromal questionnaire: A case for IRT-based adaptive testing of psychotic
experiences? International Journal of Methods in Psychiatric Research, 26, 2.
Cai, L., Du Toit, S., & Thissen, D. (2011). IRTPRO: Flexible, multidimensional, multiple
categorical IRT modeling [computer software]. Chicago, IL: Scientific Software
International.
Costa, P. T., & MacCrae, R. R. (1992). Revised NEO personality inventory (NEO PI-R) and NEO
five-factor inventory (NEO FFI): Professional manual Psychological Assessment
Resources.
Cox III, E. P. (1980). The optimal number of response alternatives for a scale: A review.
Journal of Marketing Research, , 407-422.
Cronbach, L. J. (1950). Further evidence on response sets and test design. Educational and
Psychological Measurement, 10, 3.
Czachowski, S., Terluin, B., Izdebski, A., & Izdebski, P. (2012). Evaluating the cross-cultural
validity of the polish version of the four-dimensional symptom questionnaire (4DSQ)
using differential item functioning (DIF) analysis. Family Practice, 29(5), 609-615.

523226-L-bw-Bebber523226-L-bw-Bebber523226-L-bw-Bebber523226-L-bw-BebberProcessed on: 27-8-2018Processed on: 27-8-2018Processed on: 27-8-2018Processed on: 27-8-2018 PDF page: 97PDF page: 97PDF page: 97PDF page: 97
85
Embretson, S. E., & Reise, S. P. (2013). Item response theory for psychologists Psychology
Press.
Emons, W. H., Meijer, R. R., & Denollet, J. (2007). Negative affectivity and social inhibition in
cardiovascular disease: Evaluating type-D personality and its assessment using item
response theory. Journal of Psychosomatic Research, 63(1), 27-39.
Evers, A., van Vliet-Mulder, J. v., & Groot, C. d. (2000). Documentatie van tests en
testresearch in Nederland.
Goldberg, D., Williams, P., & D &Williams, P. (1988). A User’s guide to the general health
questionnaire general health questionnaire. Windsor: NFER^ Nelson..Windsor: NFER^
Nelson.
Hilbert, S., Küchenhoff, H., Sarubin, N., Toyo Nakagawa, T., & Bühner, M. (2016). The
influence of the response format on psychometric properties of a personality
questionnaire: An analysis of a dichotomous, a likert-type, and a visual analogue scale.
TPM: Testing, Psychometrics, Methodology in Applied Psychology, 23(1)
Hosman, C. M. H. (1983). Help seeking for psychosocial problems. (Manual). Lisse: Swets &
Zeitlinger.
Jacoby, J., & Matell, M. S. (1971). "Three-point scales are good enough". Journal of
Marketing Research, 8, 495.
Koeter, M., & Ormel, J. (1991). General health questionnaire; nederlandse bewerking [dutch
version]. Lisse, the Netherlands: Swets and Seitlinger.

523226-L-bw-Bebber523226-L-bw-Bebber523226-L-bw-Bebber523226-L-bw-BebberProcessed on: 27-8-2018Processed on: 27-8-2018Processed on: 27-8-2018Processed on: 27-8-2018 PDF page: 98PDF page: 98PDF page: 98PDF page: 98
86
Lozano, L. M., García-Cueto, E., & Muñiz, J. (2008). Effect of the number of response
categories on the reliability and validity of rating scales. Methodology, 4(2), 73-79.
Maydeu-Olivares, A., Kramp, U., García-Forero, C., Gallardo-Pujol, D., & Coffman, D. (2009).
The effect of varying the number of response alternatives in rating scales: Experimental
evidence from intra-individual effects. Behavior Research Methods, 41(2), 295-308.
Meijer, R. R., & Baneke, J. J. (2004). Analyzing psychopathology items: A case for
nonparametric item response theory modeling. Psychological Methods, 9 (3), 354.
Orlando, M., & Thissen, D. (2000). Likelihood-based item-fit indices for dichotomous item
response theory models. Applied Psychological Measurement, 24(1), 50-64.
Peabody, D. (1962). Two components in bipolar scales: Direction and extremeness.
Psychological Review, 69(2), 65.
Reise, S. P., & Waller, N. G. (2009). Item response theory and clinical measurement. Annual
Review of Clinical Psychology, 5, 27-48.
Samejima, F. (1969). Estimation of latent ability using a response pattern of graded scores.
Psychometrika Monograph Supplement.
Samejima, F. (1997). Graded response model. Handbook of modern item response theory
(pp. 85-100) Springer.
Schaufeli, W., & Dierendock, D. (2000). Manual utrecht burnout scale. (). Amsterdamn:
Pearson Assessment & Information.

523226-L-bw-Bebber523226-L-bw-Bebber523226-L-bw-Bebber523226-L-bw-BebberProcessed on: 27-8-2018Processed on: 27-8-2018Processed on: 27-8-2018Processed on: 27-8-2018 PDF page: 99PDF page: 99PDF page: 99PDF page: 99
87
Terluin, B., Rhenen, W. V., Schaufeli, W. B., & De Haan, M. (2004). The four-dimensional
symptom questionnaire (4DSQ): Measuring distress and other mental health problems
in a working population. Work & Stress, 18(3), 187-207.
Terluin, B. (1996). De vierdimensionale klachtenlijst (4DKL). Een Vragenlijst Voor Het Meten
Van Distress, Depressie, Angst En Somatisatie [the Four-Dimensional Symptom
Questionnaire (4DSQ).A Questionnaire to Measure Distress, Depression, Anxiety, and
Somatization].Huisarts & Wetenschap, 39(12), 538-547.
Terluin, B. (2014). Four-dimensional symptom questionnaire (4DSQ). Encyclopedia of quality
of life and well-being research (pp. 2348-2350) Springer.
Terluin, B., Smits, N., Brouwers, E. P., & de Vet, H. C. (2016). The four-dimensional symptom
questionnaire (4DSQ) in the general population: Scale structure, reliability,
measurement invariance and normative data: A cross-sectional survey. Health and
Quality of Life Outcomes, 14(1), 130.
Terluin, B., Smits, N., & Miedema, B. (2014). The english version of the four-dimensional
symptom questionnaire (4DSQ) measures the same as the original dutch questionnaire:
A validation study. The European Journal of General Practice, 20(4), 320-326.
-
cultural validation of the turkish four-dimensional symptom questionnaire (4DSQ) using
differential item and test functioning (DIF and DTF) analysis. BMC Family Practice, 17(1),
1.

523226-L-bw-Bebber523226-L-bw-Bebber523226-L-bw-Bebber523226-L-bw-BebberProcessed on: 27-8-2018Processed on: 27-8-2018Processed on: 27-8-2018Processed on: 27-8-2018 PDF page: 100PDF page: 100PDF page: 100PDF page: 100
88
Terluin, B., van Marwijk, H. W., Ader, H. J., de Vet, H. C., Penninx, B. W., Hermens, M. L., . . .
Stalman, W. A. (2006). The four-dimensional symptom questionnaire (4DSQ): A
validation study of a multidimensional self-report questionnaire to assess distress,
depression, anxiety and somatization. BMC Psychiatry, 6, 34.
van Bebber, J., Wigman, J. T., Wunderink, L., Tendeiro, J. N., Wichers, M., Broeksteeg, J., . . .
Meijer, R. R. (2017). Identifying levels of general distress in first line mental health
services: Can GP-and eHealth clients’ scores be meaningfully compared? BMC
Psychiatry, 17(1), 382.

523226-L-bw-Bebber523226-L-bw-Bebber523226-L-bw-Bebber523226-L-bw-BebberProcessed on: 27-8-2018Processed on: 27-8-2018Processed on: 27-8-2018Processed on: 27-8-2018 PDF page: 101PDF page: 101PDF page: 101PDF page: 101
89
Chapter 5
Application of the Patient-Reported Outcomes Measurement Information System (PROMIS) item
parameters for Anxiety and Depression in the Netherlands
This chapter was based on the manuscript:
van Bebber, J., Flens, G., Wigman, J.T.W., de Beurs, E., Sytema, S., Wunderink, L., and Meijer, R.R.
(2018). The Patient-Reported Outcomes Measurement Information System (PROMIS) item
parameters for Anxiety and Depression: Applicability for the Dutch general and Dutch clinical
population.
for publication in International Journal for Methods in Psychiatric Research.
Abstract
The Patient-Reported Outcomes Measurement Information System (PROMIS) Health organization
has compiled and calibrated item banks for various domains in the United States and these item
banks have been translated into Dutch language. Also, in earlier studies the item banks for Anxiety
and Depression have been administered in two samples, one stratified sample drawn from the Dutch
general population and one convenience sample drawn from the Dutch clinical population. The aim
of this study was to investigate the validity of the official PROMIS item parameters for the item banks
of Anxiety and Depression that have been estimated based on data collected in the United States for
use in the Netherlands. For both domains, we determined (i) the fit of U.S. item parameters, (ii) the
effect on individual domain scores and domain levels, (iii) whether using the official PROMIS item
parameters instead of Dutch parameters would affect the magnitude of the correlations with full
item bank totals, and, (iv) whether using the official PROMIS item parameters instead of Dutch
parameters would affect the classification accuracies of adaptive test scores for diagnoses of anxiety-
and mood disorders. The results showed that especially in the clinical population sample, fit
appeared to be problematic for many items. However, simulations revealed that both types of item
parameters perform nearly equally well in practice. We tentatively conclude that the official PROMIS
item parameters can be used for scaling respondents in the Netherlands.

523226-L-bw-Bebber523226-L-bw-Bebber523226-L-bw-Bebber523226-L-bw-BebberProcessed on: 27-8-2018Processed on: 27-8-2018Processed on: 27-8-2018Processed on: 27-8-2018 PDF page: 102PDF page: 102PDF page: 102PDF page: 102
90
5.1 Introduction
5.1.1 The Patient-Reported Outcomes Measurement Information System From a patient’s perspective, Patient-Reported Outcomes (PROs) such as the ability to carry out daily
chores, the ability to participate in various social interactions, or the degree to which one
experiences sleep disturbances are much more relevant than physical indicators and concepts of
health, such as variability in heart rate, Body Mass Indexes, or (changes in) functional magnetic
resonance images over time. However, PROs are frequently not standardized across patient
populations and studies, thus limiting the comparability of scores across studies. Moreover, many
PRO measures have low measurement precision (Cella et al., 2010).
In order to overcome these limitations, the Patient-Reported Outcomes Measurement
Information System (PROMIS) research group collected candidate items for various patient reported
outcomes in the U.S. (Cella et al., 2007; DeWalt, Rothrock, Yount, Stone, and PROMIS Cooperative
Group, 2007). Furthermore, data that were representative of the 2000 U.S. census were collected in
the U.S. (Cella et al., 2010). Based on these data, final item banks were compiled. Item banks, or item
pools, are collections of items that all pertain to the same domain or construct of interest. To
indicate a respondent’s level on these domains/constructs, the PROMIS Health Organization uses T-
scores. That is, item banks are scaled in such a way that the resulting person scores first are
standardized according to the 2000 US census and are then rescaled to have a mean of 50 and a
standard deviation of 10 by the well-known transformation T = z * 10 + 50.
For these collections of items, parameter values have been derived by means of item
response theory (Embretson & Reise, 2013). These parameter values can be used (i) to compute IRT
scale scores, (ii) to compile brief versions of questionnaires with optimal measurement properties for
specific testing purposes (e.g., have maximum measurement precision for certain trait levels), and
(iii) to enable computerized adaptive testing (CAT). In CAT, items that are presented to respondents
are tailored to responses given to previous items. With each consecutive item, an updated person
score is derived, and the item that increases measurement precision maximally for this score is
utilized next. This process usually continues until a predefined measurement precision is reached. In
CATs, fewer items are needed to derive reliable scores compared to assessments with traditional
(fixed-length) questionnaires. For a more elaborate introduction to the topic of CAT, see Meijer and
Nering (1999).
The aim of the PROMIS Health Organization is that these item banks will be used worldwide
so that results from studies conducted in different countries can be compared more easily: “The
main goal of the PROMIS initiative is to develop and evaluate, for the clinical research community, a

523226-L-bw-Bebber523226-L-bw-Bebber523226-L-bw-Bebber523226-L-bw-BebberProcessed on: 27-8-2018Processed on: 27-8-2018Processed on: 27-8-2018Processed on: 27-8-2018 PDF page: 103PDF page: 103PDF page: 103PDF page: 103
91
set of publicly available, efficient and flexible measurements of PROs, including health-related quality
of life (HRQL)” (Cella et al., 2010, p. 2). In addition, Terwee et al (2014, p. 1734) “…expected that
PROMIS will be implemented worldwide and that PROMIS instruments will experience rapid
adoption, once their cross-cultural validity is documented”. Data gathered in various countries with
internationally accepted instruments could be more easily combined and reanalyzed in meta-
analyses.
Recently, 17 PROMIS item banks for adults have been translated into the Dutch language
(Terwee et al., 2014). Two of those, the adult PROMIS item banks for Anxiety and Depression, were
recently administered by the Foundation for Benchmarking Mental Health Care4 in two samples, one
stratified sample drawn from the Dutch general population and one convenience sample drawn from
the Dutch clinical population (Flens et al., 2017a, 2017b). This offers the opportunity to investigate
whether the item parameters are similar in the Dutch and the U.S. item banks. For reasons of
simplicity, in the remainder of this article, we will refer to the item parameters that were derived in
the U.S. as the PROMIS item parameters and refer to the item parameters that were derived from
data collected in the Netherlands as Dutch item parameters. For research purposes, the official
PROMIS item parameters are freely available upon request from the PROMIS Health Organization.
5.1.2 Aims of this study First, we investigated whether the PROMIS item parameters could also be used to describe the data
sampled from the Dutch general population and the Dutch clinical population. Second, we
investigated the effect of using the PROMIS item parameters instead of Dutch item parameters in
simulated adaptive tests. In particular, we performed Real Data Simulations (RDS) using both
parameter sets (i) to investigate differences in T-scores computed, (ii) to investigate differences in
levels of anxiety and depression respectively as proposed by Cella et al. (2014), (iii) to compare the
correlations of simulated adaptive test scores with unweighted full item bank total scores, and (iv) to
compare the predictive power of simulated CAT scores for diagnoses of mood- and anxiety disorders,
respectively. Finally, we used the PROMIS item parameters to compare the distributions of anxiety
and depressive symptom experiences across populations.
4 The Foundation for Benchmarking Mental Health Care is a Dutch trusted third party which aims to provide a country-wide performance benchmark to evaluate and compare treatment outcomes of mental health care providers in the Netherlands.

523226-L-bw-Bebber523226-L-bw-Bebber523226-L-bw-Bebber523226-L-bw-BebberProcessed on: 27-8-2018Processed on: 27-8-2018Processed on: 27-8-2018Processed on: 27-8-2018 PDF page: 104PDF page: 104PDF page: 104PDF page: 104
92
5.2 Methods
5.2.1 Participants The U.S. PROMIS Wave one data file (Cella et al., 2010) was used by Pilkonis et al. (2011) for
estimating item parameters for the emotional stability item banks Anxiety and Depression. For
efficiency reasons, data were collected using a block design, where respondents did not have to
respond to all items. As a result, approximately one third of the Nmin = 2243 and Nmax = 2928 (number
of respondents in the block design varied across items) respondents in this block design responded to
all emotional stability items. One hundred of these cases were flagged due to unrealistically short
response times and removed from further analyses (Pilkonis et al., 2011). In addition, respondents
who answered less than 50% of the items from a specific domain were removed from further
analyses for that specific domain. These criteria resulted in sample sizes of N = 788 and N = 782
participants for the PROMIS Anxiety and Depression samples, respectively (full item bank
administrations, i.e. numbers of respondents that responded to all items from these item banks). For
all analyses in this article, we used the item parameters calibrated in using the block design and refer
to them as the PROMIS item parameters.
The Dutch general population sample (Flens et al., 2017a, 2017b) was obtained using an
online panel (Desan Research Solutions; www.desan.nl). Respondents participated voluntarily in the
panel and received a small financial compensation for participation. A sample of N = 1,486
respondents was drawn, and stratified on gender, age, education level, ethnicity and region. The
response rate was 71% resulting in N = 1,055 respondents. Of these respondents, 53 respondents
were excluded from further analyses because they showed suspicious response patterns (e.g., all
responses in one category in combination with very short response times). The final general
population sample consisted of N = 1,002 respondents. The composition of this sample represented
the marginal composition of the Dutch general population in 2013 (Statistics Netherlands;
www.cbs.nl) in terms of gender, age (younger, middle-aged and older), education (low, middle and
high), ethnicity (Dutch natives, western- and non-western immigrants), and region (north, east,
south, and west), with deviations of maximal 2.5% for each category. Detailed information on the
stratification process used can be found in Flens et al. (2017a, 2017b).
For the Dutch clinical population sample, N = 3,296 patients with common mental disorders
who started their treatment in ambulatory mental health care were invited by the Dutch mental
health care provider Parnassia Group to respond to all items from the PROMIS Anxiety and
Depression item banks online (Flens et al., 2017). In accordance with Parnassia’s policy, item banks
were only administered when informed consent had been obtained. The patients’ diagnoses (4th ed.;

523226-L-bw-Bebber523226-L-bw-Bebber523226-L-bw-Bebber523226-L-bw-BebberProcessed on: 27-8-2018Processed on: 27-8-2018Processed on: 27-8-2018Processed on: 27-8-2018 PDF page: 105PDF page: 105PDF page: 105PDF page: 105
93
DSM–IV; American Psychiatric Association, 1994) were assessed prior to the study in two ways. First,
a psychiatric nurse administered the Mini International Neuropsychiatric Interview (MINI-plus;
Sheehan et al., 1998) in Dutch (van Vliet & de Beurs, 2007) by phone. Second, the diagnoses were
verified in clinical face-to-face assessments and, in case of comorbid diagnoses, the primary diagnosis
was established. The response rate in the clinical sample was 31% resulting in N = 1,032. Of these, 24
patients were excluded from further analyses because of missing values on some items. The final
clinical sample thus consisted of 1,008 patients. In terms of DSM-IV diagnoses, 44% had a primary
diagnosis of mood disorder, 33% an anxiety disorder, and 23% a disorder not specified any further
(e.g., attention deficit disorder, somatoform disorder, personality disorder). For the variables gender
and age no systematic differences between non-responders and responders were found (Flens et al.,
2017).
Extensive information on the demographic background of respondents in the four samples
that were used in this study can be found in Table A1 in the supplementary material of this article.
The composition of the U.S. general population samples and of the Dutch general population sample
was similar in terms of gender, age, and with respect to the percentage of respondents that attained
a college degree. Respondents from the Dutch general population sample were somewhat less likely
to have received an advanced degree compared to the U.S. general population samples.
Furthermore, respondents in the Dutch clinical sample were approximately twelve years younger
than respondents in the PROMIS wave-1 samples, and the Dutch clinical sample contains
approximately 10% more females than the PROMIS wave one samples. Due to differences in the way
demographic variables, such as ethnicity and relationship status, were recorded in the U.S. and in the
Netherlands, a more in-depth comparison of the four samples was not possible.
5.2.2 Instruments The selection of items for the PROMIS item banks for Anxiety and Depression has been thoroughly
discussed in Cella et al. (2010). All items together with the official PROMIS item parameters can be
found online (www.assessmentcenternet). The items comprising the PROMIS Anxiety item bank can
be found in Table A2.1 (appendix), and the items comprising the PROMIS Depression item bank can
be found in Table A2.2 (appendix). These tables also list the labels that are used for convenience in
the remainder of this article.
5.2.3 Statistical analyses: Fit of item parameters For each domain, Anxiety and Depression, we first ran one analysis in which we determined the fit of
the official PROMIS U.S. item parameters to the data of the Dutch general population and Dutch

523226-L-bw-Bebber523226-L-bw-Bebber523226-L-bw-Bebber523226-L-bw-BebberProcessed on: 27-8-2018Processed on: 27-8-2018Processed on: 27-8-2018Processed on: 27-8-2018 PDF page: 106PDF page: 106PDF page: 106PDF page: 106
94
clinical population sample5. This was done in IRTPRO (Cai, Du Toit, and Thissen, 2011) by entering the
U.S item parameters as starting values and setting the number of iterations of the Bock Atkinson
Expectation Maximization algorithm equal to one. We used summed-score based item diagnostics
(Orlando & Thissen, 2000) to assess item-level fit. These test statistics can be used to evaluate
differences between observed and expected (model implied) item score frequencies for various
score levels. Score levels are summed scores without the item targeted in the specific item fit test.
Note that for each combination of item bank and target population, nearly 30 tests are performed.
Furthermore, with more than 1000 respondents in each group, the tests of item fit are very
powerful. These considerations led us to choose alfa overall to equal .01, resulting in a comparison-
wise alfa of .0004 by the conventional Bonferroni correction as criterion indicating misfit. We note
however, that in our view, fit is best considered as a continuum and not as a dichotomy.
In order to get an idea of the magnitude of the effect of using the PROMIS item parameters
instead of Dutch item parameters on the item level, we computed differences in expected item
scores for thirteen T-scores (from 30 to 90 with steps of 5) along the depression continuum using
both parameter sets. Expected item scores are those item scores that are most likely, given the
parameter values of items in combination with the theta-values that correspond to designated T-
scores. We did this for those 23 items of the depression item bank that were also used in the study
conducted by Cella et al. (2014).
5.2.4 Statistical analyses: Real Data Simulations To evaluate the practical consequences of using the official PROMIS item parameters that might not
be optimal for scaling Dutch respondents, we used Real Data Simulations (Sands, Waters, & McBride,
1997). RDS can be used to determine important characteristics of CATs that are not yet implemented
in practice. All RDS were performed using the response patterns from the Dutch clinical population
sample because the fit of the official PROMIS item parameters was much more problematic in this
sample than in the Dutch general population sample (see Results section).
For each item bank, we ran two RDS6. In the first run, we used the official PROMIS item
parameters, and in the second run, we used item parameters that were calibrated using the data
5 Readers that are familiar with the framework of IRT might question why we did not perform Differential Item Functioning (DIF) analyses. We did not do so because the official PROMIS item parameters have been calibrated in a block design for reasons of efficiency, and up to our knowledge, a combination of a blocked design with DIF analyses is not feasible. In addition, DIF tests would take into account the estimation errors of the official PROMIS item parameter estimates, while in CAT applications, it is assumed that the true values of item parameter estimates would be known. That is, our fit tests are more stringent than DIF tests. 6 The following settings have been used in the simulations: The first item was the one that provided maximum information with respect to the group mean of the U.S. general population ( = 0). Furthermore, we used Expected A Posteriori (EAP) as inter-item estimator, combined with Minimum Expected Posterior Variance

523226-L-bw-Bebber523226-L-bw-Bebber523226-L-bw-Bebber523226-L-bw-BebberProcessed on: 27-8-2018Processed on: 27-8-2018Processed on: 27-8-2018Processed on: 27-8-2018 PDF page: 107PDF page: 107PDF page: 107PDF page: 107
95
from both Dutch samples in Multiple Group Item Response Theory analyses (Flens et al., 2017a,
2017b).
First, we transformed all CAT scores to the for PROMIS item banks conventional T-score
metric and computed the difference in T-scores based on PROMIS item parameters and based on
Dutch item parameters for each item bank.
Second, we recoded these T-scores into the four (normal, mild, moderate, and severe) levels7
of anxiety and depression proposed by Cella et al. (2014) and computed differences between levels
based on PROMIS versus Dutch item parameters.
Third, we used the adaptive test scores to compare the correlations of simulated adaptive
test scores with unweighted item bank totals for each item bank.
In addition, for patients in the clinical sample, information on their current primary DSM-IV
(American Psychiatric Association, 2000) diagnoses were available. We used this information to
create two dummy variables. The first contrasted patients with and without anxiety disorder (that is,
generalized anxiety disorder, obsessive- compulsive disorder, specific phobia, social phobia, panic
disorder with and without agoraphobia, or post-traumatic stress syndrome) as primary diagnosis. The
second dummy variable contrasted patients with and without any kind of mood disorder (that is, first
episode or recurrent depression, dysthymia, or depressive episode in bipolar disorder). Fourth, for
each item bank, we compared the classification accuracies (count correct classifications divided by
total count classifications) of CAT scores based on the aforementioned parameter sets (official
PROMIS U.S. item parameters and item parameters estimated on Dutch data) for the DSM-IV
diagnoses of having any kind of anxiety disorder and of having any kind of mood disorder. We used
the program Firestar (Choi, 2009) to compile syntax to be used in R (R Core Team, 2014) to perform
these analyses.
5.2.5 The latent distributions of anxiety and depression in the Dutch general and Dutch clinical population For each domain, we used the official PROMIS item parameters to compute expected a posteriori
(EAP) IRT scale scores for respondents in the Dutch general population sample, and in the Dutch
clinical population sample. This was done to compare the distributions of anxiety and depressive
symptom experiences in both Dutch samples to the distributions of anxiety and depressive symptom
(MEPV) to choose most appropriate follow-up items. A minimum of four items was always administered. When the standard error of the person estimate fell below .45, a value that corresponds to a reliability of .80, no more items were administered. We chose this cut-off value, because, according to the assessment criteria of the Dutch commission on test affairs (COTAN), a reliability of a least .80 is required to qualify an instrument as sufficiently reliable in contexts where important decisions about individuals’ futures are made. 7 T < 55: Normal, 55-64.99: Mild, 65-74.99: Moderate, and T > 75: Severe.

523226-L-bw-Bebber523226-L-bw-Bebber523226-L-bw-Bebber523226-L-bw-BebberProcessed on: 27-8-2018Processed on: 27-8-2018Processed on: 27-8-2018Processed on: 27-8-2018 PDF page: 108PDF page: 108PDF page: 108PDF page: 108
96
experiences in the U.S. general population. These scores were fixated to be standardized (M = 0 and
SD = 1) in the PROMIS calibration samples, which served as points of reference.
5.3 Results
5.3.1 Fit item parameters for the PROMIS Anxiety item bank The results of the sum score based item diagnostics for the 29 anxiety items for the Dutch general
and Dutch clinical population samples can be found in Table A 5.3.1 in the Appendix. According to the
criterion of .0004 for significance, application of the official PROMIS item parameters to the data
from the Dutch general population resulted in acceptable fit for only nine out of 29 anxiety items. For
the Dutch clinical population sample (columns five through seven), application of the U.S. item
parameters resulted in acceptable fit for only for one item according to our level of significance.
5.3.2 Fit item parameters for the PROMIS Depression item bank The results of the summed-score based item diagnostics for the 28 PROMIS Depression items are
displayed in Table A 3.2 (Appendix). In general, results were similar to those of the PROMIS Anxiety
item bank. Application of the official PROMIS item parameters to the data from the Dutch general
population resulted in acceptable fit for nine out of 29 PROMIS Depression items. With respect to the
Dutch clinical population sample (Table A 5.2.2, columns five through seven), only the response data
to items EDDEP28 and EDDEP48 showed acceptable fit using the PROMIS item parameters.
In order to illustrate the procedure of the aforementioned sum score based item diagnostics,
observed and expected score frequencies for various score levels (total scores without the item
targeted) on item EDDEP04, I felt worthless, in the Dutch general population sample are displayed in
Table A4 in the appendix. We collapsed score levels in such a way as to create expected score
frequencies of at least 100 for one response category. As can be seen from Table A4, for nearly all
score levels, much less respondents chose the lowest response option than the PROMIS item
parameters predicted. With the exception of very high score levels, the reverse holds for the second
and third response option.
In Table 5.1, the differences in expected item scores using both parameter sets are displayed
for the depression items conditional on thirteen T-scores along the depression continuum. As can be
seen, for most items and score levels expressed in terms of T-scores, usage of either PROMIS or
Dutch item parameters led to the same expected item scores. The item for which we found most
differences was item EDDEP04, I felt worthless.

523226-L-bw-Bebber523226-L-bw-Bebber523226-L-bw-Bebber523226-L-bw-BebberProcessed on: 27-8-2018Processed on: 27-8-2018Processed on: 27-8-2018Processed on: 27-8-2018 PDF page: 109PDF page: 109PDF page: 109PDF page: 109
97
Table 5.1 Differences in expected item scores caused by using Dutch item parameters instead of official PROMIS item parameters for thirteen T-scores along the depression continuum.
T-score Item 30 35 40 45 50 55 60 65 70 75 80 85 90 I felt worthless -1 1 2 1 1 1 I felt that I had nothing to look forward to
I felt helpless 1 I withdrew from other people -1 I felt that nothing could cheer me up
-1
I felt that I was not as good as other people
-1 -1 -1
I felt sad 1 -1 I felt that I wanted to give up on everything
-1 -1
I felt that I was to blame for things 1 I felt like a failure 1 -1 I had trouble feeling close to people
I felt disappointed in myself 1 I felt that I was not needed -1 I felt lonely 1 -1 I felt depressed 1 1 1 I felt discouraged about the future 1 1 I found that things in my life were overwhelming
1 1 1 1
I felt unhappy 1 1 1 I felt I had no reason for living 1 I felt hopeless 1 1 1 I felt pessimistic 1 -1 I felt that my life was empty -1 -1 I felt emotionally exhausted 1 1
Blank spaces represent correspondence in item scores.
5.3.3 How serious is misfit for practical decisions? Results Real Data Simulations The results of the comparisons of T-scores based on PROMIS versus Dutch item parameters are
summarized in Table 5.2. For both item banks, application of PROMIS or Dutch item parameters led
to absolute differences in individual T-scores of more than five points in approximately 12% of all
cases. Differences of more than ten points were found in 0.3% of all cases for the PROMIS Anxiety
item bank, and in 0.8% of all cases for the PROMIS Depression item bank.

523226-L-bw-Bebber523226-L-bw-Bebber523226-L-bw-Bebber523226-L-bw-BebberProcessed on: 27-8-2018Processed on: 27-8-2018Processed on: 27-8-2018Processed on: 27-8-2018 PDF page: 110PDF page: 110PDF page: 110PDF page: 110
98
Table 5.2 Differences in T-scores based on official PROMIS item parameters and Dutch item parameters for the anxiety and depression item banks (cumulative percentages).
DIFF > ABS (1) DIFF > ABS (2) DIFF > ABS (3) DIFF > ABS (5) DIFF > ABS (10) Anxiety 71.1 % 52.2 % 31.2 % 12.0 % 0.3 % Depression 70.3 % 51.2 % 32.0 % 12.6 % 0.8 %
In Table 5.3, the cross tabulation of levels of anxiety as proposed by Cella et al. (2014) based
on PROMIS item parameters and levels of anxiety based on Dutch item parameters is displayed. The
same cross tabulation for the Depression item bank may be found in Table A 5.6 (Appendix).
Differences of more than one level were only encountered two times, both for the depression item
bank. Furthermore, for both item banks, both parametrizations led to the same levels of anxiety and
depression in three out of four cases (78% for anxiety and 75% for depression).
Table 5.3 Cross tabulation levels of anxiety based on official PROMIS item parameters and based on Dutch item parameters.
Level Dutch item parameters Normal Mild Moderate Severe Total
Level PROMIS item parameters
Normal 133 30 0 0 163 Mild 19 273 32 0 324 Moderate 0 108 344 11 463 Severe 0 0 28 30 58 Total 152 411 404 41 1008
When comparing the correlations between simulated adaptive test scores (in which PROMIS
parameters or the Dutch parameters were used) and unweighted full item bank total scores, we
found that the choice of PROMIS or Dutch item parameters had a small effect on the magnitudes of
the correlations coefficients. These differences were very small, although when we used the Dutch
item parameters, the correlations were somewhat larger for both item banks. For the PROMIS
Anxiety item bank, we found a correlation of r = .921 when using the PROMIS item parameters in
RDS, whereas using the Dutch item parameters resulted in a correlation coefficient of r = .932. For
the PROMIS Depression item bank, we obtained a correlation of r = .925 when using the PROMIS
item parameters, whereas the Dutch item parameters lead to a correlation of r = .930. We also
computed the correlations between both sets of simulated adaptive test scores (one set based on
Dutch item parameters, and one set based on PROMIS item parameters). For anxiety, the correlation
equaled .935, and for depression, the correlation was equal to .916. Note that since both coefficients
are close to one, the relative positions of individuals are roughly the same, independent of the item
parameters used.

523226-L-bw-Bebber523226-L-bw-Bebber523226-L-bw-Bebber523226-L-bw-BebberProcessed on: 27-8-2018Processed on: 27-8-2018Processed on: 27-8-2018Processed on: 27-8-2018 PDF page: 111PDF page: 111PDF page: 111PDF page: 111
99
Three logistic regression analyses were conducted to predict whether respondents in the
Dutch clinical population sample would suffer from an anxiety disorder. In the first analysis, the
unweighted total scores of all PROMIS Anxiety items were used as predictor. In the second analysis,
the simulated adaptive test scores based on the PROMIS item parameters were used as predictor
and in the third analysis, the simulated adaptive test scores based on the Dutch item parameters
were used as predictor. In all three analyses, the tests of full models against the constant only
models were statistically non-significant, indicating that the test scores did not reliably distinguish
patients with and without an anxiety disorder diagnosis, regardless of which item parameters
(PROMIS or Dutch) were used to simulate adaptive test scores. The constant only model for the
dependent variable anxiety disorder diagnoses yielded a classification accuracy of 67.1% overall by
predicting ‘no mood disorder’ for every respondent.
Three additional logistic regression analyses were conducted to predict whether respondents
in the Dutch clinical population sample would suffer from a mood disorder. The results of these
analyses are displayed in Table 5.4.
Table 5.4 Logistic regression results for predicting mood disorder diagnosis. Variables B SE (B) W 2 Df p eB 95% CI eB SDEP* .019 .003 44.5 1 <.01 1.019 1.013,1.025
2 47.8 N 1008 CATDEP-U.S.** .646 .087 54.8 1 <.01 1.908 1.603,2.270
2 62.5 N 1008 CATDEP-Dutch*** .639 .088 52.6 1 <.01 1.895 1.589,2.259
2 58.4 N 1008
*Unweighted item bank totals; **Simulated adaptive test scores using official U.S. PROMIS item parameters; ***Simulated adaptive test scores using the Dutch item parameters.
The test of the first full model against a constant only model was statistically significant,
indicating that the unweighted item bank total score distinguishes between respondents with and 2 = 47.8, p<.01 with df = 1; Nagelkerke’s R2 = .062). The test of
the second full model against a constant only model was statistically significant, indicating that the
simulated adaptive test score based on the PROMIS Depression item parameters distinguishes
between respondents with and without a mood disorder di 2 = 62.5, p<.01 with df = 1;
Nagelkerke’s R2 = .081). A test of the third full model against a constant only model was statistically
significant, indicating that the simulated adaptive test score based on the Dutch Depression item
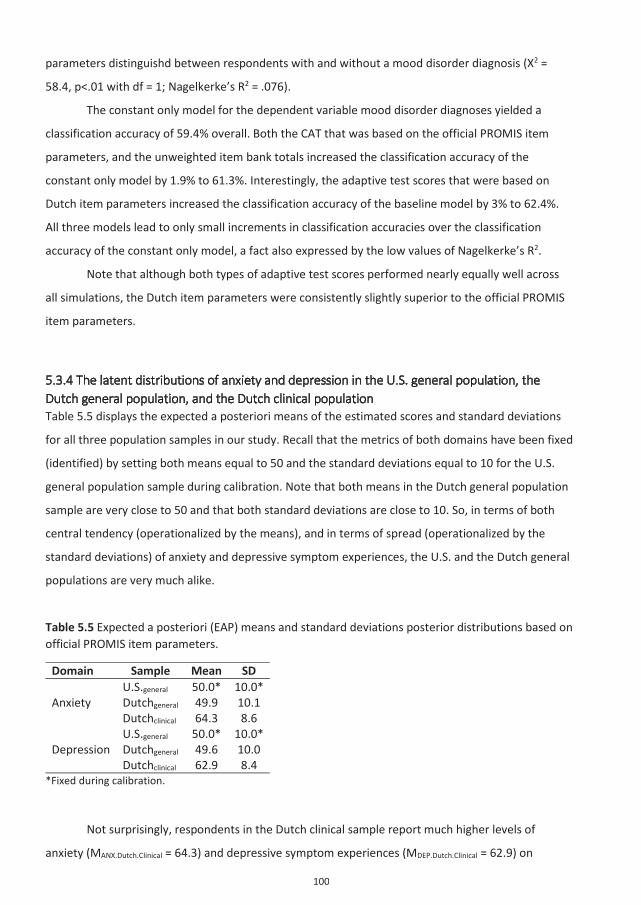
523226-L-bw-Bebber523226-L-bw-Bebber523226-L-bw-Bebber523226-L-bw-BebberProcessed on: 27-8-2018Processed on: 27-8-2018Processed on: 27-8-2018Processed on: 27-8-2018 PDF page: 112PDF page: 112PDF page: 112PDF page: 112
100
parameters distinguishd 2 =
58.4, p<.01 with df = 1; Nagelkerke’s R2 = .076).
The constant only model for the dependent variable mood disorder diagnoses yielded a
classification accuracy of 59.4% overall. Both the CAT that was based on the official PROMIS item
parameters, and the unweighted item bank totals increased the classification accuracy of the
constant only model by 1.9% to 61.3%. Interestingly, the adaptive test scores that were based on
Dutch item parameters increased the classification accuracy of the baseline model by 3% to 62.4%.
All three models lead to only small increments in classification accuracies over the classification
accuracy of the constant only model, a fact also expressed by the low values of Nagelkerke’s R2.
Note that although both types of adaptive test scores performed nearly equally well across
all simulations, the Dutch item parameters were consistently slightly superior to the official PROMIS
item parameters.
5.3.4 The latent distributions of anxiety and depression in the U.S. general population, the Dutch general population, and the Dutch clinical population Table 5.5 displays the expected a posteriori means of the estimated scores and standard deviations
for all three population samples in our study. Recall that the metrics of both domains have been fixed
(identified) by setting both means equal to 50 and the standard deviations equal to 10 for the U.S.
general population sample during calibration. Note that both means in the Dutch general population
sample are very close to 50 and that both standard deviations are close to 10. So, in terms of both
central tendency (operationalized by the means), and in terms of spread (operationalized by the
standard deviations) of anxiety and depressive symptom experiences, the U.S. and the Dutch general
populations are very much alike.
Table 5.5 Expected a posteriori (EAP) means and standard deviations posterior distributions based on official PROMIS item parameters.
Domain Sample Mean SD
Anxiety U.S.general 50.0* 10.0* Dutchgeneral 49.9 10.1 Dutchclinical 64.3 8.6
Depression U.S.general 50.0* 10.0* Dutchgeneral 49.6 10.0 Dutchclinical 62.9 8.4
*Fixed during calibration.
Not surprisingly, respondents in the Dutch clinical sample report much higher levels of
anxiety (MANX.Dutch.Clinical = 64.3) and depressive symptom experiences (MDEP.Dutch.Clinical = 62.9) on

523226-L-bw-Bebber523226-L-bw-Bebber523226-L-bw-Bebber523226-L-bw-BebberProcessed on: 27-8-2018Processed on: 27-8-2018Processed on: 27-8-2018Processed on: 27-8-2018 PDF page: 113PDF page: 113PDF page: 113PDF page: 113
101
average than respondents in the general populations samples. Furthermore, the scores of
respondents in the Dutch clinical population sample are more homogenous than the scores in both
general population samples, as indicated by clearly lower standard deviations (SDANX.Dutch.Clinical = 8.6,
SDDEP.Dutch.Clinical = 8.4).
5.4 Discussion
5.4.1 Summary of main findings With respect to the Dutch clinical population, considering the results of the summed-score based
item diagnostics, we found that the response data of very few items (one from the anxiety and two
from the depression item bank) could be described sufficiently well by the official PROMIS item
parameters. With respect to the Dutch general population, only the response data for approximately
one third of all PROMIS Anxiety and Depression items could be described reasonably well by the
official PROMIS item parameters. Interesting, however, was that using the PROMIS item parameters
for all items of both item banks in RDS instead of the Dutch item parameters did not lead to
substantial decrements in various indicators of validity.
At first glance, these two results may seem contradictory. But statistical significance (of
misfit) does not imply practical significance, the latter referring to whether practical decisions (such
as classifications of subjects) change due to misfit. As Sinharay and Haberman (2014) and Crisan,
Tendeiro, and Meijer (2017) have shown, in many cases violations of model assumptions do not have
much influence on practical decisions.
In addition, using the official PROMIS item parameters to compare the distributions of
anxiety and depressive symptoms experiences across populations revealed that the samples of the
general populations in the U.S. and in the Netherlands were quite comparable in terms of anxiety
and depressive symptom experiences.
5.4.2 Practical implications and recommendations Although the fit statistics indicated that the PROMIS item parameters did not describe the Dutch data
very well, especially for the Dutch clinical population sample, using the PROMIS item parameters
instead of the Dutch item parameters did not lead to dramatic decreases in correlations and
classification accuracies. Thus, for sake of simplicity and international comparability, for research
purposes on group level, we recommend using the official PROMIS item parameters that have been
calibrated in the U.S. by Pilkonis (2011). For assessing individuals, however, the situation is more
complex, and additional research is recommended (see below). Although most respondents received

523226-L-bw-Bebber523226-L-bw-Bebber523226-L-bw-Bebber523226-L-bw-BebberProcessed on: 27-8-2018Processed on: 27-8-2018Processed on: 27-8-2018Processed on: 27-8-2018 PDF page: 114PDF page: 114PDF page: 114PDF page: 114
102
similar T-scores and the same severity levels, for both item banks, approximately 12 % of all
respondents showed differences in T-score larger than 5, and one fourth of all respondents were
classified at somewhat different severity levels. Note that we cannot treat either scores (based on
PROMIS or based on Dutch item parameters) as a gold standard, because both parameter sets
performed moderately at best with respect to predicting which individuals did receive a diagnosis of
anxiety or mood disorder, and which did not. In addition, the predictive power of the simulated
adaptive test scores based on the PROMIS Depression item bank was also weak. In our view, these
observations cast doubt on the validity of both item banks for detecting cases of anxiety and
depression in clinical populations.
5.4.3 Strengths and limitations To our knowledge, this is the first study that investigated the cross-cultural validity of the official
PROMIS item parameters for the emotional stability item banks of Anxiety and Depression.
Furthermore, it is one of the first studies that did not focus solely on fit indices when assessing the
cross-cultural validity of measurement model parameter estimates, but also incorporated various
validity indices that are relevant for test practice.
One limitation of the study was that the procedure we used to compute fit statistics did not
take into account the standard errors of the PROMIS item parameter estimates. Because
approximately 2000 respondents have been used in the original block design for calibrating the
items, we assume that the accompanying standard errors were actually quite small, and thus we
expect that our results will not differ much from those we would have obtained when these standard
errors had been incorporated. Another limitation of this study is the fact that the data in the U.S
have been collected 2006/2007, while the data in the Netherlands have been collected in 2014/2015.
In addition to this, in the U.S., the census of the year 2000 served as reference, while in the
Netherlands, the composition of the Dutch general population in 2013 was used. The meaning of
symptoms may change over the years, and these subtle changes may also affect item parameters.
Although the results with respect to prediction of diagnostic status are disappointing, we
think that two remarks are important. First, all respondents in the clinical sample had received a
DSM-IV diagnosis and all respondents were still in treatment for those disorders. In a sample without
this restriction of range (e.g., including healthy controls from the general Dutch population), the
predictor scores would have been more useful to better discriminate respondents with an anxiety
diagnosis from those without such a diagnosis. Related to this is that the PROMIS item banks were
primarily developed for use in the general population.

523226-L-bw-Bebber523226-L-bw-Bebber523226-L-bw-Bebber523226-L-bw-BebberProcessed on: 27-8-2018Processed on: 27-8-2018Processed on: 27-8-2018Processed on: 27-8-2018 PDF page: 115PDF page: 115PDF page: 115PDF page: 115
103
5.4.4 Directions for future research To further investigate the validity of the PROMIS Anxiety and Depression item parameters for use in
the Netherlands, we suggest the following. First, administer both item banks to respondents drawn
from the Dutch general and Dutch clinical population, use RDS to compute simulated adaptive test
scores according to both parameterizations, and determine for which test takers the severity levels
differ. Second, ask these respondents and possibly also informed others (best friends and/or first
degree relatives) which severity level best reflects the clients’ situation.
Furthermore, future research may investigate the fit of the official PROMIS item parameters
for other PROMIS domains across different countries. This is also what the PROMIS Health
Organization tries to accomplish by international research collaborations. But instead of performing
numerous ‘pairwise’ DIF analyses (U.S versus a single foreign country), we advocate an approach that
incorporates data collected in various countries in a single calibration study. If international
comparability of scores is the core aim of the PROMIS Health Organization, efforts should be made to
find parameter estimates that fit optimally in various countries where these parameters shall be
implemented.
Another interesting direction for future research would be temporal invariance of the official
PROMIS item parameter estimates, because much research is longitudinal and not (only) cross-
sectional. Are the item parameters invariant with respect to therapeutic interventions? For example,
does the construct of depression have the same meaning before and after recovery from a
depressive episode?
However, until item parameters may be based on truly international calibration samples, the
existing official PROMIS item parameters may be implemented, even though results of strict fit tests
seem to warn against their use.
5.5 Appendix
Table A5.1 Demographic background of respondents in the four samples. PROMISANX PROMISDEP DUTCHGEN DUTCHCLIN Sample size 788 782 1002 1008 Gender (% female) 52.0 51.9 52.1 61.6 Age – mean 51.0 51.0 48.9 38.4 Age – SD 18.9 18.8 16.5 13.0 College degree (in %) 18.0 18.1 18.8 --- Advanced degree* (in %) 13.1 12.9 9.3 ---
* Master, Medical Doctor and PhD degree.

523226-L-bw-Bebber523226-L-bw-Bebber523226-L-bw-Bebber523226-L-bw-BebberProcessed on: 27-8-2018Processed on: 27-8-2018Processed on: 27-8-2018Processed on: 27-8-2018 PDF page: 116PDF page: 116PDF page: 116PDF page: 116
104103
Table A5.2.1 Labels and items PROMIS item bank anxiety. Label Item EDANX01 I felt fearful. EDANX02 I felt frightened. EDANX03 It scared me when I felt nervous. EDANX05 I felt anxious. EDANX07 I felt like I needed help for my anxiety. EDANX08 I was concerned about my mental health. EDANX12 I felt upset. EDANX13 I had a racing or pounding heart EDANX16 I was anxious if my normal routine was disturbed. EDANX18 I had sudden feelings of panic. EDANX20 I was easily startled. EDANX21 I had trouble paying attention. EDANX24 I avoided public places or activities. EDANX26 I felt fidgety. EDANX27 I felt something awful would happen. EDANX30 I felt worried. EDANX33 I felt terrified. EDANX37 I worried about other people's reactions to me. EDANX40 I found it hard to focus on anything other than my anxiety. EDANX41 My worries overwhelmed me. EDANX44 I had twitching or trembling muscles. EDANX46 I felt nervous. EDANX47 I felt indecisive. EDANX48 Many situations made me worry. EDANX49 I had difficulty sleeping. EDANX51 I had trouble relaxing. EDANX53 I felt uneasy. EDANX54 I felt tense. EDANX55 I had difficulty calming down.

523226-L-bw-Bebber523226-L-bw-Bebber523226-L-bw-Bebber523226-L-bw-BebberProcessed on: 27-8-2018Processed on: 27-8-2018Processed on: 27-8-2018Processed on: 27-8-2018 PDF page: 117PDF page: 117PDF page: 117PDF page: 117
105
Table A5.2.2 Labels and items PROMIS item bank Depression. Label Item EDDEP04 I felt worthless. EDDEP05 I felt that I had nothing to look forward to. EDDEP06 I felt helpless. EDDEP07 I withdrew from other people. EDDEP09 I felt that nothing could cheer me up. EDDEP14 I felt that I was not as good as other people. EDDEP17 I felt sad. EDDEP19 I felt that I wanted to give up on everything. EDDEP21 I felt that I was to blame for things. EDDEP22 I felt like a failure. EDDEP23 I had trouble feeling close to people. EDDEP26 I felt disappointed in myself. EDDEP27 I felt that I was not needed. EDDEP28 I felt lonely. EDDEP29 I felt depressed. EDDEP30 I had trouble making decisions. EDDEP31 I felt discouraged about the future. EDDEP35 I found that things in my life were overwhelming. EDDEP36 I felt unhappy. EDDEP39 I felt I had no reason for living. EDDEP41 I felt hopeless. EDDEP42 I felt ignored by people. EDDEP44 I felt upset for no reason. EDDEP45 I felt that nothing was interesting. EDDEP46 I felt pessimistic. EDDEP48 I felt that my life was empty. EDDEP50 I felt guilty. EDDEP54 I felt emotionally exhausted.

523226-L-bw-Bebber523226-L-bw-Bebber523226-L-bw-Bebber523226-L-bw-BebberProcessed on: 27-8-2018Processed on: 27-8-2018Processed on: 27-8-2018Processed on: 27-8-2018 PDF page: 118PDF page: 118PDF page: 118PDF page: 118
106
Table A5.3.1 Summed score based item diagnostics for the PROMIS Anxiety items.
Label Dutchgeneral Dutchclinical
2 d.f. P 2 d.f. p EDANX01 643.78 104 .0001 689.92 163 .0001 EDANX02 252.19 98 .0001 288.53 162 .0001 EDANX03 512.06 106 .0001 348.26 175 .0001 EDANX05 245.29 122 .0001 531.99 155 .0001 EDANX07 202.24 109 .0001 768.10 170 .0001 EDANX08 189.30 133 .0010 806.27 193 .0001 EDANX12 376.49 124 .0001 497.46 160 .0001 EDANX13 262.84 158 .0001 618.33 223 .0001 EDANX16 260.63 158 .0001 463.70 227 .0001 EDANX18 120.65 111 .2498 296.24 175 .0001 EDANX20 168.59 158 .2673 410.48 234 .0001 EDANX21 218.02 145 .0001 406.96 198 .0001 EDANX24 226.16 168 .0019 329.89 241 .0001 EDANX26 320.54 152 .0001 835.12 214 .0001 EDANX27 173.97 131 .0071 779.32 192 .0001 EDANX30 670.55 129 .0001 263.27 158 .0001 EDANX33 328.89 84 .0001 255.67 163 .0001 EDANX37 203.54 167 .0283 384.23 238 .0001 EDANX40 182.84 94 .0001 766.76 145 .0001 EDANX41 261.92 107 .0001 542.57 166 .0001 EDANX44 241.71 175 .0006 263.03 246 .2174 EDANX46 199.42 118 .0001 294.51 148 .0001 EDANX47 308.90 135 .0001 731.12 186 .0001 EDANX48 279.60 133 .0001 623.77 164 .0001 EDANX49 312.36 198 .0001 599.52 235 .0001 EDANX51 161.60 158 .4054 266.75 189 .0002 EDANX53 200.00 114 .0001 609.50 146 .0001 EDANX54 194.89 121 .0001 263.68 146 .0001 EDANX55 171.24 120 .0015 311.76 168 .0001

523226-L-bw-Bebber523226-L-bw-Bebber523226-L-bw-Bebber523226-L-bw-BebberProcessed on: 27-8-2018Processed on: 27-8-2018Processed on: 27-8-2018Processed on: 27-8-2018 PDF page: 119PDF page: 119PDF page: 119PDF page: 119
107
Table A5.3.2 Summed score based item diagnostics for the PROMIS Depression items.
Label Dutchgeneral Dutchclinical
2 d.f. P 2 d.f. P EDDEP04 1822.90 99 .0001 648.09 148 .0001 EDDEP05 1044.77 110 .0001 327.08 163 .0001 EDDEP06 432.50 103 .0001 587.27 152 .0001 EDDEP07 321.73 144 .0001 348.24 194 .0001 EDDEP09 227.40 111 .0001 431.78 164 .0001 EDDEP14 245.73 151 .0001 390.27 223 .0001 EDDEP17 250.20 116 .0001 370.64 158 .0001 EDDEP19 379.23 115 .0001 332.97 182 .0001 EDDEP21 188.07 135 .0017 423.05 191 .0001 EDDEP22 198.45 106 .0001 586.14 159 .0001 EDDEP23 197.37 147 .0035 592.64 205 .0001 EDDEP26 231.35 131 .0001 274.13 174 .0001 EDDEP27 196.79 136 .0005 323.07 197 .0001 EDDEP28 170.30 154 .1746 248.45 204 .0183 EDDEP29 446.98 106 .0001 595.35 139 .0001 EDDEP30 331.88 130 .0001 712.14 192 .0001 EDDEP31 185.82 139 .0049 246.16 168 .0001 EDDEP35 210.60 131 .0001 850.74 185 .0001 EDDEP36 443.24 117 .0001 348.42 150 .0001 EDDEP39 331.40 94 .0001 285.01 172 .0001 EDDEP41 138.39 90 .0008 219.02 146 .0001 EDDEP42 168.00 147 .1132 446.98 205 .0001 EDDEP44 216.36 131 .0001 507.23 186 .0001 EDDEP45 151.17 129 .0886 338.77 187 .0001 EDDEP46 391.23 148 .0001 358.56 196 .0001 EDDEP48 129.43 131 .5228 245.75 184 .0016 EDDEP50 221.82 154 .0003 433.48 224 .0001 EDDEP54 289.64 150 .0001 409.48 192 .0001
Table A5.4 Observed and expected score frequencies for different score levels, Item EDDEP04, Dutch general population.
Score level Category 1 Category 2 Category 3 Category 4 Category 5 Obs. Exp. Obs. Exp. Obs. Exp. Obs. Exp. Obs. Exp.
0 134 134 0 0 0 0 0 0 0 0 1-2 93 106 13 0 0 0 0 0 0 0 3-6 81 113 25 2 9 0 0 0 0 0 7-13 75 114 38 8 10 1 0 0 0 0 14-22 47 102 51 27 32 4 2 0 0 0 23-44 28 78 105 102 78 40 11 3 0 0 45-96 3 5 21 31 83 83 54 44 9 8 97-112 0 0 0 0 0 0 0 0 0 0

523226-L-bw-Bebber523226-L-bw-Bebber523226-L-bw-Bebber523226-L-bw-BebberProcessed on: 27-8-2018Processed on: 27-8-2018Processed on: 27-8-2018Processed on: 27-8-2018 PDF page: 120PDF page: 120PDF page: 120PDF page: 120
108
Table A5.5 Content coverage of sets of fitting items.
Domain Factor Count
item bank Percentage item bank
Count subset
Percentage subset
Anxiety
1. Fear 7 .24 1 .13 2. Anxious misery 11 .38 3 .38 3. Hyperarousal 6 .21 3 .38 4. Somatic symptoms 4 .14 1 .13 5. Other 1 .03 0 .00
Depression
1. Negative mood 5 .18 0 .00 2. Decreased positive affect 3 .11 2 .22
3. Information processing deficits 3 .11 1 .11
4. Negative views of the self 5 .18 1 .11
5. Negative social cognition 4 .14 4 .44
6. Other 8 .29 1 .11
Table A5.6 Crosstab levels of depression based on official PROMIS item parameters and based on Dutch item parameters.
Level Dutch item parameters Normal Mild Moderate Severe Total
Level PROMIS item parameters
Normal 138 41 1 1 181 Mild 49 309 27 0 385 Moderate 0 109 271 26 406 Severe 0 0 6 30 36 Total 187 459 305 57 1008
5.6 References
American Psychiatric Association, & American Psychiatric Association. (2000). DSM-IV-TR: Diagnostic
and statistical manual of mental disorders, text revision. Washington, DC: American Psychiatric
Association, 75.
Cai, L., Du Toit, S., & Thissen, D. (2011). IRTPRO: Flexible, multidimensional, multiple categorical IRT
modeling [computer software]. Chicago, IL: Scientific Software International.

523226-L-bw-Bebber523226-L-bw-Bebber523226-L-bw-Bebber523226-L-bw-BebberProcessed on: 27-8-2018Processed on: 27-8-2018Processed on: 27-8-2018Processed on: 27-8-2018 PDF page: 121PDF page: 121PDF page: 121PDF page: 121
109
Cella, D., Riley, W., Stone, A., Rothrock, N., Reeve, B., Yount, S., . . . PROMIS Cooperative Group.
(2010). The patient-reported outcomes measurement information system (PROMIS) developed
and tested its first wave of adult self-reported health outcome item banks: 2005-2008. Journal
of Clinical Epidemiology, 63(11), 1179-1194.
Cella, D., Yount, S., Rothrock, N., Gershon, R., Cook, K., Reeve, B., . . . PROMIS Cooperative Group.
(2007). The patient-reported outcomes measurement information system (PROMIS): Progress of
an NIH roadmap cooperative group during its first two years. Medical Care, 45(5 Suppl 1), S3-
S11.
Choi, S. W. (2009). Firestar: Computerized adaptive testing simulation program for polytomous item
response theory models. Applied Psychological Measurement, 33(8), 644.
DeWalt, D. A., Rothrock, N., Yount, S., Stone, A. A., & PROMIS Cooperative Group. (2007). Evaluation
of item candidates: The PROMIS qualitative item review. Medical Care, 45(5 Suppl 1), S12-21.
Evers, A., Lucassen, W., Meijer, R., & Sijtsma, K. (2010). COTAN beoordelingssysteem voor de kwaliteit
van tests. Amsterdam: Nederlands Instituut van Psychologen.
Flens, G., Smits, N., Terwee, C. B., Dekker, J., Huijbrechts, I., & de Beurs, E. (2017). Development of a
computer adaptive test for depression based on the dutch-flemish version of the PROMIS item
bank. Evaluation & the Health Professions.
Flens, G., Smits, N., Terwee, C. B., Dekker, J., Huijbrechts, I., Spinhoven, P., & de Beurs, E. (2017).
Development of a Computerized Adaptive Test for Anxiety Based on the Dutch–Flemish Version
of the PROMIS Item Bank. Assessment.
Orlando, M., & Thissen, D. (2000). Likelihood-based item-fit indices for dichotomous item response
theory models. Applied Psychological Measurement, 24(1), 50-64.

523226-L-bw-Bebber523226-L-bw-Bebber523226-L-bw-Bebber523226-L-bw-BebberProcessed on: 27-8-2018Processed on: 27-8-2018Processed on: 27-8-2018Processed on: 27-8-2018 PDF page: 122PDF page: 122PDF page: 122PDF page: 122
110
Pilkonis, P. A., Choi, S. W., Reise, S. P., Stover, A. M., Riley, W. T., Cella, D., & PROMIS Cooperative
Group. (2011). Item banks for measuring emotional distress from the patient-reported
outcomes measurement information system (PROMIS(R)): Depression, anxiety, and anger.
Assessment, 18(3), 263-283.
R Core Team. (2014). R: A language and environment for statistical computing. Vienna, Austria: R
Foundation for Statistical Computing.
Sands, W. A., Waters, B. K., & McBride, J. R. (1997). Computerized adaptive testing: From inquiry to
operation. American Psychological Association.
Sheehan, D. V., Lecrubier, Y., Sheehan, K. H., Amorim, P., Janavs, J., Weiller, E., . . . Dunbar, G. C.
(1998). The mini-international neuropsychiatric interview (M.I.N.I.): The development and
validation of a structured diagnostic psychiatric interview for DSM-IV and ICD-10. The Journal of
Clinical Psychiatry, 59 Suppl 20, 22-33;quiz 34-57.
Terwee, C. B., Roorda, L. D., de Vet, H. C., Dekker, J., Westhovens, R., van Leeuwen, J., . . . Boers, M.
(2014). Dutch-flemish translation of 17 item banks from the patient-reported outcomes
measurement information system (PROMIS). Quality of Life Research : An International Journal
of Quality of Life Aspects of Treatment, Care and Rehabilitation.
van Vliet, I. M., & de Beurs, E. (2007). The MINI-international neuropsychiatric interview. A brief
structured diagnostic psychiatric interview for DSM-IV en ICD-10 psychiatric disorders. [Het Mini
Internationaal Neuropsychiatrisch Interview (MINI). Een kort gestructureerd diagnostisch
psychiatrisch interview voor DSM-IV- en ICD-10-stoornissen] Tijdschrift Voor Psychiatrie, 49(6),
393-397.

523226-L-bw-Bebber523226-L-bw-Bebber523226-L-bw-Bebber523226-L-bw-BebberProcessed on: 27-8-2018Processed on: 27-8-2018Processed on: 27-8-2018Processed on: 27-8-2018 PDF page: 123PDF page: 123PDF page: 123PDF page: 123
111
Chapter 6
Predicting Relapse and Outcome in First Episode Psychosis: Impact of Negative Symptoms, and Personalized Low Dose versus Maintenance
Antipsychotic Treatment
This chapter was based on the manuscript:
Wunderink, L., van Bebber, J., Sytema, S., Boonstra, N., Meijer, R.R., and Wigman, J.T.W. (2018).
Predicting Relapse and Outcome in First Episode Psychosis: Impact of Negative Symptoms, and
Personalized Low Dose versus Maintenance Antipsychotic Treatment.
Manuscript submitted for publication in Lancet Psychiatry.
“If you walk through hell, keep going.”
(Winston Churchill)
Abstract
Relapse of psychosis indicates worse functional outcome. The aim of most current treatment
strategies is relapse-prevention, though neither predictors of relapse nor causation of functional
decline has been established. If relapse were a consequence of a decline-related confounder,
preventing relapse might only partly impact upon decline. We hypothesized baseline negative
symptoms to predict both functional deficits and relapse risk. We examined: 1) what predicted
relapse, 2) what predicted functional outcome and 3) if baseline negative symptoms (BNS) predicted
relapse, whether medication strategies would make a difference reducing relapse rates. Post-hoc
analysis of 7-year follow-up data of a first episode psychosis (FEP) cohort involved in a dose-
reduction/discontinuation (DR) vs maintenance treatment (MT) trial (ISRCTN16228411). Patients
(n=128) participating in the original trial, recruited from 257 FEP patients referred from October 2001
to December 2002 to 7 mental health care services in a 3.2 million population catchment area. After
7 years, 103 patients consented to follow-up assessment. In the original trial, patients were randomly

523226-L-bw-Bebber523226-L-bw-Bebber523226-L-bw-Bebber523226-L-bw-BebberProcessed on: 27-8-2018Processed on: 27-8-2018Processed on: 27-8-2018Processed on: 27-8-2018 PDF page: 124PDF page: 124PDF page: 124PDF page: 124
112
assigned after 6 months of remission to DR strategy or MT for 18 months. Thereafter, treatment was
uncontrolled. Main outcome (functional outcome by treatment strategy) has been reported before.
The hypotheses tested here were formulated after data-collection. Relapse was predicted by BNS
and duration of untreated psychosis (DUP), and functional outcome was predicted by BNS, number
of relapses and treatment strategy. Although all predictors had their unique contributions, BNS had
the largest pseudo-partial correlation (rpp) with the dependent variable in both models (rpp = .60 for
relapse and rpp = .90 for functional outcome). Within MT, high levels of BNS were related to higher
relapse rates. Within high and low BNS groups, relapse rates were equal across treatment strategies.
BNS not only predicted non-recovery, but also relapses during 7-year follow-up. Apparent
consequences of relapse, mainly non-recovery, have to be partially attributed to BNS. Relapse
prevention by (low-dose) maintenance treatment does not seem effective, since relapse rates were
equal across arms and depended only on BNS and DUP.

523226-L-bw-Bebber523226-L-bw-Bebber523226-L-bw-Bebber523226-L-bw-BebberProcessed on: 27-8-2018Processed on: 27-8-2018Processed on: 27-8-2018Processed on: 27-8-2018 PDF page: 125PDF page: 125PDF page: 125PDF page: 125
113
6.1 Introduction Relapse in patients with a first psychotic episode (FEP) has been shown to be related to worse
outcomes in many domains, including functional outcome (e.g. daily functioning, acquiring and
maintaining a job, achieving educational goals, having meaningful relationships; Austin et al., 2015)
and neurobiological outcome (e.g. brain structural integrity, cortical thinning; Andreasen, Liu, Ziebell,
Vora, & Ho, 2013). Since this relationship has generally been assumed to be a causal one, e.g. by the
conceivable impact of active psychosis on brain integrity, one of the most important goals of
intervention programs in psychosis in recent years has been prevention of relapse. Maintenance
therapy with antipsychotics has been shown to be the most effective intervention to reduce the
short term risk of relapse, though stringent evidence for a robust effect of antipsychotics on long-
term relapse prevention is lacking (Leucht et al., 2012a, 2012b). In addition, antipsychotic
maintenance treatment has substantial drawbacks, and apart from extrapyramidal and metabolic
side effects (De Hert, Detraux, van Winkel, Yu, & Correll, 2011; Lieberman et al., 2005; McEvoy et al.,
2005; Salimi, Jarskog, & Lieberman, 2009) , antipsychotics have a negative impact on drive, curiosity,
and reward-related behavior through their D2 receptor blockade (Artaloytia et al., 2006). Another
potential drawback is evidence of accelerated shrinking of cortical thickness by antipsychotic drug
exposure (Fusar-Poli et al., 2013; Ho, Andreasen, Ziebell, Pierson, & Magnotta, 2011; Lesh et al.,
2015).
In a randomized trial by our group selected FEP patients who had been initially treated
successfully with antipsychotics and achieved remission during 6 months, were randomized to either
a treatment strategy of dose-reduction/discontinuation or (also low dose) maintenance treatment
for 18 months. After 18 months, twice as many patients had experienced a relapse in the dose
reduction/discontinuation group, compared to the maintenance group, only counterbalanced by a
trending improvement in vocational functioning in the dose-reduction group (Wunderink et al.,
2007). However, the relapse rates came on par from 3 years follow-up on, and by 7 years the
patients who had previously been in the dose-reduction strategy showed twice the recovery rate of
the maintenance patients. Thus, the initially higher relapse rates in the dose-reduction strategy did
not have a decisive impact on long-term outcome, and because of equal long-term relapse rates in
both treatment arms no conclusions could be drawn on the independent impact of relapse rates on
functional outcome.
A causal link between relapse and functional deterioration has not been established in a
strict sense. It is conceivable that a common factor could be causally related to both relapse and
functional outcome, more or less explaining the apparent relation of relapse and unfavorable
outcome. A functional brain disturbance, e.g. an excitation-inhibition imbalance in cortical areas (that
might be due to lack of GABA-ergic parvalbumin interneuron activity (Chung, Fish, & Lewis, 2016) or

523226-L-bw-Bebber523226-L-bw-Bebber523226-L-bw-Bebber523226-L-bw-BebberProcessed on: 27-8-2018Processed on: 27-8-2018Processed on: 27-8-2018Processed on: 27-8-2018 PDF page: 126PDF page: 126PDF page: 126PDF page: 126
114
lack of glutamatergic input into that system (Coyle, Basu, Benneyworth, Balu, & Konopaske, 2012;
Gonzalez-Burgos & Lewis, 2012; Moghaddam & Krystal, 2012)) might be causally related to both
negative symptoms and exaggerated (disinhibited) ventral tegmental dopamine response in case of
stress by a still unknown mechanism (Howes, McCutcheon, & Stone, 2015). Thus, this functional
brain disturbance may lead to episodes of positive symptom experiences. If there is some truth in
this hypothesis, it should be possible to predict relapses (positive symptom-exacerbations) by
negative symptom levels at baseline (BNS). It has already been shown by a number of studies that
low levels of BNS are a strong predictor of functional recovery, particularly in the long-term (Austin
et al., 2015; Díaz-Caneja et al., 2015; McGorry et al., 2014; Wunderink et al., 2013). If, in addition,
relapse would be predicted by BNS, it would mean that relapses are - at least partially - not the
independent cause of worse functional outcome, but - to a certain extent - an epiphenomenon. It
would also imply that relapse prevention at all costs would not be the right way to go, since it would
be targeting a consequence rather than a cause of the disease.
The aim of this post hoc analysis was to test the hypothesis that levels of BNS predict both
functional outcome and relapse risk. More specifically, we wanted to disentangle the effects of BNS
and relapses on functional outcome and to investigate whether the relationship between relapse and
outcome could be (partially) explained by BNS.
Post-hoc, we examined: 1) which factors predicted relapse, 2) which factors predicted
functional outcome, and 3) if BNS predicted relapse, whether medication strategies would make a
difference reducing relapse rates.
6.2 Methods The details of the original and 7-year follow-up study have been described previously elsewhere
(Wunderink et al., 2013; Wunderink et al., 2007). We used data collected at baseline and data
collected during the follow-up to answer the new research questions formulated above.
6.2.1 Subjects The patient flow-chart of the original 2-year trial and the 7-year follow-up study are depicted in
Figure 6.1.

523226-L-bw-Bebber523226-L-bw-Bebber523226-L-bw-Bebber523226-L-bw-BebberProcessed on: 27-8-2018Processed on: 27-8-2018Processed on: 27-8-2018Processed on: 27-8-2018 PDF page: 127PDF page: 127PDF page: 127PDF page: 127
115
Figure 6.1 Flow Diagram of the original 2-year trial and the 7-year follow-up study.
Assessed for eligibility (n = 378)
Excluded (n = 221)♦ Not meeting inclusion criteria (n = 121)♦ Declined to participate (n = 98)♦ Other reasons (n = 2)
Analysed (n=52) ♦ Lost to follow-up (n= 13)♦ Excluded from analysis (n= 0)
Analysed (n=65) ♦ Lost to follow-up (n= 0)♦ Excluded from analysis (n= 0)
Allocated to Discontinuation (n = 68)♦ Received allocated intervention (n = 65) ♦ Withdrawal of Informed Consent (n = 3)
Analysed (n= 63)♦ Lost to follow-up (n= 0)♦ Excluded from analysis (n= 0)
Allocated to Maintenance (n = 63)♦ Received allocated intervention (n = 63) ♦ Withdrawal of Informed Consent (n = 0)
Analysed (n=51) ♦ Lost to follow-up (n= 12)♦ Excluded from analysis (n= 0)
Allocation
7-year follow-up
2-year follow-up
Randomized (n= 157)
Enrollment
Not included in Trial (n = 26)♦ Suicide (n = 1)♦ Nonresponding (n = 8)♦ Relapsing (n = 9)♦ Refusing (n = 8)
Included in Trial (n = 131)

523226-L-bw-Bebber523226-L-bw-Bebber523226-L-bw-Bebber523226-L-bw-BebberProcessed on: 27-8-2018Processed on: 27-8-2018Processed on: 27-8-2018Processed on: 27-8-2018 PDF page: 128PDF page: 128PDF page: 128PDF page: 128
116
Of the N = 378 patients that were initially screened, 257 met the eligibility criteria described
more extensively by Wunderink et al. (2007). Patients seen for the first time in mental health care
services because of a first episode of psychosis from October 1, 2001, until December 1, 2002
(N=257), in a 3.2 million-population catchment area were asked to participate in the original 2-year
trial comparing DR with MT. It is important to note that all patients with a first episode psychosis
who had a first contact with mental health care services were immediately anonymously registered
by the research team to ensure no selection bias would occur because of selectively including
patients. Only after the patients would have responded sufficiently to the prescribed antipsychotic
medication they were asked for participation and consent. Of the 257 eligible FEP patients, 111
patients refused to participate or were lost to follow-up, and 18 patients did not show the required
symptomatic response. A sustained positive symptom remission of a minimal duration of 6 months
within 1 year after the start of antipsychotic treatment was required. This implied all relevant
positive symptom scores on the Positive And Negative Syndrome Scale, (PANSS; Kay, Fishbein, &
Opler, 1987) had to be continuously at or below the severity level of “mild” (score 3). One hundred
twenty-eight patients were included in the original trial and completed it. Seven years after inclusion
in the original trial, 103 patients were located and consented to a one-time follow-up assessment
(Wunderink et al., 2013).
Of these 103 patients, 71 (68.9%) were male. The mean age at the end of the follow-up
period was 26 years and 4 months (SD 6 years, 7 months). At baseline, 66 (64.1%) were living
together with either a partner, parent or a relevant other, 45 (43.7 %) had a job for at least 16 hours
a week, and 37 (35.9%) reported any drug or alcohol abuse or dependency.
6.2.2 Assessments and definitions Baseline data were sampled as part of the original trial. For details see Wunderink et al. (2007). For
the present post-hoc analysis, the following variables are relevant: sex, age, symptom severity
(PANSS), social functioning, and duration of untreated psychosis (operationalized as the time interval
between the first positive symptom experience and the start of antipsychotic treatment). Due to its
skewed distribution, we used the log-transformed version of DUP (log-DUP) in the analyses.
Seven-year follow-up data included symptom severity using the PANSS, level of social
functioning during the last six months of follow-up assessed by the Groningen Social Disability
Schedule (GSDS; Wiersma, de Jong, Kraaijkamp, & Ormel, 1990), information regarding relapses
(number of relapses, time to first relapse), and the type and dose of antipsychotics during the last
two years of follow-up.

523226-L-bw-Bebber523226-L-bw-Bebber523226-L-bw-Bebber523226-L-bw-BebberProcessed on: 27-8-2018Processed on: 27-8-2018Processed on: 27-8-2018Processed on: 27-8-2018 PDF page: 129PDF page: 129PDF page: 129PDF page: 129
117
The definitions of the concepts used in the current study are the following:
Relapse: Operationalized by a two-step criterion: 1) clinician needs to adjust antipsychotics (increase
dosage) or take any other measures (additional visits), and 2) any PANSS positive symptom item
score was above 3 for at least one week.
Symptomatic remission: (a) Criterion to enter the trial (3 years before the Andreasen criteria were
published): all PANSS positive symptom scores had to be continuously at or below the severity level
of mild (score 3) during 6 consecutive months during the first year of treatment. (b) To evaluate the
7-year follow-up: the Andreasen criteria were used (selected PANSS item scores had to be at a level
of mild (3) or less sustained for at least six consecutive months; Andreasen et al., 2005).
Functional recovery: Adequate functioning in the core domains of everyday life for at least six
months. Adequate functioning was operationalized as only having ratings of either ‘no’ (0) or
‘doubtful or some’ (1) disability on six out of seven domains of the GSDS. For reasons of limited
applicability, we decided to exclude the parenthood domain. The GSDS item scores range from ‘no
disability’ (0) to ‘severe disability’ (3).
Recovery: Meeting the criteria of both symptomatic remission and functional recovery.
6.2.3 Statistical analyses Descriptive information on sample characteristics have been reported elsewhere (Wunderink,
Nieboer, Wiersma, Sytema, & Nienhuis, 2013).
To determine which factors predicted relapse and which factors predicted functional
outcome at the end of the follow-up period, we applied forward stepwise logistic regression
analyses. Possible candidates as predictors were selected on the basis of findings reported in the
literature and the hypotheses to be tested. In particular, for predicting relapse, treatment strategy,
log-DUP, and BNS were the possible candidates, and for predicting functional outcome, treatment
strategy, number of relapses, and BNS. For both logistic regressions, we computed pseudo-partial
correlations in order to assess the unique contributions of the predictors in the final models.
In order to investigate whether BNS or medication strategies would be the key variable for
predicting relapses, we divided the patients on the basis of their BNS severity into two categories
(median-split): a low BNS group (PANSSneg < 13, n = 54) and a high BNS group (PANSSneg > 12, n = 49).
Then we compared relapse survival rates within the treatment strategies (MT and DR) across low and
high negative symptom levels, and relapse survival rates within BNS categories (low and high) across
treatment strategies.

523226-L-bw-Bebber523226-L-bw-Bebber523226-L-bw-Bebber523226-L-bw-BebberProcessed on: 27-8-2018Processed on: 27-8-2018Processed on: 27-8-2018Processed on: 27-8-2018 PDF page: 130PDF page: 130PDF page: 130PDF page: 130
118
6.3 Results
6.3.1 Number of relapses and functional outcome At the end of the follow-up period, the majority (68%) of the patients were symptomatically
remitted, while only a minority (33%) were functionally recovered. Only 29% met both criteria and
thus were considered fully recovered. In terms of odds ratios, we found a clear relationship between
number of relapses and recovery: no relapse yielded an odds-ratio of one in two, one relapse an
odds-ratio of 1 in 4, 2 relapses an odds-ratio of 1 in 5, and 3 or more relapses resulted in no recovery
at all.
6.3.2 Predicting relapse For relapse as the dependent variable (Table 6.1), the logistic regression model with log-DUP and
BNS as independent variables was significant ( 2(2) = 13.3, p < .001, and Nagelkerke’s pseudo R2 =
.167). The effect of treatment strategy ( 2(1) = 0.1, df=1, p = .75) on relapse was not significant when
controlling for log-DUP and BNS. These two predictors had the strongest relationship with relapse
and were therefore added to the model in the two previous steps. Longer DUP and more BNS
increase the probability of a relapse to happen. In order to evaluate the unique contribution of each
predictor, we computed pseudo-partial correlations between each predictor and the occurrence of
relapse during follow-up (Hosmer, Lemeshow, & Sturdivant, 2013). The variance that is accounted for
by (the) other predictor(s) is removed from both variables under investigation before computing the
correlation. In addition, pseudo-partial correlations take the categorical nature of variables into
account. The pseudo-partial correlations (rpp) equaled rpp = .60 for BNS and rpp =.31 for log-DUP. Thus,
the unique contribution of BNS when taking log-DUP into account was larger than vice versa.
Table 6.1 Logistic regression results for predicting relapse based on patients’ characteristics.
Variables B SE(B) Wald 2 df P eB 95% CI eB
BNS 0.13 0.05 7.0 1 < .01 1.14 1.04, 1.26
Log-DUP 0.40 0.20 3.8 1 < .05 1.49 1.00, 2.22
Model 2 13.3 2 < .01
n 103
BNS: Baseline Negative Symptoms; Log-DUP: log-transformed Duration of Untreated Psychosis.

523226-L-bw-Bebber523226-L-bw-Bebber523226-L-bw-Bebber523226-L-bw-BebberProcessed on: 27-8-2018Processed on: 27-8-2018Processed on: 27-8-2018Processed on: 27-8-2018 PDF page: 131PDF page: 131PDF page: 131PDF page: 131
119
6.3.3 Predicting functional outcome In Table 6.2, the results of the logistic regression analysis for the dependent variable functional
outcome are displayed. The model including treatment strategy, number of relapses and BNS as
predictors was significant ( 2(3) = 33.4, p < .01, and Nagelkerke’s pseudo R2 = .386). MT, more
relapses, and more BNS were predictive of worse functional outcome. The pseudo-partial
correlations between each predictor and the criterion, controlling for the other two predictors in the
model equaled rpp = .57 for treatment strategy, rpp = .90 for baseline negative symptoms and rpp =.64
for total number of relapses. Thus, the unique contribution of BNS was greater than the
contributions of either treatment strategy or number of relapses.
Table 6.2 Logistic regression results for predicting functional outcome based on patients’
characteristics and treatment strategy.
Variables B SE(B) Wald 2 df P eB 95% CI eB
Treatment strategy* 1.34 0.52 6.73 1 < .01 3.81 1.39, 10.47
BNS -0.22 0.07 10.45 1 < .01 .81 0.71, 0.92
Number of relapses -0.66 0.24 7.45 1 < .01 .52 0.32, 0.83
Model 2 33.4 3 < .01
N 103
* Maintenance treatment (0) & Dose reduction (1); BNS: Baseline Negative Symptoms.
6.3.4 Disentangling the effects of baseline negative symptoms and treatment strategy on relapse risk In Figure 6.2a-b, the survival functions representing relapse likelihood are displayed for the DR (left
hand) and for the MT (right hand) strategy. The drawn lines represent the survival for low levels of
BNS, and the dotted lines represent survival for high levels of BNS. Although the effect of BNS pooled
over strata (treatment strategies) was significant (log rank 2 = 5.36, df = 1, p = .021), indicating that
more BNS are associated with higher relapse risk regardless of treatment strategy, the survival
functions in 2a cross, so we present results for each stratum separately hereafter.

523226-L-bw-Bebber523226-L-bw-Bebber523226-L-bw-Bebber523226-L-bw-BebberProcessed on: 27-8-2018Processed on: 27-8-2018Processed on: 27-8-2018Processed on: 27-8-2018 PDF page: 132PDF page: 132PDF page: 132PDF page: 132
120
Figure 6.2a-b Survival functions for dose reduction/discontinuation (left-hand) and dose maintenance (right-hand).
For the dose reduction/discontinuation treatment strategy, the differences in survival
between low and high levels of BNS was not significant (log rank 2 = 0.1, df = 1, p = .80). At the end
of the follow-up period, the relapse rate for low BNS equaled 57% with a median of 427 days until
relapse, and the relapse rate for high BNS equaled 68% with a median of 1553 days until relapse.
As can be seen from Figure 6.2b, for the maintenance treatment strategy, high levels of BNS
are associated with a higher relapse risk during follow-up (log rank 2 = 9.0, df = 1, p < .01). More
specifically, at the end of the follow-up period, the relapse rate for low levels of BNS were 50%
(median survival time 2282 days), while the relapse rate for high levels of BNS were 85% (median
survival time 854 days).
In Figure 6.3a-b, the survival functions representing relapse likelihood are displayed for low
(left hand) and high (right hand) levels of BNS. The drawn lines represent the dose
reduction/discontinuation treatment strategy; the dotted lines represent the maintenance treatment
strategy. Although difficult to infer from Figure 6.3a/b, the effect of treatment strategy pooled over
strata (levels of BNS) was not significant (log rank 2 = 0.1, df = 1, p = .79). Note that for low levels of
BNS, MT seems more effective, while for high levels of BNS, DR seems advantageous.

523226-L-bw-Bebber523226-L-bw-Bebber523226-L-bw-Bebber523226-L-bw-BebberProcessed on: 27-8-2018Processed on: 27-8-2018Processed on: 27-8-2018Processed on: 27-8-2018 PDF page: 133PDF page: 133PDF page: 133PDF page: 133
121
Figure 6.3a-b Survival functions for low (left-hand) and high (right-hand) levels of baseline negative symptoms.
For low levels of BNS, the difference in survival between treatment strategies was not
significant (log rank 2 = 1.6, df = 1, p = .20). At the end of the follow-up period, the relapse rate for
DR equaled 57% with a median of 427 days until relapse, and the relapse rate for MT equaled 50%
with a median of 2282 days until relapse. The shorter median in DR reflects the earlier relapsing of
subjects in this group compared to subjects in the MT group.
Also, for high levels of BNS, the difference in survival between treatment strategies was not
significant (log rank 2 = 2.2, df = 1, p = .14). Thus, although the differences in survival did not reach
the level of statistical significance, differences between treatment strategies at end point were larger
for high levels of BNS. More precisely, at the end of the follow-up period, the relapse rate for DR
equaled 68% with a median of 1553 days until relapse, and the relapse rate for MT equaled 85% with
a median of 854 days until relapse.
6.4 Discussion
6.4.1 Main findings In the post hoc analyses described in this paper, we found that levels of baseline negative symptoms
(BNS) are key (i) in predicting which individuals with a first episode of psychosis (FEP) will experience
a relapse during a follow-up period of seven years, and (ii) in predicting these patients’ levels of social
and occupational functioning at the end of a long-term follow-up period. In addition to BNS, the log-

523226-L-bw-Bebber523226-L-bw-Bebber523226-L-bw-Bebber523226-L-bw-BebberProcessed on: 27-8-2018Processed on: 27-8-2018Processed on: 27-8-2018Processed on: 27-8-2018 PDF page: 134PDF page: 134PDF page: 134PDF page: 134
122
transformed DUP has been found to have incremental value for the prediction of relapse risk, longer
DUP being associated with a higher risk of relapse. For predicting functional outcome, the number of
relapses and treatment strategy have been found to have incremental value next to BNS, more
relapses worsening functional outcome, and the dose reduction/discontinuation treatment strategy
(DR) being positively related to better functional outcome compared to the maintenance treatment
strategy (MT).
6.4.2 Our results in the light of existing literature and implications for treatment of FEP patients The results of our study thus disagree with the notion that (number of) relapses would be most
important for predicting functional outcome in patients with FEP (Emsley, Chiliza, & Asmal, 2013;
Penn, Waldheter, Perkins, Mueser, & Lieberman, 2005; Sheitman & Lieberman, 1998; Wiersma,
Nienhuis, Slooff, & Giel, 1998), and therefore more attention should be directed at prevention of
these relapses (Haandel, Slooff, & van den Bosch, 2001). At first sight, the odds ratios for recovery
conditional on number of relapses seemed to confirm the general assumption of relapse causing
worse functional outcome. However, as previously stated, more detailed analysis showed the
relationship of relapse and functional outcome to be more complicated, and to depend on levels of
BNS, at least partially.
Furthermore, relapse rates were only higher in the DR strategy initially compared to MT.
However, from 3-years follow-up on, the relapse rates came on par. In patients with low BNS, DR
tended to effect higher relapse rates initially, but relapse rates equalized during the course of the full
follow-up period. Regarding relapse rates, DR did not cause more relapses in the long term, though in
patients with less severe negative symptoms relapse rates tended to be higher than in MT initially.
This somewhat counterintuitive finding may also correspond to the finding by Gaebel et al., who
found that patients who showed a most favorable first reaction to antipsychotic treatment appeared
to respond worse to dose reduction than patients who did not show such a favorable reaction
initially (Gaebel et al., 2015).
Though number of relapses has a unique negative impact on functional outcome, the
association between BNS and functional outcome is much stronger. The importance of this finding
might be that, though prevention of relapses is still of the utmost importance as one of few
amenable factors in treating patients with schizophrenia-spectrum disorders, functional outcome will
not only depend on the prevention of relapses but to a large extent on the preexisting negative
symptoms. Thus, treatment aimed at improving functional outcome should address BNS next to
relapse prevention. The fact that treatment strategy, particularly in patients with more severe
negative symptoms, did not make a difference regarding relapse rates nor, in the long run, in the

523226-L-bw-Bebber523226-L-bw-Bebber523226-L-bw-Bebber523226-L-bw-BebberProcessed on: 27-8-2018Processed on: 27-8-2018Processed on: 27-8-2018Processed on: 27-8-2018 PDF page: 135PDF page: 135PDF page: 135PDF page: 135
123
subgroup of patients with low levels of BNS, might seem somewhat counterintuitive, since higher
dosages of antipsychotics have a beneficial effect on relapse, as well as in preventing relapse in
stabilized patients (Tiihonen et al., 2017). Though not significant, the survival curve of patients with
high BNS in MT appears to show a less favorable downward course compared to DR strategy. A
possible explanation might be that the MT strategy in our original trial was also a relatively low dose
strategy, which may not be sufficient to prevent relapses in relapse-prone patients. The mean daily
dose of haloperidol equivalents at 7 years of follow-up was 2.2 mg in the dose reduction strategy
against 3.6 mg in the maintenance strategy. A question still unanswered is whether in patients with
high levels of baseline negative symptoms, who are more relapse prone, higher dosages of
antipsychotics than used in this trial might be beneficial to prevent relapses, and whether their levels
of functioning would benefit or suffer from a higher dosage strategy than used in this trial. The same
could be stated for the use of clozapine in this high BNS patient group. This would correspond to the
guidelines that recommend clozapine in case of prominent negative symptoms, and to the results of
the recent study by Tiihonen et al. (2017)
If negative symptoms would be a proxy for a biological basis of relapse-proneness (being
suggestive of an ill-wired brain structure), it would be very important to adapt our staging approach
in such a way as to incorporate negative symptoms in risk profiles (Wunderink, 2017). In addition,
resources should be deployed to find optimal treatment strategies for patients with more severe
negative symptoms in line with the aforementioned dilemma: to prevent relapses and thereby
running a risk to limit initiative and drive, or to accept a certain relapse risk possibly in favor of not
further jeopardizing already impaired functioning.
A limitation of our post-hoc analysis is that the original study has not been powered to detect
significant differences in relapse rates between the DR and MT strategies within the high and low
BNS groups. A lack of power may be one of the reasons why we did not find significant differences
between the treatment strategies regarding relapse rates in the high and low BNS groups. Our results
should be tested in larger, adequately powered trials.
6.5 References
Andreasen, N. C., Carpenter, W. T., Kane, J. M., Lasser, R. A., Marder, S. R., & Weinberger, D. R.
(2005). Remission in schizophrenia: Proposed criteria and rationale for consensus. The American
Journal of Psychiatry, 162, 441-449.

523226-L-bw-Bebber523226-L-bw-Bebber523226-L-bw-Bebber523226-L-bw-BebberProcessed on: 27-8-2018Processed on: 27-8-2018Processed on: 27-8-2018Processed on: 27-8-2018 PDF page: 136PDF page: 136PDF page: 136PDF page: 136
124
Andreasen, N. C., Liu, D., Ziebell, S., Vora, A., & Ho, B. -C. (2013). Relapse duration, treatment
intensity, and brain tissue loss in schizophrenia: A prospective longitudinal MRI study. The
American Journal of Psychiatry, 170(6), 609-15.
Artaloytia, J. F., Arango, C., Lahti, A., Sanz, J., Pascual, A., Cubero, P., . . . Palomo, T. (2006). Negative
signs and symptoms secondary to antipsychotics: A double-blind, randomized trial of a single
dose of placebo, haloperidol, and risperidone in healthy volunteers. The American Journal of
Psychiatry, 163(3), 488-93.
Austin, S. F., Mors, O., Budtz-Jørgensen, E., Secher, R. G., Hjorthøj, C. R., Bertelsen, M., . . .
Nordentoft, M. (2015). Long-term trajectories of positive and negative symptoms in first
episode psychosis: A 10year follow-up study in the OPUS cohort. Schizophrenia Research, 168(1-
2), 84-91.
Chung, D. W., Fish, K. N., & Lewis, D. A. (2016). Pathological basis for deficient excitatory drive to
cortical parvalbumin interneurons in schizophrenia. American Journal of Psychiatry, 173(11),
1131-1139.
Coyle, J. T., Basu, A., Benneyworth, M., Balu, D., & Konopaske, G. (2012). Glutamatergic synaptic
dysregulation in schizophrenia: Therapeutic implications. Handbook of Experimental
Pharmacology, (213), 267-95.
Díaz-Caneja, C. M., Pina-Camacho, L., Rodríguez-Quiroga, A., Fraguas, D., Parellada, M., & Arango, C.
(2015). Predictors of outcome in early-onset psychosis: A systematic review. NPJ Schizophrenia,
1, 14005.
Emsley, R., Chiliza, B., & Asmal, L. (2013). The evidence for illness progression after relapse in
schizophrenia. Schizophrenia Research, 148(1-3), 117-21.

523226-L-bw-Bebber523226-L-bw-Bebber523226-L-bw-Bebber523226-L-bw-BebberProcessed on: 27-8-2018Processed on: 27-8-2018Processed on: 27-8-2018Processed on: 27-8-2018 PDF page: 137PDF page: 137PDF page: 137PDF page: 137
125
Fusar-Poli, P., Smieskova, R., Kempton, M. J., Ho, B. C., Andreasen, N. C., & Borgwardt, S. (2013).
Progressive brain changes in schizophrenia related to antipsychotic treatment? A meta-analysis
of longitudinal MRI studies. Neuroscience and Biobehavioral Reviews, 37(8), 1680-91.
Gaebel, W., Riesbeck, M., Wölwer, W., Klimke, A., Eickhoff, M., von Wilmsdorff, M., . . . Möller, H. -J.
(2015). Predictors for symptom re-exacerbation after targeted stepwise drug discontinuation in
first-episode schizophrenia: Results of the first-episode study within the german research
network on schizophrenia. Schizophrenia Research.
Gonzalez-Burgos, G., & Lewis, D. A. (2012). NMDA receptor hypofunction, parvalbumin-positive
neurons, and cortical gamma oscillations in schizophrenia. Schizophrenia Bulletin, 38(5), 950-7.
Haandel, B. -V., Slooff, C. J., & van den Bosch, R. J. (2001). Reasoning about the optimal duration of
prophylactic antipsychotic medication in schizophrenia: Evidence and arguments. Acta
Psychiatrica Scandinavica, 103, 335-346.
De Hert, M., Detraux, J., van Winkel, R., Yu, W., & Correll, C. U. (2011). Metabolic and cardiovascular
adverse effects associated with antipsychotic drugs. Nature Reviews. Endocrinology, 8(2), 114-
26.
Ho, B. C., Andreasen, N. C., Ziebell, S., Pierson, R., & Magnotta, V. (2011). Long-term antipsychotic
treatment and brain volumes: A longitudinal study of first-episode schizophrenia. Archives of
General Psychiatry, 68(2), 128-137.
Hosmer Jr, D. W., Lemeshow, S., & Sturdivant, R. X. (2013). Applied logistic regression. Hoboken (NJ):
John Wiley & Sons.
Howes, O., McCutcheon, R., & Stone, J. (2015). Glutamate and dopamine in schizophrenia: An update
for the 21st century. Journal of Psychopharmacology (Oxford, England), 29(2), 97-115.

523226-L-bw-Bebber523226-L-bw-Bebber523226-L-bw-Bebber523226-L-bw-BebberProcessed on: 27-8-2018Processed on: 27-8-2018Processed on: 27-8-2018Processed on: 27-8-2018 PDF page: 138PDF page: 138PDF page: 138PDF page: 138
126
Kay, S., Fishbein, A., & Opler, L. (1987). The positive and negative syndrome scale (PANSS) for
schizophrenia. Schizophrenia Bulletin, 13, 261-275.
Lesh, T. A., Tanase, C., Geib, B. R., Niendam, T. A., Yoon, J. H., Minzenberg, M. J., . . . Carter, C. S.
(2015). A multimodal analysis of antipsychotic effects on brain structure and function in first-
episode schizophrenia. JAMA Psychiatry (Chicago, Ill.).
Leucht, S., Tardy, M., Komossa, K., Heres, S., Kissling, W., & Davis, J. M. (2012a). Maintenance
treatment with antipsychotic drugs for schizophrenia. The Cochrane Database of Systematic
Reviews, (5), CD008016.
Leucht, S., Tardy, M., Komossa, K., Heres, S., Kissling, W., Salanti, G., & Davis, J. M. (2012b).
Antipsychotic drugs versus placebo for relapse prevention in schizophrenia: A systematic review
and meta-analysis. The Lancet, 379(9831), 2063-2071.
Lieberman, J. A., Stroup, T. S., McEvoy, J. P., Swartz, M. S., Rosenheck, R. A., Perkins, D. O., . . . Hsiao,
J. K. (2005). Effectiveness of antipsychotic drugs in patients with chronic schizophrenia. The New
England Journal of Medicine, 353, 1209-1223.
McEvoy, J. P., Meyer, J. M., Goff, D. C., Nasrallah, H. A., Davis, S. M., Sullivan, L., . . . Lieberman, J. A.
(2005). Prevalence of the metabolic syndrome in patients with schizophrenia: Baseline results
from the clinical antipsychotic trials of intervention effectiveness (CATIE) schizophrenia trial and
comparison with national estimates from NHANES III. Schizophrenia Research, 80, 19-32.
McGorry, P., Keshavan, M., Goldstone, S., Amminger, P., Allott, K., Berk, M., . . . Hickie, I. (2014).
Biomarkers and clinical staging in psychiatry. World Psychiatry : Official Journal of the World
Psychiatric Association (WPA), 13(3), 211-23.

523226-L-bw-Bebber523226-L-bw-Bebber523226-L-bw-Bebber523226-L-bw-BebberProcessed on: 27-8-2018Processed on: 27-8-2018Processed on: 27-8-2018Processed on: 27-8-2018 PDF page: 139PDF page: 139PDF page: 139PDF page: 139
127
Moghaddam, B., & Krystal, J. H. (2012). Capturing the angel in "angel dust": Twenty years of
translational neuroscience studies of NMDA receptor antagonists in animals and humans.
Schizophrenia Bulletin, 38(5), 942-9.
Penn, D. L., Waldheter, E. J., Perkins, D. O., Mueser, K. T., & Lieberman, J. A. (2005). Psychosocial
treatment for first-episode psychosis: A research update. The American Journal of Psychiatry,
162(12), 2220-32.
Salimi, K., Jarskog, L. F., & Lieberman, J. A. (2009). Antipsychotic drugs for first-episode schizophrenia:
A comparative review. CNS Drugs, 23, 837-855.
Sheitman, B. B., & Lieberman, J. A. (1998). The natural history and pathophysiology of treatment
resistant schizophrenia. Journal of Psychiatric Research, 32, 143-150.
Tiihonen, J., Mittendorfer-Rutz, E., Majak, M., Mehtälä, J., Hoti, F., Jedenius, E., . . . Taipale, H. (2017).
Real-World effectiveness of antipsychotic treatme
with schizophrenia. JAMA Psychiatry (Chicago, Ill.).
Wiersma, D., de Jong, A., Kraaijkamp, H. J. M., & Ormel, J. (1990). GSDS II, the groningen social
disabilities schedule, second version. Groningen: Department of Psychiatry, Rijksuniversiteit
Groningen.
Wiersma, D., Nienhuis, F. J., Slooff, C. J., & Giel, R. (1998). Natural course of schizophrenic disorders:
A 15-year followup of a dutch incidence cohort. Schizophrenia Bulletin, 24, 75-85.
Wunderink, L. (2017). Taking a bleulerian perspective: A role for negative symptoms in the staging
model? World Psychiatry : Official Journal of the World Psychiatric Association (WPA), 16(3),
268-270.

523226-L-bw-Bebber523226-L-bw-Bebber523226-L-bw-Bebber523226-L-bw-BebberProcessed on: 27-8-2018Processed on: 27-8-2018Processed on: 27-8-2018Processed on: 27-8-2018 PDF page: 140PDF page: 140PDF page: 140PDF page: 140
128
Wunderink, L., Nieboer, R. M., Wiersma, D., Sytema, S., & Nienhuis, F. J. (2013). Recovery in remitted
first-episode psychosis at 7 years of follow-up of an early dose reduction/discontinuation or
maintenance treatment strategy: Long-term follow-up of a 2-year randomized clinical trial.
JAMA Psychiatry (Chicago, Ill.).
Wunderink, L., Nienhuis, F. J., Sytema, S., Slooff, C. J., Knegtering, R., & Wiersma, D. (2007). Guided
discontinuation versus maintenance treatment in remitted first-episode psychosis: Relapse
rates and functional outcome. The Journal of Clinical Psychiatry, 68(5), 654-61.

523226-L-bw-Bebber523226-L-bw-Bebber523226-L-bw-Bebber523226-L-bw-BebberProcessed on: 27-8-2018Processed on: 27-8-2018Processed on: 27-8-2018Processed on: 27-8-2018 PDF page: 141PDF page: 141PDF page: 141PDF page: 141
129
Chapter 7
The development of a smart screening device for primary health care
A version of this chapter was published as:
van Bebber, J., Meijer, R.R., Wigman, J.T.W., Sytema, S., and Wunderink, L. (2018). A Smart Screening
Device for Patients with Mental Health Problems in Primary Care: Development and Pilot Study. JMIR
mental health, 5(2); DOI:10.2196/mental.9488.
Abstract
Adequate recognition of mental health problems is prerequisite for successful treatment. Though
most people tend to consult their general practitioner first when they experience mental health
problems, general practitioners are not very well equipped to screen for various forms of
psychopathology to help them determining clients’ need for treatment. In this paper, the
development and characteristics of a computerized adaptive test battery (named CATja), build to
facilitate triage in primary care settings, is described and first results of its implementation are
reported. CATja was developed in close collaboration with general practitioners and mental health
assistants (MHAs). During implementation, MHAs were requested to appraise clients’ rankings
(N=91) on the domains to be tested and to indicate the treatment level they deemed most
appropriate for clients before test administration. We compared (i) the agreement between domain
score appraisals and domain score computed by CATja, and (ii) the agreement between initial (before
test administration) treatment level advise and final treatment levels advise. Agreements (Cohen’s
Kappa) between MHAs’ appraisals of clients’ scores and client’s scores computed by CATja were
mostly between .40-.50 (Cohen’s Kappas’ = .10-.20), and the agreement between ‘initial’ treatment
levels final treatment level advised was .65 (Cohen’s Kappa = .55). By using CATja, caregivers can
efficiently generate summaries of their clients’ mental well-being on which decisions about
treatment type and care level may be based. Further validation research is needed.

523226-L-bw-Bebber523226-L-bw-Bebber523226-L-bw-Bebber523226-L-bw-BebberProcessed on: 27-8-2018Processed on: 27-8-2018Processed on: 27-8-2018Processed on: 27-8-2018 PDF page: 142PDF page: 142PDF page: 142PDF page: 142
130
7.1 Introduction
7.1.1 Background Mental well-being is fundamental to the functioning of communities and nations. However, the
World Health Organization states that “(…) many people with mental health problems do not receive
the treatment and care they need, despite the development of effective interventions” (World Health
Organization, 2005, p.9). Matching the level of provided care to the client’s need for care is a difficult
task because many factors have to be balanced simultaneously. Clients want access to the best care,
but working hours of practitioners/clinicians are limited and the interest of society is to keep care
affordable. In order to reconcile these conflicting interests, various models of care have been
proposed.
In the Netherlands, the structure of mental health care most closely resembles a stratified
model, where “the initial treatment is selected based on the client`s treatment needs” (Lipton,
Stewart, Stone, Láinez, & Sawyer, 2000, p. 2598). The lowest level of mental health care is provided
in general practices. Dutch general practitioners (GPs) are supported by mental health assistants
(MHAs) who have a background in psychology, psychiatric care, or social work. MHAs are capable of
treating light and/or stable mental problems, and they can help to link clients to social care agencies
for housing, employment, and/or debt counseling. To get access to either generalistic or specialistic
mental health care providers, clients need a referral from their GP. MHAs advise GPs in whether
clients should be treated in general practices, or whether they should be referred to either
generalistic or specialized mental health care providers. We use the term triage here to label the
decision process just described.
7.1.2 Aims of this study Psychological tests and questionnaires have long been used to provide valuable information to guide
mental health care interventions. In this article, an online computerized adaptive test (CAT) battery
(named CATja) is described that was specifically designed to screen clients in general practices for
various forms of psychopathology and thereby facilitating triage. The construction of items banks
(Cella et al., 2010; Loewy, Bearden, Johnson, Raine, & Cannon, 2005; Terluin, 1996) and the
derivation of parameter estimates for these item banks have been described elsewhere (van Bebber
et al., 2017a; van Bebber et al., 2017b; Pilkonis et al., 2011; Hahn et al., 2010). In this article, we
describe the development of CATja and report first results of a pilot study where MHAs implement
the tool in daily practice.

523226-L-bw-Bebber523226-L-bw-Bebber523226-L-bw-Bebber523226-L-bw-BebberProcessed on: 27-8-2018Processed on: 27-8-2018Processed on: 27-8-2018Processed on: 27-8-2018 PDF page: 143PDF page: 143PDF page: 143PDF page: 143
131
7.2 Methods
7.2.1 Developmental approach Autonomy plays a crucial role in a person’s motivation, especially for those who are mainly
intrinsically motivated (Gagné & Deci, 2005). Adopting CATja would require the MHAs to change their
working routine in many ways and because the best way to promote change is to provide those who
are supposed to change with feelings of ownership of the new situation (Pierce, Kostova, & Dirks,
2001), we included MHAs in the developmental process. Also, their expertise was highly valued. We
organized regular meetings where we inventorized the opinions and ideas of MHAs, and where we
gave specific recommendations (such as testing adaptively in order to tap a broad range of
constructs efficiently or how to safeguard clients’ privacy). Furthermore, these meetings enabled us
to judge whether our plans would be supported. An important contribution by the MHAs was that
we should not focus solely on deficiencies (e.g., psychopathology), but should also pay attention to
clients’ strengths (e.g., positive psychological constructs). In addition, MHAs had a strong preference
for blended care, (i.e., combination of e-assessment and face-to-face interview). Besides the scores
on various dimensions, each client is uniquely characterized by a specific combination of situational
and environmental factors (e.g., life events, motivation to change). Information on all these
characteristics that make individuals unique was preferred to be obtained in face-to-face interviews.
Furthermore, because a significant proportion of clients are treated by MHAs, and the relationship
between therapist and client is crucial for successful treatment (Lambert & Barley, 2001), time spent
on getting this auxiliary information during personal sessions is still spent in a valuable way.
7.2.2 Computerized adaptive testing (CAT) In CAT, items that are presented to respondents are tailored to responses given to previous items.
With each consecutive item, an updated person score is derived, and the item that increases
measurement precision maximally for this score is utilized next. This process usually continues until a
predefined measurement precision is reached. In CATs, much less items are needed to derive reliable
scores compared to assessments with traditional questionnaires. For an introduction to CAT, see
Meijer & Nering (1999).
7.2.3 Content of the alpha version of CATja The domains of psychopathology available in the alfa version were chosen based on (i) high
prevalence in the target population (anxiety and depression), (ii) the explicit wish of the envisioned
end users (distress), and (iii) severity of functional impairment (positive and negative symptoms of

523226-L-bw-Bebber523226-L-bw-Bebber523226-L-bw-Bebber523226-L-bw-BebberProcessed on: 27-8-2018Processed on: 27-8-2018Processed on: 27-8-2018Processed on: 27-8-2018 PDF page: 144PDF page: 144PDF page: 144PDF page: 144
132
psychosis). Five psychopathology domains are currently available: Anxiety and Depression using the
PROMIS item pools (Pilkonis et al., 2011), Positive and Negative symptoms of psychosis based on the
Prodromal Questionnaire (van Bebber et al., 2017a), and the Distress scale of the Four-Dimensional
Symptom Questionnaire (van Bebber et al., 2017b). In addition, MHAs can assess the domains
Companionship and Emotional support, using PROMIS item pools (Hahn et al., 2010). Thus, contrary
to many existing eHealth screening tools (Meuldijk et al., 2017), CATja (i) incorporates domains of
positive psychology as well as more severe symptoms of psychopathology (e.g. hallucinations), and
(ii) only utilizes items that are appropriate for a given client due to its adaptive testing routine.
7.2.4 Sample characteristics We approached participating MHAs Primary Care Consultants Northern Netherlands (Eerste Lijns
Advies Noord-Nederland, ELANN), an organization that advises GPs in the north of the Netherlands
on eHealth advancements. Four MHAs participated in the pilot, and these assessed 31 MHAs clients
in total (23 females). Clients were informed that their responses would be stored anonymously for
research purposes, and they provided informed consent for this by selecting the hyperlink provided
in the email that was send to them by their MHAs. On average, clients were thirty years and six
months old (SD = 12.2). All clients had achieved a high school degree, three graduated applied
sciences, and three graduated university. With respect to relationship status, nine clients chose the
response option ‘living apart together’, eleven were living together, and another eleven clients
reported to be single. Twelve clients reported to be still following education, six were looking for
work, four were working part-time, and nine were working full-time.
7.2.5 Statistical analyses In order to get a first impression on how implementing CATja would change the information available
to MHAs, and how their decisions concerning clients’ triage would be affected, we did the following.
For each domain, we asked the MHAs to estimate quartile scores for each domain clients were to be
tested on before administering CATja. These estimates were compared to the quartile scores
computed by CATja. Additionally, we requested MHAs to appraise expected treatment levels before
testing their clients with CATja, and to report final treatment levels advised after testing. We
compared these initial and final treatment levels. The questionnaire used can be found in appendix
A1. For all domains and for treatment level advised, we computed coefficients of agreement

523226-L-bw-Bebber523226-L-bw-Bebber523226-L-bw-Bebber523226-L-bw-BebberProcessed on: 27-8-2018Processed on: 27-8-2018Processed on: 27-8-2018Processed on: 27-8-2018 PDF page: 145PDF page: 145PDF page: 145PDF page: 145
133
7.3 Results The alfa version of CATja consisted of three interfaces, see (Roqua, 2017). When the domains and
constructs to be assessed have been chosen, an invitation is sent to the client by email containing a
hyperlink that leads to CATja’ s test administration interface. In this email, the client is informed that
some information on their demographic background will be requested, and that their answers will be
stored anonymously for research purposes. When responding, clients can change answers given to
previous items and revised scores are calculated. When finished, a report is automatically generated
and sent to the MHA. In this report several concepts that are essential for correct interpretation of
the report are explained: the norm groups that served as reference for scores, the concept of
quartiles, and the meaning of quartiles for psychopathology domains and positive psychological
domains. For all psychopathology domains, low scores (Q1/2) are indicative of healthy functioning,
whereas for Companionship and Emotional support, high scores (Q3/4) indicate healthy functioning.
The main part of the report consists of a table with quartile scores for the domains administered. All
items presented are given together with the response options chosen by the client at the end of the
report.
Not all clients were tested on all domains; the number of subjects on which agreement could
be based varied from two for negative symptoms of psychosis to sixteen for anxiety and depression.
In Table 7.1, the cross-tabulation of the quartile scores estimated by MHAs and the quartile scores
computed by CATja is shown.
Table 7.1 Agreement between clients’ quartile scores appraised by MHAs before test administration
and quartile scores computed by CATja (all domains and constructs).
Quartile CATja
Q1 Q2 Q3 Q4
Quartile estimate by MHA
Q1 5 3 1 0
Q2 13 8 10 2
Q3 10 8 16 1
Q4 5 2 3 2
In 31 out of 91 cases, clients’ scores estimated by MHAs before test administration and
clients’ scores as computed by CATja were identical. The proportion of agreement equaled .35
(weighted kappa = .14). In case appraisals by MHAs and quartiles given by CATja were not congruent,
MHAs’ appraisals were typically higher than quartiles computed by CATja. This trend was present
only for the domains of psychopathology, not for the domains companionship and emotional
support. Furthermore, agreement seemed to depend on the homogeneity of domain content. That

523226-L-bw-Bebber523226-L-bw-Bebber523226-L-bw-Bebber523226-L-bw-BebberProcessed on: 27-8-2018Processed on: 27-8-2018Processed on: 27-8-2018Processed on: 27-8-2018 PDF page: 146PDF page: 146PDF page: 146PDF page: 146
134
is, agreement for the distress domain (2/15 = .13) was lower than for anxiety (7/16 = .44), depression
(8/16 = .50), and emotional support (6/14 = .43). In seven out of eleven cases (weighted kappa = .57),
the initial judgment of treatment level to be advised to clients and the final advice (after test
administration) of treatment level were in agreement. In case of disagreement, initial treatment
levels were always higher than final treatment levels advised to clients.
7.4 Discussion The first results for the new screening device are promising, because the information obtained with it
seems to add useful information to existing practice. Psychopathology domain scores as appraised by
MHAs before test administration usually were higher than the domain scores reported by CATja.
Furthermore, with respect to treatment level advise, in case of no agreement, final treatment levels
recommended to clients were always lower than the initial appraisals (before test administration). A
tentative explanation for these findings would be that MHAs use the knowledge of the scores
reported by CATja to lower the treatment levels they advise their clients. Under the assumption that
the psychopathology domain scores computed by CATja are better estimates than the
psychopathology domain scores appraised by MHAs, implementing CATja in order to determine the
treatment level to be advised to clients would lead to less referrals to more specialized mental health
care. Note that this preliminary finding, which would imply cost reduction, is opposite to what has
been reported for other triage tools (Dijksman, Dinant, & Spigt, 2013). This result should be further
tested in a study that includes many more clients in a randomized controlled treatment design where
half of the participating MHAs use CATja and the other half does not. For all cases in which clients are
referred to either generalistic or specialistic health care services, caregivers could be requested to
rate the appropriateness of the referrals. On average, referrals for which CATja was used should be
judged as more appropriate than those in the control condition. Another criterion for the
incremental value of CATja would be to request clients to judge the degree to which they think their
condition did improve since they contacted their GP.

523226-L-bw-Bebber523226-L-bw-Bebber523226-L-bw-Bebber523226-L-bw-BebberProcessed on: 27-8-2018Processed on: 27-8-2018Processed on: 27-8-2018Processed on: 27-8-2018 PDF page: 147PDF page: 147PDF page: 147PDF page: 147
135
7.5 Appendix A7.1 Form client
Name client/ client number: The upper part of the form is not part of the data collected by the UMCG. Remove this part at the end of treatment, or at the end of the pilot
------------------------------------------------------------------------------------------------------------------------------------------------------------ Test session requested
Date: __(dd) - __(mm) Time: __(hh) - __(mm)
Domain Norm group Expected result1 Positive symptoms of psychosis Clients generalistic MHC Q1 Q2 Q3 Q4
Negative symptoms of psychosis Clients generalistic MHC Q1 Q2 Q3 Q4
Anxiety2 General population Clients specialistic MHC
Q1 Q2 Q3 Q4 Q1 Q2 Q3 Q4
Depression2 General population Clients specialistic MHC
Q1 Q2 Q3 Q4 Q1 Q2 Q3 Q4
Friendship General population Q1 Q2 Q3 Q4 Emotional support General population Q1 Q2 Q3 Q4 Distress Clients generalistic MHC Q1 Q2 Q3 Q4
1Mark the option that is appropriate according to your judgement. 2The client´s scores on the domains anxiety and depression are compared with two norm groups: General population and clients specialistic mental health care.
Treatment in … Expected level of care advised 1 General Practice Generalistic MHC3 Specialistic MHC3 Final level of care advised General Practice Generalistic MHC3 Specialistic MHC3
3 Mental Health Care. In case expected and final level of care do not match, could you explain hereafter why not? ________________________________________________________ ________________________________________________________ ________________________________________________________
7.6 References
Cella, D., Riley, W., Stone, A., Rothrock, N., Reeve, B., Yount, S., . . . PROMIS Cooperative Group.
(2010). The patient-reported outcomes measurement information system (PROMIS) developed
and tested its first wave of adult self-reported health outcome item banks: 2005-2008. Journal
of Clinical Epidemiology, 63(11), 1179-1194.

523226-L-bw-Bebber523226-L-bw-Bebber523226-L-bw-Bebber523226-L-bw-BebberProcessed on: 27-8-2018Processed on: 27-8-2018Processed on: 27-8-2018Processed on: 27-8-2018 PDF page: 148PDF page: 148PDF page: 148PDF page: 148
136
Dijksman, I., Dinant, G., & Spigt, M. G. (2013). eDiagnostics: A promising step towards primary mental
health care. Family Practice, 30(6), 695-704.
Gagné, M., & Deci, E. L. (2005). Self-determination theory and work motivation. Journal of
Organizational Behavior, 26(4), 331-362.
Hahn, E. A., DeVellis, R. F., Bode, R. K., Garcia, S. F., Castel, L. D., Eisen, S. V., . . . Cella, D. (2010).
Measuring social health in the patient-reported outcomes measurement information system
(PROMIS): Item bank development and testing. Quality of Life Research, 19(7), 1035-1044.
Lambert, M. J., & Barley, D. E. (2001). Research summary on the therapeutic relationship and
psychotherapy outcome. Psychotherapy: Theory, Research, Practice, Training, 38(4), 357.
Lipton, R. B., Stewart, W. F., Stone, A. M., Láinez, M. J., & Sawyer, J. P. (2000). Stratified care vs step
care strategies for migraine: The disability in strategies of care (DISC) study: A randomized trial.
Jama, 284(20), 2599-2605.
Loewy, R. L., Bearden, C. E., Johnson, J. K., Raine, A., & Cannon, T. D. (2005). The prodromal
questionnaire (PQ): Preliminary validation of a self-report screening measure for prodromal and
psychotic syndromes. Schizophrenia Research, 79(1), 117-125.
Meijer, R. R., & Nering, M. L. (1999). Computerized Adaptive Testing: Overview and Introduction.
Applied Psychological Measurement 23(3); 187-210.
Meuldijk, D., Giltay, E. J., Carlier, I. V., van Vliet, I. M., van Hemert, A. M., & Zitman, F. G. (2017). A
validation study of the web screening questionnaire (WSQ) compared with the mini-
international neuropsychiatric interview-plus (MINI-plus). JMIR Mental Health, 4(3), e35.
Pierce, J. L., Kostova, T., & Dirks, K. T. (2001). Toward a theory of psychological ownership in
organizations. Academy of Management Review, 26(2), 298-310.

523226-L-bw-Bebber523226-L-bw-Bebber523226-L-bw-Bebber523226-L-bw-BebberProcessed on: 27-8-2018Processed on: 27-8-2018Processed on: 27-8-2018Processed on: 27-8-2018 PDF page: 149PDF page: 149PDF page: 149PDF page: 149
137
Pilkonis, P. A., Choi, S. W., Reise, S. P., Stover, A. M., Riley, W. T., Cella, D., & PROMIS Cooperative
Group. (2011). Item banks for measuring emotional distress from the patient-reported
outcomes measurement information system (PROMIS(R)): Depression, anxiety, and anger.
Assessment, 18(3), 263-283.
RoQua. CATja. University Medical Center Groningen, The Netherlands. URL: https//catja.roqua.nl
https://www.webcitation.org/6vBtzg110 Assessed: 2017-11-23.
Terluin, B. (1996). De vierdimensionale klachtenlijst (4DKL). Een Vragenlijst Voor Het Meten Van
Distress, Depressie, Angst En Somatisatie [the Four-Dimensional Symptom Questionnaire
(4DSQ).A Questionnaire to Measure Distress, Depression, Anxiety, and Somatization].Huisarts &
Wetenschap, 39(12), 538-547.
van Bebber, J., Wigman, J. T., Meijer, R. R., Ising, H. K., Berg, D., Rietdijk, J., . . . Jonge, P. (2017a). The
prodromal questionnaire: A case for IRT-based adaptive testing of psychotic experiences?
International Journal of Methods in Psychiatric Research, 26(2).
van Bebber, J., Wigman, J. T., Wunderink, L., Tendeiro, J. N., Wichers, M., Broeksteeg, J., . . . Meijer,
R. R. (2017b). Identifying levels of general distress in first line mental health services: Can GP-
and eHealth clients’ scores be meaningfully compared? BMC Psychiatry, 17(1), 382.
World Health Organization. (2005). Mental health declaration for Europe: Facing the challenges,
building solutions: First WHO European ministerial conference on mental health, Helsinki,
finland 12-15 january 2005.

523226-L-bw-Bebber523226-L-bw-Bebber523226-L-bw-Bebber523226-L-bw-BebberProcessed on: 27-8-2018Processed on: 27-8-2018Processed on: 27-8-2018Processed on: 27-8-2018 PDF page: 150PDF page: 150PDF page: 150PDF page: 150

523226-L-bw-Bebber523226-L-bw-Bebber523226-L-bw-Bebber523226-L-bw-BebberProcessed on: 27-8-2018Processed on: 27-8-2018Processed on: 27-8-2018Processed on: 27-8-2018 PDF page: 151PDF page: 151PDF page: 151PDF page: 151
139
Chapter 8
General Discussion
The main aim of the research presented in this thesis was to develop a number of computerized
adaptive test (CATs) modules that jointly can be used as a screening device (named CATja) to assess
mental well-being of GP clients. The purpose of this device was to facilitate mental health assistants
(MHAs) in assessing their clients’ strengths and weaknesses in order to better determine which level
of care (within GP practices, generalist or specialist mental health care services) best suits their
clients’ needs. Importantly, CATja was designed to screen efficiently (i.e. adaptively) and developed
in close collaboration with the MHAs that will use the device in the future. The individual chapters in
this thesis comprise research that helped us to lay the scientific foundation for these adaptive test
modules.
8.1 Main findings of this thesis The modules of CATja comprise several domains of psychopathology (weaknesses) as well as
constructs of positive psychology (strengths). In this thesis, I describe how CATs (including parameter
specifications) were developed by our team for some of these domains, and how, for other domains,
we investigated the applicability of already existing item pools (i.e. item banks plus parameter
specifications) for use in the Netherlands. With respect to the latter domains, we collaborated with
the Dutch Flemish PROMIS group (Terwee et al., 2014). The Patient-Reported Outcomes
Measurement Information System (PROMIS) research group collected candidate items for various
patient reported outcomes measures (Cella et al., 2007), and based on data that were representative
of the 2000 U.S. census, final item banks were compiled and calibrated that can be used to construct
computer adaptive tests (CAT). The aim of the PROMIS research group is that these item banks will
be used worldwide so that results from studies conducted in different countries can be compared
more easily. See chapter five for more information regarding the PROMIS initiative and the particular
PROMIS item banks that are used in CATja. We developed adaptive tests for positive and negative
symptoms of psychosis by means of item response theory modeling (chapter 2). The research
presented in chapter 3 showed that GP clients and eHealth clients respond in a comparable way to
the a-specific symptoms of stress that comprise the distress scale of the Four-Dimensional Symptom

523226-L-bw-Bebber523226-L-bw-Bebber523226-L-bw-Bebber523226-L-bw-BebberProcessed on: 27-8-2018Processed on: 27-8-2018Processed on: 27-8-2018Processed on: 27-8-2018 PDF page: 152PDF page: 152PDF page: 152PDF page: 152
140
Questionnaire (4DSQ). By that, we demonstrated that GP clients and eHealth clients experiencing
equal levels of general distress tend to choose the same response options on the distress items of
the 4DSQ. Thus, using the same item parameters and norm scores in both application modes is
appropriate. In chapter 4, we found that the current practice of collapsing the three highest response
options of the distress items of the 4DSQ prior to summation of item scores into total scale scores
should be avoided because this practice decreases measurement precision for high levels of distress.
In chapter 5, we showed that the original PROMIS item parameters for anxiety and depression that
were estimated based on data collected in the U.S. did not show a good fit when applied to data
collected in the Netherlands with the same item banks. In other words, Dutch and U.S. American
people do not respond in the same way to symptoms of anxiety and depression. Simulations
revealed, however, that using the official PROMIS item parameters instead of Dutch parameters
(parameters estimated from the data collected in the Netherlands) did not lead to meaningful
decrements in accuracy of predicting which individuals have been diagnosed to have an anxiety or
mood disorder respectively. Therefore, we eventually recommended usage of the original American
parameters, in order to facilitate international research collaborations. In chapter 6, we described a
cohort study on symptomatic and functional recovery in individuals who experienced a first episode
of psychosis (FEP) in the past. The research unveiled that levels of baseline negative symptoms were
most important in predicting which individuals were going to relapse, followed by the length of the
duration of untreated psychosis (DUP). Furthermore, also for predicting functional outcome, levels of
baseline negative symptoms (and not number of relapses) were most important. Thus, we argued
that solely focusing on relapse prevention in posttreatment of FEP patients may be insufficient, and
that attention should be diverted to monitoring levels of negative symptoms instead. Note that this
presumption (although at that time not tested yet) led us to incorporate a module for negative
symptoms in CATja (chapter 2). Findings of this study are in line with the research described in
chapter 2 which also revealed that baseline negative symptoms had the strongest relationship with
social and occupational functioning at the end of the follow-up period of eighteen months. In chapter
7, we described the developmental approach that we took for CATja and the pilot study that
accompanied the implementation of CATja. We reported that clients’ levels of psychopathology as
computed by CATja were generally lower than the levels of psychopathology estimated by the MHAs
prior to testing. In addition, we also tentatively concluded that MHAs seem to lower the treatment
level they advise their clients when they are provided with the score profiles generated by CATja. By
means of the work described in this thesis, we contributed to the scientific literature, and also
developed a practical tool that facilitates decision-making processes in clinical practice.

523226-L-bw-Bebber523226-L-bw-Bebber523226-L-bw-Bebber523226-L-bw-BebberProcessed on: 27-8-2018Processed on: 27-8-2018Processed on: 27-8-2018Processed on: 27-8-2018 PDF page: 153PDF page: 153PDF page: 153PDF page: 153
141
8.2 Generalizability of research findings To what degree may the research findings of this thesis be generalized beyond the situational
specifics (i.e., the specific instruments used in specific contexts) in which they were found? Note that
we are not referring to generalizability in strict statistical sense – or more precisely – in the strict
sense of inferential statistics. In order to provide the reader with a better understanding of what is
meant here, the following two examples might be helpful.
8.2.1 Measurement invariance between application modes: GP clients/paper and pencil versus eHealth clients When instruments possess the properties of structural equivalence (i.e., the property of collections
of items to have the same meaning for subgroups) and scalar invariance (i.e. the property of
collections of items that the same observed scores indicate the same position on the latent
continuum for individuals belonging to different subgroups) for certain application modes,
measurements may be considered to be invariant between application modes (see chapter 4 for a
more in depth introduction to the topic). Based on our findings of structural equivalence and scalar
invariance for the distress scale of the 4DSQ, the question rises whether we can assume that GP- and
eHealth clients who are seeking professional help for psychological complaints respond in the same
way to all different kinds of psychopathology items.
Although many studies that investigated measurement invariance of paper and pencil and
online administrations have been published, most of these studies consider either various measures
of personality dimensions (e.g. Fouladi, Mccarthy, & Moller, 2002; Hays & McCallum, 2005), or
measures of (neuro-)cognitive functioning for educational and developmental testing purposes (e.g.
Silverstein et al., 2007; Kern, Green, Nuechterlein, & Deng, 2004). A few exceptions to this general
rule are studies that investigate equivalence of administration modes for specific instruments.
Schulenberg et al. (2001) found the Beck Depression Inventory (Beck, Steer, & Brown, 1996) to be
invariant with respect to paper and pencil versus online administration, but Coles et al. (2007) found
the Obsessive Compulsive Inventory (Foa et al., 2002) not be invariant with respect to these
differences in application. Because different results have been found with different instruments, we
cannot state that all evidence collected on this matter so far suggests either presence or absence of
measurement invariance for measures of psychopathology. In this case, we first have to rely on the
frequently stated advice that equivalence has to be established for each measure between all
application modes of interest (American Psychological Association. Board of Scientific Affairs.
Committee on Psychological Tests, & Assessment, 1986; van Bebber et al., 2017).
Although only some patient reported outcomes (PROs) are indicators of psychopathology,
like anxiety and depression, an informative review and meta-analysis on the psychometric

523226-L-bw-Bebber523226-L-bw-Bebber523226-L-bw-Bebber523226-L-bw-BebberProcessed on: 27-8-2018Processed on: 27-8-2018Processed on: 27-8-2018Processed on: 27-8-2018 PDF page: 154PDF page: 154PDF page: 154PDF page: 154
142
equivalence of paper and pencil and online testing of PROs is provided by Muehlhausen et al. (2015).
The 435 extracted Interclass correlation coefficients between application modes varied between .65
and .99, with a pooled correlation coefficient of .88. Most researchers would agree that an R2 of
.65*.65*100 = 42.25% demonstrates absence of measurement invariance, while most researchers
would also agree that an R2 from .95*.95*100 = 90.25% does demonstrate measurement invariance
between application modes. With respect to PROs, no general conclusion can be formulated either.
With respect to measurement invariance of PROs, the recommendations given by Coons et al. (2009)
are worth mentioning. These researchers categorized modifications from so called migrations of
paper and pencil versions to computerized versions as minor (e.g. simply placing item content into a
text screen format and/or visualizing one item on each page instead of multiple), moderate (e.g.,
splitting one item onto multiple screens), or substantial (e.g., changes in item stem wordings and/or
changes in response options). For minor changes, equivalence may be simply assessed by cognitive
interviewing techniques (i.e. techniques that explicitly focus on the cognitive processes that
respondents use to answer survey questions). For moderate changes, Coons et al. (2009) advised
quantitative equivalence testing, as we performed for the distress scale of the 4DSQ. For substantial
changes, Coons et al. (2009) advised to handle the electronic version as a new instrument, which
requires full psychometric testing. Although measures of psychopathology differ from PROs, the
same guidelines that Coons et al. (2009) provided for PROs apply here as well. Thus, we recommend
readers to logically and critically evaluate in which way(s) online testing situations differ from taking
the paper and pencil versions of instruments, and how these differences might influence the
response behavior of subjects. Additionally, researchers should carefully question themselves in
which way(s) online sampling might additionally influence research results, because this data
collection approach leads to different sample compositions in terms of demographic variables (e.g.
gender, age, socio-economic status) that are related to the constructs of interests.
8.2.2 Relevance of baseline negative symptoms for relapse prevention and long-term functional outcome
Relapse prevention
In chapter six, we reported that levels of negative symptoms assessed with the positive and negative
syndrome scale (PANSS; Kay, Flszbein, & Opfer, 1987) at ´baseline´ are predictive of both relapse risk
and functional outcome (i.e. social and occupational functioning). May we assume to find the same
relationships in case we would use another instrument to assess levels of negative symptom
experiences at baseline (BNS)? For example, when we would use the CAT-NEG (Bebber et al., 2017)

523226-L-bw-Bebber523226-L-bw-Bebber523226-L-bw-Bebber523226-L-bw-BebberProcessed on: 27-8-2018Processed on: 27-8-2018Processed on: 27-8-2018Processed on: 27-8-2018 PDF page: 155PDF page: 155PDF page: 155PDF page: 155
143
based on the Prodromal Questionnaire (Loewy, Bearden, Johnson, Raine, & Cannon, 2005), or the
Scale for the Assessment of Negative Symptoms (SANS; Andreasen, 1989)? To formulate the question
in a slightly different way, to what extend is the idea that levels of BNS experiences (i.e. the domain,
irrespective of which specific symptoms are utilized and how these are phrased) are predictive of
relapse risk and functional outcome justified?
With respect to the relationship between BNS and relapse prevention, earlier studies
reported mixed results. Probably the most cited (> 1200 citations according to Google scholar in
February 2018) study on this matter is the study conducted by Robinson et al. (1999) who used the
SANS as an indicator of BNS. The relationship was found to be non-significant. But there were
important methodological differences between the study conducted by Robinson et al. and our
study. First, Robinson et al. compared dose maintenance against dose discontinuation, while we
compared dose maintenance against either dose reduction or dose discontinuation. The difference
between treatment arms in the study of Robinson et al. was thus greater than the difference
between treatment arms in our study. Related to this difference is the fact that Robison et al.
entered medication strategy as first predictor in their model on relapse prevention, because it had
the strongest (odds ratio of 5) relationship with relapse risk. Second, and even more important
according to the view of the author of this chapter, Robinson et al. did enter an indicator of
premorbid adaptation to school and premorbid social withdrawal as predictor to the model before
testing the effect of BNS. The effect of premorbid adaptation and social withdrawal was significant
(odds ratio of 1.6), even when controlling for different medication strategies. In my opinion, the
construct of poor premorbid adaptation and social withdrawal may in fact be conceived as direct
consequences of BNS, or even as alternative indicators of BNS. So it does not surprise that Robinson
et al. did not find BNS being related to relapse rates when already controlling for differences in
premorbid adaptation to school and social withdrawal. In a recent systematic review and meta-
analysis conducted by Alvarez-Jimenez et al., the authors found that in only two out of eight studies,
BNS were related to relapse risk (Alvarez-Jimenez et al., 2012). With respect to the methodological
quality of the studies included in their meta-analysis, the authors note that “Statistical methods and
description of methodology and results were poor in many studies. (...) and potentially important
predictors of outcome such as premorbid adjustment, diagnosis, sex, age or negative symptoms were
rarely included in the multivariate models” (Alvarez-Jimenez et al., 2012, p.117).
To conclude this section, until now, not enough high-quality studies have been conducted as
to provide a definitive answer to the question whether the relationship between BNS and relapse risk
may or may not be generalized beyond the situational specifics (using the PANSS as indicator of BNS)
of our study.

523226-L-bw-Bebber523226-L-bw-Bebber523226-L-bw-Bebber523226-L-bw-BebberProcessed on: 27-8-2018Processed on: 27-8-2018Processed on: 27-8-2018Processed on: 27-8-2018 PDF page: 156PDF page: 156PDF page: 156PDF page: 156
144
Functional outcome
In chapter 2, we reported a substantial relationship (at least when considering restriction of range in
the predictor induced by the data collection design) between levels of BNS assessed with the CAT-
NEG and long-term social and occupational functioning in prodromal subjects (Bebber et al., 2017). In
fact, many research teams have documented the predictive value of negative symptoms (either as
the only predictor or in combination with measures of neurocognitive functioning) for later social
and occupational functioning. See for example (Rabinowitz et al., 2012) and (Norman et al., 2000) for
the PANSS, and (Milev, Ho, Arndt, & Andreasen, 2005) for the SANS. Note that the author was unable
to retrieve any study that reported absence (or inverse direction) of this relationship. So, in my
opinion, the generalization that levels of BNS, irrespective of the way in which these were assessed,
are predictive of long-term functioning in individuals that are either prodromal or psychotic seems
justified.
8.3 Lessons learned
8.3.1 Evaluation of model fit and Differential Item Functioning The evaluation of model fit is usually done using some kind of test statistic (e.g. summed score chi-
square as proposed by Orlando & Thissen, 2000 or Lagrange multiplier as proposed by Glas, 1999),
where often the differences between observed and model-implied item responses are compared.
Comparable test statistics are employed to investigate differential item functioning (DIF), a popular
technique to assess measurement invariance across groups, an important aspect of item quality.
When testing for DIF, response functions between groups are either compared directly to one
another (the typical two group scenario), or group-specific response functions are compared to
general response functions (the multigroup scenario). Regardless of whether testing model fit or DIF
effects, and regardless of which test statistic is implemented, large sample sizes quickly lead to
significant test results even though deviations between model and data may be small and negligible
for practical testing purposes. An alternative is to investigate the magnitudes of differences between
observed and expected item score frequencies, as was done in chapters 2 and 3, or to quantify the
detrimental effect of using estimated parameters under a misfitting model on coefficients expressing
criterion- or predictive validity, as was done in chapter 5. In my opinion, test statistics should be used
as a first step, that is to ‘flag’ items that are most problematic, either with respect to model fit or DIF.
Then, the alternatives described above should be implemented for the ‘flagged’ items to
investigate whether deviations are meaningful for test practice. Furthermore, in chapter 3, using the
response data of GP patients and eHealth clients, we found that considering all respondents to be

523226-L-bw-Bebber523226-L-bw-Bebber523226-L-bw-Bebber523226-L-bw-BebberProcessed on: 27-8-2018Processed on: 27-8-2018Processed on: 27-8-2018Processed on: 27-8-2018 PDF page: 157PDF page: 157PDF page: 157PDF page: 157
145
random draws from the same population in which distress is standard normally distributed would
have been incorrect. Instead, a multigroup IRT model was used to correctly estimate item
parameters for the distress items of the 4DSQ. The effect of erroneously assuming equal prior
distributions on item- and person parameter estimates is a topic that until now has not received
proper attention in the scientific literature on estimation strategies.
8.3.2 Never underestimate people’s resistance to change when implementing new tools On a more practical level, CATja was developed taking a ‘bottom up’ approach, as was stated in the
general introduction of this thesis. That is, we organized regular meetings with our envisioned end
users (GPs and MHAs) in which we inventoried their ideas and wishes, and in which we checked
whether our plans found support. The first reason for these meetings was that we wanted to
incorporate the knowledge and expertise of the people who would be using CATja in daily practice in
developing CATja. The second reason was that we wanted to avoid, or at least minimize, MHAs’
resistance to adopt their working routines when asked to implement CATja. Still, our first result
showed that it is not easy to get CATja used in practice.
Interesting in this context is that on December 1, 2017 the search term resistance to change
with IT innovations yielded 1,130,000 hits on Google Scholar. The concept is of such importance
within organizational theory that even measures have been developed to measure this construct
(Oreg, 2003). Furthermore, resistance to change in the context of IT innovations is no longer seen as
inherently negative. Ford et al. (2008) pointed out that resistance may actually also have functional
aspects. Individuals may be against change as a result of their rational tendencies to pursue their
own strategies and objectives. Furthermore, sometimes change agents are advised to embrace
resistance to change because authentic resistance might contribute to successful implementation of
change.
To what degree was our approach of implementing CATja in line with these new findings?
Although the version that we piloted in 2017 was only the alfa version of the instrument that will be
improved based on experience, there was the problem of the use of various so-called GP information
systems. These are electronic systems in which caregivers may store all kinds of information that
they consider relevant for a good understanding of clients digitally. During all meetings held with the
MHAs, they stated that they would only use our instrument in case it would be integrated within the
GP information system they were using. The problem was that there are numerous different
systems, and that integrating CATja into all these different systems was too expensive in the first
phase of the project. Our argument that we would integrate CATja in case GPs and MHAs would be

523226-L-bw-Bebber523226-L-bw-Bebber523226-L-bw-Bebber523226-L-bw-BebberProcessed on: 27-8-2018Processed on: 27-8-2018Processed on: 27-8-2018Processed on: 27-8-2018 PDF page: 158PDF page: 158PDF page: 158PDF page: 158
146
positive or enthusiastic about the application in general did help to convince some MHAs, but others
did not collaborate in the implementation of CATja probably for this reason.
8.4 Limitations A limitation of the research described in this thesis was that we did not further investigate or validate
the value of CATja for triaging GP patients with psychological complaints. There are also more
specific limitations to the individual studies. In the study described in chapter 2 on the applicability of
CAT for positive and negative symptoms experiences of psychosis, we could not provide a conclusive
answer to the question whether the CATs based on positive and negative symptom experiences
(Bebber et al., 2017) or the PQ-16 (i.e. the brief version that is implemented in the Netherlands; Ising
et al., 2012) are to be preferred in clinical practice. Therefore, a definitive recommendation on the
best questionnaire to use could not be provided. Furthermore, the study on the optimal number of
response options for the items of the distress scale of the 4DSQ in chapter 4 suffers from the
shortcoming that parts of the data have not been gathered with a response scale consisting of three
response options in the first place. Therefore, it was difficult to determine whether the use of three
response options would have had better psychometric properties than the existing scales in which
the three highest response options are collapsed after administration. Conclusions from this study
should therefore be interpreted with caution.
8.5 Future Research
8.5.1 The incremental value of CATja: Improved placement and recovery? Although the first results of our pilot study discussed in chapter 7 of this thesis were promising, more
research is needed before CATja can be implemented on a large scale in practice. Ideally, a
randomized controlled treatment (RCT) design is applied, where clients are randomly assigned to
either a treatment (triage based on screening with CATja) or a control (triage without CATja)
condition. For all cases in which clients are referred to either generalist or specialist health care
services, a proper criterion for judging whether placement improves through the use of CATja would
be to ask caregivers to rate the appropriateness of the referrals. If CATja works, the referrals in the
treatment condition should, on average, be judged as more appropriate than those in the control
condition. Also, clients in both experimental conditions could be requested to judge the degree to
which they think their condition did improve since baseline. Baseline would be defined as the
moment the clients approached their GPs for reasons of psychological complaints, i.e. intake.

523226-L-bw-Bebber523226-L-bw-Bebber523226-L-bw-Bebber523226-L-bw-BebberProcessed on: 27-8-2018Processed on: 27-8-2018Processed on: 27-8-2018Processed on: 27-8-2018 PDF page: 159PDF page: 159PDF page: 159PDF page: 159
147
Although the caregivers’ opinions would be a proxy for the – hard to operationalize –criteria of
“recovery”, the main problem with conducting an experimental design is that it will be very difficult
to randomly assign patients to both experimental conditions (treatment and control). We do not
have direct access to clients, but only indirect, via their MHAs.
8.5.2 Future research and improvements 4DSQ The research presented in chapter 3 only tested whether the principles of structural equivalence and
scalar invariance would hold for the distress scale of the 4DSQ. In future research, one should
investigate whether these principles also apply to the other three symptom dimensions of the 4DSQ:
anxiety, depression, and somatization. As for the distress scale, cut-off values for classifying eHealth
clients’ levels of anxiety, depression, or somatization as low, moderate, and high were based on total
scores of GP clients. Furthermore, our study presented in chapter 4 revealed that the current
practice of recoding 4DSQ distress item scores prior to computing scale scores should be avoided
because it leads to decreased measurement precision for high levels of distress. In case this finding
would generalize to the other three dimensions of the 4DSQ, the current practice of recoding item
scores should be discouraged. In addition, according to the current cut-off values for the distress
scale, approximately half of all GP-clients and about two-thirds of all eHealth clients are experiencing
high levels of distress. Although these cut-off values were based on clinical expertise in the first place
(instead of having certain percentages of respondents in each category), it is questionable whether
this classification scheme (and those for the other three 4DSQ dimensions) is still up to date.
Research on these new cut-off values should be based on scale totals that are computed from raw
item scores (the original five response options weighted as 0,1,2,3,4) as to preserve measurement
precision for high levels of distress (and possible high levels of anxiety, depression, and
somatization).
8.5.3 The intercorrelations of CATja’s domains of psychopathology and constructs of positive psychology In future research, it may be investigated how strongly the seven domains and constructs that
currently can be assessed with CATja are intercorrelated in the population of individuals who contact
their GP for psychological complaints. First, this would increase our understanding of our patients’
score profiles. How much of the variance is shared by items with similar content, and how much
variance is unique to particular constructs? Second, the answers to these questions could also
improve test practice. In case, say, constructs A and B do correlate at least moderately, knowledge
about the standing of an individual on construct A may be used to accelerate adaptive testing of
523226-L-bw-Bebber523226-L-bw-Bebber523226-L-bw-Bebber523226-L-bw-BebberProcessed on: 27-8-2018Processed on: 27-8-2018Processed on: 27-8-2018Processed on: 27-8-2018 PDF page: 160PDF page: 160PDF page: 160PDF page: 160
148
construct B (Paap et al., 2017). To provide the reader with an example, in case of full item bank
administration, the correlation between the PROMIS domains companionship (6 items) and
emotional support (16 items) equals r = .78, which means that both domains have approximately
61% common variance. In this case, the score that individual A received on Companionship could be
used as prior information for testing individual A on Emotional support by using this score as
preliminary input for item selection and/or score estimation (instead of using the group average for
these purposes). In case many items of both domains provide information on the relative standings
of individuals on both domains, multidimensional IRT models may be fitted to combinations of
domains with similar content (e.g., anxiety and depression). Both approaches, the ‘empirical prior’
and the multidimensional approach would further decrease the number of items respondents would
have to respond to in order to reach reliable score estimates, thus making the time to complete the
screening instrument even shorter.
8.6 The future of CATja The development of information technology tools is an ongoing process. For CATja, a next step is to
expand the number of domains from which MHAs can choose. Kessler et al. (2003) found that
problems concerning alcohol- and/or substance abuse/dependency are frequently encountered in
primary health care. For the development of this module, we are currently in close collaboration with
Addiction Care Northern Netherlands (Verslavingszorg Noord Nederland, VNN). In order to reduce
the influence of social desirability response bias, we will combine the items on alcohol and drug
taking habits and behavioral effects of substances with questions concerning the dieting style,
physical exercise habits, and sleeping patterns of respondents. In addition to possibly reducing
response bias, we consider the aforementioned aspects as important parts of an holistic perspective
on clients. Furthermore, we are currently working on adding a module for the residual effects of
traumatic experiences, another for autism spectrum disorders, and one for attention deficit
hyperactivity disorders. More domains will be added in the more distant future.
Furthermore, the report section will be expanded. First, the table that contains the client’s
scores on the selected domains of psychopathology and constructs of positive psychology is now just
a snapshot of the strengths and weaknesses of a client. In the future, we want to add the option to
visualize differences between measurement waves (e.g., baseline, post-treatment, and various
follow-up measures) in graphical form. Second, in line with existing evidence of the effectiveness of
interventions, certain therapeutic options may be connected to specific score profiles (Pilling,
Whittington, Taylor, Kendrick, & Guideline Development Group, 2011). A particular promising, but
just upcoming intervention is the experience sampling method (ESM), which has already proven its

523226-L-bw-Bebber523226-L-bw-Bebber523226-L-bw-Bebber523226-L-bw-BebberProcessed on: 27-8-2018Processed on: 27-8-2018Processed on: 27-8-2018Processed on: 27-8-2018 PDF page: 161PDF page: 161PDF page: 161PDF page: 161
149
value as a personalized measure in the treatment of depression (Kramer et al., 2014). The core
assumption is that patients are capable of influencing their mind states (e.g. positive affect) if they
are empowered by providing them insight in personal and contextual factors that have impact on
their mind states. However, in line with our guiding principles (chapter 7), MHAs will still be in charge
to decide what they think the best choices would be for their patients.
8.7 References
Alvarez-Jimenez, M., Priede, A., Hetrick, S., Bendall, S., Killackey, E., Parker, A., . . . Gleeson, J. (2012).
Risk factors for relapse following treatment for first episode psychosis: A systematic review and
meta-analysis of longitudinal studies. Schizophrenia Research, 139(1), 116-128.
American Psychological Association. Committee on Professional Standards, American Psychological
Association. Board of Scientific Affairs. Committee on Psychological Tests, & Assessment. (1986).
Guidelines for computer-based tests and interpretations The Association.
Andreasen, N. C. (1989). The scale for the assessment of negative symptoms (SANS): Conceptual and
theoretical foundations. The British Journal of Psychiatry.
Bebber, J., Wigman, J. T., Meijer, R. R., Ising, H. K., Berg, D., Rietdijk, J., . . . Jonge, P. (2017). The
prodromal questionnaire: A case for IRT-based adaptive testing of psychotic experiences?
International Journal of Methods in Psychiatric Research, 26(2).
Beck, A. T., Steer, R. A., & Brown, G. K. (1996). Beck depression inventory-II. San Antonio, 78(2), 490-
498.
Cella, D., Yount, S., Rothrock, N., Gershon, R., Cook, K., Reeve, B., . . . PROMIS Cooperative Group.
(2007). The patient-reported outcomes measurement information system (PROMIS): Progress of
an NIH roadmap cooperative group during its first two years. Medical Care, 45(5 Suppl 1), S3-
S11.

523226-L-bw-Bebber523226-L-bw-Bebber523226-L-bw-Bebber523226-L-bw-BebberProcessed on: 27-8-2018Processed on: 27-8-2018Processed on: 27-8-2018Processed on: 27-8-2018 PDF page: 162PDF page: 162PDF page: 162PDF page: 162
150
Coles, M. E., Cook, L. M., & Blake, T. R. (2007). Assessing obsessive compulsive symptoms and
cognitions on the internet: Evidence for the comparability of paper and internet administration.
Behaviour Research and Therapy, 45(9), 2232-2240.
Coons, S. J., Gwaltney, C. J., Hays, R. D., Lundy, J. J., Sloan, J. A., Revicki, D. A., . . . Basch, E. (2009).
Recommendations on evidence needed to support measurement equivalence between
electronic and paper-based patient-reported outcome (PRO) measures: ISPOR ePRO good
research practices task force report. Value in Health, 12(4), 419-429.
Foa, E. B., Huppert, J. D., Leiberg, S., Langner, R., Kichic, R., Hajcak, G., & Salkovskis, P. M. (2002). The
obsessive-compulsive inventory: Development and validation of a short version. Psychological
Assessment, 14(4), 485.
Ford, J. D., Ford, L. W., & D'Amelio, A. (2008). Resistance to change: The rest of the story. Academy of
Management Review, 33(2), 362-377.
Fouladi, R. T., Mccarthy, C. J., & Moller, N. (2002). And-pencil or online? evaluating mode effects on
measures of emotional functioning and attachment. Assessment, 9(2), 204-215.
Glas, C. A. (1998). Detection of differential item functioning using lagrange multiplier tests. Statistica
Sinica, 8(3), 647-667.
Glas, C. A. (1999). Modification indices for the 2-PL and the nominal response model. Psychometrika,
64(3), 273-294.
Hays, S., & McCallum, R. S. (2005). A comparison of the pencil-and-paper and computer-administered
Minnesota multiphasic personality Inventory–Adolescent. Psychology in the Schools, 42(6), 605-
613.

523226-L-bw-Bebber523226-L-bw-Bebber523226-L-bw-Bebber523226-L-bw-BebberProcessed on: 27-8-2018Processed on: 27-8-2018Processed on: 27-8-2018Processed on: 27-8-2018 PDF page: 163PDF page: 163PDF page: 163PDF page: 163
151
Ising, H. K., Veling, W., Loewy, R. L., Rietveld, M. W., Rietdijk, J., Dragt, S., . . . van der Gaag, M.
(2012). The validity of the 16-item version of the prodromal questionnaire (PQ-16) to screen for
ultra high risk of developing psychosis in the general help-seeking population. Schizophrenia
Bulletin, 38(6), 1288-1296.
Kay, S. R., Flszbein, A., & Opfer, L. A. (1987). The positive and negative syndrome scale (PANSS) for
schizophrenia. Schizophrenia Bulletin, 13(2), 261.
Kern, R. S., Green, M. F., Nuechterlein, K. H., & Deng, B. H. (2004). NIMH-MATRICS survey on
assessment of neurocognition in schizophrenia. Schizophrenia Research, 72(1), 11-19.
Kessler, R. C., Barker, P. R., Colpe, L. J., Epstein, J. F., Gfroerer, J. C., Hiripi, E., . . . Zaslavsky, A. M.
(2003). Screening for serious mental illness in the general population. Archives of General
Psychiatry, 60(2), 184-189.
Kramer, I., Simons, C. J., Hartmann, J. A., Menne-Lothmann, C., Viechtbauer, W., Peeters, F., . . .
Delespaul, P. (2014). A therapeutic application of the experience sampling method in the
treatment of depression: A randomized controlled trial. World Psychiatry, 13(1), 68-77.
Loewy, R. L., Bearden, C. E., Johnson, J. K., Raine, A., & Cannon, T. D. (2005). The prodromal
questionnaire (PQ): Preliminary validation of a self-report screening measure for prodromal and
psychotic syndromes. Schizophrenia Research, 79(1), 117-125.
Milev, P., Ho, B., Arndt, S., & Andreasen, N. C. (2005). Predictive values of neurocognition and
negative symptoms on functional outcome in schizophrenia: A longitudinal first-episode study
with 7-year follow-up. American Journal of Psychiatry, 162(3), 495-506.
Muehlhausen, W., Doll, H., Quadri, N., Fordham, B., O’Donohoe, P., Dogar, N., & Wild, D. J. (2015).
Equivalence of electronic and paper administration of patient-reported outcome measures: A

523226-L-bw-Bebber523226-L-bw-Bebber523226-L-bw-Bebber523226-L-bw-BebberProcessed on: 27-8-2018Processed on: 27-8-2018Processed on: 27-8-2018Processed on: 27-8-2018 PDF page: 164PDF page: 164PDF page: 164PDF page: 164
152
systematic review and meta-analysis of studies conducted between 2007 and 2013. Health and
Quality of Life Outcomes, 13(1), 167.
Norman, R. M., Malla, A. K., McLean, T., Voruganti, L. P. N., Cortese, L., McIntosh, E., . . . Rickwood, A.
(2000). The relationship of symptoms and level of functioning in schizophrenia to general
wellbeing and the quality of life scale. Acta Psychiatrica Scandinavica, 102(4), 303-309.
Oreg, S. (2003). Resistance to change: Developing an individual differences measure. Journal of
Applied Psychology, 88(4), 680.
Orlando, M., & Thissen, D. (2000). Likelihood-based item-fit indices for dichotomous item response
theory models. Applied Psychological Measurement, 24(1), 50-64.
Orlando, M., & Thissen, D. (2003). Further investigation of the performance of S-X2: An item fit index
for use with dichotomous item response theory models. Applied Psychological Measurement,
27(4), 289-298.
Paap, M. C., Kroeze, K. A., Glas, C. A., Terwee, C. B., van der Palen, J., & Veldkamp, B. P. (2017).
Measuring patient-reported outcomes adaptively: Multidimensionality matters! Applied
Psychological Measurement.
Pilling, S., Whittington, C., Taylor, C., Kendrick, T., & Guideline Development Group. (2011).
Identification and care pathways for common mental health disorders: Summary of NICE
guidance. BMJ (Clinical Research Ed.), 342.
Rabinowitz, J., Levine, S. Z., Garibaldi, G., Bugarski-Kirola, D., Berardo, C. G., & Kapur, S. (2012).
Negative symptoms have greater impact on functioning than positive symptoms in
schizophrenia: Analysis of CATIE data. Schizophrenia Research, 137(1-3), 147-150.

523226-L-bw-Bebber523226-L-bw-Bebber523226-L-bw-Bebber523226-L-bw-BebberProcessed on: 27-8-2018Processed on: 27-8-2018Processed on: 27-8-2018Processed on: 27-8-2018 PDF page: 165PDF page: 165PDF page: 165PDF page: 165
153
Robinson, D., Woerner, M. G., Alvir, J. M. J., Bilder, R., Goldman, R., Geisler, S., . . . Mayerhoff, D.
(1999). Predictors of relapse following response from a first episode of schizophrenia or
schizoaffective disorder. Archives of General Psychiatry, 56(3), 241-247.
Schulenberg, S. E., & Yutrzenka, B. A. (2001). Equivalence of computerized and conventional versions
of the beck depression inventory-II (BDI-II). Current Psychology, 20(3), 216-230.
Silverstein, S. M., Berten, S., Olson, P., Paul, R., Williams, L. M., Cooper, N., & Gordon, E. (2007).
Development and validation of a world-wide-web-based neurocognitive assessment battery:
WebNeuro. Behavior Research Methods, 39(4), 940-949.
Terwee, C., Roorda, L., De Vet, H., Dekker, J., Westhovens, R., Van Leeuwen, J., . . . Perez, B. (2014).
Dutch–Flemish translation of 17 item banks from the patient-reported outcomes measurement
information system (PROMIS). Quality of Life Research, 23(6), 1733-1741.
van Bebber, J., Wigman, J. T., Wunderink, L., Tendeiro, J. N., Wichers, M., Broeksteeg, J., . . . Meijer,
R. R. (2017). Identifying levels of general distress in first line mental health services: Can GP-and
eHealth clients’ scores be meaningfully compared? BMC Psychiatry, 17(1), 382.

523226-L-bw-Bebber523226-L-bw-Bebber523226-L-bw-Bebber523226-L-bw-BebberProcessed on: 27-8-2018Processed on: 27-8-2018Processed on: 27-8-2018Processed on: 27-8-2018 PDF page: 166PDF page: 166PDF page: 166PDF page: 166
154

523226-L-bw-Bebber523226-L-bw-Bebber523226-L-bw-Bebber523226-L-bw-BebberProcessed on: 27-8-2018Processed on: 27-8-2018Processed on: 27-8-2018Processed on: 27-8-2018 PDF page: 167PDF page: 167PDF page: 167PDF page: 167
155
Samenvatting
In dit proefschrift wordt onderzoek beschreven dat verricht is om een online, slimme testbatterij
voor de eerste lijn van de Geestelijke Gezondheidszorg in Nederland te kunnen ontwikkelen. Deze
testbatterij heeft de naam CATja gekregen. CATja is primair ontwikkeld om huisartsen en hun
praktijkondersteuners voor de geestelijke gezondheidszorg (POH’s-GGZ) te faciliteren bij de triage
van hun cliënten. Dat wil zeggen, CATja is ontworpen om hulp te bieden bij het beantwoorden van de
vraag op welk zorgniveau de cliënt het beste geholpen kan worden. Is behandeling in de
huisartsenpraktijk door de POH-GGZ voldoende? Of is verwijzing naar de generalistische of zelfs
specialistische GGZ vereist? Om hulp te bieden bij het beantwoorden van deze vragen genereert
CATja een profiel van klachten en krachten van de cliënt. Met klachten bedoelen wij verschillende
vormen van psychopathologie zoals angst en depressie, met krachten wordt verwezen naar
verschillende positieve psychologische constructen, zoals vriendschap en emotionele steun.
Het vernieuwende aan CATja is het adaptieve karakter. Adaptief betekent dat vervolgvragen
tijdens de testafname afgestemd worden op eerder gegeven antwoorden van de cliënt. Na ieder
gegeven antwoord wordt de mate waarin een bepaalde dimensie (bijvoorbeeld angst) bij deze cliënt
aanwezig is opnieuw berekend en wordt bepaald welke vervolgvraag de meeste informatie oplevert
om deze mate nog nauwkeuriger te kunnen bepalen. Vragen die weinig toegevoegde informatie
zouden verschaffen over een cliënt worden overgeslagen. Er worden vragen aangeboden totdat de
positie van de cliënt op het te meten construct met de gewenste nauwkeurigheid bepaald kan
worden. Men zou kunnen zeggen dat ‘het gedrag’ van een “computerized adaptive test” (CAT,
vandaar ook de naam CATja voor de testbatterij) als het ware het gedrag van een ervaren
interviewer nabootst. Ook is CATja ontworpen in nauwe samenwerking met de beoogde uiteindelijke
gebruikers: de POH’s-GGZ. In verschillende fases van het project (ontwerp, ontwikkeling,
implementatie- onderzoek) hebben zij steeds bijgedragen aan het project, zowel qua inhoud als qua
praktische uitvoering.
CATja bestaat uit een aantal modules (tests) die specifieke domeinen van psychopathologie
en positieve psychologie constructen meten. De eerste versie van CATja, de alfaversie, omvat de
volgende vijf domeinen van psychopathologie: angst, depressie, distress (algemene stress
symptomen), negatieve symptomen van psychose en positieve symptomen van psychose. Bovendien
staan de gebruiker de volgende twee positieve psychologie constructen ter beschikking: emotionele
steun en vriendschap. Om deze tests online op adaptieve manier aan te kunnen bieden, was
onderzoek vereist.

523226-L-bw-Bebber523226-L-bw-Bebber523226-L-bw-Bebber523226-L-bw-BebberProcessed on: 27-8-2018Processed on: 27-8-2018Processed on: 27-8-2018Processed on: 27-8-2018 PDF page: 168PDF page: 168PDF page: 168PDF page: 168
156
In hoofdstuk 2 is onderzocht of het mogelijk is om positieve symptomen van psychose (zoals
hallucinaties en wanen; CAT-POS) en negatieve symptomen van psychose (zoals gebrek aan initiatief,
apathie, sociale terugtrekking, demotivatie: CAT-NEG) adaptief te meten. We laten zien dat deze
CATs over goede meeteigenschappen beschikken. Ten eerste zijn de CATs efficiënt, dat wil zeggen
dat met relatief weinig (±10) vragen betrouwbare scores berekend kunnen worden. Ter vergelijking:
de originele lijst bevat 92 items en de in Nederland veel gebruikte verkorte versie bevat 16 items
(PQ-16). Ten tweede zijn deze CATs ook effectief. De CAT-POS is beter in staat te voorspellen welke
patiënten met hoog risico op een eerste psychose daadwerkelijk een psychose zullen ontwikkelen
binnen een follow-up periode van 18 maanden dan de oorspronkelijke lijst met 45 positieve
symptomen of de verkorte versie van dezelfde lijst. Hetzelfde geldt voor de voorspelling van hoe lang
deze patiënten zullen worden opgenomen in een psychiatrische kliniek vanwege de aandoening, wat
van groot belang is vanwege de daarmee gepaard gaande zorgkosten. Bovendien blijkt de CAT-NEG
het sociaal en beroepsmatig functioneren van patiënten aan het einde van de follow-up beter te
voorspellen dan de PQ-92 of de bestaande verkorte versie, de PQ-16.
In hoofdstuk 3 is op basis van de algemene stress-symptomen van de Vierdimensionale
klachtenlijst (4DKL) onderzocht in hoeverre het antwoordgedrag van mensen die vanwege psychische
problemen contact opnemen met hun huisarts en het antwoordgedrag van eHealth cliënten
vergelijkbaar is. Aangezien we voor de specificaties van de adaptieve tests deels gebruik maken van
datasets die op traditionele manier (“pen-en-papier”) in bijvoorbeeld de huisartsenpraktijk
verzameld zijn, maar we de CAT’s uiteraard wel online willen inzetten, was het belangrijk om vooraf
vast te stellen of het antwoordgedrag in beide contexten al dan niet vergelijkbaar is. In hoofdstuk 3
laten we zien dat beide groepen cliënten in beide contexten deze vragen op eenzelfde manier
beantwoorden, maar ook dat eHealth cliënten duidelijk hogere niveaus van stress ervaren dan
huisartsenpatiënten. Ook met dit verschil dienden wij rekening te houden bij het bepalen van de
specificaties van deze adaptieve test.
Voor de vragen van deze schaal is verder onderzocht, op welke manier de gegeven
antwoorden het beste gekwantificeerd kunnen worden. Per vraag van deze schaal, bijvoorbeeld Hebt
u de afgelopen week last van – piekeren? kan een patiënt aangeven hoe vaak zij/hij de afgelopen
week last van dat symptoom heeft gehad. Dit doet de patiënt door een van de vijf mogelijke
antwoordalternatieven te kiezen: “nee”, “soms”, “regelmatig”, ”vaak”, of “heel vaak of
voortdurend”. Op basis van onderzoek met deze vragen is in hoofdstuk 4 gebleken dat door het
samenvoegen van de drie zwaarste antwoordalternatieven “regelmatig”, “vaak” en “heel vaak of
voortdurend” voorafgaand aan de berekening van schaalscores verhoogde en sterk verhoogde
niveaus van stress minder nauwkeurig in kaart gebracht kunnen worden. Voorts hebben we in dit
onderzoek geen steun kunnen vinden voor de bewering, dat deze transformatie het effect van de

523226-L-bw-Bebber523226-L-bw-Bebber523226-L-bw-Bebber523226-L-bw-BebberProcessed on: 27-8-2018Processed on: 27-8-2018Processed on: 27-8-2018Processed on: 27-8-2018 PDF page: 169PDF page: 169PDF page: 169PDF page: 169
157
veronderstelde neiging van sommige respondenten, om extreme antwoordalternatieven te kiezen op
de schaalscores, zou verminderen. Op basis hiervan raden we het samenvoegen van de
antwoordcategorieën voor de 4DKL af, en doen wij dit in het kader van CATja ook niet.
Twee andere domeinen van CATja betreffen angst en depressie. Vragen over deze domeinen
die in CATja zijn opgenomen komen uit de PROMIS8 databank. In hoofdstuk 5 hebben we onderzocht
of de item parameters van de PROMIS-domeinen angst en depressie die berekend zijn op basis van
gegevens die in de Verenigde Staten verzameld zijn, ook bruikbaar zijn om respondenten in
Nederland te testen. Dit blijkt zowel voor mensen uit de algemene bevolking als ook voor cliënten
van de tweede lijn GGZ het geval te zijn. Daarom kunnen we voor CATja – voorlopig- de Amerikaanse
item parameters gebruiken, wat wenselijk is omdat hierdoor onderzoek dat in beide landen verricht
is met deze PROMIS-domeinen, beter te vergelijken is, en de gegevens ten behoeve van meta-
analyses samengevoegd kunnen worden.
Hoewel geen vereiste voor de ontwikkeling van CATja, zijn we in hoofdstuk 6 ook nagegaan
welke factoren voorspellen of iemand die voor het eerst een psychose heeft ervaren een tweede of
meer psychotische episoden zal meemaken (een terugval of relapse), en daarnaast welke factoren
het sociaal functioneren op de langere termijn voorspellen van individuen, die een eerste
psychotische episode hebben doorgemaakt. Het al dan niet optreden van een relapse bleek het beste
voorspeld te kunnen worden door middel van twee variabelen. Ten eerste het tijdsinterval dat ligt
tussen het optreden van de eerste positieve symptomen en het inzetten van behandeling door
middel van psychofarmaca, de zogenaamde duration of untreated psychosis (DUP). Een langere DUP
bleek samen te gaan met een grotere kans op relapse. Ten tweede bleek de ernst van de negatieve
symptomen aan het begin van de behandeling voorspellend te zijn voor de kans op relapse – waarbij
ernstiger symptomen samengaan met een grotere kans op relapse. Het sociaal functioneren van
iemand die een eerste psychose ervaren heeft bleek het beste voorspeld te kunnen worden door het
niveau van negatieve symptomen aan het begin van de studie (lager is beter), het aantal
voorafgaande relapses (minder is beter), en het toepassen van een dosisreductie-strategie van
antipsychotica zodra de positieve symptomen van psychose gedurende een half jaar verdwenen
waren (antipsychotica individueel zo laag doseren als mogelijk is zonder symptomen toe te laten is
beter dan een vaste onderhoudsdosering). Deze bevindingen onderstrepen het belang van een
8 Het Patient Reported Outcomes Measurement Information System (PROMIS) is een valide en betrouwbaar meetsysteem waarmee op zeer efficiënte wijze patiënt-gerapporteerde gezondheidsuitkomsten en welzijn gemeten kan worden, bij volwassenen en kinderen. PROMIS is ontwikkeld in de U.S.A., gefinancierd door het National Institute of Health. In 2010 is de ‘Dutch-Flemish PROMIS’ groep opgericht met als doel om PROMIS in het Nederlands-Vlaams te vertalen en in Nederland en Vlaanderen te implementeren. Op deze website vindt u informatie over de beschikbare meetinstrumenten en het gebruik van PROMIS in Nederland. Voor meer informatie, zie http://www.dutchflemishpromis.nl/validatie_21_22.html.

523226-L-bw-Bebber523226-L-bw-Bebber523226-L-bw-Bebber523226-L-bw-BebberProcessed on: 27-8-2018Processed on: 27-8-2018Processed on: 27-8-2018Processed on: 27-8-2018 PDF page: 170PDF page: 170PDF page: 170PDF page: 170
158
online screener die in staat is vroegtijdig het bestaan van positieve symptomen van psychose te
onderkennen (beperking van de DUP), en tevens de aanwezigheid van negatieve symptomen in beeld
te brengen, zodat rekening kan worden gehouden met en behandeling kan worden geboden voor
een hogere kans op terugval en grotere problemen bij het herstel van functioneren. Op deze wijze
kan profilering met behulp van CATja bijdragen aan personalized medicine en een betere prognose
van psychosen
Hoofdstuk 7 van dit proefschrift is gewijd aan een uitgebreidere beschrijving van CATja
evenals aan de rapportage van de eerste resultaten van de pilot die in 2017 is verricht. In deze pilot
hebben we de ervaringen van een aantal POH’s-GGZ die met CATja gewerkt hebben systematisch in
kaart gebracht. Tevens hebben we tijdens de pilot ook geprobeerd de ervaringen van hun cliënten
die met CATja getest zijn in kaart te brengen. De eerste resultaten van de pilot wijzen uit dat POH’s
GGZ de psychische gesteldheid van hun cliënten over het algemeen minder gunstig inschatten dan de
scores die CATja berekent laten zien. Met andere woorden, op basis van CATja wordt de ernst van de
psychische klachten minder ernstig ingeschat dan wanneer de POH-GGZ zelf een inschatting hiervan
maakt. Ten tweede lijkt het zo te zijn dat POH’s GGZ hun cliënten over het algemeen behandeling op
een minder zwaar niveau adviseren wanneer zij het scoreprofiel dat CATja genereert hebben kunnen
raadplegen dan wanneer zij zelf een inschatting maken zonder gebruik van CATja.
De alfaversie van CATja is vrij beschikbaar voor iedereen die er mee wil werken. Uiteraard is
het systeem nog in ontwikkeling – volgens de betrokken onderzoekers en programmeurs is deze
versie dan ook meer als proof of principle te beschouwen dan als een definitief product. Dat wil
zeggen, als bewijs dat het mogelijk is om diverse domeinen adaptief te meten. De eerste resultaten
van de pilot wijzen verder uit dat CATja toegevoegde waarde heeft voor de patiënten die er gebruik
van hebben gemaakt en voor de dagelijkse praktijk van huisartsen en POH’s GGZ. CATja zal verder
worden ontwikkeld. Ten eerste willen we graag een aantal modules toevoegen. Er ligt al een
concreet plan voor een module Gezonde leefstijl die de facetten alcohol- en middelengebruik,
beweging, eetgewoonten en slaappatronen zal bevatten. Daarnaast willen we graag een module
toevoegen waarmee de effecten van vroege traumatische ervaringen in kaart gebracht kunnen
worden. Voorts denken wij aan een module voor de detectie van autisme spectrum stoornissen, en
aan een module die zich richt op ADHD. Verder bestaan er plannen om het rapportgedeelte uit te
breiden. Zo willen we graag concrete behandelopties koppelen aan specifieke scoreprofielen, en een
rapportage-module voorbereiden voor de cliënt zelf. Tevens zal er de mogelijkheid komen om
cliënten herhaaldelijk te testen waardoor de ontwikkeling van symptoomprofielen door de tijd heen
(intake, post-treatment en follow-up bijvoorbeeld) als ook de berekening van verschilscores mogelijk
gemaakt zullen worden. Dit biedt interessante mogelijkheden voor (kosten)effectiviteitsstudies van
behandelpakketten en interventies, en gefundeerde keuzes in de inzet van bepaalde interventies. De

523226-L-bw-Bebber523226-L-bw-Bebber523226-L-bw-Bebber523226-L-bw-BebberProcessed on: 27-8-2018Processed on: 27-8-2018Processed on: 27-8-2018Processed on: 27-8-2018 PDF page: 171PDF page: 171PDF page: 171PDF page: 171
159
preventie van aandoeningen in vroege stadia van hun ontwikkeling is een ander zeer belangrijk
aspect van de meerwaarde die deze screener kan opleveren.

523226-L-bw-Bebber523226-L-bw-Bebber523226-L-bw-Bebber523226-L-bw-BebberProcessed on: 27-8-2018Processed on: 27-8-2018Processed on: 27-8-2018Processed on: 27-8-2018 PDF page: 172PDF page: 172PDF page: 172PDF page: 172
160

523226-L-bw-Bebber523226-L-bw-Bebber523226-L-bw-Bebber523226-L-bw-BebberProcessed on: 27-8-2018Processed on: 27-8-2018Processed on: 27-8-2018Processed on: 27-8-2018 PDF page: 173PDF page: 173PDF page: 173PDF page: 173
161
Dankwoord
Uiteraard heb ik een groot aantal mensen te danken die mij op verschillende manieren ondersteund hebben in de totstandkoming van dit proefschrift. Allereerst gaat mijn dank uit naar mijn promotor Rob Meijer en mijn copromotoren Hanneke Wigman en Lex Wunderink. Rob, je was een van de eerste die mij weer de hand gereikt heeft toen ik terug was uit Griekenland. En Lex, je bent me altijd blijven steunen. Dit zal ik jullie nooit vergeten. Hanneke, je hebt heel veel tijd en moeite gestoken in de verbetering van mijn schriftelijke uitdrukkingsvaardigheid in het Engels. En jouw klinische kennis is een onmisbare bijdrage geweest voor de totstandkoming van dit proefschrift.
Voorts gaat mijn dank uit aan Peter de Jonge, die zich niet heeft laten afschrikken door het feit, dat mijn mobiele nummer op de sollicitatiebrief elf nummers lang was, en ik niet op de uitnodiging voor een sollicitatiegesprek gereageerd heb. En mij alsnog de kans hebt gegeven te promoveren. Ook wil ik graag Sjoerd Sytema bedanken van wie ik veel waardevolle feedback op mijn onderzoeksvoorstellen en op mijn papers heb ontvangen. Sjoerd, die letzte Schlacht gewinnen wir!
Daarnaast ben ik dank verschuldigd aan Karel Kroese en Rivka de Vries die de eigenlijke engine achter CATja in R geprogrammeerd hebben. En niet te vergeten ook de inzet van Tim Rasveldt en Arnold van der Meulen die de nodige interfaces voor CATja in Ruby on rails geprogrammeerd hebben.
Graag wil ik ook mijn dank uitspreken naar Mark van der Gaag (Parnasia), Bart Schrieken en Jojanneke Broeksteeg (Interapy) voor het feit dat ik de gegevens die zij over jaren verzameld hebben voor dit proefschrift mocht gebruiken, en die mij de gelegenheid geboden hebben een kijkje in de keuken van een eHealth provider te nemen.
Voorts wil ik graag een aantal medeauteurs in het bijzonder noemen. Ten eerste Jorge Tendeiro. Ik heb veel van jou geleerd. Ook wat lesgeven betreft. Ten tweede Marieke Wichers, dank voor jouw bijdrage aan mijn ontwikkeling! Ten derde Gerard Flens, nogmaals van harte bedankt dat ik voor ons PROMIS paper gebruik mocht maken van de gegevens die jij verzameld hebt. En uiteraard ook voor al jouw waardevolle suggesties. Niet te vergeten onze gesprekken over muziek .
Daarnaast hoor ik ook de naam van Susan Niessen te vermelden die mij bij veel organisatorische klussen rond het samenstellen van dit proefschrift en het plannen van de verdediging heeft geholpen.
Ook wil ik mijn dank uitspreken naar Margo Jongsma, de secretaresse van het ICPE, die mij vanaf het begin bij heel veel dingen op weg heeft geholpen hier in het UMCG, en die altijd beschikbaar is geweest voor een motiverend praatje.
Last but zeker not least wil ik ook graag mijn dank uitspreken aan al mijn vrienden en aan mijn familie. In het bijzonder wil ik hier Martijn Corte noemen, die de laatste twee jaar ervoor gezorgd heeft dat ik ‘am Ball geblieben bin’. Ook Lucas Ypey heeft op zijn manier een bijdrage geleverd door mij met een open houding te bejegenen. Ik zal onze gesprekken over God, het geloof en de wereld niet vergeten, en ik hoop dat het goed met je gaat in het nieuwe leven dat voor jou pas net begonnen is. Ook al had je je dit anders voorgesteld. En hier hoort ook de naam van mijn ex-vriendin Muirne Paap vermeld te worden bij wie ik altijd terecht kon voor advies, en die mij met vele belangrijke spelers in het veld in contact heeft gebracht. Voorts verdient mijn moeder het om in het bijzonder genoemd te worden, want zij is altijd in mij blijven geloven, en heeft zich altijd ervoor ingezet om ok mijn vader ervan te overtuigen mij te blijven steunen. Atom Heart Mother!

523226-L-bw-Bebber523226-L-bw-Bebber523226-L-bw-Bebber523226-L-bw-BebberProcessed on: 27-8-2018Processed on: 27-8-2018Processed on: 27-8-2018Processed on: 27-8-2018 PDF page: 174PDF page: 174PDF page: 174PDF page: 174
162

523226-L-bw-Bebber523226-L-bw-Bebber523226-L-bw-Bebber523226-L-bw-BebberProcessed on: 27-8-2018Processed on: 27-8-2018Processed on: 27-8-2018Processed on: 27-8-2018 PDF page: 175PDF page: 175PDF page: 175PDF page: 175
163
Curriculum Vitae
Contact details
Name: Jan van BebberAddress: Kleine Rozenstraat 34
9712 TM GroningenPhone: +31-625588515e-mail: [email protected]
[email protected] date: 24-03-1979
Educational program & courses
1999 Highschool degree at Städtisches Stiftsgymnasium Xanten, Germany
2000-2007 Psychology at the University of Groningen (RuG)Master degrees in Differential Psychology and Industrial &Organizational PsychologyMinor in Methodology & StatisticsBachelor thesis: Second generation immigrants and testbias(Tellegen & van Bebber, 2003)Master thesis: Validation competence profiles for temporary employees (Schellekens, van Bebber, et al., 2006)
2013 Registerpsycholoog Arbeids- & Organisatiepsychologie Dutch Psychological Association (NIP)
2014-2018 PhD at the Interdisciplinary Center for Psychopathology and Emotion Regulation of the University Medical Center Groningen
2009 Course OPLM RCEC (Cito & University of Twente)2014 Course Publishing in English
2014-2016 Project Management (UMCG)2015 ICO-course Analysis of Measurement instruments (Cees Glas)2016 Mixed Models for Clustered Data (UMCG)2016 Longitudinal Data Analysis (UMCG)2016 University Teaching Skills (University of Groningen)2016 Health Psychology - Theory, research and practice2017 Science Writing course (UMCG)
2017-2018 University Teaching Qualification
523226-L-bw-Bebber523226-L-bw-Bebber523226-L-bw-Bebber523226-L-bw-BebberProcessed on: 27-8-2018Processed on: 27-8-2018Processed on: 27-8-2018Processed on: 27-8-2018 PDF page: 176PDF page: 176PDF page: 176PDF page: 176
164
Work experience
1999-2000 Civilian service (instead of military service in Germany),Geriatric department Marienhospital Cologne, Germany.Elderly care and facilitating the rehabilitation of patients.
2006 Internship at the Dutch Employee Insurance Company (UWV),Member project group Job date. Validating Schelleken’s competence profiles in long-term unemployed citizens.
2007-2014 From August 2007 until March 2014, I was working as a psychometrician and methodologist at Meurs HRM (now eello). Within the Research & Development team, my primary responsibility was the ´evolution´ of existing intelligence scales. In particular, for the subtests number series and verbal analogies, I was investigating how certain item characteristics influence psychometric properties (item difficulty and power) of test items. The results of this work were then used to write algorithms for automatic item generation. Furthermore, I spend a substantive part of my working hours on performing IRT-analyses, aiming at calibrating sufficient amounts of items so that these could be used in computerized adaptive tests that would replace the existing linear tests in the long run.The validation of existing instruments that were used for personnel selectionand career advising was the second core responsibility of my employment at Meurs HRM. More specifically, I wrote the research reports for the Q1000 Capaciteiten Hoog (an intelligence test battery for test takers with an educational background of applied sciences or above) and for the Q1000 Drijfveren (a motivational profile) These reports were evaluated by the Dutch Testing Agency (COTAN, Dutch Association of Psychologists) in order to get these instruments certified.Meurs HRM solely delivers computerized test batteries for online environments, so communication and coordinating tasks and responsibilities with our IT department was an important aspect of my work as well.In 2012 and 2013, in order to enlarge my own expertise, I spent approximately half a day on a weekly basis on evaluating and rating job candidates’ behavior during structured interviews and role plays that were part of assessments procedures.
2013 Evaluation of Schuhfried’s Tower of London test (Freiburg version) based on the criteria of the Dutch Testing Agency (COTAN).
2014-2018 PhD-candidate at the University Medical Center Groningen (UMCG),Interdisciplinary Center for Psychopathology and Emotion Regulation.Development of a computerized adaptive test battery to screen clients in general practices for various forms of psychopathology and for assessing clients’ need for treatment: CATja (https://catja.roqua.nl/). My thesis has been approved already and I will defend it 24th of September this year. My appointment with the UMCG ends July, 31.
2016 German translation of the Auditory vocal hallucination rating scale (AVHRS) developed by Jenner & Van de Willige, 2002

523226-L-bw-Bebber523226-L-bw-Bebber523226-L-bw-Bebber523226-L-bw-BebberProcessed on: 27-8-2018Processed on: 27-8-2018Processed on: 27-8-2018Processed on: 27-8-2018 PDF page: 177PDF page: 177PDF page: 177PDF page: 177
165
Publications
2011 Paap, M.C.S., Meijer, R.R., van Bebber, et al. (2011). A Study on the dimensionality and measurement precision of the SCL-90-R using Item Response Theory. International Journal of Methods in Psychiatric Research 20 (3), e39-e55.
2017 van Bebber, J., Wigman, J.T.W., Meijer, R.R., et al. (2017). The Prodromal Questionnaire: A case for IRT-based adaptive testing of psychotic experiences? International Journal of Methods in Psychiatric Research 26 (2).
2017 van Bebber, J., Wigman, J.T.W., Wunderink, L. et al. (2017). Identifying levels of general distress in first line mental health services: Can GP- and eHealth clients’ scores be meaningfully compared? BMC Psychiatry 17 (1), 382.
2018 van Bebber, J., Meijer, R.R., Wigman, J.T.W., et al. (2018). A Smart
Screening Device for Patients with Mental Health Problems in Primary Health Care: Development and Pilot Study. JMIR mental health, 5(2), e41.
2018 van Bebber, J., Flens, G., Wigman, J.T.W., et al. (2018) Application of the Patient-Reported Outcomes Measurement Information System (PROMIS) item parameters for Anxiety and Depression in the Netherlands. Revision accepted for publication in International Journal of Methods in Psychiatric Research.
2018 Wunderink, L. van Bebber, J, Sytema, S., et al. (2018). Predicting Relapse and Outcome in First Episode Psychosis: Impact of Negative Symptoms, and Personalized Low Dose versus Maintenance Antipsychotic Treatment.Submitted for publication in Lancet psychiatry.
Presentations
2012 Poster presentation at the conference of the International Testing Commission (ITC), Amsterdam.
2015 Oral presentation at the spring congress of the Dutch association of psychiatry, Maastricht
2017 Oral presentation at the conference of the Psychometric Society, Zürich.2017 Oral presentation at the conference of the European Network for Mental Health
Service Evaluation (ENMESH), Groningen.

523226-L-bw-Bebber523226-L-bw-Bebber523226-L-bw-Bebber523226-L-bw-BebberProcessed on: 27-8-2018Processed on: 27-8-2018Processed on: 27-8-2018Processed on: 27-8-2018 PDF page: 178PDF page: 178PDF page: 178PDF page: 178
166
Teaching experience
2012 Guest lectures for the bachelor course Test theory at the University of Twente. The first lecture was about the role and responsibilities of the Dutch testing agency in the Netherlands. The second lecture was on various types of norms for psychological tests and questionnaires.
2015-2016 Tutoring and grading assignments for the courses Statistics 3 and Test Theory at the faculty of behavioral and social sciences, department ofpsychology, University of Groningen.
2016 Guest lecture Real Data Simulations for the master course Item Response Theory at the psychology department of the University of Groningen.
2017 Lecture for the bachelor course Test theory at the University of Groningen. During the first part of the lecture, I discussed the assignment on Factor Analysis that students had to do in order to be allowed to take the final examination at the end of the course. The second half of the lecture was about my PhD-project, especially the application that we build for use in primary care in the Netherlands (CATja).
2017 Individual supervision of a student from applied psychology during her internship (pilot CATja & study on usability of the application) at our department and individual supervision of another student from management science (bachelor thesis, creation of a business case for CATja).
Proficiencies
Fluent in written and spoken English, German and Dutch.Basic skills in (re)design of courses.Experience with lecturing, mentoring, and individual supervision of students.Experience with grading and course evaluation.Good social skills, cultural awareness.Skilled with SPSS, Mplus, MIRT, IRTPRO & R. Experienced with MS Word, Excel, & Power Point.
Hobbies
Music, reading, sports (running, work out, badminton & squash), dancing,and strategic games.

523226-L-bw-Bebber523226-L-bw-Bebber523226-L-bw-Bebber523226-L-bw-BebberProcessed on: 27-8-2018Processed on: 27-8-2018Processed on: 27-8-2018Processed on: 27-8-2018 PDF page: 179PDF page: 179PDF page: 179PDF page: 179
167
References
Wouter Lucassen Former team manager at Meurs HRM. [email protected](+31) 622500121
Rob Meijer Promoter & Head of the department of statistics and [email protected] psychometrics at the faculty of social sciences of(+31) 624611170 the University of Groningen.
Lex Wunderink Project manager during my PhD-project & lex.wunderink@ psychiatrist at the Friesland Mental Health Servicesggzfrieland.nl (GGZ Friesland).(+31) 6461 21136

523226-L-bw-Bebber523226-L-bw-Bebber523226-L-bw-Bebber523226-L-bw-BebberProcessed on: 27-8-2018Processed on: 27-8-2018Processed on: 27-8-2018Processed on: 27-8-2018 PDF page: 180PDF page: 180PDF page: 180PDF page: 180
168
Research Institute SHARE This thesis is published within the Research Institute SHARE (Science in Healthy Ageing and healthcaRE) of the University Medical Center Groningen / University of Groningen. Further information regarding the institute and its research can be obtained from our internet site: http://www.share.umcg.nl/ More recent theses can be found in the list below. ((co-) supervisors are between brackets)
2018 Miranda Azevedo R de Shades of blue; an epidemiological investigation of depressive symptom dimensions and the association with cardiovascular disease (prof P de Jonge, dr AM Roest) Pang C Computational methods for data discovery, harmonization and integration; using lexical and semantic matching with an application to biobanking phenotypes (prof MA Swertz, prof JL Hillege) Arifin B Distress and health-related quality of life in Indonesian Type 2 diabetes mellitus outpatients (prof MJ Postma, dr PJM Krabbe, dr J Atthobari) Zakiyah N Women’s health from a global economic perspective (prof MJ Postma, dr ADI van Asselt) Metting, EI Development of patient centered management of asthma and COPD in primary care (prof T van der Molen, prof R Sanderman, dr JWH Kocks) Scheffers WJ Body experience in patients with mental disorders (prof RA Schoevers, dr JT van Busschbach, dr MAJ van Duijn) Suhoyo Y Feedback during clerkships: the role of culture (prof JBM Kuks, prof J Cohen-Schotanus, dr J Schönrock-Adema) Kikkert LHJ Gait characteristics as indicators of cognitive impairment in geriatric patients (prof T Hortobagyi, dr CJ Lamoth, dr N Vuillerme) Veen HC van der Articulation issues in total hip arthroplasty (prof SK Bulstra, dr JJAM van Raay, dr IHF Reininga, dr I van den Akker-Scheek) Elsenburg LK Adverse life events and overweight in childhood, adolescence and young adulthood (prof AC Liefbroer, dr N Smidt) Becking K Inflammatory matters; exploring the underlying pathophysiology of unipolar and bipolar disorder (prof RA Schoevers, dr BCM Haarman)

523226-L-bw-Bebber523226-L-bw-Bebber523226-L-bw-Bebber523226-L-bw-BebberProcessed on: 27-8-2018Processed on: 27-8-2018Processed on: 27-8-2018Processed on: 27-8-2018 PDF page: 181PDF page: 181PDF page: 181PDF page: 181
169
‘t Hoen EFM Practical applications of the flexibilities of the agreement on trade-related aspects of intellectual property rights; lessons beyond HIV for access to new essential medicines (prof HV Hogerzeil, prof BCA Toebes) Stojanovska V Fetal programming in pregnancy-associated disorders; studies in novel preclinical models (prof SA Scherjon, dr T Plösch) Eersel MEA van The association of cognitive performance with vascular risk factors across adult life span (prof JPJ Slaets, dr GJ Izaks, dr JMH Joosten) Rolfes L Patient participation in pharmacovigilance (prof EP van Puijenbroek, prof K Taxis, dr FPAM van Hunsel) Brandenbarg D The role of the general practitioner in the care for patients with colorectal cancer (prof MY Berger, prof GH de Bock, dr AJ Berendsen) Oldenkamp M Caregiving experiences of informal caregivers; the importance of characteristics of the informal caregiver, care recipient, and care situation (prof RP Stolk, prof M Hagedoorn, prof RPM Wittek, dr N Smidt) Kammen K van Neuromuscular control of Lokomat guided gait; evaluation of training parameters (prof LHV van der Woude, dr A den Otter, dr AM Boonstra, dr HA Reinders-Messelink) Hornman J Stability of development and behavior of preterm children (prof SA Reijneveld, prof AF Bos, dr A de Winter) Vries, YA de Evidence-b(i)ased psychiatry (prof P de Jonge, dr AM Roest) Smits KPJ Quality of prescribing in chronic kidney disease and type 2 diabetes (prof P denig, prof GJ Navis, prof HJG Bilo, dr GA Sidorenkov) Zhan Z Evaluation and analysis of stepped wedge designs; application to colorectal cancer follow-up (prof GH de Bock, prof ER van den Heuvel) For more 2018 and earlier theses visit our website

523226-L-bw-Bebber523226-L-bw-Bebber523226-L-bw-Bebber523226-L-bw-BebberProcessed on: 27-8-2018Processed on: 27-8-2018Processed on: 27-8-2018Processed on: 27-8-2018 PDF page: 182PDF page: 182PDF page: 182PDF page: 182
170
I remember whips and chains -
I remember earth led pain -
I remember many things that make my soul wants to sin(g).
My singing soul, Ludovic Navarre
We are all brothers born from different mothers.
Gambian wisdom