Computerized Oral Proficiency Test for Japanese - BYU ...
119
Brigham Young University Brigham Young University BYU ScholarsArchive BYU ScholarsArchive Theses and Dissertations 2011-07-08 Computerized Oral Proficiency Test for Japanese: Measuring L2 Computerized Oral Proficiency Test for Japanese: Measuring L2 Speaking Ability with ASR Technology Speaking Ability with ASR Technology Hitokazu Matsushita Brigham Young University - Provo Follow this and additional works at: https://scholarsarchive.byu.edu/etd Part of the Linguistics Commons BYU ScholarsArchive Citation BYU ScholarsArchive Citation Matsushita, Hitokazu, "Computerized Oral Proficiency Test for Japanese: Measuring L2 Speaking Ability with ASR Technology" (2011). Theses and Dissertations. 2691. https://scholarsarchive.byu.edu/etd/2691 This Thesis is brought to you for free and open access by BYU ScholarsArchive. It has been accepted for inclusion in Theses and Dissertations by an authorized administrator of BYU ScholarsArchive. For more information, please contact [email protected], [email protected].
-
Upload
khangminh22 -
Category
Documents
-
view
1 -
download
0
Transcript of Computerized Oral Proficiency Test for Japanese - BYU ...

Brigham Young University Brigham Young University
BYU ScholarsArchive BYU ScholarsArchive
Theses and Dissertations
2011-07-08
Computerized Oral Proficiency Test for Japanese: Measuring L2 Computerized Oral Proficiency Test for Japanese: Measuring L2
Speaking Ability with ASR Technology Speaking Ability with ASR Technology
Hitokazu Matsushita Brigham Young University - Provo
Follow this and additional works at: https://scholarsarchive.byu.edu/etd
Part of the Linguistics Commons
BYU ScholarsArchive Citation BYU ScholarsArchive Citation Matsushita, Hitokazu, "Computerized Oral Proficiency Test for Japanese: Measuring L2 Speaking Ability with ASR Technology" (2011). Theses and Dissertations. 2691. https://scholarsarchive.byu.edu/etd/2691
This Thesis is brought to you for free and open access by BYU ScholarsArchive. It has been accepted for inclusion in Theses and Dissertations by an authorized administrator of BYU ScholarsArchive. For more information, please contact [email protected], [email protected].

Computerized Oral Proficiency Test for Japanese: Measuring Second Language
Speaking Ability with ASR Technology
Hitokazu Matsushita
A thesis submitted to the faculty ofBrigham Young University
in partial fulfillment of the requirements for the degree of
Master of Arts
Deryle W. Lonsdale, ChairDan P. DeweyJ. Paul Warnick
Department of Linguistics and English Language
Brigham Young University
August 2011
Copyright © 2011 Hitokazu Matsushita
All Rights Reserved

ABSTRACT
byubaselinestretch2 Computerized Oral Proficiency Test for Japanese: MeasuringSecond Language Speaking Ability with ASR Technology
Hitokazu MatsushitaDepartment of Linguistics and English Language
Master of Arts
Developing a time- and cost-efficient method for second language (L2) oral pro-ficiency measurement is one of the research topics that has attracted much attention inrecent decades. The purpose of this study is to develop a computerized oral testing sys-tem for L2 Japanese using automatic speech recognition (ASR) technology. Two testingmethods called elicited imitation (EI) and simulated speech (SS) are proposed to quan-tify L2 accuracy and fluency via ASR processing. This study also suggests systematicEI item creation leveraging corpus technology and discusses the effectiveness of the testitems created through analyses of item difficulty. Further, refinement of the EI gradingsystem is described through a series of statistical investigations. For SS, this study re-ports the five most influential L2 fluency features identified through machine learningand proposes a method to yield individual SS scores with these features based on pre-vious studies. Lastly, several methods to combine the EI and SS scores are presented toestimate L2 oral proficiency of Japanese.
Keywords: L2 oral proficiency, EI, SS, ASR, computerized oral test


ACKNOWLEDGMENTS
I am deeply indebted to Dr. Deryle Lonsdale, my advisor and mentor. I would not
have been able to pursue this research without his guidance and help.
I would like to express my appreciation to my other committee members for their
advice and encouragement for this thesis project. I am grateful for all the instructors of
the Japanese program in the Department of Asian and Near Eastern Languages at BYU,
my ten research assistants, and Shinsuke Tsuchiya, my co-researcher, who coordinated
data collection, proctored test administration, conducted manual grading and transcrip-
tion, and provided valuable feedback on this research. I am also grateful for the technical
support provided by Devin Asay, Russell Hansen, and Sharon Boyle at the Humanities
and Technology and Research Support Center at BYU. They have offered me substantial
server space and allowed me to use their lab computers for data collection during these
two years. I would like to thank the Center for Language Studies for their generous sup-
port for OPI administration. I would also like to mention that this research was partially
funded by a grant from the U.S. Department of Education (International Research and
Studies Program, No. P017A080087).
I am deeply thankful for Lynne Hansen, my sponsor. I would not have been able
to reach this point without her considerable support for my schooling here at BYU.
I would like to thank my family for their support and love throughout my life. Es-
pecially, I would like to extend my deepest gratitude to Megumi, my wife, and Momoka,
Yamato and Sunao, my precious children, for their selfless sacrifice, patience, and love.


Table of Contents
List of Tables xii
List of Figures xiv
1 Introduction 1
1.1 Overview . . . . . . . . . . . . . . . . . . . . . . . . . . . . . . . . . . . . . . . 1
1.2 Problem: Quantification of Accuracy and Fluency Features . . . . . . . . . . 2
1.3 Solution: Separation of Accuracy and Fluency Measurement . . . . . . . . . 4
2 Review of Literature 7
2.1 Elicited Imitation . . . . . . . . . . . . . . . . . . . . . . . . . . . . . . . . . . 7
2.1.1 Basic Concept . . . . . . . . . . . . . . . . . . . . . . . . . . . . . . . . 7
2.1.2 Applications . . . . . . . . . . . . . . . . . . . . . . . . . . . . . . . . . 9
2.1.3 Computer Scoring . . . . . . . . . . . . . . . . . . . . . . . . . . . . . 11
2.2 Simulated Speech . . . . . . . . . . . . . . . . . . . . . . . . . . . . . . . . . . 13
2.2.1 Development . . . . . . . . . . . . . . . . . . . . . . . . . . . . . . . . 13
2.2.2 Computer Evaluation . . . . . . . . . . . . . . . . . . . . . . . . . . . 14
2.3 EI and SS: Testing Methods for Accuracy and Fluency Measures . . . . . . . 16
3 EI Item Creation 19
3.1 Systematic Item Creation . . . . . . . . . . . . . . . . . . . . . . . . . . . . . . 19
3.2 Previous Study . . . . . . . . . . . . . . . . . . . . . . . . . . . . . . . . . . . 20
vii

3.3 Syntactic and Semantic Features in Japanese . . . . . . . . . . . . . . . . . . 22
3.3.1 Noun-Modifying Clauses . . . . . . . . . . . . . . . . . . . . . . . . . 23
3.3.2 Embedded Clauses and pro-Drop . . . . . . . . . . . . . . . . . . . . . 25
3.3.3 Evidentiality . . . . . . . . . . . . . . . . . . . . . . . . . . . . . . . . . 27
3.3.4 Application of the Theoretical and Empirical Notions to Item Creation 28
3.4 Item Engineering Approach . . . . . . . . . . . . . . . . . . . . . . . . . . . . 29
3.5 Corpus-Based Approach . . . . . . . . . . . . . . . . . . . . . . . . . . . . . . 31
3.5.1 Prototype Generation . . . . . . . . . . . . . . . . . . . . . . . . . . . 33
3.5.2 Corpus Processing . . . . . . . . . . . . . . . . . . . . . . . . . . . . . 34
3.5.3 Selection / Adaptation . . . . . . . . . . . . . . . . . . . . . . . . . . . 35
3.6 Item Effectiveness Analyses . . . . . . . . . . . . . . . . . . . . . . . . . . . . 37
3.6.1 Method . . . . . . . . . . . . . . . . . . . . . . . . . . . . . . . . . . . . 37
3.6.2 Factorial ANOVA . . . . . . . . . . . . . . . . . . . . . . . . . . . . . . 38
3.6.3 Rasch Model Analysis . . . . . . . . . . . . . . . . . . . . . . . . . . . 40
3.7 Discussion . . . . . . . . . . . . . . . . . . . . . . . . . . . . . . . . . . . . . . 41
4 Japanese EI Grading System and Results 45
4.1 System Development . . . . . . . . . . . . . . . . . . . . . . . . . . . . . . . . 45
4.2 System I: Grammar-Based Approach . . . . . . . . . . . . . . . . . . . . . . . 45
4.3 System II: Corpus-Based Approach . . . . . . . . . . . . . . . . . . . . . . . . 49
4.4 System III: Analogical-Modeling Approach . . . . . . . . . . . . . . . . . . . 54
4.4.1 AM-Generated Corpora: AM as a “Virtual” Learner . . . . . . . . . . 54
4.4.2 System Components . . . . . . . . . . . . . . . . . . . . . . . . . . . . 57
4.4.3 Method . . . . . . . . . . . . . . . . . . . . . . . . . . . . . . . . . . . . 59
4.4.4 Results . . . . . . . . . . . . . . . . . . . . . . . . . . . . . . . . . . . . 60
viii

4.5 Discussion . . . . . . . . . . . . . . . . . . . . . . . . . . . . . . . . . . . . . . 62
5 Japanese Simulated Speech and its Combination with EI 65
5.1 Japanese Simulated Speech: Basic Approach . . . . . . . . . . . . . . . . . . 65
5.2 SS Test Items . . . . . . . . . . . . . . . . . . . . . . . . . . . . . . . . . . . . . 66
5.3 Method . . . . . . . . . . . . . . . . . . . . . . . . . . . . . . . . . . . . . . . . 68
5.4 Analysis . . . . . . . . . . . . . . . . . . . . . . . . . . . . . . . . . . . . . . . 71
5.4.1 First Stage: Machine Learning Process . . . . . . . . . . . . . . . . . . 71
5.4.2 Second Stage: Score Generation . . . . . . . . . . . . . . . . . . . . . . 74
5.4.3 Results . . . . . . . . . . . . . . . . . . . . . . . . . . . . . . . . . . . . 76
5.5 Combination of EI and SS Scores . . . . . . . . . . . . . . . . . . . . . . . . . 78
6 Conclusion 83
6.1 Significance of This Study . . . . . . . . . . . . . . . . . . . . . . . . . . . . . 83
6.2 Limitations of This Study . . . . . . . . . . . . . . . . . . . . . . . . . . . . . 85
6.3 Future Work . . . . . . . . . . . . . . . . . . . . . . . . . . . . . . . . . . . . . 86
6.3.1 Manual Transcription Tool . . . . . . . . . . . . . . . . . . . . . . . . . 86
6.3.2 SS Scoring Improvement . . . . . . . . . . . . . . . . . . . . . . . . . . 87
6.3.3 Simultaneous EI/SS Scoring . . . . . . . . . . . . . . . . . . . . . . . . 87
6.3.4 Acoustic Model Training . . . . . . . . . . . . . . . . . . . . . . . . . . 88
6.3.5 Language Model Training for SS grading . . . . . . . . . . . . . . . . 88
6.3.6 EI Item Creation Tool . . . . . . . . . . . . . . . . . . . . . . . . . . . . 89
6.4 Comprehensive EI/SS Schema . . . . . . . . . . . . . . . . . . . . . . . . . . 89
References 91
A EI Graders 101
ix

B Decision Trees 103
x
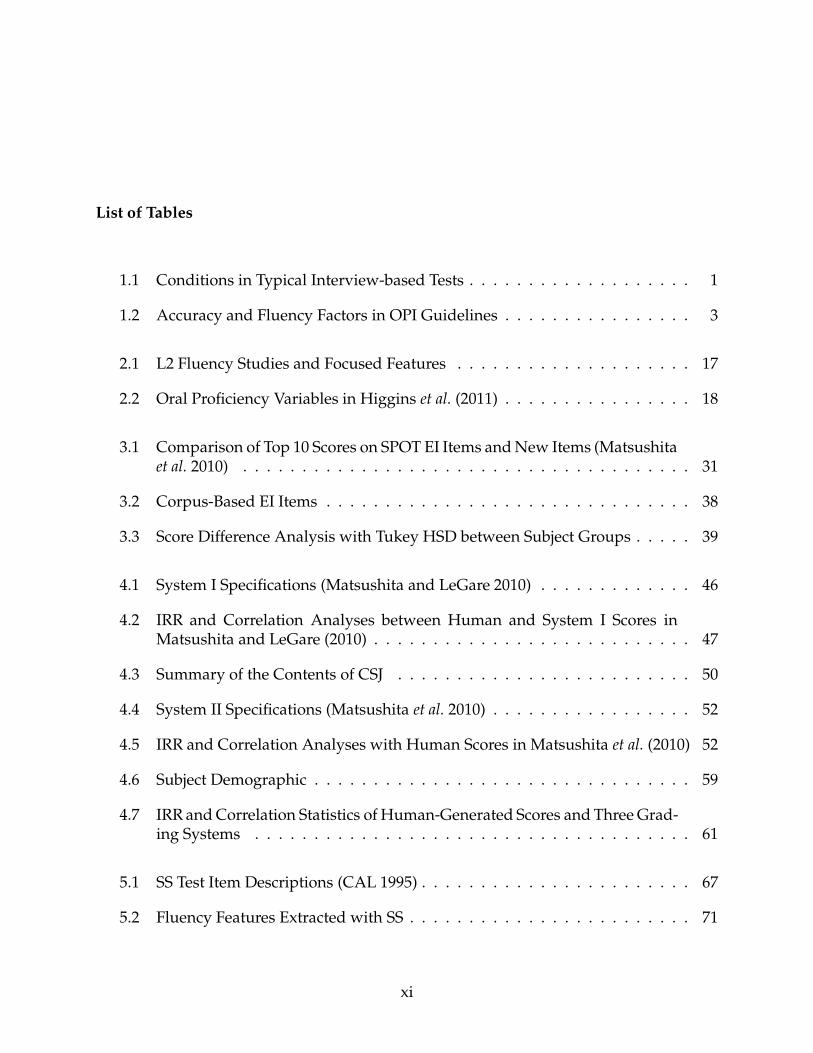
List of Tables
1.1 Conditions in Typical Interview-based Tests . . . . . . . . . . . . . . . . . . . 1
1.2 Accuracy and Fluency Factors in OPI Guidelines . . . . . . . . . . . . . . . . 3
2.1 L2 Fluency Studies and Focused Features . . . . . . . . . . . . . . . . . . . . 17
2.2 Oral Proficiency Variables in Higgins et al. (2011) . . . . . . . . . . . . . . . . 18
3.1 Comparison of Top 10 Scores on SPOT EI Items andNew Items (Matsushitaet al. 2010) . . . . . . . . . . . . . . . . . . . . . . . . . . . . . . . . . . . . . . 31
3.2 Corpus-Based EI Items . . . . . . . . . . . . . . . . . . . . . . . . . . . . . . . 38
3.3 Score Difference Analysis with Tukey HSD between Subject Groups . . . . . 39
4.1 System I Specifications (Matsushita and LeGare 2010) . . . . . . . . . . . . . 46
4.2 IRR and Correlation Analyses between Human and System I Scores inMatsushita and LeGare (2010) . . . . . . . . . . . . . . . . . . . . . . . . . . . 47
4.3 Summary of the Contents of CSJ . . . . . . . . . . . . . . . . . . . . . . . . . 50
4.4 System II Specifications (Matsushita et al. 2010) . . . . . . . . . . . . . . . . . 52
4.5 IRR and Correlation Analyses with Human Scores in Matsushita et al. (2010) 52
4.6 Subject Demographic . . . . . . . . . . . . . . . . . . . . . . . . . . . . . . . . 59
4.7 IRR andCorrelation Statistics of Human-Generated Scores and Three Grad-ing Systems . . . . . . . . . . . . . . . . . . . . . . . . . . . . . . . . . . . . . 61
5.1 SS Test Item Descriptions (CAL 1995) . . . . . . . . . . . . . . . . . . . . . . . 67
5.2 Fluency Features Extracted with SS . . . . . . . . . . . . . . . . . . . . . . . . 71
xi

5.3 TiMBL Results . . . . . . . . . . . . . . . . . . . . . . . . . . . . . . . . . . . . 73
5.4 WEKA Results . . . . . . . . . . . . . . . . . . . . . . . . . . . . . . . . . . . . 74
5.5 Features of Regression Model andMathematical Treatment in Higgins et al.(2011) . . . . . . . . . . . . . . . . . . . . . . . . . . . . . . . . . . . . . . . . . 75
5.6 SS Score Generation Factors . . . . . . . . . . . . . . . . . . . . . . . . . . . . 75
xii

List of Figures
1.1 Basic Concept of the Proposed Computerized Testing System . . . . . . . . 5
2.1 EI Processing Model . . . . . . . . . . . . . . . . . . . . . . . . . . . . . . . . 8
3.1 New and Old Item Score Comparison (Matsushita et al. 2010) . . . . . . . . . 30
3.2 Schema of Corpus-Based Item Creation . . . . . . . . . . . . . . . . . . . . . 32
3.3 ChaKi.NET . . . . . . . . . . . . . . . . . . . . . . . . . . . . . . . . . . . . . . 32
3.4 Internally Headed Relative Clause of Japanese (Matsushita et al. 2010) . . . 33
3.5 Example of Dependency Search Query . . . . . . . . . . . . . . . . . . . . . . 34
3.6 Center-Embedded Clause Sentence as an EI Item . . . . . . . . . . . . . . . . 35
3.7 Graphical Diagram of an EI Item with Center-Embedded Clause Structure . 36
3.8 Interaction of Subject and Item Levels . . . . . . . . . . . . . . . . . . . . . . 39
3.9 Alternative EI Testing Approach . . . . . . . . . . . . . . . . . . . . . . . . . 40
3.10 Item Information Criteria Analyses of Corpus-Based Items . . . . . . . . . . 42
4.1 Regression Analysis of Matsushita and LeGare (2010) . . . . . . . . . . . . . 48
4.2 Distribution of System I and Human Scores (Matsushita and LeGare 2010) . 49
4.3 Format Conversion of CSJ Data . . . . . . . . . . . . . . . . . . . . . . . . . . 51
4.4 Regression Analyses of Matsushita et al. (2010) . . . . . . . . . . . . . . . . . 53
4.5 Distribution of System II and Human Scores (Matsushita et al. 2010) . . . . . 53
4.6 AM-Based Learner Corpus Creation (Matsushita and Tsuchiya 2011) . . . . 56
4.7 Screenshot of AM Exemplars . . . . . . . . . . . . . . . . . . . . . . . . . . . 57
xiii

4.8 Example of AM-Generated Learner Corpus . . . . . . . . . . . . . . . . . . . 58
4.9 System III Schema (Matsushita and Tsuchiya 2011) . . . . . . . . . . . . . . . 58
4.10 EI Tester . . . . . . . . . . . . . . . . . . . . . . . . . . . . . . . . . . . . . . . 60
4.11 Regression and Score Distribution Analyses of System III . . . . . . . . . . . 61
4.12 System III and Item Development Cycle . . . . . . . . . . . . . . . . . . . . . 62
4.13 Combination of Corpus-Based Item Creation and System III . . . . . . . . . 63
5.1 Screenshot of Computer-Based Japanese SS Test . . . . . . . . . . . . . . . . 69
5.2 Screenshots of Dictated Speech Samples . . . . . . . . . . . . . . . . . . . . . 70
5.3 TiMBL Feature Vectors . . . . . . . . . . . . . . . . . . . . . . . . . . . . . . . 72
5.4 Pause Count Distribution . . . . . . . . . . . . . . . . . . . . . . . . . . . . . 76
5.5 SS Score Distribution . . . . . . . . . . . . . . . . . . . . . . . . . . . . . . . . 77
5.6 SS Total Score Differences . . . . . . . . . . . . . . . . . . . . . . . . . . . . . 78
5.7 Scatterplot of EI and SS Scores . . . . . . . . . . . . . . . . . . . . . . . . . . . 79
5.8 Discrete Scoring and OPI Ratings . . . . . . . . . . . . . . . . . . . . . . . . . 81
5.9 Approximate OPI Rating Distribution in EI–SS Scoring Method . . . . . . . 81
6.1 Comprehensive Schema of Computerized Japanese Oral Testing System . . 90
A.1 ASR and Human Graders . . . . . . . . . . . . . . . . . . . . . . . . . . . . . 101
B.1 Decision Tree for All 12 Features . . . . . . . . . . . . . . . . . . . . . . . . . 103
B.2 Decision Tree for 5 Selected Features . . . . . . . . . . . . . . . . . . . . . . . 104
xiv

Chapter 1
Introduction
1.1 Overview
Development of a reliable and time-efficient second language (L2) oral proficiency
test is currently of great interest in the field of language testing. The main reason for this
motivation is because a common approach in L2 speaking assessment is to interview a
learner. Measuring speaking ability per this approach involves complex processes: (1) a
test taker must be able to produce speech samples recorded for evaluation, and (2) two or
three human evaluators typically listen to the collected speech samples to evaluate oral
proficiency based on a stipulated rubric, and raters’ judgments are averaged to produce
a single score. Regarding (1) and (2), the following conditions exist during test adminis-
tration and evaluation from testers’ and test takers’ perspectives.
Table 1.1: Conditions in Typical Interview-based Tests (cf. Newfields 1994)
Tester Test Taker
Test Administration Needs substantial amount oftime to test multiple test tak-ers
Needs to be well-informedabout the testing procedure
Test Evaluation
Needs to be well-trained toyield consistent scores or rat-ings based on a rubric in ashort time
Needs to wait longer to ob-tain a score or rating andfeedback with receptive skilltests
As Table 1.1 above indicates, using interview-based tests requires a great deal of
work and time for both testers and test takers. Considering this situation, the grading
process is especially labor-intensive because a rating is produced through averaging two
1

or three raters’ respective judgments, as mentioned above. Because of this complexity, it
is necessary that the raters spend substantial time to yield well-justified ratings. How-
ever, this is not acceptable in most language institutions because of the time constraints
and the limited availability of qualified raters. Therefore, administering interviews is
very difficult, especially in programs for less commonly taught languages, due to limited
resources, although it is essential to examine students’ oral skill development regularly
(Kenyon and Malabonga 2001).
Another issue is the cost of commercially available interview tests. For instance,
oral proficiency interviews (OPIs), provided by Language Testing International (LTI), are
widely administered tests which have been regarded as a recognized standard for mea-
suring oral proficiency of various target languages. However, the administration of OPIs
is very costly: a single OPI costs approximately 130 US dollars for a 30-minute interview
and evaluation1. Because of the cost, the OPI is regarded as a high-stakes test for learners
to demonstrate their L2 oral proficiency for official documentation. Therefore, the OPI is
not necessarily suitable to assess L2 speaking ability regularly at language institutions for
formative and summative purposes.
To develop a cost- and time-efficient test, it is crucial to identify the problems re-
lated to L2 oral proficiency measurement. Furthermore, it is inevitable to utilize some
sort of computer technology to realize such efficiency. In the following section, I will fo-
cus on two important aspects that are frequently discussed in studies on L2 oral language
production, namely, accuracy and fluency.
1.2 Problem: Quantification of Accuracy and Fluency Features
Accuracy and fluency in speech production are essential constructs in measuring
L2 oral proficiency (Housen and Kuiken 2009), and many oral proficiency tests take these
constructs into account in the test development and evaluation processes (e.g., the Test of
Spoken English (TSE) Scale by the Educational Testing Service (ETS); Common European
Framework of Reference (CEF) of Council of Europe; see Luoma 2004 for more detail). For
example, the OPI guidelines (ACTFL 1999) incorporate accuracy and fluency factors in the
1See http://www.languagetesting.com for more detail.
2

descriptions of its rating scale. Table 1.2 enumerates the representative characteristics of
L2 accuracy and fluency pointed out in the OPI guidelines:
Table 1.2: Accuracy and Fluency Factors in OPI Guidelines
Accuracy Features Fluency Features
pronunciation hesitation patternsvocabulary choice turn taking
(morpho-)syntactic formation length of a narrationdiscourse structures discourse management
These accuracy and fluency factors are further explained in detail for the basis
of final ratings2 in the evaluation procedure. As one can imagine, interpreting these
descriptions accurately and generating ratings which are consistent with other evalua-
tors requires substantial experience because this type of grading procedure is inevitably
subjective (McNamara 2000). Moreover, the manifestation of accuracy and fluency fea-
tures can be quite different in every interview because the topics to be covered are de-
termined during the initial conversation according to several factors such as test takers’
background, and thus the linguistic information gained in an interview is basically un-
predictable before it starts. Therefore, multiple raters are inevitably necessary to ensure
the high stability of ratings in such disparate testing and grading procedures (Hughes
2003).
The first problem that needs to be addressed in this study is to obtain accuracy and
fluency features in a quantifiable manner for the development of an efficient oral test. For
this it is necessary to ensure that the testing system is able to retrieve these two types of
features from speech samples at a satisfatory level of precision consistently. However, this
problem highlights the limitation of current computer technology: It is not possible for a
computer system to handle speech samples with unpredictable language usage correctly,
2There are ten sublevels in OPI: Namely, Superior, Advanced(High, Mid, Low), Intermediate(High, Mid,Low), and Novice(High, Mid, Low). For raters’ final judgment, detailed descriptions on expected perfor-mance in each sublevel are provided.
3

because the performance depends largely on language data, or corpora, provided for the
system training (Nagatomo et al. 2001). In other words, the level of precision in speech
processing with computers is likely to be very limited if the input speech samples are out-
side the domain of the language data. This situation is highly probable in this study, and
in particular, it makes obtaining reliable accuracy features very difficult, because of the
nature of L2 speakers’ speech samples, which are more unpredictable and unorganized
than first language (L1) speakers’.
1.3 Solution: Separation of Accuracy and Fluency Measurement
The computerized oral proficiency test proposed in this study is not designed to
function with speech samples collected from random topics because of the limitation of
speech processing technology. Thus, it is imperative to use more rigidly regulated test-
ing methods than the interview-based counterpart so that the system can successfully
obtain and process the structured speech data to extract accuracy and fluency features.
To accomplish this, I propose a testing system using two objective testing methods called
elicited imitation (EI) and simulated speech (SS). This approach has two advantages: (1)
it limits the variety of learners’ speech samples obtained in the testing phase in order
to make feature extraction more manageable with the computer system, (2) it allows the
computer system to be trained in a domain-specific manner according to the employed
testing methods and to process the speech samples in an analytic manner. Figure 1.1
shows the basic concept of this approach.
The main purpose of this study is (1) to develop a fully computerized oral testing
system for L2 Japanese using automatic speech recognition (ASR) technology (Jurafsky
and Martin 2008), (2) to inform systematic EI test item creation with corpus data, and (3)
to evaluate learners’ test performance with the EI and SS grading results provided by the
system. My approach, however, does not aim to implement the same testing and grading
procedures as in interview-based exams, because of the limitation of speech recognition
technology mentioned above. The testing system I propose here contains the following
capability: (1) it handles multiple test takers concurrently with a computer-mediated test,
4

L2 Oral Proficiency
Elicited Imitation (EI) Simulated Speech (SS)
Computer Process Computer Process
Accuracy Features Fluency Features
Combined Oral Proficiency Measurement
Figure 1.1: Basic Concept of the Proposed Computerized Testing System
and (2) it extracts various linguistic features from collected speech samples without re-
quiring any human labor.
This thesis is organized as follows. In Chapter 2, I will explain the development
of EI as an accuracy measurement and SS as a fluency measurement, based on various
previous studies. In Chapter 3, the EI item creation procedure with corpus technology
will be discussed. In Chapter 4, the system development of the EI grading system will be
explained, based on our previous studies. In Chapter 5, I will describe the fluency feature
extraction with the grading system and the process of combining EI and SS results to
predict overall L2 oral proficiency. Chapter 6 will be the conclusion.
5

6

Chapter 2
Review of Literature
In this chapter, I will describe the development and analyses of EI and SS as viable
testing methods based on available literature. EI and SS have been investigated based
on fundamentally different backgrounds. The former has mainly been used in the fields
of language acquisition and psycholinguistics research for several decades as an effective
experimental data collection technique, whereas SS has been considered as an alternative
testing procedure to labor-intensive interview tests especially for less commonly taught
languages. In the following sections, I will explain the strengths of these methods through
previous studies and how these two can be combined to measure L2 oral proficiency with
ASR technology.
2.1 Elicited Imitation
2.1.1 Basic Concept
Elicited imitation (EI) has been receiving attention as a viable language testing
method in various fields, especially in second language acquisition (SLA). Although there
are some slight differences in administering EI among various studies, the basic proce-
dure of EI is as follows:
The procedure involves preparing a stimulus string . . . that illustrates some
grammatical feature . . ., and subjects are instructed to repeat exactly what they
hear. (Chaudron 2003)
This simple process is repeated several times to collect multiple speech samples to exam-
ine whether the learner has acquired the target grammatical structures or lexical items
incorporated in the model sentences, based on the assumption that “success at exact imi-
7

tation demonstrates the learner’s possession of the target features in his or her linguistic
knowledge store” (Chaudron 2003).
Despite its simplicity, EI requires learners to employ multiple linguistic skills to
successfully reproduce a series of target sentences. Figure 2.1 and the following descrip-
tions illustrate the fundamental processes that learners need to execute during an EI per-
formance (Vinther 2002).
︸ ︷︷ ︸
Comprehension Skills
Listening Decoding
Production Skills︷ ︸︸ ︷
Interpreting Recalling ProducingInput Output
Figure 2.1: EI Processing Model (Based on Vinther 2002)
Listening. The test taker perceives a sound sequence contained in an EI item phonolog-
ically to process it as a series of linguistic units (e.g., sound sequences, words, phrases,
etc.) in the decoding phase.
Decoding. Bley-Vroman and Chaudron (1994) state that the input is decomposed as
chunks, or meaningful linguistic units in the short-term or working memory when it is
heard. They say that the size of the chunks varies depending on the test taker’s grammati-
cal knowledge: the more familiar the test taker is with the target language, the more accu-
rately he or she is able to process the model sentence at this stage because the knowledge
helps form a larger size of chunks and store the linguistic information without exceeding
memory capacity.
Interpreting. Vinther (2002) mentions that the meaning of the decomposed units of in-
formation are to be syntactically and semantically processed at this stage. She also points
out that if the test taker understands the meaning of the stimuli but fails to produce an
accurate repetition, it is possible to reason that the grammar system of the target language
8
has not been developed sufficiently to reconstruct the level of complexity contained in the
presented sentence at this stage1.
Recalling. McDade et al. (1982) discuss the relationship between the timing and accuracy
level of the performance (either immediate or delayed imitation). Based on their study,
they claim that if the test taker fails to interpret model sentences properly, the imitation
is significantly hindered even if the test taker is asked to repeat stimuli immediately. On
the other hand, sentences that he or she understands are correctly repeated even if there
are time intervals between listening and repetition. This result indicates that recalling
the stimuli for imitation is highly determined by L2 comprehension capacity or success-
ful processes in the preceding stages. This also implies that it is impossible to produce
sentences without internalized productive knowledge and mechanisms of the target lan-
guage (cf. Levelt 1995).
Producing. Similar to recalling, Vinther (2002) maintains that EI measures production
ability, although the accuracy of EI repetitions is highly determined by the preceding
comprehension due to the nature of the task. She claims that EI requires developed L2
speaking ability because it is possible that poor imitation occurs even if the subject has
been able to understand the model sentences successfully.
Although there are still a number of unknown aspects regarding EI processing,
the model above clearly indicates that EI is a highly complex language task that requires
several factors of L2 knowledge for successful imitation, not just a memory test. The
various applications of EI based on this assumption are reported in the literature. In the
following subsection, applications of EI in language testing are discussed.
2.1.2 Applications
EI has been utilized as an experimental data collection method for more than four
decades in psychology and language acquisition studies such as child language develop-
ment (e.g. Fraser et al. 1963, McDade et al. 1982) and implicit knowledge measurement
1I indicate the interpreting stage as both comprehension and production skills because the interpretationis analogous to Levelt’s (1995) conceptualizer, which precedes the process to transfer the idea to linguisticrepresentations, according to the explanation of Vinther (2002).
9

(Ellis 2005, Erlam 2006, Ellis 2008, Erlam 2009) and its instructional impact (see the de-
tailed overview in Ellis 2010). Although the research slowed down temporarily during
the 1980s due to severe criticism of the methodology, it regained research attention in the
late 1990s again and started being regarded as a viable testing method (Jessop et al. 2007).
The noteworthy studies in terms of this present research are those which focus on
the application of EI to L2 testing. Naiman (1974) discusses the usefulness of EI for mea-
suring L2 ability. He developed twelve carefully designed EI sentences along with com-
prehension and production tests and conducted experiments with 112 young students
who were learning L2 French in an immersion program. His results show a strong associ-
ation between scores on imitation and other types of production tests. He claims that EI is
a more effective testing method to examine L2 production skills than spontaneous speech
counterparts because it is easily implemented to identify L2 learners’ morphosyntactic ac-
quisition patterns explicitly and examine the development of their productive grammar
effectively.
Bley-Vroman and Chaudron (1994) provide a detailed investigation of previous
psycholinguistic and SLA studies and discuss the potential of EI as an L2 proficiency
measurement. They delineate the concept of chunking (see 2.1.1) and explain how lin-
guistic representations formed through chunking are stored in the short-term memory.
They point out, based on the claim by Forster (1987), that the representations are encoded
at stratified control levels, which regulate the interpretation of presented linguistic in-
formation in short-term memory. Furthermore, they claim that several control levels are
activated during the EI task and a successful or poor EI performance is determined by the
intensity of the activation. Based on these theoretical assertions, they maintain that the
length of the model sentences has a significant effect on a subject’s ability to produce EI
repetitions because it provides a direct impact on chunking and representation formation
processes regulated by L2 proficiency and short-term memory capacity.
Inspired by Bley-Vroman and Chaudron (1994) and Chaudron’s subsequent study
(Chaudron et al. 2005), research on EI as an L2 proficiency measurement has been con-
ducted by Graham (2006) and others. In a pioneering study, Graham (2006) reports that
he and his colleagues developed and refined sixty English EI items with designated syl-
10
lable lengths (5–25) through the test validation process. They administered the test to
156 students at an intensive English program (IEP) in the US and conducted correlational
analyses between EI scores and ratings of other oral tests such as the OPI. They mention
that there was a moderately strong correlation between EI and OPI (r ≈ 0.65) in the ex-
periment and conclude that EI has a potential to be a highly reliable testing technique for
oral language skills.
Furthermore, he and his colleagues conducted subsequent studies: Graham et al.
(2008b), Hendrickson et al. (2008), Weitze and Lonsdale (in print), Weitze et al. (2009). The
important findings of these studies are summarized as follows:
1. Sentence length based on the syllable count (i.e., the number of syllables in an EI
sentence) influences L2 learners performance most crucially, which conforms to the
claim by Bley-Vroman and Chaudron (1994).
2. Lexical frequency and lexical density (i.e., the number of content words in an EI
item) are minor factors that affect EI item difficulty.
3. Morphological density and morphosyntactic features do not account significantly
for learners’ EI performance.
4. There is a strong association between EI score patterns and the acquisition order
proposed by DeKeyser (2005), and the score distributions are highly unified regard-
less of learners’ L1.
5. Overall, EI scores predict OPI ratings within two sublevels of margin of error (be-
tween Novice Low and Superior)2.
2.1.3 Computer Scoring
Scoring EI is one of the important issues discussed in the literature. Although there
are some differences among studies, many researchers employ holistic scales as a grading
method. As a typical example, Keller-Cohen (1981) uses a 1-to-7 scale continuum (1 for
no repetition and 7 for perfect imitation) in the EI study for L1 lexical acquisition. This
2See the footnote in 1.2 on OPI ratings.
11

approach, however, requires complex subjective grading procedures observed in typical
interview-based tests and causes the same evaluation problem described in 1.1 and 1.2.
Charting a new direction, Chaudron et al. (2005) introduced a scoring method in
the development of EI-based language assessment batteries by taking advantage of the
limited variety of EI responses. In the scoring process, they counted mispronounced syl-
lables in each repetition to yield a score ranging from four points (the highest) if the repeti-
tion is a perfect imitation, to zero if four or more errors are made. Based on this approach,
Graham (2006) further proposed a binary scoring method, in which one point is given for
each correctly pronounced syllable in an EI utterance and zero otherwise, and the total
number of correct syllables in all the items is used as a test score. Obviously, these two
scoring methods are highly objective, which does not require graders to be well trained
native speakers to ensure consistent scoring. Lonsdale et al. (2009) report that agreement
in approximately 175,000 double-graded syllable scores yielded by fifty graders (includ-
ing both native and non-native speakers of English) was as high as 91% with the binary
scoring method proposed by Graham (2006).
In concert with the establishment of these objective EI grading methods above,
various attempts were made to develop an automated grading system using ASR tech-
nology. As a landmark study, Graham et al. (2008a) present a detailed validation study
with an experimental ASR grading system. They used SPHINX, an ASR engine devel-
oped at Carnegie Mellon University (Lee 1989) and recognition grammars designed to
score EI items systematically. They conducted correlational analyses against randomly
selected human-generated scores reported in Graham (2006). With this method, they re-
ported that they attained an 88% correlation coefficient between human and ASR scores
although there are some technical limitations with the proposed system, such as its in-
ability to produce syllable-level scores.
Based on the results shown byGraham et al. (2008a), ASR-based systems for Japanese
EI have been investigated in a series of our studies. The detailed descriptions of the de-
velopment of Japanese EI systems will be provided in Chapter 4.
12

2.2 Simulated Speech
2.2.1 Development
Simulated Speech (SS) is another testing method to measure L2 oral proficiency
which has been used for many years in the field of language testing. The basic procedure
of this method is described as follows:
One speaker produces a long turn alone without interacting with other speak-
ers, but they also typically include extracts of situations where the exami-
nees say something in a particular situation, possibly in response to another
speaker whose turn is heard . . . Luoma (2004:44-45)
The tests using this method are frequently referred to as “semi-direct” oral tests
(O’Loughlin 2001) in contrast with direct tests such as OPIs discussed in Chapter 1, which
involve face-to-face or phone interviews, because those tests requires test takers to speak
in a rather communicatively confined environment although they still need to employ
their various L2 strategies for production (Shohamy 1994). This testing method started
being utilized in 1980s, especially when the simulated oral proficiency interview (SOPI)
was introduced for L2 Chinese oral proficiency assessments (Clark and Li 1986). The
motivation for the development of SOPI was to make oral proficiency assessment more
accessible to learners of less commonly taught languages because it was common that
well-trained interviewers of the OPI or other oral interviews for those languages were not
readily available at many language institutions. A number of validation studies of SOPI
were actively conducted in 1990s. Those studies mainly reported that the high concurrent
validity of SOPI, indicating the correlation between OPI and SOPI for various languages
ranged from 0.89 to 0.93 (Clark and Li 1986, Stansfield et al. 1990, Shohamy et al. 1989,
among others). Although some of them point out that there are some critical differences
between these two types (see Shohamy 1994 and Koike 1998 for more detail) and caution
that ratings produced by semi-direct tests are not necessarily equivalent to those of direct
tests, many studies indicated that semi-direct oral tests are the optimal second choice for
measuring L2 speaking ability if oral interviews are not available (Clark and Li 1986).
13

Based on the findings of the investigations of SOPI and other semi-direct speaking
tests, the possibility of computer-mediated tests has been examined intensively for the
last two decades (Malone 2007). The computerized oral proficiency interview (COPI),
for example, is a computer-mediated version of SOPI which provides more features than
the tape-mediated SOPI was not able to offer, such as an adaptive testing procedures
based on the test taker’s self-assessment and the test taker’s control over preparation
and response time (Malabonga et al. 2005). The oral proficiency interview by computers
(OPIc) is another computer-mediated oral test proposed by the LTI and used in recent
years based the concept similar to COPI (Malone and Montee 2010)3.
2.2.2 Computer Evaluation
Themajor characteristic of SS discussed in 2.2.1 is that themain focus of this testing
method is on the ease of test administration by utilizing technology in lieu of trained in-
terviewers who are not always available, especially for less commonly taught languages.
However, this does not mean that rating processes are also eased with this technique.
In fact, SOPI, COPI, and OPIc still require human raters who evaluate collected speech
samples based on the American Council on the Teaching of Foreign Languages (ACTFL)
grading scales which are used for the OPI evaluation. Of course, human evaluation en-
sures that ratings for these semi-direct tests are comparable to those of OPIs with the same
grading rubric. However, this situation makes these tests unaffordable in many cases for
most learners and prevents them from being used other than for criterion-referenced pur-
poses. To overcome this issue, various attempts have been made to develop automatic
grading systems with computer technology.
This area of research began in the last two decades along with the advancement of
computer processing power and the field of natural language processing (NLP) including
speech processing technology (Jamieson 2005). Some studies investigate the possibilities
of utilizing the technology for automatic evaluation systems. Hansen and Rowe (2006)
developed a semi-directed speech testing system called the fully-automated speech test
(FAST) based on Hansen (2001), which points out that there are strong associations be-
3See http://www.languagetesting.com/kgic/ for more detail.
14

tween L2 speaking capability and temporal features such as length of speech and silence
time. In this study, they administered computer-mediated semi-direct tests with video
prompts to elicit monologic speech samples to 210 English-as-a-second-language (ESL)
learners in the US, in order to examine whether the temporal features correctly predict
the proficiency levels measured by the placement test offered at the institution. Based
on their analyses, they claim that the temporal features they focused on and proficiency
levels indicate a strong statistical association and the combination of speech technology
with these evaluation features will provide an effective method for L2 ability assessment
as well as language acquisition and attrition research.
Similarly, Beigi (2009) reports that he implemented an automatic classification sys-
tem which distinguishes seven levels of human English OPIc ratings (Novice Low to Ad-
vanced) based on temporal features such as the time lengths of audio samples and actual
speech segments. In his study, he used 973,000 OPIc speech samples collected in actual
OPIc administrations and corresponding human ratings for system training. Based on the
results, he mentions that the system attained approximately 53% accuracy of agreements
between computer-generated and human ratings although the features concerned in this
study were temporal features only.
Research on the automatic evaluation system called SpeechRaterSM, which has been
investigated at ETS for several years, is one of the most current and comprehensive stud-
ies regarding computer evaluation for semi-direct oral tests (Xi et al. 2008, Zechner et al.
2009, Yoon et al. 2010, Higgins et al. 2011, among others). In their most recent study,
Higgins et al. (2011) used more than 20,000 L2 English speech samples (45 to 60 seconds
each) obtained from the Internet-based Test of English as a Foreign Language (TOEFL-
iBT) and TOEFL Practice Online (TPO) test for the ASR-based grading system develop-
ment. First, they examined three multiple regression models as possible score estimators,
which generated numerical values predicting test scores based on the fivemost influential
speech features in human rating. They obtained moderately strong correlations (r ≈ 0.7)
with all three regression models between human and machine scores in this step. Based
on these results, they further developed a logit scoring model with 90% prediction inter-
vals to provide approximate score ranges that the test taker is likely to gain with human-
15

generated scores. These ETS studies will be used as the basis of the fluency measurement
with SS in Chapter 4.
2.3 EI and SS: Testing Methods for Accuracy and Fluency Measures
The most important aspect of the previous EI and SS studies cited in 2.1 and 2.2
is to explicate how EI and SS function to measure L2 oral accuracy and fluency in terms
of the development of the oral proficiency testing system in this research. The critical
characteristic of EI is that test takers are required to use particular grammatical features
presented in the test items in their production. Therefore, it is reasonable to think that
avoiding or failing to reproduce the features accurately indicates tangible information
on the limitation of learners’ current oral production capability. Regarding this aspect,
Naiman (1974:34) describes as follows:
The advantage of using imitation as a technique for collecting data comes from
the fact that whatever sound or grammatical structures the researcher wishes
to look at can be elicitedwithout having to record hours of spontaneous speech
. . .. Spontaneous speech data . . . suggest that speakers of a second language
will go to considerable length to avoid the use of a sound or grammatical struc-
ture that is particularly difficult for them.
In other words, the test taker of EI is forced to produce sentences with specific
features regardless of whether he or she has already acquired those features in the target
language. Therefore, as described in 2.1.1 and Vinther (2002), both comprehension and
production are hindered significantly if those features are absent in the current interlan-
guage, which leads to less accurate production in the EI task. Because of the objective
grading with EI mentioned in 2.1.2, the differences in production accuracy can be distin-
guished with quantified scores. This is the basis for the assumption in this study that EI
is a powerful technique to tap the test taker’s L2 oral accuracy. At the same time, this
fact further indicates that (1) creating EI test items which are able to classify learners’ L2
accuracy in a gradable manner is very crucial in developing an effective EI test, and (2)
dictating EI responses with ASR accurately is crucial to attain precise objective grading
16

proposed by Graham (2006). Regarding these issues, I will propose a proceduralized item
development technique in Chapter 3 and an optimal language model development for EI
grading using ASR in Chapter 4.
The main reason that I chose SS for fluency measurement is rather obvious. A sub-
stantial number of studies have been conducted to measure L2 fluency based on various
features. Typically, these studies examine several quantifiable fluency features to illus-
trate the role of fluency observed in production activities and indicate the relationship be-
tween those features and L2 oral proficiency (Koponen and Riggenbach 2000, Segalowitz
2010). Table 2.1 shows the empirical and theoretical fluency studies and their focused
features.
Table 2.1: L2 Fluency Studies and Focused Features
Study Features
Ellis (1993) temporal variables and hesitation phenomenaLaver (1994) filled and unfilled pausesFreed et al. (2004) speech rate, total words spoken, duration of speaking
time, etc.Garcıa-Amaya (2009) speech rate, repetitions, repairs, total number of
words, etc.Chambers (1997) number of pauses, length of run, place of pauses, L1
transfer of pause patterns, etc.Kormos and Denes (2004) speech rate, phonation-time ratio, mean length of
runs, etc.
Interestingly, these fluency features play critical roles inmeasuring oral proficiency
in computer-based SS tests such as the TOEFL test. See Table 2.2, which shows the L2
proficiency features investigated in Higgins et al. (2011).
Note that the majority of variables indicated in Table 2.2 are fluency-related fea-
tures. Therefore, the computer-generated scores in Higgins et al. (2011) are fundamentally
based on fluency features obtained through semi-direct test items used in their study. Fur-
ther, retrieving most temporal features mentioned in Table 2.2 with ASR does not require
17

Table 2.2: Oral Proficiency Variables in Higgins et al. (2011)
Variable Name Feature Type Feature Description
wpsec Fluency Speech articulation ratetpsecutt Fluency and Vocaburary Uniquewords normalized by speech du-
rationtpsec Fluency and Vocaburary Unique words normalized by total word
durationwdpchk Fluency Average length of speech chunkswdpchkmeandev Fluency Mean absolute deviation of chunk
lengthslongpmn Fluency Mean duration of long pausessilmean Fluency Mean duration of silencessilpwd Fluency Duration of silences normalized by re-
sponse length in wordslmscore Grammar Language Model scorelongpwd Fluency Number of long pauses normalized by
response length in wordsamscore Pronunciation Acoustic Model score
the high-precision dictation capability because those features are basically determined by
the presence or absence of utterances in the speech samples, regardless of learners’ L2
speaking ability. In other words, the ASR settings for fluency measurement are not neces-
sarily trainedwith ample L2 acoustic and corpus data to obtain such information. Because
of these reasons, it is safe to say that retrieving fluency features from an SS test with ASR
is an optimal approach considering the limitation on the available ASR capability.
In Chapter 3, I will focus on the creation of optimal EI test items with a systematic
procedure based on corpus technology.
18

Chapter 3
EI Item Creation
3.1 Systematic Item Creation
Creating optimal EI items is the first important stage for the development of effec-
tive EI tests. Several studies which discuss criteria for EI item creation are found in SLA
and psycholinguistics literature. The following items indicate some of the typical condi-
tions pointed out in those previous studies on this issue:
Sentence Length: EI items must exceed participants’ short-term memory capacity to
avoid rote repetition. This includes controlling sentence length based on the number
of syllables or words (Jessop et al. 2007).
Target Features: Lexical and morphological features in EI items must be carefully chosen
because they may make items too easy or difficult for learners to imitate, which greatly
affects EI performance and scores (Tomita et al. 2009).
Feature Positions: Ideally, the target features must be placed in the middle position of the
stimuli (Erlam 2006).
However, these criteria are rather vague and difficult to interpret in creating items for
a particular target language. In the case of Japanese EI, for example, it is reasonable to
assume that the maximum sentence length of test items should be considerably longer
than those of English items due to the fact that the amount of information contained
in a syllable (or mora1) is significantly small compared with English (Maddieson 2005).
Also, the complex morphosyntactic features are often unavoidable even with a short
Japanese sentence because of the agglutinative nature of the language, which causes high
morphological complexity due to consecutive morpheme attachment in single words
1A mora (pl. morae) is a phonological unit used for the binary scoring in this study. See Chapter 4 inTsujimura (2007) for detailed description from a linguistic viewpoint.
19

(e.g., causative passives, see Shibatani 1990). Further, verb formation and compound-
ing constructions are linguistically significant characteristics of Japanese (Kageyama 1993,
Matsumoto 1996) but those features are almost always located at the end of the sentence
because the language is typologically verb-final. Undoubtedly, these language-specific
characteristics should be taken into account in the production of optimal Japanese EI
items along with the suggestions on item creation above.
Moreover, it is important to develop a method to constantly create a sufficient
number of new items with various difficulty levels in order to avoid the practice effect
(Brown 1988) that comes from multiple exposure to the same prompts over time. Also, it
is necessary to proceduralize an item management system to classify test items according
to difficulty levels and to properly reflect test takers’ oral proficiency by using such as-
sorted items retrieved from the item database. Logistically, this involves much time and
effort if the process relies solely on native speakers’ intuition. Therefore, developing a
systematic procedure is imperative to address such a issue.
In this chapter, I will propose a structured method to create quality EI items from
a linguistic and pedagogical point of view, based on the study conducted by Christensen
et al. (2010). Further, I will examine the effectiveness of newly created items with two
statistical analyses.
3.2 Previous Study
Christensen et al. (2010) examined amethod to create English EI items utilizing var-
ious NLP techniques, based on the item creation criteria suggested by Jessop et al. (2007).
They point out that manually created items found in previous studies such as Graham
et al. (2008b) and Valian and Prasada (2006) significantly lack naturalness due to exces-
sive emphasis on specific features such as word order and lexical complexity for the sake
of the research purpose. They claim that such artificial test items do not necessarily reflect
learners’ L2 proficiency and emphasize the use of sentences that occur in corpora to en-
sure accurate predictions of L2 oral proficiency. To systematically produce EI items which
contain target features from L1 corpus data, they developed a comprehensive NLP tool
leveraging various language resources to retrieve test item candidates. This tool exam-
20

ines lexical density, word frequency, syllable length and grammatical features in queries
in the process of sentence searches from the various corpora they used. They report that
the correlation of the scores of EI items selected with this tool to the ratings of an oral
proficiency test administered at an English-for-academic-purposes (EAP) institution was
significantly stronger than those of the manually created EI items in Graham et al. (2008a).
They further mention that this item creation method is far more time-efficient than the
manual creation approach and enables them to create EI tests for specific purposes by
using different types of corpora as needed.
Interesting aspects of their study include EI items based on natural language in-
stances obtained from a spoken data corpus and on the effectiveness of corpus-based
EI items in measuring oral proficiency. I claim that their approach is also desirable to
Japanese EI item creation because (1) some of the similar tools and language resources
used in their study are also available to replicate this study, and (2) this approach may
open a path to overcome the ceiling effect seen in Matsushita and LeGare (2010) (see also
4.3) more easily than addressing it with a manual item creation approach.
However, this item creation method is not applicable unconditionally because of
the language-specific aspects mentioned in 3.1 above. To customize this approach to
Japanese item creation, the following points should be considered:
(1) Christensen et al. (2010) mainly focused on sentence length, lexical frequency and
complexity, and morphological features based on the annotation information pro-
vided by the language resources used in their study. However, I argue that these
features are not enough to create optimal Japanese EI items which draw clear dis-
tinctions, especially between those who are rated as Advanced Mid and Advanced
High or Superior under the OPI criteria. This is mainly because the inflectional
morphemes are largely salient and regular in Japanese (Kageyama 2010), and thus
it is unlikely that those features affect difficulty in EI performance significantly2. In
terms of Japanese EI item creation, there is a strong need to take into considera-
2Matsushita et al. (2010) reported that the EI test used in Matsushita and LeGare (2010) did not differ-entiate between advanced learners and native speakers based on the comparison between EI scores andOPI ratings. We claimed that this was mainly because the test items used in the study focused solely ongrammatical features.
21

tion a higher level of language phenomena based on a viewpoint of theoretical and
empirical linguistics in order to incorporate desirable difficulty levels in EI items.
(2) To accomplish (1), it is necessary to list language phenomena that contribute to the
enhancement of item quality in a systematic manner. To address this task, identify-
ing such language phenomena through careful examination of (psycho)linguistic lit-
erature and statistical item analyses with the empirical data are important. Further,
establishing an effective procedure to identify item candidates that contain such
phenomena with existing and/or custom-made corpus tools is also important.
(3) It is essential to create EI items according to the needs and interests of learners and
instructors. Therefore, using grammatical features taught in a language program as
criteria for item development should also be considered. Regarding this, the method
suggested by Christensen et al. (2010) is useful because the typical features covered
in language programs are identifiable with most NLP resources available in public
use.
In the rest of this chapter, I discuss the item creation process based on (1) – (3)
above. In this particular study, I developed thirty corpus-based Japanese EI items accord-
ing to (a) the scheduled acquisition order based on the topics covered in the textbooks
used in the Japanese program at Brigham Young University (BYU), and (b) the syntactic
and semantic phenomena which are unique to the language and not covered in the text-
books specifically. Section 3.3 will discuss the theoretical background of syntactic and se-
mantic phenomena in (b) above. Section 3.4 will illustrate the item engineering approach
discussed in Matsushita et al. (2010) as a comparison with the corpus-based approach dis-
cussed in the subsequent sections. The rest of the sections will discuss the corpus-based
approach and the statistical analyses based on an empirical study.
3.3 Syntactic and Semantic Features in Japanese
There are numerous linguistic features that make the Japanese language distinct
from other languages. However, it is impossible to enumerate all of them and examine
whether they are ideal for EI item creation in this single study. In this section, I discuss
22

only three linguistic phenomena: noun-modifying clauses, embedded clauses contain-
ing pro-dropped pronouns, and evidentiality based on several theoretical and empirical
linguistic studies.
3.3.1 Noun-Modifying Clauses
Various psycholinguistic studies indicate that Japanese relative clauses are one of
the complex syntactic structures that require high memory load and cause a garden path
effect (Carroll 2008). For example, Sawa (2005) reports on a study of reading time and
comprehension in a self-paced reading test containing various relativized sentences with
22 native speakers of Japanese. He indicates that SS and SO sentences3 delayed reading
speed and SS sentences resulted in the highest error rates in comprehension tasks. He
ascribes these results to the garden path effect caused by these sentence structures. In-
terestingly, Sawasaki (2009) conducted a similar study with 84 L2 Japanese speakers and
reported that SS and SO sentences also caused the longest reading time.
Further, Comrie (2010) explains the unique characteristic of Japanese relative clauses
compared to their English counterparts. The following examples illustrate the difference
in the flexibility of NP extraction in the process of relativization between Japanese and
English:
(3.1) a. The person who kept the dog died.
b. *The dog [that the person who kept died] came to the station every evening to
greet his master.
(3.2) a. Inu o kawaigatte kureta hito ga nakunatta.
b. [Kawaigatte kureta hito ga nakunatta] inu ga maiban eki made kainusi o
mukae ni kita.
(Comrie 2010:41)
3SS: the head noun serves as a subject in both relative and matrix clauses; SO: the head noun serves asan object in the relative clause and as a subject in the matrix clause.
23

There are several syntactic frameworks which describe the phenomenon above.
For instance, from the government and binding (GB) perspective (see Chomsky 1981),
(3.2b) is called a violation of subjacency (Chomsky 1977) and cannot be perceived as a
relative clause for the English counterpart depicted in (3.1b). Therefore, Comrie (2010)
refers to such relative clauses as noun-modification clauses which are distinctively differ-
ent from the conventional relativization patterns discussed in Keenan and Comrie (1977).
As a similar case, Nakayama (2002) introduces a pragmatic complex NP, an example of
which is shown below:
(3.3) [Yuumei-nafamous
haiyuu-gaactor-NOM
nesshin-niardently
shashin-ophoto-ACC
totta]take-PST
sakuhinshuu-gacollection-NOM
saikinrecently
chuumoku-sare-ta.attention-CAU-PST
‘The collection of the photos the famous actor took recently attracted attention.’
(Nakayama 2002:410)
The interesting aspect of this structure is that there is no empty category that has
a connection with the head noun to indicate an argument role in the relativized clause in
the bracket. However, the embedded clause still behaves as a modifier of the head noun
following it. Regarding the processing of these noun-modification formations, Nakayama
(2002) indicates that L1 speakers address such complex NPs based on the valency infor-
mation of the verbs inside the modifying clauses while parsing the sentences and make
constant predictions of the sentence endings based on the saturation of argument require-
ments.
Regarding EI item development, there are several advantages to using such noun-
modification clauses. First, the structure makes it possible for verb constructions to locate
in the middle of prompt sentences by utilizing the prenominal modification in Japanese.
Second, unlike English, creating short sentences with noun-modification clauses is rela-
tively easy with pro-drop (Tsujimura 2007), which makes it possible to create syntactically
complex EI prompts with a few simple lexical items. Third, these structures are very com-
mon in Japanese, which enables a corpus search tool to provide a substantial number of
instances effectively.
24

The pro-drop phenomenon is also a very common linguistic feature in Japanese
and provides an interesting syntactic and semantic influence to structurally complex sen-
tences. The following subsection will discuss the relationship between embedded clauses
and pro-drop.
3.3.2 Embedded Clauses and pro-Drop
Along with the noun-modification constructions, sentence embedding and its ef-
fects are extensively discussed in the field of cognitive science. Regarding embedded
clauses, Bader and Bayer (2006) discuss sentence structures which are not processable for
most native speakers of English because of the memory overload with multiple nomina-
tive NPs. As shown in (3.4), the following type of sentence is very difficult to process
although it is perfectly grammatical:
(3.4) #The administrator who the intern who the nurse supervised had bothered lost the
medical reports.
(Bader and Bayer 2006:21)
They explain that this is mainly because the embedded clauses are nested hierar-
chically, which causes memory overload in processing the sentence. See the following
diagram:
(3.5) CP1
The administrator CP2 lost the ... reports
who the intern CP3 had bothered
who the nurse supervised
(Bader and Bayer 2006:21)
25

Miyamoto (2008) also discusses the same issue in the case of Japanese. He men-
tions that the following Japanese sentence is not processable for most native speakers of
Japanese either:
(3.6) #Sensei-gateacher-NOM
gakusei-gastudent-NOM
onnanoko-gagirl-NOM
syoonen-oboy-ACC
mikake-ta-tosay-PST-that
hanashi-ta-totell-PST-that
it-ta.say-PST
‘The teacher said that the student told that the girl saw the boy.’
(Miyamoto 2008:240)
The hierarchical structure of (3.7) is analogous to the one shown in Bader and Bayer
(2006):
(3.7) CP1
sensei-ga CP2 itta
gakusei-ga CP3 hanashita-to
onnanoko-ga syoonen-o mikaketa
(Based on Bader and Bayer 2006)
This center-embedding construction, however, is not completely impossible in Japanese.
With pro-dropped pronouns mentioned above, the following sentence is perfectly sound
and processable for native speakers:
(3.8) ∅
pro(=I)nani-gawhat-NOM
gen’in-nano-kacause-COP-Q
∅
PRO(=I)wakara-nai-no-gaunderstand-NEG-COMP-NOM
ichibanmost
komari-mashita.trouble-PST
‘What baffled me most is that I didn’t know what caused it.’
26

(3.9) CP1
pro(=watashi-ga) CP2 ichiban komari-mashita
PRO(=watashi-ga) CP3 wakaranai-no-ga
nani-ga gen’in-na-no-ka
c-co
mm
and
Comrie (2010) mentions that semantically vacuous lexical morphemes such as -no
may be linked to the flexible structures in noun-modification structures discussed 3.3.1.
This explanation may be applicable to this center-embedded construction above, along
with pro-drop. However, the concrete reasons for this phenomenon remain to be seen,
and it is not the main focus of this study. The main focus here is whether L2 speakers of
Japanese, especially those who speak English as their L1, are capable of repeating such
sentences in EI if the structure is not possible in their L1 in any case. Based on this per-
spective, this structure is also considered in item development in this study.
3.3.3 Evidentiality
The semantic feature I chose for this study is evidentiality (McCready and Ogata
2007). Japanese evidentials imply sources of information the speaker relies on. Different
evidentials exhibit different connotations according to the sources. The following exam-
ples show typical evidentials and subtle differences among them. These evidentials are
not clearly distinctive, but each evidential can be used to cover a specific domain of se-
mantic types of references.
(3.10) a. KonoPROX
kusuri-wamedicine-TOP
yokuwell
kikuwork-INF
rashii.EVID
‘I infer from what I heard that this medicine works well.’
27

b. Kinooyesterday
moalso
daremoanyone
ko-na-kattacome-NEG-PST
node,so
kyootoday
moalso
daremoanyone
ko-naicome-NEG
mitaiEVID
da.COP
‘No one came yesterday, so it seems that no one will come today, either.’
c. Koizumi-sooridaijin-waKoizumi-PM-TOP
aitsu-ohim-ACC
kubineck
nito
surudo
sooEVID
da.COP
‘Prime Minister Koizumi is going to fire him (I heard).’
McCready and Ogata (2007:154–160)
The examples above show a critical difference between epistemic modals and ev-
identials. In (3.10a), the speaker implies that (s)he has come to realize the efficacy of the
medicine through some inference based on reading an advertisement, and so forth. The
speaker in (3.10b), on the other hand, makes the statement based on his or her previous
experience gained the day before. In (3.10c), the speaker makes this comment based on
hearsay. According to McCready and Ogata (2007), each evidential is perceived as an
indirect inferential, a judgmental, or a hearsay type respectively, and none of these are
deterministic on the facts implied with the main clauses. Because of this, native Japanese
speakers can perceive these statements not only as epistemic but also as referential ex-
pressions which indicate where the knowledge comes from.
Evidentials are also one of the salient features, and the combination with a complex
sentence structure, as in (3.10b), commonly occurs in Japanese. In this study, this feature
is considered in the item creation process.
3.3.4 Application of the Theoretical and Empirical Notions to Item Creation
The linguistic features in the preceding subsections are discussed in the theoretical
and empirical linguistics literature. However, there are few previous studies applying
these features to Japanese EI or other similar testing methods. We (Matsushita et al. 2010)
recently investigated these syntactic and semantic features with the item engineering or
manual item creation approach and compared them with items used in Matsushita and
LeGare (2010), which were selected from the Simple Performance-Oriented Test (SPOT,
28

Kobayashi et al. 1996, Ford-Niwa and Kobayashi 1999)4, in order to examine the effec-
tiveness of those items. The following section will sketch some findings of the study and
describe the direction toward corpus-based item creation proposed in the present study.
3.4 Item Engineering Approach
Matsushita et al. (2010) examined additional eight EI items containing the afore-
mentioned linguistic features along with those selected from SPOT. The item creation
with this approach is as follows:
1. Select target syntactic and semantic features as described in 3.3.
2. Create several item candidates for each target feature.
3. Consult with several native speakers. Examine the naturalness of each sentence.
Decide which candidate sounds most plausible.
4. Adjust sentence length and lexical items as needed.
Based on this process, the new items were carefully designed to contain approxi-
mately the same mora lengths as the SPOT items used in Matsushita and LeGare (2010).
The lexical items in these new sentences were also carefully chosen from basic vocabulary
lists used in the introductory courses to avoid excessive influence from the lexical items
on EI performance. With these EI items, we compared the scores yielded by the binary
scoring method proposed by Graham (2006) to those of the SPOT items. We adminis-
tered these eight items along with the sixty SPOT items to 157 subjects using a computer-
delivered testing tool in Winter 20105. Figure 3.1 shows the score difference among three
groups classified according to the courses that the subjects enrolled at the time of the data
collection (100: first-year, 200: second-year, and 300: third-year Japanese courses)6.
4The reasons that we chose SPOT for item selection are because (1) the test procedure is very similarto EI: the test taker listens to a series of prompts while reading the same sentences on the answer sheetand fills in blanks in the printed sentences very quickly (two seconds for each item), and (2) therefore, thelengths and the morphosyntactic features contained in those SPOT sentences are sufficiently processablefor L2 learners in EI tasks as well.
5Refer to 4.2 in Chapter 4 for more detail on the testing tool.6See also 3.6.1 in this chapter for further descriptions on these courses and the textbooks.
29

4050
6070
80
Number of Items
Mea
n of
Sco
res
60 Items 68 Items 8 Items
Levels
300200100
Figure 3.1: New and Old Item Score Comparison (Matsushita et al. 2010)
Clearly, the additional eight items with complex syntactic and semantic features
weremore challenging than the SPOT items for all the subject groups based on these mean
score patterns. Further, we showed the detailed score differences of the high achievers in
these subject groups, as seen in Table 3.1.
As indicated, only subjects 78, 38, and 76 achieved higher scores on the eight new
items than on the SPOT items. According to a pre-test survey the participants answered,
these three learners were near-native speakers who received formal education in Japan,
whereas all of the others had limited or no overseas experience. Matsushita et al. (2010)
point out that these eight items effectively distinguished learners with substantial L2
capability from those with less L2 experience and concluded that the ceiling effect was
greatly lessened by these carefully engineered EI items.
30

Table 3.1: Comparison of Top 10 Scores of SPOT Items and New Items (Matsushita et al. 2010)
Subject ID SPOT Items (%) New Items (%)
78 99.21 100.0038 98.07 100.0042 97.89 84.0276 97.81 100.0080 97.54 82.2528 96.84 64.5043 96.14 72.7866 95.88 78.1141 95.00 64.5070 94.74 92.31
These results indicate that the item feature identification based on language-specific
phenomena is effective for optimal EI test creation. However, item creation based on the
item engineering approach is time-consuming, and it is difficult to developmultiple items
with the same linguistic features in a short time. The corpus-based approach is a method
that overcomes these disadvantages. I will discuss the basic procedure of item creation
with this approach in the following section.
3.5 Corpus-Based Approach
The basic concept of corpus-based item creation is depicted in Figure 3.2. As the
figure indicates, the process of the corpus-based approach is simple. Using annotated
corpora, multiple sentences with particular target features are retrieved based on various
corpus queries. Then optimal item candidates are selected among those retrieved sen-
tences and modified according to EI item criteria such as the maximum mora length if
necessary. The important aspect of this approach is the corpus tool which enables us to
identify desirable sentences contained in the corpora in an efficient manner.
For this study, I used ChaKi.NET (Iwatate et al. 2011) as a corpus tool. This tool
contains a wide variety of functions to enable users to search for sentences in a similar
manner to Christensen et al. (2010). Figure 3.3 shows the screenshot of ChaKi.NET.
31

PrototypeGeneration
CorpusProcessing
Corpus Tool Selection /Adaptation New Items
Annotated Corpus
Corpus Queries
Figure 3.2: Schema of Corpus-Based Item Creation
Figure 3.3: ChaKi.NET
Matsushita et al. (2010) discuss the possibility of using such a corpus tool to find
item candidates with the item retrieval procedure shown in Figure 3.2. As an example, we
identified a sentence with a internally headed relative clause (IHRC, see Tsujimura 2007)
from a collection of large-sized spoken data called the Corpus of Spontaneous Japanese
32

(CSJ, Maekawa 2003, Furui et al. 2005)7 based on the sentence with the syntactic structure
in their study as a prototype. Figure 3.4 shows the engineered and CSJ-based sentences.
(a) Engineered Sentence (b) CSJ Sentence
Figure 3.4: Internally Headed Relative Clause of Japanese (Matsushita et al. 2010) (a) IHRCsentence manually engineered by native speakers (b) IHRC sentence retrieved from CSJ data
In 3.5.1, I will describe each stage of the corpus-based approach and the item anal-
ysis in detail.
3.5.1 Prototype Generation
As shown in Figure 3.2, the first stage of item creation is to generate prototypical
cases that embody the target constructions for a corpus search, based on the identified
linguistic features discussed in 3.3. This process involves such tasks as creating sample
sentences and extracting the common syntactic constructions in those sentences. In this
respect, the corpus-based approach is exactly the same as the item engineering approach.
However, the advantage of this corpus-based approach is that perfectly formed proto-
types are not necessary at this stage because the prototypes are used as search queries
and acceptable only if sentence fragments are generated for the corpus search.
Based on those prototypes, search queries are created. Chaki.NET covers most of
the search functions utilized in Christensen et al. (2010): regular expressions, dependency
7Refer to 4.3 for further descriptions on CSJ.
33

search, word list search, and so forth. Figure 3.5 shows an example of the dependency
search query for simple relative clauses8.
Figure 3.5: Example of Dependency Search Query
Of course, the tool suggests multiple sentences based on the queries. Therefore,
it is necessary for humans to examine the appropriateness of those sentences as possible
EI items. In 3.5.3, I will describe the selection and adaptation process using an actual
sentence.
3.5.2 Corpus Processing
Along with prototype generation, corpus processing is a preparatory stage for cor-
pus searching. As Christensen et al. (2010) indicate, plain corpora need to be annotated
with morphological and syntactic information in order to search for sentences with vari-
ous strategies. In this study, I used the morphological analyzerMecab 0.989 to decompose
the CSJ sentences into morphemes and add lexical information (part of speech (POS), pro-
nunciation, conjugation and declension classes, etc.) to the morphemes10. Further, I used
8As shown in 3.5, ChaKi.NET utilizes a dependency grammar framework to manage the constituencyrelations (see Yamada andMatsumoto 2003). In the field of Japanese NLP as well as linguistics, using a syn-tactic unit called bunsetsu is the mainstream approach for syntactic analysis, and the concept is incorporatedin this tool as well. Kurohashi and Nagao (2003) illustrate the application of bunsetsu to corpus annotationand parsing with detailed description based on their large-scale automatic corpus annotation project.
9http://mecab.sourceforge.net/10Although CSJ is annotated with detailed information, I processed it with the tools discussed above
because the tagging and dependency strategies of CSJ are slightly different from the format used forChaKi.NET. In a future study, I will investigate a method to incorporate the CSJ annotation informationdirectly in ChaKi.NET.
34

the Japanese dependency structure analyzer CaboCha 0.5311 to create dependency rela-
tions of the morphemes decomposed with MeCab.
3.5.3 Selection / Adaptation
Ideal items are selected at this stage among the suggested sentences through the
process discussed in 3.5.1. However, it is unlikely to find optimal EI items directly in the
corpus data in many cases because those sentences tend to contain undesirable lexical
items and mora lengths excessive for EI test items. Therefore, it is necessary to do some
minor modification to tailor those sentences manually. For example, the sample sentence
used to explain the relationship between pro-drop and the center-embedded structure in
Example 3.8 was actually found in CSJ using the corpus-based item creation approach
discussed here. See Figure 3.6.
1:初めは
2:赤ちゃんだから
D
4:ないと
D
3:仕方が
D
5:思っていましたが
D
13:困りました。
D
6:半年
7:過ぎても
D
8:収まらず
D
10:原因なのか
D
9:何が
D
11:分からないのが
D
D
12:一番
D
14:
D
(a) Original Sentence
1:何が
2:原因なのか
D
3:分からないのが
D
5:困りました。
D
4:一番
D
6:
D
(b) Tailored Sentence
Figure 3.6: Center-Embedded Clause Sentence as an EI Item (a) Center-embedded clausesentence found in CSJ (b) Center-embedded clause sentence tailored for EI use (D denotes“dependent”)
11http://chasen.org/ ˜ taku/software/cabocha/
35
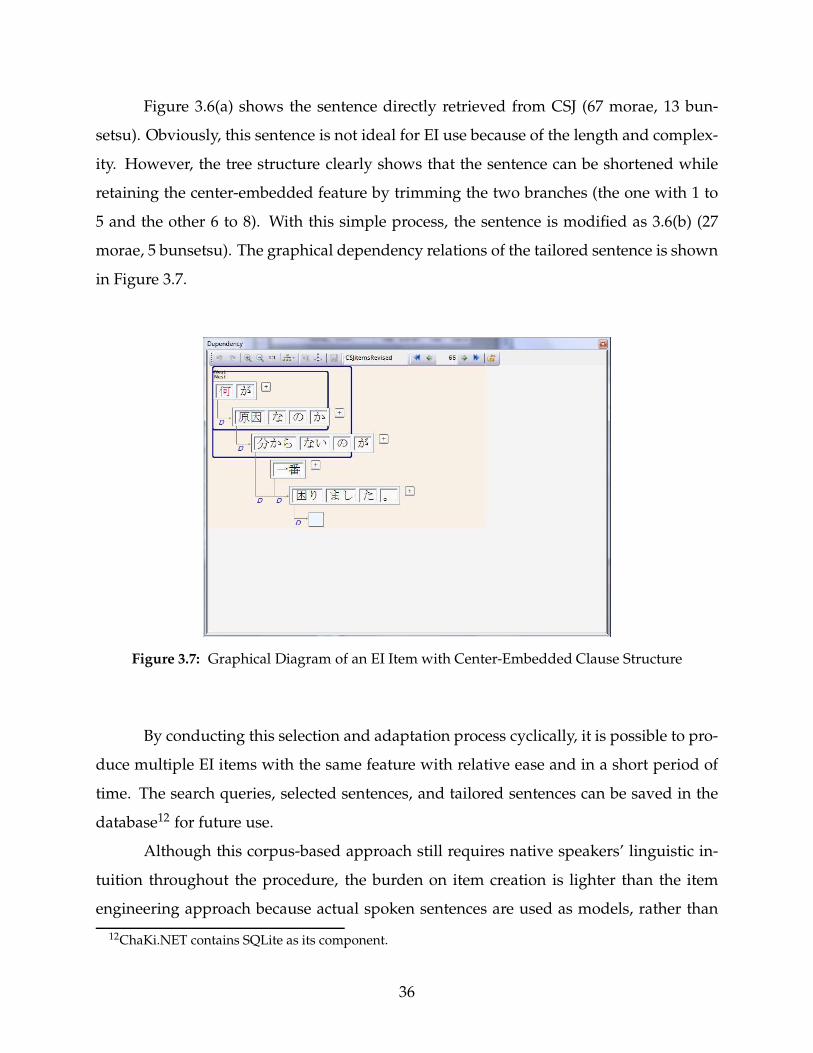
Figure 3.6(a) shows the sentence directly retrieved from CSJ (67 morae, 13 bun-
setsu). Obviously, this sentence is not ideal for EI use because of the length and complex-
ity. However, the tree structure clearly shows that the sentence can be shortened while
retaining the center-embedded feature by trimming the two branches (the one with 1 to
5 and the other 6 to 8). With this simple process, the sentence is modified as 3.6(b) (27
morae, 5 bunsetsu). The graphical dependency relations of the tailored sentence is shown
in Figure 3.7.
Figure 3.7: Graphical Diagram of an EI Item with Center-Embedded Clause Structure
By conducting this selection and adaptation process cyclically, it is possible to pro-
duce multiple EI items with the same feature with relative ease and in a short period of
time. The search queries, selected sentences, and tailored sentences can be saved in the
database12 for future use.
Although this corpus-based approach still requires native speakers’ linguistic in-
tuition throughout the procedure, the burden on item creation is lighter than the item
engineering approach because actual spoken sentences are used as models, rather than
12ChaKi.NET contains SQLite as its component.
36

sentences generating manually. The other advantage is authenticity. Because these sen-
tences were actually used in speech by native speakers, they are more natural than those
artificially generated based on linguistic notions only.
With this process, I created thirty EI items to examine the effectiveness of this ap-
proach. In the following section, I will discuss in detail the statistical analyses of the items
created with this method.
3.6 Item Effectiveness Analyses
3.6.1 Method
Using EI items created with the corpus-based approach, a study was conducted to
analyze item effectiveness. The method is described as follows.
Items. The items were created based on the textbooks used in the courses offered at BYU
(the 100 level: first-year, focusing on basic vocabulary, conversation, and grammar skills;
the 200 level: second-year, focusing on further practice in conversation and basic reading
and writing skills; and the 300 level: third-year, focusing more on reading, writing, and
culture). Refer to Jorden and Noda 1987, Jorden and Noda 1988, Jorden and Noda 1990,
Watabe 1979, Watabe 1982 for the content covered in these courses. Also, items with the
syntactic and semantic features described in 3.3 were also created. Both types of items
were found through the corpus-based process discussed in the previous section. In this
study, 26 textbook-based EI items were selected with grammatical features covered in
those textbooks and four sentences with the aforementioned syntactic and semantic fea-
tures. The textbook-based items were classified according to the class number and item
level as shown in Table 3.2 (see also Table 4.6) and the other four were categorized as
superior based on the assumption that their difficulty exceeds the other 26 items. The
breakdown of items is summarized in Table 3.2.
The total number of subjects examined in the analyses below is 231. The test was
administered with the testing tool mentioned in 3.4 above. The EI scores were generated
using the latest version of the EI grading system called System III. Thus, the statistical
37

Table 3.2: Corpus-Based EI Items
Item Level Class Number # Items # Morae # Bunsetsu
100 Level101 4 13–14 2–4
102 4 13–15 3–4
200 Level201 4 17–20 4–5
202 4 17–20 3–4
300 Level301 5 22–24 4–5
302 5 24–25 4–5
Superior 4 25–31 5–6
analyses discussed below are based on results obtained through this grading system. Re-
fer to 4.4.3 for other details on the subjects, test administration, and grading system.
3.6.2 Factorial ANOVA
Figure 3.8 illustrates the scores according to the item levels indicated in Table 3.2
and the class levels of subjects mentioned in 4.4.3. As indicated in Figure 3.8, the mean
scores of the 100-level, 200-level, and 300-level subject groups decreases significantly as
the item level increases whereas those of the native subject group are stable. Also, the
score decrease trends are uniquely different from one group to the next. As the interac-
tion plot indicates, there is an interaction between class and item levels (FClass Level(3,222) =
337.85, p < 0.0001 and FItem Level(3,222) = 225.67, p < 0.0001, respectively). Therefore, it is
safe to say that these corpus-based EI items functioned effectively to classify these sub-
jects according to their proficiency levels.
Table 3.3 below shows the Tukey post-hoc test based on the factorial ANOVA anal-
ysis above. Along with Figure 3.8, this table indicates that the score differences of respec-
tive class level pairs are uniquely distributed. In other words, these results indicate that
each level of items functioned effectively to differentiate these subject groups.
38

3040
5060
7080
9010
0
Item Level
Mea
n of
Item
Sco
res
100 200 300 Superior
Native Subjects300−Level Subjects200−Level Subjects100−Level Subjects
Figure 3.8: Interaction of Subject and Item Levels
Table 3.3: Score Difference Analysis with Tukey HSD between Subject Groups (the numbersin the table are mean differences; *p < 0.05, **p < 0.01, ***p < 0.001)
Subject Groups 100 Level Items 200 Level Items 300 Level Items Superior Items
L200-L100 15.78*** 14.15*** 5.39 3.76L300-L100 27.10*** 40.46*** 36.50*** 30.92***
Native-L100 33.96*** 58.07*** 66.81*** 65.05***L300-L200 11.32*** 26.31*** 31.12*** 27.15***
Native-L200 18.18 43.92*** 61.43*** 61.29***Native-L300 6.86 17.60 30.31** 34.14**
39

3.6.3 Rasch Model Analysis
Another method used in this study to examine item effectiveness is a Rasch model.
The main purpose of this analysis, however, is different from the conventional approach
used in the item response theory (IRT) analysis, which is a commonly used statistical anal-
ysis method for item effectiveness evaluation (see also Doran 2005). Rather than focusing
on the difficulty of each item here, I treat these EI items as components of individual test
batches classified according to the item levels described in 3.6.1, in order to enable EI to
measure oral proficiency in a discrete manner. See Figure 3.9.
L100 EI
L200 EI
L300 EI
Superior EI
Success
Diffi
culty
Leve
l
Success
Success
Success
Failure
Failure
Failure
Failure
Figure 3.9: Alternative EI Testing Approach
This figure indicates that the person who can reproduce EI items of a certain item
level with satisfactory accuracy will be considered as a successful learner at that level;
otherwise, the learner is considered unsuccessful at that level and to not have reached
that level of proficiency. The rationale for this alternative EI testing method is described
as follows:
1. The binary scoring method in Graham (2006) (see also Equation 4.1) does not pro-
vide information on which item level is difficult for learners to repeat because it
treats all the morae in a test equally in its calculation procedure. On the other hand,
40
this approach enables us to identify the particular level of items that posed a chal-
lenge for learners. If these items are created effectively based on stratified difficulty
levels, this approach will also show the effectiveness of these items as well.
2. In this item effectiveness study, I used only thirty corpus-based items. This ap-
proach will tell us whether this number is sufficient to examine learners’ ability.
Based on these perspectives and the approach depicted in Figure 3.9, I categorized
the EI items according to (1) item levels and (2) class numbers described in Table 3.2, and
conducted an one-parameter unconstrained Rasch model analyses. As mentioned, each
item is regarded as a component of item sets categorized according to class levels or class
numbers, and raw scores calculated with Equation 4.1 are not accumulated. In this anal-
ysis, if a test taker achieves more than 80% for all items in the item level or class number,
the person is considered as successful, which is denoted as 1 in the parameter, and 0 oth-
erwise. The item information criteria plots with the Rasch model in Figure 3.10 show
the respective results. Figure 3.10(a) indicates that the item level difficulties differentiate
the subjects’ ability. The test information function, however, depicts a fluctuated curve,
which may indicate the item-level categorization does not function with these test items.
Figure 3.10(b) indicates that the subjects’ ability is also clearly differentiated according
to the class number, except for 200-level item groups, due to identical trends in the item
characteristic curves. The item information function, which reaches its peak at around
1.5, is rather stable. In terms of the Rasch model analysis, it is probably safe to say that
the class number approach is more reliable than the item level counterpart for the discrete
grading process in Figure 3.9.
3.7 Discussion
The item analyses in the previous section clearly show that the corpus-based items
function effectively for this test in both the conventional scoring method and the item
level classification method illustrated in Figure 3.9. Regarding the Rasch model approach
above, it is reasonable that class number categorization functions more effectively than
the item level counterpart because it reflects the scheduled acquisition order designed in
41

−1.5 −1.0 −0.5 0.0 0.5 1.0 1.5
0.0
0.2
0.4
0.6
0.8
1.0
Item Characteristic Curves
Ability
Pro
babi
lity
L100L200L300Superior
−1.5 −1.0 −0.5 0.0 0.5 1.0 1.5
02
46
8
Item Information Curves
Ability
Info
rmat
ion
−1.5 −1.0 −0.5 0.0 0.5 1.0 1.5
02
46
810
12
Test Information Function
Ability
Info
rmat
ion Total Information: 22.839
Information in (−1.5, 0): 5.717 (25.03%)
Information in (0, 1.5): 15.411 (67.48%)
(a) Item Level
−1.5 −1.0 −0.5 0.0 0.5 1.0 1.5
0.0
0.2
0.4
0.6
0.8
1.0
Item Characteristic Curves
Ability
Pro
babi
lity
L101L102L201L202L300L302Superior
−1.5 −1.0 −0.5 0.0 0.5 1.0 1.5
0.0
0.5
1.0
1.5
2.0
2.5
Item Information Curves
Ability
Info
rmat
ion
−1.5 −1.0 −0.5 0.0 0.5 1.0 1.5
02
46
8
Test Information Function
Ability
Info
rmat
ion Total Information: 22.808
Information in (−1.5, 0): 4.232 (18.56%)
Information in (0, 1.5): 12.428 (54.49%)
(b) Class Number
Figure 3.10: Item Information Criteria Analyses of Corpus-Based Items
42

the Japanese program. Pedagogically speaking, this approach is more suitable to observe
students’ progress in the program longitudinally.
The superior items with syntactic and semantic complexities functioned effectively
in this study. In both factorial and Rasch model analyses, these items required high L2
capability to be reproduced accurately. Interestingly, native speakers’ performance was
not significantly hindered with these items although their scores slightly decreased as
the item level increased. This is also a promising result because these items are totally
acceptable for these native speakers despite the syntactic and semantic complexities in-
herent in the language while non-native speakers’ performance is greatly affected by the
difficulties.
In the next chapter, I will discuss the development of the ASR-based EI grading
system in detail.
43

44

Chapter 4
Japanese EI Grading System and Results
4.1 System Development
As mentioned in Chapter 2, another important aspect in the development of the
automatic EI grading system is attaining high accuracy of dictation for reliable score gen-
eration based on the binary scoring protocol proposed by Graham (2006). To accomplish
this, we conducted a series of studies to develop a robust grading system through the
investigation of optimal language model (LM) creation. The first approach (System I)
uses LMs with very limited language resources based on the assumption that variation
in EI responses is small enough to produce desirable EI dictation with such LMs. The
second approach (System II), on the other hand, utilizes a large L1 corpus coupled with
the language resources used in System I to gain wider coverage to handle unexpected
EI repetitions. The third approach (System III) adds artificially created learner corpora
to System II to increase the capability to deal with interlanguage-influenced EI responses
more accurately. In this chapter, I will depict each approach according to the findings
from the previous Japanese EI studies and propose a method to enhance robustness of
the grading system.
4.2 System I: Grammar-Based Approach
Matsushita and LeGare (2010) investigated an ASR-based grading system for Japa-
nese EI (System I1) based on English EI studies conducted by Graham et al. (2008a) and
Lonsdale et al. (2009). In this study, we selected sixty Japanese EI items with appropri-
ate sentence lengths (10 – 25 morae) containing semantically generic lexical items (i.e.,
free from gender-oriented words, proper nouns and interjections) from SPOT (see 3.3.4).
1I call this System I to compare it easily with subsequent systems (System II and System III).
45
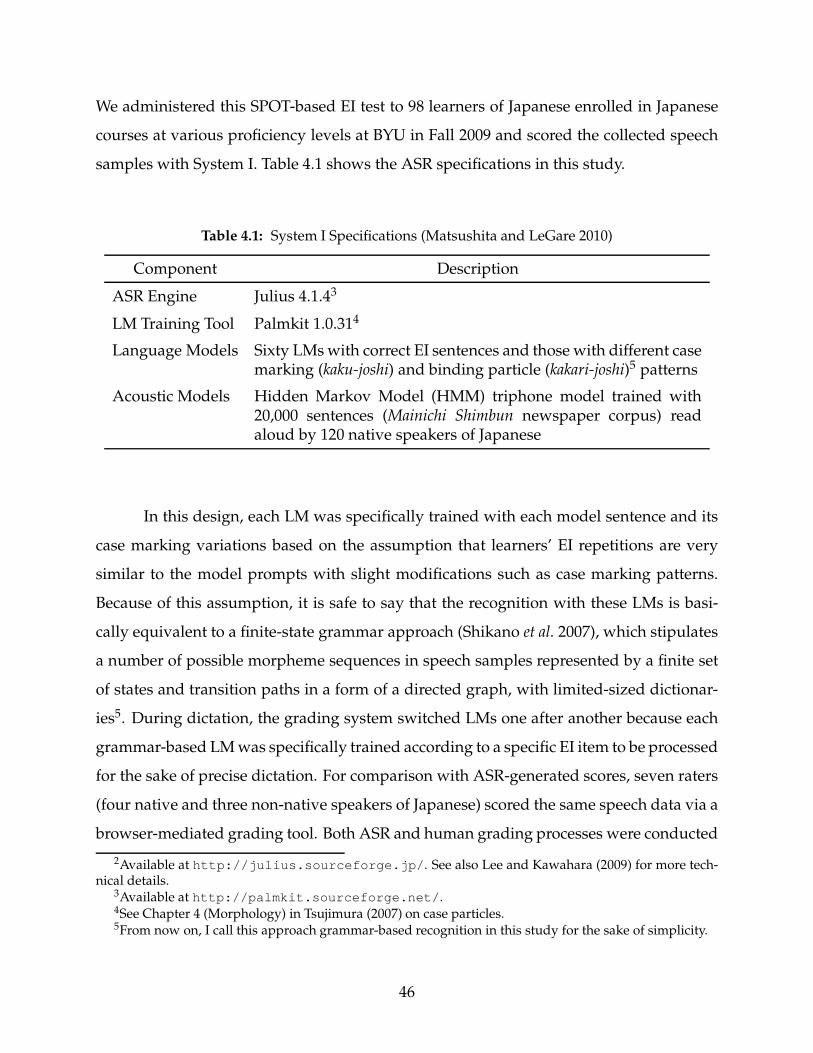
We administered this SPOT-based EI test to 98 learners of Japanese enrolled in Japanese
courses at various proficiency levels at BYU in Fall 2009 and scored the collected speech
samples with System I. Table 4.1 shows the ASR specifications in this study.
Table 4.1: System I Specifications (Matsushita and LeGare 2010)
Component Description
ASR Engine Julius 4.1.43
LM Training Tool Palmkit 1.0.314
Language Models Sixty LMswith correct EI sentences and those with different casemarking (kaku-joshi) and binding particle (kakari-joshi)5 patterns
Acoustic Models Hidden Markov Model (HMM) triphone model trained with20,000 sentences (Mainichi Shimbun newspaper corpus) readaloud by 120 native speakers of Japanese
In this design, each LM was specifically trained with each model sentence and its
case marking variations based on the assumption that learners’ EI repetitions are very
similar to the model prompts with slight modifications such as case marking patterns.
Because of this assumption, it is safe to say that the recognition with these LMs is basi-
cally equivalent to a finite-state grammar approach (Shikano et al. 2007), which stipulates
a number of possible morpheme sequences in speech samples represented by a finite set
of states and transition paths in a form of a directed graph, with limited-sized dictionar-
ies5. During dictation, the grading system switched LMs one after another because each
grammar-based LMwas specifically trained according to a specific EI item to be processed
for the sake of precise dictation. For comparison with ASR-generated scores, seven raters
(four native and three non-native speakers of Japanese) scored the same speech data via a
browser-mediated grading tool. Both ASR and human grading processes were conducted
2Available at http://julius.sourceforge.jp/ . See also Lee and Kawahara (2009) for more tech-nical details.
3Available at http://palmkit.sourceforge.net/ .4See Chapter 4 (Morphology) in Tsujimura (2007) on case particles.5From now on, I call this approach grammar-based recognition in this study for the sake of simplicity.
46

based on the binary scoring method proposed by Graham (2006). The screenshots of ASR
and human graders are shown in Appendix A.
In this grading process, either zero or one was assigned to each mora of all the
collected EI responses. To generate individual item and/or subject scores, Equation 4.1
below is used:
EI Score =
∑i
Mi
∑j
Mj
× 100 (i ≤ j) (4.1)
where ∑iMi indicates the total number of correctly pronounced morae and ∑jMj indi-
cates the total number of morae in an item or an entire test.
Based on the human- and ASR-generated binary values and EI scores with Equa-
tion 4.1, Matsushita and LeGare (2010) conducted two statistical analyses to examine
the effectiveness of System I. First, we produced the inter-rater reliability (IRR) statistics
based on Lonsdale et al. (2009) to observe differences between ASR and human binary
scores. We then analyzed the correlations of subject- and item-level scores to examine the
strength of the linear relationship. See Table 4.2 and the corresponding regression and
residual analyses shown in Figure 4.1.
Table 4.2: IRR and Correlation Analyses between Human and System I Scores in Matsushitaand LeGare (2010)
(a) IRR Analysis
IRR Statistic Value
Robinson’s R (%) 84.3
Unweighted κ 0.65
Rater Bias 0.53
(b) Correlation Analysis
n r r2 p
Subject-Level 98 0.98 0.9604 2.2× 10⁻¹⁶
Item-Level 5880 0.84 0.7056 2.2× 10⁻¹⁶
The strong correlation shown in Table 4.2 and Figure 4.1 above indicates that Sys-
tem I is capable of yielding reasonably accurate subject-level scores with the simple LMs.
47

Human Score (%)
AS
R S
core
(%
)
0 20 40 60 80 100
020
4060
8010
0
(a) Regression Analysis
0 20 40 60 80 100
−15
−5
05
1015
20
Fitted values
Res
idua
ls
Residuals vs Fitted
29
40
62
−2 −1 0 1 2
−2
−1
01
23
4
Theoretical Quantiles
Sta
ndar
dize
d re
sidu
als
Normal Q−Q
29
40
62
0 20 40 60 80 100
0.0
0.5
1.0
1.5
2.0
Fitted values
Sta
ndar
dize
d re
sidu
als
Scale−Location29
4062
0.00 0.02 0.04 0.06 0.08 0.10 0.12
−2
02
4
Leverage
Sta
ndar
dize
d re
sidu
als
Cook’s distance 0.5
0.5
1
Residuals vs Leverage
56
29
62
(b) Residual Analysis
Figure 4.1: Regression Analysis of Matsushita and LeGare (2010) (a) the scatterplot andcorresponding regression line and with human- and ASR-generated subject-level scores and(b) the corresponding residual analysis (Cook’s distance < 0.5)
However, the results also exhibit problems inherent in the grammar-based recognition.
As shown in 4.1(a), the lower-half of the ASR scores are rather favorably generated com-
pared with the human counterparts. Figure 4.2 depicts the situation more clearly.
As indicated in the first histogram, low ASR scores generally start around 40%
whereas human scores spread to lower than 40%, although the mean and standard devi-
ation of both scores are almost identical to each other. We concluded that this favorable
grading was caused by the grammar-based LMs, which lacked wider coverage to dictate
highly inaccurate EI responses due to learners’ low proficiency. Due to this limited dic-
tation capability, System I assigned wrongly pronounced morphemes to correct ones in
the recognition process, which led to better ASR scores than those of humans. Further,
these descriptive statistics indicate that there were a large number of high score achievers
in this EI test which caused a ceiling effect (Hughes 2003) with this SPOT-based EI test.
Matsushita and LeGare (2010) assumed this was because of low difficulty of the chosen
EI items. Refer also to Section 3.4 regarding this item difficulty issue.
48
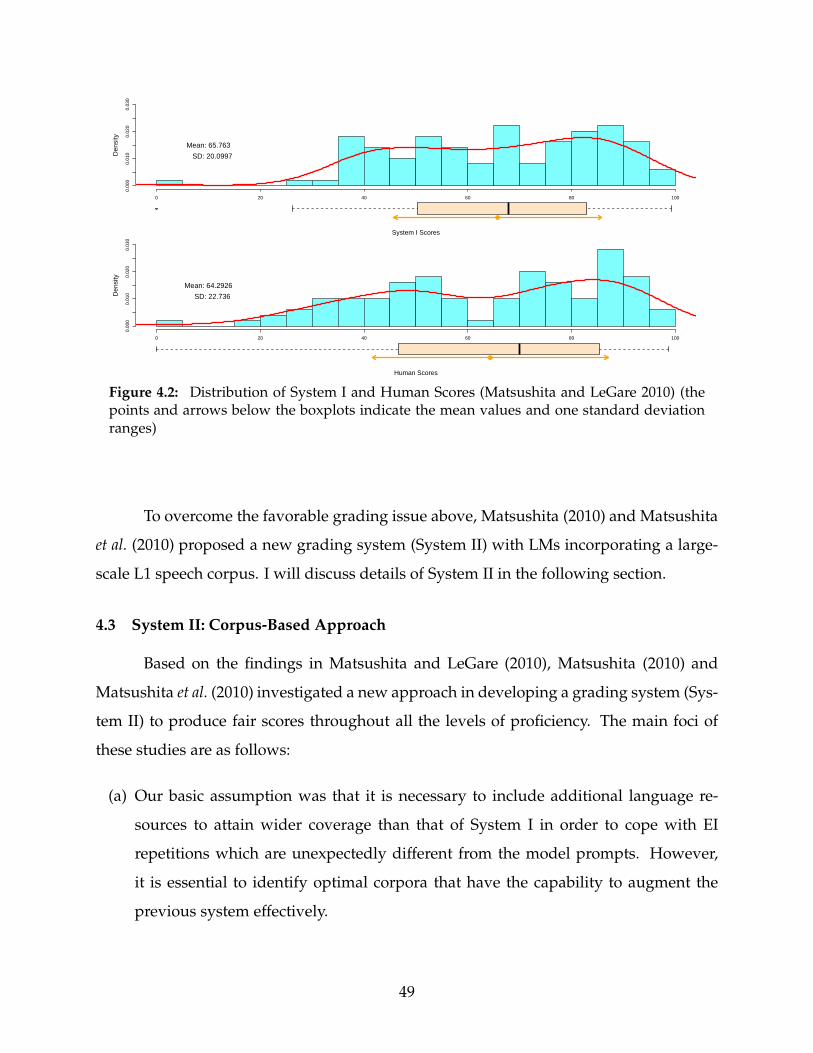
Den
sity
0 20 40 60 80 100
0.00
00.
010
0.02
00.
030
Mean: 65.763
SD: 20.0997
System I Scores
Den
sity
0 20 40 60 80 100
0.00
00.
010
0.02
00.
030
Mean: 64.2926
SD: 22.736
Human Scores
Figure 4.2: Distribution of System I and Human Scores (Matsushita and LeGare 2010) (thepoints and arrows below the boxplots indicate the mean values and one standard deviationranges)
To overcome the favorable grading issue above, Matsushita (2010) and Matsushita
et al. (2010) proposed a new grading system (System II) with LMs incorporating a large-
scale L1 speech corpus. I will discuss details of System II in the following section.
4.3 System II: Corpus-Based Approach
Based on the findings in Matsushita and LeGare (2010), Matsushita (2010) and
Matsushita et al. (2010) investigated a new approach in developing a grading system (Sys-
tem II) to produce fair scores throughout all the levels of proficiency. The main foci of
these studies are as follows:
(a) Our basic assumption was that it is necessary to include additional language re-
sources to attain wider coverage than that of System I in order to cope with EI
repetitions which are unexpectedly different from the model prompts. However,
it is essential to identify optimal corpora that have the capability to augment the
previous system effectively.
49

(b) Increasing LM coverage leads to more perplexity, or a increased number of possible
choices at any given point in the speech recognition processes, which may cause the
grading system to become more sensitive to subtle mispronunciations and cause
harsher grading even on EI responses deemed essentially correct by human raters.
Therefore, it is important to manipulate the distribution of word occurrences in the
training corpora to retain the dictation capability of System I.
Regarding (a), these studies chose to use CSJ, a large-scale corpus, briefly explained
in 3.5. Matsushita et al. (2010) report that CSJ has several advantages for EI system grad-
ing: (1) the corpus is composed of large-sized pure spoken data rather than written texts
such as newspapers, which is desirable in dealing with variations of EI responses as de-
scribed in 4.2, (2) a wide variety of speech-specific language phenomena including disflu-
ency features (e.g., fillers and fragments, repairs, word coalescence, vowel devoicing, etc.)
are precisely annotated, and (3) the language data are stored in an XML database, which
enables users to easily customize the provided linguistic information at their disposal.
Table 4.3 below summarizes the contents of the CSJ6.
Table 4.3: Summary of the Content of CSJ
Characteristic Description
# Speakers 1,417 (947 males and 470 females)
Types academic presentations, extemporaneous presentations,interviews, dialogues, reading transcriptions, etc.
# Hours 658.8
# Tokens 7.5 million
To incorporate the CSJ language data in the grading system, the lexical items and
corresponding annotation information were retrieved and converted to the text format
for LM training. A simple Perl script was used to retrieve the necessary language data
(morphemes, pronunciation, POS information, and so on) in 3,286 XML files in the CSJ
6The detailed specifications of CSJ are found in NINJAL (2006).
50

package and to reorganize the information according to the Cambridge-CMU toolkit for-
mat7, as shown in Figure 4.3.
(a) XML Format (b) Cambridge-CMU Toolkit Format
Figure 4.3: Format Conversion of CSJ Data
Regarding the perplexity issue mentioned in (b) above, Matsushita et al. (2010)
report that the occurrence of correct EI items in the LMs was increased to make those
sentences stochastically dominated in the training copora (at least 70% of the total size) to
ensure that the correct sentences would be favorably recognized. The other specifications
of System II are summarized in Table 4.4.
With this system, Matsushita et al. (2010) conducted the IRR and correlational anal-
yses with the same dataset used in Matsushita and LeGare (2010). Additionally, a second
round of human grading was conducted by three more native and non-native speakers of
Japanese for comparison. The results of the analyses are shown in Table 4.5 and Figure 4.4.
7See http://mi.eng.cam.ac.uk/ ˜ prc14/toolkit.html . Palmkit, the LM toolkit used in ourstudies, conforms to this format as well.
8Compared with the acoustic model used in Matsushita and LeGare (2010), Matsushita (2010) reportsthat the recognition accuracy of EI responses was significantly improved with this CSJ model. See alsoNanjo et al. (2004) for more technical details.
51
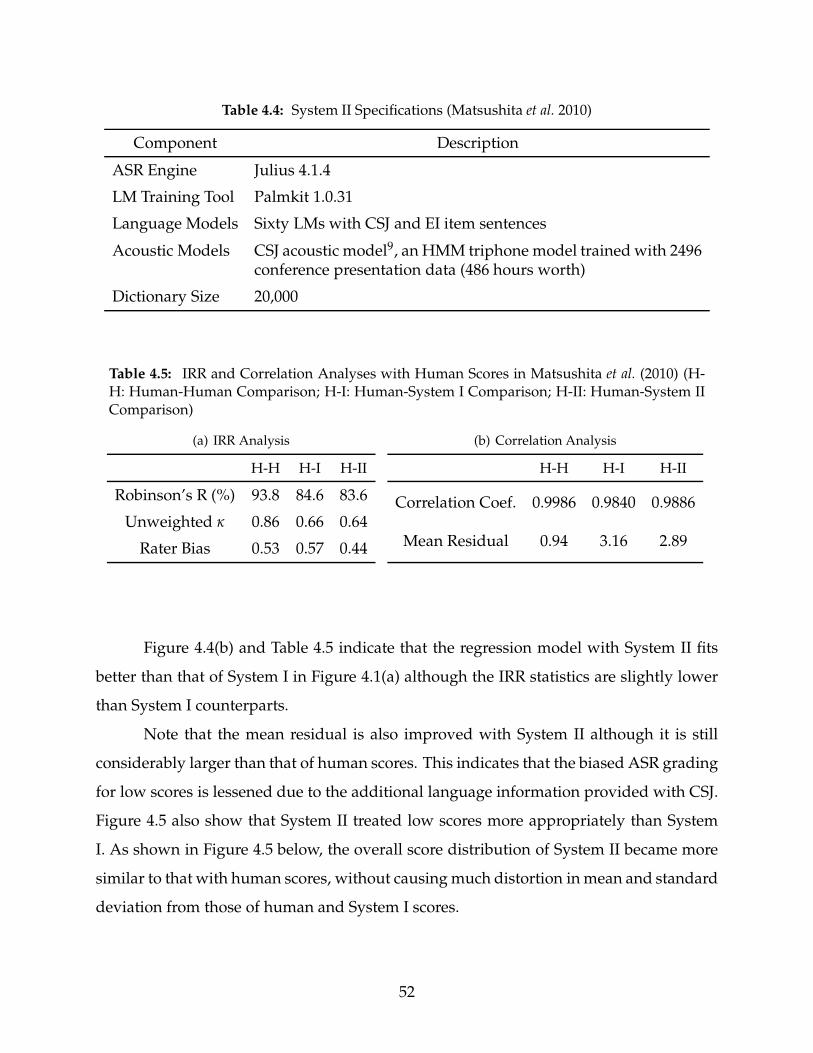
Table 4.4: System II Specifications (Matsushita et al. 2010)
Component Description
ASR Engine Julius 4.1.4
LM Training Tool Palmkit 1.0.31
Language Models Sixty LMs with CSJ and EI item sentences
Acoustic Models CSJ acoustic model9, an HMM triphone model trained with 2496conference presentation data (486 hours worth)
Dictionary Size 20,000
Table 4.5: IRR and Correlation Analyses with Human Scores in Matsushita et al. (2010) (H-H: Human-Human Comparison; H-I: Human-System I Comparison; H-II: Human-System IIComparison)
(a) IRR Analysis
H-H H-I H-II
Robinson’s R (%) 93.8 84.6 83.6
Unweighted κ 0.86 0.66 0.64
Rater Bias 0.53 0.57 0.44
(b) Correlation Analysis
H-H H-I H-II
Correlation Coef. 0.9986 0.9840 0.9886
Mean Residual 0.94 3.16 2.89
Figure 4.4(b) and Table 4.5 indicate that the regression model with System II fits
better than that of System I in Figure 4.1(a) although the IRR statistics are slightly lower
than System I counterparts.
Note that the mean residual is also improved with System II although it is still
considerably larger than that of human scores. This indicates that the biased ASR grading
for low scores is lessened due to the additional language information provided with CSJ.
Figure 4.5 also show that System II treated low scores more appropriately than System
I. As shown in Figure 4.5 below, the overall score distribution of System II became more
similar to that with human scores, without causingmuch distortion inmean and standard
deviation from those of human and System I scores.
52

1st Human Score (%)
2nd
Hum
an S
core
(%
)
0 20 40 60 80 100
020
4060
8010
0
(a) Human-Human Regression
Human Score (%)
AS
R S
core
(%
)
0 20 40 60 80 100
020
4060
8010
0
(b) Human-System II Regression
Figure 4.4: Regression Analysis of Matsushita et al. (2010) (a) the scatterplot and regressionline of 1st and 2nd human-graded scores and (b) 1st human and System II Counterpart (cf.Figure 4.1(a))
Den
sity
0 20 40 60 80 100
0.00
00.
010
0.02
00.
030
Mean: 63.1728
SD: 22.3493
System II Scores
Den
sity
0 20 40 60 80 100
0.00
00.
010
0.02
00.
030
Mean: 65.2026
SD: 23.0049
Human Scores
Figure 4.5: Distribution of System II and Human Scores (Matsushita et al. 2010) (cf. Figure 4.2)
The newly emerging issue is that the majority of ASR scores over 60% are lower
than those from humans, as shown in Figure 4.4(b). It is obvious that System II was in-
53

fluenced by the perplexity associated with the CSJ data, although the occurrences of cor-
rect sentences were significantly increased in the LMs. A possible explanation of this is
that disfluency phenomena (repair, fillers, etc.) and collocations that were unlikely in the
training data caused deviation from the actual EI responses due to the lack of such infor-
mation in the LMs while the system was determining word sequences based on n-gram
representations9. This assumption also indicates that there is a significant discrepancy be-
tween L1 and L2 production which cannot be filled with L1 speech corpora such as CSJ.
Therefore, it is necessary to consider incorporation of L2 language data to System II to
overcome the problem. In the following section, I discuss another grading system using
a machine-learning mechanism to maximize the effect of small learner corpus data.
4.4 System III: Analogical-Modeling Approach
This section will describe the most current grading system developed in the series
of Japanese EI studies so far, based on Matsushita and Tsuchiya (2011). The significant
characteristic of System III is the incorporation of EI transcription data using a machine-
learning system called analogical modeling (AM, Skousen 1989, Skousen et al. 2002). In
the following subsections, I will depict the rationale for this approach, compare this sys-
tem with the previous versions, and suggest future directions with this approach.
4.4.1 AM-Generated Corpora: AM as a “Virtual” Learner
The most reasonable solution to the problems observed by Matsushita et al. (2010)
is to integrate learner corpora in order to capture the speech patterns that occur particu-
larly in L2 production. The questions that need to be addressed here are (1) what types of
learner corpora are optimal for EI grading and (2) how can those corpora can be incorpo-
rated in the existing grading system to enhance its evaluation capability without losing
original advantages.
Regarding (1), it is obvious that the most reliable language resource for the system
development is EI transcription data obtained from past test administrations. The main
reason is that the most probable L2 irregularities that are likely to occur in the EI task
9See Manning and Schutze (2002:441) on beam search for more detail.
54

are easily obtained from the EI speech samples, whereas learner corpora available for
public use do not necessarily contain such L2 phenomena because of the high possibilities
of avoidance (Laufer and Eliassona 1993) if the language sources are from spontaneous
speech (e.g., Uemura 1998). Also, multiple speech samples of the same model prompts
are available from EI transcription data. This enables us to identify error patterns of
particular EI items that can be incorporated in new LMs.
The problem with the use of available transcription data is that the size is still sig-
nificantly small, which means that using the raw data for LM training does not provide
a probabilistic impact in the LMs especially when it is merged with large-scale corpora
such as CSJ. Therefore, it is necessary to develop a method to identify the characteristics
of EI speech observed in the transcription data and to artificially create EI responses con-
taining those characteristics in a systematic manner. A conventional approach to address
such a problem is creating either rule-based grammars or statistical n-gram models based
on the obtained data to enumerate all the possible sentence patterns. However, general-
izing grammars manually is quite difficult especially with L2 data, and it is also difficult
to obtain reasonable outputs with n-gram models based on such a small dataset as EI
transcription. To address this issue, Matsushita and Tsuchiya (2011) proposed use of ana-
logical modeling (AM, Skousen 1989, Skousen et al. 2002), an exemplar-based machine
learning system. The advantages of AM for creating artificial EI responses are summa-
rized as follows:
1. AM captures regularities in seemingly irregular language phenomena in a small
amount of language data. As described in 2.1.1, learners are highly likely to commit
certain speech errors in the EI repetitions when they imitate sentences in which the
contained morphosyntactic features exceed their current linguistic knowledge. Fur-
ther, it is natural to assume that the error patterns in EI responses exhibit some sort
of unified patterns unlike open-ended speech, if not perfectly regular, considering
the confined environment in the EI task. If this assumption is correct, AM is an ideal
tool to identify such regularities and suggest reasonably possible EI speech patterns
with the small amount of transcription data.
55
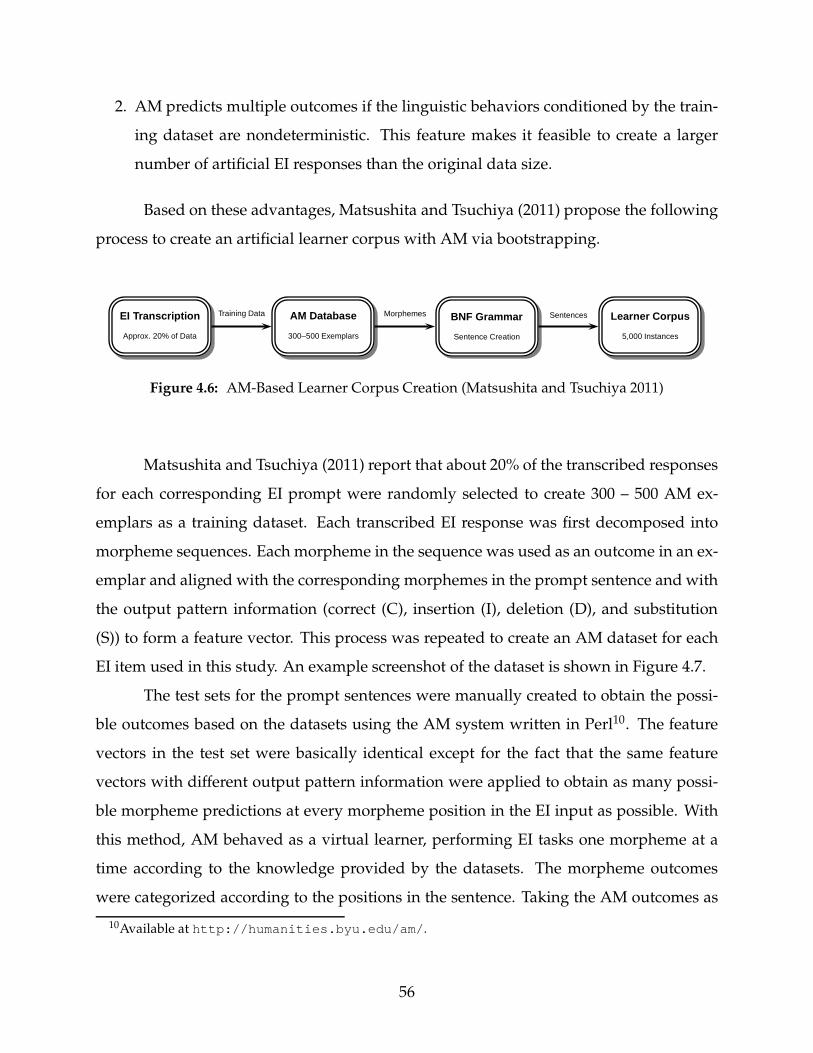
2. AM predicts multiple outcomes if the linguistic behaviors conditioned by the train-
ing dataset are nondeterministic. This feature makes it feasible to create a larger
number of artificial EI responses than the original data size.
Based on these advantages, Matsushita and Tsuchiya (2011) propose the following
process to create an artificial learner corpus with AM via bootstrapping.
EI Transcription
Approx. 20% of Data
AM Database
300–500 Exemplars
BNF Grammar
Sentence Creation
Learner Corpus
5,000 Instances
Training Data Morphemes Sentences
Figure 4.6: AM-Based Learner Corpus Creation (Matsushita and Tsuchiya 2011)
Matsushita and Tsuchiya (2011) report that about 20% of the transcribed responses
for each corresponding EI prompt were randomly selected to create 300 – 500 AM ex-
emplars as a training dataset. Each transcribed EI response was first decomposed into
morpheme sequences. Each morpheme in the sequence was used as an outcome in an ex-
emplar and aligned with the corresponding morphemes in the prompt sentence and with
the output pattern information (correct (C), insertion (I), deletion (D), and substitution
(S)) to form a feature vector. This process was repeated to create an AM dataset for each
EI item used in this study. An example screenshot of the dataset is shown in Figure 4.7.
The test sets for the prompt sentences were manually created to obtain the possi-
ble outcomes based on the datasets using the AM system written in Perl10. The feature
vectors in the test set were basically identical except for the fact that the same feature
vectors with different output pattern information were applied to obtain as many possi-
ble morpheme predictions at every morpheme position in the EI input as possible. With
this method, AM behaved as a virtual learner, performing EI tasks one morpheme at a
time according to the knowledge provided by the datasets. The morpheme outcomes
were categorized according to the positions in the sentence. Taking the AM outcomes as
10Available at http://humanities.byu.edu/am/ .
56
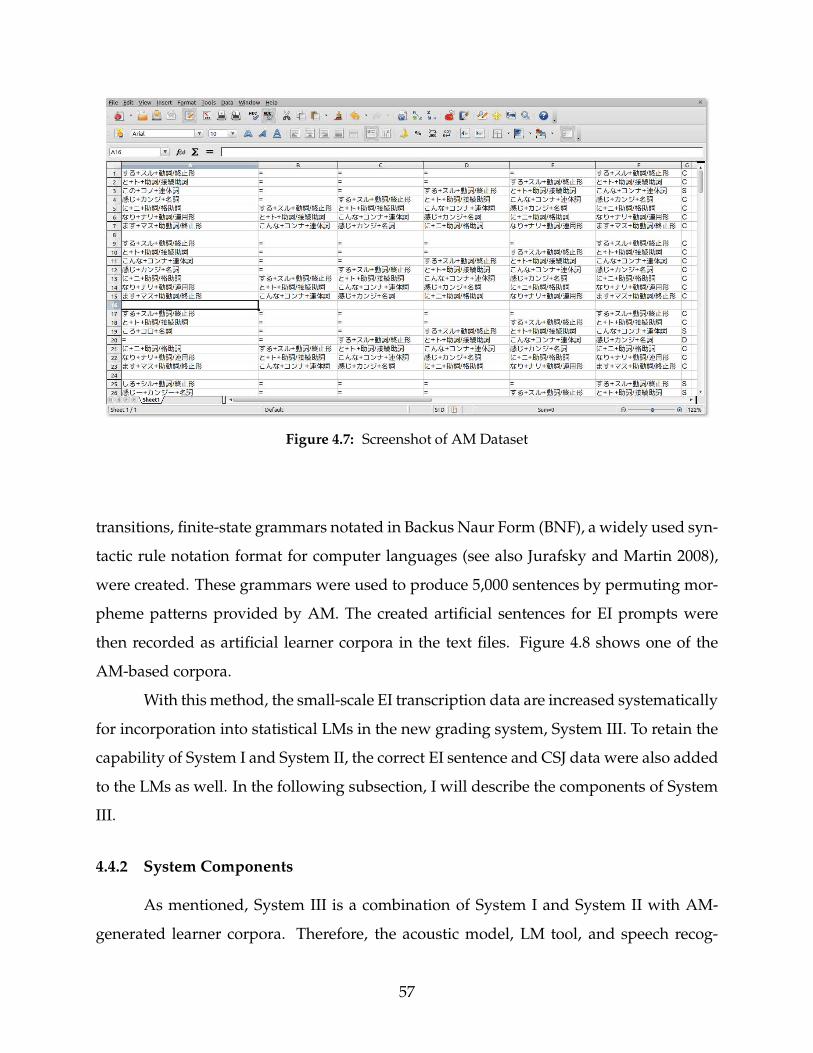
Figure 4.7: Screenshot of AM Dataset
transitions, finite-state grammars notated in Backus Naur Form (BNF), a widely used syn-
tactic rule notation format for computer languages (see also Jurafsky and Martin 2008),
were created. These grammars were used to produce 5,000 sentences by permuting mor-
pheme patterns provided by AM. The created artificial sentences for EI prompts were
then recorded as artificial learner corpora in the text files. Figure 4.8 shows one of the
AM-based corpora.
With this method, the small-scale EI transcription data are increased systematically
for incorporation into statistical LMs in the new grading system, System III. To retain the
capability of System I and System II, the correct EI sentence and CSJ data were also added
to the LMs as well. In the following subsection, I will describe the components of System
III.
4.4.2 System Components
As mentioned, System III is a combination of System I and System II with AM-
generated learner corpora. Therefore, the acoustic model, LM tool, and speech recog-
57

Figure 4.8: Example of AM-Generated Learner Corpus
nition engine are the same as System II, described in Table 4.411. Figure 4.9 shows the
schematic representation of System III. Note that EI sentences, CSJ, and AM-generated
corpora were all incorporated to create an item-specific LM to grade each EI item. This
process was repeated according to the number of EI items, as described in 4.2.
EI Sentence
AM-Generated Corpus
CSJ Data
LM ToolkitStatistical LM
&Dictionary
ASR Engine
EI Speech Sample
Acoustic Model
Dictation / ScoreConversion
EI Score
Figure 4.9: System III Schema (Matsushita and Tsuchiya 2011)
11Julius 4.1.5.1 was used for this study instead, but the functionality of it was about the same as theprevious version.
58

4.4.3 Method
The research design for this study is described below.
Participants. Two hundred and thirty nine learners who were enrolled in introductory-
to graduate-level Japanese courses offered at BYU in Fall 201012 participated in this study.
The majority of the participants (approx. 93%) are native speakers of English. The rest of
them are native speakers of Korean, Spanish, Chinese, or Japanese. The proficiency levels
of those learners were divided according to course numbers (100, 200, and 300 or above)
as follows.
Table 4.6: Subject Demographic
Class Level # Participants
100 82
200 35
300 or above 120
Native 2
Test Administration. The participants were asked to take the test during the two weeks
close to the end of the semester. The test was administered with Macintosh desktop
computers at the testing lab. The newly created sixty EI items13 were presented using
a computer-mediated testing tool, shown in Figure 4.10 below. This tool was preinstalled
in those lab computers before the test administration. The EI responses of the participants
were recorded as uncompressed .wav audio files and stored locally, and then uploaded
to server space with an applescript.
Grading. The audio files were downloaded from the server space to a local computer
for grading. Sampling frequencies, volumes, and bit rates were converted with SoX14,
12The number of subjects used in the analysis was decreased to 231 due to the poor quality of somerecordings in the data collection process.
13Along with the thirty corpus-based test items described in Chapter 3, additional thirty items retrieveddirectly from the textbooks cited in 3.6.1 were also used in this study.
14http://sox.sourceforge.net/
59

(a) Pre-Test Survey (b) EI Test
Figure 4.10: EI Tester
ffmpeg15 and normalize-audio16 for dictation with Julius. The grading system then pro-
cessed each audio file to produce dictation texts of EI responses and convert them to the
binary scores with a Perl script. The item- and subject-level EI scores were generated with
Equation 4.1. In addition, two native speakers of Japanese the transcribed EI responses
manually to facilitate IRR analyses shown in Table 4.7 below. The transcription data were
decomposed to morae withMeCab17, a Japanesemorphological analyzer and a Perl script
to conduct the binary grading. for score generation, and the binary scores were calculated
with the same grading protocol as ASR scores with Equation 4.1.
4.4.4 Results
The scores generated by the three grading systems were compared with IRR and
correlation analyses as in the previous studies (Matsushita and LeGare 2010, Matsushita
et al. 2010). As shown in Table 4.7, scores generated with System III exhibit the best agree-
15http://www.ffmpeg.org/16http://normalize.nongnu.org/17http://mecab.sourceforge.net/
60
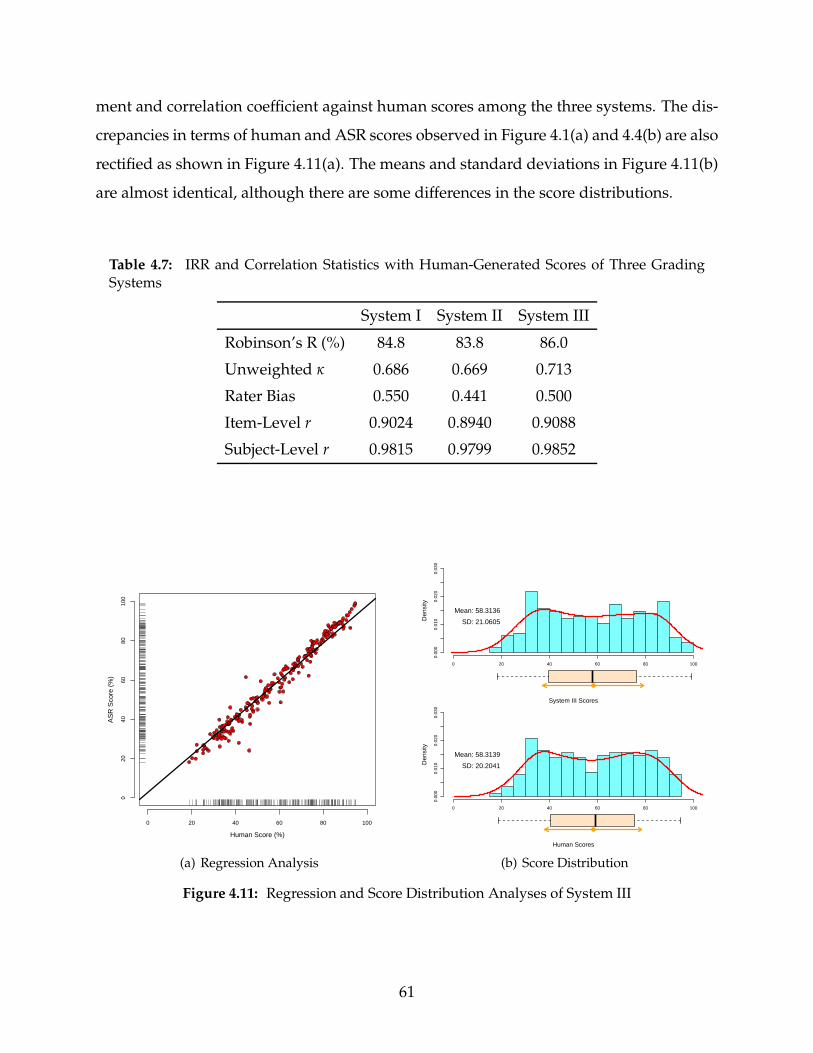
ment and correlation coefficient against human scores among the three systems. The dis-
crepancies in terms of human and ASR scores observed in Figure 4.1(a) and 4.4(b) are also
rectified as shown in Figure 4.11(a). The means and standard deviations in Figure 4.11(b)
are almost identical, although there are some differences in the score distributions.
Table 4.7: IRR and Correlation Statistics with Human-Generated Scores of Three GradingSystems
System I System II System III
Robinson’s R (%) 84.8 83.8 86.0
Unweighted κ 0.686 0.669 0.713
Rater Bias 0.550 0.441 0.500
Item-Level r 0.9024 0.8940 0.9088
Subject-Level r 0.9815 0.9799 0.9852
Human Score (%)
AS
R S
core
(%
)
0 20 40 60 80 100
020
4060
8010
0
(a) Regression Analysis
Den
sity
0 20 40 60 80 100
0.00
00.
010
0.02
00.
030
Mean: 58.3136
SD: 21.0605
System III Scores
Den
sity
0 20 40 60 80 100
0.00
00.
010
0.02
00.
030
Mean: 58.3139
SD: 20.2041
Human Scores
(b) Score Distribution
Figure 4.11: Regression and Score Distribution Analyses of System III
61

4.5 Discussion
In this chapter, I have discussed the development of the three ASR-based EI grad-
ing systems. As shown in 4.4, System III using AM for learner corpus creation is the most
effective grader among the three approaches. The significant aspect of System III is that
it improved the IRR and correlation statistics with only 20% of the entire transcription
data. Therefore, it is possible to enhance grading accuracy further by incorporating more
transcription data in the AM exemplars as more test iterations are conducted with the
same items. The best practice to ensure consistent grading performance with System III
is to use newly created items along with the actual items in test administrations in order
to obtain substantial transcription data with the collected speech samples. This process is
also useful to examine difficulty levels of those experimental items, thereby determining
whether they are optimal for future use. Therefore, both item and system development
can be investigated concurrently with this approach. See Figure 4.12.
Experimental Items
Test Items
Item Difficulty Analysis Retain/Discard Items
Manual Transcription AM Exemplars
System III Grading
Grading Results
Optimal Items
AM Learner Corpora
Figure 4.12: System III and Item Development Cycle
Further, the corpus-based item development approach discussed in Chapter 3 can
be combined effectively with the process of grading system refinement. Figure 4.13 shows
the comprehensive schema which combines Figure 4.12 and Figure 3.2. As shown in
Figure 4.13 below, the item creation process is connected to the item analysis and man-
62

ual transcription through EI test administration. The effectiveness of the experimental
items is investigated as conducted in this study, and the result will return to the proto-
type generation as feedback to the next item creation. Regardless of whether the exper-
imental items are optimal or not, the transcription data can be utilized for AM learner
corpus creation for the augmentation of System III, if the transcription contains ample
interlanguage-influenced production phenomena.
EI Test Administration
PrototypeGeneration
CorpusProcessing
Corpus Tool Selection /Adaptation
Experimental Items
Test Items
Item Difficulty Analysis
Factorial AnalysisRasch Model Analysis
Retain/Discard Items
Manual Transcription AM Exemplars
System III Grading
Grading Results
Annotated Corpus
Modification
Corpus Queries
Refinement
Analysis Results
Optimal Items
AM Learner Corpora
Figure 4.13: Combination of Corpus-Based Item Creation and System III
Thus, System III and the test items used in Chapter 3 are the components of the
current version of the testing and grading system developed through a series of Japanese
EI studies. Although there is still much room for improvement, this Japanese EI testing
system provides valuable information on learners’ proficiency in terms of L2 accuracy
based solidly on the targeted linguistic concepts using an automatic grading procedure.
The scores generated with this testing system integrate L2 accuracy information with SS
scores as fluency measurement for L2 proficiency assessment.
In the following chapter, I will discuss the SS system and the combination of EI
and SS results to measure L2 oral proficiency.
63

64

Chapter 5
Japanese Simulated Speech and its Combination with EI
5.1 Japanese Simulated Speech: Basic Approach
As described in Chapter 2, Simulated Speech (SS) is another method for oral pro-
ficiency measurement used in the field of language testing. In the previous two chapters,
I mentioned that EI is used to measure L2 oral accuracy by designing test items which
reflect learners’ L2 capability effectively and by carefully setting up the ASR system to
yield precise grading results. In this chapter, I will discuss the use of SS to measure L2
oral fluency, which is another aspect of L2 oral proficiency addressed by this system.
In Matsushita (2010), we investigated several fluency factors with EI speech samples, but
this attempt has not been fruitful simply because EI speech samples are too short to extract
desirable fluency features. The time lengths of EI repetitions produced by typical learn-
ers range from one to thirteen seconds with the prompts used in the current Japanese EI
test. Although some relevant features are observable with those EI speech samples (e.g.,
hesitation, fillers, length of repetitions, etc.), it is still difficult to retrieve a majority of the
fluency features enumerated in Table 2.2 from such short speech samples. On the other
hand, SS allows us to obtain various fluency features due to the less controlled speech
environment provided with this testing method, as discussed in 2.2.
There are several considerations in processing SS speech samples with ASR: (1) it
is unlikely that precise dictation with such open-ended speech samples will be accom-
plished, especially with samples produced by non-native speakers, and (2) learners’ per-
formance in SS depends on a wide variety of latent factors other than their pure L2 ca-
pability (e.g., prior knowledge of and/or experience with the topics presented by the test
items, etc.), which requires complex procedures to design appropriate test items for fair
grading (see Luoma 2004).
65

As mentioned in Chapter 1, the main reason for the separation of accuracy and
fluency measures with EI and SS is to overcome the limitation of ASR capability. By rel-
egating EI to L2 production accuracy measurement, the ASR system for SS is dedicated
solely to fluency feature extraction, and the problem (1) above is not as significant with
this approach. Although the SS system is still required to process speech samples with
a certain level of precision in dictation to retrieve several fluency features, this approach
enables us to develop the ASR system with more generic specifications than the EI coun-
terpart.
The item difficulty issue mentioned in (2) above is beyond the scope of this study
and still remains to be addressed in future studies. Therefore, I chose existing SS items
available for public use rather than creating original items, for the sake of simplicity. The
following section will describe the selected test items for this study.
5.2 SS Test Items
Test items used in this studywere selected from the Japanese SOPI test (CAL 1995),
with permission from the Center for Applied Linguistics. The effectiveness of these test
items has been thoroughly tested in actual SOPI administrations and they are deemed
viable items based on the analyses developed in a series of previous studies on SOPI
items for other languages (see Clark and Li 1986 and Stansfield et al. 1990).
These items are categorized in three groups according to task type: picture tasks,
topic tasks, and situation tasks (four picture tasks, five topic tasks, and five situation
tasks are enclosed in the test package). In the picture tasks, test takers are asked to pro-
vide detailed descriptions on the topics related to the presented pictures according to the
questions asked by a native speaker. In the topic tasks, questions on particular topics
(e.g., school life) are given, and the subjects are asked to answer the questions and give
the justifications for their answers. In the situation tasks, subjects are asked to imagine
that they are in particular situations described in the test directions and to play roles (e.g.,
offering advice, apologies, etc.) in the hypothetical situations. These items are also clas-
sified as Intermediate, Advanced, and Superior based on the anticipated task difficulty.
There are three Intermediate, eight Advanced, and three Superior items in the test.
66

Among these fourteen items, I chose five for the computerized SS test. Table 5.1
provides descriptions of the selected items.
Table 5.1: SS Test Item Descriptions (CAL 1995)
Test Item Level Prep. Time Response Time Task Type
Picture 1 Intermediate 15 sec. 1 min. 20 sec. Describe a typical shoppingmall to a Japanese tourist
Topic 1 Intermediate 15 sec. 45 sec. Give a description of thekind of weather he or shelikes
Situation 1 Intermediate 10 sec. 45 sec. State what kind of hotelroom he or she wants, statethe length of stay, and askabout restaurant hours
Topic 3 Advanced 20 sec. 1 min. 15 sec. Give a step-by-step descrip-tion of how a Japanese stu-dent can find a summer job
Situation 3 Superior 20 sec. 1 min. Apologize to a host motherfor returning home verylate after missing the lasttrain home
The criterion for choosing these test items is familiarity of the topics to the subjects.
All three Intermediate items were chosen for the Japanese SS test to ensure that even
low-level learners are able to produce a certain amount of speech with these tasks. I
also selected the other two high-level items based on consultation with an experienced
teaching assistant in the Japanese program, in order to select items with topics which
are covered in the class materials. The related assumption is that learners are able to
perform well in the test by applying their learning experience to these high-level but
familiar topics.
67

With these items, a study was designed to investigate the effectiveness of the pro-
posed Japanese SS system. I will describe the experiment, the system specifications, and
targeted fluency features in the following section.
5.3 Method
The overall data collection procedure and subject demographics were already de-
scribed in 4.4.3. The following sections provide additional detail concerning the SS test
administration in this study.
Participants. In addition to the 231 subjects described in Table 4.6, SS data were also
collected from twelve additional native speakers of Japanese using the same testing tool
explained in 4.4.3. Further, nineteen non-native subjects were randomly selected among
the 231 subjects to take OPI tests for comparison with EI and SS scores.
Testing Procedure. The testing procedure used in this study was basically identical to the
Japanese SOPI besides the fact that ours was computer-delivered. The SS items were pre-
sented to the subjects as the second portion of the speaking test following the completion
of the EI test discussed in Chapter 3 and Chapter 4. At the beginning, general instructions
were provided with the test administration tool to briefly explain the nature of SS. The
written instructions for each test item taken from the SOPI booklet were displayed on the
screen when the audio description of the item started. A picture was also presented in
a separate window for the picture task. After the audio instruction was completed for
an item, the preparation and response time were displayed in a countdown clock on the
screen in order for the test takers to be able to pace their thinking and speaking processes.
When the test takers reached the last five seconds in the response time, a small warn-
ing beep sounded. Once they finished an item, they were requested to press a button to
proceed to the next item. Figure 5.1 shows an example screenshot of the picture task.
The data management process is the same as described in 4.4.3. The SS speech
samples were saved as .wav files on the local desktops and uploaded to the designated
server space with a batch script along with the EI speech files.
68

Figure 5.1: Screenshot of Computer-Based Japanese SS Test
ASR Specifications for Fluency Feature Extraction. Because the collected data consisted
of open-ended speech, generic ASR components of Julius were used for fluency feature
extraction. A single language model trained with CSJ data (see 4.3 for more detail) was
incorporated in Julius to dictate all five test items. The acoustic model was the same as
the one used for Systems II and III, described in Table 4.4. By utilizing various types of
information provided in the dictation process, the following fluency features were ex-
tracted with Julius. The time frame counts (100 milliseconds per frame) provided during
the forced alignment processes were used to measure speech and silence lengths. Also,
the number of phonemes were counted in the test items from the forced alignment in-
formation as well. Regarding pauses, I used 400 milliseconds as a threshold to divide
continuous speech runs, based on the study by Freed et al. (2004). Julius denoted such
pauses as “<sp>” (i.e., a short pause) in the dictation outputs when it encountered si-
lence spans which exceeded the threshold in the recognition processes, as indicated in
Figure 5.2(a).
The number of pauses, tokens (the total number of morpheme instances), and
types (the number of unique morphemes) were counted by parsing the dictation results
with a Perl script in the post-processing stage. Regarding filled pauses, dictation results
69

(a) Output for Type, Token and Pause Counts (b) Output for Filler Counts
Figure 5.2: Screenshots of Dictated Speech Samples
with POS information tagged to the dictated morphemes (see 5.2(b)) were produced sepa-
rately to identify the filler instances efficiently. The information on the number of tokens,
types, and filled pauses provided by ASR dictation outputs was regarded to be satisfacto-
rily accurate, if not perfectly precise, for the analyses of L2 fluency in this study because
the main purpose of the ASR dictation for SS is to roughly differentiate types of mor-
pheme instances in the speech samples1 along with the extraction of temporal features.
Therefore, it is reasonable to assume that the approximate estimates of these L2 fluency
phenomena are readily attainable with this type of generic ASR system.
Feature Descriptions. Based on the dictation results obtained through the ASR procedure
above, the eleven fluency feature values listed in Table 5.2 were obtained. As mentioned
in 2.3, the rationale for extracting these features for fluency measurement are based on
previous studies by Xi et al. (2008) andHiggins et al. (2011), which assert that these fluency
features provide critical information on L2 proficiency in the evaluation process using
semi-direct oral tests such as SS.
1See the ASR output (Situation 1) shown in 5.2(a) to confirm the accuracy level of the dictation.
70

Table 5.2: Fluency Features Extracted with SS
Feature Description
(1) # Tokens Number of morpheme tokens in a test item
(2) # Types Number of morpheme types in a test item
(3) # Pauses Number of short pauses in speech
(4) Speech Length Total speech duration in a test item
(5) Silence Length Total length of silence in a test item
(6) Speech Rate Number of phonemes per second
(7) # Fillers Number of filled pauses in a test item
(8) # Runs Number of fluent speech runs in a test item
(9) Tokens per Run Number of tokens normalized by fluent speech runs
(10) Speech Time per Run Speech length normalized by fluent speech runs
(11) Types per Speech Length Number of types normalized by speech length
5.4 Analysis
In this section, I examine the eleven fluency features described in the previous
section in an effort to develop an optimal SS grading method using a two-step approach.
First, I use two machine learning (ML) systems to determine the most influential features
for score calculation. Second, based on the study conducted by Higgins et al. (2011), a
simple score generation model with the selected features is proposed.
5.4.1 First Stage: Machine Learning Process
Unlike EI analyses laid out in Chapter 3 and 4, there are no human-evaluated
scores or ratings for benchmarks in this SS study. Therefore, a different approach to pro-
cess the data is required for the development of SS score generation. The first step I use
for SS scoring is using two ML systems to identify the most significant fluency factors.
For this approach, I use TiMBL (Daelemans and van den Bosch 2005), and WEKA (Hall
et al. 2009), ML tools extensively utilized to address NLP problems.
71

TiMBL is a amemory-basedmachine learning system based on the k-nearest neigh-
bor (k-NN) algorithm. This tool is frequently used to address problems with language
phenomena which are unsolvable with conventional rule-based, theoretical approaches
(e.g., Ernestus and Baayen 2003). The strength of this system is the use of a statistical
model based on the given unstructured data to predict the general behavioral patterns
based on the model. This tool is desirable for this SS analysis because it has the capabil-
ity to order the features according to the amount of information gained in the training
process. This capability enables us to identify the most influential features for SS score
generation.
To analyze the obtained fluency data with TiMBL, the feature vectors were created
and stored as input files, as shown in Figure 5.3.
Figure 5.3: TiMBL Feature Vectors
The eleven fluency features of each test item response were aligned according to
the order shown in Table 5.2 to form a feature vector. Here the class level of the sub-
ject in Table 4.6 was considered as the output of each vector, based on the assumption
that the class level is an approximation of the subject’s proficiency level. The class level
information was placed at the end of each vector.
The formed feature vectors were consolidated to create datasets for statistical learn-
ing. The datasets were classified as (a) those with the twelve additional native speakers’
data mentioned in 5.3 and (b) those without them. The learning process was conducted
72

with these datasets containing the vectors for each test item and those with all the test
items combined. For the analysis, I used the leave-one-out validation process to obtain
the results.
Table 5.3 shows the results of the TiMBL predictions. As shown, the prediction
accuracy of (a) is higher than (b), due to the addition of twelve native speakers. The most
important aspect of these results is the five influential factors indicated in the last two
columns. Although the order of the variables is slightly different, the same five fluency
features (# Tokens, # Types, # Pauses, # Fillers, and # Runs) are considered as influential
in all the datasets.
Table 5.3: TiMBL Results (the numbering of variables corresponds to Table 5.2; the order ofthe five variables is according to the information gain ratio/values)
Top 5 Influential VariablesTest Item (a) With 12 NS (b) Without 12 NS(a) (b)
Picture 1 0.754630 0.710744 2, 7, 8, 3, 1 8, 2, 7, 3, 1Topic 1 0.768519 0.702479 3, 8, 2, 7, 1 8, 3, 2, 7, 1Situation 1 0.717593 0.661157 7, 2, 8, 3, 1 8, 2, 7, 3, 1Topic 3 0.800926 0.753086 8, 3, 2, 7, 1 3, 8, 2, 1, 7Situation 3 0.708333 0.669421 8, 2, 3, 7, 1 8, 7, 3, 2, 1All 0.922517 0.715670 2, 8, 3, 1, 7
Further, to confirm that the five features found with the TiMBL models are also
influential in the other framework, the same datasets were processed with WEKA, a data
mining system using various decision tree models constructed via the support vector
machines (SVM, see Burges 1998).
The J48 classification method (C4.5 decision tree models) was used for this anal-
ysis. The results in Table 5.4 show the prediction accuracy rates based on the created
decision trees. It clearly shows that the prediction rates between the trees with all the
features and with the five features are almost identical. This trend is shown in datasets
both with and without the twelve additional native speakers. Therefore, it is safe to say
that these five fluency features are the most dominant factors inmaking predictions about
73

learners’ proficiency levels and other features are inconsequential for score generation in
this study.
Table 5.4: WEKA Results
Prediction Accuracy Rate (%)
Test Item With 12 NS Without 12 NS
All Features 5 Features All Features 5 Features
Picture 1 86.1111 82.8704 80.5785 80.1653Topic 1 82.4074 79.6296 78.9256 76.4463Situation 1 80.5556 79.1667 76.4463 71.9008Topic 3 84.2593 81.4815 81.4185 78.6008Situation 3 83.3333 81.9444 80.5785 76.8595All 89.3916 82.0593 79.8061 74.7981
5.4.2 Second Stage: Score Generation
In the second stage, the fluency features identifiedwith theML processes above are
used to generate SS scores for individual subjects. Unlike EI, calculation is not straight-
forward because it is necessary to identify a particular calculation formula with these fea-
tures to combine them and yield reasonable scores. Again, the conventional regression
model is not appropriate for this analysis due to the lack of human-graded scores.
Higgins et al. (2011) analyzed the features in Table 2.2 to develop a multiple regres-
sion model with human- and ASR-generated scores of the TOEFL iBT speaking test items.
Table 5.5 shows the features that they selected according to statistical significance in the
model and the associated mathematical treatment to normalize each feature and to yield
the best fit with the regression model. Note that these score calculation features in Ta-
ble 5.5 aside from amscore and lmscore2 include the majority of the ML-selected features
in Table 5.3.
2Zechner et al. (2009) mention that although these features were incorporated in their scoring process asin 5.5, they cannot be significant numbers evenwith the mathematical treatment because of the probabilisticnature. Therefore, I simply ignore these features in this study.
74

Table 5.5: Features of Regression Model and Mathematical Treatment in Higgins et al. (2011)(see also Table 2.2)
Feature Calculation Assigned Weight Transformation
amscore3 logP(x|w) 4 Inverse
wpsec # TokensItem Time Length 2 —
tpsecutt# Types
Speech Length 2 —
wdpchk# Types# Runs 1 Logarithmic
lmscore α × logP(x) + β × N 1 Inverse
It is reasonable to assume that these weights and mathematical treatments in Ta-
ble 2.2 are also applicable to the SS score generation in this study. One concern about
their approach is, however, that the calculation of tpsecutt and wdpchk are highly likely
to interact with each other due to the same numerator used in the calculation. Therefore,
I change one of the these formulas by incorporating the # Fillers feature, which is not in-
corporated in this table. Thus, the SS score generation formula is defined as in Table 5.6.
Table 5.6: SS Score Generation Features
SS Score Factor Calculation
Factor 1 ( f1) 2× # TokensItem Time Length
Factor 2 ( f2) 2× # Tokens−# TokensSpeech Length
Factor 3 ( f3) log(# Types# Runs
)
SS Score = ∑i
fi
3See Kawahara and Lee (2005) for the detail of the probabilistic calculation of AM and LM scores.
75

# Pauses is not incorporated in this formula. The reasons for this are because (1)
I assume that pause counts generally interact strongly with # Runs because they appear
alternatively in speech samples, and (2) this feature seems not to behave monotonically
(either a constant increase or decrease according to the class levels), which makes it quite
complex to develop a particular mathematical treatment for it. Figure 5.4 depicts the dis-
tribution of pausesmade by the subjects in all five SS items. Interestingly, this pause count
feature is salient only with the 300-level subjects in terms of the mean and distribution,
but other subject groups’ are similarly distributed. Because of this peculiar characteristic,
this feature is excluded for the calculation in this study.
Class Level
Pau
se C
ount
L100 L200 L300 Native
010
2030
4050
6070
80
Figure 5.4: Pause Count Distribution (the points and arrows on the boxplots indicate themean values and one standard deviation ranges)
5.4.3 Results
Based on the formula in Table 5.4.2 above, SS scores for the 231 subjects were
generated. Figures 5.5(a) and (b) show the SS item score differences according to class
76

levels and the interaction between the item type and the class level based on the associ-
ated factorial ANOVA results. The differences for test items and for class levels are both
statistically significant (FItem Type(4,222) = 4.5478, p < 0.001 and FClass Level(3,222) = 311.2628,
p < 0.0001, respectively). However, the differences in test items are not uniformly signif-
icant according to the Tukey post hoc test (only Topic 1–Situation 1 and Topic 3–Topic 1
pairs, p < 0.01). Therefore, the stipulated item difficulties of the five SOPI items used in
this study (see Section 5.2) do not affect subjects’ SS scores generated with the calculation
method above.
L100 L200 L300 Native L100 L200 L300 Native L100 L200 L300 Native L100 L200 L300 Native L100 L200 L300 Native
05
1015
20
Picture 1 Topic 1 Situation 1 Topic 3 Situation 3
SS
Sco
re
(a) SS Item Score Distribution
Item Type
Mea
n of
SS
Sco
res
Native Subjects300−Level Subjects200−Level Subjects100−Level Subjects
Picture 1 Topic 1 Situation 1 Topic 3 Situation 3
46
810
1214
16
(b) Item Type – Class Level Interaction
Figure 5.5: SS Score Distribution (a) the score differences according to item type and classlevel (b) the interaction between item type and class level
77

Figures 5.6(a) and (b) show the differences and distribution of the total scores of
the five SS items. The ANOVA analysis shows that the difference between the class level
groups are significantly different (FClass Level(3,222) = 108.1, p < 0.0001). Also, the associ-
ated Tukey HSD analysis indicates that the differences among all the subject groups are
significant (the p values are ranging from 0.03 to less than 0.0001). Further, the score dis-
tribution exhibited in Figure 5.6(b) seems bimodal, but the Anderson-Darling (AD) test
indicates its strong normality with p < .0001 (A = 2.297). Therefore, it is safe to say that
this SS score generation method is reasonably useful in measuring learners’ performance
concerning the ML-selected features in an efficient manner.
100 200 300 Native
2040
6080
Class Level
SS
Sco
re
(a) Score Differences
Den
sity
0 20 40 60 80
0.00
00.
005
0.01
00.
015
0.02
00.
025
0.03
0
Mean: 40.122
SD: 16.642
SS Score
(b) Score Distribution
Figure 5.6: SS Total Score Differences (a) Total score differences according to class levels (b)Distribution of SS scores
5.5 Combination of EI and SS Scores
Finally, I will discuss the combination of the EI scores obtained with System III,
discussed in Chapter 4, and the SS scores above. Figure 5.7(a) indicates the simple two-
dimensional distribution of these scores. There is a moderate correlation between these
scores (r = 0.83), but the regression model itself is not statistically significant (p = 0.974).
78

This is promising because it indicates that these two types of language testing method-
ologies focus on different but weakly related aspects of L2 oral production.
Figure 5.7(b) shows the same scatterplot superimposedwith nineteen subjects’ OPI
ratings on the associated EI–SS scores. The OPI ratings are indicated with the initials
(NM: Novice-Mid, NH: Novice-High, IL: Intermediate-Low, IM: Intermediate-Mid, IH:
Intermediate-High, and AL: Advanced-Low). Additionally, the two native speakers are
regarded as Superiors in this analysis, and their scores are marked as SP. As shown, the
Novice-level scores are clustered in the lower-left portion of the graph; the Intermediate-
level scores are on the middle to the upper-right portion; and the Advanced to Superior
scores are located around the upper-right edge. Interestingly, EI scores for one subject
with an AL rating are almost identical to the native speakers’, but the corresponding SS
score is clearly lower than theirs. The opposite phenomenon can be observed with an-
other AL subject’s SS score: the SS score is close to the those of native speakers’, but the
corresponding EI score is lower than theirs. Therefore, it is possible to observe some char-
acteristics associated with OPI ratings and EI–SS scores with this simple score alignment
method.
SS Score
EI S
core
0 10 20 30 40 50 60 70 80
020
4060
8010
0
(a) Scatterplot
SS Score
EI S
core
SPSP
AL
IH
AL
IM
IHIH
IM
NHNH
IL
NH
NH
NHNH
NM
NM
NM
NH
NM
0 10 20 30 40 50 60 70 80
020
4060
8010
0
(b) Scatterplot with OPI Ratings
Figure 5.7: Scatterplot of EI and SS Score (a) the simple scatterplot of EI and SS scores and(b) the scores superimposed with the associated OPI ratings
79

An alternative comparison strategy is to use the discrete EI scoring method dis-
cussed in 3.6.3 to differentiate proficiency groups more clearly. To illustrate the score
distribution, I calculated EI binary scores based on the following procedure:
1. As described in 3.6.3, the item scores are separated according to the item levels and
and class numbers in Table 3.2.
2. The binary scores are added if the subject attains 80% of accuracy on all the items in
the item level or class number. If this is not the case, the scores are not included in
the total scores.
3. The accumulated binary scores satisfying the condition in (2) are processed with
Equation 4.1.
Figures 5.8(a) and (b) depict the EI–SS score distribution with the discrete scoring
method above. Overall, the class number approach is more conservative than the item
level counterpart, and the majority of the EI scores in Figure 5.8(b) are lower than (a). The
ratings on the right side of each score cluster tend to be higher than those on the left side.
The significant aspect of this grading approach is that the AL rating with the low EI score
is more clearly separated from those of native speakers in both Figure 5.8(a) and (b) than
that in Figure 5.7, which enables us to observe the difference of advanced-level learners
from (near-)native speakers more easily.
Although it is still impossible to discriminate test takers in the same classification
levels as the OPI (i.e., ten sublevels), this EI–SS approach provides a good estimation of
the L2 oral proficiency in a very effective manner. Lastly, Figure 5.9 shows the approx-
imate OPI rating distribution pattern according to Figure 5.8(b). Because of the scarcity
of OPI ratings in this study, OPI ratings with Novice Low, Advanced Mid, Advanced
High were not available. Therefore, the OPI distribution clusters including those ratings
shown in Figure 5.9 are based solely on my assumption. Definitely, more data are needed
to investigate the effectiveness of this EI–SS approach in further research.
80

SS Score
EI S
core
SPSP
ALIH
AL
IMIHIH
IM
NHNHIL
NH
NH
NHNH
NM
NM
NMNH
NM
0 10 20 30 40 50 60 70 80
020
4060
8010
0
(a) Class Level
SS ScoreE
I Sco
re
SPSP
AL
IH
AL
IMIHIH
IM
NHNHIL
NH
NH
NHNH
NMNM
NMNH
NM
0 10 20 30 40 50 60 70 80
020
4060
8010
0
(b) Class Number
Figure 5.8: Discrete EI Scoring and OPI Ratings (a) The OPI distribution in the class level EIand SS scores (b) The OPI distribution in the class number EI and SS scores
SS Score
EI S
core
Novice Low(?) − High
Novice High − Intermediate Mid
Intermediate Mid − Advanced Low
Advanced Low − High(?)
Superior
0 10 20 30 40 50 60 70 80
020
4060
8010
0
Figure 5.9: Approximate OPI Rating Distribution in EI–SS Scoring Method
81

82

Chapter 6
Conclusion
6.1 Significance of This Study
In this study, I discussed an approach to measuring L2 oral proficiency using two
separate testing and scoring methods, and I addressed the effectiveness of these two
methods from various perspectives. This proposed approach is innovative compared
to many of the existing computer-mediated oral language testing systems because these
systems put great emphasis only on structured speech tasks which heavily circumscribe
the speech patterns of test takers (e.g., Bernstein et al. 2010, Muller et al. 2009) or on com-
pletely open-ended speech tasks (Cucchiarini et al. 2000). The twomost significant aspects
of this study are (1) combining structured and open-ended speech tasks, namely EI and
SS, as a joint speaking test and administering it with a computer-based testing system,
and (2) evaluating the speech samples obtained through the test administration with two
ASR-based grading systems, which are configured independently to maximize the ASR
capability to observe L2 oral proficiency globally, as schematized in Figure 1.1.
From a language administration point of view, there are several advantages of us-
ing EI and SS as an integrated test battery as follows:
1. Unlike typical oral interviews, test takers are allowed to have multiple “fresh starts”
(Hughes 2003) during the EI/SS test by providing a substantial number of test items
(thirty EI and five SS items), which is frequently pointed out as one of the character-
istics of effective oral tests.
2. The combination of EI and SS helps increase the face validity of the test, which is
hardly guaranteed with only structured speech tasks such as EI.
83
3. The test administration is very time-efficient. The required time for completion of a
single test is less than thirty minutes. This indicates that a substantial number of test
takers are able to complete the test within a day if multiple computers with good
quality headsets are available.
Also, the following are advantages from the perspective of test evaluation:
1. The grading process is virtually automatic with the ASR systems. Although it takes
several hours to complete the entire grading process, this is much more time- and
cost-efficient than evaluating the speech samples with human labor, which is favor-
able for language institutions with fewer resources.
2. Unlike criterion-referenced tests, the EI/SS results are strictly numeric due to the
objective and analytic nature of the test. Therefore, the test results are applicable
to both longitudinal and cross-sectional studies to examine learners’ progress and
compare their performance.
3. The speech samples collected in the test administration can be used later for quali-
tative studies as well. These samples are useful in various situations such as when
educators or researchers need to investigate learners’ particular characteristics (e.g.,
error-making patterns) in the EI and SS tasks. It is also possible to conduct similar
qualitative studies to the one illustrated in 3.4 (see also Matsushita et al. 2010), ex-
amining the relationship between learners’ test performance and their learning ex-
perience. In fact, the findings obtained through such qualitative analyses are highly
important and necessary for further testing and grading procedure refinement.
These advantages clearly indicate that the ASR-based EI/SS testing system de-
veloped in this study is a solution for the time- and cost-efficiency problems posed in
Chapter 1. However, it is still premature to say that this testing system is a satisfactory
alternative to existing interview-based tests, which can offer us more details regarding
L2 oral proficiency. The following discussion will describe some of the limitations of the
system proposed in this research.
84
6.2 Limitations of This Study
The following points summarize some of the issues that have not been addressed
in this study:
1. Clearly, not all the L2 accuracy factors listed in 1.2 are encompassed in EI. For ex-
ample, pronunciation accuracy is not considered in this study although this factor
plays some role in the ASR processing. To refine EI grading, it is necessary to investi-
gate what types of pronunciation patterns were unacceptable to human graders and
how those phonologically abnormal EI responses were treated with the EI grading
system through qualitative analyses. Also, no accuracy factors related to social and
cultural appropriateness, such as vocabulary choice in a particular context, are taken
into account in either EI or SS due to the test format and grading capability. There-
fore, it is not possible to incorporate such factors with the current EI and SS grading
criteria. Ideally, these features should be obtained and processed through SS, which
provides test takers with a less-controlled speech environment; however, it is not
feasible for the current SS system to accurately capture and incorporate such factors
in evaluation due to its heavy emphasis on fluency features and the system con-
figuration. Presumably, this may be the main reason that there were no significant
differences in SS scores among the five SS items, as indicated in Figure 5.5(a).
2. Related to the issue above, the critical disadvantage of the current SS gradingmethod
is that the system is not able to scrutinize the content of the produced speech before
extracting fluency features for grading. Therefore, there is no method to identify
situations where learners speak about unrelated matters and to avoid grading such
speech samples.
3. Further, this study does not discuss a systematic method for SS item creation al-
though this is also a critical aspect for constantly developing new versions of the
test for the future administrations.
4. Test score calibration processes against existing oral tests such as OPIs have not been
thoroughly conducted. In this study, I mainly used class levels as rough approxi-
85

mations for proficiency levels, which are obviously not perfect correlates with OPI
ratings. Therefore, it is critically important to conduct further statistical analyses
to increase the reliability and validity of the EI/SS test and produce scores closely
comparable with such oral tests.
The limitations enumerated above clearly show that there are still many issues to
be addressed to improve the current EI/SS testing system in order to ensure more effec-
tive testing and grading processes. Needless to say, it is critically important to conduct
further literature review and data collection in order to identify possible solutions to these
issues.
6.3 Future Work
Along with the limitations described in the previous section, the development of
new tools and the addition of language resources are the other issues to be considered
in future studies. To realize more fine-tuned testing and scoring systems, the following
future work and suggested possible approaches need to be investigated.
6.3.1 Manual Transcription Tool
Regarding the EI grading system, manual transcription is essential to create AM
training datasets for LM development and to identify new optimal EI items through item
analyses, as schematized in Figure 4.13. The problem inherent in this process is, however,
that it is difficult to unify the transcription notations (e.g., kanji vs. hiragana, etc.) among
human transcribers, which often makes annotation with NLP tools unstable and conse-
quently impede the AM exemplar creation process. To stabilize transcription processes,
the development of a comprehensive transcription tool to assist transcribers is necessary.
One could envision a tool that suggests desirable transcription notations according to the
transcribers’ input based on the previously transcribed data and conducts annotation of
the transcribed EI responses under the CSJ annotation standard concurrently.
86

6.3.2 SS Scoring Improvement
In this study, I used the formula proposed by Higgins et al. (2011) to generate SS
scores based on the fluency features selected by TiMBL and WEKA, the ML systems.
Although this approach satisfactorily functioned for proficiency estimation, there is much
room for further improvement of score generation in various aspects. For example, I
did not take into account the weights on relevant fluency features provided by TiMBL,
which may contain important information for SS scoring, because the order of the fluency
features are uniquely varied for each test item. In this study, I treated these features
equally in the scoring process. This might be another reason that there were no significant
difference among item types in terms of score distribution, as indicated in Figure 5.5(a).
Therefore, it is reasonable to assume that the combination of these weights and the feature
valuesmay yieldmore effective SS item and total scores than the current version’s. Also, it
may be possible to integrate the # pauses feature into the score calculation, which was not
attempted in this study due to the peculiar distribution pattern illustrated in Figure 5.4,
by utilizing its corresponding weight in the calculation process. To investigate this, it is
necessary to develop or improve the current score calculation methods. This study should
be conducted be conducted in the immediate future.
6.3.3 Simultaneous EI/SS Scoring
It is desirable to grade EI and SS items during the test administration in order to
provide test takers with scores upon the completion of the test. This is also advantageous
for test administrators as well because it accelerates the entire evaluation procedure by
delegating the scoring processes to multiple local computers used for testing, rather than
spending several hours for grading with a single computer. This is attainable by incor-
porating the core libraries of Julius to the test administration tool described in 4.4.3. In
theory, it is possible that the incoming speech is processed as direct input via microphone
and the dictation results for binary scoring are produced as each item is completed. The
audio input can be exported as .wav files at the same time for other processes such as
87

transcription. This is reasonably attainable by leveraging incorporated functions in the
Julius libraries and plugins.
6.3.4 Acoustic Model Training
Dealing with speech samples containing the test takers’ English utterances1 with
the current ASR system is another problem with the grading processes. Although it is im-
possible to identify all the possible L1 utterances that can occur in the EI and SS tasks, in-
corporating common English expressions often used during EI and SS performance in the
acoustic model can reduce the influence on grading results. de Wet et al. (2010) conducted
a study of acoustic model development to process accented English speech samples with
ASR. They report that incorporating accent features to the acoustic model does not sig-
nificantly increase overall recognition accuracy. However, considering the appreciable
difference in the phonological patterns between English and Japanese, it is worthwhile to
investigate integration of English speech instances to the CSJ acoustic model using HTK
Toolkit2 in future studies.
6.3.5 Language Model Training for SS grading
In this study, I used a generic LM trained only with the CSJ data for the SS feature
extraction procedure, based on the rationale mentioned in 5.3. However, it is still neces-
sary to increase recognition accuracy to ensure retrieval of more accurate token, type and
pause counts, which are among the most influential fluency factors in this study. Also,
recognition accuracy in SS grading is inseparably tied to the issues of the vocabulary pat-
tern identification for discrimination of unrelated speech (see section 6.2). To improve
the grading system in this respect, it is important to incorporate corpus data containing
instances related to SS item topics. The main issue for this LM development is collecting
appropriate corpus data. A possible approach for this task is selecting language data with
a web tool based on context-vector models (see Billhardt et al. 2002), frequently used in
1I focus only on English here because the majority of our subjects are native speakers of English.2http://htk.eng.cam.ac.uk/
88

information retrieval. If this LM augmentation approach is possible, we will be able to in-
tegrate pragmatic and sociolinguistic factors into the current SS evaluation criteria, which
are considered as important aspects of L2 proficiency along with accuracy and fluency in
many interview tests.
6.3.6 EI Item Creation Tool
In Chapter 3, I discussed the corpus-based approach to create optimal EI items
and its effectiveness. One of the weaknesses in this approach is that the available cor-
pora are not necessarily able to provide item candidates with particular types of syntactic
and semantic structures; therefore, it is possible that users may not find desired sentences
with this approach. A possible solution for this problem is creating an item engineer-
ing tool which consolidates syntactic fragments obtained from corpora to form possible
EI candidates. In some respect, this approach resembles the item engineering method
discussed in 3.4. The main difference, however, is developing a method engineering sen-
tences based on corpus data, rather than creating items according to linguistic intuitions
only. An eventual solution would require as input various NLP resources such as a lex-
ical conceptual structure (LCS) database3, Japanese WordNet4, subcategorization frame
dictionaries5, and so forth.
6.4 Comprehensive EI/SS Schema
Figure 6.1 shows a comprehensive schematic representation of the current EI/SS
testing and grading system as it would incorporate the new functions and tools suggested
in the previous section. It is necessary to conduct a number of empirical studies and sys-
tem refinement processes to ensure the robustness of such a system to reach the optimal
level of functionality. The ideal system depicted here will probe L2 learners’ oral profi-
ciency in a more effective manner and provide valuable information on their L2 speaking
ability for various purposes.
3http://cl.it.okayama-u.ac.jp/rsc/lcs/4http://nlpwww.nict.go.jp/wn-ja/index.en.html5http://www.gsk.or.jp/catalog/GSK2007-D/catalog.html
89

EI / SS Test Administration
PrototypeGeneration
CorpusProcessing
Corpus Tool Selection /Adaptation
Item Creation Tool
EI Experimental Items
EI Test Items
SS Test Items
SS Feature Extraction
SS Grading
Topic-Based LMs
SS Item Creation
Language Resources
Item Difficulty Analysis
Factorial AnalysisRasch Model Analysis
Retain/Discard Items
Manual Transcription
Manual Transcription ToolAM Exemplars
Optimized AcousticModel
System III Grading
Combined Grading Results
L2 Oral Proficiency
Annotated Corpus
Modification
Refinement
Analysis Results
Optimal Items
AM Learner Corpora
Figure 6.1: Comprehensive Schema of Computerized Japanese Oral Testing System
90

References
ACTFL. 1999. Oral Proficiency Interview Tester Training Manual. New York: AmericanCouncil on the Teaching of Foreign Languages.
Bader, Markus, and Josef Bayer. 2006. Introducing the human sentence processing mech-anism. Case and Linking in Language Comprehension, volume 34, 19–47. SpringerNetherlands.
Beigi, Homayoon. 2009. Computer rating of oral test responses using Verbosity. TechnicalReport RTI-20091211-01, Recognition Technologies.
Bernstein, Jared, Alistair VanMoere, and Jian Cheng. 2010. Validating automated speak-ing tests. Language Testing 27.355–377.
Billhardt, Holger, Daniel Borrajo, and Victor Maojo. 2002. A context vector model forinformation retrieval. Journal of the American Society for Information Science andTechnology 53.236–249.
Bley-Vroman, Robert, and Craig Chaudron. 1994. Elicited imitation as a measure ofsecond-language competence. Research Methodology in Second-Language Acquisi-tion, ed. by Elaine Tarone, Susan M. Gass, and Andrew D. Cohen, 245–261. Hillsdale,NJ: Lawrence Erlbaum.
Brown, James D. 1988. Understanding research in second language learning. CambridgeLanguage Teaching Library. Cambridge, UK: Cambridge University Press.
Burges, Christopher J.C. 1998. A tutorial on support vector machines for pattern recogni-tion. Data Mining and Knowledge Discovery 2.121–167.
CAL. 1995. Japanese simulated oral proficiency interview. Center for Applied Linguistics.
Carroll, David W. 2008. Psychology of Language. Belmont, CA: Thompson Wadsworth,5th edition.
Chambers, Francine. 1997. What do we mean by fluency? System 25.535–544.
Chaudron, Craig. 2003. Data collection in SLA research. The Handbook of SecondLanguage Acquisition, ed. by Catherine J. Daughty and Michael H. Long, 762–821.Malden, MA: Blackwell Publishing.
——, Matthew Prior, and Uli Kozok. 2005. Elicited imitation as an oral proficiencymeasure. Paper at presented 14th World Congress of Applied Linguistics, Madison,Wisconsin.
91

Chomsky, Noam. 1977. On wh-movement. New York: Academic Press.
——. 1981. Lectures on Government and Binding: The Pisa Lectures. Holland: ForisPublications.
Christensen, Carl, Ross Hendrickson, and Deryle Lonsdale. 2010. Principled construc-tion of elicited imitation tests. Proceedings of the 7th Conference on InternationalLanguage Resources and Evaluation (LREC ’10), ed. by Nicoletta Calzolari, KhalidChoukri, Bente Maegaard, Joseph Mariani, Jan Odijk, Stelios Piperidis, Mike Rosner,and Daniel Tapias, 233–238. Valetta, Malta: European Language Resources Associa-tion (ELRA).
Clark, John L.D., and Ying-che Li. 1986. Development, validation, and disseminationof a proficiency-based test of speaking ability in Chinese and an associated assess-ment model for other less commonly taught languages. Washington, DC: Center forApplied Linguistics.
Comrie, Bernard. 2010. Japanese and the other languages of the world. NINJAL ProjectReview 1.29–45.
Cucchiarini, Catia, Helmer Strik, and Lou Boves. 2000. Quantitative assessment of sec-ond language learners’ fluency bymeans of automatic speech recognition technology.Journal of the Acoustical Society of America 107.989–999.
Daelemans, Walter, and Antal van den Bosch. 2005. Memory-Based Language Process-ing. Cambridge, UK: Cambridge University Press.
de Wet, Febe, Pieter Muller, Christa van der Walt, and Thomas Niesler. 2010. Segmen-tation and accuracy-based scores for the automatic assessment of oral proficiency forproficient l2 speakers. Proceedings of the 21st Annual Symposium of the PatternRecognition Association of South Africa (PRASA), 75–80, Stellenbosch, South Africa.
DeKeyser, Robert M. 2005. What makes learning second-language grammar difficult? areview of issues. Language Learning 55.1–25.
Doran, Harold C. 2005. The information function for the one-parameter logistic model:Is it reliability? Educational and Psychological Measurement 65.665–675.
Ellis, Rod. 1993. The Study of Second Language Acquisition. Oxford University Press.
——. 2005. Measuring implicit and explicit knowledge of a second language. Studies inSecond Language Acquisition 37.141–172.
——. 2008. Investigating grammatical difficulty in second language learning: Implicationsfor second language acquisition research and language testing. International Journalof Applied Linguistics 1.4–22.
——. 2010. Does explicit grammar instruction work? NINJAL Project Review 1.3–22.
92

Erlam, Rosemary. 2006. Elicited imitation as a measure of L2 implicit knowledge: Anempirical validation study. Applied Linguistics 27.465–491.
——. 2009. The elicited imitation test as a measure of implicit knowledge. Implicit andexplicit knowledge in second language learning, testing and teaching, ed. by RodEllis, chapter 3, 65–92. Bristol, UK: Multilingual Matters.
Ernestus, Mirajam, and R. Harald Baayen. 2003. Predicting the unpredictable: Interpret-ing neutralized segments in Dutch. Language 79.5–38.
Ford-Niwa, Junko, and Noriko Kobayashi. 1999. SPOT: A test measuring “control”exercised by learners of Japanese. The Acquisition of Japanese as a Second Language,ed. by Kazue Kanno, 53–69. Amsterdam, Netherlands: John Benjamins PublishingCompany.
Forster, Ken I. 1987. Binding, plausibility, andmodularity. Modularity in knowledge rep-resentation and natural language understanding, ed. by Jay L. Garfield. Cambridge,MA: MIT Press.
Fraser, Colin, Ursula Bellugi, and Roger Brown. 1963. Control of grammar in imitation,comprehension, and production. Journal of Verbal Learning and Verbal Behavior2.121–135.
Freed, Barbara F., Norman Segalowitz, and Dan P. Dewey. 2004. Context of learning andsecond language fluency in French: Comparing regular classroom, study abroad andintensive domestic immersion programs. Studies in Second Language Acquisition26.275–301.
Furui, Sadaoki, Masanobu Nakamura, Tomohisa Ichiba, and Koji Iwano. 2005. Anal-ysis and recognition of spontaneous speech using Corpus of Spontaneous Japanese.Speech Communication 47.208–219.
Garcıa-Amaya, Lorenzo. 2009. New findings on fluency measures across three differentlearning contexts. Selected Proceedings of the 11th Hispanic Linguistics Symposium,ed. by Joseph Collentine, Maryellen Garcıa, Barbara Lafford, and Francisco M.Marın,68–80, Somerville, MA.
Graham, C. Ray. 2006. An analysis of elicited imitation as a technique for measuring orallanguage proficiency. Selected Papers from the Fifteenth Internation Symposium onEnglish Teaching, 57–67. Taipei, Taiwan: English Teachers Association.
——, Deryle Lonsdale, Casey Kennington, Aaron Johonson, and Jeremiah McGhee.2008a. Elicited imitation as an oral proficiency measure with ASR scoring. Proceed-ings of the Sixth International Conference on Language Resources and Evaluation(LREC ’08), 57–67, Marrakech, Morocco.
——, Jeremiah McGhee, and Benjamin Millard. 2008b. The role of lexical choice inelicited imitation item difficulty. Proceedings of Second Language Research Forum(SLRF), 57–67.
93

Hall, Mark, Eibe Frank, Geoffrey Holmes, Bernhard Pfahringer, Peter Reutemann,and Ian H. Witten. 2009. The WEKA data mining software: An update. SIGKDDExplorations 11.
Hansen, Lynne. 2001. Language attrition: The fate of the start. Annual Review of Ap-plied Linguistics, ed. by Mary McGroarty, volume 21, 60–73. Cambridge: CambridgeUniversity Press.
——, and Joshua Rowe. 2006. A computerized test of oral language proficiency: De-velopment of an automated instrument. Readings in Second Language Pedagogyand Second Language Acquisition: In Japanese Context, ed. by Masashi Negishi,Tae Umino, and Asako Yoshitomi, 75–82. Amsterdam, Netherlands: John BenjaminsPublishing Company.
Hendrickson, Ross, Meghan Eckerson, Aaron Johnson, and Jeremiah McGhee. 2008.What makes test items difficult? – A syntactic, lexical and morphological study ofelicited imitation test items. Proceedings of the Second Language Research Forum(SLRF).
Higgins, Derrick, Xiaoming Xi, Klaus Zechner, and David M.Williamson. 2011. A three-stage approach to the automated scoring of spontaneous spoken responses. Com-puter Speech and Language 25.282–306.
Housen, Alex, and Folkert Kuiken. 2009. Complexity, accuracy, and fluency in secondlanguage acquisition. Applied Linguistics 30.461–473.
Hughes, Arthur. 2003. Testing for Language Teachers. Cambridge, UK: CambridgeUniversity Press, 2nd edition.
Iwatate, Masakazu, Masayuki Asahara, Toshio Morita, and Yuji Matsumoto. 2011.ChaKi.NET [corpus search and management tool]. http://sourceforge.jp/projects/chaki/ .
Jamieson, Joan. 2005. Trends in computer-based second language assessment. AnnualReview of Applied Linguistics 25.228–242.
Jessop, Lorena, Wataru Suzuki, and Yasuyo Tomita. 2007. Elicited imitation in secondlanguage acquisition research. The Canadian Modern Language Review 64.215–220.
Jorden, Eleanor H., and Mari Noda. 1987. Japanese: The Spoken Language, Part 1. NewHaven, CT / London: Yale University Press.
——, and——. 1988. Japanese: The Spoken Language, Part 2. NewHaven, CT / London:Yale University Press.
——, and——. 1990. Japanese: The Spoken Language, Part 3. NewHaven, CT / London:Yale University Press.
94

Jurafsky, Daniel, and James H. Martin. 2008. Speech and Language Processing. UpperSaddle River, NJ: Prentice Hall, 2nd edition.
Kageyama, Taro. 1993. Bunpou to gokeisei [Grammar and word formation]. Tokyo: HitujiShobou.
——. 2010. Typology of compounds and the uniqueness of Japanese. NINJAL ProjectReview 1.5–27.
Kawahara, Tatsuya, and Akinobu Lee. 2005. Open-source speech recognition soft-ware Julius (<special issue> a software toolbox for research activity(2)). Journalof Japanese Society for Artificial Intelligence 20.41–49.
Keenan, Edward L., and Bernard Comrie. 1977. Noun phrase accessibility and universalgrammar. Linguistic Inquiry 8.63–99.
Keller-Cohen, Deborah. 1981. Elicited imitation in lexical development: Evidence from astudy of temporal reference. Journal of Psycholinguistic Research 10.273–288.
Kenyon, Dorry M., and Valerie Malabonga. 2001. Comparing examinee attitudes to-ward computer-assisted and other oral proficiency assessment. Language Learning& Technology 5.60–83.
Kobayashi, Noriko, Junko Ford-Niwa, and Hilofumi Yamamoto. 1996. Nihongo noatarashii sokuteihoo SPOT [SPOT: A new method for measuring Japanese ability]. Sekaino Nihongo Kyooiku [Japanese Education in the World] 6.201–218.
Koike, Dale. A. 1998. What happens when there’s no one to talk to? Spanish foreignlanguage discourse in simulated oral proficiency interviews. Talking and testing:Discourse approaches to the assessment of oral proficiency, ed. by Richard YoungandAgnesW.He, 70–98. Amsterdam, Netherlands: John Benjamins Publishing Com-pany.
Koponen, Matti, and Heidi Riggenbach. 2000. Overview: Varying perspectives on flu-ency. Perspectives on Fluency, 5–24. The University of Michigan Press.
Kormos, Judit, and Mariann Denes. 2004. Exploring measures and perceptions of fluencyin the speech of second language learners. System 32.145–164.
Kurohashi, Sadao, and Makoto Nagao. 2003. Building a Japanese parsed corpus. Tree-banks: building and using parsed corpora, ed. by Anne Abeille, chapter 14, 249–260.Dordrecht: Kluwer Academic Publishers.
Laufer, Batia, and Stig Eliassona. 1993. What causes avoidance in L2 learning. Studiesin Second Language Acquisition 15.35–48.
Laver, John. 1994. Principles of phonetics. Cambridge, UK: Cambridge University Press.
95

Lee, Akinobu, and Tatsuya Kawahara. 2009. Recent development of open-source speechrecognition engine Julius. Asia-Pacific Signal and Information Processing Associa-tion Annual Summit and Conference.
Lee, Kai-Fu. 1989. Automatic speech recognition: The development of the SPHINXsystem. Boston, MA: Kluwer Academic Publishers.
Levelt, Willem J. M. 1995. The ability to speak: from intentions to spoken words. Euro-pean Review 3.13–23.
Lonsdale, Deryle, Dan P. Dewey, Jeremiah McGhee, Aaron Johnson, and Ross Hen-drickson. 2009. Methods of scoring elicited imitation items: an empirical study.Paper presented at American Association for Applied Linguistics (AAAL), Denver,CO.
Luoma, Sari. 2004. Assessing Speaking. Cambridge Language Assessment Series. Cam-bridge, UK: Cambridge University Press.
Maddieson, Ian. 2005. Issues of phonological complexity: Statistical analysis of the re-lationship between syllable structures, segment inventories and tone contrasts. UCBerkeley Phonology Lab Annual Report.
Maekawa, Kikuo. 2003. Corpus of Spontaneous Japanese: Its design and evaluation.Proceedings of IEEE Workshop on Spontaneous Speech Processing and Recognition,7–12, Tokyo.
Malabonga, Valerie, Dorry M. Kenyon, and Helen Carpenter. 2005. Self-assessment,preparation and response time on a computerized oral proficiency test. LanguageTesting 22.59–92.
Malone, Margaret E. 2007. Oral proficiency assessment: The use of technology in testdevelopment and rater training. Center for Applied Linguistics.
——, and Megan J. Montee. 2010. Oral proficiency assessment: Current approaches andapplications for post-secondary foreign language programs. Language and Linguis-tics Compass 4.972–986.
Manning, Christopher D., and Hinrich Schutze. 2002. Foundations of Statistical NaturalLanguage Processing. Cambridge, MA: The MIT Press, 5th edition.
Matsumoto, Yo. 1996. Complex predicates in Japanese: A syntactic and semantic studyof the notion “word”. Stanford, CA / Tokyo: Center for the Study of Language andInformation / Kuroshio.
Matsushita, Hitokazu. 2010. Computerized oral testing: Optimal models for elicitedimitation in Japanese. Paper presented atNorthwest Linguistics Conference (NWLC)2010, Surrey, BC, Canada.
96

——, and Matthew LeGare. 2010. Elicited imitation as a measure of Japanese L2 profi-ciency. Paper presented at Association of Teachers of Japanese (ATJ), Philadelphia,PA.
——, Deryle Lonsdale, and Dan Dewey. 2010. Japanese elicited imitation: ASR-basedoral proficiency test and optimal item creation. Corpus, ICT and Language Edu-cation, ed. by George R. S. Weir and Shin’ichiro Ishikawa, 161–172. Glasgow, UK:University of Strathclyde Publishing.
——, and Shinsuke Tsuchiya. 2011. The development of effective language models foran EI-based L2 speaking test: Capturing Japanese interlanguage phenomena withASR technology. Paper presented at American Association for Applied Linguistics(AAAL), Chicago, IL.
McCready, Eric, and Norry Ogata. 2007. Evidentiality, modality and probability. Lin-guistics and Philosophy 30.147–206.
McDade, Hiram L., Martha A. Simpson, and Donna Elmer Lamb. 1982. The use ofelicited imitation as ameasure of expressive grammar: A question of validity. Journalof Speech and Hearing Disorders 47.19–24.
McNamara, Tim. 2000. Language Testing. Oxford Introductions to Language Study.Oxford, UK: Oxford University Press.
Miyamoto, Edson T. 2008. Processing sentences in Japanese. Oxford Handbook ofJapanese Linguistics, ed. by Shigeru Miyagawa and Mamoru Saito, chapter 9, 217–249. New York: Oxford University Press.
Muller, Pieter, Febe de Wet, Christa van der Walt, and Thomas Nielser. 2009. Automat-ically assessing the oral proficiency of proficient L2 speakers. Proceedings of SLaTE2009.
Nagatomo, Kentaro, Ryuichi Nishimura, Kumiko Komatsu, Yuka Kuroda, AkinobuLee, Hiroshi Saruwatari, and Shikano Kiyohiro. 2001. Complemental backoff algo-rithm for merging language models. IPSJ SIG Notes 2001.49–54.
Naiman, Neil. 1974. The use of elicited imitation in second language acquisition research.Working Paper on Bilingualism 2.1–37.
Nakayama,Mineharu. 2002. Sentence processing. TheHandbook of Japanese Linguistics,ed. by Natsuko Tsujimura, 398–424. Malden, MA: Blackwell Publishing.
Nanjo, Hiroki, Tatsuya Kawahara, Takahiro Shinozaki, and Sadaoki Furui. 2004.Onsei ninshiki no tame no onkyoo moderu to gengo moderu no shiyoo [Specifica-tions of Language and Acoustic Models for Speech Recognition]. http://www.kokken.go.jp/katsudo/seika/corpus/public/manuals/asr.pdf , National Insti-tute for Japanese Language and Linguistics.
97

Newfields, Tim. 1994. Oral proficiency testing: One approach for college classes. TokaiUniversity Foreign Language Education Center Journal 14.185–190.
NINJAL. 2006. Nihongo hanashikotoba kopasu no kochikuho [The construction ofthe Corpus of Spontaneous Japanese]. http://www.ninjal.ac.jp/products-k/katsudo/seika/corpus/csj_report/CSJ_rep.pdf , National Institute forJapanese Language and Linguistics.
O’Loughlin, Kieran J. 2001. The equivalence of direct and semi-direct speaking tests.Studies in Language Testing. Cambridge, UK: Cambridge University Press.
Sawa, Takashi. 2005. Comprehension of the relative clause structure in Japanese: Ex-perimental examination for Japanese sentence processing by the self-paced readingmethod. Proceedings of Tokyo Gakugei University 56.329–333.
Sawasaki, Koichi. 2009. Nihongo gakushuusya no kankeisetsu rikai: Eigo, kankokugo,chuugokugo bogo wasya no yomi jikan kara no koosatsu [Processing of relative clausesby learners of Japanese: a study on reading times of English/Korean/Chinese L1 speakers].Daini Gengo to shite no Nihongo no Shuutoku Kenkyuu [Acquisition of Japanese as aSecond Language] 12.86–106.
Segalowitz, Norman. 2010. Cognitive Bases of Second Language Fluency. CognitiveScience and Second Language Aquisition Series. New York: Routledge.
Shibatani, Masayoshi. 1990. The languages of Japan. Cambridge, UK: Cambridge Uni-versity Press.
Shikano, Kiyohiro, Katsutada Ito, Tatsuya Kawahara, Kazuya Takeda, and Mikio Ya-mamoto. 2007. Onsei Ninshiki Shisutemu [Speech Recognition System]. Tokyo, Japan:Ohmsha, 7th edition.
Shohamy, Elana. 1994. The validity of direct versus semi-direct oral tests. LanguageTesting 11.99–123.
Shohamy, Elena, Chambers Gordon, Dorry M. Kenyon, and Charles W. Stansfield. 1989.The development and validation of a semi-direct test for assessing oral proficiency inHebrew. Bulletin of Hebrew Higher Education 4.4–9.
Skousen, Royal. 1989. Analogical Modeling of Language. Dordrecht: Kluwer AcademicPublishers.
——, Deryle Lonsdale, and Dilworth B. Parkinson. 2002. Analogical Modeling: Anexemplar-based approach to language. Amsterdam/Philadelphia: John BenjaminsPublishing Company.
Stansfield, Charles W., Dorry M. Kenyon, Ricardo Paiva, Fatima Doyle, Ines Ulsh, andMaria A. Cowles. 1990. Development and validation of the Portuguese speaking test.Hispania 73.641–651.
98

Tomita, Yasuyo, Wataru Suzuki, and Lorena Jessop. 2009. Elicited imitation: To-ward valid procedures tomeasure implicit second language grammatical knowledge.TESOL Quarterly 43.345–349.
Tsujimura, Natsuko. 2007. An Introduction to Japanese Linguistics. Malden, MA: Black-well Publishing, 2nd edition.
Uemura, Ryuichi. 1998. Uemura Corpus. http://www.env.kitakyu-u.ac.jp/corpus/ .
Valian, Virginia, and Sandeep Prasada. 2006. Direct object predictability: Effects onyoung children’s imitation of sentences. Journal of Child Language 33.247–269.
Vinther, Thora. 2002. Elicited imitation: A brief overview. International Journal ofApplied Linguistics 12.54–73.
Watabe, Masakazu. 1979. Nihongo ga umaku naru hon [Toward better Japanese]. Tokyo:Bunkyosha.
——. 1982. Japanese history and literature: Intermediate reader. Provo, UT: BrighamYoung University.
Weitze, Malena, and Deryle Lonsdale. in print. The effect of syntax on English languagelearning. LACUS Forum XXXVI. Linguistics Association of Canada and the U.S.
——, Jeremiah McGhee, and C. Ray Graham. 2009. Variability in L2 acquisition acrossL1 language families. Paper presented at Second Language Research Forum (SLRF),Kalamazoo, MI.
Xi, Xiaoming, Derrick Higgins, Klaus Zechner, and David M. Williamson. 2008. Auto-mated scoring of spontaneous speech using SpeechRater v1.0. ETS Research ReportNo. RR-08-62. Princeton, NJ: Educational Testing Service.
Yamada, Hiroyasu, and Yuji Matsumoto. 2003. Statistical dependency analysis withsupport vector machines. Proceedings of International Conference on Parsing Tech-nologies.
Yoon, Su-Youn, Lei Chen, and Klaus Zechner. 2010. Predicting word accuracy for theautomatic speech recognition of non-native speech. Proceedings of Interspeech, 773–776.
Zechner, Klaus, Derrick Higgins, Xiaoming Xi, and David M. Williamson. 2009. Auto-matic scoring of non-native spontaneous speech in tests of spoken English. SpeechCommunication 51.883–895.
99

100

Appendix A
EI Graders
(a) ASR Grader
(b) Human Grader
Figure A.1: ASR and Human Graders (a) Mora alignment of correct and dictated EI itemsand corresponding binary scores generated by System I (b) Web-based human scoring systemwith the binary grading method
101

102

Appendix B
Decision Trees
Speech.Rate
Speech.Rate
<= 5.776637
X.Types
> 5.776637
100 (358.0/96.0)
<= 4.878425
Words.Run
> 4.878425
X.Pauses
<= 4.266667
Speech.Length
> 4.266667
X.Fillers
<= 17
X.Fillers
> 17
Native (2.0)
<= 5
100 (8.0)
> 5
Types.SpeechLength
<= 7
X.Runs
> 7
Speech.Rate
<= 1.220504
Silence.Length
> 1.220504
200 (4.0)
<= 5.190402
100 (6.0/1.0)
> 5.190402
X.Tokens
<= 20.199556
200 (10.0)
> 20.199556
X.Tokens
<= 59
300 (2.0)
> 59
X.Types
<= 51
200 (4.0)
> 51
200 (2.0)
<= 35
100 (4.0/2.0)
> 35
Words.Run
<= 27
Speech.Rate
> 27
100 (13.0/1.0)
<= 2.833333
X.Fillers
> 2.833333
X.Runs
<= 20
200 (5.0/1.0)
> 20
100 (7.0/1.0)
<= 14
Silence.Length
> 14
200 (3.0)
<= 8.68
Speech.Rate
> 8.68
200 (2.0)
<= 5.029338
X.Fillers
> 5.029338
Types.SpeechLength
<= 15
100 (4.0/1.0)
> 15
300 (4.0)
<= 1.095462
X.Fillers
> 1.095462
300 (2.0)
<= 8
Speech.Rate
> 8
100 (7.0)
<= 5.379113
Speech.Rate
> 5.379113
300 (2.0)
<= 5.57956
100 (2.0)
> 5.57956
200 (4.0)
<= 5.152124
X.Tokens
> 5.152124
100 (8.0/1.0)
<= 100
200 (2.0)
> 100
100 (6.0/1.0)
<= 28.339089
X.Tokens
> 28.339089
300 (4.0/2.0)
<= 56
X.Fillers
> 56
SpeechTime.Run
<= 8
SpeechTime.Run
> 8
300 (3.0)
<= 2.967778
200 (2.0)
> 2.967778
Silence.Length
<= 2.840909
300 (7.0)
> 2.840909
100 (3.0)
<= 13.02
SpeechTime.Run
> 13.02
300 (4.0)
<= 2.688824
100 (2.0)
> 2.688824
X.Types
<= 44
Speech.Rate
> 44
X.Pauses
<= 28
SpeechTime.Run
> 28
100 (13.0/1.0)
<= 10
SpeechTime.Run
> 10
200 (6.0/1.0)
<= 1.860526
100 (5.0)
> 1.860526
X.Tokens
<= 2.029412
SpeechTime.Run
> 2.029412
100 (4.0)
<= 41
X.Types
> 41
X.Tokens
<= 37
X.Tokens
> 37
200 (3.0)
<= 44
300 (4.0)
> 44
100 (7.0/1.0)
<= 54
X.Types
> 54
Speech.Rate
<= 42
200 (4.0/1.0)
> 42
100 (2.0)
<= 6.727246
300 (3.0)
> 6.727246
Native (4.0/1.0)
<= 2.083333
Words.Run
> 2.083333
300 (11.0/1.0)
<= 4.8
Speech.Length
> 4.8
300 (8.0/2.0)
<= 19.871745
100 (7.0/2.0)
> 19.871745
X.Fillers
<= 6.66476
X.Pauses
> 6.66476
100 (4.0)
<= 2
Silence.Length
> 2
Words.Run
<= 16.14
Speech.Rate
> 16.14
300 (27.0/2.0)
<= 4.458333
X.Tokens
> 4.458333
Speech.Rate
<= 115
200 (2.0)
> 115
300 (14.0/2.0)
<= 6.598213
200 (2.0)
> 6.598213
Speech.Length
<= 6.490749
200 (5.0)
> 6.490749
X.Fillers
<= 63.14
200 (3.0)
> 63.14
Speech.Rate
<= 12
Silence.Length
> 12
X.Types
<= 6.142349
SpeechTime.Run
> 6.142349
200 (3.0)
<= 57
300 (7.0/2.0)
> 57
100 (9.0/2.0)
<= 2.432963
300 (4.0)
> 2.432963
100 (4.0)
<= 19.16
X.Tokens
> 19.16
100 (3.0/1.0)
<= 92
300 (3.0)
> 92
Speech.Length
<= 20
X.Runs
> 20
Native (7.0)
<= 23.951189
X.Pauses
> 23.951189
X.Pauses
<= 16
Speech.Rate
> 16
100 (2.0/1.0)
<= 14
X.Tokens
> 14
Native (3.0)
<= 88
100 (2.0/1.0)
> 88
Speech.Rate
<= 9.201416
X.Pauses
> 9.201416
Native (3.0/1.0)
<= 6.900398
Types.SpeechLength
> 6.900398
300 (21.0)
<= 2.002011
100 (2.0)
> 2.002011
300 (2.0)
<= 18
X.Runs
> 18
300 (2.0)
<= 9
Native (12.0/2.0)
> 9
Words.Run
<= 27
300 (94.0/3.0)
> 27
X.Fillers
<= 5.882353
X.Pauses
> 5.882353
X.Types
<= 2
Silence.Length
> 2
200 (3.0)
<= 60
300 (3.0)
> 60
300 (72.0/2.0)
<= 10.65
X.Tokens
> 10.65
X.Pauses
<= 85
X.Tokens
> 85
Silence.Length
<= 32
100 (2.0)
> 32
Words.Run
<= 12.21
X.Tokens
> 12.21
100 (2.0/1.0)
<= 4.166667
Speech.Rate
> 4.166667
300 (7.0/1.0)
<= 7.685197
Native (5.0)
> 7.685197
300 (17.0/1.0)
<= 75
Speech.Rate
> 75
200 (2.0)
<= 7.735496
300 (4.0)
> 7.735496
300 (49.0/3.0)
<= 134
X.Tokens
> 134
Native (2.0)
<= 145
300 (3.0)
> 145
X.Runs
<= 47
SpeechTime.Run
> 47
Speech.Rate
<= 25
Speech.Rate
> 25
Words.Run
<= 9.599414
X.Runs
> 9.599414
Speech.Length
<= 6.133333
300 (118.0/14.0)
> 6.133333
300 (9.0/1.0)
<= 39.52
Native (8.0/1.0)
> 39.52
200 (2.0/1.0)
<= 7
X.Pauses
> 7
X.Fillers
<= 29
SpeechTime.Run
> 29
X.Pauses
<= 10
Native (7.0)
> 10
Native (4.0)
<= 23
X.Runs
> 23
Native (2.0)
<= 9
300 (10.0/1.0)
> 9
300 (16.0)
<= 3.002143
X.Tokens
> 3.002143
Silence.Length
<= 218
Native (3.0)
> 218
Native (3.0)
<= 5.91
300 (17.0/3.0)
> 5.91
300 (7.0/1.0)
<= 8.742434
Native (7.0)
> 8.742434
300 (26.0/1.0)
<= 3.192957
Speech.Length
> 3.192957
100 (2.0/1.0)
<= 68.94
X.Fillers
> 68.94
300 (5.0)
<= 21
Native (4.0/1.0)
> 21
Figure B.1: Decision Tree for All 12 Features
103

X.Types
X.Types
<= 49
X.Types
> 49
X.Runs
<= 36
X.Runs
> 36
X.Types
<= 12
100 (157.0/49.0)
> 12
X.Types
<= 23
X.Pauses
> 23
100 (43.0/4.0)
<= 14
X.Runs
> 14
200 (2.0)
<= 2
X.Tokens
> 2
200 (2.0/1.0)
<= 17
X.Runs
> 17
X.Runs
<= 10
100 (9.0/1.0)
> 10
100 (28.0/4.0)
<= 7
X.Fillers
> 7
X.Fillers
<= 10
100 (15.0/2.0)
> 10
100 (2.0)
<= 6
200 (7.0/1.0)
> 6
X.Tokens
<= 13
X.Runs
> 13
200 (3.0/1.0)
<= 31
300 (6.0)
> 31
200 (3.0)
<= 5
X.Pauses
> 5
X.Types
<= 14
X.Tokens
> 14
Native (3.0/1.0)
<= 28
100 (2.0)
> 28
100 (49.0/10.0)
<= 44
X.Fillers
> 44
X.Tokens
<= 9
100 (7.0/3.0)
> 9
200 (4.0/1.0)
<= 48
300 (2.0)
> 48
X.Tokens
<= 16
X.Tokens
> 16
X.Fillers
<= 47
X.Runs
> 47
200 (3.0)
<= 6
100 (5.0)
> 6
X.Fillers
<= 9
X.Runs
> 9
Native (2.0)
<= 4
300 (5.0/1.0)
> 4
X.Pauses
<= 14
X.Runs
> 14
X.Fillers
<= 27
X.Runs
> 27
X.Pauses
<= 8
300 (10.0/2.0)
> 8
X.Fillers
<= 22
X.Fillers
> 22
300 (9.0/4.0)
<= 3
X.Types
> 3
X.Fillers
<= 41
X.Pauses
> 41
Native (4.0)
<= 7
300 (3.0)
> 7
100 (3.0/1.0)
<= 18
X.Tokens
> 18
200 (3.0/1.0)
<= 57
300 (7.0/2.0)
> 57
200 (3.0)
<= 4
100 (3.0)
> 4
X.Tokens
<= 13
100 (5.0)
> 13
100 (2.0)
<= 56
300 (2.0)
> 56
300 (12.0/3.0)
<= 15
X.Pauses
> 15
X.Fillers
<= 31
100 (2.0/1.0)
> 31
100 (2.0)
<= 4
300 (15.0/3.0)
> 4
100 (15.0/1.0)
<= 53
X.Pauses
> 53
X.Runs
<= 29
X.Runs
> 29
X.Pauses
<= 21
100 (2.0)
> 21
X.Types
<= 25
X.Types
> 25
100 (4.0)
<= 42
200 (4.0/1.0)
> 42
X.Runs
<= 48
100 (2.0/1.0)
> 48
300 (5.0/1.0)
<= 17
X.Pauses
> 17
200 (2.0)
<= 26
X.Runs
> 26
X.Tokens
<= 19
200 (2.0)
> 19
200 (3.0)
<= 60
300 (3.0)
> 60
X.Fillers
<= 30
200 (2.0)
> 30
X.Runs
<= 9
100 (38.0/5.0)
> 9
X.Types
<= 20
X.Tokens
> 20
200 (4.0/1.0)
<= 45
300 (2.0)
> 45
100 (7.0/1.0)
<= 65
X.Types
> 65
200 (2.0)
<= 45
100 (4.0/1.0)
> 45
X.Runs
<= 69
X.Runs
> 69
X.Pauses
<= 18
X.Runs
> 18
X.Types
<= 17
X.Fillers
> 17
X.Runs
<= 62
100 (3.0/1.0)
> 62
Native (4.0)
<= 10
X.Pauses
> 10
100 (2.0/1.0)
<= 16
300 (2.0)
> 16
300 (24.0/5.0)
<= 4
X.Types
> 4
X.Runs
<= 52
X.Runs
> 52
300 (11.0/1.0)
<= 13
X.Tokens
> 13
X.Fillers
<= 76
300 (5.0)
> 76
300 (3.0/1.0)
<= 8
X.Pauses
> 8
X.Pauses
<= 29
300 (2.0/1.0)
> 29
100 (3.0)
<= 26
200 (3.0/1.0)
> 26
Native (6.0/2.0)
<= 9
X.Pauses
> 9
X.Pauses
<= 21
X.Runs
> 21
300 (5.0/1.0)
<= 19
X.Runs
> 19
300 (3.0)
<= 10
X.Pauses
> 10
Native (8.0/1.0)
<= 20
300 (3.0/1.0)
> 20
300 (44.0/2.0)
<= 14
X.Runs
> 14
X.Fillers
<= 15
300 (57.0/9.0)
> 15
300 (11.0/4.0)
<= 14
Native (4.0)
> 14
X.Types
<= 23
X.Tokens
> 23
X.Tokens
<= 55
300 (48.0/12.0)
> 55
100 (4.0/1.0)
<= 70
X.Pauses
> 70
X.Fillers
<= 37
X.Tokens
> 37
X.Runs
<= 12
300 (3.0)
> 12
X.Pauses
<= 20
200 (4.0/1.0)
> 20
200 (3.0/1.0)
<= 29
300 (2.0)
> 29
200 (3.0)
<= 77
X.Types
> 77
100 (2.0)
<= 53
200 (2.0/1.0)
> 53
X.Tokens
<= 93
X.Fillers
> 93
200 (3.0)
<= 72
X.Pauses
> 72
X.Pauses
<= 38
X.Fillers
> 38
100 (4.0/1.0)
<= 33
300 (6.0/2.0)
> 33
200 (2.0)
<= 8
100 (21.0/4.0)
> 8
X.Types
<= 7
X.Runs
> 7
100 (7.0/2.0)
<= 68
200 (2.0)
> 68
300 (6.0)
<= 26
X.Pauses
> 26
100 (2.0)
<= 41
X.Fillers
> 41
200 (4.0/1.0)
<= 12
300 (15.0/5.0)
> 12
X.Pauses
<= 27
300 (98.0/3.0)
> 27
X.Runs
<= 28
X.Tokens
> 28
X.Tokens
<= 19
300 (4.0/1.0)
> 19
300 (5.0)
<= 103
X.Runs
> 103
X.Runs
<= 15
Native (11.0/2.0)
> 15
X.Types
<= 12
300 (8.0/1.0)
> 12
X.Runs
<= 79
Native (3.0)
> 79
300 (3.0)
<= 9
X.Pauses
> 9
300 (2.0)
<= 19
X.Tokens
> 19
X.Pauses
<= 122
300 (2.0)
> 122
Native (6.0)
<= 24
300 (3.0/1.0)
> 24
X.Types
<= 132
X.Pauses
> 132
300 (64.0/10.0)
<= 86
100 (2.0/1.0)
> 86
X.Runs
<= 47
300 (42.0/7.0)
> 47
X.Tokens
<= 25
X.Fillers
> 25
300 (72.0/10.0)
<= 218
Native (3.0)
> 218
Native (12.0/3.0)
<= 13
300 (7.0/1.0)
> 13
Figure B.2: Decision Tree for 5 Selected Features
104