
Deciphering maintenance challenges through computerized ...
214
Deciphering maintenance challenges through computerized maintenance management system in Ethiopian manufacturing industries By Zerihun Tariku Hunegnaw SUBMITTED IN ACCORDANCE WITH THE REQUIREMENTS FOR THE DEGREE OF DOCTORAL DEGREE IN BUSINESS LEADERSHIP (DBL) in the subject BUSINESS LEADERSHIP at the Graduate School of Business Leadership (SBL) UNIVERSITY OF SOUTH AFRICA (UNISA) Supervisor: Dr. Fanta Tesegera Jetu 2020
-
Upload
khangminh22 -
Category
Documents
-
view
2 -
download
0
Transcript of Deciphering maintenance challenges through computerized ...

Deciphering maintenance challenges through computerized
maintenance management system in Ethiopian manufacturing
industries
By
Zerihun Tariku Hunegnaw
SUBMITTED IN ACCORDANCE WITH THE REQUIREMENTS
FOR THE DEGREE OF
DOCTORAL DEGREE IN BUSINESS LEADERSHIP (DBL)
in the subject
BUSINESS LEADERSHIP
at the
Graduate School of Business Leadership (SBL)
UNIVERSITY OF SOUTH AFRICA (UNISA)
Supervisor: Dr. Fanta Tesegera Jetu
2020

1
Ukucacisa imingeni yolondolozo
ngokusebenzisa iinkqubo zolawulo lokulondoloza
ngekhompyutha
kwimizimveliso yase-Ethiopia
Ngu
Zerihun Tariku Hunegnaw
INGENISWA NGOKUVUMELANA NEEMFUNO ZESIDANGA SOBUGQIRHA
KWISIFUNDO SOBUNKOKELI KWEZOSHISHINO (DBL)
KWISIFUNDO
UBUNKOKELI KWEZOSHISHINO
Esikolweni sothweso-zidanga zoBunkokeli kwezoShishino
(SBL)
UNIVERSITY OF SOUTH AFRICA (UNISA)
Ikhankatha: uGqir Fanta Tesegera Jetu
2020

2
Abstract
Given the need for prompt responses to today’s dynamic market, maintenance and maintenance management functions are becoming increasingly fundamental for industrial companies. Reduction of waste and bottlenecks, particularly the reduction of overproduction and work in process, accentuates the impact of malfunctions or failures of equipment on production. As such, it has become ever more urgent for proactive world-class maintenance to turn to computer-based support for efficacious management. To successfully manage activities such as the scheduling of activities, the planning of preventive maintenance actions, the analysis of data (to reduce the occurrence of malfunction and failures), and augment the absolute performance of the maintenance function, industrial companies implement information systems enabled by computerised maintenance management systems (CMMS) to deliver timely and accurate information. However, while various CMMS are available on the market, not all meet the exactitudes of each industrial company. The overall objective of this thesis is threefold: to explore major barriers and obstacles that have a negative impact on implementing CMMS; to identify the most common critical success factors (CSFs) that have a positive impact on implementing CMMS; and to develop an optimised CMMS model suitable to the context of Ethiopian manufacturing industries. To achieve this, an exploratory descriptive research design was employed, utilising both quantitative and qualitative data-gathering techniques, including structured interviews and questionnaires. Both qualitative and quantitative findings suggest that the most important CSFs for CMMS implementation were work planning and scheduling and work identification and responsibilities, while the Ethiopian manufacturing firms lagged behind in the case of information technology and appraisal. Overall, key issues in maintenance management range from several maintenance techniques, information systems, scheduling, and optimisation models. This thesis is projected to be a useful source of information for both maintenance managers and stakeholders in CMMS decision making. It also creates opportunities for future research in this area of study.
Keywords: Computerised maintenance management systems, CMMS, Ethiopian manufacturing industries, information systems, maintenance, maintenance decision making, maintenance management

3
Isicatshulwa
Ngenxa yesidingo seempendulo ezikhawulezileyo kwimarike yanamhlanje eguqukayo, ukulondoloza kunye nololondolozo lwemisebenzi yolowulo ziya zisanda ngokubaluleka kwiinkampani zoshishino. Ukuncitshiswa kwenkcitho kunye nokuxinana kwindawo eziphezulu , ngakumbi ukucuthwa kwemveliso egqithisileyo kunye nokusebenza kwinkqubo, kunyusa ifuthe lokungasebenzi kakuhle okanye ukusilela kwezixhobo kwimveliso. Kananjalo, kuye kwangxamiseka nangakumbi kulondolozo lwenqanaba lehlabathi ukuba liphendukele kwinkxaso esekwe kwikhompyutha ukwenzela ulawulo olusebenzayo.
Ukulawula ngempumelelo imisebenzi efana nokucwangciswa kwemisebenzi, ukucwangciswa kwezenzo zolondolozo zokukhuselo, ucalulo lwedatha (ukunciphisa ukwenzeka kokungasebenzi kakuhle kunye nokusilela), kunye nokwandisa ukusebenza ngokupheleleyo komsebenzi wolondolozo, iinkampani zamashishini zisebenzisa iinkqubo zolwazi ezenziwa ziinkqubo zolawulo lokulondoloza ngekhompyutha (i-CMMS) ukuhambisa ulwazi oluchanekileyo kwangexesha.
Nangona kunjalo, ngelixa ii-CMMS ezahlukeneyo zifumaneka kwimarike, ayizizo zonke ezihlangabezana ngqo nemilinganiselo yenkampani nganye yemizimveliso. Eyona njongo yale ngcingane ebhaliweyo engqinelwa ziingxoxo, ithisisi ihlulwe kathathu: ukuphonononga imiqobo engundoqo kunye nezithintelo ezinefuthe elibi ekuphumezeni iiCMMS; Ukuchonga ezona zinto zibalulekileyo zempumelelo (CSFs) ezinefuthe elihle ekuphumezeni iCMMS; kunye nokuvelisa imodeli ye-CMMS elungele imeko yemizimveliso yase-Ethiopia.
Ukufezekisa oku, uyilo lophando oluchazayo lwasetyenziswa, kusetyenziswa ubuchule bokuqokelela idatha eninzi kunye nesemgangathweni, kubandakanya udliwanondlebe olulungiselelweyo kunye nephepha lemibuzo.Zozibini iziphumo ezedatha esengangathweni kunye nedatha ngokobungakanani zibonisa ukuba ezona CSFs zibalulekileyo ekuphunyezweni kweCMMS yayikukucwangciswa komsebenzi nokucwangciswa nokwenza uludwe lweenkqubo kunye nokuchongwa komsebenzi kunye noxanduva, ngelixa iifemu zemveliso zase-Ethiopia zisasele ngasemva kwimeko yolwazi lwetekhnoloji kunye novavanyo.
Kukonke, imiba ephambili kulawulo lolondolozo isukela kwiindlela ezahlukeneyo zobuchule zolondolozo, kwiinkqubo zolwazi, kuludwe lokwenziwa kweenkqubo zolwazi, kunye neemodeli ezigqibeleleyo. Le thisisi kuqikelelwa ukuba ingumthombo wolwazi oluluncedo kubo bobabini abaphathi bezolondolozo kunye nabachaphazelekayo ekuthathweni kwezigqibo kwiCMMS. Ikwadala amathuba ophando lwexesha elizayo kulo mmandla wokufunda.
Amagama angundoqo: Iinkqubo zolawulo lolondolozo ngekhompyutha, CMMS, Imizimveliso yase-Ethiopia, iinkqubo zolwazi, ulondolozo, ulondolozo lokwenza izigqibo, ulondolozo lolawulo

4
Declaration of Originality
I declare that “Deciphering Maintenance Challenges through Computerized Maintenance
Management System in Ethiopian Manufacturing Industries” is my own, original work and
that all the sources that I have used or quoted have been indicated and acknowledged by means
of appropriate referencing format.
September, 2020 ____________________________ _________________________ ZERIHUN TARIKU HUNEGNAW DATE
Student Number: 77665880

5
Acknowledgements
Firstly, I am grateful to God for good health and well-being that were necessary to complete
this thesis. Secondly, I would like to thank the management and staff of Moha Soft Drinks S.C,
National Tobacco Enterprise S.C, Almeda Textile PLC, Ethiopia Leather Industry PLC
(ELICO), Sheba Leather Industry PLC, Birhanena Selam Printing Enterprise, Adami Tulu
Pesticides Processing S.C, Ethiopia Plastic Industry , National Cement S.C, Akaki Basic Metal
Industry, DH Geda Blanket Factory PLC, Adama Agricultural machinery Industry, Mesfin
Industrial Engineering PLC, Finfine Furniture Factory (3F ) on which this research study was
conducted and all those who supported me in conducting this study successfully.
I would like to graciously thank my supervisor Dr. Fanta Tesegera for his support, supervision,
feedback and constant academic and moral support. He had strong faith in my ability to achieve
better results by pushing me to my limits and by making himself available at any time to
accommodate me. A special thanks to Jasper Schouten, who has been very helpful throughout
the study duration, in providing necessary input and technical feedback. I am also hugely
appreciative to Trevor Noah, Prof. David Reedy and Dr. Eugen Antinov especially for sharing
their academic expertise so willingly, and for being so dedicated to their academic advice, data
analysis, content, and language editing.
My special gratitude also goes to my research assistants Yosef Girma, Nathan Mesfin, Yihenew
Mesfin, Temesegen Mulugeta, and Nahom Dejene, for their devotion and hard work. I would
also like to thank Mrs. Zeyneba Ahmed, UNISA- SBL Administrative Assistant, for her
support and encouragement throughout this study and Beza Amanuel for thesis editing. I would
especially like to thank my good brothers and friends of mine, Anteneh Fekadu, Yodit Birhanu,
Limenew Feleke, Shimeles Kassa, Tikikel Yimer, Dr. Begashaw Bayleyegn, Andient Amare,
Desta Lemma, Haymanot Tadesse, Yohannes Arefayine, Abdulkarim Hussien and all others
whom their names are not mentioned here, for making my journey in this study a rich and
pleasurable experience and also for their encouragement and motivation.
I am especially grateful and thankful to all my family members. Especially my Mum (Etete),
my wife Betelhem Sisay, and my two wonderful children, Elnathan and Markan, for their
constant perseverance in making my dream come true. You have helped me through bad and
good, to ensure I had nothing but the best. Your love and guidance mean the world to me and
has led me to where I am today. I love you, and God bless you all.

6
Table of Contents
Abstract .....................................................................................................................................
5
Table of Contents ..................................................................................................................... 6
List of Tables ............................................................................................................................ 9
List of Figures ......................................................................................................................... 10
List of Appendices .................................................................................................................. 11
List of Abbreviations ............................................................................................................. 11
Definition of Key Terms ........................................................................................................ 13
Chapter 1: Introduction ........................................................................................................ 14 1.1 Overview ........................................................................................................................ 14 1.2 Statement of the Problem ............................................................................................... 16 1.3 Research Objectives ....................................................................................................... 18 1.4 Research Questions ........................................................................................................ 19 1.5 Research Gap and Significance ..................................................................................... 20 1.6 Research Assumptions ................................................................................................... 20 1.7 Scope of the Research .................................................................................................... 20 1.8 Chapters Synopsis .......................................................................................................... 21
Chapter 2: Context and Background ................................................................................... 24 2.1 Introduction .................................................................................................................... 24 2.2 Research Background .................................................................................................... 24 2.3 Context of the Research Problem .................................................................................. 26 2.4 Scope of the Research .................................................................................................... 27 2.5 Summary ........................................................................................................................ 28
Chapter 3: Literature Review ............................................................................................... 29 3.1 Introduction .................................................................................................................... 29 3.2 Computerized Maintenance Management System (CMMS) ......................................... 29 3.3 Maintenance ................................................................................................................... 31
3.3.1 Maintenance Strategies in Manufacturing .............................................................. 32 3.3.2 The Rationale Behind Maintenance in Manufacturing ........................................... 37 3.3.3 Maintenance Objective and Best Practice............................................................... 38
3.4 Maintenance Management ............................................................................................. 39 3.4.1 Strategic Dimensions of Maintenance Management .............................................. 39 3.4.2 Maintenance Management Framework................................................................... 42 3.4.3 Maintenance Management Models ......................................................................... 44
3.5 Selecting an Appropriate CMMS ................................................................................... 46 3.6 Implementing CMMS .................................................................................................... 47
3.6.1 Critical Success Factors in CMMS Implementation ............................................... 50 3.6.2 Benefits of Implementing CMMS .......................................................................... 51 3.6.3 Challenges of CMMS Implementation ................................................................... 52 3.6.4 CMMS Optimization .............................................................................................. 53
3.7 Summary ........................................................................................................................ 54
14
Acknowledgements ..................................................................................................................
Declaration of Originality ......................................................................................................

7
Chapter 4: Theoretical Foundation and Conceptual Framework .................................... 55 4.1 Introduction .................................................................................................................... 55 4.2 Theoretical Foundation .................................................................................................. 55 4.3 Maintenance Management Pyramid Model ................................................................... 56
4.3.1 Layer 1: Balancing the Workload ........................................................................... 57 4.3.2 Layer 2: Creating Organization Power ................................................................... 63 4.3.3 Layer 3: Condition-Based Approach ...................................................................... 66 4.3.4 Layer 4: Making Maintenance a Core Business Approach .................................... 68 4.3.5 Layer 5: Continuous Improvement ......................................................................... 69
4.4 Summary ........................................................................................................................ 72
Chapter 5: Methodology and Design.................................................................................... 73 5.1 Introduction .................................................................................................................... 73 5.2 Research Approach ........................................................................................................ 73 5.3 Research Design ............................................................................................................. 75
5.3.1 Semi-Structured Interviews .................................................................................... 76 5.3.2 Questionnaire .......................................................................................................... 77 5.3.3 Sampling ................................................................................................................. 78
5.4 Data Collection .............................................................................................................. 86 5.4.1 Questionnaire Design .............................................................................................. 87 5.4.2 Data Validity and Reliability .................................................................................. 88 5.4.3 Pilot Study and Reliability Test .............................................................................. 90
5.5 Data Analysis ................................................................................................................. 90 5.5.1 Qualitative Data Analysis ....................................................................................... 90 5.5.2 Quantitative Data Analysis ..................................................................................... 91
5.6 Ethical Considerations ................................................................................................... 92 5.7 Summary ........................................................................................................................ 92
Chapter 6: Findings and Discussion ..................................................................................... 93 6.1 Introduction .................................................................................................................... 93 6.2 Findings from Qualitative Analysis [Interviews] .......................................................... 93
6.2.1 Question 1 Themes and Findings ............................................................................ 99 6.2.2 Question 2 Themes and Findings .......................................................................... 101 6.2.3 Question 3 Themes and Findings .......................................................................... 103 6.2.4 Question 4 Themes and Findings .......................................................................... 104 6.2.5 Question 5 Themes and Findings .......................................................................... 106 6.2.6 Question 6 Themes and Findings .......................................................................... 107 6.2.7 Question 7 Themes and Findings .......................................................................... 109 6.2.8 Question 8 Themes and Findings .......................................................................... 110 6.2.9 Question 9 Themes and Findings .......................................................................... 112 6.2.10 Question 10 Themes and Findings ...................................................................... 113 6.2.11 Question 11 Themes and Findings ...................................................................... 115 6.2.12 Question 12 Themes and Findings ...................................................................... 116 6.2.13 Question 13 Themes and Findings ...................................................................... 117
6.3 Quantitative Data Analysis and Findings .................................................................... 119 6.3.1 Respondents Characteristics ................................................................................. 120 6.3.2 Reliability and Confirmatory Factor Analysis of Scales ...................................... 121 6.3.3 Critical Success Factors ........................................................................................ 124 6.3.4 Regression Modelling ........................................................................................... 129
6.4 Discussion .................................................................................................................... 130 6.4.1 Key Inferences Drawn from the Statistical Analyses ........................................... 130

8
6.4.2 Addressing the Research Questions ...................................................................... 133 6.5 Summary ...................................................................................................................... 136
Chapter 7: Recommendation of an Optimized CMMS Model for Ethiopian Manufacturing Industries ................................................................................................... 138
7.1 Introduction .................................................................................................................. 138 7.2 Modeling and Optimization of CMMS Model ............................................................ 138 7.3 Reasons for CMMS Optimization in Ethiopian Context ............................................. 139 7.4 Principles of Modelling and Optimization of the Proposed CMMS Model ................ 141 7.5 Modeling the Optimized CMMS Model ...................................................................... 143 7.6 New Optimized CMMS Parameters ............................................................................ 146 7.7 Functionalities of the Proposed Optimized CMMS Model ......................................... 147 7.8 Simulating and Testing the New Optimized CMMS Model ....................................... 154 7.9 Summary ...................................................................................................................... 154
Chapter 8: Conclusions, Recommendations, Limitations, and Future Research .......... 156 8.1 Conclusions .................................................................................................................. 156 8.2 Recommendations ........................................................................................................ 158 8.3 Study Limitations ......................................................................................................... 159 8.4 Future Research ........................................................................................................... 160
References ............................................................................................................................. 161
Appendices ............................................................................................................................ 171

9
List of Tables
Page Table 1: Maintenance Strategy Decision Elements .............................................................................. 42 Table 2: Maintenance Management Models ........................................................................................ 45 Table 3: List of parameters for Integrated Maintenance Management Strategic Frame Work ............. 57 Table 4: Key Performance Indicators of World-Class Maintenance .................................................... 70 Table 5: Ethiopian Large & Medium Scale Manufacturing Industries by Geographic Region ............ 80 Table 6: Sample Size Based on Purposive Non-Random Sampling Method ....................................... 83 Table 7: Industries Studied ................................................................................................................... 84 Table 8: Targeted Sample Based on Predetermined Criteria ................................................................ 85 Table 9: Key Elements and Themes from Interview Questions ........................................................... 94 Table 10: In vivo generated word transcription & identified Themes .................................................. 97 Table 11: Identified Interviewee Codes for Q1................................................................................... 100 Table 12: Identified Interviewee Codes for Q2................................................................................... 101 Table 13: Identified Interviewee Codes for Q3................................................................................... 103 Table 14: Identified Interviewee Codes for Q4................................................................................... 105 Table 15: Identified Interviewee Codes for Q5................................................................................... 106 Table 16: Identified Interviewee Codes for Q6................................................................................... 107 Table 17: Identified Interviewee Codes for Q7................................................................................... 109 Table 18: Identified Interviewee Codes for Q8................................................................................... 111 Table 19: Identified Interviewee Codes for Q9................................................................................... 112 Table 20: Identified Interviewee Codes for Q10................................................................................. 114 Table 21: Identified Interviewee Codes for Q11................................................................................. 115 Table 22: identified Interviewee Codes for Q12 ................................................................................. 117 Table 23: Identified Interviewee Codes for Q13................................................................................. 118 Table 24: Respondents by Industry ..................................................................................................... 120 Table 25: Fundamental Characteristics of Respondents ..................................................................... 121 Table 26: Reliability Test Analysis ..................................................................................................... 122 Table 27: Confirmatory Factor Analysis ............................................................................................ 124 Table 28: Critical Success Factors Sorted by Mean Rating ................................................................ 125 Table 29: Section B: Difference Between Mean Rating ..................................................................... 125 Table 30: Section B: Components P-Values Based on Paired Samples T-Tests ................................ 126 Table 31: Section B: Components P-values Based on Wilcoxon Signed Ranks Tests ....................... 126 Table 32: Statistical Analysis of Components of the Proposed Integrated Maintenance Management Strategic Framework Model................................................................................................................ 127 Table 33: Section C: Differences Between Mean Ratings .................................................................. 127 Table 34: Section C: P-Values Based on Paired Samples T-Tests ..................................................... 127 Table 35: Statistical Analysis of the Components of the Proposed CMMS Optimized Model .......... 128 Table 36: Section D: Differences Between Mean Ratings .................................................................. 128 Table 37: Section D: P-Values Based on Paired Samples T-Tests ..................................................... 128 Table 38: Component C Model Score ................................................................................................. 129 Table 39: Comparing Various Industries Based on Critical Success Factors ..................................... 131 Table 40: Most Important Decisions for CMMS Design, Selection, and Development ..................... 133 Table 41: Optimization Variables ....................................................................................................... 142 Table 42: Detail optimized CMMS Model Functionalities ................................................................. 149

10
List of Figures
Page Figure 1: The Link between Production and Maintenance ................................................................... 31 Figure 2: The Position of the Maintenance Function in the Organizational System ............................ 32 Figure 3: Overview of Different Types of Maintenance in Manufacturing .......................................... 34 Figure 4: Component Failure Rate over Time for Component Population ........................................... 37 Figure 5: Investment Life Cycle and Driving Forces of Asset Management ........................................ 40 Figure 6: Key Elements for SMM......................................................................................................... 41 Figure 7: Generic Model for Maintenance Management ...................................................................... 44 Figure 8: Information System Development Cycles ............................................................................. 48 Figure 9: Maintenance Management Pyramid ...................................................................................... 57 Figure 10: Research Design Process ..................................................................................................... 78 Figure 11: Proportion of Ethiopian Large and Medium Scale Manufacturing Industries ..................... 81 Figure 12: Ethiopian Large and Medium Scale Manufacturing Industries by Strata/Industry ............. 82 Figure 13: In vivo generated Interview Codes Spiral Word Cloud....................................................... 97 Figure 14: Identified and categorized overarching Themes word cloud ............................................... 99 Figure 15: Identified Themes from Interview Q1 ............................................................................... 100 Figure 16: Identified Themes from Interview Q2 ............................................................................... 102 Figure 17: Identified Themes from Interview Q3 ............................................................................... 104 Figure 18: Identified Themes from Interview Q4 ............................................................................... 105 Figure 19: Identified Themes from Interview Q5 ............................................................................... 107 Figure 20: Identified Themes from Interview Q6 ............................................................................... 108 Figure 21: Identified Themes from Interview Q7 ............................................................................... 110 Figure 22: Identified Themes from Interview Q8 ............................................................................... 111 Figure 23: Identified Themes from Interview Q9 ............................................................................... 113 Figure 24: Identified Themes from Interview Q10 ............................................................................. 114 Figure 25: Identified Themes from Interview Q11 ............................................................................. 116 Figure 26: Identified Themes from Interview Q12 ............................................................................. 117 Figure 27: Identified Themes from Interview Q13 ............................................................................. 118 Figure 28: Proposed CMMS Optimized Model Use-Cases ................................................................ 144 Figure 29: Proposed CMMS Model Static Structure .......................................................................... 145 Figure 30: Component Diagram of the New Proposed Optimized CMMS Model ............................. 146

11
List of Abbreviations
CBM Condition-based Management
CMMS Computerized Maintenance Management Systems
CM Corrective Maintenance
CSFs Common Critical Success Factors
GDP Gross Domestic Product
ECSA Ethiopian Central Statistics Agency
EPMS Electronic Performance Monitoring Systems
IMF International Monetary Fund
IMS Information Management System
IS Information Systems
IT Information Technology
IMMSFM Integrated Maintenance Management Strategic Framework Model
LCC Life Cycle Cost
NPV Net Present Value
MIS Management Information Systems
OEM Overall Equipment Effectiveness
O&M Operation and Maintenance
PDM Predetermined Maintenance
PM Preventive Maintenance
RCM Reliability Centered Maintenance
RM Reactive Maintenance
SCADA Supervisory control and data acquisition
SMM Strategic Maintenance Management
SNNPR South Nations Nationalities Peoples Region
TPM Total Productive Maintenance

12
List of Appendices
Page Appendix A: Interview Questions....................................................................................................... 169 Appendix B: Consent Letter .............................................................................................................. 170 Appendix C: Pre-determined Criteria for Selecting Sample ………………………………………...171 Appendix D: Ethiopian Large and Medium Scale Manufacturing Industries by Sector .............. …..172 Appendix E: Ethiopian Large and Medium Manufacturing Industries Cluster by Region…………..172 Appendix F: Target Strata Companies by Non-Probability Sampling ……………………………….173 Appendix G: Target Population ......................................................................................................... 173 Appendix H: Strata by Industrial Group ............................................................................................ 104 Appendix I: Respondent Population …………………………………………………………………175 Appendix J: Respondent by Type of Industry ……………………………………………………….175 Appendix K: Respondents Length of Work Experience ……………………………………………..176 Appendix L: Significance Score for Components B………………………………………………….176 Appendix M: Significance Score for Components C .................................................................... ….118 Appendix N: Significance Score for Components D .......................................................................... 145 Appendix O: Signed Information Sheet ……………………………………………………………..178 Appendix P: Ethics Clearance Approval Certificate………………………………………………….179 Appendix Q: R-code ..................................................................................................................... ….181 Appendix R: Regression Analysis and t-test results………………………………………………….182 Appendix S: Observation Checklist…... ……………………………………………………………..183 Appendix T: Structured Survey Questionnaire……..………………………………………………..185 Appendix V: Companies Permission Letters ................................................................................ ….200 Appendix W: Turnitin Digital Certificate …………………………………………………………....213

13
Definition of Key Terms
Maintenance: All actions which have the objective of retaining or restoring an item in or to a state in which it can perform its required function. Maintenance is broadly divided reactive/corrective maintenance, preventive maintenance, and predictive maintenance.
Management: The organization and coordination of the activities of a business in order to achieve defined objectives.
Maintenance management: is a business concept that describes the successful and efficient management of maintenance issues involved in the upkeep, operation, and productivity of a factory, manufacturing facility, or plant. In short, the administrative, financial, and technical framework for assessing and planning maintenance operations on a scheduled basis.
Maintenance Management Strategy: is a written document and provides a management framework for the maintenance personnel to determine appropriate maintenance policies, procedures, and standards. Maintenance strategy generally includes corrective, preventive, or condition-based maintenance.
Management Information System (MIS): MIS refers to an information system that makes timely and effective decisions for planning, directing, and controlling the activities for which they are responsible and also helps businesses achieve their goals and objectives. In this study, MIS was used as a similar definition to Information System (IS).
Computerized maintenance management systems (CMMS): is a type of management software that performs functions in support of management and tracking of operation and maintenance activities.
CMMS development and Implementation: this is a part of the software development process devoted to delivering the system into its context of the use
Key Issues for CMMS implementation Success: the key success issues in this study can be called “success factors,” which refer to factors that have to be achieved in order to carry out a successful implementation of MIS. These are key areas where successful performance assured the success of the organization and the attainment of its goals that top management should take into account

14
Chapter 1: Introduction
1.1 Overview
Currently, proactive organizations are acknowledging the importance of investing in
maintenance due to the impact it holds across all levels of business. While maintenance and
management maintenance functions remain complex, they associate various vital components
of an organization, including quality, risk analysis, elimination of malfunctions, risk
assessment, safety, and environment (Stamboliska, Rusiński, & Moczko, 2015). In this context,
mundane maintenance practices that were commonly used [such as ‘preventive maintenance’
or ‘fix it when it breaks’] are no longer effective in achieving optimized maintenance given the
current market challenges characterized by high risk in operation. Globalized market settings
are forcing industrial companies to compete not only in pricing and quality of products and
services, but also in technology, innovation, information technology (IT), reliability, and
reduced lead times (Uysal & Tosun, 2012). In the area of maintenance and maintenance
management, computerized maintenance management systems (CMMS) are shown to play a
significant role in the management of maintenance activities if applied effectively and
effectively.
The capacity of CMMS in handling vast volumes of data rapidly and purposefully has opened
up new opportunities for maintenance, which has facilitated a deliberate and considered
approach to managing and company’s assets (Kans, 2008). These computerized systems are
progressively becoming a central component in the organizations’ maintenance department due
Over the past two decades, the role of maintenance and maintenance management in
manufacturing and service sectors has become increasingly essential due to reasons such as
gaining a competitive edge, decreasing additional costs, and increasing customer satisfaction
(Kans 2008, Uysal & Tosun, 2012). To achieve first-rate performance, more and more firms
are replacing reactive and ‘fire-fighting’ maintenance strategies with proactive strategies such
as predictive, preventive, and aggressive maintenance strategies such as Total Productive
Maintenance (TPM). Such strategies have been recognized as organizational functions with a
substantial impact on the overall performance of the industrial companies and whose efficiency
has a high potential for improvement (Lopes & Figueiredo, 2016). In the past,
maintenance and maintenance management techniques were overlooked in detriment of more
perceptible corporate functions such as logistics and production, since for many companies,
they were viewed as functions with no value (Lopes & Figueiredo, 2016).

15
to their ability to offer support on a variety of levels in a company’s hierarchy. CMMS can
offer support to Condition-based Monitoring (CBM) of assets and machines to provide greater
insight into wear and imminent failures. A CMMS can also offer maintenance managers crucial
information in a manner that allows effective control of departmental activities (Kans, 2008).
Through this system, historical data necessary for the development of maintenance schedules
can also be retrieved by various maintenance personnel, which can be influential in
ameliorating the consistency of information. Essentially, CMMS software packages are able to
provide maintenance management with statistics and crucial reports that detail the performance
in key parts and highlights problematic issues.
The rapid changes in the Ethiopian business environment due to government investment
policies and other factors, the rise in international competition, shrinkage of markets, and
diffusion of the IT throughout organizations, have put pressure on businesses to continually
review and upscale their traditional manufacturing strategies (Oqubay, 2018). In fact, there is
a constant search for new ways to achieve a competitive advantage through new manufacturing
techniques. This leads those companies to primarily increase know-how and coordination of
the company processes that cross its manufacturing functions, including maintenance and
maintenance management. The introduction of CMMS in large and medium scale
manufacturing industries in Ethiopia, in particular, has created opportunities for better
planning, needs analysis, and condition monitoring. All of these new techniques have one thing
in common: they steer away from the old run-to-failure approach in maintenance.
After a comprehensive background analysis of the Ethiopian manufacturing industry with
regards to computerized maintenance, the researcher identified a gap in research: research is
limited (inexistent) on CMMS in the Ethiopian context. Additionally, while various CMMS
are used in some Ethiopian industries, not all meet the exactitudes of each company. As such,
the development and successful implementation of CMMS in large and medium scale
manufacturing industries in Ethiopia has often been faced with barriers and challenges. No
research has developed a model to address the challenges faced by the Ethiopian industries in
the areas of CMMS, which makes this study unique in that regard. The future of the Ethiopian
manufacturing industries lies in shifting the industrial structure towards high-growth
competitive enterprises that are linked to the domestic economy. This can be ensured by
effectively adopting Computerized Maintenance Management Systems (CMMS). The main
objective of this research was to examine the development and successful implementation of
CMMS in large and medium scale manufacturing industries in Ethiopia. The research

16
examined the most common decision elements or dimensions considered for the selection,
design, and development of CMMS; major barriers and obstacles that have a negative impact
on implementing CMMS; the most common critical success factors (CSFs) that have a positive
impact on implementing CMMS; the factors and parameters for the development and proposal
of a CMMS optimization model suitable to the context of Ethiopian manufacturing industries.
It is, therefore, very important that other successful contemporary practices in maintenance
also take root in Ethiopia, or the country might inevitably descend further on the global
economic ladder. Of course, as a developing country, the resources of the country are limited.
But while the country may possess fewer assets and capital goods than others, there is no
sensible reason why these assets should give the country lower returns than they do elsewhere.
It is imperative to note that the future of the Ethiopian manufacturing industries lies in shifting
the industrial structure towards high-growth competitive enterprises that are linked to the
domestic economy. This can be ensured by effectively adopting CMMS in the bid to improve
the performance of industrial companies in the region.
As such, the main objective of this research was to explore the development and successful
implementation of CMMS in large and medium scale manufacturing industries in Ethiopia.
The research examined the most common decision elements or dimensions considered for the
selection, design, and development of CMMS; major barriers and obstacles that have a negative
impact on implementing CMMS; the most common critical success factors (CSFs) that have a
positive impact on implementing CMMS; the factors and parameters for the development and
proposal of a CMMS optimization model suitable to the context of Ethiopian manufacturing
industries.
This first chapter provides a general overview of this research, which is followed by an
explanation of the statement of the problem, objectives of the research, and research questions
to guide the study. An explanation of why large and medium scale Ethiopian manufacturing
industries are selected as a research topic is also presented. An outline of the significance,
contributions to the field, and delimitation & scope of this research are then provided, followed
by the synopsis of the entire thesis.
1.2 Statement of the Problem
Of all the many talents Ethiopians have, technical maintenance is certainly not the strongest.
In fact, the very sight of the cities, the state of public infrastructure, and even the condition of

17
many private properties is an evidence of the collective inability to keep them in their intended
shape and capacity. In other words, the Ethiopian industrial sector has not invested adequately
or appropriately on human resources for the management and maintenance of assets. Of course
– it may not be necessary to care much about how things look, but the problem is that such
visible neglect points toward a much more serious consequence: the economic damage caused
by failing and underperforming assets. The losses incurred by unexpected breakdowns in
production, as well as the premature retirement of all sorts of public and private capital goods,
add up to hundreds of millions of birrs per year for the nation that already has great difficulty
in making ends meet. In Ethiopian large and medium scale manufacturing industries,
equipment is more complex and, therefore, more difficult to clean, maintain, and operate. Poor
maintenance policies and procedures can affect business operations of these industries and the
overall economy of the country with reduced revenue, escalating costs, and, ultimately,
profitability.
Previous studies under different contexts have demonstrated that the use of CMMS can result
in a variety of advantages. For instance, in a survey conducted by A.T Kearney and Industry
Week, and reported by Campbell, Jardine, and McGlynn (2016), 558 companies worldwide
that currently use CMMS exhibit an average of 17.8% decrease in inventory maintenance and
repair; 19.4% savings in the cost of materials; 20.1% reduction in equipment downtime; and
28.3% increase in productivity maintenance. The average payback period in this survey was
14.5 months. In another study, Poór and Šimon (n.d.) demonstrate that a properly functioning
CMMS can provide savings of between 8% and 12% during the actual use. But, depending on
factors such as material conditions, the approach of reactive maintenance, and the model used,
a company could easily achieve savings of between 30% and 40%. Correspondingly, in a study
conducted in a hydropower plant in China, Li, Ai, and Shi (2007) demonstrate the effectiveness
of their model in managing the governor system, stability, generator, excitation system,
transformer, and auxiliary equipment. Their system was built up step by step, and achievement
at each step was effectively applied to serve the production. The system was also successfully
integrated with the existing SCADA system, and MIS, also called the EPMS. The actions
coordinated well and shared information amongst them. In similar research conducted in the
process industry, Ramachandra, Srinivas, and Shruthi (2012) demonstrate that an efficient
CMMS can result in the proper recording of data/information, reduced inventory costs,
increased productivity, and improved day to day decision making in the long-term planning.
Their study demonstrates a manual maintenance system, involving manual work of

18
computation. As highlighted by these studies, and noted by Wireman (1994), the use of CMMS
is not specific to one industry, situation, or mission, which indicates effective and efficient
application in the manufacturing industry in Ethiopia.
Many companies in Ethiopia have been implementing Information Management System (IMS)
in their respective organizations and reorganizing their business processes (Oqubay, 2018).
CMMS mainly depends on Information Technology (IT); consequently, successful CMMS can
be measured by the effectiveness of IT to support an organization’s strategies. The demand for
efficient and effective use of IT is also gradually increasing (Beaumaster, 2002). In Ethiopia,
manufacturing industries are implementing an IT system to provide special attention to
planning, acquisition, and implementation in order to manage daily activities of maintenance.
In these industries, lack of maintenance capacity is not a matter of technical skill (Oqubay,
2018). Most companies have excellent mechanics and electricians who would stand firm in any
international comparison. The problem is with the management and the ability to make
informed decisions on the basis of financial and technical facts. Those industries must be aware
of the various issues which are a part of the ability of the organization to achieve effective IT
implementation and, for the purposes of this thesis, the areas of maintenance and maintenance
management.
1.3 Research Objectives
The main objective of this research was to explore the development and successful
implementation of CMMS in large and medium scale manufacturing industries in Ethiopia.
This resulted in the development and proposal of integrated maintenance management
strategies and an optimized CMMS model. This was based on the theoretical understanding of
existing research in the literature and the result of empirical data to be established in this
research. In order to achieve this primary objective, it was necessary to understand the current
maintenance practice in Ethiopian manufacturing industries, and thereby establish the extent
to which these manufacturing industries invest in the development and implementation of
CMMS.
To achieve this research’s main objective, various other objective had to be achieved. Firstly,
it was vital to discuss the relevance of the research topic by achieving a theoretical
understanding of current research on CMMS, which led to identifying the potential gaps in the
literature. Secondly, it was necessary to explore and understand the motivation for the

19
selection, design, and development of CMMS in large and medium scale manufacturing
industries in Ethiopia. Thirdly, the identification of major barriers and critical success factors
and determining the successful implementation of CMMS in large and medium scale
manufacturing industries in Ethiopia was also deemed important.
After this was done, it was necessary to propose an integrated maintenance management
strategic framework and an optimization CMMS model for improving the selection,
development, and successful implementation of CMMS within this study’s context. To this
end, a comprehensive literature review was conducted, and feedback was solicited through an
appropriately designed research instrument to establish the current practice of CMMS in
Ethiopian industrial companies. This assisted in formulating an integrated maintenance
strategic framework that resulted in the development of an optimized CMMS model suitable
to the Ethiopian context.
1.4 Research Questions
To achieve the pre-stated research objectives, this study was guided by two central research
questions. (CRQ1) What are the major barriers and obstacles that have a negative impact on
implementing CMMS in Ethiopian manufacturing industries? (CRQ2) What factors and
parameters should be considered for the development and proposal of a CMMS optimization
model suitable to the context of Ethiopian manufacturing industries, and how do they affect
these industries? Three other sub-research questions were also formulated to supplement this
study’s central research questions. (RQ1) What are the most common decision elements or
dimensions considered for the selection, design, and development of CMMS in Ethiopian
manufacturing industries? (RQ2) What are the most common critical success factors (CSFs)
that have a positive impact on implementing CMMS in Ethiopian manufacturing industries?
(RQ3) Which decision elements or dimensions to be considered in formulating the integrated
maintenance management strategy for selection, design, and development of CMMS in order
to implement successfully in Ethiopian manufacturing industries? In general, the research
questions [and sub-research questions] were developed based on the problem statement and
extensive literature review in order to address the purpose of this research in the subsequent
sections.

20
1.5 Research Gap and Significance
There has been little, or no substantial research carried out in Ethiopia concerning maintenance
management systems for industries. This research was, therefore, important as it addressed the
need for this kind of research in the Ethiopian context. In general, there were three main areas
where the work to be presented in this thesis provided a significant addition to knowledge.
Firstly, the findings of this research contributed to maintenance management literature, in
general, and to CMMS literature, in particular. This may provide some ideas for other
researchers to execute more research in the field of CMMS development and implementation
in developing countries or emerging economies. Secondly, there is no reported research
regarding the development and successful implementation of CMMS models and strategies in
less developed countries, in general, and in particular, Ethiopia. Thus, this research represented
a first attempt at reporting a story of the major barriers and critical success factors (CSFs)
toward CMMS development and implementation in the Ethiopian manufacturing industries.
Thirdly, a very significant contribution of this research was to provide an optimized CMMS
model and maintenance management strategies for the development and successful
implementation of CMMS by Ethiopian manufacturing industries. This can be used as a model
by other organizations in Ethiopia and manufacturing industries in other developing countries.
1.6 Research Assumptions
The key assumptions were the review work combined with the results of this research, and the
new CMMS optimized model to be proposed by the researcher provided insight into the
maintenance management systems being practiced in Ethiopian manufacturing industries and
to identify areas for improvement. It was also assumed that this research would create
awareness among the management and maintenance department regarding the importance of
CMMS in Ethiopian manufacturing industries.
1.7 Scope of the Research
Based on the research questions and objectives, the scope of this thesis work was limited to
large and medium scale manufacturing industries engaging various types of industries in the
Ethiopian manufacturing industry. It was also focused on studying and identifying the major
barrier and critical success factors associated with the development and successful
implementation of CMMS. The research engaged the different types of professionals at specific

21
departments within the company who had a direct influence on the maintenance management
system, namely Production, Maintenance, and Quality Assurance.
1.8 Chapters Synopsis
Each chapter of the thesis illustrated different aspects of the computerized maintenance
management system (CMMS). In order to provide the reader with an overview of the thesis,
the research structure was organized and presented in the following broad chapters.
Chapter One: Introduction
This introductory chapter illustrates the need for CMMS in the Ethiopian manufacturing
industries illustrating that the country, especially in the manufacturing industry, is lagging
behind in technical aspects. It also provides the main objective of the paper, which is to explore
the development and successful implementation of CMMS in large and medium scale
manufacturing industries in Ethiopia.
Chapter Two: Context and Background of Ethiopian Manufacturing Industries
The context and background of the thesis are presented in this chapter, which indicates the
country’s declining economy and reliance on the manufacturing industry to generate revenues.
This justifies the rationale for selecting medium and large manufacturing industries in Ethiopia
as the fulcrums of this study, indicating the role that CMMS can play in maintenance
management, productivity, and cost saving. In this chapter, the challenges and issues with the
status quo, including the gaps in the existing body of knowledge and scholarship, are also
articulated.
Chapter Three: Literature Review
Chapter three provides a literature review with regards to computerized maintenance
management systems (CMMS), which included the levels of maintenance, the types of
maintenance, maintenance management process, maintenance planning, and scheduling, and
staffing maintainability. This chapter provides considerable insight into some of the research
questions, which are later expounded in the data analysis chapter. It also outlined a literature
study on generic maintenance models and how the proposed integrated maintenance
management strategies and CMMS optimization model.

22
Chapter Four: Theoretical Foundations and Conceptual Framework
This chapter presents the development and implementation model of optimized CMMS
modeling, which is termed as “The Maintenance Management Pyramid Model.” The
theoretical and philosophical underpinnings presented in this chapter creates a platform for
better presenting the research methodology in the subsequent Chapter five. Essentially, system
theory, the theoretical basis through which this research is founded, is discussed in this section.
Chapter Five: Research Methodology & Design
This chapter indicates that this thesis adopts a mixed-method as the research methodology. As
such, data was collected both qualitatively and quantitatively to allow for triangulation and
enhanced reliability and validity. Methods for data collection, including interviews and
questionnaires, are presented, along with sampling techniques for both qualitative and
quantitative approaches. Data analyses, thematic analysis for qualitative research, and a
combination of statistical approaches for quantitative research are presented. The researcher
also demonstrated how ethical considerations are met in this research.
Chapter Six: Findings and Discussion
The result from the survey questionnaire and in-depth interviews are presented to guide the
development of an optimized CMMS model and integrated maintenance management
strategies. Qualitative research findings indicate a set of key elements and themes that
addresses this study’s research questions. Various triangulations are presented as well,
especially in the section that discusses the qualitative data analysis, under each interview
question. The intention in this chapter was to give the readers the researcher explanation of the
empirical findings related to the research questions. Moreover, theory and empirical data were
combined to interpret and analyze the findings.
Chapter Seven: Recommended CMMS Model for Ethiopian Manufacturing Industries
After data analysis, presentation of findings, and discussion of these findings, this chapter
presents the proposed CMMS model for Ethiopian manufacturing industries as developed by
the researcher. The researcher builds on a variety of themes, dimensions, and elements derived
from the research findings, both qualitatively and quantitatively, to recommend the model.
Chapter comprehensively discusses the theory of maintenance management strategic
23
framework and optimization of the proposed model. In essence, everything about the
recommended model is discussed, including modeling and optimization, the optimized
parameters, functionalities of the proposed model, as well as simulation and testing of the
model.
Chapter Eight: Conclusions and Recommendations for Future Research
This chapter concludes the study whilst providing recommendations for future research based
on the outcomes of this research. The key recommendations for Ethiopian manufacturing
industries from this thesis are that these companies should adopt a CMMS package that is open
source, ready-to-use, and easy to maintain. Moreover, the CMMS must consist of self-
contained modules or otherwise be capable of being modified as per the enterprise's interests
and planning. Essentially, the recommended CMMS framework presented in Chapter Seven
can provide such firms with implementable solutions to solve most of the current maintenance
management issues.

24
Chapter 2: Context and Background
2.1 Introduction
This chapter sets the scene for this study and is divided into three other sections. The first
section provides the background of the research, justifying the rationale for choosing medium
and large manufacturing industries. The second section describes the context of the research
problem by providing an explanation of why large and medium scale Ethiopian manufacturing
industries are pivotal to this study. Finally, the scope of research is provided, discussing the
extent of content that will be covered in this thesis through research to provide more logical
conclusions and conclusive satisfactory answers to the pre-stated research questions.
2.2 Research Background
Ethiopia, the second-most populous country in Africa, is a one-part nation with a planned
economy [United Nations, Department of Economic and Social Affairs, 2019]. Before 2016,
the country’s economy grew at a rate of 8%-11% per year, making it one of the fastest-growing
countries among the 188 International Monetary Fund (IMF) member states. According to
Statista (2019), the largest sector contributing to the Ethiopian national economy, at 46.1%, is
the service industry. The next largest, accounting for 42% of the Gross Domestic Product
(GDP), but rapidly declining, is agriculture. This decline, however, has not been offset by the
growth in the manufacturing industry, which is just 13% of the GDP (Statista, 2019).
Undoubtedly, a combination of external and internal factors, including population growth,
weak infrastructure, and foreign debt, which cause increasing inequalities between individuals,
groups, and regions, have prevented many developing countries from achieving significant
socio-economic improvements (Eneh 2017; Shorrocks & Van der Hoeven, 2004). As a
developing country, Ethiopia has manufacturing management their prime agenda. As noted by
Kebede and Heshmati (2020) the country is currently are going through a process of
restructuring their manufacturing systems to emphasize competition, integration with global
markets, and increasing the level of private sector development.
While the Ethiopian manufacturing sector is the fastest-growing sector with an average annual
growth rate of 10.6% (Statista, 2013), most industries remain isolated from the world market
and technology, with high costs relative to best-practice operations elsewhere due to different
challenges. Among all the challenges, production losses due to “maintenance management”
problems are among the biggest and most urgent (Addis, Dvivedi, & Beshah, 2017). Therefore,

25
the future of the Ethiopian manufacturing industries lies in shifting the industrial functions
towards high-growth competitive and innovative methodologies that are linked to efficient and
effective maintenance management. Reviving investment for this purpose will require
maintenance management policies, strategies, and substantial efforts to mobilize advanced
information technology and software tools.
As noted by Haile et al., (2017), the competitiveness of manufacturing industries depends on
the availability and productivity of their production facilities. Due to intense global
competition, manufacturing companies in Ethiopia are striving to improve and optimize their
productivity in order to remain competitive (Getahun et al., 2018). This would be possible in
Ethiopian manufacturing industries if the production losses were identified and eliminated so
that the manufacturers could bring their products to the market at a minimal cost. This situation
has led to a need for a rigorously defined performance measurement system that is able to take
into account different important elements of productivity in the manufacturing process.
Manufacturing enterprises play an important role in improving the economic environment of a
country. According to Haile et al., (2017), the capability of producing high-quality products
with shorter delivery time according to diverse customer requirements has become a challenge
for many manufacturing industries in Ethiopia. Furthermore, non-price factors, such as quality,
product design, innovation, and delivery services and other critical success factors, are the
primary determinants of product success in today's global arena (Hietschold, Reinhardt &
Gurtner 2014; Reguia, 2014).
Maintenance has developed along with all other management fields. It is considered in all areas,
even though the consideration is given a higher degree in the industrial sector (Parida et al.,,
2015). Like every management system, maintenance is also structured to match the exact kind
of work which has to be managed. Maintenance, which often involves high investment
machines and equipment, is generally considered to be one of the largest expenses in operating
a plant (Shin & Jun, 2015). Installation of increasingly complex production and control
equipment creates new and varied maintenance needs. Management must, therefore, use
maintenance resources wisely by limiting the number of non-productive hours spent on repair
jobs. This is particularly true for Ethiopian medium and large organizations operating in an
increasingly competitive environment where there is considerable pressure to make their
operational, tactical and strategic processes more efficient and effective.

26
To this end, a fully utilized CMMS has come out as an ideal IT tool to support the maintenance
function in most medium and large-scale organizations in Ethiopia. CMMS is a software
package that maintains a computer database of information about maintenance operations
(Mandal & Tewari, 2017). Effective physical asset management is also a mission-essential total
business management requirement. Also, the lack of integration with higher-level or even
parallel financial and accounting, procurement, inventory, or timekeeping systems can waste
valuable technical and administrative resources. According to Addis et al., (2017), production
scheduling and maintenance planning are among the most important problems in the
manufacturing industry. Production scheduling aims to respond rapidly to the market and to
meet customer requirements by effectively assigning jobs or operations to the production
system (Addis et al., 2017). Simultaneously, maintenance planning is carried out to maintain
the manufacturing system or to restore it to an acceptable operating condition.
2.3 Context of the Research Problem
The advances in computer hardware and software development, have affected most areas of
business and industry, including manufacturing industries throughout the world. According to
Parida and Kumar (2006), this has especially occurred in the area of maintenance management
and planning in an attempt to reduce waste, malfunction, system failures, and production costs
while at the same time, increase productivity and customer satisfaction. The use of CMMS is
no longer a luxury or trivial business overhead; it is a fundamental requirement for better
management of production assets and facilities (Schuman & Brent, 2005). In today's global
economy with strong and powerful competition, for developing nations like Ethiopia, the use
of CMMS in manufacturing industries is a “necessary evil” to attain and maintain a competitive
edge in productivity and quality. As pointed out by Sharma and Govindaraju (2010), one of the
greatest benefits of CMMS is the elimination of paperwork and manual tracking activities;
thus, enabling the maintenance staff to be more productive. It should be noted that the
functionality of a CMMS lies in its ability to collect and store information in an easily
retrievable format.
While the most Ethiopian medium and large manufacturing firms are well equipped
technically, Kahsay, Osanna, and Durakbasa (2007) note that they lack dynamism, leadership,
and management skills to enable efficient and effective computerized maintenance and
management maintenance in their respective companies. It is important to note that a CMMS
does not make decisions; rather, it provides management with the best information available to

27
improve the operational efficiency of a facility. As pointed out by Sahoo and Liyanage (2008),
maintenance can be a highly profitable activity if it is based on a rational, proactive approach
toward assets and their needs. Technical managers and department heads should demand more
room to lift their efforts beyond repair as the only conceivable option (Duran, 2011). In return,
they must be willing to be held accountable and justify their operations by accurately reporting
on technical and financial indicators – which become relevant as soon as people proactively
make decisions rather than wait for coincidence to determine their work schedule. This requires
a professionalization of technical management, adequate administrative tools, and accounting
methods that are capable of displaying the full picture of an asset's total life cycle cost.
As demonstrated by scholars such as Durán (2011) and MAzurkiewicz (2014), implementing
computer-aided maintenance management systems is an effective approach toward solving the
problems of decreased productivity relative to labor costs and consequent rise in unit costs,
which are continually afflicting present-day Ethiopian manufacturing managers. As such, the
purpose of this thesis work was to focus on the investigation of the effectiveness of the
development and the successful implementation of CMMS in Ethiopian manufacturing
industries. Additionally, it proposed an integrated maintenance management strategy and
developed an optimized CMMS model suitable for the context of Ethiopian manufacturing
industries. Hence, this research narrowed the knowledge gap prevalent in the management and
utilization of CMMS based on the fact that the investment of information systems is needed
for supporting daily maintenance management in Ethiopia manufacturing industries.
2.4 Scope of the Research
The scope of this research is tied into two levels, production efficiency, and organizational
effectiveness and success. This research is aimed at understanding various ways through which
efficiency, productivity, and effectiveness of industrial systems, processes, and workforce can
be improved through effective CMMS deployment with the ultimate objective of cost
minimization and profit maximization. The research objectives also relate to efficiency,
rationality, and viability of general management, administration, and policies. Medium and
large manufacturing companies were deemed fitting to fulfill this endeavor on account of their
structures, resources, and complexity in operations. Firms in Ethiopia were thought appropriate
for this study because there is a gap in the literature in this area, and the ‘management’ side of
CMMS is not fully implemented or effective in this region.

28
2.5 Summary
This chapter presented this research’s background and scope in the attempt to provide the
context of the problem addressed throughout this dissertation. The various studies that address
the same issue, especially in the Ethiopian context, were analyzed to identify not only the scope
of the problem but also the gaps in the literature. This chapter was written with the intention of
clarifying the importance and the necessity of this research in the first-place detailing why the
study and basic rationale behind the thesis were the major questions that guided this chapter.

29
Chapter 3: Literature Review
3.1 Introduction
In Chapter one, the research problem, research objectives, research questions, approach,
significance, and thesis synopsis were described. As part of the discussion of the background
and context in Chapter two, the researcher referred to the literature regarding the
implementation of CMMS and its adoption in Ethiopian manufacturing industries. The
following section, Chapter three, provides a general overview of the previous studies and
researches on CMMS. In doing so, it addresses the pre-stated sub-research questions one and
two, which aimed to identify the best practices about maintenance management systems within
manufacturing industries as well as identify the main problems being experienced with CMMS
at Ethiopian manufacturing industries. In this chapter, the concept of maintenance
management systems was also examined based on existing studies, including the levels of
maintenance, the types of maintenance, the maintenance management process, and elements
of a CMMS.
3.2 Computerized Maintenance Management System (CMMS)
Before providing empirical evidence regarding maintenance, maintenance management, and
the implementation of CMMS and its benefits and challenges, it is important to define CMMS
as a concept in scholarly descriptions and perspectives. Kans (2008) and Uysal and Tosun
(2012) define CMMS as a management tool, mostly in software form, that aids monitoring of
operations and maintenance exercises. The benefit of CMMS (also often referred to as
computer-aided maintenance management system) comes from the ability of a computer to
hold vast quantities of information, retrieve it quickly, process it at high speeds and present it
in a form which is of most value to users (Sullivan et al., 2004). From the foregoing, it will be
accurate to say computer application in maintenance can allow for easy and quick access to
precise data and as such valuable time is being saved. Kans (2008) states that computerized
maintenance systems are utilized instead of the manual (paper based) work maintenance
systems that have been used for many years because they are effective and efficient in
operation. The use of computers in maintenance can provide ready access to precise data and
ability to quick search and find detailed, relevant information with ease (Sullivan et al., 2004).
They offer the opportunity to manage and provide a broad scope of summarized information
with better quality than a manual system could ever provide.

30
CMMS is also known as Enterprise Asset Management and Computerized Maintenance
Management Information System (CMMIS) (Karray et al., 2012). A CMMS software package
maintains a computer database of information about an organization’s maintenance operations,
i.e., CMMIS - computerized maintenance management information system (Kans, 2008). The
software has evolved from relatively simple mainframe planning of maintenance activity to
window based, multi-user systems that cover a multitude of maintenance functions. The
capacity of CMMS to handle vast quantities of data purposefully has rapidly opened new
opportunities for maintenance, facilitating a more deliberate and considered approach to
managing assets (Uysal & Tosun, 2012). Among others, the greatest benefit of the CMMS is
the elimination of paperwork and manual tracking of activities; thus, enabling the staff to
become more productive. It should be noted that the functionality of a CMMS lies in its ability
to collect and store information in an easily retrievable format (Sullivan et al., 2004). A CMMS
does not make decisions; rather, it provides the Operational & Management manager with the
best information to affect the operational efficiency of a facility.
As in almost every sphere of organizational activity, modern computational facilities have
offered dramatic scope for improved effectiveness and efficiency. Maintenance is one area in
which computing has been applied, and CMMS have existed, in one form or another, for
several decades (Kans, 2008). The software has evolved from relatively simple mainframe
planning of maintenance activity to Windows-based, multi-user systems that cover a multitude
of maintenance functions. The capacity of CMMS to handle vast quantities of data purposefully
and rapidly has opened up new opportunities for maintenance, facilitating a more deliberate
and considered approach to managing the assets of an organization (Labib, 2004). The CMMS
is now a central component of many companies’ maintenance departments, and it offers
support on a variety of levels in the organizational. Firstly, Labib (2004) mentions that it can
support condition-based monitoring (CBM) of machines and assets, to offer insight into wear
and imminent failures. Secondly, if implemented effectively, CMMS can track the movement
of spare parts and requisition replacements when necessary.
According to Uysal and Tosun (2012), this system can also allow operators to report faults
sooner; thus, enabling maintenance staff to respond to problems more quickly. The researchers
also argue that CMMS it can facilitate improvement in communication between operations and
maintenance personnel and is influential in improving the consistency of information passed
between these two departments. Further, it provides maintenance planners with historical

31
information necessary for developing PM schedules while also providing maintenance
managers with information in a form that allows for effective control of their department’s
activities. Kans (2008) also agrees that CMMA offers accountants information on machines to
enable capital expenditure decisions to be taken and affords senior management a crucial
insight into the state of asset healthcare within their organization.
3.3 Maintenance
Maintenance is a key feature of organizational asset management and applies for the entire
lifetime of physical assets. The purpose of management goes further than just ‘fixing’ to
appropriate management of an asset health for its lifetime. According to Berno (2011) and
Kelly (2006), maintenance is the combination of all technical and associated administrative
actions intended to retain an item in, or restore it to, a state in which it can perform its required
function. Congruently, maintenance has also been described as “a routine and recurring activity
of keeping a particular machine or facility at its normal operating condition so that it can deliver
its expected performance or service without causing any loose of time on account of accidental
damage or breakdown” (Walia, Huria, & Cordero, 2010). Gits (2010) notes that maintenance
acts as a support for the production process, where the production input is converted into
specified production output.
Figure 1: The Link between Production and Maintenance (Berno, 2011)
Industrial maintenance comes as a secondary process, which has to contribute to obtaining the
objectives of production. Maintenance must be able to retain or restore the systems for carrying
out a perfect production function. As noted by Berno (2011) and illustrated in Figure 1,
maintenance as a support function in the production system should be valued as a critical role
and even as a prerequisite. This implies that the maintenance function in an organization must
be carried out effectively and taken at the proper time. Berno (2011) adds that the prime target
Production
Maintenance
Primary Production Input
Potential Production Capacity
Maintenance Demand
Primary Production Input

32
of maintenance should be to ensure the system function of production is maintained and
sustained at optimal levels. In this regard, effective maintenance procedures should provide the
right parameters of cost maintainability, reliability, and, ultimately, productivity for any
industrial company.
According to Al-Turki (2011), the maintenance function should be placed at the heart of any
production system [see Figure 2], and therefore, should consist of purposes and goals that
match with the purposes and goals of the organization. Hence, for the planning of maintenance,
the following should also be considered: production planning, decisions on maintenance, and
the complete organization. As illustrated in Figure 2, if resources in the form of money, tools,
spares, information, material, labor, and external services are invested towards maintenance, it
translates into better organizational performance in terms of safety, maintainability, systems
availability, output, and overall profitability. Al-Turki (2011) insist that enterprise system,
production system, and maintenance system must be intertwined for any industrial organization
to attain optimal productivity.
Figure 2: The Position of the Maintenance Function in the Organizational System (Al-Turki, 2011)
3.3.1 Maintenance Strategies in Manufacturing
As mentioned previously in this thesis, maintenance is defined as a combination of all
technical, administrative, and managerial actions during the lifecycle of an item intended to
retain it in or restore it to a state in which it can perform the required function. In
manufacturing, proper maintenance and repair are very crucial for any kind of equipment which
Enterprise System
Production System
Labor
Material
Spares
Money
External Services
Output
Availability
Maintainability
Safety
Profit
Maintenance System
Tools
Information

33
is subjected to operations. Safety assurance is also an important parameter to be taken care of
when dealing with an operational business entity; it is even more critical when operations are
associated with underground mining production systems due to its environment and space
limitations. To improve safety and production capacity in manufacturing industries, knowledge
of maintenance strategies is needed, and this knowledge should have its base in the
understanding of various types of maintenance.
Berno (2011) discusses two types of maintenance in industrial companies; corrective
maintenance (CM) and preventive maintenance (PM) [see Figure 3]. Like repair work,
corrective maintenance is performed after a breakdown or after failure is detected in equipment
or system. According to Berno (2011), CM denotes the maintenance carried out after fault
recognition and intended to put an item into a state in which it can perform a required function.
For repair work, some modeling approaches are available. After corrective repair, the failed
system or equipment is expected to perform in a normal state as if nothing had happened. CM
can further be divided into deferred [delayed] and immediate [instant] maintenance.
CM is the most expensive form of maintenance, especially if the maintenance is going to be
done urgently because no planning or coordination can be made. Therefore, the start-up cost
and the cost of lost production can be high (Kumar et al., 2010). CM does not involve
forecasting failure when an item tends to fail. Depending on the necessity of the failed item(s)
on the functioning of the system, maintenance can be done immediately or deferred. CM is the
maintenance strategy applied most often when it is difficult to predict when an item will fail
(Kumar et al., 2010). CM includes all unscheduled maintenance actions performed as a result
of a system or product failure to restore the system to a specified condition. The CM cycle
includes failure identification and verification (based on some symptom), localization and fault
isolation, disassembly to gain access to the faulty item, item removal and replacement with a
spare or repair of the item in place, reassembly, checkout and condition verification (Kumar et
al., 2010). On the other hand, preventive repair is defined as the maintenance carried out at
predetermined intervals or according to prescribed criteria and intended to reduce the
probability of failure or the degradation of the functioning of an item.
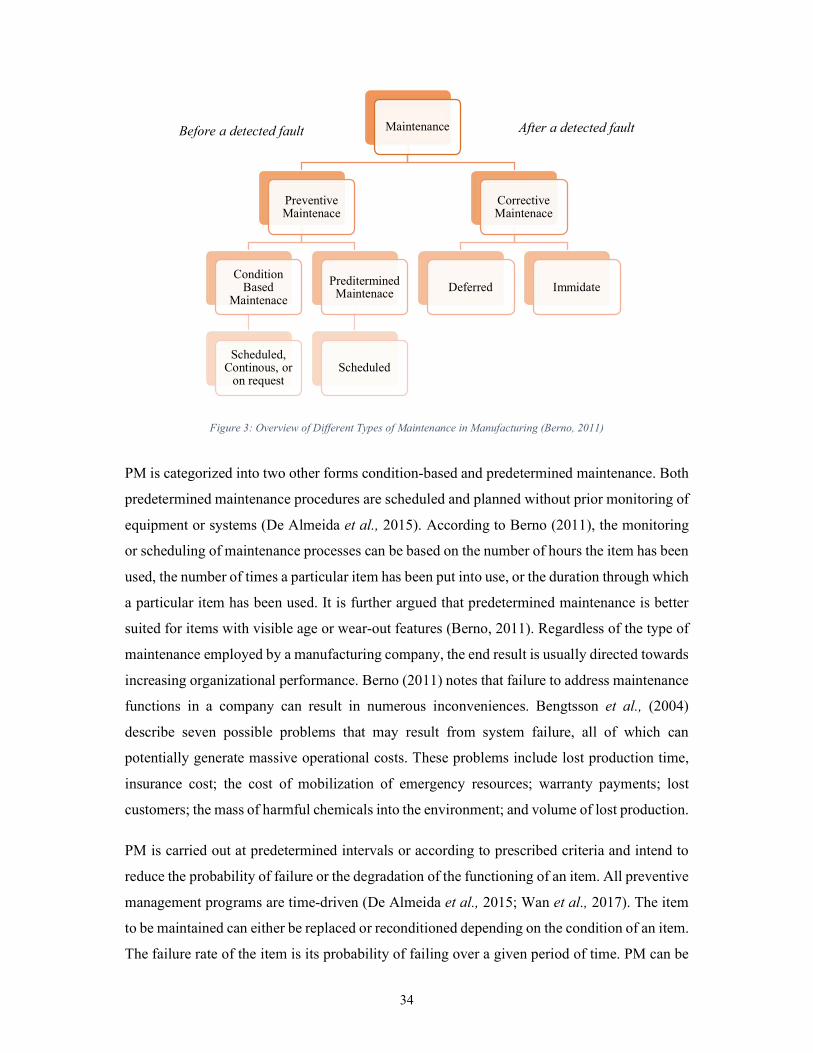
34
Figure 3: Overview of Different Types of Maintenance in Manufacturing (Berno, 2011)
PM is categorized into two other forms condition-based and predetermined maintenance. Both
predetermined maintenance procedures are scheduled and planned without prior monitoring of
equipment or systems (De Almeida et al., 2015). According to Berno (2011), the monitoring
or scheduling of maintenance processes can be based on the number of hours the item has been
used, the number of times a particular item has been put into use, or the duration through which
a particular item has been used. It is further argued that predetermined maintenance is better
suited for items with visible age or wear-out features (Berno, 2011). Regardless of the type of
maintenance employed by a manufacturing company, the end result is usually directed towards
increasing organizational performance. Berno (2011) notes that failure to address maintenance
functions in a company can result in numerous inconveniences. Bengtsson et al., (2004)
describe seven possible problems that may result from system failure, all of which can
potentially generate massive operational costs. These problems include lost production time,
insurance cost; the cost of mobilization of emergency resources; warranty payments; lost
customers; the mass of harmful chemicals into the environment; and volume of lost production.
PM is carried out at predetermined intervals or according to prescribed criteria and intend to
reduce the probability of failure or the degradation of the functioning of an item. All preventive
management programs are time-driven (De Almeida et al., 2015; Wan et al., 2017). The item
to be maintained can either be replaced or reconditioned depending on the condition of an item.
The failure rate of the item is its probability of failing over a given period of time. PM can be
Maintenance
Preventive Maintenace
Condition Based
Maintenace
Scheduled, Continous, or
on request
Preditermined Maintenace
Scheduled
Corrective Maintenace
Deferred Immidate
Before a detected fault After a detected fault
35
divided into condition-based maintenance (CBM) or predetermined maintenance (PDM). In
condition monitoring, parameters are measured to ensure that maintenance is done before
failure and is performed based on predetermined criteria (Kumar et al., 2010). Inspection is
done at regular intervals by a person involved in maintenance to ensure that maintenance is
performed as soon as it is required. Through regular inspections, measurements or tests, or
continuous monitoring, one can determine when it is time for replacement, servicing, or
adjustments (Shin & Jun, 2015).
These checks can be performed in three ways: using the subjective senses (sight, hearing,
touch, smell, and taste); intermittent or continuous use testing methods for detecting wear; and
running the equipment and notice that all functions work (Kumar et al., 2010). Conversely,
predetermined maintenance is carried out in accordance with established intervals of time or
number of units of use but without previous condition investigation. In order for PDM
implementation to be successful, the failure rate of an item needs to be increasing as the usage
time of an item increases. Therefore, the decision for the item maintenance interval should be
based on machine hours, age, frequency of use, and the distance traveled (Coetzee 2004).
According to Rastegari and Mobin (2016), most groups of similar machines will display failure
rates that can be predicted in some ways if averaged over a long period of time. The Bathtub
curve relates the failure rate to operating time. The mean-time to failure curve/Bathtub curve
indicates that a new machine has a high probability of failure because of installation problems
during the first few weeks of operation. After this initial period, the probability of failure
increases sharply with the elapsed time.
According to De Almeida et al., (2015), a complete CBM program must include monitoring
and diagnostic techniques. These techniques include vibration monitoring, acoustic analysis,
motor analysis technique, motor operated valve testing, thermography, tribology, process
parameter monitoring, visual inspections, and other non-destructive testing techniques.
Explanations for some of the commonly used CBM techniques can be given as per. CBM is
normally suitable when the failure rate is dependent on operating conditions rather than time
(Wan et al., 2017). Preventative maintenance includes all scheduled maintenance actions
performed to maintain a system or product in a specified operational condition. Scheduled
maintenance, notes De Almeida et al., (2015), covers periodic inspections, condition
monitoring, critical-item replacements (prior to failure), periodic calibration, and the like.
There are certain tasks of this type of maintenance that will result in system downtime, whereas

36
other tasks can be accomplished while the system is operating or in standby status. Scheduled
maintenance can be measured in terms of frequency, downtime, and where applicable, labor
hours (Wan et al., 2017).
Other forms of maintenance strategies that are worth noting include Total Productive
Maintenance (TPM) and Reliability Centered Maintenance (RCM). TPM aims to maximize
equipment effectiveness (Singh et al., 2013). It consists of a range of methods that are known
from maintenance management experience to be effective in improving reliability, quality, and
production. This maintenance strategy also tries to improve a company by improving personnel
and plant and changing the corporate culture (Singh et al., 2013). Cultural change at a plant is
a difficult task to perform, and it involves working in small groups, a strong role for machine
operators in the maintenance program, and support from the maintenance department. In the
TPM framework, the goals are to develop a "maintenance-free" design and to involve the
participation of all employees to improve maintenance productivity. Normally the company
put forwards its main priorities based on its plans, and these priorities performance actions
need to be measured, so the issue of the need of key performance indicators arise. According
to Singh (2013), the main parameters which are usually important to measure include total
system/plant effectiveness as well as system/plant productivity, availability, cost efficiency,
and quality.
A metric termed the “Overall equipment effectiveness (OEE)” is the benchmark used for
world-class maintenance programs. The OEE is established by measuring equipment
performance (Singh et al., 2013). Measuring equipment effectiveness must go beyond just
availability or machine uptime. It must factor in all issues related to equipment performance.
The formula for equipment effectiveness must look at the availability, the rate of performance,
and quality rate. This allows all departments to be involved in determining equipment
effectiveness. On the other hand, RCM is a process used to determine what must be done to
ensure that any physical asset continues to do what its users want it to do in its present operating
context (Rausand & Vatn, 2006). The process was developed within the aircraft industry and
later adopted to several other industries and military branches. A high number of standards and
guidelines have been issued where the RCM methodology is tailored to different application
areas (Mkandawire, Ijumba, & Saha, 2015).
The major advantage of the RCM analysis process is that it is a structured and traceable
approach to determine the optimal type of PM (Rausand & Vatn, 2006). This is achieved

37
through a detailed analysis of failure modes and failure causes. Although the main objective of
RCM is to determine the preventive maintenance, the results from the analysis may also be
used in relation to corrective maintenance strategies, spare parts optimization, and logistic
consideration; in addition, RCM has an important role in overall system safety management
(Rausand & Vatn, 2006). The use of RCM in the mining industry is very minimal; however,
some of the mines have implemented the method carefully with successful results. According
to Rausand and Vatn (2006), the fact that RCM can handle complex system operations with
optimal results makes it an attractive technique to be used in Mining industries to optimize
their maintenance activities.
3.3.2 The Rationale Behind Maintenance in Manufacturing
The need for maintenance is predicated on actual or impending failure (Berno, 2011). Ideally,
maintenance is performed to keep equipment and systems running efficiently for at least the
design life of the component(s). As such, the practical operation of a component is a time-
based function. According to Sullivan et al., (2010), if one were to graph the failure rate a
component population versus time, it is likely the graph would take the “bathtub” shape, as
shown in Figure 4. In the figure, the Y-axis represents the failure rate and the X-axis signifies
time. The curve can be divided into three distinct sections: infant mortality, useful life, and
wear-out periods.
Figure 4: Component Failure Rate over Time for Component Population (Sullivan et al., 2010)

38
The initial infant mortality period of the bathtub curve is characterized by a high failure rate,
followed by a period of decreasing failure (Sullivan et al.,, 2010). Many of the failures
associated with this region are linked to poor design, poor installation, or misapplication. The
infant mortality period is followed by a nearly constant failure rate period known as useful life.
There are many theories about why components fail in this region (Sullivan et al.,, 2010). Most
acknowledge that poor operations and maintenance (O&M) often play a significant role. It is
also generally agreed that a component failure rate over time for component population, that
exceptional maintenance practices encompassing preventive and predictive elements can
extend this period. The wear-out period is characterized by a rapidly increasing failure rate
over time. In most cases, this period encompasses the normal distribution of design life failures
(Sullivan et al.,, 2010). Equipment failure or breakdown losses are a contributing factor to
overall equipment effectiveness (OEE). OEE measures the productivity of individual
equipment in a factory. It identifies and measures losses of important aspects of manufacturing,
namely, availability, performance, and quality rate. This supports the improvement of
equipment effectiveness, and thereby, its productivity (Muchiri & Pintelon, 2008).
Manufacturers in other industries have also embraced OEE to improve their asset utilization
(Muchiri & Pintelon, 2008). According to Bernstein (2005),
𝑂𝐸𝐸 = 𝑎𝑣𝑎𝑖𝑙𝑎𝑏𝑖𝑙𝑖𝑡𝑦 𝑟𝑎𝑡𝑒 × 𝑝𝑒𝑟𝑓𝑜𝑟𝑚𝑎𝑛𝑐𝑒 𝑟𝑎𝑡𝑒 × 𝑞𝑢𝑎𝑙𝑖𝑡𝑦 𝑟𝑎𝑡𝑒
Where OEE is considered to be 85 %. The availability rate expresses losses due to unplanned
stoppages; the performance rate expresses losses due to machine performance lower than ideal
or standard operating rates; and the quality rate expresses losses due to rejects and reworks
(Bernstein, 2005).
3.3.3 Maintenance Objective and Best Practice
According to Moghaddam (2013), the maintenance management team should, at least on an
annual basis, maintain and update the maintenance department’s objectives. These should be
based on and should be in line with the framework as defined in the maintenance policy. The
objectives should be developed by first doing an analysis of how well the maintenance
organization is already performing in terms of the management team’s direction as set out in
the policy document (Moghaddam, 2013). The results of maintenance audits should also be
reviewed at this time. After this, it should be no more than a formality to set the objectives for

39
the year ahead. In line with good management practices, the objectives that must be achieved
and the dates for achieving such results should be very specific (Moghaddam, 2013).
Further, according to Vogl, Weiss, and Helu (2019), best practice is a very useful concept in
real-world applications. Despite the need to improve on processes as times change and things
evolve, best practice is considered by some as a business buzzword used to describe the process
of developing and following a standard way of doing activities that any organization can use
or implement to obtain better results. Implementing best practice in manufacturing, especially
in the areas of maintenance and reliability, can help an organization to (Vogl, Weiss, & Helu
2019): (i) increase output with the same assets; (ii) reduce the need for capital replacement;
(iii) reduce maintenance cost per unit; (iv) reduce total cost per unit; (v) improve performance,
cost, productivity, and safety; (vi) increase competitiveness; and (vii) increase market share.
3.4 Maintenance Management
Maintenance Management involves devising and setting in place methodology and resources
for the planning, organization, and control of exercises related to maintenance of equipment or
facility (Ding & Kamaruddin, 2015; Nodem, Gharbi, & Kenné, 2011). The maintenance philosophy
has been described as an expression of the role of the maintenance function within a company
and the basic approach it will take in fulfilling it. To align effectively to this objective, it is a
vital necessity that the maintenance management team evolve a policy document or statement.
This would describe, in broad terms, the direction in which the maintenance management team
intends to lead the maintenance department. The policy document would start, mostly, with a
general philosophy and vision of the maintenance organization and should go on to address the
policy of individual functional blocks that makes up the maintenance cycle within the
organization (Ding & Kamaruddin, 2015). Within an industry, notes Jasiulewicz-Kaczmarek
(2014), it will be accurate to regard maintenance as a sub-system charged with the
responsibility of delivering maintenance services.
3.4.1 Strategic Dimensions of Maintenance Management
If one puts maintenance into a larger context, it is part of asset management. Asset management
is characteristically about managing physical assets optimally over their life cycle in order to
meet the stated business objectives (Komonen, 2012). Figure 5, illustrates the life cycle
perspective and the driving forces of asset management, in which maintenance is part of
operations over the life cycle (Komonen, 2012). In this study, the researcher is only interested

40
in “operations and maintenance” part of the figure. That is, no preceding or following stages
of the life cycle, such as installation or disposal of equipment, are of interest.
Figure 5: Investment Life Cycle and Driving Forces of Asset Management (Komonen, 2010)
The main objective of maintenance is to preserve the condition of manufacturing equipment
through the operational life cycle (Berno, 2011). Thus, maintenance strategy and
manufacturing strategy have to be directly interrelated. This is not the case in many situations,
as the importance of maintenance is not recognized. The strategic level of maintenance
management is often ignored, and the focus is set only on tactical and operational aspects, such
as how to maintain equipment in technical respect (Robson, 2010). This can actually lead to a
reduction in manufacturing performance. And in turn – if maintenance and manufacturing are
managed strategically, in parallel, and strategies and operations establish a coherent link
between each other – this can lead to increased performance in manufacturing (Robson, 2010).
Operations and maintenance
Installation and commencing Manufacturing Design of process
and equipment Concept design Disposal
· Changing demand
· Changing competitive environment
· Modified product
· Economic obsolescence
· Changing operational requirements
· Wear and aging
· Technical obsolescence
· Environmental obsolescence
Use of investment Investment
Asset management of plants in operation : focus on
upkeeping of plants’ productivity and profit making capability , and improving plants in changing business environment
Asset management of new installations : focus on the
optimisation of the life cycle profits of plants

41
Figure 6: Key Elements for SMM (Robson, 2010)
In discussing the key elements of strategic maintenance management (SMM), Robson (2010)
describes the importance of both internal and external organizational objectives. These can be
expressed in a visual format, as shown in Figure 6. On the upper level, it is recognized that the
business objectives are dependent not only on the internal objectives but also on the external
environment. And the business objectives are the input to determining maintenance and
manufacturing strategies. Maintenance strategies are for ensuring that the load requirements of
equipment are met and that the equipment state is appropriate. The maintenance strategy
determines how maintenance is conducted on the operational level, and implementation of
strategy results in some performance (i.e., equipment state is restored or improved). The
linkage between maintenance and manufacturing is direct, as manufacturing is dependent on
equipment to be maintained. Manufacturing outputs serve the market and the reactions from
the market feedback to decision making.
When taking a strategic approach to maintenance management, two key aspects must be
emphasized. Firstly, maintenance management is a core business function for overall business
survival and success, and therefore it should be managed strategically. Secondly, maintenance
management needs to be based on quantitative models, which integrate maintenance decisions
with other strategic decisions such as production planning (Robson, 2010). In the SMM
approach, maintenance is a multi-disciplinary activity, which involves: understanding of
Business objectives
Equipment state
Manufacturing strategies
Operating load of equipment
Maintenance strategies
Implementation of manufacturing
strategy Implementation of
maintenance strategy
Maintenance output performance
Manufacturing output performance
Internal environment External environment
Corporate Customers
New entrants Competitors
Low cost Shareholders Market share
Marketing / sales Suppliers
Competitive advantage Etc .
Manufacturing outputs to the
market
Inputs to decision making from the
external environment

42
degradation mechanisms of equipment and linking it with data collection and analysis to assess
the state of the equipment; building quantitative models to predict the effects of different
maintenance actions on degradation; managing maintenance from a strategic perspective
(Langston & Lauge-Kristensen, 2013).
Table 1: Maintenance Strategy Decision Elements (Pinjala et al., 2006)
Pinjala et al., (2006) in their study summarized maintenance strategy decision elements and
strategic dimensions of maintenance management into various categories, including service-
delivery options; organizational design and structuring of maintenance work; support systems;
and maintenance methodologies, see Table 1. The first four decisions are called structural
decisions, as these decisions cannot be undone fast. For example, if maintenance has been
outsourced, it is practically impossible to bring it back in-house immediately. The last six
decisions are generally linked to specific operating aspects of a company, such as the
production process. Both the structural and infrastructural decisions are closely interrelated.
They can have a major impact on the maintenance function’s ability to implement and support
the overall business strategy.
3.4.2 Maintenance Management Framework
According to Crespo Marquez et al., (2009), the maintenance management process can be
divided into two parts, the definition of the strategy and strategy implementation. The first part,
the definition of the maintenance strategy, requires the definition of the maintenance objectives
as an input, which should be derived directly from the business plan. This initial part of the
maintenance management process conditions the success of maintenance in an organization

43
and determines the effectiveness of the subsequent implementation of maintenance plans,
schedules, controls, and improvements (Crespo Marquez et al., 2009). In the case of
maintenance, effectiveness can represent the overall company satisfaction with the capacity
and condition of its assets or with the reduction of the overall company costs obtained because
production capacity is available when needed. Effectiveness concentrates then on the
correctness of the process and whether the process produces the required result (Crespo
Marquez et al., 2009).
The second part of the process, the implementation of the selected strategy, has a different
significance level. The ability to deal with the maintenance management implementation
problem, for instance, the ability to ensure proper skill levels, proper work preparation, suitable
tools, and schedule fulfillment, will allow the company to minimize the direct maintenance
cost such as labor and other maintenance required resources. In this part of the process, the
efficiency of management is dealt with, which should be less important. Efficiency is acting or
producing with minimum waste, expense, or unnecessary effort. Efficiency is then understood
as providing the same or better maintenance for the same cost (Crespo Marquez et al., 2009).
Figure 7 presents a generic model proposed for maintenance management for built and in use
assets and consists of eight sequential management building blocks. The first three building
blocks condition maintenance effectiveness, the fourth and fifth ensure maintenance efficiency,
blocks six and seven are devoted to maintenance and assets life cycle cost assessment of assets.
Finally, block number eight ensures continuous maintenance management improvement
(Crespo Marquez et al., 2009).
Once these activities are accomplished, the organization can gain effective control of systems
and operations to ensure the functionality of each asset throughout its life cycle. This is carried
out by the implementation of a CMMS, a maintenance function measurement system, and
planning and scheduling the maintenance activities (Kans, 2008; Uysal & Tosun, 2012). It is
accomplished according to various tactics employed depending on the value that these assets
represent and the risks they entail for the organization. Among these tactics, Kans (2008) notes,
includes run to failure; redundancy; scheduled replacement; scheduled overhauls; ad-hoc
maintenance; preventive maintenance; age or use based; condition-based maintenance; and
redesign.

44
Figure 7: Generic Model for Maintenance Management (Crespo Marquez et al., 2009)
Finally, it is proposed that the implementation of methods for continuous improvement, such
as RCM and TPM, can be effective in unceasing maintenance management (Rausand & Vatn,
2006; Singh et al., 2013). The same scholars also recommend the use of process reengineering
techniques [such as Activity Based Process Mapping techniques, Process Value Analysis
techniques, and Innovative Process Visioning techniques, among others] for stepped leap
improvements in maintenance.
3.4.3 Maintenance Management Models
Having looked at the generic maintenance management generic framework, it is important to
succinctly describe some of the maintenance management models available. Maintenance
optimization is the process to attempt the balance of maintenance requirements such as
legislative, economic, technical, or others. The goals is to select the appropriate maintenance
technique for each piece of equipment in the system and identifying the periodicity that the
maintenance technique should be conducted to achieve the best requirement, maintenance
target concerning safety, equipment reliability, and system availability/costs. (Garg &
Deshmukh, 2006) has presented various resources in the field of maintenance optimization
models as shown in Table 2.

45
Table 2: Maintenance Management Models (Garg & Deshmukh, 2006)
Modeling approach
Simplified definition and a brief example of utilization
Bayesian models
Bayesian models incorporate Bayesian probabilistic mathematics in analyzing and determining a deterioration function of a system based on data. Firstly, combined classical Bayesian approach is about assuming that true probabilities and probability distributions exist, and these are estimated by available data. Secondly, a wholly subjective Bayesian approach means probabilities and distributions are constructed only by subjective data which can be validated, and the rest is assumed (“best guesses”). Usually the latter is the best approach in real-world situations as hard data is usually not of enough quality, and for decision makers predictions made by experts are more respectful than assumptions made from bad data. (Apeland et al., 2003)
Mixed integer linear programming models
Mixed integer linear programming is a basic mathematical framework for solving problems, in which objective functions are to be met under some defined rules. The problems are programmed and solved by computers. Goel, Grievink, and Weijnen (2003) have used the technique in optimizing reliability requirements of a machine at design stage and doing this in parallel with selecting suitable process configurations, production and maintenance planning for a multipurpose process plant. In their one example, the above optimization problem involved defining and calculating 1680 binary variables, 8012 continuous variables and 13 377 constraints. That is, it is possible to solve very complex problems with this technique.
Fuzzy multiple criteria decision making and linguistic models
Fuzzy multiple criteria decision-making models are good in choosing maintenance strategies in situations of imperfect or missing data on the condition of a system to be maintained. Fuzzy logic is basically about declaring a probabilistic function for a set of input data belonging to a set of output data. In this case, this means it is possible to qualitatively assess how a certain maintenance strategy can identify different failure causes in equipment. For example, we can qualitatively say that there is a somewhat strong probability of a TPM strategy to be able to identify failures caused by, say, dirt in the surrounding of equipment (because inspections are conducted by cross functional teams that should be able to detect these kinds of problems). Then, it is possible to form a fuzzy logic function between failure causes and maintenance strategies. Finally, the optimal maintenance strategy can be found by calculating, which maintenance strategy can identify the failure causes best in a situation (Azadeh & Abdolhossein, 2016).
Simulation and Markovian probabilistic models
Simulation approaches incorporate many techniques how to model a system. The main power of simulation is to examine huge numbers of possible scenarios of behavior in stochastic systems. One possible and common tool is Monte Carlo simulation, which can be used to analyze, for example, different deterioration possibilities of a system (Barata et al., 2002, p. 256-258). Then, in Markovian models a system to be maintained is described by states, in which it can be at certain time, and probabilistic functions, which dictate the transitions between states (deterioration processes). For example, a component could be either in operation (state 1) or broken (state 2), and there is some probabilistic function which dictates when the functioning component breaks down (transition). By this approach it is possible to model, what costs are incurred by a system being in different states (i.e. downtime costs) and transitions (maintenance or deterioration) Chiang & Yuan, 2001, p. 165-166)
Analytical hierarchy process, Petri nets and maintenance organization modeling approaches
Analytical hierarchy process suits in decision making situations in which there are multiple criteria to be met and many possibilities of actions. In analytical hierarchy process, all possible criteria are prioritized and each possible action against each criterion is evaluated. As an outcome, actions are prioritized in respect to all criteria. Some scholars have utilized the technique in determining optimal maintenance strategy, using pairwise judgments for evaluating the applicability of each possible strategy in meeting several profit, cost, equipment availability and safety criteria (Goossens & Basten, 2015). A Petri net is a graphical representation of a system, which goes through different states through transitions. Petri nets allow both visualization and modeling of a system behavior mathematically or using other sophisticated methods. Finally, organizational modeling approaches aim to model a whole maintenance management system. There are many possible ways and perspectives to model these systems (Leigh & Dunnett, 2016; Wang, Atli, & Kondo, 2014).
According to Garg and Deshmukh (2006), maintenance management optimization models can
be divided into a few sub classes. Of each of these sub classes, an example model is narrowly
introduced. However, fully detailed explanations on how to make these models technically are
not given, because that is not in the scope of this study. Rather, these examples provide some

46
perspective on maintenance modelling and the basis for the new integrated maintenance
management strategic framework and an optimization of CMMS model that suits to the
Ethiopian manufacturing industries in this study. The subclasses of maintenance management
models include (but not limited to) Bayesian models; mixed integer linear programming
models; fuzzy multiple criteria decisions making and linguistic approaches; simulation and
Markovian probabilistic models; analytical hierarchy process, and Petri Nets and maintenance
organization modelling approaches.
At this point, it is worth mentioning that the new integrated maintenance management strategic
framework and an optimization of CMMS model made for this study borrows some features
from some of the methodologies presented in Table 2. Firstly, the new optimized CMMS model
is obviously a simulation model, in which there are many stochastic elements. Thus, it partly
applies Bayesian and Markovian methodologies. Secondly, the model is basically computer
programming, relating partly to mix integer linear programming. Thirdly, it is possible (but not
very practical) to visually represent systems, which makes it comparable with Petri nets.
Finally, the model could be categorized into the category of organizational modelling
approaches, as the systemic view is taken in modelling.
3.5 Selecting an Appropriate CMMS
A CMMS can either be developed in-house or purchased as a ready-made software. Regardless
of the option a company chooses, it is important to review a number of criteria to make the
right selection for factories application (Garcia et al., 2004). In-house development means
software developed in-house by factories own employees or people subcontracted to develop
it for factories under factories direction and as per factories specifications. Ideally, an in-house
system offers a great deal of flexibility to a company (Garcia et al., 2004). It also provides the
best link with existing plant information systems because it can be designed to accommodate
the needs of other departmental systems. An in-house system can be designed to meet the
highly specialized needs of a company, while readily adapting to its current maintenance
operations. However, the main disadvantages of in-house development of CMMS include high
cost, longer development time, and high potential for narrowed focus as opposed to innovation
and creativity (Garcia et al., 2004). As an alternative to in-house CMMS, ready-made software
has been shown to offer various benefits, especially in terms of saving time and money (Iung,
2006). The reason for the significant savings in readymade software is because factories save
many of the time-consuming factors involved in in-house development such as involving

47
extensive programming efforts and extensive testing and redesign. Because the solutions are
developed over a number of years and designed to meet a variety of needs and specifications,
they often prove to have more sophisticated, creative, and innovative approaches to
maintenance solutions (Kans, 2008). In sum, advantages of CMMS ready software include, but
not limited to, relatively low cost; no development time; shorter implementation time; provides
current state-of-the-art technology; provides additional features than factories proposed
system, thus further improving productivity; provides the required flexibility to meet factories
current and future needs; and user groups to help factories get most out of factories software.
However, issues with linking to existing information systems and failure to meet highly
specialized needs have been cited as potential drawbacks.
Given the advantages of an already made CMMS software, scholars seem to propose their
adoption over in-house applications. However, how does a company find and select the
maintenance software that is best for its application? If a proper logical selection method is not
followed, it may result in the acquisition of software that will not satisfy the company’s needs,
and involve delayed implementation, cancelled projects, returned software, and frustration
(Iung, 2006). There are a number of ways to select software. Factories can rely solely on those
programs that are advertised in popular trade journals. Factories can call competitors and ask
them about the system they bought (Kans, 2008). They can also hire a consultant to figure out
needs and requirements. In an effort to achieve maximum results and return on the investment,
there is a need to manage the evaluation, acquisition and implementation process—from start
to finish. This way, Iung (2006) asserts, not only can factories realize the potential benefit and
drawbacks of a proposed system, but also will be able to select the best package to suit the
current and future needs.
3.6 Implementing CMMS
The implementation of CMMS is a significant investment for organizations. Since information
systems (IS) are sociotechnical systems, development involves the joint design of activity
systems and ICT systems (Kans, 2008). It is important to define the key stages of the
information system implementation process. Consequently, Kans (2008) IS implementation
stages which are concerned with a number of key activities in the process. In addition, the IS
implementation process concept is similar to O'Brien and Marakas (2006) who explained a
five-step process called the information systems development cycle which includes the steps
of: (1) investigation; (2) analysis; (3) design; (4) implementation; and (5) maintenance (Figure

48
8). The first phase of IS development process is systems investigation or system conception
which is aimed to determine how, based on informatics planning and management, to develop
a project management plan and obtain management approval.
Systems analysis is focused on identifying the information needs and developing the functional
requirements of a system. Systems design is the process of planning a technical artefact and
developing specifications for hardware, software, data, people, and network. In addition, this
phase involves building the information system to its specifications. System implementation
involves delivery of systems, testing the system, training people to use the system, and
converting to the new business system. Finally, system maintenance is the process of making
necessary changes to the functionality of an information system (O'Brien & Marakas, 2006).
Figure 8: Information System Development Cycles (O'Brien & Marakas, 2006)
One of the most important processes of CMMS implementation is the initial part of the project
or strategic planning of IT (Gunasekaran & Ngai, 2004). Many companies focus on their
strategic planning with aims to develop long-term plans, change their organization, and
improve their competitiveness. Planning is a major issue for the CMMS implementation
process, and CMMS planning can be defined as “organizational activities directed toward: first,
recognizing organizational opportunities for using information technology; second,
determining the resource requirements to exploit these opportunities; and third, developing

49
strategies and action plans for realizing these opportunities and meeting the resource needs”
(Beni 2014). However, before implementation, it is important to view the business model, and
then identify suitable CMMS requirements (Gunasekaran & Ngai, 2004). In order to increase
the effective IT planning process, therefore, Beni (2014) suggests nine planning agenda. This
IT planning agenda points out various issues that managers or organizations require giving
attention to: 1. intra-organizational political analysis; 2. intra-organizational market analysis;
3. business strategy analysis; 4. business market analysis; 5. technology analysis; 6.
organizational learning analysis; 7. organizational culture; 8. IT infrastructure analysis; and 9.
IT risk-taking analysis.
Scholars agree that the implementation of CMMS requires a project management approach
administrated by the right team with top management for the successful planning and
implementation of the CMMS project (Beaumaster, 2002; Gunasekaran & Ngai, 2004). For
instance, the IT procurement involves all aspects of IT acquisition not only the software and
hardware, but also various services, support personnel, intellectual properties, and items related
to information technologies. Furthermore, Beaumaster (2002) provides the necessary functions
in this process including investment analysis, risk assessment analysis, life cycle planning, and
systems acquisition. Various factors required, according to Beaumaster (2002) regarding
CMMS implementation, concern putting the system into practice, managing change,
developing skills, training and evaluation. In order to achieve implementation goals and
objectives, Gunasekaran and Ngai (2004) claims that successful implementation of CMMS
needs a strong project team which can include key and IT knowledge managers from all
functional areas. They also suggest that education and training are the most important factors
of any change process in an organization, and the users need to be motivated to work in a
transparent and open communication environment.
One of the important factors in CMMS implementation is the top management support and
involvement in order to successfully implement the CMMS solution (Gunasekaran & Ngai,
2004). According to O'Brien and Marakas (2006), CMMS activities involve hardware and
software acquisition, software development, testing of programs and procedures, development
of documentation, and a variety of conversation alternatives. Also, education and training of
end-users and specialists who will operate a CMMS are involved. The first step, acquisition of
hardware, software, and services, concerns how the organizations evaluate and select the
hardware, software, and IT services; thus, all hardware and software requirements are set up.

50
Most large organizations both in private and public sectors formalize these requirements by
listing them in a document called an RFP (request for proposal) or RFQ (request for quotation)
(O'Brien & Marakas, 2006). Then these requirement documents are sent to the suitable vendors,
and the agreement is signed. The second step is concerned with development or modification
of software application in order to meet the organization’s requirements. The third stage is a
vital implementation activity which involves the education and training of the maintenance
department personnel such as end-users. They have to learn how the implemented CMMS
impacts the organization’s business processes and management. The fourth step concerns
developing documentation for the system users.
Finally, the last step is the conversion process which concerns changing the approaches from
the old systems to new systems. Conversions can be achieved on a parallel basis, phases basis,
pilot conversion, and plunging in to a new system (O'Brien & Marakas, 2006). Another
perspective of implementation process is highlighted by Amandi-Echendu et al., (2015), who
presented the phases and main functions of IT projects that are similar as the literature
mentioned previously. These phases consist of project initiation, requirement definition,
acquisition/development, implementation, and termination. In addition, they claimed that every
IT project should carry out quality control, risk management, and change management over the
entire life cycle of the project. In order to achieve CMMS project implementation, Amandi-
Echendu et al., (2015), also explained that the maintenance department should meet the
following basic requirements for it to be efficient. These include a clear business objective;
comprehension of the nature of the change; and understanding the project risk, in order to
achieve CMMS project implementation.
3.6.1 Critical Success Factors in CMMS Implementation
Various scholars presented a set of CSFs of CMMS Implementation including technical
characteristics, user involvement, communications, management support, project team
characteristics, difference between technology provider and receiver, incentives, infrastructure
support and obstacles, to identify their effects on external technology transfer project.
Moreover, a list of success factors are also drawn up by Milis and Mercken (2002), who found
a large number of possible success factors and also provided an overview of the possible
success factors regarding IT project implementation. However, in CMMS, CSFs can be
grouped in four categories according to Ahuja and Khamba (2008). The first category
integrates factors which influence implementation goal and objectives. The second category

51
contains the components that relate to project team in order to improve the motivation and
cooperation of the team. The third category concentrates on the acceptance of the project and
the result. Finally, the fourth category is concerned with the implementation process which
deals with implementation politics and planning.
3.6.2 Benefits of Implementing CMMS
Various scholars, past and present, have explored in-depth the numerous benefits of CMMS
across different industries and contexts. In a past study, Wilder and Cannon (1993) argue that,
if implemented properly, a CMMS can effective in any industry as it assures management of
properly maintaining capital investment in costly plat equipment. In this study, the scholars
note that such systems are particularly important for a variety of functions, including work
orders, inventory, reports, graphs, preventive maintenance tasks, and crafts. In a more recent
study, Jamkhaneh et al., (2018) findings suggest that the concept of CMMS is important for
companies because it relates positively to relevant organizational factors, including effective
instruction, employees’ involvement, senior management support, decision-making structure,
and resource allocation. Other scholars have argued that computer-aided maintenance
management systems are vital for companies because they help in reducing overtime, ensuring
compliance with regulatory standards, increasing safety, reducing downtime and repair costs,
enhancing productivity, eliminating paperwork, managing spare parts inventory, managing
work orders efficiently, as well as planning and scheduling preventive maintenance
(Jamkhaneh et al., 2018; Munyensanga, Widyanto, & Aziz 2018; Stephens, 2010).
According to Wienker, Henderson, and Volkerts (2016), a well-implemented CMMS can bring
numerous benefits to any company, but the most notable is the ability for such systems to ‘turn
data into information’ that can then be utilized to analyze problems and help identify solutions
that can improve performance and productivity. Other additional benefits, according to the
researchers, include reducing stock, reduced time for spare parts and tools assembly, easy
access to historical data, high-quality reporting, and improving planning and scheduling. The
reported benefits of CMMS have attracted applications across various industries, sectors, and
countries. In their study, Munyensanga, Widyanto, and Aziz (2018) provide management of
information implemented in a CMMS’s database via an Android application called SafeUp.
Their study shows that CMMS can be effective for restoring the shutdown and breakdown
statues that result from the system of a Circulating Water Pump (CWP). This study suggests

52
that CMMS can be an effective tool for assurance of the performance of industrial equipment
such as water pumps.
For electrical and electronics engineering, Kozusko (1986) note that the computerization of
information enabled by CMMS can result in better management of the need for and the cost of
maintenance personnel, provide better historical costs of maintenance to improve budgeting,
optimize stocking levels of spare parts, improve thermal efficiency, and improve availability
by reducing the number and severity of outages. As mentioned previously, other scholars have
also attempted to study the applicability and effectiveness of CMMS application in other areas
and industries, including hydropower plant in China by Li, Ai, and Shi (2007); process industry
by Ramachandra, Srinivas, and Shruthi (2012); finance and asset management in United State
by O’Hanlon (2005); and in the construction industry in China by Chan, Lee, and Burnett
(2003). In manufacturing, the study of Uysal and Tosun (2012) found that CMMS
implementation can be effective, particularly in allowing maintenance practitioners in the
manufacturing industry to concentrate on improving productivity and less on maintenance
costs. The analysis in this study was conducted using a multi-attribute decision-making
methodology called fuzzy TOPSIS to conduct interviews and questionnaires from three
electrical manufacturing companies in Turkey. In a recent study conducted in Turkey to
investigate the effectiveness of CMMS application in a firm that produces dairy products,
Arslankaya and Atay (2015) similar results. The study found that the implementation of CMMS
and lean manufacturing techniques can result in the elimination of losses due to breakdowns,
which ultimately enhances the productivity and motivation of employees. As noted, prior in
this study, no study has been conducted in manufacturing firms relating to CMMS application,
despite its use and empirical evidence of its effectiveness.
3.6.3 Challenges of CMMS Implementation
From previous research, scholars have attempted to identify and categorize problematic issues
regarding the CMMS implementation. These issues create or worsen the implementation
problems. The more specific categorizations of the issues can be viewed as: management
process issues, organizational environment issues, leadership issues, technical systems issues,
and personnel issues (Ahuja & Khamba, 2008). Management process issues speak to the
functional operation of an organization such as budgeting, personnel, and general management.
Organizational environment issues are identified as factors which are less tangible such as
organizational culture, change, and behavior. Leadership issues relate to the areas which

53
involve the interaction and direction of the organization executive. Technical systems issues
are mainly those referring to the hardware and software considerations of information
technologies. Personnel issues are those issues surrounding each individual in the organization.
These issues impact the planning, procurement, and deployment of information systems in
their organizations. In this study, these categorizations of IS issues were the frame of study in
terms of challenges or problems that an organization faces when a CMMS is implemented. In
addition, Ahuja and Khamba (2008) claims that MIS implementation processes are not easy to
achieve. They also identified some issues which many organizations have faced, and these
factors also impact organizational processes and products associated with each implementation
stage. These factors include characteristics of the organization (specialization, centralization,
formalization), characteristics of the technology being adopted (complexity), characteristics of
the task to which the technology is being applied (task uncertainty, autonomy and
responsibility of person performing the task, task variety), and characteristics of the
organizational environment (uncertainty and inter organizational dependence). Another
perspective of MIS implementation challenges is also presented by Lucey (2004) that the
problems relate to CMMS implementation include the following: lack of management in the
design phase of the CMMS; inappropriate emphasis of the computer system; undue focus on
low-level data processing applications particularly in maintenance area; lack of management
knowledge of maintenance as a profit center; and lack of top management support.
3.6.4 CMMS Optimization
Systems that support the total maintenance operation improves the quality of maintenance and
physical asset management and be integrated with the overall business system of the
organization. CMMS provides greater levels of manageability to maintenance operations
(Kans 2008; Uysal & Tosun, 2012). CMMS covers the total scope of the maintenance operation
providing the means to improve the overall quality of maintenance management. Enterprise
Asset Management (EAM) provides a broader scope of integrated software to manage physical
assets, human resources and parts inventory, in an integrated system for maintenance
management, maintenance, procurement, inventory management, human resources, work
management, asset performance, and process monitoring (Peters, 2006). Vast amounts of data
associated with maintenance tasks comes under computer control and be available as key
information for planning, scheduling, backlog control, equipment history, parts availability,
inventory control, performance measurement, downtime analysis, etc.
54
Maintenance departments in manufacturing industries throughout the world and also in
Ethiopia increasingly rely on a computerized maintenance management system (CMMS) to
gather, sort, analyze, and report on essential information related to equipment and facilities
performance. Managers use this information, among other things, to set department priorities
and cost-justify equipment purchases. In many cases, the CMMS is not producing the desired
results. The question is, when is the time to upgrade factories CMMS? Optimization means
determining existing useful features in factories where CMMS are currently not being used and
start utilizing them to improve productivity (Braghlia et al., 2006). Upgrading means
determining lack of useful features in factories CMMS and then obtaining them either by
upgrading factories current CMMS or by acquiring a new CMMS package.
The most important step in the upgrade/optimize process is an audit of factories’ CMMS.
Observations based on audits reveal how audits can form the basis of a CMMS upgrade. The
dynamic nature of business operations and the continuous challenge to keep costs down makes
periodic audits a necessity if the businesses are to succeed (Braghlia et al., 2006). Two major
steps comprise the audit procedure. The first step is establishing a baseline, and the second is
comparing subsequent audits to the baseline to measure improvements. Essentially the audit
shows strengths and weaknesses. The strengths are continued, and the weaknesses are analyzed
to establish actions for improvement. For long-range improvements, the audits are required at
least once a year to continue the improvements (Braghlia et al., 2006).
3.7 Summary
In the first part of this chapter, the definition of maintenance and maintenance management
systems was explained. It was determined that to analyze any maintenance management
process, the current system should be looked at holistically by taking into account the levels of
maintenance, the different strategies, the maintenance process, work planning, and scheduling,
maintenance analyzing and the computerized maintenance management system in place
(CMMS). This first part of the chapter answered research question RQ1 and research objective
RO1 which was to identify the best practices in the literature about maintenance management
systems within organizations. The subsequent chapter provides this study’s theoretical
foundation and conceptual framework where theoretical, conceptual, and philosophical
underpinnings of this research are expounded.

55
Chapter 4: Theoretical Foundation and Conceptual Framework
4.1 Introduction
This chapter presents this research’s conceptual frameworks for the Ethiopian industrial
companies. Firstly, the model “The Maintenance Management Pyramid Model” is described,
and its relevance and application in this study expounded. The theoretical, philosophical, and
conceptual underpinnings of the study are discussed throughout this chapter. The models
incorporate pieces that are borrowed from various scholarly works, but the structure and overall
coherence are originally built by the researcher.
4.2 Theoretical Foundation
This entire thesis is grounded under system theory, a theory introduced in the 1930s by L. von
Bertalanffy as a modeling tool that accommodates or analyses the interrelationship and overlap
between separate systems (Callier & Desoer, 2012). The theory can best be defined as an
interdisciplinary theory about the nature of complex systems in nature, society, and science, as
well as a framework by which one can investigate and/or describe any group of elements that
work together to produce some results. In this thesis, and the model it presents, a variety of
interdependent and interrelated elements of CMMS for Ethiopian manufacturing industries are
presented, illustrating the importance of systems theory in this research. Based on this theory,
a system (such as CMMS) is a cohesive conglomeration of both interrelated and interdependent
parts which can occur naturally or made by humans. According to Callier and Desoer (2012),
every aspect of a system is bounded by space and time, and influenced by its environment
while being defined by its purpose and structure, and expressed through its functioning. As
illustrated by the proposed model in this thesis, a system is more than the sum of its components
because it expresses synergy and emergent aspects.
The Maintenance Management Pyramid Model adopted in this study involved an
interconnection of different maintenance management elements under a single model. Some of
the key constructs under this pyramid include spare part management, reactive maintenance,
asset inventory, resource allocation, CMMS, world class maintenance, operational
involvement, predictive maintenance, and financial optimization as illustrated in Table 3 and
Figure 9 and discussed independently thereafter. Furthermore, systems theory was though
fitting for this study because it investigates both the principles common to all complex entities
[such as those found in a CMMS framework] and the mathematical models that are used to
56
describe them. This theory was particularly accommodating when formulating the use-cases,
static structure, and component diagrams for the CMMS for Ethiopian manufacturing
industries. System theory helped in driving the focus on the interactions and on the
relationships between parts as the researcher tried to understand various Ethiopian
manufacturing companies, and CMMS’s functioning and outcomes. This, according to Mele,
Pels, and Polese (2010), entailed a dialogue between holism and reductionism.
4.3 Maintenance Management Pyramid Model
This model is an integrated maintenance management strategic framework model which is
formulated by the researcher for the purpose of this research for the Ethiopian manufacturing
and industries. It introduces some of the fundamental concepts of maintenance management,
as discussed by various scholars such as Garg and Deshmukh (2006), Labib (2004), and Parida
et al., (2015) and is based on the most prominent expert views currently available on the
subject. Therefore, the model is adapted from the maintenance management framework
proposed by scholars such as (Holtz & Campbell, 2003). By using a single figurative
framework (the building of a pyramid), it highlights the relationships and interactions between
these concepts and the fact that the one cannot be applied without another. According to
Mostafa et al., (2015), organizing and improving the maintenance function in a company is
like building a pyramid. Each layer is supported by a more solid and larger layer.
Starting in the middle or skipping a layer cannot be effective as the strength of the layer on top
depends much on the quality of the layers below (Mostafa et al., 2015). Maintenance
management is the art of getting the most out of a company's assets. Over the past few decades,
note Carla et al., (2009), it has become a solemn profession with a decisive impact on
competitiveness and profits - often decreasing the effects of marketing and product innovation.
At present, Best Practice Maintenance Management (BPMM) has become the challenge of
finding most companies’ optimal combination of some fifteen concepts and methods that have
been successfully applied around the world (Carla et al., 2009l; Ireland & Dale, 2001). If these
concepts and methods are considered to be the building blocks, they can be put together in five
layers to form a pyramid (see Figure 9) of increasingly advanced management techniques,
resulting ultimately in what is considered to be World Class Maintenance, a set of benchmarks
for maintenance as being applied by the world's most successful companies. They can be listed,
as shown in Table 3.

57
Table 3: List of parameters for Integrated Maintenance Management Strategic Frame Work
However, in order to attain the World Class level, one has to start at the bottom. A solid
foundation is needed to carry the maintenance department step by step towards ever higher
standards of performance (Holtz & Campbell, 2003).
Figure 9: Maintenance Management Pyramid (Constructed by the Researcher)
4.3.1 Layer 1: Balancing the Workload
The first layer of the pyramid is described by Holtz and Campbell (2003) and Ireland and Dale
(2001) as the most difficult to build. Solid groundwork must be done before the rest of a proper
structure can be shaped. Although the tools and materials are seemed to be obvious and easy,
many companies have failed to lay a foundation capable of carrying the higher layers of
maintenance management techniques (Singh et al., 2013). The objective of the first layer is to
organize the work of the maintenance department in such a way that at least some part of it can
1. Reactive Maintenance 8. Spare Parts Management 2. Asset Inventory 9. Technical Training 3. Maintenance Needs Analysis 10. Operations Involvement 4. Resource Allocation 11. Predictive Maintenance 5. Preventive Maintenance 12. Reliability Center Maintenance 6. Workflow Control 13. Total Productive Maintenance 7. Computerized Maintenance 14. Financial Optimization System (CMMS) 15. World Class Maintenance
= done / achieved Start
Spare Parts Management
Work Flow Control
CMMS Technical Training +
Operations Involvement
Predictive Maintenance
Reliability Centred
Maintenance
Total Productive
Maintenance
Financial Optimization
World Class Maintenance
Time / Layer
Size of required effort
5
2
3
4
1
+ +
Reactive Maintenance
Asset Inventory
Maintenance needs
Analysis
Resource Allocation + + +
Preventive Maintenance +
+ +
+

58
be done by planning in advance. Ireland and Dale (2001) state that gaining control over the
agenda is the first step of improvement. It creates the capacity which can only be achieved if
breakdowns and failures are handled. This means that there is a need to introduce some amount
of preventive maintenance before moving any further. Balancing the workload between run-
to-failure and planned preventive actions means that only 50% of the total available man-hours
are spent on the prevention of failures and merely 50% on fixing them (Singh et al., 2013). As
soon as this is attained, more advanced tools can be implemented to optimize the maintenance
effort (as depicted in layer 2). Ultimately, the benchmark for BPMM is to reach more than 85%
of planned maintenance, against 15% or less of the time spent on unplanned reactive work
(Singh et al., 2013). Nonetheless, there is a need to have a look at the building blocks that make
up the ground layer of the pyramid.
4.3.1.1 Reactive Maintenance (RM)
Reactive maintenance (also called breakdown maintenance or run-to-failure) is the oldest and
most simple way of doing maintenance (Motawa & Almarshad 2013). Although there has
criticism of this maintenance method, [such as in Jin et al., (2006)], it is still widely applied all
around the world. Nevertheless, RM can only be considered a responsible strategy if an
organization can afford breakdowns and the subsequent (sometimes costly) repair or
replacement of broken equipment. Unfortunately, this is often not the case. Research has shown
that doing reactive maintenance is up to three times more expensive than planning work in
advance (Jin et al., 2006). This is primarily a result of the greater efficiency of planned work
in terms of resource utilization (tools, staff) and the supply of required materials (spare parts).
The calculation does not take into account the indirect losses that may be the result of
production downtime, which obviously can be much higher than the cost of repair.
It is clear that reactive maintenance does not give much support to management and does not
need much conscious planning and control. In fact, notes Jin et al., (2006), whenever RM is
predominantly applied in a company, it usually indicates the absence or disregard of
maintenance management rather than a deliberate choice for a run-to-failure approach of
equipment. However, reactive maintenance can actually turn out to be a cost-efficient treatment
of a particular machine under certain conditions (Motawa & Almarshad, 2013). But to consider
it as the only option for all assets might result in wastage of money.

59
4.3.1.2 Asset inventory
According to Campbell, Jardine, and McGlynn (2016), any pro-active approach of maintenance
starts with a complete inventory of assets. This seems quite logical: in order to maintain a
property or a production line, a firm needs to have some idea of what it actually consists of.
Yet, many companies do not have a proper inventory of their fixed assets, either because it is
outdated or incomplete (Campbell, Jardine, & McGlynn, 2016). Keeping the information accurate
is the main purpose of fixed asset management. Acquisitions, movements, retirements, and
modifications of assets are relevant for the maintenance function to properly define a
maintenance program and plan their work accordingly and efficiently. Asset inventory is,
therefore, not about just having a list; it is about carrying out fixed procedures to keep the list
updated over time (Campbell, Jardine, & McGlynn, 2016). Some software for maintenance
management provides useful tools to assist the upkeep of an asset inventory.
Van et al., (2013) note that it is important to note that a company's asset inventory often was
established to serve financial purposes (balance sheet and depreciation), rather than having any
technical meaning. Although a financial inventory should equally represent the company's
properties as the technical, its level of detail is usually too low for the coordination of
maintenance works (Van et al., 2013). While it is highly advisable to keep one single asset
inventory for the company as a whole, a clever coding method must ensure that both the
technical and the financial department can use the inventory for their respective tasks.
4.3.1.3 Maintenance Needs Analysis
When the fixed assets are listed in a detailed inventory, the technical department must
determine which measures (if any) should be applied to each asset in order to effectively
prevent it from breaking down – or to reduce the chances of breakdown to an acceptable and
stable level (Campbell & Reyes-Picknell, 2015). This is called maintenance needs analysis and
usually requires a sizeable effort. But the department's own workforce and machine operators,
which are often left untapped, can be a valuable source of information. If one wants to gain
control over the occurrence of breakdowns and failures, we must know from each asset its
periodic requirements in terms of, but not limited to, lubricating, adjusting/balancing, cleaning,
replacing parts, tightening, and painting/coating (Campbell & Reyes-Picknell, 2015; Ireland &
Dale 2001).

60
The periodicity of these services is either expressed in calendar time (years/months/
weeks/days), running hours, or output (parts produced, distance covered, etc.). If the technical
department only has experience in repairing breakdowns and is not used to taking a lot of
preventive measures, it may be difficult to obtain decisive information (Campbell & Reyes-
Picknell, 2015). However, the repair history and information about failure causes can often be
used to deduce an asset's maintenance needs. Manuals and user guides are evidently another
important source of information. But service requirements and intervals as given by the
manufacturer must always be verified and, if necessary, adapted to the actual operating
conditions and the behavior of a particular machine, as well as its age, remaining useful life,
and the availability of replacement parts (Campbell & Reyes-Picknell, 2015). If the company
lacks the capacity to determine the maintenance needs for some or all of its assets, it should
seek external expertise for a physical survey and technical analysis.
4.3.1.4 Resource Allocation
Estimating the time and materials needed for planned work is a necessary step before one can
make feasible schedules and implement them accordingly. The needs analysis done previously
can now be used to forecast the resources. The department eventually has to allocate for
preventive maintenance. Based on the identified maintenance needs, note Saygin and Tamma
(2012), it becomes crucial to estimate the man-hours, consumables, and spare parts that are
required for each of the preventive actions intend to be taken. It is important that the estimates
are realistic and precise: if they are inaccurate, the risk of overloading or under-utilizing the
resources can be faced (Saygin & Tamma, 2012). The results of the estimation must be
compared with the actual staff and stocks available. Certainly, they would not immediately
make a perfect match, but the comparison might identify possible problems and indicate what
corrective steps may have to be taken with regard to human resources and supplies. According
to Saygin and Tamma (2012), well-documented resource allocation can give the maintenance
department strong support for its demands in terms of staffing and materials, and hence
budgeting.
The next comes the most difficult part of constructing the first layer of the pyramid. After duly
defining and calculating the scope of the operation, Mostafa et al., (2015) mention, the real
challenge is to free-up or obtain the required resources and dedicate them exclusively to the
implementation of the plans. The way of working in a maintenance department cannot be
changed from one day to another. In order to make a successful change from breakdown

61
maintenance being the greater part of the department's daily workload towards preventive
maintenance as its primary occupation, one has to move carefully but very determined from
one side to the other. Breakdowns do not suddenly cease to occur from the moment a company
starts preventive maintenance. They still have to be attended to while the department steadily
expands its preventive maintenance program.
To get this process started, the department has to allocate some of its resources exclusively to
a feasible selection of the preventive measures as defined in the needs’ analysis (Saygin &
Tamma, 2012). It is very important to be realistic at this stage: the department must be capable
of performing the measures as planned along with its 'normal' work. To make sure that this is
the case, one could, for instance, focus on a particular group of machines, preferably some on
which preventive maintenance is expected to have a high impact, such as machines with a high
failure rate; for which repairs normally require a lot of time (or money); and those important
for production (Saygin & Tamma, 2012). It is advisable to schedule particular staff for
particular days to perform the preventive measures and to make sure that they are not disturbed
by any urgent last-minute calls. Repairing breakdowns and doing planned preventive
maintenance is very difficult to manage single-handedly. The unpredictability of the first is
likely to disturb the feasibility of the other, which is why they should be separated in staffing
as much as possible.
4.3.1.5 Preventive Maintenance (PM)
After preparing the ground for preventive maintenance, the nest step encompasses actually plan
the actions and combine the technical needs analysis with the resource allocation into a
preventive maintenance program. This is a detailed work planning that translates the intervals
as defined by the needs analysis into real dates on which the services are going to be performed
or finished (De Almeida et al., 2015). For intervals that are not based on calendar time, this
requires some forecasting on the basis of historical data. Working out an optimal program can
be a difficult task, since the accumulation of independent intervals may result in large
periodical variations in total workload. Tuning the different maintenance sequences alongside
each other will help to equalize the total workload over time (De Almeida et al., 2015). The
effects are best seen in the program as a whole, which is why preventive maintenance should
be prepared as a single program for all of the company's assets – even if a firm is planning to
divide the actual implementation in a series of smaller steps.

62
Although the preventive measures are often quite simple - such as cleaning, adjusting, and
lubricating, keeping up a PM program is more difficult than it seems. Many companies have
problems following the schedules they once put in place. In fact, surveys have shown that only
20 % of companies in the U.S believe that their preventive maintenance programs are being
implemented effectively and according to plan (De Almeida et al., 2015). This shows that it is
important that the program is based on realistic objectives: it must be feasible to uphold the
plan over a long period of time. Capacity planning is, therefore, the most important element of
drafting a preventive maintenance program. A good program brings together the maintenance
needs of the equipment with the capacity of the department. Any large discrepancy between
the two must be solved before implementing the program (De Almeida et al., 2015).
In a sizeable company, the number of assets maintained easily reaches into the thousands. This
means that a complete preventive maintenance program would consist of at least 50 to 100
work orders per week (Campbell & Reyes-Picknell, 2015). Managing all of them by manual
and paper-based planning tools is an almost impossible task, especially if they are triggered by
different types of periodicity (calendar, running hours, and kilometers). It becomes even more
difficult if some of them are being deferred (for whatever reason) and need to be reworked.
This is where specialized computer programs can be particularly useful. CMMS are
indispensable for keeping up preventive maintenance in companies with a significant asset
base. They assist in workload monitoring by calculating the effects of (re-)scheduling, and most
systems are designed for handling different types of periodicity while keeping the planning
horizon wide enough for timely decision-making and efficient resource utilization (De Almeida
et al., 2015).
However, if the basics of our preventive maintenance program are implemented step by step,
this would consume around 50% of the time. It is critical to focus on the assets that are used to
require much of our capacity in terms of repair so that our preventive actions have a maximum
impact (De Almeida et al., 2015). Why can it be relatively easy to take away 50% of the time
spent on repairs? Consider the fact that breakdowns hardly ever present themselves in an
orderly fashion. Maintenance managers often run from one to the other, but in between them,
there is also a lot of idle time consumed when waiting for the right parts, waiting for a particular
tool, or just waiting for the next breakdown to happen. Planned preventive maintenance does
not involve such waiting, so by reducing the number of breakdowns, it does save not only time
actually spent on repairs but also the time spent on waiting.

63
4.3.2 Layer 2: Creating Organization Power
Although it is important to gradually gain more control over the department's workload by
implementing the preventive maintenance program, it is also essential to have a closer look at
the organizational structure surrounding the maintenance process (Holtz & Campbell 2003;
Ireland & Dale 2001). The second layer of the maintenance management pyramid focuses on
processes and tools that directly support maintenance, such as technical administration and
spare parts management. Implementing or improving them will contribute to the efficiency of
the maintenance effort.
The objective is to make the company’s maintenance activities literally manageable, in the
sense that they can be largely controlled by management decision-making. This requires
information gathering, data accuracy, and schedule compliance (Ireland & Dale, 2001). The
second layer also provides solid support for the introduction of maintenance strategies beyond
preventive maintenance. Predictive Maintenance (PDM), Reliability Center Maintenance
(RCM), and Total Productive Maintenance (TPM) are strategies that cannot be applied without
the tools presented in the following sections.
4.3.2.1 Work Flow Control
This practice involves documenting and tracking the maintenance work that is performed. A
work order system is used to initiate, record, and track all maintenance activities (Schulz &
Gitzel, 2013). The work may start as a request that needs approval. Once approved, the work
is recorded, then planned, scheduled, performed, and finally, some essential information about
the work is stored. Unless the discipline is in place and enforced to follow this process
completely, data is lost, and accurate analysis can never be performed (Schulz & Gitzel, 2013).
It is only until all the maintenance activities are tracked through the work order system that
effective planning and scheduling can start. According to Schulz and Gitzel, 2013, this requires
someone (or several people) to perform the following activities systematically: (i) review the
A solid foundation is built for further improvements of the maintenance effort when preventive measures account for 50% of the total workload in hours and reactive maintenance is reduced to 50% of time spent. To achieve this, a firm needs an accurate inventory of fixed assets, perform a needs analysis, and allocate resources to work out a preventive maintenance program. Steadily implement the program.
Summary Layer 1: Balancing the Workload

64
work submitted; (ii) approve the work; (iii) plan the work activities; (iv) schedule the work
activities; and (v) record the completed work activities. Productivity decreases unless a
disciplined process is followed for these steps. At least 80 % of all maintenance work should
be planned 7 days or more ahead and then be scheduled on a weekly basis (Schulz & Gitzel,
2013). In addition, the schedule compliance should reach at least 90 % at the end of every
week.
4.3.2.2 Computerized Maintenance Management Systems (CMMS)
In most companies, the maintenance function uses sufficient data for its computerization. The
use of computerized maintenance management systems for the collection, processing, and
analysis of technical data has become popular throughout the world (Lopes et al., 2016).
CMMS software manages or facilitates the functions already discussed above and provides
support for some of the practices that will be covered later in this dissertation. Although CMMS
has been applied successfully for almost three decades in some countries, it turns out to be
difficult to make full use of these systems. For a CMMS to be effective, Lopes et al., (2016)
note, it must be properly integrated. Its valuable contribution to maintenance management can
only be secured if it is used completely, and when the data collected has complete accuracy.
4.3.2.3 Spare Part Management
The function of storekeeping and procurement is to provide the right parts at the right time.
The goal is to have enough spare parts, without having too many of them (Gopalakrishnan &
Banerji 2013). It is clear that no storekeeping and procurement process can cost-effectively
take into account a reactive maintenance process. However, if the majority of maintenance
work is planned some weeks or more in advance, the supply of materials for the maintenance
process can be optimized. Many companies experience service levels below 90%. As a result,
more than 10% of requests for spare parts face stock-outs (Gopalakrishnan & Banerji, 2013).
This level of service leaves customers (maintenance personnel) fending for themselves,
stockpiling personal stores, and circumventing the standard procurement channels in order to
obtain their materials.
To prevent such a situation, store controls are needed that will allow the service levels to reach
95-97%, with 100% data accuracy. This requires coordination between the maintenance
planning function and the supply department. Forecasting and analysis of consumption data
are a joint responsibility and need to be performed on a regular basis to rationalize stock levels,

65
while the service level can be optimized. Data collection must be done on two levels: first by
recording stock supplies and direct delivery (how much did we use) and second by recording
spare parts used on the work order (what exactly did we use it for) (Gopalakrishnan & Banerji,
2013). They must be reconciled periodically, and discrepancies should be explored. Integrating
the CMMS with the system(s) used for stock management simplifies and accelerates these
processes.
4.3.2.4 Technical Training
This function of maintenance is frequently overlooked, with quite dramatic consequences albeit
they are hard to document. Training ensures that the technicians working on the equipment
have the technical skills required to understand and maintain the equipment (Barberá et al.,
2012). While there are exceptions, the majority of companies lack the technical skills within
their organizations to maintain their own equipment. When these figures are coupled with the
lack of apprenticeship programs available to technicians, the unpleasant view of a workforce
where the technology of the equipment has exceeded the skills of the technicians that operate
or maintain it becomes a reality. With developing countries rapidly catching up their relative
technical disadvantage, this problem gets amplified. Imports of high-tech equipment as a one-
off investment will not give the expected returns if they are not sided with an equal investment
in technical training. The roadside landscape in Africa is often marked with abandoned capital
goods in a condition that suggests a lack of technical mastery; both in operations of such
equipment as well as the maintenance they require. The benchmark of best practice
maintenance suggests a yearly budget for training of at least 4% of total payroll (Barberá et al.,
2012). This is a minimum requirement for a technical department that has to keep its skills in
pace with the development and technical progress of the average production environment.
Summary Layer 2: Create Organizational Power
After establishing an appropriate organizational environment for maintenance along with an efficient inventory and procurement function for the delivery of spare parts (service level >95%) and a system for workflow control that enables to plan 80% of the maintenance work for at least a week ahead, with schedule compliance of 90% or more. The next task is to design Computerized Maintenance Management Systems to assist with the above mentioned. The proper implementation and consistent use of a CMMS are, therefore, essential for any further improvements of the maintenance function. Another condition is the structured provision of technical training to keep the technicians' skills in line with the technology they need to use or take care of. A training budget of 4% of payroll is considered to be the minimum rule-of-thumb for technical departments worldwide.

66
4.3.3 Layer 3: Condition-Based Approach
On top of the solid foundation of the first two layers [refer Figure 9], even more sophisticated
tools for maintenance management can be introduced. Predictive or condition-based
maintenance is a scientific approach that makes the maintenance effort more effective and more
cost-efficient as well (Ahmad & Kamaruddin, 2012). Another important element in further
improvement of technical maintenance is the involvement of the production department. As
the main user of the company's assets, they have both an interest and a responsibility in the
total maintenance process.
4.3.3.1 Operational Involvement
The operations or production departments must take enough ownership of their equipment,
which can support the maintenance department's efforts. According to Abdallah (2013),
operational involvement, which varies from company to company, includes some of the
following activities: (a) inspecting equipment prior to start-up; (b) filling out work requests for
maintenance; (c) recording breakdown or malfunction data for equipment; (d) performing some
basic equipment service, such as lubrication; (e) performing routine adjustments on equipment;
and (f) executing maintenance activities (supported by central maintenance). The extent to
which operations are involved in maintenance activities may depend on the complexity of the
equipment, the skills of the operators, or even union- and collective-labor agreements
(Abdallah 2013). The goal should always be to free up some maintenance resources to
concentrate on more advanced maintenance techniques.
4.3.3.2 Predictive Maintenance (Condition-Based)
Once maintenance resources have been freed up after the involvement of the operations
department, they should be refocused on the predictive technologies that apply to their assets
(Susto et al., 2015). For example, rotating equipment is a natural fit for vibration analysis;
electrical equipment is a natural fit for thermography, and so on. According to Susto et al.,
(2015), predictive maintenance allows technical departments to take exactly the right measures
at exactly the right time. Shin and Jun (2015) note that simple interventions (such as
adjustments, cleaning, and lubrication) and more complicated ones (mechanical and electrical
balancing) performed at the right time do prevent not only breakdowns but also lessen the
effects of wear. This results in prolonged lifetimes of essential parts create cost savings that

67
easily justify the purchase of the necessary equipment and the time spent on condition
monitoring (Susto et al., 2015).
The focus in this step should be on investigating and purchasing technology that solves or
mitigates chronic equipment problems that actually exist in your company, not to purchase all
the technology available. Predictive maintenance inspections should be planned and scheduled,
utilizing the same techniques that are used to schedule preventive tasks (Shin & Jun, 2015).
All data should be integrated into the CMMS. Because of its cost efficiency and (by this time)
proven effectiveness, predictive maintenance is advocated as the best strategy for production
and manufacturing environments. Susto et al., (2015) suggest that an optimal maintenance
function achieves up to 50% PDM as part of its total maintenance effort.
4.3.3.3 Reliability Centered Maintenance (RCM)
Reliability centered techniques can also be applied to preventive and predictive efforts to
optimize the programs. This is an analytical exercise, taking into account the broader context
in which the assets are being used (Anderson & Neri, 2015). Financial, operational and
environmental considerations are brought in to modify the maintenance strategy.
If a particular asset has a high environmental impact in case of failure, or when it is safety-
related, or extremely critical to the operation, then the appropriate PM/PDM programs are
enhanced in order to guarantee the asset's reliability (Shin & Jun, 2015). If an asset is going to
restrict or impact the production or operational capacity of the company to a certain
(measurable) extend, then another level of PM/PDM activities are applied with a cost ceiling
in mind.
If the asset is going to be allowed to fail and the cost to replace or rebuild the asset is high, then
another level of PM/PDM activities is specified (Shin & Jun, 2015). There is always the
possibility that it is more economical to allow some assets to run to failure, and this option is
also considered in RCM. In any case, Anderson and Neri (2015) argue, RCM tools require
accurate data to be effective. For this reason, the RCM process is used after the organization
has progressed to the point that ensures complete and accurate asset data, as well as sound
information about the cost and effectiveness of the PM and PDM programs.

68
Summary Layer 3: Going Condition-Based
By systematically involving the operations department in the maintenance effort, the capacity is freed up, which allows doing up to 50% predictive maintenance. The PDM program is effectively supported by the solid structure of the first two built layers. An organization is now able to engage in reliability centered maintenance, making informed choices about maintenance strategy on the basis of accurate data and risk analysis. Cost savings go hand-in-hand with reliability, and the maintenance resources are used efficiently.
4.3.4 Layer 4: Making Maintenance a Core Business Approach
A professional and well-equipped maintenance organization is able to play a key role in a
company's strategic planning and decision-making. Al-Turki, (2011) ascertain that when
maintenance and asset care are recognized as a core business process and become relevant
aspects of the company's long-term strategy, it can reach even higher levels of impact and
efficiency.
4.3.4.1 Total Productive Maintenance (TPM)
Total productive maintenance is an operational philosophy insisting that everyone in the
company understands that their job performance impacts the capacity of the equipment in some
way (Singh et al., 2013). For example, operators may understand the true capacity of the
equipment and not run it beyond design specifications, which could create unnecessary
breakdowns. TPM is like Total Quality Management. The only difference is that companies
focus on their assets, not on their products. TPM can use all of the tools and techniques for
implementing, sustaining, and improving the total quality effort (Singh et al., 2013). TPM and
TQM are, therefore, often implemented together, such as in an undertaking towards ISO 9001
certification.
4.3.4.2 Financial Optimization
This statistical technique combines all of the relevant data about an asset, such as downtime
cost, maintenance cost, low-efficiency cost, and quality costs (Bharadwaj, Silberschmdt &
Wintle, 2012). It then balances that data against financially optimized decisions, such as when
to take the equipment offline for maintenance, whether to repair or replace an asset, how many
critical spare parts to carry, and what the maximum-minimum levels on routine spare parts
should be. Financial optimization requires accurate data; making these types of decisions
incorrectly would have a devastating effect on a company's competitive position (Bharadwaj,

69
Silberschmdt & Wintle, 2012). When a company reaches a level of sophistication where this
technique can be used, it is approaching best-in-class status.
Summary Layer 4: Make Maintenance a Core Business Process
By applying the concepts of Total Productive Maintenance, the impact of maintenance on the production process is maximized. The consistent collection of asset performance data and information about the various components of maintenance costs, now clearly pays off. The company is able to optimize cost-efficiency and to make informed strategic decisions about asset replacement, amortization and capital investments.
4.3.5 Layer 5: Continuous Improvement
4.3.5.1 World-Class Maintenance
World Class Maintenance is defined as a set of key performance indicators (KPI's). Achieving
World-Class Maintenance means actively aiming for and reaching the target levels associated
with the performance indicators. According to Singh et al., (2013), some of the target levels
are considered to be fundamental and applicable everywhere; others are context-specific and
vary from company to company as well as between different business sectors.
An overview of the key performance indicators and their target levels are described below in
Table 4 World Class Maintenance KPI's used by IVARA Corporation, a leading reliability
consultancy firm based in Ontario, Canada, for technical maintenance in manufacturing and
production. The target levels were established by research among hundreds of business-leading
companies all over the world, conducted in the year 2005. World Class Maintenance is a
process of continuous improvement rather than a fixed state. This is an ongoing evaluation
program that includes constantly looking for the "little things" that can make your company
more competitive (Singh et al., 2013). When such a program becomes an integral part of a
company's way of working, the maintenance resources are used to the fullest extent and with a
maximum impact.

70
Table 4: Key Performance Indicators of World-Class Maintenance
A
Measure: Cost Indicator type: Result, lagging
Key performance indicator World Class target level
1 Maintenance Cost Context-specific
2 Maintenance Cost / Replacement Asset Value of Plant and Equipment
2 - 3%
3 Maintenance Cost / Manufacturing Cost < 10 - 15%
4 Maintenance Cost / Unit Output Context-specific
5 Maintenance Cost / Total Sales 6 - 8%
B Measure: Failures Indicator type: Result, lagging
Key performance indicator World Class target level
6 Mean Time Between Failure (MTBF) Context-specific
7 Failure Frequency Context-specific
C Measure: Downtime Indicator type: Result, lagging
Key performance indicator World Class target level
8 Unscheduled Maintenance Related Downtime (hours) Context-specific
9 Scheduled Maintenance Related Downtime (hours) Context-specific
10 Maintenance Related Shutdown Overrun (hours) Context-specific
D Measure: Work Identification Indicator type: Process, leading
Key performance indicator World Class target level
11 Percentage age of work requests remaining in 'Request' status for less than 5 days, over the specified time period
80% of all work requests should be processed in 5 days or less. Some work requests will require more time to review, but attention must be paid to 'latest finish date' or 'required by date.'
12 Percentage age of available man-hours used for proactive work (AMP1 + AMP initiated corrective work) over the specified time period
The target for proactive work is 75 to 80%. Recognizing 5 - 10% of available man-hours attributed to redesign or modification (improvement work), this would leave approx. 10 - 15% reactive
13 Percentage of available man-hours used on modifications over the specified time period
Expect a level of 5 to 10% of man-hours spent on modification work
E Measure: Work Planning Indicator type: Process, leading
Key performance indicator World Class target level
14 Percentage age of work orders with man-hour estimates within 10% of actual over the specified time period
Estimating accuracy of greater than 90% would be the expected level of performance

71
15 Percentage age of work orders, over the specified time period, with all planning fields completed as planned
95% or more should be expected. Expect a high level of compliance for these fields to enable the scheduling function to work
16 Percentage age of work orders assigned 'Rework' status (due to a need for additional planning) over the last month
This level should not exceed 2 to 3%
17 Percentage age of work orders in 'New' or 'Planning' status less than 5 days, over the last month
80% of all work orders should be possible to process in 5 days or less. Some work orders will require more time to plan but attention must be paid to 'latest finish date'
F Measure: Work Scheduling Indicator type: Process, leading
Key performance indicator World Class target level
18 Percentage age of work orders, over the specified time period, having a scheduled date earlier or equal to the latest finish or required by date
95% or more should be expected in order to ensure that the majority of work orders are completed before their 'latest finish date'
19 Percentage age of scheduled available man-hours to total available man-hours over the specified period
Target of 80% of man-hours applied to scheduled work
20 %age of work orders assigned 'Delay' status due to unavailability of manpower, equipment, space or services over the specified time period
This number should not exceed 3 to 5%
G Measure: Work Execution Indicator type: Process, leading
Key performance indicator World Class target level
21 Percentage age of work orders completed during the schedule period before the latest finish or required by date
Schedule compliance of 90% or more should be achieved
22 Percentage age of maintenance work orders requiring rework
Rework should be less than 3%
23 Percentage age of work orders with all data fields completed over the specified period
Should achieve 95% or more. Expect work orders to be reviewed and closed promptly
H Measure: Work Follow-up Indicator type: Process, leading
Key performance indicator World Class target level
24 Percentage age of work orders closed within 3 days, over the specified time period
Should achieve 95% or more. Expect work orders to be reviewed and closed promptly
I Measure: Performance analysis Indicator type: Process, leading
Key performance indicator World Class target level
25 Number of asset reliability improvement actions initiated by the performance analysis function, over the specified time period
No number is correct, but level of relative activity is important. No actions being initiated when lots of performance gaps exist is inappropriate
26 Number of equipment reliability improvement actions resolved over the specified time period (did we achieve performance gap closure)
This is a measure of project success

72
4.4 Summary
This chapter provides an in-depth analysis of the theoretical and conceptual frameworks used
in guiding this thesis. It defines the model that was formulated by the researcher for the purpose
of this research for the Ethiopian manufacturing and industries. The model is named “The
Maintenance Management Pyramid Model.” This model introduces some of the fundamental
steps of maintenance management and is based on the most prominent expert views currently
available on the subject. The five layers of this model are discussed comprehensively in various
individual subsections. This model was evaluated in an empirical study in Chapter 5 as part of
the research methodology that has been discussed in the next chapter.

73
Chapter 5: Methodology and Design
5.1 Introduction
As the title suggests, this subsection's fundamental purpose is to elucidate on the research
methods that this research intends to employ in the collection of data and its analysis thereafter.
It presents the research approaches, strategies, as well as the research design adopted. Finally,
the trustworthiness of the research regarding validity and reliability is discussed. The
methodology used in developing an integrated maintenance management strategy and design
of an optimized CMMS model combines the current maintenance practices and operations
together in Ethiopian large and medium scale industries is stipulated. This provided a road map
for the researcher to achieve the research objectives.
5.2 Research Approach
This research was carried out in the large and medium scale manufacturing industries in
Ethiopia that have successfully implemented CMMS or are in the process of developing and
implementing CMMS. It explored the CMMS development and implementation issues and
achievements realized as a result of a strategic move towards CMMS development and
implementation. After considering the objectives of the research and the level of CMMS
development and implementation in Ethiopian manufacturing industries, the researcher felt the
appropriateness of adopting both qualitative and quantitative data gathering techniques, i.e.,
survey method, using a structured questionnaire as data gathering instrument supported by
qualitative data which was obtained through structured interviews.
The mixed-methods approach, that is, the adoption of qualitative and quantitative research
methodologies within the same study, draws upon the potential strengths of both
methodologies to allow a researcher to explore diverse perspectives and uncover relationships
that exist between the intricate layers of multifaceted research questions (Tashakkori &
Creswell, 2007). The multidimensional nature of this study’s research questions and objectives
informed the researcher’s decision to adopt this research design. As noted by Creswell and
Clark (2017), the basic premise behind designing and implementing mixed-method is that this
integration allows a more complete and synergistic utilization of data than do separate
qualitative and quantitative research methodologies. Correspondingly, Kothari (2004) argues
that the adoption of different research approaches enables the researcher to seek a more

74
panoramic view of their research landscape, viewing the research topic from different
perspectives and through diverse lenses.
Qualitative research methods provide flexibility, and questions can be adopted as they go along
and have become increasingly important modes of inquiry for the social sciences and applied
fields such as education, regional planning, nursing, social work, community development, and
management (Marshall & Rossman, 2006). Moreover, the interview are useful methods of
obtaining information and opinions from experts during the early stages of the research project
(Liamputtong & Ezzy, 2005). One of the strengths of interviews is their nature in terms of
personal touch. If respondents relate to the interviewer, they are more likely to be willing to
share a personal opinion, yield data in quantity quickly. Marshall and Rossman (2006)
suggested that we might also interview in search of opinions, perceptions, and attitudes toward
some topics. Visiting the industries and observing the onsite operations of the maintenance
activities enables the researcher to grasp the overall idea, gain some insights, and form a general
idea of the research objectives. It helps in consolidating and getting more definite and stronger
information on the research being done. This understanding of the situation at the grassroots
level after visiting some industries helped the researcher in the final formulation of the
questionnaire that was not too ambiguous for the respondents.
On the other hand, data for the quantitative method was obtained through the administration of
a structured self-administrative questionnaire. An advantage of using a self-administrative
questionnaire is that they are an entirely standardized measuring instrument as the questions
are always phrased exactly in the same way for all respondents (Liamputtong & Ezzy, 2005).
The biggest advantages of self-administrative questionnaires are that they are comparatively
cheap and time-saving for the researcher (Richardson, 2005). A combination of these research
designs was done to provide more data to work with and, ultimately, a more accurate
evaluation. It was, therefore, important to get to the source of primary information so that each
method could complement and substantiate the other and finally making the findings more
concrete. In short, the strengths of qualitative studies should be demonstrated for research that
is exploratory or descriptive in nature and that stress on the importance of context, setting, and
participants’ frames of reference (Marshall & Rossman, 2014). The approach applied in this
research was both exploratory and descriptive survey method, in that the research focused on
specific research objectives in the form of survey method, in order to provide a detailed
description of the research process. The descriptive aspect of the research incorporated

75
perspectives drawn from both the participants in the research and those to be drawn by the
researcher from relevant literature. The method applied in this research was conducted in a
manner that ensured that the research satisfactorily answered the research questions.
5.3 Research Design
Research design essentially refers to the plan or strategy of shaping the research that might
include the entire process of research from conceptualizing a problem to writing research
questions and on to data collection, analysis, interpretation, and report writing. It provides the
framework for the collection and analysis of data and subsequently indicates which research
methods are appropriate. The most common, useful purposes and main aims of the research
are exploration, description, and rational explanation based on data (Maxwell, 2012). For the
purpose of this research, after examining the objectives of the study and realizing the lack of
previous study and published literature on CMMS development and implementation in
Ethiopia manufacturing industries, an exploratory, a descriptive research design was chosen,
as it can conclusively describe the characteristics and state-of-the-art of the population under
study.
Exploratory, descriptive research was thought to best suit the current research since exploratory
study research is performed when a researcher has little knowledge about the situation or has
no information on how similar problems or research issues have been solved in the past
(Maxwell, 2012). It embarks on investigating and finding the real nature of the problem. In
addition, solutions and new ideas could surface from this type of research. Descriptive research,
on the other hand, is a research that describes a phenomenon to document and describe the
phenomenon of interest (Marshall & Rossman, 2014), while providing a clear answer of who,
what, when, where, why, and way (6 Ws) of the research problem and data are typically
collected through a questionnaire survey, interviews or observation(s) (Maxwell, 2012). An
extensive literature review was also conducted in this research. The main reason behind
choosing these methods was to understand the topic of the study in a detailed manner and to
synthesize the findings, and to conclude the ideas regarding the topic. According to Maxwell
(2012), a literature review is a collection of available documents on relevant topics that may
be either published or unpublished.
An exhaustive and systematic search of the literature related to maintenance management and
CMMS was conducted. This literature search was conducted using, among others, the
76
electronic databases on the UNISA website such as Emerald, ScienceDirect, InformaWorld,
and SpringerLink. Also, another search was conducted in an attempt to include related journals,
articles, conference papers, government, and industry reports, books, and thesis. The literature
that was reviewed and presented for this research intended to reveal the elements of best
CMMS and the importance it plays within Ethiopian manufacturing industries. It was also
important for this research to reveal the best generic CMMS models that would guide the
researcher in developing and proposing integrated maintenance management strategies and
optimization of CMMS models for the Ethiopian manufacturing industries. The methodology
that was used in developing this improved integrated maintenance management strategy and
optimization model involved a detail scientific investigation of the current maintenance
management practices and operations in Ethiopian manufacturing industries.
The literature review included data, information, ideas, and evidence, which were taken from
a definite view of the specific topic. The viewpoint should have a certain aim, and it should
give an idea about how the topic should be studied. The rationale behind this research was to
present the integration of the theoretical background and the result of the finding. First, the
background of maintenance management strategies and optimized CMMS models are
followed. At the end of the literature review, the results were summarized and synthesized. The
theories that are explored in this study are basically related to the maintenance management
systems and trends and challenges in production facilities. Before framing the interview and
survey questions, an in-depth study was made in the area of maintenance and production,
development, and implementation of CMMS in connection with the relevant literature. This
study was conducted in this manner to get a better understanding of the concept and also to
make the discussions more interesting and interactive during the interviews, survey research,
and Observation.
5.3.1 Semi-Structured Interviews
The initial primary data was obtained through semi-structured interviews with participants or
respondents, and the main reason to interview is to gain full and detailed information about the
experience under study (Polkinghorne, 2005). Interviews are the most broadly used source as
a method of collecting data for evidence (Blumberg, Cooper, and Schindler, 2008). Desai and
Potter (2006) define interview as a technique of gathering data from humans by asking
questions and getting them to react verbally. Congruently, Kumar (2005) defines interviews as
any person-to-person interaction between two or more individuals with a specific purpose in

77
mind. The interview in this study was confined to the maintenance management team that can
take any related maintenance decisions. The interview was also used to identify the answers
from both the management team and technical perspectives of CMMS development and
implementation team in the manufacturing industries. The interview was employed to obtain
different perspectives from experienced people in this industry. Qualitative interviews are
characterized by a low degree of standardization, and the answers are never the same. The
researcher was able to ask for clarification and lead the interview process in the right direction,
giving the possibility for the interviewee to understand every specific situation, which was
crucial when analyzing and concluding the collected data (Yin, 2003).
5.3.2 Questionnaire
The questionnaire was the main research instrument in this study to elicit as much related
information as possible from the respondents. It would contain enough questions to be able to
meet survey objectives but not so many as to be off-putting to respondents. The questions must
be long enough to elicit the information that was required but short enough to encourage an
optimum response rate (Brace, 2018). The questionnaire used in this research was developed
based on a five-point Likert Scale that ranges from (1) Strongly Disagree to (5) Strongly Agree.
A rating by a Likert Scale is more useful when a behavior, attitude, or another phenomenon of
interest needs to be evaluated on a continuum of, say, “inadequate” to “excellent,” “never” to
“always,” or “strongly disagree” to “strongly agree” (Nemoto & Beglar, 2014). The advantages
of the Likert Scale are flexibility, economy, ease of composition, and the fact that it is possible
to obtain summaries of data from a cluster of items. Nemoto and Beglar (2014) suggest that a
good questionnaire: is complete, i.e., gets all the data needed; is short, i.e., does not abuse the
respondents time or concentration; asks only relevant questions; gives clear instructions; has
precise, unambiguous and understandable questions; has objective questions, i.e., does not
suggest answers; starts with general questions; and use mostly closed questions. The research
design process is presented in Figure 10.

78
Figure 10: Research Design Process (Constructed by the Researcher)
Prior to the development of the survey questionnaire, the researcher had explored the
manufacturing industries through a preliminary study. During the preliminary study, the
researcher had talked, discussed, questioned, and sought the maintenance managers’ opinions
with regards to CMMS design, selection, development, and implementation initiatives as one
of the outcomes of IT implementation and process automation. The preliminary study had been
purely explorative, to see the state of the art of CMMS in the Ethiopian Manufacturing
industries so that the questionnaire was formulated by the level of CMMS design, selection,
development, and implementation.
5.3.3 Sampling
5.3.3.1 Sampling of Interviewees
In qualitative research, there are various sampling techniques that a researcher can adopt to
select a sample that is representative of a wider population based on the research objective. As
noted by Taherdoost (2016), sampling techniques in research can broadly be divided into two:
probability and non-probability sampling methods. In probability sampling, also known as
random sampling, the researcher starts with a complete sampling frame of all eligible
participants from which a sample will be selected (Taherdoost, 2016). In this way, all eligible
participants have a chance of being chosen for the sample, and results are more generalizable.
There are five sub-categories of probability sampling, including simple random, systematic
sampling, cluster sampling, and stratified sampling. In simple random, all participants have an
equal chance of selection. In cluster sampling, the entire population is divided into clusters or
groups. From these clusters, random sampling is conducted, all of which are used in the final
sample (Wilson, 2010). Similarly, in stratified sampling, the population is divided into strata
Literature Interviews Surveys
Analysis
Conclusion

79
(subgroups), and then a randomized sampling is conducted from each stratum. Unlike cluster
sampling, however, a subgroup (unlike a cluster) is a natural set of items that may include
occupation, gender, or company size (Taherdoost, 2016). Lastly, systematic sampling involves
selecting individuals at regular intervals from the sampling frame. The intervals are chosen to
ensure that adequate sample size is obtained.
According to Taherdoost (2016), non-probability sampling, a researcher does not start with a
complete sampling frame, which means some participants have no chance of participation. As
such, the researcher cannot estimate the effect of sampling error, and there is a significant risk
of ending up with a sample that is not representative of the population. The subcategories of
non-probability sampling include quota sampling, convenience sampling, judgment sampling,
and snowballing sampling. Taherdoost (2016) notes that quota sampling is a technique where
participants are chosen on the basis of predetermined features so that the final sample will have
the same distribution of features as the wider population. Judgmental sampling is a sampling
method where the researcher selects some participants deliberately to provide important
information or vital data for the research that cannot otherwise be obtained from other
participants (Taherdoost, 2016). Convenience sampling is a technique used to select
participants because they are often easily or readily available. Lastly, Taherdoost (2016) notes
that snowballing sampling is the selection of a few cases to help encourage others to take part
in the research, thus increasing sample size.
For the interviews, purposive sampling was used to target the maintenance management team
that could take any related maintenance decisions. This meant they had direct working relations
with maintenance activities in their own respective companies. These are known higher
officials who are limited to General Managers, Maintenance Managers, Production Managers,
and Quality and Assurance Managers. After sampling, the second step involved approaching
interview participants at their working place after arranging the meeting with their telephone
contact numbers. The third step was delivering the consent letter obtained from the higher
authority of their respective companies to the participants. The fourth step was getting firstly
the interview participants familiarized with the purpose of the research. In this relation, the
researcher provided the participants with the informed consent letters and consent forms. Then
he obtained the consent of all interview participants to take part in the study. The fifth step
was getting the consent form signed by interview participants and provides their contact
number and getting agreed on the date, time, and place for interview meetings.

80
The sixth step was given the structured interview questions to Interview participants before
starting the interview meeting. The seventh step was summarizing views of their views that
were recorded in the form of a report and taking proper notes.
5.3.3.2 Sampling Questionnaire Participants
For the purpose of this research, the population sample (sampling frame) was drawn from the
Directory of the Federal Democratic Republic of Ethiopia Ministry of Trade (2014) and a report
published by the ECSA (2014). In 2014, there were a total of 2,203 large and medium scale
manufacturing industries across all sectors, both public and private companies, excluding small
scale manufacturing industries in Ethiopia (ECSA, 2014). The cluster sampling method was
used by the ECSA to cluster the total population of large and medium scale manufacturing
industries, geographically, based on their externally homogenous and internally heterogeneous
characteristics. Politically there are 11 regional governmental states (i.e., Afar, Amhara,
Oromia, Benishangul Gumz, Tigray, Somalie, South Nations, and Nationality People (SNNP)
and Gambella) and three city administrations (i.e., Addis Ababa, Diredawa, and Harari) in
Ethiopia. At the first stage of cluster sampling, 2203 large and medium manufacturing
industries were clustered geographically based on their location, see Table 5.
Table 5: Ethiopian Large & Medium Scale Manufacturing Industries by Geographic Region (CSA, 2014)
Cluster by geographic area
Number of Large and Medium Industries
Distribution Proportion (%)
Addis Ababa 887 40.26
Afar 12 0.54
Amhara 271 12.30
Benishangul 7 0.32
Diredewa 43 1.95
Gambella 8 0.36
Harari 43 1.95
Oromia 364 16.52
SNNP 309 14.03
Somalie 12 4.86
Tigray 247 11.21
Total 2,203 100.00

81
For the purpose of this study, the total target population was 2,203, as listed above in Table 5,
which includes all large and medium scale manufacturing industries in Ethiopia. However, due
to the nature and complexity of the population and where it is the only feasible alternative, the
researcher adopted the combination of probability and non-probability sampling methods. At
the first stage, a multistage stratified random sampling method was used by the researcher to
draw simple random samples from successively more homogenous groups “strata” until the
individual subject level is reached. The researcher stratified all large and medium scale
manufacturing industries by “industry group,” which were clustered by geographic region (i.e.,
Food Products & Beverage, Tobacco Products, Textiles, Wearing Apparel, Leather, Wood
Products, Paper Products, and Printing, Chemicals and Chemical Products, Rubber and Plastic
Products, Non-Metallic Mineral Products, Basic Iron and Steel, Fabricated Metal Products,
Machinery and Equipment, Motor Vehicles, Trailers and Semi-Trailers, and Furniture) to
minimize the sampling error( see Figure 11).
Figure 11: Proportion of Ethiopian Large and Medium Scale Manufacturing Industries across all the Region
The industry group further stratified to “sample companies” within industries constraining the
sample to stratified proportions, then random individual workers (target samples) within the
companies. The purpose of multistage stratified random sampling was to increase the output
of this research precision by ensuring that the key population of subjects is represented in the
sample. In a multi-stage stratified random sampling method, the population distribution sample
at the first stage and second stage are described in Figure 11 to address the total population are
being the equal probability of being selected.
40.2
6
0.54
12.3
0
0.32
1.95
0.36
1.95
16.5
2
14.0
3
4.86
11.2
1
- 5.00
10.00 15.00 20.00 25.00 30.00 35.00 40.00 45.00

82
Figure 12: Ethiopian Large and Medium Scale Manufacturing Industries by Strata/Industry Group
From the total target population of 2,203 medium and large manufacturing industries
throughout the country, the researcher chose purposive/ judgment non probability sampling
method to select the sample based on who he thought would be appropriate for the study based
on predetermined selection criteria. This is used primarily when there is a limited number of
people that have expertise in the area being researched.
According to the preliminary survey conducted by the researcher (secondary data and
telephone calls to HR and Maintenance Departments), of the total number of populations, 77
companies comply with the researcher’s criteria if we omit criteria # 16, “availability of CMMS
as a separate module.” But if criterion # 16 is considered, 28 companies only comply with the
researcher predetermined criteria. Although all 28 companies comply with predetermined
criteria, the target population (N= 8604) is too big, and it is almost impossible (time & cost-
wise) to conduct the survey for the sample size of 2733.
562
1
47 41
89
48
127
75 87
608
18
120
5 12
363
0
100
200
300
400
500
600
700

83
Table 6: Sample Size Based on Purposive Non-Random Sampling Method
#
Industrial Group
Total Population and Sample Size
Total Target
staff
Managers (100%)
Planners (100%)
Team Leaders (50%)
Technicians (30%)
Operators (30%)
Total Sample
Size 1 Food Products & Beverage 924 12 6 40 118 748 297.8
i Dashen Brewery S.C 376 4 2 24 76 270
ii Addis Mojo Edible Oil S.C 291 4 2 8 18 259
iii Fafa Food S.C 257 4 2 8 24 219
2 Tobacco Products 199 4 2 6 32 155 65.1
i National Tobacco S.C 199 4 2 6 32 155
3 Textiles 3367 8 4 22 169 3164 1022.9
i Almeda Textile Factory 3284 4 2 16 148 3114
ii Hawassa Textile Factory 83 4 2 6 21 50
4 Wearing Apparel 720 4 2 6 102 606 221.4
i ELICO Ethiopia Leather S.C 720 4 2 6 102 606
5 Leather 385 8 4 8 60 305 125.5
i Sheba Leather Factory 193 4 2 4 28 155
ii Shew Tannary 192 4 2 4 32 150
6 Wood Products 117 4 2 4 17 90 40.1
i Ethiopia plywood enterprise 117 4 2 4 17 90
7 Paper Products and Printing 888 8 4 12 165 699 277.2
i MAMCO S.C 97 4 2 4 16 71
ii Birhanena Selam Printing Factory 791 4 2 8 149 628
8 Chemicals and Chemical Products
328 8 4 14 65 237 109.6
i Kadisco Chemical Industry PLC 97 4 2 6 23 62
ii Adami Tulu Chemical Factory 231 4 2 8 42 175
9 Rubber and Plastic Products 515 8 4 8 82 413 164.5
i Ethio Plastic Factory S.C 355 4 2 4 56 289
ii Excell Palstic Factory PLC 160 4 2 4 26 124
10 Non-Metallic Minearl Products 752 8 4 14 48 678 236.8
i National Cement S.C 344 4 2 8 48 282
ii Saba Dimensional Stone PLC 408 4 2 6
396
11 Basic Iron and Steel 1393 12 6 32 286 1057 436.9
i Akaki Spare Part & Hand Tools S.C
690 4 2 12 156 516
ii Kality Metal Products 388 4 2 12 79 291
iii Waliya Steel Industry 315 4 2 8 51 250
12 Fabricated Metal Products 327 8 4 14 59 242 109.3
i DH Geda Metal Factory PLC 65 4 2 6 12 41
ii Ziqualla Steel Rolling Mill 262 4 2 8 47 201
13 Machinery and Equipment 962 8 4 32 209 709 303.4
i Nazereth Tractor Factory 148 4 2 8 25 109
ii Addis Engineering Enterprise 814 4 2 24 184 600
14 Motor Vehicles, Trailers and Semi-Trailers
1020 8 4 18 225 765 318
i Maru Engineering PLC 148 4 2 6 22 114
ii Mesfin Industrial Engineering 872 4 2 12 203 651
15 Furniture 74 4 2 4 12 52 27.2
i Finfine Furniture Factory (3F) 74 4 2 4 12 52
TOTAL 8604 104 52 212 1480 6756 2732.8

84
Since all companies within the same strata were homogenous and had very similar
characteristics, the researcher used a quota sampling method to choose one company from each
stratum to further eliminate and reduce the total population based on their geographic location.
As a result, 15 companies (Table 7) were listed with complete information, and that conform
to the following predetermined selection criteria developed by the researcher.
Table 7: Industries Studied
Industrial Group
Total # industries # of industries based on predetermined criteria
Frequency %age Frequency %age
Food Products & Beverage 562 25.51 1 6.67
Tobacco Products 1 0.05 1 6.67
Textiles 47 2.13 1 6.67
Wearing Apparel 41 1.86 1 6.67
Leather 89 4.04 1 6.67
Wood Products 48 2.18 1 6.67
Paper Products and Printing 127 5.76 1 6.67
Chemicals and Chemical Products 75 3.40 1 6.67
Rubber and Plastic Products 87 3.95 1 6.67
Non-Metallic Mineral Products 608 27.60 1 6.67
Basic Iron and Steel 18 0.82 1 6.67
Fabricated Metal Products 120 5.45 1 6.67
Machinery and Equipment 5 1.38 1 6.67
Motor Vehicles & Trailers/Semi-Trailers 12 0.54 1 6.67
Furniture 363 16.48 1 6.67
TOTAL 2203 100.00 15 100.00
At the second stage of the multiple-stage stratified random sampling method for this cross-
sectional survey among Ethiopian Large and Medium Manufacturing Industries, a
disproportionate stratified sampling method was used further to determine the sample size from
the 15-industrial group. Based on this analysis, 15 companies were selected as a result of the
purposive/ judgment sampling method using preliminary survey information and
predetermined selection criteria developed by the researcher. In stratified random sampling,
some researchers have prior information regarding certain characteristics of the population

85
composition, and they want the selection of sample items to reflect this (Kotrlik & Higgins,
2001). The members of a particular stratum would thus be more alike or homogeneous than
the population at large. In other words, the variation within any particular stratum would be
smaller than the variation among the respective data. It may be unwise to ignore the differences
among such clearly discernible populations, so it is important to include them when a random
sample is drawn. The empirical investigation of this research used a non-proportionate
stratified random sampling method to provide a representative sample from each stratum for
field survey.
Each organization has a large population within the different departments but only the general
manager, Quality manager, maintenance managers, maintenance planners, maintenance team
leaders, maintenance technicians, production managers, production planners, production
team/group leaders, and plant/machine operators are directly involved and have an influence
on the company’s maintenance management system. Table 8, depicts the targeted sample and
the positions and departments that they are in. Therefore, the total number of respondents for
the research that represents all 15 industries are shown in Appendix A. A total of 354
respondents, which nearly constitutes more than 38.12 % of the total staff (N =927) working
on all 15 industrial sectors within the chosen organizations, were selected for the field survey
to ensure the reliability of the sample and minimize sample adequacy problems. This number
was thought to be statistically representative of the manufacturing industry in Ethiopia.
Table 8: Targeted Sample Based on Predetermined Criteria
Position Department General Manager Management Quality Manager Quality & Inspection Maintenance Manager Maintenance Maintenance Planner Maintenance Maintenance team leaders Maintenance Maintenance Technicians Maintenance Production Manager Production Production Planner Production Production Team Leaders Production
Plant/machine operators Production
The respondents for the interviews are also derived from the same sampling list, adding an
advantage to the researcher, as they are already known when they would be contacted for
appointments. To support the quantitative data, a total of 15 interviewees, which was only

86
limited to maintenance managers, was considered to explore and identify the scenario that
Ethiopian manufacturing industries have been undergoing through the selection, design,
development, and implementation of CMMS. The questions to be raised in the semi-structured
interviews are quite similar to the survey questionnaire for re-affirmation and consolidation
and triangulation of the findings. Visiting the manufacturing industries and observing the on-
site development enabled the researcher and his interpreters to see the actual progress that was
really taking place at those selected manufacturing industries. It helped the researcher and his
interpreters to grasp the overall idea, to gain some insights, and to form a general idea as to the
degree of CMMS development and implementation that are taking place. It also helped to
consolidate and to get more definite and stronger information of the research being done. To
recruit participants, a letter of support which were guaranteed from each company for this
research was presented to each department and section so they can facilitate access to potential
research participants. Several steps were followed to approach participants and collect the
relevant data. The first step was contacting the participants in their department or section as
per their names (employees) already obtained.
The second step was, delivering the consent letter obtained from the higher authority to the
sample participants. The third step was getting the respondents familiarized with the purpose
of the research while providing the participants with the informed consent letters and consent
formats at the same time. Then, the trained data collectors obtained the consent of all groups
of participants to take part in the study. The fourth step was getting the consent form signed by
the participants. The fifth step was arranging a daily meeting during the data collection period
to administer and summarize the day’s work. The meetings made in each day had great
determination in which ways to perform better in the following days.
5.4 Data Collection
To draw valid conclusions from the research study, it is essential that the researcher has sound
data to analyze and interpret (Silverman, 2016). The most common instruments that are used
for this purpose are interviews and questionnaires. The method for collecting data on this
research was semi-structured interviews and questionnaires. Interviews and questionnaires
were used to gather plant-specific results and to tap into the specific knowledge of these
employees.

87
Questionnaires ensure that the opinions of the people that are directly impacted by this research
outcome are gathered. Structured interviews allow for direct contact with employees. The same
questions were asked to all interviewees to ensure that data collection was consistent across
the board. The semi-structured interview through a pre-determined questionnaire consisting of
13 questions used to gather primary information with the heads of the maintenance department
(See Appendices A).
5.4.1 Questionnaire Design
Bearing the research objectives in mind, extensive literature review, including meetings and
discussions with technical experts in the manufacturing industries community, were conducted
before the conceptualization of the possible questionnaire items. This was important because
of the different levels of CMMS developments between the developed nations and developing
countries with an emerging economy like Ethiopia. From the preliminary fieldwork, meetings,
and discussions with as many maintenance staff as possible at any opportunity at the early stage
of the research, before the formulation of the questionnaires, the researcher decided to frame
the questionnaire into seven components. Caution was taken to avoid too many missing values
from the questionnaire; this would affect the quality of the data process and findings.
The inclusion of too many terms that may confuse the respondents and that would not pursue
in answering the questionnaire. The researcher was also made to understand from the numerous
feedbacks that generally Ethiopian manufacturing industries would normally first acquire
integrated maintenance management strategies and develop CMMS. Based on the above, a
structured questionnaire was developed, covering as many terms as possible to achieve the
objectives of the study. Therefore, items listed in the questionnaire were based on the level of
CMMS selection, design, development and successful implementation in Ethiopia. The
questionnaire consists of the following seven components: 1. Organization & management 2.
Work identification & responsibilities 3. Work planning & scheduling 4. Workflow control
and performance measures 5. Information technology & appraisal 6. Spare part and materials
management 7. Facility, safety, and working environmental aspects
It was good to pre-test the questionnaire on a small number of people before using it on its
earnest (Collins 2003). Therefore, for the pre-test, the questionnaires were sent to two groups
of people, three questionnaires were sent to maintenance engineers for three selected
organization (Ethiopian Air Lines, National Cement Factory, and Meta Abo Brewery) and three

88
selected professionals working at the Institute of Technology, Addis Ababa University and
Jimma University to establish if they have any difficulties in answering the questions.
Problematic questions were then eliminated so that there would be no difficulties in the
recording of the data. The feedbacks were received, and amendments were made to the
questionnaire. Moreover, expert comments were obtained to improve the quality of the survey
instrument. The questionnaire had been modified accordingly upon receiving feedbacks and
comments from these people.
Their relevant comments had been taken into considerations. Some new elements were added
while those not related were changed and deleted. Suggestions on technical aspects like size
and type of server, computer configurations, and operating systems had been excluded because
it had been stated during the preliminary study.
5.4.2 Data Validity and Reliability
The term validity means that the measurements are correct, i.e., the instrument measures what
is intended to measure and that it measures this correctly. The validity of a measurement
instrument is the extent to which the instrument measures what it is supposed to measure. It
takes different forms, each of which is important in different situations (Silverman, 2016). A
new set of questionnaires had resulted after the pre-test sessions. To ensure that the measures
developed in the instrument were relevant and appropriate, the instruments were tested for
validity and reliability. Validity refers to the extent to which an empirical measure adequately
reflects the real meaning of the concept under consideration (Babbie, 2007). This was
supported by Silverman (2016) who indicates that the most critical was whether or not the
results from a quantitative research study accurately reflect the phenomenon under
investigation. It was characteristic of a measure or protocol that assesses what it actually claims
to measure.
The validity, which could be face validity (determining whether the measure seems to make
logical sense as an indicator of a concept) or content validity (a test for whether the measure
covers the full range, or all of the dimensions, of a concept’s meaning), has been a mechanism
to re-confirm whether whatever that was supposed to measure had actually been addressed. In
this research, an in-depth study of the extent of CMMS development and implementation was
done through the literature review, coupled with the preliminary fieldwork that had gauged the

89
level of CMMS development and implementation in Ethiopia, had helped in the fine-tuning of
the questionnaire development.
The extensive discussions held with the various quarters of professionals, both maintenance
managers, and engineers, and academicians, helped to ensure adequate content validity to the
level of CMMS selection, design, development, and successful implementation. The
questionnaires were sent to selected experts in this discipline to check on the validity of the
instrument. They evaluated the validity of the instrument for the face (logical) and content
validity.
They also evaluate the appropriateness of the issues addressed also based on the level of CMMS
development and implementation in Ethiopia and related major barriers and key success
factors. The experts selected include the Managing Director of Techpro Consultancy PLC and
The Project Coordinator of National Cement Factory; two experts were selected from the
industry in Ethiopia. The industry experts were chosen due to the vast experience and
knowledge in this particular field and who have actually seen, witnessed, and participated in
the development and implementation of CMMS in Ethiopia.
The researcher strongly felt that feedback provides by the industry professionals would be able
to give an insight, comments, ideas, and suggestions, and they were able to judge the relevance
of the topic being researched. The inputs received from these experts were extremely important
in the process of finalizing the questionnaire and conducting a pilot study.
In the process of report writing, and to increase the credibility of qualitative data, the process
of participants’ verification was done vigorously. Follow up phone calls and e-mail
communications were made to the interviewees, both to clarify and verify their statements and
to validate whatever that they have said. Respondents’ validation was important to improve
accuracy, validity, and transferability of the information from the interview transcript. More
often, the process of validation was concerned with ensuring that their comments or thought
have been correctly described and interpreted. Descriptive and interpretative validities took
most of the time, as there had been many recursive points that might be similar in nature but to
be said by various respondents.

90
5.4.3 Pilot Study and Reliability Test
A pilot study was conducted in July 2014 by distributing the questionnaire to 10 manufacturing
industries of all types within Addis Ababa, Ethiopia. All completed questionnaires were
returned. As the objective of the pilot study was to ensure that respondents understood the
instructions, the questions being asked, the terminologies used, avoidance of leading questions,
clarity was observed and that the instruments used were reliable to the subject being studied,
the returned questionnaires were looked at thoroughly for more corrective inputs.
All input in the form of comments, suggestions, ideas, proposals, corrections, and views were
taken into consideration to improve, improvise, and upgrade the level of reliability of the
instrument. To ensure that the measures and variables developed as the instruments in the
questionnaire were appropriate, the instrument was tested for its reliability. Prior to the actual
data-gathering exercise, a reliability test was done on the data collected from the pilot study.
The outcome of this exercise was a new set of questionnaires used for the actual survey, to be
conducted in January 2015.
5.5 Data Analysis
5.5.1 Qualitative Data Analysis
Data analysis is the central step in qualitative research; whatever the data, it is their analysis
that forms the outcomes of the research (Dey, 2003). Qualitative data collection was entirely
carried out by the researcher, who has the required level of knowledge in the subject of the
research. Semi-structured interviews were used as sources of data collection as they presented
a chance to collect full and detailed information about this study’s research problem. The
interviews also presented a chance to get a personal viewpoint about the use of CMMS in the
Ethiopian set-up. In most cases, qualitative data collection is limited to documentation and
recording the phenomena under question; then, qualitative data analysis is focused on
analyzing those recordings (Dey, 2003).
To analyze data from interview transcripts, the researcher used thematic analysis as the key
methodology for analysis. Qualitative data analysis Nvivo12 helped in the organization,
analysis, and generation of insight in this study’s unstructured qualitative data. The researcher
personally classified and interpreted linguistic materials that were recorded on a recorder and

91
stored in a password-protected flash drive. After makings sense of the collected material,
implicit and explicit statements were drawn.
All opinions, work experiences, feelings, and input from all interview participants were
analyzed, and themes, as well as patterns, identified. The goal was to analytically reduce the
data by producing memos, coding, abstracts, and summaries. This also involved drawing
conclusions and testing their validity.
All arguments were grouped into relevant codes, and added or skipped categories if needed. In
case there was a confusion on grouping of arguments in to codes, cross-referencing was made
with interviewees through telephone call and agreement was reached about the grouping of the
arguments into codes. The categorized rationales were grouped in to codes and overarching
themes using Nvivo software. Consensus meeting (conference) was held with all interviewee
to validate the software generated themes in which all most interviewees were participated.
During this meeting additional questions on the overarching themes were raised, namely
questions about the number of identified themes, items used in the in-depth interview, practical
suggestions from the interviewees and observed hiatus on site. These questions were discussed
and agreed to proceed between the researcher and the interviewee. The overarching themes
containing the categorized coded rationales were given back to the interview participants, in
the form of a textual description accompanied by bar graphs and plots depicting the word
length, number, frequency and statically analysis of the reported rationales. These, slightly
adapted, bar graphs can be found in the result section (Chapter six) of this report.
5.5.2 Quantitative Data Analysis
The quantitative data analysis employed a variety of statistical analyzes to make sense of data.
Data analysis for the survey questionnaire was done using the common statistical software
SPSS (Data Coding, Entry, Cleaning & Analysis was done using SPSS-V23 Software &
custom program was written in R language). The Sample R code for conducting multiple
pairwise comparisons using t-tests and Wilcoxon signed ranks tests. All questions were
individually analyzed, taking into considerations all the available factors and support through
descriptive and inferential analysis using a custom-written program by the researcher using R-
Language (See Appendix Q). The number of pairwise comparisons was very large (28 paired
tests between 7 components, 15 paired tests between 5 components, and 24 paired tests between
8 components and 57 subcomponents), and it was virtually impossible to conduct all the tests

92
manually in SPSS. Conducting multiple paired t-tests and Wilcoxon sign-rank tests is often
needed, but there is no readily available tool for doing it. This is why a custom program was
written in R language, as widely used for statistical computing, to conduct such pairwise
comparisons automatically. The code is provided in the Appendix and can be used by other
researchers.
5.6 Ethical Considerations
The interviewees and survey participants gave a clear written description of the purpose, scope,
and intended outcomes of the research. The research was carried out in a way that ensured
confidentiality and anonymity of the participant organizations and the individual participants
in the surveys. The target respondents in the organizations which participate in the research
and the interviewees were not named in the research, and they remained anonymous in the
research.
Participants were informed that the research interview questions and survey questionnaires
were designed only for the purpose of this research. As such, the confidentiality of personal
information such as names was to be maintained at the highest level. All the recorded
interviews were stored safely in a password-protected flash drive and were to be discarded
safely after transcription of data and presentation of final thesis.
5.7 Summary
This methodology chapter outlines the research methods employed in this project. It provides
a thorough account of the design, approach, philosophy, and strategies used to guide the
research. It also describes the methods used to collect data [survey and interviews] and analyze
it thereafter. It also describes the research logic [descriptive] employed, which was conducted
via an exploratory qualitative approach to address the objectives and research questions stated
in Chapter 1. The role of the researcher in the collection, analysis, and presentation of data was
also highlighted. Other research procedures including research description of the target
population, determination of sample size, questionnaire development, interviews, pre-testing
the questionnaire, pilot study, validity and reliability test, ethical consideration are also
described in this chapter. Details of the analysis from both qualitative and quantitative methods,
findings, and inferences are presented in the ensuing section, Chapter six.

93
Chapter 6: Findings and Discussion
6.1 Introduction
The ultimate objective of any research is to find out solutions for the pre-stated research
problems. The outcome can be measured by the systematic analysis of the collected data. Data,
in this research, was collected both quantitatively and qualitatively through an amalgam of
various methodologies including literature review, survey questionnaire, and semi-structured
interviews. Such data, in raw information, can be analyzed by applying appropriate qualitative
and statistical techniques. This process is very fundamental to any research because the
researcher can analyze data meaningfully and interpret the analyzed data to infer conclusions.
The findings presented here are important because they are generalizable to a larger population
due to the multiplicity of data used and the scope of research. In this way, the findings of this
study are connected to theory and prior researches in the area of CMMS and manufacturing. In
other words, this research, after the interpretation of collected data and its presentation, can
correlate with other studies. This present chapter discusses this research’s findings, its
interpretation, and the discussion thereof.
6.2 Findings from Qualitative Analysis
As noted in the methodology chapter, thematic analysis was used as the main method for data
analysis and NVivo Version 12 software to aid in the organization, analysis and drawing of
inferences. However, when the software cut across questions, the researcher reorganized the
findings to follow the order of the interview questions. The use of NVivo software in the
analysis of qualitative data has been used previously by scholars in various fields. For instance,
Welsh (2002) assess the way in which NVivo can be used to analyze qualitative data. The study
compared the use of manual techniques and NVivo in the analysis of interview transcripts. The
findings of that study suggests that computer-assisted qualitative data analysis software like
NVivo are not only efficient in analysis but also save time. This means that the use of NVivo
increases both reliability and validity of findings. However, they also note that the combination
of both manual and computer-assisted methods may offer the best results. Congruently, in
analyzing extensive qualitative data, Azeem, Salfi, and Dogar (2012) found that NVivo can
effectively assist the management and synthesis of ideas. The software offer a variety of
analyzing tools that can help a researcher develop new understandings and theories about the
data and testing of answers to research questions.

94
In this study, UML 2.5 was applied for CMMS modeling. The collected information was
sieved, sorted, grouped, and assembled in accordance with the question numbers that acted as
the coding system in order to solicit the emerging themes/points and to establish certain
patterns in all the answers. The summarization of the collected information was done mainly
based on typology and quasi statistics i.e. classified, grouped, themed or patterned and the
number of times or frequencies a subject/topic were mentioned in the interview process. The
key themes were identified after the data analysis as shown in Table 9.
Table 9: Key Elements and Themes from Interview Questions
Questions Identified Codes Themes
1. Are there documented Policies, Programs and Procedures regarding Maintenance Management System in your company?
Availability of documented policies - Polices - Programs - Procedures
Availability of documented programs
Availability of documented procedures
Availability of active updating programs
Availability of documented shop functions and SOP
Availability Work Process effectiveness review and evaluation
2. Do you have a clear mission and quality statement which addresses and supports maintenance management?
Availability of mission statement - Mission - Quality statement
Availability of clear objectives
Availability of strategies
Availability of organizational chart and structure
Availability of function statement
Availability of Job description
3. In your opinion what are the problems, if any, with the maintenance staff with regard to the maintenance structures, competency and training?
Availability of management and leadership training - Management
training - Planner training - Craft training
Availability of supervisors, dispatchers, foremen and planner training
Availability of technicians, Operators and drivers training
Availability of refreshment training
4. What percentage of the annual budget goes to maintenance management?
Do you plan annual fleet and maintenance budget - Budget planning - Reporting and
feedback - Effective control
Do you have cost reporting & budget documentation
Do you formally identifying and presenting long-range requirements for renewals and replacement to management
Do you Plan annual fleet and maintenance budget
5. In your opinion does the company perform the following types of maintenance and if yes, what problems, if any, do you think the
Do you use Corrective Maintenance C - Effective strategies - Strategy assessment

95
Questions Identified Codes Themes company experiences with performing these types of maintenance?
Do you use Predictive Maintenance Strategy
Do Use Planned Maintenance Strategy
Do you use Reliability Centered Maintenance Strategy
6. Do you have computerized maintenance management system (CMMS) within the company? If any, what are the constraints using the system?
Adequacy of computerized equipment management system
- Maintenance Information Systems
- Software/ hardware
Report design and utilization
Facility and equipment reports
Availability of easy to use maintenance management system
Availability of in house developed systems for equipment management (expert systems)
7. Do you have an effective way to generate and track work orders?
Availability of standard work request format. - Priority system - Work order system
and procedures - Emergency &
shutdown scheduling
- Planning procedures
Availability of standard work order.
Availability standard inter- shop order
Availability of carryover authorization
Immediate response and decision on maintenance capability within shop, outsource or onsite maintenance
8. How do you verify the work was done efficiently and correctly?
Using performance measurement methods - Performance
measures - Continuous
improvement - Maintenance
process re-engineering
Report summaries preparation
Using engineered performance standards to estimate man hours on work orders
Conducting improvement studies
9. Are you able to access historical information on the last time, which was done by the maintenance department, by whom, and for what condition?
Availability of maintenance history records - maintenance history
records - equipment history
records - spare part history
records - Inventory system
Availability of equipment history records
Spare parts information records
Computerized inventory system
10. How are your spare-parts inventories managed and controlled? Do you have either excess inventories or are you consistently waiting for parts to arrive?
Periodic inventory review - Inventory polices - Control procedures - Warehousing
Documentation of spare parts and material usage on work order sheet.

96
Questions Identified Codes Themes
Spare parts availability and control
11. Do you have an organized system to store documents (electronically) related to Operations & Maintenance procedures, equipment manuals, and warranty information?
Availability of detail and complete specifications - Specification - warranties & cost
information - manuals &
documentation
Coding and classification of equipment
Availability of initial cost and warranties
Service contract and standardization
Availability of load rating, manuals and documentation
12. Do you believe that the actual maintenance cost (labor, downtime, overtime, spare part and other related costs) is tracked and controlled by your office or department without any restrictions
Establishing periodic budget execution planning - Budget execution
plan - Budget control plan
Identifying works in the budget plan.
Controlling budget against expenditure
13. In your opinion are there any other problems with the maintenance management system at the company that affects the overall equipment effectiveness (OEE), which is not covered in the above questions?
Safety awareness - Maintenance - Safety - Environment
Use of personal safety equipment
Securing emergency safety kit with in working places
Availability of fire extinguisher at different locations
Proper location of emergency evacuation system
Periodic safety assessment
Awareness of maintenance impact on the environment
Consider the environment when developing equipment management strategies.
Preliminary conclusions and concepts for improvements were developed from the qualitative
data. These conclusions and concepts were tested with the study participants to crosscheck
whether they agreed with its conclusion and whether they made sense to their experience.
Feedback from different groups was appropriately interpreted, and validated conclusions were
drawn from qualitative data.
These all ensured authenticity and trustworthiness of this study. Nvivo 12 qualitative analysis
software was used to rate and analyze the importance of the identified codes for this study for
data collected through in-depth interview for all 13 questions. Figure 13 shows the word cloud
generated through the software to rate the most frequent words during interview verbatim to
define and identify the relevant codes through qualitative analysis.

97
Figure 13: In vivo generated Interview Codes Spiral Word Cloud
The total interview verbatim transcribed word count from interview questions is 2722, the
identified in vivo codes from these transcribed word counts are 60 and 37 themes are finally
identified from the in vivo codes that are categorized for each interview questions.
Table 10: In vivo generated word transcription & identified Themes
Questions
# identified Themes
Word Length
Number of Transcription
% of occurrences
Q1 1 Polices 4 1 1.14%
2 Programs 5 1 1.14%
3 Procedures 6 1 1.14%
Q2 1 Mission 6 1 1.14%
2 Quality statement 6 1 1.14%
Q3 1 Management training 9 1 1.14%
2 Planner training 8 1 1.14%
3 Craft training 7 1 1.14%
Q4 1 Budget planning 7 1 1.14%
2 Reporting and feedback 2 2 1.28%
3 Effective control 3 35 4.96%
Q5 1 Effective strategies 6 3 1.43%
2 Strategy assessment 3 5 1.71%
Q6 1 Maintenance Information Systems
3 7 1.99%

98
Questions
# identified Themes
Word Length
Number of Transcription
% of occurrences
2 Software/ hardware 6 1 1.14%
Q7 1 Priority system 10 2 1.28%
2 Work order system and procedures
2 2 1.28%
3 Emergency & shutdown scheduling
13 1 1.14%
4 Planning procedures 12 29 4.11%
Q8 1 Performance measures 9 2 1.28%
2 Continuous improvement 7 1 1.14%
3 Maintenance process re-engineering
6 10 1.42%
Q9 1 maintenance history records 2 3 1.43%
2 equipment history records 10 1 1.14%
3 spare part history records 9 1 1.14%
4 Inventory system 8 1 1.14%
Q10 1 Inventory polices 5 1 1.14%
2 Control procedures 14 1 1.14%
3 Warehousing 5 2 1.28%
Q11 1 Specification 4 1 1.14%
2 warranties & cost information 5 2 1.28%
3 manuals & documentation 6 1 1.14%
Q12 1 Budget execution plan 7 5 1.71%
2 Budget control plan 10 1 1.14%
Q13 1 Maintenance 8 1 1.14%
2 Safety 12 3 1.43%
3 Environment 4 1 1.14%
Total 37 Themes are identified from 61 In vivo codes with a word length of 2722
After thematically analyzing the data of the in-depth interview, 37 (thirty-seven) overarching
themes were identified from all 13 questions that covered the interviews of all interviewee and
from 61 identified codes using Nvivo12, see Table 10. The identified and categorized
overreaching themes are illustrated in Figure 14. The thematic analysis is triangulated to
frequency measurements in order to increase representativeness of the data and increase
reliability.

99
Figure 14: Identified and categorized overarching Themes word cloud
In qualitative analysis frequency, measurements were necessary to perform meaningful
statistical analyses because the study aimed to investigate and identify problems rapidly with
high measurement frequency (i.e. temporal resolution) without compromising compliance. The
analysis and results of each individual interview question are presented in the ensuing sections.
6.2.1 Question 1 Themes and Findings
As shown in Table 9, maintenance management Policies, Programs, and Procedures are
documents designed as minimum requirements in compliance with the industry’s overall
Policies and programs currently in use. This also includes standard Operating Procedures
(SOP’s). Table 11 shows the identified interviewee codes for interview question one, from
which the data for graphical representation is generated. These identified 6 codes comprised
reasons related to 3 grouped themes. All existing problems and characteristics of the variable
of interest, for example, its fluctuation pattern or its occurrence rate are stated with theses
codes.
Findings from this interview question suggest that apart from a trend mutually understood by
the employees of the maintenance center and interlinked sub-process at manufacturing
industries, there are no policies, programs, and procedures regarding maintenance management
which any relevant personnel or manager can refer to whenever needed.

100
Table 11: Identified Interviewee Codes for Q1
# identified Interviewee Codes for Q1 Word Length Transcripts Percentage%
1 Availability of documented policies 9 6 30%
2 Availability of documented programs 6 5 25%
3 Availability of documented procedures 5 5 17.5%
4 Availability of active updating programs 3 5 20%
5 Availability of documented shop functions and SOP
7 6 22.5%
6 Availability Work Process effectiveness review and evaluation
8 12 30%
Average 6.33 6.5 24.00%
All Manufacturing industries in Ethiopia studied in this research do not have written policies
and procedures that direct managers to identify and report maintenance problems of machine
and equipment or instructs managers on what corrective action to take if they suspect or detect
maintenance problems on machines and equipment. Without clearly defined authority and
responsibility to identify, report, and act upon underused or idle machines and equipment, the
maintenance department likely retains the broken, underused or unneeded machine in the
factory.
Figure 15: Identified Themes from Interview Q1
30.0
25.0
17.5
20.0
22.5
30.0
0 5 10 15 20 25 30 35
Availability of documented policies
Availability of documented programs
Availability of documented procedures
Availability of active updating programs
Availability of documented shop functions and SOP
Work Process effectiveness review and evaluation
POLICIES, PROGRAMS AND PROCEDURES

101
Keeping broken, underused and idle machines and equipment in the factory is inefficient,
causing unnecessary expenses associated with storing and maintaining that machine and
equipment and preventing the company from converting the asset to cash and using it for other
priorities. The triangulated results from the first interview question are shown in Figure 15.
Standard Operating Procedures (SOP) maintenance activities, which are key elements for
efficient shop functioning, did not exist due to the limitations on guidelines and directives. The
effectiveness of the total work process was not evaluated and revised periodically. There was
no well-established work planning to assist in maintenance activity.
Also, the supervisors did not have a rating mechanism that could have helped them out in
assuring the maintenance quality. As shown in Figure 15, the elements which assist formal
documentation (policies, programs, and procedures) lie below 30%, which is critical when
compared to the mean value. Most Ethiopian manufacturing industries lack documented
procedures and programs which facilitate work process effectiveness and evaluation. Ethiopian
manufacturing industries should establish their own programs and procedures to create an
effective Equipment management system. All sub elements under Policies programs and
Procedures fall under 30%, which clearly indicates immediate change in this area.
6.2.2 Question 2 Themes and Findings
Table 12 shows the identified interviewee codes for interview question two. These identified
codes covered reasons related to practicability for both the participant from the manufacturing
industry and the researcher. These codes represent critical problems identified and prioritized
as per this study analysis from all the existing manufacturing industries.
Table 12: Identified Interviewee Codes for Q2
# identified Interviewee Codes for Q2 Word Length Transcripts Percentage%
1 Availability of mission statement 9 8 55%
2 Availability of clear objectives 2 5 25%
3 Availability of strategies 3 5 27.5%
4 Availability of organizational chart and structure 7 7 52.5%
5 Availability of function statement 9 8 55%
6 Availability of Job description 13 12 62.5%
Average 7.16 7.5 46.00%
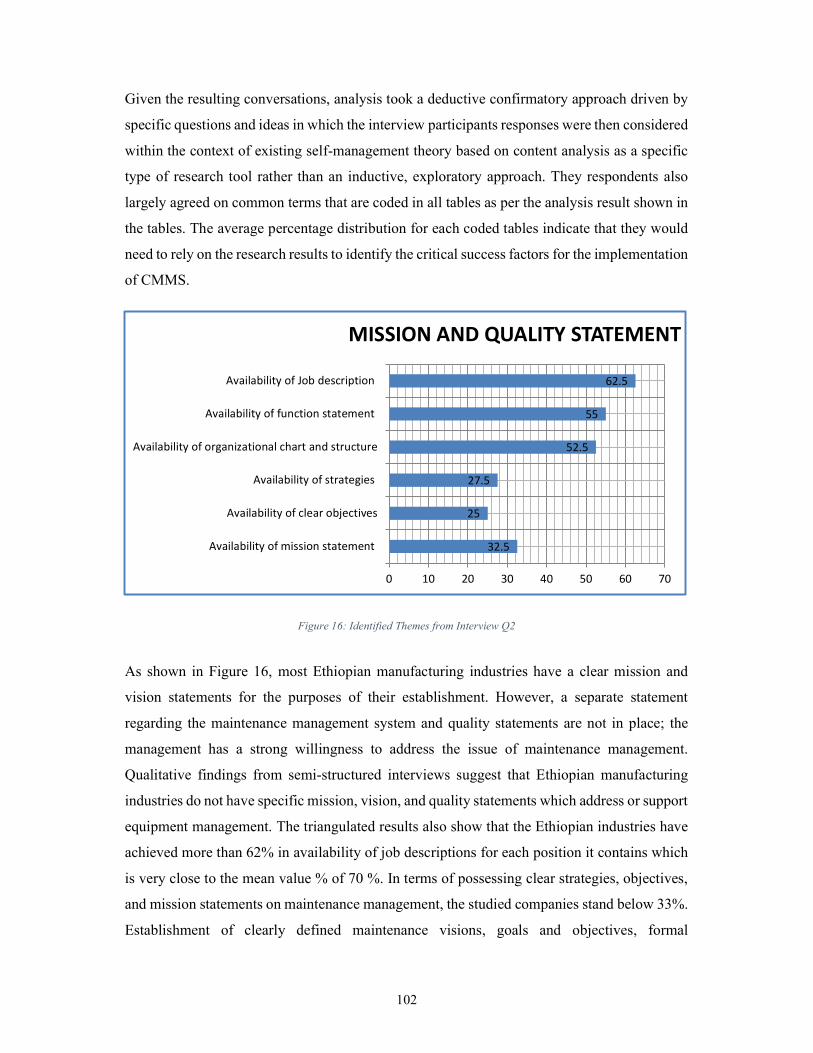
102
Given the resulting conversations, analysis took a deductive confirmatory approach driven by
specific questions and ideas in which the interview participants responses were then considered
within the context of existing self-management theory based on content analysis as a specific
type of research tool rather than an inductive, exploratory approach. They respondents also
largely agreed on common terms that are coded in all tables as per the analysis result shown in
the tables. The average percentage distribution for each coded tables indicate that they would
need to rely on the research results to identify the critical success factors for the implementation
of CMMS.
Figure 16: Identified Themes from Interview Q2
As shown in Figure 16, most Ethiopian manufacturing industries have a clear mission and
vision statements for the purposes of their establishment. However, a separate statement
regarding the maintenance management system and quality statements are not in place; the
management has a strong willingness to address the issue of maintenance management.
Qualitative findings from semi-structured interviews suggest that Ethiopian manufacturing
industries do not have specific mission, vision, and quality statements which address or support
equipment management. The triangulated results also show that the Ethiopian industries have
achieved more than 62% in availability of job descriptions for each position it contains which
is very close to the mean value % of 70 %. In terms of possessing clear strategies, objectives,
and mission statements on maintenance management, the studied companies stand below 33%.
Establishment of clearly defined maintenance visions, goals and objectives, formal
32.5
25
27.5
52.5
55
62.5
0 10 20 30 40 50 60 70
Availability of mission statement
Availability of clear objectives
Availability of strategies
Availability of organizational chart and structure
Availability of function statement
Availability of Job description
MISSION AND QUALITY STATEMENT

103
maintenance process documentation (policy and procedures), clarification of maintenance job
roles and responsibilities, and following all the maintenance procedures is mandatory for better
maintenance management.
6.2.3 Question 3 Themes and Findings
Numerous human resource studies have demonstrated that good training programs lead to less
personnel turbulence and higher morale. The costs avoided thereby are significant, and such
cost savings are additive with expenses reduced or eliminated through the better maintenance
programs, which, in turn, also result from effective training. Thorough training of maintenance
personnel substitutes for highly formalized procedural rules. Besides encouraging a greater
sense of employee responsibility from job enlargement and enrichment, better-trained
mechanics and forepersons, provide greater tasking flexibility and staffing depth for the
organization. According to the findings of this study, the Ethiopian manufacturing industries’
existing complex industrial production machines and equipment demands a number of
professional skills. Table 13 shows the identified interviewee codes for question three from the
interviews. Such data was used to generate the graphical representation for Figure 17.
Table 13: Identified Interviewee Codes for Q3
# identified Interviewee Codes for Q3 Word Length Transcripts Percentage%
1 Availability of management and leadership training 7 6 30%
2 Availability of supervisors, dispatchers, foremen and planner training
5 5 27.5%
3 Availability of technicians, Operators and drivers training 9 9 60%
4 Availability of refreshment training 4 5 25%
Average 6.25 6.25 36.00%
As shown in Figure 17, if mechanics lack machine and equipment specific-item training (type
rating), then their "repairs" may be ineffectual or leads to more expensive premature failures.
Likewise, machines and equipment operators must understand how to obtain maximum
efficiency and safety from their equipment, and this requires more deliberate instruction than
the "learn as you go" approach. No matter where they obtain their knowledge, skills, and
abilities (KSA), whether from local training institutes, machine and equipment dealers, or their
employers (coaching), operators must prevent unnecessary, improper wear on their assigned
machines and equipment.

104
Figure 17: Identified Themes from Interview Q3
The training currently given to most Ethiopian manufacturing industries’ technical personnel
is the basic training that is conducted in technical and vocational training centers to have basic
operations skills. In a modern maintenance management system, the maintenance personnel
should be trained for specific machines and equipment during purchasing time. As shown in
Figure 17, most Ethiopian Manufacturing Industries’ have good moves in terms of operators,
drivers, and technicians training. On the other side, capacity building for planners, supervisors,
dispatchers, and forepersons can be said poor (<28%). There should also be a system to upgrade
management and leadership training.
6.2.4 Question 4 Themes and Findings
Life cycle cost (LCC) is the total cost of ownership of machinery and equipment, including its
cost of acquisition, operation, maintenance, conversion, and/or decommission. LCCs are
summations of cost estimates from inception to disposal for both equipment and projects as
determined by an analytical study and estimate of total costs experienced in annual time
increments during the project life with consideration for the time value of money. The point of
LCC analysis is to choose the most cost-effective approach from a series of alternatives to
achieve the lowest long-term cost of ownership. An LCC is an economic model over the project
life span. Usually, the cost of operation, maintenance, and disposal costs exceed all other first
costs many times over. Table 14 shows the identified interviewee codes for question four in
the interviews. This data was used to generate the graphical representation for this question.
30
27.5
60
25
0 10 20 30 40 50 60 70
Availability of management and leadership training
Availability of supervisors, dispatchers, foremenand planner training
Availability of technicians, Operators and driverstraining
Availability of refreshment training
TRAINING

105
Table 14: Identified Interviewee Codes for Q4
# identified Interviewee Codes for Q4 Word Length Transcripts Percentage%
1 Do you plan annual fleet and maintenance budget 12 10 55%
2 Do you have cost reporting & budget documentation 10 9 52.5%
3 Do you formally identifying and presenting long-range requirements for renewals and replacement to management
6 5 22.5%
Average 9.3 8.00 43.00%
The best balance among cost elements is achieved when the total LCC is minimized. As with
most engineering tools, an LCC provides the best results when both engineering art and science
are merged with good judgment to build a sound business case for action. Businesses must
summarize LCC results in net present value (NPV) format considering depreciation, taxes, and
the time value of money, see Figure 18.
Figure 18: Identified Themes from Interview Q4
The findings suggest that, at present, Ethiopian manufacturing industries have no separate
annual plan on maintenance budget; detailed costs regarding maintenance management were
not reported or separately known. There was no budget documentation regarding maintenance
management as well as established periodic budget execution plan for maintenance
management. Results also show that the companies did not control the budget against
expenditure regarding parts, and at the same time, there was no separate controlling budget
against fuel and lubrication. The studied companies did not also evaluate various how works
were identified in each year's budget plan. Additionally, there were no long-term requirements
55
52.5
22.5
0 10 20 30 40 50 60
Planning annual fleet and maintenance budget
Cost reporting & budget documentation
Formally identifying and presenting long-rangerequirements for renewals and replacement to…
BUDGET REQUIREMENTS FOR MAINTENANCE MANAGEMENT OPERATIONS
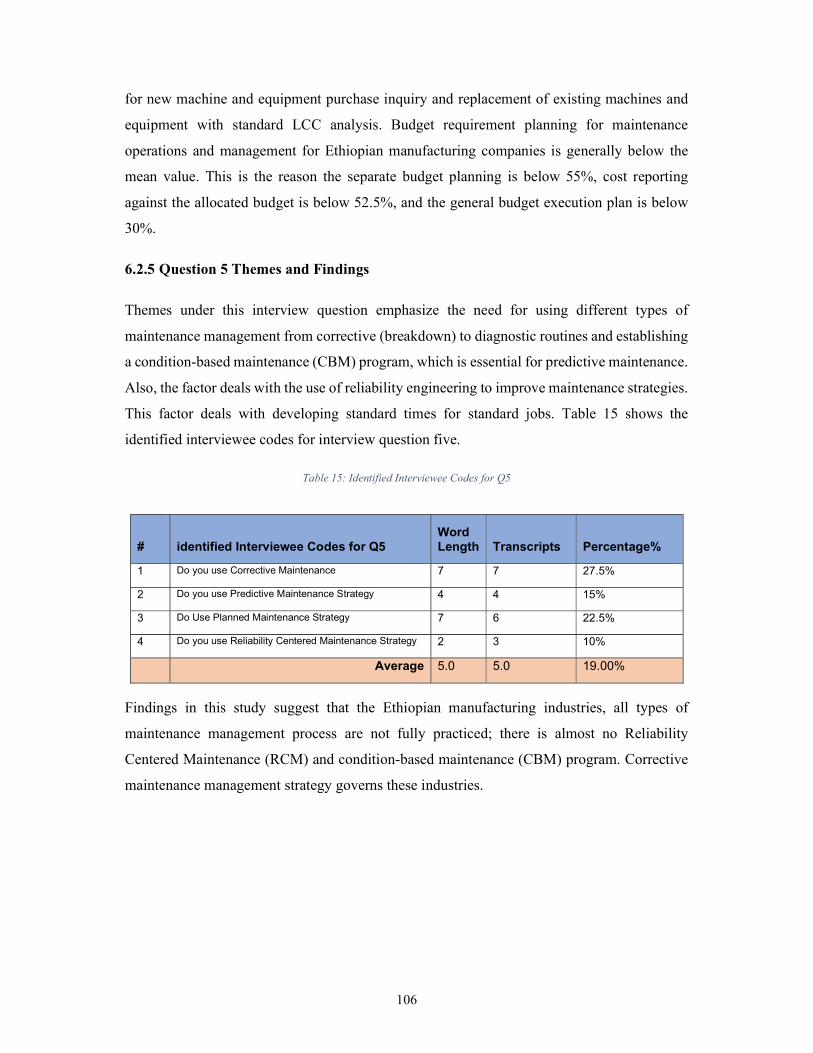
106
for new machine and equipment purchase inquiry and replacement of existing machines and
equipment with standard LCC analysis. Budget requirement planning for maintenance
operations and management for Ethiopian manufacturing companies is generally below the
mean value. This is the reason the separate budget planning is below 55%, cost reporting
against the allocated budget is below 52.5%, and the general budget execution plan is below
30%.
6.2.5 Question 5 Themes and Findings
Themes under this interview question emphasize the need for using different types of
maintenance management from corrective (breakdown) to diagnostic routines and establishing
a condition-based maintenance (CBM) program, which is essential for predictive maintenance.
Also, the factor deals with the use of reliability engineering to improve maintenance strategies.
This factor deals with developing standard times for standard jobs. Table 15 shows the
identified interviewee codes for interview question five.
Table 15: Identified Interviewee Codes for Q5
# identified Interviewee Codes for Q5 Word Length Transcripts Percentage%
1 Do you use Corrective Maintenance 7 7 27.5%
2 Do you use Predictive Maintenance Strategy 4 4 15%
3 Do Use Planned Maintenance Strategy 7 6 22.5%
4 Do you use Reliability Centered Maintenance Strategy 2 3 10%
Average 5.0 5.0 19.00%
Findings in this study suggest that the Ethiopian manufacturing industries, all types of
maintenance management process are not fully practiced; there is almost no Reliability
Centered Maintenance (RCM) and condition-based maintenance (CBM) program. Corrective
maintenance management strategy governs these industries.

107
Figure 19: Identified Themes from Interview Q5
Figure 19 shows that corrective maintenance management strategies dominate Ethiopian
manufacturing industries compared to other strategies. Therefore, as supported by the
quantitative study results in the following section, a proper CMMS system needs in a place to
resolve these problems.
6.2.6 Question 6 Themes and Findings
Table 16: Identified Interviewee Codes for Q6
# identified Interviewee Codes for Q6 Word Length Transcripts Percentage%
1 Adequacy of computerized equipment management system
9 8 10%
2 Report design and utilization 2 5 40%
3 Facility and equipment report 3 5 47.5%
4 Availability of easy to use maintenance management system
7 7 30%
5 Availability of in house developed systems for equipment management (expert systems)
9 8 10%
Average 6.0 6.6 28.00%
Table 16 presents the identified codes for interview question six, thus, illustrating the data that
was used to generate graphical representation for results from this interview question. The
themes highlighted by this question deal with the proper use of information technology
27.5
15
22.5
10
0 5 10 15 20 25 30
Corrective Maintenance
Predictive maintenance
Planned Maintenance
Realiablity Centred Maintenance
TYPES OF MAINTENANCE MANAGEMENT STRATEGY

108
hardware and software in maintenance and equipment management (CMMS). One aspect about
this is the availability of adequate information systems. An information system is a tool for
proper management and control. It must be designed so that it satisfies maintenance
management requirements. It has a significant impact on maintenance systems and
management. It should have all the necessary sub-systems that provide machine and
equipment, work-load, and spares control, in addition to a timely reporting system.
Figure 20: Identified Themes from Interview Q6
As illustrated in Figure 20, the findings of this study suggest that there is no computerized
system easy to use the maintenance management system, i.e., separate maintenance
management software (CMMS) in the Ethiopian manufacturing industry context. In most
companies, they implemented ERP solutions like Microsoft Dynamics tools, which are
currently being used for report writing and financial analysis. Some of the companies use
Microsoft Excel for the recording of the spare parts and daily routines. Currently, there are
good start-ups guidelines for maintenance data handling (paper-based record-keeping) on
maintenance workflow at most Ethiopian Manufacturing Industries, but it lacks effectiveness,
and it is not inclusive of all the necessary parameters like labor hour, responsible person, and
specific shop assignment. Findings also demonstrate that most Ethiopian manufacturing
industries' current machine and equipment history and data handling has various following
limitations. For example, there is no well-defined data and history records index; no standard
formats to manage maintenance management system (there are formats developed by any
10
40
47.5
30
10
0 5 10 15 20 25 30 35 40 45 50
Adequacy of computerized equipmentmanagement system
Report design and utilization
Facility and equipment reports
Availability of easy to use maintenancemanagement system
Availability of in house developed systems forequipment management (expert systems)
MANAGEMENT INFORMATION SYSTEM (MIS)

109
person within the department) even the existing formats are not properly filled, authorized, and
handled for data management purpose; no clear data handling procedures, indexes
guide/manual; and there is also no responsible section to handle record especially on
maintenance work.
6.2.7 Question 7 Themes and Findings
For successful accomplishment of maintenance activities, it is necessary to develop and
implement a clearly known workflow system and use different recording formats, which need
approvals for generating and tracking work orders. This simplifies the task of maintenance and
enhances productivity. Table 17 presents the identified codes for interview question seven.
Table 17: Identified Interviewee Codes for Q7
# identified Interviewee Codes for Q7 Word Length Transcripts Percentage%
1 Availability of standard work request format. 13 12 60%
2 Availability of standard work order. 10 8 40%
3 Availability standard inter- shop order 11 10 55%
4 Availability of carryover authorization 7 7 25%
5 Immediate response and decision on maintenance capability within shop, outsource or onsite maintenance
9 7 35%
Average 10.0 8.8 43.00%
The findings of this study suggest that the following problems are observed in Ethiopian
manufacturing industries due to improper maintenance flow system; (i) inefficient and
ineffective implementation of maintenance workflow system; (ii) lack of accurate job
descriptions for each technical personnel, including supervisors; (iii) lack of standard formats
to be used by all personnel; (iv) lack of coordination between workers, department, and top
management; (v) occurrence of frequent accidents inefficient maintenance work
accountability; (vi) insufficient recording system Lack of clearly identified maintenance flow;
(vii) inadequate reporting system to department heads and managers; (viii) lack of efficient
maintenance management system; (ix) poor maintenance work order generation and tracking.
In addition to these problems, the technical personnel and the department as a whole did not
try to work based on manuals and procedures, rather, they operate based on their experiences
without any analysis of the maintenance analysis which are basic for work order generation
and tracking.

110
Figure 21: Identified Themes from Interview Q7
As shown in Figure 21, standard work request formats are available (60%) along with standard
work order (55%). However, work tracking is poor in most Ethiopian Manufacturing
Industries. In general, the existence of such and other associated problems related to work order
generation and tracking cause low productivity of technical personnel and maintenance
activities. It is strongly recommended that the industries should develop a standard and uniform
maintenance workflow system along with standard formats that are used for work generation
and tracking. This will help to compromise conflicting ideas during the maintenance work
processing. Maintenance activities pass through different steps and require a good decision on
each step. This requires not only technical personnel but also the maintenance manager to take
corrective action in relation to the objectives of the company. The procedures in which
maintenance activities pass should be known and controlled by the proper concerned personnel.
Therefore, the duties of the maintenance manager, workshop supervisors, inspectors/planners,
forepersons, mechanics, and drivers/operators in the process of maintenance and repair have to
be clearly identified and controlled.
6.2.8 Question 8 Themes and Findings
In this question, themes such as performance appraisal and analysis are shown to be vital for
continuous improvement. Maintenance management should measure the performance of
60
55
42.5
25
35
0 10 20 30 40 50 60 70
Availability of standard work request format.
Availability of standard work order.
Availability standard inter- shop order
Availability of carryover authorization
Immediate response and decision on maintenancecapability within shop, outsource or onsite
maintenance
WORK FLOW PROCEDURE

111
maintenance activities and assess its impact on key operations. These factors are, in general,
which performance measures are procedures for obtaining performance indices and action
plans and improvement. The identified codes for question eight in the interview are presented
in Table 18.
Table 18: Identified Interviewee Codes for Q8
# identified Interviewee Codes for Q8 Word Length Transcripts Percentage%
1 Using performance measurement methods 3 4 17.5%
2 Report summaries preparation 7 6 35%
3 Using engineered performance standards to estimate man hours on work orders
6 5 22.5%
4 Conducting improvement studies 6 6 25%
Average 5.5 5.25 25.00%
In Ethiopian manufacturing industries, the results of this study show, there is some
performance measurement trial to set working skilled labor hours to accomplish a specific
maintenance work. The measurements are not technically feasible and seem to have been done
for completeness of the activity. The assigned hours are not standardized skilled labor hours.
Several reports like skilled labor hours spent by the technician are available. Those reports do
not meet the standard of modern maintenance management systems (CMMS). They are not
also properly analyzed using different variables of Key Performance Indicators (KPI’s).
Figure 22: Identified Themes from Interview Q8
17.5
35
22.5
25
0 5 10 15 20 25 30 35 40
Using performance measurement methods
Report summaries preparation
Using engineered performance standards toestimate man hours on work orders
Conducting improvement studies
MEASUREMENT OF WORK PERFORMANCE

112
Interview results, as shown in Figure 22, illustrate that in Ethiopian companies, conducting
improvement studies is below 25% and, in general, using performance measurement methods
is below 18%. Therefore, such companies need strong attention to these cases in order to
improve their working cultures. Productivity measures relate real physical output to real input.
They range from single factor measures, such as output per unit of labor input or output per
unit of capital input, to measures of output per unit of multifactor input. Such measures also
reflect changes in technology, the scale of production, educational levels of workers,
managerial techniques, and many other factors in addition to the contributions of the particular
inputs. Variance review is the process of comparing the previous work status with current
working procedures using productivity measurement parameters.
6.2.9 Question 9 Themes and Findings
Vital themes under this interview question include the historical information of any machine
and or equipment includes the availability of inventory, part and spare part information,
machine and equipment historical data, and availability of fleet available in the industry. The
identified interviewee codes from question nine in the interviews are presented in Table 19.
Table 19: Identified Interviewee Codes for Q9
# identified Interviewee Codes for Q9 Word Length Transcripts Percentage%
1 Availability of maintenance history records 6 5 37.5%
2 Availability of equipment history records 9 7 50%
3 Spare parts information records 8 7 47.5%
4 Computerized inventory system 3 4 17.5%
Average 6.5 5.75 38.00%
The findings of this study in relation to this question show that to retrieve the historical
information of any maintenance activities in Ethiopian Manufacturing Industries with respect
of information technology and use of software tools is below the standard and needs overall
improvement as we can observe from the study analysis, Figure 23.

113
Figure 23: Identified Themes from Interview Q9
Findings also show trend in Ethiopian manufacturing industries with respect to maintenance
historical information there are lack of the following information: (i) - reports on functions of
the maintenance work; (ii) - summary of work order status; (iii) - standard operating and
procedures and directives; (iv) - key contacts at senior levels or others, regarding maintenance
policies and procedures; (v) - room locations (with drawing or layout) and telephone numbers
of every departments; (vi) - details of staff leave arrangements and schedule; (vii) - location of
all records, offices and record storage areas (with drawing or layout if helpful) and information
about the prevailing physical conditions especially; (viii) - file lists, indexes and other control
documents (photocopies should be supplied if possible); (ix) - description of existing record
retention practices; (x) - information about perceived shortcomings such as backlogs,
complaints, turnovers, etc.; and (xi) - inventory of all resources, including staff, stationery and
stocks, , supplies and transport.
6.2.10 Question 10 Themes and Findings
Themes from this section involve inventory and tool control procedures. Fundamentally, the
need for an up-to-date inventory system and clear policies and procedures for tool management
is emphasized. Spare parts availability and bench stock management is essential for a
productive maintenance management system. This also includes inventory policies, control
procedures, and warehousing. Table 20 presents the identified codes from interview question
ten and data used to generate the ensuing graphical representation for this question.
37.5
50
47.5
17.5
0 10 20 30 40 50 60
Availability of maintenace history records
Availability of equipment history records
Spare parts information records
Computerized inventory system
INFORMATION SYSTEM & HISTORICAL RECORDS

114
Table 20: Identified Interviewee Codes for Q10
# identified Interviewee Codes for Q10 Word Length Transcripts Percentage%
1 Periodic inventory review 12 10 60%
2 Documentation of spare parts and material usage on work order sheet.
9 7 47.5%
3 Spare parts availability and control 13 12 62.5%
Average 11.33 9.67 57.00%
Findings from the analysis suggest that there is a well-organized inventory management system
in most Ethiopian medium and large manufacturing industries. However, there is a lack of
automation and lack of disposal of salvage and obsolete machines and equipment. Furthermore,
some industries are organized with proper usage of a manual stock index, but the other
warehouses found in these industries' maintenance centers are not properly managed. The other
clear problem observed in Ethiopian medium and large manufacturing Industries spare part
management is the stock control activity. Even though the control is done manually involving
many stock control staff and time taking, it is efficient for controlling purposes only.
Figure 24: Identified Themes from Interview Q10
Figure 24 shows that Ethiopian Medium and Large manufacturing industries show a
progressive development and also has a good practice. From the result, spare part availability
and control 62.5%, documentation of spare parts and materials usage work order sheet is
47.5%, and periodic inventory review is around 60%. Still, these industries are far from mean
value scores, and as such, they need improvements, especially by putting computerized spare
part management and warehouse management system in place.
60
47.5
62.5
0 10 20 30 40 50 60 70
Periodic inventory review
Documentation of spare parts and material usageon work order sheet.
Spare parts availability and control
PARTS & MATERIAL AVAILABILITY

115
6.2.11 Question 11 Themes and Findings
The essential themes in this section include standardization and codification. Each piece of
machines and equipment must have unique identification numbers so that they can be noted
easily and accurately. A common practice is to describe them by individual names. Since
several departments use the same item, they brand the items by different names and store them
in different places. But the most recommended way of identifying machines and equipment is
providing with code that breaks the machine and equipment down into groups, types, and
classes, each being a subdivision of the next higher order. Because of rationalized codification,
many firms have reduced the number of items. It enables the systematic grouping of similar
items and avoids confusion caused by a long description of the items. Table 21 shows the
identified themes from question eleven of this study’s interviews.
Table 21: Identified Interviewee Codes for Q11
# identified Interviewee Codes for Q11 Word Length Transcripts Percentage%
1 Availability of detail and complete specifications 7 8 47.5%
2 Coding and classification of equipment 9 10 62.5%
3 Availability of initial cost and warranties 7 7 45%
4 Service contract and standardization 5 4 22.5%
5 Availability of load rating, manuals and documentation 4 4 20%
Average 6.4 6.6 40.00%
Since the standardization of names is achieved through codification, it serves as the starting
point of simplification and standardization. It helps in avoiding duplication of items and results
in the minimization of the number of items, leading to accurate records. Codification enables
easy recognition of an item in stores, thereby reducing clerical efforts to the minimum. If items
are coded according to the sources, it is possible to bulk the items while ordering.
Standardization enables the materials manager to achieve the overall economy and ensures the
interchangeability of parts. Since more than one manufacturer can supply standard items, it
will imply better availability, better price, and better delivery. Standardization also implies
route purchase efforts, less stock, and hence less obsolete items.

116
Figure 25: Identified Themes from Interview Q11
Findings from this study, as shown in Figure 25, show that recording keeping and availability
of documents are poor in most Ethiopian manufacturing industries. Availability of initial
purchase costs, specification of machines and equipment, manuals and documentation in a
proper place is below 20%, service contract and standardization of machines and equipment is
below 23%, availability of initial costs and warranties related documents for life cost analysis
is 45%, and availability of detail and complete specification of machines and equipment is
below 47.5%. Whereas, coding and classification of machines and equipment are around
62.5%, which is good.
6.2.12 Question 12 Themes and Findings
The most significant themes under this interview question include the actual maintenance
activity costs (which are labor, downtime, overtime, spare part, and other related costs), costs
related with budget against maintenance activity expenditures, costs which are planned and
schedules for maintenance activity, and established costs for periodic maintenance activities.
The identified codes for this question are presented in Table 22.
47.5
62.5
45
22.5
20
0 10 20 30 40 50 60 70
Availability of detail and complete specifications
Coding and classification of equipments
Availability of initial cost and warranties
Service contract and standardization
Availability of load rating , manuals anddocumentation
DOCUMENTATION MANAGMENT AND RECORD KEEPING

117
Table 22: identified Interviewee Codes for Q12
# identified Interviewee Codes for Q12 Word Length Transcripts Percentage%
1 Establishing periodic budget execution planning 8 6 30%
2 Identifying works in the budget plan. 9 7 37.5%
3 Controlling budget against expenditure 8 6 30%
Average 8.33 6.33 33.00%
As shown in Figure 26, there are almost very poor maintenance activity cost tracking
procedures in most Ethiopian manufacturing industries. Controlling budget against
maintenance expenditure is less than 30% while identifying works in the budget plan is almost
38% because of the paper-based system and establishing period budget execution planning is
impossible to track due to the lack of a maintenance management system which can easily
analysis and retrieve data in a short period for budget planning.
Figure 26: Identified Themes from Interview Q12
6.2.13 Question 13 Themes and Findings
The improvement of safety, health, and working conditions depend ultimately upon people
working together, whether governments, employers, or workers, which are the major themes
addressed under this interview question. Safety management involves the functions of
planning, identifying problem areas, coordinating, controlling, and directing the safety
activities at the worksite, all aimed at the prevention of accidents and ill-health. Table 23 shows
the identified interviewee codes for interview question 13.
30
37.5
30
0 5 10 15 20 25 30 35 40
Establishing periodic budget execution planning
Identifying works in the budget plan.
Controlling budget against expenditure
BUDGET EXECUTION PLAN

118
Table 23: Identified Interviewee Codes for Q13
# identified Interviewee Codes for Q13 Word Length Transcripts Percentage%
1 Safety awareness 8 9 47.5%
2 Use of personal safety equipment 6 5 27.5%
3 Securing emergency safety kit with in working places 3 3 10%
4 Availability of fire extinguisher at different locations 6 4 22.5%
5 Proper location of emergency evacuation system 5 4 20%
6 Periodic safety assessment 4 3 12.5%
Average 5.33 4.67 23.00%
Accident prevention is often misunderstood, for most people believe wrongly that the word
“accident” is synonymous with “injury.” This assumes that no accident is of importance unless
it results in an injury. Maintenance managers are obviously concerned with injuries to the
workers, but their prime concern should be with the dangerous conditions that produced the
injury – with the “incident” rather than the “injury.” Inside the manufacturing industries, there
are many more “incidents” than injuries.
Figure 27: Identified Themes from Interview Q13
47.5
27.5
10
22.5
20
12.5
0 5 10 15 20 25 30 35 40 45 50
Safety awareness
Use of personal safety equipments
Securing emergency safety kit with in working places
Availability of fire extinguisher at different locations
Proper location of emergency evacuation system
Periodic safety assessment
MAINTENANCE AND SAFETY

119
A dangerous act can be performed hundreds of times before it results in an injury, and it is to
eliminate these potential dangers that managers’ efforts must be directed. Companies cannot
afford to wait for human or material damage before doing anything. So, safety management
means applying safety measures before accidents happen. Effective safety management has
three main objectives: to make the environment safe; to make the job safe, and to make workers
safety conscious. A poorly planned and untidy workshop layout is the underlying cause of
many accidents resulting from falls of material and collisions between workers and plant or
equipment.
Findings show that there are a number of limitations of safety issues in most Ethiopian
Manufacturing Industries. Firstly, there is a problem with the awareness of safety procedures
in all shops, see Figure 27. Secondly, the use of safety machine and equipment are not
implemented properly even if there was available safety equipment. The periodic assessment
of safety in these industries is also not available. In most companies, the maintenance personnel
does not use the appropriate safety equipment in a real situation in maintenance. There is also
a lack of proper distribution of safety items, nor is their compilation.
Lastly, ambulance or standby vehicles are not properly allocated for emergency problems
inside manufacturing factories to admit the injured to a clinic for medical treatment. The
findings also show that the working conditions in Ethiopian manufacturing industries and
maintenance management with regards to the environment are poor. Therefore, in order to
manage these problems, the following recommendation is given training on awareness creation
for safety procedures, working conditions, and environment; give the safety equipment to the
personnel periodically; conduct an assessment periodically; and follow-up on proper
implementation with regard to these specific points.
6.3 Quantitative Data Analysis and Findings
While qualitative data analysis involved identifying themes in the data and the relationships
between these themes, the quantitative data analysis involved a variety of statistical methods
as described in the methodology chapter. The ensuing sections presents the results of those
analyses, while attempting to draw inferences and deductions from the questionnaires.

120
6.3.1 Respondents Characteristics
The study represents various industries, as described in Table 24. Machine and Equipment
Industry, Leather &Wearing Apparel Industry, and Non-Metallic Mineral Products/Cement
Industry being represented by more than 12 firms. Most respondents worked in the company
less than 5 (47.7%) or 5-10 years (31.5%) with 4.3% and 8.2% having 11-15 and 16-20 years
of experience within the company, respectively. A significant number of respondents come
from maintenance (36.2%), Production (37%), QA (15.9%) or IT (10.9%) departments.
Table 24: Respondents by Industry
Industries Frequency % Valid % Cumulative
% Food & Beverage Industry 19 6.7 6.7 6.7 Machinery and Equipment Industry
51 18.1 18.1 24.8
Non-Metallic Mineral Products/Cement Industry 32 11.3 11.3 36.2
Furniture Industry 16 5.7 5.7 41.8 Tobacco Products Industry 20 7.1 7.1 48.9 Textiles Industry 28 9.9 9.9 58.9 Leather & Wearing Apparel Industry 33 11.7 11.7 70.6
Wood & Timber Industry 1 .4 .4 70.9
Pulp and Paper Industry 25 8.9 8.9 79.8
Chemicals Industry 13 4.6 4.6 84.4 Rubber and Plastic Products Industry 20 7.1 7.1 91.5 Iron, Metal & Steel Industry 24 8.5 8.5 100.0 Total 282 100.0 100.0
Most respondents have at least a Diploma or Advanced Diploma (98.2%); a majority, 70.7%
of the respondents already have a degree, and 20 (7.1%) at least hold a post-graduate degree.
The distributions of respondents by current positions in the company and experience in the
current position are also presented in Table 25. As illustrated, 100 (36.2%) participants work
in maintenance, while 102 (37.0%) work in production. The remaining respondents work in
information technology [30 (10.9%)] and quality assurance [44(15.9%)] departments. The
various positions of participants in the maintenance department are also described in Table 25.
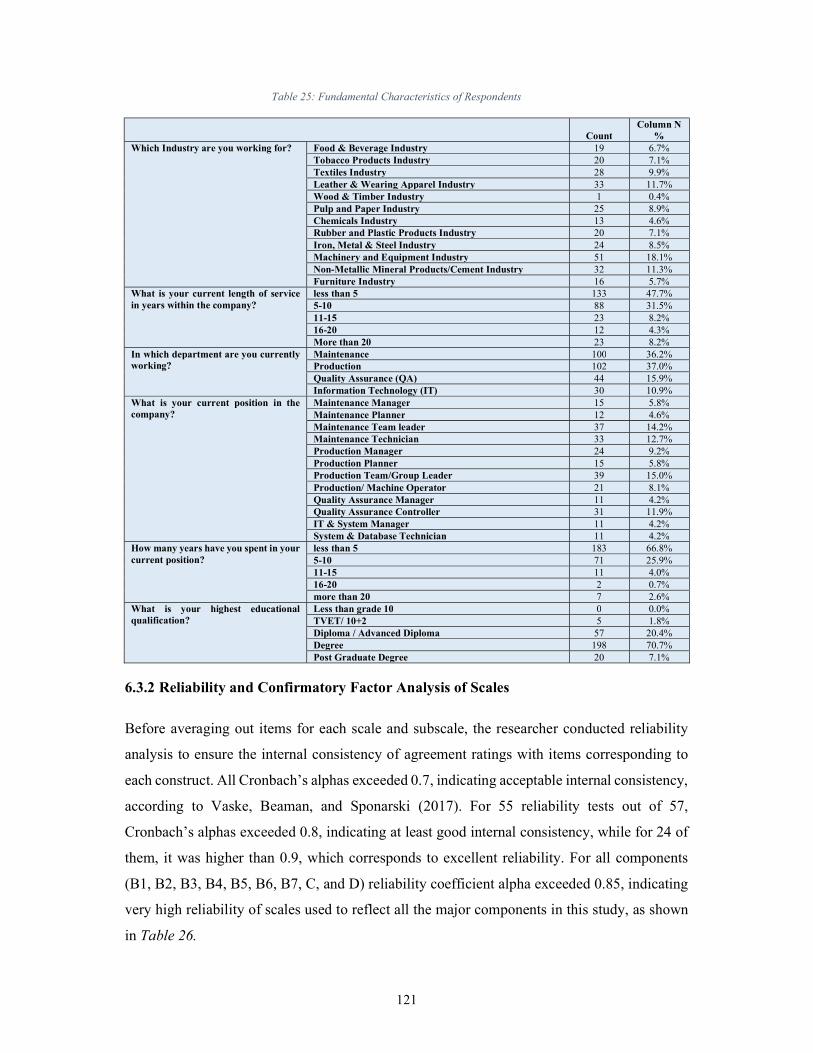
121
Table 25: Fundamental Characteristics of Respondents
Count Column N
% Which Industry are you working for? Food & Beverage Industry 19 6.7%
Tobacco Products Industry 20 7.1% Textiles Industry 28 9.9% Leather & Wearing Apparel Industry 33 11.7% Wood & Timber Industry 1 0.4% Pulp and Paper Industry 25 8.9% Chemicals Industry 13 4.6% Rubber and Plastic Products Industry 20 7.1% Iron, Metal & Steel Industry 24 8.5% Machinery and Equipment Industry 51 18.1% Non-Metallic Mineral Products/Cement Industry 32 11.3% Furniture Industry 16 5.7%
What is your current length of service in years within the company?
less than 5 133 47.7% 5-10 88 31.5% 11-15 23 8.2% 16-20 12 4.3% More than 20 23 8.2%
In which department are you currently working?
Maintenance 100 36.2% Production 102 37.0% Quality Assurance (QA) 44 15.9% Information Technology (IT) 30 10.9%
What is your current position in the company?
Maintenance Manager 15 5.8% Maintenance Planner 12 4.6% Maintenance Team leader 37 14.2% Maintenance Technician 33 12.7% Production Manager 24 9.2% Production Planner 15 5.8% Production Team/Group Leader 39 15.0% Production/ Machine Operator 21 8.1% Quality Assurance Manager 11 4.2% Quality Assurance Controller 31 11.9% IT & System Manager 11 4.2% System & Database Technician 11 4.2%
How many years have you spent in your current position?
less than 5 183 66.8% 5-10 71 25.9% 11-15 11 4.0% 16-20 2 0.7% more than 20 7 2.6%
What is your highest educational qualification?
Less than grade 10 0 0.0% TVET/ 10+2 5 1.8% Diploma / Advanced Diploma 57 20.4% Degree 198 70.7% Post Graduate Degree 20 7.1%
6.3.2 Reliability and Confirmatory Factor Analysis of Scales
Before averaging out items for each scale and subscale, the researcher conducted reliability
analysis to ensure the internal consistency of agreement ratings with items corresponding to
each construct. All Cronbach’s alphas exceeded 0.7, indicating acceptable internal consistency,
according to Vaske, Beaman, and Sponarski (2017). For 55 reliability tests out of 57,
Cronbach’s alphas exceeded 0.8, indicating at least good internal consistency, while for 24 of
them, it was higher than 0.9, which corresponds to excellent reliability. For all components
(B1, B2, B3, B4, B5, B6, B7, C, and D) reliability coefficient alpha exceeded 0.85, indicating
very high reliability of scales used to reflect all the major components in this study, as shown
in Table 26.

122
Table 26: Reliability Test Analysis
Code Scale/subscale Cronbach's alpha
B1 First Component: Organization & management 0.867
B1A Organization 0.868
B1B Policies, programs and procedure 0.909
B1C Supervision & Planning Functions 0.867
B1D Training 0.919
B1E Motivation 0.834
B2 Second Component: Work Identification & responsibilities 0.906
B2A Work flow Procedure 0.808
B2B Relationship Between Departments & Sections 0.841
B2C Planned Maintenance 0.919
B2D Reception, Inspection, and Quality control 0.900
B2E Service Works 0.885
B2F Routine, Recurring Work 0.822
B2G Work Requirements Documentation 0.862
B3 Third Component: Work Planning & Scheduling 0.901
B3A Priority System 0.905
B3B Planning and scheduling of Work 0.949
B3C Alterations and Improvement Work 0.838
B3D Budget Requirements for Equipment management operations 0.862
B3E Budget Execution Plan 0.907
B3F Backlog of Funded Work 0.920
B3G Emergency Work & Shutdown Scheduling 1.000
B4 Fourth Component: Work Flow Control and Performance Measures 0.876
B4A Scheduling & Planning control 0.823
B4B Inventory and Availability 0.897
B4C Maintenance management Process Re-Engineering 0.912
B4D Shop, Spaces, Tools & machineries 0.908
B4E Outsourced Maintenance and Transportation 0.908
B5 Fifth Component: Information Technology & Appraisal 0.916
B5A Management Information System (MIS) 0.933
B5B Measurement of Performance 0.903
B5C Productivity Measurement 0.910
B5D Information System & Historical Records 0.863
B5E Variance Review 0.926
B6 Sixth Component: Spare Part and Materials Management 0.846

123
Code Scale/subscale Cronbach's alpha
B6A Parts & Material Availability 0.877
B6B Storeroom Operation 0.935
B6C Inventory Functions and Costs 0.910
B7 Seventh Component: Facility, Safety and Working Environmental Aspects 0.864
B7A Facility and working condition 0.851
B7B Equipment and Safety 0.900
B7C Maintenance and Environment 0.910
C Proposed Integrated Maintenance Management Strategic Framework Model 0.870
C1 Balance Your Work Load 0.822
C2 Create Organizational Power 0.829
C3 Go Condition-based 0.796
C4 Make Maintenance A core Business Process 0.810
C5 Never Stop Improving 1.000
D Proposed Computerized Maintenance Management System (CMMS) Optimized Model 0.923
D1 Asset Inventory 0.884
D2 Tools supply & Administration 0.901
D3 Consumables control 0.900
D4 Asset maintenance 0.888
D5 Hour accounting 0.840
D6 Spare parts control 0.887
D7 Purchase requisition 0.712
D8 Fleet management 0.806
Moreover, confirmatory factor analysis (as described in Table 27) was used to validate the
measurement models for each block of our questionnaire, including the Critical Success
factors, Proposed Integrated Maintenance Management Strategic Framework Model
(IMMSFM), and Proposed CMMS Optimized Model. Key fit metrics, as described by Brown
(2014), indicate that an adequate measurement model fit of the measurement models used in
this study (all SRMR values<0.08, all CFIs>0.9).

124
Table 27: Confirmatory Factor Analysis
Factor Analysis
Critical Success Factors
Proposed IMMSF Model
Proposed CMMS Optimized Model
Number of items 7 5 8 Standardized Root Mean Square Residual:
0.048 0.038 0.056
Comparative Fit Index (CFI) 0.906 0.960 0.908
Tucker-Lewis Index (TLI) 0.896 0.921 0.872
6.3.3 Critical Success Factors
In order to identify the most common critical success factors (CSFs) that have a positive impact
on implementing CMMS in Ethiopian manufacturing industries, the researcher evaluated the
degree of development of various critical success factors and prioritized them from the most
pronounced in surveyed Ethiopian firms to the least well-developed. Differences in means are
not always statistically significant, which is why in addition to descriptive analysis of scores
for each success factor alone, the researcher assessed the extent to which each factor score is
significantly higher compared to other factors by counting the number of factors compared to
which its score is higher according to the paired samples t-test and its nonparametric analogue
– Wilcoxon sign-rank test, which is both widely used for analyzing differences between
dependent samples. Every significantly positive difference at 5% level gives a component +2
points, at 10% - +1 points, while every significantly negative one gives -2 points (for 5%
significance) and -1 point (for 10% significance). As a result, this study’s measure accounts
for situations when a difference is significant at 10% level, but not at 5% level. For
standardization, the number of points for component j is transformed so that it varies from 0 to
100 using the formula:
Significance scores of higher than 75 indicate that the corresponding factor is significantly
more developed in Ethiopian manufacturing industries compared to the majority of other
factors. 50-75 – significantly higher than some of the factors, 25-50 – significantly lower than
some of the factors, 0-25 – significantly lower than most of the factors. For example, when the
researcher compared seven components to one another, he compared each of them with six
other components, which is why the maximum sum of points was 12, and the minimum was -
12, which corresponds to items that are statistically higher than all others and items that is
100
j
j
Num of points Theoretical minimum number of pointsSignificance score
Theoretical maximum of points Theoretical minimum number of points

125
significantly lower than all others. A component with a score of 8 would get a significance
score of (8-(-12))/ (12-(-12)) *100=83.3%. The researcher also computed significance scores
based on both paired t-tests and paired Wilcoxon sign-rank tests and average them out.
Table 28: Critical Success Factors Sorted by Mean Rating
Components Mean Standard Deviation
%ile 25 Median %ile 75 Minimum Maximum
B3. Third Component: Work Planning & Scheduling
3.61 0.66 3.17 3.63 4.04 1.00 5.00
B6. Sixth Component: Spare Part and Materials Management
3.59 0.74 3.11 3.65 4.05 1.00 5.00
B2. Second Component: Work Identification & responsibilities
3.56 0.66 3.14 3.54 4.00 1.58 5.00
B4. Fourth Component: Work Flow Control and Performance Measures
3.54 0.69 3.09 3.56 4.00 1.00 5.00
B1. First Component: Organization & management
3.51 0.70 2.97 3.55 3.98 1.60 5.00
B7. Seventh Component: Facility, Safety and Working Environmental Aspects
3.49 0.80 2.90 3.47 4.01 1.00 5.00
B5. Fifth Component: Information Technology & Appraisal
3.41 0.75 2.88 3.41 3.96 1.05 5.00
As shown in Table 28, the researcher considered seven components reflecting decision
elements or dimensions (critical success factors). Overall, differences in scores on different
components do not seem to be large, which is why it was especially important to identify
whether any of these differences was significant or not. Average differences between
components are presented in the table below. The largest difference is between component B3
and B5 (B3’s score s 0.2 points higher than that of B5). This is then followed by another higher
average difference between components B5 and B6, and B2 and B5, see Table 29.
Table 29: Section B: Difference Between Mean Rating
Component B1 B2 B3 B4 B5 B6 B7
B1 0.000 -0.053 -0.101 -0.028 0.100 -0.083 0.022
B2 0.053 0.000 -0.048 0.025 0.153 -0.030 0.075
B3 0.101 0.048 0.000 0.072 0.200 0.018 0.123
B4 0.028 -0.025 -0.072 0.000 0.128 -0.055 0.050
B5 -0.100 -0.153 -0.200 -0.128 0.000 -0.182 -0.078
B6 0.083 0.030 -0.018 0.055 0.182 0.000 0.105
B7 -0.022 -0.075 -0.123 -0.050 0.078 -0.105 0.000

126
P-values of differences according to t-tests and Wilcoxon tests are presented in Table 30 and
Table 31, respectively. P-values below 0.05 indicate that the difference is significant at 5%
level, while p-values in the range (0.05, 0.1) indicate significance at the 10% level.
Table 30: Section B: Components P-Values Based on Paired Samples T-Tests
Table 31: Section B: Components P-values Based on Wilcoxon Signed Ranks Tests
Component B1 B2 B3 B4 B5 B6 B7
B1 0.054 0.003 0.244 0.004 0.027 0.655
B2 0.054 0.042 0.591 0.000 0.108 0.058
B3 0.003 0.042 0.009 0.000 0.692 0.001
B4 0.244 0.591 0.009 0.000 0.025 0.129
B5 0.004 0.000 0.000 0.000 0.000 0.010
B6 0.027 0.108 0.692 0.025 0.000 0.001
B7 0.655 0.058 0.001 0.129 0.010 0.001
Overall, the conclusions about the significance of differences based on these two methods are
very similar, which ensures the robustness of this study’s results. Significance scores were
based on the aggregation of information from Table 29, Table 30, and Table 31. Based on the
ranking presented above, the critical success factors that are relatively well-developed
compared to others are B3 (Work Planning & Scheduling) and B2 (Work Identification &
responsibilities), while factor B5 (Information Technology & Appraisal) is by far the least
characteristic of Ethiopian firms. Next, the researcher considered five components reflecting
the readiness of companies to different aspects of the Proposed Integrated Maintenance
Management Strategic Framework Mode, as described in Table 32.
Component B1 B2 B3 B4 B5 B6 B7
B1 0.074 0.003 0.439 0.004 0.069 0.466
B2 0.074 0.060 0.314 0.000 0.398 0.051
B3 0.003 0.060 0.008 0.000 0.808 0.003
B4 0.439 0.314 0.008 0.000 0.097 0.159
B5 0.004 0.000 0.000 0.000 0.000 0.036
B6 0.069 0.398 0.808 0.097 0.000 0.014
B7 0.466 0.051 0.003 0.159 0.036 0.014
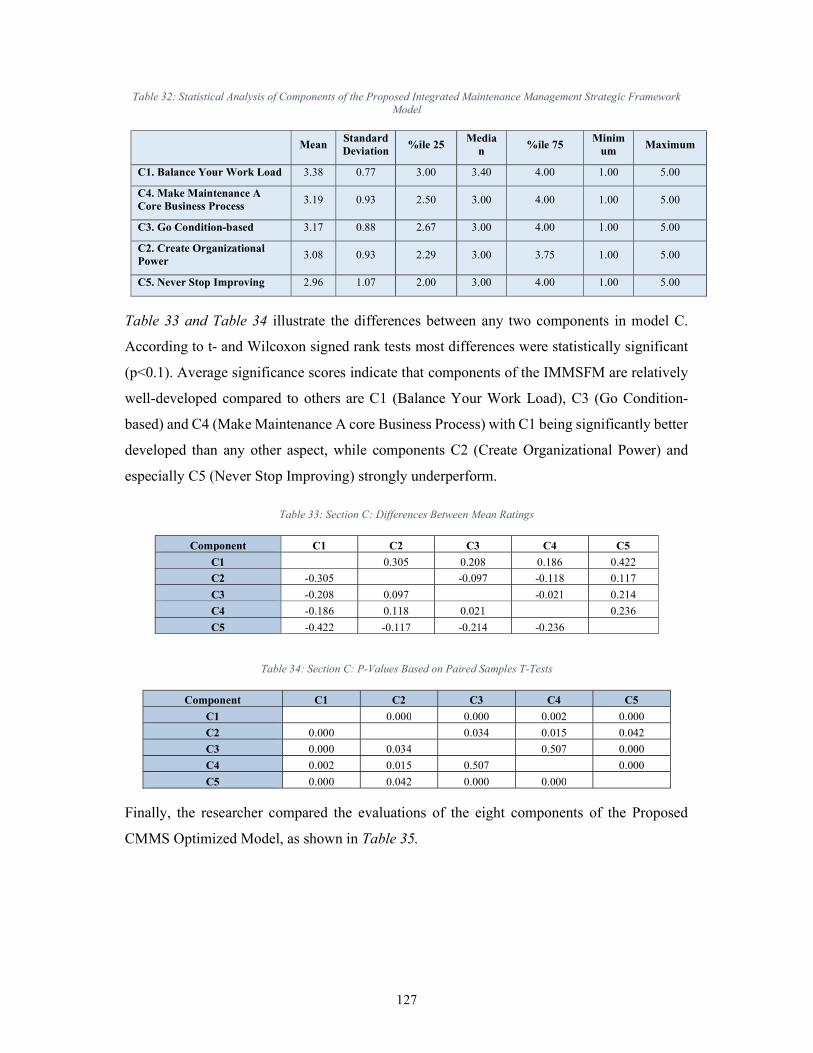
127
Table 32: Statistical Analysis of Components of the Proposed Integrated Maintenance Management Strategic Framework Model
Mean
Standard Deviation
%ile 25 Media
n %ile 75
Minimum
Maximum
C1. Balance Your Work Load 3.38 0.77 3.00 3.40 4.00 1.00 5.00
C4. Make Maintenance A Core Business Process
3.19 0.93 2.50 3.00 4.00 1.00 5.00
C3. Go Condition-based 3.17 0.88 2.67 3.00 4.00 1.00 5.00
C2. Create Organizational Power
3.08 0.93 2.29 3.00 3.75 1.00 5.00
C5. Never Stop Improving 2.96 1.07 2.00 3.00 4.00 1.00 5.00
Table 33 and Table 34 illustrate the differences between any two components in model C.
According to t- and Wilcoxon signed rank tests most differences were statistically significant
(p<0.1). Average significance scores indicate that components of the IMMSFM are relatively
well-developed compared to others are C1 (Balance Your Work Load), C3 (Go Condition-
based) and C4 (Make Maintenance A core Business Process) with C1 being significantly better
developed than any other aspect, while components C2 (Create Organizational Power) and
especially C5 (Never Stop Improving) strongly underperform.
Table 33: Section C: Differences Between Mean Ratings
Component C1 C2 C3 C4 C5
C1 0.305 0.208 0.186 0.422
C2 -0.305 -0.097 -0.118 0.117
C3 -0.208 0.097 -0.021 0.214
C4 -0.186 0.118 0.021 0.236
C5 -0.422 -0.117 -0.214 -0.236
Table 34: Section C: P-Values Based on Paired Samples T-Tests
Component C1 C2 C3 C4 C5
C1 0.000 0.000 0.002 0.000
C2 0.000 0.034 0.015 0.042
C3 0.000 0.034 0.507 0.000
C4 0.002 0.015 0.507 0.000
C5 0.000 0.042 0.000 0.000
Finally, the researcher compared the evaluations of the eight components of the Proposed
CMMS Optimized Model, as shown in Table 35.

128
Table 35: Statistical Analysis of the Components of the Proposed CMMS Optimized Model (Mean)
Mean Standard Deviation
%ile 25 Median %ile 75 Minimum Maximum
D5. Hour accounting 3.49 0.82 3.00 3.67 4.00 1.00 5.00 D7. Purchase requisition
3.48 0.80 3.00 3.50 4.00 1.00 5.00
D6. Spare parts control
3.46 0.79 3.00 3.50 4.00 1.00 5.00
D3. Consumables control
3.40 0.86 3.00 3.50 4.00 1.00 5.00
D8. Fleet management 3.36 0.82 3.00 3.50 4.00 1.00 5.00 D4. Asset maintenance 3.33 0.83 3.00 3.25 4.00 1.00 5.00 D1. Asset Inventory 3.25 1.00 3.00 3.00 4.00 1.00 5.00 D2. Tools supply & Administration
3.24 0.91 2.67 3.33 4.00 1.00 5.00
Even though the point differences among the readiness of various components presented in
Table 35 are not large (the maximum point difference is 0.255), most of them are statistically
significant (as shown in Table 36) and allow ranking the components based on the significance
scores.
Table 36: Section D: Differences Between Mean Ratings
Component D1 D2 D3 D4 D5 D6 D7 D8 D1 0.010 -0.146 -0.085 -0.245 -0.215 -0.230 -0.110 D2 -0.010 -0.157 -0.095 -0.255 -0.225 -0.241 -0.120 D3 0.146 0.157 0.062 -0.099 -0.069 -0.084 0.036 D4 0.085 0.095 -0.062 -0.160 -0.130 -0.146 -0.025 D5 0.245 0.255 0.099 0.160 0.030 0.014 0.135 D6 0.215 0.225 0.069 0.130 -0.030 -0.015 0.105 D7 0.230 0.241 0.084 0.146 -0.014 0.015 0.120 D8 0.110 0.120 -0.036 0.025 -0.135 -0.105 -0.120
Table 37: Section D: P-Values Based on Paired Samples T-Tests
Component D1 D2 D3 D4 D5 D6 D7 D8
D1 0.899 0.005 0.233 0.000 0.000 0.001 0.094
D2 0.899 0.002 0.062 0.000 0.000 0.000 0.025
D3 0.005 0.002 0.097 0.008 0.091 0.064 0.789
D4 0.233 0.062 0.097 0.000 0.002 0.002 0.160
D5 0.000 0.000 0.008 0.000 0.423 0.522 0.005
D6 0.000 0.000 0.091 0.002 0.423 0.862 0.019
D7 0.001 0.000 0.064 0.002 0.522 0.862 0.016
D8 0.094 0.025 0.789 0.160 0.005 0.019 0.016
Average significance scores indicated that components, D5, D6, and D7 have significantly
higher agreement ratings while components D1 and D2 were the most underperforming areas
requiring improvement before implementing the computerized system. Thanks to the fact that
this study’s survey had a reasonable coverage of industries, the researcher had a chance to
compare the readiness of different industries (with a sample size of at least 12) to the

129
implementation of Integrated Maintenance Management Systems. The comparison was made
using a series of independent samples t-tests and presented in a compact form in Table 39 with
the help of SPSS Custom Tables, where values in the same row not sharing the same subscript
were significantly different at p< 0,05 in the two-sided test of equality for column means. Tests
were adjusted for all pairwise comparisons within a row of each innermost sub table using the
Bonferroni correction.
6.3.4 Regression Modelling
In order to identify critical success factors that are strongly associated with the overall score
on components C and D the researcher built 2 regression models with components C and D
scores as dependent variables and components B1-B7 scores as explanatory variables. All
significant coefficients were expected to produce positive signs. Summary of parameter
estimates of the first model of component C score are presented in Table 38.
Table 38: Component C Model Score
Model R R Square Adjusted R Square Std. Error of the Estimate
C ,511a .261 .240 .57571
D ,716a .513 .499 .52271
The model illustrates over 51% of the readiness to adopt the IMSFM (R=0.513). The model is
overall significant (F(7,253)=38.016, p<0.001). The impact of B3, B4, B5, and B7 on the
dependent variable is significant at the 5% level (p<0.05). The model also shows 26% of the
readiness to adopt the Proposed CMMS (R2=0.261). The model is overall significant
(F(7,247)=14.543, p<0.001). The impact of B4 and B7 on the dependent variable is significant
at the 5% and the 10% levels, respectively (p=0.038 and 0.058, respectively).
Adjusted R-square is used in order to add precision and reliability by considering the impact
of additional explanatory variables [ B1-B7] that tend to skew the results of R-squared
measurements. R-square can’t be used alone to conclude whether the model is biased or not
due to R-squared increases every time an independent variable added to the model and when a
model contains an excessive number of independent variables and polynomial terms, it
becomes overly customized to fit the peculiarities and random noise in the sample rather than
reflecting the entire population.

130
Statisticians call this overfitting the model, and it produces deceptively high R-squared values
and a decreased capability for precise predictions. Fortunately, adjusted R-squared (0.240) and
R-squared (0.261) for model C and R-squared (0.513) and R-squared (0.499) for model D
respectively which addresses both the drawbacks of R-square and justify the regression
analysis is précised and reliable.
This approach provides a better basis for judging the improvement in a fit due to adding an
explanatory variable, but it does not have the simple summarizing interpretation that R-square
has. Use of adjusted R-squared for this analysis is used to compare the goodness-of-fit for
regression models (C &D) as dependent variables that contain differing numbers of
independent variables [B1-B7].
None of the regressions showed critical multicollinearity (VIFs<5) and, therefore, standard
errors were not heavily inflated. It is worth mentioning that critical success factors B1-B7
account for a smaller proportion of the Proposed CMMS’s score compared to the
corresponding score for the Proposed IMMSFM, indicating that the potential success of the
computerized system is less reliant on traditional critical success factors.
At the same time, the significant (at a 5% significance level) CSF that impacts both components
C and D measured in this study was component B4 (Workflow Control and Performance
Measures), while component B7 was statistically significant at a 10% or a lower significance
level. These two critical success aspects can thus be considered the most influential
determinants of a company’s readiness to adopt the proposed strategic framework model and
the CMMS optimized model.
6.4 Discussion
6.4.1 Key Inferences Drawn from the Statistical Analyses
As shown in the literatures, including Li, Ai, and Shi (2007); Srinivas and Shruthi (2012);
O’Hanlon (2005); Chan, Lee, and Burnett (2003); and Uysal and Tosun (2012), the application
of CMM to solve a variety of maintenance issues can be applied in manufacturing industry,
across various sectors.
Overall, in this study, Non-Metallic Mineral Products/Cement Industry clearly stood out,
having the highest scores on most components. The following industries were outliers,
including Tobacco Products and Chemicals Industry. The Pulp and Paper Industry had no

131
significantly stronger aspects compared to other industries, too, but the industry is not
dominated by the leaders as much as Tobacco Products, and Chemicals. Machinery and
Equipment Industry and Leather & Wearing Apparel Industry, as well as Textiles industry
outperformed the two outsiders on many aspects and, therefore, can be considered to have a
medium level of readiness for the system’s implementation.
Despite all the differences in key success factors, the number of significant differences was
modest, especially looking at component C (Proposed IMMSFM) as a whole. The non-metallic
products/Cement industry outperformed the furniture, tobacco, and chemical industries. The
tobacco industry is also significantly outperformed by two other industries: Textile and
Machinery/Equipment industries. Differences in component D (Proposed CMMSO ptimized
Model) are even less impressive: Chemicals industry is outperformed by Food & Beverage,
Leather, and Wearing Apparel, Machinery and Equipment industry and Non-Metallic Mineral
products/Cement Industry.
As shown in Table 39, the implementation of a computerized system has its peculiarities and
the readiness to implement it is rather homogeneous across industries with just a few
exceptions1.
Table 39: Comparing Various Industries Based on Critical Success Factors
Which Industry are you working for?
Foo
d &
Bev
erag
e In
dus
try
Tob
acco
Pro
duc
ts
Ind
ustr
y
Tex
tile
s In
dus
try
Lea
ther
& W
eari
ng
App
arel
In
dust
ry
Pu
lp a
nd
Pap
er
Ind
ustr
y
Che
mic
als
Indu
stry
Rub
ber
and
Pla
stic
P
rod
ucts
In
dust
ry
Iron
, Met
al &
Ste
el
Ind
ustr
y
Mac
hine
ry a
nd
Eq
uipm
ent
Indu
stry
Non
-Met
allic
Min
eral
P
rodu
cts/
Cem
ent
Ind
ustr
y
Fu
rnit
ure
Ind
ustr
y B1. First Component: Organization & management
3,24a 3,01a 3,62a,b 3,47a,b 3,37a 3,40a,b 3,62a,b 3,54a,b 3,55a,b 4,02b 3,25a
B2. Second Component: Work Identification & responsibilities
3,48a,b,f 2,94a 3,63b,f 3,74b,c,f 3,35a,b 3,32a,b 3,66b,d,f 3,54a,b,f 3,54b,e 4,02f 3,52a,b,f
B3. Third Component: Work Planning & Scheduling
3,66a,b,c 3,12a 3,72a,b,c 3,75b,c 3,44a,b 3,32a,b,c 3,51a,b,c 3,52a,b,c 3,62a,b,c 4,04c 3,49a,b,c
B4. Fourth Component: Work Flow Control and
3,71a,b 3,00a 3,69b 3,64a,b 3,43a,b 3,20a,b 3,44a,b 3,60a,b 3,50a,b 3,78b,c 3,57a,b
1
Note: In Table 39 Values in the same row and sub-table not sharing the same subscript are significantly different at p< ,05 in the two-sided test of equality for column means. Cells with no subscript are not included in the test. Tests are adjusted for all pairwise comparisons within a row of each innermost sub-table using the Bonferroni correction.

132
Which Industry are you working for?
Foo
d &
Bev
erag
e In
dus
try
Tob
acco
Pro
duc
ts
Ind
ustr
y
Tex
tile
s In
du
stry
Lea
ther
& W
eari
ng
App
arel
Ind
ustr
y
Pul
p an
d P
aper
In
dus
try
Che
mic
als
Ind
ust
ry
Rub
ber
an
d P
last
ic
Pro
duc
ts I
ndu
stry
Iron
, Met
al &
Ste
el
Ind
ustr
y
Mac
hin
ery
and
Equ
ipm
ent
Indu
stry
Non
-Met
alli
c M
iner
al
Pro
duc
ts/C
emen
t In
dus
try
Fur
nitu
re I
ndus
try
Performance Measures B5. Fifth Component: Information Technology & Appraisal
3,14a,b,d 2,79a 3,46a,b,d 3,61b,d 3,39a,b,d 2,92a,b 3,39a,b,d 3,56b,c,d 3,42a,b,d 3,79d 3,47a,b,d
B6. Sixth Component: Spare Part and Materials Management
3,79a 3,25a,b 3,76a 3,63a 3,43a,b 2,79b 3,30a,b 3,68a 3,71a 3,84a 3,69a,b
B7. Seventh Component: Facility, Safety and Working Environmental Aspects
3,61a,b 2,99a 3,51a,b 3,76b 3,47a,b 3,48a,b 3,26a,b 3,68a,b 3,36a,b 3,60a,b 3,55a,b
C1. Balance Your Work Load
3,57a,b 3,02a 3,59a,b 3,40a,b 3,32a,b 2,93a 3,08a 3,38a,b 3,36a,b 3,83b 3,12a,b
C2. Create Organizational Power
2,76a 2,54a 3,12a,b 3,11a,b 2,94a,b 2,48a 2,93a,b 3,34a,b 3,26a,b 3,73b 2,58a
C3. Go Condition-based
3,38a,b 2,56a 3,15a,b 3,25a,b 3,13a,b 2,69a 3,28a,b 3,15a,b 3,18a,b 3,74b 2,87a,b
C4. Make Maintenance A core Business Process
3,50a,b 2,66a 3,35a,b 3,12a,b 3,26a,b 2,79a,b 3,03a,b 3,21a,b 3,37a,b 3,55b 2,67a,b
C5. Never Stop Improving
3,13a,b 2,00a 3,00a,b 3,26b 2,87a,b 2,17a,b 3,05a,b 3,00a,b 3,26b,c 3,23b,d 2,53a,b
D1. Asset Inventory
3,59a 3,03a 3,36a 3,29a 3,00a 2,58a 3,18a 3,04a 3,49a 3,38a 3,31a
D2. Tools supply & Administration
3,31a 2,83a 3,37a 3,39a 3,05a 2,59a 3,14a 3,18a 3,43a 3,55a 3,00a
D3. Consumables control
3,97a 3,06a,b 3,46a,b 3,52a,b 3,29a,b 2,65b 3,14a,b 3,26a,b 3,58a 3,58a 3,37a,b
D4. Asset maintenance
3,42a,b,c 2,86a,b 3,51a,b,c 3,55a,c 3,37a,b,c 2,66b 3,21a,b,c 3,22a,b,c 3,34a,b,c 3,72c 3,22a,b,c
D5. Hour accounting
3,78a 3,18a 3,56a 3,58a 3,37a 2,95a 3,35a 3,52a 3,76a 3,53a 3,36a
D6. Spare parts control
3,72a,c,d 3,27a,c,d 3,44a,c,d 3,73a,b 3,38a,c,d 2,80c 3,28a,c,d 3,41a,c,d 3,66b,d 3,52a,c,d 3,35a,c,d
D7. Purchase requisition
3,47a 3,35a 3,52a 3,71a 3,30a 3,00a 3,11a 3,45a 3,73a 3,53a 3,54a
D8. Fleet management
3,73a 3,03a 3,52a 3,53a 3,39a 2,77a 3,34a 3,34a 3,42a 3,35a 3,20a
C. Proposed Integrated Maintenance Management Strategic Framework Model
3,29a,c,f,g 2,56a,b 3,27c,f,g 3,23a,c,f,g 3,11a,c,f,g 2,61a,c,d 3,08a,c,f,g 3,22a,c,f,g 3,24c,e,f,g 3,62f 2,75b,d,g
D. Proposed Computerized Maintenance Management System (CMMS) Optimized Model
3,69a 3,06a,b 3,45a,b 3,55a 3,27a,b 2,75b 3,22a,b 3,29a,b 3,54a 3,52a 3,26a,b

133
6.4.2 Addressing the Research Questions
After comprehensive data analyses both qualitatively and quantitatively, the research questions
were addressed individually. This section describes how each research question was addressed,
and inferences deduced.
6.4.2.1 RQ1—What are the most common decision elements or dimensions considered for the selection, design, and development of CMMS in Ethiopian manufacturing industries?
According to the statistical research finding, there are seven most common decision elements
or dimensions that can be considered for the selection, design, and development of CMMS in
Ethiopian manufacturing industries. These decisions include work planning and scheduling
(mean rate 3.61); spare parts and material management (mean rate 3.59); work identification
and responsibilities (mean rate 3.56); workflow control and performance measures (mean rate
3.54); organization and management (mean rate 3.51); facility, safety, and working
environment aspects (mean rate 3.49); and information technology and appraisal (mean rate
3.41). These decision elements are summarized in Table 40 and are based on their priority and
importance.
Table 40: Most Important Decisions for CMMS Design, Selection, and Development
Fundamentally, the findings suggest that the Ethiopian manufacturing industries need a CMMS
framework that can be able to handle all the seven decisions in a single model. As revealed in
the literature review, a robust CMMS software is used to schedule, and record operations and
planned/preventive maintenance activities associated with facility equipment (Kans 2008;
Uysal & Tosun, 2012). This framework can prioritize and generate work orders and schedules
for personnel to support ‘decision’ calls and perform planned/periodic equipment maintenance.
Furthermore, upon completion of work order, performance data such as manhours expended,
Mean Standard Deviation
Percentile 25
Median Percentile
75 Minimum Maximum
B3. Third Component: Work Planning & Scheduling
3.61 0.66 3.17 3.63 4.04 1.00 5.00
B6. Sixth Component: Spare Part and Materials Management
3.59 0.74 3.11 3.65 4.05 1.00 5.00
B2. Second Component: Work Identification & responsibilities
3.56 0.66 3.14 3.54 4.00 1.58 5.00
B4. Fourth Component: Work Flow Control and Performance Measures
3.54 0.69 3.09 3.56 4.00 1.00 5.00
B1. First Component: Organization & management
3.51 0.70 2.97 3.55 3.98 1.60 5.00
B7. Seventh Component: Facility, Safety and Working Environmental Aspects
3.49 0.80 2.90 3.47 4.01 1.00 5.00
B5. Fifth Component: Information Technology & Appraisal
3.41 0.75 2.88 3.41 3.96 1.05 5.00

134
supplies/inventory, and date work was performed can typically be loaded into the database for
tracking—which supports future planning, operations, and maintenance. The technology and
appraisal package within a CMMS software should enable access to all the information needed
for detailed planning and scheduling, which includes failure analysis, related documents,
blueprints, equipment, costs, tools, materials, labor, and work plan operations.
6.4.2.2 RQ2— What are the most common critical success factors (CSFs) that have a positive impact on implementing CMMS in Ethiopian manufacturing industries?
As mentioned previously in this research, organizing and improving the maintenance function
in a company is like building a pyramid. Each layer is supported by a larger, more solid one
beneath. Starting in the middle or skipping a layer would do no good, as the strength of the
layer on top depends much on the quality of the layers below. These critical success factors
(CSFs) that have a positive impact on implementing CMMS in Ethiopian manufacturing
industries are generated from the integrated strategic framework model by the researcher.
Therefore, based on the empirical analysis, the research found that the following layer is the
most critical success factors based on their importance and priority: C1 [Balance Your Work
Load (100%)]; C3 [Go Condition-based (62.5%)]; C4 [Make Maintenance A core Business
Process (62.5%)]; C2 [Create Organizational Power (21.88%)]; and C5 [Never Stop Improving
(3.13%)]. To achieve ‘world-class’ maintenance, the Ethiopian manufacturing companies
under this study must be able to achieve various maintenance fundamentals under each layer
[from C1 to C5]. For instance, under C1 [Balance Your Work Load], a company must combine
reactive maintenance, asset inventory, maintenance needs analysis, resource allocation, and
preventive maintenance in the first layer of the maintenance management pyramid (Singh et
al., 2013). In the second layer C2 [Creating Organizational Power], a company must implement
the following maintenance management practices, including workflow control, CMMS, spare
part management, and technical training. C2 provides solid support for the introduction CMMS
if maintenance strategies go beyond preventive maintenance. In other words, maintenance
strategies such as Predictive Maintenance (PDM), Reliability Center Maintenance (RCM), and
Total Productive Maintenance (TPM) cannot be applied without C2 (Ireland & Dale, 2001).
The third layer of the pyramid, C3 [Condition-Based Approach], involves being able to engage
in reliability-centered management, making informed choices about maintenance strategy
based on the accuracy of data and risk analysis. At this level, the company must conduct
operational involvements (which includes activities such as inspecting equipment, filling out

135
requests for maintenance, and more), predictive maintenance, and reliability-centered
maintenance (Ahmad & Kamaruddin, 2012). At the fourth layer of the pyramid, C4 [Make
Maintenance a Core Business process], the company is nearing world-class maintenance
management by becoming more professional and well-equipped. According to Singh et al.,
(2013), this level entails performing total productive maintenance (TPM) and financial
optimization, which enables informed strategic decisions about asset replacement,
amortization, and capital investments. Finally, at layer five, C5 [Continuous Improvement], the
company achieves the ultimate world-class maintenance. This encompasses actively aiming
for and reaching the target levels associated with the key performance indicators (KPIs) (Singh
et al., 2013). This also entails constantly looking for key things that can make the company
more competitive. As such, to get to the fifth layer and achieve world-class maintenance, the
company must aim for continual improvement rather than remain fixated.
6.4.2.3 RQ3—What are the decision elements or dimensions to be considered in formulating the integrated maintenance management strategy for the selection, design, and development of CMMS in order to implement successfully in Ethiopian manufacturing industries?
Based on the findings of this research, the list of decision elements or dimensions to be
considered in formulating the integrated maintenance management strategy include reactive
maintenance; asset inventory; maintenance needs analysis; resource allocation; preventive
maintenance; workflow control; CMMS; spare part management; technical training; operations
involvement; predictive maintenance; reliability-centered maintenance; total productive
maintenance; financial optimization; and world-class maintenance. If one would consider the
building blocks, these fifteen concepts and elements can be put together in five layers to form
a pyramid of increasingly advanced management techniques, resulting ultimately in what is
considered to be World Class Maintenance (as described in Chapter 4, in Table 3 and Figure
9), a set of benchmarks for maintenance as being applied by the world's most successful
companies. However, in order to reach the World Class level, one obviously has to start at the
bottom. A solid foundation is needed to carry the maintenance department step by step towards
ever higher standards of performance.
6.4.2.4 CRQ1— What are the major barriers and obstacles that have negative impact on implementing CMMS in Ethiopian manufacturing industries?
Establishing what exactly are the problems pertaining to the maintenance department is crucial
in selecting a proper CMMS for a company’s specific needs. Excessive downtime and lack of
inventory control are seen as the major problems affecting most industries (Jafarnejad, Soufi,

136
& Bayati, 2014). However, according to the empirical data analysis and findings, significance
scores in this study, which are 0-50 as paired t-test and paired Wilcoxon sign-rank tests, the
various major barriers and obstacles that have a negative impact on implementing CMMS in
Ethiopian manufacturing industries. The Major barriers included B5 [Information Technology
& Appraisal (0%)]; B7 [Facility, Safety and Working Environmental Aspects (37.5%)]; B1
[Organization & management (41.67%)]; and B4 [Work Flow Control and Performance
Measures (45.83%)].
6.4.2.5 CRQ2— What are the factors and parameters to be considered for the development and proposal of CMMS optimization model suitable to the context of Ethiopian manufacturing industries, and how do they impact on these industries?
Lastly, to answer the second central research question, parameters to be considered for the
development and proposal of CMMS optimization model suitable to the context of Ethiopian
manufacturing industries were generated from the integrated maintenance management
strategy called “the maintenance management pyramid’. The importance of this optimization
model to maximize profitability and makes maintenance as a profit center rather than cost. In
addition, there are quality and risk-related variables in the model that affect profitability
optimization. After the empirical analysis of these parameters, the various elements were
identified as the most factors and parameters to be considered for the development and proposal
of CMMS optimization model suitable to the context of Ethiopian manufacturing industries.
This included D5 [Hour accounting (85.71%); D7 [Purchase requisition (82.14%)]; D6 [Spare
parts control (82.14%)]; D3 [Consumables control (51.79%)]; D8 [Fleet management
(39.29%)]; D4 [Asset maintenance (30.36%)]; D1 [Asset Inventory (17.86%)]; and D2 [Tools
supply & Administration (10.71%)].
6.5 Summary
This chapter presented the data analysis process, interpretation of the analyzed data, and its
discussion. The researcher presented this data systematically and chronologically according to
the items of research questions described in Chapter 1. The purpose of this section was laid out
together with all the research questions, three sub-research questions RQ1, RQ2, and RQ3, and
two central research questions CRQ1 and CRQ2. Data were analyzed using various
computational programs, including SPSS, and the results were presented in various descriptive
tables and figures. Pairwise comparisons using t-tests and Wilcoxon signed ranks tests were
also used, and in descriptive and inferential analysis, R-Language was utilized. The researcher

137
used Nvivo Version 12 software for qualitative analysis, and UML 2.5 was applied for CMMS
modeling. After the analysis of data and its interpretation, various inferences were made and
discussed in individual sections. In the end, all the research questions were answered, and
clarifications as well as illustrations were provided. In the next chapter, the proposed CMMS
optimized model for the Ethiopian industrial companies is described.

138
Chapter 7: Recommendation of an Optimized CMMS Model for Ethiopian Manufacturing Industries
7.1 Introduction
After data analysis, interpretation, and discussion of findings, this chapter presents the
proposed CMMS model as a recommendation for Ethiopian manufacturing industries. The
proposed CMMS optimization model is shown to allow strategies to be evaluated and
compared to each other. In addition, this model can reveal optimal strategy in a given situation
(Vilarinho, Lopes, & Oliveira, 2017). However, in modeling, there is always a risk of going
“too deep”: that means, often, the real-world data and applicability of models are not taken into
account, but the focus is rather on pure theoretic deception. However, as the modeling of
CMMS is certainly applied to science and intends to be valuable for practitioners, it should be
directed by real-world applications. Although, mathematical modeling in maintenance faces a
serious problem of the absence of sufficient data related to the problem to be solved (Vilarinho
et al., 2017). The solution to this is to collaborate more with managers and engineers in order
to gather not only quantitative data but also qualitative information on maintenance processes.
Often the qualitative information is even more valuable than quantitative: for example,
determining a deterioration function for a system based on failure rates, and without knowing
how the system works, cannot capture the real deterioration process. However, as noted by
Crawford (2014), that optimization models are much more precise and can offer much more to
maintenance decision making than “purely qualitative” approaches such as RCM and TPM,
yet at the cost of increased complexity. Problem structuring and sharing with others, well-
organized data collection and analysis, development of models with the problem owners, and
application of information technology are necessities for taking advantage of optimization
models. Also, the integration of optimization and qualitative techniques should be made
(Vilarinho et al., 2017). The findings of this study as highlighted previously in Chapter Six
were used to formulate the recommended CMMS framework. As such, all the fundamentals of
this recommended framework for the Ethiopian industrial companies are described in the
subsequent sections, from modeling the framework to simulating and testing.
7.2 Modeling and Optimization of CMMS Model
In Ethiopia, large and medium manufacturing industries administer a significant private and
public investment in their production plants, equipment, a fleet of vehicles, trucks, and other

139
machineries. These industries are committed to managing this investment efficiently and wish
to acquire a reliable and fully integrated Maintenance Management Systems (software
package) to support and enhance the management of their assets (Haile, Srour, & Vivarelli,
2017). According to Lopes et al., (2016), a CMMS should consist of integrated modules for
equipment supply and administration (including cost chargebacks), maintenance, consumables,
and spare parts control and provide fleet-level functionality with regard to equipment
utilization and life-cycle cost analysis.
The system must be secure, maintainable, flexible, scalable, and user-friendly. The software
package should have a minimum of specific functionalities, as defined below, and flexible
reporting features. Correspondingly, Rastegari and Mobin (2016) agree that a CMMS program
should produce accurate detail- and summary reports in real-time as well as a periodical
overview, which can be converted into statistics, modified and exported in different formats
like .pdf and .csv as needed, used for decision-making and saved for future reference and
further analysis.
7.3 Reasons for CMMS Optimization in Ethiopian Context
Maintenance management is frequently associated with a wide range of difficulties. In order to
examine the difficulty in managing the function, the researcher attempted to identify various
reasons applicable to the Ethiopian context. Firstly, there is a lack of maintenance management
models in Ethiopian industrial companies. Maintenance in this context is somewhat “under-
developed” in Ethiopia (McKone & Schroeder, 2001).
Secondly, as noted by Reason and Hobbs (2017), there is a wide diversification in the
maintenance problems. Maintenance is composed of a set of activities for which it is very
difficult to find procedures and information support systems in one place to ease the
improvement process. Normally, there is a very wide diversification in the problems that
maintenance encounters, sometimes a very high level of variety in the technology used to
manufacture the product. Lack of plant/process knowledge and data is also a reason that
necessitates CMMS optimization in the Ethiopian manufacturing context. Managers,
supervisors, and operators typically find that the lack of plant and process knowledge is the
main constraint, followed by the lack of historical data, to implement suitable maintenance
policies (Lin & Su, 2013). Lack of time or poor time management to complete the analysis
required has also been viewed as a reason behind the lack of CMMS implementation. Many

140
managers indicate how they do not have the required time to carry out suitable maintenance
problems analysis (Lin & Su 2013). Day to day actions and decision-making activities distract
them from these fundamental activities to improve maintenance. Lack of top management
support, as described by Jonsson (2000), is also one of the biggest challenges in CMMS
optimization and implementation, especially in firms with no adequate training on the
programs.
Lack of leadership to foster maintenance improvement programs, fear of an increase in
production disruptions, etc., are other common causes of maintenance underdevelopment in
organizations. As in the case of leadership and management, the implementation of advanced
manufacturing technologies has also been a great challenge for personnel with a lack of skills
in this area (Barberá et al., 2012). Barberá et al., (2012) note that during the last two decades,
as a consequence of the implementation of advanced manufacturing technologies and just-in-
time production systems, the nature of the production environment has changed. This has
allowed many companies to manufacture products massively in a customized and highly
efficient way. However, the increase in automation and the reduction in buffers of inventory in
the plants have clearly put more pressure on the maintenance system, because disruption to
production flows can quickly become costly by rapidly disrupting a large portion of the
operation.
In highly automated plants, the limitations of computer controls, the integrated nature of the
equipment, and the increased knowledge requirements make it more difficult to diagnose and
solve equipment problems (Barberá et al., 2012). This makes maintenance crucially relevant
to operations management in order to stay productive and profitable. It has been found that
when human intervention in these highly automated environments is required, the problems
are normally complex and difficult to solve (Reason & Hobbs, 2017).
When this occurs, new or unfamiliar problems often arise. Moreover, urgent safety and
environmental factors have also been at the center of maintenance operations in recent years.
In addition to process and technology-related issues mentioned above, new and more urgent
safety and environmental factors, as described by Weber et al., (2012), such as emerging
regulations, put pressure on a maintenance manager and add complexity to this function.

141
7.4 Principles of Modelling and Optimization of the Proposed CMMS Model
As the findings of this study suggest, the most common decision elements or dimensions
considered for the modeling of CMMS in the Ethiopian manufacturing industry context include
(i) work planning and scheduling; (ii) spare part and materials management; (iii) work
identification and responsibilities; (iv) workflow control and performance measures; (v)
organization and management; (vi) facility, safety, and working environment aspects; and (vii)
information and technology appraisal.
As the results of this study indicate, the Ethiopian manufacturing industries require a CMMS
framework that can be able to incorporate all these seven essential components for maintenance
management. Such essential features have previously been recommended by scholars such as
Kans (2008) and Uysal and Tosun (2012) and will therefore play a fundamental role in this
study’s recommended CMMS framework. Furthermore, this study highlights the decision
elements that can be considered integral in the integrated maintenance management strategy
for the selection, design, and development of CMMS to implement it efficiently in Ethiopian
manufacturing industries. Such elements as identified in this study’s results, and implemented
in the recommended CMMS framework for Ethiopian industries include reactive maintenance;
asset inventory; maintenance needs analysis; resource allocation; preventive maintenance;
workflow control; CMMS; spare part management; technical training; operations involvement;
predictive maintenance; reliability-centered maintenance; total productive maintenance;
financial optimization; and world-class maintenance.
These elements, along with the success factors identified in the conceptual framework in
Chapter 4, play a vital role in the formulation of this recommended CMMS framework for
Ethiopian industries. According to Ding and Kamaruddin (2015) maintenance optimization
models cover four aspects: (1) the description of a technical system, how it functions and what
is its importance; (2) how the system deteriorates over time and what the consequences of this
deterioration are to other system components; (3) a description of the available information
regarding the system and open possibilities of actions for management; and (4) objective
functions of the operators in the model and an optimization technique which helps in finding
the best balance. Every maintenance model incorporates prediction or extrapolation of future
performance of a system, whether it is deterministic or probabilistic.

142
Table 41: Optimization Variables
Optimization variables
Description
Profitability
Maintenance influences the productivity and profitability of the manufacturing equipment. For example, Al-Najjar and Alsyouf (2003) showed that maintenance is actually a profit-generating function, not a mere cost center. In addition to the view that maintenance can increase the profitability of equipment owners, it is also interesting to analyze which decisions increase the profitability of the maintainers of the equipment, if these are separate organizational units. Already at this point, before introducing the AB model made for this study, it is argued that profitability should be the focus number one in optimizing maintenance tasks. Yet, this seems not to be the case, as optimization of other variables has been conducted way more than the optimization of profitability.
Total costs
Part of the maintenance strategy is, of course, to either minimize or optimize maintenance costs. Maintenance includes costs of direct labour, materials, fuel power, equipment and purchased services (González Bosch & Enríquez 2005). If maintenance costs are broken down to pieces, we can identify three typical types of costs: costs of regular planned, unplanned and irregular (for refurbishments) maintenance. Typically, costs of regular planned maintenance (PM) are way lower than unplanned (CM) costs (González Bosch & Enríquez 2005). However, the downtime cost of equipment due to maintenance tasks should also be taken into account. Thus, if the total costs of maintenance are the optimization target in maintenance strategy, then the goal is to find the optimal level of maintenance service, which minimizes total costs of maintenance tasks and equipment downtime.
Reliability of equipment
In the maintenance management context, reliability means the predictable and manageable performance of the system. In RCM, the goal is to maximize system reliability. In other words, the goal is to balance the costs and benefits of maintenance (Gabbar et al., 2003). In theory, balancing is possible when the assumption that the reliability of equipment is a function of the design and the build quality holds true.
Risks of machine failures
Taking the probable risks of machine failures into account when optimizing maintenance strategy means: first, the possible risks have to be identified, their probabilities have to be estimated, and the hazard level of the consequences has to be reviewed. Then, the maintenance activities have to be planned so that the risks are optimized (risk levels are acceptable) in relation to maintenance costs. Either the maintenance activities have to be done more frequently, or the probability of machine failures has to be reduced (Karuppuswamy, Sundararaj & Elangovan 2006)
Quality in production
insist on taking product quality into account also when optimizing maintenance services and costs. In general, equipment that is not maintained properly experiences speed losses and / or lack of precision, which results in defects in products and runs manufacturing processes out of control. This leads to increased production costs and lower profitability. The role of maintenance is, therefore, to control production quality as well.
Spare part inventory levels
There are a few unique aspects of managing maintenance inventories compared to traditional ones. These are: (1) maintenance policies dictate the need for inventories; (2) reliability information is generally not available to the degree needed for the prediction of failure times; (3) part failures are often dependent on each other; (4) demand for parts is sometimes met through cannibalization of other parts or units; (5) costs of being out of spare parts generally include quality reduction and lost production, and maybe risks to personnel; (6) machine obsolescence reduces the need for spare parts and increases the need for machine replacements; and (7) components of the equipment are more likely to be stocked than complete units, if the major unit of equipment is expensive, and repair may be preferred to part replacements (Gopalakrishnan & Banerji 2013).
Scheduling of maintenance activities
There are often coordination problems between production and maintenance job processing. A machine may be idle, yet production jobs are waiting, or a machine may not be broken, but it is still waiting for maintenance personnel to come conduct PM (Garg & Deshmukh 2006). This leads to increased downtime of equipment and wasted resources. An optimized job schedule could increase the uptime of equipment by determining when to perform maintenance activities and when to process each job.
Uncertainty of the future performance is always present in real-life situations, at least to some
degree, which means a probabilistic approach to modeling is necessary. Frangopol and
Bocchini (2012) argue that mathematical and probability-based maintenance models are

143
complex, but they usually provide the most accurate results in forecasting and optimizing
maintenance strategies. There are actually many optimization models that study optimal
maintenance strategies on an infinite time span. This is the case basically because it is
theoretically easier to study optimal strategies on infinite rather than finite time span (Reason
& Hobbs, 2017). However, infinite operating time is impossible, and thus, optimization models
should take into account the age of equipment. (Khatab, Ait-Kadi, & Rezg, 2014). In this study,
the optimal CMMS strategy is defined to be the one that maximizes profitability. In addition,
there are quality and risk-related variables in the model that affect profitability optimization
and are described in Table 41.
7.5 Modeling the Optimized CMMS Model
In order to determine the parameters to be considered for the development and proposal of the
new CMMS optimization model, which is already based on the integrated maintenance
management strategic framework requirements and decisions, the researcher followed the
relationship between organizational structure and the implementation of IT system (Cato &
Mobley, 2001) in order to model the optimized CMMS for the Ethiopian Manufacturing
Industries.
Generally, as illustrated in this research, the modeling procedures justify and support the
rationale behind the successful implementation of a CMMS software. Essentially, for this to
happen, the company should have a strategic maintenance framework [such as the one
demonstrated by the researcher in this study] as a company policy before selecting and/or
developing any maintenance system. If a CMMS is selected from the existing software in the
market, it should possess various parameters and should coincide with the fundamental
maintenance factors depending on the company. However, if the maintenance department
decides on developing the CMMS software [as proposed in this research], the proposed model
must pass through three essential stages before implementation, including the use-cases model,
static structure model, and component diagram model. All these models must produce the same
results, since a single difference translates to errors or ineffectiveness in implementation.
The Use Cases describes the top-level actors’ relationship with the organization. In software
development, a use-case is a dynamic diagram that models the functionality of a proposed
system based on actors and use cases (Linzhang et al., 2004). In other words, these are set of
actions, functions, and services that a particular system needs in order to perform optimally

144
(see, Figure 28). In developing the CMMS framework for Ethiopian manufacturing industries,
the use cases diagrams were important for visualizing the functional requirements of the
proposed system and they greatly helped in design choices and developmental priorities. This
was also vital in the identification of internal and external factors that may have influenced the
system and any parameter that was to be taken under consideration.
Figure 28: Proposed CMMS Optimized Model Use-Cases (Constructed by the Researcher)
On the other hand, the Static Structure, like an organizational structure, describes the top-level
entity relationships. A use static diagram in this research, (see, Figure 29), shows the static
structure of the proposed CMMS model; that is, the elements that exist, the internal structures
of these elements, and the relationship with one another. In this diagram, a number of classes
are identified and grouped together in a class diagram, this then aids in determining the static
relationships between various elements and attributes (Rountev, Volgin, & Reddoch, 2005). In
this study, the static structure represents, among other things, the procedural workflow
[showing how to generate, request, evaluate, perfume, approve] and submit for work
completion after approval.

145
Figure 29: Proposed CMMS Model Static Structure (Constructed by the Researcher)
Lastly, the Component Diagram, in this study, shows how the optimized CMMS software
model will be implemented and synchronized in each company at a minimum level. Unlike the
use-cases and static diagrams, the component diagram does not describe the functionalities of
the system in question but rather the components used to make those functionalities. From this
perspective, the component diagram in this study was used by the researcher to visualize the
physical components of the proposed CMMS model (see Figure 30). It was also used to
describe the organization and relationship of the components used in this development as well
as construct the executables by using forward and reverse engineering. It was used to describe

146
how the software can be managed from the IT infrastructure whether through the internet or
Intranet or from single or multiple computers.
Figure 30: Component Diagram of the New Proposed Optimized CMMS Model (Constructed by the Reasercher)
7.6 New Optimized CMMS Parameters
The researcher now expands on what he considers to be the essential functionality of the new
CMMS functionality parameters. The new CMMS provides functionality that is normally
grouped into 8 (eight) subsystems or modules for specific activity sets. The complete list of
these activities as shown in Figure 30 are: (i) to have an effective and efficient system for
Equipment Inventory, including coding and classification and the recording of essential
equipment unit data; the inventory must also provide access to technical documentation. (ii) to
have an effective and efficient system for Equipment Supply and Administration, which must

147
be capable of processing equipment requests, allocating, scheduling, and dispatching
equipment units and their crew towards construction projects, as well as producing chargeback
invoices. (iii) to have an effective and efficient system for Consumables Control, which must
handle the requesting, approving, and issuing of fuel, oil, and lubricants, as well as the on-
charging of their costs to the equipment user. (iv) to have an effective and efficient system for
Equipment Maintenance, which must be capable of processing work orders that are initiated
by service requests (repairs) and maintenance models (scheduled services); the system must
handle the routing and monitoring of work orders over different workshops and ensure the
timely release of equipment for maintenance by full integration with the Equipment Supply
Administration. (v) to have an effective and efficient system for Hour Accounting, which
keeps track of the workload and productivity of maintenance technicians, hours worked must
be allocated via work orders to equipment units so as to calculate the labor component of
maintenance costs. (vi) to have an effective and efficient system for Spare Parts Control,
which must handle the stock management and inventory of spare parts in different warehouses,
as well as the requesting, to approve and issuing of spare parts, including the registration of
their use in/on particular equipment units so as to calculate the materials component of
maintenance costs.
(vii) to have an effective and efficient system for Purchase Requisition for the direct
procurement of technical parts, materials, and services, follow up on their status; the system
must maintain accurate information about suppliers and prices. (viii) to have an effective and
efficient system for Fleet Management, which calculates accurate performance metrics on the
basis of equipment utilization (uptime, downtime and idle time) and life cycle costs (fixed-,
operating- and maintenance costs) and aging of equipment classes and units; the fleet metrics
must provide all information necessary for the definition of chargeback rates and decisions
about equipment retirement/disposal and replacement.
7.7 Functionalities of the Proposed Optimized CMMS Model
The system should produce all the necessary pre-formatted forms to collect and transfer
information, showing all relevant available (reference) data. These include dates, names,
descriptions, statuses, ratings, codes, and record numbers. The forms must be available in
English, Amharic language (national language) and or any other local language. The system
must be capable of transferring Gregorian calendar dates into the Ethiopian calendar and vice
versa. All forms must be printable on any size paper by the standard printer and margin settings

148
and bear the company logo and any other information of the company. Forms and formats
should establish an adequate approval chain by collecting the signatures of authorized
functionaries; they must be named by (at least) position title and, where possible, by a person.
It is imperative that all forms and formats meet standards for internal control, record keeping,
and accounting, ensuring appropriate segregation of duties and generally accepted standards
for administrative accountability.
Forms and formats printed, processed, and archived must constitute a reliable audit trail that
meets minimum requirements for internal/external auditing. According to Labib (2004), the
system should properly run in all Windows platforms (Windows XP service pack three and
above, Server 2003 and above, including Vista, Server 2008, and Windows 7). It must be
compatible with all other standard applications (Office 2007 SP2 and above). The system
should use features of the Vista LIP Amharic language interface pack. Batch data transfer must
be possible in comma-separated data formats. The software must be compatible with the future
application of GPS tracking software and barcode/RFID solutions for spare parts management.
The Database engine and programming language (front end) of the optimized CMMS proposed
by the researcher are MS SQL Server 2008 and VB.Net or any equivalent alternatives with
proven similar capacity; alternatives should not require any additional licenses, and their costs
should not exceed that of a genuine SQL version 2008 R2 Enterprise with 10 CALs (client
access licenses).
Adequate data types and storage must be programmed for bi-lingual functionality (English and
Amharic and/or any local language), and also redundancy must be included for GPS- and
barcode data. The Networking requirement proposed by the researcher for the new optimized
CMMS software should run in a LAN/VLAN environment and must be capable of being
consulted by remote access (TCP/IP) through a secure interface. Future access by
mobile/handheld devices must also be possible. The Documentation requirement of the
proposed CMMS software should have well-prepared, descriptive, and user-friendly manuals
for end-users and system administrators. The database structure and all scripts must be made
available with properly documented Developer’s Notes, version control, and history
descriptions and a complete bugs/issues log report, as shown in Table 42.

149
Table 42: Detail optimized CMMS Model Functionalities as Described by Researcher
SN Module / functionality Ref Requirements
1 Equipment inventory
Functionality 1.01 define and specify equipment classes on the basis of systematic categories
1.02 define class attributes (utilization and consumption targets, maintenance intervals and condition parameters) that are inherited by all members of the class
1.03 register equipment units and all their details under the appropriate class
1.04 create a library of technical documentation by class and unit
1.05 record and update mileage and/or engine hours by date and unit
1.06 record the measured values of condition parameters by date and unit
1.07 view the up-to-date equipment unit data, including maintenance alerts and triggers for condition-based predictive maintenance
1.08 view the equipment unit library and bookmark relevant pages by user
Reporting features 1.09 produce equipment overviews by category and class
1.10 produce overviews of equipment allocations by class and unit
2 Equipment supply and administration
Functionality 2.01 define and specify clients and construction projects with relevant details including budgets and accounts, locations and durations
2.02 define and specify tasks under projects, including the particulars of supervisors
2.03 record equipment requests by equipment type with reference to tasks
2.04 allocate equipment units to tasks according to equipment requests
2.05 view equipment allocations and availability by list and graph (calendar scheduling or Gantt-type charts) including scheduled maintenance (see 4.07)
2.06 route equipment requests to requisitions for equipment rental
2.07 monitor and follow up equipment rental agreements
2.08 create response notices in reply to equipment requests
2.09 transfer equipment units (dispatch and return) and create the necessary documentation for approval, release and handover
2.10 create equipment utilization sheets and daily checklists related to (and for the duration of) equipment allocations
2.11 create vouchers for fuel (and other consumables) in strict relation to equipment allocations (tasks) and calibrated by average consumption

150
SN Module / functionality Ref Requirements
2.12 process transfer notes, utilization sheets and fuel vouchers when they are signed and returned, maintaining full reference to equipment unit and task
2.13 create charge back invoices on the basis of equipment allocation and consumption of fuel, oil and lubricants
Reporting features 2.14 produce overviews of equipment requests and allocations by client, project and status (open, allocated, dispatched, returned)
2.15 produce overviews for equipment dispatch and return/release
2.16 produce schedules of equipment allocation (future) and utilization (past)
3 Consumables control
Functionality 3.01 define and specify classes of consumables (fuels, oils, lubricants and any other relevant types)
3.02 register consumable stocks under the appropriate classes and in a variety of stock locations, including tanker trucks and filling stations
3.03 create delivery sheets for distributors
3.04 record stock transactions with reference to fuel/FOL vouchers
3.05 reconcile delivery sheets with the intake lines of fuel/FOL vouchers
3.06 enter/update stock balances on the basis of measurement and random checks
3.07 reconcile stock balance with transactions in/out
3.08 view stock balance by stock location/batch and by consumable class
3.09 calculate average consumption by consumable class and trigger the requisition of replenishment on the basis of minimum stock levels
Reporting features 3.10 produce up-to-date stock reports (balance) at any time
3.11 produce transaction overviews (in/out) by consumable and class
3.12 produce counting sheets for inventory and stock checks
3.13 produce consumption overviews per equipment unit and client/project/task
4 Equipment maintenance
Functionality 4.01 define standard maintenance routines, including work instructions/checklists , estimated work hours and parts needed (if any and known in advance)
4.02 define maintenance models consisting of routines to be performed by time schedule, interval (mileage/hours) or measurement (condition parameters)
4.03 automatically create maintenance jobs for all equipment units on the basis of maintenance models that are due; timely and in advance
4.04 record service requests with detailed description of the service/failure to be attended, the

151
SN Module / functionality Ref Requirements
equipment unit involved and the particulars of the requestor
4.05 create work orders on the basis of service requests entered and the maintenance jobs generated by the system
4.06 create work orders for any other jobs related to maintenance
4.07 view equipment allocations and availability by list and graph (calendar scheduling or Gantt-type charts) including scheduled maintenance (see 2.05)
4.08 allocate and schedule/prioritize work orders (planned completion date) towards different workshops or technical disciplines
4.09 assign work orders to technicians, print them together with associated check lists and spare parts vouchers/request forms; confirm status (on hand)
4.10 assign work orders to external parties (workshops) when necessary and generate purchase requisitions for the services requested
4.11 automatically generate requests for the allocation/release of equipment units under maintenance/repair when work orders are scheduled
4.12 automatically generate spare parts reservations for maintenance jobs due
4.13 process and close work orders completed and enter feedback, hours worked and spare parts used by confirming stock transactions posted (see 6.09)
4.14 generate follow-up or sequential orders for time-intensive works and/or multiple workshops/disciplines while maintaining coherence/reference
4.15 re-schedule and/or reallocate work orders, lifting/suspending equipment allocations and spare parts reservations accordingly
Reporting features 4.16 produce up-to-date overviews of work orders on hand by workshop/discipline and by a technician, including planned completion dates
4.17 produce overviews of work orders completed, including schedule compliance (late/on time) by workshop/discipline and by a technician
4.18 produce overviews of work orders planned, equipment availability (allocation status), and workload by workshop/discipline and technician
4.19 produce overviews of work orders by order type (breakdown, scheduled maintenance, predictive maintenance) and by equipment unit
5 Hour accounting
Functionality 5.01 create week-based hour accounts for technicians, including work factor, working days and shift rotations, leave entitlements
5.02 create and print daily time sheets for technicians
5.03 automatically book hours worked on work orders into the appropriate account when work orders are closed (see 4.13)
5.04 book any other hour categories (leave, break/idle and ad hoc) into the appropriate account

152
SN Module / functionality Ref Requirements
5.05 view leave entitlements and balances per technician
5.06 process leave requests, sick leave, recovery and time-for-time
5.07 close the work week and calculate statistics per technician
5.08 close the month and calculate overtime claims per technician
Reporting features 5.09 produce overviews of hours booked by category and technician
5.10 produce monthly overtime reports
5.11 produce reports with productivity and sick leave/absence statistics
6 Spare parts control
Functionality 6.01 define and specify spare parts classes, groups and subgroups in relation to the equipment classification and their functional elements
6.02 define and specify warehouses, stores, store sections and part locations (bins)
6.03 register spare parts stocks with all their details (units, supplier(s), prices, item codes, budgets/accounts etc) under subgroup and in part location(s)
6.04 keep the balance (quantity), min/max level, unit price (moving average) and average turnover/consumption of every registered spare part
6.05 search for spare parts, view their up-to-date balance by user-friendly search protocols and strategies (comprehensive and conclusive), also by remote
6.06 record stock transactions (out) with reference to requisitions, which in turn refer to work orders; create unique goods issue notes
6.07 record stock transactions (in) with reference to purchase receptions; create unique goods received notes (see 7.02)
6.08 record stock movements between parts locations
6.09 trace back (and post forward) stock transactions to equipment units to allocate material costs and confirm use in the maintenance administration (see 4.13)
6.10 make parts reservations for maintenance work orders due
6.11 automatically generate replenishment requisitions on the basis of minimum and maximum stock levels and average turnover/consumption
6.12 create stock count sheets for random stock checks and physical inventory
6.13 reconcile stock balances with inventory results, record authorized corrections for accountability and future reference
Reporting features 6.14 produce stock reports (balance and value) by (sub)group and stock location, as well as overall total stock levels, calculate depreciation
6.15 produce transaction overviews by spare part and (sub)group, client/requestor, equipment type and unit, budget

153
SN Module / functionality Ref Requirements
6.16 produce stock reviews for non-, slow, and fast moving items, analyzing stock value and turnover
6.17 produce categorized stock lists with item codes for lookup/reference by technicians and administrators
7 Purchase requisition
Functionality 7.01 register suppliers and their full details including assortment (via 6.03), maintain supplier database with possibility of ranking
7.02 record direct purchase requisitions with reference to work order; record stock replenishment requisitions by spare part (code)
7.03 produce source documents for the Procurement Department to create purchase orders and make the purchase
7.04 view outstanding purchase requisitions and follow/update their status (expected/ promised delivery dates)
7.05 record purchase receptions with reference to requisition; create unique goods received notes
7.06 record purchase costs and update work orders (direct purchase) and stock value/unit price (stock purchase) accordingly
Reporting features 7.07 produce overviews of purchase requisitions by status, showing requestor and/or work order details, supplier and date requested/promised/delivered
7.08 produce categorized supplier lists
8 Fleet management
Functionality 8.01 create consolidated overviews of equipment utilization, showing (scheduled) uptime, actual use/engine hours, downtime, and idle time
8.02 create overviews of equipment life cycle costs (fixed-, operating- and maintenance costs) and revenues (chargebacks)
8.03 view the composition of equipment classes by method of equipment supply (own/ rent/lease), age, status and costs indices
8.04 create overviews of equipment maintenance by class and unit (equipment history card) showing maintenance costs by labor and materials
Reporting features 8.05 produce fleet-level asset inventories (acquisition value, depreciation, current value, salvage value)
8.06 produce overviews of key performance indicators (utilization, fuel/FOL consumption, up/downtime, age/status, costs) per equipment class, type and unit

154
7.8 Simulating and Testing the New Optimized CMMS Model
It is commonly recognized that there is no procedure to verify that the model operates correctly,
realistically (Macchi & Fumagalli, 2013). In this respect, the model is subject to critique,
whether it is structurally realistic. The structural realism was tried to be increased throughout
the modeling process by receiving feedback from the reviewers and supervisor of this thesis
and adjusting the model structure accordingly.
Even in pure technical respect, one cannot be totally sure that the model works correctly in
practice. As the complexity or just the number of features in the model is increased, the
likelihood of bugs in the final code is highly increased (Macchi & Fumagalli, 2013). In practice,
it would take too much time to check every line of the code and verify that those are correct.
Even if this was done and all the technical bugs were corrected, in the end, semantic errors
would still be very likely.
As such, the most practical way to increase confidence that the model works as intended is to
check that the model does not crash while running test simulations and qualitatively analyze
that the test results are believable (Macchi & Fumagalli, 2013). In the case of unrealistic results,
model modification is normally recommended. However, it should also be noted that dynamic
systems are not necessarily predictable, as dynamic phenomena can be totally realistic while
being totally unexpected. For this research, all those involved in the modeling of the proposed
CMMS framework for the Ethiopian manufacturing industries are well-versed with the
technicalities of maintenance management systems. Thus, in the end, the model was considered
to be working as it should be the author, supervisor, and reviewers of this thesis.
7.9 Summary
In this chapter, the theory of maintenance management strategic framework and optimization
of the proposed CMMS model was explained. The concepts of maintenance and maintenance
management systems were reviewed and then used to develop a framework to set the various
functions within the integrated maintenance management strategic systems.
A clear perspective of the three levels of business activities, operational, tactical, and strategic,
was maintained in positioning these functions within the manufacturing industries. This initial
part of the maintenance management process conditions and the success of maintenance in
manufacturing industries determined the effectiveness of the subsequent successful
implementation of the CMMS for better maintenance plans, schedules, controls and

155
improvements. Effectiveness shows how well a department or function meets its goals or
company needs and is often discussed in terms of the quality of the service provided, viewed
from the production planning, design capacity and international standard perspectives. This
chapter also contributed in addressing various research questions as described in the first
chapter of this thesis. The next chapter describes the summary of findings, conclusions,
recommendations, and avenues for future research.

156
Chapter 8: Conclusions, Recommendations, Limitations, and Future Research
8.1 Conclusions
Through an exploratory research design, both qualitatively and quantitatively, the major
findings of this research showed that the most important CSFs for CMMS implementation were
Work Planning & Scheduling and Work Identification & responsibilities. At the same time, the
Ethiopian manufacturing firms lagged in the case of Information Technology & Appraisal.
Also, in the case of readiness of companies to different aspects of the Proposed Integrated
Maintenance Management Strategic Framework, firms underperformed in areas such as Create
Organizational Power and Never Stop Improving while firms show effective performance as
far as Balance Your Work Load is related. Lastly, for the Proposed Computerized Maintenance
Management System (CMMS) Optimized Model, the components such as Asset Inventory and
Tools supply & Administration were most poorly performed while firms showed good
performance for the components such as Hour accounting, Purchase requisition, and Spare
parts control. Overall, it can be concluded as per the findings that Non-Metallic Mineral
Products/Cement Industry clearly stood out, having the highest scores on most components.
To arrive at these conclusions, reliability analysis and confirmatory factor analysis were
conducted to ensure the internal consistency of agreement ratings with items corresponding to
each construct and to validate the measurement models for each block of our questionnaire,
respectively. The study included three main scales and several subscales or components. The
first scale was critical success factors with components such as B1, B2, B3, B4, B5, B6, and
B7. The second scale was the readiness of companies to different aspects of the Integrated
Maintenance Management Strategic Framework Model with components such as C1, C2, C3,
C4, and C5. The last scale was Proposed Computerized Maintenance Management System
(CMMS) Optimized Model with components such as D1, D2, D3, D4, D5, D6, D7, and D8. For
all of these scales, the reliability coefficient alpha exceeded 0.85, signifying very high
reliability. Additionally, confirmatory factor analysis indicated an adequate measurement
model fit for the measurement models used in our study (all CFIs>0.9, all SRMR values<0.08).
To address all the research questions [RQ1, RQ2, RQ3, CRQ1, and CRQ2], the researcher
firstly determined CSF for the successful implementation of CMMS in large and medium scale
manufacturing industries in Ethiopia. The results based on t-tests and Wilcoxon tests showed

157
each CSF score is significantly higher compared to other factors. It was concluded, as per the
results, that the largest difference was between CSF component Work Planning & Scheduling
(B3) and Information Technology & Appraisal (B5). Other than that, the significance of
differences based on t-tests and Wilcoxon tests were very similar, which ensured the strength
of the fndings. Work Planning & Scheduling and Work Identification & responsibilities are
the main characteristic of Ethiopian firms, while Information Technology & Appraisal is their
least characteristic.
Information Technology & Appraisal, along with Facility, Safety, and Working Environmental
Aspects can also be regarded as the major barriers and obstacles that have a negative impact
on implementing CMMS in Ethiopian manufacturing industries. On the other hand, critical
success factors (CSFs) such as Balance Your Work Load, Go Condition-based, and Make
Maintenance A Core Business Process are the main factors that have a positive impact on
implementing CMMS in Ethiopian manufacturing industries. As far as the readiness of
companies to different aspects of the Proposed Integrated Maintenance Management Strategic
Framework is concerned, firms underperform in areas such as Create Organizational Power
and especially Never Stop Improving, while firms show effective performance as far as Balance
Your Work Load is related. The components such as Asset Inventory and Tools supply &
Administration were most poorly performed while firms showed good performance for the
components such as Hour accounting Purchase requisition, and Spare parts control.
Overall, when formulating the integrated maintenance management strategy for selection,
design and development of CMMS, the strategy should be in the form of five layers forming a
pyramid to successfully implement it in Ethiopian manufacturing industries. The first layer
includes Reactive Maintenance; Asset Inventory; Maintenance Needs Analysis; Resource
Allocation, and Preventive Maintenance. The second layer involves Workflow Control;
CMMS, and Technical Training. The third layer features Operations Involvement; Predictive
Maintenance and Reliability Centered Maintenance. The fourth layer incorporates Total
Productive Maintenance and Financial Optimization. The final and fifth layer is World Class
Maintenance. Lastly, the factors and parameters important for the development and proposal
of CMMS optimization model suitable to the context of Ethiopian manufacturing industries
include Hour accounting, Purchase requisition, and Spare parts control.
158
8.2 Recommendations
As far as Information Technology (IT) & appraisal is concerned, the present IT infrastructure
of most Ethiopian Manufacturing Industries is relatively small, since the industries’ do not use
any systems supported by broadband networking and high-end MIS and ERP solutions.
However, it is clear that these industries have embarked on introducing computerized
management information systems for a number of business processes in the coming years. This
process is still at a very early stage, which means that the necessary IT capacity has yet to be
built both in terms of infrastructure (hardware) as well as staffing (network and systems
management). Consequently, the requirements of a system for maintenance and production
planning management should not exceed technical and organizational possibilities that are
available throughout this process, but at the same time, neatly fit into the enterprise's expanding
IT environment.
It is therefore recommended that, for effective information technology & appraisal, the
Ethiopian Manufacturing Industries need to choose a CMMS package that is open source,
ready-to-use, and easy to maintain. Furthermore, the CMMS must consist of self-contained
modules or otherwise be capable of being modified as per the enterprise's interests and
planning. This means that it is recommended that the supplier of the CMMS should be a
specialized company which can deliver on-the-job training and guarantees appropriate after-
sales support for effective IT and appraisal. Additionally, in order to create enhanced
organizational power, it is recommended that Ethiopian Manufacturing Industries need to have
a closer look at the organizational structure surrounding the maintenance process and apply
tools and processes that directly support maintenance, such as spare parts management and
technical administration.
For spare parts management, firms should use forecasting and analysis of consumption data on
a regular basis to rationalize stock and service levels. For technical administration, technical
skills can be enhanced by arranging workshops and training sessions on a regular basis.
Adopting these two tools can contribute to the efficiency of the maintenance effort and increase
organizational power. It is also recommended to make the maintenance activities literally
manageable by adopting measures such as information gathering, the accuracy of data, and
compliance with the schedule. For bringing the culture of never stop improving or world-class
maintenance, it is recommended that Ethiopian Manufacturing Industries should constantly
look for the "little things" that can make the firm more competitive. When such a culture

159
becomes an essential part of a company's way of functioning, the maintenance resources can
be employed to the maximum extent and with full effect. However, before attaining the World
Class level, it is recommended to address the other drawbacks and lags first.
As most of the Ethiopian Manufacturing Industries lag in the effective management of asset
inventory, which is an important component of CMMS, it is recommended to develop fixed
procedures that include documenting, labeling along with the best of breed software solution
sand constantly monitoring and appraising the inventory. It is also suggested to adopt a robust
tracking system as part of the accounting process, which can enable the companies to compute
depreciation, monitor maintenance requirements, and schedule repairs on the fixed assets.
Finally, for the effective tools supply & administration, it is recommended that Ethiopian
Manufacturing Industries should adopt predictive management approach by including the
collection and analysis of data, and developing the capability to explore the whole scope of
operation to locate and resolve significant fundamental issues that may surface in the long-
term. Concerning collecting and analyzing data, manufacturing companies should look out for
failure patterns that can reveal issues that are not clearly visible.
8.3 Study Limitations
Currently, there is no enough literature and previous experience in Ethiopian Manufacturing
industries with Enterprise Resource Programs or with the implementation of CMMS. This is
mainly because CMMS is a relatively new concept and a recent concern among manufacturing
industries and researchers in developing nations like Ethiopia. As such, some of the limitations
that arose in this study are related to the conceptual basis of the research and the limit associated
with the methodological instruments. Since this research was based on an exploratory design
that was supported by a descriptive survey, the researcher lacked solid access for strong,
existing, and tested framework contexts. This gives the research generally weak conceptual
support. Additionally, the study was conducted across the entire Ethiopian geographical
context (cross-cultural). This kind of survey, according to Harzing, Reiche, and Pudelko
(2013), presents researchers with numerous challenges, which ultimately can reduce the
reliability and validity of data collected. To counter this challenge, the researcher used uniform
data collection procedures, which increased response equivalence from all respondents in all
manufacturing industries across all regions.

160
Additionally, the pre-testing of data instruments was done to control problems related to
questionnaire development, thereby minimizing the variance that comes from measurement
errors. Research limitations may also have emanated from the kind of research methods used,
either in the collection of data or its analysis thereof. For example, a survey can sometimes be
culturally-biased based on the region where the study is conducted (Couper & De Leeuw 2003).
To avert or minimize this problem, the researcher avoided culturally-biased questions in the
Linkert-Scale survey, but this may have affected opinions and viewpoints given by different
research participants. Also, some of the methods like the t-test and Willcox test are considered
to be sensitive to the conditions of normality and equality of variance. To reduce the impact of
this limitation, the researcher performed the tests separately and compared them to each other.
Less sensitive statistics were also used, and analysis was made using non-parametric tests.
8.4 Future Research
The future work can consider examining both practically and theoretically a similar model
proposed in this study but do it extensively by involving numerous industries across different
countries. Within the same line of thought, researchers and scholars can also consider exploring
the functionalities of each element in the proposed CMMS separately, outlining the importance
and limitations of each. Future studies can also develop a maintenance management software
tool after prototyping and consider integrating the proposed CMMS framework with various
process improvement systems such as simulation techniques such as Monte Carlo simulation
and Six-Sigma. Also, research can be done on how the value can be increased by interfacing
this proposed CMMS with operational software in procurement, production, HR management
software, and finance. Other future studies should endeavor to inspect the tools needed by the
technical department to make them strong. Only when the maintenance function is properly
empowered to its task it can fully assume its responsibility as a core business process. Lastly,
future work can be conducted on assessing how CMMS can be made more efficient and robust.
This might include evaluating how to make the system process the entire workload of the
technical department, including repairs, preventive maintenance, modifications, and work for
third parties (on-charged); how to interface CMMS with the company's stock management
system, allowing for availability checks, stock reservations, forecasting and eventually stock
mutations and how to integrate the computerized maintenance management system (CMMS)
in a larger MIS environment at any stage, with proper interfaces towards operations,
administration, and finance. Finally, future studies can explore the economic impact of CMMS
for the manufacturing industry in particular, and the local and national economy in general.

161
References
Abdallah, A.B., 2013. The influence of" soft" and" hard" total quality management (TQM) practices on total productive maintenance (TPM) in Jordanian manufacturing companies. International Journal of Business and Management, 8(21), p.1.
Addis, S., Dvivedi, A. and Beshah, B., 2017. Identifying and prioritising operational performance indicators of the Ethiopian leather industry. International Journal of Productivity and Quality Management, 22(3), pp.378-394.
Ahmad, R. and Kamaruddin, S., 2012. An overview of time-based and condition-based maintenance in industrial application. Computers & Industrial Engineering, 63(1), pp.135-149.
Ahuja, I.P.S. and Khamba, J.S., 2008. Strategies and success factors for overcoming challenges in TPM implementation in Indian manufacturing industry. Journal of Quality in Maintenance Engineering, 14(2), pp.123-147.
Al-Najjar, B. and Alsyouf, I., 2003. Selecting the most efficient maintenance approach using fuzzy multiple criteria decisions making. International journal of production economics, 84(1), pp.85-100.
Al-Turki, U., 2011. A framework for strategic planning in maintenance. Journal of Quality in
Maintenance Engineering, 17(2), pp.150-162.
Anderson, R.T. and Neri, L. eds., 2012. Reliability-centered maintenance: management and engineering methods. Springer Science & Business Media.
Apeland, S. and Scarf, P.A., A Fully Subjective Approach to Modeling Inspection Maintenance, European Journal of Operational Research, Vol. 148, No. 2, 2003, pp. 410-425.
Arslankaya, S. and Atay, H., 2015. Maintenance management and lean manufacturing practices in a firm which produces dairy products. Procedia-Social and Behavioral Sciences, 207, pp.214-224.
Azadeh, A. and Abdolhossein Zadeh, S., 2016. An integrated fuzzy analytic hierarchy process and fuzzy multiple-criteria decision-making simulation approach for maintenance policy selection. Simulation, 92(1), pp.3-18.
Azeem, M., Salfi, N.A. and Dogar, A.H., 2012. Usage of NVivo software for qualitative data analysis. Academic Research International, 2(1), pp.262-266.
Barata, J., Soares, C.G., Marseguerra, M. and Zio, E., 2002. Simulating Modeling of Repairable Multi-Component Deteriorating Systems for ‘On Condition’ Maintenance Optimization, Reliability Engineering and System Safety, Vol. 76, No. 3, 256- 264.

162
Barberá, L., Crespo, A., Viveros, P. and Stegmaier, R., 2012. Advanced model for maintenance management in a continuous improvement cycle: integration into the business strategy. International Journal of System Assurance Engineering and Management, 3(1), pp.47- 63.
Bengtsson, M., Olsson, E., Funk, P. and Jackson, M., 2004. Design of condition-based maintenance system—A case study using sound analysis and case-based reasoning. Condition-based Maintenance Systems—An Investigation of Technical Constituents and Organizational Aspects; Malardalen University: Eskilstuna, Sweden, p.57.
Beni, S.S., 2014, January. Implementation of Computerized Maintenance Management System in National Iranian Gas Company and sub-companies. In Proceedings of the 2014 International Conference on Industrial Engineering and Operations Management Bali, Indonesia, January 7-9 2014 (pp. 1181-1186).
Berno, P., 2011. A tool for the integration of FMECA and diagnostic analysis.
Bharadwaj, U.R., Silberschmidt, V.V. and Wintle, J.B., 2012. A risk based approach to asset integrity management. Journal of Quality in Maintenance Engineering, 18(4), pp.417- 431.
Blumberg, B., Cooper, D.R. and Schindler, P.S., 2008. Business research methods (Vol. 2). London: McGraw-Hill Higher Education.
Braglia, M., Carmignani, G., Frosolini, M. and Grassi, A., 2006. AHP-based evaluation of CMMS software. Journal of manufacturing technology management, 17(5), pp.585- 602.
Brace, I., 2018. Questionnaire design: How to plan, structure and write survey material for effective market research. Kogan Page Publishers.
Brown, T.A., 2014. Confirmatory factor analysis for applied research. Guilford Publications.
Callier, F.M. and Desoer, C.A., 2012. Linear system theory. Springer Science & Business Media.
Campbell, J.D. and Jardine, A.K., 2001. Maintenance excellence: optimizing equipment life- cycle decisions. CRC Press.
Campbell, J.D., Jardine, A.K. and McGlynn, J. eds., 2016. Asset management excellence: optimizing equipment life-cycle decisions. CRC Press.
Campbell, J.D. and Reyes-Picknell, J.V., 2015. Uptime: Strategies for excellence in maintenance management. Productivity Press.
Carla Bittencourt Reis, A., Cabral Seixas Costa, A.P. and Teixeira de Almeida, A., 2009. Planning and competitiveness in maintenance management: An exploratory study in manufacturing companies. Journal of Quality in Maintenance Engineering, 15(3), pp.259-270.
Cato, W.W. and Mobley, R.K., 2001. Computer-managed maintenance systems: a step-by-step guide to effective management of maintenance, labor, and inventory. Elsevier.

163
Chan, K.T., Lee, R.H.K. and Burnett, J., 2003. Maintenance practices and energy performance of hotel buildings. Strategic planning for energy and the environment, 23(1), pp.6-28.
Chiang, J.H. and Yuan, J., 2001. Optimal Maintenance Policy for a Markovian System under Periodic Inspection, Reliability Engineering and System Safety, Vol. 71, No. 2, pp. 165-172.
Coetzee, J. L., 2004. Maintenance, Trafford Publishing, Victoria BC. ISBN-13:
9781412023627
Collins, D., 2003. Pretesting survey instruments: an overview of cognitive methods. Quality of
life research, 12(3), pp.229-238.
Couper, M.P. and De Leeuw, E.D., 2003. Nonresponse in cross-cultural and cross-national surveys. Cross-cultural survey methods, pp.157-177.
Crawford, J.K., 2014. Project management maturity model. Auerbach Publications.
Crespo Marquez A, Gupta JND., 2006. Contemporary maintenance management: process, framework and supporting pillars. Omega, 34(3): 313-326.
Creswell, J.W. and Clark, V.L.P., 2017. Designing and conducting mixed methods research. Sage publications.
De Almeida, A.T., Cavalcante, C.A.V., Alencar, M.H., Ferreira, R.J.P., de Almeida-Filho, A.T. and Garcez, T.V., 2015. Preventive maintenance decisions. In Multicriteria and Multiobjective Models for Risk, Reliability and Maintenance Decision Analysis (pp. 215-232). Springer, Cham.
Dey, I., 2003. Qualitative data analysis: A user friendly guide for social scientists. Routledge.
Ding, S.H. and Kamaruddin, S., 2015. Maintenance policy optimization—literature review and directions. The International Journal of Advanced Manufacturing Technology, 76(5- 8), pp.1263-1283.
Durán, O., 2011. Computer-aided maintenance management systems selection based on a fuzzy AHP approach. Advances in Engineering Software, 42(10), pp.821-829.
Eneh, O.C., 2017. Growth and development of sustainable micro, small and medium enterprises sector as a veritable factor for poverty reduction in developing countries. Preface and Acknowledgements, 6(1), p.149.
Gabbar, H.A., Yamashita, H., Suzuki, K. and Shimada, Y., 2003. Computer-aided RCM-based plant maintenance management system. Robotics and Computer-Integrated Manufacturing, 19(5), pp.449-458.
Garcia E, Guyennet H, Lapayre JC, Zerhouni N., 2004. A new industrial cooperative telemaintenance platform. Computers and Industrial Engineering, 46(4): 851-864.

164
Garg, A. and Deshmukh, S.G. (2006), Application and Case Studies Maintenance Management: Literature Review and Directions, Journal of Quality in Maintenance Engineering, 12(3), pp. 205-238.
Getahun, T.D., Gebrehiwot, A., Kebedew, B.G. and Fikru, D., 2018. Manufacturing competitiveness in Ethiopia: developments, challenges and prospects. Research Report 32, Addis Ababa: Ethiopian Development Research Institute.
Goel, H.D., Grievink, J. and Weijnen, M.P.C., 2003. Integrated Optimal Reliable Design, Production, and Maintenance Planning for Multipurpose Process Plants, Computers & Chemical Engineering, Vol. 27, No. 11, pp. 15431555
González Bosch, V. and Tamayo Enríquez, F., 2005. TQM and QFD: exploiting a customer complaint management system. International Journal of Quality & Reliability Management, 22(1), pp.30-37.
Goossens, A.J. and Basten, R.J., 2015. Exploring maintenance policy selection using the Analytic Hierarchy Process; an application for naval ships. Reliability Engineering & System Safety, 142, pp.31-41.
Gopalakrishnan, P. and Banerji, A.K., 2013. Maintenance and spare parts management. PHI Learning Pvt. Ltd..
Gunasekaran, A. and Ngai, E.W., 2004. Information systems in supply chain integration and management. European journal of operational research, 159(2), pp.269-295.
Frangopol, D.M. and Bocchini, P., 2012. Bridge network performance, maintenance and optimization under uncertainty: accomplishments and challenges. Structure and Infrastructure Engineering, 8(4), pp.341-356.
Haile, G., Srour, I. and Vivarelli, M., 2017. Imported technology and manufacturing employment in Ethiopia. Eurasian Business Review, 7(1), pp.1-23.
Harzing, A.W., Reiche, B. and Pudelko, M., 2013. Challenges in international survey research: A review with illustrations and suggested solutions for best practice. European Journal of International Management, 7(1), pp.112-134.
Hemming, R.J. and Davis, D.L., 2003. Eat an Elephant-Implement a CMMS. Maintenance World.
Hietschold, N., Reinhardt, R. and Gurtner, S., 2014. Measuring critical success factors of TQM implementation successfully–a systematic literature review. International Journal of Production Research, 52(21), pp.6254-6272.
Holtz, R. and Campbell, P., 2003. Six Sigma: Its implementation in Ford’s facility management and maintenance functions. Journal of Facilities Management, 2(4), pp.320-329.
Hox, J.J. and Boeije, H.R., 2005. Data collection, primary versus secondary.
Ireland, F. and Dale, B.G., 2001. A study of total productive maintenance implementation. Journal of Quality in Maintenance Engineering, 7(3), pp.183-192.

165
Iung B., 2006. Research and development on E-maintenance: Survey of some recent advantages and directions. In: Proceedings of the 2nd international conference on Maintenance and Facility Management, Sorrento, Italy
Jafarnejad, A., Soufi, M. and Bayati, A., 2014. Prioritizing Critical Barriers of Computerized Maintenance Management System (CMMS) by Fuzzy Multi Attribute Decision Making (F-MADM)(Using LFPP). Kuwait Chapter of Arabian Journal of Business and Management Review, 33(2576), pp.1-17.
Jamkhaneh, H.B., Pool, J.K., Khaksar, S.M.S., Arabzad, S.M. and Kazemi, R.V., 2018. Impacts of computerized maintenance management system and relevant supportive organizational factors on total productive maintenance. Benchmarking: An International Journal.
Jasiulewicz-Kaczmarek, M. (2014). Integrating lean and green paradigms in maintenance management. IFAC Proceedings Volumes, 47(3), 4471-4476.
Jin, X., Siegel, D., Weiss, B.A., Gamel, E., Wang, W., Lee, J. and Ni, J., 2016. The present status and future growth of maintenance in US manufacturing: results from a pilot survey. Manufacturing review, 3.
Jonsson P, (2000) Toward a holistic understanding of disruptions in operations management. Journal of Operations Management, 18:701–718.
Kahsay, G., Osanna, P.H. and Durakbasa, N.M., 2007. Investigation of quality awareness, developments and factors impeding product quality improvement in Ethiopian medium and large scale manufacturing industries.
Kans, M., 2008. “An approach for determining the requirements of computerized maintenance management systems”, Computers in Industry, Vol. 59 No. 1, pp. 32-40.
Karray, M.H., Chebel-Morello, B. and Zerhouni, N., 2012. A formal ontology for industrial maintenance. Applied Ontology, 7(3), pp.269-310.
Karuppuswamy, P., Sundararaj, G. and Elangovan, D., 2006. Application of computerized maintenance management system coupled with risk management techniques for performance improvement of manufacturing systems. International Journal of Business Performance Management, 9(1), pp.7-21.
Kebede, S.G. and Heshmati, A., 2020. Energy Use and Labor Productivity in Ethiopia: The Case of the Manufacturing Industry. Energies, 13(11), p.2714.
Kelly, A., 2006. Strategic maintenance planning (Vol. 1). Elsevier.
Khatab, A., Ait-Kadi, D. and Rezg, N., 2014. Availability optimization for stochastic degrading systems under imperfect preventive maintenance. International Journal of Production Research, 52(14), pp.4132-4141.
Komonen K, (2012) A cost model of industrial maintenance for profitability analysis and benchmarking. International Journal of Production Economics, 79(1):15–31.
Kothari, C.R., 2004. Research methodology: Methods and techniques. New Age International.

166
Kotrlik, J.W.K.J.W. and Higgins, C.C.H.C.C., 2001. Organizational research: Determining appropriate sample size in survey research appropriate sample size in survey research. Information technology, learning, and performance journal, 19(1), p.43.
Kozusko, A.M., 1986. Computerized Plant Maintenance Management Presented at the Institute of Electrical and Electronics Engineers 1985 IEEE Symposium on Nuclear Power Systems Nuclear Science Symposium. IEEE Transactions on Nuclear Science, 33(1), pp.962-965.
Kumar, U., Nissen, A., Schunnesson, H., and Parida, A., (2010). Operational Safety and Maintenance, LTU, Luleå, Sweden.
Labib, A.W., 2004. A decision analysis model for maintenance policy selection using a CMMS. Journal of Quality in Maintenance Engineering, 10(3), 191-202.
Langston, C. and Lauge-Kristensen, R., 2013. Strategic management of built facilities. Routledge.
Leigh, J.M. and Dunnett, S.J., 2016. Use of Petri nets to model the maintenance of wind turbines. Quality and Reliability Engineering International, 32(1), pp.167-180.
Liamputtong, P. and Ezzy, D., 2005. Qualitative research methods (Vol. 2). Melbourne: Oxford university press.
Linzhang, W., Jiesong, Y., Xiaofeng, Y., Jun, H., Xuandong, L. and Guoliang, Z., 2004, November. Generating test cases from UML activity diagram based on gray-box method. In 11th Asia-Pacific software engineering conference (pp. 284-291). IEEE.
Li, Z., Ai, Y. and Shi, H., 2007, June. Optimal maintenance information system of Gezhouba hydro power plant. In 2007 IEEE Power Engineering Society General Meeting (pp. 1- 5). IEEE.
Lopes, I., Senra, P., Vilarinho, S., Sá, V., Teixeira, C., Lopes, J., & Figueiredo, M., 2016. Requirements specification of a computerized maintenance management system–a case study. Procedia CIRP, 52, 268-273.
Lucey, T. and Lucey, T., 2004. Management information systems. Cengage Learning EMEA.
Macchi, M. and Fumagalli, L., 2013. A maintenance maturity assessment method for the manufacturing industry. Journal of Quality in Maintenance Engineering, 19(3), pp.295-315.
Mandal, S. and Tewari, P.C., 2017. A Proposed Framework for Computerized Maintenance Management System for a Power Plant. IUP Journal of Mechanical Engineering, 10(2), p.62.
Marshall, C. and Rossman, G.B., 2014. Designing qualitative research. Sage publications.
Maxwell, J.A., 2012. Qualitative research design: An interactive approach (Vol. 41). Sage publications.

167
MAzurkiewicz, D., 2014. Computer-aided maintenance and reliability management systems for conveyor belts. Eksploatacja i Niezawodność, 16(3).
McKone KE, Schroeder RG, Cua KO, (2001) The impact of Total Productive Maintenance practices on manufacturing performance. Journal of Operations Management, 19(1):39–58.
Mele, C., Pels, J. and Polese, F., 2010. A brief review of systems theories and their managerial applications. Service Science, 2(1-2), pp.126-135.
Milis, K. and Mercken, R., 2002. Success factors regarding the implementation of ICT investment projects. International Journal of Production Economics, 80(1), pp.105- 117.
Mkandawire, B.O.B., Ijumba, N. and Saha, A., 2015. Transformer risk modelling by stochastic augmentation of reliability-centerd maintenance. Electric Power Systems Research, 119, pp.471-477.
Moghaddam, K.S., 2013. Multi-objective preventive maintenance and replacement scheduling in a manufacturing system using goal programming. International Journal of Production Economics, 146(2), pp.704-716.
Mostafa, S., Lee, S.H., Dumrak, J., Chileshe, N. and Soltan, H., 2015. Lean thinking for a maintenance process. Production & Manufacturing Research, 3(1), pp.236-272.
Motawa, I. and Almarshad, A., 2013. A knowledge-based BIM system for building maintenance. Automation in Construction, 29, pp.173-182.
Munyensanga, P., Widyanto, S.A. and Aziz, M.N., 2018. Information management to improve the effectiveness of preventive maintenance activities with computerized maintenance management system at the intake system of circulating water pump. Procedia CIRP, 78, pp.289-294.
Nemoto, T. and Beglar, D., 2014. Likert-scale questionnaires. In JALT 2013 Conference Proceedings (pp. 1-8).
Nodem, F.D., Gharbi, A. and Kenné, J.P., 2011. Preventive maintenance and replacement policies for deteriorating production systems subject to imperfect repairs. International Journal of Production Research, 49(12), pp.3543-3563.
O'Brien, J.A. and Marakas, G.M., 2006. Management information systems (Vol. 6). McGraw- Hill Irwin.
Oqubay, A., 2018. The Structure and Performance of the Ethiopian Manufacturing Sector (No. 299). Working Paper Series.
O’Hanlon, T., 2005. Computerized maintenance management and enterprise asset management best practices. Reliabilityweb. com Asset Management White Paper Series, NetexpessUSA Inc.
Ornstein, M., 2013. Designing a questionnaire. A companion to survey research, pp.45-58.

168
Parida, A., Kumar, U., Galar, D. and Stenström, C., 2015. Performance measurement and management for maintenance: a literature review. Journal of Quality in Maintenance Engineering, 21(1), pp.2-33.
Parida, A. and Kumar, U., 2006. Maintenance performance measurement (MPM): issues and challenges. Journal of Quality in Maintenance Engineering.
Poór, P. and Šimon, M., Modern company maintenance management based on the principle computerized maintenance management system (CMMS) implementation. Advances in Engineering Mechanics and Materials ISBN: 978-1-61804-241-5
Polkinghorne, D.E., 2005. Language and meaning: Data collection in qualitative research. Journal of counseling psychology, 52(2), p.137.
Desai, V. and Potter, R. eds., 2006. Doing development research. Sage.
Ramachandra, C.G., Srinivas, T.R. and Shruthi, T.S., 2012. A study on development and implementation of a computerized maintenance management information system for a process industry. International Journal of Engineering and Innovative Technology (IJEIT), 2(5).
Rastegari, A. and Mobin, M., 2016, January. Maintenance decision making, supported by computerized maintenance management system. In 2016 Annual Reliability and Maintainability Symposium (RAMS) (pp. 1-8). IEEE.
Reason, J. and Hobbs, A., 2017. Managing maintenance error: a practical guide. CRC Press.
Reguia, C., 2014. Product innovation and the competitive advantage. European Scientific Journal, ESJ, 10(10).
Rountev, A., Volgin, O. and Reddoch, M., 2005, September. Static control-flow analysis for reverse engineering of UML sequence diagrams. In ACM SIGSOFT Software Engineering Notes (Vol. 31, No. 1, pp. 96-102). ACM.
Sahoo, T. and Liyanage, J.P., 2008. Computerized maintenance management systems: For effective plant performance. Chemical Engineering, 115(1), p.38.
Saygin, C. and Tamma, S., 2012. RFID-enabled shared resource management for aerospace maintenance operations: a dynamic resource allocation model. International Journal of Computer Integrated Manufacturing, 25(1), pp.100-111.
Schulz, D. and Gitzel, R., 2013, September. Seamless maintenance—Integration of FDI Device Management & CMMS. In 2013 IEEE 18th Conference on Emerging Technologies & Factory Automation (ETFA) (pp. 1-7). IEEE.
Sharma, R. and Govindaraju, N., 2010, November. Intelligent support system a maintenance planning activity. In 2010 2nd International Conference on Chemical, Biological and Environmental Engineering (pp. 331-335). IEEE.
Schuman, C.A. and Brent, A.C., 2005. Asset life cycle management: towards improving physical asset performance in the process industry. International Journal of Operations & Production Management.

169
Shorrocks, A. and Van der Hoeven, R. eds., 2004. Growth, inequality, and poverty: Prospects for pro-poor economic development. OUP Oxford.
Shin, J.H. and Jun, H.B., 2015. On condition-based maintenance policy. Journal of Computational Design and Engineering, 2(2), pp.119-127.
Singh, R., Gohil, A.M., Shah, D.B. and Desai, S., 2013. Total productive maintenance (TPM) implementation in a machine shop: a case study. Procedia Engineering, 51, pp.592- 599.
Silverman, D. ed., 2016. Qualitative research. Sage.
Stamboliska, Z., Rusiński, E., & Moczko, P., 2015. Proactive condition monitoring of low- speed machines. In Proactive Condition Monitoring of Low-Speed Machines (pp. 53- 68). Springer, Cham.
Statista., 2019. Ethiopia: Gross domestic product (GDP) in current prices from 2012 to 2022 (in billion U.S. dollars). The Statistical Portal.
https://www.statista.com/statistics/455080/gross-domestic-product-gdp-in-ethiopia/
Stephens, M.P., 2010. Productivity and reliability-based maintenance management. Purdue University Press.
Sullivan, G., Pugh, R., Melendez, A.P. and Hunt, W.D., 2010. Operations & Maintenance Best Practices-A Guide to Achieving Operational Efficiency (Release 3) (No. PNNL- 19634). Pacific Northwest National Lab.(PNNL), Richland, WA (United States).
Susto, G.A., Schirru, A., Pampuri, S., McLoone, S. and Beghi, A., 2015. Machine learning for predictive maintenance: A multiple classifier approach. IEEE Transactions on Industrial Informatics, 11(3), pp.812-820.
Taherdoost, H., 2016. Sampling methods in research methodology; how to choose a sampling technique for research. How to Choose a Sampling Technique for Research (April 10, 2016).
Tashakkori, A. and Creswell, J.W., 2007. Exploring the nature of research questions in mixed methods research.
Uysal, F., & Tosun, Ö., 2012. Fuzzy TOPSIS-based computerized maintenance management system selection. Journal of Manufacturing Technology Management, 23(2), 212-228.
Van Horenbeek, A., Scarf, P.A., Cavalcante, C.A. and Pintelon, L., 2013. The effect of maintenance quality on spare parts inventory for a fleet of assets. IEEE Transactions on Reliability, 62(3), pp.596-607.
Vaske, J.J., Beaman, J. and Sponarski, C.C., 2017. Rethinking internal consistency in Cronbach's Alpha. Leisure Sciences, 39(2), pp.163-173.
Vilarinho, S., Lopes, I. and Oliveira, J.A., 2017. Preventive maintenance decisions through maintenance optimization models: a case study. Procedia Manufacturing, 11, pp.1170- 1177.

170
Vogl, G.W., Weiss, B.A. and Helu, M., 2019. A review of diagnostic and prognostic capabilities and best practices for manufacturing. Journal of Intelligent Manufacturing, 30(1), pp.79-95.
Walia, D.S., Huria, J. and Cordero, I., 2010. Equipment maintenance and repair. Community eye health, 23(73), p.26.
Wan, J., Tang, S., Li, D., Wang, S., Liu, C., Abbas, H. and Vasilakos, A.V., 2017. A manufacturing big data solution for active preventive maintenance. IEEE Transactions on Industrial Informatics, 13(4), pp.2039-2047.
Wang, Z., Atli, M. and Kondo Adjallah, H., 2014. Coloured stochastic Petri nets modelling for the reliability and maintenance analysis of multi-state multi-unit systems. Journal of Manufacturing Technology Management, 25(4), pp.476-490.
Weber, P., Medina-Oliva, G., Simon, C. and Iung, B., 2012. Overview on Bayesian networks applications for dependability, risk analysis and maintenance areas. Engineering Applications of Artificial Intelligence, 25(4), pp.671-682.
Welsh, E., 2002, May. Dealing with data: Using NVivo in the qualitative data analysis process. In Forum qualitative sozialforschung/Forum: qualitative social research (Vol. 3, No. 2).
Whitney, K., Bradley, J.M., Baugh, D.E. and Jr, C.W.C., 2015. Systems theory as a foundation
for governance of complex systems. International Journal of System of Systems
Engineering, 6(1-2), pp.15-32.
Wienker, M., Henderson, K. and Volkerts, J., 2016. The computerized maintenance
management system an essential tool for world class maintenance. Procedia
Engineering, 138(1), pp.413-2.
Wilder, P. and Cannon, M., 1993, May. Advantages of a computerized maintenance
management system in managing plant operations. In [Proceedings] IEEE 1993
Annual Textile, Fiber and Film Industry Technical Conference (pp. 5-1). IEEE.
Wilson, J. 2010. Essentials of business research: a guide to doing your research project, SAGE
Publication
Wireman, T., 1994. Computerized maintenance management systems. Industrial Press Inc..

171
Appendices
Appendix A: Interview Questions

172
Appendix B: Consent Letter

173
Appendix C: Pre-determined Criteria for Selecting Sample
# Attribute/predetermined Criteria Assessment / assumption
1 Nature of business Large and medium manufacturing industries
2 Number of employees 50 and above
3 Site area (sqm/hectare), single/multi (nr) Any
4 Net floor space maintained (sqm) 50 m2
5 Technical installations / complexity Medium and high
6 Structural installation Available
7 Electrical installation Available
8 Data and telecommunications Available
9 Water source (tab and/or borehole) Available
10 Sanitary and drainage lines Available
11 User fittings and production assets under maintenance
More than 5 batching and/or continuous machines available
12 Maintenance (outsourced/insourced) Insourced
13 Maintenance department More than 10 staff
14 Education Level of maintenance dept staff TVET and above
15 Available technical information Available in soft and hard copy
16 CMMS Available as separate/component module
17 Number of computers in maintenance dept 1 and above
18 Existing MIS/ERP in the company Available/on the process of implementing ERP
19 Organization structure – Key Roles General Manager, Quality Manager, Maintenance Manager, Production Manager, Maintenance Planner, Maintenance team leader, Maintenance Technicians, Production Planner, Production Team Leaders & Plant/machine operators

174
Appendix D: Ethiopian Large and Medium Scale Manufacturing Industries
by Sector (ECSA, 2014)
Indu
stri
al
Gro
up
Add
is A
baba
Afa
r
Am
har
a
Ben
isha
ngu
l
Dir
edew
a
Gam
bella
Har
ari
Oro
mia
SNN
P
Som
alie
Tig
ray
Tot
al
Pro
port
ion
by I
ndu
stry
Food Products & Beverage 255 0 45 2 25 1 7 130 54 7 36 562 25.51
Tobacco Products 1 0 0 0 0 0 0 0 0 0 0 1 0.05
Textiles 29 2 4 0 1 1 0 3 6 0 1 47 2.13
Wearing Apparel 34 0 0 0 1 0 0 5 0 0 1 41 1.86
Leather 53 0 6 0 0 0 1 26 0 0 3 89 4.04
Wood Products 16 0 2 0 0 0 0 17 12 0 1 48 2.18
Paper Products and Printing 102 0 4 0 4 0 3 8 1 0 5 127 5.76
Chemicals and Chemical Products 55 0 0 0 1 0 0 16 1 0 2 75 3.40
Rubber and Plastic Products 61 0 0 0 1 0 0 22 1 0 2 87 3.95
Non-Metallic Mineral Products 121 9 109 0 2 3 20 84 131 0 129 608 27.60
Basic Iron and Steel 13 0 0 0 1 0 0 0 0 0 4 18 0.82
Fabricated Metal Products 45 0 18 0 0 0 3 10 11 0 33 120 5.45
Machinery and Equipment 3 0 0 0 1 0 0 1 0 0 0 5 1.38
Motor Vehicles, Trailers and Semi-Trailers 10 0 0 0 0 0 0 1 0 0 1 12 0.54
Furniture 89 1 83 5 6 3 9 41 92 5 29 363 16.48
TOTAL 887 12 271 7 43 8 43 364 309 12 247 2203 100.00
Appendix E: Ethiopian Large and Medium Manufacturing Industries
Cluster by Region
887
12
271
7
43
8
43
364
309
12
247
0 100 200 300 400 500 600 700 800 900 1000
Addis Ababa
Afar
Amhara
Benishangul
Diredewa
Gambella
Harari
Oromia
SNNP
Somalie
Tigray

175
Appendix F: Target Strata Companies by Non-Probability Sampling
Appendix G: Target Population
# Industries Frequency PercentValid
PercentCumulative
Percent
1 Food & Beverage Industry 22 5.5 5.5 5.5
2 Machinery and Equipment Industry 48 12.0 12.0 17.5
3Non-Metallic Mineral Products/Cement Industry
30 7.5 7.5 25.1
4 Furniture Industry 27 6.8 6.8 31.8
5 Tobacco Products Industry 25 6.3 6.3 38.1
6 Textiles Industry 46 11.5 11.5 49.6
7 Leather & Wearing Apparel Industry 53 13.3 13.3 62.9
8 Wood & Timber Industry 16 4.0 4.0 66.9
9 Pulp and Paper Industry 35 8.8 8.8 75.7
10 Chemicals Industry 19 4.8 4.8 80.5
11 Rubber and Plastic Products Industry 16 4.0 4.0 84.5
12 Iron, Metal & Steel Industry 62 15.5 15.5 100.0
Total 399 100.0 100.0
Planned Target Population

176
Appendix H: Strata by Industrial Group
# Strata by Industrial Group
Disproportionate stratified Random sampling Total Target sample
Managers
(100%)
Planners
(100%)
Team Leaders (50%)
Technicians (30%)
Operators (30%)
Total Sample Size
1 Food Products & Beverage 55 4 2 6 16 27 21.9
i Moha Soft Drink S.C 55 4 2 6 16 27
2 Tobacco Products 65 4 2 6 32 21 24.9
i National Tobacco S.C 65 4 2 6 32 21
3 Textiles 128 4 2 16 14 92 45.8
i Almeda Textile PLC 128 4 2 16 14 92
4 Wearing Apparel 72 4 2 4 12 50 26.6
i ELICO Ethiopia Leather Industry
72 4 2 4 12 50
5 Leather 68 4 4 4 12 44 26.8
i Sheba Leather Industry PLC 68 4 4 4 12 44
6 Wood Products 36 4 2 4 8 18 15.8
i Ethiopia Plywood Enterprise 36 4 2 4 8 18
7 Paper Products and Printing 88 4 4 16 18 46 35.2
i Birhanena Selam Printing Enterprise
88 4 4 16 18 46
8 Chemicals and Chemical Products
43 4 2 8 8 21 18.7
ii Adami Tulu Pesticides Processing S.C
43 4 2 8 8 21
9 Rubber and Plastic Products 37 4 2 4 6 21 16.1
i Ethiopia Plastic Industry 37 4 2 4 6 21
10 Non-Metallic Minearl Products
78 4 2 12 16 44 30
i National Cement S.C 78 4 2 12 16 44
11 Basic Iron and Steel 102 4 2 12 18 66 37.2
i Akaki Basic Metal Industry 102 4 2 12 18 66
12 Fabricated Metal Products 65 4 2 6 14 39 24.9
i DH Geda Metal Factory PLC 65 4 2 6 14 39
13 Machinery and Equipment 41 4 2 8 9 18 18.1
i Adama Agricultural Machinery Industry
41 4 2 8 9 18
14 Motor Vehicles, Trailers and Semi-Trailers
78 4 2 12 16 44 30
ii Mesfin Industrial Engineering PLC
78 4 2 12 16 44
15 Furniture 74 4 2 4 12 52 27.2
i Finfine Furniture Factory (3F)
74 4 2 4 12 52
TOTAL 927 56 32 106 197 511 399

177
Appendix I: Respondent Population
Appendix J: Respondent by Type of Industry
# Industries Frequency PercentValid
PercentCumulative
Percent
1 Food & Beverage Industry 19 6.7 6.7 6.7
2 Machinery and Equipment Industry 51 18.1 18.1 24.8
3Non-Metallic Mineral Products/Cement Industry
32 11.3 11.3 36.2
4 Furniture Industry 16 5.7 5.7 41.8
5 Tobacco Products Industry 20 7.1 7.1 48.9
6 Textiles Industry 28 9.9 9.9 58.9
7 Leather & Wearing Apparel Industry 33 11.7 11.7 70.6
8 Wood & Timber Industry 1 .4 .4 70.9
9 Pulp and Paper Industry 25 8.9 8.9 79.8
10 Chemicals Industry 13 4.6 4.6 84.4
11 Rubber and Plastic Products Industry 20 7.1 7.1 91.5
12 Iron, Metal & Steel Industry 24 8.5 8.5 100.0
Total 282 100.0 100.0
Actual Respondant Population
19
51
32
16
20
28
33
1
25
13
20
24
6.7
18.1
11.3
5.7
7.1
9.9
11.7
.4
8.9
4.6
7.1
8.5
0 10 20 30 40 50 60
FOOD & BEVERAGE INDUSTRY
MACHINERY AND EQUIPMENT INDUSTRY
NON-METALLIC MINERAL PRODUCTS/CEMENT INDUSTRY
FURNITURE INDUSTRY
TOBACCO PRODUCTS INDUSTRY
TEXTILES INDUSTRY
LEATHER & WEARING APPAREL INDUSTRY
WOOD & TIMBER INDUSTRY
PULP AND PAPER INDUSTRY
CHEMICALS INDUSTRY
RUBBER AND PLASTIC PRODUCTS INDUSTRY
IRON, METAL & STEEL INDUSTRY
Figure Respondant by Type of Industry
Percenatage of Response #of Respondant

178
Appendix K: Respondents Length of Work Experience
Appendix L: Significance Score for Components B
133
88
23
12
23
47.2
31.2
8.2
4.3
8.2
0 20 40 60 80 100 120 140
LESS THAN 5
5-10
11-15
16-20
MORE THAN 20
Figure Length of Work Expireance
Percentage of Response No of Respondant
0.00
37.50
41.67
45.83
62.50
75.00
87.50
0.00 10.00 20.00 30.00 40.00 50.00 60.00 70.00 80.00 90.00 100.00
B5
B7
B1
B4
B2
B6
B3

179
Appendix M: Significance Score for Components C
Appendix N: Significance Score for Components D
3.13
21.88
62.50
62.50
100.00
0.00 10.00 20.00 30.00 40.00 50.00 60.00 70.00 80.00 90.00 100.00
C5
C2
C3
C4
C1
10.71
17.86
30.36
39.29
51.79
82.14
82.14
85.71
0.00 10.00 20.00 30.00 40.00 50.00 60.00 70.00 80.00 90.00
D2
D1
D4
D8
D3
D6
D7
D5

180
Appendix O: Signed Information Sheet

181
Appendix P: Ethics Clearance Approval Certificate

182

183
Appendix Q: R-code
R code developed by the researcher for conducting multiple pairwise comparisons using t-tests and Wilcoxon signed ranks tests (using the example of comparing 7 critical success factors)
# set working directory and read file setwd("F:/BUSINESS/Freelance/2018/March/21 Zerihun") data<-read.csv("data.csv") # set option to avoid using scientific notation for decimal numbers options(scipen=1000) # call dplyr library for data management library(dplyr) # select only columns you want to compare data2<-data%>%select(B1, B2, B3, B4, B5, B6, B7) # create empty table with columns corresponding to variable 1, # variable 2 and p-values of the two tests. testtab<-data.frame(var1=NA,var2=NA,difference=NA, p_t=NA,p_w=NA, points_t, points_w) for (i in 1:7) { for (j in 1:7) { result_t<-t.test(data2[,i], data2[,j], paired=TRUE) result_w<-wilcox.test(data2[,i], data2[,j],paired=TRUE) diff<-mean(data2[,i],na.rm=TRUE)-mean(data2[,j],na.rm=TRUE) p_t<-result_t$p.value p_w<-result_w$p.value points_t<-ifelse(p_t<0.05&diff<0,-2,ifelse(p_t<0.1&diff<0,-1, ifelse(p_t<0.05&diff>0,2, ifelse(p_t<0.1&diff>0,1, 0)))) points_w<-ifelse(p_w<0.05&diff<0,-2,ifelse(p_w<0.1&diff<0,-1, ifelse(p_w<0.05&diff>0,2, ifelse(p_w<0.1&diff>0,1, 0)))) testtab<-rbind(testtab,c(i,j,diff, p_t,p_w,points_t, points_w)) } } testtab<-testtab%>%na.omit() write.csv(testtab, "testtab.csv")

184
Appendix R: Regression Analysis and t-test results
Standardized Coefficients
B Std. Error Beta Tolerance VIF
(Constant) .209 .201 1.045 .297
B1. First Component: Organization & management
.016 .070 .015 .223 .824 .430 2.327
B2. Second Component: Work Identification & responsibilities
-.009 .103 -.008 -.087 .931 .228 4.392
B3. Third Component: Work Planning & Scheduling
.254 .101 .225 2.523 .012 .243 4.122
B4. Fourth Component: Work Flow Control and Performance Measures
.224 .101 .209 2.216 .028 .217 4.611
B5. Fifth Component: Information Technology & Appraisal
.168 .085 .172 1.978 .049 .255 3.924
B6. Sixth Component: Spare Part and Materials Management
.005 .066 .005 .068 .945 .446 2.243
B7. Seventh Component: Facility, Safety and Working Environmental Aspects .175 .060 .190 2.916 .004 .456 2.195
1
a. Dependent Variable: C. Proposed Integrated Maintenance Management Strategic Framework Model
Coefficientsa
Model
Unstandardized Coefficients
t Sig.
Collinearity Statistics
(Constant)
B1. First Component:
Organization & management
B2. Second Component:
Work Identification & responsibilities
B3. Third Component:
Work Planning & Scheduling
B4. Fourth Component: Work Flow Control and
Performance Measures
B5. Fifth Component: Information
Technology & Appraisal
B6. Sixth Component:
Spare Part and Materials
Management
B7. Seventh Component:
Facility, Safety and Working
Environmental Aspects
1 7.897 1.000 .00 .00 .00 .00 .00 .00 .00 .00
2 .028 16.653 .57 .02 .00 .00 .00 .06 .01 .13
3 .021 19.199 .14 .27 .04 .02 .00 .00 .30 .03
4 .020 20.079 .04 .04 .01 .02 .04 .04 .07 .74
5 .014 24.084 .12 .43 .01 .04 .02 .06 .50 .03
6 .009 30.080 .11 .09 .04 .16 .07 .80 .03 .07
7 .006 36.060 .01 .14 .49 .01 .67 .01 .08 .00
8 .005 38.085 .01 .02 .42 .76 .20 .03 .01 .00
1
a. Dependent Variable: C. Proposed Integrated Maintenance Management Strategic Framework Model
Collinearity Diagnosticsa
Model Eigenvalue Condition Index
Variance Proportions
Standardized Coefficients
B Std. Error Beta Tolerance VIF
(Constant) 1.460 .222 6.571 .000
B1. First Component: Organization & management
.048 .077 .052 .620 .536 .432 2.317
B2. Second Component: Work Identification & responsibilities
.037 .114 .037 .325 .745 .225 4.436
B3. Third Component: Work Planning & Scheduling
.069 .114 .068 .603 .547 .235 4.258
B4. Fourth Component: Work Flow Control and Performance Measures
.237 .114 .248 2.081 .038 .210 4.763
B5. Fifth Component: Information Technology & Appraisal
-.001 .095 -.001 -.012 .991 .250 4.006
B6. Sixth Component: Spare Part and Materials Management
.022 .074 .024 .294 .769 .440 2.274
B7. Seventh Component: Facility, Safety and Working Environmental Aspects .128 .067 .155 1.907 .058 .454 2.203
1
a. Dependent Variable: D. Proposed Computerized Maintenance Management System (CMMS) Optimized Model
Coefficientsa
Model
Unstandardized Coefficients
t Sig.
Collinearity Statistics
(Constant)
B1. First Component:
Organization & management
B2. Second Component:
Work Identification & responsibilities
B3. Third Component:
Work Planning & Scheduling
B4. Fourth Component: Work Flow Control and
Performance Measures
B5. Fifth Component: Information
Technology & Appraisal
B6. Sixth Component:
Spare Part and Materials
Management
B7. Seventh Component:
Facility, Safety and Working
Environmental Aspects
1 7.896 1.000 .00 .00 .00 .00 .00 .00 .00 .00
2 .029 16.527 .57 .02 .00 .00 .01 .06 .01 .13
3 .022 19.050 .14 .27 .04 .02 .00 .00 .28 .04
4 .020 19.948 .03 .05 .01 .01 .04 .03 .07 .73
5 .014 23.919 .13 .42 .01 .04 .02 .06 .50 .03
6 .009 30.238 .11 .10 .07 .13 .05 .81 .03 .07
7 .006 36.459 .00 .13 .50 .00 .68 .03 .10 .00
8 .005 38.168 .01 .01 .38 .80 .20 .01 .01 .00
1
a. Dependent Variable: D. Proposed Computerized Maintenance Management System (CMMS) Optimized Model
Collinearity Diagnosticsa
Model Eigenvalue Condition Index
Variance Proportions

Zerihun Tariku, PhD Scholar, UNISA Companies Observation Protocol
Type of Industry: ________________________________
Name of Company: ________________________________
Primary Contact Person: ________________________________
Position of Contact Person: ________________________________
Address: __________________________________________
(For example see next page)
# Attribute Observation Themes 1 Nature of business 2 Number of employees
3 Site area (sqm/hectare), single/multi (nr)
4 Net floor space maintained (sqm)
5 Technical installations / complexity
6 Structural
7 Electrical
8 Data and telecommunications
9 Tap water
10 Production water
11 Sanitary and drainage
12 User fittings and production assets under maintenance
13 Maintenance (outsourced/insourced)
14 Company staff
15 Maintenance department staff
16 Production department staff
17 Quality and Assurance staff
18 Level of staffing
19 Available information
20 Requested database platform
21 Additional modules
22 Number of users 23 Active interfaces with MIS/ERP
24 Passive interfacing
APPENDIX S: COMPANYS’ OBSERVATION CHECKLIST
185

Zerihun Tariku, PhD Scholar, UNISA Companies Observation Protocol
EXAMPLE OF CLIENT ASSESMENT
# Attribute Observation Themes 1 Nature of business manufacturing (HS7326, iron/steel 8201, hand tools)
2 Number of employees 500-600
3 Site area (sqm/hectare), single/multi (nr) approx 15 hectare, single
4 Net floor space maintained (sqm) approx 30,000
5 Technical installations / complexity industrial / medium
6 Structural B,G, G+3, concrete/brick, sandwich panel
7 Electrical 230/400V, EEPCO grid, backup generator(s) demand around 12 MVA
8 Data and telecommunications wired phone network wired LAN in office (limited), dial up
9 Tap water 2 boreholes, town supply pressure pump and gravity distribution
10 Production water borehole (treated) 11 Sanitary and drainage waste water: septic tanks / soak away
12 User fittings and production assets under maintenance
- furnaces (induction) - milling machines - lathe machines - grinding machines - drilling machines - gear hobbing and cutting machines - rolling machines - folding machines - forging machines - heat treatment installations - surface treatment installations - transport and storage equipment - vehicles - furniture and fixtures
13 Maintenance (outsourced/insourced) largely insourced
14 Maintenance department around 60 employees
15 Level of staffing diploma and higher
16 Available information drawings, floor plans schedules/diagrams: cabling, wiring, piping specifications of materials used asset inventory location coding (workshop) manuals for production assets
17 Requested database platform SQL, VB.NET front end
18 Additional modules spare parts management time-accounting
19 Number of users 1-10
20 Active interfaces with MIS/ERP none
21 Passive interfacing purchasing finance and budgets
186

ZERIHUN TARIKU HUNEGNAW
Student Number 77665880 PhD Scholar, Graduate School of Business Leadership
Structured Survey Questionnaire
Please provide the following information regarding your work situation by marking an X in the appropriate box. Please feel free to write any comments in the comments field. If the question does not apply or you do not have the information necessary to answer, then leave the line blank.
Please also be informed that Sections A, B, C and D must be completed.
Section A - Biographical Information This section of the questionnaire refers to background or biographical information. Although I am aware of the sensitivity of the questions in this section, the information allow me to compare groups of respondents. Once again, I want to assure you that your response will remain anonyms.
1. What is your Gender
Female 1 Male 2
2. What is your Age
3. Which Industry are you working for? Food & Beverage Industry 1 Tobacco Products Industry 2
Textiles Industry 3
Leather & Wearing Apparel Industry 4
Wood & Timber Industry 5
Pulp and Paper Industry 6
Chemicals Industry 7
Rubber and Plastic Products Industry 8
Iron, Metal & Steel Industry 9
Machinery and Equipment Industry 10
Non-Metallic Mineral Products/Cement Industry 11
Furniture Industry 12
4. What is your current length of service in years within the company?
Less than 5 1
5-10 2
11-15 3
Appendix T: Structured Survey Questionnaire
187

ZERIHUN TARIKU HUNEGNAW
Student Number 77665880 PhD Scholar, Graduate School of Business Leadership
16-20 4
More than 20 5
5. In which department are you currently working? Maintenance 1
Production 2
Quality Assurance (QA) 3
Information Technology (IT) 4
6. What is your current position in the company? Maintenance Manager 1 Maintenance Planner 2
Maintenance Team leader 3
Maintenance Technician 4
Production Manager 5
Production Planner 6
Production Team/Group Leader 7
Production/ Machine Operator 8
Quality Assurance Manager 9
Quality Assurance Controller 10
IT & System Manager 11
System & Data base Technician 12
7. How many years have you spent in your current position? Less than 5 1
5-10 2
11-15 3
16-20 4
More than 20 5
8. What is your highest education qualification? Less than grade 10 1
TVET/10+2 2
Diploma/advance diploma 3
Graduate degree 4
Postgraduate degree 5
188

ZERIHUN TARIKU HUNEGNAW
Student Number 77665880 PhD Scholar, Graduate School of Business Leadership
SECTION B – MAIN STUDY QUESTIONNAIRES This section is to measure and identify the most common critical success factors (CSFs) and explore the decision elements or dimensions considered for the selection, design and development of CMMS in Ethiopian large and medium manufacturing industries.
189

ZERIHUN TARIKU HUNEGNAW
Student Number 77665880 PhD Scholar, Graduate School of Business Leadership
First Component: Organization & management
No Questions
Str
ongl
y D
isag
ree
Dis
agre
e
Neu
tral
Agr
ee
Str
ongl
y A
gree
A. Organization 1. Availability of mission statement on maintenance management 1 2 3 4 5 2. Availability of clear objectives to support the maintenance
management. 1 2 3 4 5
3. Availability of strategies to achieve objectives on maintenance management
1 2 3 4 5
4. Availability of clear organizational chart and structure 1 2 3 4 5 5. Availability of function statement for all sections which define
roles, authority & responsibility 1 2 3 4 5
6. Availability of Job description for each position 1 2 3 4 5 B. Policies, programs and procedure. 1. Availability of documented policies 1 2 3 4 5 2. Availability of documented programs 1 2 3 4 5 3. Availability of documented procedures 1 2 3 4 5 4. Availability of active updating programs 1 2 3 4 5 5. Availability of documented shop functions and SOP 1 2 3 4 5 6. Work Process effectiveness review and evaluation 1 2 3 4 5
C. Supervision & Planning Functions 1. Machine /plant demand and maintenance job coordination. 1 2 3 4 5 2. Supervision coverage adequacy 1 2 3 4 5 3. Establishment of planning functions to support maintainability 1 2 3 4 5 4. Availability of type rating to check supervisor for appropriate
machine maintenance quality 1 2 3 4 5
5. Ratio of supervisors to maintenance workers, operators and drivers
1 2 3 4 5
6. Labor productivity follow-up 1 2 3 4 5 7. Implementation of coaching on technical staff 1 2 3 4 5
D. Training 1. Availability of management and leadership training 1 2 3 4 5 2. Availability of supervisors, foremen and planner training 1 2 3 4 5 3. Availability of technicians and Operators training 1 2 3 4 5 4. Availability of refreshment training 1 2 3 4 5
E. Motivation 1. Conducting a work satisfaction survey 1 2 3 4 5 2. Annual turnover due to quits and discharges of skilled man
power 1 2 3 4 5
3. Employees’ financial motivation 1 2 3 4 5 4. Employees’ awards and recognition 1 2 3 4 5 5. Less barriers between labor and management 1 2 3 4 5
190

ZERIHUN TARIKU HUNEGNAW
Student Number 77665880 PhD Scholar, Graduate School of Business Leadership
Second Component: Work Identification & responsibilities
No Questions
Str
ongl
y D
isag
ree
Dis
agre
e
Neu
tral
Agr
ee
Str
ongl
y A
gree
A. Work flow Procedure 1. Availability of standard printed work request format. 1 2 3 4 5 2. Availability of standard printed work order. 1 2 3 4 5 3. Availability standard printed inter- shop order 1 2 3 4 5 4. Availability of carryover authorization 1 2 3 4 5 6. Immediate response and decision on maintenance capability
within shop, outsource or onsite maintenance 1 2 3 4 5
B. Relationship Between Departments & Sections 1. Organization and cooperation between departments and
sections 1 2 3 4 5
2. Availability of documented shop functions and SOP (Standard Operating Procedure) for each section and teams.
1 2 3 4 5
3. Personnel understanding of their work relationships 1 2 3 4 5 4. Accomplishment of team work assignment for same jobs. 1 2 3 4 5
C. Planned Maintenance 1. Careful analysis of maintenance strategies and tasks 1 2 3 4 5 2. Effective predictive maintenance programs 1 2 3 4 5 3. Use of predictive maintenance tools like sensors and needed
hardware 1 2 3 4 5
4. Effective preventive maintenance programs 1 2 3 4 5 5. Accomplishing preventive maintenance work within 20% of
schedule per month 1 2 3 4 5
6. Periodically reviewing equipment history records. 1 2 3 4 5 D. Reception, Inspection and Quality control
1. Availability of clearly defined job description for reception and inspection.
1 2 3 4 5
2. Capability of inspection team to check all types of equipment maintenance quality.
1 2 3 4 5
3. Availability of documented PM/PDM inspection scheduling. 1 2 3 4 5 4. Improving maintenance practice based on inspection history. 1 2 3 4 5 5. Availability of facilitate/speed-up procedures for inspection 1 2 3 4 5
E. Service Works 1. Classifying service work separately from maintenance work 1 2 3 4 5 2. Clearly documenting process and procedure of service work 1 2 3 4 5 3. Service work follow up and analysis 1 2 3 4 5
F. Routine, Recurring Work 1. Classifying recurring work to be controlled separately 1 2 3 4 5 2. Reporting standing work order scheduling & performance 1 2 3 4 5 3. Cost estimation of recurring work 1 2 3 4 5
G. Work Requirements Documentation 1. Establishing prioritization of all work 1 2 3 4 5 2. Summarizing jobs by status 1 2 3 4 5 3. Reviewing work load periodically 1 2 3 4 5 191

ZERIHUN TARIKU HUNEGNAW
Student Number 77665880 PhD Scholar, Graduate School of Business Leadership
Third Component: Work Planning & Scheduling No Questions
Str
ongl
y D
isag
ree
Dis
agre
e
Neu
tral
Agr
ee
Str
ongl
y A
gree
A. Priority System 1. Appropriateness of priority criteria 1 2 3 4 5 2. Consistency of priority criteria 1 2 3 4 5 3. Documentation & distribution of priority criteria 1 2 3 4 5
B. Planning and scheduling of Work 1. Work planning and scheduling for all tasks 1 2 3 4 5 2. Developing and implementing work processing procedure 1 2 3 4 5 3. Daily scheduling for conducting work 1 2 3 4 5 4. weekly scheduling for conducting work 1 2 3 4 5 5. Monthly scheduling for conducting work 1 2 3 4 5 6. quarterly scheduling for conducting work 1 2 3 4 5 7. annually scheduling for conducting work 1 2 3 4 5 8. Documenting & reviewing scheduling procedures periodically 1 2 3 4 5
C. Alterations and Improvement Work 1. Classifying alterations and improvement separately from
maintenance work 1 2 3 4 5
2. Processing and programming of work separately from physical operations and maintenance
1 2 3 4 5
3. Distribution of work force within a planned target 1 2 3 4 5 D. Budget Requirements for Equipment management
operations
1. Planning annual maintenance budget 1 2 3 4 5 2. Cost reporting & budget documentation 1 2 3 4 5 3. Formally identifying and presenting long-range requirements
for renewals and replacement to management 1 2 3 4 5
E. Budget Execution Plan 1. Establishing periodic budget execution planning 1 2 3 4 5 2. Identifying works in the budget plan. 1 2 3 4 5 3. Controlling budget against expenditure 1 2 3 4 5
F. Backlog of Funded Work
1. Defining accepted and applied backlog 1 2 3 4 5 2. Backlog summaries of approved work 1 2 3 4 5 3. Backlog reports review and analysis 1 2 3 4 5
G. Emergency Work & Shutdown Scheduling 1. Minimizing emergency work occurrences 1 2 3 4 5 2. Standard time assessment for specific jobs 1 2 3 4 5 3. shutdown scheduling and planning 1 2 3 4 5 4. Short and long term plans to prevent emergency work 1 2 3 4 5
192

ZERIHUN TARIKU HUNEGNAW
Student Number 77665880 PhD Scholar, Graduate School of Business Leadership
Fourth Component: Work Flow Control and Performance Measures
No Questions
Str
ongl
y D
isag
ree
Dis
agre
e
Neu
tral
Agr
ee
Str
ongl
y A
gree
A. Scheduling & Planning control 1. Performance within +15% of planned works 1 2 3 4 5 2. Accomplishment of work within planned time 1 2 3 4 5 3. Accountability of sections for downtime 1 2 3 4 5 4. Planning review due to shortage of material ,tools, skilled labor
and spaces 1 2 3 4 5
B. Inventory and Availability 1. Availability of detail and complete specifications 1 2 3 4 5 2. Coding and classification of machine, equipment & assets 1 2 3 4 5 3. Availability of initial cost and warranties 1 2 3 4 5 4. Service contract and standardization 1 2 3 4 5 5. Availability of load rating , manuals and documentation 1 2 3 4 5
C. Maintenance management Process Re-Engineering 1. Designing Key maintenance processes 1 2 3 4 5 2. Work process automation 1 2 3 4 5 3. Quality cost measuring 1 2 3 4 5 4. Establishing Key performance indicators 1 2 3 4 5
D. Shop, Spaces, Tools & machineries 1. Shop space adequacy 1 2 3 4 5 2. Maintenance shop process flow synchronization 1 2 3 4 5 3. Tools and working machineries availability 1 2 3 4 5 4. Tools and working machineries adequacy 1 2 3 4 5 5. Tools and working machines status 1 2 3 4 5
E. Outsourced Maintenance and Transportation 1. Adequate number of vehicles for maintenance department and
transportation of outsourced maintenance 1 2 3 4 5
2. Accessibility of all necessary tools in the outsourced maintenance shop
1 2 3 4 5
3. Outsourced maintenance quality management 1 2 3 4 5 4. After sale support maintenance collateral 1 2 3 4 5 5. Availability of checking mechanisms for outsourced
maintenance works 1 2 3 4 5
6. Availability of performance measures related with outsourced maintenance works
1 2 3 4 5
193

ZERIHUN TARIKU HUNEGNAW
Student Number 77665880 PhD Scholar, Graduate School of Business Leadership
Fifth Component: Information Technology & Appraisal
No Questions
Str
ongl
y D
isag
ree
Dis
agre
e
Neu
tral
Agr
ee
Str
ongl
y A
gree
A. Management Information System (MIS) 1. Adequacy of computerized maintenance management system 1 2 3 4 5 2. Report design and utilization 1 2 3 4 5 3. Facility and equipment reports 1 2 3 4 5 4. Availability of easy to use maintenance management system 1 2 3 4 5 5. Availability of in house developed systems for maintenance
management (expert systems) 1 2 3 4 5
B. Measurement of Performance 1. Using performance measurement methods 1 2 3 4 5 2. Report summaries preparation 1 2 3 4 5 3. Using engineered performance standards to estimate man hours
on work orders 1 2 3 4 5
4. Conducting improvement studies 1 2 3 4 5 C. Productivity Measurement
1. Frequent productivity studies 1 2 3 4 5 2. Conducting work sampling of representative shop workforce 1 2 3 4 5 3. Comparisons of various categories of work 1 2 3 4 5 4. Conducting improvement action plan 1 2 3 4 5
D. Information System & Historical Records 1. Availability of facility history records 1 2 3 4 5 2. Availability of equipment history records 1 2 3 4 5 3. Spare parts information 1 2 3 4 5 4. Computerized inventory system 1 2 3 4 5
E. Variance Review 1. Periodic assessment of maintenance management strategies 1 2 3 4 5 2 Review policy for variance between planned and actual
activities 1 2 3 4 5
3. Establishing parameters and guidelines for conducting these reviews
1 2 3 4 5
4. Variance records and periodic review 1 2 3 4 5
Sixth Component: Spare Part and Materials Management
No Questions
Str
ongl
y D
isag
ree
Dis
agre
e
Neu
tral
Agr
ee
Str
ongl
y A
gree
A. Parts & Material Availability 1. Periodic inventory review 1 2 3 4 5 2. Documentation of spare parts and material usage on work order
sheet. 1 2 3 4 5
3. Spare parts availability and control 1 2 3 4 5 194

ZERIHUN TARIKU HUNEGNAW
Student Number 77665880 PhD Scholar, Graduate School of Business Leadership
B. Storeroom Operation 1. Warehouse control procedure and record system 1 2 3 4 5 2. Security and accessibility 1 2 3 4 5 3. Safety stock management and control 1 2 3 4 5 4. Integration of salvage and “bench stock” with inventory
control 1 2 3 4 5
5. Integration with maintenance planning 1 2 3 4 5 6. Disposal procedure for obsolete spare part 1 2 3 4 5 7. Slack time minimization b/n purchasing and request. 1 2 3 4 5 8, Stock identification and ease of warehouse arrangement 1 2 3 4 5
C. Inventory Functions and Costs 1. Purchase orders cost management 1 2 3 4 5 2. Materials handling cost management 1 2 3 4 5 3. Materials stock out cost management 1 2 3 4 5
Seventh Component: Facility, Safety and Working Environmental Aspects
No Questions
Str
ongl
y D
isag
ree
Dis
agre
e
Neu
tral
Agr
ee
Str
onge
st
Agr
ee
A. Facility and working condition
1. Availability of clinics or medical units in the working area 1 2 3 4 5
2. Availability of adequate shower ,toilets, lockers and dressing room
1 2 3 4 5
3. Availability of digital and technical library 1 2 3 4 5
4. Availability of proper layout management 1 2 3 4 5
5. Availability of adequate working bays 1 2 3 4 5
B. Equipment and Safety 1. Safety awareness 1 2 3 4 5 2. Use of personal safety equipment 1 2 3 4 5 3. Securing emergency safety kit with in working places 1 2 3 4 5 4. Availability of fire extinguisher at different locations 1 2 3 4 5 5. Proper location of emergency evacuation system 1 2 3 4 5 6 Periodic safety assessment 1 2 3 4 5
C. Maintenance and Environment 1. Awareness of maintenance impact on the environment 1 2 3 4 5 2. Consider the environment when developing maintenance
management strategies. 1 2 3 4 5
195

ZERIHUN TARIKU HUNEGNAW
Student Number 77665880 PhD Scholar, Graduate School of Business Leadership
Section C - Proposed Integrated Maintenance Management Strategic Frame Work Model
This questionnaire is to measure the level of availability, understanding, value and commitment of a proposed integrated maintenance management Strategic Framework Model for Ethiopian Large and Medium Manufacturing industries. Please indicate whether you strongly disagree, disagree, neutral, agree or strongly agree with the statements that the model proposes.
No Questions
Str
ongl
y D
isag
ree
Dis
agre
e
Neu
tral
Agr
ee
Str
onge
st
Agr
ee
1. Balance Your Work Load
1.1. Currently Reactive Maintenance/Breakdown Maintenance is practiced below 50% in our Industry
1 2 3 4 5
1.2 There is a complete fixed asset and maintainable equipment Inventory document and register in our Industry
1 2 3 4 5
1.3 There is a maintenance needs analysis polices and procedures documents to apply preventive maintenance strategy
1 2 3 4 5
1.4 Proper resources are allocated to implement preventive maintenance strategy
1 2 3 4 5
1.5 Currently there is preventive maintenance programs & checklists for all fixed assets and maintainable equipment
1 2 3 4 5
2. Create Organizational Power 2.1 There is a work order system used to initiate, record and track
all maintenance activities 1 2 3 4 5
2.2 There is a computer assisted maintenance management software system(CMMS)
1 2 3 4 5
2.3 There is a spare part management system which is automatically linked with Preventive Maintenance System and has automatic minimum stock notification
1 2 3 4 5
2.4 There is adequate yearly trainings for all maintenance department staffs on maintenance management
1 2 3 4 5
3. Go Condition Based 3.1 Production Operators are highly involved in breakdown,
preventive and predictive maintenance activities 1 2 3 4 5
3.2 Is there any predictive maintenance strategy practice and tools in your company?
1 2 3 4 5
3.3 Is there any Reliability Centered Maintenance strategy practice and tools in your company?
1 2 3 4 5
4. Make Maintenance A core Business Process 4.1 Is there a total productive maintenance philosophy in your
company in which all the company employee understand their job performance impact machine productivity?
1 2 3 4 5
4.2 Is there a system in a place that analyze and report maintenance costs( labor, spare part, downtime etc)
1 2 3 4 5
5 Never Stop Improving 5.1 Is there a self- directed continuous maintenance management
improvement research and practices? 1 2 3 4 5
196

ZERIHUN TARIKU HUNEGNAW
Student Number 77665880 PhD Scholar, Graduate School of Business Leadership
Section D- Proposed Computerized Maintenance Management System (CMMS) Optimized Model
This questionnaire is to measure the value of major critical success factors for the selection, development and implementation of an optimized computerized maintenance management system (CMMS) model based on the proposed and developed integrated maintenance management Strategic Framework Model for Ethiopian Large and Medium Manufacturing industries. Please indicate whether you strongly disagree, disagree, are neutral, agree or strongly agree with the statements that the model proposes.
SN Module / functionality Ref System Requirements
Stro
ngly
D
isag
ree
Dis
agre
e
Neu
tral
Agr
ee
Stro
nges
t A
gree
1 Asset Inventory 1.01 Do you have a manual or computer generated system in a place to produce asset overviews by category and class
1 2 3 4 5
1.02 Do you have a manual or computer generated system in a place to produce overviews of asset allocations by class and unit
1 2 3 4 5
2 Tools supply & Administration
2.01 Do you have a manual or computer generated system in a place to produce overviews of tools requests and allocations by client, units and status (open, allocated, dispatched, returned)
1 2 3 4 5
2.02 Do you have a manual or computer generated system in a place to produce overviews for tools dispatch and return/release
1 2 3 4 5
2.03 Do you have a manual or computer generated system in a place to produce schedules of tools allocation (future) and utilization (past)
1 2 3 4 5
3 Consumables control
3.01 Do you have a manual or computer generated system in a place to produce up-to-date stock reports (balance) at any time
1 2 3 4 5
3.02 Do you have a manual or computer generated system in a place to produce transaction overviews (in/out) by consumable and class
1 2 3 4 5
3.03 Do you have a manual or computer generated system in a place to produce counting sheets for inventory and stock checks
1 2 3 4 5
3.04 Do you have a manual or computer generated system in a place to produce consumption overviews per machine/ equipment unit and client/department//section/unit/task
1 2 3 4 5
4 Asset maintenance
4.01 Do you have a manual or computer generated system in a place to produce up-to-date overviews of work orders on hand by workshop/discipline and by technician, including planned completion dates
1 2 3 4 5
4.02 Do you have a manual or computer generated system in a 1 2 3 4 5 197
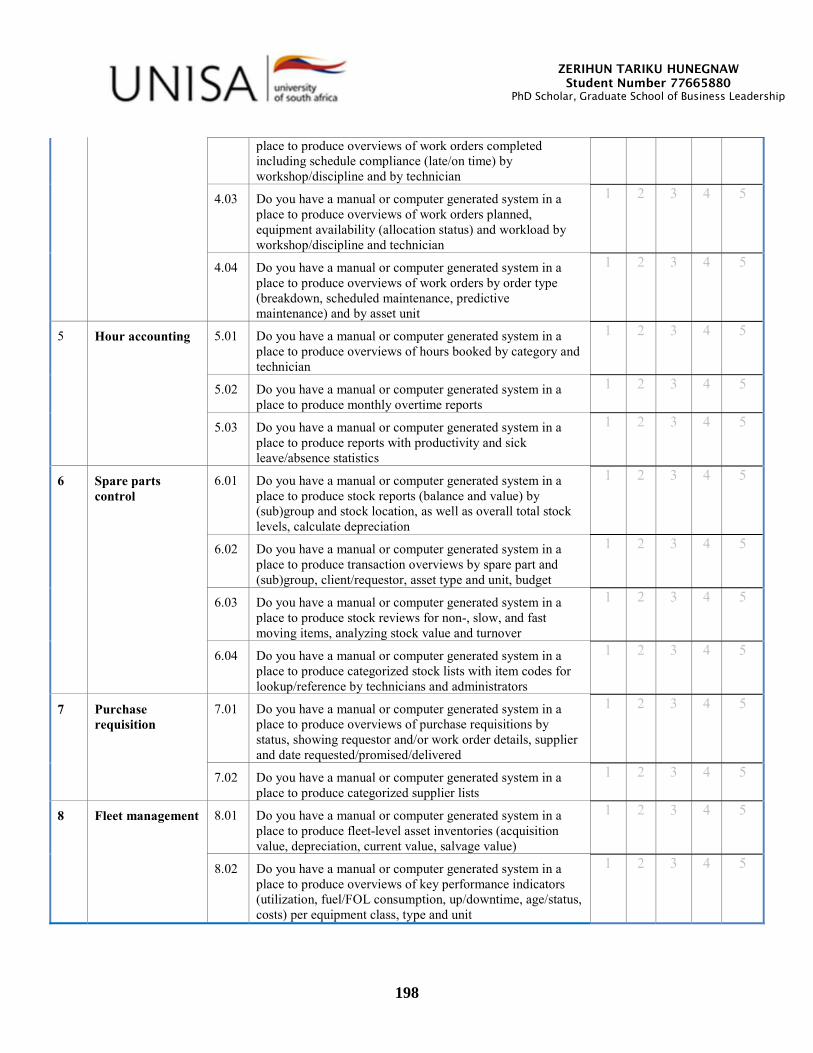
ZERIHUN TARIKU HUNEGNAW
Student Number 77665880 PhD Scholar, Graduate School of Business Leadership
place to produce overviews of work orders completed including schedule compliance (late/on time) by workshop/discipline and by technician
4.03 Do you have a manual or computer generated system in a place to produce overviews of work orders planned, equipment availability (allocation status) and workload by workshop/discipline and technician
1 2 3 4 5
4.04 Do you have a manual or computer generated system in a place to produce overviews of work orders by order type (breakdown, scheduled maintenance, predictive maintenance) and by asset unit
1 2 3 4 5
5 Hour accounting 5.01 Do you have a manual or computer generated system in a place to produce overviews of hours booked by category and technician
1 2 3 4 5
5.02 Do you have a manual or computer generated system in a place to produce monthly overtime reports
1 2 3 4 5
5.03 Do you have a manual or computer generated system in a place to produce reports with productivity and sick leave/absence statistics
1 2 3 4 5
6 Spare parts control
6.01 Do you have a manual or computer generated system in a place to produce stock reports (balance and value) by (sub)group and stock location, as well as overall total stock levels, calculate depreciation
1 2 3 4 5
6.02 Do you have a manual or computer generated system in a place to produce transaction overviews by spare part and (sub)group, client/requestor, asset type and unit, budget
1 2 3 4 5
6.03 Do you have a manual or computer generated system in a place to produce stock reviews for non-, slow, and fast moving items, analyzing stock value and turnover
1 2 3 4 5
6.04 Do you have a manual or computer generated system in a place to produce categorized stock lists with item codes for lookup/reference by technicians and administrators
1 2 3 4 5
7 Purchase requisition
7.01 Do you have a manual or computer generated system in a place to produce overviews of purchase requisitions by status, showing requestor and/or work order details, supplier and date requested/promised/delivered
1 2 3 4 5
7.02 Do you have a manual or computer generated system in a place to produce categorized supplier lists
1 2 3 4 5
8 Fleet management 8.01 Do you have a manual or computer generated system in a place to produce fleet-level asset inventories (acquisition value, depreciation, current value, salvage value)
1 2 3 4 5
8.02 Do you have a manual or computer generated system in a place to produce overviews of key performance indicators (utilization, fuel/FOL consumption, up/downtime, age/status, costs) per equipment class, type and unit
1 2 3 4 5
198

ZERIHUN TARIKU HUNEGNAW
Student Number 77665880 PhD Scholar, Graduate School of Business Leadership
Comment Box: if you have any comment please feel free to write below. If the box is not enough use any paper and attach with this questioner
Thank You Very Much for Your Cooperation!
199

200
Zerihun
Typewritten text
Appendix V: Industries Research Permission Letters
201

202

203
204

205

206

207
208

209

210

211

212
Submission author:Assignment title:Submission title:
File name:File size:
Page count:Word count:
Character count:Submission date:
Submission ID:
Digital ReceiptThis receipt acknowledges that Turnitin received your paper. Below you will find the receiptinformation regarding your submission.
The first page of your submissions is displayed below.
Zerihun Tariku HUNEGNAWAssignment 1 FINALFinal ThesisZerihun_Tariku_Hunegnaw_776658…12.85M19157,961329,53912-Jun-2020 02:50PM (UTC+0200)1342556196
Copyright 2020 Turnitin. All rights reserved.213
Zerihun
Typewritten text
Appendix W: Turnitin Certificate