U. S. Geological Survey - USGS Publications Repository
89
UNITED STATES DEPARTMENT OF THE INTERIOR U.S. GEOLOGICAL SURVEY PROCEEDINGS OF THE WORKSHOP ON METHODS AND TECHNIQUES FOR DIGITIZING CARTOGRAPHIC DATA Open File Report 85-307 U. S. Geological Survey Reston, Virginia 1985
-
Upload
khangminh22 -
Category
Documents
-
view
0 -
download
0
Transcript of U. S. Geological Survey - USGS Publications Repository
UNITED STATES DEPARTMENT OF THE INTERIOR
U.S. GEOLOGICAL SURVEY
PROCEEDINGS OF THE WORKSHOP ON METHODS AND TECHNIQUES FOR DIGITIZING CARTOGRAPHIC DATA
Open File Report 85-307
U. S. Geological Survey
Reston, Virginia 1985

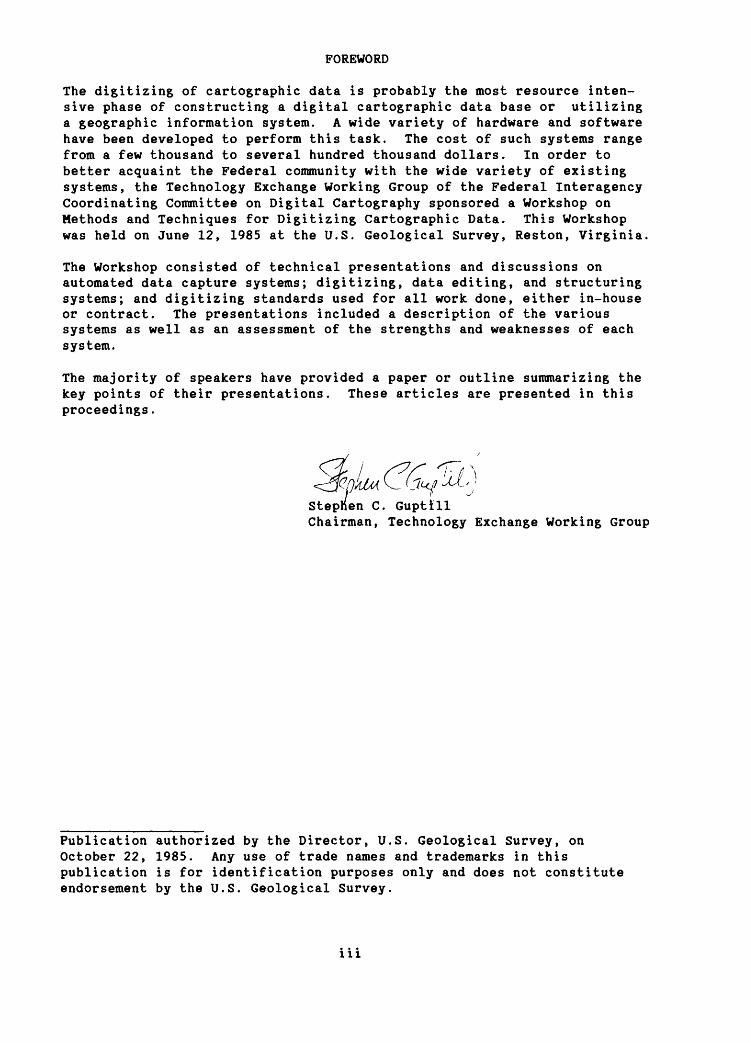
FOREWORD
The digitizing of cartographic data is probably the most resource inten sive phase of constructing a digital cartographic data base or utilizing a geographic information system. A wide variety of hardware and software have been developed to perform this task. The cost of such systems range from a few thousand to several hundred thousand dollars. In order to better acquaint the Federal community with the wide variety of existing systems, the Technology Exchange Working Group of the Federal Interagency Coordinating Committee on Digital Cartography sponsored a Workshop on Methods and Techniques for Digitizing Cartographic Data. This Workshop was held on June 12, 1985 at the U.S. Geological Survey, Reston, Virginia,
The Workshop consisted of technical presentations and discussions on automated data capture systems; digitizing, data editing, and structuring systems; and digitizing standards used for all work done, either in-house or contract. The presentations included a description of the various systems as well as an assessment of the strengths and weaknesses of each system.
The majority of speakers have provided a paper or outline summarizing the key points of their presentations. These articles are presented in this proceedings.
Stephen C. GuptlllChairman, Technology Exchange Working Group
Publication authorized by the Director, U.S. Geological Survey, on October 22, 1985. Any use of trade names and trademarks in this publication is for identification purposes only and does not constitute endorsement by the U.S. Geological Survey.
iii

CONTENTS _____ Page
The Scitex Raster Graphic Processing System, by M.P. Lee ............. 1Laserscan Automated Map Production System (LAMPS) at USGS, by
R.L. Gwynn ...................................................... 15Line Trace Overview, by R.L. Liston and T.W. Gossard ................. 23The Analytical Mapping System, by B.M. White ......................... 29BLM's Automated Digitizing System: ADS, by M. Mogg .................. 42Intergraph Use at Eastern Mapping Center, by G.L. Fairgrieve ......... 49Use of Computervision System within the Soil Conservation Service,
by E.L. Chapman .................................................. 52Local Interactive Digitizing and Edit System (LIDES) Overview,
by R.L. Liston and T.W. Gossard .................................. 59Advanced Cartographic Data Digitizing System (ACDDS), by
M.J. Gonsalves ................................................... 63Topologically Based Data Structure for Computer Readable Map and
Geographic System: TIGER, by R.W, Marx and F.R. Broome ............ 69
iv

THE SCITEX RASTER GRAPHIC PROCESSING SYSTEM
Michael P. LeeNational Mapping DivisionU.S. Geological Survey526 National CenterReston, VA 22092
INTRODUCTION
In 1978, the USGS acquired its first Scitex Response equipment to use raster-formatted data for digital cartographic applications. This initial purchase included two color scanners, two interactive editing stations, and one high-speed laser-drum plotter. Early applications research and development efforts with the Scitex addressed:
o Map replicationo Map revisiono Processed-image graphic generationo Computer-generated simulated-color orthophotoso Slope map thematic graphicso Open-window thematic graphicso Digital line graphics
Today, the USGS has the two original color scanners, fifteen (15) interactive editing stations and one upgraded laser plotter with both halftone and continuous-tone plotting capabilities. The system is in full production with on-going applications research continuing in such areas as the digital revision of 1:24,000-scale topographic maps, bulk data collection for 1:24,000-scale digital line graph (DIG) data-base categories, geologic map color separation, and high-quality Landsat image generation.
AGENCY APPLICATIONS
Currently, the USGS Scitex equipment is used as a bulk data entry and editing system in support of a joint USGS/Census Bureau project. The thrust of this project is to provide complete DLG transportation and hydrography data-base coverage of the United States at 1:100,000-scale for use in the 1990 census.
Briefly, color proofs of transportation and hydrography feature separates are prepared from 1:100,000-scale graphic sources. These proofs are scanned on the Scitex and the resulting raster linework files are interactively edited to ensure proper skeletonization (line thinning). After skeletonization, a raster-to-vector conversion of the data is performed and the vector data are output to magnetic tape. These raw vector data are then passed to an off-line structuring program which yields preliminarily structured DLG data files. These data sets in turn are loaded on interactive vector-based workstations (i.e., Intergraph) for further attribute tagging and editing.
RASTER DATA PROCESSING
Raster Data Structure
A matrix or array of spatially ordered numbers is termed a raster and each cell within it is called a pixel or picture element. The manner in which these numbers are ordered or structured varies according to application and computer storage requirements.
The most common data structure for cartographic applications is the linear list (Horowitz and Shani, 1978). Linear lists possess some sort of a single dimensionally ordered set of elements. The type of ordering is dictated by data processing requirements (i.e., line by line). Within the linear list structure are a number of substructures or coding schemes:
o Run codingo Chain codingo Column ending notationo Linked listso Sparse matrices
Raster processing entails the storage of large volumes of data. The development of these varied substructures has hinged primarily on the need for data compression, with specific concern to the type of data captured and stored, as well as the techniques utilized to process and manipulate the data.
The most prevalent linear-list substructures in cartographic use today are run coding and chain coding (Horowitz and Shani, 1978). Run coding is the most common raster data format, while chain coding is the most common vector data format. A brief comparison is provided.
The chain coding data structure has been used extensively for representing curves or sequences of points. The simplest way to describe a curve is to record X and Y coordinate pairs for each point or pixel of the curve. This method of storage is extremely inefficient, and can be improved by recognizing that any single pixel in a rectilinear array, as shown in Figure 1, has only eight possible neighbors.
Figure 2 shows a curve representation utilizing chain coding. This coding scheme records X, Y coordinates relative to a previous pixel in terms of direction. Therefore, an entire curve can be described by an initial X, Y position followed by a sequence of directions to the next points. This scheme only requires three bits to store the direction, thus providing substantial savings in storage.
Run coding is a simple coding technique for data compression. Images stored in raster formats contain segments or scan lines. Figure 3 shows such a scan line. If there exists a significant change in detail in this scan line, an "edge" is said to occur. The number of pixels from the first edge to the second represents a "run" of like pixels. If, as in Figure 4, the locating of

the end of a run is determined by counting the number of pixels from the beginning of the line to the end of the run, the data structure is called run-end coding. If, as in Figure 5, the locating of the end of a run is determined by counting the number of pixels from the previous end, the data structure is termed run-length coding.
Run-end coding requires a large, fixed number of bits to define each run position. Run-length coding requires fewer bits on the average, thus offering the advantage of storing an image in a smaller amount of memory (Pratt, 1978). The Scitex utilizes the run-length coding scheme for data collection, processing, and output.
Data Collection
The capture of data for raster data structures requires the use of special hardware devices commonly referred to as raster scanners. Unlike manual digitizing equipment, on which features of interest are traced and stored in vector chains, scanners convert a source document to a series of successive scan lines which contain values relative to optical densities present on the source manuscript. Early black-and-white scanners would optically sense the presence or absence of black linework on a source and store the captured data as a binary raster image; O's for white and 1's for black.
The pixel size, or resolution, or early scanners, varied from instrument to instrument, but today's commercially available scanners are capable of sensing data at 0.001 inch (1 mil) resolution. Color scanners with these resolution capabilities (such as the Scitex) have been available since the mid-1970's.
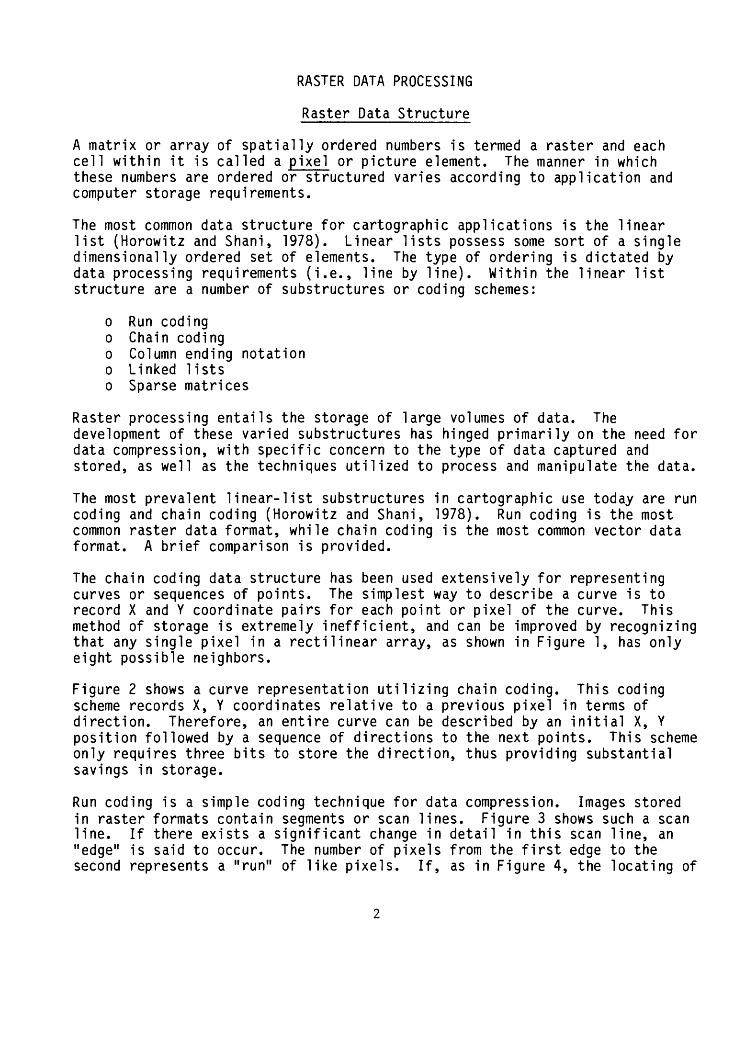
The current hardware designs of scanners generally fall into two categories; flatbed and rotating drum. Flatbed scanners, as portrayed in Figure 6, are composed of a flat table surface and a gantry which carries an optical sensing device. Source documents, which are held in place by a vacuum, are positioned on the table surface. Figure 7 shows the manner in which the sensor moves over the desired scanned area. This scanning order is termed "row prime" (Goodchild and Granfield, 1983).
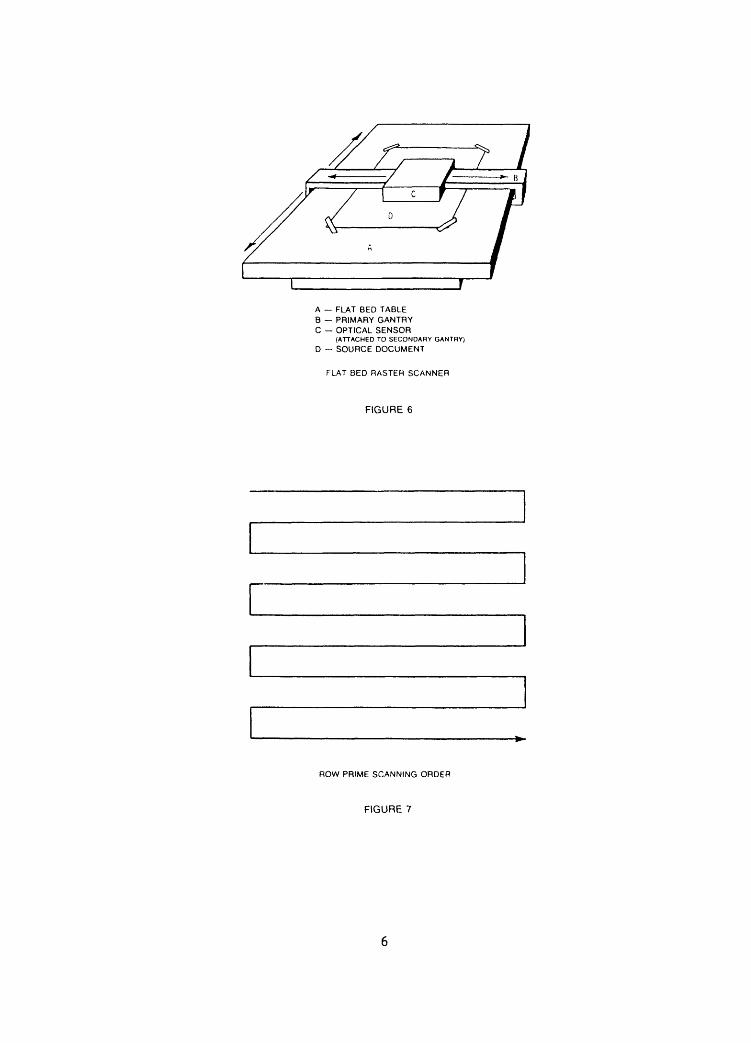
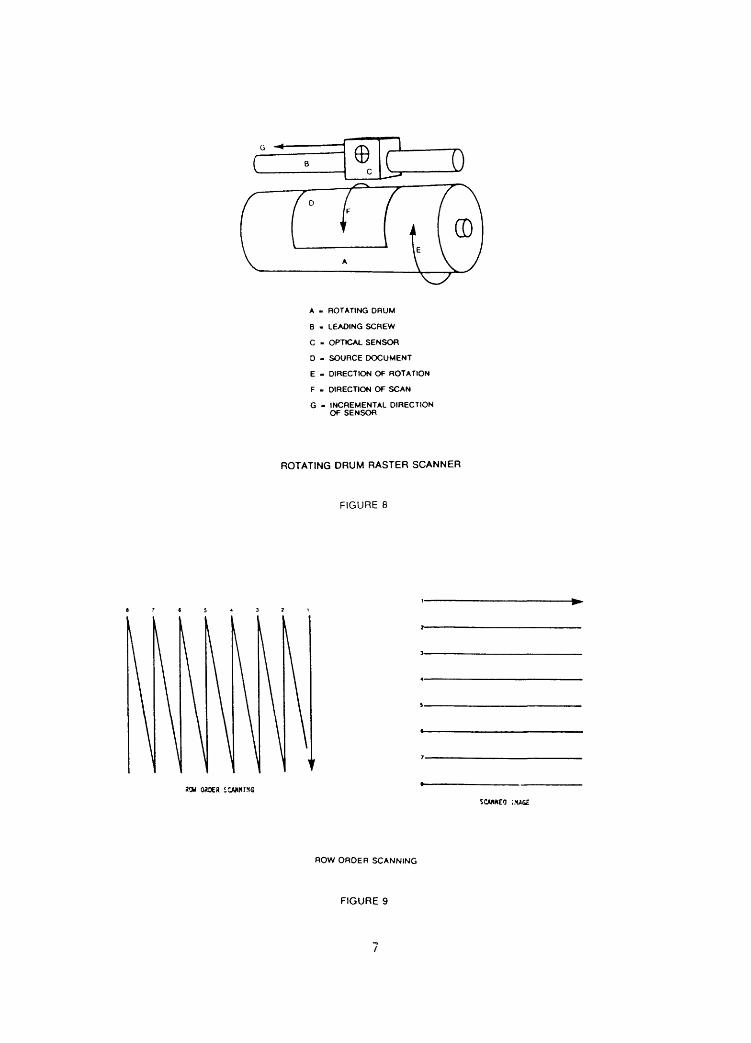
Rotating drum scanners, such as the Scitex and that which is portrayed in Figure 8, are becoming increasingly popular. These scanners are comprised of a rotating drum scanning surface and an optical sensing unit which is held in place above the drum by a leading screw. Source documents are mounted on the drum and held in place by a vacuum. As the drum rotates, the optical device senses a row of data and is then incremented by the leading screw to capture the adjacent row. As Figure 9 illustrates, this type of data capture is termed "row order scanning", with the first scan line sensed down the drum becoming the first scan line across the image (Goodchild and Granfield, 1983).
The Scitex scanner contains a 36-inch x 39-inch rotating drum and an optical head capable of sensing reflected color. Prior to scanning, the Scitex operator chooses a scanning resultion (which can range from 4 to 47 pixels per mm) and calibrates all colors on the source document.
The Scitex calibrates color by measuring the additive color reflectance characteristics of a color on the source. The additive colors are red, green,

\*-
/
tp
\
/ \
EIGHT POSSIBLE NEIGHBORS
FIGURE 1
2
A
1234 56
CHAIN -|2.31 1206670
BASIC CHAIN CODE
FIGURE 2

SCAN LINE
2ND EDGE
CHANGEOR
"EDGE"
RUN COOING
FIGURE 3
SCAN LINE POSITION
CODE - [ SCAN LINE | START X j END X | START X | END X | START X
RUN END COOING
FIGURE 4
SCAN LINE POSITION
CODE - |SCANUNE[ START x | AX | AX ] AX | AX
RUN LENGTH COOING
FIGURES
A FLAT BED TABLE B PRIMARY GANTRY C OPTICAL SENSOR
(ATTACHED TO SECONDARY GANTRY)
D SOURCE DOCUMENT
FLAT BED RASTER SCANNER
FIGURE 6
ROW PRIME SCANNING ORDER
FIGURE 7
e 7 6 5
sow osoea SCANNTMG
A - ROTATING DRUM
B - LEADING SCREW
C - OPTICAL SENSOR
D - SOURCE DOCUMENT
E - DIRECTION OF ROTATION
F - DIRECTION OF SCAN
G - INCREMENTAL DIRECTION OF SENSOR
ROTATING DRUM RASTER SCANNER
FIGURE 8
ROW ORDER SCANNING
FIGURE 9

and blue. Ideally, white would be 100% red, 100% green, and 100% blue. Black would be 0% red, 0% green, and 0% blue. Yellows typically possess high red and green percentages and a low blue percentage. Violets are high in red and blue content and low in green. Browns contain a moderate red and green percentage and a low blue percentage. By directing the optical head to each color on the source, red, green, and blue ratios are measured and stored for subsequent use in the data scanning process. During data capture, sensed ratios are compared with stored ratios and color assignments are given to each run length. The Scitex is capable of sensing twelve colors per scan.
This coding scheme is repeated until the end of the scan row is reached, at which time an end-of-line bit is set. The optical sensor is then advanced one resolution unit in the y-axis and is ready to capture the next scan line. Upon the completion of a scan, the raster data file is stored directly on magnetic disc and is ready for manipulation by the cartographer.
Interactive Data Manipulation
One way to manipulate data on the Scitex is interactively. Many times the altering of data requires human interaction to decide which action should be performed to affect a desired change. This type of processing is done at the Scitex edit station.
The edit station is composed of a 19-inch color display console, digitizing tablet, electronic stylus or cursor, a special function box, an alphanumeric terminal, a tape drive, a central processing unit (CPU), and two disc drives which provide online magnetic disc storage. Stored files on disc are accessible via the edit station. Files are called to temporary memory locations and interactive processing is performed. When editing is complete, the raster file can be restored on disc.
For interactive editing, it is desirable to view all or portions of the scanned file on the color console. Color channels, which correspond to the order in which colors were calibrated during the scanning process, are used to recreate the scanned image on the screen in colors that closely resemble those on the source document.
The color console's resolution is limited to a maximum of 320 pixels across and 256 pixels down the screen. Therefore, if a file possesses a resolution of 10 pixels per mm, a maximum area of 32.0 mm x 25.6 mm, at source scale, can be displayed in full detail. By zooming down, or sampling by one increment, the operator could quadruple the areal view of a file being displayed with only a slight loss of detail. In effect, every other scan line is eliminated (for display) as is every other pixel. The remaining image is compacted into one-fourth the original area and the surrounding voids are filled in with adjacent data using the same compacting method.
Zooming up, on the other hand, replicates the scan lines and the pixels within, but does not increase the detail; the finest detail attainable is at the scanning resolution.

The special function box enables the operator to move about the raster file in a display mode, in various zooms, as well as interact with the data. Coloring is the digitizing action involved in changing the color value of a pixel or group of pixels to any of the remaining eleven color channels. The function box is used to select the color to be drawn and the size, or width in pixels, of the color dot to be drawn. By placing the stylus on that area of the display that needs editing, the operator can press down and color the selected areas with the chosen color channel. Certain colors on display can be protected from this action and will not be overridden in the coloring procedure. This process is especially useful in correcting areas of a file which contain erroneously coded pixels caused by color mixing during the scanning phase. Many times transition areas will be sensed as some other calibrated color and improperly coded during scanning.
Automatic Data Manipulation
Scitex automatic functions are used to manipulate data in desired ways. These functions are initiated at the edit station's alphanumeric terminal. Some automatic functions allow interactive editing at certain phases of their execution. Other automatic functions do not need operator intervention and act upon a file in a global fashion.
All automatic functions use prompts to gain user-defined parameters. Knowing the functions and prompt entries which are necessary for execution prior to their use can facilitate a time savings if the operator chooses to batch certain automatic functions. The Scitex text-editor enables the operator to set up a series of function commands and prompt entries to (1) retrieve files from storage, (2) act upon them with either one or many automatic functions, and (3) store the altered files in the Scitex library. Using the text-editor in this fashion allows time-consuming operations to execute during non-peak hours and leave the peak periods for those operations that require operator assistance or interactive editing.
Data Output
The final component of the Scitex is the laser plotter. This equipment is used to plot images on photographic films. The most common apoplication of the laser plotter in cartography is producing color separation films for either compilation or reproduction purposes.
In either case, color separation is a costly process to perform photographically or manually. The Scitex easily performs these tasks. The plotter is composed of a 40 x 75-inch, high-speed drum, an argon laser, and a servo head which directs the laser beam onto the drum surface. The servo h ad moves horizontally across the rotating drum in the same manner as the scanner's optical sensor. Film is mounted on the drum and exposed with a pre-selected color channel; thus the color separation procedure becomes a plot-no plot activity, plotting only areas of a raster file which contain the identified color. Exposing all colors in the same fashion, on separate films, produces a set of color-separated positives or negatives, depending on the purpose of the separation procedure.

Another capability of the laser plotter is exposing all colors of a file in conjunction with screening options. By assigning different screen densities to each color to be exposed, half-tone screened products can be achieved using a single exposure by the plotter.
ATTRIBUTE CODING SCHEME
As discussed previously, the Scitex Response system uses a run-length encoding scheme for data capture, processing, and output. This data structure's primary attribute is color. In addition, it is assumed that the Scitex Operating System also assigns topological connectivity values to individual pixels above the pixel level for use in many of their processing algorithms. This type of attributing is transparent to the user and is beyond the scope of this discussion.
The Scitex is also capable of converting lineal features embedded in the run lengths into vector strings. Vectorization entails reducing lineal features within a file to one-pixel-width lines, or skeletons. Once in this form, local minimums and maximums can be detected and chain-like data strings isolated and combined to form vectors. This process is performed for each color line present in the raster file. During this conversion, each color is assigned a "font" code which, in itself, can be considered a vector attribute.
For the joint USGS/Census project, all raster linework is in one color and therefore, all vector strings derived from these files have the same font code. In the case of 1:100,000-scale transportation overlays, this font code corresponds to the DIG attribute code for fourth-class roads. (Fourth-class roads happen to be the most prominent features on 1:100,000-scale transportation graphics.) This DIG attribute is assigned during off-line processing and structuring. The resulting DIG files are subsequently loaded onto vector-based graphic terminals where first, second, and third-class roads are re-attributed and final re-structuring of the data commences.
In this context, the Scitex possesses a primitive attribute coding scheme within its vector data structure. Other attribute fields are present in these vector files (i.e., color, curve type, line weight, etc.), but their use is geared more toward vector-to-raster conversion and raster symbolization.
STRENGTHS AND WEAKNESSES
Strengths
A major strength of the Scitex Response system is high-speed data collection and output. Relatively quick raster scanning can be performed independent of a document's complexity and often takes only a fraction of the time other systems need for vector input. Scanning a document 24 by 36-inches at 20 points per mm takes 94 minutes. Plotting another document the same size and resolution requires less than 15 minutes.
Color encoding provides the flexibility of scanning monochrome or multicolored documents including lithographs. Monochrome source materials can be pre-digitally annotated with color markers to aid in the editing of unwanted
10
features and/or used as a guide to areas within a file that are known, through experience, to exhibit anomalies caused by processing algorithms. Where color separations of an existing lithograph are not available, the Scitex is an excellent solution to obtaining such products by scanning the lithograph, editing the raster file, and digitally separating colors on the laser plotter.
Variable input resolutions also enhance the usefulness of this digital tool. Depending on data density, data type, and associated accuracy requirements, a resolution can be selected to uniquely satisfy the needs of the user with respect to application, processing times, and output product quality.
Raster data manipulation is another strong feature of the Scitex Response system. Interactive editing at the Scitex edit station provides the opportunity to selectively alter and view data prior to output. Hundreds of automatic functions are available, many of which exploit the topologic properties (i.e., connectivity) inherent in raster data structures. These functions enable the user to alter, clean, and/or isolate data elements for specific applications. Macros of automatic functions can be constructed and batched during non-peak hours.
Scitex supports a system contained raster to vector capability. This eliminates off-loading data to ancillary systems to perform this process. Upon vectorization, data can be acted upon at the Scitex edit station or off-loaded to vector-based graphic systems for additional work. In addition, a variety of vector data structures can be accommodated by the Scitex. A primary use of this capability could be template tracking of vector data for a vector-to-raster/symbolization utility, but this type of application needs extensive testing and development. Some private industry concerns are using this type of application with their Scitex 1 s but their data/symbol requirements do not approach the complexities of topographic mapping.
Weaknesses
A major weakness of the Scitex is the extensive interactive editing often associated with many system applications. Because source materials are primarily color separations of existing graphics, digitally separating or deleting features which appear in the same color can become a very labor-intensive activity. This unfortunate condition adversely effects most production sceneries, though it is still considered more cost effective to employ raster graphic processing than to rely solely on manual vector encoding. Future research and development activities will address refining the pre-scan options available to the cartographer for preparing source material derivatives used in the scanning process.
Another "drawback" to raster processing is its relative newness in cartography when compared to vector technologies. Vector conceptualization is well established in digital cartography; thinking in raster is not. They are two different types of digital processing and raster data structures are often viewed as "lacking" when traditional vector-based capabilities cannot be mimicked. Understanding raster technology's niche in digital cartography, coupled with continuing research and development, should help dispel! this notion.
11

Other associated weaknesses of the Scitex include: (1) limited cartographic software development; the Scitex Operating System code is not available to customers, (2) a knowledge base located in Israel; software problems are resolved overseas resulting in slow response rates, and (3) purchasing for the public sector; Scitex equipment is very expensive and usually entails a sole-source procurement.
FUTURE SYSTEM PLANS
Currently, research activities are focusing on using the Scitex as a primary data collection device in digital data-base construction. Soon, a research project will be initiated to study a variety of data collection and processing scenarios for capturing graphic-based spatial information in support of 1:24,000-scale DLG hypsography and hydrography data-base categories. These categories, in turn, will offer the USGS and its customers greater opportunities to use these types of files to construct high-quality digital terrain models.
In addition, the continuous-tone upgrade to the Scitex laser plotter will enable the USGS to produce high quality, large-format Landsat images which closely resemble photographic prints. Increased contrast, edge enhancements, and the use of a black printer are all new capabilities provided with this upgrade. Future research will also address the use of the Scitex Response 280 to scan linework and text into the system and merge this data with the Landsat image prior to plotting.
REFERENCES
Gallauresi, D.R., et. al., "Interactive Raster Data Structure: Final Technical Report", Rome Air Development Center, Griffiss Air Force Base, N.Y., 1982.
Goodchild, M.F., and Granfield, A.W., "Optimizing Raster Storage: An Examination of Four Alternatives", Proceedings Auto-Carto Six, 1983.
Horowitz, E., and Shani, S., Fundamentals of Data Structures, Computer Science Press, Rockville, Md., 1978.
Peuquet, D.J., "An Examination of Techniques for Reformatting Digital Cartographic Data: The Raster-to-Vector Process", Cartographica, Vol. 18, No. 1, 1981.
Pratt, W.K., Digital Image Processing, 1978.
Smith, D.G., "Raster Data Development in the National Mapping Division, U.S. Geological Survey", Proceedings American Congress on Surveying and Mapping, Fall 1981.
12
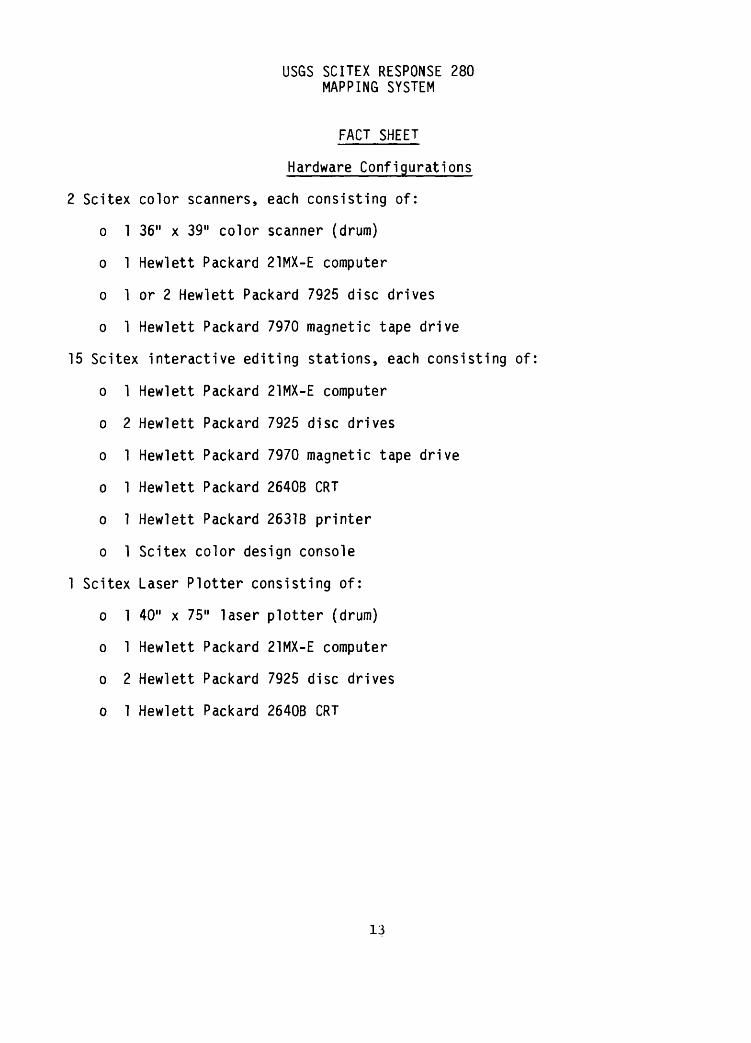
USGS SCITEX RESPONSE 280 MAPPING SYSTEM
FACT SHEET
Hardware Configurations
2 Scitex color scanners, each consisting of:
o 1 36" x 39" color scanner (drum)
o 1 Hewlett Packard 21MX-E computer
o 1 or 2 Hewlett Packard 7925 disc drives
o 1 Hewlett Packard 7970 magnetic tape drive
15 Scitex interactive editing stations, each consisting of
o 1 Hewlett Packard 21MX-E computer
o 2 Hewlett Packard 7925 disc drives
o 1 Hewlett Packard 7970 magnetic tape drive
o 1 Hewlett Packard 2640B CRT
o 1 Hewlett Packard 2631B printer
o 1 Scitex color design console
1 Scitex Laser Plotter consisting of:
o 1 40" x 75" laser plotter (drum)
o 1 Hewlett Packard 21MX-E computer
o 2 Hewlett Packard 7925 disc drives
o 1 Hewlett Packard 2640B CRT
13

Software
Scitex Response 280 software with scanning, plotting, and automatic/interactive editing capabilities.
Scitex Response 300 software with continuous-tone plotting capability.
Locations of Computer Facilities
Eastern Mapping CenterReston, VA2 scanners, 9 edit stations, 1 laser plotter
Mid-Continent Mapping CenterRolla, MO2 edit stations
Rocky Mountain Mapping CenterDenver, CO2 edit stations
Western Mapping Center Menlo Park, CA 2 edit stations
System Costs (all standalone)
1 Scitex color scanner with associated peripherals - $150,000
1 Scitex edit station with associated peripherals - $250,000
1 Scitex laser plotter with associated peripherals - $300,000
Agency System Contact
Michael P. Lee National Mapping Division U.S. Geological Survey 526 National Center Reston, VA 22092 (703) 860-6201
14

LASER-SCAN AUTOMATEDMAP PRODUCTION SYSTEM (LAMPS)
AT U.S. GEOLOGICAL SURVEY
Robert L. GwynnCartographer
U.S. Geological Survey526 National Center
Reston, Virginia 22092
INTRODUCTION
The Laser-Scan Automated Map Production System (LAMPS) is a standalone data acquisition system with capabilities for digitizing, editing, and plotting in vector format. The system will be used to create, update, and manipulate digital cartographic data. It provides a fast, efficient, and cost-effective method for database creation and map production.
The LAMPS at USGS recently passed acceptance tests and personnel are being trained to begin production activities. Flow lines are being developed to implement a semi-automated routine to digitize contour overlays. Since this is a new system no production cost or manhour figures are available. However, test results demonstrate that the system will increase throughput and reduce the manhours required to digitize contour data.
HARDWARE CONFIGURATION
Computer
The USGS LAMPS is a DEC 11/750 VAX-based system with a VMS operating system. Peripherals consist of two 456 MB disk drives, two dual density (800-1600 bpi) tape drives, and a line printer. Description of the other system hardware components LASERTRAK (Digitizer, Display, and Plotter) and the Laser-Scan Interactive Edit Station (LITES) follows.
LASERTRAK
LASERTRAK is a combined digitizer, display, and hard copy check plot system. It provides a semi-automated method of data capture using a local raster-scan technique. Interactive facilities allow the operators to use their cartographic judgment and experience while automating and speeding-up the otherwise tedious and repetitive task of data capture to produce digital vector files.
15
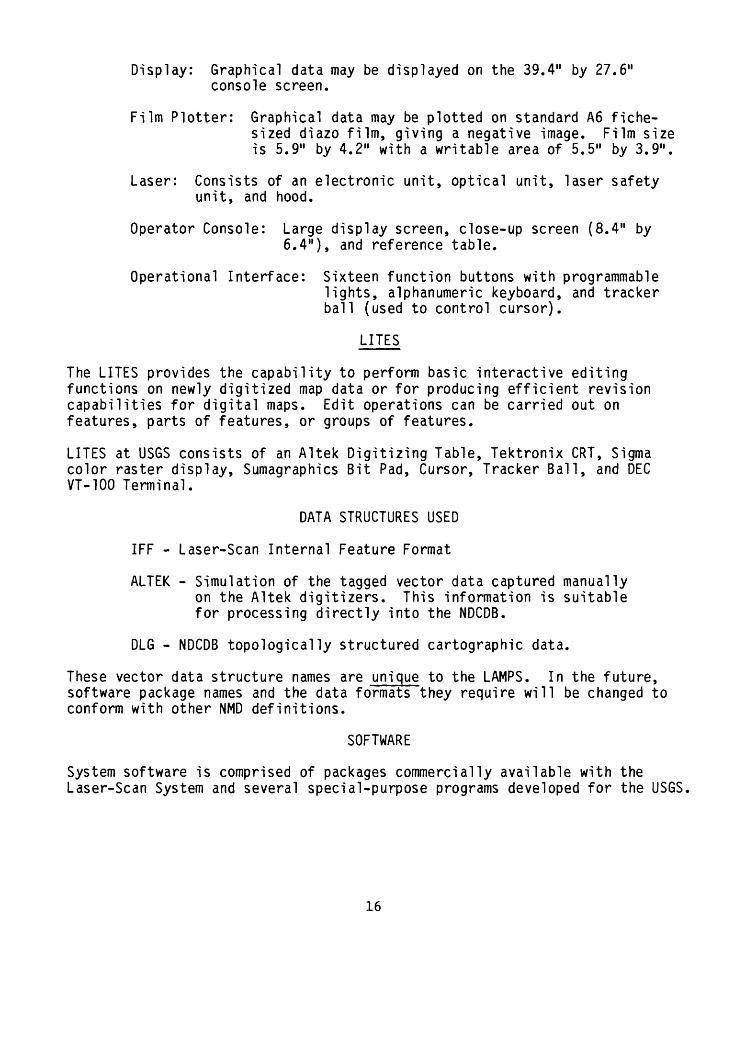
Display: Graphical data may be displayed on the 39.4" by 27.6" console screen.
Film Plotter: Graphical data may be plotted on standard A6 fiche- sized diazo film, giving a negative image. Film size is 5.9" by 4.2" with a writable area of 5.5" by 3.9".
Laser: Consists of an electronic unit, optical unit, laser safety unit, and hood.
Operator Console: Large display screen, close-up screen (8.4" by6.4"), and reference table.
Operational Interface: Sixteen function buttons with programmablelights, alphanumeric keyboard, and tracker ball (used to control cursor).
LITES
The LITES provides the capability to perform basic interactive editing functions on newly digitized map data or for producing efficient revision capabilities for digital maps. Edit operations can be carried out on features, parts of features, or groups of features.
LITES at USGS consists of an Altek Digitizing Table, Tektronix CRT, Sigma color raster display, Sumagraphics Bit Pad, Cursor, Tracker Ball, and DEC VT-100 Terminal.
DATA STRUCTURES USED
IFF - Laser-Scan Internal Feature Format
ALTEK - Simulation of the tagged vector data captured manually on the Altek digitizers. This information is suitable for processing directly into the NDCDB.
DLG - NDCDB topologically structured cartographic data.
These vector data structure names are unique to the LAMPS. In the future, software package names and the data formats they require will be changed to conform with other NMD definitions.
SOFTWARE
System software is comprised of packages commercially available with the Laser-Scan System and several special-purpose programs developed for the USGS.
16

Data Manipulation Package - (DAMP)
Package of Laser-Scan utility programs designed to perform map processing operation. Examples of these routines are:
Conversion Programs - Converts Laser-Scan Internal Feature Format(IFF) to different output formats.
Merge/Split - IFF data can be split or merged into new maps.
Non-graphic Editor - Using keyboard IFF editor.
Coordinate Transformation - Convert raw digitized maps into chosencoordinate system.
Clipping and Sorting - Clip maps to an exact rectangular outline and/orsort into overlays and features for output.
USGS Special Purpose Programs
Plot Routines
FPPGERB - for plotting IFF format on GERBER plotter
FPPVERS - for plotting IFF format on VERSATEC plotter
FPPKONG - for plotting IFF format on KONGSBERG plotter
VCTPLT - IFF to VERSATEC program modules
Output Routines
I2ALTEK - IFF to ALTEK format converter (DLG Files)
I2NMD - IFF to NMD format converter (DEM Files)
RAS2I - USGS coordinate filter and formatter
Input Routine
DLG32I - USGS DLG3 to IFF format converter
LASERAID - LASERTRAK Digitizing Software
ELZ - Edge Following mode
17

FLF - Fast line follower
LAJ - Junction capture version (LASERAID with junctions)
Command Procedures Package
Calibration Package
AGENCY APPLICATIONS
The immediate application for the LAMPS is the collection of line data from contour overlays. Special purpose software has been developed to accommodate all phases of this activity. The DLG and/or DEM files can be generated by utilizing digital data collected via the LASERTRAK or from data stored in the NDCDB.
The LAMPS digitized DLG data is suitable for input into the UCLGES. The DEM contour data is currently scheduled for processing through the Contour to Grid (CTOG) software located on the Perkin-Elmer computer.
ATTRIBUTE CODING SCHEME
The attribute tagging scheme is intended to provide dual output for processing into DLG or DEM files. The first step of both procedures is semi-automated feature tagging by the operator during the initial data capture. In the case of contour files, elevation tags are adequate for output to DEM processing software. In instances where DLG data requires multiple attribute codes, they must be keyed in at the LASERTRAK or at the LITES. Node generation is done automatically, as a background operation, in a batch mode.
STRENGTHS AND WEAKNESSES OF THE SYSTEM
Strengths
Speed of Data Capture - Allows operators to use cartographic judgment and add intelligence to data while eliminating many tedious and repetitive tasks associated with the capture of vectorized digital information. Digitizing speed is up to 15 times faster than manual line-following and produces a filtered vector representation of lines in real time to a user-specified tolerance.
Utilizes or Collects DLG Data - Special purpose software enables use or generation of DLG data without interfaces to other systems. Up to this time, multi-system processing has been required to collect and/or utilize DLG data.
18

Efficiently Handled Networked Contour Data - This capability provides a method to collect DLG and DEM data to support current production activities. The DIG data will be added to the NDCDB and the OEM's will provide data for the Offline Orthophoto Printing System (OLOPS).
Semi-Automated Tagging Capability
Operator can automatically add one feature and an elevation during the initial data capture.
Junction Recognition
When line-following the LASERTRAK is able to detect and analyze junctions. The number of arms to a particular junction is determined and a unique junction coordinate point is derived. These point values are stored for reference and the same node values are generated when the other lines intersecting that junction are digitized.
Node Generation
Eliminates a costly, time consuming task associated with manual digitizing. This information is subsequently used to generate the topological structure required by the NDCDB.
Weaknesses
LASERTRAK
Preparation of Source Material
Expense - LASERTRAK uses a film negative which is a photographicreduction of the original source document. This is a more time consuming and expensive operation than the one-to-one reproductions used by other USGS digitizing systems.
Size - For digitizing purposes the readable area on the film negative is 3.8" by 2.7". This size constraint increases the amount of preparation required to digitize overlays of existing 7.5-minute quadrangles. Some maps can be done in two sections but other factors such as geographical location, line weights, and density of data may necessitate splitting the original map into four or more sections.
Limited Amount of Auto Tags at Scanner
The LASERTRAK has the capability to automatically generate one feature tag and an elevation value to each line at the time it is digitized.
19

Additional codes must be added manually via the keyboard before the feature is accepted for storage to disk. The ability to automatically add multiple codes would help to expedite digitizing and eliminate the probability of errors on complicated categories of data.
Too Much Operator Intervention Required
Although the LAMPS is a new system, there appears to be potential for more automation. Several digitizing processes could be optomized to reduce operator intervention. For example, the operator helps the system through all junctions by indicating the line to be followed. On neat lines or grids this procedure could be automated by providing end points or an azimuth of the line to be digitized. In some cases fully automated elevation tagging could be accomplished by providing a high-and-low value then defining the direction of slope. The current edge joining routine requires the operator to indicate the line ends that are to be joined. There is a distinct possibility that this activity could be at least partially accomplished by automated methods.
LITES
Restricted Ability to Add Multiple Attribute Codes
With the current system the operator can automatically ado only one feature code and an elevation value during initial data capture. Minor codes can only be added by manual methods at either the LASERTRAK or LITES. In both cases, each of the individual codes must be manually input to the appropriate elements. This tedious and time-consuming process can be partially solved by the development of special purpose software.
The current system does not provide the ability to add attribute information to nodes, areas, or degenerate lines. Development of this capability is a prime requirement to assure the implementation of a more efficient routine to digitize all categories of cartographic data.
Cannot Write User Commands or Macros to Optimize Operator Efficiency
The current version of LITES does not permit the development of user customized techniques through user commands or macros. Several data manipulation procedures would be optimized by the capability to combine individual menu commands into one function. Macros could provide the ability to define useful editing functions that are not already available in the system.
20

TYPICAL DIGITIZING SESSION
The LASERTRAK is a relatively new method of data capture and a very limited number of people have obtained hands-on experience. A description of a typical digitizing session is included to provide some feel for use of the system.
Preparation - A film negative is produced from the original source document, inserted in the Optics Unit, projected at X10 magnification on the large console screen. A line-width range of .0012" to .012" on the reduced negative can be detected by the LASERTRAK. Before any measurements can be made, the signal detection threshold is set to a level suitable for the contrast of the negative.
Initialization - The system is initialized by reading the calibration coefficients from a file, and the material to be digitized is registered to the required coordinate system by measuring the corner points. This establishes the scale and orientation, and removes any dependence on the precision of the photographic reduction factor or on the alignment of the negative in the holder.
Feature Coding - By means.of the control console the operator can classify and code features at the initial capture stage. This is accomplished by selecting the appropriate function button at the time of initial alignment. The feature number automatically increments by a pre-determined value or is entered by the operator via keyboard. This function has proven to be valuable for digitizing contours.
Feature Selection - On entry to the main loop, a red cursor and feature number are displayed on the screen. The operator can select the features that are to be digitized and has complete control over the order of selection. The cursor is moved via the trackerball to indicate the feature the operator wants to digitize.
Digitizing - The cursor is also used to define the direction of the line.It takes the form of two parallel lines which are moved so the line to be digitized is centered between them. The line following is then started, operator assistance is required if irregularities halt or divert progress. Ambiguities can be corrected by the operator, i.e., connecting two line ends of manually digitizing points along the line. Progress of the line follower can be viewed by watching the red cursor track the feature to the end.
Feature Evaluation - When the LASERTRAK reaches the end of a line the operator has the ability to accept, reject, or view the digitized feature. Under normal circumstances the digitized line is accepted
21

without question. If there is a concern about integrity of the data, the feature can be viewed, in a filtered or unfiltered mode, on the close-up screen. If a feature is determined to be unacceptable it can be rejected and redigitized. An example of an unacceptable feature is when the system jumps between contour lines in an extremely dense area.
Feature Acceptance - The operator accepts a completely digitized feature by pushing the END button. The newly digitized feature will then be erased from the console display screen. The paint-out serves several purposes: (1) Verifies accuracy of digitizing, (2) prevents double digitizing, (3) eliminates omissions (as some features are painted out others become progressively clearer), (4) provides a built-in progress check, and (5) provides ability to continue partially completed jobs; after initial registration previously digitized data is painted out. To digitize another feature repeat the procedure beginning with feature selection.
Future System Plans
In the near future, developmental efforts will begin for the implementation of production procedures to capture other categories of map data to support the 100K census project, MARK II activities, and data collection for the NDCDB. Although the system has been proven capable of collecting other categories of cartographic information, additional development will be required to meet different project requirements. Other attribute tagging routines will be developed through spcial purpose software or utilizing interactive editing procedures. Further testing is required to evaluate the merits of both methods.
The LAMPS also appears to have great potential for the collection of land-use/land-cover data. The ability to digitize line data or open windows seems to be ideally suited to this type application.
REFERENCES
Antell, R.E., 1982, The Laser-Scan Fastrack Automatic Digitizing System, AUTO CARTO 5, Crystal City, VA, August 22-28, 1982, pp. 51-64.
I.C.A.A.C.I., 1984, Computer Assisted Cartography Research and Development Report, pp. 94-96X
Laser-Scan, 1985, Technical Publications (LAMPS, LASERTRAK, LITES).
22

LINE TRACE OVERVIEW
Richard L. Listen and Terry W. GossardU.S. Department of Agriculture
Forest Service - Engineering StaffGeometronics Development GroupP.O. Box 2417, Room 1109-RPE
Washington, D.C. 20013
INTRODUCTION
LINE TRACE was developed by the USDA Forest Service, Engineering Staff, Geome tronics Development Group in support of mapping activities at the Agency's Geo metronics Service Center (GSC) in Salt Lake City, Utah. System software is presently optimized for digitizing standard U.S. Geological Survey (USGS) con tour plates and resource oriented, thematic polygon formatted map sheets. Vec torizing is achieved through software based line following of raster scan data. Line following, tagging, and edit occur simultaneously in a highly interactive environment under complete operator control.
The Forest Service's GSC, established in 1975, is responsible for preparing and updating all 1:24,000 primary base series (PBS) and 1:126,720 secondary base series (SBS) maps over National Forest System lands. The total area of interest encompasses approximately 10,500 primary and 330 secondary base map sheets.
LINE TRACE was operational at GSC in the fall of 1983. Primary use has been in the generation of digital terrain data in support of orthophoto generation. Orthophotos are a layer to the primary base map series.
HARDWARE CONFIGURATION
LINE TRACE is supported by four highly interactive work stations, each of which supports digitizing, tagging, and editing of scanned line maps. Each work sta tion consists of:
A 1024 X 1024, 19-inch, monochromatic, high resolution, RAM refreshed display monitor (Mitsubishi).
An alphanumeric display terminal (Hazel tine Corp.) and keyboard for command entry.
. A trackball with two button switches supporting cursor movement and point/line selection (Management Systems, Inc.).
23

All work stations are supported by software resident on a Digital Equipment Corporation (DEC) POP 1144 with 256 Kb of 16-bit memory. Each pair of stations is controlled by a display processor (Grinnell Systems Corp.) supporting six (three per station) 1024 X 1024, 1-bit, memory refreshed planes, and a video look-up table, the latter providing grey scale remapping capability. Other sys tem components include:
A (Trilog T-100) printer/plotter.
An (Digi Data Corp.) 800/1600 bpi, 9-track tape drive.
A separate video terminal supporting system maintenance and program development.
An auto-dial modem and communications interface supporting program development and maintenance from a remote location.
An (Plessey Peripheral System) 80-megabyte disk storage system.
Raster scan data is provided by a stand-alone (Optronics P-1000) scanning sub system consisting of: a 10-inch drum scanner with 8-bit (256 grey scale) resol ution; aperature plates ranging from 400 to 12.5 microns; and associated 800/ 1600 bpi tape drive, system controller, and video terminal.
Hardware configurations are shown in Figure 1. Total hardware costs (1982) were approximately $75,000 for the scanner subsystem and $200,000 for LINE TRACE com ponents.
SOFTWARE CHARACTERISTICS
LINE TRACE is programmed entirely in the FORTH programming language under PolyFORTH II, the 1982 version supported by FORTH Inc., Hermosa Beach, Cal i form'a.
FORTH is a high level language ideally suited for real time interactive applica tions, such as LINE TRACE. It is highly interactive, makes efficient use of memory, and is very fast. For the programmer, FORTH provides a core resident assembler and compiler along with a small, fast interpreter, executive, and text editor. New, English-like command words are defined in terms of previously defined words or directly in terms of assembler instructions.
The LINE TRACE application code resides in seven overlay modules in a multi tasking environment. Overlays provided, and their definitions, are:
TAPES - Project initialization, raster data input, and thresholding
ADMIN - Project descriptive information
REGISTER - Map registration point coordinate collection
RETOUCH - Raster data edit tools and thinning
24

OPERATOR TERMINAL
h-TAPE
10-INCH DRUM SCANNER
AGNETIC TAPE
MINICOMPUTER
^r.*v ̂ X / /
DISPLAY. PROCESSORS
-MATRIXPRINTER/PLOTTER
/4 INTERACTIVE GRAPHIC WORK STATION! WITH HIGH RESOLUTION DISPLAY, LPHANUMERIC TERMINAL AND
TRACKBALL
SYSTEM TERMINAL
HARDWARE CONFIGURATION
Figure 1.
25
LINES - Contour or polygon digitizing, tagging, and edit
JOINING - Joining polygon processing blocks
SHIPPING - Data compression and output
HELP screens enable an operator to quickly review both the overlays and commands available within an overlay. Their usage in conjunction with access to a previ ously trained operator have enabled new operators to acquire a firm grasp of system capabilities within 2 to 3 days.
In the LINES environment, LINE TRACE makes use of a fast but highly interactive, software based, line following algorithm for extracting line pixel coordinates from raster scan data. Line following actually takes place on one of the three 1024 X 1024, 1-bit, memory refresh planes supporting each work station. As the line is being followed, a highlighted trace is displayed to the operator, thus differentiating the line currently in process from the background graphic.
Line following, tagging, and edit take place simultaneously on a line-by-line basis in a highly interactive environment. For this reason, it is normally pre ferable that line labels be left on the source scan document. This provides a convenient reference for tagging, thus minimizing the distraction associated with frequent looks away from the graphic monitor to view a composite map sheet.
LINE TRACE operation is very similar to manual digitizing with the exception that the operator has at his/her disposal some very powerful tools to make the task easier, less error prone, and faster.
The fundamental principle adhered to in software design was to provide the ana lyst the tool kit necessary to process source documents of varying quality in any of several different ways. It is left to the analyst to decide what should be digitized, how it should be digitized, and what tools should be used for both digitizing and handling data anomalies. The tools available include:
Tools for extracting line work from scanned source documents, thus enabling lines to be represented as ones (Is) and background as zeroes (Os); i.e., interactive thresholding.
Pencils, erasers, rulers, and rectangular masks for cleaning up the source document.
A line width thinning tool to support centerline digitizing.
A fast, software based line follower with sufficient intelligence to recognize line breaks, closure, and edge of data.
Commands enabling an operator to stop line following, erase portions of a line, reject a line, or accept a line.
A manual digitizer under control of a trackball cursor.
26

An operator or software controlled microscope for close-in digitizing and edit with operator selectable magnification.
Commands supporting manual or automatic increment and decrement of con tours by the contour interval.
. Digitizing modes permitting manual or automatic selection of lines to be digitized.
Display options enabling composite viewing of digitized line work and associated labels as overlays to the source graphic document.
Post-edit commands enabling retrieval of previously digitized line work, retagging, and repositioning of labels.
Joining commands providing for the reassembly of polygon strings following segmented processing of the source graphic.
. Data compression tools reducing the number of x,y coordinate pairs required to adequately represent a line for a given application.
DATA STRUCTURE AND ATTRIBUTE CODING
Each line is represented on disk as a feature record and a string record. The feature record contains: a system assigned feature number; a label reference; the line start and end point x,y coordinates; a closure flag; a link address pointing to the string record; and other data elements, type depending on whether the line represents polygon or contour data. The label reference in the case of contour data is an elevation. The same reference for polygon data points to a label table entry containing an ASCII string of up to 20 characters. The string record retains full resolution line data by storing a pixel count and direction for each direction vector making up the line.
Data files are placed on magnetic tape using commands available in the SHIPPING overlay. Data output includes:
Project descriptive information (the ADMIN file).
. Map registration data (the REGISTER file).
. A label table, if polygon data (the LABEL file).
Labeled strings of x,y pixel coordinates with associated string header information (the LINES file).
All data are formatted in the Forest Service standard ASCII or EBCDIC RIDS poly gon Data Exchange Format.
27

PRODUCT STATISTICS AND PLANNED SYSTEM IMPROVEMENTS
Generating Terrain Data Files for Orthophoto Quadrangle Production
Even though most 1;24,000 7.5-minute quadrangles within the Forest Service area of interest are in areas of relatively high relief (i.e., dense contours), GSC production statistics show an average of 10 hours per quad to digitize, tag, and edit contour plates scanned at 6-mil resolution.
LINE TRACE generated terrain data are then merged with spot elevation data in flat areas (e.g., lakes). Spot elevation data is digitized manually on a Intergraph POP 1134 based digitizing and edit system. The data are then archived as arrays of randomly collected spot elevation terrain data files, from which Wild OR1 orthophoto projection drive tapes are later generated.
Future plans are to investigate alternatives for collecting spot elevation data on the LINE TRACE system to relieve production demands on the Intergraph System.
Polygon Digitizing
^Polygon digitizing, tagging, and edit throughputs have averaged 1 hour per 100 polygons at raster resolutions of 25 mils. Current production rates are limited by the time spent tagging individual polygons. Recent enhancements provide for off-line generation of label position tables with LINE TRACE being used to trace polygon boundaries, thus providing more efficient use of LINE TRACE capabili ties.
Polygon digitizing is full boundary digitizing, not arc/node. As a result, the current software outputs an x,y coordinate pair for each pixel (full resolution) in an effort to eliminate slivers. This has resulted in x,y coordinate strings whose dimensions may exceed array size limitations of a given geographic infor mation system (GIS) package. Plans are to implement a point elimination capa bility to minimize future problems.
Future plans also include development of a program for conversion of LINE TRACE data to topologically structured arc/node data files.
REFERENCES
Listen, R.L., 1983, LINE TRACE: An Interactive Line Following, Tagging, and Edit System; ACSM-ASP Fall Convention Proceedings, Salt Lake City, Utah, pp. 406-419.
28

THE ANALYTICAL MAPPING SYSTEM
Barbara M. White Computer Specialist
Western Energy and Land Use Team U.S. Fish and Wildlife Service
2627 Redwing Road Fort Coll ins, CO 80526
INTRODUCTION
The Geographic Information System (GIS) originally developed by the U.S. Fish and Wildlife Service's (FWS) Western Energy and Land Use Team (WELUT) has three software components: the Analytical Mapping System (AMS) for digital data entry; the Map Overlay and Statistical System (MOSS) for data processing, analysis, and display; and the Cartographic Output System (COS) for enhanced cartographic products. This paper describes the AMS data entry component of the GIS as it is operating at the WELUT facility in Fort Coll ins, Colorado.
BACKGROUND
The Wetlands Analytical Mapping System (WAMS, since shortened to the AMS) was initially developed for the FWS's National Wetlands Inventory project in 1976. At that time, applications of the AMS centered on wetlands mapping from aerial photography, using the Analytical Photogrammetric Plotting System (APPS). The APPS comprised the hardware component, developed concurrently with the AMS software. In 1978, the AMS was rewritten for the Data General C330 minicomputer at WELUT. The geographic analysis system, MOSS, also under went its final stages of development and became the primary analysis component for the geographic data entered with the AMS. New resource management applica tions came with the availability of data entry and analysis software, which did not require input from photogrammetric sources. The AMS was modified at WELUT to accept data from table digitizers to meet the demands for digital map data. WELUT soon began using the AMS in a production mode and subsequently became a center for the maintenance and development of table digitizing capabilities. The FWS's National Wetlands Inventory office in St. Petersburg, Florida, currently supports and maintains the APPS digitizing capabilities.
Several Department of Interior land agency offices have adopted the AMS in recent years. The FWS's National Coastal Ecosystems Team in Slide!!, Louisiana; the FWS's Region 7 Office in Anchorage, Alaska; the Bureau of Land Management's (BLM) Colorado State Office in Denver, Colorado; and the U.S. Army's Engineering Topographic Labs in Ft. Belvoir, Virginia, have installed the AMS as part of their geographic data processing capabilities.
29

HARDWARE CONFIGURATION
The AMS originally was written to run on the Hewlett-Packard 9830, when the primary use for the program was photogrammetric applications using the APRS. Since 1978 and the addition of table digitizing capabilities, the AMS was rewritten and maintained for the Data General series of minicomputers, beginning with the C330 and C350 16-bit models and, most recently, for the MV8000 and MV4000 32-bit models.
The AMS program, maintained and operated at WELUT, runs under Data General's Advanced Operating System (AOS) and the AOS/Virtual Storage operating system of the MV series computers. The minimal hardware requirements include a Central Processing Unit (CPU), a disk drive for random access of mass storage, a tape drive for long term data storage, a printing device for hard- copy text output, and a plotting device for hardcopy graphics output. Examples of hardware configurations and the software needed for running the AMS are provided in Table 1.
The AMS program can support the APPS plotter and several digitizing stations; each station is comprised of several pieces of hardware. A typical digitizing station at WELUT has the following hardware configuration:
Altek digitizing table - backed by a wire grid that provides digitiz ing accuracy of approximately 1/1000 of an inch.
Cursor - sends electrical impulses to the digitizing table, generat ing points which are later converted to coordinate pairs.
Blue Box - interfaces between the digitizing buttons of the cursor and the Gold Box (AMS interface).
Gold Box - basically is a microcomputer with read-only-memory that interfaces the digitizing device (either a digitizing table or an APPS) with the CPU and translates points into latitude/longitude pairs and serves as a hardware buffer to temporarily store coordinate points when they are received too rapidly to be processed by the CPU. Software recently was developed to emulate the functions of the Gold Box; however, the emulator developed at WELUT does not adequately handle the high rate of data input for increment and stream modes of digitizing.
Button Box - connects to the Gold Box and includes the digitizing mode (i.e., the point mode) used by WELUT.
Graphics display terminal - allows constant monitoring of the digitizing process.
Alphanumeric terminal - allows direct communication with the computer and interaction with the AMS.
The AMS program will run on a variety of graphics display terminals, alphanumeric terminals, and digitizing tables. Hardware can be shared depending on the workload.
30

Table 1. Examples of hardware configurations and software needed for running the AMS.
Hardware and software
Computers:
Data General S280 (comparable to C350)
16-bit processor512 kilobyte main memory353 Mb disk drive800/1600 bpi magnetic tape driveOperator consoleAOSAdditional software
Data General MV4000
32-bit processor2 megabyte main memory353 megabyte disk drive800/1600 bpi magnetic tape driveOperator consoleAOS/Virtual StorageSoftware entitlements
Data General Desktop Generation Model 20
16-bit microprocessor1 megabyte main memory1 floppy diskette drive1 30 megabyte hard disk driveCartridge tape driveTerminalPrinterAOSAdditional 1 megabyte main memory
Plot 10 compatible graphics display terminal and hardcopy unit
Alphanumeric terminal
Digitizing tablet and/or APPS
Plotter/output device
AMS software
31

SOFTWARE DESCRIPTION
The AMS consists of three major software packages: (1) the Photogrammetric Subsystem, (2) the Digitizing Subsystem, and (3) the Data Base Management Subsystem. The necessary information for the efficient and successful opera tion of these subsystems is contained in the AMS System Manager's Guide (Autometric, Inc. 1979). An AMS System Manager's Guide (Zack and Sandelin 1985) is currently being written for the version of the AMS maintained at WELUT. This AMS System Manager's Guide will include: a comprehensive description of the primary processes within the AMS main menu, file specifica tions, startup procedures, cause and effect of data set errors, and a list of procedures to correct a data set error. The Data General Text Control System can be used to cross-reference the AMS routines called by several programs, as well as to generate an alphabetical listing of source codes.
The most recent AMS user's manual (Autometric 1979) available for general distribution was written in 1979. Since many enhancements have occurred and most menus have changed since 1979, a user's manual (Sandelin and D'Erchia 1985) is being written at WELUT to reflect the version of the AMS currently maintained and operated at WELUT.
An AMS Acceptance Test document (Zack 1985) was written in conjunction with an acceptance test utility program to test various functions in a new or existing operational version of the AMS. The utility program is a user friendly, menu-driven testing system that allows the user to easily perform the various test functions currently in the data base. Knowledge of the AMS program is required to evaluate the results and document any problems or failures in the tested version. The draft report includes: an explanation of each option in the acceptance test menu and its submenus, step-by-step directions for completing the 57 test functions currently available in the data base, and software documentation to assist users and system managers in performing the acceptance test on operational versions of the AMS.
DATA ORGANIZATION AND STRUCTURE
Geographic information entered into the AMS is organized on the basis of individual maps (geounits) that are classified according to project and theme. The maps are not stored in a permanent data base until all of the data entry has been completed for a single geographic data theme (such as land use, soil type, vegetation type, or elevation). Storage of the data base in project and theme directories is separated from the user directory, which contains work files that are appended as data are entered.
Maps are identified by the geographic coordinates of the map's center point or "geounit center ID". A data-based map is located in a theme directory and is composed of five files, named with the nine digit geounit ID, and prefixed with a letter that indicates the data type (e.g., A395610903). This directory also stores a list of the attributes allowable for the classifica tion scheme being used; this file is cross-referenced as attributes are entered during digitizing.
There are two types of projects, USAA and "project data base". USAA automatically verifies the geounit center ID coordinates for GS standard topo graphic maps (7.5- and 15-minute quadrangles, and 0.5 x 1 degree [1:100,000]
32

and 1x2 degree [1:250,000] map sheets). Centers for "irregular" maps, not printed under a standard format, are computed through another process and are classified as a "project data base", a necessary designation for maps with irregularly spaced control points. When this option is selected, the operator must enter the geographic coordinates for each border encompassing the map or maps to be digitized. An interval is specified that divides the area into equal units with the same edge relationships as USAA maps when a "geoblock" contains several adjacent maps. The program then calculates the geounit centers for each map unit. Projects, themes, and classification schemes are created and edited in the Data Base Functions set of routines.
The user work area is the initial storage location for map data and remains independent of the data base. Each work area can contain up to nine different jobs (maps) in various states of processing at any given time. The Job Index File tracks the progress of all active maps in the work area. Work being done on a map in the user area will not affect maps already stored in the data base until the map is moved to the data base. The user will be alerted by the AMS program if any updates are required to adjacent maps due to the new map transferred to the permanent data base. All segment, polygon, node, attribute, and translation information is stored in the work area files until a map is completed, at which time six files (see Data Base Transfer) are transferred to the permanent data base under project and theme directories. Work area directories link each job with its respective project and theme, and with hardware and processes.
AMS INFORMATION FLOW
The AMS is a sophisticated digitizing, editing, and data base management system used to extract ground information for any size area from map sheets or aerial photographs for efficient data storage and further computer-assisted analysis (Fig. 1). Since the digitizing process requires that the information is presented on maps and photographs which conform to specific conditions (i.e., data format), time and money is needed for map preparation to ensure topologic consistency and quality. If aerial photographs are used, the known camera parameters and ground control points for the photogrammetric triangula- tion process must be obtained for storage in the AMS data base.
Map Preparation
Map information may go through several manual processes before it is entered into an AMS digital data base. Most data are obtained from remotely sensed sources, usually aerial photography. Ground features of interest are interpreted, delineated, and labeled on the photography according to a specific classification scheme. For table-digitizing, the interpreted features are transferred from the photos to standard scale base maps (e.g., 1:24,000 quad rangles) using a zoom transfer scope. The features are drawn onto a mylar overlay in pencil that is later inked and labeled for use in the data entry process. Since the data entry process is the most expensive, most time- consuming, and most tedious aspect of a GIS application, quality control is an important consideration in map preparation.
33

u-
FEAT
URE
INTE
RPRE
TATI
ONAN
D DE
LINE
ATIO
N
AERIAL
PHOTOGRAPHY
TRI
ANGULATION
DATA
CAMERA
INTERIOR
ORIE
NTAT
ION
FRAME
ID C
HECK
EDGE
IN
FORM
ATIO
N
DATA B
ASE
MANA
GER
DIGI
TAL
RECO
RDS
OF
FEATURES
PHOTOGRAMMETRIC
TRIANGULATION
PROCESS
TRI
AN
GULA
TION
RESULTS
DIGI
TIZI
NG
PROCESS
OPER
ATIO
NAL
DATA B
ASE
f CO
NTRO
L 1
CAME
RA
PARAM.
CAMERA
PARAM.
DATA
BASE
STOR
AGE
GENERAL
INFORMATION
Fig
ure
1.
AMS
info
rmatio
n
flow
.

Map Registration
Maps, from which data are digitized, usually contain grids of tick marks referencing one or more of the major coordinate systems: Geographic, Universal Transverse Mercator (UTM), or State Plane. Although the AMS relies exclusively on the latitude/longitude coordinates of the Geographic system, MOSS routines are available that convert UTM and State Plane map coordinates to latitude/ longitude.
Registration involves selection of several "control" points for which geographic coordinates are known and table coordinates can be measured. In a mathematical sense, geographic coordinates are designated as the dependent variables, while the table coordinates are the independent variables. Linear models can be formulated from these sets of data that describe the relation ships between the two coordinate systems. Several map types typically are used by an agency to graphically represent data. The AMS, therefore, provides options for registering standard maps, as well as less commonly used "irregular maps".
Data Capture
Mapped geographic features are classified into three types of map data: points, lines, and area or polygon. The point, line, and area data can represent several characteristics such as size (length, perimeter, number of points), distance (proximity, narrowness, contiguity), and configuration (shape, orientation, disperson). The ultimate objective of the AMS is to tie points, lines, areas, and attributes into a coherent network of related features.
AMS segments are captured simultaneously with attributes and nodes. Each segment has three attribute characteristics: the line itself (as in the case of a point or linear features) and identifiers for the polygonal areas to the left and right of the line. These three attributes are entered just prior to digitizing each segment and are cross-referenced in terms of the legality of the character strings entered with classification scheme files (see Data Organization and Structure). Coordinates are directly associated with attri butes; data types do not need to be separated into different themes.
Quality control is provided through use of a checkpoint test. The check point test is performed after 20 segments have been digitized. The purpose of the test is to determine if a geounit has been physically disturbed since the set-up or previous checkpoint test. If a checkpoint fails, all segments digitized since the last successful checkpoint can be deleted from the data set. If the test is successful, all segments are written to a permanent file and digitizing may continue.
The AMS has the capability of assigning unique attributes to data as part of the digitizing procedure. There is no unique symbolism capability in the AMS; however, labels and identifiers can be attached to data for graphic purposes only, using the CARTOGRAPHICS edit procedures.
"Like-attribute" digitizing is now available in the version of the AMS supported by WELUT. Like-attribute digitizing assigns an attribute to all segment data. This capability decreases the time involved in digitizing by allowing the operator to concentrate on segment data capture apart from
35

attribute assignment. A polygon assignment function allows for reassigning attributes following 1 ike-attribute digitizing. This function requires a geounit to pass polygon verification and formation without error. A new polygon attribute can be assigned by: (1) physically identifying a polygon, (2) identifying a polygon number, or (3) renaming an old attribute. Each technique assigns a new attribute to respective segments composing the target polygon and any associated islands. To identify a polygon, the operator uses a cursor to "spark" a point location within the target polygon. Unique features permit the operator to assign a specific attribute to one polygon or several in succession. To ensure quality control, the operator can view the polygon number and old and new attributes during assignment and list and display polygons according to number and attribute.
Parallel with data capture, the program GEOCOPY allows the user to copy all arc data in the current map/theme to another theme. GEOCOPY is used to keep an identical set of coordinates that describe a feature common to two or more themes, such as ownership boundaries.
Map Editing
The AMS edit functions are located in the digitizing menu under the Table Digitizing Subsystem (Table 2) and require input primarily from the registered map. Display capabilities, however, are necessary to verify the feature on which an operation will be performed. The edit functions can be used to delete features, change attributes, and divide segments. Deletion of a node results in deletion of the segments tied to the node. Similarly, deletion of a polygon results in the deletion of all associated segments, even though some segments may be associated with neighboring polygons.
Segment and polygon attributes can be modified by using the CHANGE ATTRIBUTE option under the digitizing menu or the POLYGON IDENTIFICATION/ ASSIGNMENT option under the Table Digitizing Subsystem which does not require access to a registered map. This option allows an operator to display polygon data by geounit, number, or attribute; to list polygons with their attributes and areal magnification; and to clear the geounit data without setting up a map.
Labels, used for cartographic display, can be inserted into a map using the CARTOGRAPHICS option. The desired location of the label is digitized first. A small box indicating the position of the label is displayed, and the location of the feature is sparked, tying it to the label. Cartographic "lead lines", if necessary, can be digitized at this point. These labels can be edited as needed.
Cartographic functions in the AMS also allow an operator to: (1) change the interactive display window; (2) locate and identify textual labels and lead lines; (3) repack/renumber valid textual labels and lead lines, provided features are deleted; and (4) control/change defaults for the following program functions: intended map product scale, interactive text string display, string angle entry method, item value mode, and defining values for textual labels and lead lines (including label or feature attribute usage, label text, text font character height, character width, label text angle, label location, line style, line coordinate data, and color codes for labels and lead lines). Thus, the operator can visually enhance AMS products.
36

Table 2. Menu structure of the AMS (Version 1.03) program maintained and operated at WELUT.
Menu options under the Main Menu
Submenu options under the Main Menu options
1. Data Base Specifications
2. Table Digitizing Subsystem
Options to set the default values for project, theme, and station parameters.
Options for digitizing and editing a map. The Cartographies menu options are located under the AMS Digitizing Functions menu.
Options for computer verification.
Plot options.
3. APRS Digitizing Subsystem
4. Photogrammetric Subsystem
5. Utility Options
6. Report Options
7. Restricted Options
Options include data base options to create use area, project, and theme; GEOCOPY; and data-basing a map.
Options for digitizing using the APPS hardware.
Options to perform aerotriangulations and to create/edit the camera and frame data bases.
Options include locate map points, transform map points, unlock data sets, change node criteria, and magnetic tape functions.
Options for various summary reports, data set file dumps, and DAP (Dataset Analysis Program).
Options include change password, data base options to delete project and theme, and RESCUE (program used to view or modify job file records).
37

Hardcopy plots are generated by the AMS under the PLOT set of routines. Plotting a digital map involves two steps: compiling the segment coordinates and attributes from the map files, which are then scaled and reformatted for the particular plotting device.
Polygon Formation/Verification
Polygon verification can be run in the AMS in either interactive or batch modes. The interactive mode is controlled by the operator to a large extent, whereby the operator must correct errors as they are detected. Batch mode automatically collects a list of errors that can be repaired by the operator at a later time. Typically, the operator runs a map through verification at least twice to ensure that all errors are corrected. No polygons exist prior to the initial run through the program, and all segments must be processed. Many polygons are successfully formed and verified following the first run and require no further processing.
The AMS breaks down polygon formation/verification into eight primary tasks, each addressed by a separate subroutine and controlled by the verifica tion program:
VI - Checks for crossed segments at each node.
V2 - Identifies all segments modified since the most recent run through verification.
V3 - Generates several parameters for later use in polygon formation.
V4 - Simultaneously sorts edge nodes clockwise from the northwest corner of the map and searches for edge nodes not linked to a segment.
V5 - Handles the actual formation of polygons, including island polygons.
V6 - Assigns island polygons formed in the V5 to their parent polygons. Any polygon or group of polygons totally enclosed by, and not connected to, the parent polygon is classified as an island and must be identified with its parent polygon. This operation is necessary to retain the island/parent spatial relationships, primarily for area computations and feature searching for editing and display.
V7 - Adjusts polygon records to indicate the presence of islands and points to parent polygons, as well as to other islands within the same parent.
V8 - Completes the verification process by searching for changes in the edge node file which necessitates updates to adjacent maps. The data base management system flags maps that require updates and informs the operator as the verification process is exited.
38

The verification process recently was expanded to include the VI subroutine that checks for crossed segments at each node, identically digitized segments, and degenerate segments attached to a node. The island assignment software was also improved to ensure that each island is assigned to its correct parent polygon.
Data Base Transfer
A map is considered complete and can be moved to the permanent data base in the AMS after final successful polygon verification. This is a relatively simple process that involves a basic file copy and directory change. The five files in the user work area that contain the most important data are trans ferred to the data base. These five files are the Normal Node File, the Segment Index File, the Edge Node File, the Polygon File, and the Segment Coordinate File. The files are labelled A through E, respectively, followed by the geounit center ID. Registration parameters from the Restart File also are transferred into the Polygon File (D). After the transfer is complete, the operator can delete all the work files from the user area, which opens up space for new jobs.
STRENGTHS/WEAKNESSES OF THE AMS
Many of the positive features of the AMS have been emphasized throughout this paper in describing the system processes. However, the AMS is not a perfect system and lacks some important features that may detract from its appeal.
A detailed analysis of the strengths and weaknesses of the AMS (process by process) is contained in the draft report "A Comparison of FWS and BLM Geographic Data Entry Systems" (Hansen et al. 1984). This report includes a summary of the responses obtained from two surveys conducted to determine the opinions of data entry operators, computer programmers, and system analysts working with the system, and specific information on changes and/or enhance ments made to different versions of the AMS since the report was written.
Several changes have occurred in the AMS maintained and operated by WELUT: the polygon identification/assignment software was added; the verifica tion program was expanded to check for crossed segments at nodes and misassigned islands, and several editing functions can be performed by the operator without having to register (set up) a map.
Strengths of the AMS include the following capabilities:
System limitation of 32,767 segments or polygons.
Takes advantage of CPU processing capabilities by writing most routines with double precision accuracy.
Includes a photogrammetric capability and has further option of collecting data from photo models.
39

Registers a variety of maps and photographs (assuming an APRS capability) at any scale, provided that sufficient control points can be identified and described in geographic coordinates.
Provides a very comprehensive data base management system to account for both maps in progress in user work areas and maps completed and stored in the data base.
Accurately defines ground position in terms of predicting geographic location (projection).
AMS users have also identified several weaknesses in the system, including:
Outdated menus, help files, and software documentation.
Available help commands provide a minimal amount of information, typically a one-line description of what the command does.
Length of AMS attributes limited to 16 characters.
Cartographic capabilities are somewhat limited, and the plotting hardware has limitations in terms of producing highly accurate hard copy plots.
Attribute positioning is required to plot attributes on AMS hardcopy plots, which is both time-consuming and limited to attribute positioning techniques.
AMS data sets can be viewed in any format except the readable ASCII format.
Functions used by both the APPS and table digitizing are sometimes difficult to modify (e.g., a positive change to one may have a negative effect on the other one).
Learning the code is difficult due to lack of AMS documentation.
AGENCY APPLICATIONS
The digital data produced in the AMS are reformatted for entry into MOSS, the primary geographic information analysis package used in the FWS. The reformatted data are used to build digital data bases in MOSS and to generate high quality map products in COS. Raw AMS data can also be used to produce black and white COS products.
Applications of the GIS technology developed at WELUT focus on natural resource management and planning efforts. Computer-assisted resource manage ment applications supported by the FWS include:
40

Fish and Wildlife Species Analysis and ModelingFish and Wildlife Habitat Suitability DeterminationsRegional Resource PlanningNational Wetlands InventoryNational Wildlife Refuge Master PlanningNational Wildlife Refuge ManagementWetland Change AnalysisCoastal Zone PlanningCoastal Wetland ChangesRiparian Habitat AssessmentLand Use PlanningEnergy Development AssessmentResource Management Plan DevelopmentCoal Management ProgramOil Shale Management ProgramTarsands Development PlanningForest Management PlanningForest Pest Management and Impact AssessmentSoils/Land Use AssessmentSoils Primary Sample Unit Selection and AnalysisLand Records Information Management
REFERENCES
Autometric, Inc., 1979, The Analytical Mapping System (Data General Eelipse with AOS), Revision 2, Autometric, Inc., Falls Church, Va., 59 p.
Hansen, D. B. , Dwyer, M. F., and and BLM Geographic Data Entry Systems,
Mogg, M. A., 1984, A Comparison of FWS U.S. Fish and Wildlife Service, Western
Energy and Land Use Team, Draft Report, Fort Coll ins, Colo., 218 p
Sandelin, User 1 s Manual,
J. D. and D'Erchia, F., 1985, The Analytical Mapping System U.S. Fish and Wildlife Service, Western Energy and Land Use
Team, Fort Collins, Colo., (In prep.).
Smith, B. and Zack, J., 1984, Addendum. Analytical Mapping System, Version 1.03. In Hansen, D. B. , Dwyer, M. F. , and Mogg, M. A. A Comparison of FWS and BLM Geographic Data Entry Systems, U.S. Fish and Wildlife Service, Western Energy and Land Use Team, Draft Report, Fort Collins, Colo.
Zack, J. S. and Sandelin, J., 1985, Analytical Mapping System Version103, System Manager's Guide (Data General Eclipse with AOS), U.S.Wildlife prep.).
Service, Western Energy and Land Use Team, Fort Collins,Fish Colo.
and (In
Zack, J. S., 1984, Analytical Mapping System (AMS) Acceptance Test User's Manual (Version 84.1), U.S. Fish and Wildlife Service, Western Energy and Land Use Team, Draft Report, Fort Collins, Colo., 393 p.
41

NAME OF SYSTEM: AUTOMATED DIGITIZING SYSTEM (ADS)
Marilyn MoggCartographer
Bureau of Land ManagementBuilding 50
Denver Federal CenterDenver, CO 80225
INTRODUCTION
Hardware Configuration
CPU - Data General models: C330, M600, MV8,000, MV10,000 Data General Model 20 Desktop
Digitizing Tablets - Calcomp models: 8000, 9000, 9100 .001" resolution Altek backlit Tektronix
Command Entry and Editing - Tektronix series: 4010, 4050Tektronix series 4110 Visual 500 ADM
Plotting - Zeta models: 8, 3600Calcomp models: 907, 960, 1070
Software
ADS is the data entry module of the Bureau of Land Management Geographic Information System, ADS/MOSS/COS (Automated Digitizing System/Map Overlay Statistical System/Cartographic Output System). It has routines to handle the registration of a variety of source maps and diagrams. Point, line and aerial
42

data can be collected and stored in ADS files. ADS allows digitizing through several modes, including point-to-point, stream and increment. It also has up to 42 commands for editing data, such as moving points, adding points, attributes, and deleting items, etc.
Location of Computer Facilities
Denver Service Center - (center for development, maintenance, and technology transfer)
*Data General C330 and peripherals for software testing -State Offices of Alaska, California, Colorado, New Mexico, Oregon, Wyoming
*full operational capability with CPU and peripherals - State Offices of Idaho, Nevada, Utah, Arizona, Montana
peripherals networking to other sites
System Costs
Hardware -
- Processing: $30,000 - $200,000- Entry Station: $12,000 - $30,000- Plotting: $50,000 - $200,000
Software -
- Public domain software, developed in-house- Maintenance and enhancement cost - approximately three workyears/year
BUREAU CONTACT
Eric StrandChief, Branch of Graphics Systems DevelopmentBureau of Land ManagementDenver Service CenterD-441P. 0. Box 25047Denver, CO 80225-0047
43

BACKGROUND
The Automated Digitizing System (ADS) was originally designed to be the data entry module to an automated land record system. It was the first concept of what is now known as ALMRS (Automated Land and Minerals Record System). At some point in its early development, ADS was linked to MOSS (Map Overlay Statistical System), and as the field became more aware of other agency applications of various geographic information systems for resource management, ADS/MOSS evolved as the Bureau of Land Management CIS. This evolution involved several enhancements to increase and streamline its capability for entering a variety of resource data types, and to decrease its emphasis on land records.
Since BLM is a land management agency, its primary application of a GIS is for resource inventory and analysis to aid in Bureau functions in the following areas:
- resource management planning- environmental impact assessment- monitoring land use- reclamation- leasing
The ADS/MOSS/COS system is also being investigated for certain tasks in cartography, such as compilation and negative plate production.
ADS System
The ADS system consists of several modules performing separate tasks related to data input. These tasks include: data capture, editing, output, data base maintenance, and links to the analysis software. The 17 specific functions are as follows:
1. Capture data with ADS REV.6.2. Edit data in ADS REV.6 format.3. Zeta plot of nodes after closure.4. ADS REV.6 to MOSS conversion5. Execute MOSS.6. Read-Display-Print MOSS data files.7. Create an ADS production plot.8. Create Zeta plot of an ADS menu.9. Create an ADS menu.10. Display master map file.11. Delete maps from ADS data base.
44
12. Clean up ADS master map file.13. Update ADS master map file.14. Delete maps from MOSS data base.15. Printout/display ADS help files.16. Document a program or macro.17. Halt execution.
ADS is a menu-driven system. A separate menu is chosen for each theme or layer of data to be digitized so that each theme is stored in a separate data file. The menus are operated from a tablet location and contain all data entry commands necessary for capturing data to provide a convenient system for program operation, with a minimum of manuevering between tablet and terminal. The list of commands is as follows:
-enter point data-enter line data-enter line data (offset)-enter line data - multiple theme-enter line data (offset) - multiple themes-enter text (descriptive)-display geographic coordinates-edit map file-enter attributes-assign polygon shading attributes-enter section number attributes-change themes (data types)-move the menu to a new position-pause until ready-display this map on Tektronix-end of job
ADS' origin as a land record system is evidenced by those commands developed specifically for entry of township, range, sections, and their attributes.
The menu system also allows the operator to specify up to 90 point symbols, 36 line symbols, and any number of shading symbols to correspond to the data being digitized. Shading types can be varied by operator-specified spacing, angle and pattern.
ADS uses several registration routines to accommodate a variety of source materials, including 7.5 minute and 15 minute quads, sources with geographic control in quad format, and diagrams with no control at all. Two methods are used to predict geographic coordinate values. One, used specifically with 7.5 minute and 15 minute quads, is a geometric fit in which the program assumes a conic projection.
45

Another registration method uses a least squares method to predict coordinates. It allows the operator to input as many known control points as desired, breaks the map into "patches" with four known geographic corner coordinates, and then the corresponding table coordinates are used to derive coefficients for two first-order polynomials; one for predicting latitude and the other for predicting longitude. This method is more useful for smaller-scale source materials.
Point, line, or aerial data can be digitized with ADS, using one of several types of digitizing modes, including point-to-point, stream, or increment. Formation of polygons is handled by a separate routine in ADS, called closepoly. Closepoly identifies intersections in digitized line data, creates nodes, forms a file of the nodes and their joining arcs, and finally forms polygons, tagging each with its attribute or attributes. Closepolycan be performed interactively or in batch processing. This allows the operator to digitize the linework randomly and without regard to direction, intersections, or attributes (referred to as "free form" or "spaghetti" digitizing).
Attributes can be entered for any of the three types of data by entering the attribute on the keyboard and positioning it by sparking its location on the tablet, or by identifying its location with crosshairs on the CRT. There are very few, if any, attribute encoding standards in the Bureau except those developed for each particular project. Even though there are a few themes that are collected for most projects, such as ownership status, and landnet data, very little effort has been expended for developing standardized attributes. With consideration being given to an automated mapping program, this issue is being examined as to the feasibility of maintaining encoding standards for selected themes.
One of the elements of ADS that makes it a versatile system is its editing capability. The editing module has more than 40 commands that allow interactive editing of lines, points, and attributes, as well as a variety of display commands to allow plotting, windowing or zooming, overlaying, and edgematching.
ADS was developed to allow data entry with a variety of hardware (vendor) types. The typical configuration consists of several stations driven by a minicomputer and interfaced with a plotting device. A station is made up of a digitizing tablet with at least .001" resolution. Most of the tablets used by the BLM are also backlit. Command entry and editing are accomplished on a Tektronix or Tektronix emulating vector display terminal. A hardcopy device may be an additional optional piece of equipment.
46

Strengths of System
Users of the ADS system find the extensive editing capability of tremendous benefit for maintaining quality control. The commands are easy to use with sufficient on-line help documentation to allow the new user to use even the most obscure editing command. The method of entering aerial data by digitizing lines in the "spaghetti" method is extremely efficient in terms of human labor. A typical 7.5 minute quad with soils-type data with an average of 150 polygons can be digitized in four hours. Another half an hour would be required to run the closepoly macro. A landnet theme for a 7.5 minute quad can be digitized, encoded, and polygons formed in less than an hour. Users and project managers also appreciate the ease with which ADS allows updating of existing map files, and the variety of methods available for labelling and tagging features.
Weaknesses of System
Several weaknesses have been identified through intensive use of the system. These are as follows:
1) The registration routines are limited. It has been suggested thatgeometric fits for predicting coordinate values is not valid for many projections. The system also requires that all sources be in a quad format so that patching can be accomplished. This restriction eliminates many source materials with the most up-to-date information.
2) The ADS to MOSS conversion routine is limited. Data can be converted to MOSS format in the UTM projection only. This limits the user's capability in terms of output products.
3) ADS has no projection capability.
4) System and programming documentation is sometimes out-of-date, sketchy, or non-existent, making system updates, corrections, and enhancements difficult. There is also a lack of documentation regarding the limits of the system.
Future Plans
A study was completed in cooperation with the Bureau of Land Management and the Fish and Wildlife Service to analyze the capabilities of the two data entry systems used by these agencies. Its goal was to identify areas in which the two systems were similiar and dissimiliar and make recommendations for the improvement of each system. It is the BLM's intention to enhance the Bureau's system to reflect the best of both systems. Some specific plans are:

1) to improve the registration routines to handle nonformatted source materials.
2) to enhance its compilation capabilities. Users would like to see some capability for building data from existing data, such as aliquot parts from sections, and data entry from keyboard entry of coordinates.
3) to incorporate projection capability to make output more versatile.
4) to improve the availability of all types of documentation.
48

INTERGRAPH SYSTEMS USE IN EASTERN MAPPING CENTER
Gary L. Fairgrieve U.S. Geological Survey, EMC
1925 Newton Square East Reston, Virginia 22090
SYSTEM CONFIGURATION
The Eastern Mapping Center (EMC) Intergraph Systems are all located in our facility at Newton Square in Reston, Virginia. There are also Intergraph Systems in each of the other three National Mapping Division production centers and one in the EROS Data Center. The systems at Eastern Mapping Center are configured as shown:
System 1
POP 1170Five Graphics Workstations256KB MemoryTwo 300MB Disk DrivesTwo 80MB Disk DrivesOne Alphanumeric TerminalThree Tape DrivesOne Line PrinterOne System Console
POP 1170Three Graphics Workstations192KB MemoryTwo 300MB Disk DrivesTwo 80MB Disk DrivesOne Alphanumeric TerminalThree Tape DrivesOne Line PrinterOne System Console
System 2
49
Agency System Contact
There are two systems managers responsible for the EMC Intergraph Systems and software development associated with the systems. They are:
Bob Lazar and Karen Milliard U.S. Geological Survey, EMC 1925 Newton Square East Reston, Virginia 22090
APPLICATIONS
The initial production project associated with the Intergraph systems was the production of the I:2,000,000-sca1e data base. This data was col lected soley on the EMC Intergraph system and allowed our first evaluation of the equipment and procedures in the production environment. This project was 16 man-years of Intergraph digitizing effort.
The EMC Intergraph systems are currently being used in several different applications of the equipment. The current major application is associated with production of I:100,000-sca1e data. The data being captured using Scitex scanning equipment and are being passed to Intergraph systems for attribute tagging according to USGS data standards. Road data are being tagged by the Bureau of the Census and reviewed using a combination of plots and the Intergraph systems.
The Intergraph systems are also used to review Land Use Land Cover digitizing that is done under contract. They will be used in the review of I:l,000,000-sca1e data that is being contracted and the review and acceptance of 7.5-minute data produced under contract.
Other uses of the systems include applications by the EMC Special projects Group to produce requested digital and graphic products to meet the needs of other USGS Divisions and requests from other agencies. Digitizing and/or the revision of existing digital data may be required.
STRENGTHS AND WEAKNESSES
The new VAX-based systems with the color capability have demonstrated a substantial production time savings for the data review process. These systems and associated software have shown improvement in our attribute coding production. A major advantage is the flexibility to perform operations associated with many digital products.
There are problems associated with having two systems in production operations that are drastically different in their operating systems and capabilities.
FUTURE SYSTEM PLANS
Eastern Mapping Center would hope to keep the two POP 1170 systems in production through Fiscal Year 1986 and then replace them with additional stations on the VAX systems or with other types of systems. Naturally these plans depend upon budget considerations and program direction. The equipment condition and maintenance support will also be important to these future plans.
50

System 3
VAX 11/780Five Graphics Workstations8 MB MemoryTwo 300 MB Disk DriveOne 675 MB Disk DriveTwo Graphics ProcessorsTwo V80 PlottersOne Line PrinterThree Tape Drives
VAX 11/780Five Graphics Workstations8 MB MemoryTwo 300 MB Disk DrivesOne 675 MB Disk DrivesTwo Graphics ProcessorsTwo V80 PlottersOne Line PrinterThree Tape Drives
System 4
Software
Systems 1 and 2 are running using version 7.6 of the Intergraph Operating Systems. The new systems 3 and 4 are operating under version 8.6 with a planned upgrade to version 8.8 of the software. Software has been written to take data between our digital systems and to take DLG-3 data from the National Digital Cartographic Database (NDCDB) into the Intergraph System and to display Digital Elevation data.
Software was purchased with the new VAX-based systems to provide us DEM viewing and editing capability and to take advantage of the color capability of these systems. The EMC systems manager is completing the software to allow interactive edit of DLG data including the translators into the system and output to other systems.
This software effort has been concentrated in the areas of taking Scitex produced data into the system for attribute tagging and taking data that has been tagged by others into the system for error detection and correction. The current production of l:100,000-scale data and the deadlines associated with the project have driven the concentration in this area.
Software Costs
The two systems purchased 8 years ago cost about $500,000 each. The two VAX-based sysems including the software packages and Fortran 77 compilers were $1.2 million each.
51
USE OF COMPUTERVISION SYSTEMSWITHIN THE
SOIL CONSERVATION SERVICE
Edgar L. Chapman
National CIS Coordinator Cartography & Geographic Information Systems Division
United States Department of Agriculture Soil Conservation Service
P.O. Box 2890 Washington, D. C. 20013
INTRODUCTION
The Soil Conservation Service (SCS) is concerned about wise use of our soil resources. Over the years, SCS has mapped and accumulated a great amount of soil data as a part of the National Cooperative Soil Survey (NCSS) Program. The soil survey is a valuable aid for land users and land use decision-makers.
SCS is presently responsible for collecting, analyzing, displaying and distributing natural resource information including soil survey data. For the past 9 years, SCS has used Computervision equipment to support their automated mapping activities, which includes the digitizing of detailed soil surveys. This paper discusses the Computervision hardware and software used by SCS and the strengths and weaknesses of this equipment in supporting SCS digital activities.
BACKGROUND
A soil survey is an "on-the-ground11 inventory of soils as they occur on the landscape. Published soil surveys have three main parts: (1) maps that show the geographic distribution of the different kinds of soils,(2) text that describes/characterizes and classifies the soils, and(3) tables that evaluates/interprets the soils for different uses. Soil surveys are made by trained and experienced soil scientists employed by SCS and cooperating agencies.
The soil survey is one major source of many sources of information needed to describe, analyze and understand the total natural resource system. Users rely on soil survey information to help them make sound decisions regarding land use and land management. Planners, land developers, engineers, realtors, farmers, local and state governments, foresters, researchers, scientists, educators, community officials and environmentalists are among the many users. The requests and needs for digital soil data from both private and government sectors are increasing.
52

In 1970, SCS procured a Gerber photoplotter (Model 77), which was used primarily for plotting control grids in support of the agencies map mosaic activities. This system consisted of a Hewlett Packard 16 bit processor with 16K memory, a controller, a 9-track 800/1600 BPI tape drive, a table with a 60" x 96" plotting surface, a pen plotter head, a scriber head and a photo head. This plotter was upgraded to a Model 4477 in 1983, and is presently used for producing press ready materials from digital data in support of the National Cooperative Soils Survey (NCSS) Program, and SCS, national activity mapping program.
In 1976, SCS procured approximately $ 2.5 million dollars worth of computer equipment as an initial effort to implement automated mapping technology within the agency. This procurement action was accomplished through a Request for Bid (RFB). Although Computervision was awarded the contract, they had to assemble CPU and peripheral hardware from several different vendors (i.e., Data General, Control Data, Tektronix, etc.) to meet SCS specifications. Digitizing capabilities were installed in all four SCS regional centers with the primary expertise available through the northeastern region located in Lanham, Maryland.
The Lanham office, which has since been attached to the SCS National Headquarters Cartography and Geographic Information System (CGIS) Division Staff has been assigned developmental responsibilities for SCS digital activities. An SCS reorganization in 1982 provided for the central location of cartographic services, including the digital capabilities, at the National Cartographic Center (NCC) in Fort Worth, Texas. Both CGIS and NCC provided detailed soil digitizing and interpretation services, utilizing 6, 16 bit processors, 12 interactive digitizer-edit stations and a Calcomp pen plotter at each location. CGIS had, in addition to these peripherals, a Computervision flat-bed raster scanner and a Gerber photoplotter, and was responsible for the national level mapping and interpretations, and all technical support and software development. The scanner, which was also procured in 1976 was a flat-bed, variable speed, electro optical, raster scanner which was one of only a few scanners that Computervision manufactured. The scanner could only detect solid lines with a width of .005" to .015" on clear or translucent bases. Though technically functional, the use of this scanner suffered from these restricted input capabilities. It was not cost effective to modify existing SCS map products for scan digitizing.
53

In the last quarter of FY 84, SCS upgraded the Computervision equipment at both the CGIS and NCC sites. Delivery extended from November 1984 through February of 1985. The hardware is as follows:
CGIS Development Staff
o 1 - CDS4001 32 bit processor with 6 MB of main memoryo 2-300 MB disk driveso 2 - 9-track, 800/1600 BPI tape driveso 2 - Calcomp pen plotters (Model 960 and 1077)o 1 - Gerber photoplotter (Model 4477)o 1 - color Instaview workstationo 1 - monochrome terminalo 1 - Computervision digitizero 1 - Silent 700 line printer
NCC Production Staff
o 1 - CDS4101 32 bit processor with 6 MB of main memoryo 3 - 300 MB disk driveso 2 - 9-track, 800/1600 BPI tape driveso 1 - Calcomp pen plotter (Model 1055)o 1 - color Instaview workstationo 3 - monochrome terminalso 3 - Computervision digitizerso 1 - hardcopy devise
The Computervision scanner was used as a trade-in to the overall procurement, and portions of the largest existing CGP100 CPU at Lanham were inserted into the CDS4001 as part of the upgrade. The CGIS Gerber photo- plotter is scheduled for relocation at the NCC during the last quarter of FY 85.
SOFTWARE
The 4 Computervision software packages which were obtained during the hardware up-grade are as follows:
o The CADDS4X General Mapping package provides interactive digitizing and editing capabilities, supports 3 map projections (state plane, UTM and Lambert) and provides internal control and interface to other software packages.
o The Area Information Management (AIM) package features polygonprocessing with interactive polygon editing and overlay capabilities, and provides a set of information-manipulation tools that allow analysis of all graphic and non-graphic information in the data base.
o The Visualization package provides:one-, two-, or three-point perspective views of three-dimensional models, hidden-line removal, and quick revisions of completed renderings,
54
o The Site Engineering package supports three major phases of civil engineering design: collection and assembling data describing existing site conditions; designing the objects to be constructed (their location or footprint); and detailing designs as production standard documents. It features terrain modeling, contour map generation, and profile and cross section design.
The CGIS staff also procured the proprietary source code, and both locations have direct CV communication capabilities, enabling rapid data transfer. Specific or customized software programs are developed in-house to enhance the production, operation, analysis, and exchange of SCS data.
LOCATION OF COMPUTER FACILITIES/AGENCY SYSTEM CONTACTS
SCS has Computervision equipment at the following two sites:
Cartography and Geographic Information Systems Division 10,000 Aerospace Road - 1st Floor Matland Bldg. #2 Lanham, Maryland 20706
System Contact - Ron Glenn, CIS Specialist (301) 436-6116
National Cartographic Center Fort Worth Federal Center 501 Felix Street Bldg. 23, Room 60 Post Office Box 6567 Fort Worth, Texas 76115
System Contact - Dennis Castor, Chief of Computer Graphic Branch (817) 334-5292
SYSTEM COSTS
The Computervision upgrade was procured through the National Cartographic Center (NCC), with delivery to both sites, and amounted to approximately $750K. SCS has picked up a maintenance agreement, beyond the standard 90 day warranty period, which amounts to approximately $150K on a yearly basis for both sites. The Gerber photoplotter, upgraded 2 years ago, is valued at approximately $160K and is also under a maintenance contract for approximately $20K per year.
55
AGENCY APPLICATIONS
The Computervision turn-key system is used by the Cartography and Geographic Information Systems (CGIS) development staff to:
o test and evaluate new CV softwareo develop additional programs to enhance systemo design technical interfaces to provide for exchange of datao develop procedures for using computerized soils data to support
natural resource assessment activities o develop resource data bases in support of SCS, CIS pilot
study activitieso digitize national activity map products o provide technical support to the NCC staff
The National Cartographic Center (NCC) production staff uses the system to:
o provide quality control of products from SCS's commerciallycontracted digitizing activities
o support the development of the SCS Soil Survey Geographic DataBase (SSURGO) and the State General Soil Geographic DataBase (STATSGO)
o provide soil interpretation products in support of state andlocal planning activities
o support SCS distribution of digital data
DATA STRUCTURE
The CADDS4X interactive digitizing and editing software allows the user to perform "arc/node" or "spaghetti" digitizing of the source maps. Polygon development and feature identification is accomplished through the use of the AIM software. Once the data has been edited they are stored in line-segments. Graphics are stored in 3 files (polygon, line-segment and island) and supported by link list processing. The data properties which are stored in each of these 3 files are as follows:
o Polygon File
- Area (Islands have been subtracted)- Exclusive Area (Includes Islands)- Perimeter- Unique Polygon ID- Envelope- Pointer to 1st Record in Line-Segment File Assigned to This
Polygon- Pointer to 1st Record in Island File
56

o Line-Segment File
- Unique ID- Length of Line- Envelope- Pointer to Polygon to Left- Pointer to Polygon to Right- Pointer to Next Line-Segment of Left Polygon- Pointer to Next Line-Segment of Right Polygon
o Island File
- Unique ID of Line-Segment That Makes Up The Island- Point to Next Record in Island File
An unlimited number of records of attribute (text) information can be stored on each spatial entity, at a format of 80 characters per record.
SCS has developed draft technical specifications for line-segment digitizing at scales of 1:24,000, 1:100,000 and 1:250,000 primarily for the purpose to support SCS contract digitizing activities. These specifications presently serve as an exchange format with other federal and state agencies. Copies are available by contacting Gale W. TeSelle, Director, Cartography and Geographic Information Systems (CGIS) Division, (202) 447-5421.
STRENGTHS AND WEAKNESSES OF SYSTEM
The strengths and weaknesses of the earlier CADD3 and the present CADD4X systems are as follows:
CADDS 3STRENGTHS:
o Handled large data sets o Efficient digitizing software o Vendor supports user conferences
WEAKNESSES:o Required extensive in-house enhancement to support mapping needs o Operational procedures not very user friendly o Polygon editing and manipulation
CADDS 4STRENGTHS:
o Provides better mapping support (map projections, coordinatetransformation, 3-D contouring - etc.)
o Interactive polygon editing o Good training and user support from vendor o Vendor supports user conferences
WEAKNESSES:o Presently will not handle large data setso Computervision does not have an emphasis on marketing mapping
software; so software development staff is limited o Does not support some of the more common CIS analysis functions
57

SCS has made considerable strides in the refinement of digitizing and control methods in the automated mapping arena since our initial involvement in 1976. The latest Computervision upgrade has put SCS, however, in a learning environment. The internal data structure and command language, as well as the theory behind operational construction, are considerably different from the previous CADDS 3/CGP-100 hardware and software. Though the system and software hold good promise for enhanced processing capabilities, present production levels have been critically reduced as of February 1985. As with all "canned" software, customizing the software to meet cost effective production methods, specifically geared to unique agency needs, must be developed, Some software functions have been degraded in the vendors CADDS3 to CADDS4X software conversion. Overall, hardware operation has been good at the Lanham site with the exception of "settling in" malfunctions. The NCC site, however, did experience a prolonged adjustment period which was eventually attributed to an irregular power surge.
Presently, CGIS is getting healthy feedback from the vendor regarding the software difficulties that have been encountered. Available funds and vendor familiarity were the primary reasons for the Computervision upgrade to SCS's digital capabilities. Past experience and expertise has enabled the CGIS staff to provide "workarounds" in an effort to maintain the minimal SCS services. This familiarity is also providing a cooperative means between SCS and the vendor to return the new system back to a full production level, within a few months.
FUTURE SYSTEM PLANS
SCS's first priority is to customize the new Computervision CADDS4X software to meet the agency's automated mapping requirements. The CGIS development staff is also working on the test, evaluation, selection and implementation of CIS hardware and software technology in SCS, in both the micro and minicomputer arena.
58

LOCAL INTERACTIVE DIGITIZING AND EDIT SYSTEM (LIDES) OVERVIEW
Richard L. Listen and Terry W. Gossard U.S. Department of Agriculture
Forest Service Engineering Staff
Geometronics P.O. Box 2417
Washington, D.C. 20013
INTRODUCTION
LIDES is currently under development by the USDA Forest Service, Engineering Staff, Geometronics Development Group in Arlington (Rosslyn), Virginia. Pilot testing by Forest level users is scheduled for completion in June 1985; imple mentation (Version 1.0) is scheduled for October 1985.
LIDES is intended to be strictly a data collection system that provides digi tized, edited, and tagged point, line, contour, and polygon feature files to local Forest level application programs. The only exception to this is a pro vision for calculating polygon acreages and perimeters when digitizing polygon manuscripts.
HARDWARE CONFIGURATION
LIDES software can be used on any of the Interactive Graphic Systems (IGS) acquired under the USDA LOT 7 contract awarded to Tetra Tech, Inc., San Diego, California. With the exception of a Calcomp digitizing table, all hardware com ponents are manufactured by Hewlett-Packard (HP) Corp. Hardware components include:
HP 9020B 32-bit computer with monochromatic CRT, ASCII keyboard, 1.5 megabytes of RAM, 4%-inch floppy disc drive, and Series 500 BASIC single- user compilers.
HP 7908 Winchester Disc Drive with 16.7 megabytes of formatted disc storage and high density cassette tape backup/recovery capability.
HP 2932A 136-column impact printer supporting 200 characters per second output.
HP 7580B plotter with 8 pens providing plots on 24-inch wide paper, vellum, and double matte polyester film material.
Calcomp 9000 (36 X 48 inch) digitizing table with digitizing pen and cur sor.
59

System costs under the USDA LOT 7 contract (Fall 1983) were approximately $70,000 per system.
SOFTWARE CHARACTERISTICS
LIDES consists of two computer programs: LIDES-Vector and LIDES-Raster. Both are being written in the HP Series 500 BASIC language reference system. Both programs make use of hierarchial menues, help screens, and frequent operator prompts.
LIDES-Vector
LIDES-Vector supports conventional manual digitizing of points, lines, contours, and polygons using either a digitizing pen or cursor. Program options, digi tizing modes, and feature attributes can be entered via keyboard or digitizing of a menu pad taped to the digitizing table, as featues are being digitized. Contour elevations are assigned via increment or decrement of the previous ele vation by the contour interval. Feature edit requires reference to system assigned feature (record) numbers, using ADD, DELETE, and MODIFY options. The software was originally developed on a Tektronix 4054 desktop computer graphics system and later converted to the HP 9000 environment. File management, map registration, digitizing, edit, plotting, and attribute assignment are provided by four separate programs. Program outputs include:
. Digitized, tagged, and edited point, line, contour, and assembled arc- node polygon feature files.
Hardcopy edit plots at source document scale showing feature line work, system assigned feature (record) numbers and/or feature attributes.
Acreage/perimeter listings by polygon feature number or by polygon attribute.
LIDES-Raster
LIDES-Raster supports automatic raster-to-vector conversion of scanned polygon or manually traced polygon manuscripts. Scanning support will be provided by the USDA Forest Service-Geometronics Service Center (GSC) in Salt Lake City, Utah. Thinning tools reduce line work to unit width. Automatic error detec tion algorithms log the locations of line breaks and spurs on disc for later edit. Software based line following algorithms are used to automatically vec torize (trace) and assemble (identify line segments belonging to each polygon) polygons. The assembly phase includes automatic computation of polygon cen- troids and linking of islands to exterior polygons. Edit tools enable an opera tor to spool through the errors file, view each error image under variable mag nification, and correct errors using software based pencils, erasers, and masks.
LIDES-Raster was developed on the HP 9000, is modular, and takes full advantageof the HP 9000 environment. Program outputs are identical to those availableunder LIDES-Vector but apply only to polygon manuscripts.
60

DATA STRUCTURE
A design goal for both LIDES-Vector and LIDES-Raster is that the content of internal working files be able to support the Standard Digital Line Graph (DIG) Distribution Format for 1:24,000 scale maps (Geological Survey Circular 895-C). It is also planned that future versions of LIDES support the Optional DIG Dis tribution Format as applied to polygon manuscripts. The content of LIDES-Raster working files could presently support either format.
Output data formats required by Forest level users will be identified as part of LIDES pilot testing, which is currently underway. While both the Standard and Optional DLG Formats are viable candidates, it is doubtful if either will be selected as required output formats for Version 1.0 LIDES, scheduled for imple mentation in September 1985. User applications will likely require output data in formats acceptable to local application programs, few of which require topo- logically structured data. Most present application programs require data whose character is closer to DLG-1 (Level 1) standards.
ATTRIBUTE CODING SCHEME
There are, at present, no National or Regional Forest Service attribute coding standards being adhered to for thematic digitizing done in support of resource staff needs at the Forest level. Most standards, if they exist, are set at the Forest level, and then often in relationship to a specific application program. Few Forests use major/minor attribute code logic in a manner similar to that identified for standard 7.5-minute 1:24,000 scale base series categories (Geo logical Survey Circular 895-G). Most use single text string attributes of variable length.
LIDES-Vector point, line, contour, and polygon features can be assigned text attributes of up to 20 characters, one attribute per feature, at the time of digitizing. An option is provided to assign multiple attributes to individual polygons via generation and subsequent digitizing of an attribute worksheet. The user first constructs an attribute dictionary containing up to 63 entries. Each entry consists of a major code, minor code, and optional text string of up to 80 characters (e.g., TM/PP/TIMBER MAP - PONDEROSA PINE). An attribute worksheet is subsequently generated that contains up to 63 columns. Each column points to a dictionary entry and as many rows as there are polygons on a given map sheet. After worksheet entries (cells) have been filled in, attributes are assigned to individual polygons via digitizing of the worksheet.
LIDES-Raster attributes are assigned via use of the attribute worksheet.
POTENTIAL LIDES IMPROVEMENTS
Again, we expect the pending Pilot Test and Evaluation Report to both identify and prioritize desired system improvements. We do expect, however, that recom mended improvements will include, at a minimum:
Extension of automatic raster-to-vector processing to contour digitizing.
61

Provision for additional data output formats, particularly those requiring topologically structured data.
Further optimization of programs to take full advantage of the HP 9000 environment. This will likely include the programming of several computational intensive LIDES-Raster routines in assembly language.
62

DIGIIZING DATA EDITING AND STRUCTURING WITH THE
DIGITIZING SYSTEM (ACDDS)
Matthew J. Gonsalves, CartographerDefense Mapping Agency
Hydrographic/Topographic Center (DMA/HTC) Washington, D.C. 20315-0030
NAME OF SYSTEM
Advanced Cartographic Data Digitizing System (ACDDS)
Computer Vendor
Research and development procurement through the Rome Air Development Center, Rome, New York.
Contractor: Synectics Corporation111 East Chestnut Street Rome, New York, 13440
HARDWARE CONFIGURATION
The ACDDS is comprised of 2 independent subsystems (host and work station) separated by function.
Host Subsystem
The host subsystem is used for processing and outputting digital data. Host hardware includes the following list of items:
a. One Data General (DG) Eclipse S/130 with 1 MB MOS Memory,
b. One DG 6061 190 MB disk drive with controller,
c. One DG 6061-A 190 MB disk drive.
d. One 8613 floating point instruction set with high speed multiply/divide.
e. One DG 9-track 6026 mag tape drive with controller (800/1600 BPI).
63

f. One DG 9-track 6026-A mag tape drive (800/1600 BPI).
g. Two DG Video display terminals (VDT's) with I/O interface.
h. Three Synchoronous Line Multiplexors (SLM) for communication with the work stations.
i. One DG 4218 300 LPM line printer.
j. One DG 6040 60 CPS hard copy terminal with I/O interface.
k. One DG 6045 10 MB disk unit 5 MB fixed, 5 MB removable.
Work Stations
The work stations are used for digitizing and editing data and submitting batch processing tracks to the host. Each work station consists of the following hardware items:
a. One DG NOVA 4/S computer with 64 KB of memory,
b. One 10 MB disk drive 5 MB mixed 5 MB removable,
c. One DG Video display terminal with keyboard.
d. One universal line multiplexor (ULM) for communication with the host.
e. Threshold Technology 500 Voice terminal.
f. One Alteck Corp. DATATAB back lite digitizer.
g. One Tektronix GMA 102A 19" Graphic display terminal.
SOFTWARE
ACDDS Software consists of utility and applications programs geared toward digitizing, editing, and processing data.
Digitizing Software
Analog features are entered on work station digitizers via the following methods:
a. Trace Mode - used to record linear and areal features.
b. Discrete Point Mode - used to record point feature information.
64

c. Depth Entry Mode - used to record bathymetric data.
d. Type placement - Allow the operator to input textual strings and assign a particular font style, point size and rotation angle.
Processing Software
Once collected, the digital data can be manipulated using the following batch functions:
a. Sort files by feature attributes,
b. Merge files with identical file parameters,
c. Convert to and from different formats,
d. Perform unit conversions.
e. Perform transformations from table coordinates (X,Y) to geographic coordinates (lat., long.).
f. Perform inverse transformations (lat., long.) to (X,Y).
g. Perform projection transformations.
h. Create "windows" in data files or section unwanted data from edges of a source.
i. Panel files with a common border.
Editing Software
A full compliment of edit functions exist at the work stations. They enable the user to add, delete, or modify features or headers input during digitization. Edit functions include:
a. Locate feature (by X,Y, or geographic position, or by feature number).
b. Delete feature from the file.
c. Modify the beginning, end or middle of a linear or areal feature.
d. Join two features.
e. Add, delete, modify or change position of a point feature or depth value.
f. Display features at different scales (from .IX - 10X magnifica tion) .
65

COMMUNICATIONS
Communications between the host and work stations is effected via a utilities task or by physically taking the work station 5 MB disk to the host.
LOCATION
The ACDDS is located in the Automated Compilation Branch of the Hydrog raphy and Navigation Department (HNAC), 425 Erskine Hall, DMA/HTC.
SYSTEM COST
Hardware & Software - $275K.
AGENCY SYSTEM CONTACT
Matthew J. GonsalvesHydrography and Navigation Techniques (HNT)252 Erskine Hall, DMA/HTC - (202) 227-3130
BACKGROUND
Work
Worked in the Hydrography and Navigation Department's Automated Compila tion Branch (HNAC) since 1980. Operated all plotters and data collection systems. Since May 1984 have been with HNT. Worked on software mainte nance of ACDDS, software enhancements and testing, new system procure ments and various technical writing assignments.
Education
B.S. Forestry, Minor Hydrology - University of New Hampshire
Currently working toward M.E. in Photogrammetric & Geodetic Sciences at Virginia Polytechnic Institute and State University.
AGENCY APPLICATIONS
The purpose of the ACDDS is to capture data from analog sources or receive soft copy data via mag tape in an effort to automate the chart compilation process. Currently, all hydrographic data represented on a chart can be digitized and tagged on the work station. Photogrammetrically compiled color coded manuscripts of shoreline and topographic features are scanned
66

on the Scitex Response 250 Mapping System and digitally transferred to the ACDDS host. Once on the host, hydro and topo data can be merged and manipulated to the desired output format. This can then be symbolized and output on color separated, reproduction quality, film positives.
DATA STRUCTURE
The ACDDS employs a sequential data structure. Data is blocked in 64 word records. The first 14 records of a file contain source parameters. Next, a numbered header record uniquely identifies the characteristics encoded for each feature. Immediately following the header record is the textual record which contains descriptive text regarding the feature. Finally 1 or more data records contain the (X,Y) coordinates (for a table file) or geographic coordinates (for a geographic file).
ATTRIBUTE CODING SCHEME
The ACDDS has an internal attribute coding scheme based on DMA's "Chart #1 Nautical Chart Symbols and Abbreviations" guide. Under this format, features are uniquely labeled to arrive at the correct symbol when being output.
STRENGTHS AND WEAKNESSES
Strengths
a. User friendly, menu driven, interactive digitizing, edit, and processing software.
b. Automated type placement and symbolization capability,
c. Compatibility with other DMA systems,
d. Independance of host and work stations,
e. VDT copy capability.
Weaknesses
a. Lack of memory on NOVA 4/S work stations,
b. No soft copy symbolization capability.
c. Communication lines between work stations and host are very slow (8K bits/sec.).
67

FUTURE SYSTEM PLANS
Future System Plans include:
a. Expansion of system from 4 to 6 work stations.
b. Enhance type placement capability to accommodate more word processing capabilities.
c. Provide capability to receive graticule data in soft copy form from the UNIVAC 1181.
68

A TOPOLOGICALLY BASED DATA STRUCTURE FOR A COMPUTER-READABLE MAP AND GEOGRAPHIC SYSTEM
Robert W. Marx Frederick R. Broome Bureau of the Census
Washington, DC 20233
BACKGROUND
All of you are experts in the computer field. As users of automated mapping and geographic systems, you know that developing and implementing a system of national scale takes time. It will be no surprise to you, therefore, that the TIGER System we are using for our 1990 census is taking shape even now in our computer program and data content specifications.
The acronym TIGER stands for Tppologically ^Integrated Geographic Jincoding and Referencing. Let me review briefly what those words mean to us.
T_ stands for Topologically. Topology is the scientific explanation of how points and lines relate to each other on a map to define a geographic area. The TIGER File uses these points and lines to provide a disciplined, mathematical description of the earth's surface features such as streets, rivers, railroads, pipelines, and so forth.
j_ stands for Integrated. The TIGER File is the data base that we will use in our 1990 census to relate or integrate the information from the maps we prepare in cooperation with the U.S. Geological Survey, the GBF/DIME-Files we used for automated address matching to street segments (called geocoding) in the 1980 census, and the geographic area relationship file we used for data tabulation in 1980. These geographic records no longer will be separate sources of information. Rather, they will be parts of one single computer file. This will prevent inconsistencies and errors such as we experienced in the last decennial census.
£ stands for Geographic. The TIGER File is a process of representing geographic features or areas on the earth's surface. All census-relevant features on the earth's surface, including streets, rivers, railroads, pipelines, and so forth, will be part of the TIGER File. A major goal of the TIGER System is to assure that no duplication or omission occurs for these features or areas.
£ stands for Encoding, which means that we store the geographic information that is, the points, lines and areas--within the TIGER System. As a result the map no longer exists in printed form as you and I have known printed maps all our lives, but in the computer.
R_ stands for Referencing. The TIGER System assures automated access and retrieval of consistent information concerning features and areas on the earth's surface. Geographic information, defining the location and relationships of streets, rivers, railroads, pipelines, and so forth, to each other and the political and
69

statistical areas for which we tabulate census data, will be available quickly in the form of computer-produced maps and printouts. The TIGER File will be the largest integrated digital geographic data base in the world. The thought is mind-boggling, especially to us, as we have committed ourselves to carry this off by 1990!
I have used the terms TIGER File and TIGER System several times now. Let me tell you how I distinguish between these two phrases.
The TIGER File is a computer data base that contains computer-readable information representing the position of roads, rivers, and other map features, along with feature attributes such as names, geographic codes, and address ranges, stored in this new integrated data structure.
0 The TIGER System includes the TIGER File as well as all of the specifications, procedures, computer programs, computer hardware, and related materials needed to build and use the TIGER File.
AGENCY APPLICATIONS
Development of the TIGER System started about 20 years ago. It began with the Census Bureau's development of the Address Coding Guides. (See Figure 1.) We used the Address Coding Guides to relate the addresses on our housing unit mailing list to the other geographic codes needed to collect and tabulate data for our 1970 census. This approach had problems that resulted in errors- errors that were difficult to detect.
ADDRESS FILE127 HOLMES ST. 138 HOLMES ST. 195 HOLMES ST. 201 HOLMES ST. 208 HOLMES ST.
MATCHING
ADDRESS CODING GUIDE101-199 HOLMES ST., BK. 303 100-298 HOLMES ST., BK. 205 201-299 HOLMES ST., BK. 101
GEOCODED ADDRESSES
127 HOLMES ST., BK. 303 138. HOLMES ST., BK. 205 195 HOLMES ST., BK. 303 201 HOLMES ST., BK. 101 208 HOLMES ST., BK. 205
Figure l.--The 1970 Census Address Coding Guide
70

The development of the dual independent map encoding (DIME) file structure used for our 1980 census eliminated many of the errors in the Address Coding Guides. (See Figure 2.) It did this through the mathematical relationships inherent in a topologically structured file such as DIME. The GBF/DIME-File structure, by itself, could not solve all the problems because there were systemic errors in those files and other flaws in the overall geographic system that included the GBF/DIME-Files.
ADDRESS FILE127 HOLMES ST 138 HOLMES ST 195 HOLMES ST 201 HOLMES ST 208 HOLMES ST
GBF/DIME FILE.
MATCHING)(
FEATURE NAME
HOLMES ST. HOLMES ST.
ADDRESS LEFT RIGHT
101-199 201-299
100-198 200-298
BLOCK LEFT RIGHT
303101
205 205
GEOCODED ADDRESSES
127 HOLMES ST., BK. 303 138 HOLMES ST., BK. 205 195 HOLMES ST., BK. 303 201 HOLMES ST., BK. 101 208 HOLMES ST., BK. 205
Figure 2. The 1980 Census Geographic Base (DIME) File
I expect that many of you are familiar with the problems the Census Bureau encountered in 1980, so I'll review them only briefly. (Marx, 1983)
To begin, maps were not created on time. When the maps did arrive, the census enumerators who depended on the maps sometimes had to make do with maps that were very out of date and difficult to read. The entire census process was slowed down because so many people and events depended on maps.
Second, the large amount of clerical work required to produce the maps and the related geographic control files created errors and inconsistencies between the maps, GBF/DIME-Files, and the geographic area relationship file.
Third, the fact that all of these products were essential to the work in other divisions throughout the Census Bureau caused a cascade of problems to all other participants in our data collection and processing operations and ultimately the users of our data.
71

ELEMENTS OF THE TIGER FILE DATA STRUCTURE
The requirement to eliminate the inconsistencies between these three key geographic controls and produce more readable and "user-friendly" maps had a significant effect on the design of the TIGER File,.
While in some ways, the TIGER File is nothing more than a different way of storing all the geographic information contained in the three separate products of the past, in fact, the TIGER File is much more than the sum of those parts. The keyword in the full name for which TIGER is an acronym is "Integrated." This differentiates the TIGER File from all the previous files we prepared and from a data transfer structure such as the DLG-3. The TIGER File structure relates the address range information to all the geographic codes we use for tabulation of the collected data, and to all the physical features and area boundaries we show on our maps. It ensures that the same information will appear on a geocoded address list as on a map or in a printed report.
This is no simple task. To do this we start with the network of physical features and nonvisible political and statistical boundaries that exist in our nation. We classify this information as 0-, 1-, and 2-cells. (Corbett, 1979) It is important to note that these are not merely points, lines, and areas. While similar to points, lines and areas, these descriptions do have a very specific meaning, specifically,
0 0-cells represent only feature intersections or end points, not inter mediate points used to define shape or other types of point locations.
0 1-cells represent the line connecting two 0-cells, not the shape of the line that we define separately.
0 2-cells represent the smallest areas formed by a linked set of 1-cells. Collections of 2-cells define geographic areas, even areas as small as a census block.
To illustrate these principles, let us assume that the earth is divided into small areas by roads as shown in Figure 3. In terms of the TIGER File structure, the roads from intersection to intersection or intersection to a dead-end would enter our data structure as 1-cells. The ends of the 1-cells the intersections or end points themselves are the 0-cells; they show up as the numbered points on the diagram. The areas enclosed by a set of 1-cells are the 2-cells; they are designated A, B, C, D, and E on the diagram.
At the core of the TIGER File is a list for each of the topological elements shown on the map the 0-cells, 1-cells, and 2-cells. (Kinnear, 1984) (See Figure 4.) We match each 0- and 2-cell list to a directory. We are providing no directory for the 1-cell list because access to this list comes by referring to the end-points of the 1-cell, the codes for the surrounding areas, or one of the 1-cell attributes, such as feature name, that refers to a group of 1-cells. Each of the directories is a B-tree structure; an efficient computer data base structure used because we need rapid access along with optimum computer storage and ease of update. This structure stores all geometric and topological relationships and feature attributes either explicitly in the records or implicitly in the data base structure.
72

2-CELL 1-CELL
0-CELLS
Figure 3.--The Topological Elements of a Map
0-Cells 1-Cells 2-Cells
Directories
Lists
l II lI IL. _ J
Figure 4.--The Basic TIGER File Structure
73

In general, entry into the TIGER File is through a directory to a list, and possibly thence to one or more other lists. But this is only the beginning. Linked to these core files are other files containing the essential information needed for census taking in the United States. It is important to note that this type of file structure could be adapted to any other set of geographic area identifiers or attributes as well; it is the integrated nature of the structure that is the key.
The following sections elaborate on these core files and their related files.
0-Cells
The 0-cel1 files contain the coordinates for all the feature intersections or end points on the map. The 0-celIs have two basic files: the 0-cel1 directory and the 0-cel1 list. (See Figure 5.) Entry into the TIGER File via a 0-cell is through the 0-cell directory. This directory contains one record per 0-cell. It provides a one-way entry route, so there are no pointers to this directory. The directory has a one-to-one correspondence with the 0-cell list and each directory record has a pointer to the corresponding record in the 0-cell list.
0-CELL DIRECTORY
Peano Key
3764
3765
3779
3801
List Position Pointer
17
73
14
^ -N
EXAMPLE
1-cell Position 102
- cell Position 980 cell Position 17
1 cell Position 96
1-CELL LIST
POSSIBLE | 0-CELL |
ATTRIBUTES | LIST
0-CELL LIST
File Pos.
14
15
16
17
10
19
20
^
Coordinates
X, Y
X, Y
X. Y
X, Y
LZ
Attributes (and/or pointer)
s. . . st . . .^
**
^ v ^^
1 - cell Pointer
27
*9O
41
9O^^
71
Ow
^ .
File Pos.
95
96
97
98
52- loo101
102
103
x^
To 0-cell
from to
17
17
^
/
17
^^^
Internal 0-cell Thread Pointers
EOT
102 -x
96>
^"V^
Other Fields
...
v
EOT- End of Threading
NOTE: The actual fields in each list and/or directory record will vary as the parts of TIGER are finalized
Figure 5.--0-Cell Relationships in the TIGER File
74

The purpose of the U-cell directory is to find the nearest point in the TIGER File to any given point on a map rapidly. To accomplish this, we order the directory in a unique spatial sequence by a Peano key. We use the Peano key (named after the 19th century Italian mathematician, Giuseppe Peano, who proved that two-dimensional space could be considered as a one-dimensional line) to merge the x-coordinate and y-coordinate of a point so we can store the value in a one-dimensional array. (Kramer, 1970) To produce a Peano key, we merge the binary bits of the latitude and longitude value for each point by alternating the bits to produce a new binary number. (See Figure 6.) We need to carry only the Peano key and a pointer to the 0-cell list on this directory record. In the actual TIGER File 0-cell directory, we carry some other fields of data for processing convenience.
X Y Coordinates 404 196
Binary 110010100 011000100 Representation
Merging Into Key
CompletePeano Key 101101001000110000
Figure 6.--Merging the Latitude and Longtidue Values to Create a Peano Key
The 0-cell list records contain many more fields of data and pointers than do the 0-cell directory records. We store the 0-cell list records randomly in the 0-cell list as we load them. There is still only one record in the list per 0-cell. The 0-cell list record contains the actual x and y coordinates of the point, selected attributes of the point, plus a pointer to a 0-cell attributes list. The record also has a pointer to the first record in the 1-cell list that has this 0-cell as one of the end points. Note that even though the 0-cell is defined as the intersection of two or more 1-cells, or the terminator of an interior 1-cell, the 0-cell record only points to one 1-cell record. The 1-cell records contain the pointers to the other 1-cells ending at this same 0-cell. This technique of "threading" reduces computer storage and we use it extensively in other parts of the TIGER File as well.
75

2-Cells
The 2-cells have the same two kinds of basic files as the 0-cells--a 2-cell directory and a 2-cell list. (See Figure 7.) We refer to the smallest 2-cells as "atomic 2-cells." The atomic 2-cells represent the areas created by over laying all the roads, rivers, railroads, and boundaries shown on the map. As with the 0-cells, there is a one-to-one correspondance between the two files. Entry into the TIGER File via a 2-cell is through the 2-cell directory a sequential list of all 2-cells--to the 2-cell list. Entry into the TIGER File also can be through a number of other directories and lists, such as one of the geographic covers that I will describe later, that point to the first record in the 2-cell list for that geographic area.
The 2-cell list records contain several fields of data and several pointers as well. We store the 2-cell records randomly in the 2-cell list as we load them. Each 2-cell record has pointers that point to the files containing the higher levels of geography the tabulation areas for both the 1980 and 1990 censuses. In addition, there is a pointer to the first record in the 1-cell file that has this 2-cell as its left or right side. We "thread" the other 1-cell records bounding this 2-cell, and those that are interior to it, from the first bounding 1-cell record. If the data content of the 2-cell list records become too large, we may create a 2-cell descriptive list to contain rarely accessed items such as 2-cell centroid, perimeter, area, or population count.
The geographic cover list file mentioned above has an esential relationship to the 2-cell file. For tabulation purposes, we group the atomic 2-cells to form all other tabulation units for which the Census Bureau provides data. We define "cover" as the set of geographic code identifiers that refer to each political or statistical area recognized in either the 1980 or 1990 census. We group the codes for areas such as state, county, city, census tract, and so forth, to define every area in the United States; hence, every area in the TIGER File. We store these cover records in a cover list file.
Connected to these cover lists via pointers are various cover directories, each ordered according to access needs. We use multiple directories because there is not a single hierarchy that suits all needs. For example, Metropolitan Statistical Areas cross state boundaries so a state sequence may not be efficient for that type of access. Counties do not cross state boundaries, so state ordering could be used. The cover directories point to the cover list that in turn points to the 2-cell list.
1-Cells
The 1-cells connect 0-cells and bound 2-cells. (See Figure 8.) They represent linear features and are the central element of the TIGER File structure. We store the 1-cell list randomly in the sequence in which it is loaded. The 1-cell records contain both feature attributes and/or pointers to other files containing the attributes. The 1-cell list records have pointers to the 0-cell list, the 2-cell list, the curvature descriptor list, the 1-cell descriptor list, and even to other records within the 1-cell list. The threading of these pointers to, from, and through the 1-cell list can be thought of as tying all the parts of the TIGER File together.
76
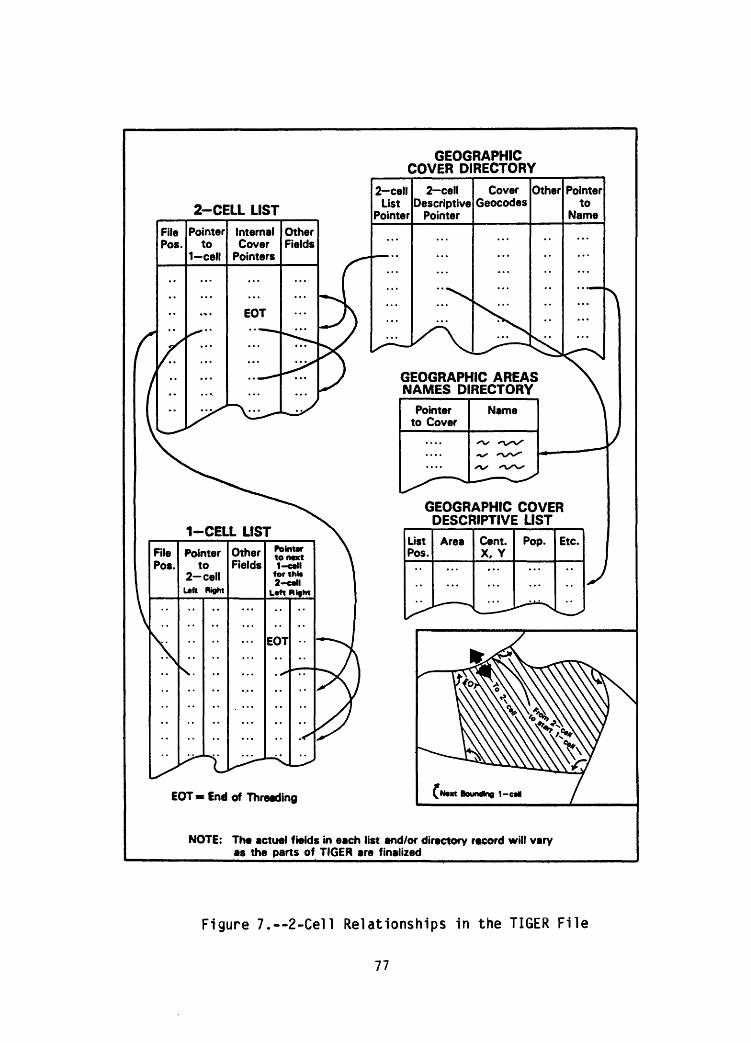
GEOGRAPHIC COVER DIRECTORY
2-cellDescriptive
Pointer
GEOGRAPHIC AREAS NAMES DIRECTORY
GEOGRAPHIC COVER DESCRIPTIVE LIST
List Pos.
^
Area
-- ->
Cent. X. Y
^_ '
Pop. Etc.
^,
EOT = End of Threading k N«« Bounding 1-c*
NOTE: The actual fields in each list and/or directory record will vary as the parts of TIGER are finalized
Figure 7.--2-Cell Relationships in the TIGER File
77

0-CELL LIST 2-CELL LIST
FilePos.
^
Pointerto
1-cell
kV
OtherFields
File Pos.
Other Fields
1-CELL LIST
File Pos.
Pointerto
0-cell
From To
Pointerto
Curv.
1-CELL DESCRIPTOR LIST
Pointerto
Desc.
Ptr. to next2-cell
Bounding1-cell
Left Right
Desc. Fields
Ptr. to next 0-cell
Connecting 1-cell
Other FieldsAdd, etc.
Flags
Ptr. to next1-cell
Same Name
1-CELL NAMES LIST
1-CELL CURVATURE
NOTE: The actual fields in each list and/or directory record will vary as the parts of TIGER are finalized.
1-cell Feature Coordinates
Figure 8.--l-Cell Relationships in the TIGER File
78

We store the attributes that are likely to be common to many 1-cells in their own files, thereby reducing the storage and processing overheads even more. Items such as street names usually refer to more than one 1-cell record; there fore, there is a names directory and a names list; the latter with pointers to the first 1-cell descriptor record for that street. The name is threaded through all the 1-cell records for the street by pointers in the descriptor records. However, since entry can be through the 1-cell list to the descrip tor list, in order to recover the name for the 1-cell, the descriptor list also has pointers back to the names file.
There are extensive attribute codes and/or data content fields for each 1-cell. We store only the items we refer to most frequently in the 1-cell list record. We store all other items in a 1-cell descriptor list file. Pointers in the 1-cell list records point to the descriptor list records and the descriptor list records point to the corresponding 1-cell list record.
There also is a pointer from the 1-cell list record to the curvature list file. This file provides all the coordinates we need to describe the shape of a 1-cell. Storing the intermediate coordinates in a separate file reduces the processing load for all the other queries to the 1-cells.
Among other things, each 1-cell record includes a field that describes the envelop of the 1-cell. This is roughly the rectangle that encloses the 1-cell plus its intermediate curvature coordinates. We use the envelop to speed spatial searches.
You can see that the TIGER File really is many files, all linked together that is, integrated. We benefit from this structure in that it relates all the address range information, geographic codes, and mappable features. Thus any change in one item is reflected in all other files simultaneously. This solves the problems we encountered in using separately produced files during the 1980 census.
OTHER TIGER SYSTEM ELEMENTS
Overall the TIGER System includes a host of other computer programs and operations in addition to those needed to maintain and update the data base. There is an automated production and control system that keeps track of all the files, when they are loaded, assigns blank tapes, writes labels on each file, records the status of the file partitions probably all records for a single county and provides reports on file status. Because the TIGER data base is too large to maintain on-line at all times, there are programs for loading and unloading the data base partitions.
There are special programs for loading a 1:100,000-scale digitial line graph (DIG) file from the U.S. Geological Survey into the TIGER F'ile format. This is a nontrivial process requiring the vertical integration of all map elements delivered in separate files or layers roads, railroads, streams, county boundaries, and so forth into the single layer 2-dimensional , topological TIGER File structure. There are programs for plotting maps from the data base. There are programs for doing geocoding using the data base. In addition, even more programs are necessary to complete the job of building the TIGER File.
79

STRENGTHS AND WEAKNESSES OF SYSTEM
Of course, implementing a highly technological data structure like the TIGER System is not free. There is a huge capital investment, but it's an accept able investment. The cost for the geographic phases of the 1980 census represented almost 20 percent of the total cost of the 1980 census. With the TIGER System working for the 1990 census, the total dollar cost for the geographic phases should run about the same as in 1980, allowing for inflation However, this will represent less than 10 percent of the total cost of the 1990 census.
It is easier to say "TIGER" than it is to make one. The plan for developing a nationwide TIGER File is ambitious, but is being achieved through well thought out, measured steps. To achieve this objective in time to meet the needs of the 1990 Decennial Census, we are calling on a wider variety of resources than ever before.
The key to our plans for developing the TIGER File is having an accurate, consistent, cartographic base. We are sharing the job of creating this base with the U.S. Geological Survey, the agency with responsibility for coordi nating all Federal civilian map making activities in the United States. Under the terms of our agreement, we will work together to use their automated scanning and manual digitizing techniques, as appropriate, to convert the highly accurate l:100,000-scale maps for the United States into an automated file. (Callahan and Broome, 1984)
In return for the basic map information, the Bureau of the Census will:
0 Assign Geological Survey feature class codes to the road data: for example, "freeway," "city street," "footpath," and so forth.
0 Capture in computer-readable form all map changes that we can determine to have taken place since the Geological Survey prepared the 1:100,000-scale maps and enter these changes into the TIGER File.
0 Enter the names for all features shown on the maps whether the features came from the Geological Survey or our sources.
0 Enter the address range information for each segment side, as gathered by our 12 regional offices, into the TIGER File.
0 Collect and enter the boundaries of all political and statistical areas to be recognized in the 1990 census, as well as all areas the Census Bureau recognized in the 1980 census.
The resulting file will meet the mission responsibilities of both agencies. It will provide a more complete and useful product to both agencies than either agency would have achieved on its own and will do so at no long-term increase in cost to either agency.
The TIGER File, and the underlying DIG files, will provide users of Census Bureau and Geological Survey data with a new, rich data source, but these are complicated data and file structures. These data files provide tremendous opportunities, but require real effort to understand. (Knott, 1984)
80
User accessibility to these data will be through the DLG-3 formatted data from the Geological Survey or from the TIGER System. Any user who wishes an understanding of the data to be available needs to understand the two structures and the ideas behind them. The TIGER File structure described here is the initial interpretation. There undoubtedly will be some change in the structure after the initial digital base is completed by the end of 1987.
Digital Line Graph (DIG)
The DIG is perhaps the closest data exchange format existing that approaches a standard in the Federal area. The concept behind the DIG structure, its characteristics, and associated data have been documented by the Geological Survey in a series of seven publications (USGS Circular 895-A through G). Circular C specifically documents the file structure for the l:24,000-scale map based DIG that is most similar to the 1:100,000-scale map based DIG. This file is being used by the Census Bureau as the cartographic base of the TIGER System. The DLG-3 structure is used for fully topologically structured data files designed to be integrated into geographic information systems.
The DLG-3 structure has three major components: nodes, lines, and areas. These are analogous to 0-cells, 1-cells, and 2-cells in the TIGER topological structure. The line is the basic element of the structure and any use of the data must start by processing these line records. The line records contain one-way pointers to the nodes at each end of the line and to the areas on each side of the line. These pointers provide the minimal information needed for a topological structure.
The DLG-3 format can be characterized as an "open" structure in the sense that users can add data to the structure easily with minimal disturbance to the other elements. However, if this data file is to be used for purposes other than mapping, a great deal of processing may be required to create additional pointers that, for example, allow one to "get back" to the line from its nodes. Also, there are no provisions for connecting areas having the same attributes.
Of course, the file structure as described is really a data exchange format and the Geological Survey's mapping system must convert the DLG-3 data into a more complex structure for internal use. Likewise, users of these data will be faced with the problem of processing a DLG-3 file to put it into a more accessible form.
TIGER File
The TIGER File structure being developed by the Census Bureau is a topologically structured file also, but additional information also will be carried by adding nontopologically structured elements in the file. The DLG-3 file, as currently conceived, does not have these extra structures.
This extra information makes the TIGER File a less "open" structure. For example, an addition of a road segment will involve the reestablishing of both to and from pointers for the 0- and 2-cells. Also, pointers to the descriptive record and feature name file must be established. Any key geographic location codes must be reestablished correctly with respect to the new line.
81

The system provides pointers to "walk around the 0-cell." This easily finds all 1-cells that meet at an 0-cell; also, to walk around the 2-cells, that is, to find easily all 1-cells that bound a 2-cel1 in sequence.
This type of built-in structure makes some types of retrieval easier, but at an additional complexity in the structure and more overhead for maintenance.
Contrasted File Structures
The DLG-3, TIGER File, and GBF/DIME-File structure may be viewed in the following way. (See Figure 9.)
GBF/DIME-Flle
One or more segments in a 1-cell. Each segment record contains:
a. Left and right area identifiers, b. Beginning and ending node points, c. Left and right address ranges.
DLG-3
Attribute List
Intermediate Node List
Attribute List
Attribute List
TIGER File
FeatureName
1 *
Descriptive
0-Cell
I
1-Cell
i i
/
Key Geograp Location
Shape
Address Range Data
2-Cell Area Landmark
The Census Bureau carries the attributes for the 0-, 1-, and 2-cells on the 0-, 1-, and 2-cell records, and In separate lists attached to each record.
Figure 9. The DLG-3, TIGER File, and GBF/DIME-File Structures
In one sense, contrasting the DLG-3 and the TIGER File structure is comparing apples and oranges. The DLG-3 is an external data exchange structure while the TIGER File structure is an internal structure. However, the Census Bureau will provide data in a format similar to the internal structure as well as the traditional GBF/DIME-File format.
82

FUTURE SYSTEM PLANS
We hear that, "Geography is the heart of the census if we have no geography, we have no census." This may be an overstatement, yet it makes an important point. Put simply, the TIGER System will help us complete a consistent, accurate, efficient, cost-effective, and useful 1990 census...and on time!
0 For data collection operations, the TIGER System will create maps with consistent geographic codes and a current definition of the streets our enumerators may have to walk. The geographic structure provides the framework to which the enumerators or the computer will link all housing units in the country. Maps will be ready at the start of the census, when they are needed most urgently.
0 For data tabulation operations, the TIGER System promises to ease the tabulation and manipulation of the data so we can concentrate on the quality of our data products instead of trying to remove inconsistencies between the data tabulations and the accompanying maps. This should help us speed up our delivery of the data so that it is not outdated before it is released.
On a larger scale, but still within the Census Bureau, the TIGER System will play a critical role.
0 For our economic censuses the TIGER System will provide a way to geocode all of the business establishments across the country, using more current geographic boundaries and more complete address range information.
0 For future statistical operations, the TIGER System will support improved sample selection processes, to reduce the costs of our intercensal household sample program.
The greatest benefits produced by the TIGER System will accrue to those who should reap the primary benefits our citizens and government. After all, they are the ones paying for it. By improving the geographic operations of the census, we will improve the data that we, by law, must provide to the Executive Branch, the Congress and the public.
The TIGER System will have benefits for others as well.
-- Through our unique, historical agreement, the Census Bureau and the Geological Survey will produce a national digital cartogrpahic data base that will serve many mapping needs of our Nation.
-- We are working with the U.S. Postal Service to compare our street name and address range information with their records as a way to improve our files and make their mail delivery more efficient.
We're excited about developing our system. We're anxious to share with you what we've learned. We'd like to learn more through your insights, comments, and questions, and we whole heartedly invite them.
The TIGER System will give us a "bigger bang for the buck" as we move toward 1990. The maps will be readable; the geocoding will be consistent with the maps; and the lists of geographic areas will be complete and up-to-date. The
83

TIGER System will allow us to conduct the 1990 census more efficiently than ever before. It will set the stage and standard for census taking the world over...and for years to come. We look forward to discussing this system with you in the days and years ahead.
REFERENCES
Callahan, George M. and Broome, Frederick R., "The Joint Development of aNational 1:100,000-Scale Digital Cartographic Data Base," Proceedingsof the American Congress on Surveying and Mapping, Washington, DC, 1984
Corbett, James P., "Topological Principles in Cartography," Technical Paper No. 48, U.S. Bureau of the Census, December 1979
Kinnear, Christine, "TIGER-U Documentation File," Internal Geography Division documentation text file, U.S. Bureau of the Census, January 1984
Knott, Joseph J., "TIGER vs. DLG," Paper presented at the URISA 84 Conference, Seattle, WA, August 1984
Kramer, Edna E., The Nature and Growth of Modern Mathematics, Hawthorn Books, Inc., New York, NY, 1970
Marx, Robert W., "Automating Census Geography for 1990," American Demographics, June 1983
84

AUTHORS: Robert W. Marx and Frederick R. BroomeChief, Geography Division Chief, Mapping Operations Branch
Geography Division
AGENCY: U.S. Department of Commerce, Bureau of the Census Washington, D.C. 20233
NAME OF SYSTEM: Not Applicable. The system we are using consists of the following components that we acquired and interconnected:
Sperry 1100/74 Mainframe Computer Tektronix 4115B Terminals Tektronix 4926 Hard Disks Houston Instruments 7000 andTektronix 4957 Digitizing Tables
Telebyte Tape Drives Calcomp 5500 Electrostatic Plotter with
Calcomp 953 Controller Tektronix 4691 Color Copy Units
SOFTWARE: Agency developed data base management system, file update routines, applications modules for map production, address matching, and geographic area aggregation; known as the Topologically Integrated Geographic Encoding and Referencing (TIGER) System.
LOCATION: Suitland, MD; Boston, MA; Atlanta, GA; Dallas, TX; Denver, CO; Jeffersonville, IN
SYSTEM COST: $25,000,000 (est.)
AGENCY SYSTEM CONTACT: Joseph J. KnottAssistant Chief for Geoprocessing Geography Division (301) 763-1794
t> VS. OOVBRNMBNTPRINTING OFWCB: 1985 - 491-405 - 226/20072