Cataclysmic Variables from Sloan Digital Sky Survey. VI. The Sixth Year (2005)
Upload
khangminh22Category
view
7download
0
Two Types of Soft X-ray Spectra in Cataclysmic Variables
K. Mukai'22
Code 662, NASA/Goddard Space Flight Center, Greenbelt, MD 20771, USA
and
A. Kinkhabwala, J.R. Peterson, S.M. Kahn, F. Paerels,
Columbia Astrophysics Laboratory, Columbia University, 550 West 120th Street, New York, New York 10027, USA.
ABSTRACT
We present results of analyses of Chandra HETG soft X-ray spectra (A = 1.5-25 A) of seven cataclysmic variables. We find that these spectra divide unambiguously into two distinct types. Spectra of the first type, consisting of EX Hya, V603 Aql, U Gem, and SS Cyg, are remarkably well fit by a simple cooling flow model, which assumes only steady-state isobaric radiative cooling. This model has only two free parameters, the maximum temperature, ICT,,,, which provides a rough measurement of the depth of the potential well, and the overall normalization, which provides a highly precise measurement of the total accretion rate. Spectra of the second type, consisting of V1223 Sgr, A 0 Psc, and GK Per, are grossly inconsistent with a simple cooling flow model. They instead exhibit a hard continuum, and, in addition, show strong H-like and He-like ion emission but little Fe L-shell emission, which is consistent with expectations for line emission from a photoionized plasma. Using a simple photoionization model, we argue that the observed line emission for these sources can be driven entirely by the hard continuum. The physical significance of these two distinct types of X-ray spectra is also explored.
Subject headings: Stars: novae, cataclysmic variables - X-rays: stars
'Also Universities Space Research Association
'Also Columbia Astrophysics Laboratory, Columbia University, 550 West 120th Street, New York, New York 10027, USA

- 2 -
1. Introduction
Cataclysmic variables (CVs) are interacting binaries in which the accreting object (the primary) is a white dwarf (see Warner 1995 for a review). X-ray emission in CVs is most likely associated with the accretion process, which is capable of shock-heating accreted ma- terial up to high temperatures (IcTmax w 10-50 keV). Their accretion geometry is strongly influenced by the magnetic field of the primary. Non-magnetic systems have undisrupted accretion disks that connect to the white dwarf surface via a boundary layer (Patterson & Raymond 1985a,b). In magnetic systems, the accretion stream follows the primary’s mag- netic field lines, and is close to vertical when it hits the surface (see, e.g., Aizu 1973; Wu et al. 1994). In both cases, the emergent X-ray spectrum is expected to be the sum of emission from plasmas over a continuous temperature distribution, from the shock temperature to the white dwarf photospheric temperature.
2. Observations and Spectra
We present Chandra HETG spectra of all seven CVs observed by 2002 March, and obtained from the public Chandra archive. These include four magnetic CVs of the in- termediate polar (IP) class (EX Hya, V1223 Sgr, AO Psc, and GK Per), two dwarf novae (SS Cyg and U Gem), and one old nova (V603 Aql). Of these, the spectra of EX Hya and U Gem have been published by Mauche et al. (2001); Mauche (2002), and by Szkody et al. (2002), respectively. For CVs with multiple HETG observations, we have chosen to analyse one spectrum per system (quiescent spectrum of SS Cyg, and one of two outburst spectra of GK Per).
These seven X-ray spectra divide unambiguously into two types. Spectra of the first type are well fit by a simple cooling flow model, whereas spectra of the second type are well described by a simple model of a photoionized plasma. Combined first-order (rn = & l ) MEG spectra of cooling flow CVs and of photoionized CVs are shown in Figs. 1 and 2, respectively, and are discussed below in 53.1 and 53.2, respectively.
3. Spectral Analysis
3.1. Cooling Flow Spectra
The four CV spectra of EX Hya, V603 Aql, U Gem, and SS Cyg shown in Fig. 1 are strikingly similar. These spectra exhibit strong H- and He-like ion emission from 0, Ne, Mg,
- 3 -
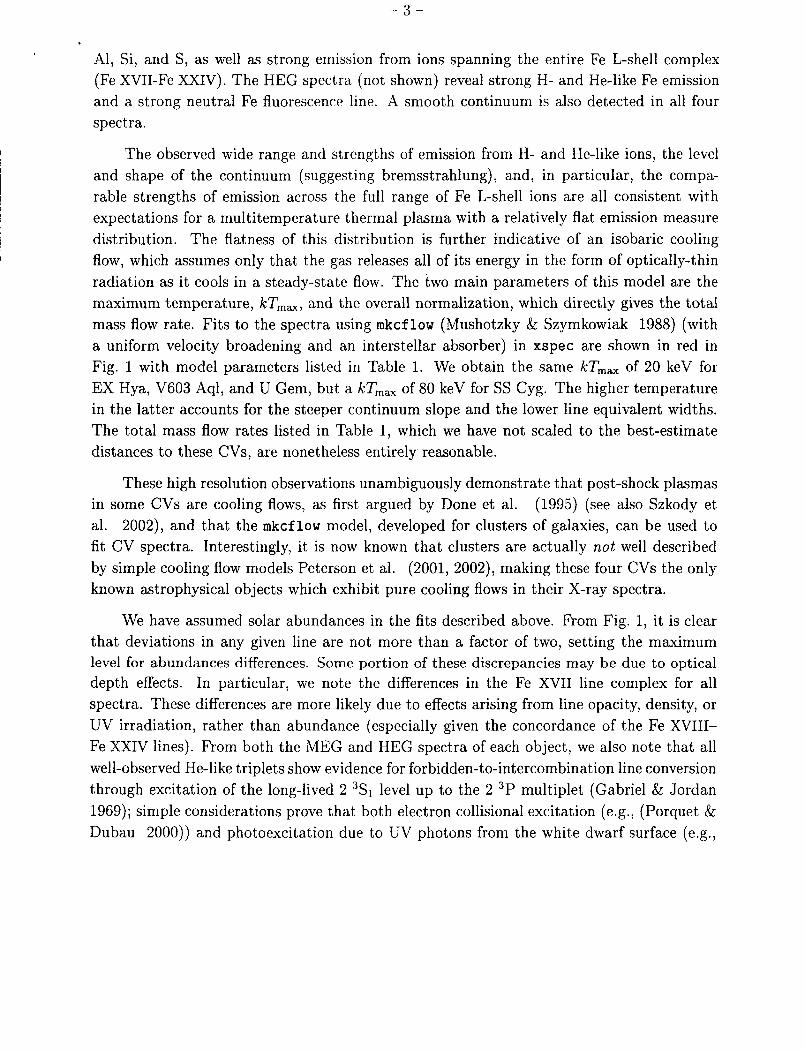
Al, Si, and S, as well as strong emission from ions spanning the entire Fe L-shell complex (Fe XVII-Fe XXIV). The HEG spectra (not shown) reveal strong H- and He-like Fe emission and a strong neutral Fe fluorescence line. A smooth continuum is also detected in all four
I spectra.
The observed wide range and strengths of emission from H- and He-like ions, the level and shape of the continuum (suggesting bremsstrahlung), and, in particular, the compa- rable strengths of emission across the full range of Fe L-shell ions are all consistent with expectations for a multitemperature thermal plasma with a relatively flat emission measure distribution. The flatness of this distribution is further indicative of an isobaric cooling flow, which assumes only that the gas releases all of its energy in the form of optically-thin radiation as it cools in a steady-state flow. The two main parameters of this model are the maximum temperature, IcT,,, and the overall normalization, which directly gives the total mass flow rate. Fits to the spectra using mkcflow (Mushotzky & Szymkowiak 1988) (with a uniform velocity broadening and an interstellar absorber) in xspec are shown in red in Fig. 1 with model parameters listed in Table 1. We obtain the same ICT,, of 20 keV for EX Hya, V603 Aql, and U Gem, but a Urn, of 80 keV for SS Cyg. The higher temperature in the latter accounts for the steeper continuum slope and the lower line equivalent widths. The total mass flow rates listed in Table 1, which we have not scaled to the best-estimate distances to these CVs, are nonetheless entirely reasonable.
These high resolution observations unambiguously demonstrate that post-shock plasmas in some CVs are cooling flows, as first argued by Done et al. (1995) (see also Szkody et al. 2002), and that the mkcflow model, developed for clusters of galaxies, can be used to fit CV spectra. Interestingly, it is now known that clusters are actually not well described by simple cooling flow models Peterson et al. (2001, 2002), making these four CVs the only known astrophysical objects which exhibit pure cooling flows in their X-ray spectra.
We have assumed solar abundances in the fits described above. From Fig. 1, i t is clear that deviations in any given line are not more than a factor of two, setting the maximum level for abundances differences. Some portion of these discrepancies may be due to optical depth effects. In particular, we note the differences in the Fe XVII line complex for all spectra. These differences are more likely due to effects arising from line opacity, density, or UV irradiation, rather than abundance (especially given the concordance of the Fe XVIII- Fe XXIV lines). From both the MEG and HEG spectra of each object, we also note that all well-observed He-like triplets show evidence for forbidden-to-intercombinat ion line conversion through excitation of the long-lived 2 3S1 level up to the 2 3P multiplet (Gabriel & Jordan 1969); simple considerations prove that both electron collisional excitation (e.g., (Porquet & Dubau 2000)) and photoexcitation due to UV photons from the white dwarf surface (e.g.,

- 4 -
Kahn et al. 2001) are potentially important in driving this conversion.
3.2. Photoionized Spectra
The spectra shown in Fig. 2 are noticeably different from those shown in Fig. 1, but are very similar to one another. In particular, note the nearly identical continuum shape and line equivalent widths in V1223 Sgr and A 0 Psc. We restrict our analysis to these two objects first, discussing GI< Per's inclusion in this class further below.
The most apparent difference between these spectra and those shown in Fig. 1 is the presence of a relatively hard, power-law-like continuum in V1223 Sgr and A 0 Psc. Another striking difference is the presence of strong H- and He-like 0, Ne, Mg, Si, and S emission lines, but no detectable Fe XVIII-Fe XXIV lines. Fe L-shell emission is limited only to Fe XVII lines, while K a lines of Fe (H-like, He-like, and fluorescence) are strongly detected in the HEG spectra (not shown), escluding low Fe abundance as a cause of weak Fe L-shell emission. This type of emission line spectrum is incompatible with cooling flow plasma, and instead resembles what is expected for photoionized plasma (Liedahl 1999; Sako et al. 2000). The possible presence of photoionized plasma in some CVs was first proposed by Kallman et al. (1993). We note the overall similarities of line emission from these objects and that from the prototypical Seyfert 2 galaxy, NGC 1068, where the fact that the emitting plasmas are photoionized has been conclusively demonstrated by Kinkhabwala et al. (2002a).
We model these spectra with the xspec photoionization model photoion3 (Kinkhabwala et al. 2002a,b). We assume that the observed continuum of V1223 Sgr and A 0 Psc is that which drives the line emission. Also, we assume that the observed reprocessed line emission created in the photoionized medium is completely unabsorbed along our line of sight. The bright resonance lines in the He-like triplets are inconsistent with traditional photoionization models (Porquet & Dubau 2000). We are able to fit the data, however, by assuming that all lines remain completely unsaturated at all ionic column densities, due to radial velocity distribution widths of thousands of km s-'. With these assumptions, we find that a simple model of a photoionized cone of plasma fits the data very well. Fits to the three CV spectra using this model are shown in Fig. 2 in red with corresponding fit parameters listed in Table 2.
In the case of GK Per, the continuum clearly has a different slope than the continua from the other two CVs. However, the presence of H- and He-like ions and conspicuous
http://xmm.astro.columbia.edu/photoion/photoion. html

- 5 -
absence of Fe L-shell emission (aside from Fe XVII) argues that GK Per’s line emission is also driven by photoionization. To fit GK Per’s spectrum, we assume that its photoionizing continuum is the same as in the other two CVs (shown as the blue line in Fig. 2), but is obscured along our particular line of sight. It would be difficult to explain the photoexcited 0 VI1 resonance line otherwise. In addition, we assume that all line emission is observed directly with no absorption, as with the other two spectra. This gives the fit shown in red in Fig. 2 with corresponding parameters listed in Table 2.
Lower limits to the accretion rates necessary to power the observed continuum in V1223 Sgr and A 0 Psc and inferred continuum in GK Per are given in Table 2. These values are similar to the mass flow rates in the cooling-flow CVs. Abundances in photoion- ized plasma are difficult to determine. However, the presence of line emission from 0 VI1 to S XVI in all spectra is consistent with a broad, relatively flat distribution in log ionization parameter with no large (greater than a factor of a few) deviations from solar abundances, which is similar to the inferred distribution for NGC 1068 (Kinkhabwala et ai. 2002a). Note the large nitrogen to oxygen ratio in GK Per, which is not seen in the other two spectra. This, as well as the unusual UV line ratios noted by Mauche et al. (1997), may suggest an abundance anomaly, perhaps related to the evolved nature of the secondary in this system (Kraft 1964).
As with the cooling flow cases, the He-like triplets again exhibit conversion of the for- bidden to intercombination lines, suggesting high electron density and/or a strong, ambient UV radiation field.
4. Discussion
We have shown that a simple cooling flow model is capable of reproducing the X-ray spectra of four CVs, while a photoionization model can successfully reproduce the strikingly different spectra of three other CVs. It is somewhat surprising that the classification of our sample into two X-ray spectral types does not follow the traditional classification into magnetic and non-magnetic CVs.
We belive that the reason that EX Hya, an IP, and non-magnetic CVs share the same spectral shape is the robustness of the cooling flow model. Although the magnetic field of the primary controls the accretion geometry, this does not necessarily change the shock temperature ICT,,, or the density by orders of magnitudes. As long as additional cooling mechamisms (Wu et al. 1994) or post-shock heating can be ignored, and the post-shock plasma is optically thin, the resultant spectra should share the same basic cooling flow shape.

6
The difference between the two soft X-ray spectral types may be the specific accretion rate (accretion rate per unit area). In most IPS, the magnetic field collimates the flow onto small regions (<0.2% of the white dwarf surface in XY Ari: Hellier 1997). EX Hya, however, is thought to have a much lower specific accretion rate than typical IPS, creating a tall, lower density, shock (Allan et al. 1998). The resultant top-hat geometry of the post-shock region will allow the cooling flow X-rays to escape the post-shock region from the side without having to travel through the pre-shock flow. Typical IPS such as V1223 Sgr and A 0 Psc, on the other hand, probably have a pillbox geometry. It is possible that these systems are also ultimately powered by the cooling flow, the lower temperature part of which is hidden by the pre-shock accretion flow. This would leave only a hard tail of the cooling flow, which could then photoionize the more upstream regions of the accretion flow, producing the observed line emission.
However, the last point begs the question of why we observe such highly similar hard continua in the two photoionized sources, V1223 Sgr and A 0 Psc. A model of a multitem- perature bremsstrahlung continuum with multiple partial covering absorved can reproduce the observed continuum shape. It remains to be seen, however, if the remarkably similar spectra of V1223 Sgr and A 0 Psc can be reproduced naturally, or if it requires a high degree of fine-tuning. If the latter is the case, we may have to look for an alternative origin of the ionizing continuum.
Evidence that the photoionized emission arises from pre-shock flow comes from the inferred large radial velocity distributions, which is present only in the near free-fall pre- shock flow. Further evidence may come from GK Per. The shorter-wavelength, higher- ionization line strengths are significantly weaker in this source than in the other two. We have assumed that the reprocessed line emission in all three objects is unabsorbed. However, if we discard this assumption for GK Per, and instead assume that its line emission spectrum is intrinsically similar to that of V1223 Sgr and A 0 Psc, then this source must be differentially obscured, with obscuration increasing with ionization parameter all the way down to the photoionizing continuum. This favors a spatially-stratified ionization model, which should arise naturally in an accretion flow. Such a spatially-stratified medium is different from the case of NGC 1068, for which spatially-resolved spectroscopy reveals that an intrinsic density distribution is more important than spatial stratification for the creation of the observed range of ionization (Brinkman et al. 2002).
These hypotheses are admittedly somewhat tentative. However, the existence of two types of soft X-ray spectra among CVs is beyond doubt. Further observations of a larger sample of CVs, and more detailed analyses of the existing spectra should be helpful in proving or disproving our hypotheses.

- 7 -
We thank Ming Feng Gu for previous extensive help with his atomic code FAC, and Coel Hellier and Chris Mauche for useful discussion. The Columbia University team-is supported by NASA. AK acknowledges additional support from a NASA GSRP fellowship.

- 8 -
REFERENCES
Aizu, K. 1973, Prog. Theor. Phys., 49, 1184
Allan, A., Hellier, C., & Beardmore, A.P. 1998, MNRAS, 295, 167
Brinkman, A.C., Kaastra, J.S., van der Meer, R.L.J., Kinkhabwala, A., Behar, E., Paerels, F.B.S., Kahn, S.M., Sako, M. 2002, A&A, in press (astro-ph/0211403)
Cropper, M., Ramsay, G., & Wu, K. 1998, MNRAS, 293, 222
Done, C., Osborne, J.P., & Beardmore, A.P. 1995, MNRAS, 276, 483
Gabriel, A.H., & Jordan, C. 1969, MNRAS, 145, 241
Hellier, C 1997, MNRAS, 291, 71
Kahn, S.M., Leutenegger, M.A., Cottam, J., Rauw, G., Vreux, J.-M., den Boggende, A.J.F., Mewe, R., & Gudel, M. 2001, A&A, 365, L312
Kallman, T.R., et al. 1993, ApJ, 411, 869
Kinkhabwala, A., Sako, M., Behar, E., Kahn, S.M., Paerels, F.B.S., Brinkman, A.C., Kaas- tra, J.S., Gu, M.F., & Liedahl, D.A. 2002, ApJ, 575, 732
Kinkhabwala, A., Behar, E., Sako, M., Gu, M.F., Kahn, S.M., & Paerels, F.B.S. 2002, in preparation
I I Kraft, R.P. 1964, ApJ, 139, 457
Liedahl, D.A. 1999, in “X-Ray Spectroscopy in Astrophysics,” eds. J . van Paradijs & J . A. I I M. Bleeker (Berlin: Springer)
~
~ ~
Mauche, C.W. 2002, in “The Physics of Cataclysmic Variables and Related Objects,” eds. B.T. Gansicke, K. Beuermann & K. Reinsch (San Francisco: Astronomical Society of the Pacific), 113
~ Mauche, C.W., Lee, Y.P. & Kallman, T.R. 1997, ApJ, 477, 832
Mauche, C.W., Liedahl, D.A., & Fournier, K.B. 2001, ApJ, 560, 992
Mushotzky, R.F., & Szymkowiak, A.E. 1988, in “Cooling Flows in Clusters and Galaxies,” ed. A.C. Fabian, Dordrecht, Netherlands, Kluwer Academic Publishers, 53
~
Patterson, J . , & Raymond, J.C. 1985, ApJ, 292, 535

- 9 -
Patterson, J., & Raymond, J.C. 1985, ApJ, 292, 550
Peterson, J.R., Kahn, S.M., Paerels, F.B.S., Kaastra, J.S., Tamura, T., Bleeker, J.A.M., Ferrigno, C., & Jernigan, J.G. 2002, ApJ, submitted (astro-ph/0210662)
Peterson, J.R., Paerels, F.B.S., Kaastra, J.S., Arnaud, M., Reiprich, T. H., Fabian, A. C., Mushotzky, R. F., Jernigan, J. G. , & Sakelliou, I. 2001, A&A, 365, L104
Porquet, D., & Dubau, J. 2000, A&AS, 143, 495
Ramsay, G. 2000, MNRAS, 314, 403
Sako, M., Kahn, S.M., Paerels, F.B.S., & Liedahl, D.A. 2000, ApJ, 543, L115
Szkody, P., Nishikida, K., Raymond, J.C., Seth, A., Hoard, D.W., Long, K.S., Sion, E. 2002, ApJ, 574, 942
Warner 1995, Cataclysmic Variables (Cambridge: Cambridge Univ. Press)
Wu, K., Chanmugam, G., & Shaviv, G. 1994, ApJ, 426, 664
This preprint was prepared with the AAS L A W macros v5.0.

- 10
5 10 15 20 25 CAI
Fig. 1.- Chandra HETG spectra (MEG, m = fl orders) of 4 CVs which exhibit cooling flow spectra. Data are shown in black with the cooling flow model shown in red.

- 11 -
40
e 20 0
X 3
5 10 15 20 25 [AI
Fig. 2.- Chandra HETG spectra (MEG, rn = f l orders) of 3 CVs that exhibit photoionized models. Data are shown in black with the photoionization model shown in red. The blue line in the bottom panel shows the inferred intrinsic continuum for GK Per.

- 1 2 -
Table 1. Cooling Flow CVs.
Model EX Hya V603 Aql U Gem SS Cyg Parameters 1706" 1901" 647" 3454"
NH [ ~ m - ~ ] 2e20 2e20 le21 7e20 a,, [km s-llb 200 400 300 550 kT,, [keV] 20 20 20 80
3.9e-11 5.6e-12 4.4e-12 2.6e-11 f i d - 2 C 100
"ObsID. bobserved line width, assuming a constant
CMass flow rate for an assumed distance of
velocity broadening for all lines.
100 pc in M, yr-l.

- 1 3 -
Table 2. Photoionized CVs.
Model V1223 Sgr A 0 Psc GK Per Parameters 649" 1 898a 3454"
f b 0.5 ' 0.5 0.5 N i p i n s i c [ ~ m - ~ ] 0 0 7e22 a, [km s-lId 600 600 600 Lx dG0 e 1.6e32 6e31 2.9e32
Ionic Column Densities [cm-21 >9.4e- 12 >3.5e-12 > 1.7e- 1 1 h;ird-2 f
100
N VI 0 VI1 0 VI11 Ne IX Ne X Mg XI Mg XI1 Si XI11 Si XIV s xv s XVI Fe XVII
8e17 2.5e18 1.7e18 4e17 5e17
1.7e17 3.2e17 1.7e17 5e17
1.5e17 4e17 2e17
5e17 1.3e18 le18 2e17 5e17 2e17
4.7e17 2.5e17 7e17
2.5e17 6e17 2e17
2e18 1.2e18 1.2e18 2e17
1.5e17 le17 5e16 7e16 7e16 le17 le17 le17
"ObsID. bCovering fraction f = S2/47r for cone geom-
etry.
for GK Per. 'Required obscuration of inferred continuum
dObserved line width, assuming a constant velocity broadening for all lines.
(13.6 eV< E < 10 keV) luminosity for an as- sumed distance of 100 pc in ergs s-l.
fMinimum accretion rate for an assumed dis- tance of 100 pc in Ma yr-l.
eBolometric power-law L(E) rx
Copyright © 2022 FDOKUMEN