Representations of impedance spectra of ceramics. Part II. Spectra of polycrystalline SrTiO3
12
Representations of impedance spectra of ceramics Part II. Spectra of polycrystalline SrTiO 3 Joa ˜o C.C. Abrantes a , Joa ˜o A. Labrincha b , Jorge R. Frade b, * a ESTG, Instituto Polite ´cnico de Viana do Castelo, Ap. 574, 4900 Viana do Castelo, Portugal b Ceramics and Glass Engineering Department (UIMC), University of Aveiro, 38010 Aveiro, Portugal (Communicated by A.R. West) Received 15 April 1999; accepted 2 August 1999 Abstract Simultaneous representations of M0,Z0,A0, and tg(d)) vs. frequency were used to analyze impedance spectroscopy data of SrTiO 3 and to demonstrate the applicability of these representations. The log(tg(d)) vs. log(f)) representation usually shows several local extremes (maxima or minima), which can be interpreted to obtain a wide range of relevant parameters, even for cases in which the Nyquist plot (Z0 vs. Z9) shows overlapped bulk and grain boundary arcs. Peaks of log(tg(d)) indicate electrode to grain boundary transition, and/or the grain boundary to bulk transition. Local minima can be used to extract the grain boundary or the electrode relaxation frequencies. The admittance representation is slightly less useful. The modulus representation shows the bulk contribution term, but does not reveal the grain boundary or contributions of electrode terms. © 2000 Elsevier Science Ltd. All rights reserved. Keywords: A. Interfaces; C. Impedance spectroscopy; D. Electrical properties 1. Introduction Some applications of titanate ceramic materials are dependent mainly on major differ- ences between the bulk and grain boundary transport properties. In these cases, the overall behavior can be changed by adjusting the average grain size, as predicted by the classical * Corresponding author. E-mail address: [email protected] (J.R. Frade). Pergamon Materials Research Bulletin 35 (2000) 965–976 0025-5408/00/$ – see front matter © 2000 Elsevier Science Ltd. All rights reserved. PII: S0025-5408(00)00281-6
Transcript of Representations of impedance spectra of ceramics. Part II. Spectra of polycrystalline SrTiO3

Representations of impedance spectra of ceramicsPart II. Spectra of polycrystalline SrTiO3
Joao C.C. Abrantesa, Joao A. Labrinchab, Jorge R. Fradeb,*aESTG, Instituto Polite´cnico de Viana do Castelo, Ap. 574, 4900 Viana do Castelo, Portugal
bCeramics and Glass Engineering Department (UIMC), University of Aveiro, 38010 Aveiro, Portugal
(Communicated by A.R. West)Received 15 April 1999; accepted 2 August 1999
Abstract
Simultaneous representations of M0, Z0, A0, and tg(d)) vs. frequency were used to analyzeimpedance spectroscopy data of SrTiO3 and to demonstrate the applicability of theserepresentations. The log(tg(d)) vs. log(f)) representation usually shows several local extremes(maxima or minima), which can be interpreted to obtain a wide range of relevant parameters, evenfor cases in which the Nyquist plot (Z0 vs. Z9) shows overlapped bulk and grain boundary arcs.Peaks of log(tg(d)) indicate electrode to grain boundary transition, and/or the grain boundary tobulk transition. Local minima can be used to extract the grain boundary or the electrode relaxationfrequencies. The admittance representation is slightly less useful. The modulus representationshows the bulk contribution term, but does not reveal the grain boundary or contributions ofelectrode terms. © 2000 Elsevier Science Ltd. All rights reserved.
Keywords:A. Interfaces; C. Impedance spectroscopy; D. Electrical properties
1. Introduction
Some applications of titanate ceramic materials are dependent mainly on major differ-ences between the bulk and grain boundary transport properties. In these cases, the overallbehavior can be changed by adjusting the average grain size, as predicted by the classical
* Corresponding author.E-mail address:[email protected] (J.R. Frade).
Pergamon Materials Research Bulletin 35 (2000) 965–976
0025-5408/00/$ – see front matter © 2000 Elsevier Science Ltd. All rights reserved.PII: S0025-5408(00)00281-6

brick layer model [1]. Strontium titanate based materials may be suitable for high-temper-ature applications such as gas sensors [2–5] or electrochemical applications [6,7]. In suchcases, one must have a proper understanding of the relative role of grain boundaries. Notethat changes in working conditions (temperature and gas composition) may exert differenteffects on the bulk and grain boundary conductivity.
Maier and coauthors [8] showed that impedance spectroscopy is an efficient method toseparate the bulk and grain boundary contributions, by comparing the spectra obtained forsingle crystals, bicrystals, and ceramic samples. Their results show that one may expect greatdifferences between the relevant relaxation frequencies of acceptor-doped strontium titanate,fel ,, fgb ,, fB, where subscripts el, gb, and B denote the electrode process, the grainboundaries, and bulk, respectively. Thus, impedance spectra should show well-resolved bulk,grain boundary, and electrode terms, except possibly for unusual microstructures with broadsize distributions, odd particle shapes, etc.
Flieg and Maier [9] used finite element simulations to assist the interpretation of imped-ance spectra of ceramic materials. These authors predicted significant differences betweenthe actual spectra and those expected for the brick layer model for materials with unusualmicrostructures. Nevertheless, they concluded that the brick layer model usually givessufficiently good predictions for ceramic samples because the effects of several microstruc-tural features may cancel each other.
The bulk contribution of titanate materials may be revealed by a modulus representation(log(M0) vs. log(f)), even in cases where the Nyquist plots fail to reveal separate bulk andgrain boundary peaks [10]. Alternatively, one may use representations of log(tg(d)) vs.log(f), and/or log(A0) vs. log(f), as proposed in part I of this work [11]. These representationscan be used to extract a wider range of parameters, which cannot be extracted from arepresentation of the modulus.
The representation of tg(d) vs. frequency may show two maxima (at fp1 and fp2), whichare related to the bulk to grain boundary transition and the grain boundary to electrodetransition, as follows [11]:
(fgbfB)1/2 < f p1~RB/Rgb!1/2 (1)
(fgbfel)1/2 < f p2~Rgb/Rel!
1/2 (2)
Resistance ratios are thus needed to correct the estimates of the transition frequencies f1 5(fgbfB)1/2 and f2 5 (fgbfel)
1/2.The plot of tg(d) vs. frequency often shows a minimum (at fmin1), which can be used to
obtain the grain boundary relaxation frequency, as follows [11]:
fgb 5 fmin1@RB/~Rgb 1 RB!#1/2 (3)
One must thus multiply the frequency at the minimum by a factor [RB/(Rgb 1 RB)]1/2 toobtain a correct value of the grain boundary relaxation frequency fgb. A second localminimum is also predicted and should yield the electrode relaxation frequency as follows:
fel 5 fmin2@~RB 1 Rgb!/~RB 1 Rgb 1 Rel!#1/2 (4)
966 J.C.C. Abrantes et al. / Materials Research Bulletin 35 (2000) 965–976

Representations of log(A0) may show peaks that are related to the grain boundary orelectrode relaxation frequencies, as follows:
fgb 5 f p1RB/~RB 1 Rgb! (5)
fel 5 f p2~RB 1 Rgb!/~RB 1 Rgb 1 Rel! (6)
Simulated study cases [11] showed that the parameters revealed by representations of theadmittance are usually similar to those shown by tg(d). However, tg(d) is more suitable forspectra with a small high-frequency contribution. The present work was conducted tocompare both types of representation.
2. Experimental
Powders of strontium titanate were prepared by solid-state reaction of carbonate(BDH30275) and titania (Merck 808) at 1100°C for 15 h. These powders were used to
Fig. 1. Scanning electron microstructures of samples A (fired at 1600°C for 20 h) (a) and B (fired at 1300°C for3 h) (b).
967J.C.C. Abrantes et al. / Materials Research Bulletin 35 (2000) 965–976

obtain disks, which were fired at 1600°C for 20 h to obtain a dense sample with coarsegrain size (sample A), or at 1300°C for 4 h to obtain a sample with fine grain size (sampleB). X-ray diffraction indicated that these materials were single phase, with the perovskitestructure. Scanning electron micrographs (Fig. 1) were obtained after polishing andthermal etching. The etching temperature was 10% below the corresponding sinteringtemperature (in °C).
A Hewlett Packard HP428A precision LCR meter was used to obtain the impedancespectra in the temperature range 300 –1000°C, in air or in N2 atmosphere. These spectrawere obtained on cooling, with steps of –25°C. An interactive computer program wasdeveloped to show several simultaneous representations of the impedance data; this wasinstalled on a desktop computer for quick inspection of the data obtained over relativelywide temperature ranges. The frequency range (and the corresponding scales of Z9, Z0,A0, M0, and tg(d)) may be adjusted as required to show overall spectra or amplificationof selected ranges. The3 and4 cursors are used to scan the frequency range, and thecorresponding values of f, Z9, Z0, A0, M0, and tg(d) are displayed on the computer screen.A code developed by Boukamp [12] was also used to fit the impedance data.
Fig. 2. Nyquist representation of the impedance spectrum of sample A at 450°C (a) and the correspondingrepresentations of Z0, M0, A0, and tg(d) (b).
968 J.C.C. Abrantes et al. / Materials Research Bulletin 35 (2000) 965–976

3. Results
Fig. 2a shows the impedance spectrum of a strontium titanate sample with large grain size(sample A) at 450°C. This spectrum shows part of the high frequency arc, which wasascribed to the bulk, and a main arc at relatively low frequencies, which increases withdecreasing grain size and was thus ascribed to resistive grain boundaries. Fig. 3 shows thatthe values of RgbS/L obtained for the sample A with large grain size (o) are at least one orderof magnitude smaller than those for sample B with small grain size (L). The results of bulkresistance obtained for both samples (triangles for sample A, and1 for sample B) fit acommon line with an activation energy of about 0.99 eV.
The bulk relaxation frequency is revealed by peaks in Z0 and modulus M0 plots, as shownin Fig. 2b. Z0 shows the high frequency (bulk) peak at about 0.8 MHz. This is close to thepeak frequency of M0 (at 0.9 MHz). The results obtained at other temperatures confirm thisfinding (Fig. 4).
At 450°C, the frequency dependence of Z0 shows the grain boundary peak at fgb 5 174Hz. Alternately, one may resort to the minimum of tg(d), (fmin 5 638 Hz), which is relatedto the grain boundary relaxation frequency (Eq. (3)). On inserting the values of bulk andgrain boundary resistances, RB 5 7.9 kV and Rgb 5 83 kV (obtained from Fig. 2a), oneobtains fmin[RB/(RB 1 Rgb)]
1/2 5 188Hz. Fig. 4 shows that the differences between fgb andfmin may be accounted for by the factor [RB/(RB 1 Rgb)]
1/2. The temperature dependence of
Fig. 3. Bulk and grain boundary resistances (normalized with the area to thickness ratio S/L). The grain boundarydata for sample A (o) and sample B (L) were obtained by fitting with a Boukamp code. The bulk contributionswere obtained by fitting (closed triangles for sample A), or from tg(d) representations (open triangles for sampleA, and 1 for sample B). The symbols (3) correspond to the peaks of tg(d) obtained for sample A, prior toapplication of Eq. (1).
969J.C.C. Abrantes et al. / Materials Research Bulletin 35 (2000) 965–976

the values of fgb corresponds to an activation energy of 1.73 eV, which is somewhat higherthan the activation energy of the grain boundary resistance (1.53 eV).
The maximum of tg(d) corresponds to fp1 5 60 kHz, and Z9 5 7.9 kV; this is close to thebulk resistance. Actually, the peak frequency of tg(d) is higher than the effective transitionfrequency, as described by Eq. (1), (fBfgb)
1/2 5 fp (RB/Rgb)1/2 ' 19 kHz, and RB ' Z´(19 3
103) 5 8.5 kV. This result is shown in Fig. 3 (open triangles) and agrees with estimates ofbulk resistance obtained by fitting with Boukamp’s [12] code (Œ).
The representation of A0 shown in Fig. 2b confirms the results extracted from therepresentation of tg(d). The peak of A0 corresponds to the minimum of tg(d), being relatedto the grain boundary relaxation frequency. However, the peak of A0 occurs at higherfrequency, because the factors in Eqs. (3) and (5) are significantly different. On inserting thevalues of bulk and grain boundary resistance and combining these equations, one obtainsfp1/fmin1 5 3.1, which is consistent with the differences between the representation of A0 andtg(d). Therefore, the representation of A0 does not provide additional information relative tothe representation of tg(d).
The spectrum of sample A at 550°C (Fig. 5a) shows a major grain boundary term, but thefrequency range of measurements (20 Hz to 1 MHz) is insufficient for complete detection ofthe bulk and electrode contributions. The maximum of Z0 (Fig. 5b) can be used to evaluatethe grain boundary relaxation frequency (fgb 5 4.5 kHz), and the minimum of tg(d), (fmin 510.4 kHz), can be inserted in Eq. (3) to obtain a similar result (fgb 5 5.3 kHz). The modulusrepresentation is less suited for this case.
Fig. 4. Bulk (triangles), and grain boundary relaxation frequencies (circles) obtained for sample A. The closedsymbols correspond to the peaks of Nyquist plots, and the open symbols were obtained from peaks of the modulus(bulk), or minima of tg(d) (grain boundary), after the required correction (Eq. (3)). The symbols (1) representminima of tg(d) prior to correction.
970 J.C.C. Abrantes et al. / Materials Research Bulletin 35 (2000) 965–976

The maximum of tg(d) occurs at fp 5 105 kHz, and is related to a bulk to grain boundarytransition (RB 5 1.07 kV). However, the actual frequency range is insufficient to resolve thebulk contribution of the spectra. Note that the bulk relaxation frequency increases withtemperature, as shown in Fig. 4; the activation energy is about 0.92 eV.
Fig. 6a shows a typical impedance spectrum at higher temperatures (650°C). The maxi-mum of Z0 and the minimum of tg(d) (Fig. 6b) are suitable to obtain the grain boundaryrelaxation frequency as found at lower temperatures. This representation shows the grainboundary to electrode transition (at fp ' 60 Hz), and Z´(60)5 813 is close to the sum of bulkand grain boundary resistances obtained by fitting with Boukamp code [12] (RB 1 Rgb 5 794V). Actually, the electrode resistance is about one order of magnitude smaller than the grainboundary resistance, and one must thus use Eq. (2) to obtain a better estimate of the grainboundary to electrode transition (fp(Rel/Rgb)
1/2 ' 180 Hz, and RB 1 Rgb 5 Z9(180)5 804V).
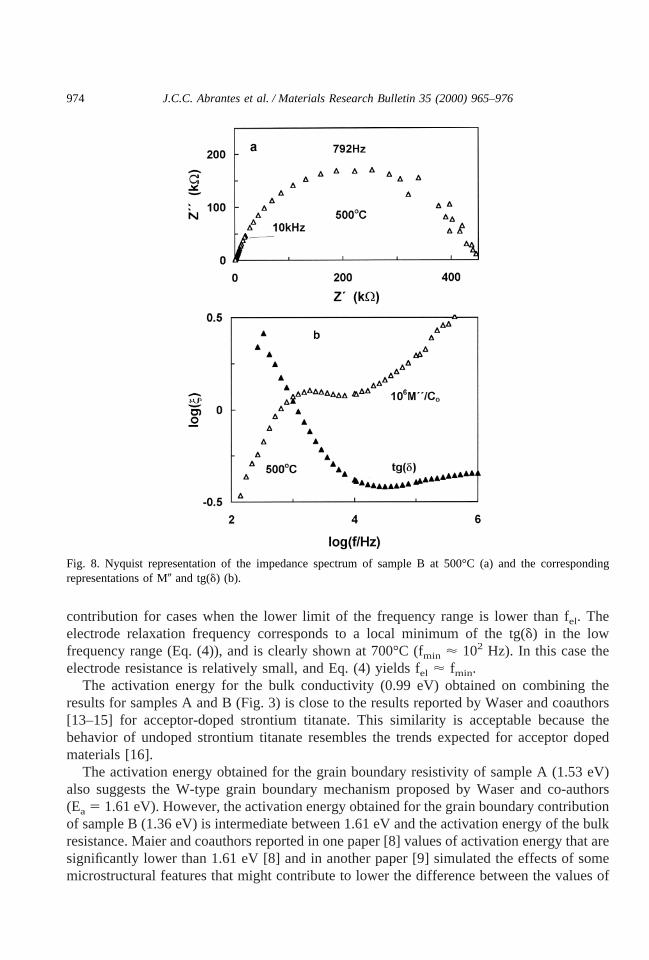
Figs. 7 and 8 show results for sample B (with fine grain size). The usual representationsof Z0 vs. Z9 (Fig. 7a and 8a) show a single arc, which can be ascribed to the resistive grainboundaries. However, alternative representations of tg(d) or modulus (Figs. 7b and 8b) can
Fig. 5. A: Nyquist representation of the impedance spectrum of sample A at 550°C (a) and the correspondingrepresentations of Z0, M0, and tg(d) (b).
971J.C.C. Abrantes et al. / Materials Research Bulletin 35 (2000) 965–976

be used to evaluate a minor bulk resistance and the corresponding relaxation frequency. Thefrequency values at the peak of the modulus are similar for samples A (with coarse grainsize) and sample B (with fine grain size), and were thus ascribed to the bulk relaxationfrequency. Typical values for sample A are 20.3 kHz at 300°C and 247 kHz at 400°C, andthe corresponding values for sample B are 18.4 kHz at 300°C and 273 kHz at 400°C. Thesefrequencies are much higher than the typical range of relaxation frequencies suggested by theNyquist plots (Figs. 7a and 8a).
The arc revealed by the usual Nyquist plot (Fig. 8a) was ascribed to the grain boundaryterm, because the peak frequency agrees with the order of magnitude obtained for sample A(Fig. 4). The amplitude of this arc was used to obtain the values of RgbA/L shown in Fig. 3.The maximum of the modulus shown in Fig. 8b (at about 1 kHz) must thus be related to thegrain boundary relaxation frequency rather than the bulk relaxation frequency.
The peak tg(d) in Fig. 8b reveals the bulk to grain boundary transition; this occurs at aboutfp1 5 105 Hz, and the dependence of Z9 on frequency yields Z9(105) 5 6.8 kV. These values(x in Fig. 3) are significantly lower than the bulk resistivity of sample A. However, the grainboundary resistance is at least two orders of magnitude higher than the bulk resistance, and
Fig. 6. Nyquist representation of the impedance spectrum of sample A at 650°C (a) and the correspondingrepresentations of Z0, M0, and tg(d) (b).
972 J.C.C. Abrantes et al. / Materials Research Bulletin 35 (2000) 965–976

one must thus use Eq. (1) to obtain a better estimate of the transition, (fgbfB)1/2 5 fp1(RB/Rgb)
1/2. On extrapolating the grain boundary resistance from the data shown in Fig. 3, andassuming RB 5 Z9(105) 5 6.8 kV, one obtains (fgbfB)1/2 5 2.8 kHz, and RB ' Z9(2.8 3103) 5 31 kV. Further iterations yield RB ' 27 kV. A similar scheme was used for othertemperatures, and the results obtained in this way (1 in Fig. 3) are close to the bulkresistivity of sample A.
Fig. 7b also demonstrates the advantages of the tg(d) representation relative to therepresentation of A0 in cases where the usual Nyquist plot is insufficient. This confirmsprevious conclusions drawn from the analysis of simulated study cases [11].
The representations shown in Figs. 2b, and 5b through 8b fail to show the applicability ofthe representations of tg(d) or A0 to characterize the electrode processes in the actualcircumstances. Note that the electrode relaxation frequency is usually close to the lower limitof the frequency range of the equipment (20 Hz) and the electrode resistance tends to berelatively small. In addition, the scattering of the data is usually higher at low frequencies.Additional spectra were thus obtained for sample A in an atmosphere of N2 (Fig. 9a and b)to demonstrate that the representation of tg(d) may be suitable to characterize the electrode
Fig. 7. Nyquist representation of the impedance spectrum of sample B at 400°C (a) and the correspondingrepresentations of M0, A0, and tg(d) (b).
973J.C.C. Abrantes et al. / Materials Research Bulletin 35 (2000) 965–976
contribution for cases when the lower limit of the frequency range is lower than fel. Theelectrode relaxation frequency corresponds to a local minimum of the tg(d) in the lowfrequency range (Eq. (4)), and is clearly shown at 700°C (fmin ' 102 Hz). In this case theelectrode resistance is relatively small, and Eq. (4) yields fel ' fmin.
The activation energy for the bulk conductivity (0.99 eV) obtained on combining theresults for samples A and B (Fig. 3) is close to the results reported by Waser and coauthors[13–15] for acceptor-doped strontium titanate. This similarity is acceptable because thebehavior of undoped strontium titanate resembles the trends expected for acceptor dopedmaterials [16].
The activation energy obtained for the grain boundary resistivity of sample A (1.53 eV)also suggests the W-type grain boundary mechanism proposed by Waser and co-authors(Ea 5 1.61 eV). However, the activation energy obtained for the grain boundary contributionof sample B (1.36 eV) is intermediate between 1.61 eV and the activation energy of the bulkresistance. Maier and coauthors reported in one paper [8] values of activation energy that aresignificantly lower than 1.61 eV [8] and in another paper [9] simulated the effects of somemicrostructural features that might contribute to lower the difference between the values of
Fig. 8. Nyquist representation of the impedance spectrum of sample B at 500°C (a) and the correspondingrepresentations of M0 and tg(d) (b).
974 J.C.C. Abrantes et al. / Materials Research Bulletin 35 (2000) 965–976

activation energy obtained for the grain boundaries and the bulk. In addition, sample Bretains a significant porosity; this might also cause changes in the grain boundary relaxationfrequency and its temperature dependence.
4. Conclusions
Representations of log(M0), tg(d), and log(A0) vs. log(f) may be used to interpret theimpedance spectroscopy of electroceramics with highly resistive grain boundaries, and toextract the relevant parameters of the bulk behavior, which might be concealed by the usualNyquist plots. The modulus representation is most suitable for the term with the lowestcapacity, but usually fails to show other contributions. In this case, one may resort to plotsof log(tg(d)) vs. log(f) to extract the relevant parameters of the grain boundary or electrodeprocesses.
A minimum tg(d) is usually related to the grain boundary relaxation frequency, and asuitable correction can be used in cases where the grain boundary resistance is much higherthan the bulk resistance. The peaks of tg(d) vs. frequency provide information about the bulkto grain boundary transition, which is suitable to obtain the bulk resistance RB, or the grain
Fig. 9. Nyquist representation of the impedance spectrum of sample A in N2 at 600 and 700°C, and thecorresponding representations of and tg(d) (b).
975J.C.C. Abrantes et al. / Materials Research Bulletin 35 (2000) 965–976

boundary to electrode transition, which is suitable to obtain RB 1 Rgb. These transitions maybe significantly displaced from the actual peaks of tg(d) when the grain boundary resistanceis much higher than the bulk resistance. A correction is proposed for these cases.
Acknowledgments
This work was sponsored by JNICT and Programme PRAXIS XXI, under ContractPRAXIS/3/3.1/MMA/1760/95, and by the European Commision under network researchcontract FMRX-CT97-0130.
References
[1] J.E. Bauerle, J Phys Chem Solids 30 (1969) 2657–2670.[2] J. Gerblinger, H. Meixner, Sensors Actuators B4 (1991) 99–102.[3] U. Schonauer, Sensors Actuators B4 (1991) 431–436.[4] C. Tragut, Sensors Actuators B4 (1992) 742–746.[5] J.C.C. Abrantes, J.A. Labrincha, J.R. Frade, Sensors Actuators B 56 (1999) 198-205[6] S. Steinsvik, R. Bugge, J. Gjonnes, J. Tafto, T. Norby, J Phys Chem Solids 6 (1997) 969–976.[7] J.R. Jurado, F.M. Figueiredo, B. Gharbage, J.R. Frade, Solid State Ionics 118 (1999) 89–97.[8] I. Denk, J. Claus, J. Maier, J Electrochem Soc 144 (1997) 3526–36.[9] J. Fleig, J. Maier, J Electrochem Soc 145 (1998) 2081–9.
[10] D. Sinclair, A. West, J Appl Phys 66 (1989) 3850–6.[11] J.C.C. Abrantes, J.A. Labrincha, J.R. Frade, Mater Res Bull 35 (6) (2000) 955–964.[12] B. Boukamp, Solid State Ionics 20 (1986) 31–44.[13] M. Vollman, R. Waser, J Am Ceram Soc 77 (1997) 235–243.[14] M. Vollman, R. Waser, J Electroceram 1 (1997) 51–64.[15] M. Vollman, R. Hagenbeck, R. Waser, J Am Ceram Soc 80 (1997) 2301–2314.[16] N.H. Chan, R.K. Sharma, D.M. Smyth, J Electrochem Soc 128 (1981) 1762–769.
976 J.C.C. Abrantes et al. / Materials Research Bulletin 35 (2000) 965–976