EVALUATION OF LATERAL CEPHALOMETRIC VARIABLES ...
104
EVALUATION OF LATERAL CEPHALOMETRIC VARIABLES AND ITS EFFICACY IN IDENTIFICATION OF SEXUAL DIMORPHISM IN CHENNAI POPULATION USING DISCRIMINANT FUNCTION ANALYSIS Dissertation Submitted to THE TAMILNADU Dr. M.G.R. MEDICAL UNIVERSITY In Partial Fulfillment for the Degree of MASTER OF DENTAL SURGERY BRANCH IX ORAL MEDICINE AND RADIOLOGY APRIL 2016
-
Upload
khangminh22 -
Category
Documents
-
view
2 -
download
0
Transcript of EVALUATION OF LATERAL CEPHALOMETRIC VARIABLES ...
EVALUATION OF LATERAL CEPHALOMETRIC VARIABLES AND ITS
EFFICACY IN IDENTIFICATION OF SEXUAL DIMORPHISM IN CHENNAI
POPULATION USING DISCRIMINANT FUNCTION ANALYSIS
Dissertation Submitted to
THE TAMILNADU Dr. M.G.R. MEDICAL UNIVERSITY
In Partial Fulfillment for the Degree of
MASTER OF DENTAL SURGERY
BRANCH IX
ORAL MEDICINE AND RADIOLOGY
APRIL 2016
ACKNOWLEDGEMENT
I thank Dr. Kailasam, B.Sc., MDS, Professor and Head, of the
Department of Oral Medicine and Radiology, Ragas Dental College and
Hospital, Chennai, who has been instrumental in shaping my views
throughout the completion of my dissertation in all aspects. His enthusiasm
and unlimited zeal proved to be a major driving force throughout the
dissertation completion. Sir, I solemnly express my deep felt gratitude for your
valuable and great guidance and suggestions.
I express my deep sense of gratitude to Dr. R.Sangeetha, MDS, who
was there at each step guiding me to prepare this dissertation. I am deeply
grateful for her detailed and constructive comments, and for her important
support throughout this work.
I also thank Dr. Anand.B, MDS, Dr. Massillamani, MDS,
Dr. Aparna, MDS, Readers, Dr. Santana MDS, Professor and for their
motivation towards the completion of the dissertation.
I would like to extend my gratitude to Dr.Srividhya, Dr.Aneetha,
Dr.Athreya, Dr.Malvika, Senior Lecturers for thier valuable help throughout
my study and giving me constant support and encouragement.
I take this opportunity to thank Dr. S. Ramachandran MDS,
Principal, Ragas Dental College & Hospital and to Dr. N.S. Azhagarasan
MDS, and Dr. N. R. Krishnaswamy MDS, Vice-principals, Ragas Dental
College for their generous support rendered throughout my course.
I also thank my bachmates, Dr.Veda, Dr,Dheeraj, Dr.Jason,
Dr.Dafina for encouraging me and helping me in completing this dissertation.
I also thank my seniors and juniors who have also been a support. I extend my
gratitude to them for their friendly help, and cooperation throughout my
postgraduate life.
I would like to take this opportunity to especially thank my parents
Mrs. K.Vimala and Mr. K.K.Rao without whom my existence and the fruit of
my success in my life would have just been a dream. I would also like to thank
my beloved sister, Mrs. K.Lakshmi who has been a great support throughtout
my life.
I would like to express my gratitude towards my friends, Mr. Krishna
Praveen and Dr.Khushbu Sharma who have been a helping hand and
supportive throughout the completion of my dissertation.
Above all, I am thankful to the All Mighty, who has given me the
strength to successfully cross the journey of my life till now and will help me
do the same for the rest of my life.
Truly
Korla. Swetha
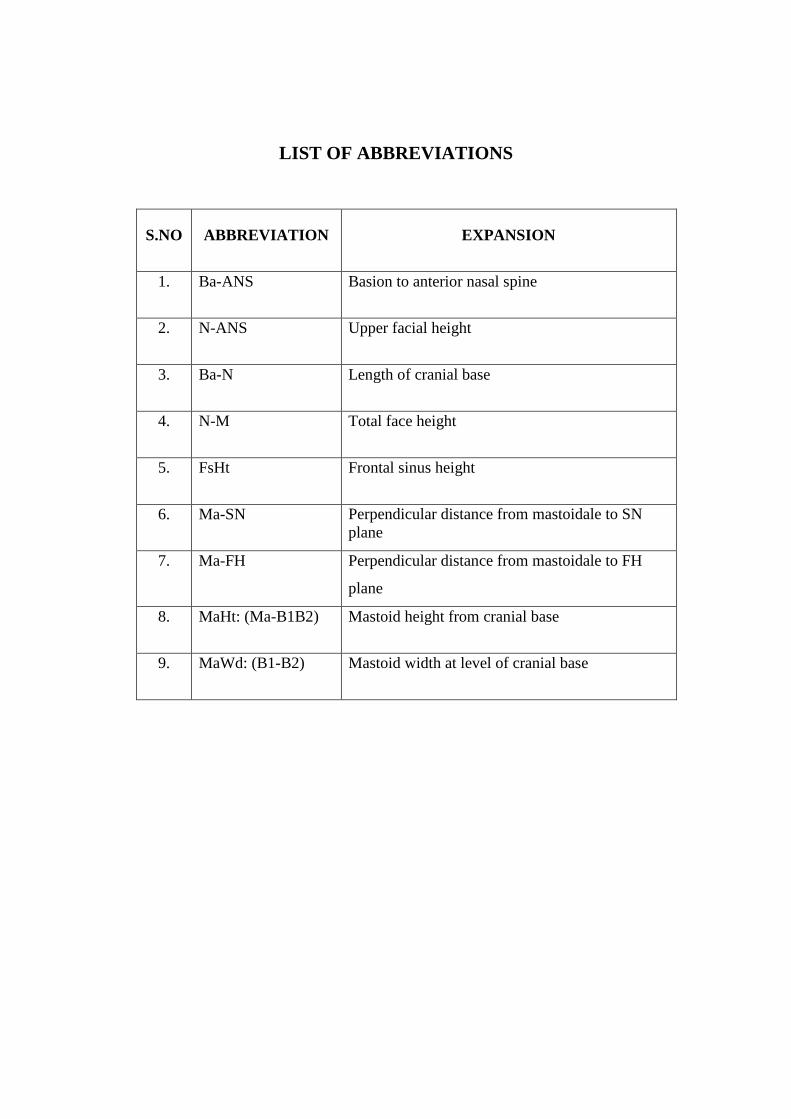
LIST OF ABBREVIATIONS
S.NO ABBREVIATION EXPANSION
1. Ba-ANS Basion to anterior nasal spine
2. N-ANS Upper facial height
3. Ba-N Length of cranial base
4. N-M Total face height
5. FsHt Frontal sinus height
6. Ma-SN Perpendicular distance from mastoidale to SN
plane
7. Ma-FH Perpendicular distance from mastoidale to FH
plane
8. MaHt: (Ma-B1B2) Mastoid height from cranial base
9. MaWd: (B1-B2) Mastoid width at level of cranial base
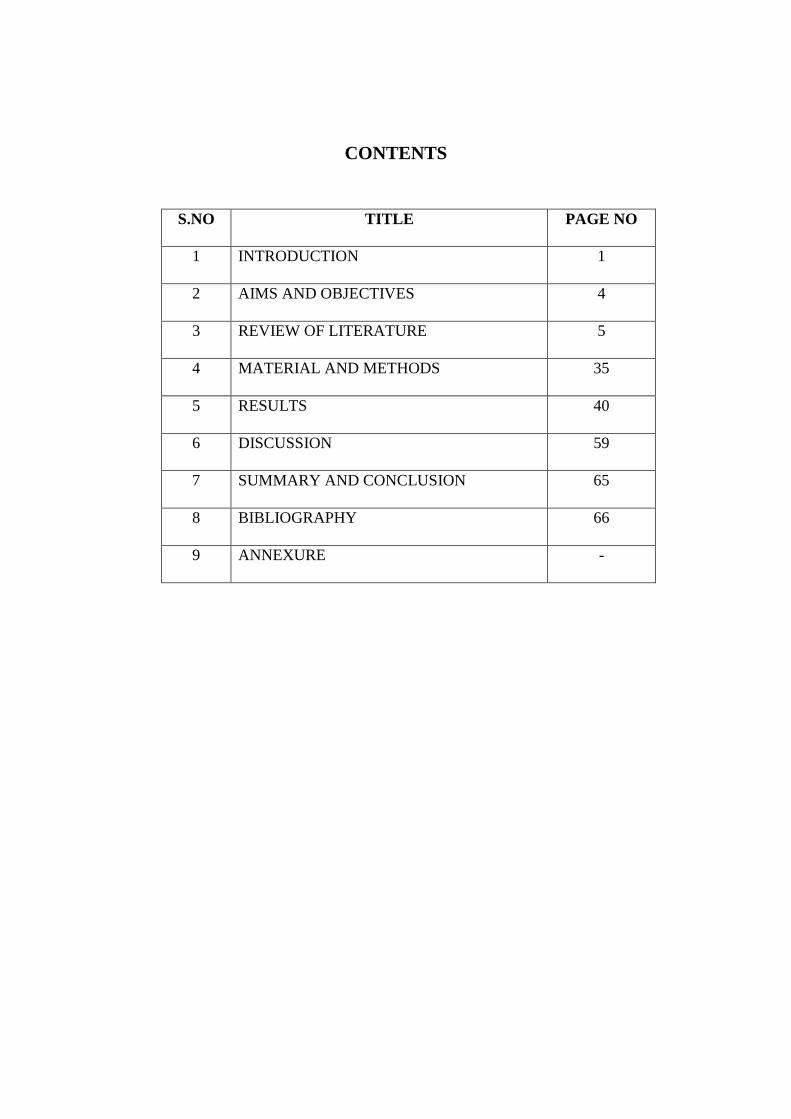
CONTENTS
S.NO TITLE PAGE NO
1 INTRODUCTION 1
2 AIMS AND OBJECTIVES 4
3 REVIEW OF LITERATURE 5
4 MATERIAL AND METHODS 35
5 RESULTS 40
6 DISCUSSION 59
7 SUMMARY AND CONCLUSION 65
8 BIBLIOGRAPHY 66
9 ANNEXURE -
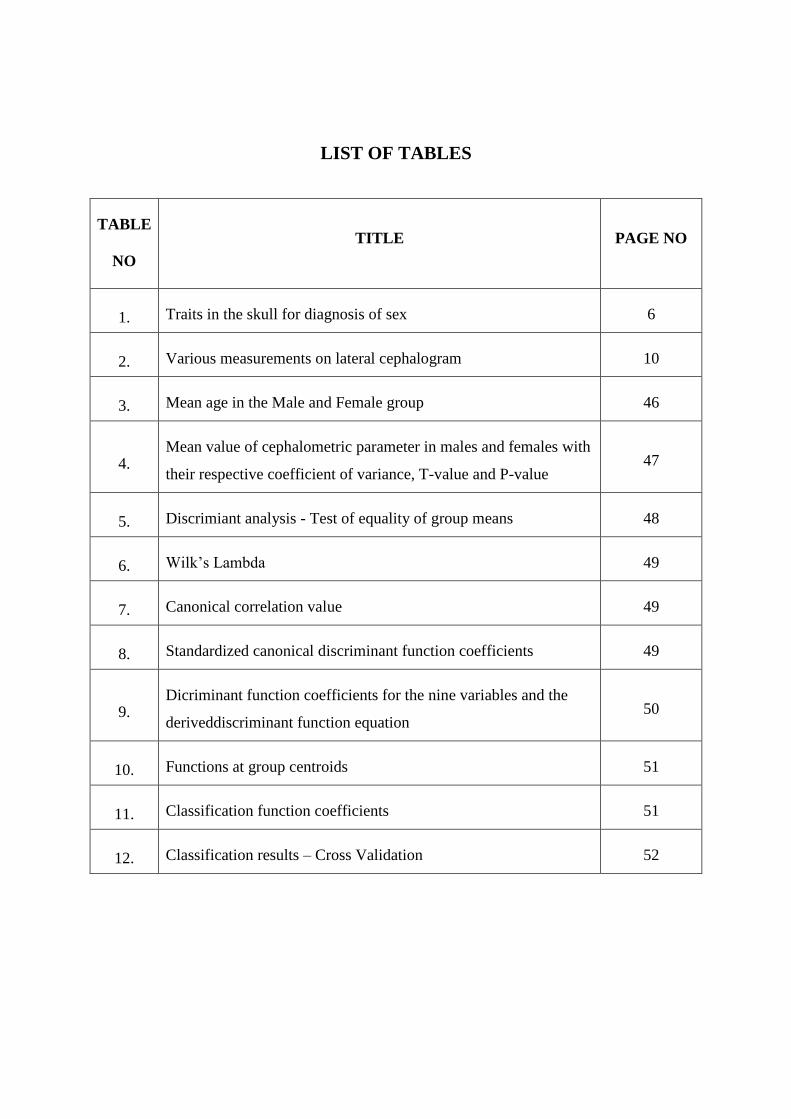
LIST OF TABLES
TABLE
NO
TITLE PAGE NO
1. Traits in the skull for diagnosis of sex 6
2. Various measurements on lateral cephalogram 10
3. Mean age in the Male and Female group 46
4. Mean value of cephalometric parameter in males and females with
their respective coefficient of variance, T-value and P-value 47
5. Discrimiant analysis - Test of equality of group means 48
6. Wilk’s Lambda 49
7. Canonical correlation value 49
8. Standardized canonical discriminant function coefficients 49
9. Dicriminant function coefficients for the nine variables and the
deriveddiscriminant function equation 50
10. Functions at group centroids 51
11. Classification function coefficients 51
12. Classification results – Cross Validation 52
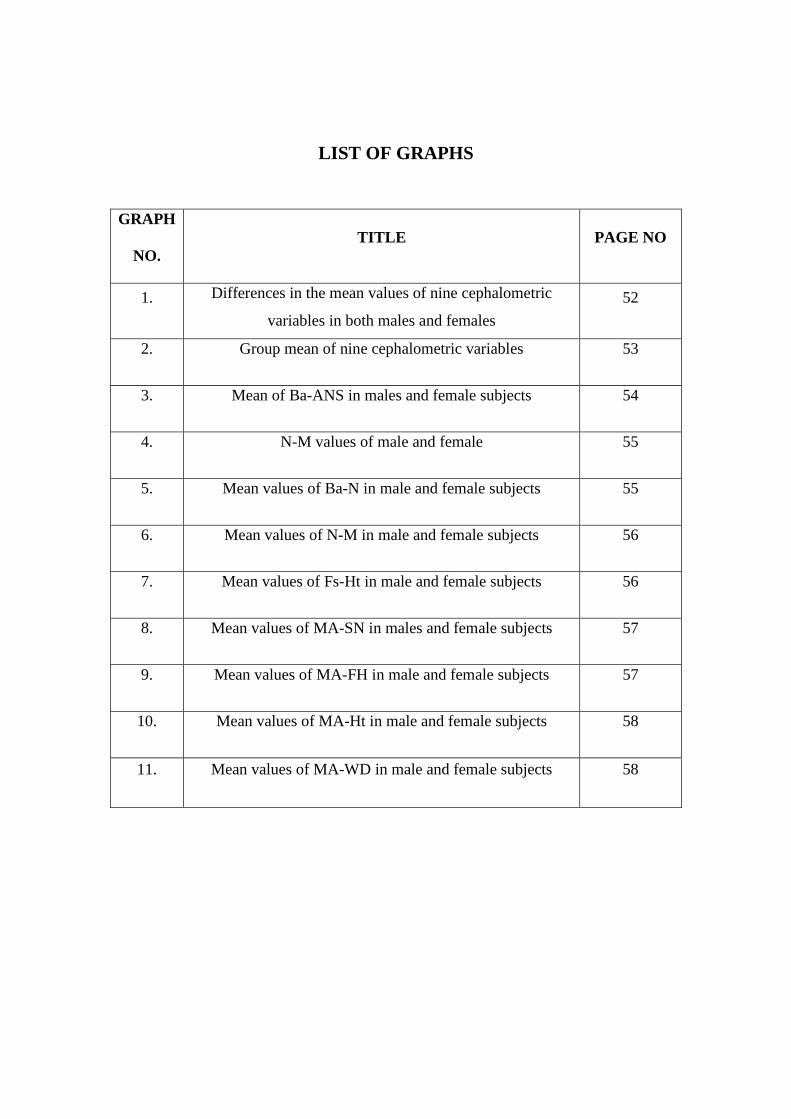
LIST OF GRAPHS
GRAPH
NO.
TITLE PAGE NO
1. Differences in the mean values of nine cephalometric
variables in both males and females
52
2. Group mean of nine cephalometric variables 53
3. Mean of Ba-ANS in males and female subjects 54
4. N-M values of male and female 55
5. Mean values of Ba-N in male and female subjects 55
6. Mean values of N-M in male and female subjects 56
7. Mean values of Fs-Ht in male and female subjects 56
8. Mean values of MA-SN in males and female subjects 57
9. Mean values of MA-FH in male and female subjects 57
10. Mean values of MA-Ht in male and female subjects 58
11. Mean values of MA-WD in male and female subjects 58
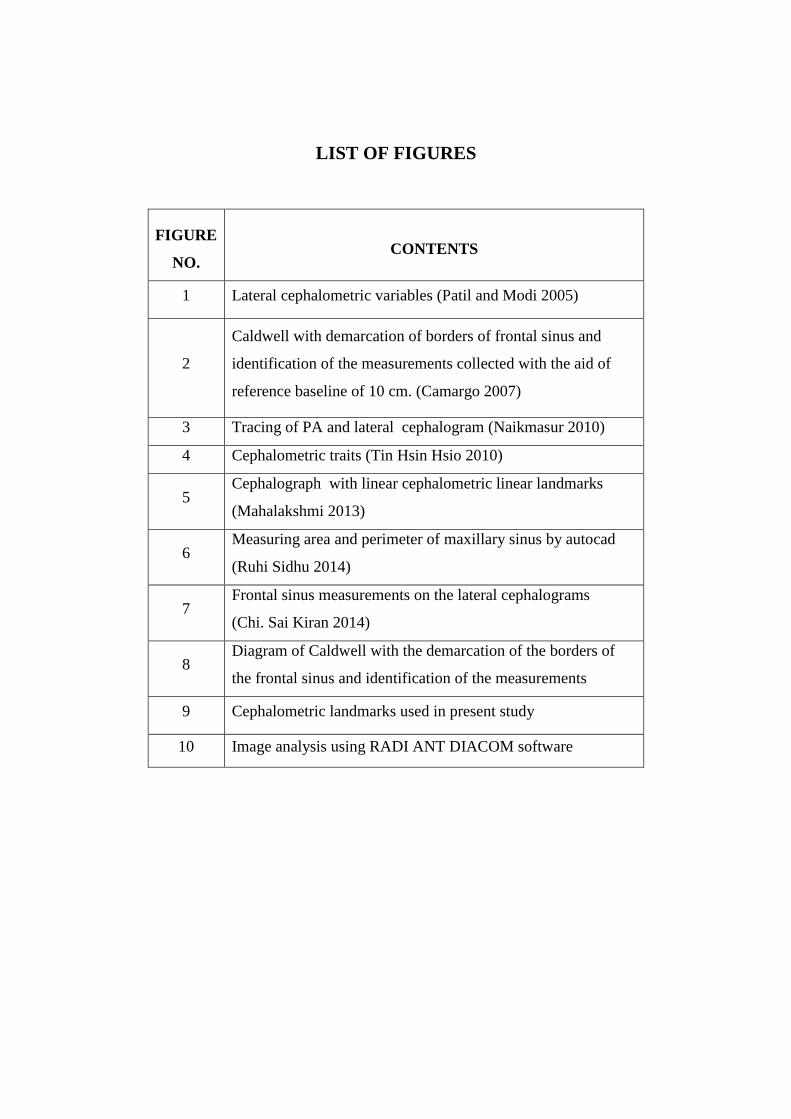
LIST OF FIGURES
FIGURE
NO. CONTENTS
1 Lateral cephalometric variables (Patil and Modi 2005)
2
Caldwell with demarcation of borders of frontal sinus and
identification of the measurements collected with the aid of
reference baseline of 10 cm. (Camargo 2007)
3 Tracing of PA and lateral cephalogram (Naikmasur 2010)
4 Cephalometric traits (Tin Hsin Hsio 2010)
5 Cephalograph with linear cephalometric linear landmarks
(Mahalakshmi 2013)
6 Measuring area and perimeter of maxillary sinus by autocad
(Ruhi Sidhu 2014)
7 Frontal sinus measurements on the lateral cephalograms
(Chi. Sai Kiran 2014)
8 Diagram of Caldwell with the demarcation of the borders of
the frontal sinus and identification of the measurements
9 Cephalometric landmarks used in present study
10 Image analysis using RADI ANT DIACOM software

Introduction
Introduction
1
INTRODUCTION
Forensic medicine is an interdisciplinary science applying reliable and
scientifically proven knowledge to form accurate and precise statements.34
Anthropometry constitutes a technique of expressing the form of the human
body.34
The use of anthropometry in the field of forensic science and medicine
dates back to 1882 when Alphonse Bertillon, a French police expert invented
a system of criminal identification based on anthropometric measurements.33
Anthropometric characteristics have direct relationship with sex, shape and
form of an individual and these factors are intimately linked with each other
and plays a major role in manifestation of the internal structure and tissue
components which in turn, are influenced by environmental and genetic
factors.34,27
Use of anthropometry may arise under several sets of
circumstances i.e. Natural, intentional and accidental (war dead cases, air
crash, road and train accidents, earth quake, flood, fire; deliberately
mutilation, disfigurement, pounding, gouging etc. of the dead body).35,36
Earlier the role of the dentistry in forensic sciences was confined to the
dental records where orthopanthomogram, intraoral periapical radiograph,
history were compared to dental restorations, dental anomalies, missing,
impacted, periodontal pathology of the unidentified body. Recently due to the
improved techniques, the skull radiography with its variables were found to
exhibit sexual dimorphism, thus increasing the scope of the dentistry in the
field of forensic sciences.

Introduction
2
The first step in forensic identification is determination of sex of an
individual.50
Human skeleton bone is used for sex determination as it has
extraordinary resistance to putrefaction and effects of external agents.60
The
major contributors in determining the sex in skeletal components are pelvis
followed by the skull.5,47,58
As the pelvis is fragile, the skull plays a major role
in determination of sex.63
Craniofacial skeleton exhibits inherent complexity
exhibiting large variability in size, shape and proportions which leads to
individualization.57
However reliability of skull in identification of sex
questionable until adolescence.7,46,14
Several studies have been conducted in the past to identify the sex of
the individual using anthropometric measurements of the skull which resulted
in an accuracy ranging from 77 to 92% .7,37,51,31,39,48,49,61
The studies
conducted to determine sex from the skull radiograph resulted in an accuracy
ranging from 80-100%. 6,7,15,25,32,35,36,46
In this regard skull radiographic
studies are feasible, accurate, reproducible method of sex determination by
using multiple linear and angular measurements.17
Further these cephalometric
variables provide multiple points for comparison.32,46
Veyre-Goulet63
et al conducted a study using 18 cephalometric
variables for sexual dimorphism in European population and claimed an
accuracy of 95.6%. Kanchan and Modi
32 et al conducted a study using
10 cephalometric variables for sexual dimorphism in Central Indian
population and claimed an accuracy of 99%. Hsiao
25 et al conducted a study
Introduction
3
using 18 cephalometric variables for sex discrimination and claimed an
accuracy of 100%.
The craniofacial characteristic traits of sex determination exhibit
population dependent differences, therefore there is a need for population
specific assessment.27
In this study, we are using lateral cephalographs of
individuals of Chennai population within the range of 25-45years to evaluate
the lateral cephalometric variables and to derive a discriminant function
equation which could be of any value in future forensic investigations in
Chennai population.

Aims & Objectives
Aims and Objectives
4
AIMS AND OBJECTIVE
AIM OF THE STUDY:
The aim of the study is to evaluate the lateral cephalometric variables
and its efficacy in identification of sexual dimorphism in Chennai population
using discriminant function analysis.
OBJECTIVES OF THE STUDY:
To assess the lateral cephalometric variables of Chennai population
within the age group of 25-45 yrs using RADI ANT DIACOM
software.
To statistically derive a discriminant function equation.
Applying the outcome in identification of sexual dimorphism
statistically.

Review of Literature
Review of Literatures
5
REVIEW OF LITERATURE
Determination of sex is usually the first step in identification of an
individual. The pelvis and skull are the two most used parts of the skeletal
system in identification of sex. The pelvis being more fragile is usually found
in more damaged conditions than the skull, making the latter used more
often.63
Features like larger and stronger skulls, prominent mastoids, pogonion
and supraorbital ridges help to differentiate skulls of males from female
individuals.3 Sometimes these features may lead to misidentification like in
the cases of females with larger skulls or men with small skull. Vikan
Sassouni57
1963 et al has stated the importance of lateral cephalograms in
sexual dimorphism.
In the recent years, new methods in sex determination using
radiographs of skulls have been proposed. In this study we are using lateral
cephalographs and evaluating the efficacy of lateral cephalometric variables in
determining sex. A proper and detailed review of literature is of at most
importance to obtain a meaningful study and results.
Ceballos and Rentschler12
et al 1958 had conducted a study to
determine the sex in 35 adult skull characteristics. Posteroanterior skull
projection was used, from which they measured four diameters: total
craniofacial height, mastoid height, bicondylar width, and mandibular width.
They have concluded from extensive tests that "sex can be predicted in 88 per
cent of the cases by utilization of these measurements."
Review of Literatures
6
Hanihara23
et al 1959 had conducted a study in 35 Japanese skulls.
The aim of the study was to use discriminant analysis in sex determination. He
has used nine measurements: maximum length, breadth of the skull, height of
the skull, facial breadth, upper facial height, mandibular breadth, symphysial
height, condylar height, and ramal breadth. The discriminate functional
equation derived in the study was able to differentiate the sex with 88.6%
accuracy rate.
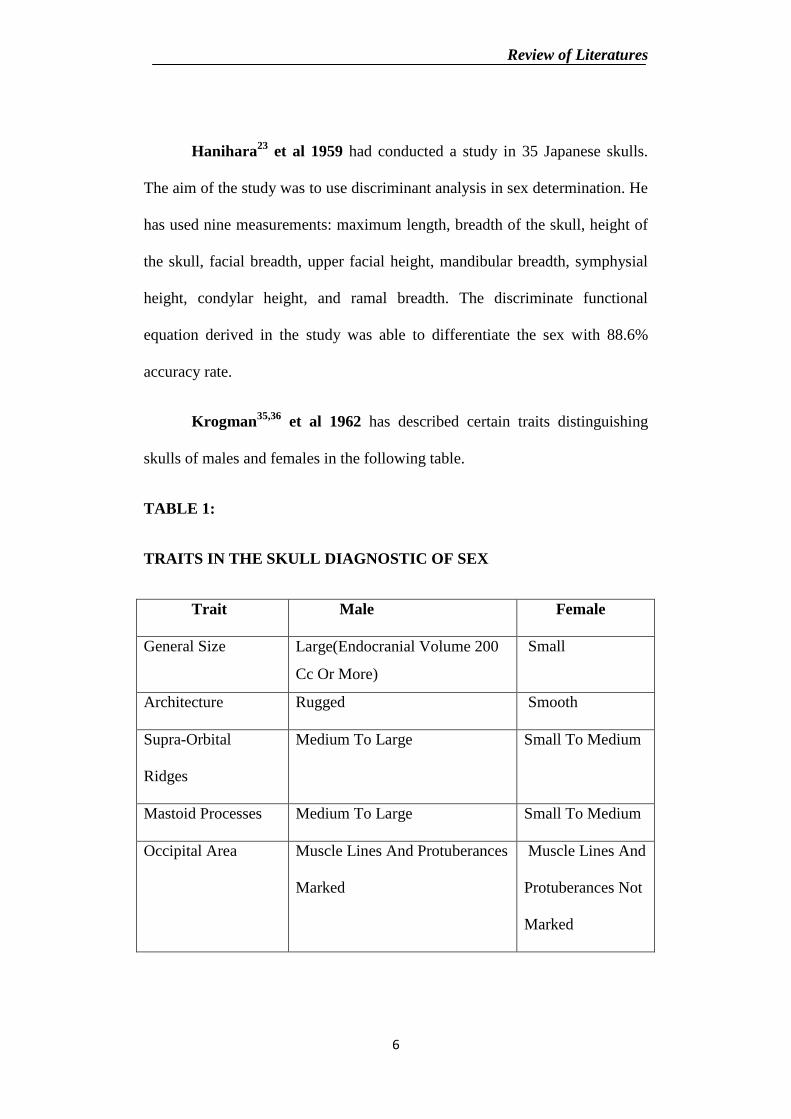
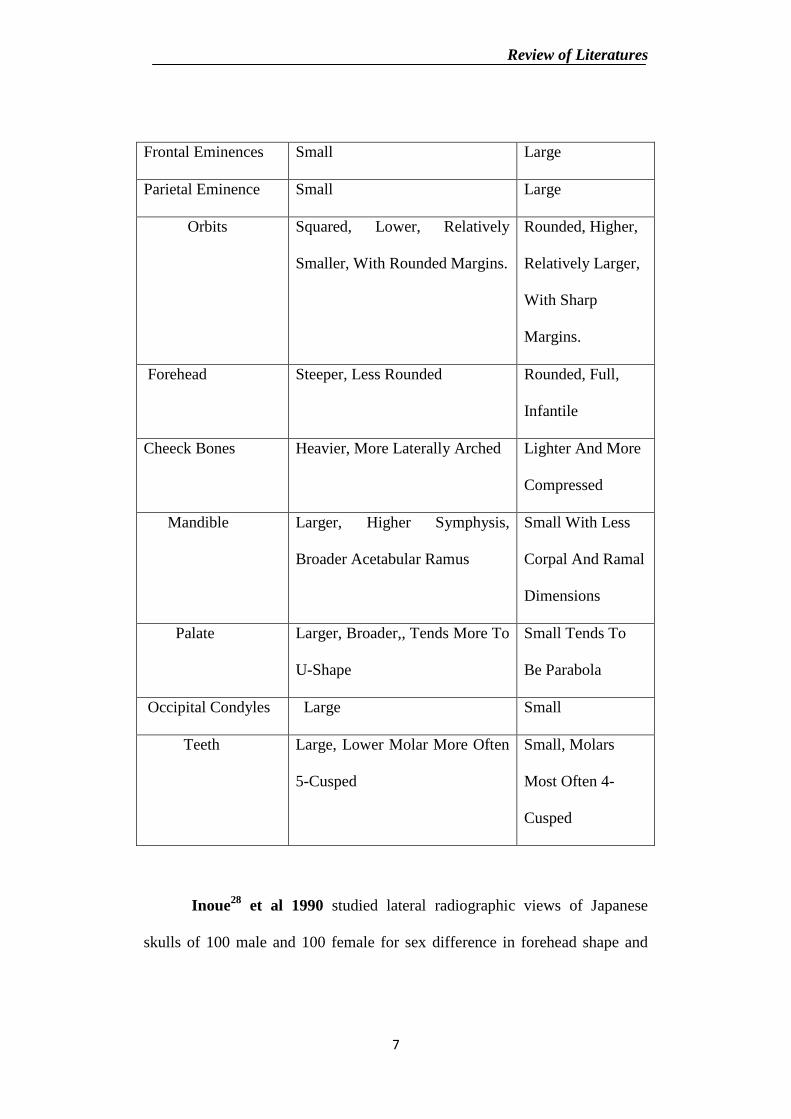
Krogman35,36
et al 1962 has described certain traits distinguishing
skulls of males and females in the following table.
TABLE 1:
TRAITS IN THE SKULL DIAGNOSTIC OF SEX
Trait Male Female
General Size Large(Endocranial Volume 200
Cc Or More)
Small
Architecture Rugged Smooth
Supra-Orbital
Ridges
Medium To Large Small To Medium
Mastoid Processes Medium To Large Small To Medium
Occipital Area Muscle Lines And Protuberances
Marked
Muscle Lines And
Protuberances Not
Marked
Review of Literatures
7
Frontal Eminences Small Large
Parietal Eminence Small Large
Orbits Squared, Lower, Relatively
Smaller, With Rounded Margins.
Rounded, Higher,
Relatively Larger,
With Sharp
Margins.
Forehead Steeper, Less Rounded Rounded, Full,
Infantile
Cheeck Bones Heavier, More Laterally Arched Lighter And More
Compressed
Mandible Larger, Higher Symphysis,
Broader Acetabular Ramus
Small With Less
Corpal And Ramal
Dimensions
Palate Larger, Broader,, Tends More To
U-Shape
Small Tends To
Be Parabola
Occipital Condyles Large Small
Teeth Large, Lower Molar More Often
5-Cusped
Small, Molars
Most Often 4-
Cusped
Inoue28
et al 1990 studied lateral radiographic views of Japanese
skulls of 100 male and 100 female for sex difference in forehead shape and
Review of Literatures
8
quantified it with the Fourier analysis method. An automated sexing computer
system based on the quantification was created and achieved 85% accuracy in
sex determination.
Hong Wei Song26
et al 1992 conducted a study in 60 chinese skulls
consisting of 30 males and 30 females. Forty one variables on each skull were
measured and one group of 14 and a second group of 5 variables were selected
from all the variables by applying multiple stepwise regression on a computer.
Discriminate function equation for the 14 and 5 variables for sex diagnosis
have been obtained and then these variables are highly significant. The
discriminate rate for the group of 5 variables resulted in accurate sex
determination in 96.7% of cases. For the group of 14 variables there was
100% success rate.
Wen -Jeng Hwang65
et al 1996 conducted a study in Caucasians and
African American to establish age and sex specific normative data within a
age group of 6-18 years by using conventional cephalometry.
The cephalometric variables used in this study are 12 in number which
includes linear measurements and angular measurements.
Cephalometric variables are SNA, SNB, FNA, AFB, ANV, BNV,
AOOB, APBP, AFBF, POOR.
There was no significant difference between males and females in
most of the angular and linear measurements.
Review of Literatures
9
Exceptions to this were the linear measurements AP-BP, AF-BF, PO-
OR and the angular measurements FNB, AFB.
Maryna Steyn43
et al 1997 conducted a study to establish population
specific standards for sex determination from the skull of South African
whites. A total of 12 standard cranial and five mandibular measurements were
taken from 44 male and 47 female skeletons of known sex and race. These
were subjected to discriminant function analysis. Bizygomatic breadth was the
most dimorphic dimension. Five functions were developed from the complete
cranium, vault, face, mandible and bizygomatic breadth. Dimensions from the
complete cranium provided the best accuracy. In the mandible, bigonial
breadth was the most dimorphic of the measurements taken. Average
accuracies ranged from 80% (bizygomatic breadth alone) to 86% (cranium).
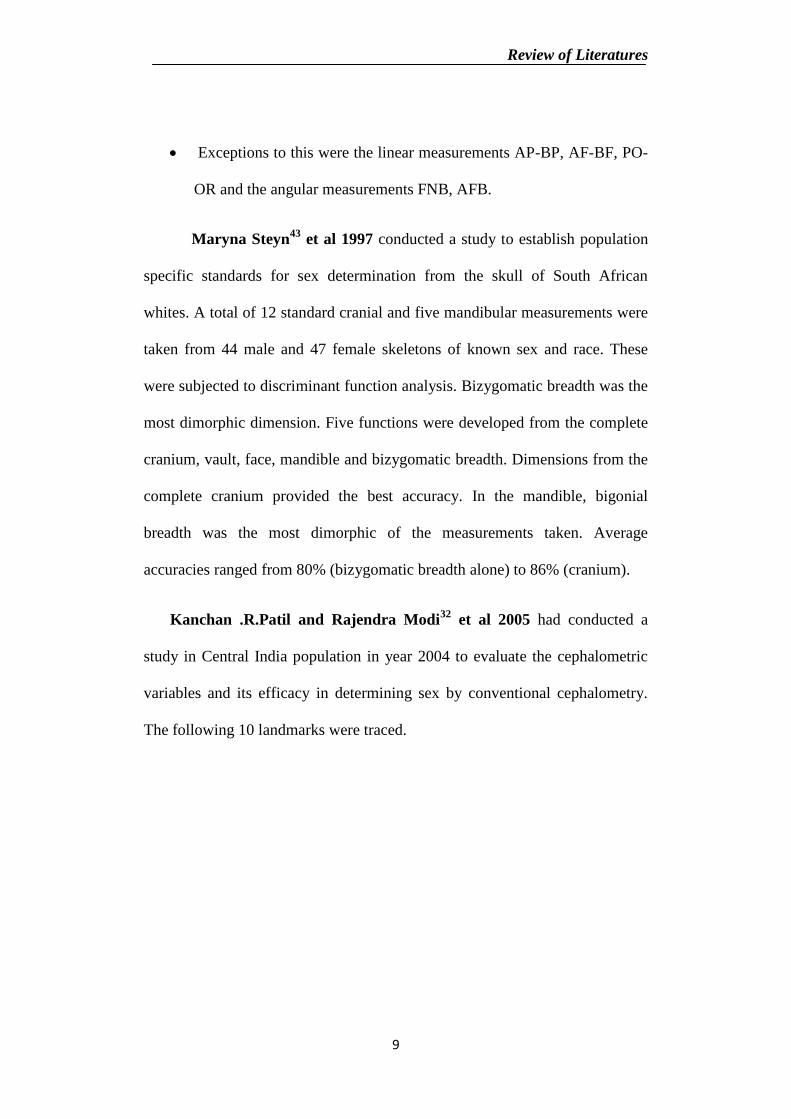
Kanchan .R.Patil and Rajendra Modi32
et al 2005 had conducted a
study in Central India population in year 2004 to evaluate the cephalometric
variables and its efficacy in determining sex by conventional cephalometry.
The following 10 landmarks were traced.
Review of Literatures
10
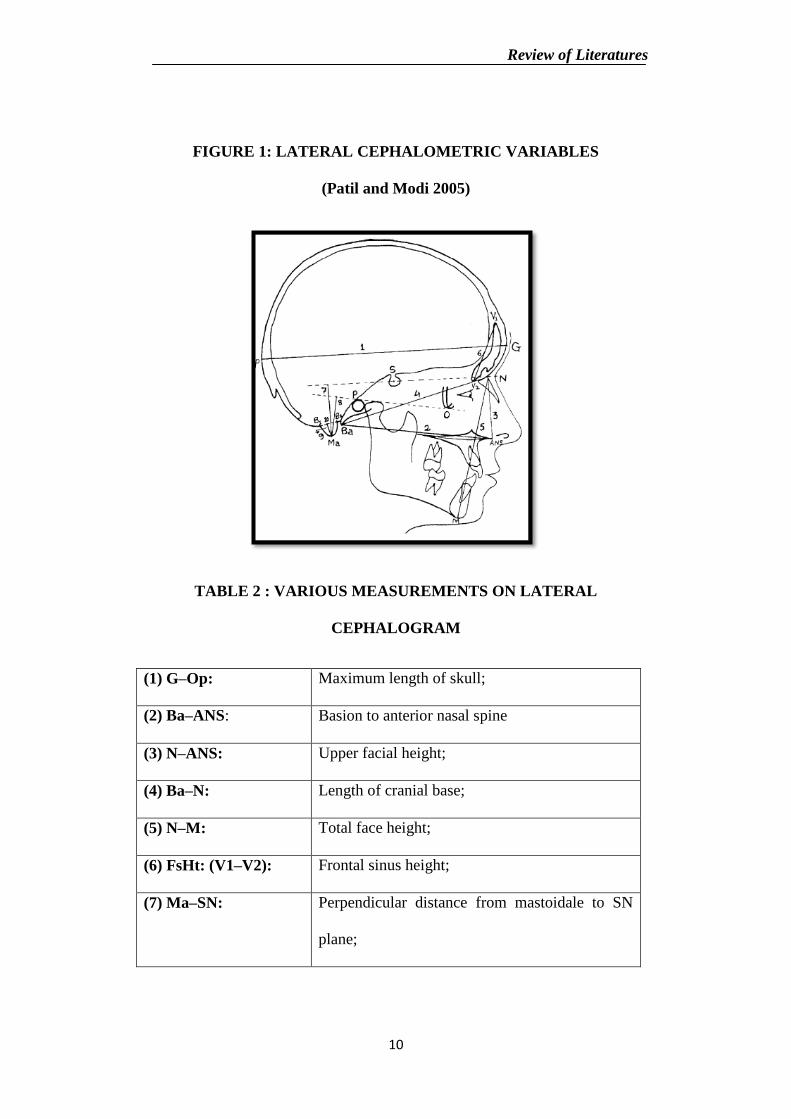
FIGURE 1: LATERAL CEPHALOMETRIC VARIABLES
(Patil and Modi 2005)
TABLE 2 : VARIOUS MEASUREMENTS ON LATERAL
CEPHALOGRAM
(1) G–Op: Maximum length of skull;
(2) Ba–ANS: Basion to anterior nasal spine
(3) N–ANS: Upper facial height;
(4) Ba–N: Length of cranial base;
(5) N–M: Total face height;
(6) FsHt: (V1–V2): Frontal sinus height;
(7) Ma–SN: Perpendicular distance from mastoidale to SN
plane;
Review of Literatures
11
(8)Ma–FH: Perpendicular distance from mastoidale to FH
plane;
(9)Ma-B1B2 Mastoid from cranial base
(10)Ma-Wd(B1-B2) Mastoid width at the level of cranial base
Discriminant function was derived for variables and discriminant score
were then calculated for individuals.
A sectioning point was then determined which divided the score.
Reliability of this discriminant function was 99%.
It was observed that Ba–N, MaHt, N–M, MaWd, Ba–ANS, Ma–FH
and G–Op were major variables in determination of sex and their
respective discriminative powers were 25.88, 15.12, 13.31, 11.88, 7.78,
7.02 and 6.90%, where as FsHt, Ma– SN and N–ANS were the least
reliable variables to determine the sex.
Out of 10 variables studied the seven variables, i.e. Ba–N; MaHt; N–
M; MaWd;Ba–ANS; MaFH and G–Op were found to be more reliable
while remaining three, i.e. FsHt; Ma–SN and N–ANS were found to be
least reliable in descending order in determining sex.
Marlon Alvaro Moldeza42
2006 et al quantified relevant
cephalometric parameters for Filipinos according to age and sex.
Review of Literatures
12
A total of 157 Filipino subjects (78 males, 79 females) were divided
into comparison groups (GI, GII, GIII, and GIV) on the basis of
chronological age and sex using digital lateral cephalometry.
They were divided into GI = 7 years of age; GII = 9.5years of age;
GIII = 14 years of age; and GIV = 22 years of age.
All relevant angular and linear parameters and coordinates were
measured with the aid of Windows-based cephalometric software
WinCeph.
N-S, N-Me, N-ANS, ANS-Me, A-Ptm, Gn-Cd, Pog_-Go, Cd-Go, Is-
Is, Ii-Ii, Mo-Ms, Mo-Mi are the linear measurements measured.
The angular measurements are facial Angle, Convexity, A-B plane,
Y-axis, FH to SN, SNA, SNB, ANB, FP to SN, PP to SN, MP to
SN,RP to SN, Gonial Angle, Is to SN, Ii to MP, Is to Ii, OP to SN, OP
to FH.
The male group had a longer anterior cranial base (S-N), total facial
height (N-Me), longer lower anterior facial height (N-ANS), longer
ramus height (Cd-Go), longer lower posterior dentoalveolar height
(Mo-Mi_), and total mandibular length (Gn-Cd) than the female group.
All these linear measurements were statistically significantly different
between males and females in GI, GIII, and GIV.
No statistically significant differences were present in the angular
measurements.
Review of Literatures
13
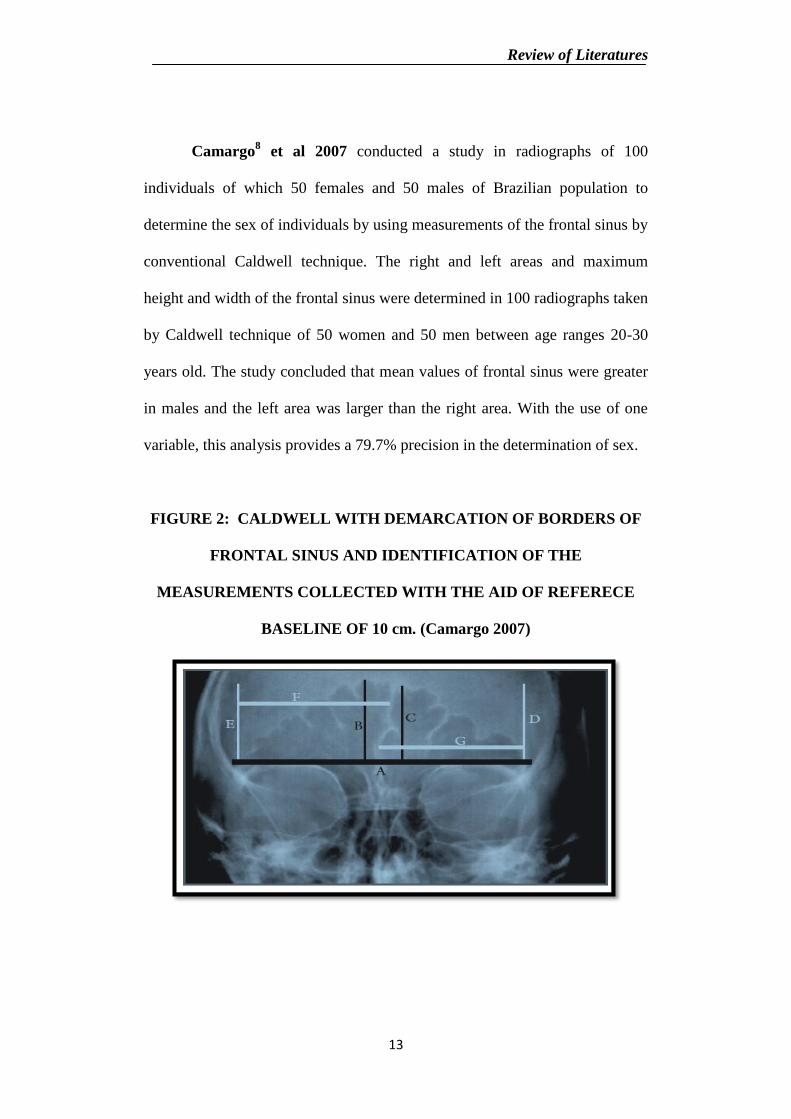
Camargo8 et al 2007 conducted a study in radiographs of 100
individuals of which 50 females and 50 males of Brazilian population to
determine the sex of individuals by using measurements of the frontal sinus by
conventional Caldwell technique. The right and left areas and maximum
height and width of the frontal sinus were determined in 100 radiographs taken
by Caldwell technique of 50 women and 50 men between age ranges 20-30
years old. The study concluded that mean values of frontal sinus were greater
in males and the left area was larger than the right area. With the use of one
variable, this analysis provides a 79.7% precision in the determination of sex.
FIGURE 2: CALDWELL WITH DEMARCATION OF BORDERS OF
FRONTAL SINUS AND IDENTIFICATION OF THE
MEASUREMENTS COLLECTED WITH THE AID OF REFERECE
BASELINE OF 10 cm. (Camargo 2007)
Review of Literatures
14
Sophie A. Veyre-Goulet63
et al 2008 conducted a study in a sample
comprised of 114 dry skulls (59 men and 55 women). Lateral teleradiography
was conducted on each skull. The cephalometric traces were made by an
orthodontic software. Nineteen cephalometric points were identified which
enabled the identification of 18 cephalometric variables as described in Hsiao
et al. There were eight angles, nine linear measurements (mm), and a
proportional measurement (%).
Variables Description:
Angular:
1. GMSN Angle between the glabella to metopion line and the sella to
nasion line (SN)
2. GMFH Angle between the glabella to metopion line and the porion to
orbitale line (Frankfort horizontal plane, FH)
3. GMBaN Angle between the glabella to metopion line and the basion to
nasion line (BaN)
4. GSgM Angle between the metopion to supraglabellare line and the
supraglabellare to glabella line
5. IOpSN Angle between the inion to opisthocranion line and the SN line
6. IOpFH Angle between the inion to opisthocranion line and the FH line
7. IOpBaN Angle between the inion to opisthocranion line and the BaN
line
Review of Literatures
15
8. OIOp Angle between the opisthocranion to inion line and the inion to
opisthion line
Linear measurements (mm):
9. SgGM Distance between supraglabellare and the glabella to metopion
line
10. GSgN Distance between glabella and the supraglabellare to nasion line
11. FSHt Frontal sinus height, vertical parameters of the frontal sinus
cavity
12. FSWd Frontal sinus width on bregma to nasion line
13. IOpO Distance between inion and the opisthocranion to opisthion line
14. MaSN Distance between mastoidale and the SN line
15. MaFH Distance between mastoidale and the FH line
16. MaHt Mastoid height from cranial base
17. MaWd Mastoid width at the level of cranial base Proportional, %:
18. GPI Glabella projection index = (distance between glabella and the
supraglabellare to nasion line)
The p value was significant in the FS-HT, Ma-SN, Ma-FH, Ma-HT,
Ma-WD.
Sex was determined with 95.6% accuracy using the 18 variables
discriminant function.
Review of Literatures
16
The stepwise discriminant analysis selected eight variables the
distances GSgN, MaHt, SgGM, FSHt, MaWd, and FSWd, the angle
GMSN, and the GPIA which could predict sex with the same accuracy.
All the linear variables were greater in males than in females.
In conclusion, it can be said that skull-sexing methods using lateral
teleradiography seem always suitable but the most indicative variables
could differ relative to the ethnic population concerned.
V.G Naikmasur46
et al 2010 conducted a study in of South Indian state
and immigrant Tibetans population within the age range of 25-54 years. Only
the dentulous subjects were considered in the study. Conventional lateral and
posterior anterior cephalometric radiographs of each selected subject were
taken and Manual method of tracing was done.
The linear measurements on the lateral cephalogram are
Ba-ANS(depth of the face), N-ANS(upper facial height), Ba-N(length
of the base of the skull), N-Me(anterior facial height), Id-
Me(symphysis height), Ar-Go(mandibular ramus height),
Me-Go(mandibular body length).
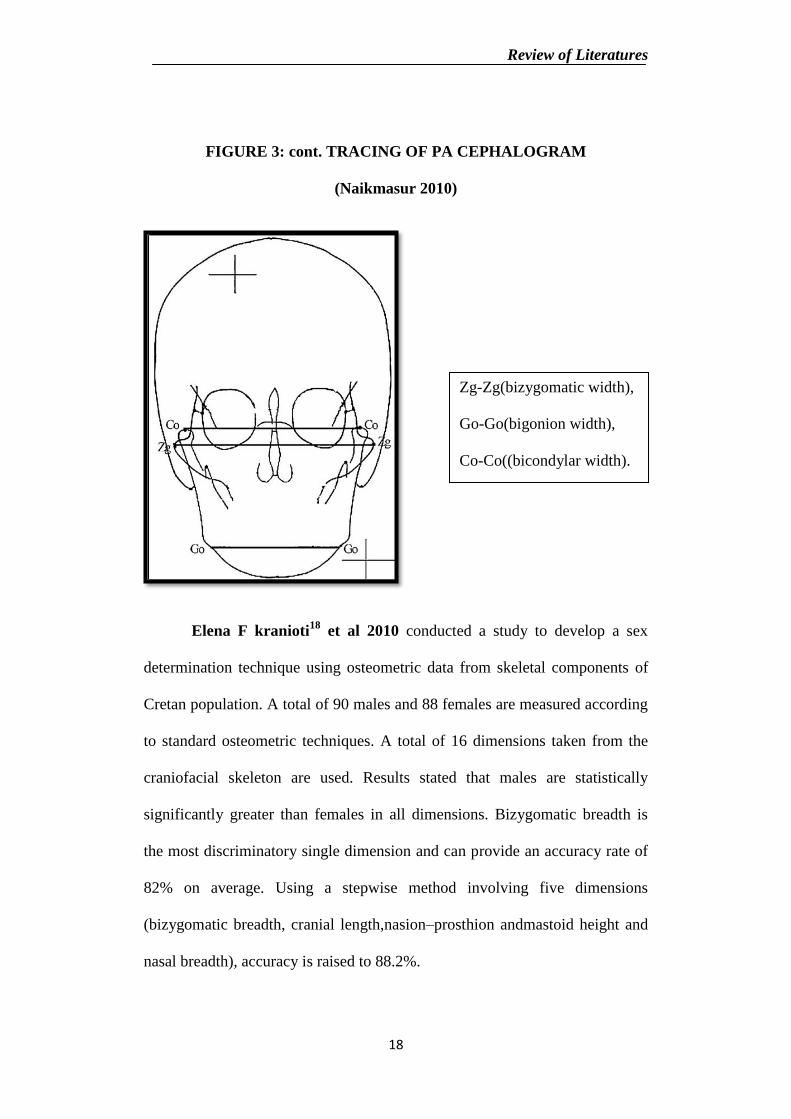
The linear measurements in the posterior anterior view are Zg-
Zg(bizygomatic width), Go-Go(bigonion width), Co-Co((bicondylar
width).
The classification accuracy for males was about 77.8% for South
Indian population and 85.2% for Tibetans.
Review of Literatures
17
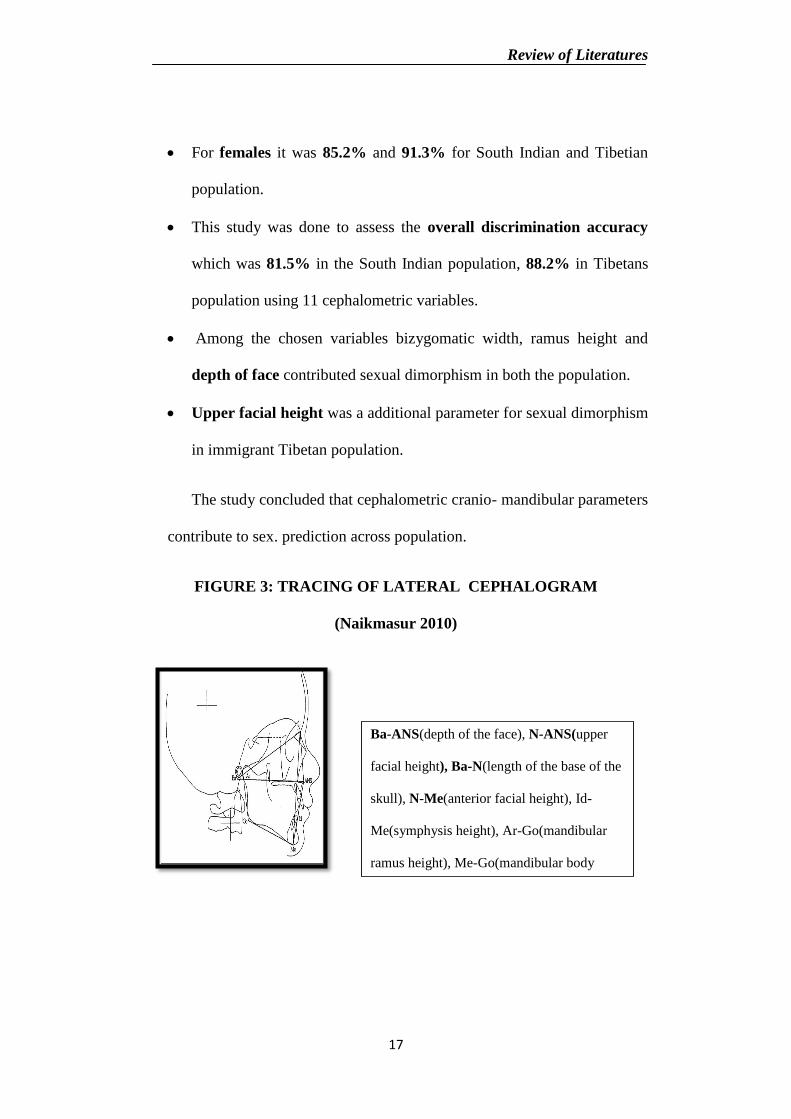
For females it was 85.2% and 91.3% for South Indian and Tibetian
population.
This study was done to assess the overall discrimination accuracy
which was 81.5% in the South Indian population, 88.2% in Tibetans
population using 11 cephalometric variables.
Among the chosen variables bizygomatic width, ramus height and
depth of face contributed sexual dimorphism in both the population.
Upper facial height was a additional parameter for sexual dimorphism
in immigrant Tibetan population.
The study concluded that cephalometric cranio- mandibular parameters
contribute to sex. prediction across population.
FIGURE 3: TRACING OF LATERAL CEPHALOGRAM
(Naikmasur 2010)
Ba-ANS(depth of the face), N-ANS(upper
facial height), Ba-N(length of the base of the
skull), N-Me(anterior facial height), Id-
Me(symphysis height), Ar-Go(mandibular
ramus height), Me-Go(mandibular body
Review of Literatures
18
FIGURE 3: cont. TRACING OF PA CEPHALOGRAM
(Naikmasur 2010)
Elena F kranioti18
et al 2010 conducted a study to develop a sex
determination technique using osteometric data from skeletal components of
Cretan population. A total of 90 males and 88 females are measured according
to standard osteometric techniques. A total of 16 dimensions taken from the
craniofacial skeleton are used. Results stated that males are statistically
significantly greater than females in all dimensions. Bizygomatic breadth is
the most discriminatory single dimension and can provide an accuracy rate of
82% on average. Using a stepwise method involving five dimensions
(bizygomatic breadth, cranial length,nasion–prosthion andmastoid height and
nasal breadth), accuracy is raised to 88.2%.
Zg-Zg(bizygomatic width),
Go-Go(bigonion width),
Co-Co((bicondylar width).
Review of Literatures
19
Tin Hsin Hsio25
et al 2010 conducted a study in population of 50 male
and 50 female cephalograms of Taiwanese children of age 15-16 yrs years of
age to validate sex determination using digital lateral radiographic
cephalometry and discriminative function analysis. Twenty two cephalometric
variables were performed using computerized cephalometric system winiceph
version 8.0.Statistical analysis.
The angular measurements were glabella-metopion to basion- nasion,
glabella-metopion to sella-nasion, glabella-metopion to porion-
orbitale,inion-opisthocranion to basion-nasion, inion oipisthocranion
to sella-nasion,inion-opisthocranion to porion-orbitale, glabella-
suprabellare-metopion, opisthion-inion to inion-opisthocranion.
Linear cephalometric variables are glabella to opisthocranion, basion
to bregma, basion to opisthion, frontal sinus height, frontal sinus
width, mastoid width at the level of the cranial base, mastoid height
from the cranial base, mastoidale to sella-nasion, mastoidale to
porion-orbitale, supraglabellare to glabella-metopion, inoin to
opisthocranion-opisthion, supraglabellare to nasion, glaballe to
supraglabellare-nasion.
For stepwise discriminant functional analysis, this study used the SAS
computer program to select a combination of measurements that best
determine the sex.
Review of Literatures
20
The program selected seven of these twenty two cephalometric
variables for discriminant function analysis.
Seven variables are GM-BaN˚, Iop-BaN˚, Fswd(mm), Ba-Br(mm),
Bao(mm), MaHt(mm), GPI(mm).
The model alone with the GM-BaN alone classifies 73% of the sexes
correctly.
The models with two variables GM-BaN and basi-bregmatic height
and three variables (GM-BaN,Ba-Br and MaHt) classify the sexes
with 84% and 90% accuracy respectively.
The models with seven cephalometric variables (GM-BaN, Ba-Br,
MaHt, Ba-O, GPI, IOP-BaN and frontal sinus width classify the sexes
with accuracy ranging from 92-95%.
In conclusion, this study selects at least 4 cephalometric traits required to
obtain the maximum discriminant effectiveness of sex determination in
children and adolescents.
Review of Literatures
21
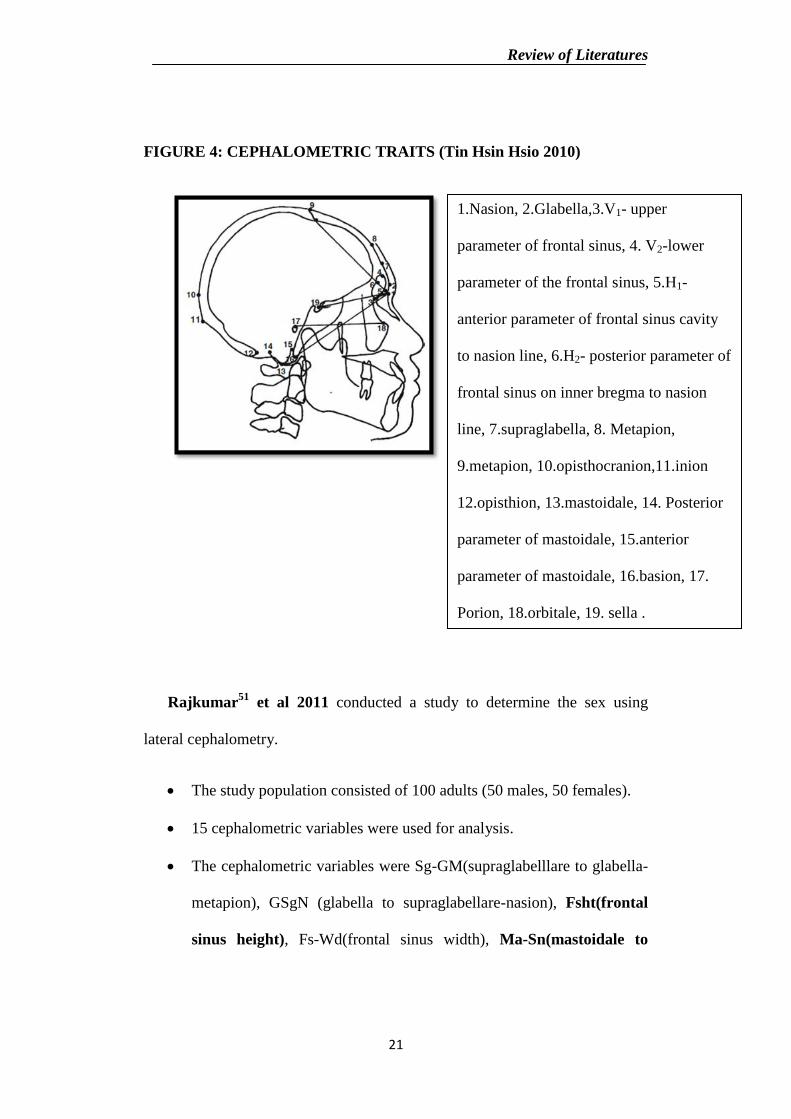
FIGURE 4: CEPHALOMETRIC TRAITS (Tin Hsin Hsio 2010)
Rajkumar51
et al 2011 conducted a study to determine the sex using
lateral cephalometry.
The study population consisted of 100 adults (50 males, 50 females).
15 cephalometric variables were used for analysis.
The cephalometric variables were Sg-GM(supraglabelllare to glabella-
metapion), GSgN (glabella to supraglabellare-nasion), Fsht(frontal
sinus height), Fs-Wd(frontal sinus width), Ma-Sn(mastoidale to
1.Nasion, 2.Glabella,3.V1- upper
parameter of frontal sinus, 4. V2-lower
parameter of the frontal sinus, 5.H1-
anterior parameter of frontal sinus cavity
to nasion line, 6.H2- posterior parameter of
frontal sinus on inner bregma to nasion
line, 7.supraglabella, 8. Metapion,
9.metapion, 10.opisthocranion,11.inion
12.opisthion, 13.mastoidale, 14. Posterior
parameter of mastoidale, 15.anterior
parameter of mastoidale, 16.basion, 17.
Porion, 18.orbitale, 19. sella .
Review of Literatures
22
sella-nasion), Ma-Fh(mastoidale to Frankfort horizontal plane),
Ma-WD(mastoidale width from cranial base), CBL(Cranial base
length), GMSN(Glabella-metapion to sella –nasion),GMFN (Glabella-
metapion to porion –orbitale), GMBaN (Glabella-metapion to basion
nasion), GSgM(metapion-supraglabebellare to supraglabellare
galbella), SNAr-(Sella-nasion to articulare), GPI(glabella projective
index).
This study was done to assess the discrimination accuracy using these
15 variables which was found to be 84%.
Ji-Hwan Kim30
et al 2011 conducted a study in the year 2010 to establish
cephalometric norms of Mongolian adults and compare them with Korean
adults. Lateral cephalometric radiographs of 74 Mongolian adults (35 men, 39
women) and 95 Korean adults (52 men, 43 women). Forty craniofacial
variables were measured, and groups were compared by analysis of covariance
which consisted of measurements from the cranial base, vertical and
horizontal skeletal skeletal relationship, size of the mandible,,dentition and
soft tissue.
VERTICAL SKELETAL RELATIONSHIP:
AFH (mm) Anterior facial height, distance N-Me
FHR Facial height ratio, posterior to anterior facial height ratio, S-
Go/N-Me
Review of Literatures
23
LAFHR Lower anterior facial height ratio, ANS-Me/N-Me
These were variables had a P-value which was significant.
Sexual dimorphism was found to be significant, especially for skeletal linear
measurements and vertical skeletal relationships.
Guilherme Janon22
et al 2011, had conducted a study on cephalometric
variables for sex determination in Afro-Caucasian Brazilian subjects to
compare the skeletal, dental and soft tissue characteristics of Caucasian and
Afro-Caucasian Brazilian subjects and to evaluate sexual dimorphism within
the groups.
The sample comprised lateral cephalograms divided into 2 groups.
Caucasian females and males did not have any statistically significant
difference in the measurements.
The Afro-Caucasian female subjects had less mandibular protrusion
and smaller total posterior facial height and upper posterior facial
height than males.
The study concluded that Brazilian Afro-Caucasian subjects have
greater dentoalveolar and soft tissue protrusion than Brazilian Caucasian
subjects, with slight sexual dimorphism in some variables.
Review of Literatures
24
Das Gupta13
et al 2012 conducted a study in 70 adult skulls with known
sex out of which 35 male and 35 female. Only skulls with no apparent
deformity and intact mastoid process were included in the study.
The mastoid measurements taken were mastoid length, medio-lateral
diameter, anterior posterior diameter and size.
The study stated that mastoid length is the best discrimination
followed by anterior-posterior being second best indicator in the
prediction of sex.
The study concluded that the four variables when put to together,
correctly determined the sex in 90% of the samples. Mastoid length was
found to be the best sex determinant with a discriminant power of 85.7%.
Almas Binnal2 et al 2012 conducted a study in 100 lateral
cephalograms in 50 males and 50 females subjects aged between 25 and 54
years belonging to South Indian population to determine the accuracy of
cephalometric variables to determine sex.
The following nine cephalometric variables –Basion to anterior nasal
spine(Ba-ANS), length of the cranial base(Ba-N), total facial
height(N-M), frontal sinus height(Fs-ht), mastoidale to porion-
orbitale plane(Ma-Fh), mastoid height (Ma-Ht),mastoid width at
the cranial base(Ma-Wd).
Review of Literatures
25
Among the nine cephalometric variables 7 cephalometric variables
were reliable in identification of sex.
The seven variables are Ma-Sn, Ba-ANS, N-M, Ma-Fh, N-ANS, Ba-N,
Ma-Ht.
The derived discriminate function equation accurately identified 88%
of male study as males and 84% of females study subjects as females.
The study concluded the derived discriminant function can be useful in
identification of sex in human remains pertaining to South Indian population.
Ayar Razzaq Ali56
et al 2013 conducted a study in a population of
113 adults with age ranging from 22-43 of which 51 were males and 62 were
females using digital lateral cephalograms. Total of 11 cephalometric variables
were measured of which 8 were linear measurements and 3 were angular
measurements.
8 linear cephalometric variables were nasion-menton, basion-nasion,
glabella to opsithocranium, Ba-ANS, N-ANS, Ma-SN, Frontal sinus
height. The angular measurements are Ba-N-M,M-N-ANS,S-N-M.
The study concluded that the overall predictive accuracy of sex
determination by discriminate analysis was 85.8%.
The first ranked variable in the discriminate power was nasion-
menton with 87.3% diagnostic accuracy.
Review of Literatures
26
Next followed by length of the cranial base and finally the S-N-M
angle gave the overall predictive accuracy of sex determination.
The study concluded that the lateral cephalometric measurements of
craniofacial bones are useful to support sex determination of Iraqi population
in forensic radiographic medicine.
Maria Elen41
et al 2013 had conducted a study on sexual dimorphism
by three dimensional geometric morphometrics of the palate and the cranial
base in a sample of 176 crania of known sex -94 males, 82 females. Three
dimensional geometric co-ordinates of 30 ecto-cranial landmarks were
digitized using a microscribe 3DX contact digitizer. The results indicate that
there are shape differences between sexes. In males, the palate is deepest and
more elongated; the cranial base is shortened. The accuracy of improves when
both shape and size are combined that is 90.4% for the cranial base and 74.8%
for the palate.
Mahalakshmi44
et al 2013 conducted a study in 156 subjects
comprising of 76 males and 80 females with in a age range of 25-55yrs to
determine sexual dimorphism and stature using lateral cephalogram. Digital
lateral skull view of each subject was taken. Ten linear measurements were
plotted using specially designed windows trophy diacom software on
radiograph. Data was subjected to discriminant function analysis and
regression analysis for sex and stature determination respectively. The 10
cephalometric linear variables plotted for analysis are
Review of Literatures
27
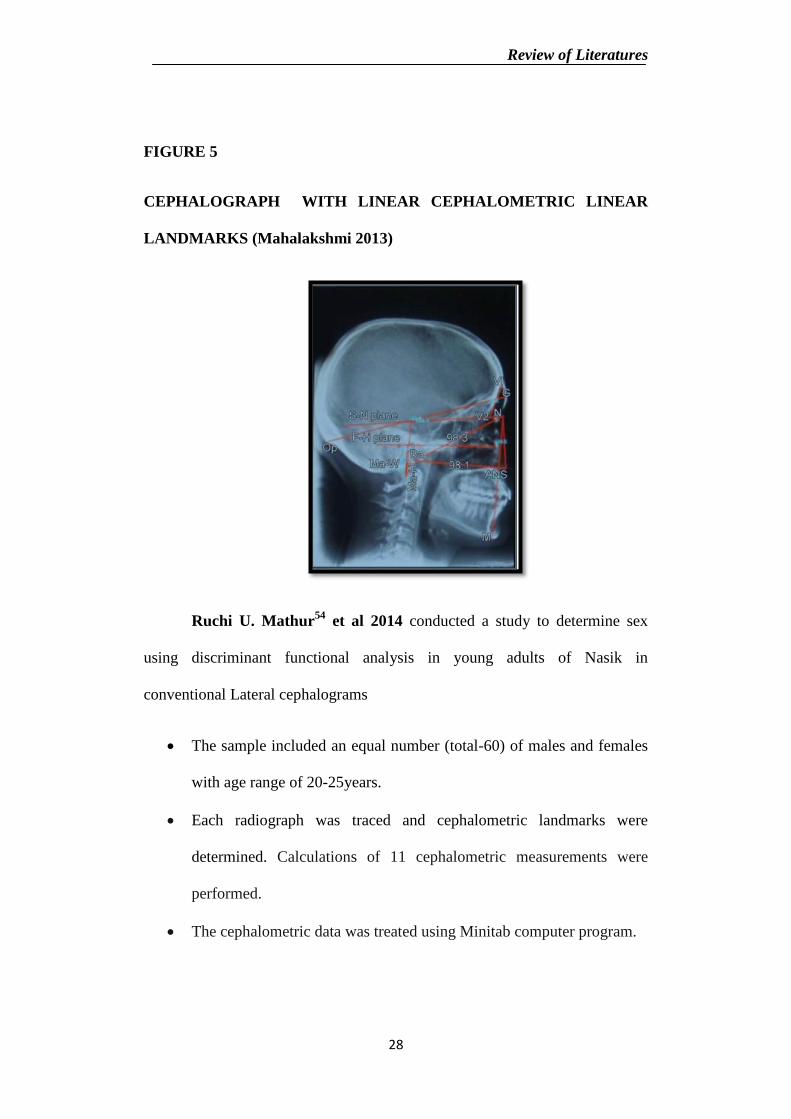
1. G-OP: glabella to opisthocranion
2. Ba-ANS: nasion to anterior nasal spine
3. N-ANS: nasion to anterior nasal spine
4. Ba-N: basion to nasion
5. N-M: nasion to menton
6. Fs-HT: V1-V2- upper and lower parameter of the frontal sinus
cavity.
7. Ma-SN: perpendicular distance from the mastoidale to S-N plane.
8. Ma-FH: perpendicular distance from mastoidale to the FH plane.
9. Ma-HT: Ma-B1B2- anterior and posterior parameter of the
mastoid width at the level of the cranial base.
10. Ma-WD:B1-B2 mastoid width at the level of cranial base.
This study concluded that MA-ht, V1-V2, G-OP, Facial depth (Ba-
ANS) and total facial height (N-M) emerged to be the major
contributors for sexual dimorphism whereas upper facial ht and cranial
base were least reliable for sex determination. Based on these
variables, sexual dimorphism can be determined with an accuracy of
73.1% and mastoid ht gave significant sexual differentiation of 71.8%.
Review of Literatures
28
FIGURE 5
CEPHALOGRAPH WITH LINEAR CEPHALOMETRIC LINEAR
LANDMARKS (Mahalakshmi 2013)
Ruchi U. Mathur54
et al 2014 conducted a study to determine sex
using discriminant functional analysis in young adults of Nasik in
conventional Lateral cephalograms
The sample included an equal number (total-60) of males and females
with age range of 20-25years.
Each radiograph was traced and cephalometric landmarks were
determined. Calculations of 11 cephalometric measurements were
performed.
The cephalometric data was treated using Minitab computer program.
Review of Literatures
29
With discriminant function derived by using all the 11 variables
simultaneously the sex was determined correctly in 93% of the cases.
Out of 11 variables studied, 4 variables were more reliable in
determining sex of the adolescent population of Nasik.
Out of 11 variables studied, 4 variables, i.e. N-S, N-ANS, Co-Gn &
Gonial angle were more reliable while the remaining 7 were found to
be less reliable in determining sex of the young adults of Nasik.
Mahesh Kumar45
et et al 2014 conducted a study in a population of
800 subjects- 400 males and 400 females, of age above 18 years.
The purpose of the study was to determine the sex from the
cephalometric parameters-
1. max head length,
2. maximum head breadth,
3. maximum biparietal diameter,
4. bigonial diameter,
5. morphological facial length by discriminant function analysis.
This study concluded that the cephalometric variables classified the
sex with an accuracy of 77.5%. The accuracy in males was 76.3% and
78.8% in females.45
Review of Literatures
30
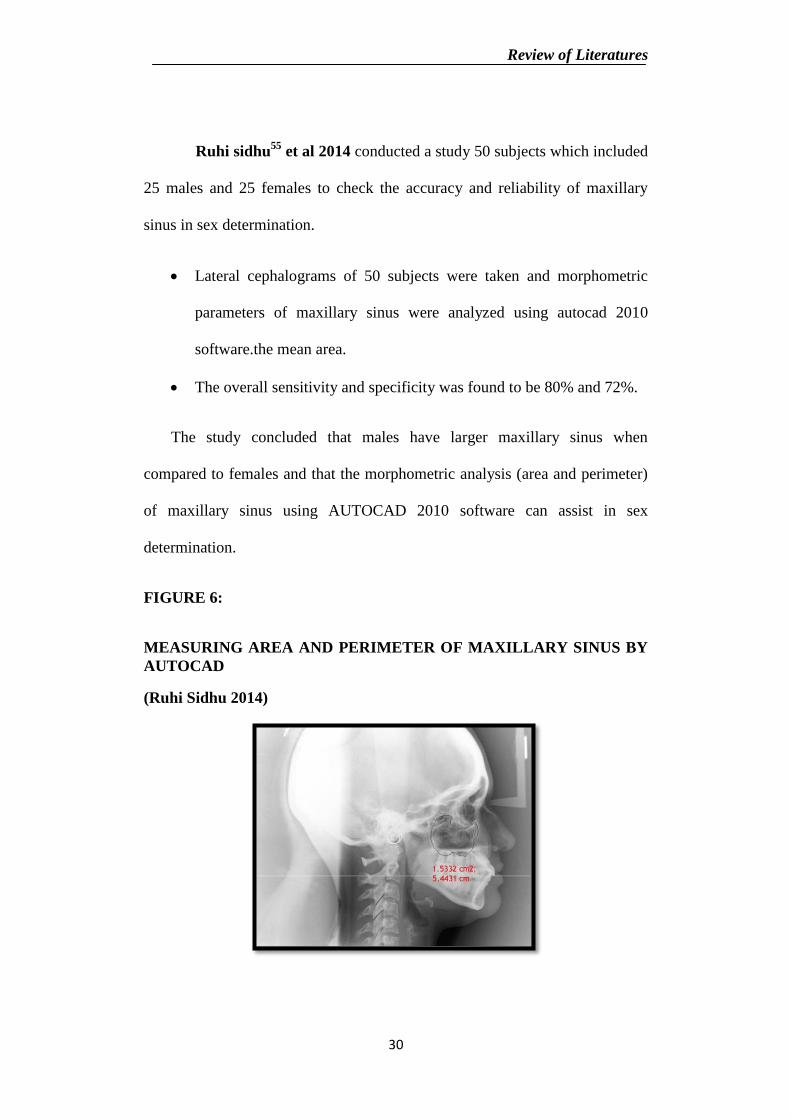
Ruhi sidhu55
et al 2014 conducted a study 50 subjects which included
25 males and 25 females to check the accuracy and reliability of maxillary
sinus in sex determination.
Lateral cephalograms of 50 subjects were taken and morphometric
parameters of maxillary sinus were analyzed using autocad 2010
software.the mean area.
The overall sensitivity and specificity was found to be 80% and 72%.
The study concluded that males have larger maxillary sinus when
compared to females and that the morphometric analysis (area and perimeter)
of maxillary sinus using AUTOCAD 2010 software can assist in sex
determination.
FIGURE 6:
MEASURING AREA AND PERIMETER OF MAXILLARY SINUS BY
AUTOCAD
(Ruhi Sidhu 2014)
Review of Literatures
31
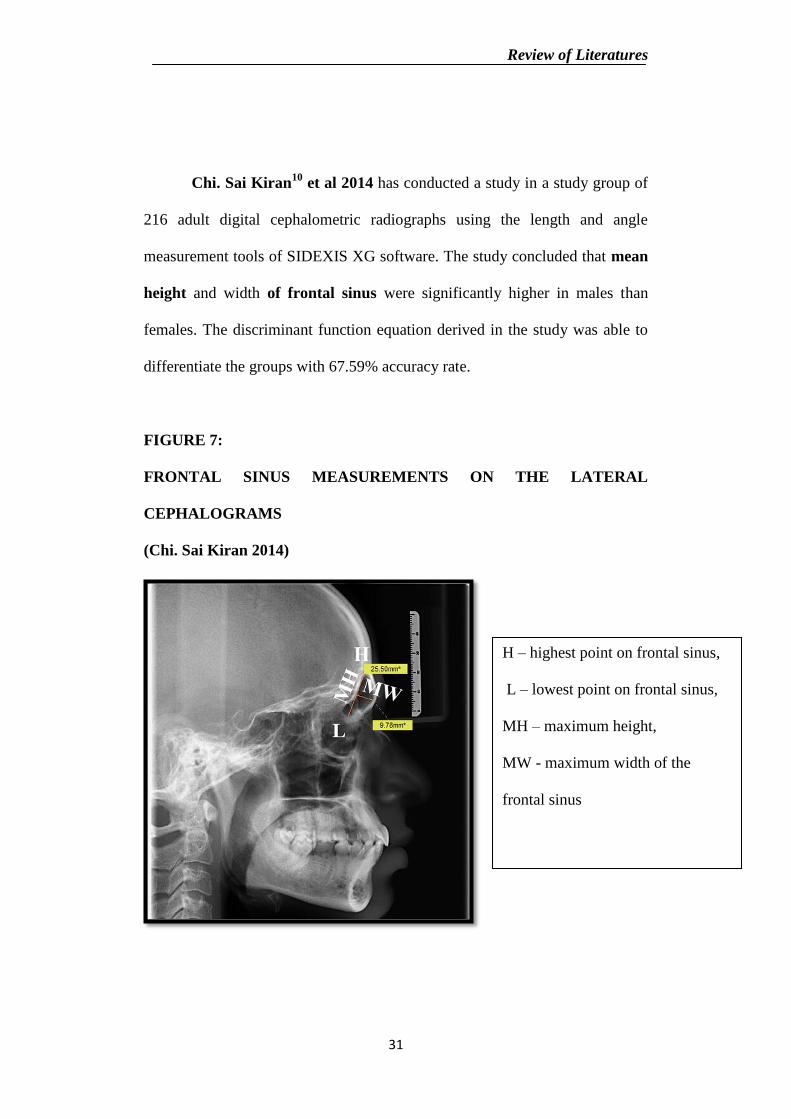
Chi. Sai Kiran10
et al 2014 has conducted a study in a study group of
216 adult digital cephalometric radiographs using the length and angle
measurement tools of SIDEXIS XG software. The study concluded that mean
height and width of frontal sinus were significantly higher in males than
females. The discriminant function equation derived in the study was able to
differentiate the groups with 67.59% accuracy rate.
FIGURE 7:
FRONTAL SINUS MEASUREMENTS ON THE LATERAL
CEPHALOGRAMS
(Chi. Sai Kiran 2014)
H – highest point on frontal sinus,
L – lowest point on frontal sinus,
MH – maximum height,
MW - maximum width of the
frontal sinus
Review of Literatures
32
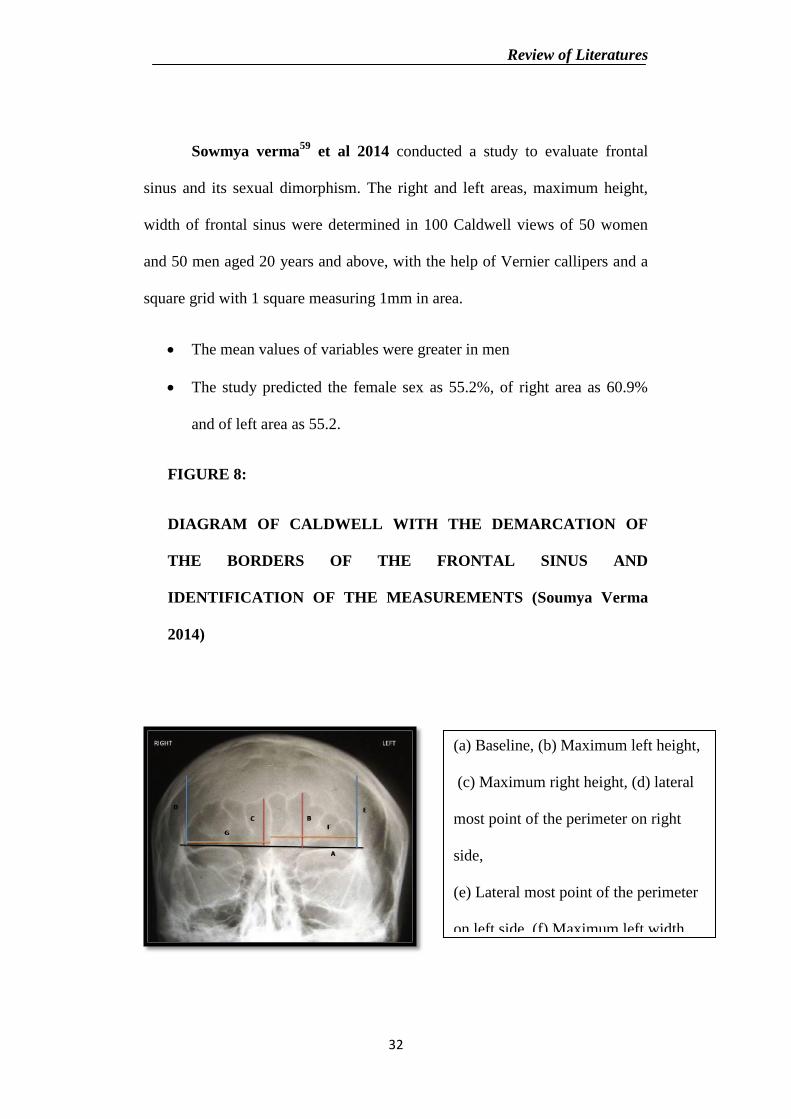
Sowmya verma59
et al 2014 conducted a study to evaluate frontal
sinus and its sexual dimorphism. The right and left areas, maximum height,
width of frontal sinus were determined in 100 Caldwell views of 50 women
and 50 men aged 20 years and above, with the help of Vernier callipers and a
square grid with 1 square measuring 1mm in area.
The mean values of variables were greater in men
The study predicted the female sex as 55.2%, of right area as 60.9%
and of left area as 55.2.
FIGURE 8:
DIAGRAM OF CALDWELL WITH THE DEMARCATION OF
THE BORDERS OF THE FRONTAL SINUS AND
IDENTIFICATION OF THE MEASUREMENTS (Soumya Verma
2014)
(a) Baseline, (b) Maximum left height,
(c) Maximum right height, (d) lateral
most point of the perimeter on right
side,
(e) Lateral most point of the perimeter
on left side, (f) Maximum left width,
(g) Maximum right width
Review of Literatures
33
David marianayagam60
et al 2010 conducted a study to establish
cephalometric norms from digital posterior cephalogram for a Indian
population. The study population consisted of 45 men and 55 women of age
range 25-55 yrs old subjects had well balanced face and ideal occlusion. 12
cephalometric variables were used in the study. They are
1. Cranial width (eur-eur)
2. ZL-ZR
3. Facial width( ZA-AZ)
4. Nasal width(NC-CN)
5. Maxillary wdith(JL-JR)
6. Mandibular width(AG-GA)
7. Maxillary intermolar width
8. Mandibular intermolar width
9. A6-B6
10. 6A-6B
11. Upper midline deviation
12. Lower midline deviation.
13. The study concluded that there were statistical differences
between male and female samples.
Comparison indicated that males have larger values than females.
Review of Literatures
34
Essam M. Mehlab19
et al 2013 conducted a study to evaluate the age
and sex dependent changes of craniofacial skeleton of the age period 7-17
years old. Two hundred children and adolescent consisting of 100 males and
100 females were categorized according to age into 5 equal groups and
underwent posterior anterior cephalograms using high resolution after
digitizing the PA landmarks. The land mark co-ordinates were used to
calculate the cranial, bifrontotemporal, bizygomatic, mid facial, maxillary
skeletal base, bigonial, biantegonial and nasal widths. Measurements of
maxillary and mandibular intermolar widths were made directly on the plaster
model with calliper. Both maxillary and mandibular intermolar widths show
progressive significant difference, between males and females with age. The
study concluded that there was a significant change in transverse craniofacial
difference between males and was significantly evident in male measurements
compared to females.
Li Luo38
et al 2014 conducted a study in 127 males and 81 females
skulls in the year 2013 for determining sex using automatic sex determination
method by 3D digital skulls construction. Statistical shape model for skulls is
constructed, which projects the high dimensional skull data into a low
dimensional shape space and fisher discriminant analysis is used to classify
skulls in shape space. The correct rate in classifying is 95.7% for females and
91.4% for male.

Materials and Methods
Materials and Methods
35
MATERIALS AND METHODS
TYPE OF STUDY: RETROSPECTIVE STUDY
STUDY PERIOD: June 2015-Oct 2015
PLACE CONDUCTED: Sri Venkateshwara Scan Center, Velachery,
Chennai.
Sample size: 100 lateral cephalograms
Male-50
Female -50
Age group-25 to 45 yrs belonging to Chennai population.
Nine cephalometric parameters (Ba-ANS, N-ANS, Ba-N, N-M,Fs-
Ht,Ma-FH,Ma-Ht, Ma-Wd) were used to arrive a discriminant function
equation for identification of sex.
INCLUSION CRITERIA:
Study population included 50 male and 50 females in the age group of
25 to 45yrs within Chennai population.
EXCLUSION CRITERIA:
Individuals with the history of orthodontic and orthognathic treatment,
trauma and surgery of the skull,
Materials and Methods
36
Clinical features suggestive of hereditary, developmental, nutritional
disturbances and facial asymmetry were not included in the study.
CHEMICALS/ MATERIALS/REAGENTS USED :
FOR TAKING THE DIGITAL LATERAL CEPHALOGRAM:
KODAK 8000C DIGITAL PANAROMIC AND CEPHALOMETRIC
SYSTEM
FOR MEASUREMENTS:
KODAK DENTAL IMAGING SOFTWARE 6.12-15.0.
RADI ANT DICOM VIEWER 22.3- EVALUATION VERSION.
Facility to be obtained:
Sri Venketeshwara Scans, Velachery, Chennai.
Estimated budget:
Rs 30,000
Statistics to be used
Student t-test.
Discriminant functional analysis.
Statistical analysis using the statistical package—SPSS, VERSION
20.0
Materials and Methods
37
METHODOLOGY:
Lateral cephalograms of the study subjects would be obtained by using
– KODAK having teeth in centric occlusion.
The cephalograhs were obtained using a digital extraoral radiographic
machine KODAK 8000C DIGITAL PANAROMIC AND
CEPHALOMETRIC SYSTEM.
The exposure parameters were 80 KVp, 10mA and 0.50seconds.29
Digital cephalograms will be obtained.
The following nine cephalometric variables were derived using a
range of cephalometric bony landmarks –Ba-ANS, N-ANS, Ba-N, N-
M, Fs-Ht, Ma-SN, Ma-FH, Ma-Ht, Ma-Wd.
Linear cephalometric variables were measured using DIACOM
software.
Initially mean values, standard deviation, coefficient of variation were
calculated for all the variables.
Values derived were compared using student t test.
A dicriminant function equation is derived statistically.
Discriminant functional analysis is used to assess the efficacy of the
selected cephalometric variables in the discrimination of the sexes.
A sectiononing point is derived which divided the score into male and
female group with minimum overlap.
Materials and Methods
38
Cross validation was done to evaluate the efficacy of the discriminant
function equation in determinantion of sex.
CEPHALOMETRIC LANDMARKS USED IN THE STUDY ARE
The landmarks were
Basion—(Ba)—lowest point on the anterior rim of the foremen
magnum in the median plane
Anterior Nasal Spine—(ANS)—anterior tip of the sharp bony process
of the maxilla
Nasion—(N)—most anterior point on the frontonasal suture in the
midsagittal plane
Menton—(M)—lowest point on the symphysial outline of Chin
Mastoidale—(Ma)—lowest point of the mastoid process
Sella—(S)—mid-point of Sella-turcica
V1 and V2—upper and lower parameter of the frontal sinus cavity
respectively
B1 and B2—anterior and posterior parameter of the mastoidal width at
the level of cranial base respectively
Frank-furt Horizontal plane—(FH plane)—line connecting the Porion
top of the earpost of the cephalostat with the Orbitale lowest point
of bony orbit,
Sella-Nasion plane—(SNplane)—line connecting Sella with Nasion.
Materials and Methods
39
THE LINEAR MEASUREMENTS USED ARE
Basion to anterior nasal spine (Ba-ANS)
Upper facial height (N-ANS)
Length of cranial base (Ba-N)
Total face height (N-M)
Frontal sinus height (Fs-Ht)
Mastoidale to sella-nasion plane (Ma-SN)
Mastoidale to porion-orbitale plane (Ma-FH)
Mastoid height from cranial base (Ma-Ht)
Mastoid width at the level of cranial base (Ma-Wd)

Figures
Figures
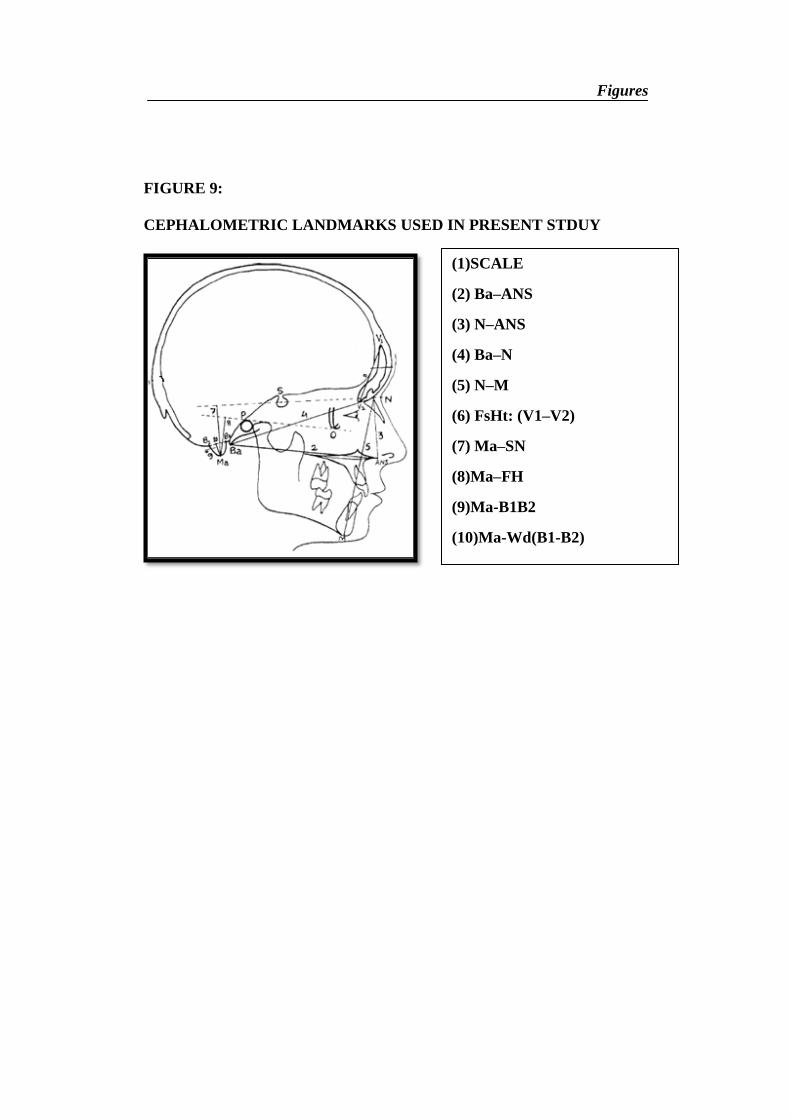
FIGURE 9:
CEPHALOMETRIC LANDMARKS USED IN PRESENT STDUY
(1)SCALE
(2) Ba–ANS
(3) N–ANS
(4) Ba–N
(5) N–M
(6) FsHt: (V1–V2)
(7) Ma–SN
(8)Ma–FH
(9)Ma-B1B2
(10)Ma-Wd(B1-B2)
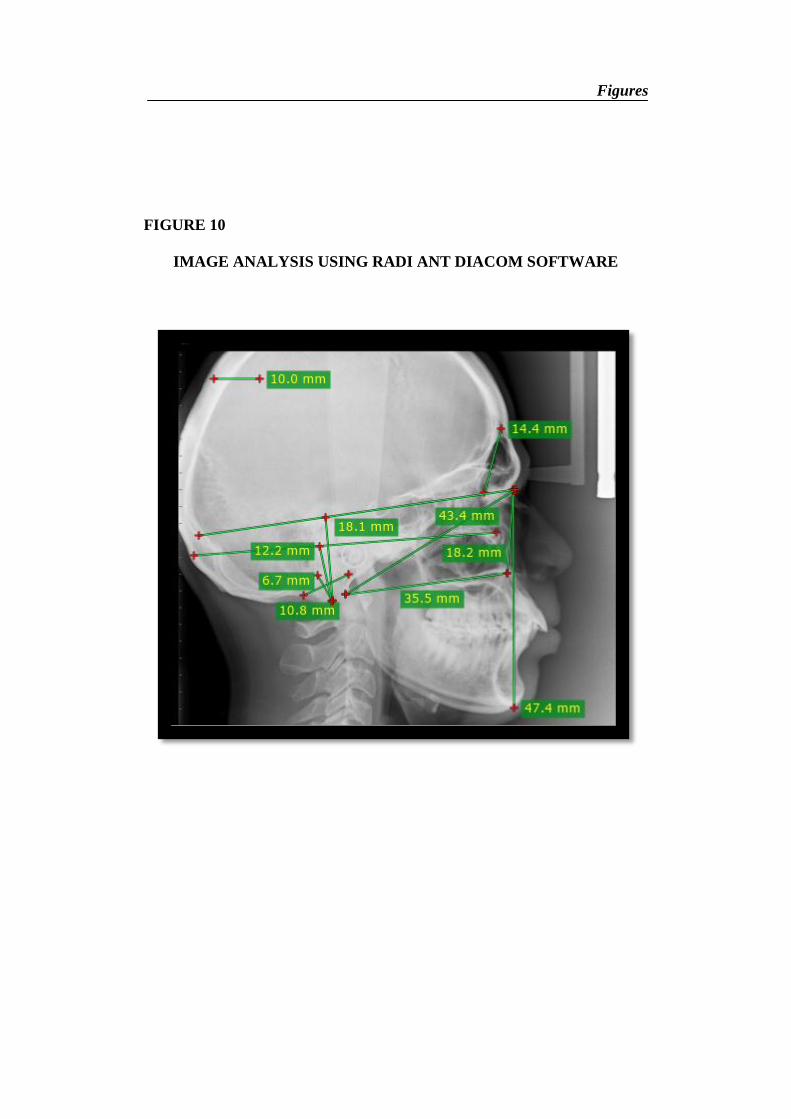
Figures
FIGURE 10
IMAGE ANALYSIS USING RADI ANT DIACOM SOFTWARE

Results
Results
40
RESULTS
The present study is a retrospective study conducted in the Department
of Oral Medicine and Radiology of Ragas Dental College and Hospital,
Uthandi, Chennai. Aim of the study is “To evaluate the lateral cephalometric
variables and its efficacy in identification of sexual dimorphism in Chennai
population using discriminant function analysis.” Total of 100 cephalograms
were collected which consisted of 50 males and 50 females. Nine
cephalometric variables were considered in the study and their discrimination
in determination in sex was assessed. Discriminant function equation was
derived following which cross-validation was done within the study
population.
Results of the present study documents the following data:
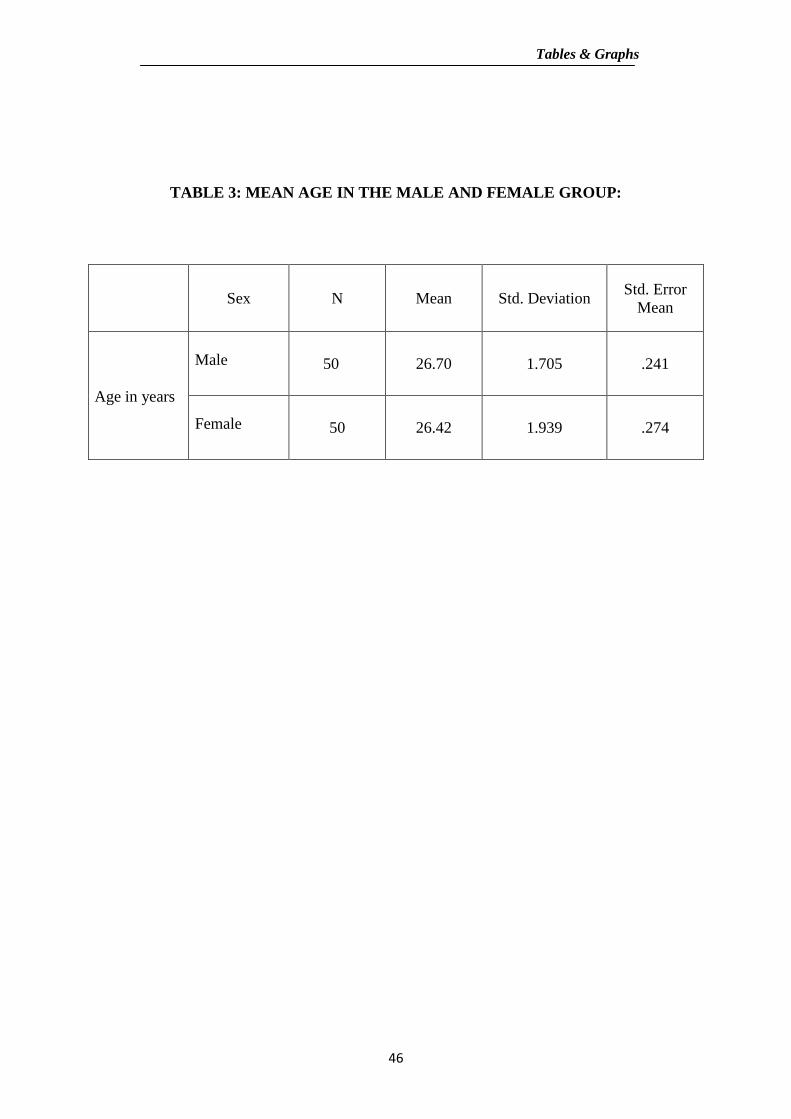
TABLE 3:
Mean age in the Male and Female group:
The mean age of the male and female group is 26.70 in the males and 26.42 in
the females.
Results
41
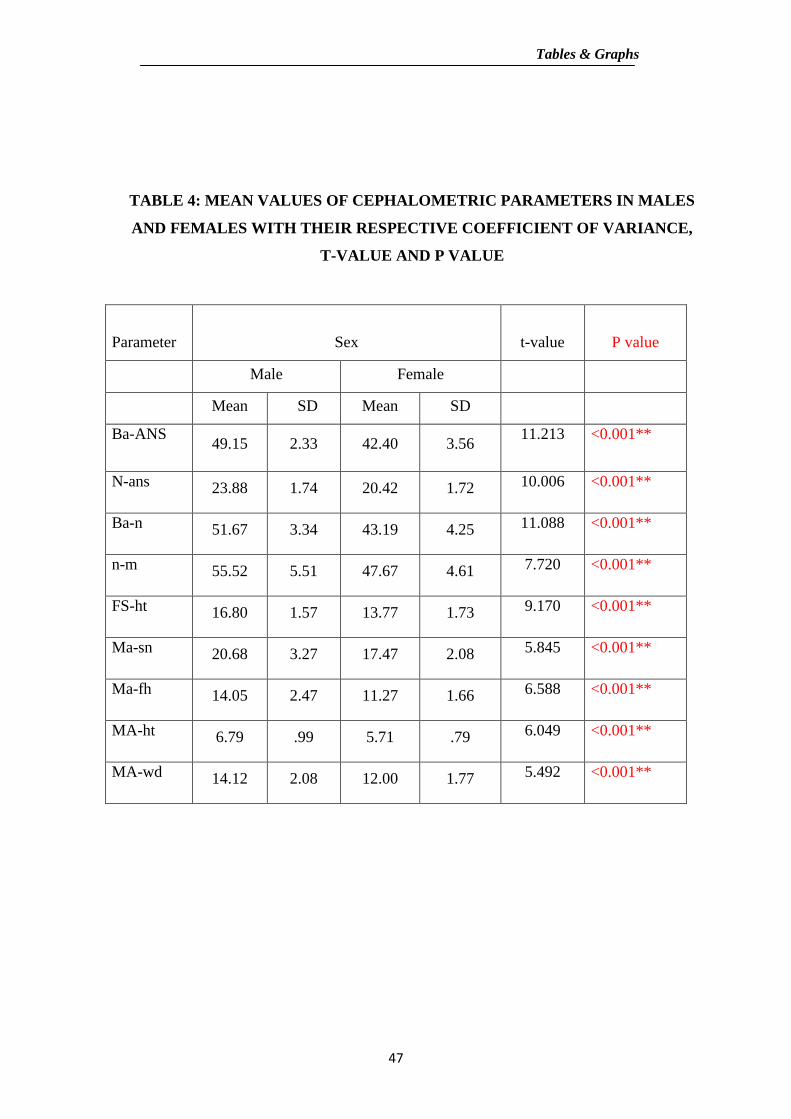
TABLE 4:
Mean values of cephalometric parameters in males and females with their
respective coefficient of variance, t-value and p value:
T-test was done to test the variables which were significant to select the
variables for discriminative analysis. It was found that all the variables were
significant with P VALUE <0.001.
The mean Ba-ANS value for the male group is 49.15 and in female
group is 42.40.
The mean N-ANS value for the male group is 23.88 and in female
group is 20.42.
The mean Ba-N value for the male group is 51.67 and in female group
is 43.19.
The mean N-M value for the male group is 55.52and in female group is
47.67.
The mean Fs-HT value for the male group is 16.80 and in female group
is 13.77.
The mean Ma-SN value for the male group is 20.68 and in female
group is 17.47.
The mean Ma-FH value for the male group is 14.05 and in female
group is 11.27.
Results
42
The mean Ma-ht value for the male group is 6.79 and in female group
is 5.71.
The mean Ma-wd value for the male group is 14.12 and in female
group is12.00.
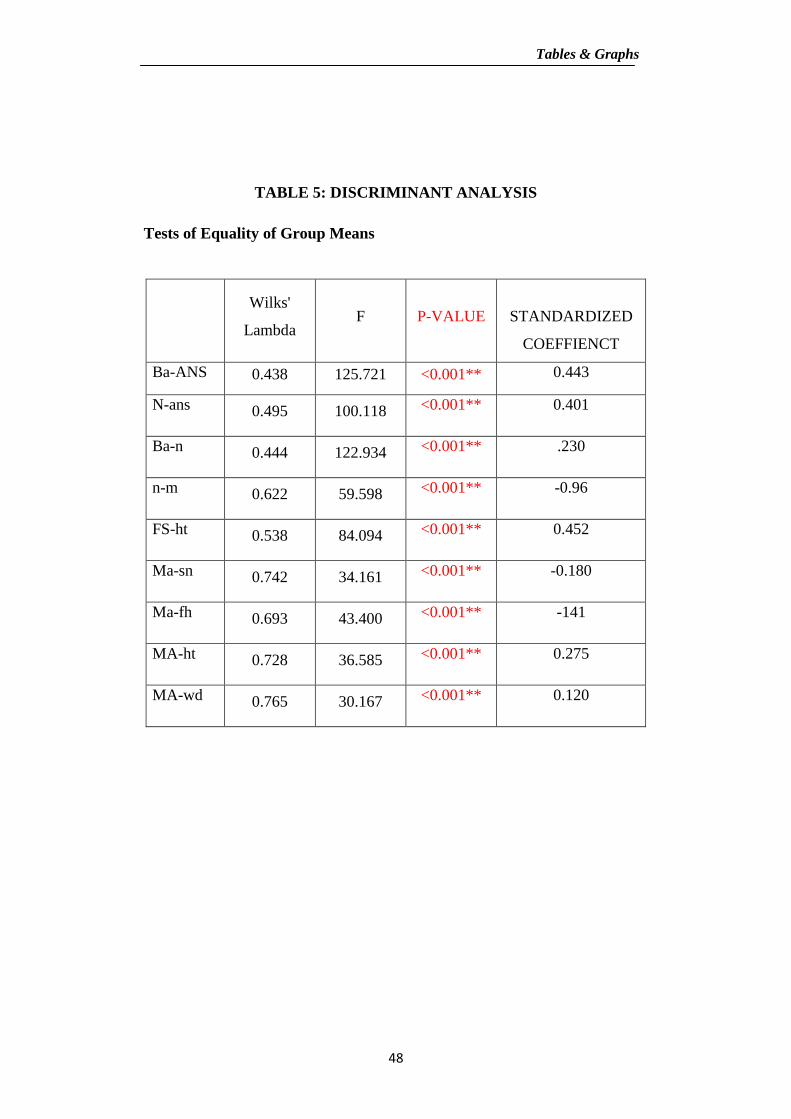
TABLE-5
Discrimiant analysis - Test of equality of group means:
Discriminant analysis is used to determine which variable discriminate
between two or more groups for which the test of equality.
In this table the variable are tested for further significance using the
teat of equality.
All the variables were significant with a p-value of <0.001.
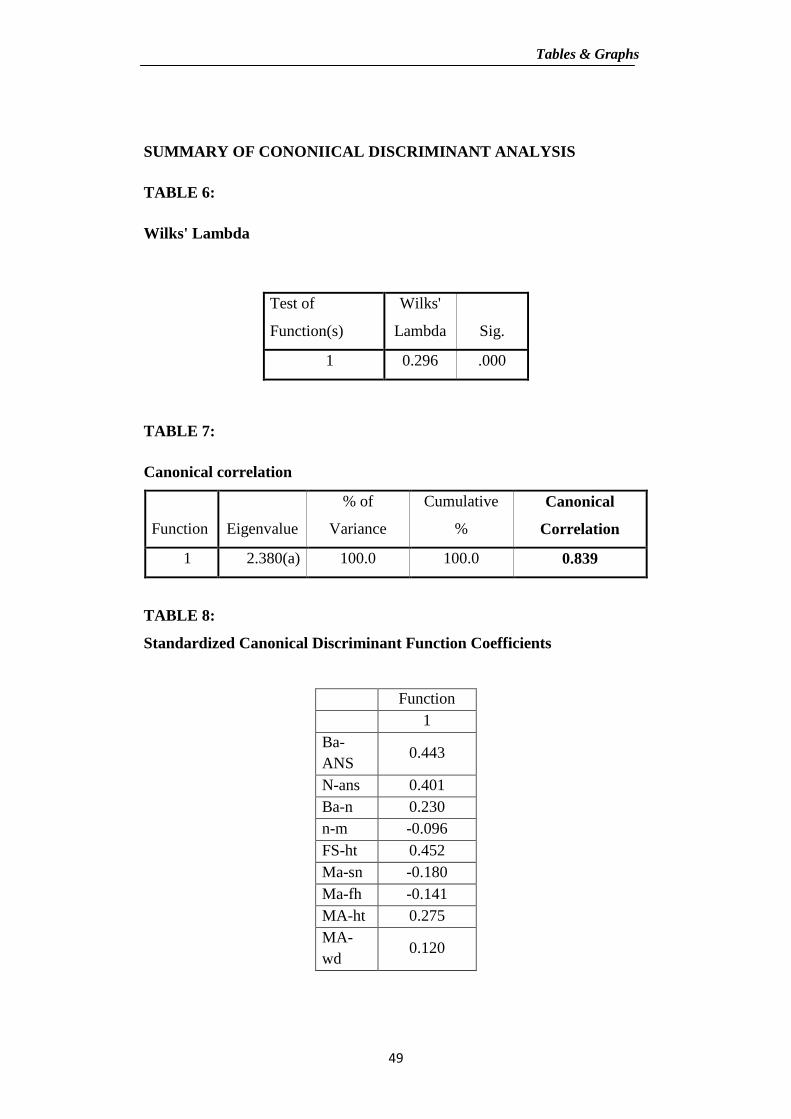
TABLE 6:
Wilk’s Lambda:
In this study the overall Wilk’s lambda coefficient is 0.296 with a p
value of <0.001which means the variables are contributory and highly
significant.
Results
43
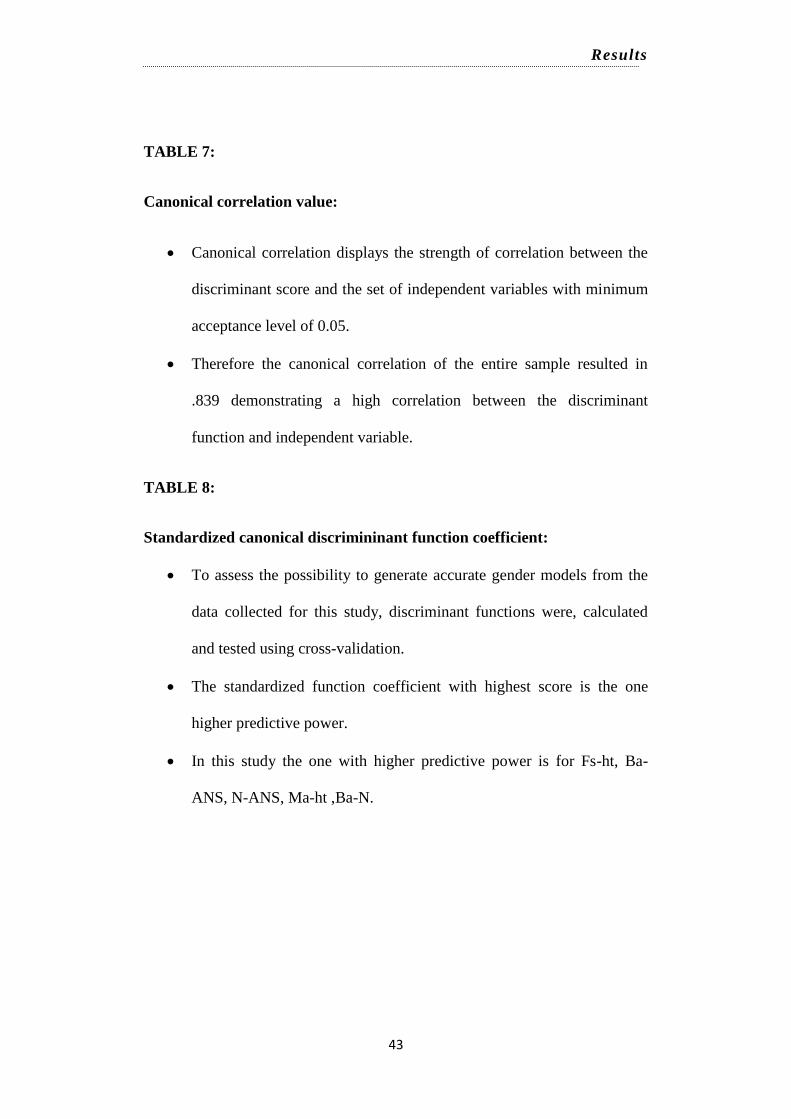
TABLE 7:
Canonical correlation value:
Canonical correlation displays the strength of correlation between the
discriminant score and the set of independent variables with minimum
acceptance level of 0.05.
Therefore the canonical correlation of the entire sample resulted in
.839 demonstrating a high correlation between the discriminant
function and independent variable.
TABLE 8:
Standardized canonical discrimininant function coefficient:
To assess the possibility to generate accurate gender models from the
data collected for this study, discriminant functions were, calculated
and tested using cross-validation.
The standardized function coefficient with highest score is the one
higher predictive power.
In this study the one with higher predictive power is for Fs-ht, Ba-
ANS, N-ANS, Ma-ht ,Ba-N.
Results
44
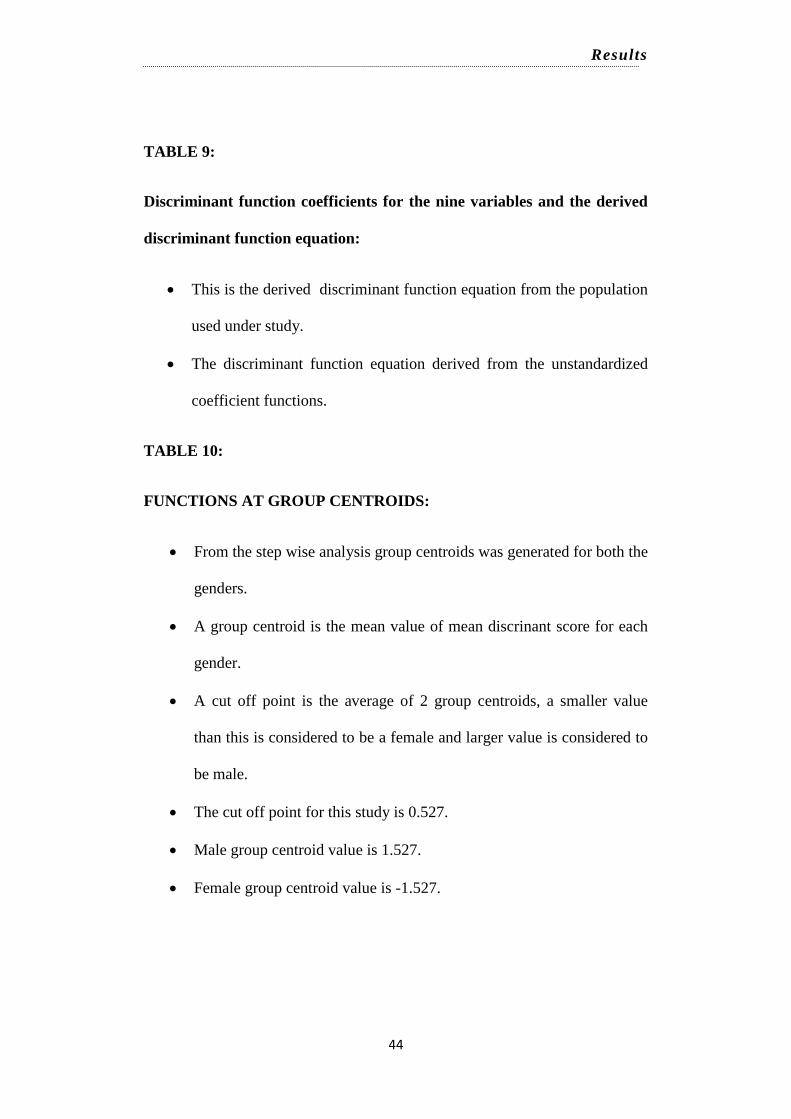
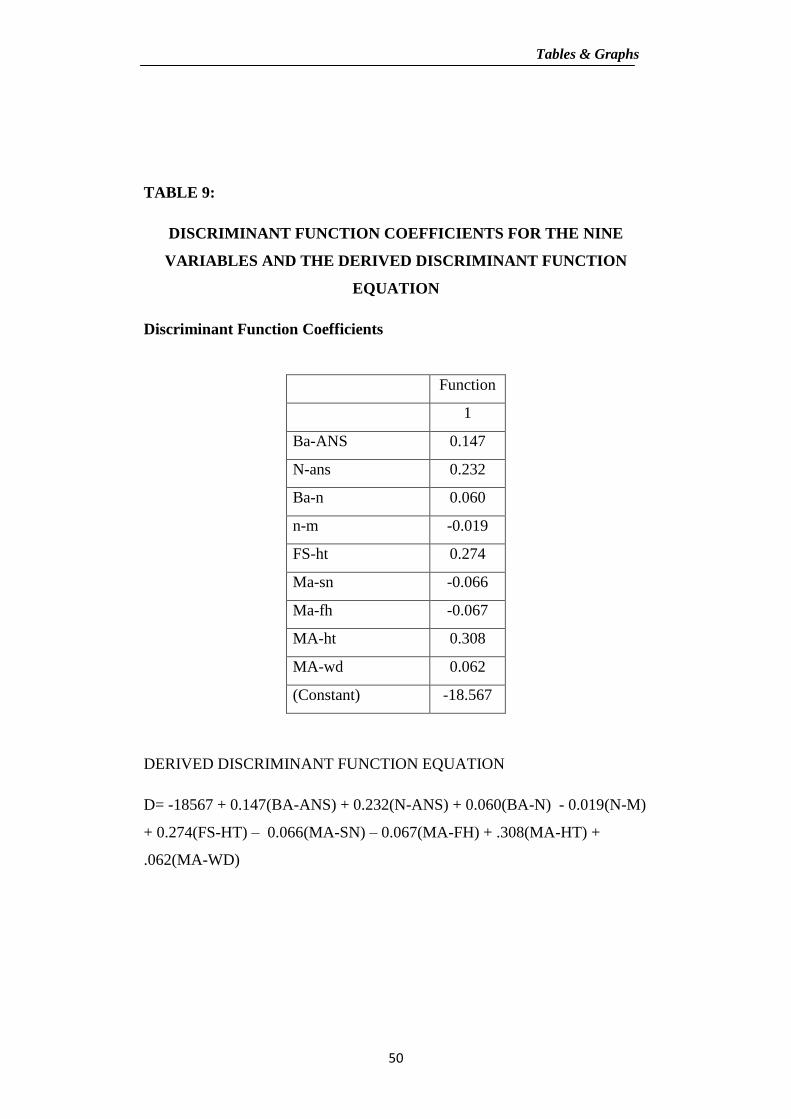
TABLE 9:
Discriminant function coefficients for the nine variables and the derived
discriminant function equation:
This is the derived discriminant function equation from the population
used under study.
The discriminant function equation derived from the unstandardized
coefficient functions.
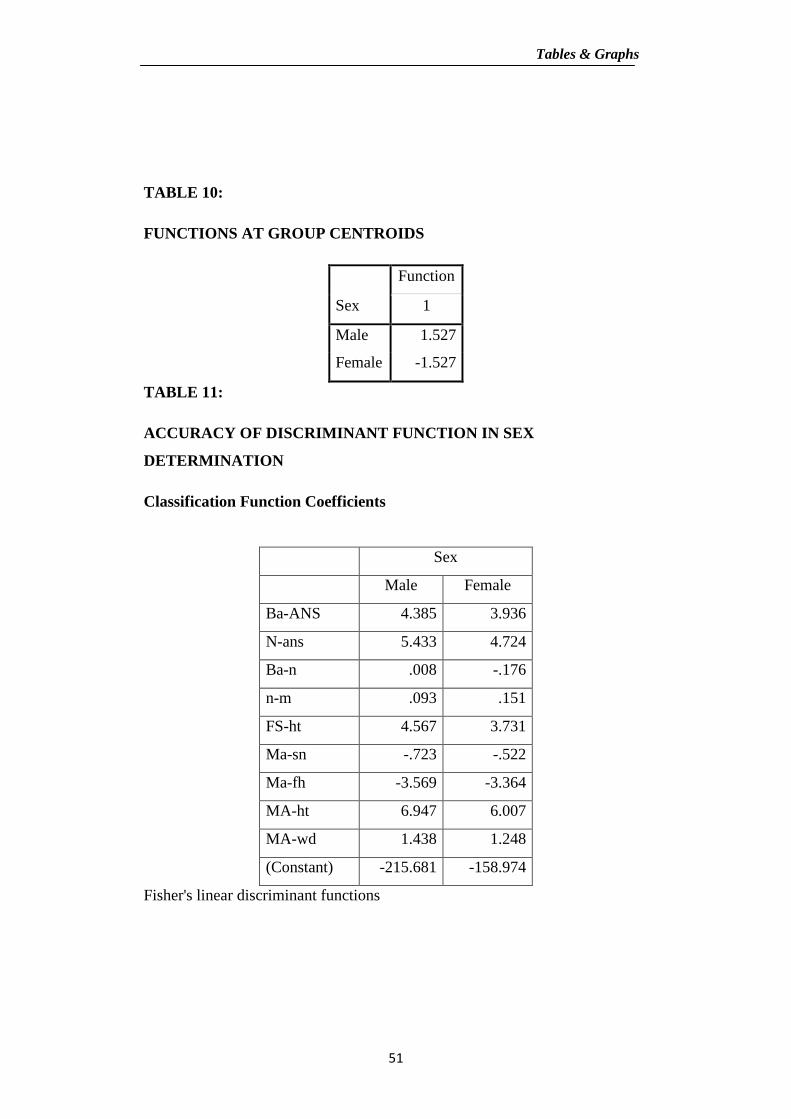
TABLE 10:
FUNCTIONS AT GROUP CENTROIDS:
From the step wise analysis group centroids was generated for both the
genders.
A group centroid is the mean value of mean discrinant score for each
gender.
A cut off point is the average of 2 group centroids, a smaller value
than this is considered to be a female and larger value is considered to
be male.
The cut off point for this study is 0.527.
Male group centroid value is 1.527.
Female group centroid value is -1.527.
Results
45
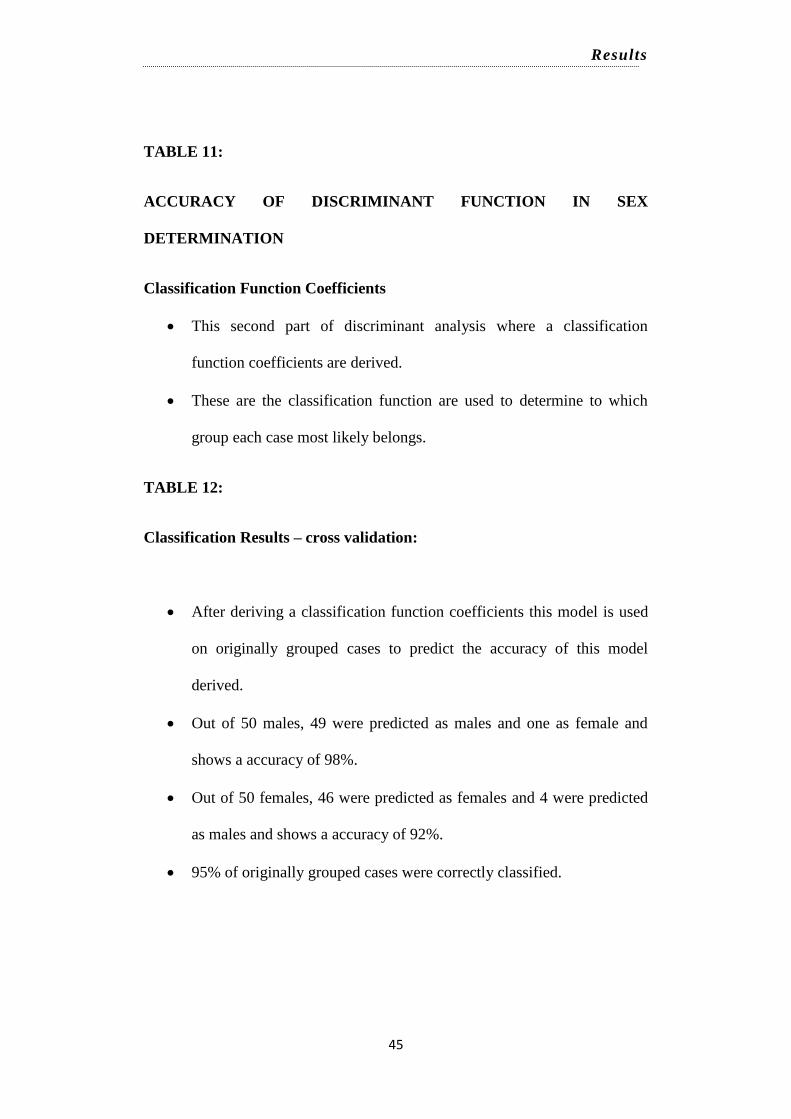
TABLE 11:
ACCURACY OF DISCRIMINANT FUNCTION IN SEX
DETERMINATION
Classification Function Coefficients
This second part of discriminant analysis where a classification
function coefficients are derived.
These are the classification function are used to determine to which
group each case most likely belongs.
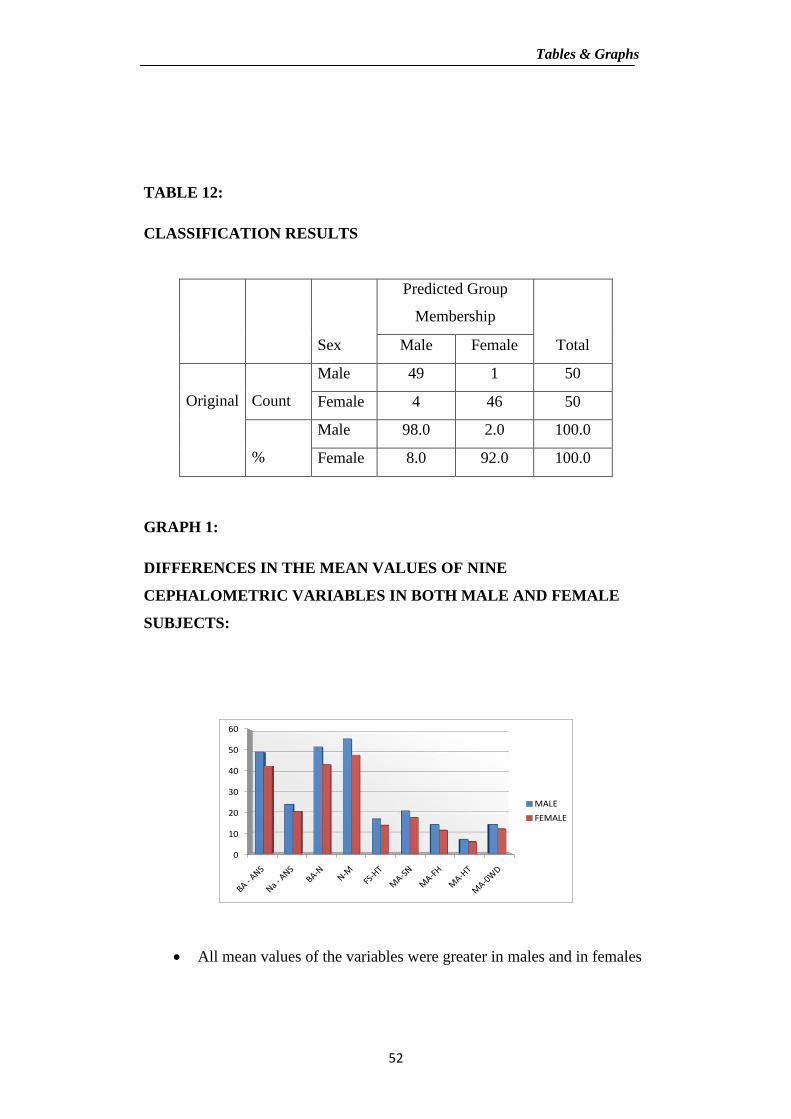
TABLE 12:
Classification Results – cross validation:
After deriving a classification function coefficients this model is used
on originally grouped cases to predict the accuracy of this model
derived.
Out of 50 males, 49 were predicted as males and one as female and
shows a accuracy of 98%.
Out of 50 females, 46 were predicted as females and 4 were predicted
as males and shows a accuracy of 92%.
95% of originally grouped cases were correctly classified.

Tables & Graphs
Tables & Graphs
46
TABLE 3: MEAN AGE IN THE MALE AND FEMALE GROUP:
Sex N Mean Std. Deviation Std. Error
Mean
Age in years
Male 50 26.70 1.705 .241
Female 50 26.42 1.939 .274
TABLE 4:
MEAN VALUES OF CEPHALOMETRIC PARAMETERS IN MALES
AND FEMALES WITH THEIR RESPECTIVE COEFFICIENT OF
VARIANCE, T-VALUE AND P VALUE
Tables & Graphs
47
Parameter
Sex
t-value
P value
Male Female
Mean SD Mean SD
Ba-ANS 49.15 2.33 42.40 3.56
11.213 <0.001**
N-ans 23.88 1.74 20.42 1.72 10.006 <0.001**
Ba-n 51.67 3.34 43.19 4.25 11.088 <0.001**
n-m 55.52 5.51 47.67 4.61 7.720 <0.001**
FS-ht 16.80 1.57 13.77 1.73 9.170 <0.001**
Ma-sn 20.68 3.27 17.47 2.08 5.845 <0.001**
Ma-fh 14.05 2.47 11.27 1.66 6.588 <0.001**
MA-ht 6.79 .99 5.71 .79 6.049 <0.001**
MA-wd 14.12 2.08 12.00 1.77 5.492 <0.001**
TABLE 4: MEAN VALUES OF CEPHALOMETRIC PARAMETERS IN MALES
AND FEMALES WITH THEIR RESPECTIVE COEFFICIENT OF VARIANCE,
T-VALUE AND P VALUE
Tables & Graphs
48
TABLE 5: DISCRIMINANT ANALYSIS
Tests of Equality of Group Means
Wilks'
Lambda F P-VALUE
STANDARDIZED
COEFFIENCT
Ba-ANS 0.438 125.721 <0.001** 0.443
N-ans 0.495 100.118 <0.001** 0.401
Ba-n 0.444 122.934 <0.001** .230
n-m 0.622 59.598 <0.001** -0.96
FS-ht 0.538 84.094 <0.001** 0.452
Ma-sn 0.742 34.161 <0.001** -0.180
Ma-fh 0.693 43.400 <0.001** -141
MA-ht 0.728 36.585 <0.001** 0.275
MA-wd 0.765 30.167 <0.001** 0.120
Tables & Graphs
49
SUMMARY OF CONONIICAL DISCRIMINANT ANALYSIS
TABLE 6:
Wilks' Lambda
Test of
Function(s)
Wilks'
Lambda Sig.
1 0.296 .000
TABLE 7:
Canonical correlation
Function Eigenvalue
% of
Variance
Cumulative
%
Canonical
Correlation
1 2.380(a) 100.0 100.0 0.839
TABLE 8:
Standardized Canonical Discriminant Function Coefficients
Function
1
Ba-
ANS 0.443
N-ans 0.401
Ba-n 0.230
n-m -0.096
FS-ht 0.452
Ma-sn -0.180
Ma-fh -0.141
MA-ht 0.275
MA-
wd 0.120
Tables & Graphs
50
TABLE 9:
DISCRIMINANT FUNCTION COEFFICIENTS FOR THE NINE
VARIABLES AND THE DERIVED DISCRIMINANT FUNCTION
EQUATION
Discriminant Function Coefficients
Function
1
Ba-ANS 0.147
N-ans 0.232
Ba-n 0.060
n-m -0.019
FS-ht 0.274
Ma-sn -0.066
Ma-fh -0.067
MA-ht 0.308
MA-wd 0.062
(Constant) -18.567
DERIVED DISCRIMINANT FUNCTION EQUATION
D= -18567 + 0.147(BA-ANS) + 0.232(N-ANS) + 0.060(BA-N) - 0.019(N-M)
+ 0.274(FS-HT) – 0.066(MA-SN) – 0.067(MA-FH) + .308(MA-HT) +
.062(MA-WD)
Tables & Graphs
51
TABLE 10:
FUNCTIONS AT GROUP CENTROIDS
Sex
Function
1
Male 1.527
Female -1.527
TABLE 11:
ACCURACY OF DISCRIMINANT FUNCTION IN SEX
DETERMINATION
Classification Function Coefficients
Sex
Male Female
Ba-ANS 4.385 3.936
N-ans 5.433 4.724
Ba-n .008 -.176
n-m .093 .151
FS-ht 4.567 3.731
Ma-sn -.723 -.522
Ma-fh -3.569 -3.364
MA-ht 6.947 6.007
MA-wd 1.438 1.248
(Constant) -215.681 -158.974
Fisher's linear discriminant functions
Tables & Graphs
52
TABLE 12:
CLASSIFICATION RESULTS
Sex
Predicted Group
Membership
Total Male Female
Original
Count
Male 49 1 50
Female 4 46 50
%
Male 98.0 2.0 100.0
Female 8.0 92.0 100.0
GRAPH 1:
DIFFERENCES IN THE MEAN VALUES OF NINE
CEPHALOMETRIC VARIABLES IN BOTH MALE AND FEMALE
SUBJECTS:
0
10
20
30
40
50
60
MALE
FEMALE
All mean values of the variables were greater in males and in females
Tables & Graphs
53
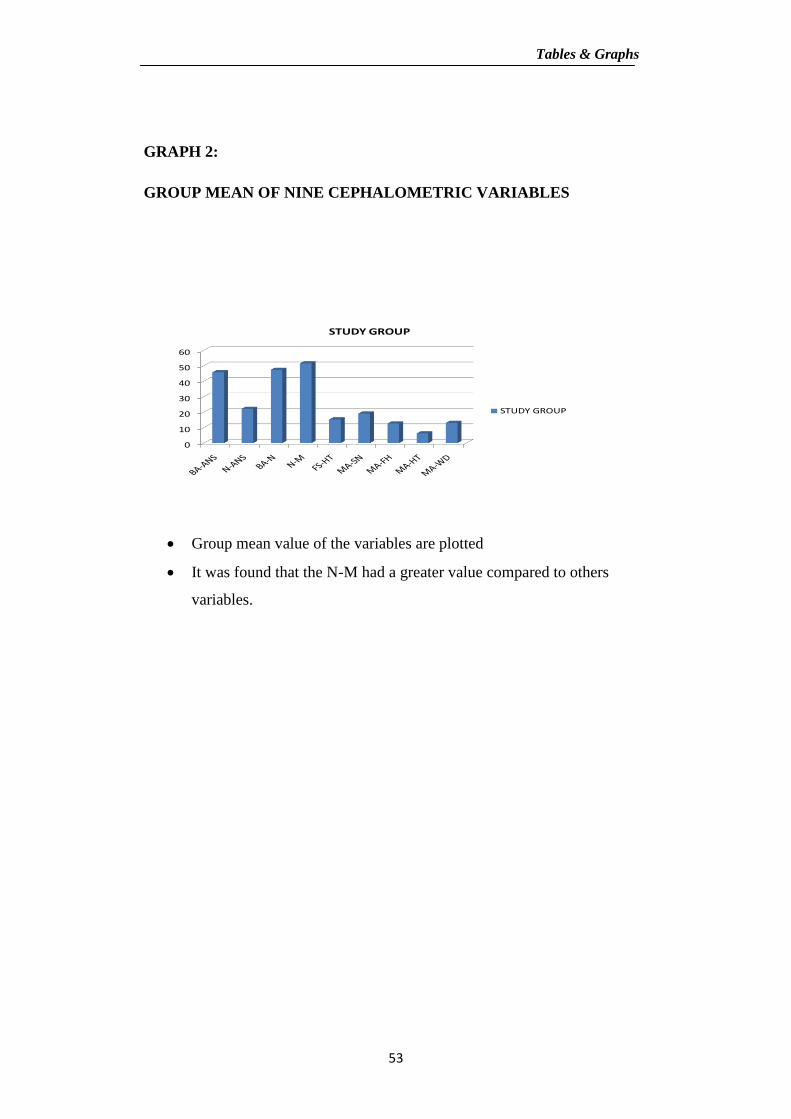
GRAPH 2:
GROUP MEAN OF NINE CEPHALOMETRIC VARIABLES
0
10
20
30
40
50
60
STUDY GROUP
STUDY GROUP
Group mean value of the variables are plotted
It was found that the N-M had a greater value compared to others
variables.
Tables & Graphs
54
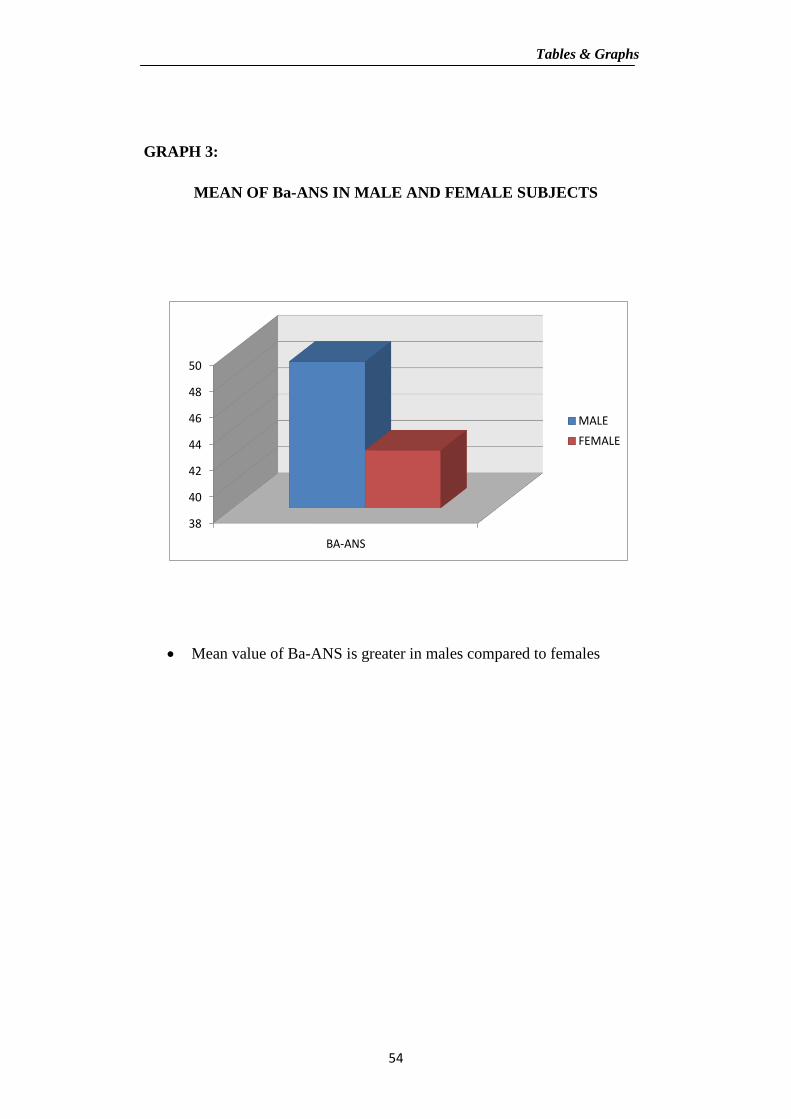
GRAPH 3:
MEAN OF Ba-ANS IN MALE AND FEMALE SUBJECTS
38
40
42
44
46
48
50
BA-ANS
MALE
FEMALE
Mean value of Ba-ANS is greater in males compared to females
Tables & Graphs
55
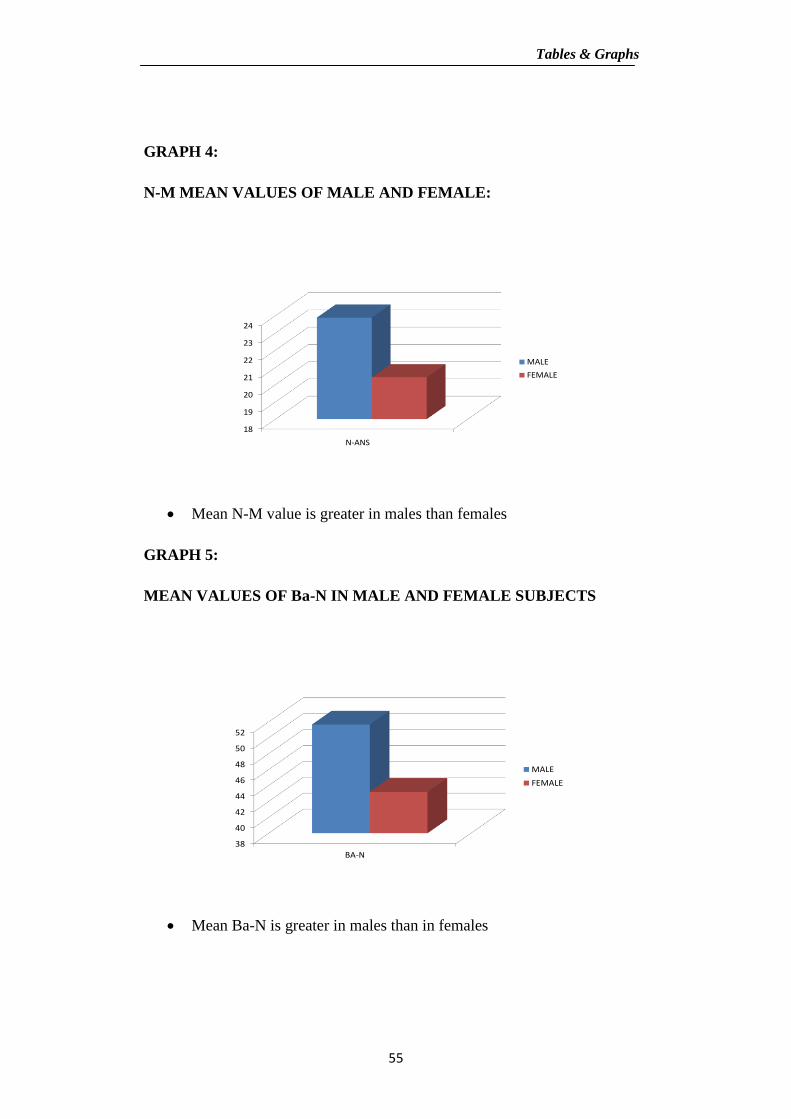
GRAPH 4:
N-M MEAN VALUES OF MALE AND FEMALE:
18
19
20
21
22
23
24
N-ANS
MALE
FEMALE
Mean N-M value is greater in males than females
GRAPH 5:
MEAN VALUES OF Ba-N IN MALE AND FEMALE SUBJECTS
38
40
42
44
46
48
50
52
BA-N
MALE
FEMALE
Mean Ba-N is greater in males than in females
Tables & Graphs
56
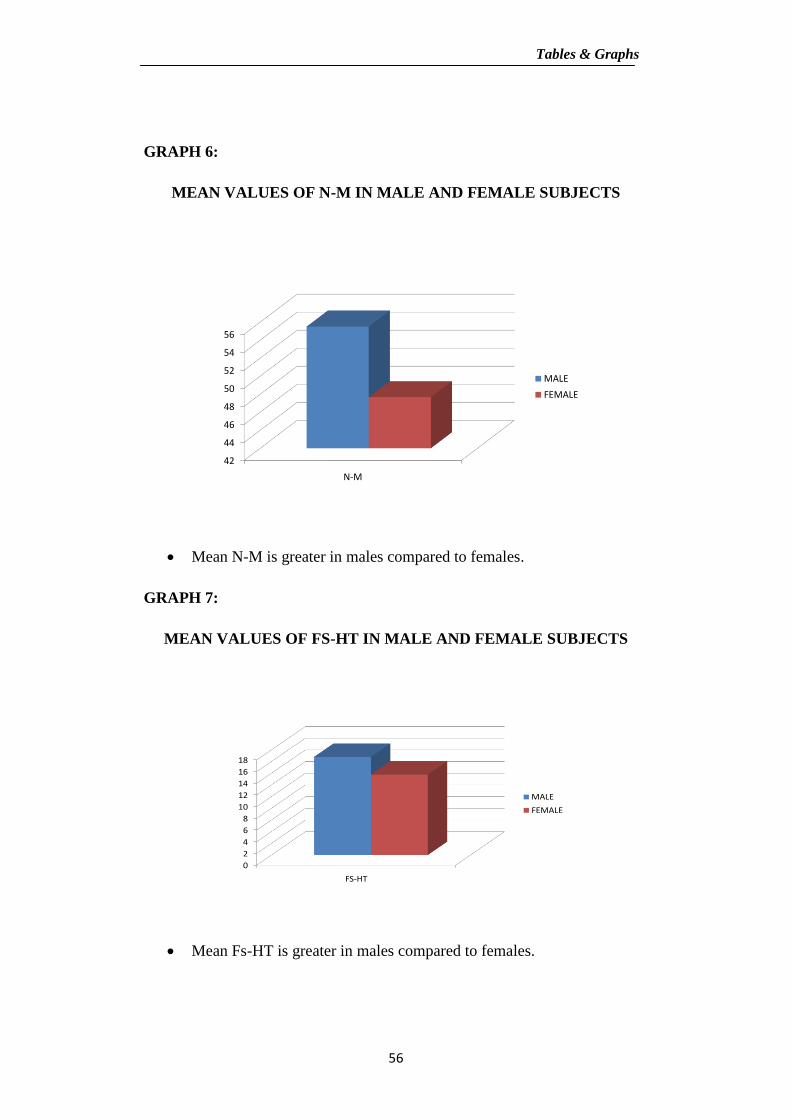
GRAPH 6:
MEAN VALUES OF N-M IN MALE AND FEMALE SUBJECTS
42
44
46
48
50
52
54
56
N-M
MALE
FEMALE
Mean N-M is greater in males compared to females.
GRAPH 7:
MEAN VALUES OF FS-HT IN MALE AND FEMALE SUBJECTS
0
2
4
6
8
10
12
14
16
18
FS-HT
MALE
FEMALE
Mean Fs-HT is greater in males compared to females.
Tables & Graphs
57
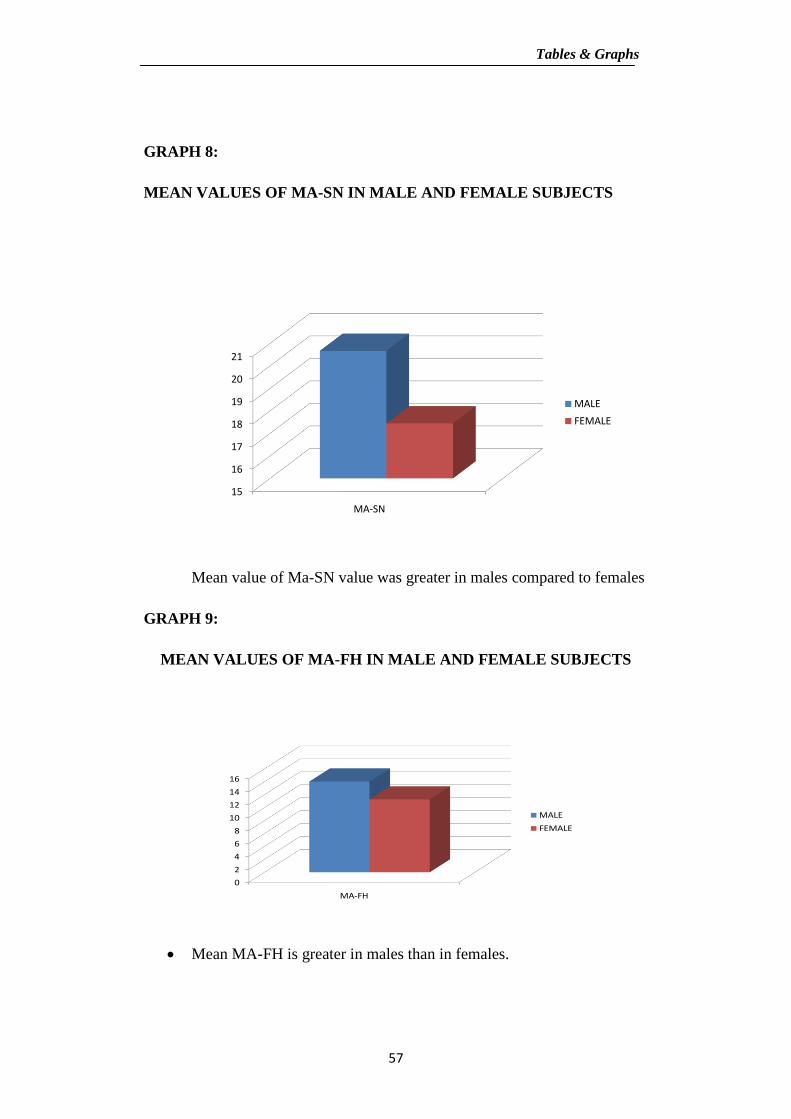
GRAPH 8:
MEAN VALUES OF MA-SN IN MALE AND FEMALE SUBJECTS
15
16
17
18
19
20
21
MA-SN
MALE
FEMALE
Mean value of Ma-SN value was greater in males compared to females
GRAPH 9:
MEAN VALUES OF MA-FH IN MALE AND FEMALE SUBJECTS
0
2
4
6
8
10
12
14
16
MA-FH
MALE
FEMALE
Mean MA-FH is greater in males than in females.
Tables & Graphs
58
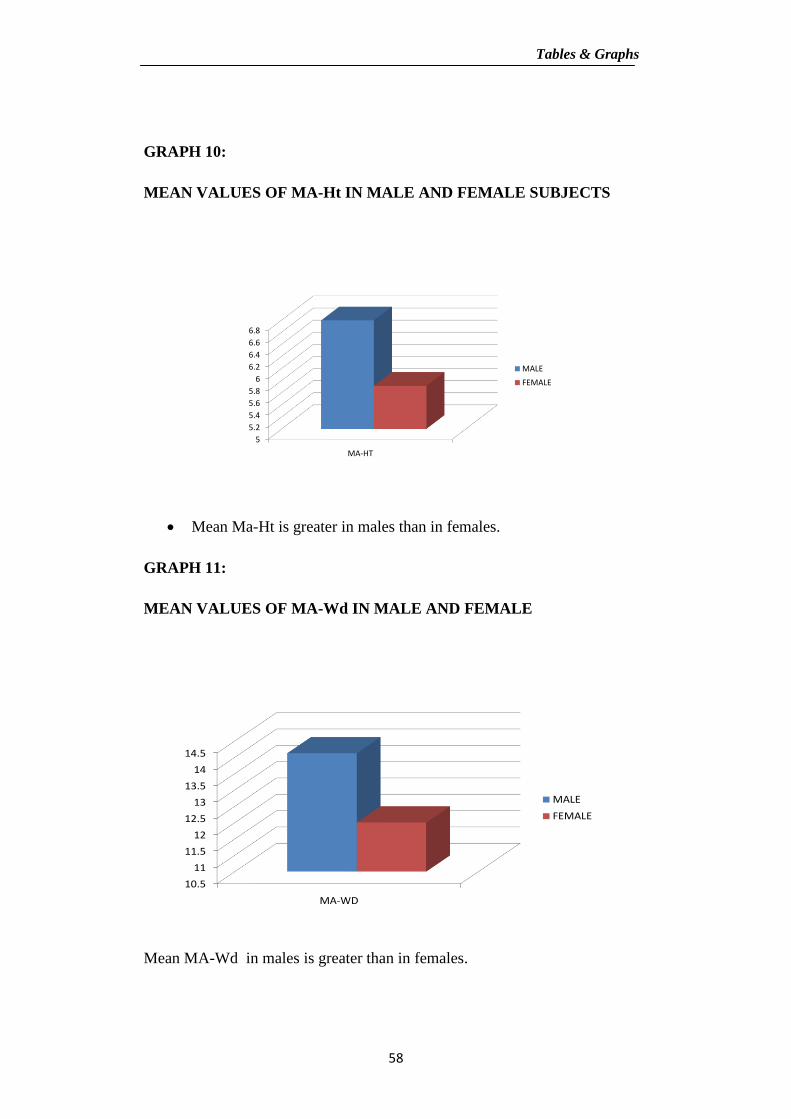
GRAPH 10:
MEAN VALUES OF MA-Ht IN MALE AND FEMALE SUBJECTS
5
5.2
5.4
5.6
5.8
6
6.2
6.4
6.6
6.8
MA-HT
MALE
FEMALE
Mean Ma-Ht is greater in males than in females.
GRAPH 11:
MEAN VALUES OF MA-Wd IN MALE AND FEMALE
10.5
11
11.5
12
12.5
13
13.5
14
14.5
MA-WD
MALE
FEMALE
Mean MA-Wd in males is greater than in females.

Discussion
Discussion
59
DISCUSSION
In forensic sciences, the key analysis in construction of biological
profile of human skeletal is to determine sex.66
Human skeletal bone is used
for sex determination as it has extraordinary resistance to putrefaction and
effects of external agents.60
Craniofacial skeleton exhibits inherent complexity
expressed by a large variability in size, shape, and proportions, which leads to
individualization.57
Many studies were conducted to determine the sex from
anthropometric skull measurements and from skull radiographs.21
Pelvis is
considered the gold standard for gender analysis in forensics.35,36,7
Cephalographs are considered the second gold standard as they are more
objective, standardized and reproducible.29,63
Expression of secondary sexual characters plays a vital role in
determination of sexual dimorphism.7 Lateral cephalometric variables exhibit
sexual dimorphism between genders of the same species. Expression of sexual
dimorphism, is highly accurate by the age of 25, since the growth of the
craniofacial region is completed and expression of cephalometric parameters
are more pronounced at this age but however the parameters are affected by
changes occurring due to senility.35,36,52
Because of this, in this study the
subjects selected in Chennai population were within the age range of 25-45.
In this study a total of 100 lateral cephalographs were collected
retrospectively, which consisted of 50 of each gender. The cephalometric
variables selected in this study are Ba-ANS, N-ANS, Ba-N, N-M, Fs-Ht, Ma-
Discussion
60
SN, Ma-FH, Ma-Ht, Ma-Wd and these were measured by Radiant Diacom
viewer 2.2.3. The following were subjected to statistical analysis by SPSS
version 20.00. The study had two parts where the part I consisted of evaluating
the variables and to test their significance followed by discriminant function
analysis where a discriminant function equation and classification functions
were derived from the study population. The part II of the study was to
statistically cross validate the study population with the derived equation and
classification functions and to check the accuracy of the model. By using the
student t-test, all the 9 predictor variables were found to be highly significant
(p<.0.001). All the predictor variables were subjected to step wise
discriminant function analysis. Further significance was assessed using Wilk’s
lambda (Test of Equality). Canonical correlation was done to assess the
relationship between the variables, which was found to be significant. A
discriminate function53
equation was derived statistically from the population
used in the study, following which a cross validation has been done to evaluate
the efficacy of this model which had an overall accuracy 95%. This model had
accuracy in predicting males by 98% and females by 92%.
In the present study, the cephalometric variables used were considered
according to evidences from the previous studies in which have reported of
high significance in sex determination (Hsiao TH25
et al 1996, De Paiva14
et
al 2003, Patil and Modi32
et al 2005, Williams66
et al 2006). In the present
study FS-ht, Ba-ANS, N-ANS, Ma-ht, Ba-N, Ma-wd were considered to be the
Discussion
61
major variables for sex determination compared to Ma-FH, Ma-SN,N-M
which were considered to be least reliable. It was observed that all the
cephalometric variables were greater in males compared to females.
Fs-ht was considered to be major variable which was consistent with
the findings of Camargo8 et al 2007, Veyre gouley
63 et al (2008)
Mahalaxmi44
et al(2013), Sowmya Verma59
et al (2014), Sai Kiran10
et al
2014 and was not consistent with findings of Almas Binnal2 2013.
Ba-ANS (depth of the face) was considered to be major variable which
was consistent with the findings of Kanchan and Modi32
et al 2005, V.G
Naikmasur46
et al 2010, Mahalaxmi44
et al 2013, Almas Binnal2 2012.
Naikmasur 2010 has done a study in immigrant Tibetian and in in South
Indians where the depth of the face was very significant sex discriminator.46
Ma-ht, Ma-wd were considered to be the other major variables which
were consistent with the study done by Paiva et al (2003) 14
, Kemkes et al
20064, Das Gupta et al 2012
13,Veyre Goulet et al 2008
63, Mahalaxmi et al
2013 44
. Paiva et al 2003 14
and Kemes et al 20064 concluded that mastoid
process is the most protected and resistant structure to damage, even in cases
of burns, due to its anatomical position at the base of the skull and its compact
nature.62
Thus, this anatomical region is favorable for sex determination
especially when multiple measurements are carried out. (Paiva14
et al (2003),
Kemes4 et al 2006). Das Gupta
13 2012 et al conducted a study using
Discussion
62
anthropometric skull measurements for the mastoid process, the mastoid
height was the best sex determinant with an accuracy of 85.7% and the overall
accuracy using mastoid measurements was 90%.13
N-ans which was the other major variable in this study is consistent
with Ruchi Mathur 201554
and was inconsistent with Almas Binnal et al
2013.2
According to Chang9 et al 1993 and Rogers
52 et al 2005 there is a
variation in growth of the different parts of the skull, with sexual differences
being best defined in the late growing structures of the skull, such as lower
facial height, facial depth and mastoid process, while the cranial base and
upper face are the middle growing regions in which some sexual differences
may be evident.9,52
In the present study the results were consistent as the Ma-
ht, Ma-wd (mastoid process), Ba-ANS(depth of the face) emerged as major
contributors of sexual dimorphism excluding lower facial height. This
disparity could be explained by geographical diversity. Almas Binnal2 et al
2013 conducted a study in 100 subjects belonging to south Indian population
where the major variables were found to be lower facial height, depth of the
face and mastoid process which were consistent with the proportions of
Chang9 et al and Rogers
52 et al.
The discriminant functional equation derived in this study is 95%
accurate in differentiating male and female subjects. Hsiao25
et al (1996)
Discussion
63
studied 100 cephalograms of Taiwanese origin and claimed 100% accuracy in
sex determination using 18 cephalometric variables,25
the variables common
with our study were Frontal sinus height, mastoid width, mastoid height,
mastoid to SN, mastoid to FH. Franklin20
et al 2005 reported an accuracy of
77-80% in sexual discrimination using 8 cephalometric variables20
, the
variables common with our study was the mastoid length. Almas Binnal2 et al
2012 claimed accuracy of 86% gender determination using the same 9
variables,2 all the variables were consistent with our study. Naikumasur
46 et
al 2010 reported a accuracy of 81.5% and 88.2% respectively by comparing
the reliability of craniomandibular parameters in South Indian and Indian
immigrant of Tibetans population using 12 variables on lateral and posterior-
anterior cephalograms,46
the variables common with our study are Ba-ANS,
N-ANS, Ba-N, N-Me. A study done by Patil and Modi32
et al 2005 in Central
India population showed a accuracy of 99% considering 10 cephalometric
variables,32
the variables common with study were Ba-ANS,N-ANS, Ba-N, N-
M, Fs-HT, Ma-ht Ma-SN,Ma-FH,Ma-Wd. Verey-Goulet63
et al 2008
conducted a study using 18 cephalometric variable based on Hasio25
et al for
sex determination and claimed a accuracy of 95.6%, where the variables
common with our study are Fs-ht, Ma-SN, Ma-FH, Ma-ht,Ma-Wd. Ayar
Razzaq Ali56
et al 2013 conducted a study conducted a study using 13
cephalometric variables and claimed an accuracy of 85.8%, the variables
common with our study were N-M, Ba-N, Ba-ANS, N-ANS, Ma-SN,Fs-ht.
Discussion
64
Mahalakshmi44
et al 2013 conducted a study using 10 cephalometric
variables for sex determination and claimed a accuracy of 73.1%, where the
variables common with our study were Ba-ANS, N-ANS,Ba-N, N-M, Fs-ht,
Ma-SN, Ma-FH, Ma-ht, Ma-wd. The disparity in the findings may be
explained by the number of predictor variables, age of the study group,
varying predictor variables, heterogenous population groups,64
population
specificity, magnification factors.

Summary & Conclusion
Summary & Conclusion
65
SUMMARY AND CONCLUSION
In this study a total of 100 lateral cephalographs were collected
retrospectively, which consisted of 50 males and 50 females. Nine
cephalometric variables were measured by Radiant Diacom viewer 2.2.3, the
nine cephalometric parameters are Ba-ANS, N-ANS, Ba-N, N-M, Fs-Ht, Ma-
SN, Ma-FH, Ma-Ht, Ma-Wd. It was found that statistically all the predictor
variables were significant. All the predictor variables were greater in males
than compared to the females. In the present study FS-ht, Ba-ANS, N-ANS,
Ma-ht, Ba-N, Ma-wd were considered to be the major variables for sex
determination and Ma-fh, Ma-SN,N-M were considered to be least reliable. A
discriminate function equation was derived statistically from the population
used in the study, following which a cross validation has been done to evaluate
the efficacy of this model which had an overall accuracy 95% This model had
accuracy in predicting males by 98% and females by 92%.
Sex determination based on cephalometric traits exhibit population
specificity, hence a need for a population specific assessment.27
The lateral
cephalometric traits are influenced by a number of factors which produces
differences in skeletal proportions between different geographical areas thus
we in this study have derived discriminant function which can be a valuable
tool in identification of sex in population pertaining to Chennai. Further
studies should be conducted and specific standards of assessment are to be
drawn among different populations of the world.

Bibliography
Bibliography
BIBLIOGRAPHY
1. Adams BJ, Byrd JE. Inter-Observer variation of selected
postcranial skeletal remains; Forensic Sci 2002; 47(6):1193-1202.
2. Almas Binnal, Yashoda.B.K Devi; Identification of sex using
Lateral Cephalogram ; Role of cephalofacial parameters; Journal
of Indian Academy of Oral Medicine and Radiology,
2012;24(4):280-283.
3. Alyssa E. Sprowl; Sex Determination Using Discriminant
Function Analysis in Hispanic Children and Adolescents: A Lateral
Cephalometric Study; (2013). UNLV/Dissertations /Professional
Papers/Capstone 2013.
4. Ariane Kemkes, and Tanja Gobel; Metric Assessment of the
‘‘Mastoid Triangle’’ for Sex Determination: A Validation Study, J
Forensic Sci, September 2006; 51(5).
5. Bass WM. Human osteology: A laboratory and field manual of
the human skeleton Columbia: Missouri Archaeological Society
1971;235.
6. Bibby RE. A cephalometric study of sexual dimorphism. Am J
Orthod 1979;76: 256–9.
7. Biggerstaff RH. Craniofacial characteristics as determinants of
age, sex and race in forensic dentistry; Dent Clin North Am
1977;21(1):85-97.
66
Bibliography
8. Camargo, Daruge, Prado, Caria, Alves, Silva; The frontal sinus
morphology in radiographs of Brazilian subjects: its forensic
importance; Braz. J. Morphol.Sci, 2007,24(4): 239-243.
9. Chang H P, Roentgenographic cephalometric studies of Chinese
adults (in Taiwan) with excellent occlusion; Foreinsic Sciences
1979;33: 112-131.
10. Chi.Sai Kiran, P. Ramaswamy, Tanya Khaitan; Frontal sinus
index-A new tool for sex determination; Journal of forensic
radiology and imaging 2014;2:77-79.
11. Clement JG, Ranson DL. Craniofacial identification in forensic
medicine. New York: Oxford University Press, 1988.
12. Ceballos J.L, E.H. Rentschler, Roentgen diagnosis of sex based
on adult skull characteristics; Comparision study of cephalometry
of male and female skull films (frontal projection), Radiology
1958;70: 55–61.
13. Das Gupta.A, Arindom Banerjee, Anil Kumar, Sambasiva,
Josna; Dicriminant analysis of mastoid measurements in sex
determination; J Life Sci 2012;4(1):1-5.
14. De Paiva LA, Segre M. Sexing the human skull through the
mastoid process; Rev Hosp Clin Fac Med Sao Paulo
2003;58(1):15-20.
Bibliography
15. Deshmukh G & Devershi DB; Comparison of Cranial Sex
Determination by Univariate and MultivariateAnalysis; J.Anat.Soc.
India 2006;55(2):48-51.
16. David M, Ashmita V, Cephalometric norma for India adults using
digital posteroanterior analysis; World Journal of Dentistry
2011;2(3):199-205
17. Evans K.T, B. Knight, D.K. Whittaker, Forensic Radiology;
Blackwell Scientific Publication, Oxford, 1981, pp. 48.
18. Elena F. Kranioti , Mehmet Yasar Iscan b, Manolis
Michalodimitrakis, A Craniometric analysis of the modern Cretan
population; Forensic Science International 2008;110–110.
19. Esssam M. Mehlab, Gamal Abdel Salam; cephalometric
evaluation of age dependent craniofacial skeleton changes in
children of 7-17 years age group: assessment of gender impact;
Nature and Science 2012; 10(11).
20. Franklin D, Freedman L, Milne N. Sexual dimorphism and
discriminant function sexing in indigenous South African crania;
HOMO 2005;55(3):213-28.
21. Giles E, Elliott O. Sex determination by discriminant function
analysis of Crania; Am J Phys Anthrop 1963; 21: 53–68.
22. Guilherme Janson, Camila Leite Quaglio, Arnaldo Pinzan,
Eduardo Jacomino Franco, Marcos Roberto de Freitas,
Bibliography
Craniofacial characteristics of Caucasian and Afro-Caucasian
Brazilian subjects with normal occlusion; ,J Appl oral sci,
2011;19(2):118-24.
23. Hanihara, K. Sex Diagnosis of Japanese Skulls and Scapulae by
Means of Discriminant Functions; J. Anthrop. Soc. Nippon,1959;
67:21.
24. Hong-Po Chang, Zennosuke Kinoshita, and Tatsuo Kawamoto;
A study of the growth changes in facial configuration; European
Journal of Orthodontics 1993;15: 493-501.
25. Hsiao TH, Chang HP, Liu KM. Sex determination by
discriminant function analysis of lateral radiographic
cephalometry; J Forensic Sci 1996;41: 792–5.
26. Hong Weisong, Lin Zi Qing, Jia Jing Tao, Sex diagnosis of
Chinese skull using multiple stepwise discriminant function
analysis; Forensic Science International 1992;54(2):135-140.
27. Iscan MY. Forensic anthropology of sex and body size; Forensic
Sci Int 2005;147:107-12
28. Inoue.M, Fourier analysis of the forehead shape of skull and sex
determination by use of computer; Forensic Sci. Int
1990;47(2):101–112.
29. Jacobson A. Radiographic cephalometry (2nd ed). US:
Quintessence Publishing Co Inc 1995; 223.
Bibliography
30. Ji-Hwan Kim, Odontuya Gansukh, Bazar Amarsaikhan, Shin-
Jae Lee; Comparison of cephalometric norms between Mongolian
and Korean adults with normal occlusions and well-balanced
profiles; Korean J Orthod 2011;41(1).
31. Keen.J; A study of differences between male and female skulls;
Am. J. Phys. Anthropol 1950; 8:65–80.
32. Kanchan R. Patila, Rajendra N. Modyb; Determination of sex by
discriminant function analysis and stature by regression analysis; a
Lateral Cephalometric study; Forensic Science International
,2005;147:175–180.
33. Kewel Krishan, Anthropometry in forensic medicine and forensic
science anthropometry; Journal of Forensic Science 2006; 2(1).
34. Kosa F; Application and role of anthropological research in the
practice of forensic medicine; Acta Biol Szeged 2000;44 (1-4):179-
188.
35. Krogman W.M; The Human Skeleton in Forensic Medicine,
Postgrad. Med.,1955; 17:2-3.
36. Krogman W.M, Iscan.M.Y; The Human Skeleton in Forensic
Medicine; Charles C. (2 nd edition)Thomas, Springfield Illinois,
1986.
37. Kranioti EF, Manolis M; Sexual dimorphism of humerus in
contemporary cretans – a population specific study and a review of
Bibliography
literature; Journal of Forensic Sciences 2009;54(5):996-1000.
38. Li Luo Mengyang Wang, Yun Tian, Fuquuing Duan, Zhongke
wu, Mingquan Zhou, Yves Rozenholc; Automatic sex
determination of skulls based on a statistical shape model;
Computational and Mathematical methods in Medicine ;volume
2013, Article ID 251628.
39. Meredith Stacy Robinson A,B, Mubarak Ariyo Bidmos; The
skull and humerus in the determination of sex: Reliability of
discriminant function equations; Forensic Science International
2009;186:86.e1–86.
40. Maria Carolina Salome Marquezin, Annicele da Silva
Andrade, Moara de Rossi, Gustavo Hauber Gameiro, Maria
Beatriz, Duarte Gaviao, Paula Midori Castelo; Evaluation of
sexual dimorphism and the relationship between craniofacial,
dental arch and masseter muscle characteristics in mixed dentition;
Rev. CEFAC 2014; 16(4).
41. Maria Elani, Efstratios Valakos, Sotiris; Sex determination by
three dimensional grometric morphometrics of palate and cranial
base; Anthrop.ANZ 2013;. 70/4,407-425.
42. Marlon Alvaro Moldeza; Koshi Satob; Junji Sugawarac; Hideo
Mitanid; Linear and Angular Filipino Cephalometric Norms
According to Age and Sex; Angle Orthodontist 2006; 76(5).
Bibliography
43. Maryna Steyn, M. Yasar Iscan; Sexual dimorphism in the crania
and mandibles of South African whites; Forensic Science
International 1998;98:9–16.
44. Mahalakshm IP, Priscilla MD, Determination of sexual
dimorphism and stature using lateral cephalogra;, J Indian Aca
Oral Med Radiol 2013; 25(2):116-120.
45. Mahesh K, Mohammed M, Patnaik VVG, Determination of sex
by discriminant function analysis; A cephalometric study.
International Journal of Pure and applied Bioscience 2013; 1(4):
18-21.
46. Naikmasur VG, Shrivastava R, Mutalik S. Determination of sex
in South Indians and immigrant Tibetans from cephalometric
analysis and discriminant functions; Forensic Sci Int 2010; 197:
122.e1-6.
47. Novotny V; Sex determination of the pelvic bone: a systems
approach; Anthropology 1986;24:197–206.
48. O’Higgins P, Johnson D, Moore W, McAndrew T;
Determination of race and sex of the human skull by discriminant
function analysis of linear and angular dimensions; Forensic Sci
Int 1989;41:41.
49. Osvaldo, Fortes de Oliveira; Rachel, Lima Ribeiro Tinoco;
Eduardo, Daruge Júnior; Andrea Sayuri, Silveira DiasTerada;
Bibliography
Ricardo Henrique, Alves da Silva; Luiz Renato, Paranhos; Sexual
Dimorphism in Brazilian Human Skulls: Discriminant Function
Analysis; JFOS. December 2012; 30(2): 26-33.
50. Reichs KJ, Bass WM; Forensic Osteology: Advances in the
Identification. of Human Remains (2nd Edition); Springfield,
Illinois, U.S.A. Charles C. Thomas Pub Ltd, 1998.
51. Rajkumar badam, Manjunath,ranims; Determination of sex by
discriminant function analysis of lateral radiographic
cephalometry; Journal of Indian academy of Oral Medicine and
Radiology, 2011; 23(3); 179-183.
52. Rogers TL; Determining the sex of human remains through
cranial morphology; J Forensic Sci 2005; 50:493–500.
53. Rosner B.; Fundamentals of Biostatistics; 5th ed. Duxbury; 2000;
80-240.
54. Ruchi U. Mathur, Aarti M. Mahajan, Rishikesh C. Dandekar,
Rahul B. Patil; Determination of Sex using Discriminant Function
Analysis in Young Adults of Nashik: A Lateral Cephalometric
Study; J Adv Med Dent Scie 2014;2(1):21-25.
55. Ruhi Sidhu, Sunira Chandra, Parvathi Devi, Neeraj Taneja,
Kunal Sah, Navdeep Kaur; Forensic importance of maxillary
sinus in gender determination: A morphometric analysis from
Bibliography
western uttar Pradesh, India; European journal of general dentistry
2014; 3(1).
56. Razzaq AA, Lamia H.Al Nakib; The value of lateral
cephalomeric image in sex identification;. J Bagh college Dentistry
2013; 25(2):54-58.
57. Sassouni V; Dentofacial radiography in forensic dentistry; J Dent
Res 1963;42:274-302.
58. Scheuer L.; Application of osteology to forensic medicine; Clin
Anat 2002;15(4):297-312.
59. Saumya Verma, V. G. Mahima, and Karthikeya Patil;
Radiomorphometric analysis of frontal sinus for sex determination
; J Forensic Dent Sci. 2014 SepDec; 6(3): 177–182.
60. Shankar .S, Krishnamurthy. A, Kruthika, Suresh; Identifying
sexual dimorphism in Paediatric south Indian population using
stepwise discriminant function analysis; Journal Of Forensic and
Legal Medicine (2013); 1-5.
61. Townsend G.C, L.C. Richards, A. Carroll; Sex determination of
Australian Aboriginal skulls by discriminant function analysis;
Aust. Dent. J 1982;27:320–326.
62. Tomohito Nagaoka, Akio Shizushima, Junmei Sawada,
Soichiro Tomo, Keigo Hoshino, Hanako Sato, Kazuaki Hirata;
Sex determination using mastoid process measurements: standards
Bibliography
for Japanese human skeletons of the medieval and early modern
periods; Anthropological science 2008; 116(2):105–113.
63. Veyre-Goulet SA, Mercier C, Robin O, Guerin C.; Recent
human sexual dimorphism study using cephalometric plots on
lateral teleradiography and discriminant function analysis; J
Forensic Sci 2008;53(4):786-89.
64. Vioarsdottir US, O’Higgins P, Stringer C.; A geometric
morphometric study of regional differences in the ontogeny of the
modern human facial skeleton; J Anat 2002;201 :211–29.
65. Wen-Jeng Huang, Reginald Tylor, Ananda P. Dasanayake;
Determining Cephalometric Norms For Caucasians And African
Americans and African Americans in Birmingham; The Angle
Orthodontic,1996;68(6).
66. Williams BA, Rogers TL.; Evaluating the accuracy and precision
of cranial morphological traits for sex determination; J Forensic
Sci 2006;51(4):729-35.

Annexures
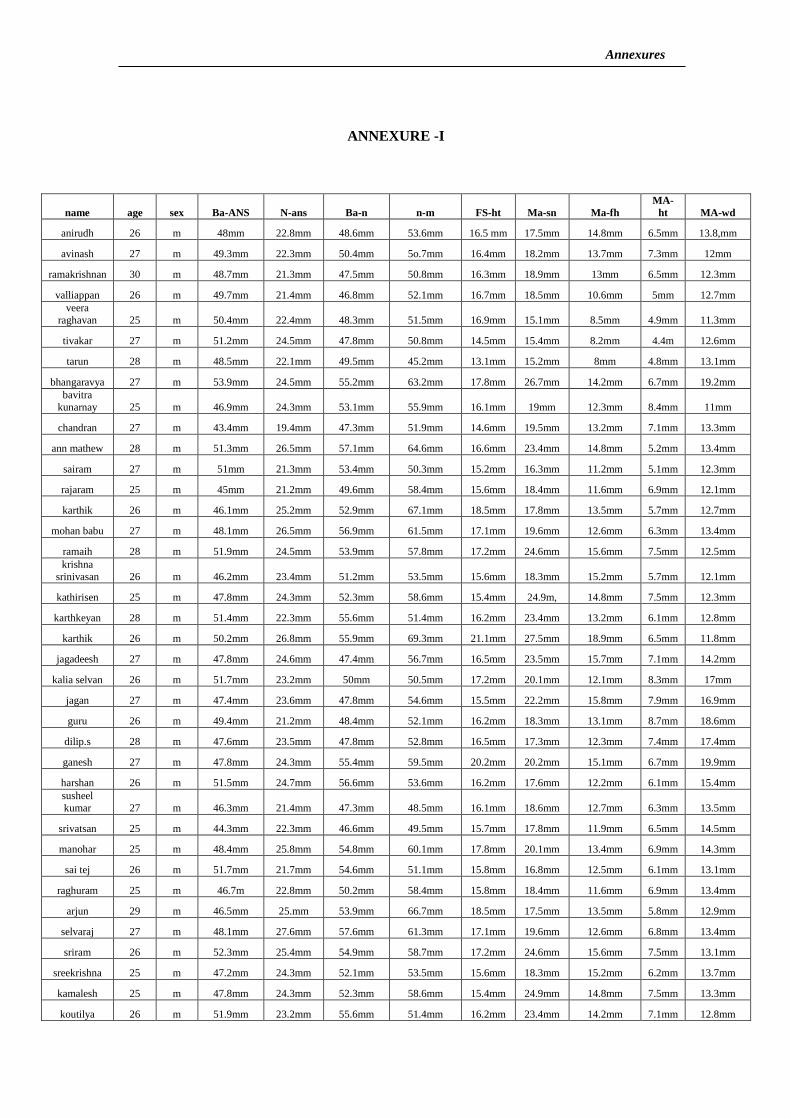
Annexures
ANNEXURE -I
name age sex Ba-ANS N-ans Ba-n n-m FS-ht Ma-sn Ma-fh
MA-
ht MA-wd
anirudh 26 m 48mm 22.8mm 48.6mm 53.6mm 16.5 mm 17.5mm 14.8mm 6.5mm 13.8,mm
avinash 27 m 49.3mm 22.3mm 50.4mm 5o.7mm 16.4mm 18.2mm 13.7mm 7.3mm 12mm
ramakrishnan 30 m 48.7mm 21.3mm 47.5mm 50.8mm 16.3mm 18.9mm 13mm 6.5mm 12.3mm
valliappan 26 m 49.7mm 21.4mm 46.8mm 52.1mm 16.7mm 18.5mm 10.6mm 5mm 12.7mm
veera
raghavan 25 m 50.4mm 22.4mm 48.3mm 51.5mm 16.9mm 15.1mm 8.5mm 4.9mm 11.3mm
tivakar 27 m 51.2mm 24.5mm 47.8mm 50.8mm 14.5mm 15.4mm 8.2mm 4.4m 12.6mm
tarun 28 m 48.5mm 22.1mm 49.5mm 45.2mm 13.1mm 15.2mm 8mm 4.8mm 13.1mm
bhangaravya 27 m 53.9mm 24.5mm 55.2mm 63.2mm 17.8mm 26.7mm 14.2mm 6.7mm 19.2mm
bavitra
kunarnay 25 m 46.9mm 24.3mm 53.1mm 55.9mm 16.1mm 19mm 12.3mm 8.4mm 11mm
chandran 27 m 43.4mm 19.4mm 47.3mm 51.9mm 14.6mm 19.5mm 13.2mm 7.1mm 13.3mm
ann mathew 28 m 51.3mm 26.5mm 57.1mm 64.6mm 16.6mm 23.4mm 14.8mm 5.2mm 13.4mm
sairam 27 m 51mm 21.3mm 53.4mm 50.3mm 15.2mm 16.3mm 11.2mm 5.1mm 12.3mm
rajaram 25 m 45mm 21.2mm 49.6mm 58.4mm 15.6mm 18.4mm 11.6mm 6.9mm 12.1mm
karthik 26 m 46.1mm 25.2mm 52.9mm 67.1mm 18.5mm 17.8mm 13.5mm 5.7mm 12.7mm
mohan babu 27 m 48.1mm 26.5mm 56.9mm 61.5mm 17.1mm 19.6mm 12.6mm 6.3mm 13.4mm
ramaih 28 m 51.9mm 24.5mm 53.9mm 57.8mm 17.2mm 24.6mm 15.6mm 7.5mm 12.5mm
krishna
srinivasan 26 m 46.2mm 23.4mm 51.2mm 53.5mm 15.6mm 18.3mm 15.2mm 5.7mm 12.1mm
kathirisen 25 m 47.8mm 24.3mm 52.3mm 58.6mm 15.4mm 24.9m, 14.8mm 7.5mm 12.3mm
karthkeyan 28 m 51.4mm 22.3mm 55.6mm 51.4mm 16.2mm 23.4mm 13.2mm 6.1mm 12.8mm
karthik 26 m 50.2mm 26.8mm 55.9mm 69.3mm 21.1mm 27.5mm 18.9mm 6.5mm 11.8mm
jagadeesh 27 m 47.8mm 24.6mm 47.4mm 56.7mm 16.5mm 23.5mm 15.7mm 7.1mm 14.2mm
kalia selvan 26 m 51.7mm 23.2mm 50mm 50.5mm 17.2mm 20.1mm 12.1mm 8.3mm 17mm
jagan 27 m 47.4mm 23.6mm 47.8mm 54.6mm 15.5mm 22.2mm 15.8mm 7.9mm 16.9mm
guru 26 m 49.4mm 21.2mm 48.4mm 52.1mm 16.2mm 18.3mm 13.1mm 8.7mm 18.6mm
dilip.s 28 m 47.6mm 23.5mm 47.8mm 52.8mm 16.5mm 17.3mm 12.3mm 7.4mm 17.4mm
ganesh 27 m 47.8mm 24.3mm 55.4mm 59.5mm 20.2mm 20.2mm 15.1mm 6.7mm 19.9mm
harshan 26 m 51.5mm 24.7mm 56.6mm 53.6mm 16.2mm 17.6mm 12.2mm 6.1mm 15.4mm
susheel
kumar 27 m 46.3mm 21.4mm 47.3mm 48.5mm 16.1mm 18.6mm 12.7mm 6.3mm 13.5mm
srivatsan 25 m 44.3mm 22.3mm 46.6mm 49.5mm 15.7mm 17.8mm 11.9mm 6.5mm 14.5mm
manohar 25 m 48.4mm 25.8mm 54.8mm 60.1mm 17.8mm 20.1mm 13.4mm 6.9mm 14.3mm
sai tej 26 m 51.7mm 21.7mm 54.6mm 51.1mm 15.8mm 16.8mm 12.5mm 6.1mm 13.1mm
raghuram 25 m 46.7m 22.8mm 50.2mm 58.4mm 15.8mm 18.4mm 11.6mm 6.9mm 13.4mm
arjun 29 m 46.5mm 25.mm 53.9mm 66.7mm 18.5mm 17.5mm 13.5mm 5.8mm 12.9mm
selvaraj 27 m 48.1mm 27.6mm 57.6mm 61.3mm 17.1mm 19.6mm 12.6mm 6.8mm 13.4mm
sriram 26 m 52.3mm 25.4mm 54.9mm 58.7mm 17.2mm 24.6mm 15.6mm 7.5mm 13.1mm
sreekrishna 25 m 47.2mm 24.3mm 52.1mm 53.5mm 15.6mm 18.3mm 15.2mm 6.2mm 13.7mm
kamalesh 25 m 47.8mm 24.3mm 52.3mm 58.6mm 15.4mm 24.9mm 14.8mm 7.5mm 13.3mm
koutilya 26 m 51.9mm 23.2mm 55.6mm 51.4mm 16.2mm 23.4mm 14.2mm 7.1mm 12.8mm
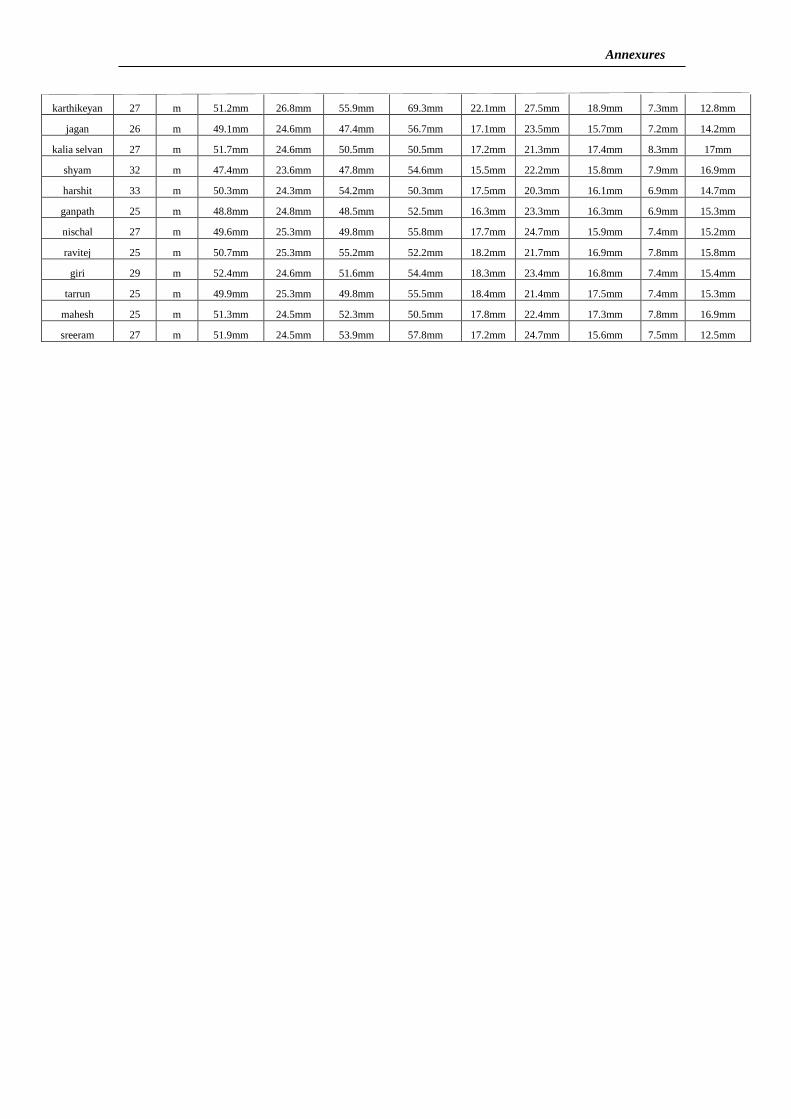
Annexures
karthikeyan 27 m 51.2mm 26.8mm 55.9mm 69.3mm 22.1mm 27.5mm 18.9mm 7.3mm 12.8mm
jagan 26 m 49.1mm 24.6mm 47.4mm 56.7mm 17.1mm 23.5mm 15.7mm 7.2mm 14.2mm
kalia selvan 27 m 51.7mm 24.6mm 50.5mm 50.5mm 17.2mm 21.3mm 17.4mm 8.3mm 17mm
shyam 32 m 47.4mm 23.6mm 47.8mm 54.6mm 15.5mm 22.2mm 15.8mm 7.9mm 16.9mm
harshit 33 m 50.3mm 24.3mm 54.2mm 50.3mm 17.5mm 20.3mm 16.1mm 6.9mm 14.7mm
ganpath 25 m 48.8mm 24.8mm 48.5mm 52.5mm 16.3mm 23.3mm 16.3mm 6.9mm 15.3mm
nischal 27 m 49.6mm 25.3mm 49.8mm 55.8mm 17.7mm 24.7mm 15.9mm 7.4mm 15.2mm
ravitej 25 m 50.7mm 25.3mm 55.2mm 52.2mm 18.2mm 21.7mm 16.9mm 7.8mm 15.8mm
giri 29 m 52.4mm 24.6mm 51.6mm 54.4mm 18.3mm 23.4mm 16.8mm 7.4mm 15.4mm
tarrun 25 m 49.9mm 25.3mm 49.8mm 55.5mm 18.4mm 21.4mm 17.5mm 7.4mm 15.3mm
mahesh 25 m 51.3mm 24.5mm 52.3mm 50.5mm 17.8mm 22.4mm 17.3mm 7.8mm 16.9mm
sreeram 27 m 51.9mm 24.5mm 53.9mm 57.8mm 17.2mm 24.7mm 15.6mm 7.5mm 12.5mm
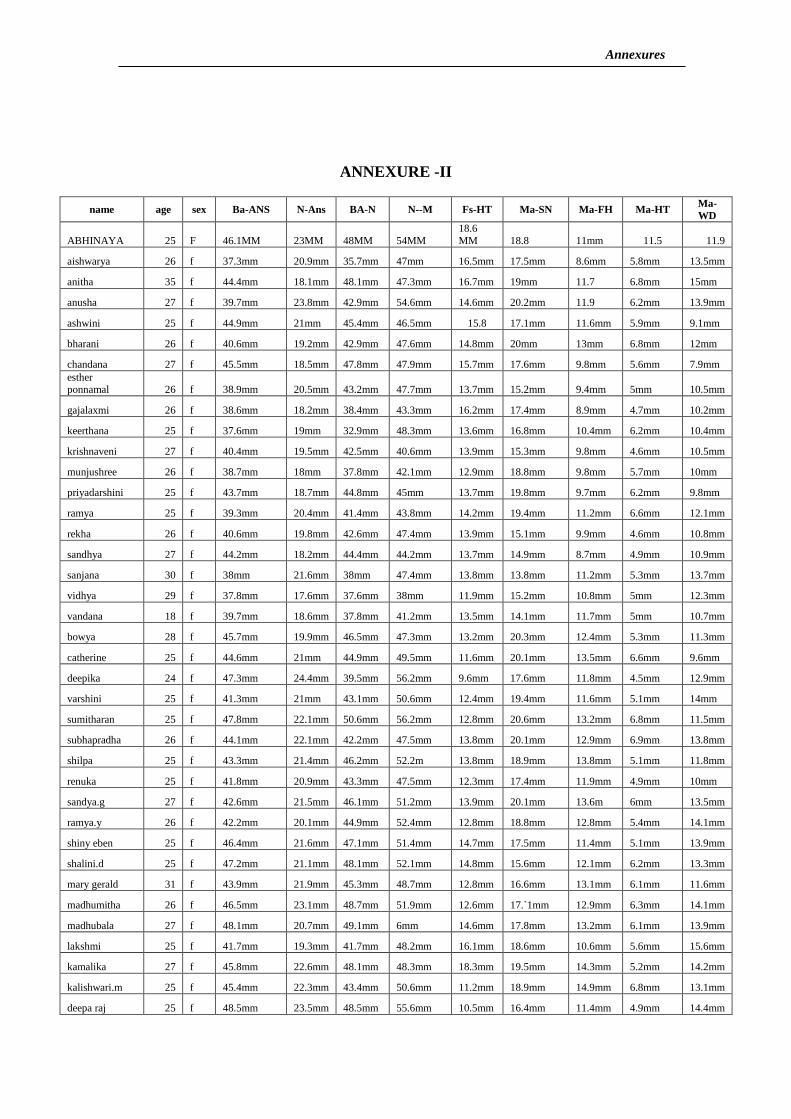
Annexures
ANNEXURE -II
name age sex Ba-ANS N-Ans BA-N N--M Fs-HT Ma-SN Ma-FH Ma-HT Ma-
WD
ABHINAYA 25 F 46.1MM 23MM 48MM 54MM
18.6
MM 18.8 11mm 11.5 11.9
aishwarya 26 f 37.3mm 20.9mm 35.7mm 47mm 16.5mm 17.5mm 8.6mm 5.8mm 13.5mm
anitha 35 f 44.4mm 18.1mm 48.1mm 47.3mm 16.7mm 19mm 11.7 6.8mm 15mm
anusha 27 f 39.7mm 23.8mm 42.9mm 54.6mm 14.6mm 20.2mm 11.9 6.2mm 13.9mm
ashwini 25 f 44.9mm 21mm 45.4mm 46.5mm 15.8 17.1mm 11.6mm 5.9mm 9.1mm
bharani 26 f 40.6mm 19.2mm 42.9mm 47.6mm 14.8mm 20mm 13mm 6.8mm 12mm
chandana 27 f 45.5mm 18.5mm 47.8mm 47.9mm 15.7mm 17.6mm 9.8mm 5.6mm 7.9mm
esther ponnamal 26 f 38.9mm 20.5mm 43.2mm 47.7mm 13.7mm 15.2mm 9.4mm 5mm 10.5mm
gajalaxmi 26 f 38.6mm 18.2mm 38.4mm 43.3mm 16.2mm 17.4mm 8.9mm 4.7mm 10.2mm
keerthana 25 f 37.6mm 19mm 32.9mm 48.3mm 13.6mm 16.8mm 10.4mm 6.2mm 10.4mm
krishnaveni 27 f 40.4mm 19.5mm 42.5mm 40.6mm 13.9mm 15.3mm 9.8mm 4.6mm 10.5mm
munjushree 26 f 38.7mm 18mm 37.8mm 42.1mm 12.9mm 18.8mm 9.8mm 5.7mm 10mm
priyadarshini 25 f 43.7mm 18.7mm 44.8mm 45mm 13.7mm 19.8mm 9.7mm 6.2mm 9.8mm
ramya 25 f 39.3mm 20.4mm 41.4mm 43.8mm 14.2mm 19.4mm 11.2mm 6.6mm 12.1mm
rekha 26 f 40.6mm 19.8mm 42.6mm 47.4mm 13.9mm 15.1mm 9.9mm 4.6mm 10.8mm
sandhya 27 f 44.2mm 18.2mm 44.4mm 44.2mm 13.7mm 14.9mm 8.7mm 4.9mm 10.9mm
sanjana 30 f 38mm 21.6mm 38mm 47.4mm 13.8mm 13.8mm 11.2mm 5.3mm 13.7mm
vidhya 29 f 37.8mm 17.6mm 37.6mm 38mm 11.9mm 15.2mm 10.8mm 5mm 12.3mm
vandana 18 f 39.7mm 18.6mm 37.8mm 41.2mm 13.5mm 14.1mm 11.7mm 5mm 10.7mm
bowya 28 f 45.7mm 19.9mm 46.5mm 47.3mm 13.2mm 20.3mm 12.4mm 5.3mm 11.3mm
catherine 25 f 44.6mm 21mm 44.9mm 49.5mm 11.6mm 20.1mm 13.5mm 6.6mm 9.6mm
deepika 24 f 47.3mm 24.4mm 39.5mm 56.2mm 9.6mm 17.6mm 11.8mm 4.5mm 12.9mm
varshini 25 f 41.3mm 21mm 43.1mm 50.6mm 12.4mm 19.4mm 11.6mm 5.1mm 14mm
sumitharan 25 f 47.8mm 22.1mm 50.6mm 56.2mm 12.8mm 20.6mm 13.2mm 6.8mm 11.5mm
subhapradha 26 f 44.1mm 22.1mm 42.2mm 47.5mm 13.8mm 20.1mm 12.9mm 6.9mm 13.8mm
shilpa 25 f 43.3mm 21.4mm 46.2mm 52.2m 13.8mm 18.9mm 13.8mm 5.1mm 11.8mm
renuka 25 f 41.8mm 20.9mm 43.3mm 47.5mm 12.3mm 17.4mm 11.9mm 4.9mm 10mm
sandya.g 27 f 42.6mm 21.5mm 46.1mm 51.2mm 13.9mm 20.1mm 13.6m 6mm 13.5mm
ramya.y 26 f 42.2mm 20.1mm 44.9mm 52.4mm 12.8mm 18.8mm 12.8mm 5.4mm 14.1mm
shiny eben 25 f 46.4mm 21.6mm 47.1mm 51.4mm 14.7mm 17.5mm 11.4mm 5.1mm 13.9mm
shalini.d 25 f 47.2mm 21.1mm 48.1mm 52.1mm 14.8mm 15.6mm 12.1mm 6.2mm 13.3mm
mary gerald 31 f 43.9mm 21.9mm 45.3mm 48.7mm 12.8mm 16.6mm 13.1mm 6.1mm 11.6mm
madhumitha 26 f 46.5mm 23.1mm 48.7mm 51.9mm 12.6mm 17.`1mm 12.9mm 6.3mm 14.1mm
madhubala 27 f 48.1mm 20.7mm 49.1mm 6mm 14.6mm 17.8mm 13.2mm 6.1mm 13.9mm
lakshmi 25 f 41.7mm 19.3mm 41.7mm 48.2mm 16.1mm 18.6mm 10.6mm 5.6mm 15.6mm
kamalika 27 f 45.8mm 22.6mm 48.1mm 48.3mm 18.3mm 19.5mm 14.3mm 5.2mm 14.2mm
kalishwari.m 25 f 45.4mm 22.3mm 43.4mm 50.6mm 11.2mm 18.9mm 14.9mm 6.8mm 13.1mm
deepa raj 25 f 48.5mm 23.5mm 48.5mm 55.6mm 10.5mm 16.4mm 11.4mm 4.9mm 14.4mm
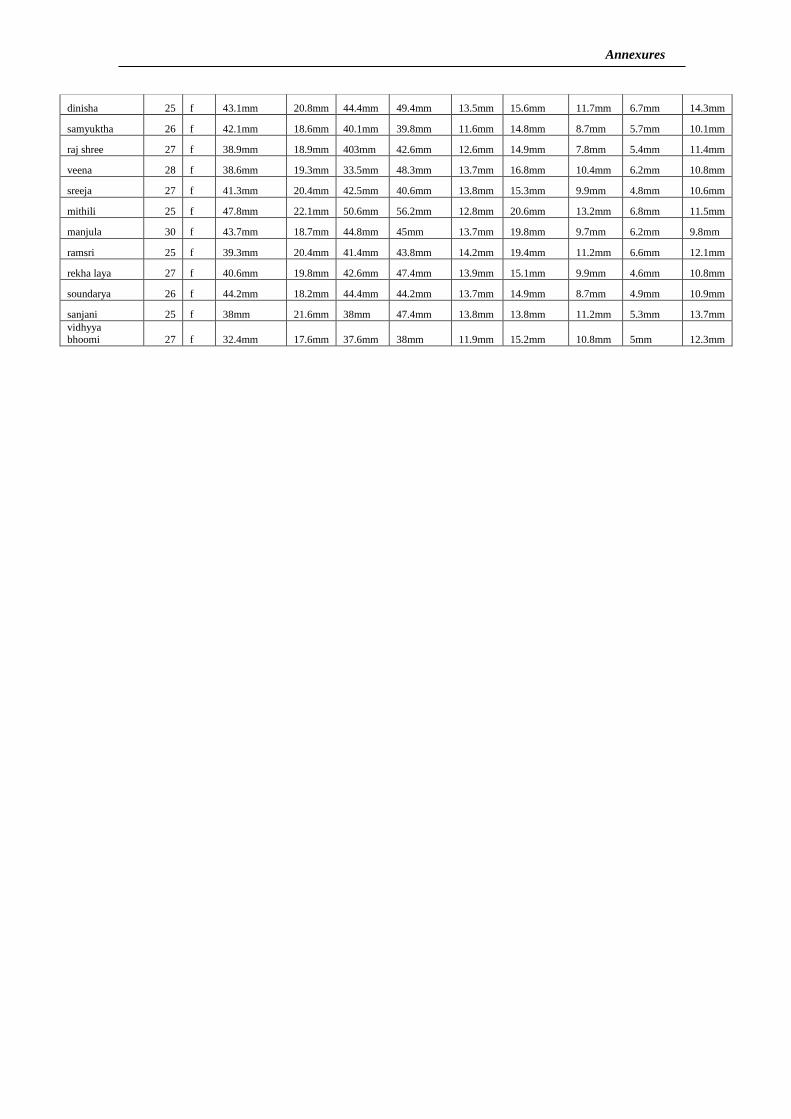
Annexures
dinisha 25 f 43.1mm 20.8mm 44.4mm 49.4mm 13.5mm 15.6mm 11.7mm 6.7mm 14.3mm
samyuktha 26 f 42.1mm 18.6mm 40.1mm 39.8mm 11.6mm 14.8mm 8.7mm 5.7mm 10.1mm
raj shree 27 f 38.9mm 18.9mm 403mm 42.6mm 12.6mm 14.9mm 7.8mm 5.4mm 11.4mm
veena 28 f 38.6mm 19.3mm 33.5mm 48.3mm 13.7mm 16.8mm 10.4mm 6.2mm 10.8mm
sreeja 27 f 41.3mm 20.4mm 42.5mm 40.6mm 13.8mm 15.3mm 9.9mm 4.8mm 10.6mm
mithili 25 f 47.8mm 22.1mm 50.6mm 56.2mm 12.8mm 20.6mm 13.2mm 6.8mm 11.5mm
manjula 30 f 43.7mm 18.7mm 44.8mm 45mm 13.7mm 19.8mm 9.7mm 6.2mm 9.8mm
ramsri 25 f 39.3mm 20.4mm 41.4mm 43.8mm 14.2mm 19.4mm 11.2mm 6.6mm 12.1mm
rekha laya 27 f 40.6mm 19.8mm 42.6mm 47.4mm 13.9mm 15.1mm 9.9mm 4.6mm 10.8mm
soundarya 26 f 44.2mm 18.2mm 44.4mm 44.2mm 13.7mm 14.9mm 8.7mm 4.9mm 10.9mm
sanjani 25 f 38mm 21.6mm 38mm 47.4mm 13.8mm 13.8mm 11.2mm 5.3mm 13.7mm
vidhyya bhoomi 27 f 32.4mm 17.6mm 37.6mm 38mm 11.9mm 15.2mm 10.8mm 5mm 12.3mm
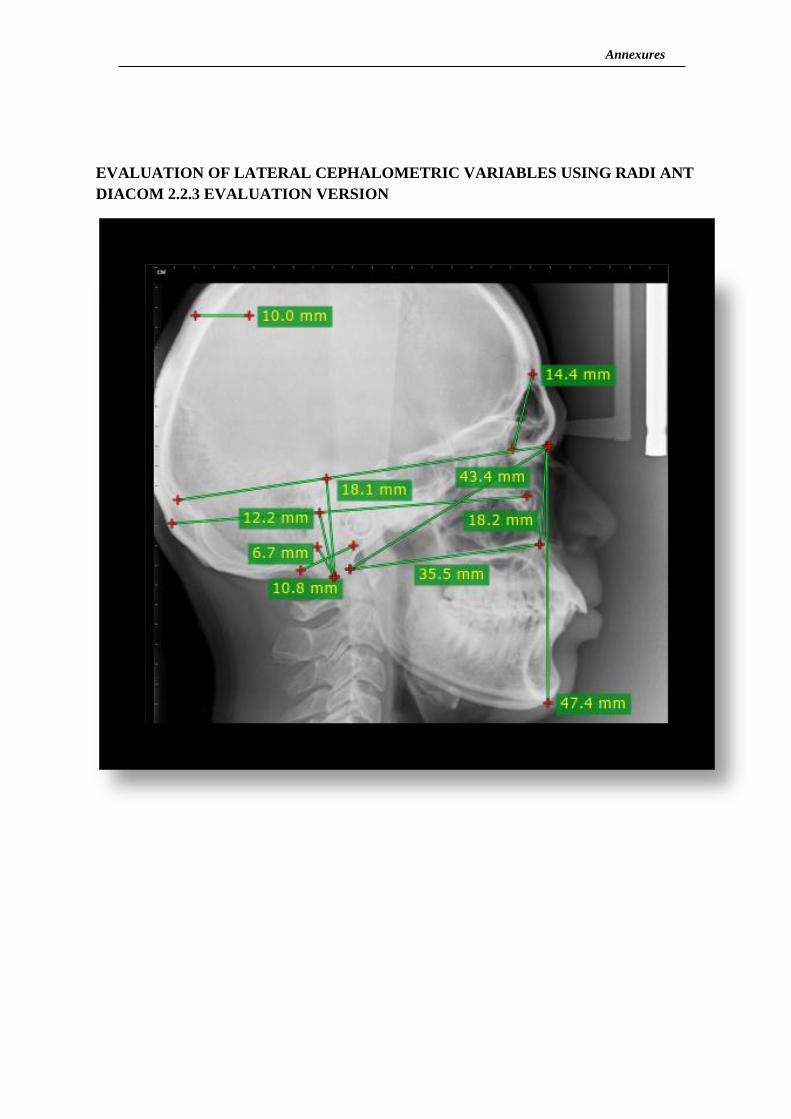
Annexures
EVALUATION OF LATERAL CEPHALOMETRIC VARIABLES USING RADI ANT
DIACOM 2.2.3 EVALUATION VERSION
Annexures
ANNEXURE -III