Tumor Treatment Response Based on Visual and Quantitative Changes in Global Tumor Glycolysis Using...
13
PII S1095-0397(99)00016-3 Clinical Positron Imaging Vol. 2, No. 3, 159–171. 1999 Copyright 1999 Elsevier Science Inc. Printed in the USA. All rights reserved. 1095-0397/99 $–see front matter ORIGINAL ARTICLE Tumor Treatment Response Based on Visual and Quantitative Changes in Global Tumor Glycolysis Using PET-FDG Imaging: The Visual Response Score and the Change in Total Lesion Glycolysis Steven M. Larson, MD, Yusuf Erdi, PhD, Timothy Akhurst, MD, Madhu Mazumdar, PhD, Homer A. Macapinlac, MD, Ronald D. Finn, PhD, Cecille Casilla, Melissa Fazzari, MS, Neil Srivastava, Henry W.D. Yeung, MD, John L. Humm, PhD, Jose Guillem, MD, Robert Downey, MD, Martin Karpeh, MD, Alfred E. Cohen, MD, Robert Ginsberg, MD Memorial Sloan-Kettering Cancer Center, New York, NY “Functional” tumor treatment response parameters have been developed to measure treatment induced biochemical changes in the entire tumor mass, using positron emission tomography (PET) and [F-18] fludeoxyglucose (FDG). These new parameters are intended to measure global changes in tumor glycolysis. The response parameters are determined by comparing the pre- and posttreatment PET-FDG images either visually from the change in image appear- ance in the region of the tumor, or quantitatively based on features of the calibrated digital PET image. The visually assessed parameters are expressed as a visual response score (VRS), or visual response index (VRI), as the estimated percent response of the tumor. Visual Response Score (VRS) is recorded on a 5 point response scale (0–4): 0: no response or progression; 1: 1–33%; 2: .33%–66%; 3: .66%–99%; and 4: .99%, estimated response, respectively. The quantitative changes are expressed as total lesion glycolysis TLG or as the change in TLG during treatment, also called dTLG or Larson-Ginsberg Index (LGI), expressed as percent response. The volume of the lesion is determined from the PET-FDG images by an adaptive thresholding technique. This response index is computed as, dTLG (LGI) 5 {[(SUV ave ) 1 * (Vol) 1 – (SUV ave ) 2 * (Vol) 2 ]/[(SUV ave ) 1 * (Vol) 1 ]} * 100. Where “1” and “2” denote the pre- and posttreatment PET-FDG, scans respectively. Pre- and posttreatment PET-FDG scans were performed on a group of 41 locally advanced lung (2), rectal (17), esophageal (16) and gastric (6) cancers. These patients were treated before surgery with neoadjuvant chemo-radiation. Four experienced PET readers determined individual VRS and VRI blinded to each other as well as to the clinical history. Consensus VRS was obtained based on a discussion. The interobserver variability captured by intraclass correlation coefficient was 89.7%. In addition, reader reliability was assessed for the categorized VRS using Kendall’s coefficient of concordance for ordinal data and was found to be equal to 85% This provided assurance that these response parameters were highly reproducible. The correlation of dTLG with % change in SUV ave and % change in SUV max , as widely used parameters of response, were 0.73 and 0.78 (P , .0001) respectively. The corresponding correlation of VRI were 0.63 and 0.64 (P , .0001) respectively. Both dTLG and VRI showed greater mean changes than SUV maximum or average (59.7% and 76% vs. 46.9% and 46.8%). We conclude that VRS and dTLG are substantially correlated with other response parameters and are highly reproduc- ible. As global measures of metabolic response, VRS, VRI and dTLG (LGI) should provide complementary information to more commonly used PET response parameters like the metabolic rate of FDG (MRFDG), or the standardized uptake value (SUV), that are calculated as normalized per gram of tumor. These findings set the stage for validation studies of the VRS and dTLG as objective measures of clinical treatment response, through comparison to the appropriate gold standards of posttreatment histopathology, recurrence free survival, and disease specific survival in well characterized populations of patients with locally advanced cancers. (Clin Pos Imag 1999;2:159–171) 1999 Elsevier Science Inc. All rights reserved. Key Words: PET; FDG; Glycolysis; Tumor Response; Tumor Metabolism. 159
-
Upload
independent -
Category
Documents
-
view
0 -
download
0
Transcript of Tumor Treatment Response Based on Visual and Quantitative Changes in Global Tumor Glycolysis Using...

PII S1095-0397(99)00016-3 Clinical Positron ImagingVol. 2, No. 3, 159–171. 1999
Copyright 1999 Elsevier Science Inc.Printed in the USA. All rights reserved.
1095-0397/99 $–see front matterORIGINAL ARTICLE
Tumor Treatment ResponseBased on Visual and Quantitative
Changes in Global Tumor GlycolysisUsing PET-FDG Imaging: The Visual Response
Score and the Change in Total Lesion GlycolysisSteven M. Larson, MD, Yusuf Erdi, PhD, Timothy Akhurst, MD, Madhu Mazumdar, PhD,
Homer A. Macapinlac, MD, Ronald D. Finn, PhD, Cecille Casilla, Melissa Fazzari, MS,Neil Srivastava, Henry W.D. Yeung, MD, John L. Humm, PhD, Jose Guillem, MD,
Robert Downey, MD, Martin Karpeh, MD, Alfred E. Cohen, MD, Robert Ginsberg, MDMemorial Sloan-Kettering Cancer Center, New York, NY
“Functional” tumor treatment response parameters have been developed to measure treatmentinduced biochemical changes in the entire tumor mass, using positron emission tomography(PET) and [F-18] fludeoxyglucose (FDG). These new parameters are intended to measureglobal changes in tumor glycolysis. The response parameters are determined by comparingthe pre- and posttreatment PET-FDG images either visually from the change in image appear-ance in the region of the tumor, or quantitatively based on features of the calibrated digitalPET image. The visually assessed parameters are expressed as a visual response score (VRS),or visual response index (VRI), as the estimated percent response of the tumor. VisualResponse Score (VRS) is recorded on a 5 point response scale (0–4): 0: no response orprogression; 1: 1–33%; 2: .33%–66%; 3: .66%–99%; and 4: .99%, estimated response,respectively. The quantitative changes are expressed as total lesion glycolysis TLG or as thechange in TLG during treatment, also called dTLG or Larson-Ginsberg Index (LGI), expressedas percent response. The volume of the lesion is determined from the PET-FDG images byan adaptive thresholding technique. This response index is computed as, dTLG (LGI) 5{[(SUVave)1 * (Vol)1 – (SUVave)2 * (Vol)2]/[(SUVave)1 * (Vol)1]} * 100. Where “1” and “2” denotethe pre- and posttreatment PET-FDG, scans respectively. Pre- and posttreatment PET-FDGscans were performed on a group of 41 locally advanced lung (2), rectal (17), esophageal(16) and gastric (6) cancers. These patients were treated before surgery with neoadjuvantchemo-radiation. Four experienced PET readers determined individual VRS and VRI blindedto each other as well as to the clinical history. Consensus VRS was obtained based on adiscussion. The interobserver variability captured by intraclass correlation coefficient was89.7%. In addition, reader reliability was assessed for the categorized VRS using Kendall’scoefficient of concordance for ordinal data and was found to be equal to 85% This providedassurance that these response parameters were highly reproducible. The correlation of dTLGwith % change in SUVave and % change in SUVmax, as widely used parameters of response,were 0.73 and 0.78 (P , .0001) respectively. The corresponding correlation of VRI were 0.63and 0.64 (P , .0001) respectively. Both dTLG and VRI showed greater mean changes thanSUV maximum or average (59.7% and 76% vs. 46.9% and 46.8%). We conclude that VRSand dTLG are substantially correlated with other response parameters and are highly reproduc-ible. As global measures of metabolic response, VRS, VRI and dTLG (LGI) should providecomplementary information to more commonly used PET response parameters like themetabolic rate of FDG (MRFDG), or the standardized uptake value (SUV), that are calculatedas normalized per gram of tumor. These findings set the stage for validation studies of theVRS and dTLG as objective measures of clinical treatment response, through comparison tothe appropriate gold standards of posttreatment histopathology, recurrence free survival, anddisease specific survival in well characterized populations of patients with locally advancedcancers. (Clin Pos Imag 1999;2:159–171) 1999 Elsevier Science Inc. All rights reserved.
Key Words: PET; FDG; Glycolysis; Tumor Response; Tumor Metabolism.
159

160 Clinical Positron Imaging, Volume 2, Number 3
longest survival; patients with partial response, inter-Introductionmediate survival; and patients with no response or pro-
The use of PET-FDG in oncology, for staging and gression, the shortest survival.3 It is perhaps surprising,diagnosis of suspected tumor recurrence is now given the sensitivity of radiographic methods, thatone of the most rapidly expanding areas in nu- there is such a good correlation between radiographic
clear medicine and indeed all of diagnostic imaging. response and patient treatment outcome. It seems thatThe application of PET-FDG to the differential diagno- radiographic methods accurately monitor a trend ofsis of the pulmonary nodule as well as the staging and response and this trend, either favorable or unfavor-detection of recurrence for lung and colorectal cancer able, may accurately predict patient outcome in manyare particularly important to clinical oncology.1 The clinical situations.value of the PET technique in detecting the presence It is evident that the evaluation of tumor responseof cancer in these situations is the result of the rapid by CT and other anatomic-based imaging methods canimprovements in sensitivity for detection of small vol- be confounded by numerous factors. These includeume tumor based on recent advances in PET imaging the situation where a tumor mass does not change ininstrumentation. size, despite death of tumor cells. In this case, fibrous
Positron emission tomography (PET) may have a tissue, edema of tissues as a direct treatment effect,special potential for accurate and rapid monitoring of may cause a persistent mass despite a histopathologiccancer treatment response, based on metabolic im- response. For these reasons, there are a number ofaging of changes in tumor metabolism. Our objective situations in which radiographic response does notin this paper, was to describe the conceptual develop- correlate well with treatment outcome. This is espe-ment and performance characteristics of two tumor cially true in regard to the persistent mediastinal massresponse parameters obtained with PET-FDG imaging, post-treatment with Hodgkin’s disease; in the esopha-the visual response score (VRS) and change in total geal and gastric cancers, where masses may persist de-lesion glycolysis, (dTLG) also called the Larson-Gins- spite other evidence of response. Another difficult areaberg Index (LGI). Unlike commonly used parameters is in bony involvement by tumor where non-specificof response, such as the Standardized Uptake Value bone changes on x-ray and bone scan can mask tu-(SUV), or the local glucose metabolic rate (LGMR), mor response.that are normalized per unit mass, our new parameters Differentiating edema and posttreatment scarringare intended to evaluate the global metabolic response from tumor persistence or recurrence is a commonof the entire lesion to treatment. problem in colorectal cancer, brain tumor and intra-
Measuring the response of tumors to anticancer ther- thoracic tumors. An additional problem with anatomicapy is most commonly done using radiographic proce- measures is the time it takes for the mass to changedures that provide images of anatomic changes that size when responding or progressing. This time canoccur during treatment. Chest x-ray, CT, MRI are be in the order of weeks to months. These relativelymodalities that are usually employed for response mea- slow changes can make clinical care difficult, especiallysurements. Typical response criteria include a com- if an ineffective and toxic therapy is being employed.plete response (CR), in which the tumor mass disap- The limitation of anatomic based imaging methodspears: PR, in which there is a greater than 50% for monitoring treatment response is well known andreduction in the product of the maximum two diame- has led to a search for alternatives. Advances in imagingters measured perpendicular to one another in the methods that are capable of quantitative assessment oftumor; minimal response, when the reduction in the biochemical features of tumors may offer importantproduct of two diameters is more than 75% but less clinical advantages. Examples of this type of functionalthan 50%; and stable disease, when the tumor reduc- imaging technology include magnetic resonance im-tion is 25% greater than baseline measurements.2 aging (MRI) and spectroscopy (MRS); PET, single pho-
Despite the recognized limitations of sensitivity for ton emission tomography (SPECT). There is a generalmeasuring the lower limit of tumor response in the view that these methodologies are at a point in theirtotal tumor mass, radiographic responses have been technical evolution as to be ripe for application tofound to be very useful clinically for defining prognosis clinical trials in oncology. The National Cancer Insti-of treated patients and for determining if a given treat- tute has issued a recent request for proposals, RFA Cament is effective. For example, in patients with non- 98-024 based on these ideas.small cell lung cancer (NSCLC), Gralla showed that In this regard, PET-FDG imaging seems to be a prom-patients with CT criteria for complete response had the ising functional modality for assessing tumor response.
Modern PET instruments have limits of detection forhuman tumor in clinical imaging that approach 7–10
Address correspondence to: S.M. Larson, MD, Memorial Sloan-Ketter- mm in diameter, or about 2.5 times the intrinsic PETing Cancer Center, Department of Nuclear Medicine, Room S212,1275 York Avenue, New York, NY 10021. detection resolution under optimal conditions of use.

Larson-Ginsberg Index: A PET Measure of Treatment Response/Larson et al. 161
Thus, the detection limits are similar to spiral CT, A histopathologic scoring system has been developedthat evaluates the degree of response of locally ad-although the regions of the body where PET imaging
is optimal is different. In general PET is less sensitive vanced tumor. This pathology score is based on thefollowing principle. After treatment, the tumor re-to small volume disease in the lung because of motion
degradation over the time required to capture the im- sponds by replacing dead tumor cells with fibrosis. Thefraction of the total tumor that has been replaced withages. On the other hand, PET can detect small volume
disease in lymph nodes, when spiral CT imaging is fibrous tissue is graded as the percentage response inthe tumor.35negative. But PET combines this resolution with the
ability to assay biochemical properties of tumors. For The ultimate correlation for any assessment of re-sponse, including this histopathologic scoring system,example, although FDG imaging of the accelerated
glycolysis of tumors is the most commonly applied clini- is the ability to predict progression free survival timeand disease specific survival time. Obviously, the pres-cally, positron emitting radiotracers that are applicable
to assessing additional key metabolic processes of tu- ence of residual tumor, means that response is incom-plete. The pathologic scoring system is as follows: 0)mors have been recently developed. These include la-
beled amino acids and nucleosides and these will un- no response or progression; 1) 1–33% response; 2).33%–66% response; 3) .66%–99% response; anddoubtedly be applied more extensively for imaging
important biochemical features of tumors in the near 4) .99% response, respectively. In lung cancer, wherethis histopathologic scoring system has been evaluatedfuture. We can expect that detection limits will get ever
smaller, as PET resolution improves below the current most thoroughly, this concept seems to hold up well,and the complete responders have a long recurrence-range of 3.5 mm for modern BGO based systems, down
to 1–2 mm resolution that is possible with current ex- free survival. Also, a preliminary study in 80 patientsundergoing a neoadjuvant protocol in locally advancedperimental LSO systems.4
Thus, positron emission tomography (PET) seems rectal cancers, showed a good correlation between dis-ease-specific survival time and response score (D. Klim-to have special potential for providing a more accurate
and rapid method for monitoring cancer treatment stra, personal communication).Thus, histopathologic scoring will likely give us im-response in the clinical situations where changes in
the anatomic features of the mass do not track with portant response information in the setting of locallyadvanced cancers treated with a neoadjuvant presurgi-the response of the tumor cells within the mass. PET
relies on the metabolism of viable cells within the tu- cal protocol, but even pathology must be considereda somewhat imperfect gold standard. The best goldmor mass, to produce its images. In so far as the meta-
bolic marker is tumor cell specific, the PET image will standard, is the outcome of the patient, including timeto disease-specific survival time and progression freereflect the metabolic status of the treated tumor. Thus
sequential tumor uptake of a metabolic tracer as mea- survival.Based on these considerations, we have formulatedsured by PET can in principle provide a quantitative
response parameter that reflects a treatment induced a hypothesis, that global changes in tumor metabolismas measured by PET-FDG scanning will be the optimalbiochemical change in the sensitive tumor. Because
the response to treatment is a killing of cells, an ideal method for evaluating tumor treatment response inthe clinical setting because a metabolic change in thePET method would also accurately reflect the number
of viable cells present in the tumor posttreatment over tumor is less likely to be confounded by extraneousfactors that make treatment response problematic bymultiple decades of cell-kill.
Histopathologic assessment of tumor response re- anatomic based methods. The development of VRSand dTLG sets the stage for testing this hypothesis ofmains an important standard against which diagnosticclinical response in locally advanced cancers. PET-FDGimaging methods must be compared. The advantageVRS and dTLG should provide practical clinical param-of histopathologic examination is resolution, so thateters with pathologic assessment as well as the ultimatein principle, even a few cells are detectable in the post-gold standards of recurrence free survival time andtreatment specimen. Of course, sampling error of adisease specific survival time. If successful, these globalmass may miss a few residual cells in a small volumemethods for metabolic changes in tumors during treat-biopsy post treatment. In some cases, the entire tumorment could be applied to other metabolic PET tracersis removed after treatment, and so a thorough evalua-as well.tion of the tumor can be made to search for residual
cancer cells. A complete tumor specimen is normallyavailable after neoadjuvant treatment protocols are
Materials and Methodsused. In patients with locally advanced cancers. theseprotocols are becoming very popular to reduce the Patientssize of the tumor mass and to downstage the tumor ifpossible, before surgery.5 The posttreatment specimen Patients with locally advanced aerodigestive tract tu-
mors were studied with PET, before and after neo-includes the entire tumor, and is removed at surgery.
162 Clinical Positron Imaging, Volume 2, Number 3
adjuvant presurgical treatment. A total of 41 patients post-treatment scan, compared to the total lesion gly-were studied, with locally advanced malignancies. The colysis in the pre-treatment scan. The calculations arepatients had in common that they were patients under- based on the volume derived from the PET, and thegoing neoadjuvant treatment before definitive surgical average SUV. The computation was then made ac-resection. These patients were all patients who had cording to the following formula:undergone pre- and posttreatment PET scans for lo-
dTLG(LGI) 5 {[(SUVave)1 * (Vol)1 2 (SUVave)2cally advanced solid tumors with esophageal cancer,rectal cancer, gastric cancer and lung cancer, between * (Vol)2]/[(SUVave)1 * (Vol)1]} * 100 .January 1997 and October 1998 at Memorial Sloan-
Where the subscripts “1” and “2” denote the pre-treat-Kettering Cancer Center (MSKCC). The patients in-ment and the post-treatment PET-FDG, scans respec-cluded 17 patients with rectal cancer; 16 patients withtively.esophageal cancer; 6 patients with gastric cancer; and
For derivation of the formula, see Appendix.2 patients with lung cancer.PET images were performed as follows: 2-fluoro-
2-deoxy-D-glucose (FDG) was prepared using standard Visual Response Score (VRS)procedures in the MSKCC Radiochemistry/Cyclotron
The visual change in the response of tumors to treat-CORE facility. The FDG was provided in sterile salinement was assessed by comparing pretreatment andfor injection, according to USP standards. After bloodposttreatment scans. The following visual grading sys-glucose was drawn, the patient received 10 mCi of FDGtem was employed:intravenously, and at about 45 minutes after injection,
the patient underwent whole body imaging, using the Zero: no evidence of treatmentGE ADVANCE PET scanner.7 Data was routinely col- effect, or progressionlected from the lower neck to pubic symphisis, with
11: , or 5 33% of tumor massalternating emission and transmission images of 6 andwith Rx effect4 minutes each. After reconstruction, the images were
21: . 33% to .66% of tumoranalyzed for visual response score, and the pet volumemass with Rx effectand LGI was determined (see below). A total of 82
31: . 66% of tumor mass withscans were included for analysis among the 41 patients,Rx effectand only the primary was evaluated for response. In
41: Rx effect in all of the tumor;addition, standardized uptake values were also com-uptake is gone, CR.puted (see below). Within a region, the GE ADVANCE
software computes SUVmaximum. SUVaverage was computed This grading scheme was used because it correlatedby placing a region of interest within the perimeter of with a commonly used pathologic grading system devel-the tumor region seen on the tumor slice containing oped by our colleagues.6 In addition, the response indexthe SUVmaximum. (VRI) was also recorded as the best subjective estimate
of % change, and this was recorded independently.Measurement of Volumes Interobserver variation was determined by indepen-
dent reading of 4 observers, who were trained in nu-Based on the PET-FDG Uptakeclear medicine. Grading was accomplished, on inde-In a method developed by Erdi et al., the volume can bependent grading sheets that was collected by theestimated on PET scan based on an empirical approachnuclear medicine data manager, before a consensusthat computes the volume from the quantitative infor-grading that was then achieved among the 4 reviewers.mation in the tumor. For details of this volumetric
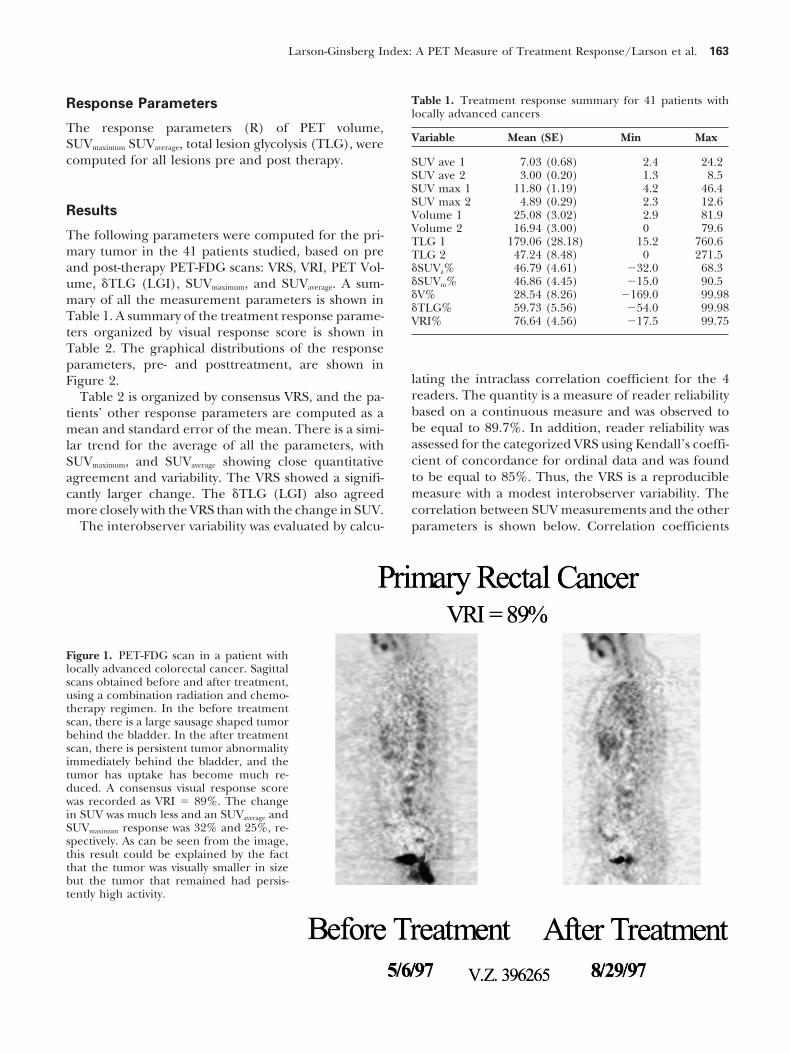
Examples of the appearance of typical images areapproach, see reference.8 Basically, if the tumor toillustrated in Figure 1 for locally advanced rectal cancer.background ratio is greater than 3:1, the area can beThe VRI was 89%, indicating a major response. Theaccurately determined in a tomographic section of thepre- and posttreatment images were displayed on thetumor, by applying a threshold that is 40% of the maxi-same monitor, and the projection that showed the tu-mum value in the region. These thresholded areas,mor most completely, along its entire length, was cho-are then multiplied by the number of slices and thesen for analysis. Because the rectal cancer and thethickness of the slices (4.3 mm), to determine the totalesophageal cancers tend to elongate along the axis ofvolume of the tumor.the body, sagittal views were used for the treatmentcomparison. The best estimate of % change was ob-Calculation of the Changetained by panning through all the image sections thatin Total Lesion Glycolysis (dTLG): contained the tumor, in both the pretreatment and
The Larson-Ginsberg Index (LGI) the posttreatment image. A similar approach was takenfor the esophageal, lung and gastric cancers in thisThe dTLG (LGI) was calculated as the response score
based on a change in the total lesion glycolysis in the study.
Larson-Ginsberg Index: A PET Measure of Treatment Response/Larson et al. 163
Table 1. Treatment response summary for 41 patients withResponse Parameterslocally advanced cancers
The response parameters (R) of PET volume,Variable Mean (SE) Min MaxSUVmaximum SUVaverage, total lesion glycolysis (TLG), were
computed for all lesions pre and post therapy. SUV ave 1 7.03 (0.68) 2.4 24.2SUV ave 2 3.00 (0.20) 1.3 8.5SUV max 1 11.80 (1.19) 4.2 46.4SUV max 2 4.89 (0.29) 2.3 12.6
Results Volume 1 25.08 (3.02) 2.9 81.9Volume 2 16.94 (3.00) 0 79.6The following parameters were computed for the pri- TLG 1 179.06 (28.18) 15.2 760.6
mary tumor in the 41 patients studied, based on pre TLG 2 47.24 (8.48) 0 271.5and post-therapy PET-FDG scans: VRS, VRI, PET Vol- dSUVa% 46.79 (4.61) 232.0 68.3
dSUVm% 46.86 (4.45) 215.0 90.5ume, dTLG (LGI), SUVmaximum, and SUVaverage. A sum-dV% 28.54 (8.26) 2169.0 99.98mary of all the measurement parameters is shown indTLG% 59.73 (5.56) 254.0 99.98
Table 1. A summary of the treatment response parame- VRI% 76.64 (4.56) 217.5 99.75ters organized by visual response score is shown inTable 2. The graphical distributions of the responseparameters, pre- and posttreatment, are shown in
lating the intraclass correlation coefficient for the 4Figure 2.readers. The quantity is a measure of reader reliabilityTable 2 is organized by consensus VRS, and the pa-based on a continuous measure and was observed totients’ other response parameters are computed as abe equal to 89.7%. In addition, reader reliability wasmean and standard error of the mean. There is a simi-assessed for the categorized VRS using Kendall’s coeffi-lar trend for the average of all the parameters, withcient of concordance for ordinal data and was foundSUVmaximum, and SUVaverage showing close quantitativeto be equal to 85%. Thus, the VRS is a reproducibleagreement and variability. The VRS showed a signifi-measure with a modest interobserver variability. Thecantly larger change. The dTLG (LGI) also agreedcorrelation between SUV measurements and the othermore closely with the VRS than with the change in SUV.
The interobserver variability was evaluated by calcu- parameters is shown below. Correlation coefficients
Figure 1. PET-FDG scan in a patient withlocally advanced colorectal cancer. Sagittalscans obtained before and after treatment,using a combination radiation and chemo-therapy regimen. In the before treatmentscan, there is a large sausage shaped tumorbehind the bladder. In the after treatmentscan, there is persistent tumor abnormalityimmediately behind the bladder, and thetumor has uptake has become much re-duced. A consensus visual response scorewas recorded as VRI 5 89%. The changein SUV was much less and an SUVaverage andSUVmaximum response was 32% and 25%, re-spectively. As can be seen from the image,this result could be explained by the factthat the tumor was visually smaller in sizebut the tumor that remained had persis-tently high activity.
164 Clinical Positron Imaging, Volume 2, Number 3
Table 2. Tumor response parameters organized by VRS
VRS FREQ VRI% dV% dSUVm% dSUVa% dTLG%
0&1 4 3.1 (8.7) 27.3 (25.9) 0.6 (5.5) 0.2 (10.9) 21.9 (17.8)2 5 52.1 (4.7) 25.7 (13.5) 35.3 (5.7) 36.6 (5.2) 51.9 (10.2)3 28 88.3 (1.7) 31.1 (10.5) 52.7 (4.6) 52.9 (4.8) 66.6 (5.7)4 4 99.1 (0.3) 50.2 (29.1) 66.7 (17.7) 62.7 (18.1) 82.7 (8.9)
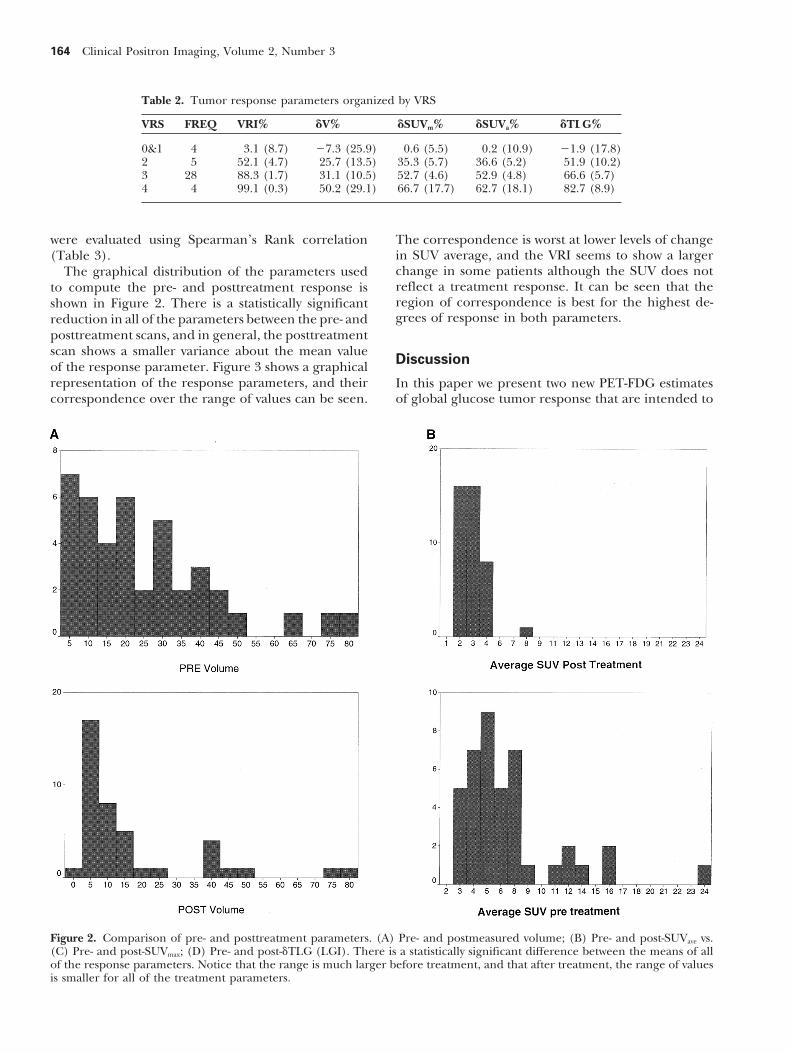
were evaluated using Spearman’s Rank correlation The correspondence is worst at lower levels of changein SUV average, and the VRI seems to show a larger(Table 3).change in some patients although the SUV does notThe graphical distribution of the parameters usedreflect a treatment response. It can be seen that theto compute the pre- and posttreatment response isregion of correspondence is best for the highest de-shown in Figure 2. There is a statistically significantgrees of response in both parameters.reduction in all of the parameters between the pre- and
posttreatment scans, and in general, the posttreatmentscan shows a smaller variance about the mean value
Discussionof the response parameter. Figure 3 shows a graphicalrepresentation of the response parameters, and their In this paper we present two new PET-FDG estimates
of global glucose tumor response that are intended tocorrespondence over the range of values can be seen.
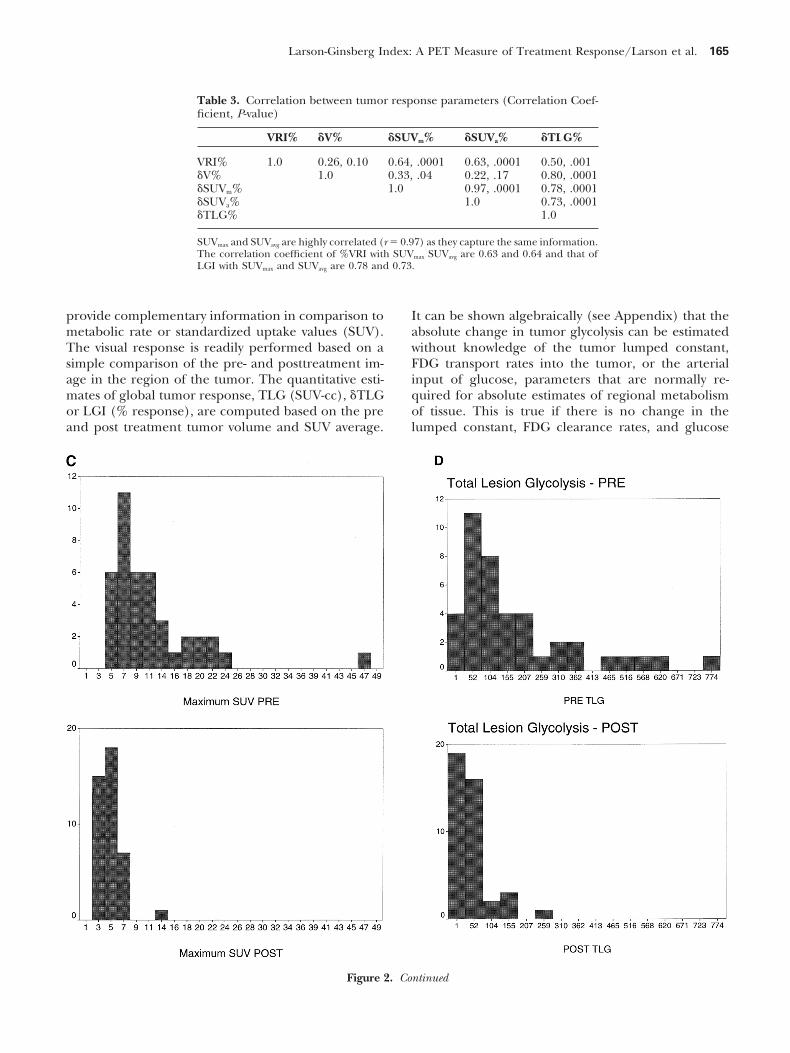
Figure 2. Comparison of pre- and posttreatment parameters. (A) Pre- and postmeasured volume; (B) Pre- and post-SUVave vs.(C) Pre- and post-SUVmax; (D) Pre- and post-dTLG (LGI). There is a statistically significant difference between the means of allof the response parameters. Notice that the range is much larger before treatment, and that after treatment, the range of valuesis smaller for all of the treatment parameters.
Larson-Ginsberg Index: A PET Measure of Treatment Response/Larson et al. 165
Table 3. Correlation between tumor response parameters (Correlation Coef-ficient, P-value)
VRI% dV% dSUVm% dSUVa% dTLG%
VRI% 1.0 0.26, 0.10 0.64, .0001 0.63, .0001 0.50, .001dV% 1.0 0.33, .04 0.22, .17 0.80, .0001dSUVm% 1.0 0.97, .0001 0.78, .0001dSUVa% 1.0 0.73, .0001dTLG% 1.0
SUVmax and SUVavg are highly correlated (r 5 0.97) as they capture the same information.The correlation coefficient of %VRI with SUVmax SUVavg are 0.63 and 0.64 and that ofLGI with SUVmax and SUVavg are 0.78 and 0.73.
provide complementary information in comparison to It can be shown algebraically (see Appendix) that theabsolute change in tumor glycolysis can be estimatedmetabolic rate or standardized uptake values (SUV).
The visual response is readily performed based on a without knowledge of the tumor lumped constant,FDG transport rates into the tumor, or the arterialsimple comparison of the pre- and posttreatment im-
age in the region of the tumor. The quantitative esti- input of glucose, parameters that are normally re-quired for absolute estimates of regional metabolismmates of global tumor response, TLG (SUV-cc), dTLG
or LGI (% response), are computed based on the pre of tissue. This is true if there is no change in thelumped constant, FDG clearance rates, and glucoseand post treatment tumor volume and SUV average.
Figure 2. Continued
166 Clinical Positron Imaging, Volume 2, Number 3
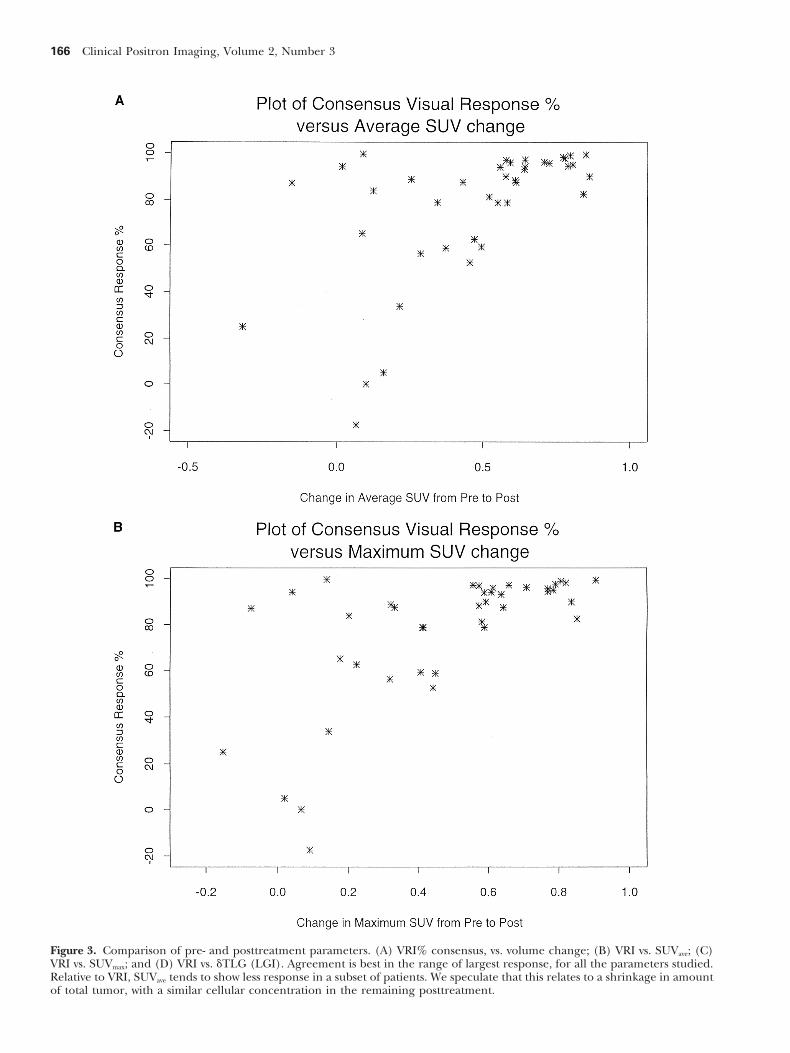
Figure 3. Comparison of pre- and posttreatment parameters. (A) VRI% consensus, vs. volume change; (B) VRI vs. SUVave; (C)VRI vs. SUVmax; and (D) VRI vs. dTLG (LGI). Agreement is best in the range of largest response, for all the parameters studied.Relative to VRI, SUVave tends to show less response in a subset of patients. We speculate that this relates to a shrinkage in amountof total tumor, with a similar cellular concentration in the remaining posttreatment.

Larson-Ginsberg Index: A PET Measure of Treatment Response/Larson et al. 167
concentration, between scan 1 and scan 2. This mea- and cellular elements, that do not respond uniformlyto treatment. As an ideal, a biochemical measure, likesurement of the reduction in tumor metabolism be-glycolysis, that measures a metabolic signal like FDGtween pre and post treatment is based on an approachuptake that is based primarily on the metabolism ofthat was originally developed by Phelps et al., for evalu-the tumor cells themselves, may respond more selec-ating changes in regional myocardial metabolism be-tively and occur more rapidly than CT measurementtween the fed and fasting state.9 A novel feature ofof tumor mass anatomy. The biochemical change inthe current method is the incorporation of a volumethe mass may predict treatment response. The totalestimate, to transform the assay of metabolic changeglycolysis change should correlate best with a changefrom a regional (i.e., per gram), to a global measurein the surviving fraction of tumor cells present in the(i.e., per tumor mass). For this purpose, the tumorentire tumor mass. This was our rationale for devel-volume is estimated according to the method of Erdioping and characterizing two new measures of globalet al., that is based on an adaptive PET image thresh-biochemical change of the tumor cells in the mass toolding technique.8
treatment, the VRS and the LGI.Both the visual and the calculated response parame-Before treatment, the volume of tumors in our seriesters assess global response of metabolism to tumor,
was estimated to be between 7,000–40,000 mg. Thisthat we hypothesize, is proportional to a change inamounts to about 7–40 3 109 cells at baseline. Withviable cellular mass during treatment.the GE Advance, we estimate that we can probablydetect as little as 300 mg of residual tumor, that con-
Relationship of a Change in Tumor Cell tains about 3 3 108 cells. Thus, in the majority ofNumber to Treatment Response and the cancers that we have studied, it should be possible toChange in Total Glycolysis in a Tumor Mass readily measure 98% to 99% reduction in the cellular
mass of tumor. In fact, in this group of patients, weTumor response to chemotherapy and radiation is afound that despite an intensive regimen of therapy,function of the amount of tumor cells present that arethe majority of treatment response must have beensensitive to the treating agent. Simply stated, for a given considerably less than that. Only 4 out of 41 locally
dose of treatment, large tumors are less likely to be advanced patients seemed to have a maximum measur-totally killed than small tumors. In fact, for both che- able response, were there was no detectable tumor atmotherapy and radiation therapy, the log of the surviv- the site of previous PET scan abnormalities.ing fraction of a homogeneous population of sensitivetumor cells is a linear function of treatment dose.
FDG Uptake in TumorsThe initial principles on which chemotherapy isbased were developed by Skipper et al., working with There is a general consensus in the literature that un-L1210 leukemia model.10 Skipper found that a single der a variety of normal growth conditions in tissuecell, inoculated into a receptive mouse, doubled every culture, (i.e., with adequate nutrients and oxygen-12 hours and that this was enough to achieve a lethal ation), that the uptake of FDG is a linear function ofpopulation of tumor cells (109 cells) in about 19 days. the number of viable cancer cells present. Each cancerUsing this model, Skipper found that chemotherapy cell seems to have a characteristic rate of glucose me-that would kill 99.999% of these tumors, a 5 log kill, tabolism.11 Similar finding have been observed in vivo,was effective at tumor control, only if the tumor cell in autoradiographic sections.12 In human astrocytoma,number present at the time of treatment was small, the level of FDG uptake was found to correlate withsay 104 cells. From these ideas, the concept of “log-kill” cellular density.13
and “tumor control probability” evolved. In this case PET-FDG scanning of tumors traces its origins tofor example, the chance that the tumor will recur early animal studies by Som et al.,14 and Larson et al.,15,16
would be only about 0.1. If the chemotherapy dose that showed excellent uptake of FDG in animal tumors.were increased to be sufficient for a 6 log kill, the tumor This uptake is due to a characteristic phenotype ofcontrol probability would only be .01, and so forth. malignant metabolism17 that leads to an increase in
In principle, the best assessment of treatment glycolysis, as well as other aspects of metabolism, in-change in the tumor, would involve an assessment of cluding nucleic acid and amino acid transport.the reduction in the sensitive tumor cells within the PET-FDG has been used for nearly 17 years in theentire tumor mass, and this result could be expressed study human tumors. The initial human studies in on-as a surviving fraction of the original pretreatment cology were performed in brain tumors by Di Chirotumor mass. CT or other anatomic measures, measure et al.18 This group of investigators realized that thethe total tumor mass, but shrinkage of the mass is slow major value of PET-FDG studies was in the biologicto occur, even in responding tumors. Perhaps this is characterization of the tumors. The degree of uptake
of FDG was a good predictor of Grade of tumor,19,20because some tumors, consist of a mixture of stroma
168 Clinical Positron Imaging, Volume 2, Number 3
and accurately provided the differential diagnosis of a mass specific rate of metabolism, as “mg/min/100gm,” for example.tumor recurrence versus radiation necrosis.21 PET-FDG
scanning detected malignant degeneration of low The LMRG in tumors can in principle be measuredwith PET-FDG scanning, provided that the arterial in-grade gliomas with transformation to high grade,22 and
also predicted that meningioma tumors were likely to put function is known and that a correction factorfor differences in the metabolism of FDG and naturalrecur.23 PET-FDG scanning also was highly accurate in
predicting prognosis after treatment.24 glucose can be determined. This correction factor iscalled the “lumped constant,”30 and in normal brainThe gray matter of the brain is one of the few normal
structures that tends to be more avid for glucose than tissue, where it has been determined in humans, it isapproximately 0.54, that is FDG is metabolized aboutneoplasm. In the earliest studies, the parameter that
was used to assess active brain tumor was the uptake 54% as efficiently as glucose, by brain tissue. For tu-mors, however, this relationship varies, and althoughof FDG in the tumor in comparison to normal brain
structures, particularly the white matter. Gliomas arise the average lumped constant is about 1, each tumormay have its unique “lumped constant.”33 The two pa-from the white matter of the brain, and in general,
the lower grade tumors are slightly more glucose avid, rameters of global metabolism that we have proposed,have the advantage that the lumped constant need notand the higher grade tumors are much more glucose
avid, than white matter. The relative uptakes were de- be known because this parameter cancels out in thecomparisons of pre- and posttreatment FDG-PET scan-termined both visually and quantitatively, by a simple
ratio of the concentration on the attenuation corrected ning. There is the assumption that the lumped constantin the pretreatment and posttreatment state, is un-PET scan in the region of interest containing tumor.
For example, in treated tumors, if the maximum up- changed.Because of the difficulty of obtaining an arterial in-take in a region of interest over tumor was greater
than 1.4 times the uptake over the contralateral white put function on each patient, an alternative method ofrelative quantification was developed. These methods,matter, the patient’s prognosis was poor.24 Numerous
investigators have confirmed this work, in regard to called the differential uptake value, or DUR,34 or thestandardized uptake value or SUV, have found widethe prognostic and the biologic predictions of PET-
FDG scanning in malignant brain tumors. The quanti- acceptance because of their convenience. These meth-ods are based on the concentration in tissues, correctedtative findings, including cut-off thresholds values of tu-
mor uptake relative to normal brain structures, have also for the amount injected and the body weight.35 In thisway, at somatic tumor sites, the SUV reduces individualbeen confirmed by other investigators as well.25,26,27,28
It can be argued that these ratios, that depend on variability by accommodating for some of the normaldifferences between individuals in much the same wayrelative concentrations per gram in tumor and normal
structures, have the virtue of normalizing for changes as concentration ratios between two distinct glucoseavid tissues do in the case of brain tumors.in blood glucose levels from patient to patient, as well
as differences in administered dose and volumes of Where it has been studied systematically, the SUVand the local metabolic rate of FDG in tumors aredistribution based on differences in individual pa-
tients’ weight and blood volume. highly correlated, as we would expect from the deriva-tion in the Appendix. In a series of 47 patients withSoon after brain tumors were studied with FDG, so-
matic tumors, were also shown to be highly glucose sarcoma, Eary et al.36 found that there was a linearcorrelation of 0.94 between the metabolic rate determi-avid. Initial studies were done with colorectal cancer
metastases.29 The use of PET-FDG in somatic tumors, nation for FDG and the SUV, determined in a mannerthat normalizes for plasma glucose level.both for staging and diagnosis suspected recurrence
is now one of the most rapidly expanding areas of The SUV measurement has been studied extensivelyin common human tumors such as lung cancer, andnuclear medicine.1
a variety of minor modifications have been used toimprove the accuracy of this quantitative measure forApproaches to Quantitativetruly characterizing malignant lung cancer in compari-Evaluation of Regional Glucose Metabolism son to benign normal tissue in the setting of the patientsuspected of having lung cancer. For example, leanFrom the point of view of monitoring response to ther-
apy, quantitative assessment of tumor metabolism is body mass, total body mass, average SUV over the mass,and maximum SUV have all been shown to have highlyhighly desirable. Based on an early foundation of re-
gional cerebral glucose utilization, quantitative studies effective data analysis methods in PET-FDG scanning.In 120 malignant lesions and 77 benign process identi-were used following the methods introduced by Soko-
loff,30 and as applied to human studies.31,32 This method fied by biopsy, receiver operating characteristic curves(ROC) curves showed that the weighted average SUVrequires arterial blood sampling to determine an input
function. The data obtained is normally expressed as was slightly superior to other approaches in terms of
Larson-Ginsberg Index: A PET Measure of Treatment Response/Larson et al. 169
area under the ROC curve, as a measure of test accuracy to assess global changes in metabolism that are likelyto correlate better with the total change in cell mass,for distinguishing benign from malignant disease.37
As a number of authors have pointed out, these SUV a very important factor in tumor response to therapy.We have determined the interobserver variability of ameasurements must be carefully performed to avoid
pitfalls. For example, there is an element of individual- visual response score. Blinded readings are found toity to the measurement in the SUV such that SUV may be in substantial agreement. Evaluation of these twobe overestimated in obese subjects, because there is new parameters in comparison to pathologic assess-relatively more % body fat contributing to weight. Also, ment of response as well as progression-free survival isif one SUV measure is to be compared to another in ongoing in a group of patients with locally advancedthe same patient, it is important that the timing of aerodigestive tract tumors.the SUV measurements, in relationship to the time ofinjection, be as nearly identical as possible.
With proper attention to detail of performance, the AppendixSUV would seem to be a good surrogate for a determi-
Rationale and Derivation of thenation of tumor metabolic rate of glucose. QuantitativeLarson-Ginsberg Index (LGI), aanalysis of solid tumors, using the SUV, should give usMeasure of Tumor Response, Based ona parameter that will predict biologic behavior of solidthe Treatment-Induced Change in Pretreatmenttumors, in much the same way as PET-FDG imaging
of brain tumor based largely on tumor/brain ratios has vs. Posttreatment Glycolysis in the Entire Tumorpredicted biologic features of prognosis and response.
FDG is a tracer for glucose metabolism, the approxi-Data is beginning to accumulate that as for brainmate metabolic rate of glycolysis30 can be shown to betumors, PET-FDG imaging will provide useful biologicrelated to FDG uptake on PET scanning as (Equa-information and predict prognosis in somatic tumors.tion 1):For example, there is an excellent correlation between
FDG uptake and tumor stage in sarcoma,38,39 lung tu- MR1(T) 5 K[Glu] * Ct/A1 (1)mor growth rate,40 and prognosis in esophageal can-
where MR1(T) is the metabolic rate in tissue at timecer,41 as well as prognosis in head and neck cancer.42
“1”; usually expressed as mmol per minute per 100PET-FDG scanning can assist in the differential diagno-grams of tissue; Ct 5 the tissue concentration of [F-18];sis of benign and malignant lung masses, based on theK 5 a specific constant that relates glucose metabolismconcept that malignant tissue generally has a higherand FDG metabolism; [Glu] 5 serum glucose concen-metabolism than benign tissue.43
tration; and A1 5 cumulated amount of FDG tracer inthe blood clearance curve (the arterial input).
PET-FDG Studies of Tumor Response Phelps and associates,9 noted that in principle, Equa-tion 1 can be used as the basis for comparing metabo-In addition, FDG reduction accurately separated re-lism of a given tissue in different clinical states, (forsponders from non-responders in patients with hepato-example states 1 and 2), provided that care was takencellular metastases of colorectal cancer.44 Moreover,to ensure that (Equation 2):PET-FDG provides information about response earlier
than CT in patients with advanced breast cancer.45 [Glu]1 5 [Glu]2; A1 5 A2. (2)FDG-PET metabolic rate at 42 days after therapy was
All of the constants that are lumped together as “K”the best predictor of long term response in non-Hodg-should also be unvarying, and so the ratio of metabo-kin’s lymphoma.46
lism in states 1 and 2, MR1/MR2 can be determinedfrom the ratio of the tissue concentrations of FDG inmicrocuries per gram of tissue. Using this approach,
Summary Phelps et al.9 determined that the myocardial MR inthe non-fasting state was 2.8 times the rate of glycolysisWe studied 41 patients with locally advanced aerodiges-
tive tract tumors using PET-FDG imaging, using attenu- in the fasting state.As a practical matter, the metabolic rate of individualation corrected whole body images obtained before
and after chemoradiation therapy. Currently used, tumor sites is normally not measured directly as a glu-cose metabolism rate because this evaluation requiresmass specific measures of tumor metabolism such as
SUV and metabolic rate estimates of uptake of FDG the determination of timed arterial blood concentra-tions of FDG glucose. Moreover, the absolute value ofare useful parameters for predicting tumor biology.
We have developed two new response parameters that the lumped constants “K” is not known with certainty.Various quantitative measures are easily available frommay be more suited to measurement of tumor re-
sponse, the VRS and the LGI. These parameters seek PET scanning, however, and one such measurement
170 Clinical Positron Imaging, Volume 2, Number 3
Perry, M.C., eds. Comprehensive textbook of thoracic on-is the concentration in individual tumors (usually incology. Baltimore: Williams & Wilkins;1996: 112.nCi/gram), or a similar measure of concentration in
3. Gralla, R.J. Preoperative and adjuvant chemotherapy intissues, normalized to the injected dose and the weightnon-small cell lung cancer. Semin. Oncol. 15(Suppl):of the patient. One such commonly used value is8–12; 1988.termed the standardized uptake value or “SUV.” The
4. Phelps, M.E.; Cherry, S.R. The changing design of posi-SUV is defined as (Equation 3):tron imaging systems. Clin. Pos. Imag. 1:31–46; 1998.
5. Rusch, V.W.; Albain, K.S.; Crowley, J.J.; et al. Neo-adjuvantSUV 5
(decay corrected dose/cc of tumor)(injected dose/patient weight in grams)
. (3) therapy: A novel and effective treatment for state IIIb non-small cell lung cancer. Ann. Thorac. Surg. 58:290–295;
The SUV measurement is a dimensionless number, 1994.6. Rusch, V.; Klimstra, D.; Vendatraman, E.; et al. Aberrantand will be 1, if there is uniform distribution through-
p53 expression predicts clinical resistance to Cisplatin-out the body region being sampled. In effect the SUVbased chemotherapy in locally advanced non-small cellvalue by itself can be thought of as a normalized uptakelung cancer. Cancer Res. 55:5038–5042; 1995.value, reflecting the relative concentration per gram
7. DeGrado, T.R.; Turkington, T.G.; Williams, J.J.; Stearns,of tissue in relationship to the uniform concentrationC.W.; Hoffman, J.M.; Coleman, R.E. Performance charac-that occurs based on passive diffusion throughout theteristics of a whole-body PET scanner. J. Nucl. Med.normal extracellular fluid space of the body.35 More- 35:1398–1406; 1994.
over, the SUV is proportional to Ct.47 We can write this 8. Erdi, Y.E.; Mawlawi, O.; Larson, S.M.; et al. Segmentationrelationship as (Equation 4): of lung lesion volume by adaptive PET image thresh-
olding. Cancer 80(Suppl 12):2505–2509; 1997.SUVaverage 5 K2 * Ct,average * [Glu] (4)9. Phelps, M.E.; Hoffman, E.J.; Selin, C.; et al. Investigation
where K2 is a constant that defines the body composi- of [F18]-fluoro-2-deoxyglucose for the measurement ofmyocardial glucose metabolism. J. Nucl. Med. 19:1311–tion and relative dose injected.1319; 1978.
10. Skipper, H.E.; Schabel, Jr., F.M.; Wilcox, W.S. Experimen-Defining the Total Lesion Glycolysis tal evaluation of potential anticancer agents: XII. On theand the Change in Total Lesion Glycolysis criteria and kinetics associated with “curability” of experi-
mental leukemia. Cancer Chemother. Rep. 35:1–111;Combining Equations 4 and 1, we see that the SUV is1964.
proportional to metabolic rate, and in particular, the 11. Higashi, K.; Clavo, A.C.; Wahl, R.L. Does FDG uptakeratio of SUV1 /SUV2 is in effect a ratio of the metabolic measure proliferative activity of human cancer cells? Inrates for the tumor from state 1 to state 2, assuming vitro comparison with DNA flow cytometry and tritiatethat no change has occurred in glucose, arterial blood thymidine uptake. J. Nucl. Med. 34:414–419; 1993.concentration integral, and body composition. If the 12. Brown, R.S.; Leung, J.Y.; Fisher, S.J.; et al. Intratumoralrelative volumes are determined by the PET scan distribution of tritiated FDG in breast carcinoma: Correla-
tion between glut-1 expression and FDG uptake. J. Nucl.method above, and multiplied times the SUV ratio,Med. 37:1042–1047; 1996.the term defines the absolute change in total tumor
13. Herholz, K.; Pietrzyk, U.; Voges, J.; et al. Correlation ofglycolysis, a parameter that theoretically will be likelyglucose consumption and tumor cell density in astrocyto-to correspond to a change in cellular mass for amas. A stereotactic PET study. J. Neurosurg. 79:853–given tumor.858; 1993.It should be noted that the equation, if all of the
14. Som, P.; Atkins, H.L.; Bandoypadhyay, K.; et al. A fluori-conditions are met, can be determined as follows nated glucose analog, 2-fluoro-2-deoxy–D-glucose(F-18):(Equation 5): Non-toxic tracer for rapid tumor detection. J. Nucl. Med.
21:670–675; 1980.LGI 5 {[(SUVave)1 * (Vol)1 2 (SUVave)2 * (Vol)2]/15. Larson, S.M.; Grunbaum, Z.; Rasey, J.S. Positron imaging
[(SUVave)1 * (Vol)1]} * 100 (5) feasibility studies: I. Selective tumor concentration of[H-3] thymidine, [H-3] uridine, and [C-14]-2-deoxy-glu-where the subscripts “1’’ and “2” denote the pretreat-cose, based on the characteristic metabolism of malig-ment and the posttreatment PET-FDG scans respec- nancy. Radiology 134:771–773; 1980.
tively. 16. Larson, S.M.; Weiden, P.L.; Grunbaum, Z.; et al. Positronimaging feasibility studies. II. Characteristics of 2-deoxy-glucose uptake in rodent and canine neoplasms. ConciseReferencescommunication. J. Nucl. Med. 22:875–879; 1981.1. Wahl, R.L. Clinical oncology update: The emerging role
17. Weber, G. Enzymology of cancer cells. N. Eng. J. Med.of positron emission tomography. Prin. Prac. Oncol.296:541–551; 1976.11:1; 1997.
18. Di Chiro, G.; DeLaPaz, R.L.; Brooks, R.A. Glucose utiliza-2. Heelan, R.T.; Larson, S.M. Imaging of thoracic neoplasms.In: Aisner, J., Arriagada, R., Green, M.R., Martini, N., tion of cerebral gliomas measured by F18-fluorodeoxyglu-
Larson-Ginsberg Index: A PET Measure of Treatment Response/Larson et al. 171
cose and positron emission tomography. Neurology 32: 2-fluoro-deoxy-D-glucose: Validation of a method. Ann.Neurol. 6:371–388; 1979.1323; 1982.
33. Spence, A.M.; Muzi, M.; Graham, M.M.; et al. Glucose19. Di Chiro, G.; Fulham, M.J. Virchow’s shackles: Can PET-metabolism in human malignant gliomas measured quan-FDG challenge tumor histology? Am. J. Neuroradiol.titatively with PET, 1-[C-11]glucose and FDG: Analysis of14:524–527; 1993.the FDG lumped constant. J. Nucl. Med. 39:440–448; 1998.20. Di Chiro, G. Which PET radiopharmaceutical for brain
34. Kubota, K.; Matsuzawa, T.; Ito, M.; et al. Lung tumortumors? J. Nucl. Med. 32:1346–1348; 1991.imaging by positron emission tomography using C-1121. Di Chiro, G.; Oldfield, E.; Wright, D.C.; et al. CerebralL-methionine. J. Nucl. Med. 26:37–42; 1985.necrosis after radiotherapy or intra-arterial chemotherapy
35. Wahl, R.L. Positron emission tomography: applications tofor brain tumors: PET and neuropathologic studies. Am.oncology. In: Murray, I.P.C., Ell, P.J., eds. Nuclear medi-
J. Roentgen. 150:189–197; 1988. cine in clinical diagnosis and treatment. London: Chur-22. Francavilla, T.L.; Miletich, R.S.; Di Chiro, G.; et al. Positron chill Livingstone;1994: 801–804.
emission tomography in the detection of malignant degen- 36. Eary, J.F.; Mankoff, D.A. Tumor metabolic rates in sar-eration of low-grade gliomas. Neurosurgery 24:1–5; 1989. coma using FDG PET. J. Nucl. Med. 39:250–254; 1998.
23. Di Chiro, G.; Hatazawa, J., Katz, D.A.; et al. Glucose utiliza- 37. Lowe, V.J.; Duhaylongsod, F.G.; Patz, E.F.; et al. Pulmo-tion by intracranial meningiomas as an index of tumor nary abnormalities and PET Data analysis: A retrospectiveaggressivity and probability of recurrence: A PET study. study. Radiology 202:435–439; 1997.Radiology 164:521–526; 1987. 38. Eary, J.F.; Conrad, E.U.; Bruckner, J.D.; et al. Quantitative
24. Petronas, J.F.; Di Chiro, G.; Kufta, C.; et al. Prediction of [F-18]fluorodeoxyglucose positron emission tomographyin pretreatment and grading of sarcoma. Clin. Cancersurvival in glioma patients by means of positron emissionRes. 4:1215–1220; 1998.tomography (PET). J. Neurosurg. 62:816–822; 1985.
39. Kern, K.A.; Brunetti, A.; Norton, J.A.; et al. Metabolic25. Barker, F.G.; Chang, S.M.; Valk, P.E.; Pounds, T.R.;imaging of human extremity musculoskeletal tumors byPrados, M.D. 18-Fluorodeoxyglucose uptake and survivalPET. J. Nucl. Med. 29:181–186; 1988.of patients with suspected recurrent malignant glioma.
40. Duhaylongsod, F.G.; Lowe, V.J.; Patz, E.F.J.; Vaughn, A.L.;Cancer 79:115–126; 1997.Cleman, R.E.; Wolfe, W.G. Lung tumor growth correlates26. Schifter, T.; Hoffman, J.M.; Hanson, M.W.; et al. Serialwith glucose metabolism measured by fluoride-18 flu-FDG-PET studies in the prediction of survival in patientsorodeoxyglucose positron emission tomography. Ann.with primary brain tumors. J. Comput. Assist. Tomogr.Thorac. Surg. 60:1348–1352; 1995.
17:509–561; 1993. 41. Fukunaga, T.; Okazumi, S.; Koide, Y.; Isono, K.; Imazeki,27. Valk, P.E.; Budinger, T.F.; Levin, V.A.; Silver, P.; Gutin, K. Evaluation of esophageal cancers using fluorine-18-
P.H.; Doyle, W.K. PET of malignant cerebral tumors after fluorodeoxyglucose PET. J. Nucl. Med. 39:1002–1007;interstitial brachytherapy. Demonstration of metabolic ac- 1998.tivity and correlation with clinical outcome. J. Neurosurg. 42. Minn, H.; Lapela, M.; Klemi, P.J.; et al. Prediction of69:830–838; 1988. survival with fluorine-18-fluoro-deoxyglucose and PET in
28. Delbeke, D.; Meyerowitz, C.; Lapidus, R.L.; et al. Optimal head and neck cancer. J. Nucl. Med. 38:1907–1911; 1997.cutoff levels of F-18 fluorodeoxyglucose uptake in the 43. Patz, E.F.; Lowe, V.J.; Hoffman, J.M.; et al. Focal pulmo-differentiation of low-grade from high-grade brain tumors nary abnormalities: Evaluation with F-18 fluorodeoxyglu-
cose PET scanning. Radiology 188:487–490; 1993.with PET. Radiology 195:47–52; 1995.44. Findlay, M.; Young, H.; Cunningham, D.; et al. Noninva-29. Yonekura, Y.; Benua, R.S.; Brill, A.B.; et al. Increased accu-
sive monitoring of tumor metabolism using fluorodeoxy-mulation of 2-deoxy-2-[F-18]fluoro-D-glucose in liver me-glucose and positron emission tomography in colorectaltastases from colon carcinoma. J. Nucl. Med. 23: 1133–cancer liver metastases: correlation with tumor response1137; 1982.to fluorouracil. J. Clin. Oncol. 14:700–708; 1996.30. Sokoloff, L.; Reivich, M.; Kennedy, C.; et al. The [C14]
45. Wahl, R.L.; Zasadny, K.; Helvie, M.; Hutchins, G.D.; We-deoxyglucose method for the measurement of local cere-ber, B.; Cody, R. Metabolic monitoring of breast cancerbral glucose utilization: Theory procedure and normalchemo hormonotherapy using positron emission tomog-values in the conscious and anesthetized rat. J. Neuro-raphy: Initial evaluation. J. Clin. Oncol. 11:2101–2111;
chem. 28:897–916; 1977. 1993.31. Reivich, M.; Alavi, A.; Wolf, A.; et al. Glucose metabolic 46. Romer, W.; Hanauske, A.R.; Ziegler, S.; et al. Positron
rate kinetic model parameter determination in humans: emission tomography in non-Hodgkin’s lymphoma: Assess-Lump constant and rate constant for (F-18) fluorodeoxy- ment of chemotherapy with fluorodeoxyglucose. Bloodglucose. J. Cereb. Blood Flow Metab. 5:179–192; 1985. 91:4464–4471; 1998.
32. Phelps, M.E.; Huang, S.C.; Hoffman, E.S.; Selin, C.; Soko- 47. Hunter, G.J.; Hamberg, L.M.; Alpert, N.M.; Coi, N.C.;loff, L.; Kuhl, D.E. Tomographic measurement of local Fischman, A.J. Simplified measurement of deoxyglucose
utilization rate. J. Nucl. Med. 37:950–955; 1996.cerebral glucose metabolic rate in humans with (F-18)


![CYCLOTRON PRODUCED RADIONUCLIDES:GUIDANCE ON FACILITY DESIGN AND PRODUCTION OF [18F]FLUORODEOXYGLUCOSE (FDG)](https://static.fdokumen.com/doc/165x107/631647d8c32ab5e46f0db468/cyclotron-produced-radionuclidesguidance-on-facility-design-and-production-of-18ffluorodeoxyglucose.jpg)