FDG-PET Contributions to the Pathophysiology of Memory Impairment.
31
See discussions, stats, and author profiles for this publication at: http://www.researchgate.net/publication/281349761 FDG-PET Contributions to the Pathophysiology of Memory Impairment ARTICLE in NEUROPSYCHOLOGY REVIEW · AUGUST 2015 Impact Factor: 5.4 · DOI: 10.1007/s11065-015-9297-6 8 AUTHORS, INCLUDING: Renaud La Joie Claude Bernard University Lyon 1 35 PUBLICATIONS 328 CITATIONS SEE PROFILE Ludivine Ritz Cyceron 11 PUBLICATIONS 1 CITATION SEE PROFILE Hélène Beaunieux Université de Caen Basse-Normandie 60 PUBLICATIONS 501 CITATIONS SEE PROFILE Gaël Chételat French Institute of Health and Medical Rese… 200 PUBLICATIONS 4,982 CITATIONS SEE PROFILE Available from: Shailendra Segobin Retrieved on: 02 September 2015
Transcript of FDG-PET Contributions to the Pathophysiology of Memory Impairment.
Seediscussions,stats,andauthorprofilesforthispublicationat:http://www.researchgate.net/publication/281349761
FDG-PETContributionstothePathophysiologyofMemoryImpairment
ARTICLEinNEUROPSYCHOLOGYREVIEW·AUGUST2015
ImpactFactor:5.4·DOI:10.1007/s11065-015-9297-6
8AUTHORS,INCLUDING:
RenaudLaJoie
ClaudeBernardUniversityLyon1
35PUBLICATIONS328CITATIONS
SEEPROFILE
LudivineRitz
Cyceron
11PUBLICATIONS1CITATION
SEEPROFILE
HélèneBeaunieux
UniversitédeCaenBasse-Normandie
60PUBLICATIONS501CITATIONS
SEEPROFILE
GaëlChételat
FrenchInstituteofHealthandMedicalRese…
200PUBLICATIONS4,982CITATIONS
SEEPROFILE
Availablefrom:ShailendraSegobin
Retrievedon:02September2015

REVIEW
FDG-PET Contributions to the Pathophysiologyof Memory Impairment
Shailendra Segobin1,2,3,4& Renaud La Joie1,2,3,4 & Ludivine Ritz1,2,3,4 & Hélène Beaunieux1,2,3,4 &
Béatrice Desgranges1,2,3,4 & Gaël Chételat1,2,3,4 & Anne Lise Pitel1,2,3,4 & Francis Eustache1,2,3,4
Received: 8 May 2015 /Accepted: 4 August 2015# Springer Science+Business Media New York 2015
Abstract Measurement of synaptic activity by PositronEmission Tomography (PET) and its relation to cognitive func-tions such as episodic memory, working memory and executivefunctions in healthy humans and patients with neurocognitivedisorders have been well documented. In this review, we intro-duce the concept of PET imaging that allows the observation ofa particular biological process in vivo through the use of radio-labelled compounds, its general use to the medical world and itscontributions to the understanding of memory systems. We thenfocus on [18F]-2-fluoro-2-deoxy-D-glucose (FDG-PET), the ra-diotracer that is used to measure local cerebral metabolic rate ofglucose that is indicative of synaptic activity in the brain. FDG-PETat rest has been at the forefront of functional neuroimagingover the past 3 decades, contributing to the understanding ofcognitive functions in healthy humans and how these functionalpatterns change with cognitive alterations. We discuss method-ological considerations that are important for optimizing FDG-PET imaging data prior to analysis. We then highlight the con-tribution of FDG-PET to the understanding of the patterns offunctional differences in non-degenerative pathologies, normalageing, and age-related neurodegenerative disorders. Throughreasonable temporal and spatial resolution, its ability to measuresynaptic activity in the whole brain, independently of any spe-cific network and disease, makes it ideal to observe regionalfunctional changes associated with memory impairment.
Keywords Positron Emission Tomography (PET) . FDG .
Hypometabolism . Neurocognitive disorders
AbbreviationsAD Alzheimer’s diseaseADNI Alzheimer’s Disease Neuroimaging InitiativeCBF Cerebral Blood FlowFDG [18F]-2-fluoro-2-deoxy-D-glucoseFOV Field of viewFTD Frontotemporal dementiaFWHM Full-width-half-maximumlCMRglc Local cerebral metabolic rate of glucoseKS Korsakoff’s syndromeMCI Mild Cognitive ImpairmentMRI Magnetic Resonance ImagingMTL Medial Temporal LobePET Positron Emission TomographyPSF Point spread functionPVC Partial volume correctionPVE Partial volume effectsVOI Volume of interest
Introduction
The clinical world of today faces several challenges: the abil-ity to accurately detect a disease at an early stage, preferablybefore its onset; the ability to detect an atypical representationand the detection of co-morbid conditions, with the net aim ofadministering the most efficient treatment. This requires anunderstanding of the mechanisms underlying the disease’spathology and the links with their symptoms (that is, the cog-nitive disorders related to the pathologies of cognition). Overthe past 3 decades, neuroimaging has been affirming itself as a
* Shailendra [email protected]
1 Inserm, U1077, Caen, France2 Université de Caen Normandie, UMR-S1077, Caen, France3 Ecole Pratique des Hautes Etudes, UMR-S1077, Caen, France4 Centre Hospitalier Universitaire, UMR-S1077, Caen, France
Neuropsychol RevDOI 10.1007/s11065-015-9297-6

more and more valuable tool in complementing neuro-psychological and other clinical assessments, whetherfor clinical diagnosis or research purposes. This reviewfocuses on the use of positron emission tomography(PET) as a functional neuroimaging modality towards the bet-ter comprehension of memory systems and neurocognitivedisorders.
Neuropsychological assessments of memory have pro-duced an abundance of data, which have notably been ana-lyzed to yield organized models of human memory (Tulving1995; Eustache and Desgranges 2008). These models depictthe specificities of cognitive memory systems and how theyrelate to one another mainly through the processes ofencoding, storage, and retrieval. The introduction of PET(and later, other methods of functional neuroimaging) tookthe modelling and understanding of cognitive processes upanother level as researchers were able to map specific cogni-tive processes to functional neuroanatomy in healthy subjects.At that time, and for that purpose, PET activation studies werecarried out, in which cerebral blood flow (CBF), measured viaradio-labelled [15O] –H2O, was indicative of synaptic activity.Based on the task performed, synaptic activity would occur inspecific regions of the brain, increasing CBF, and hence anincrease in the PET signal observed. The first insightful func-tional imaging study of memory was done by Squire andcolleagues (Squire et al. 1992) who observed selective activa-tion of the hippocampus in healthy subjects based on whichtask the subjects performed and which memory function itwas associated to. This study also contributed to the under-standing of priming as decreased activation of the posteriorcortex was observed when words were presented to the sub-jects for a second time before scanning, as compared to whenthey were presented only once prior to scanning. Four PETactivation studies followed involving correlations betweenCBF and tasks related to recognition memory (Nyberg et al.1995, 1996; Tulving et al. 1994a, b) that further consolidatedthe works by (Squire et al. 1992). A subsequent meta-analysisof the 4 studies (Tulving et al. 1999) concluded that the re-gions activated were study specific, and therefore dependenton the memory-task involved. It also highlighted the role ofnot only the medial temporal lobe, but also the presence ofother regions like the frontal cortex, occipital and lingual gyri,and cerebellum. This indicates the presence of a brain networkconsisting of these regions around which the MTL is key inbrain/behaviour relationships that are involved in performancememory. [15O] – H2O PET studies have also been conductedto examine relationship between CBF and other memory com-ponents such as cognitive procedural learning (Hubert et al.2007) and musical and verbal semantic memory (Groussardet al. 2010). Taken together, PET activation studies using[15O] – H2O in healthy subjects have greatly contributed to-wards the comprehension of cognitive functions, especiallymemory ones.
FDG-PET: A Useful Tool for Neuropsychology
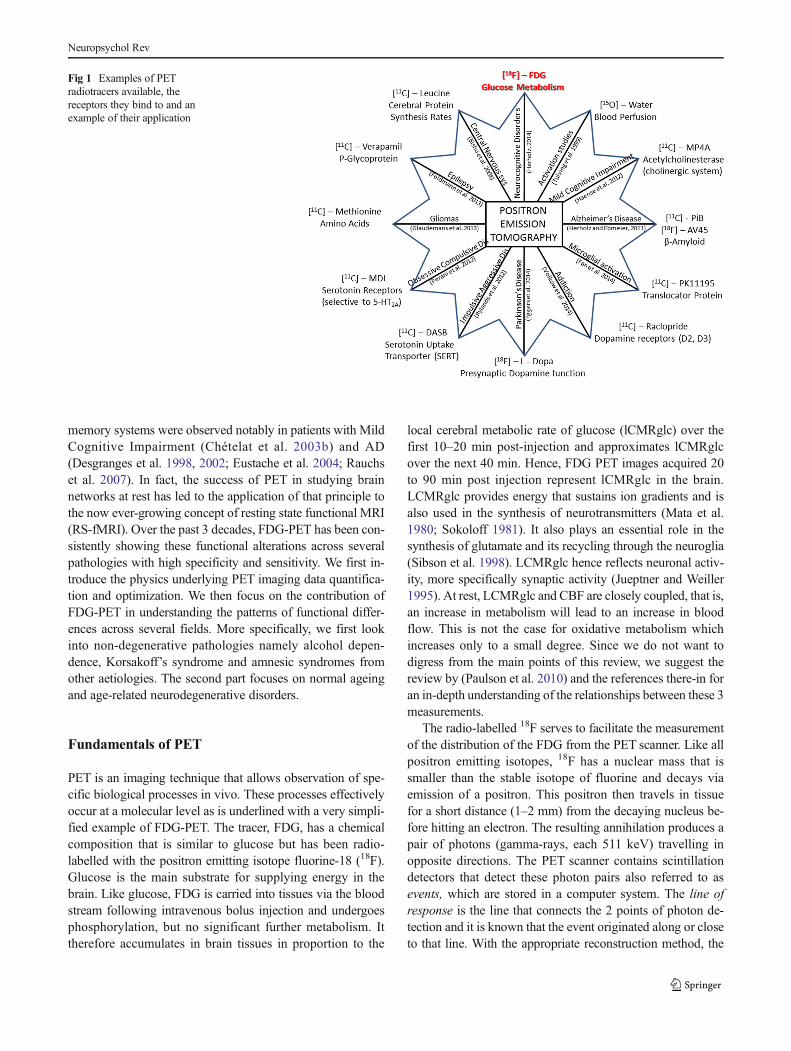
Beyond the healthy brain, it is important to understand thebiological/functional mechanisms that characterize a disease,especially when the cognitive deficits of these patients from aneuropsychological point of view do not seem to differ amongpathologies. For example, it is desirable to identify the patternof functional abnormalities that differentiates a patient withAlzheimer’s disease (AD) from one with Korsakoff’s syn-drome (KS) or a patient with semantic dementia from one withfronto-temporal dementia. From a broader perspective, PEThas been and is still used for multiple purposes, depending onthe biological process we want to explore. The brain has sev-eral pathways that work via the release of specific neurotrans-mitters. For example, dopamine is an important neurotrans-mitter in the brain’s reward system (Le Foll et al. 2014), oracetylcholine, another neurotransmitter, is associated withlearning and memory (Haense et al. 2012). Brain tumors areknown to alter regional metabolism, for example due to in-creased transport of amino acids in gliomas (Langen et al.2000). Radiotracers (radioligands) that are able to bind to thereceptors of these neurotransmitters have therefore been de-veloped so that the biological process happening in vivo with-in those brain networks or pathological processes may be ob-served in vivo via PET imaging. Figure 1 shows a non-exhaustive number of radiotracers that are used in PET stud-ies, with an example of the receptor that the radioligand bindsto and in which field of study it is used.
The remaining part of this review will mainly focus on[18F] 2-fluoro-2-deoxy-D-glucose PET (FDG-PET), whichhas been one of the most popular radiotracers used in the studyof functional decline in diseases with cognitive disorders. Itsreasonable half-life (109 min, as opposed to 2 min for [15O –H2O]) makes it ideal for the study of synaptic activity viaglucose metabolism in research and clinical centers that donot have a cyclotron unit to produce the radiotracer in situ.While it does not offer the superior temporal resolution ofelectromagnetic techniques like ElectroEncephalography(EEG) or MagnetoEncephalography (MEG), which can beof the order of 1 millisecond, it offers far better spatial resolu-tion. The detection of synaptic activity (explained below) ismore accurate in PET, compared to EEG and MEG, as it doesnot depend on the conductivity of brain tissues or the skull,and does not require complex model of the brain for signaldetection. FDG-PET studies are carried out at rest, that is,when the subject is lying down in a room with low lighting,eyes closed and doing no specific task. Even when ‘at rest,’brain circuits are known to remain active, whether for therunning of the autonomic nervous system or the brain’s naturalway of ‘wandering’ through daily tasks or events in a person’slife. The functional activity of the brain is known to be alteredin diseases, even when at rest. It has therefore been subject toseveral studies through which the functional alterations of
Neuropsychol Rev
memory systems were observed notably in patients with MildCognitive Impairment (Chételat et al. 2003b) and AD(Desgranges et al. 1998, 2002; Eustache et al. 2004; Rauchset al. 2007). In fact, the success of PET in studying brainnetworks at rest has led to the application of that principle tothe now ever-growing concept of resting state functional MRI(RS-fMRI). Over the past 3 decades, FDG-PET has been con-sistently showing these functional alterations across severalpathologies with high specificity and sensitivity. We first in-troduce the physics underlying PET imaging data quantifica-tion and optimization. We then focus on the contribution ofFDG-PET in understanding the patterns of functional differ-ences across several fields. More specifically, we first lookinto non-degenerative pathologies namely alcohol depen-dence, Korsakoff’s syndrome and amnesic syndromes fromother aetiologies. The second part focuses on normal ageingand age-related neurodegenerative disorders.
Fundamentals of PET
PET is an imaging technique that allows observation of spe-cific biological processes in vivo. These processes effectivelyoccur at a molecular level as is underlined with a very simpli-fied example of FDG-PET. The tracer, FDG, has a chemicalcomposition that is similar to glucose but has been radio-labelled with the positron emitting isotope fluorine-18 (18F).Glucose is the main substrate for supplying energy in thebrain. Like glucose, FDG is carried into tissues via the bloodstream following intravenous bolus injection and undergoesphosphorylation, but no significant further metabolism. Ittherefore accumulates in brain tissues in proportion to the
local cerebral metabolic rate of glucose (lCMRglc) over thefirst 10–20 min post-injection and approximates lCMRglcover the next 40 min. Hence, FDG PET images acquired 20to 90 min post injection represent lCMRglc in the brain.LCMRglc provides energy that sustains ion gradients and isalso used in the synthesis of neurotransmitters (Mata et al.1980; Sokoloff 1981). It also plays an essential role in thesynthesis of glutamate and its recycling through the neuroglia(Sibson et al. 1998). LCMRglc hence reflects neuronal activ-ity, more specifically synaptic activity (Jueptner and Weiller1995). At rest, LCMRglc and CBF are closely coupled, that is,an increase in metabolism will lead to an increase in bloodflow. This is not the case for oxidative metabolism whichincreases only to a small degree. Since we do not want todigress from the main points of this review, we suggest thereview by (Paulson et al. 2010) and the references there-in foran in-depth understanding of the relationships between these 3measurements.
The radio-labelled 18F serves to facilitate the measurementof the distribution of the FDG from the PET scanner. Like allpositron emitting isotopes, 18F has a nuclear mass that issmaller than the stable isotope of fluorine and decays viaemission of a positron. This positron then travels in tissuefor a short distance (1–2 mm) from the decaying nucleus be-fore hitting an electron. The resulting annihilation produces apair of photons (gamma-rays, each 511 keV) travelling inopposite directions. The PET scanner contains scintillationdetectors that detect these photon pairs also referred to asevents, which are stored in a computer system. The line ofresponse is the line that connects the 2 points of photon de-tection and it is known that the event originated along or closeto that line. With the appropriate reconstruction method, the
Fig 1 Examples of PETradiotracers available, thereceptors they bind to and anexample of their application
Neuropsychol Rev

events (several millions in a typical PETscan) are reconstruct-ed to provide local activity concentration within the field ofview (FOV) of the PET scanner.
Data Acquisition and Reconstruction
Storage of the coincident events is generally done in 2 for-mats, histogram mode or listmode. In histogram mode, eachcoincident event is placed into a sinogram, with thehistogramming often done on-the-fly by dedicated computerhardware and software. The length of the acquired frame mustbe defined a priori as the sinograms are only temporarily heldin the computer’s memory waiting for the histogramming pro-cess. Frames of longer durations can be constructed by addingthe a priori pre-defined frames but other frame durations arenot possible. The more modern scanners, like the ECAT HR+(Siemens – Knoxville, Tennessee, USA) and beyond, allowsfor data acquisition in listmode, where each coincident eventis sequentially stored to a data file. The listmode data areprocessed post-acquisition, when they can be split into smallerand as many listmode files desired, before histogramming andsubsequent image reconstruction. This temporal flexibility isbecoming more and more popular in clinical research as itallows for movement correction which has becomemandatoryfor PET acquisitions at high resolution (Bloomfield et al.2003), especially when the duration of the scan is particularlylong. Listmode data also offers the advantage ofreconstructing the PET data with variable number of framesand of different durations (dynamic scanning) post-scanning.Most clinical centers reconstruct a static scan, that is, only oneimage that contains the number of detected events summedover the duration of the scan. However, research centers oftenperform dynamic scans where the tracer distribution and me-tabolism (in the case of FDG) are ‘captured’. This allows thesubsequent analysis of the kinetics of the tracer, and the esti-mation of physiological parameters and rate constants likerates of metabolism, volume of distribution etc. These dynam-ic scanning protocols are particularly important when differ-entiating between normal- versus patho-physiological pro-cesses in the human brain or in drug development where it isimportant to understand the drug’s bio-distribution and phar-macokinetics. Dynamic scans however require accurate andabsolute quantification of the tracer distribution throughoutthe scan which requires arterial input function that is in turnedobtained via blood sampling. The problems linked to absolutequantifications and blood sampling are briefly discussed fur-ther below. For FDG-PET as applied to neurocognitive disor-ders, a static image that reflects lCMRglc 40 min post-injection and for 10 min is sufficient to reflect on differencesbetween healthy brains and those altered in their respectivepathologies.
PET has high sensitivity (i.e., it takes a small concentrationof imaging agent to detect quantities above background level
and is in 10−10 mol/l in this case), good depth of penetration(through the whole body) and reasonable temporal resolution(5–10 s per update). However, from a structural point of view,PET’s spatial resolution lags behind that of structural imagingmodalities like MRI. The High Resolution ResearchTomograph, a dedicated brain-PET scanner, offered thehighest possible spatial resolution in PET at the time of itsintroduction (Wienhard et al. 2002) with an isotropic resolu-tion of 2.5 mm at full-width-half-maximum (FWHM).Conventional clinical and research scanners have a spatialresolution that varies between 4 and 10 mm according tohow old they are. The limited resolution of PETscanners givesrise to what is termed Partial Volume Effects (PVEs) wherebythe images look blurred due to a loss of signal to the surround-ings. PVEs become particularly important when the cross-sectional distance of a structure is less than two-times theFWHM of the scanner’s response to a point source, termedpoint spread function (PSF). With the scanner’s PSF not beinga step response but rather Gaussian in shape, the tail of thelatter does not form part of the sampling space of the volumeof interest and the activity is underestimated. This underesti-mation persists until the size of the volume of interest (VOI) isnot at least twice the FWHM of the scanner’s PSF. Moreover,if the VOI is in the close neighbourhood of another activitydistribution, the true activity measurements within the VOIwill be contaminated with what is termed spillovers betweenactivity regions, causing reciprocal changes in the regions’activity measurements, and thus, underestimation or overesti-mation of the true signals of the VOI and its surroundings, asshown in Fig. 2. Physically, since PVEs are observed as ablurring on the PET images, it becomes difficult to separatetwo small objects in a close neighbourhood.
Partial Volume Correction
Partial Volume Correction (PVC) is the method used to correctfor the signal loss due to PVEs and emerged in the late 1970sand early 1980s. PVC methods can be 1) phantom-based,where a recovery coefficient is calculated and applied toVOIs whose sizes are estimated to be comparable to that ofthe phantoms (Hoffman et al. 1979); 2) reconstruction-based,where the PSF of the scanner is modelled within the recon-struction of the PET image (Reader et al. 2003); and 3) post-reconstructionmethods: where the algorithms require accuratedelineation of the VOI using higher resolution anatomicalimages like MRI or CT (Muller-Gartner et al. 1992; Roussetet al. 1998). The most popular PVC methods are post-reconstruction ones and are widely used in clinical studies.They can be voxel-based, like the Lucy-Richardson(Richardson 1972; Lucy 1974); region-based (Müller-Gartner et al. 1992; Rousset et al. 1998) or a combination ofboth (Segobin et al. 2010; Thomas et al. 2011). PVC is par-ticularly important in the study of neuropsychiatric diseases
Neuropsychol Rev

when researchers aim at understanding how the functionalactivity of a region varies with volumetric changes. For exam-ple, in a dementia context, with progressing atrophy, the ob-jective is to determine the true loss of metabolism in FDG-PET studies within VOIs that would represent loss in tissuefunction as opposed to an artefactual decrease of the PETsignal due to PVEs. The impact of PVEs and its correctionhas been widely reported in literature, especially in conditionswhere the pathology is accompanied by shrinkage within thebrain (Meltzer et al. 2000; Rousset et al. 2000).
PET Quantification
A number of physiological parameters including blood perfu-sion, volumes of distribution (for example of a drug in specifictissues), binding potential of a ligand, can be derived from PETmeasurements and require accurate and absolute quantificationof the radiotracer. The concentration of FDG in the tissue de-pends not only on the interaction of the tissuewith the radiotracerbut also on its transport to the tissue through arterial blood supply,often referred to as the arterial input function. The latter allowsthe separation of tracer that is bound to tissues from tracer that is
‘free’ and present due to blood flow effects. Input functions aredifficult to obtain as they require arterial blood samplingmultipletimes during the course of the scan. The process is invasive andcauses much discomfort to subjects during the scan. It is alsocostly as it requires a blood-laboratory with specialized equip-ment and staff. For these reasons, reference region approaches(RRAs), like the Full Reference Tissue Model (Cunninghamet al. 1991; Lammertsma et al. 1996), Simplified ReferenceTissue Model (Lammertsma and Hume 1996), LoganReference Region (Logan et al. 1996) and MultilinearReference Tissue Models (Ichise et al. 2003) were developed.One of the conditions for the RRA to be valid is the identificationof a region that is devoid of specific binding and remains invari-ant between groups (Zanderigo et al. 2013) of healthy subjectsand patients or subjects under test. This is because the referenceregion is used to quantitatively normalize (scale) the PET imagesof the two groups of subjects in clinical studies in order to avoidinter-subject variability. This variability can be due to the dose ofFDG injected, the amount trapped in brain tissue, general activa-tion of the brain tissues or intra-subject variability arising fromchanges in FDG concentrations within the brain over time(McColl et al. 1994). The choice of a reference region is not only
Fig 2 Illustration of partial volume effects in PET imaging. Top left: Trueimage of two regions lying next to each other with different signalintensities (yellow region has lower activity than brown region, see blueline on profile image below). Top right: Measured PET image showsspillover effects between the 2 signals resulting in blurring of theimage. Bottom: Profiles of the signal intensities in the true image (blue
line), measured image (red) line, signal intensity in the yellow region(lower activity) if the signal was measured in the absence of the brownregion with higher activity (dotted black line), and for the brown region ofhigher activity if measured in absence of the yellow region (green dottedline)
Neuropsychol Rev

tracer specific but may also vary according to the pathologyunder study. For example, while the gray matter of the wholecerebellum may be an appropriate reference region in the studyof patients with AD, it may not be appropriate in the context ofalcohol-dependence because the volume and metabolism of atleast a part of the cerebellum of alcoholics is affected (Pitel et al.2009). The invariance of the tracer between groups for a specificstudy allows for the conclusion that the differences observed areeffectively due to pathophysiological mechanisms and not anartefactual measurement due to the wrong choice of a referenceregion. When the use of expensive blood-laboratories is not anoption and in the absence of a well-established reference regionthat has been repeatedly documented in literature, researchgroups often resort to evaluating a reference region that at leastsatisfies the following criteria (Yakushev et al. 2008): The activ-ity in the reference region should be 1) unaffected (orleast affected) by the disease of interest, 2) minimallysusceptible to external physiological stimuli and 3) sta-ble both in controls and patients, i.e., regional traceruptake should not vary significantly across healthy sub-jects. When the finding of such a reference region stillremain a difficult task, normalization of the image tothe global mean has been employed in voxel-based analysesin dementia studies for example (Drzezga et al. 1999; Jagustet al. 2006; Mosconi et al. 2004a, b). However, such a modelshould be considered as a last resort and with extreme care asit assumes that the changes happening locally have no signif-icant impact on the global mean of the image. Should this notbe the case, then the whole model is flawed, again resulting inartefactual measurements of group differences in the wholebrain (Andersson 1997; Stamatakis et al. 1999).
Having gone briefly through the working principles andquantitative aspects of PET imaging, we shall now look intohow FDG-PET measurements at rest have helped the clinicalworld to better understand how biological processes workunder normal working conditions, how these are altered indiseases and how these biological changes explain the cogni-tive decline of patients. From a neuropsychologist’s point ofview, when it is desired to compare the patterns of metabolicdecline between a patient group and a control group, or tocorrelate these patterns to cognitive measures, acquisition ofa static FDG-PET image between 50 and 60 min post-injection is sufficient. Correction for PVE is highly recom-mended to ensure that decrease in the PET signal observedis indeed due to metabolic decline and not artefactual due theinherent low resolution of PET causing an underestimation ofthe signal. Semi-quantitative methods are sufficient for groupcomparisons or correlation studies. However, it is mandatoryto ensure that the reference region, chosen to quantitativelynormalize the PET data to, satisfies the criteria mentionedabove, so that measurements are not flawed. Figure 3 summa-rizes the steps in PET data acquisition, reconstruction and pre-processing prior to statistical analyses.
The statistical analyses can be either region-based, wherethe regions are defined a priori, or voxel-based where theanalysis is effectively conducted in the whole brain and re-quires no a priori information since the sampling is done at avoxel-level. Until the late 1990s and even early 2000s, region-based analysis dominated PET research. This changed to sta-tistical analyses that were essentially voxel-based for 2 rea-sons. Firstly, technological developments in PET allowed forimaging at a higher resolution (from 10–12 to 4–8 mm); andsecondly, image processing algorithms, especially morpho-metric methods (Ashburner and Friston 2000; Studholmeet al. 2001; Ashburner 2007) became more and more refinedand allowed for voxel-by-voxel analysis of functional andstructural data with more accuracy. The major advantage ofvoxel-based methods is that signal measurements are notaveraged-out over the whole ROI when only part of the apriori ROI is effectively affected. Regarding sample sizes,there exists no gold standard as to what the minimum numberof subjects in a study should be. Aminimum of 16 is known toproduce replicable results and lower sample sizes are likely toincrease the number of false negatives (Andreasen et al.1996). Through these statistical analyses, the research worldhas been able to better understand the functional mechanismin non-degenerative pathologies as well as across normal age-ing and several neurocognitive disorders, which are describedin more details below. As a whole, it is important to under-stand that metabolic abnormalities observed between twogroups of subjects may be due to alterations in synaptic activ-ity that is itself potentially related to 1) neuronal loss; 2) signaldrop-out due to impaired neurotransmission or 3) a disconnec-tion problem between the two graymatter nodes, whether theyare local or remotely-connected (diaschisis phenomenon,Baron et al. 1981)). Hence, while the phenotype might bethe same for some pathologies, the altered metabolism canbe explained through different physiological mechanisms.
FDG-PET Investigations in non-DegenerativePathologies
Alcohol-Dependence
Chronic alcoholism is a major public health issue and is asso-ciated with a high risk of developing physical and mentalproblems including alcohol-related brain damage and neuro-psychological impairments. Widespread structural brain dam-age was found predominantly in the frontal cortices extendingto the cingulate gyrus, cerebellum, and thalamus as well as, toa lesser extent, the hippocampus andmammillary bodies (Pitelet al. 2012). Alteration of these brain regions is in agreementwith the neuropsychological profile of alcoholic patients char-acterized by executive dysfunction, episodic memory deficits
Neuropsychol Rev

and visuospatial disabilities (Pitel et al. 2007; Sullivan et al.2000).
Chronic alcoholism has a direct and negative effect on glu-cose uptake in neurons, contributing to alcohol-related braindamage (Abdul Muneer et al. 2011). And yet, the study of
brain glucose metabolism has received limited attention inalcoholism. The few PET investigations using 18 F-2-fluoro-deoxy-glucose (FDG) revealed that alcoholic patients hadlower uptake of glucose in the global brain (Volkow et al.1992; Wang et al. 1993) with reduction of up to 20 % (Dao-
Fig 3 Flowchart summarizing FDG-PET data acquisition, reconstructionand pre-processing steps before group analysis: Data is first acquired ineither listmode or sinogram mode. A scan can be acquired dynamically(continuous frame acquisitions) when it is desired to analyse the kineticsof the tracer. Otherwise, a static scan that shows the total distribution ofthe tracer over the defined period of time and is ideal for observing local
cerebral metabolic rate of glucose in the brain. After acquisition andreconstruction, FDG-PET data is optimized via correction for partialvolume effects. In absence of fully quantitative methods that requirearterial blood sampling, semi-quantitative methods like scaling to areference region is required, prior to group comparisons
Neuropsychol Rev
Castellana et al. 1998). Hypometabolismwas found especiallyin the parietal and frontal cortices (Dao-Castellana et al. 1998;Volkow et al. 1992, 1994) extending to the anterior cingulatecortex (Dao-Castellana et al. 1998; Gilman et al. 1990; Wanget al. 1993). In a cross sectional study, alcoholic patients withclinical diagnosis of alcoholic cerebellar degeneration (ACD)characterized by nystagmus, ataxia of lower limbs and cere-bellar atrophy, were compared with alcoholic patients withoutneurological complications and control subjects (Gilman et al.1990). Although glucose metabolism was lower in the medialfrontal cortex of both patient groups compared to controls,only those with ACD had hypometabolism in the superiorvermis and none of the alcoholic patients without ACD hadmetabolic abnormalities in other cerebellar regions.
The global cortical metabolism correlated with the durationof alcohol use (Volkow et al. 1994), the number of days ofabstinence from alcohol (Volkow et al. 1992) and gamma GTmeasures (Dao-Castellana et al. 1998). These findings suggestthat global hypometabolism in alcoholic patients may resultfrom the direct effects of alcoholism on the brain but also fromalcohol-induced hepatic complications. However, when me-tabolism was analyzed in specific regions of interest, none ofthe alcoholic or hepatic parameters were found to be linked toregional hypometabolism (Dao-Castellana et al. 1998;Volkow et al. 1992), suggesting that different pathologicalmechanisms may be involved in the metabolic abnormalitiesobserved in chronic alcoholism.
Significant increase in metabolism was found in alcoholicpatients within 15–30 days of abstinence from alcohol(Volkow et al. 1994), indicating that hypometabolism inchronic alcoholism is not the consequence of irreversible braindamage but rather reflects reversible structural damage and/orsynaptic dysfunction. This metabolic recovery was more pro-nounced in frontal and parieta l regions whereashypometabolism persisted in the basal ganglia and in patientswith longer history of alcohol consumption (Volkow et al.1994). These discrepancies in the time course of recoveryamong the brain regions indicate different vulnerabilities tothe neurotoxic effects of alcohol that seems to be exacerbatedin the brain of the patients with a greater exposure of alcoholuse.
Metabolic abnormalities in specific brain regions seem to berelated to neuropsychological impairments in alcoholic pa-tients. Deficits in the Stroop test, verbal fluency and theSymbol Digit Modalities Test correlated with hypometabolismof the prefrontal and mediofrontal regions (Dao-Castellanaet al. 1998; Wang et al. 1993) as well as that of all corticalregions of interest (Wang et al. 1993). These findings empha-size the role of frontal hypometabolism in the executive dys-functions observed in alcoholic patients but also suggest thatthese impairments are subtended by multiple brain systems. Asimilar pattern of brain-behavior correlations was found forepisodic memory (Wang et al. 1993). While long-termmemory
recall correlated with the metabolism of the right temporal cor-tex and the thalamus, long-term memory recognition correlatedwith metabolism in cortical and subcortical regions. The au-thors concluded that memory deficits in alcoholic patients resultfrom abnormalities of a specific brain network rather than well-localized alterations.
The few studies that have combined MRI and PET exam-inations to assess the relationship between cortical shrinkageand hypometabolism in alcoholic patients revealed discrepan-cies in the results. (Dao-Castellana et al. 1998) found thatglobal hypometabolism was not related to global corticalshrinkage, in agreement with a study showing global and re-gional hypometabolism in alcoholic patients without brainatrophy (Volkow et al. 1992). This finding suggests that met-abolic dysfunction may occur independently of gray mattershrinkage. Other studies reported a relationship between glob-al brain metabolism and grey matter integrity in alcoholicpatients (Gilman et al. 1990; Wang et al. 1993), indicating,according to the authors, a causal relationship between corticalatrophy and brain metabolism or vice versa (Wang et al.1993). Such discrepancies could be due to certain methodo-logical aspects like choice of the ROIs for analysis or correc-tion for partial volume effects. For example, none of the abovestudies used PVC prior to their assessments. Depending on thesize of the ROIs chosen, measurements could well beartefactual due to these partial volume effects. However, it isworth noting that the literature for PET studies in alcohol-dependence is quite old (at least 20 years) and that studieswere very limited in terms of availability of sound methodo-logical procedures. The better PVC algorithms did not appearbefore 1996. The developments in PET technology and meth-odology have allowed us to carry out a direct voxel-basedcomparison between volumetric and metabolic abnormalitieswith an optimized methodology that includes PVC and quan-titative normalization (Ritz et al. 2015, In press). The studyrevealed three distinct profiles of brain abnormalities in alco-holic patients. The first profile was characterized by regionswith more severe atrophy than hypometabolism (cerebellum,cingulate cortex, hippocampus and parahippocampal gyrus)This result can be regarded as the rule to the pathologicalmechanism that pertains to the neurotoxicity of alcohol con-sumption where local atrophy induces local hypometabolism.Second, atrophied regions that include the thalamus, hippo-campus and parahippocampal gyrus have a relative preserva-tion of their metabolism compared to the atrophy andhypometabolism of the cingulate cortex, suggesting variablevulnerability of the nodes of the Papez circuit that is potential-ly due to compensatory mechanisms. The third profile refersto hypometabolism exceeded atrophy in regions of thefrontocerebellar circuit and the parietal gyrus, indicating thatfunctional loss might be the leading factor contributing to theoverall pathological mechanism. This combined PET-MRIstudy therefore highlights the need to consider not only the
Neuropsychol Rev

effects of grey matter atrophy but also other mechanisms in-volving neurotransmission, structural and functional connec-tivity and diaschisis phenomenon that combine to form theoverall pathophysiological mechanism observed in alcohol-dependent patients.
Korsakoff’s Syndrome (KS)
The combination of chronic and excessive alcohol consump-tion with thiamine deficiency can lead to the development ofthe acute and reversible Wernicke encephalopathy, which re-sults in 85 % of the cases (Day et al. 2008) in the debilitatingand enduring KS. KS is characterized by amnesia (both anter-ograde and retrograde) associated with working memory andexecutive dysfunction, as well as ataxia of gait and balance(Kopelman et al. 2009). Structural brain abnormalities havebeen described notably in the thalamus, hypothalamus (mam-millary bodies), hippocampus, frontal cortex and cerebellum(Pitel et al. 2012; Sullivan and Pfefferbaum 2009; Reed et al.2003).
Very few resting-state FDG-PET studies have been con-ducted in KS. The first study that examined glucose metabo-lism in KS had included only two KS patients within a groupof 11 patients with amnesia from various etiologies (Fazioet al. 1992a, b). Metabolism was decreased in amnesic pa-tients compared with control subjects notably in the hippo-campi, thalami and cingulate gyri. At that time, this studyprovided new insights on the role of a functional network ofhuman memory. However, the design of the study did notallow the authors to describe the specificity of brainhypometabolism in KS compared with other amnesia. Thefirst investigation of a group of KS patients was conductedby Joyce et al. in 1994. Nine KS patients had decreased glu-cose metabolism in the cingulate gyrus and precuneus com-pared with control subjects. Hypometabolism in the cingulategyrus was confirmed more recently in its middle (Pitel et al.2009) and posterior (Aupée et al. 2001; Reed et al. 2003)sections. Decreased glucose uptake in this region has beendifferently interpreted according to the authors. For Reedet al. (2003), hypometabolism in the cingulate cortex reflectssecondary effects of brain dysfunction within the Papez’s cir-cuit. This interpretation was challenged by Pitel et al. (2009),whose findings suggested that the cingulate cortex plays a keyrole in the pathophysiology of KS. In effect, the cingulatecortex was found to be 1) the brain region most severelyaffected both morphologically and metabolically in KS, 2)the only brain area to exhibit greater hypometabolism thangray matter hypodensity, and 3) the only brain region showingsignificant gray matter hypodensity and hypometabolism ineach of the 9 KS patients included in this study. Further in-vestigations are required to determine the role of synapticdysfunction in the cingulate cortex in the cascade of patholog-ical events resulting in alcohol-related brain damage.
In agreement with structural abnormalities reported inMRIand postmortem investigations, hypometabolism was alsofound in the thalamus, hippocampi and mammillary bodies(Lechevalier et al. 2000; Aupée et al. 2001; Reed et al.2003; Pitel et al. 2009) of KS patients. Abnormally low glu-cose uptake in those regions has even been found in a singlecase of KS without detectable structural brain damage onMRI(Lechevalier et al. 2000). However, hypometabolism in thethalamus, cingulate cortex and mesial prefrontal cortex waspresent not only in KS patients but in other patients withamnesia (Aupée et al. 2001), suggesting a common networkof synaptic dysfunction in amnesia regardless of etiology.According to Reed et al. (2003), once again, the pattern ofhypometabolism observed in KS is dependent on the methodused for the quantitative normalization.
The combination of FDG-PET and MRI examinationswithin the same sample of subjects provides new clueson the pathophysiology of a disease. As early as 1992,Fazio et al. discussed the apparent discrepancy betweentheir results of decreased uptake of glucose in amnesiafrom various etiologies (KS, cerebrovascular lesions,posthypoxia, and postencephalitis) and the limited struc-tural damage observed on MRI. They concluded thatstructural alteration of limited and selective brain re-gions can result in a global decrease of metabolism inthe entire Papez’s circuit. Another way to examine therelationships between structural damage and abnormalmetabolism is to conduct correlations between MRIand PET data. Using a ROI approach, brain volumesin the right frontal, total frontal, and left thalamic re-gions were related to their glucose metabolism (Reedet al. 2003). Hypometabolism did not reflect structuralabnormalities in the left frontal and temporal (includingmedial temporal) cortices, and in the right thalamus.The direct and quantitative comparison of MRI andPET data revealed that gray matter hypodensity wassignificantly greater than hypometabolism in the cere-bellar hemispheres (Pitel et al. 2009). This relative met-abolic preservation of the cerebellum is in agreementwith a previous report indicating that the severity ofmorphological abnormalities does not correlate with localmetabolic rates in the cerebellum in uncomplicated alcoholism(Gilman et al. 1990), possibly reflecting compensatory mech-anisms within the frontocerebellar circuit (Zahr et al. 2010).The reverse comparison showed the middle cingulate cortexwas the only structure to exhibit greater hypometabolism thangray matter hypodensity, suggesting that hypometabolism inthis structure may not only be due to local neuronal damagebut may also reflect synaptic dysfunction remote from mor-phological damage in other components of the Papez circuit.Hypometabolism in the cingulate cortex may have precededthe structural damage there. Taken together, those findingsindicate that different pathological mechanisms may explain
Neuropsychol Rev

the patterns of structural brain abnormalities andhypometabolism in the frontocerebellar circuit and thePapez’s circuit.
Little is known on the potential recovery of glucose metab-olism with drinking cessation and appropriate treatment. Asingle-case study of a KS patient revealed that sobriety andthiamine over a 9-month period resulted in improvements ofthe clinical state, neuropsychological performance and metab-olism of the temporal and parietal cortices but not thalamus(Fellgiebel et al. 2003). The persistence of hypometabolism inthe thalamus may explain the enduring amnesia of KS. Furtherstudies are required to confirm this hypothesis by examiningwhether disturbed glucose uptake in the thalamus recoverswith sobriety in non-Korsakoff alcoholics. In alcohol-relateddementia, memory disorders and executive dysfunction arereversible after a period of abstinence. Recovery of cognitivecapacities was associated with recovery of glucose metabolismin the diencephalon and basal forebrain in a single case study(Asada et al. 2010). Finally, regarding ataxia, cerebellar metab-olism was elevated in two KS patients with severe gait andbalance disorders but decreased over a 4- and 9-month periodwith recovery of motor functions (Fellgiebel et al. 2004).
Non-KS Amnesia
KS is only one possible etiology for amnesia. In effect, amne-sia has several variants, as shown in Fig. 4, according to its
permanence (transient or permanent amnesia) and its etiology(organic or psychogenic amnesia).
Transient Amnesias
Transient global amnesia (TGA) is a clinical syndrome char-acterized by a profound and circumscribed, yet transient an-terograde and retrograde amnesia, usually associated with re-petitive questioning, without compromise of other neurologicfunctions (Guillery et al. 2000; Hodges and Warlow 1990;Quinette et al. 2006). PET studies conducted in TGA havereported hypometabolism in Papez’s circuit core regions,more specifically in the temporal cortex (Guillery et al.2002; Jia et al. 2002) and amygdala (Guillery et al. 2002).
Transient amnesia may be associated with partial seizures.“Transient Epileptic Amnesia” (TEA) is used to qualify a syn-drome with ictal and interictal memory disturbances as coremanifestations (Heathfield et al. 1973). Results of PET studiesconducted in TEA are in the line with those reported in TGA anddescribed hypometabolism in prefrontal (Mosbah et al. 2014)and medial temporal cortices (Butler and Zeman 2008; Donget al. 2009; Koutroumanidis et al. 2000) of the Papez’s circuit.
Permanent Organic Amnesia
Permanent organic amnesia may result from several medicaldisorders like cerebral infarction, hypoxia or herpes
Fig 4 Variability in the patterns of hypometabolism observed in patientswith anterograde and/or retrograde amnesia. Top: Pitel et al. 2009; com-parison between 9 patients with Korsakoff’s syndrome and 22 controlsubjects, corrected for false discovery rate, k>200 (doi:10.1371/journal.pone.0007748.g001). Right: Eustache et al. 1997; Cerebral blood flow(CBF), oxygen consumption (CMRO2) and oxygen extraction fraction(OEF) PET images quantified from [15]O2 and C[15]O2 images for a
59 year old female patient suffering from Transient Global Amnesia. ForFDG-PET results, see Jia et al. 2002. Bottom: Reed et al. 2005; patterns ofhypometabolism in patients with permanent organic amnesia; two pa-tients with and temporal lesions due to herpes encephalitis (right) andfrontal lesions (left). All figures reproduced with permission, whererequired
Neuropsychol Rev

encephalitis (Markowitsch and Staniloiu 2012). The firststudy that investigated brain metabolism in permanent organicamnesia was conducted in amnesic patients with a variety ofunderlying pathologies and reported hypometabolism in hip-pocampus, thalamus, cingulate gyrus, and frontal basal cortex(Fazio et al. 1992a, b). These results were the first in vivoevidence of the role of the Papez’s circuit as a basis of episodicmemory.
PET studies conducted in amnesic patients with thalamicinfarction (Kopelman 2014) reported hypometabolism in thal-amus but also in connected regions not directly damaged(Clarke et al. 1994; Stenset et al. 2007). Acute hypoxic braindamage due to cardiac or respiratory arrest may also lead tochronic global amnesia. PET studies conducted in patientswith chronic post hypoxic amnesia also reported significanthypometabolim in the thalamus and medial temporal cortex(Kuwert et al. 1993; Markowitsch et al. 1997b; Reed et al.1999). Finally, Reed et al. (2005) found that episodic memoryperformances were associated with retrosplenial and medialtemporal metabolism in patients suffering amnesia followingherpes encephalitis. These studies conducted in permanentorganic amnesia were a major contribution to the validationof Papez’s circuit as the functional brain network of episodicmemory in human.
Dissociative Amnesia
Dissociative amnesia is an extreme functional memory im-pairment caused by trauma or psychological stress (Staniloiuand Markowitsch 2014). Dissociative amnesia is defined by(a) the presence of an extensive retrograde amnesia frequentlyassociated with loss of personal identity and (b) an absence ofmajor anterograde amnesia. Retrograde amnesia is often lim-ited to the episodic component of the autobiographical mem-ory with a relative preservation of semantic memory for per-sonal and general semantic knowledge. For a long time, it wasunclear whether or not functional brain abnormalities typicallyoccur in these patients. However, PET studies provided evi-dence for metabolic changes in cerebral regions involved inmemory processing, including the prefrontal (Markowitschet al. 1997a, c; Piolino et al. 2005; Stracciari et al. 2008;Glisky et al. 2004; Arzy et al. 2011), frontotemporal (Brandet al. 2009; Reinhold et al. 2006; Markowitsch et al. 1998),parietal region (Markowitsch et al. 1997c) and middle tempo-ral cortices (Hennig-Fast et al. 2008; Thomas-Antérion et al.2010; 2014). Follow-up studies have described recovery ofbrain metabolism associated with clinical recovery frommnestic block syndrome. (Thomas-Antérion et al. 2014;Markowitsch et al. 2000). The latter has been defined in theEncyclopedia of Neuroscience (2009) as a type of memorydisorder which first triggers severe retrograde amnesia butwithout marked anterograde amnesia. Patients typically sufferfrom memory loss for personal identity and autobiographical
memories and times during which their minds Bwander .̂Mnestic block syndrome usually triggers severe psychologicalstress like marital conflicts or financial crashes. Episodes areshort lasting, from a few hours to a few days and are usuallysettled over a short period of time.
FDG-PET Investigations in Normal Ageingand Neurodegenerative Diseases
In this section, we provide a view on brain glucose metabo-lism changes related to age and associated neurodegenerativedisorders. Because of its high prevalence and major socio-economic impact, we will focus on Alzheimer’s disease(AD), providing an overview of the FDG-PET findings anddiscussing their interest for both clinical utility and under-standing of underlying pathophysiological mechanisms. Thepattern of AD-related hypometabolism and its specificity willbe discussed on different levels, comparing AD to normalageing and other age-associated neurodegenerative processes,but also comparing FDG-PET abnormalities to other findingsderived from other widely used neuroimaging modalities inAD. In this section, we do not aim to be exhaustive. Instead,the idea is to provide some examples to illustrate the mainbroad concepts related with hypometabolism in ageing anddementia.
Normal Ageing
Whereas global cerebral metabolic rates of glucose has beenshown to be negatively correlated with age (e.g., Tumeh et al.2007), the patterns of age-related regional changes may serveto explain both cognitive decline and preservation. Thus, sev-eral PET studies, conducted to assess regional brain function-ing at rest, have highlighted the deterioration of metabolism inthe frontal and anterior cingulate cortices (Petit-Taboué et al.1998; Willis et al. 2002 ; Yanase et al. 2005 ; Zuendorf et al.2003; Hsieh et al. 2012; Yoshizawa et al. 2014; Kalpouzoset al. 2009a, for review). Within the frontal lobes, the lowerFDG uptake in older than younger adults involves dorsolateraland medial prefrontal cortices and orbitofrontal cortex (Bertiet al. 2014, for review). Such results have been conducted toput forward the frontal hypothesis of cognitive aging.However, even if multiple evidences support this hypothesis,controversies and conflicting data should also be acknowl-edged (Greenwood 2000; West 2000). Indeed, aging beingsuch a multi-determined phenomenon (DeCarlo et al. 2014),it could hardly be accounted for by a unifactorial model.Multiple authors have suggested that the frontal hypothesiscould be refined by assessing distinct frontal sub-regions moreprecisely, taking into account several complementary bio-markers of brain integrity at the same time (Kievit et al.2014), and considering large-scale brain networks rather than
Neuropsychol Rev

focusing on specific regions (Tisserand and Jolles 2003). Age-related metabolic decrease has also been shown in other brainregions, such as the insula, the temporal lobe and the parietallobe (Kalpouzos et al. 2009a; Berti et al. 2014, for review).This is illustrated in Fig. 5 below.
A few investigations have sought to identify those areasthat remain intact, or undergo the least deterioration. The oc-cipital and posterior cingulate cortex, cerebellum, thalamus,basal ganglia and limbic structures have been reported to bethe least altered regions (Kalpouzos et al. 2009a, for review).However some contradictory results have been found, show-ing abnormally low metabolism in the basal ganglia (Herholzet al. 2002), or posterior cingulate cortex (Zuendorf et al.2003). Nevertheless, methodological limitations could explainthese discrepancies, such as the lack of PVE correction(PVEc).
In a previous study (Kalpouzos et al. 2009a), we assessedboth structural and functional deterioration and relative pres-ervation in normal aging in the same sample of 45 healthysubjects aged 20–83 years and using up-to-date methodology(i.e., voxel-based analyses, the optimized-VBM procedureand PVEc). The frontal cortex suffered the greatest deteriora-tion, both structurally and functionally. We also found that thedecrease in FDG uptake affected other neocortical regions,including the parietal and temporal poles. Conversely, the an-terior hippocampus, the thalamus and (functionally) the pos-terior cingulate cortex were the least affected. It is worth not-ing that regarding grey matter loss, the hippocampal head wasfound to be more resilient to the normal aging process than thehippocampal tail. In contrast, a substantial decrease in anteriorhippocampal volume has been observed in AD (e.g., Chételatet al. 2008). Thus, this result signals a major difference be-tween healthy aging and AD. In addition, the hippocampusshowed a lesser degree of metabolic impairment, confirmingthe findings of Willis et al. (2002), who found ‘preserved’hippocampal relative glucose metabolism. Similarly, the con-trast between the relative preservation of the posterior cingu-late cortex in healthy aging and its major metabolic decrease
in prodromal AD, once again reveals a major difference be-tween this neurodegenerative disease and normal aging.
Overall, results from the Kalpouzos et al’s study supportthe developmental theory, postulated byGrieve et al. (2005) toaccount for structural changes in normal aging, which postu-lates that the first regions to emerge phylogenetically and on-togenetically are the most resistant to age effects, the last onesbeing the most vulnerable. This theory can also be applied tometabolic findings measured by FDG uptake.
Finally, the clear opposition between the decline in frontalstructures and the much less alteration of gray matter volumeand FDG uptake of the hippocampal region makes an inter-esting contribution to our understanding not only of age-related memory impairment but also of spared processes inolder subjects. These areas are known to subtend episodicmemory performance, although their roles can be dissociated(Buckner 2004). Some authors have suggested that the frontalcortex may be involved more in the effortful strategic process-es associated withmemory retrieval, while the hippocampus ismainly engaged in the encoding and ecphoric processes (e.g.,Schacter et al. 1996). Thus, the decline in frontal structurescombined with the relative preservation of the hippocampalregion support the idea that episodic memory decline associ-ated with normal aging reflects a failure to implement an effi-cient strategy in the retrieval of episodic memory information,with encoding and ecphoric processes being relatively unaf-fected. In addition, cognitivo-metabolic correlations haveshown that episodic memory decline in normal agingmainly results from prefrontal deterioration (Kalpouzoset al. 2009b). Once again, it is worth noting the contrastwith AD, where genuine episodic memory impairment isassociated with hippocampal dysfunction as shown bycorrelative studies (Desgranges et al. 2002; Chételatet al. 2003a).
Overall, the neurobiological changes in normal aginghighlighted by PET studies support the developmental theorywhereby brain changes follow the phylogenetic and ontoge-netic axes, and are consistent with age-related changes in
Fig 5 Age-related decrease inFDG-PET. Derived fromYoshizawa et al., PsychiatryResearch 2014.(Figure reproduced bypermission)
Neuropsychol Rev

memory performance. Findings also highlight the differencesbetween brain impairment associated with normal aging andthose which characterize Alzheimer’s disease as shown inFig. 6 below.
Alzheimer’s Disease
What is the Profile of Hypometabolism in AD?
Ferris et al. (1980) were the first to describe changes in re-gional brain metabolism in vivo in patients with AD. Whilethe localization was imprecise due to the limited spatial reso-lution of the PET devices at this time, they reported a consis-tent and statistically significant diminution in the rate of glu-cose utilization in the dementia patients as compared to the 3normal older controls in all the brain regions they assessed(temporal, frontal, caudate and thalamus), ranging from 33to 37 %, with very little overlap between the individual valuesof the patients versus the controls. They even reported signif-icant correlations between regional glucose consumption andcognitive performances, already highlighting the relationshipsbetween the severity of dementia and the rate of regional glu-cose utilization that has been consistently demonstrated bythen (and further specified). The authors concluded that Bthisinitial study clearly demonstrates the feasibility of measuringregional metabolic activity in search of correlates of aging andsenile dementia. The PET-FDG approach shows promise formapping the functional activity of the brain as related to be-havior, normal cognition and cognitive dysfunction.Furthermore, our preliminary findings suggest that this tech-nique may have considerable potential as a diagnostic tool.^
This was quite an accurate prediction: 30 years later, therehave been thousands of studies using this technique with morethan 500 in AD, and FDG-PET measure of hypometabolismhas been included in the recommendation criteria for the clin-ical diagnosis of AD (Dubois et al. 2010; McKhann et al.2011). In the last decades, major methodological improve-ments (in PET devices, acquisition and analysis techniques)and the emergence of large-scale studies as the Alzheimer’sDisease Neuroimaging Initiative (ADNI, which now includedFDG-PETscans from 1406 individuals, see Jagust et al. 2015)have greatly refined our knowledge on FDG-PET abnormali-ties over the course of AD.
Early studies already highlighted the heterogeneity ofhypometabolism across brain regions with preferential involve-ment of certain brain regions (the parietal, temporal, and tosome degree, frontal, cortex) while others remained relativelypreserved (primary sensorimotor and visual cortex and cerebel-lum; see e.g., the review by Alavi et al. (1986)). However, it isnot until 1994 that posterior cingulate hypometabolism, nowconsidered to be characteristic of the hypometabolism profileof AD, was described for the first time. This is in part due to thedevelopment of automatic voxel-based methods that allowanalysis of the whole brain (grey matter) without a priori hy-potheses or arbitrary delineation of brain regions. Interestingly,this finding of posterior cingulate hypometabolism has firstbeen published in a letter to the Editor in Lancet that has rep-resented a determinant step in the field (Minoshima et al. 1994).Indeed, not only did the authors highlight the metabolic de-crease in this limbic region in AD, but they also showed thatthis metabolic reduction was present in 3 patients with ADwhowere only questionably demented at the time of scanning,
Fig 6 In healthy aging, thefrontal and parietal corticesmanifest the greatestdeterioration, both structurallyand functionally (blue), while theanterior hippocampus and theposterior cingulate cortex are theleast affected (yellow/green).Conversely, Alzheimer’s diseaseis characterized by early andprominent deterioration of bothhippocampus and posteriorcingulate cortex (red/orange)
Neuropsychol Rev

suggesting that posterior cingulate hypometabolism might al-ready be present at a predementia stage, which is now widelyacknowledged (see below). Thus, FDG-PETstudies consistent-ly reported the presence of hypometabolism in the posteriorcingulate and temporo-parietal cortex already in patients withmild cognitive impairment (MCI) (Chételat et al. 2003a; Nestoret al. 2003a; Nestor et al. 2003b) who have cognitive deficitsbut no dementia and increased risk to develop AD. Note thatFDG-PET results are discrepant for the hippocampus, especial-ly in early stages, which is surprising given the fact that neuro-fibrillary tangles and atrophy first concern this region (see be-low for further discussion on this point).
Recent research conducted in rare clinical variants of ADbrought further insight to the characterization of AD-related pat-tern of hypometabolism (see Fig. 7, right). Lehmann et al. (2013)considered three types of focal, non-amnestic clinical syndromesthat are generally associated with underlying AD pathology: i)early onset AD, with major attentional/executive deficits ii) pos-terior cortical atrophy, characterized by major visuospatial andvisuoperceptual dysfunction, and iii) the logopenic variant ofprimary progressive aphasia, with predominant language defi-cits. All patients showed evidence for beta-amyloid depositionon 11C-labelled Pittsburgh compound B positron emission to-mography (PIB-PET), suggesting that AD pathology was themost likely etiology. Although each group showed specificitiesin their regional pattern of hypometabolism, all three groups hadsignificant hypometabolism in the posterior cingulate andtemporo-parietal cortex, supporting the idea that this pattern isthe typical signature of AD (see Fig. 7, right).
Altogether, hypometabolism in AD typically involves theposterior cingulate and temporo-parietal cortex in earlieststages (Fig. 7, left). As the disease progresses, the frontalneocortex (mostly prefrontal and medial frontal areas) pro-gressively becomes affected (Desgranges et al. 1998; Nestoret al. 2003b). The involvement of the frontal cortex seems toparallel the conversion from a pre-dementia to the dementiastage (Drzezga et al. 2003; Fouquet et al. 2009).Hypometabolism then extends to other neocortical and corti-cal areas inmore severe dementia stages, with primary corticalareas and the cerebellum being the longest preserved.
How Early is Hypometabolism in AD?
As mentioned above, MCI patients already havehypometabolism in the posterior cingulate cortex andtemporo-parietal region (see Fig. 7). This pattern ofhypometabolism has even been reported in an earlier stagein the spectrum of cognitive decline, i.e., in patients with sub-jective cognitive impairment (Scheef et al. 2012) who have amemory complaint but no deficits in objective testing and aremore likely to progress to AD than elderly without complaint(Jessen et al. 2014). Studying cognitively normal older sub-jects and middle-age individuals who carry the ApoE4 allele(which is the main genetic risk factor for sporadic AD), de-crease metabolism in parieto-temporal and posterior cingulateareas has even been detected at this asymptomatic stage(Jagust et al. 2012; Reiman et al. 1996; Small et al. 2000),although results of FDG-PET studies are very discrepant as
Fig. 7 Pattern of hypometabolism in AD. Left: Results from thevoxelwise meta-analysis by Schroeter et al. (2009), combining 9 studiescomparing AD patients to controls (n=401 and 217 respectively) and 3studies comparing MCI patients to controls (n=78 and 70, respectively).Right: Pattern of glucose hypometabolism in three rare clinical variants ofAD: early onset AD (EOAD), the logopenic variant of Primary Progressive
Aphasia (lvPPA) and Posterior Cortical Atrophy (PCA). Although somedifferences exist, all three variants show significant hypometabolism inthe posterior cingulate / precuneus and in the temporo-parietal cortex.Derived from Lehmann et al., Brain 2012 (reproduced by permissionfrom Oxford University Press)
Neuropsychol Rev

regard to the effect of the ApoE4 allele in this early stage(Fouquet et al. 2014). Posterior cingulate and temporo-parietal hypometabolism were consistently found to be asso-ciated with subsequent cognitive decline and AD inpredementia stages ranging from asymptomatic (Jagust et al.2006; Ewers et al. 2014) to MCI (Chételat et al. 2003b;Drzezga et al. 2003) stages. For instance, Jagust et al (2006)reported a correlation between decreased temporo-parietal me-tabolism and increased rate of global cognitive decline in cog-nitively normal individuals, and Chételat et al. reported the samefinding in MCI patients (Chételat et al. 2003b). Accordingly, across sectional study in autosomal dominant AD showed that adecrease of the precuneus metabolism is detectable in presymp-tomatic individuals 10 years before the expected age of symp-tom onset (Bateman et al. 2012). Given the predictive value ofthis measure for AD (see also below), hypometabolism in theseregions is considered as a biomarker that increases the likelihoodof AD etiology in the revised criteria for AD (McKhann et al.2011) including at the MCI (Albert et al. 2011) and preclinical(Sperling et al. 2011) stages. Note that hypometabolism of me-dial temporal structures (hippocampus and/or entorhinal cortex)was also found to predict future conversion to MCI or AD incognitively normal elders (de Leon et al. 2001; Mosconi et al.2008a) but this is less consistently reported across studies (seebelow for further discussion on this structure).
How Does Hypometabolism Relate to Gray Matter Atrophy?
Relevant information as for the physiopathology of the dis-ease arises from the comparison between the profiles of atro-phy and hypometabolism. Thus, several studies have assessedatrophy and hypometabolism in the same patients with AD(Caroli et al. 2010; Jobst et al. 1992; Matsuda et al. 2002;Nestor et al. 2006), or even performed statistical comparisonsbetween both imagingmodalities (Chételat et al. 2008; La Joieet al. 2012). Globally, these data revealed that, in spite of animportant overlap and correlations between the abnormalitieshighlighted by the two neuroimaging modalities (La Joie et al.2012), significant discrepancies exist between both profiles:predominant atrophy is observed in the hippocampus, whilehypometabolism predominates in the posterior associativeareas (temporo-parietal regions and posterior cingulate cor-tex); see Fig. 8, left. This observation raises two questions.The first one, called as the hippocampal paradox, refers to thefact that the hippocampus is known to be the area of earlieststructural and pathological changes (the medial temporal lobeis the first region to be involved by neurofibrillary tangles:Braak and Braak (1991); Delacourte et al. (1999)), but themetabolism of this structure is surprisingly relatively pre-served in earlier stages, or only slightly impaired and signifi-cantly less than the posterior cingulate and temporo-parietalregions (Mevel et al. 2007). Several explanations have beenproposed. One of them was that the lack of hippocampal
hypometabolism reflected methodological issues like partialvolume effects discussed above, especially using voxelwiseanalysis methods (Mosconi et al. 2005). Yet, studies assessingthis question rather invalidated this hypothesis (Mevel et al.2007). Another explanation proposes that the hippocampus isa plastic structure that might be particularly prone to developfunctional compensation mechanisms that would be reflectedin relatively preserved metabolism despite structural alter-ation. While some data might support this view (Dickersonet al. 2005), there is no strong evidence to date.
The second question relates to the disproportionatehypometabolism of posterior associative cortical areas: theseregions are atrophied including at a predementia stage(Chételat et al. 2002), but their hypometabolism is dispropor-tionate and still earlier than atrophy (Chételat et al. 2009; LaJoie et al. 2012; Mevel et al. 2007) . The most consistent hy-pothesis is that this hypometabolism reflects a distant effect ofhippocampal atrophy on the metabolism of posterior associa-tive cortical areas due to disconnection processes. This hypoth-esis is supported by several lines of experimental evidence.First, DTI studies that assess the integrity of white matter tractmicrostructure have shown the particular sensitivity of thewhite matter tracts that connect the hippocampus to the poste-rior cingulate cortex (Zhang et al. 2007; Clerx et al. 2012).Other studies have shown a link between hippocampal atrophyand decreased temporo-parietal metabolism (Meguro et al.2001), or decreased posterior cingulate cortex activity as mea-sured with functional MRI (Rémy et al. 2005). In our lab, wealso tested this hypothesis using a step-by-step multimodal neu-roimaging approach that allowed us to show i) that the hippo-campus volume in AD correlated with the cingulum volume,which itself correlated with, notably, posterior cingulate cortexand temporo-parietal metabolism (Villain et al. 2008; see Fig. 8,right); and ii) that hippocampal atrophy in MCI patients pre-dicted the rate of cingulum atrophy (but not the reverse), andcingulum atrophy in turn predicted the rate of posterior cingu-late cortex and temporo-parietal hypometabolism (but not thereverse) (Villain et al. 2010). The latter evidence suggests acausal link (and sequential relationships) between hippocampalatrophy, cingulum disruption and posterior cingulate cortex /temporo-parietal hypometabolism.
Similar processes are thought to occur as underlying mech-anisms of hypometabolism in other brain areas. Thus, longi-tudinal PET studies have shown that the medial prefrontalregions were also involved at an early stage and especiallyin patients converting from MCI to AD (Drzezga et al. 2003;Fouquet et al. 2009). In addition, Fouquet et al. found thatmetabolism of these regions, and more specifically theanterior cingulate and subgenual areas, correlated with themetabolism in the posterior cingulate cortex and thehippocampus, which the authors interpreted as the reflect ofdisconnection processes from these regions. This wasprecisely what was found in the study by Villain et al.
Neuropsychol Rev

(2010) described above as the hippocampus atrophy also cor-related with the rate of atrophy of the uncinate fasciculus (awhite matter tract connecting this region to orbitofrontal areas)and atrophy in this region correlated with the rate ofhypometabolism in the medial orbitofrontal cortex. Whilethese studies altogether offer strong argument for thediaschisis hypothesis, other mechanisms are likely to inter-vene and might as well explain part of the problem (Chételatet al. 2009).
Overall, it is of note that AD-related changes in glucosemetabolism are not simply reflective of gray matter structural
loss: both imaging modalities provide at least partly comple-mentary information about brain integrity. This point is timelyand of high importance as an increasing number of studies(Knopman et al. 2012; Wirth et al. 2013; Besson et al. 2015)are using structural MRI and FDG-PET to derive biomarkersof “neurodegeneration” or “neuronal injury”, in line with thecurrent dominant model of AD biomarker changes which ag-gregates both imaging modalities (Jack et al. 2013).Therefore, individuals are usually classified according to theirhippocampal volume (obtained from MRI) and/or temporo-parietal metabolism (derived from FDG-PET), considering
Fig. 8 Relationships between hypometabolism and other neuroimagingbiomarkers. Left: Results from a hierarchical cluster analysis showingregional variations in the relative degrees of atrophy (MRI),hypometabolism (FDG-PET) and beta-amyloid deposition (Florbetapir-PET) expressed as age-adjusted Z-scores. Hypometabolism and atrophyare globally found in the same regions although these two biomarkers arenot redundant: atrophy predominates in medial temporal regions whilehypometabolism is the strongest in temporo-parietal regions. On the op-posite, hypometabolism can be found in regions with abundant (temporo-parietal cortices) or little (medial temporal regions) beta-amyloid deposi-tion; on the opposite, frontal regions have maximal beta-amyloid
deposition with relatively weak hypometabolism. Derived from La Joieet al., The Journal of Neuroscience 2012. Right: Relationships betweengray matter atrophy, white matter atrophy and cortical hypometabolism inAD. In a group of 18 patients with AD, atrophy of the hippocampus wasrelated to the shrinkage of the cingulum bundle, which itself was corre-lated with glucose hypometabolism in multiple regions including poste-rior cingulate, right temporo-parietal cortex and thalamus. This illustratesthe hypothesis that local hypometabolism can be at least partly due toinjury in distant brain regions, potentially through disconnection mecha-nisms. Derived from Villain et al., The Journal of Neuroscience 2008. Allfigures reproduced with permission from respective publishers
Neuropsychol Rev

that these two measures are interchangeable. However, recentanalysis of ADNI data (n=585 individuals including cogni-tively intact elders, MCI and demented patients) has suggestedthat there is poor agreement between the multiple indices ofBneuronal injury^ derived from MRI, FDG-PET and cerebro-spinal fluid (Alexopoulos et al. 2014). These results stress theneed to better understand the respective roles and specificitiesof atrophy and hypometabolism to AD pathogenesis but alsofor a clinical use of these imaging methods.
How Does Hypometabolism Relate to Beta-AmyloidDeposition?
Some authors have observed that the topography of beta--amyloid deposition in the brain of patients with AD or MCIor even in beta-amyloid-positive cognitively normal oldersubjects appear quite similar to the topography ofhypometabolism: regions of greatest beta-amyloid depositioninclude the posterior cingulate cortex, temporo-parietal areaand medial frontal cortex (Buckner et al. 2005). However,when directly comparing both modalities in converting im-ages of hypometabolism and beta-amyloid deposition to z-score maps, both patterns, in AD, showed more differencesthan similarities (La Joie et al. 2012, see Fig. 8 left). Thus,there was no direct relationships between the degree ofhypometabolism and beta-amyloid deposition: in some re-gions, both beta-amyloid deposition and hypometabolismwere very significant (e.g., posterior associative areas), butin other brain regions such as the frontal lobe beta-amyloiddeposition was very high but there was almost nohypometabolism. It has been suggested that hypometabolismfollows local beta-amyloid deposition with a temporal delay(Förster et al. 2011) but this does not account for the presenceof strong hypometabolism in regions with low beta-amyloiddeposition (Klupp et al. 2014; La Joie et al. 2012). Instead, ithas been proposed that hypometabolism could be due tothe presence of beta-amyloid in distant but connectedregions (Cohen et al. 2009; Klupp et al. 2014).Further evidence is thus needed for full understandingof the relationships between beta-amyloid depositionand hypometabolism.
When assessing the correlations between both imagesvoxel-to-voxel in demented patients, no significant relation-ship was found; this finding contrasted to the strong correla-tions found between atrophy and hypometabolism in the pos-terior cingulate cortex and temporo-parietal cortex (La Joieet al. 2012). Note that a significant correlation was foundbetween global cortical hypometabolism and beta-amyloiddeposition but only when pooling AD and MCI patients withcontrols in the ADNI (Jagust et al. 2009). Studies assessingthe correlations regions-to-regions reported discrepant find-ings, with a weak but significant link in some studies mostlyin the parietal (less often in the temporal) cortex (Cohen et al.
2009; Edison et al. 2007), but not in the frontal cortex (Edisonet al. 2007; Klunk et al. 2004), while other studies found nosignificant correlation in any brain region (Forsberg et al.2008; La Joie et al. 2012). Finally, in a study assessing bothpositive and negative correlations between beta-amyloid de-position and hypometabolism in controls, MCI and AD, theauthors found almost no significant correlations within thecontrols, relatively strong and mostly positive correlationswithin the MCI, and weak and essentially negative correla-tions within the AD (Cohen et al. 2009). One hypothesis toexplain the positive correlation in the MCI (i.e., higher metab-olism with higher beta-amyloid deposition) is that those withhigher metabolism tolerate more beta-amyloid deposition (be-fore progressing clinically to AD). More recent studies con-ducted in considerable (n≥175) samples of healthy controlshave reported contradicting results: cognitively intact individ-uals with beta-amyloid have been shown to have no (Jagustet al. 2012), subtle (Knopman et al. 2014) or extended (Loweet al. 2014) hypometabolism.
How Does Hypometabolism Relate to Cognitionin Dementia? Insights from Correlational Analysesand Comparison Between Dementia Subtypes
As mentioned previously (see section BWhat is the profile ofhypometabolism in AD?^), the relationships betweenhypometabolism and cognitive deficits have been assessedsince the very first FDG-PET studies of demented patients.Overall, it has been consistently shown that the severity ofhypometabolism parallels cognitive dysfunction. A largenumber of studies have shown negative correlations betweenhypometabolism in specific regions and various measures ofcognition, either global (eg. MMSE) or domain-specific (eg.episodic memory versus language deficits), see Fig. 9 for afew exemples. Overall, studies have shown that distinct cog-nitive deficits are related to the severity of hypometabolism inregions that are known to underlie these specific cognitiveabilities in the healthy brain. For instance, episodic memorydeficits are usually related to hippocampal and posterior cin-gulate hypometabolism (Chételat et al. 2003b; Desgrangeset al. 1998; Nestor et al. 2006), while language and impair-ments are correlated to left lateral temporal and frontalhypometabolism (Desgranges et al. 1998; Furst et al. 2012).
A complementary way to study relationship between cog-nitive deficits and the pattern of brain hypometabolism is toassess FDG-PETabnormalities in other (ie non-AD) dementiasyndromes characterized by distinct patterns of cognitive def-icits (usually non episodic memory predominant). In this sec-tion, we provide an overview of FDG-PET findings in themain other neurodegenerative disorders leading to dementiain elder individuals (see Bohnen et al. 2012; Risacher andSaykin 2013 for recent reviews).
Neuropsychol Rev

Fronto-temporal lobe dementia for instance is a commoncause of early-onset (age <65 years) dementia that approachesAD as the leading cause of presenile dementia (Ratnavalliet al. 2002). It encompasses different clinical variants (behav-ioral-variant FTD, semantic dementia and progressive nonfluent aphasia), characterized by progressive decline inbehavior or language and associated with variable de-grees of frontal and temporal alteration (see Laforce2013 for review and Schroeter et al. 2007 for a meta-analysis of neuroimaging findings). The behavioral-variant of FTD (bvFTD) is characterized by predomi-nant frontal, hypometabolism, together with anteriortemporal deficits (Diehl-Schmid et al. 2007; Kandaet al. 2008; Schroeter et al. 2014). This pattern can distinguishbvFTD from AD with high accuracy (Foster et al. 2007;Rabinovici et al. 2011), although posterior cingulatehypometabolism can be present in some patients with
bvFTD (Mosconi et al. 2008b) and lead to diagnostic errors(Womack et al. 2011). The pattern of hypometabolism relatedto semantic dementia (also sometimes referred to as the tem-poral variant of FTD or semantic variant of primary progres-sive aphasia) has been reported by several groups (Desgrangeset al. 2007; Drzezga et al. 2008; Nestor et al. 2006), whoconsistently showed strong deficits in the temporal lobes witha marked anterior-posterior gradient (the temporal pole beingthe most hypometabolic), and usually a strong left-sided pre-dominance as well. Orbitofrontal/anterior cingulatehypometabolism was also highlighted in some studies(Desgranges et al. 2007; Drzezga et al. 2008; La Joie et al.2014). This pattern seems very consistent when analyzedpatient-by-patient (Iaccarino et al. 2015) and clearly differsfrom AD-related hypometabolism (Drzezga et al. 2008; LaJoie et al. 2014). Indeed, patients with semantic dementia havespared metabolism in the posterior cingulate and angular
Fig. 9 Hypometabolism accompanies cognitive deficits in AD – insightsfrom cognitive-metabolic correlation studies. Top: Results of voxelwisecorrelations between FDG uptake and performances on multiple clinical/neuropsychological test. Disease progression (decreasing MMSE or in-creasing CDRSB scores) was associated with a widespread pattern ofhypometabolism, predominating in temporo-parietal cortices but also in-cluding frontal areas. More specific cognitive deficits, assessed usingfigure copy and verbal fluency are related to more focal patterns ofhypometabolism, ie parieto-occipital and left temporo-parietal cortices
respectively. Derived from Furst et al., Neurobiology of Aging 2012.Bottom: links between specific episodic memory deficits and regionalglucose metabolism in AD patients. During a free recall task, globalperformance is positively correlated to metabolism in medial temporalregions and the posterior cingulate while intrusions are related to rightfrontal hypometabolism. Derived from Desgranges et al., Neuroimage2002 and Desgranges et al., Brain 2002 (all figures reproduced withpermission. Figure from Desgranges et al. Brain 2002 reproduced bypermission from Oxford University Press)
Neuropsychol Rev

gyrus while AD patients have relatively preserved metabolismin the temporal poles and orbitofrontal cortex, with very littleoverlap between values of semantic dementia and AD patients(La Joie et al. 2014; see Fig. 10). In progressive non fluent
aphasia, the rarest of the three syndromes only a few FDG-PET studies have been conducted and they pointed to reducedmetabolism in inferior frontal and insular regions, with a verystrong predominance in the left hemisphere (Nestor et al.
Fig. 10 FDG-PET Comparisons between AD and other dementias. Top:Typical regional hypometabolism patterns in AD, dementia with LewyBody (DLB), frontal variant of fronto temporal dementia (FTD) andtemporal variant of FTD (also called semantic dementia). Patterns arepresented as z score maps based on significantly hypometabolic voxelsrelative to nondemented comparison population. This research wasoriginally published in J Nucl Med. Bohnen et al., Effectiveness andsafety of 18 F-FDG PET in the evaluation of dementia: a review of therecent literature. J Nucl Med. 2012;53(1):59–71. © by the Society ofNuclear Medicine and Molecular Imaging, Inc. Middle Left: voxelwiseanalysis of AD (n=38) versus DLB (n=30). DLB patients have loweroccipital metabolism while AD have lower anterior and medial temporallobe metabolism. This research was originally published in J Nucl Med.Bohnen et al., 18 F-FDG PET and perfusion SPECT in the diagnosis of
Alzheimer and Lewy body dementias. J Nucl Med. 2014;55(12):1959–1965. © by the Society of Nuclear Medicine and Molecular Imaging, Inc.Middle Right: voxelwise analysis of AD (n=18) versus Semantic Dementia(SD, n=13). AD patients have lower posterior cingulate and right angularhypometabolism than patients with SDwhile the opposite contrast revealedclusters in the bilateral anterior temporal and orbitofrontal cortices. Derivedfrom La Joie et al., Neuron 2014. Bottom row: individual patterns ofhypometabolism identified in patients with Mild Cognitive Impairment(MCI) showing the heterogeneity of this clinical entity. For somepatients (from left to right), the FDG-PET abnormalities are suggestiveof AD, DLB, frontal FTD, temporal FTD (semantic dementia). Otherscases (not shown here) suggested other etiologies or showed no specificabnormalities. Derived from Cerami et al., Neuroimage Clinical 2015(figure reproduced with permission)
Neuropsychol Rev

2003c; Rabinovici et al. 2008), consistent with gray matteratrophy studies (Gorno-Tempini et al. 2004).
Contrary to fronto-temporal lobe dementia subtypes, theglucose metabolic changes associated with dementia withLewy Body is not dissimilar to those of AD (Fig. 10).Indeed, patients with dementia with Lewy Body have majordeficits of the posterior cingulate and temporo-parietal corti-ces comparable to AD patients (Kantarci et al. 2012;Minoshima et al. 2001). However, dementia with LewyBody patients show additional occipital hypometabolism,which is associated with visual hallucinations, a key featureof this disease (Kantarci et al. 2012; Perneczky et al. 2008) aswell as higher medial temporal lobe metabolism than ADpatients according to some (Mosconi, et al. 2008b; O’Brienet al. 2014) but not all (Kantarci et al. 2012; Minoshima et al.2001) studies. Occipital hypometabolism has been repeatedlyshown to differentiate patients with AD and dementia withLewy Body (Minoshima et al. 2001; Kantarci et al. 2012;O’Brien et al. 2014).
Interestingly, the patterns of hypometabolism specific toeach of these disorders seem to be detectable at thepredementia stage. A recent study assessing individual deficitsin a heterogeneous group ofMCI patients (Cerami et al. 2015)showed that some patients had patterns of hypometabolismthat were highly similar to those typical of AD, bvFTD, se-mantic dementia, dementia with Lewy Body or corticobasaldegeneration (Fig. 10, bottom); interestingly, these patternshad high predictive prognostic value.
Overall, studies have consistently reported that cognitivedeficits parallel hypometabolism, both in term of severity (theless metabolism, the more severe deficits) and topography (eg.DLB patients have occipital hypometabolism and visual hal-lucinations; bvFTD patients have frontal hypometabolism andexecutive and/or behavioral deficits). This close relationshipto cognition is the reason why FDG-PET (along with struc-turalMRI) is the last biomarker to become abnormal in currentmodels of AD biomarker changes (Jack et al. 2013).
Clinical Value of FDG-PET in Neurodegenerative Disorders
A tremendous number of studies have assessed the ability ofFDG-PET to distinguish AD patients from healthy controls orpatients suffering from other types of dementia, as well as theinterest of this technique to predict future decline in healthyelders or patients with MCI. This section does not aim toprovide an exhaustive review of these studies but rather tohighlight their main conclusions.
At the dementia stage, FDG-PET generally performs wellto distinguish patients from controls: in a meta-analysis,(Bohnen et al. 2012) reported an overall diagnostic accuracyof 93 % (sensitivity: 96 % specificity: 90 %). FDG-PET alsohas prognosis value: multiple studies including a longitudinalclinical follow-up were able to demonstrate the predictive
value of the pattern of hypometabolism associated with ADin showing that, amongst patients with MCI, those who de-veloped ADwithin a few years had lower metabolism in theseregions (Cerami et al. 2015; Chételat et al. 2003b; Drzezgaet al. 2003; Mosconi et al. 2004a, b). A thorough meta-analysis from Frisoni et al. (2013) on the clinical utility ofseveral neuroimaging biomarkers for diagnosis and prognosisshowed that FDG-PET is more accurate than SPECT and hip-pocampal atrophy. It shows similar accuracy as beta-amyloid-PET imaging in the dementia stage, but higher specificity andlower sensitivity at the MCI stage. Similar findings werehighlighted in another meta-analysis: FDG-PET was foundto perform better than structural MRI in terms of positivelikelihood ratio and odds ratio (Yuan et al. 2009). Lastly, ina study directly comparing the accuracy of FDG-PET to struc-tural MRI and beta-amyloid deposition to predict future con-version to dementia in MCI patients, FDG-PET performedsignificantly better than structural MRI and as good as beta--amyloid deposition (Brück et al. 2013).
Eventually, the assessment of brain hypometabolism mayimprove the distinction between AD and other dementias(Mosconi et al. 2008b; Panegyres et al. 2009; Rabinoviciet al. 2011). For instance, it does not only improve diagnosticaccuracy when comparing AD and FTD patients, but also thephysician’s level of confidence in the diagnosis (Foster et al.2007). Compared to beta-amyloid imaging, FDG-PET ap-pears less sensitive, but more specific (when analyzed quanti-tatively) in the AD/FTD comparison (Rabinovici et al. 2011).As mentioned earlier, FDG-PET can also be used to improvethe distinction between AD and dementia with Lewy Bodypatients: occipital hypometabolism distinguished patientswith 90 % sensitivity and 80 % specificity (Minoshima et al.2001) and improves diagnostic accuracy when added to struc-tural MRI and beta-amyloid imaging (Kantarci et al. 2012).
Globally, the vast majority of studies point to the interest ofFDG-PET as a biomarker for positive diagnosis, differentialdiagnosis and prediction of cognitive decline at thepredementia stages. However, strong variations exist amongstudies, and are partly due to the variability in the method usedto analyze FDG-PET data, ranging from visual read,computer-aided visual read using different techniques/softwares (SPM, Neurostat) or quantitative assessment ofAD-related hypometabolism derived from the comparison ofindividual images with a normative reference dataset in apredefined AD mask (Caroli et al. 2012; Prestia et al. 2013).Indeed, the recent meta-analysis by Frisoni et al. mentionedabove (Frisoni et al. 2013) concluded that the metrics (ie anal-ysis method) accounted for an equal or larger amount ofbetween-study variance than markers themselves, and thatFDG-PET was the most variable marker, stressing the needfor better harmonization among groups. Moreover, most stud-ies have shown than combining multiple measures (from neu-roimaging biomarkers, cerebro-spinal fluid biomarkers and
Neuropsychol Rev
neuropsychology) is usually more accurate than any singlemarker alone.
Conclusions and Perspectives
Over the past 3 decades, PET imaging has proven itself to bean important tool for understanding the biological processesthat occur in the healthy and diseased brain. Several radio-tracers have been developed, each allowing diagnosis of thedesired biological process with high sensitivity and specificity.The aim of this review was first to provide a brief understand-ing of PET’s working principle, and the image pre-processingsteps (example, partial volume correction) that are mandatoryfor obtaining accurate PET measurements. FDG-PET hasbeen one of the most popular radiotracers and has contributedto the understanding of many pathologies including gliomas,stroke, traumatic brain injuries and neurodegenerative disor-ders. The field of application of FDG-PET is indeed verybroad and we have limited this review to the research sideand its use to the comprehension of memory disorders, layingemphasis on non-degenerative disorders like Korsakoff’sSyndrome and degenerative pathologies like fronto-temporallobe dementia and Alzheimer’s Disease. Comparison betweenpatient and control groups has revealed the patterns of meta-bolic alterations that exist across these pathologies and corre-lation studies between FDG-PET images and neuropsycho-logical assessments have emphasized the relationship betweencognition/memory and the metabolism of cerebral structures.More importantly, it has shown differences in metabolic alter-ations between pathologies with similar profiles of cognitiveimpairments. This has led to the integration of FDG-PET as aneuroimaging biomarker in the diagnostic criteria forAlzheimer’s Disease (Jack et al. 2011). In those diagnosticcriteria, FDG-PET complements another PET imaging bio-marker that binds to beta-amyloid deposition ([18F]-Florbetapir; [11C]-PiB) and other neuroimaging biomarkerslike structural MRI that allow observation of volume lossacross key structures like the hippocampus. Multimodal neu-roimaging has the global aim of understanding the pathophys-iological mechanism preferably before its onset (in this case,that of AD at a pre-clinical stage). It should be noted thatclinical use of FDG-PET is different from its research use.While it is known to be a valuable tool in clinical diagnosisin the fields of neurology, cardiology and oncology, it is cur-rently mainly used in the latter field (Hoh 2007). This is be-cause FDG-PET remains an expensivemeans of diagnosis andimages are difficult to quantify and interpret, especially in ahospital setting where diagnosis should be quick and straight-forward. The introduction of FDG-PET as an imaging bio-marker in the diagnostic criteria for AD is the result of 3decades of research work which has converged to the point
that it has officially been acknowledged as having an invalu-able clinical use towards early detection of AD.
As noted in the Introduction, the study of brain networks atrest has proven to be so valuable that it has triggered theintroduction of RS-fMRI as an imaging modality. Basically,RS-fMRI (Biswal et al. 1995) allows the observation of struc-tures that are intrinsically active in the absence of an imposedstimulus or behaviourally salient event (Snyder and Raichle2012). It has allowed the observation of key brain networksincluding the Default Mode Network and its alterations acrosspathologies. Despite the observation of similar levels of de-cline in glucose metabolism from FDG-PET and activitylevels within the DMN from resting-state-fMRI (Ewers et al.2011), measurement of glucose metabolism is believed to bemore specific to synaptic activity (Paulson et al. 2010). Yet,both modalities rather complement each other than competeagainst each other (Riedl et al. 2014). RS-fMRI has a temporalresolution that is higher than FDG-PET and makes it ideal forobserving regions that are synchronously activated ordeactivated. Hence, the method works well for identifyingbrain networks at rest and how they are altered in pathologies.However, identifying brain networks at rest implies ‘sorting-out’ signals that have very low frequencies (<0.3 Hz) andthese are often hampered by noise coming from theMRI itself,or other biological processes happening within the humanbody. FDG-PET measures strictly processes occurring at amolecular level and these measurements contain less noise.Correlation studies with cognitive scores or volumes of cere-bral structures are therefore more robust.
Principal disadvantages of PET are its invasive nature andexpense in terms of the cost of the PET scanner, radiotracerproduction, or operating costs that would include blood labo-ratories and specialized staff. Its spatial (typically 4–6 mmFWHM) and temporal resolution is also suboptimal. Yet, itsability to observe biological mechanisms occurring at a mo-lecular level with high sensitivity and specificity supersedesthose high costs and limitations. PET will continue to play amajor role in neuroimaging through the development of newimaging biomarkers (radioligands) that will allow the obser-vation of pathophysiological mechanisms with high accuracy.The development and introduction of simultaneous PET-MRIscanners consolidates the idea that PET is still a highly ac-knowledged functional imaging technique and is likely to re-main so for the medium to longer term. PET-MRI scanners areeffectively an upgrade to the concept of obtaining structuraland functional images of the brain with one machine via thepopular PET-CT scanners. PET-MRI machines, compared toPET-CT ones, not only offer the added benefit of reduceddoses to the subjects under scan, but also the possibility toundergo simultaneous functional MR sequences like RS-fMRI, MR-spectroscopy among others, to better describecell-to-cell interactions. Beyond the methodological advan-tages like co-registered MRI and PET images that will help
Neuropsychol Rev
improve PET data quantification through accurate motion andpartial volume corrections, this system also offers the ability tosimultaneously look at physiological mechanisms with re-spect to factors that potentially alter those mechanisms. Forexample, a lower rate of tracer distribution to a region couldsimply be due to reduced cerebral blood flow. Regional brainperfusion could be simultaneously evaluated using an arterialspin labelling sequence. Another example is the measurementof neurotransmitters via MR-spectroscopy sequence whilelooking at protein synthesis rates of gliomas using PET.FDG-PET, which this review lays focus on, has dominatedthe functional neuroimaging world over the past 3 decadesand has contributed to the understanding of brain functionsin healthy humans and across several neurological disorders.It can be regarded as a tool that complements neuropsycho-logical assessments as it provides a way to describe the globalfunctional profile in the brain. Compared to other radioligandsthat have been developed, FDG-PET is not specific to anybrain circuit and can therefore be used across neurocognitivedisorders. Those disorders in turn have specific regional pat-terns of metabolic abnormalities. Hence, FDG-PETallows theinvestigation of the relationship between synaptic activity andcognitive functions in the healthy brain and how this changeswith the cognitive disorders.
Compliance with ethical standards The authors of this review haveno potential conflicts of interest to disclose. Informed consent has beenapproved, where required, for the figures in this review.
References
Abdul Muneer, P. M., Alikunju, S., Szlachetka, A. M., Mercer, A. J., &Haorah, J. (2011). Ethanol impairs glucose uptake by human astro-cytes and neurons: protective effects of acetyl-L-carnitine.International Journal of Physiology, Pathophysiology andPharmacology, 3(1), 48–56.
Alavi, A., Dann, R., Chawluk, J., Alavi, J., Kushner, M., & Reivich, M.(1986). Positron emission tomography imaging of regional cerebralglucose metabolism. Seminars in Nuclear Medicine, 16(1), 2–34.
Albert, M. S., DeKosky, S. T., Dickson, D., Dubois, B., Feldman, H. H.,Fox, N. C., et al. (2011). The diagnosis of mild cognitive impairmentdue to Alzheimer’s disease: recommendations from the NationalInstitute on Aging-Alzheimer’s Association workgroups on diag-nostic guidelines for Alzheimer’s disease. Alzheimer’s &Dementia: The Journal of the Alzheimer’s Association, 7(3), 270–279. doi:10.1016/j.jalz.2011.03.008.
Alexopoulos, P., Kriett, L., Haller, B., Klupp, E., Gray, K., Grimmer, T.,et al. (2014). Limited agreement between biomarkers of neuronalinjury at different stages of Alzheimer’s disease. Alzheimer’s &Dementia: The Journal of the Alzheimer’s Association, 10(6), 684–689. doi:10.1016/j.jalz.2014.03.006.
Andersson, J. L. (1997). How to estimate global activity independent ofchanges in local activity. NeuroImage, 6(4), 237–244. doi:10.1006/nimg.1997.0302.
Andreasen, N. C., Arndt, S., Cizadlo, T., O’Leary, D. S., Watkins, G. L.,Ponto, L. L., & Hichwa, R. D. (1996). Sample size and statistical
power in [15O]H2O studies of human cognition. Journal ofCerebral Blood Flow and Metabolism, 16(5), 804–16.
Arzy, S., Collette, S., Wissmeyer, M., Lazeyras, F., Kaplan, P. W., &Blanke, O. (2011). Psychogenic amnesia and self-identity: a multi-modal functional investigation. European Journal of Neurology,18(12), 1422–5.
Asada, T., Takaya, S., Takayama, Y., Yamauchi, H., Hashikawa, K., &Fukuyama, H. (2010). Reversible alcohol-related dementia: a five-year follow-up study using FDG-PET and neuropsychological tests.Internal Medicine, 49, 283–287.
Ashburner, J., & Friston, K. J. (2000). Voxel-based morphometry—themethods. NeuroImage, 11, 805–821.
Ashburner, J. (2007). A fast diffeomorphic image registration algorithm.NeuroImage, 38, 95–113.
Aupée, A. M., Desgranges, B., Eustache, F., Lalevée, C., de La Sayette,V., Viader, F., et al. (2001). Voxel-based mapping of brainhypometabolism in permanent amnesia with PET. NeuroImage,13, 1164–1173.
Baron, J. C., Bousser, M. G., Comar, D., & Castaigne, P. (1981).BCrossed cerebellar diaschisis^ in human supratentorial brain infarc-tion. Transactions of the American Neurological Association, 105,459–61.
Bateman, R. J., Xiong, C., Benzinger, T. L. S., Fagan, A. M., Goate, A.,Fox, N. C., et al. (2012). Clinical and biomarker changes in domi-nantly inherited Alzheimer’s disease. New England Journal ofMedicine, 367(9), 795–804. doi:10.1056/NEJMoa1202753.
Berti, V., Mosconi, L., & Pupi, A. (2014). Brain: normal variations andbenign findings in fluorodeoxyglucose-PET/computed tomographyimaging. PET Clinics, 9(2), 129–140. doi:10.1016/j.cpet.2013.10.006.
Besson, F. L., La Joie, R., Doeuvre, L., Gaubert, M., Mézenge, F., Egret,S., et al. (2015). Cognitive and brain profiles associated with currentneuroimaging biomarkers of preclinical Alzheimer’s disease. TheJournal of Neuroscience: The Official Journal of the Society forNeuroscience, 35(29), 10402–10411. doi:10.1523/JNEUROSCI.0150-15.2015.
Bishu, S., Schmidt, K. C., Burlin, T., Channing, M., Conant, S., Huang,T., et al. (2008). Regional rates of cerebral protein synthesis mea-sured with L-[1-11C]leucine and PET in conscious, young adultmen: normal values, variability, and reproducibility. Journal ofCerebral Blood Flow and Metabolism: Official Journal of theInternational Society of Cerebral Blood Flow and Metabolism,28(8), 1502–1513. doi:10.1038/jcbfm.2008.43.
Biswal, B., Yetkin, F. Z., Haughton, V. M., & Hyde, J. S. (1995).Functional connectivity in the motor cortex of resting human brainusing echo-planar MRI. Magnetic Resonance in Medicine: OfficialJournal of the Society of Magnetic Resonance in Medicine / Societyof Magnetic Resonance in Medicine, 34(4), 537–541.
Bloomfield, P. M., Spinks, T. J., Reed, J., Schnorr, L., Westrip, A. M.,Livieratos, L., et al. (2003). The design and implementation of amotion correction scheme for neurological PET. Physics inMedicine and Biology, 48(8), 959–978.
Bohnen, N. I., Djang, D. S. W., Herholz, K., Anzai, Y., & Minoshima, S.(2012). Effectiveness and safety of 18F-FDG PET in the evaluationof dementia: a review of the recent literature. Journal of NuclearMedicine: Official Publication, Society of Nuclear Medicine, 53(1),59–71. doi:10.2967/jnumed.111.096578.
Braak, H., & Braak, E. (1991). Neuropathological stageing of Alzheimer-related changes. Acta Neuropathologica, 82(4), 239–259.
Brand, M., Eggers, C., Reinhold, N., Fujiwara, E., Kessler, J., Heiss, W.D., & Markowitsch, H. J. (2009). Functional brain imaging in 14patients with dissociative amnesia reveals right inferolateral prefron-tal hypometabolism. Psychiatry Research, 174(1), 32–9.
Brück, A., Virta, J. R., Koivunen, J., Koikkalainen, J., Scheinin, N. M.,Helenius, H., et al. (2013). [11C]PIB, [18F]FDG andMR imaging inpatients with mild cognitive impairment. European Journal of
Neuropsychol Rev

Nuclear Medicine and Molecular Imaging, 40(10), 1567–1572. doi:10.1007/s00259-013-2478-8.
Buckner, R. L. (2004). Memory and executive function in aging and AD:multiple factors that cause decline and reserve factors that compen-sate. Neuron, 44(1), 195–208. doi:10.1016/j.neuron.2004.09.006.
Buckner, R. L., Snyder, A. Z., Shannon, B. J., LaRossa, G., Sachs, R.,Fotenos, A. F., et al. (2005). Molecular, structural, and functionalcharacterization of Alzheimer’s disease: evidence for a relationshipbetween default activity, amyloid, and memory. The Journal ofNeuroscience: The Official Journal of the Society forNeuroscience, 25(34), 7709–7717. doi:10.1523/JNEUROSCI.2177-05.2005.
Butler, C. R., & Zeman, A. (2008). A case of transient epileptic amnesiawith radiological localization. Nature Clinical Practice. Neurology,4(9), 516–21.
Caroli, A., Lorenzi, M., Geroldi, C., Nobili, F., Paghera, B., Bonetti, M.,et al. (2010). Metabolic compensation and depression inAlzheimer’s disease. Dementia and Geriatric Cognitive Disorders,29(1), 37–45. doi:10.1159/000257761.
Caroli, A., Prestia, A., Chen, K., Ayutyanont, N., Landau, S. M.,Madison, C. M., et al. (2012). Summary metrics to assessAlzheimer disease-related hypometabolic pattern with 18F-FDGPET: head-to-head comparison. Journal of Nuclear Medicine:Official Publication, Society of Nuclear Medicine, 53(4), 592–600.doi:10.2967/jnumed.111.094946.
Cerami, C., Della Rosa, P. A., Magnani, G., Santangelo, R., Marcone, A.,Cappa, S. F., & Perani, D. (2015). Brain metabolic maps in mildcognitive impairment predict heterogeneity of progression to de-mentia. NeuroImage. Clinical, 7, 187–194. doi:10.1016/j.nicl.2014.12.004.
Chételat, G., Desgranges, B., de La Sayette, V., Viader, F., Berkouk, K.,Landeau, B., et al. (2003a). Dissociating atrophy andhypometabolism impact on episodic memory in mild cognitive im-pairment. Brain, 126(Pt 9), 1955–1967.
Chételat, G., Desgranges, B., de La Sayette, V., Viader, F., Eustache, F., &Baron, J.-C. (2003b). Mild cognitive impairment: can FDG-PETpredict who is to rapidly convert to Alzheimer’s disease?Neurology, 60(8), 1374–1377.
Chételat, G., Desgranges, B., Landeau, B., Mézenge, F., Poline, J. B., deLa Sayette, V., et al. (2008). Direct voxel-based comparison betweengrey matter hypometabolism and atrophy in Alzheimer’s disease.Brain: A Journal of Neurology, 131(Pt 1), 60–71. doi:10.1093/brain/awm288.
Chételat, G., Villain, N., Desgranges, B., Eustache, F., & Baron, J.-C.(2009). Posterior cingulate hypometabolism in early Alzheimer’sdisease: what is the contribution of local atrophy versus disconnec-tion? Brain: A Journal of Neurology, 132(Pt 12), e133. doi:10.1093/brain/awp253. author reply e134.
Chételat, G., Desgranges, B., de La Sayette, V., Viader, F., Eustache, F., &Baron, J.-C. (2002). Mapping gray matter loss with voxel-basedmorphometry in mild cognitive impairment. Neuroreport, 13(15),1939–1943.
Clarke, S., Assal, G., Bogousslavsky, J., Regli, F., Townsend, D. W.,Leenders, K. L., & Blecic, S. (1994). Pure amnesia after unilateralleft polar thalamic infarct: topographic and sequential neuropsycho-logical and metabolic (PET) correlations. Journal of Neurology,Neurosurgery, and Psychiatry, 57(1), 27–34.
Clerx, L., Visser, P. J., Verhey, F., & Aalten, P. (2012). NewMRI markersfor Alzheimer’s disease: a meta-analysis of diffusion tensor imagingand a comparison with medial temporal lobemeasurements. Journalof Alzheimer’s Disease: JAD, 29(2), 405–429. doi:10.3233/JAD-2011-110797.
Cohen, A. D., Price, J. C., Weissfeld, L. A., James, J., Rosario, B. L., Bi,W., et al. (2009). Basal cerebral metabolism may modulate the cog-nitive effects of Abeta in mild cognitive impairment: an example ofbrain reserve. The Journal of Neuroscience: The Official Journal of
the Society for Neuroscience, 29(47), 14770–14778. doi:10.1523/JNEUROSCI.3669-09.2009.
Cunningham, V. J., Hume, S. P., Price, G. R., Ahier, R. G., Cremer, J. E.,& Jones, A. K. (1991). Compartmental analysis of diprenorphinebinding to opiate receptors in the rat in vivo and its comparison withequilibrium data in vitro. Journal of Cerebral Blood Flow andMetabolism: Official Journal of the International Society ofCerebral Blood Flow and Metabolism, 11(1), 1–9. doi:10.1038/jcbfm.1991.1.
Dao-Castellana, M., Samson, Y., Legault, F., Martinot, J., Aubin, H.,Crouzel, C., et al. (1998). Frontal dysfunction in neurologically nor-mal chronic alcoholic subjects: metabolic and neuropsychologicalfindings. Psychological Medicine, 28(05), 1039–1048.
Day, E., Bentham, P., & Callaghan, R. (2008). Thiamine for wernicke-korsakoff syndrome in people at risk from alcohol abuse. Chichetser:Wiley.
De Leon, M. J., Convit, A., Wolf, O. T., Tarshish, C. Y., DeSanti, S.,Rusinek, H., et al. (2001). Prediction of cognitive decline in normalelderly subjects with 2-[(18)F]fluoro-2-deoxy-D-glucose/poitron-emission tomography (FDG/PET). Proceedings of the NationalAcademy of Sciences of the United States of America, 98(19),10966–10971. doi:10.1073/pnas.191044198.
DeCarlo, C. A., Tuokko, H. A., Williams, D., Dixon, R. A., &MacDonald, S. W. S. (2014). BioAge: toward a multi-determined,mechanistic account of cognitive aging. Ageing Research Reviews,18, 95–105. doi:10.1016/j.arr.2014.09.003.
Delacourte, A., David, J., Sergeant, N., Buee, L., Wattez, A., Vermersch,P., et al. (1999). The biochemical pathway of neurofibrillary degen-eration in aging and Alzheimer’s disease. Neurology, 52(6), 1158.
Desgranges, B., Baron, J. C., de La Sayette, V., Petit-Taboué, M. C.,Benali, K., Landeau, B., et al. (1998). The neural substrates of mem-ory systems impairment in Alzheimer’s disease. A PET study ofresting brain glucose utilization. Brain: A Journal of Neurology,121(Pt 4), 611–631.
Desgranges, B., Baron, J.-C., Lalevée, C., Giffard, B., Viader, F., de LaSayette, V., & Eustache, F. (2002). The neural substrates of episodicmemory impairment in Alzheimer’s disease as revealed by FDG-PET: relationship to degree of deterioration. Brain: A Journal ofNeurology, 125(Pt 5), 1116–1124.
Desgranges, B., Matuszewski, V., Piolino, P., Chételat, G., Mézenge, F.,Landeau, B., et al. (2007). Anatomical and functional alterations insemantic dementia: a voxel-based MRI and PET study.Neurobiology of Aging, 28(12), 1904–1913. doi:10.1016/j.neurobiolaging.2006.08.006.
Dickerson, B. C., Salat, D. H., Greve, D. N., Chua, E. F., Rand-Giovannetti, E., Rentz, D. M., et al. (2005). Increased hippocampalactivation in mild cognitive impairment compared to normal agingand AD. Neurology, 65(3), 404–411. doi:10.1212/01.wnl.0000171450.97464.49.
Diehl-Schmid, J., Grimmer, T., Drzezga, A., Bornschein, S.,Riemenschneider, M., Förstl, H., et al. (2007). Decline of cerebralglucose metabolism in frontotemporal dementia: a longitudinal 18F-FDG-PET-study. Neurobiology of Aging, 28(1), 42–50. doi:10.1016/j.neurobiolaging.2005.11.002.
Dong, C., Sriram, S., Delbeke, D., Al-Kaylani, M., Arain, A. M., Singh,P., McLean, M. J., & Abou-Khalil, B. (2009). Aphasic or amnesicstatus epilepticus detected on PET but not EEG. Epilepsia, 50(2),251–5.
Drzezga, A., Arnold, S., Minoshima, S., Noachtar, S., Szecsi, J., Winkler,P., et al. (1999). 18F-FDG PET studies in patients withextratemporal and temporal epilepsy: evaluation of an observer-independent analysis. Journal of Nuclear Medicine: OfficialPublication, Society of Nuclear Medicine, 40(5), 737–746.
Drzezga, A., Grimmer, T., Henriksen, G., Stangier, I., Perneczky, R.,Diehl-Schmid, J., et al. (2008). Imaging of amyloid plaques andcerebral glucose metabolism in semantic dementia and
Neuropsychol Rev

Alzheimer’s disease. NeuroImage, 39(2), 619–633. doi:10.1016/j.neuroimage.2007.09.020.
Drzezga, A., Lautenschlager, N., Siebner, H., Riemenschneider, M.,Willoch, F., Minoshima, S., et al. (2003). Cerebral metabolic chang-es accompanying conversion of mild cognitive impairment intoAlzheimer’s disease: a PET follow-up study. European Journal ofNuclear Medicine and Molecular Imaging, 30(8), 1104–1113. doi:10.1007/s00259-003-1194-1.
Dubois, B., Feldman, H. H., Jacova, C., Cummings, J. L., Dekosky, S. T.,Barberger-Gateau, P., et al. (2010). Revising the definition ofAlzheimer’s disease: a new lexicon. Lancet Neurology, 9(11),1118–1127. doi:10.1016/S1474-4422(10)70223-4.
Edison, P., Archer, H. A., Hinz, R., Hammers, A., Pavese, N., Tai, Y. F.,et al. (2007). Amyloid, hypometabolism, and cognition inAlzheimer disease: an [11C]PIB and [18F]FDG PET study.Neurology, 68(7), 501–508. doi:10.1212/01.wnl.0000244749.20056.d4.
Eggers, C., Schwartz, F., Pedrosa, D. J., Kracht, L., & Timmermann, L.(2014). Parkinson’s disease subtypes show a specific link betweendopaminergic and glucose metabolism in the striatum. PloS One,9(5), e96629. doi:10.1371/journal.pone.0096629.
Eustache, F., & Desgranges, B. (2008). MNESIS: towards the integrationof current multisystemmodels of memory.Neuropsychol Rev, 18(1),53–69. doi:10.1007/s11065-008-9052-3.
Eustache, F., Desgranges, B., Petit-Taboué, M. C., de La Sayette, V., Piot,V., Sablé, C., et al. (1997). Transient global amnesia: implicit/explic-it memory dissociation and PET assessment of brain perfusionandoxygen metabolism in the acute stage. Journal of Neurology,Neurosurgery, and Psychiatry, 63(3), 357–367.
Eustache, F., Piolino, P., Giffard, B., Viader, F., de La Sayette, V., Baron,J.-C., & Desgranges, B. (2004). BIn the course of time^: a PETstudyof the cerebral substrates of autobiographical amnesia inAlzheimer’s disease. Brain: A Journal of Neurology, 127(Pt 7),1549–1560. doi:10.1093/brain/awh166.
Ewers, M., Sperling, R. A., Klunk, W. E., Weiner, M. W., & Hampel, H.(2011). Neuroimaging markers for the prediction and early diagno-sis of Alzheimer’s disease dementia. Trends in Neurosciences,34(8), 430–442. doi:10.1016/j.tins.2011.05.005.
Ewers, M., Brendel, M., Rizk-Jackson, A., Rominger, A., Bartenstein, P.,Schuff, N., et al. (2014). Reduced FDG-PET brain metabolism andexecutive function predict clinical progression in elderly healthysubjects. NeuroImage. Clinical, 4, 45–52. doi:10.1016/j.nicl.2013.10.018.
Fan, Z., Aman, Y., Ahmed, I., Chetelat, G., Landeau, B., Ray Chaudhuri,K., et al. (2014). Influence of microglial activation on neuronalfunction in Alzheimer’s and Parkinson’s disease dementia.Alzheimer’s & Dementia: The Journal of the Alzheimer ’sAssociation. doi:10.1016/j.jalz.2014.06.016.
Fazio, F., Perani, D., Gilardi, M. C., Colombo, F., Cappa, S. F., Vallar, G.,Bettinardi, V., Paulesu, E., Alberoni, M., Bressi, S., et al. (1992a).Metabolic impairment in human amnesia: a PET study of memorynetworks. Journal of Cerebral Blood Flow and Metabolism, 12(3),353–8.
Fazio, F., Perani, D., Gilardi, M. C., Colombo, F., Cappa, S. F., Vallar, G.,et al. (1992b). Metabolic impairment in human amnesia: a PETstudy of memory networks. Journal of Cerebral Blood Flow andMetabolism, 12, 353–358.
Feldmann, M., Asselin, M.-C., Liu, J., Wang, S., McMahon, A., Anton-Rodriguez, J., et al. (2013). P-glycoprotein expression and functionin patients with temporal lobe epilepsy: a case–control study. TheLancet. Neurology, 12(8), 777–785. doi:10.1016/S1474-4422(13)70109-1.
Fellgiebel, A., Scheurich, A., Siessmeier, T., Schmidt, L. G., &Bartenstein, P. (2003). Persistence of disturbed thalamic glucosemetabolism in a case of Wernicke-Korsakoff syndrome. PsychiatryResearch, 124, 105–112.
Fellgiebel, A., Siessmeier, T., Winterer, G., Luddens, H., Mann, K.,Schmidt, L. G., et al. (2004). Increased cerebellar PET glucose me-tabolism corresponds to ataxia in Wernicke-Korsakoff syndrome.Alcohol and Alcoholism, 39, 150–153.
Ferris, S. H., de Leon, M. J., Wolf, A. P., Farkas, T., Christman, D. R.,Reisberg, B., et al. (1980). Positron emission tomography in thestudy of aging and senile dementia. Neurobiology of Aging, 1(2),127–131.
Forsberg, A., Engler, H., Almkvist, O., Blomquist, G., Hagman, G., Wall,A., et al. (2008). PET imaging of amyloid deposition in patients withmild cognitive impairment. Neurobiology of Aging, 29(10), 1456–1465. doi:10.1016/j.neurobiolaging.2007.03.029.
Förster, S., Grimmer, T., Miederer, I., Henriksen, G., Yousefi, B. H.,Graner, P., et al. (2011). Regional expansion of hypometabolism inAlzheimer’s disease follows amyloid deposition with temporal de-lay. Biological Psychiatry.
Foster, N. L., Heidebrink, J. L., Clark, C. M., Jagust, W. J., Arnold, S. E.,Barbas, N. R., et al. (2007). FDG-PET improves accuracy indistinguishing frontotemporal dementia and Alzheimer’s disease.Brain: A Journal of Neurology, 130(Pt 10), 2616–2635. doi:10.1093/brain/awm177.
Fouquet, M., Besson, F. L., Gonneaud, J., La Joie, R., & Chételat, G.(2014). Imaging brain effects of APOE4 in cognitively normal indi-viduals across the lifespan. Neuropsychology Review, 24(3), 290–299. doi:10.1007/s11065-014-9263-8.
Fouquet, M., Desgranges, B., Landeau, B., Duchesnay, E., Mézenge, F.,de La Sayette, V., et al. (2009). Longitudinal brain metabolic chang-es from amnestic mild cognitive impairment to Alzheimer’s disease.Brain: A Journal of Neurology, 132(Pt 8), 2058–2067. doi:10.1093/brain/awp132.
Frisoni, G. B., Bocchetta, M., Chételat, G., Rabinovici, G. D., de Leon,M. J., Kaye, J., et al. (2013). Imaging markers for Alzheimer dis-ease: which vs how. Neurology, 81(5), 487–500. doi:10.1212/WNL.0b013e31829d86e8.
Furst, A. J., Rabinovici, G. D., Rostomian, A. H., Steed, T., Alkalay, A.,Racine, C., Miller, B. L., & Jagust, W. J. (2012). Cognition, glucosemetabolism and amyloid burden in Alzheimer’s disease.Neurobiology of Aging, 33(2), 215–225.
Gilman, S., Adams, K., Koeppe, R. A., Berent, S., Kluin, K. J., Modell, J.G., et al. (1990). Cerebellar and frontal hypometabolism in alcoholiccerebellar degeneration studied with positron emission tomography.Annals of Neurology, 28, 775–785.
Glaudemans, A. W. J. M., Enting, R. H., Heesters, M. A. A. M., Dierckx,R. A. J. O., van Rheenen, R.W. J.,Walenkamp, A.M. E., & Slart, R.H. J. A. (2013). Value of 11C-methionine PET in imaging braintumours and metastases. European Journal of Nuclear Medicineand Molecular Imaging, 40(4), 615–635. doi:10.1007/s00259-012-2295-5.
Glisky, E. L., Ryan, L., Reminger, S., Hardt, O., Hayes, S. M., Hupbach,A. (2004). A case of psychogenic fugue: I understand, aber ichverstehe nichts. Neuropsychologia, 42(8), 1132–1147.
Gorno-Tempini, M. L., Dronkers, N. F., Rankin, K. P., Ogar, J. M.,Phengrasamy, L., Rosen, H. J., et al. (2004). Cognition and anatomyin three variants of primary progressive aphasia. Annals ofNeurology, 55(3), 335–346. doi:10.1002/ana.10825.
Greenwood, P. M. (2000). The frontal aging hypothesis evaluated.Journal of the International Neuropsychological Society: JINS,6(6), 705–726.
Grieve, S. M., Clark, C. R., Williams, L. M., Peduto, A. J., & Gordon, E.(2005). Preservation of limbic and paralimbic structures in aging.Human Brain Mapping, 25(4), 391–401.
Groussard, M., Viader, F., Hubert, V., Landeau, B., Abbas, A.,Desgranges, B., et al. (2010). Musical and verbal semantic memory:two distinct neural networks? NeuroImage, 49(3), 2764–2773. doi:10.1016/j.neuroimage.2009.10.039.
Neuropsychol Rev

Guillery, B., Desgranges, B., Piolino, P., Laville, P., de La Sayette, V., &Eustache, F. (2000). Extensive temporally graded retrograde amne-sia for personal-episodic facts in transient global amnesia.Neurocase, 6, 101–105.
Guillery, B., Desgranges, B., de La Sayette, V., Landeau, B., Eustache, F.,& Baron, J. C. (2002). Transient global amnesia: concomitant epi-sodic memory and positron emission tomography assessment in twoadditional patients. Neuroscience Letters, 325(1), 62–6.
Haense, C., Kalbe, E., Herholz, K., Hohmann, C., Neumaier, B., Krais,R., & Heiss, W.-D. (2012). Cholinergic system function and cogni-tion in mild cognitive impairment. Neurobiology of Aging, 33(5),867–877. doi:10.1016/j.neurobiolaging.2010.08.015.
Heathfield, K. W. G., Croft, P. B., & Swash, M. (1973). The syndrome oftransient global amnesia. Brain, 96, 729–36.
Hennig-Fast, K., Meister, F., Frodl, T., Beraldi, A., Padberg, F., Engel, R.R., Reiser, M., Möller, H. J., & Meindl, T. (2008). A case of persis-tent retrograde amnesia following a dissociative fugue: neuropsy-chological and neurofunctional underpinnings of loss of autobio-graphical memory and self-awareness. Neuropsychologia, 46(12),2993–3005.
Herholz, K. (2014). Guidance for reading FDG PET scans in dementiapatients. The quarterly journal of nuclear medicine and molecularimaging: official publication of the Italian Association of NuclearMedicine (AIMN) [and] the International Association ofRadiopharmacology (IAR), [and] Section of the Society ofRadiopharmaceutical Chemistry and Biology, 58(4), 332–343.
Herholz, K., & Ebmeier, K. (2011). Clinical amyloid imaging inAlzheimer’s disease. The Lancet. Neurology, 10(7), 667–670. doi:10.1016/S1474-4422(11)70123-5.
Herholz, K., Salmon, E., Perani, D., Baron, J. C., Holthoff, V., Frölich, L.,et al. (2002). Discrimination between Alzheimer dementia and con-trols by automated analysis of multicenter FDG PET. NeuroImage,17(1), 302–316.
Hoh, C. K. (2007). Clinical use of FDG PET. Nuclear Medicine andBiology, 34(7), 737–42.
Hodges, J. R., & Warlow, C. P. (1990). The aetiology of transient globalamnesia. A case–control study of 114 cases with prospective follow-up. Brain, 113(3), 639–57.
Hoffman, E. J., Huang, S. C., & Phelps, M. E. (1979). Quantitation inpositron emission computed tomography: 1. Effect of object size.Journal of Computer Assisted Tomography, 3(3), 299–308.
Hsieh, T.-C., Lin,W.-Y., Ding, H.-J., Sun, S.-S., Wu, Y.-C., Yen, K.-Y., &Kao, C.-H. (2012). Sex- and age-related differences in brain FDGmetabolism of healthy adults: an SPM analysis. Journal ofNeuroimaging: Official Journal of the American Society ofNeuroimaging, 22(1), 21–27. doi:10.1111/j.1552-6569.2010.00543.x.
Hubert, V., Beaunieux, H., Chételat, G., Platel, H., Landeau, B., Danion,J. M., et al. (2007). The dynamic network subserving the threephases of cognitive procedural learning. Human Brain Mapping,28(12), 1415–1429.
Iaccarino, L., Crespi, C., Della Rosa, P. A., Catricalà, E., Guidi, L.,Marcone, A., et al. (2015). The semantic variant of primary progres-sive aphasia: clinical and neuroimaging evidence in single subjects.PloS One, 10(3), e0120197. doi:10.1371/journal.pone.0120197.
Ichise, M., Liow, J.-S., Lu, J.-Q., Takano, A., Model, K., Toyama, H.,et al. (2003). Linearized reference tissue parametric imagingmethods: application to [11C]DASB positron emission tomographystudies of the serotonin transporter in human brain. Journal ofCerebral Blood Flow and Metabolism: Official Journal of theInternational Society of Cerebral Blood Flow and Metabolism,23(9), 1096–1112. doi:10.1097/01.WCB.0000085441.37552.CA.
Jack, C. R. Jr, Albert, M. S., Knopman, D. S., McKhann, G.M., Sperling,R. A., Carrillo, M. C., et al. (2011). Introduction to the recommen-dations from the National Institute on Aging-Alzheimer’s
Association workgroupson diagnostic guidelines for Alzheimer’sdisease. Alzheimers Dement, 7(3), 257–262.
Jack, C. R., Jr., Knopman, D. S., Jagust,W. J., Petersen, R. C., Weiner, M.W., Aisen, P. S., et al. (2013). Tracking pathophysiological processesin Alzheimer’s disease: an updated hypothetical model of dynamicbiomarkers. Lancet Neurology, 12(2), 207–216. doi:10.1016/S1474-4422(12)70291-0.
Jagust,W. J., Gitcho, A., Sun, F., Kuczynski, B., Mungas, D., &Haan,M.(2006). Brain imaging evidence of preclinical Alzheimer’s diseasein normal aging. Annals of Neurology, 59(4), 673–681. doi:10.1002/ana.20799.
Jagust, W. J., Landau, S.M., Shaw, L. M., Trojanowski, J. Q., Koeppe, R.A., Reiman, E. M., et al. (2009). Relationships between biomarkersin aging and dementia. Neurology, 73(15), 1193–1199. doi:10.1212/WNL.0b013e3181bc010c.
Jagust, W. J., Landau, S. M., & Alzheimer’s Disease NeuroimagingInitiative. (2012). Apolipoprotein E, not fibrillarβ-amyloid, reducescerebral glucose metabolism in normal aging. The Journal ofNeuroscience: The Official Journal of the Society forNeuroscience, 32(50), 18227–18233. doi:10.1523/JNEUROSCI.3266-12.2012.
Jagust, W. J., Landau, S. M., Koeppe, R. A., Reiman, E. M., Chen, K.,Mathis, C. A., et al. (2015). The Alzheimer’s disease neuroimaginginitiative 2 PETcore: 2015. Alzheimer’s &Dementia: The Journal ofthe Alzheimer’s Association, 11(7), 757–771. doi:10.1016/j.jalz.2015.05.001.
Jessen, F., Amariglio, R. E., van Boxtel, M., Breteler, M., Ceccaldi, M.,Chételat, G., et al. (2014). A conceptual framework for research onsubjective cognitive decline in preclinical Alzheimer’s disease.Alzheimer’s & Dementia: The Journal of the Alzheimer ’sAssociation, 10(6), 844–852. doi:10.1016/j.jalz.2014.01.001.
Jia, J., Wang, L., Yin, L., & Tang, H. (2002). Contrast study on cognitivefunction with MRI and positron emission tomography imaging intransient global amnesia. Chinese Medical Journal, 115(9), 1321–3.
Jobst, K., Smith, A., Barker, C., Wear, A., King, E., Smith, A., et al.(1992). Association of atrophy of the medial temporal lobe withreduced blood flow in the posterior parietotemporal cortex in pa-tients with a clinical and pathological diagnosis of Alzheimer’s dis-ease. Journal of Neurology, Neurosurgery & Psychiatry, 55(3), 190.
Jueptner, M., &Weiller, C. (1995). Review: does measurement of region-al cerebral blood flow reflect synaptic activity? Implications for PETand fMRI. NeuroImage, 2(2), 148–156.
Kalpouzos, G., Chetelat, G., Baron, J. C., Landeau, B., Mevel, K.,Godeau, C., et al. (2009a). Voxel-based mapping of brain gray mat-ter volume and glucose metabolism profiles in normal aging.Neurobiology of Aging, 30(1), 112–124.
Kalpouzos, G., Chételat, G., Landeau, B., Clochon, P., Viader, F.,Eustache, F., & Desgranges, B. (2009b). Structural and metaboliccorrelates of episodic memory in relation to the depth of encoding innormal aging. Journal of Cognitive Neuroscience, 21(2), 372–389.doi:10.1162/jocn.2008.21027.
Kanda, T., Ishii, K., Uemura, T., Miyamoto, N., Yoshikawa, T., Kono, A.K., & Mori, E. (2008). Comparison of grey matter and metabolicreductions in frontotemporal dementia using FDG-PET and voxel-based morphometric MR studies. European Journal of NuclearMedicine and Molecular Imaging, 35(12), 2227–2234. doi:10.1007/s00259-008-0871-5.
Kantarci, K., Lowe, V. J., Boeve, B. F., Weigand, S. D., Senjem, M. L.,Przybelski, S. A., et al. (2012). Multimodality imaging characteris-tics of dementia with Lewy bodies. Neurobiology of Aging, 33(9),2091–2105. doi:10.1016/j.neurobiolaging.2011.09.024.
Kievit, R. A., Davis, S.W.,Mitchell, D. J., Taylor, J. R., Duncan, J., Cam-CAN Research Team, et al. (2014). Distinct aspects of frontal lobestructure mediate age-related differences in fluid intelligence andmultitasking. Nature Communications, 5, 5658. doi:10.1038/ncomms6658.
Neuropsychol Rev

Klunk,W. E., Engler, H., Nordberg, A.,Wang, Y., Blomqvist, G., Holt, D.P., et al. (2004). Imaging brain amyloid in Alzheimer’s disease withPittsburgh Compound-B. Annals of Neurology, 55(3), 306–319. doi:10.1002/ana.20009.
Klupp, E., Förster, S., Grimmer, T., Tahmasian, M., Yakushev, I., Sorg,C., et al. (2014). In Alzheimer’s disease, hypometabolism in low-amyloid brain regions may be a functional consequence of patholo-gies in connected brain regions. Brain Connectivity, 4(5), 371–383.doi:10.1089/brain.2013.0212.
Knopman, D. S., Jack, C. R., Wiste, H. J., Weigand, S. D., Vemuri, P.,Lowe, V. J., et al. (2012). Neuronal injury biomarkers are not de-pendent on β- amyloid in normal elderly. Annals of Neurology. doi:10.1002/ana.23816.
Knopman, D. S., Jack, C. R., Wiste, H. J., Lundt, E. S., Weigand, S. D.,Vemuri, P., et al. (2014). 18F-fluorodeoxyglucose positron emissiontomography, aging, and apolipoprotein E genotype in cognitivelynormal persons. Neurobiology of Aging, 35(9), 2096–2106. doi:10.1016/j.neurobiolaging.2014.03.006.
Kopelman, M. D., Thomson, A. D., Guerrini, I., &Marshall, E. J. (2009).The Korsakoff syndrome: clinical aspects, psychology and treat-ment. Alcohol and Alcoholism, 44, 148–154.
Kopelman M.D. (2014) What does a comparison of the alcoholicKorsakoff syndrome and thalamic infarction tell us about thalamicamnesia? Neuroscience and Biobehavioral Reviews.
Koutroumanidis,M., Hennessy,M. J., Seed, P. T., Elwes, R. D., Jarosz, J.,Morris, R. G., Maisey, M. N., Binnie, C. D., & Polkey, C. E. (2000).Significance of interictal bilateral temporal hypometabolism in tem-poral lobe epilepsy. Neurology, 54(9), 1811–21.
Kuwert, T., Hömberg, V., Steinmetz, H., Unverhau, S., Langen, K. J.,Herzog, H., & Feinendegen, L. E. (1993). Posthypoxic amnesia:regional cerebral glucose consumption measured by positron emis-sion tomography. Journal of the Neurological Sciences, 118(1), 10–6.
La Joie, R., Landeau, B., Perrotin, A., Bejanin, A., Egret, S., Pélerin, A.,et al. (2014). Intrinsic connectivity identifies the hippocampus as amain crossroad between Alzheimer’s and semantic dementia-targeted networks. Neuron, 81(6), 1417–1428. doi:10.1016/j.neuron.2014.01.026.
La Joie, R., Perrotin, A., Barré, L., Hommet, C., Mézenge, F., Ibazizene,M., et al. (2012). Region-specific hierarchy between atrophy,hypometabolism, and β-amyloid (Aβ) load in Alzheimer’s diseasedementia. The Journal of Neuroscience: The Official Journal of theSociety for Neuroscience, 32(46), 16265–16273. doi:10.1523/JNEUROSCI.2170-12.2012.
Laforce, R. (2013). Behavioral and language variants of frontotemporaldementia: a review of key symptoms. Clinical Neurology andNeurosurgery, 115(12), 2405–2410.
Lammertsma, A. A., & Hume, S. P. (1996). Simplified reference tissuemodel for PET receptor studies. NeuroImage, 4(3 Pt 1), 153–158.doi:10.1006/nimg.1996.0066.
Lammertsma, A. A., Bench, C. J., Hume, S. P., Osman, S., Gunn, K.,Brooks, D. J., & Frackowiak, R. S. (1996). Comparison of methodsfor analysis of clinical [11C]raclopride studies. Journal of CerebralBlood Flow and Metabolism: official journal of the InternationalSociety of Cerebral Blood Flow and Metabolism, 16(1), 42–52. doi:10.1097/00004647-199601000-00005.
Langen, K. J., Muhlensiepen, H., Holschbach,M., Hautzel, H., Jansen, P.,& Coenen, H. H. (2000). Transport mechanisms of 3-[123I]iodo-alpha-methyl-L-tyrosine in a human glioma cell line: comparisonwith [3H]methyl]-L-methionine. Journal of Nuclear Medicine:Official Publication, Society of Nuclear Medicine, 41(7), 1250–1255.
Le Foll, B., Wilson, A. A., Graff, A., Boileau, I., & Di Ciano, P. (2014).Recent methods for measuring dopamine D3 receptor occupancyin vivo: importance for drug development. Frontiers inPharmacology. doi:10.3389/fphar.2014.00161.
Lechevalier, B., Aupée, A.M., de La Sayette, V., Eustache, F., & Baron, J.C. (2000). [Function imaging of the hippocampus in Korsakoff’ssyndrome]. Bulletin de l’Académie Nationale de Médecine, 184,1491–1497.
Lehmann, M., Ghosh, P. M., Madison, C., Laforce, R., Corbetta-Rastelli,C., Weiner, M. W., et al. (2013). Diverging patterns of amyloiddeposition and hypometabolism in clinical variants of probableAlzheimer’s disease. Brain: A Journal of Neurology, 136(Pt 3),844–858. doi:10.1093/brain/aws327.
Logan, J., Fowler, J. S., Volkow, N. D., Wang, G. J., Ding, Y. S., &Alexoff, D. L. (1996). Distribution volume ratios without bloodsampling from graphical analysis of PET data. Journal of CerebralBlood Flow and Metabolism: Official Journal of the InternationalSociety of Cerebral Blood Flow and Metabolism, 16(5), 834–840.doi:10.1097/00004647-199609000-00008.
Lowe, V. J., Weigand, S. D., Senjem, M. L., Vemuri, P., Jordan, L.,Kantarci, K., et al. (2014). Association of hypometabolism and am-yloid levels in aging, normal subjects. Neurology, 82(22), 1959–1967. doi:10.1212/WNL.0000000000000467.
Lucy, L. B. (1974). Iterative technique for rectification of observed dis-tributions. Astronomy Journal, 79(6), 745–754.
Markowitsch, H. J., Fink, G. R., Thone, A., Kessler, J., & Heiss, W. D.(1997a). A PET study of persistent psychogenic amnesia coveringthe whole life span. Cognitive Neuropsychiatry, 2(2), 135–158.
Markowitsch, H. J., Weber-Luxemburger, G., Ewald, K., Kessler, J., &Heiss, W. D. (1997b). Patients with heart attacks are not validmodels for medial temporal lobe amnesia. A neuropsychologicaland FDG-PET study with consequences for memory research.European Journal of Neurology, 4(2), 178–184.
Markowitsch, H. J., Calabrese, P., Fink, G. R., Durwen, H. F., Kessler, J.,Härting, C., et al. (1997c). Impaired episodic memory retrieval in acase of probable psychogenic amnesia. Psychiatry Res, 74(2), 119–126.
Markowitsch, H. J., Kessler, J., Van der Ven, C., Weber-Luxenburger, G.,& Heiss, W.-D. (1998). Psychic trauma causing grossly reducedbrain metabolism and cognitive deterioration. Neuropsychologia,36, 77–82.
Markowitsch, H. J., Kessler, J., Weber-Luxenburger, G., Van der Ven, C.,& Heiss, W.-D. (2000). Neuroimaging and behavioral correlates ofrecovery from ‘mnestic block syndrome’ and other cognitive dete-riorations. Neuropsychiatry, Neuropsychology, and BehavioralNeurology, 13, 60–66.
Markowitsch, H. J., & Staniloiu, A. (2012). Amnesic disorders. Lancet,380(9851), 1429–40.
Mata, M., Fink, D. J., Gainer, H., Smith, C. B., Davidsen, L., Savaki, H.,et al. (1980). Activity-dependent energy metabolism in rat posteriorpituitary primarily reflects sodium pump activity. Journal ofNeurochemistry, 34(1), 213–215.
Matsuda, H., Kitayama, N., Ohnishi, T., Asada, T., Nakano, S.,Sakamoto, S., et al. (2002). Longitudinal evaluation of both mor-phologic and functional changes in the same individuals withAlzheimer’s disease. Journal of Nuclear Medicine: OfficialPublication, Society of Nuclear Medicine, 43(3), 304–311.
McColl, J. H., Holmes, A. P., & Ford, I. (1994). Statistical methods inneuroimaging with particular application to emission tomography.Statistical Methods in Medical Research, 3(1), 63–86.
McKhann, G. M., Knopman, D. S., Chertkow, H., Hyman, B. T., Jack, C.R., Jr., Kawas, C. H., et al. (2011). The diagnosis of dementia due toAlzheimer’s disease: recommendations from the National Instituteon Aging-Alzheimer’s Association workgroups on diagnosticguidelines for Alzheimer’s disease. Alzheimer’s & Dementia: TheJournal of the Alzheimer’s Association, 7(3), 263–269. doi:10.1016/j.jalz.2011.03.005.
Meguro, K., LeMestric, C., Landeau, B., Desgranges, B., Eustache, F., &Baron, J. C. (2001). Relations between hypometabolism in the pos-terior association neocortex and hippocampal atrophy in
Neuropsychol Rev

Alzheimer’s disease: a PET/MRI correlative study. Journal ofNeurology, Neurosurgery, and Psychiatry, 71(3), 315–321.
Meltzer, C. C., Cantwell, M. N., Greer, P. J., Ben-Eliezer, D., Smith, G.,Frank, G., et al. (2000). Does cerebral blood flow decline in healthyaging? A PET study with partial-volume correction. Journal ofNuclear Medicine: Official Publication, Society of NuclearMedicine, 41(11), 1842–1848.
Mevel, K., Desgranges, B., Baron, J.-C., Landeau, B., de La Sayette, V.,Viader, F., et al. (2007). Detecting hippocampal hypometabolism inmild cognitive impairment using automatic voxel-based approaches.NeuroImage, 37(1), 18–25. doi:10.1016/j.neuroimage.2007.04.048.
Minoshima, S., Foster, N. L., & Kuhl, D. E. (1994). Posterior cingulatecortex in Alzheimer’s disease. Lancet, 344(8926), 895.
Minoshima, S., Foster, N. L., Sima, A. A., Frey, K. A., Albin, R. L., &Kuhl, D. E. (2001). Alzheimer’s disease versus dementia with Lewybodies: cerebral metabolic distinction with autopsy confirmation.Annals of Neurology, 50(3), 358–365.
Mosbah, A., Tramoni, E., Guedj, E., Aubert, S., Daquin, G., Ceccaldi, M.,Félician, O., & Bartolomei, F. (2014). Clinical, neuropsychological,and metabolic characteristics of transient epileptic amnesia syn-drome. Epilepsia, 55(5), 699–706.
Mosconi, L., De Santi, S., Li, J., Tsui, W. H., Li, Y., Boppana, M., et al.(2008a). Hippocampal hypometabolism predicts cognitive declinefrom normal aging. Neurobiology of Aging, 29(5), 676–692. doi:10.1016/j.neurobiolaging.2006.12.008.
Mosconi, L., Nacmias, B., Sorbi, S., De Cristofaro, M. T. R., Fayazz, M.,Tedde, A., et al. (2004a). Brain metabolic decreases related to thedose of the ApoE e4 allele in Alzheimer’s disease. Journal ofNeurology, Neurosurgery, and Psychiatry, 75(3), 370–376.
Mosconi, L., Perani, D., Sorbi, S., Herholz, K., Nacmias, B., Holthoff, V.,et al. (2004b).MCI conversion to dementia and the APOE genotype:a prediction study with FDG-PET. Neurology, 63(12), 2332–2340.
Mosconi, L., Tsui, W. H., Herholz, K., Pupi, A., Drzezga, A., Lucignani,G., et al. (2008b).Multicenter standardized 18F-FDGPET diagnosisof mild cognitive impairment, Alzheimer’s disease, and other de-mentias. Journal of Nuclear Medicine: Official Publication, Societyof Nuclear Medicine, 49(3), 390–398. doi:10.2967/jnumed.107.045385.
Mosconi, L., Tsui, W.-H., De Santi, S., Li, J., Rusinek, H., Convit, A.,et al. (2005). Reduced hippocampal metabolism in MCI and AD:automated FDG-PET image analysis. Neurology, 64(11), 1860–1867. doi:10.1212/01.WNL.0000163856.13524.08.
Müller-Gartner, H. W., Links, J. M., Prince, J. L., Bryan, R. N., McVeigh,E., Leal, J. P., et al. (1992). Measurement of radiotracer concentra-tion in brain gray matter using positron emission tomography: MRI-based correction for partial volume effects. Journal of CerebralBlood Flow and Metabolism: Official Journal of the InternationalSociety of Cerebral Blood Flow and Metabolism, 12(4), 571–583.doi:10.1038/jcbfm.1992.81.
Nestor, P. J., Fryer, T. D., & Hodges, J. R. (2006). Declarative memoryimpairments in Alzheimer’s disease and semantic dementia.NeuroImage, 30(3), 1010–1020. doi:10.1016/j.neuroimage.2005.10.008.
Nestor, P. J., Fryer, T. D., Ikeda, M., & Hodges, J. R. (2003a).Retrosplenial cortex (BA 29/30) hypometabolism in mild cognitiveimpairment (prodromal Alzheimer’s disease). The EuropeanJournal of Neuroscience, 18(9), 2663–2667.
Nestor, P. J., Fryer, T. D., Smielewski, P., & Hodges, J. R. (2003b).Limbic hypometabolism in Alzheimer’s disease and mild cognitiveimpairment. Annals of Neurology, 54(3), 343–351. doi:10.1002/ana.10669.
Nestor, P. J., Graham, N. L., Fryer, T. D., Williams, G. B., Patterson, K.,& Hodges, J. R. (2003c). Progressive non-fluent aphasia is associ-ated with hypometabolism centred on the left anterior insula. Brain:A Journal of Neurology, 126(Pt 11), 2406–2418. doi:10.1093/brain/awg240.
Nyberg, L., Mclntosh, A. R., Houle, S., Nilsson, L.-G., & Tulving, E.(1996). Activation of medial temporal structures during episodicmemory retrieval. Nature, 380(6576), 715–717. doi:10.1038/380715a0.
Nyberg, L., Tulving, E., Habib, R., Nilsson, L. G., Kapur, S., Houle, S.,et al. (1995). Functional brain maps of retrieval mode and recoveryof episodic information. Neuroreport, 7(1), 249–252.
O’Brien, J. T., Firbank, M. J., Davison, C., Barnett, N., Bamford, C.,Donaldson, C., et al. (2014). 18F-FDG PET and perfusion SPECTin the diagnosis of Alzheimer and Lewy body dementias. Journal ofNuclear Medicine: Official Publication, Society of NuclearMedicine, 55(12), 1959–1965. doi:10.2967/jnumed.114.143347.
Panegyres, P. K., Rogers, J. M., McCarthy, M., Campbell, A., &Wu, J. S.(2009). Fluorodeoxyglucose-positron emission tomography in thedifferential diagnosis of early-onset dementia: a prospective,community-based study. BMC Neurology, 9, 41. doi:10.1186/1471-2377-9-41.
Paulson, O. B., Hasselbalch, S. G., Rostrup, E., Knudsen, G. M., &Pelligrino, D. (2010). Cerebral blood flow response to functionalactivation. Journal of Cerebral Blood Flow and Metabolism:Official Journal of the International Society of Cerebral BloodFlow and Metabolism, 30(1), 2–14. doi:10.1038/jcbfm.2009.188.
Perani, D., Garibotto, V., Gorini, A., Moresco, R. M., Henin, M.,Panzacchi, A., et al. (2008). In vivo PETstudy of 5HT(2A) serotoninand D(2) dopamine dysfunction in drug-naive obsessive-compul-sive disorder. NeuroImage, 42(1), 306–314. doi:10.1016/j.neuroimage.2008.04.233.
Perneczky, R., Drzezga, A., Boecker, H., Förstl, H., Kurz, A., &Häussermann, P. (2008). Cerebral metabolic dysfunction in patientswith dementia with Lewy bodies and visual hallucinations.Dementia and Geriatric Cognitive Disorders, 25(6), 531–538. doi:10.1159/000132084.
Petit-Taboué,M. C., Landeau, B., Desson, J. F., Desgranges, B., &Baron,J. C. (1998). Effects of healthy aging on the regional cerebral met-abolic rate of glucose assessed with statistical parametric mapping.NeuroImage, 7(3), 176–184. doi:10.1006/nimg.1997.0318.
Piolino, P., Hannequin, D., Desgranges, B., Girard, C., Beaunieux, H.,Giffard, B., Lebreton, K., & Eustache, F. (2005). Right ventral fron-tal hypometabolism and abnormal sense of self in a case of dispro-portionate retrograde amnesia. Cognitive Neuropsychology, 22(8),1005–34.
Pitel, A. L., Beaunieux, H., Witkowski, T., Vabret, F., Guillery-Girard, B.,Quinette, P., et al. (2007). Genuine episodic memory deficits andexecutive dysfunctions in alcoholic subjects early in abstinence.Alcoholism, Clinical and Experimental Research, 31(7), 1169–1178.
Pitel, A. L., Aupée, A. M., Chetelat, G., Mézenge, F., Beaunieux, H., deLa Sayette, V., et al. (2009). Morphological and glucose metabolismabnormalities in alcoholic Korsakoff’s syndrome: group compari-sons and individual analyses. PloS One, 4, e7748.
Pitel, A. L., Chételat, G., Le Berre, A. P., Desgranges, B., Eustache, F., &Beaunieux, H. (2012). Macrostructural abnormalities in Korsakoffsyndrome comparedwith uncomplicated alcoholism.Neurology, 78,1330–1333.
Prestia, A., Caroli, A., Herholz, K., Reiman, E., Chen, K., Jagust, W. J.,et al. (2013). Diagnostic accuracy of markers for prodromalAlzheimer’s disease in independent clinical series. Alzheimer’s &Dementia: The Journal of the Alzheimer’s Association, 9(6), 677–686. doi:10.1016/j.jalz.2012.09.016.
Quinette, P., Guillery-Girard, B., Dayan, J., de La Sayette, V.,Marquis, S.,Viader, F., Desgranges, B., & Eustache, F. (2006). What does tran-sient global amnesia really mean? Review of the literature and thor-ough study of 142 cases. Brain, 129(7), 1640–58.
Rabinovici, G. D., Jagust, W. J., Furst, A. J., Ogar, J. M., Racine, C. A.,Mormino, E. C., et al. (2008). Aβ amyloid and glucose metabolism
Neuropsychol Rev

in three variants of primary progressive aphasia. Annals ofNeurology, 64(4), 388–401. doi:10.1002/ana.21451.
Rabinovici, G. D., Rosen, H. J., Alkalay, A., Kornak, J., Furst, A. J.,Agarwal, N., et al. (2011). Amyloid vs FDG-PET in the differentialdiagnosis of AD and FTLD.Neurology, 77(23), 2034–2042. doi:10.1212/WNL.0b013e31823b9c5e.
Ratnavalli, E., Brayne, C., Dawson, K., & Hodges, J. R. (2002). Theprevalence of frontotemporal dementia. Neurology, 58(11), 1615–1621.
Rauchs, G., Piolino, P., Mézenge, F., Landeau, B., Lalevée, C., Pelerin,A., et al. (2007). Autonoetic consciousness in Alzheimer’s disease:neuropsychological and PET findings using an episodic learningand recognition task. Neurobiology of Aging, 28(9), 1410–1420.doi:10.1016/j.neurobiolaging.2006.06.005.
Reader, A. J., Julyan, P. J., Williams, H., Hastings, D. L., & Zweit, J.(2003). EM algorithm system modeling by image-space techniquesfor PET reconstruction. Nuclear Science, IEEE Transactions on,50(5), 1392–1397. doi:10.1109/TNS.2003.817327.
Reed, L. J., Lasserson, D., Marsden, P., Bright, P., Stanhope, N., &Kopelman, M. D. (2005). Correlations of regional cerebral metabo-lism with memory performance and executive function in patientswith herpes encephalitis or frontal lobe lesions. Neuropsychology,19(5), 555–65.
Reed, L. J., Lasserson, D., Marsden, P., Stanhope, N., Stevens, T., Bello,F., et al. (2003). FDG-PET findings in the Wernicke-Korsakoff syn-drome. Cortex, 39, 1027–1045.
Reed, L. J., Marsden, P., Lasserson, D., Sheldon, N., Lewis, P., Stanhope,N., Guinan, E., & Kopelman, M. D. (1999). FDG-PET analysis andfindings in amnesia resulting from hypoxia. Memory, 7(5–6), 599–612.
Reiman, E. M., Caselli, R. J., Yun, L. S., Chen, K., Bandy, D.,Minoshima, S., et al. (1996). Preclinical evidence of Alzheimer’sdisease in persons homozygous for the epsilon 4 allele for apolipo-protein E. The New England Journal of Medicine, 334(12), 752–758.
Reinhold, N., Kühnel, S., Brand, M., & Markowitsch, H. J. (2006).Functional neuroimaging in memory and memory disturbances.Current Medical Imaging Review, 2, 35–57.
Rémy, F., Mirrashed, F., Campbell, B., & Richter, W. (2005). Verbalepisodic memory impairment in Alzheimer’s disease: a combinedstructural and functional MRI study. NeuroImage, 25(1), 253–266.doi:10.1016/j.neuroimage.2004.10.045.
Richardson, W. H. (1972). Bayesian-based iterative method of imagerestoration. Journal of the Optical Society of America, 62(1), 55–59.
Riedl, V., Bienkowska, K., Strobel, C., Tahmasian, M., Grimmer, T.,Forster, S., et al. (2014). Local activity determines functional con-nectivity in the resting human brain: a simultaneous FDG-PET/fMRI study. The Journal of Neuroscience: The Official Journal ofthe Society for Neuroscience, 34(18), 6260–6266. doi:10.1523/JNEUROSCI.0492-14.2014.
Risacher, S. L., & Saykin, A. J. (2013). Neuroimaging biomarkers ofneurodegenerative diseases and dementia. Seminars in Neurology,33(4), 386–416. doi:10.1055/s-0033-1359312.
Ritz, L., Segobin S., Lannuzel, C., Boudehent, C., Vabret, F., Eustache, F.,Beaunieux, H., & Pitel, AL., (2015). Direct voxel-based compari-sons between grey matter shrinkage and glucose hypometabolism inchronic alcoholism. Journal of Cerebral Blood Flow&Metabolism,In Press
Rousset, O. G., Deep, P., Kuwabara, H., Evans, A. C., Gjedde, A. H., &Cumming, P. (2000). Effect of partial volume correction on esti-mates of the influx and cerebral metabolism of 6-[(18)F]fluoro-L-dopa studied with PET in normal control and Parkinson’s diseasesubjects. Synapse (New York, N.Y.), 37(2), 81–89. doi:10.1002/1098-2396(200008)37:2<81::AID-SYN1>3.0.CO;2-#.
Rousset, O. G., Ma, Y., & Evans, A. C. (1998). Correction for partialvolume effects in PET: principle and validation. Journal of Nuclear
Medicine: Official Publication, Society of Nuclear Medicine, 39(5),904–911.
Rylands, A. J., Hinz, R., Jones, M., Holmes, S. E., Feldmann,M., Brown,G., et al. (2012). Pre- and postsynaptic serotonergic differences inmales with extreme levels of impulsive aggression without callousunemotional traits: a positron emission tomography study using(11)C-DASB and (11)C-MDL100907. Biological Psychiatry,72(12), 1004–1011. doi:10.1016/j.biopsych.2012.06.024.
Schacter, D. L., Savage, C. R., Alpert, N. M., Rauch, S. L., & Albert, M.S. (1996). The role of hippocampus and frontal cortex in age-relatedmemory changes: a PET study. Neuroreport, 7(6), 1165–1169.
Scheef, L., Spottke, A., Daerr, M., Joe, A., Striepens, N., Kölsch, H., et al.(2012). Glucose metabolism, gray matter structure, and memorydecline in subjective memory impairment. Neurology, 79(13),1332–1339. doi:10.1212/WNL.0b013e31826c1a8d.
Schroeter, M. L., Stein, T., Maslowski, N., &Neumann, J., (2009). Neuralcorrelates of Alzheimer’s disease and mild cognitive impairment: asystematic and quantitative meta-analysis involving 1351 patients.Neuroimage, 47(4), 1196–1206.
Schroeter, M. L., Laird, A. R., Chwiesko, C., Deuschl, C., Schneider, E.,Bzdok, D., et al. (2014). Conceptualizing neuropsychiatric diseaseswith multimodal data-driven meta-analyses - the case of behavioralvariant frontotemporal dementia. Cortex; A Journal Devoted to theStudy of the Nervous System and Behavior, 57, 22–37. doi:10.1016/j.cortex.2014.02.022.
Schroeter, M. L., Raczka, K., Neumann, J., & Yves von Cramon, D.(2007). Towards a nosology for frontotemporal lobar degenera-tions—A meta-analysis involving 267 subjects. NeuroImage,36(3), 497–510. doi:10.1016/j.neuroimage.2007.03.024.
Segobin, S. H., Matthews, J. C., Markiewicz, P. J., & Herholz, K. (2010).A hybrid between region-based and voxel-based methods for partialvolume correction in PET. IEEE Nuclear Science Symposuim &Medical Imaging Conference, C(2), 3073–3078. doi:10.1109/NSSMIC.2010.5874365
Sibson, N. R., Dhankhar, A., Mason, G. F., Rothman, D. L., Behar, K. L.,& Shulman, R. G. (1998). Stoichiometric coupling of brain glucosemetabolism and glutamatergic neuronal activity. Proceedings of theNational Academy of Sciences of the United States of America,95(1), 316–321.
Small, G. W., Ercoli, L. M., Silverman, D. H., Huang, S. C., Komo, S.,Bookheimer, S. Y., et al. (2000). Cerebral metabolic and cognitivedecline in persons at genetic risk for Alzheimer’s disease.Proceedings of the National Academy of Sciences of the UnitedStates of America, 97(11), 6037–6042. doi:10.1073/pnas.090106797.
Snyder, A. Z., &Raichle,M. E. (2012). A brief history of the resting state:the Washington University perspective. NeuroImage, 62(2), 902–910. doi:10.1016/j.neuroimage.2012.01.044.
Sokoloff, L. (1981). Localization of functional activity in the centralnervous system by measurement of glucose utilization with radio-active deoxyglucose. Journal of Cerebral Blood Flow andMetabolism: Official Journal of the International Society ofCerebral Blood Flow and Metabolism, 1(1), 7–36. doi:10.1038/jcbfm.1981.4.
Sperling, R. A., Aisen, P. S., Beckett, L. A., Bennett, D. A., Craft, S.,Fagan, A.M., et al. (2011). Toward defining the preclinical stages ofAlzheimer’s disease: recommendations from the National Instituteon Aging and the Alzheimer’s Association workgroup. Alzheimer’sand Dementia.
Squire, L. R., Ojemann, J. G., Miezin, F. M., Petersen, S. E., Videen, T.O., & Raichle, M. E. (1992). Activation of the hippocampus innormal humans: a functional anatomical study of memory.Proceedings of the National Academy of Sciences of the UnitedStates of America.
Stamatakis, E. A., Glabus,M. F., Wyper, D. J., Barnes, A., &Wilson, J. T.(1999). Validation of statistical parametric mapping (SPM) in
Neuropsychol Rev
assessing cerebral lesions: a simulation study. NeuroImage, 10(4),397–407. doi:10.1006/nimg.1999.0477.
Staniloiu, A., &Markowitsch, H. J. (2014). Dissociative amnesia. LancetPsychiatry, 1, 226–41.
Stenset, V., Grambaite, R., Reinvang, I., Hessen, E., Cappelen, T.,Bjørnerud, A., Gjerstad, L., & Fladby, T. (2007). Diaschisis afterthalamic stroke: a comparison of metabolic and structural changesin a patient with amnesic syndrome. Acta NeurologicaScandinavica. Supplementum, 187, 68–71.
Stracciari, A., Fonti, C., & Guarino, M. (2008). When the past is lost:focal retrograde amnesia. Focus on the Bfunctional^ form.Behavioural Neurology, 20(3), 113–25.
Studholme, C., Cardenas, V., Schuff, N., Rosen, H., Miller, B., &Weiner,M. (2001). Detecting spatially consistent structural differences inAlzheimer’s and fronto temporal dementia using deformation mor-phometry. In: Proceedings of the 4th International Conference onMedical Image Computing and Computer-Assisted Intervention (pp.41–48). London: Springer.
Sullivan, E. V., & Pfefferbaum, A. (2009). Neuroimaging of theWernicke-Korsakoff syndrome. Alcohol and Alcoholism, 44, 155–165.
Sullivan, E. V., Rosenbloom, M. J., & Pfefferbaum, A. (2000). Pattern ofmotor and cognitive deficits in detoxified alcoholic men.Alcoholism, Clinical and Experimental Research, 24, 611–621.
Thomas, B. A., Erlandsson, K., Modat, M., Thurfjell, L., Vandenberghe,R., Ourselin, S., & Hutton, B. F. (2011). The importance of appropri-ate partial volume correction for PET quantification in Alzheimer’sdisease. European Journal of Nuclear Medicine and MolecularImaging, 38(6), 1104–1119. doi:10.1007/s00259-011-1745-9.
Thomas-Antérion, C., Dubas, F., Decousus, M., Jeanguillaume, C., &Guedj, E. (2014). Clinical characteristics and brain PET findingsin 3 cases of dissociative amnesia: disproportionate retrograde def-icit and posterior middle temporal gyrus hypometabolism.Neurophysiologie Clinique, 44(4), 355–62.
Thomas-Antérion, C., Guedj, E., Decousus, M., & Laurent, B. (2010).Can we see personal identity loss? A functional imaging study oftypical ‘hysterical amnesia’. Journal of Neurology, Neurosurgery,and Psychiatry, 81, 468–69.
Tisserand, D. J., & Jolles, J. (2003). On the involvement of prefrontalnetworks in cognitive ageing. Cortex; A Journal Devoted to theStudy of the Nervous System and Behavior, 39(4–5), 1107–1128.
Tulving, E. (1995). Organization of memory: Quo Vadis? In M. S.Gazzaniga (Ed.), The Cognitive Neuroscience (pp. 839–847).Cambridge, MA: MIT Press.
Tulving, E., Habib, R., Nyberg, L., Lepage, M., & McIntosh, A. R.(1999). Positron emission tomography correlations in and beyondmedial temporal lobes. Hippocampus, 9(1), 71–82. doi:10.1002/(SICI)1098-1063(1999)9:1<71::AID-HIPO8>3.0.CO;2-F.
Tulving, E., Kapur, S., Craik, F. I., Moscovitch, M., & Houle, S. (1994).Hemispheric encoding/retrieval asymmetry in episodic memory:positron emission tomography findings. Proceedings of theNational Academy of Sciences of the United States of America.
Tulving, E., Kapur, S., Markowitsch, H. J., Craik, F. I., Habib, R., &Houle, S. (1994). Neuroanatomical correlates of retrieval in episodicmemory: auditory sentence recognition. Proceedings of the NationalAcademy of Sciences of the United States of America.
Tumeh, P. C., Alavi, A., Houseni, M., Greenfield, A., Chryssikos, T.,Newberg, A., et al. (2007). Structural and functional imaging corre-lates for age-related changes in the brain. Seminars in NuclearMedicine, 37(2), 69–87. doi:10.1053/j.semnuclmed.2006.10.002.
Villain, N., Desgranges, B., Viader, F., de La Sayette, V., Mezenge, F.,Landeau, B., et al. (2008). Relationships between hippocampal atrophy,white matter disruption, and gray matter hypometabolism inAlzheimer’s disease. The Journal of Neuroscience, 28(24), 6174–6181.
Villain, N., Fouquet, M., Baron, J. C., Mézenge, F., Landeau, B., de LaSayette, V., et al. (2010). Sequential relationships between grey
matter and white matter atrophy and brain metabolic abnormalitiesin early Alzheimer’s disease. Brain, 133(11), 3301.
Volkow, N. D., Hitzemann, R., Wang, G. J., Fowler, J. S., Burr, G.,Pascani, K., et al. (1992). Decreased brain metabolism in neurolog-ically intact healthy alcoholics. The American Journal of Psychiatry,149(8), 1016–1022.
Volkow, N. D., Wang, G. J., Hitzemann, R., Fowler, J. S., Overall, J. E.,Burr, G., & Wolf, A. P. (1994). Recovery of brain glucose metabo-lism in detoxified alcoholics. The American Journal of Psychiatry,151(2), 178–183.
Wang, G. J., Volkow, N. D., Roque, C. T., Cestaro, V. L., Hitzemann, R.J., Cantos, E. L., et al. (1993). Functional importance of ventricularenlargement and cortical atrophy in healthy subjects and alcoholicsas assessed with PET, MR imaging, and neuropsychologic testing.Radiology, 186(1), 59–65. Accessed 17 February 2012.
West, R. (2000). In defense of the frontal lobe hypothesis of cognitiveaging. Journal of the International Neuropsychological Society:JINS, 6(6), 727–729. discussion 730.
Wienhard, K., Schmand, M., Schmand, M., Casey, M. E., Casey, M. E.,et al. (2002). The ECAT HRRT: performance and first clinical ap-plication of the New high resolution research tomograph. IEEETransactions on Nuclear Science, 49(1), 104–110. doi:10.1109/TNS.2002.998689.
Willis, M. W., Ketter, T. A., Kimbrell, T. A., George, M. S., Herscovitch,P., Danielson, A. L., et al. (2002). Age, sex and laterality effects oncerebral glucose metabolism in healthy adults. Psychiatry Research,114(1), 23–37.
Wirth, M., Madison, C. M., Rabinovici, G. D., Oh, H., Landau, S. M., &Jagust, W. J. (2013). Alzheimer’s disease neurodegenerative bio-markers are associated with decreased cognitive function but notβ-amyloid in cognitively normal older individuals. The Journal ofNeuroscience: The Official Journal of the Society for Neuroscience,33(13), 5553–5563. doi:10.1523/JNEUROSCI.4409-12.2013.
Womack, K. B., Diaz-Arrastia, R., Aizenstein, H. J., Arnold, S. E.,Barbas, N. R., Boeve, B. F., et al. (2011). Temporoparietalhypometabolism in frontotemporal lobar degeneration and associat-ed imaging diagnostic errors. Archives of Neurology, 68(3), 329–337. doi:10.1001/archneurol.2010.295.
Yakushev, I., Landvogt, C., Buchholz, H.-G., Fellgiebel, A., Hammers,A., Scheurich, A., et al. (2008). Choice of reference area in studies ofAlzheimer’s disease using positron emission tomography withfluorodeoxyglucose-F18. Psychiatry Research, 164(2), 143–153.doi:10.1016/j.pscychresns.2007.11.004.
Yanase, D., Matsunari, I., Yajima, K., Chen, W., Fujikawa, A.,Nishimura, S., et al. (2005). Brain FDG PET study of normal agingin Japanese: effect of atrophy correction. European Journal ofNuclear Medicine and Molecular Imaging, 32(7), 794–805. doi:10.1007/s00259-005-1767-2.
Yoshizawa, H., Gazes, Y., Stern, Y., Miyata, Y., & Uchiyama, S. (2014).Characterizing the normative profile of 18F-FDG PET brain imag-ing: sex difference, aging effect, and cognitive reserve. PsychiatryResearch, 221(1), 78–85. doi:10.1016/j.pscychresns.2013.10.009.
Yuan, Y., Gu, Z.-X., &Wei, W.-S. (2009). Fluorodeoxyglucose-positron-emission tomography, single-photon emission tomography, andstructural MR imaging for prediction of rapid conversion toAlzheimer disease in patients with mild cognitive impairment: ameta-analysis. AJNR. American Journal of Neuroradiology, 30(2),404–410. doi:10.3174/ajnr.A1357.
Zahr, N. M., Pitel, A. L., Chanraud, S., & Sullivan, E. V. (2010).Contributions of studies on alcohol use disorders to understandingcerebellar function. Neuropsychology Review, 20, 280–289.
Zanderigo, F., Ogden, R. T., & Parsey, R. V. (2013). Reference regionapproaches in PET: a comparative study on multiple radioligands.Journal of Cerebral Blood Flow and Metabolism: Official Journalof the International Society of Cerebral Blood Flow andMetabolism, 33(6), 888–897. doi:10.1038/jcbfm.2013.26.
Neuropsychol Rev

Zhang, Y., Schuff, N., Jahng, G.-H., Bayne, W., Mori, S., Schad,L., et al. (2007). Diffusion tensor imaging of cingulum fibersin mild cognitive impairment and Alzheimer disease.Neurology, 68(1), 13–19. doi:10.1212/01.wnl.0000250326.77323.01.
Zuendorf, G., Kerrouche, N., Herholz, K., & Baron, J.-C. (2003).Efficient principal component analysis for multivariate 3D voxel-based mapping of brain functional imaging data sets as applied toFDG-PET and normal aging. Human Brain Mapping, 18(1), 13–21.doi:10.1002/hbm.10069.
Neuropsychol Rev