Transport of dissolved inorganic carbon from a tidal freshwater marsh to the York River estuary
9
299 Limnol. Oceanogr., 48(1), 2003, 299–307 q 2003, by the American Society of Limnology and Oceanography, Inc. Transport of dissolved inorganic carbon from a tidal freshwater marsh to the York River estuary Scott C. Neubauer 1 and Iris C. Anderson Virginia Institute of Marine Science, School of Marine Science, College of William and Mary, Gloucester Point, Virginia 23062 Abstract The cycling of dissolved inorganic carbon (DIC) and the role of tidal marshes in estuarine DIC dynamics were studied in a Virginia tidal freshwater marsh and adjacent estuary. DIC was measured over diurnal cycles in different seasons in a marsh tidal creek and at the junction of the creek with the adjacent Pamunkey River. In the creek, DIC concentrations around high tide were controlled by the same processes affecting whole-estuary DIC gradients. Near low tide, DIC concentrations were 1.5–5-fold enriched relative to high tide concentrations, indicating an input of DIC from the marsh. Similar patterns (although dampened in magnitude) were observed at the creek mouth and indicated that DIC was exported from the marsh. Marsh pore-water DIC concentrations were up to 5 mmol L 21 greater than those in the creek and suggested a significant input of sediment pore water to the creek. A model of tidal marsh DIC export showed that, on a seasonal basis, DIC export rates were influenced by water temperature. The composition of exported DIC averaged 19% dissolved CO 2 and 81% HCO and CO . Although CO 2 can be 2 22 3 3 lost to the atmosphere during transit through the estuary, DIC in the form of carbonate alkalinity is subject to export from the estuary to the coastal ocean. When extrapolated to an estuarywide scale, the export of marsh-derived DIC to the York River estuary explained a significant portion (47 6 23%) of excess DIC production (i.e., DIC in excess of that expected from conservative mixing between seawater and freshwater and equilibrium with the atmosphere) in this system. Therefore, CO 2 supersaturation, by itself, does not indicate that an estuary is net heterotrophic. One approach to understanding the cycling of organic car- bon within ecosystems is through measurements of total sys- tem metabolism, given that the production and removal of organic matter are intimately linked to total dissolved inor- ganic carbon (DIC, or SCO 2 ) and O 2 cycling. Recent studies of estuarine CO 2 and DIC dynamics have shown that estu- aries are generally supersaturated with respect to CO 2 and exhibit high rates of net heterotrophy (i.e., respiration . photosynthesis; Smith and Hollibaugh 1993; Frankignoulle et al. 1998; Gatusso et al. 1998), although the main stem of Chesapeake Bay is net autotrophic (Kemp et al. 1997). Sources of CO 2 and DIC to estuarine waters include water- column and benthic respiration, riverine and groundwater in- puts, photodegradation of dissolved organic matter, and in- puts from intertidal marshes (Hopkinson and Vallino 1995; Kemp et al. 1997; Cai and Wang 1998). Accurate quantifi- cation of rates of net heterotrophy requires that one account 1 Corresponding author. Present address: Smithsonian Environ- mental Research Center, Edgewater, Maryland 21037 (neubauer@ si.edu). Acknowledgments We thank D. Fugate, E. Hinchey, T. Lunsford, and M. Neubauer for assistance in the field. Constructive comments on earlier ver- sions of the manuscript were provided by J. Bauer, E. Canuel, C. Currin, P. Raymond, and R. L. Wetzel. We also thank associate editor Stephen Hamilton, Wei-Jun Cai, and an anonymous reviewer for their critical comments on the manuscript. This research was supported in part by the Virginia Department of Environmental Quality through NOAA grants NA570Z0561-01 and NA670Z0360- 01. A National Estuarine Research Reserve System (NERRS) Grad- uate Research Fellowship provided partial funding to S.C.N. We also thank NERRS for access to unpublished water monitoring data. This is contribution 2485 of the Virginia Institute of Marine Sci- ence, School of Marine Science, College of William and Mary. for DIC produced within the estuary through in situ organic matter decomposition as well as DIC produced in the wa- tershed (e.g., in intertidal wetlands or groundwater) and sub- sequently transported into the estuary. Thus, CO 2 supersat- uration, by itself, is insufficient evidence for declaring the trophic status (net autotrophy or heterotrophy) of an estuary or other open ecosystem. Although the total area of estuaries is globally small, the biogeochemical cycling of carbon in these systems may be regionally significant (e.g., Smith and Hollibaugh 1993; Frankignoulle et al. 1998), so a more ro- bust understanding of the sources, cycling, and fates of DIC in estuarine waters is required. Over the past 40 yr, the fluxes of particulate and dissolved organic carbon (POC and DOC) and inorganic nutrients be- tween intertidal marshes and estuarine waters have been studied, primarily to determine whether the export of these materials could explain high rates of primary and secondary production in estuarine waters (Nixon 1980; Childers 1994; Dame 1994). Although there is no consensus on the mag- nitude or direction of marsh-estuary organic carbon fluxes, the export of DOC and POC from marshes followed by re- mineralization within the estuary is one mechanism that could explain high estuarine DIC concentrations. Addition- ally, there is potential for DIC transport from intertidal marshes to the estuary. However, there are few reports of this direct export of marsh-produced DIC (e.g., Cai and Wang 1998; Cai et al. 1999). The DIC may be added to waters overlying the marsh from plant decomposition, sed- iment metabolism, and the upward diffusion of marsh pore water. Potential inputs when the marsh surface is exposed to air include drainage of marsh pore water into tidal creeks and DIC fluxes from subtidal creek sediments. To accurately quantify the total DIC transport from a marsh, all routes of export must be considered.
Transcript of Transport of dissolved inorganic carbon from a tidal freshwater marsh to the York River estuary

299
Limnol. Oceanogr., 48(1), 2003, 299–307q 2003, by the American Society of Limnology and Oceanography, Inc.
Transport of dissolved inorganic carbon from a tidal freshwater marsh to the YorkRiver estuary
Scott C. Neubauer1 and Iris C. AndersonVirginia Institute of Marine Science, School of Marine Science, College of William and Mary, Gloucester Point, Virginia23062
Abstract
The cycling of dissolved inorganic carbon (DIC) and the role of tidal marshes in estuarine DIC dynamics werestudied in a Virginia tidal freshwater marsh and adjacent estuary. DIC was measured over diurnal cycles in differentseasons in a marsh tidal creek and at the junction of the creek with the adjacent Pamunkey River. In the creek,DIC concentrations around high tide were controlled by the same processes affecting whole-estuary DIC gradients.Near low tide, DIC concentrations were 1.5–5-fold enriched relative to high tide concentrations, indicating an inputof DIC from the marsh. Similar patterns (although dampened in magnitude) were observed at the creek mouth andindicated that DIC was exported from the marsh. Marsh pore-water DIC concentrations were up to 5 mmol L21
greater than those in the creek and suggested a significant input of sediment pore water to the creek. A model oftidal marsh DIC export showed that, on a seasonal basis, DIC export rates were influenced by water temperature.The composition of exported DIC averaged 19% dissolved CO2 and 81% HCO and CO . Although CO2 can be2 22
3 3
lost to the atmosphere during transit through the estuary, DIC in the form of carbonate alkalinity is subject to exportfrom the estuary to the coastal ocean. When extrapolated to an estuarywide scale, the export of marsh-derived DICto the York River estuary explained a significant portion (47 6 23%) of excess DIC production (i.e., DIC in excessof that expected from conservative mixing between seawater and freshwater and equilibrium with the atmosphere)in this system. Therefore, CO2 supersaturation, by itself, does not indicate that an estuary is net heterotrophic.
One approach to understanding the cycling of organic car-bon within ecosystems is through measurements of total sys-tem metabolism, given that the production and removal oforganic matter are intimately linked to total dissolved inor-ganic carbon (DIC, or SCO2) and O2 cycling. Recent studiesof estuarine CO2 and DIC dynamics have shown that estu-aries are generally supersaturated with respect to CO2 andexhibit high rates of net heterotrophy (i.e., respiration .photosynthesis; Smith and Hollibaugh 1993; Frankignoulleet al. 1998; Gatusso et al. 1998), although the main stem ofChesapeake Bay is net autotrophic (Kemp et al. 1997).Sources of CO2 and DIC to estuarine waters include water-column and benthic respiration, riverine and groundwater in-puts, photodegradation of dissolved organic matter, and in-puts from intertidal marshes (Hopkinson and Vallino 1995;Kemp et al. 1997; Cai and Wang 1998). Accurate quantifi-cation of rates of net heterotrophy requires that one account
1 Corresponding author. Present address: Smithsonian Environ-mental Research Center, Edgewater, Maryland 21037 ([email protected]).
AcknowledgmentsWe thank D. Fugate, E. Hinchey, T. Lunsford, and M. Neubauer
for assistance in the field. Constructive comments on earlier ver-sions of the manuscript were provided by J. Bauer, E. Canuel, C.Currin, P. Raymond, and R. L. Wetzel. We also thank associateeditor Stephen Hamilton, Wei-Jun Cai, and an anonymous reviewerfor their critical comments on the manuscript. This research wassupported in part by the Virginia Department of EnvironmentalQuality through NOAA grants NA570Z0561-01 and NA670Z0360-01. A National Estuarine Research Reserve System (NERRS) Grad-uate Research Fellowship provided partial funding to S.C.N. Wealso thank NERRS for access to unpublished water monitoring data.This is contribution 2485 of the Virginia Institute of Marine Sci-ence, School of Marine Science, College of William and Mary.
for DIC produced within the estuary through in situ organicmatter decomposition as well as DIC produced in the wa-tershed (e.g., in intertidal wetlands or groundwater) and sub-sequently transported into the estuary. Thus, CO2 supersat-uration, by itself, is insufficient evidence for declaring thetrophic status (net autotrophy or heterotrophy) of an estuaryor other open ecosystem. Although the total area of estuariesis globally small, the biogeochemical cycling of carbon inthese systems may be regionally significant (e.g., Smith andHollibaugh 1993; Frankignoulle et al. 1998), so a more ro-bust understanding of the sources, cycling, and fates of DICin estuarine waters is required.
Over the past 40 yr, the fluxes of particulate and dissolvedorganic carbon (POC and DOC) and inorganic nutrients be-tween intertidal marshes and estuarine waters have beenstudied, primarily to determine whether the export of thesematerials could explain high rates of primary and secondaryproduction in estuarine waters (Nixon 1980; Childers 1994;Dame 1994). Although there is no consensus on the mag-nitude or direction of marsh-estuary organic carbon fluxes,the export of DOC and POC from marshes followed by re-mineralization within the estuary is one mechanism thatcould explain high estuarine DIC concentrations. Addition-ally, there is potential for DIC transport from intertidalmarshes to the estuary. However, there are few reports ofthis direct export of marsh-produced DIC (e.g., Cai andWang 1998; Cai et al. 1999). The DIC may be added towaters overlying the marsh from plant decomposition, sed-iment metabolism, and the upward diffusion of marsh porewater. Potential inputs when the marsh surface is exposed toair include drainage of marsh pore water into tidal creeksand DIC fluxes from subtidal creek sediments. To accuratelyquantify the total DIC transport from a marsh, all routes ofexport must be considered.

300 Neubauer and Anderson
Fig. 1. Map of Sweet Hall marsh, Virginia. Fine gray lines indicate tidal creeks used in calculations of total marsh DIC export (seetext for details). Insets show the location of (A) York and Pamunkey River watersheds and Sweet Hall marsh in Virginia and (B) creekand mouth water sampling sites and pore-water sippers within the marsh. Creek width exaggerated on inset for clarity (actual creek width,;4 m).
Several recent studies have suggested that there must bea significant marsh source of DIC to estuarine waters to ac-count for measured levels of CO2 supersaturation (Cai andWang 1998; Cai et al. 1999; Raymond et al. 2000). Themajor objectives of the present study were to determinewhether DIC is exported from intertidal marshes, identifypossible sources of this DIC, and quantify this export inrelation to whole-estuary DIC dynamics. Hourly measure-ments of DIC were made over diurnal cycles in an intertidalcreek draining a tidal freshwater marsh in Virginia. Simul-taneous measurements were made at the mouth of the tidalcreek to determine whether DIC added to the creek was sub-sequently exported to the adjacent river. Marsh pore-waterDIC was measured to determine whether drainage of porewater into the creek could explain the observed temporalpatterns in creek DIC concentrations. To determine seasonaldifferences in marsh DIC cycling, data were collected duringthe period of maximum marsh macrophyte biomass (June),in late summer, when rates of senescence and decompositionwere high (August), and in November, when rates of plantproductivity and marsh respiration were low. The observedtidal and seasonal changes in DIC were combined with es-timates of tidal water transport through marsh creeks, toquantify the annual export of DIC from the marsh and un-derstand the significance of tidal marshes to the DIC budgetof the adjacent estuary. In this article, we have defined thelandward edge of the estuary as the boundary between sub-tidal waters and intertidal marshes (or nontidal uplands).
Materials and methods
Study site—Sweet Hall marsh (Fig. 1) is a 401-ha tidalfreshwater marsh located on the Pamunkey River, ;69 km(by river) from the mouth of the York River, Virginia. Themarsh is a site within the Chesapeake Bay National Estua-rine Research Reserve system in Virginia (CB-NERRVA)and is seasonally dominated by the macrophytes Peltandravirginica, Pontederia cordata, and Zizania aquatica. SweetHall has been the site of previous studies of marsh carboncycling, including measurements of total community pho-tosynthesis and respiration (Neubauer et al. 2000) and sed-iment deposition and accretion (Neubauer et al. 2002). Mostof Sweet Hall marsh (including our study site) is isolatedfrom the mainland by the Pamunkey River and a relativelydeep tidal channel (.2 m), so the marsh does not receivedirect groundwater inputs from a shallow aquifer. At SweetHall, the Pamunkey River is microtidal with a tidal range of90 cm during spring tides. Historical records indicate thatthe long-term average salinity at Sweet Hall was 0.5 (Brooks1983). However, during the year of our study (1999), salinityranged from 0 to 15.9 (average 2.8; CB-NERRVA unpub-lished data), with the highest salinities in late August andearly September after a dry summer. Pamunkey River dis-charge rates during May to August 1999 were the lowestrecorded over the past 30 years (USGS 2000).
Diurnal tidal sampling—Studies examining tidal ex-changes of DIC among the marsh, creek, and river were

301Tidal marsh DIC export
conducted on 29–30 June, 24–25 August, and 09–10 No-vember 1999. All sampling dates were within 2 d of springtide. Water samples were collected from a small tidal creek(Hill’s Ditch) draining Sweet Hall marsh (hereafter referredto as the ‘‘creek’’ site) and at the junction of this creek withthe Pamunkey River (‘‘mouth’’ site; Fig. 1). Fifty-milliliterwater samples were collected hourly using polypropylenesyringes and immediately filtered for DIC analyses as de-scribed below. A YSI 6000 datasonde recorded water depth,salinity, pH, temperature, and dissolved oxygen (DO) at 15-min intervals. At the creek site, the water intake and YSIdatasonde were located 10–15 cm above the creek bed. Theintake at the mouth site was suspended from a floating plat-form and sampled 20–30 cm below the water surface (;5–70 cm above the sediment surface, depending on tidal stage).
Water samples for DIC analysis were filtered (0.45 mmGelman Supor Acrodiscs) into 12.8-ml gas-tight Hungatetubes, stored on ice in the field and refrigerated until anal-ysis. Sample DIC analyses were performed within 2 d ofcollection. Laboratory experiments with a range of DIC stan-dards (0.5–7.0 mmol L21) showed no significant concentra-tion changes over 12 d (data not shown). Fifty-microlitersamples were injected into a vessel filled with 25 ml of 0.05mol L21 H2SO4 that was continuously sparged with CO2-freeN2 into a LI-COR 6252 infrared gas analyzer. Calibrationswere performed routinely by injecting a series of Na2CO3
standards (0.5–10 mmol L21). The median sample precisionfor 3–5 replicate standard injections was 0.01 mmol L21.
Pore-water sampling—Marsh pore water was sampled onthe same dates as the creek and mouth water-column sites.Clusters of three pore-water samplers (‘‘sippers’’) were lo-cated at 1, 15, and 30 m along a transect extending from thecreek bank (0 m) toward the marsh interior (30 m; Fig. 1).Each sipper had a 5-cm sampling window of porous sinteredplastic (Porex) centered at a depth of 5, 15, or 25 cm. Priorto sampling, sippers were purged of water and filled withargon gas to maintain anaerobic conditions. Each sipper wasthen evacuated to a vacuum of 50–60 cm Hg and allowedto refill for 4–5 h before sampling. Water was collected fromsippers within 1 h of low tide using polypropylene syringesand filtered for DIC analysis as described above. In spite ofthe relatively high vacuum and long recharge times, therewere occasions when there was not enough water for DICanalyses.
DIC export calculations—To quantify the export of DICfrom Sweet Hall marsh and place our data in a larger eco-logical context, we extrapolated DIC profiles from a singletidal creek to an estimate of whole marsh DIC flux to thesubtidal estuary. In the absence of marsh DIC input or re-moval terms, the concentration of DIC in a marsh tidal creekwill equal that in the adjacent river (DICcreek 5 DICriver). Forthis system, DICriver was estimated using DIC versus salinityregressions for the York and Pamunkey Rivers (Raymond etal. 2000). Because of tidal changes in salinity, the calculatedDICriver concentrations varied by 0.1–0.2 mmol L21 over thetidal cycle. For each hourly sampling point, the DIC enrich-ment due to marsh input (DICmarsh) was calculated as thedifference between measured (DICcreek) and predicted
(DICriver) concentrations. The DICmarsh term includes all DICadded within the marsh–tidal creek system. Periodically,DICcreek was less than calculated DICriver (generally by ,0.05mmol L21); on these occasions, we assumed that DICmarsh
was zero and within the prediction error of the DIC versussalinity regressions.
At Sweet Hall, water is confined to the tidal creeks at lowtide, but the entire marsh is typically flooded to a depth of20–40 cm at high tide. Seasonally, we determined whenflooding of the marsh surface began (i.e., ‘‘creek-full’’ depth,Dfull ). To account for spatial variations in marsh elevationand temporal changes in tidal range (e.g., over spring-neaptidal cycles), we varied this depth by 610 cm to calculate arange of DIC export. Using a computer graphics package(Canvas 5.0; Deneba Systems), the total length of all creekson a digitized USGS topographic map of Sweet Hall marshwas estimated as 48 km. Several deep (.2 m) and broad(.30 m) tidal channels that bisect the marsh were not in-cluded in this estimate. On the basis of the resolution of anindividual pixel on the digitized map (4 3 4 m), we assumedthat all creeks were 4 m wide. When water depth was belowthe creek-full depth (Dmeas , Dfull ), the total volume of waterin all tidal creeks at Sweet Hall was calculated using mea-sured water depths and estimates of creek width and length.Thus, V 5 [Dmeas 3 L 3 W] where V is water volume (m3),Dmeas is measured water depth (m), L is total length of allcreeks in the marsh (4.8 3 104 m), and W is creek width (4m). When measured water depth was greater than the creek-full depth, the total volume of water in the marsh was cal-culated as the sum of water in the marsh creeks and thatoverlying the marsh. Thus, if Dmeas . Dfull, V 5 [Dfull 3 L3 W] 1 [(Dmeas 2 Dfull ) 3 A] where A is the total area ofSweet Hall marsh (4 3 106 m2; Silberhorn and Zacherle1987).
Rates of DIC export were calculated during ebb tide whenthere was a hydrological export of water, and therefore DIC,from the marsh. This analysis only considers the transportof marsh-derived DIC (DICmarsh). Thus, if there is no DICenrichment (i.e., DICcreek 5 DICriver), the calculated DIC ex-port rate will be zero. For each set of adjacent hourly timepoints during ebb tide (t(i) and t(i11)), the average DIC en-richment (DICmarsh; mmol L21) was multiplied by the changein volume (V, in liters) to calculate hourly DIC export(DICexport; mmol h21):
DICexport 5 [(DICmarsh,t(i) 1 DICmarsh,t(i11))/2] 3 (Vt(i) 2 Vt(i11))
Marsh DIC fluxes were summed over two ebb tides per dayand divided by the total area of Sweet Hall marsh to cal-culate the average flux per m2 of marsh per day for eachsampling date.
The evasion of CO2 from marsh waters to the atmospherewas calculated using the gas-exchange coefficient (k) and theCO2 concentration gradient (under the assumption of an at-mospheric CO2 concentration of 360 ppmv) across the air-water interface as flux 5 k 3 ([CO2]water 2 [CO2]air). TheCO2 concentrations were calculated using measured DIC, sa-linity, temperature, and pH data (Park 1969; Weiss 1974;Millero 1995). Additionally, we used DIC concentrationsfrom Raymond et al.’s (2000) DIC versus salinity regressionsto estimate the amount of CO2 contributed by river water
302 Neubauer and Anderson
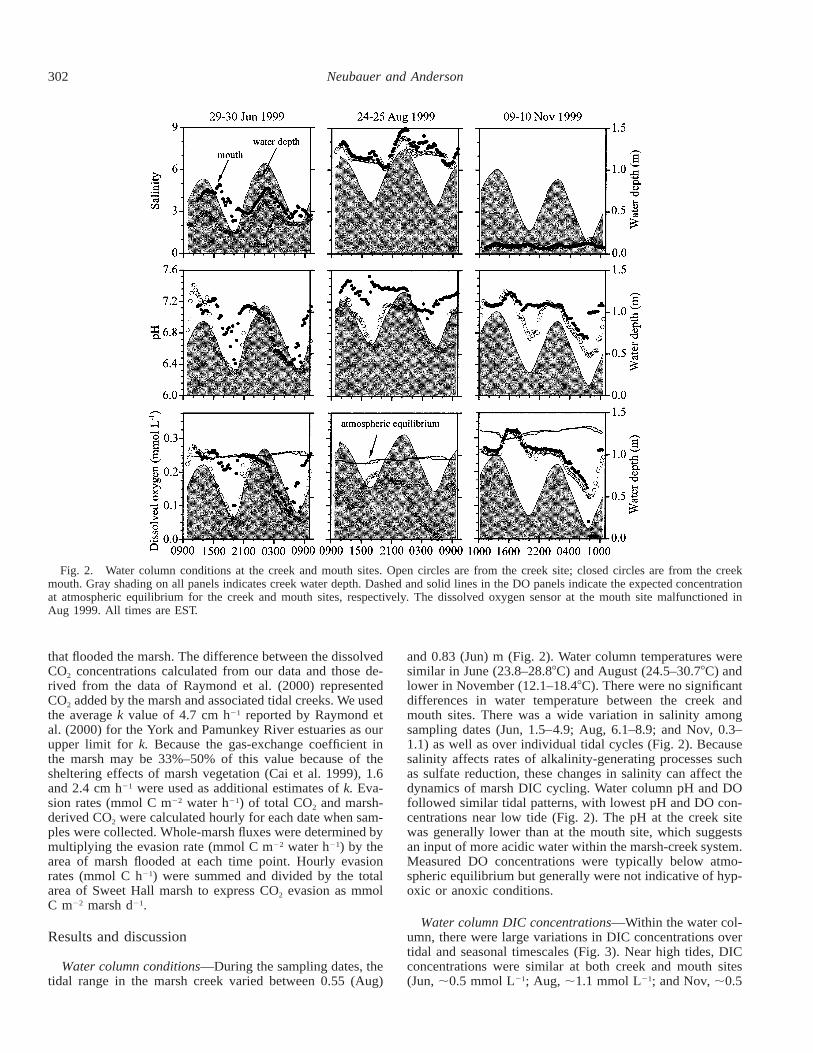
Fig. 2. Water column conditions at the creek and mouth sites. Open circles are from the creek site; closed circles are from the creekmouth. Gray shading on all panels indicates creek water depth. Dashed and solid lines in the DO panels indicate the expected concentrationat atmospheric equilibrium for the creek and mouth sites, respectively. The dissolved oxygen sensor at the mouth site malfunctioned inAug 1999. All times are EST.
that flooded the marsh. The difference between the dissolvedCO2 concentrations calculated from our data and those de-rived from the data of Raymond et al. (2000) representedCO2 added by the marsh and associated tidal creeks. We usedthe average k value of 4.7 cm h21 reported by Raymond etal. (2000) for the York and Pamunkey River estuaries as ourupper limit for k. Because the gas-exchange coefficient inthe marsh may be 33%–50% of this value because of thesheltering effects of marsh vegetation (Cai et al. 1999), 1.6and 2.4 cm h21 were used as additional estimates of k. Eva-sion rates (mmol C m22 water h21) of total CO2 and marsh-derived CO2 were calculated hourly for each date when sam-ples were collected. Whole-marsh fluxes were determined bymultiplying the evasion rate (mmol C m22 water h21) by thearea of marsh flooded at each time point. Hourly evasionrates (mmol C h21) were summed and divided by the totalarea of Sweet Hall marsh to express CO2 evasion as mmolC m22 marsh d21.
Results and discussion
Water column conditions—During the sampling dates, thetidal range in the marsh creek varied between 0.55 (Aug)
and 0.83 (Jun) m (Fig. 2). Water column temperatures weresimilar in June (23.8–28.88C) and August (24.5–30.78C) andlower in November (12.1–18.48C). There were no significantdifferences in water temperature between the creek andmouth sites. There was a wide variation in salinity amongsampling dates (Jun, 1.5–4.9; Aug, 6.1–8.9; and Nov, 0.3–1.1) as well as over individual tidal cycles (Fig. 2). Becausesalinity affects rates of alkalinity-generating processes suchas sulfate reduction, these changes in salinity can affect thedynamics of marsh DIC cycling. Water column pH and DOfollowed similar tidal patterns, with lowest pH and DO con-centrations near low tide (Fig. 2). The pH at the creek sitewas generally lower than at the mouth site, which suggestsan input of more acidic water within the marsh-creek system.Measured DO concentrations were typically below atmo-spheric equilibrium but generally were not indicative of hyp-oxic or anoxic conditions.
Water column DIC concentrations—Within the water col-umn, there were large variations in DIC concentrations overtidal and seasonal timescales (Fig. 3). Near high tides, DICconcentrations were similar at both creek and mouth sites(Jun, ;0.5 mmol L21; Aug, ;1.1 mmol L21; and Nov, ;0.5

303Tidal marsh DIC export
Fig. 3. Diurnal DIC profiles. Open circles are from the creek site; closed circles are from the creek mouth. Gray shading indicatescreek water depth. Sampling in June 1999 was cut short due to severe weather. All times are EST.
Fig. 4. Water column DIC vs. DO at the creek and mouth sites.Regression line for creek samples is fit through all data points; theline for mouth samples is fit through all points except the two lowDO, low DIC outliers from November. These outliers were omittedfrom the regression analysis because we suspect that the DO sensorwas in the sediments rather than the water column during thesesampling points. Arrows show the expected slope of 21 (i.e., 1 molDIC produced per mol DO consumed) for aerobic heterotrophicrespiration. Note that the slope of the regression line is much steeperthan 21, indicating that aerobic metabolism cannot fully accountfor water column DIC changes.
mmol L21). These high-tide concentrations were within60.05 mmol L21 of those calculated from DIC versus salin-ity regression equations for the York and Pamunkey Rivers(Raymond et al. 2000; exception: one point in August was
overestimated by 0.10 mmol L21). This suggests that theprocesses that affect estuarine DIC gradients in the York andPamunkey Rivers also control high-tide DIC concentrationsin the marsh tidal creek.
At both the creek and mouth sites, DIC concentrationsduring ebb tide increased steadily (by 0.6–1.9 mmol L21)before reaching a maximum ;1 h before low tide at themouth site and slightly after low tide in the creek (Fig. 3).Maximum concentrations at the creek site were always great-er than at the mouth site. Similarly, Cai et al. (2000) reportedthat DIC concentrations in a Georgia salt marsh creek wereup to two times greater than in the adjacent river. Becauseour measured ebb tide concentrations were up to 1.9 mmolL21 greater than predicted by the DIC versus salinity re-gression equations of Raymond et al. (2000), we suggest thatlocal processes occurring within the marsh–tidal creek sys-tem had a strong effect on ebb tide DIC concentrations.Within marsh tidal creeks, DIC can be affected by in situautotrophic and heterotrophic activity, the mixing of creekwater with other end members (e.g., river water, marsh porewater, and groundwater) and CO2 exchange with the atmo-sphere. Water column CO2 concentrations during this study(800 to .20,000 ppm) were 2–69 times greater than atmo-spheric equilibrium; therefore, the creek was a source of CO2
to the atmosphere with marsh-atmosphere CO2 fluxes of 0.3–38 mmol C m22 water h21. The inputs of DIC from watercolumn and subtidal sediment respiration were estimated us-ing changes in DO over the tidal cycle (Fig. 2) and assuminga respiratory quotient of 1 (i.e., 1 mmol CO2 produced per1 mmol O2 consumed). Although large decreases in DO dur-ing ebb tide corresponded with peaks in DIC (compare Figs.2, 3), respiration in the water column and creek sedimentscould explain ,0.2 mmol L21 of the observed 0.6–1.9 mmolL21 DIC enrichment during ebb tide. The importance of wa-ter column respiration will be less if the drainage of anoxicpore water from marsh sediments is sufficient to influenceoxygen concentrations in the creek. Across all months andat both the creek and mouth sites, DO and DIC were neg-atively correlated (r2 . 0.57, p , 0.001) with a slope of ;4mmol DIC produced per mmol DO consumed (Fig. 4). Be-cause this slope is steeper than expected for aerobic hetero-trophic respiration (i.e., a respiratory quotient of 1), we sug-gest that the marsh is ‘‘imprinting’’ water in the tidal creeksystem by either adding DIC and/or removing O2 (e.g., sul-

304 Neubauer and Anderson
Table 1. Marsh porewater DIC concentrations. Samples werecollected within 1 h of low tide along a transect extending fromcreek bank (0 m) to the marsh interior (30 m; Fig. 1). nd, no data.
Distance(m)
Depth(cm)
DIC (mmol L21)
Jun Aug Nov
111
51525
1.143.11nd
2.434.862.15
2.103.66nd
151515
51525
2.704.664.68
5.566.736.60
3.655.454.58
303030
51525
3.223.994.22
4.693.522.75
2.473.683.09
fate reduction generates carbonate alkalinity and/or reducedspecies such as Fe[II] are exported from marsh sedimentsand are chemically oxidized in the water column). BecauseDIC in tidal creek waters was always supersaturated withrespect to the atmosphere and could not be completely ex-plained by respiration within the creek, there must have beenan allochthonous source(s) of high-DIC water that was mix-ing with the creek and river waters.
Carbonate species distribution—Water draining from themarsh was supersaturated with dissolved CO2 and thereforeemitted CO2 to the atmosphere by diffusive evasion. Al-though the equilibration of dissolved CO2 with the atmo-sphere will shift the carbonate equilibrium, CO2 evasion doesnot affect the carbonate alkalinity, unless carbonate precip-itation occurs as a result. Thus, carbonate alkalinity can actas a longer-term sink for carbon and is subject to transportthrough the estuary to the coastal ocean. To determinewhether the marsh-derived DIC represents an atmosphericsource (CO2) or an estuarine sink (carbonate alkalinity) forinorganic carbon, measured pH and DIC concentrations werecombined with equations from Park (1969) to calculate theequilibrium partitioning between carbonic acid (H2CO3, pri-marily as hydrated molecular CO2), bicarbonate (HCO ),2
3
and carbonate (CO ). For the pH range observed in the223
marsh tidal creek (6.4–7.2, Fig. 2), CO was a minor frac-223
tion (,1%) of total DIC. The observed pH decreases duringebb tides (Fig. 2) caused the fraction of CO2 in the total DICpool to increase relative to carbonate alkalinity, with thehighest proportion of CO2 (up to 38%) occurring near slacklow tide, when DIC concentrations were greatest. The com-position of DIC exported from the marsh was similar in Juneand November (CO2, 21%–23%; HCO , 78%–79%). Be-2
3
cause of higher salinity in August (Fig. 2), a greater fraction(88%) of DIC was as HCO during this month. When av-2
3
eraged over ebb tides for all sampling dates, the averagecomposition of DIC exported from Sweet Hall marsh was19% (65%) dissolved CO2 and 81% (65%) HCO and2
3
CO . During years with more rainfall and freshwater input,223
the carbonate equilibrium is likely to shift toward increaseddissolved CO2 because of lower salinities and decreased sul-fate reduction rates (an alkalinity source). Changes in thisequilibrium will affect the role of the marsh as an atmo-spheric source or estuarine sink of inorganic carbon.
High CO2 concentrations in marsh tidal waters (0.03–0.82mmol L21) lead to calculated evasion rates of 0.3–38 mmolC m22 water h21 (range includes tidal and seasonal variabil-ity and k values from 1.6 to 4.7 cm h21). These fluxes arecomparable to those reported for other CO2-supersaturatedsystems, including river estuaries along the east coast ofNorth America (20.1 to 11.4 mmol C m22 h21; Raymond etal. 1997, 2000; Cai and Wang 1998) and several westernEuropean estuaries (0.4–32 mmol C m22 h21; Frankignouleet al. 1998; Hellings et al. 2001). In the present study, CO2
evasion was considerably higher when water was confinedto the tidal creeks (0.6–38 mmol C m22 water h21) versuswhen the marsh surface was flooded (0.3–8.8 mmol C m22
water h21). Because the area of tidal creeks at Sweet Hall issmall relative to the total marsh area, total (i.e., marsh-de-rived 1 riverine-derived) CO2 efflux was considerably lower
when normalized to marsh area (Jun, 7.5–52.2 mmol C m22
marsh d21; Aug, 9.4–52.1 mmol C m22 marsh d21; and Nov,4.9–29.9 mmol C m22 marsh d21). The efflux of marsh-de-rived CO2 accounted for 10%–13% (Aug) to 28%–41% (Junand Nov) of the total CO2 evasion and reflected seasonaldifferences in salinity.
Pore-water DIC concentrations—With the exception ofthe shallow creek bank sipper in June and November, allpore-water DIC concentrations (1.14–6.73 mmol L21) weregreater than those measured in the tidal creek or at the creekmouth (Table 1). Therefore, inputs of marsh pore water tothe creek via drainage or diffusion may explain the tidalpatterns in water column DIC. Pore-water DIC concentra-tions were generally higher below 5 cm depth; this was like-ly due to water residence time within marsh sediments. Us-ing a vertical infiltration rate for Sweet Hall marsh of 0.15–2.77 L m22 tide21 (water column to marsh sediments; Reay1989), an average dry sediment bulk density of 0.408 g cm23
(Neubauer et al. 2002), and an average sediment water con-tent of 67% by mass (S.C.N., unpublished data), it takes 47to .800 d to completely replace all pore water to a depthof 30 cm. Thus, although shallow (5 cm) pore water canexchange readily with overlying water when the marsh isflooded, deeper pore water turns over slowly; this allowsDIC produced by sediment heterotrophic processes to ac-cumulate in deeper sediments. The distribution of flow pathswithin marsh sediments will determine how much of thishigh DIC pore water drains into intertidal marsh creeks.
Whole marsh DIC flux—Previous studies that have ex-amined estuarine DIC dynamics have suggested a tidalmarsh source of DIC to explain observed DIC concentrationsand CO2 supersaturation within the main stem of the estuary(e.g., Cai and Wang 1998; Cai et al. 1999; Raymond et al.2000). The consistent increase in DIC during ebb tide (Fig.3) and the higher DICcreek versus DICriver concentrations sup-port the idea that the marsh was a source of DIC to marshcreek waters. Because the tidal DIC trends were similar atthe creek mouth (but somewhat less in magnitude), we sug-gest that the DIC in water draining from the marsh wasexported to the adjacent river.
The DIC export rates calculated using a model of water
305Tidal marsh DIC export
Table 2. Ebb tide DIC export and CO2 evasion from Sweet Hall marsh. Export and evasion rates are for marsh-derived (not total) DICand CO2. The DIC export rate includes hydrological export and CO2 evasion. The DIC export rates and the composition of exported DIC(6SD; n 5 3) are provided for model output over the range in Dfull. Less than 1% of all DIC was exported as CO3
22. Evasion rates ofmarsh-derived CO2 are provided for the range in Dfull and k values of 1.6, 2.4, and 4.7 cm h21 (6SD, n 5 9).
Date
Ebb tide DIC export(mmol C m22 d21)
Range Average
DIC composition(%)
HCO32 CO2
Ebb tide CO2 evasion(mmol C m22 d21)
Range Average
Jun 1999Aug 1999Nov 1999
37–13436–10120–49
82 6 4966 6 3333 6 15
77 6 188 6 079 6 3
23 6 112 6 021 6 2
1.4–11.80.6–4.00.8–4.8
4.5 6 3.21.9 6 1.22.1 6 1.2
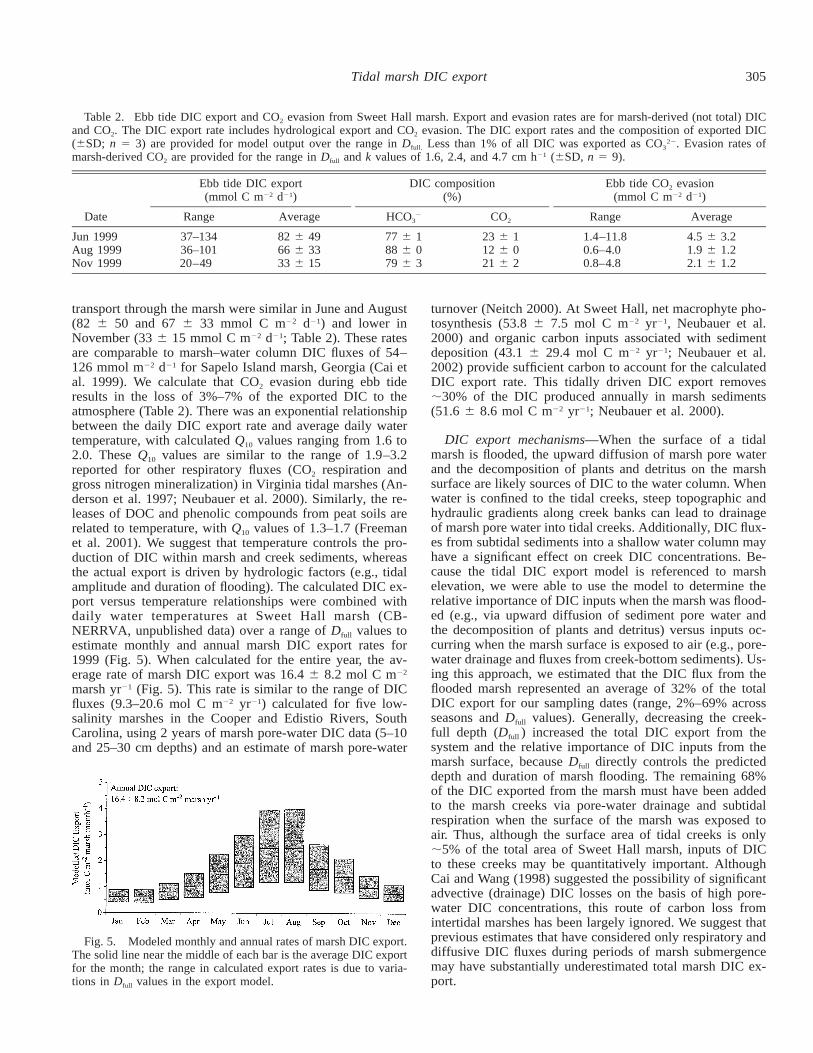
Fig. 5. Modeled monthly and annual rates of marsh DIC export.The solid line near the middle of each bar is the average DIC exportfor the month; the range in calculated export rates is due to varia-tions in Dfull values in the export model.
transport through the marsh were similar in June and August(82 6 50 and 67 6 33 mmol C m22 d21) and lower inNovember (33 6 15 mmol C m22 d21; Table 2). These ratesare comparable to marsh–water column DIC fluxes of 54–126 mmol m22 d21 for Sapelo Island marsh, Georgia (Cai etal. 1999). We calculate that CO2 evasion during ebb tideresults in the loss of 3%–7% of the exported DIC to theatmosphere (Table 2). There was an exponential relationshipbetween the daily DIC export rate and average daily watertemperature, with calculated Q10 values ranging from 1.6 to2.0. These Q10 values are similar to the range of 1.9–3.2reported for other respiratory fluxes (CO2 respiration andgross nitrogen mineralization) in Virginia tidal marshes (An-derson et al. 1997; Neubauer et al. 2000). Similarly, the re-leases of DOC and phenolic compounds from peat soils arerelated to temperature, with Q10 values of 1.3–1.7 (Freemanet al. 2001). We suggest that temperature controls the pro-duction of DIC within marsh and creek sediments, whereasthe actual export is driven by hydrologic factors (e.g., tidalamplitude and duration of flooding). The calculated DIC ex-port versus temperature relationships were combined withdaily water temperatures at Sweet Hall marsh (CB-NERRVA, unpublished data) over a range of Dfull values toestimate monthly and annual marsh DIC export rates for1999 (Fig. 5). When calculated for the entire year, the av-erage rate of marsh DIC export was 16.4 6 8.2 mol C m22
marsh yr21 (Fig. 5). This rate is similar to the range of DICfluxes (9.3–20.6 mol C m22 yr21) calculated for five low-salinity marshes in the Cooper and Edistio Rivers, SouthCarolina, using 2 years of marsh pore-water DIC data (5–10and 25–30 cm depths) and an estimate of marsh pore-water
turnover (Neitch 2000). At Sweet Hall, net macrophyte pho-tosynthesis (53.8 6 7.5 mol C m22 yr21, Neubauer et al.2000) and organic carbon inputs associated with sedimentdeposition (43.1 6 29.4 mol C m22 yr21; Neubauer et al.2002) provide sufficient carbon to account for the calculatedDIC export rate. This tidally driven DIC export removes;30% of the DIC produced annually in marsh sediments(51.6 6 8.6 mol C m22 yr21; Neubauer et al. 2000).
DIC export mechanisms—When the surface of a tidalmarsh is flooded, the upward diffusion of marsh pore waterand the decomposition of plants and detritus on the marshsurface are likely sources of DIC to the water column. Whenwater is confined to the tidal creeks, steep topographic andhydraulic gradients along creek banks can lead to drainageof marsh pore water into tidal creeks. Additionally, DIC flux-es from subtidal sediments into a shallow water column mayhave a significant effect on creek DIC concentrations. Be-cause the tidal DIC export model is referenced to marshelevation, we were able to use the model to determine therelative importance of DIC inputs when the marsh was flood-ed (e.g., via upward diffusion of sediment pore water andthe decomposition of plants and detritus) versus inputs oc-curring when the marsh surface is exposed to air (e.g., pore-water drainage and fluxes from creek-bottom sediments). Us-ing this approach, we estimated that the DIC flux from theflooded marsh represented an average of 32% of the totalDIC export for our sampling dates (range, 2%–69% acrossseasons and Dfull values). Generally, decreasing the creek-full depth (Dfull ) increased the total DIC export from thesystem and the relative importance of DIC inputs from themarsh surface, because Dfull directly controls the predicteddepth and duration of marsh flooding. The remaining 68%of the DIC exported from the marsh must have been addedto the marsh creeks via pore-water drainage and subtidalrespiration when the surface of the marsh was exposed toair. Thus, although the surface area of tidal creeks is only;5% of the total area of Sweet Hall marsh, inputs of DICto these creeks may be quantitatively important. AlthoughCai and Wang (1998) suggested the possibility of significantadvective (drainage) DIC losses on the basis of high pore-water DIC concentrations, this route of carbon loss fromintertidal marshes has been largely ignored. We suggest thatprevious estimates that have considered only respiratory anddiffusive DIC fluxes during periods of marsh submergencemay have substantially underestimated total marsh DIC ex-port.

306 Neubauer and Anderson
DIC export and estuarine net heterotrophy—For the Yorkand Pamunkey Rivers (Virginia), Raymond et al. (2000) cal-culated that net heterotrophy (based on CO2 evasion and DICexport rates) ranged from 1.7–2.1 3 109 mol C yr21 duringtheir 18-month study. Although we agree with Raymond etal. that this system was net heterotrophic, our data suggestthat the observed ‘‘net heterotrophy’’ resulted both from insitu respiration of labile organic carbon as well as DIC trans-ported into the river from tidal marshes. Excess DIC is de-fined herein as that which cannot be explained by conser-vative mixing between seawater and freshwater orequilibration with the atmosphere. On the basis of incubationexperiments, Raymond and Bauer (2000) calculated thatbacterial respiration of DOC in the water column could ac-count for 20 6 12% of CO2 evasion in the tidal freshwaterPamunkey River (CO2 evasion accounted for ;60% of theexcess DIC in the system; Raymond et al. 2000) and sug-gested that the remainder was due to respiration within riverbottom sediments, remineralization of POC, or inputs of DICfrom tidal marshes. To determine the contribution of tidalmarshes to the excess DIC pool in the York and PamunkeyRivers (i.e., Raymond et al’s net heterotrophy), we scaledour estimates of DIC flux from Sweet Hall marsh to the totalarea of tidal marshes in the estuary. Rates of heterotrophicactivity in the sediments and soils of other marshes in theestuary as well as pore-water salinities will determine theamount and speciation (CO2, HCO , and CO ) of DIC2 22
3 3
available for export from each individual marsh. Similarly,the hydrology of each tidal creek and marsh along the riverwill influence the amount of marsh-derived DIC that is ex-ported to the estuary. Therefore, the actual DIC export froman individual marsh will depend on the specific mechanismsof DIC production, accumulation, and removal in that marsh.Our subsequent calculations and those of Raymond et al.(2000) included the Pamunkey River (which contributes;70% of the annual flow to the York River) and the YorkRiver itself; the Mattaponi River (the other major tributaryof the York River) was not included in DIC production orflux estimates.
There must be an input of 1.9 3 109 mol C yr21 to theYork River estuary to account for the excess DIC pool inthe system (midpoint of range reported in Raymond et al.2000). As previously mentioned, some of this DIC may beproduced by organic matter remineralization in the river it-self. Given an annual DIC export rate of 16.4 6 8.2 mol Cm22 marsh yr21 (Fig. 5) from 5.4 3 107 m2 of tidal marshalong the York and Pamunkey Rivers (summed from inven-tories in Silberhorn 1974; Moore 1976; Doumlele 1979;Moore 1980; Priest et al. 1987; Silberhorn and Zacherle1987), the total export of DIC from tidal marshes could ac-count for 8.9 3 108 (64.4 3 108) mol C yr21, or 47 6 23%of the carbon required to support the annual excess DICproduction reported by Raymond et al. (2000). Sources ofthe remaining fraction of carbon to support excess DIC pro-duction in the estuary could include water column or sedi-ment metabolism of allochthonous DOC and POC andgroundwater inputs to the river. Although we have found noevidence of DOC export from Sweet Hall marsh, an analysisof suspended particulate matter in the creek suggested a pos-sible input of POC from the marsh to the creek (DOC and
POC samples were collected at same time as the DIC sam-ples reported herein; see Neubauer 2000). We suggest thatour calculation of DIC export may slightly underestimate theactual flux of marsh-derived DIC to the York and PamunkeyRivers because marsh pore-water DIC concentrations tend toincrease toward the saline end of estuaries (e.g., Neitch2000). However, the total area of salt marshes in York andPamunkey Rivers is small relative to the area of low salinitytidal marshes in the system, so this effect may be minor. Thegradient in marsh pore-water DIC concentrations occurs de-spite a general increase in total system metabolism (mea-sured as CO2 efflux from the marsh surface) from saline tofreshwater marshes (e.g., Neitch 2000; Neubauer et al. 2000;Miller et al. 2001), primarily because free CO2 is a greaterfraction of the DIC pool in low salinity marshes. The sig-nificance of tidal marshes as sources of DIC to estuaries canvary from year to year because of interannual changes inorganic carbon inputs in the marsh (e.g., autotrophic pro-duction and sediment deposition), microbial metabolic path-ways (e.g., salinity-induced changes in the importance ofsulfate reduction), and hydrological flushing of the system.
Our annual flux estimates were based on DIC measure-ments during 3 months (Jun, Aug, and Nov), but rates ofestuarine heterotrophy (and excess DIC production) are driv-en by a suite of interacting biological, chemical, and physicalfactors and are therefore temporally and spatially variable.In the York River estuary, Raymond et al. (2000) measuredthe highest rates of excess DIC production in the low salinityregions of the estuary during the summer and autumn (Jun–Oct). Therefore, if tidal marshes are driving the productionof excess DIC in the York River, there should be evidenceof greater marsh DIC export during the summer versus thewinter as well as a larger DIC input to the freshwater reachesof the estuary. Because DIC flux estimates (Fig. 5) and CO2
gas flux measurements from the marsh surface (Neubauer etal. 2000) reproduce the seasonal patterns of excess DIC inthe York River reported by Raymond et al. (2000), thereappears to be temporal coupling between processes occur-ring within tidal marshes and estuarine DIC dynamics. Also,the ratio of marsh to open water is much greater in the Pa-munkey River (4.05) than the York River (0.22), which sug-gests that the relative influence of marshes as DIC sourceswill be greater in the low salinity reaches of the system.Similarly, Cai et al. (1999) reported that the ratio of intertidalmarsh to estuary was a critical factor in constructing CO2
and O2 mass balances for the Satilla River, Georgia. The dataand modeling results presented herein directly confirm thesuggestions that tidal marshes are significant contributors ofDIC to estuarine waters and can explain a substantial portionof CO2 supersaturation and excess DIC production withinthese systems. Therefore, DIC concentrations in excess ofconservative mixing between freshwater and marine endmembers do not necessarily imply that an estuary is a netheterotrophic ecosystem.
References
ANDERSON I. C., C. R. TOBIAS, B. B. NEIKIRK, AND R. L. WETZEL.1997. Development of a process-based nitrogen mass balancemodel for a Virginia (USA) Spartina alterniflora salt marsh:

307Tidal marsh DIC export
Implications for net DIN flux. Mar. Ecol. Prog. Ser. 159: 13–27.
BROOKS, T. J. 1983. Pamunkey River slack water data report: Tem-perature, salinity, dissolved oxygen 1970–1980. Data report20. Virginia Institute of Marine Science, College of Williamand Mary.
CAI, W.-J., L. R. POMEROY, M. A. MORAN, AND Y. WANG. 1999.Oxygen and carbon dioxide mass balance for the estuarine-intertidal marsh complex of five rivers in the southeastern U.S.Limnol. Oceanogr. 44: 639–649.
, AND Y. WANG. 1998. The chemistry, fluxes, and sourcesof carbon dioxide in the estuarine waters of the Satilla andAlthamaha Rivers, Georgia. Limnol. Oceanogr. 43: 657–668.
, W. J. WEIBE, Y. WANG, AND J. E. SHELDON. 2000. Intertidalmarsh as a source of dissolved inorganic carbon and a sink ofnitrate in the Satilla River–estuarine complex in the southeast-ern U.S. Limnol. Oceanogr. 45: 1743–1752.
CHILDERS, D. L. 1994. Fifteen years of marsh flumes: A review ofmarsh-water column interactions in southeastern USA estuar-ies, p. 277–293. In W. J. Mitsch [ed.], Global wetlands: Oldworld and new. Elsevier.
DAME, R. F. 1994. The net flux of materials between marsh-estua-rine systems and the sea: The Atlantic coast of the UnitedStates, p. 295–302. In W. J. Mitsch [ed.], Global wetlands: Oldworld and new. Elsevier.
DOUMLELE, D. G. 1979. New Kent County tidal marsh inventory.SRAMSOE 208. Virginia Institute of Marine Science, Collegeof William and Mary.
FRANKIGNOULLE, M., AND OTHERS. 1998. Carbon dioxide emissionfrom European estuaries. Science 282: 434–436.
FREEMAN, C., C. D. EVANS, AND D. T. MONTEITH. 2001. Export oforganic carbon from peat soils. Nature 412: 785.
GATTUSO, J.-P., M. FRANKIGNOULLE, AND R. WOLLAST. 1998. Car-bon and carbonate metabolism in coastal ecosystems. Annu.Rev. Ecol. Syst. 29: 405–434.
HELLINGS, L., F. DEHAIRS, S. VAN DAMME, AND W. BAEYENS. 2001.Dissolved inorganic carbon in a highly polluted estuary (theScheldt). Limnol. Oceanogr. 46: 1406–1414.
HOPKINSON, C. S., AND J. J. VALLINO. 1995. The relationships be-tween man’s activities in watersheds and estuaries: A model ofrunoff effects on patterns of estuarine community metabolism.Estuaries 18: 598–621.
KEMP, W. M., E. SMITH, M. MARVIN-DIPASQUALE, AND W. R.BOYNTON. 1997. Organic carbon balance and net ecosystemmetabolism in Chesapeake Bay. Mar. Ecol. Prog. Ser. 150:229–248.
MILLER, W. D., S. C. NEUBAUER, AND I. C. ANDERSON. 2001. Ef-fects of sea level induced disturbances on high salt marsh me-tabolism. Estuaries 24: 357–367.
MILLERO, F. J. 1995. Thermodynamics of the carbon dioxide systemin the oceans. Geochim Cosmochim. Acta 59: 661–677.
MOORE, K. A. 1976. Gloucester County tidal marsh inventory.SRAMSOE 64. Virginia Institute of Marine Science, Collegeof William and Mary.
. 1980. James City County tidal marsh inventory. SRAM-SOE 188. Virginia Institute of Marine Science, College of Wil-liam and Mary.
NEITCH, C. T. 2000. Carbon biogeochemistry in tidal marshes ofSouth Carolina: The effect of salinity and nutrient availabilityon marsh metabolism in estuaries with contrasting histories ofdisturbance and river influence. Ph.D. dissertation, Universityof South Carolina, Columbia.
NEUBAUER, S. C. 2000. Carbon dynamics in a tidal freshwatermarsh. Ph.D. dissertation, College of William and Mary, Vir-ginia Institute of Marine Science.
, I. C. ANDERSON, J. A. CONSTANTINE, AND S. A. KUEHL.2002. Sediment deposition and accretion in a mid-Atlantic(U.S.A.) tidal freshwater marsh. Estuar. Coast. Shelf Sci. 54:713–727
, W. D. MILLER, AND I. C. ANDERSON. 2000. Carbon cyclingin a tidal freshwater marsh ecosystem: A carbon gas flux study.Mar. Ecol. Prog. Ser. 199: 13–30.
NIXON, S. W. 1980. Between coastal marshes and coastal waters—a review of twenty years of speculation and research in the roleof salt marshes in estuarine productivity and water chemistry,p. 437–525. In P. Hamilton and K. B. McDonald [eds.], Estu-arine and wetland processes with emphasis on modelling. Ple-num.
PARK, P. K. 1969. Oceanic CO2 system: An evaluation of ten meth-ods of investigation. Limnol. Oceanogr. 14: 179–186.
PRIEST, W. I. III, G. M. SILBERHORN, AND A. W. ZACHERLE. 1987.King and Queen County tidal marsh inventory. SRAMSOE291. Virginia Institute of Marine Science, College of Williamand Mary, Gloucester Point.
RAYMOND, P. A., AND J. E. BAUER. 2000. Bacterial consumption ofDOC during transport through a temperate estuary. Aquat. Mi-crob. Ecol. 22:1–12.
, , AND J. J. COLE. 2000. Atmospheric CO2 evasion,dissolved inorganic carbon production, and net heterotrophy inthe York River estuary. Limnol. Oceanogr. 45: 1707–1717.
, N. F. CARACO, AND J. J. COLE. 1997. Carbon dioxide con-centration and atmospheric flux in the Hudson River. Estuaries20: 381–390.
REAY, W. G. 1989. A geohydrological approach to subsurface hy-drodynamics and nutrient exchange within an extensive tidalfreshwater wetland. M.S. thesis, College of William and Mary,Virginia Institute of Marine Science.
SILBERHORN, G. M. 1974. York County and town of Poquoson tidalmarsh inventory. SRAMSOE 53. Virginia Institute of MarineScience, College of William and Mary.
, AND A. W. ZACHERLE. 1987. King William County andtown of West Point tidal marsh inventory. SRAMSOE 289.Virginia Institute of Marine Science, College of William andMary.
SMITH, S. V., AND J. T. HOLLIBAUGH. 1993. Coastal metabolism andthe oceanic organic carbon balance. Rev. Geophys. 31: 75–89.
USGS. 2000. Water resources for the United States: Discharge datafor the Pamunkey River near Hanover VA; station no.01673000. United States Geological Survey, Washington D.C.(accessed 14 Jun 2000); available at http://water.usgs.gov.
WEISS, R. F. 1974. Carbon dioxide in water and seawater: The sol-ubility of a non-ideal gas. Mar. Chem. 2: 203–215.
Received: 30 January 2002Amended: 29 August 2002Accepted: 2 October 2002