A combined field and modeling study of groundwater flow in a tidal marsh
19
Hydrol. Earth Syst. Sci., 16, 741–759, 2012 www.hydrol-earth-syst-sci.net/16/741/2012/ doi:10.5194/hess-16-741-2012 © Author(s) 2012. CC Attribution 3.0 License. Hydrology and Earth System Sciences A combined field and modeling study of groundwater flow in a tidal marsh Y. Q. Xia 1,2,3 and H. L. Li 4 1 Changjiang River Scientific Research Institute (CRSRI), Changjiang Water Resources Commission of the Ministry of Water Resources (CWRC), Wuhan 430010, China 2 State Key Laboratory of Biogeology and Environmental Geology, China University of Geosciences, Wuhan 430074, China 3 Center for Natural Resources Development and Protection (NRDP), Department of Civil and Environmental Engineering, Temple University, PA 19122, USA 4 State Key Laboratory of Biogeology and Environmental Geology, China University of Geosciences-Beijing, Beijing 100083, China Correspondence to: H. L. Li ([email protected]) Received: 11 May 2011 – Published in Hydrol. Earth Syst. Sci. Discuss.: 24 May 2011 Revised: 11 January 2012 – Accepted: 29 January 2012 – Published: 7 March 2012 Abstract. Bald mud beaches were found among the man- grove marshes in Dongzhaigang National Nature Reserve, Hainan, China. To investigate the possible reasons for this phenomenon, the intertidal zones of a mangrove transect and a bald beach transect with similar topography and tidal actions were selected for comparison study. Along both transects, observed water table variations were significant in the high and low intertidal zones and negligible in the middle intertidal zones. Despite the same tidal actions and above-mentioned similarities, observed groundwater salin- ity was significantly smaller along the mangrove transect (average 23.0 ppt) than along the bald beach transect (av- erage 28.5 ppt). These observations invite one hypothesis: the hydraulic structure of tidal marsh and freshwater avail- ability may be the main hydrogeological factors critical to mangrove development. Two-dimensional numerical simu- lations corroborated the speculation and gave results in line with the observed water table. The two transects investigated were found to have a mud-sand two-layered structure: a sur- face zone of low-permeability mud and an underlying high- permeability zone that outcrops at the high and low tide lines. The freshwater recharge from inland is considerable along the mangrove transect but negligible along the bald beach transect. The high-permeability zone may provide opportu- nity for the plants in the mangrove marsh to uptake freshwa- ter and oxygen through their roots extending downward into the high-permeability zone, which may help limit the buildup of salt in the root zone caused by evapotranspiration and en- hance salt removal, which may further increase the produc- tion of marsh grasses and influence their spatial distribution. The bald beach is most probably due to the lack of enough freshwater for generating a brackish beach soil condition es- sential to mangrove growth. It is also indicated that seawa- ter infiltrated the high-permeability zone through its outcrop near the high intertidal zone, and discharged from the tidal river bank in the vicinity of the low tide line. These pro- cesses thereby formed a tide-induced seawater-groundwater circulation, which likely provided considerable contribution to the total submarine groundwater discharge (SGD). Fi- nally, implications and uncertainties behind this study were summarized for future examinations. 1 Introduction Salt marshes perform a variety of functions such as maintain- ing biodiversity, stabilizing and recycling nutrients and or- ganic carbon (Valiela and Teal, 1979; Steudler and Peterson, 1984; Luther et al., 1986; Dittmar et al., 2006; Kristensen et al., 2008), buffering storms and hurricanes, and provid- ing nursery areas for marine fauna and flora (e.g. Nagelk- erken et al., 2008). They have attracted numerous scientific Published by Copernicus Publications on behalf of the European Geosciences Union.
-
Upload
independent -
Category
Documents
-
view
1 -
download
0
Transcript of A combined field and modeling study of groundwater flow in a tidal marsh
Hydrol. Earth Syst. Sci., 16, 741–759, 2012www.hydrol-earth-syst-sci.net/16/741/2012/doi:10.5194/hess-16-741-2012© Author(s) 2012. CC Attribution 3.0 License.
Hydrology andEarth System
Sciences
A combined field and modeling study of groundwater flow in atidal marsh
Y. Q. Xia1,2,3 and H. L. Li 4
1Changjiang River Scientific Research Institute (CRSRI), Changjiang Water Resources Commission of the Ministryof Water Resources (CWRC), Wuhan 430010, China2State Key Laboratory of Biogeology and Environmental Geology, China University of Geosciences, Wuhan 430074, China3Center for Natural Resources Development and Protection (NRDP), Department of Civil and Environmental Engineering,Temple University, PA 19122, USA4State Key Laboratory of Biogeology and Environmental Geology, China University of Geosciences-Beijing,Beijing 100083, China
Correspondence to:H. L. Li ([email protected])
Received: 11 May 2011 – Published in Hydrol. Earth Syst. Sci. Discuss.: 24 May 2011Revised: 11 January 2012 – Accepted: 29 January 2012 – Published: 7 March 2012
Abstract. Bald mud beaches were found among the man-grove marshes in Dongzhaigang National Nature Reserve,Hainan, China. To investigate the possible reasons for thisphenomenon, the intertidal zones of a mangrove transectand a bald beach transect with similar topography and tidalactions were selected for comparison study. Along bothtransects, observed water table variations were significantin the high and low intertidal zones and negligible in themiddle intertidal zones. Despite the same tidal actions andabove-mentioned similarities, observed groundwater salin-ity was significantly smaller along the mangrove transect(average 23.0 ppt) than along the bald beach transect (av-erage 28.5 ppt). These observations invite one hypothesis:the hydraulic structure of tidal marsh and freshwater avail-ability may be the main hydrogeological factors critical tomangrove development. Two-dimensional numerical simu-lations corroborated the speculation and gave results in linewith the observed water table. The two transects investigatedwere found to have a mud-sand two-layered structure: a sur-face zone of low-permeability mud and an underlying high-permeability zone that outcrops at the high and low tide lines.The freshwater recharge from inland is considerable alongthe mangrove transect but negligible along the bald beachtransect. The high-permeability zone may provide opportu-nity for the plants in the mangrove marsh to uptake freshwa-ter and oxygen through their roots extending downward into
the high-permeability zone, which may help limit the buildupof salt in the root zone caused by evapotranspiration and en-hance salt removal, which may further increase the produc-tion of marsh grasses and influence their spatial distribution.The bald beach is most probably due to the lack of enoughfreshwater for generating a brackish beach soil condition es-sential to mangrove growth. It is also indicated that seawa-ter infiltrated the high-permeability zone through its outcropnear the high intertidal zone, and discharged from the tidalriver bank in the vicinity of the low tide line. These pro-cesses thereby formed a tide-induced seawater-groundwatercirculation, which likely provided considerable contributionto the total submarine groundwater discharge (SGD). Fi-nally, implications and uncertainties behind this study weresummarized for future examinations.
1 Introduction
Salt marshes perform a variety of functions such as maintain-ing biodiversity, stabilizing and recycling nutrients and or-ganic carbon (Valiela and Teal, 1979; Steudler and Peterson,1984; Luther et al., 1986; Dittmar et al., 2006; Kristensenet al., 2008), buffering storms and hurricanes, and provid-ing nursery areas for marine fauna and flora (e.g. Nagelk-erken et al., 2008). They have attracted numerous scientific
Published by Copernicus Publications on behalf of the European Geosciences Union.

742 Y. Q. Xia and H. L. Li: A combined field and modeling study of groundwater flow in a tidal marsh
investigations, particularly in salt marsh ecology (Chapman,1938, 1940; Lugo and Snedaker, 1974), which includes manyinteresting and important issues such as salt marsh diebackand plant zonation (Mendelssohn et al., 1981; Dacey andHowes, 1984; Pennings and Callaway, 1992; Costa et al.,2003; Silvestri et al., 2005; Alber et al., 2008). As one of themost important salt marsh ecosystems, mangrove marshestypically occur along tidal estuaries and coastlines in trop-ical and subtropical regions (Chapman, 1977; Woodroffe etal., 1985; Kjerfve, 1990; Spalding et al., 1997). They areimportant for coastal ecology and play an important and ir-replaceable role in the maintenance of coastal biodiversity(Field et al., 1998; Bosire et al., 2008). However, mangroveforests are also one of the world’s most threatened tropicalecosystems with an obvious global degradation (Valiela etal., 2001; Liu and Diamond, 2005; Duke et al., 2007; Gilmanet al., 2008) due to increasing anthropogenic activities suchas global warming and sea level rising (Kjerfve, 1990; Dukeet al., 1998; Krauss et al., 2008).
Recently a series of discussions on the ecohydrologicalfeedback mechanisms (the linkages between the hydrolog-ical cycle, biogeochemical cycling and vegetation dynam-ics) or ecohydrological interactions were reported by manyresearchers in salt marshes (Ursino et al., 2004; Li et al.,2005; Marani et al., 2005, 2006; Wilson and Gardner, 2005;Gardner, 2009; Tossatto et al., 2009; Chui et al., 2011) andin riverine and island systems (Bauer et al., 2006; Bauer-Gottwein et al., 2008). In particular, Marani et al. (2006)linked the complex spatial patterns of vegetation to the rele-vant hydrological and ecological processes in oxygen-limitedtidal marsh ecosystems by a model of coupling hydroge-omorphic and ecological dynamics. They found that theecohydrological interactions contribute the patterns of veg-etation colonization and spatial zonation, which especiallyhighlighted the roles of hydraulic conductivity and evapo-transpiration in aerating the soils of tidal marshes. Ursino etal. (2004) and Marani et al. (2006) stated that the presenceof a zone of aerated soil beneath the marsh surface couldhave profound implications for marsh ecology. However,Gardner (2009) pointed out that it would be true only if thesubsurface air contains a permanent and significant concen-tration of oxygen for use in respiration and/or oxidation oforganic matter. Bauer et al. (2006) and Bauer-Gottwein etal. (2008) presented the quantifications and modeling of eco-hydrological feedback mechanisms (e.g. phytotoxicity, tran-spiration stream concentration factor) in semi-arid and aridregions (e.g. riverine and island systems). They concludedthat precipitation and evapotranspiration are important pro-cesses in such systems and contribute significantly to thewater balance and salt accumulation.
Freshwater is important for controlling the salinity and nu-trient transport in mangrove tidal marshes around the world.Kjerfve (1990) reported that the input of freshwater is ul-timately responsible for creation of the brackish to salinecoastal wetland environment where mangrove thrives. Nuttle
and Harvey (1995) reported the effects of the upward dis-charge of fresh groundwater on the water and solute move-ments within an intertidal wetland on Virginia’s Atlanticcoast. They found that groundwater-driven advection pre-vents infiltration of brackish water during tidal flooding andremoves solutes from the sediment of the wetland. Sel-vam (2003) examined the variations in the periodicity andquantity of freshwater flowing into mangrove wetlands in In-dia, and found that the reduction in freshwater flow wouldlead to reduction in the diversity of exclusive mangrove plantspecies. Montalto et al. (2006) presented the hydrologicalcharacteristics of the Piermont Marsh in the Hudson RiverEstuary, New York, USA. They concluded that the hydraulicproperties largely influence the ecological functions of marshand determine the groundwater discharge rate from the marshto the estuary. Schwendenmann et al. (2006) found that thesediment permeability and freshwater input had a strong ef-fect on the solute dynamics (e.g. salt content) in tidal creekand mangrove water and on the vertical distribution in thesediment in a mangrove in North Brazil (Furo do Meio,Para). Acting as a main carrier of salt and nutrients, ground-water flow plays a significant role in the mass fluxes acrossthe sediment-water interface and therefore affects the tidalmarsh ecological system (Hemond and Fifield, 1982; Howeset al., 1996; Gardner, 2005; Wilson and Gardner, 2006;Akamatsu et al., 2009).
In many tidal marsh systems in the world, high-permeability zones were found under the surface marsh mudand they usually consist of sands or sandy loam (e.g. Harveyet al., 1987; Hughes et al., 1998; Gardner and Porter, 2001;Xin et al., 2009). Gardner and Porter (2001) reported thatmarsh mud commonly overlies a sand layer in the southeast-ern United States. Schwendenmann et al. (2006) also foundthat the hydraulic conductivity of deeper fine sand strata ina mangrove in North Brazil was 7 to 18 times larger thanthat (<0.1 m day−1) of the upper mud layer. Gardner (2007)noted that the presence of the sand layer beneath marshmud is likely to increase seepage from marsh soils and en-hances lowering of the water table and thereby increases aer-ation throughout the marsh. This kind of high-permeabilityzones might also contribute to the creation of a preferentiallyaerated layer under the plant roots (Tossatto et al., 2009).
In Dongzhaigang National Nature Reserve, Hainan Island,China, most mangroves are distributed along the broad shal-low beach such as Sanjiang plain and the coastal area of Tashi(Fig. 1a); other mangrove forests are situated along rivers(e.g. Yanfeng River, Fig. 1b). However, bald beaches with-out any vegetation were found among mangrove marshes.In order to investigate the hydrogeological factors criticalto mangrove development, a mangrove transect and baldbeach transect were selected to conduct comparison study(Fig. 1b). The mangrove transect is located in the Changn-ingtou tidal marsh, and adjacent to the estuary of YanfengRiver. The bald beach transect is situated in a tidal beachwithout any vegetation and abuts the Shanweitou Village and
Hydrol. Earth Syst. Sci., 16, 741–759, 2012 www.hydrol-earth-syst-sci.net/16/741/2012/
Y. Q. Xia and H. L. Li: A combined field and modeling study of groundwater flow in a tidal marsh 743
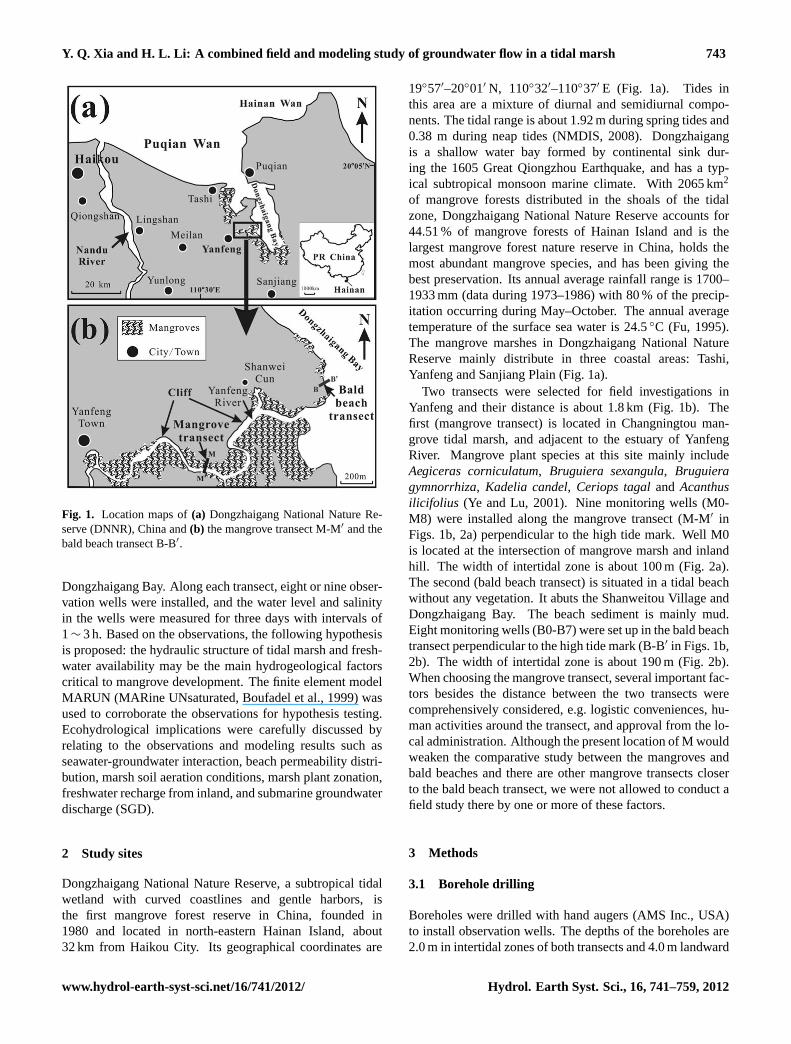
Fig. 1. Location maps of (a) Dongzhaigang National Nature Reserve (DNNR), China
and (b) the mangrove transect M-M′ and the bald beach transect B-B′.
Fig. 1. Location maps of(a) Dongzhaigang National Nature Re-serve (DNNR), China and(b) the mangrove transect M-M′ and thebald beach transect B-B′.
Dongzhaigang Bay. Along each transect, eight or nine obser-vation wells were installed, and the water level and salinityin the wells were measured for three days with intervals of1∼ 3 h. Based on the observations, the following hypothesisis proposed: the hydraulic structure of tidal marsh and fresh-water availability may be the main hydrogeological factorscritical to mangrove development. The finite element modelMARUN (MARine UNsaturated, Boufadel et al., 1999) wasused to corroborate the observations for hypothesis testing.Ecohydrological implications were carefully discussed byrelating to the observations and modeling results such asseawater-groundwater interaction, beach permeability distri-bution, marsh soil aeration conditions, marsh plant zonation,freshwater recharge from inland, and submarine groundwaterdischarge (SGD).
2 Study sites
Dongzhaigang National Nature Reserve, a subtropical tidalwetland with curved coastlines and gentle harbors, isthe first mangrove forest reserve in China, founded in1980 and located in north-eastern Hainan Island, about32 km from Haikou City. Its geographical coordinates are
19◦57′–20◦01′ N, 110◦32′–110◦37′ E (Fig. 1a). Tides inthis area are a mixture of diurnal and semidiurnal compo-nents. The tidal range is about 1.92 m during spring tides and0.38 m during neap tides (NMDIS, 2008). Dongzhaigangis a shallow water bay formed by continental sink dur-ing the 1605 Great Qiongzhou Earthquake, and has a typ-ical subtropical monsoon marine climate. With 2065 km2
of mangrove forests distributed in the shoals of the tidalzone, Dongzhaigang National Nature Reserve accounts for44.51 % of mangrove forests of Hainan Island and is thelargest mangrove forest nature reserve in China, holds themost abundant mangrove species, and has been giving thebest preservation. Its annual average rainfall range is 1700–1933 mm (data during 1973–1986) with 80 % of the precip-itation occurring during May–October. The annual averagetemperature of the surface sea water is 24.5◦C (Fu, 1995).The mangrove marshes in Dongzhaigang National NatureReserve mainly distribute in three coastal areas: Tashi,Yanfeng and Sanjiang Plain (Fig. 1a).
Two transects were selected for field investigations inYanfeng and their distance is about 1.8 km (Fig. 1b). Thefirst (mangrove transect) is located in Changningtou man-grove tidal marsh, and adjacent to the estuary of YanfengRiver. Mangrove plant species at this site mainly includeAegiceras corniculatum, Bruguiera sexangula, Bruguieragymnorrhiza, Kadelia candel, Ceriops tagaland Acanthusilicifolius (Ye and Lu, 2001). Nine monitoring wells (M0-M8) were installed along the mangrove transect (M-M′ inFigs. 1b, 2a) perpendicular to the high tide mark. Well M0is located at the intersection of mangrove marsh and inlandhill. The width of intertidal zone is about 100 m (Fig. 2a).The second (bald beach transect) is situated in a tidal beachwithout any vegetation. It abuts the Shanweitou Village andDongzhaigang Bay. The beach sediment is mainly mud.Eight monitoring wells (B0-B7) were set up in the bald beachtransect perpendicular to the high tide mark (B-B′ in Figs. 1b,2b). The width of intertidal zone is about 190 m (Fig. 2b).When choosing the mangrove transect, several important fac-tors besides the distance between the two transects werecomprehensively considered, e.g. logistic conveniences, hu-man activities around the transect, and approval from the lo-cal administration. Although the present location of M wouldweaken the comparative study between the mangroves andbald beaches and there are other mangrove transects closerto the bald beach transect, we were not allowed to conduct afield study there by one or more of these factors.
3 Methods
3.1 Borehole drilling
Boreholes were drilled with hand augers (AMS Inc., USA)to install observation wells. The depths of the boreholes are2.0 m in intertidal zones of both transects and 4.0 m landward
www.hydrol-earth-syst-sci.net/16/741/2012/ Hydrol. Earth Syst. Sci., 16, 741–759, 2012
744 Y. Q. Xia and H. L. Li: A combined field and modeling study of groundwater flow in a tidal marsh
Fig. 2. The cross-section of (a) the mangrove transect M-M' and (b) the bald beach
transect B-B'. The intertidal zone is located within 0 m≤x≤100 m for the mangrove
transect and 0 m≤x≤190 m for the bald beach transect, where x is the seaward distance
from the high tide mark. The detailed information about monitoring wells is presented
in Fig. 3 and Tables 1 and 2. The conceptual hydrological models of both transects are
also shown in this figure.
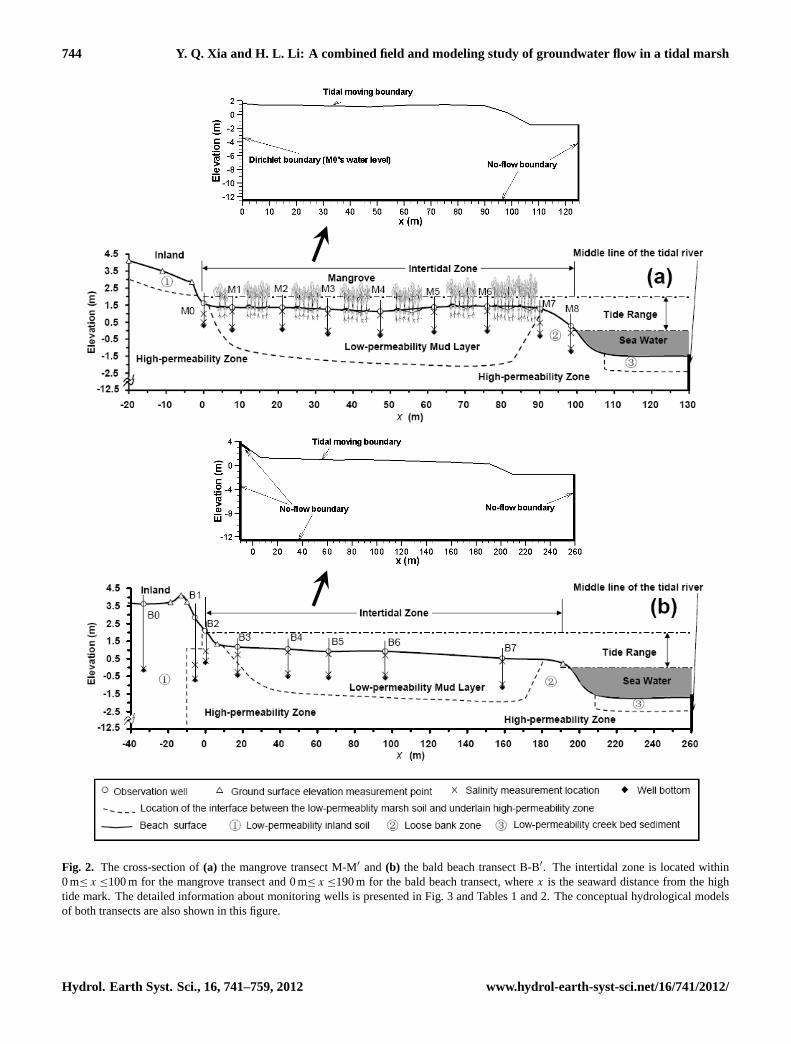
Fig. 2. The cross-section of(a) the mangrove transect M-M′ and (b) the bald beach transect B-B′. The intertidal zone is located within0 m≤ x ≤100 m for the mangrove transect and 0 m≤ x ≤190 m for the bald beach transect, wherex is the seaward distance from the hightide mark. The detailed information about monitoring wells is presented in Fig. 3 and Tables 1 and 2. The conceptual hydrological modelsof both transects are also shown in this figure.
Hydrol. Earth Syst. Sci., 16, 741–759, 2012 www.hydrol-earth-syst-sci.net/16/741/2012/
Y. Q. Xia and H. L. Li: A combined field and modeling study of groundwater flow in a tidal marsh 745
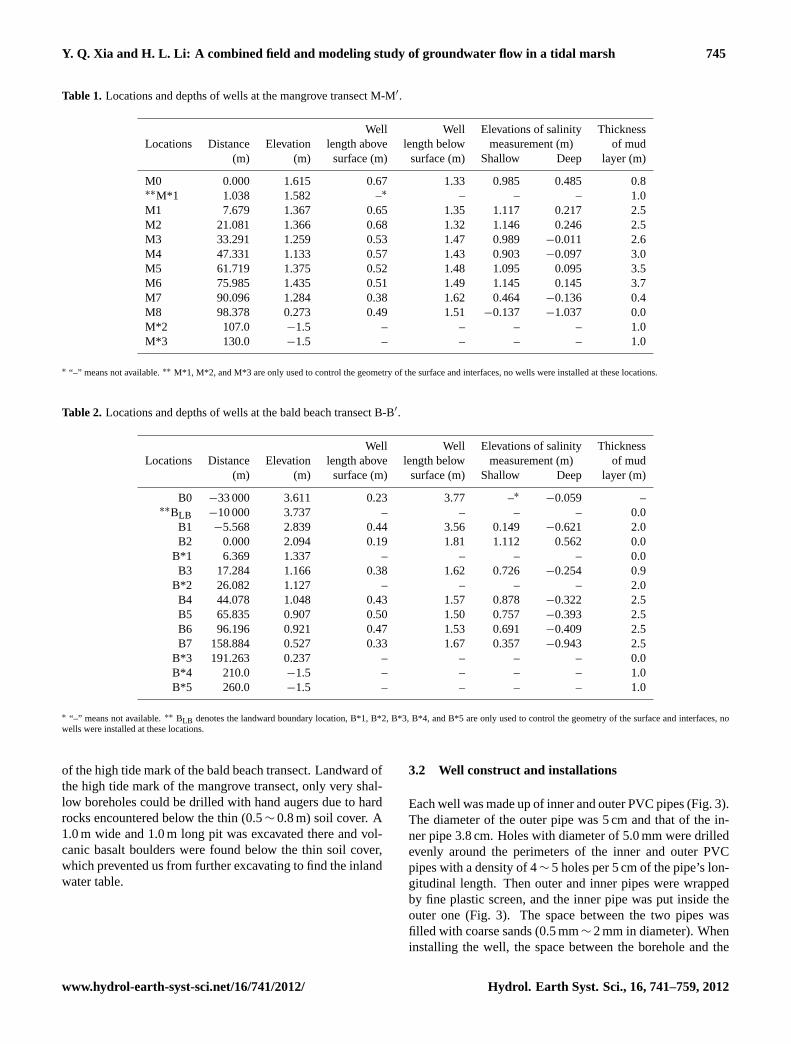
Table 1. Locations and depths of wells at the mangrove transect M-M′.
Well Well Elevations of salinity ThicknessLocations Distance Elevation length above length below measurement (m) of mud
(m) (m) surface (m) surface (m) Shallow Deep layer (m)
M0 0.000 1.615 0.67 1.33 0.985 0.485 0.8∗∗M*1 1.038 1.582 –∗ – – – 1.0M1 7.679 1.367 0.65 1.35 1.117 0.217 2.5M2 21.081 1.366 0.68 1.32 1.146 0.246 2.5M3 33.291 1.259 0.53 1.47 0.989 −0.011 2.6M4 47.331 1.133 0.57 1.43 0.903 −0.097 3.0M5 61.719 1.375 0.52 1.48 1.095 0.095 3.5M6 75.985 1.435 0.51 1.49 1.145 0.145 3.7M7 90.096 1.284 0.38 1.62 0.464 −0.136 0.4M8 98.378 0.273 0.49 1.51 −0.137 −1.037 0.0M*2 107.0 −1.5 – – – – 1.0M*3 130.0 −1.5 – – – – 1.0
∗ “–” means not available.∗∗ M*1, M*2, and M*3 are only used to control the geometry of the surface and interfaces, no wells were installed at these locations.
Table 2. Locations and depths of wells at the bald beach transect B-B′.
Well Well Elevations of salinity ThicknessLocations Distance Elevation length above length below measurement (m) of mud
(m) (m) surface (m) surface (m) Shallow Deep layer (m)
B0 −33 000 3.611 0.23 3.77 –∗−0.059 –
∗∗BLB −10 000 3.737 – – – – 0.0B1 −5.568 2.839 0.44 3.56 0.149 −0.621 2.0B2 0.000 2.094 0.19 1.81 1.112 0.562 0.0
B*1 6.369 1.337 – – – – 0.0B3 17.284 1.166 0.38 1.62 0.726 −0.254 0.9
B*2 26.082 1.127 – – – – 2.0B4 44.078 1.048 0.43 1.57 0.878 −0.322 2.5B5 65.835 0.907 0.50 1.50 0.757 −0.393 2.5B6 96.196 0.921 0.47 1.53 0.691 −0.409 2.5B7 158.884 0.527 0.33 1.67 0.357 −0.943 2.5
B*3 191.263 0.237 – – – – 0.0B*4 210.0 −1.5 – – – – 1.0B*5 260.0 −1.5 – – – – 1.0
∗ “–” means not available.∗∗ BLB denotes the landward boundary location, B*1, B*2, B*3, B*4, and B*5 are only used to control the geometry of the surface and interfaces, nowells were installed at these locations.
of the high tide mark of the bald beach transect. Landward ofthe high tide mark of the mangrove transect, only very shal-low boreholes could be drilled with hand augers due to hardrocks encountered below the thin (0.5∼ 0.8 m) soil cover. A1.0 m wide and 1.0 m long pit was excavated there and vol-canic basalt boulders were found below the thin soil cover,which prevented us from further excavating to find the inlandwater table.
3.2 Well construct and installations
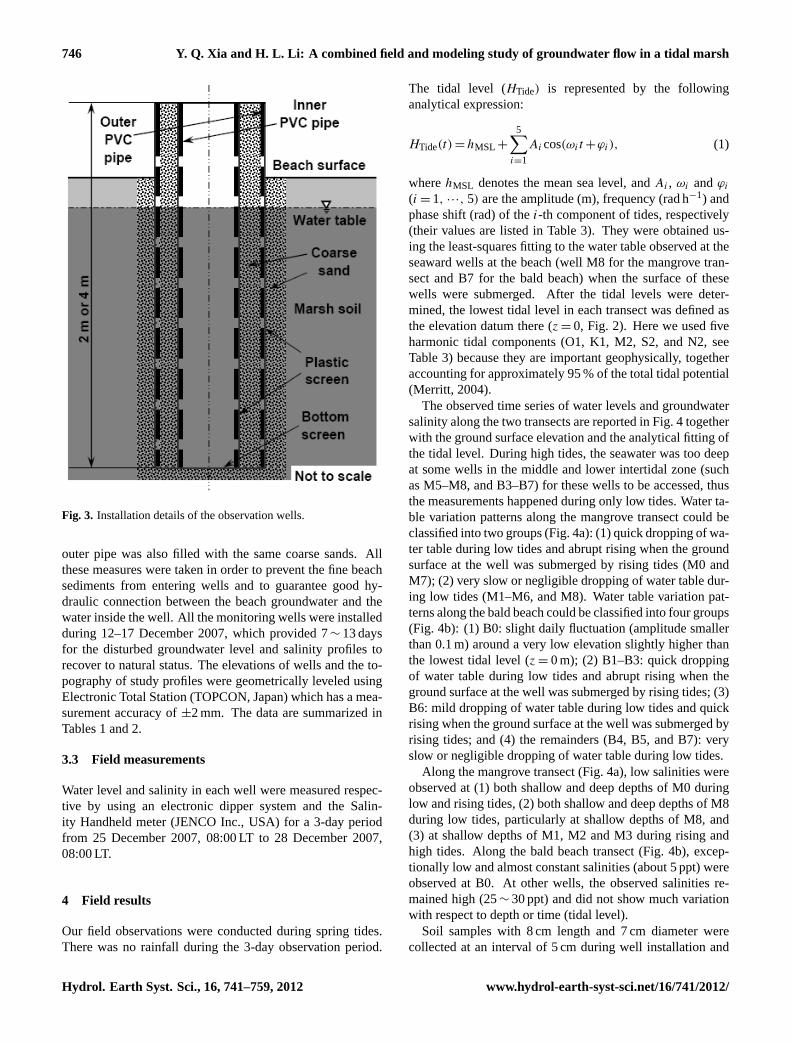
Each well was made up of inner and outer PVC pipes (Fig. 3).The diameter of the outer pipe was 5 cm and that of the in-ner pipe 3.8 cm. Holes with diameter of 5.0 mm were drilledevenly around the perimeters of the inner and outer PVCpipes with a density of 4∼ 5 holes per 5 cm of the pipe’s lon-gitudinal length. Then outer and inner pipes were wrappedby fine plastic screen, and the inner pipe was put inside theouter one (Fig. 3). The space between the two pipes wasfilled with coarse sands (0.5 mm∼ 2 mm in diameter). Wheninstalling the well, the space between the borehole and the
www.hydrol-earth-syst-sci.net/16/741/2012/ Hydrol. Earth Syst. Sci., 16, 741–759, 2012
746 Y. Q. Xia and H. L. Li: A combined field and modeling study of groundwater flow in a tidal marsh
Fig. 3. Installation details of the observation wells. Fig. 3. Installation details of the observation wells.
outer pipe was also filled with the same coarse sands. Allthese measures were taken in order to prevent the fine beachsediments from entering wells and to guarantee good hy-draulic connection between the beach groundwater and thewater inside the well. All the monitoring wells were installedduring 12–17 December 2007, which provided 7∼ 13 daysfor the disturbed groundwater level and salinity profiles torecover to natural status. The elevations of wells and the to-pography of study profiles were geometrically leveled usingElectronic Total Station (TOPCON, Japan) which has a mea-surement accuracy of±2 mm. The data are summarized inTables 1 and 2.
3.3 Field measurements
Water level and salinity in each well were measured respec-tive by using an electronic dipper system and the Salin-ity Handheld meter (JENCO Inc., USA) for a 3-day periodfrom 25 December 2007, 08:00 LT to 28 December 2007,08:00 LT.
4 Field results
Our field observations were conducted during spring tides.There was no rainfall during the 3-day observation period.
The tidal level (HTide) is represented by the followinganalytical expression:
HTide(t) = hMSL +
5∑i=1
Ai cos(ωi t +ϕi), (1)
wherehMSL denotes the mean sea level, andAi , ωi andϕi
(i = 1, ···, 5) are the amplitude (m), frequency (rad h−1) andphase shift (rad) of thei-th component of tides, respectively(their values are listed in Table 3). They were obtained us-ing the least-squares fitting to the water table observed at theseaward wells at the beach (well M8 for the mangrove tran-sect and B7 for the bald beach) when the surface of thesewells were submerged. After the tidal levels were deter-mined, the lowest tidal level in each transect was defined asthe elevation datum there (z = 0, Fig. 2). Here we used fiveharmonic tidal components (O1, K1, M2, S2, and N2, seeTable 3) because they are important geophysically, togetheraccounting for approximately 95 % of the total tidal potential(Merritt, 2004).
The observed time series of water levels and groundwatersalinity along the two transects are reported in Fig. 4 togetherwith the ground surface elevation and the analytical fitting ofthe tidal level. During high tides, the seawater was too deepat some wells in the middle and lower intertidal zone (suchas M5–M8, and B3–B7) for these wells to be accessed, thusthe measurements happened during only low tides. Water ta-ble variation patterns along the mangrove transect could beclassified into two groups (Fig. 4a): (1) quick dropping of wa-ter table during low tides and abrupt rising when the groundsurface at the well was submerged by rising tides (M0 andM7); (2) very slow or negligible dropping of water table dur-ing low tides (M1–M6, and M8). Water table variation pat-terns along the bald beach could be classified into four groups(Fig. 4b): (1) B0: slight daily fluctuation (amplitude smallerthan 0.1 m) around a very low elevation slightly higher thanthe lowest tidal level (z = 0 m); (2) B1–B3: quick droppingof water table during low tides and abrupt rising when theground surface at the well was submerged by rising tides; (3)B6: mild dropping of water table during low tides and quickrising when the ground surface at the well was submerged byrising tides; and (4) the remainders (B4, B5, and B7): veryslow or negligible dropping of water table during low tides.
Along the mangrove transect (Fig. 4a), low salinities wereobserved at (1) both shallow and deep depths of M0 duringlow and rising tides, (2) both shallow and deep depths of M8during low tides, particularly at shallow depths of M8, and(3) at shallow depths of M1, M2 and M3 during rising andhigh tides. Along the bald beach transect (Fig. 4b), excep-tionally low and almost constant salinities (about 5 ppt) wereobserved at B0. At other wells, the observed salinities re-mained high (25∼ 30 ppt) and did not show much variationwith respect to depth or time (tidal level).
Soil samples with 8 cm length and 7 cm diameter werecollected at an interval of 5 cm during well installation and
Hydrol. Earth Syst. Sci., 16, 741–759, 2012 www.hydrol-earth-syst-sci.net/16/741/2012/
Y. Q. Xia and H. L. Li: A combined field and modeling study of groundwater flow in a tidal marsh 747
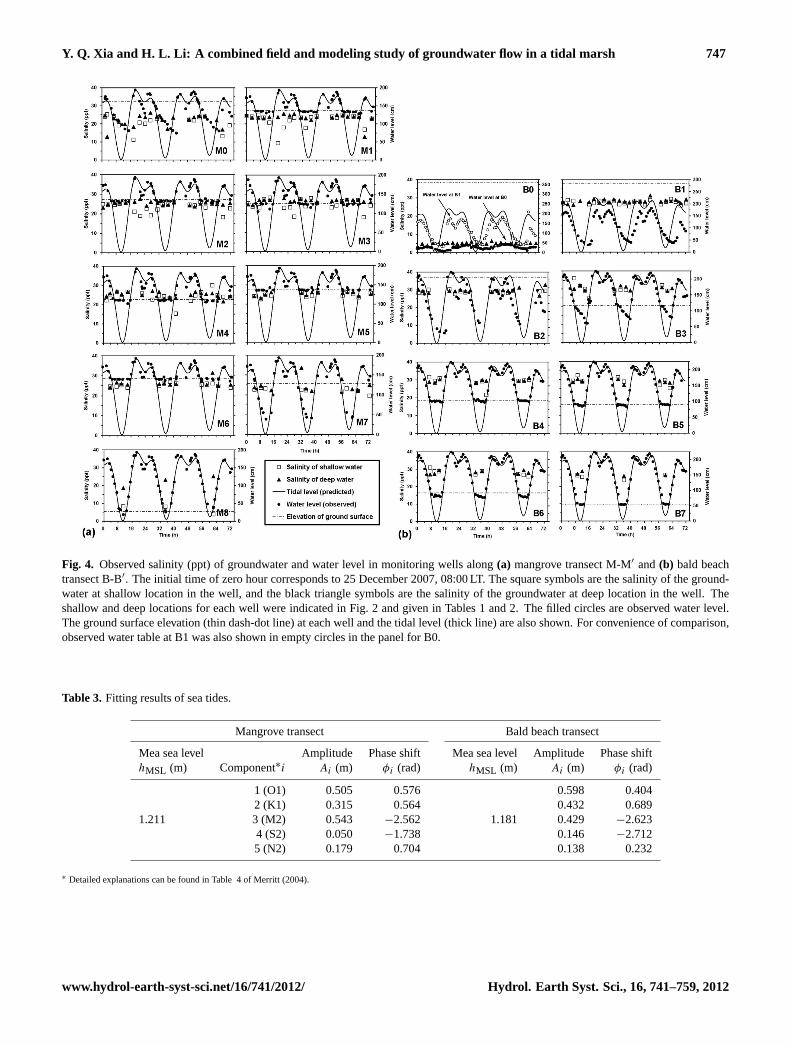
Fig. 4. Observed salinity (ppt) of groundwater and water level in monitoring wells
along (a) mangrove transect M-M' and (b) bald beach transect B-B'. The initial time
of zero hour corresponds to December 25th 2007 8:00 AM. The square symbols are
the salinity of the groundwater at shallow location in the well, and the black triangle
symbols are the salinity of the groundwater at deep location in the well. The shallow
and deep locations for each well were indicated in Fig. 2 and given in Tables 1 and 2.
Fig. 4. Observed salinity (ppt) of groundwater and water level in monitoring wells along(a) mangrove transect M-M′ and(b) bald beachtransect B-B′. The initial time of zero hour corresponds to 25 December 2007, 08:00 LT. The square symbols are the salinity of the ground-water at shallow location in the well, and the black triangle symbols are the salinity of the groundwater at deep location in the well. Theshallow and deep locations for each well were indicated in Fig. 2 and given in Tables 1 and 2. The filled circles are observed water level.The ground surface elevation (thin dash-dot line) at each well and the tidal level (thick line) are also shown. For convenience of comparison,observed water table at B1 was also shown in empty circles in the panel for B0.
Table 3. Fitting results of sea tides.
Mangrove transect Bald beach transect
Mea sea level Amplitude Phase shift Mea sea level Amplitude Phase shifthMSL (m) Component∗i Ai (m) φi (rad) hMSL (m) Ai (m) φi (rad)
1 (O1) 0.505 0.576 0.598 0.4042 (K1) 0.315 0.564 0.432 0.689
1.211 3 (M2) 0.543 −2.562 1.181 0.429 −2.6234 (S2) 0.050 −1.738 0.146 −2.7125 (N2) 0.179 0.704 0.138 0.232
∗ Detailed explanations can be found in Table 4 of Merritt (2004).
www.hydrol-earth-syst-sci.net/16/741/2012/ Hydrol. Earth Syst. Sci., 16, 741–759, 2012
748 Y. Q. Xia and H. L. Li: A combined field and modeling study of groundwater flow in a tidal marsh
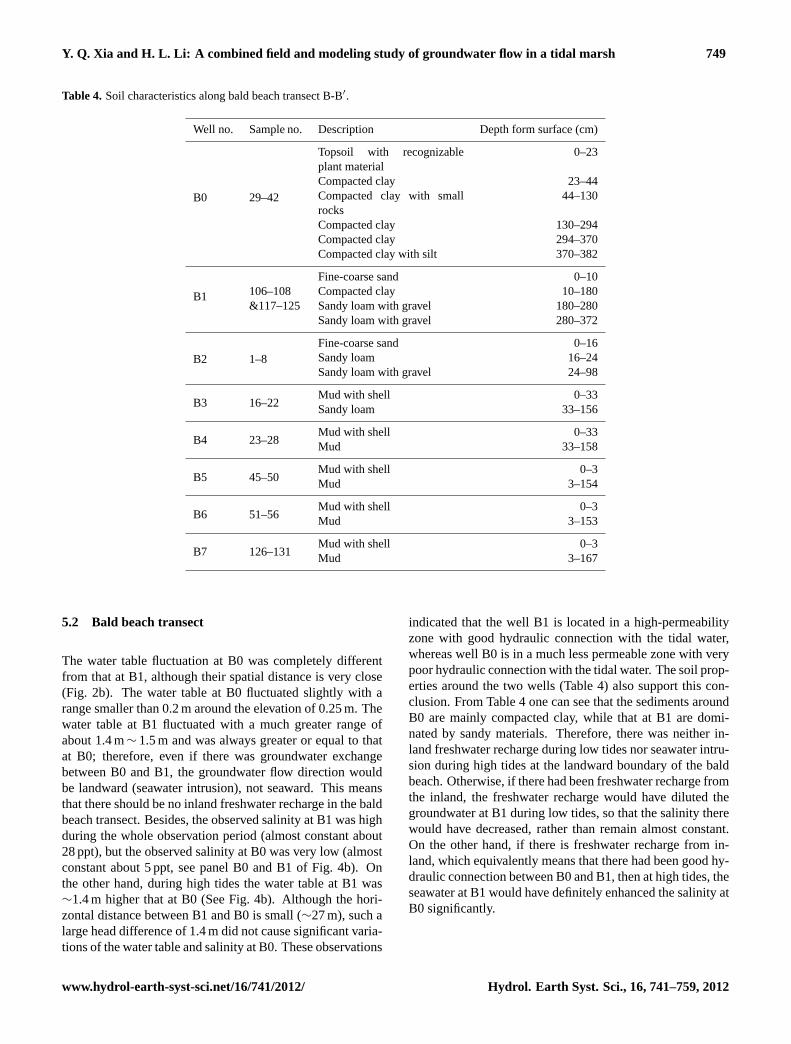
numbered sequentially. Table 4 summarizes the character-istics of soil samples collected from the bald beach transect.The sediments around B0 and the upper part of B1 are mainlycompacted clay. Sediments at B2–B3 and the lower part ofB1 are dominated by sandy loam with gravel. Mud sedi-ments are extensively distributed on tidal platform (B4–B7).The sediments around M0 are dominated by sandy loam withgravel. The sediments in the intertidal zone of the mangrovetransect (M1–M8) are almost uniform (mainly mud). Thesoil properties along the mangrove transect is much simplerthan those along the bald beach transect and therefore are nottabulated.
5 Data analysis
5.1 Mangrove transect
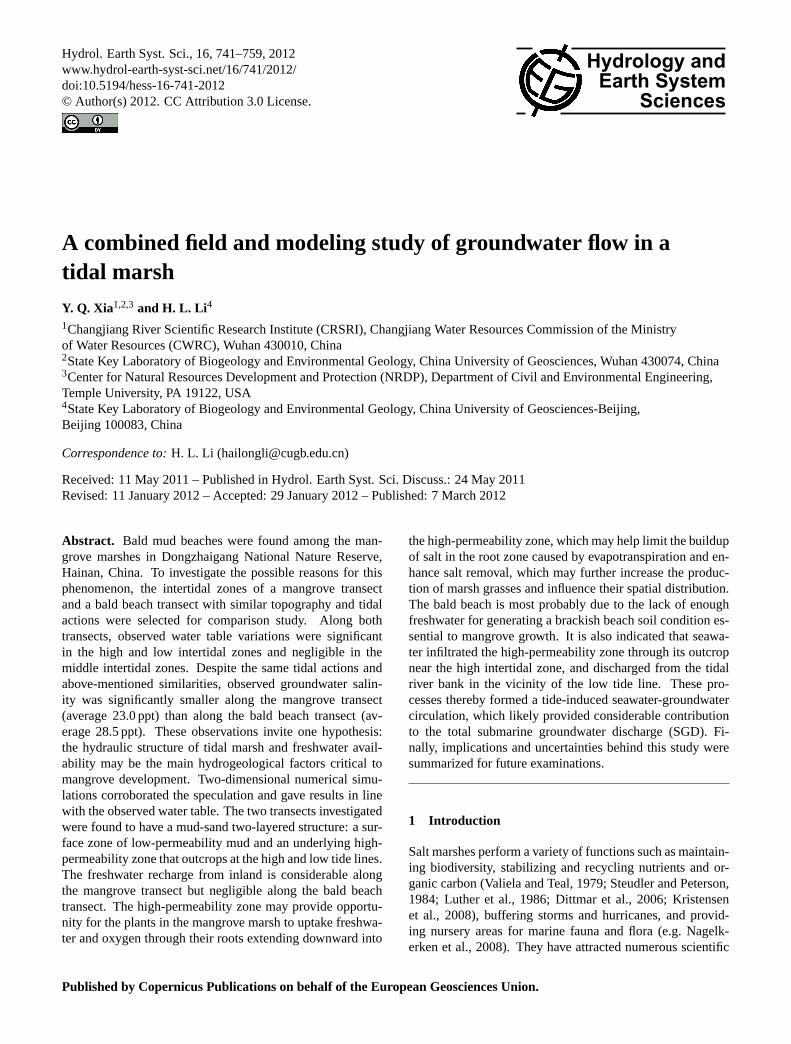
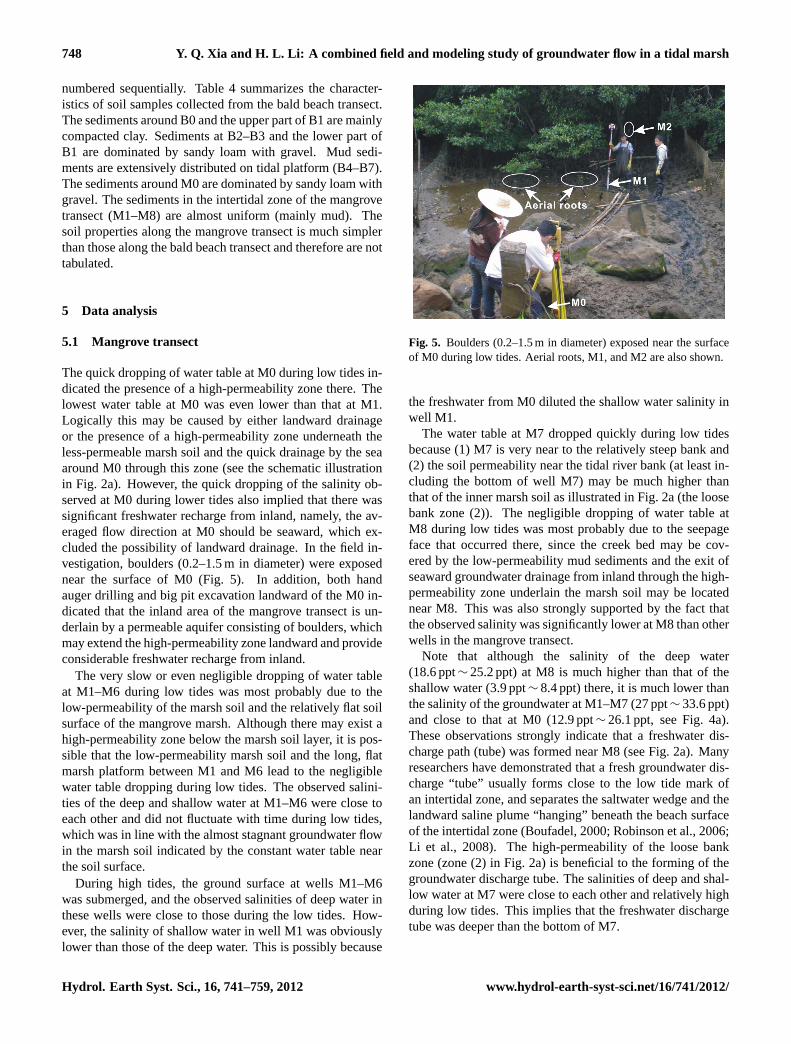
The quick dropping of water table at M0 during low tides in-dicated the presence of a high-permeability zone there. Thelowest water table at M0 was even lower than that at M1.Logically this may be caused by either landward drainageor the presence of a high-permeability zone underneath theless-permeable marsh soil and the quick drainage by the seaaround M0 through this zone (see the schematic illustrationin Fig. 2a). However, the quick dropping of the salinity ob-served at M0 during lower tides also implied that there wassignificant freshwater recharge from inland, namely, the av-eraged flow direction at M0 should be seaward, which ex-cluded the possibility of landward drainage. In the field in-vestigation, boulders (0.2–1.5 m in diameter) were exposednear the surface of M0 (Fig. 5). In addition, both handauger drilling and big pit excavation landward of the M0 in-dicated that the inland area of the mangrove transect is un-derlain by a permeable aquifer consisting of boulders, whichmay extend the high-permeability zone landward and provideconsiderable freshwater recharge from inland.
The very slow or even negligible dropping of water tableat M1–M6 during low tides was most probably due to thelow-permeability of the marsh soil and the relatively flat soilsurface of the mangrove marsh. Although there may exist ahigh-permeability zone below the marsh soil layer, it is pos-sible that the low-permeability marsh soil and the long, flatmarsh platform between M1 and M6 lead to the negligiblewater table dropping during low tides. The observed salini-ties of the deep and shallow water at M1–M6 were close toeach other and did not fluctuate with time during low tides,which was in line with the almost stagnant groundwater flowin the marsh soil indicated by the constant water table nearthe soil surface.
During high tides, the ground surface at wells M1–M6was submerged, and the observed salinities of deep water inthese wells were close to those during the low tides. How-ever, the salinity of shallow water in well M1 was obviouslylower than those of the deep water. This is possibly because
Fig. 5. Boulders (0.2-1.5 m in diameter) exposed near the surface of M0 during low
tides. Aerial roots, M1, and M2 are also shown.
Fig. 5. Boulders (0.2–1.5 m in diameter) exposed near the surfaceof M0 during low tides. Aerial roots, M1, and M2 are also shown.
the freshwater from M0 diluted the shallow water salinity inwell M1.
The water table at M7 dropped quickly during low tidesbecause (1) M7 is very near to the relatively steep bank and(2) the soil permeability near the tidal river bank (at least in-cluding the bottom of well M7) may be much higher thanthat of the inner marsh soil as illustrated in Fig. 2a (the loosebank zone (2)). The negligible dropping of water table atM8 during low tides was most probably due to the seepageface that occurred there, since the creek bed may be cov-ered by the low-permeability mud sediments and the exit ofseaward groundwater drainage from inland through the high-permeability zone underlain the marsh soil may be locatednear M8. This was also strongly supported by the fact thatthe observed salinity was significantly lower at M8 than otherwells in the mangrove transect.
Note that although the salinity of the deep water(18.6 ppt∼ 25.2 ppt) at M8 is much higher than that of theshallow water (3.9 ppt∼ 8.4 ppt) there, it is much lower thanthe salinity of the groundwater at M1–M7 (27 ppt∼ 33.6 ppt)and close to that at M0 (12.9 ppt∼ 26.1 ppt, see Fig. 4a).These observations strongly indicate that a freshwater dis-charge path (tube) was formed near M8 (see Fig. 2a). Manyresearchers have demonstrated that a fresh groundwater dis-charge “tube” usually forms close to the low tide mark ofan intertidal zone, and separates the saltwater wedge and thelandward saline plume “hanging” beneath the beach surfaceof the intertidal zone (Boufadel, 2000; Robinson et al., 2006;Li et al., 2008). The high-permeability of the loose bankzone (zone (2) in Fig. 2a) is beneficial to the forming of thegroundwater discharge tube. The salinities of deep and shal-low water at M7 were close to each other and relatively highduring low tides. This implies that the freshwater dischargetube was deeper than the bottom of M7.
Hydrol. Earth Syst. Sci., 16, 741–759, 2012 www.hydrol-earth-syst-sci.net/16/741/2012/
Y. Q. Xia and H. L. Li: A combined field and modeling study of groundwater flow in a tidal marsh 749
Table 4. Soil characteristics along bald beach transect B-B′.
Well no. Sample no. Description Depth form surface (cm)
B0 29–42
Topsoil with recognizableplant material
0–23
Compacted clay 23–44Compacted clay with smallrocks
44–130
Compacted clay 130–294Compacted clay 294–370Compacted clay with silt 370–382
Fine-coarse sand 0–10
B1 106–108 Compacted clay 10–180&117–125 Sandy loam with gravel 180–280
Sandy loam with gravel 280–372
B2 1–8Fine-coarse sand 0–16Sandy loam 16–24Sandy loam with gravel 24–98
B3 16–22Mud with shell 0–33Sandy loam 33–156
B4 23–28Mud with shell 0–33Mud 33–158
B5 45–50Mud with shell 0–3Mud 3–154
B6 51–56Mud with shell 0–3Mud 3–153
B7 126–131Mud with shell 0–3Mud 3–167
5.2 Bald beach transect
The water table fluctuation at B0 was completely differentfrom that at B1, although their spatial distance is very close(Fig. 2b). The water table at B0 fluctuated slightly with arange smaller than 0.2 m around the elevation of 0.25 m. Thewater table at B1 fluctuated with a much greater range ofabout 1.4 m∼ 1.5 m and was always greater or equal to thatat B0; therefore, even if there was groundwater exchangebetween B0 and B1, the groundwater flow direction wouldbe landward (seawater intrusion), not seaward. This meansthat there should be no inland freshwater recharge in the baldbeach transect. Besides, the observed salinity at B1 was highduring the whole observation period (almost constant about28 ppt), but the observed salinity at B0 was very low (almostconstant about 5 ppt, see panel B0 and B1 of Fig. 4b). Onthe other hand, during high tides the water table at B1 was∼1.4 m higher that at B0 (See Fig. 4b). Although the hori-zontal distance between B1 and B0 is small (∼27 m), such alarge head difference of 1.4 m did not cause significant varia-tions of the water table and salinity at B0. These observations
indicated that the well B1 is located in a high-permeabilityzone with good hydraulic connection with the tidal water,whereas well B0 is in a much less permeable zone with verypoor hydraulic connection with the tidal water. The soil prop-erties around the two wells (Table 4) also support this con-clusion. From Table 4 one can see that the sediments aroundB0 are mainly compacted clay, while that at B1 are domi-nated by sandy materials. Therefore, there was neither in-land freshwater recharge during low tides nor seawater intru-sion during high tides at the landward boundary of the baldbeach. Otherwise, if there had been freshwater recharge fromthe inland, the freshwater recharge would have diluted thegroundwater at B1 during low tides, so that the salinity therewould have decreased, rather than remain almost constant.On the other hand, if there is freshwater recharge from in-land, which equivalently means that there had been good hy-draulic connection between B0 and B1, then at high tides, theseawater at B1 would have definitely enhanced the salinity atB0 significantly.
www.hydrol-earth-syst-sci.net/16/741/2012/ Hydrol. Earth Syst. Sci., 16, 741–759, 2012
750 Y. Q. Xia and H. L. Li: A combined field and modeling study of groundwater flow in a tidal marsh
In short, the landward side of the bald beach transect canbe simplified into a no-flow boundary because this can quan-titatively describe the observed significant tidal water tablevariations and high salinity data at B1, and also qualitativelyexplain the observed very low and almost constant water ta-ble and low salinity at B0. The anomaly that the observedwater table elevation at B0 was much lower than the meansea level (1.181 m) is probably due to unknown pumping ofgroundwater in inland area near the bald beach transect.
The observed water tables at wells B1–B3 dropped veryquickly during falling tides and rose abruptly when theground surface at the well was submerged by rising tides.The lowest water tables at B1–B3 were even much lower thanthat at B4, where the water table stayed near the ground sur-face during low tides. Due to the very poor hydraulic con-nection between B0 and B1, the only reasonable explana-tion for the quick dropping of water table at B1–B3 duringlow tides could be the presence of a high-permeability zonewith a good hydraulic connection with the tidal creek belowthe mud sediment of the bald beach, a scenario similar tothe mangrove transect (see Fig. 2a and b). The groundwa-ter near B1–B3 drained quickly seaward through this high-permeability zone since the high-permeability zone outcropsin the higher intertidal zone including B1–B3. This is rea-sonable considering that the higher intertidal zone has muchless tidal submersion periods than the middle or lower in-tertidal zone, causing much less silt and mud deposition thehigher intertidal zone. Note that the water table at B1 wasmuch lower than the tidal level during high tides, indicatinga low-permeability zone covering the top part of B1. Thiswas supported by the soil properties of sediments around B1(Table 4).
The very slow or even negligible dropping of water tableat B4 and B5 during low tides was most probably due to thelow-permeability of the mud sediments and the relatively flatbeach surface of the bald beach (see Fig. 2b). Although theremay exist a high-permeability zone below the mud layer, itis possible that the low-permeability mud and the long, flatplatform near B4 and B5 lead to the negligible water tabledropping during low tides. The salinities at B4 and B5 wereessentially constant; namely, they changed neither with timenor with depth. The water table in B6 dropped considerablylower than beach surface during low tides and rose abruptlywhen the beach surface was submerged by rising tide. Thiswas most probably due to the increase of the beach slopeseaward of B6 (Fig. 2b). At B7, the water table remained ashigh as the ground surface during low tides. Note that thesurface elevation of B7 is close to that of M8. Therefore, asimilar reason might lead to this negligible water table drop-ping: namely, seepage face might occur there due to seawardgroundwater drainage of the seawater entering the outcropof the high-permeability zone near B1, B2, and B3, and theloose bank zone similar to the mangrove transect (zone (2)in Fig. 2). During low tides, the salinities of both the deepand shallow locations at B7 remained high (about 26.5 ppt)
and there was essentially no variation with depth. This wasin great contrast with the large salinity difference betweenthe shallow and deep locations at M8 and once again indi-cated that there was no inland freshwater recharge along thebald beach transect (otherwise, a freshwater discharge pathnear under the low tide line might dilute the salinity of shal-low groundwater at B7 and resulted in large salinity differ-ence between shallow and deep waters at B7, which is notthe case).
6 Numerical verification
In the Introduction, we stated the following hypothesis basedon the field investigations and observed water table and salin-ity data: the two-layered hydraulic structure of tidal marshand inland freshwater recharge may be the main hydrogeo-logical factors critical to mangrove development. Both themangrove and bald beach transects have a similar macro-scopical structure of two zones: a surface zone of low-permeability mud and an underlying high-permeability zonethat outcrops at the high and low tide lines. The fresh wa-ter recharge from inland is considerable along the mangrovetransect but negligible along the bald beach transect. In or-der to verify the hypothesis, two-dimensional numerical sim-ulations were conducted to simulate flow patterns and waterbalances that are consistent with the observed water tablesalong both transects. The salinity along the bald beach tran-sect is assumed to be constant due to the small variation ofthe observed salinities in wells along that transect (Figs. 4band 6), so the density effect and solute transport were notconsidered in the model. Considering the relatively signifi-cant salinity variations along the mangrove transect, great ef-forts were made to simulate the observed salinity variationsusing a two-dimensional cross-section numerical model, butthe match between simulation results and the salinity mea-surements was poor. This was most probably due to the sig-nificant density-dependent three-dimensional flow near andwithin the observation wells, i.e. well effects on the ground-water flow. In order to quantify the well effects, a very finethree-dimensional mesh near each well would be necessary.However, such a great numerical effort is beyond the scope ofthis paper. Owing to this, here we only report the numericalsimulation results that neglected the density effects related tosolute transport.
Numerical simulations were conducted using the MARUNmodel (Boufadel et al., 1999), which can simulate solutetransport in variably-saturated porous media, taking into ac-count the effects of salt concentration on water density andwater viscosity (Boufadel et al., 1999; Boufadel, 2000). TheMARUN code has been verified and validated extensively(Li et al., 2008; Li and Boufadel, 2010; Xia et al., 2010;Boufadel et al., 2011).
Hydrol. Earth Syst. Sci., 16, 741–759, 2012 www.hydrol-earth-syst-sci.net/16/741/2012/
Y. Q. Xia and H. L. Li: A combined field and modeling study of groundwater flow in a tidal marsh 751
Fig. 6. Observed salinity (ppt) of groundwater over the 3-day observation period in
wells along the (a) mangrove and (b) bald beach transects. The intertidal zone is
located within 0 m≤x≤100 m for the mangrove transect and 0 m≤x≤190 m for the bald
beach transect, where x is the seaward distance from the high tide mark. Note that
most of the observations were made during low tide.
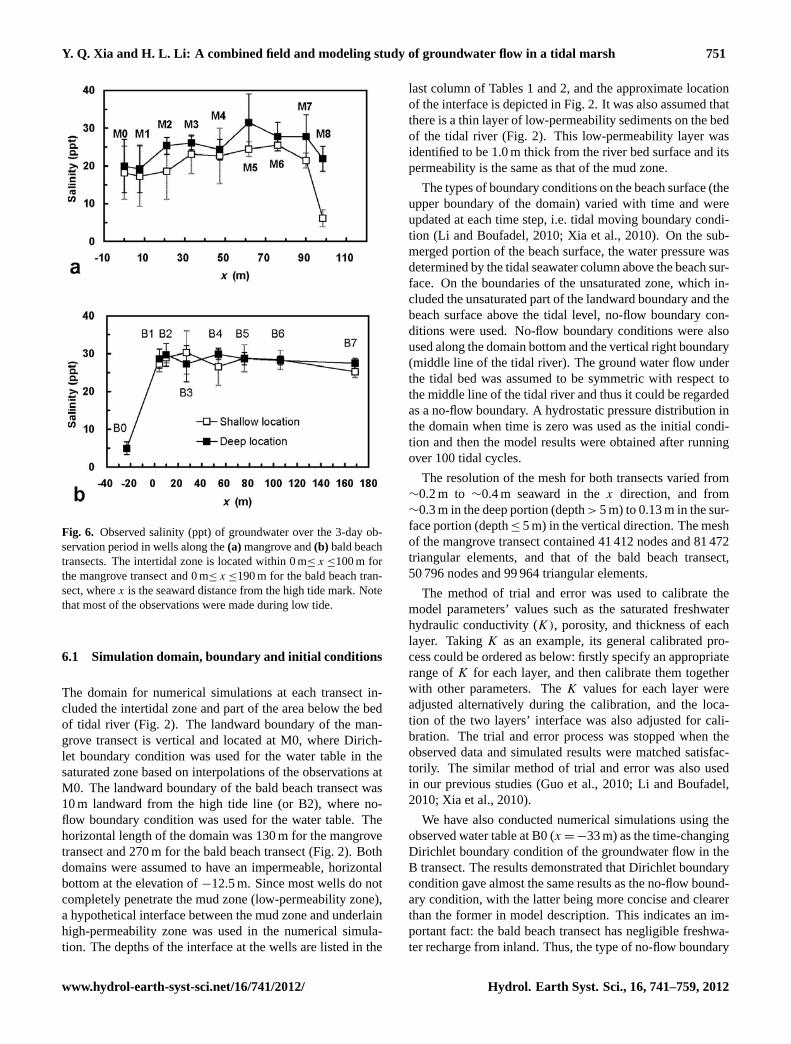
Fig. 6. Observed salinity (ppt) of groundwater over the 3-day ob-servation period in wells along the(a) mangrove and(b) bald beachtransects. The intertidal zone is located within 0 m≤ x ≤100 m forthe mangrove transect and 0 m≤ x ≤190 m for the bald beach tran-sect, wherex is the seaward distance from the high tide mark. Notethat most of the observations were made during low tide.
6.1 Simulation domain, boundary and initial conditions
The domain for numerical simulations at each transect in-cluded the intertidal zone and part of the area below the bedof tidal river (Fig. 2). The landward boundary of the man-grove transect is vertical and located at M0, where Dirich-let boundary condition was used for the water table in thesaturated zone based on interpolations of the observations atM0. The landward boundary of the bald beach transect was10 m landward from the high tide line (or B2), where no-flow boundary condition was used for the water table. Thehorizontal length of the domain was 130 m for the mangrovetransect and 270 m for the bald beach transect (Fig. 2). Bothdomains were assumed to have an impermeable, horizontalbottom at the elevation of−12.5 m. Since most wells do notcompletely penetrate the mud zone (low-permeability zone),a hypothetical interface between the mud zone and underlainhigh-permeability zone was used in the numerical simula-tion. The depths of the interface at the wells are listed in the
last column of Tables 1 and 2, and the approximate locationof the interface is depicted in Fig. 2. It was also assumed thatthere is a thin layer of low-permeability sediments on the bedof the tidal river (Fig. 2). This low-permeability layer wasidentified to be 1.0 m thick from the river bed surface and itspermeability is the same as that of the mud zone.
The types of boundary conditions on the beach surface (theupper boundary of the domain) varied with time and wereupdated at each time step, i.e. tidal moving boundary condi-tion (Li and Boufadel, 2010; Xia et al., 2010). On the sub-merged portion of the beach surface, the water pressure wasdetermined by the tidal seawater column above the beach sur-face. On the boundaries of the unsaturated zone, which in-cluded the unsaturated part of the landward boundary and thebeach surface above the tidal level, no-flow boundary con-ditions were used. No-flow boundary conditions were alsoused along the domain bottom and the vertical right boundary(middle line of the tidal river). The ground water flow underthe tidal bed was assumed to be symmetric with respect tothe middle line of the tidal river and thus it could be regardedas a no-flow boundary. A hydrostatic pressure distribution inthe domain when time is zero was used as the initial condi-tion and then the model results were obtained after runningover 100 tidal cycles.
The resolution of the mesh for both transects varied from∼0.2 m to ∼0.4 m seaward in thex direction, and from∼0.3 m in the deep portion (depth> 5 m) to 0.13 m in the sur-face portion (depth≤ 5 m) in the vertical direction. The meshof the mangrove transect contained 41 412 nodes and 81 472triangular elements, and that of the bald beach transect,50 796 nodes and 99 964 triangular elements.
The method of trial and error was used to calibrate themodel parameters’ values such as the saturated freshwaterhydraulic conductivity (K), porosity, and thickness of eachlayer. TakingK as an example, its general calibrated pro-cess could be ordered as below: firstly specify an appropriaterange ofK for each layer, and then calibrate them togetherwith other parameters. TheK values for each layer wereadjusted alternatively during the calibration, and the loca-tion of the two layers’ interface was also adjusted for cali-bration. The trial and error process was stopped when theobserved data and simulated results were matched satisfac-torily. The similar method of trial and error was also usedin our previous studies (Guo et al., 2010; Li and Boufadel,2010; Xia et al., 2010).
We have also conducted numerical simulations using theobserved water table at B0 (x = −33 m) as the time-changingDirichlet boundary condition of the groundwater flow in theB transect. The results demonstrated that Dirichlet boundarycondition gave almost the same results as the no-flow bound-ary condition, with the latter being more concise and clearerthan the former in model description. This indicates an im-portant fact: the bald beach transect has negligible freshwa-ter recharge from inland. Thus, the type of no-flow boundary
www.hydrol-earth-syst-sci.net/16/741/2012/ Hydrol. Earth Syst. Sci., 16, 741–759, 2012
752 Y. Q. Xia and H. L. Li: A combined field and modeling study of groundwater flow in a tidal marsh
Fig. 7. Simulated (red line) and observed (circles) water levels at wells along the (a)
mangrove and (b) bald beach transects. The ground surface elevation (dash dot line) at
each well and the tidal level (blue line) are also shown.
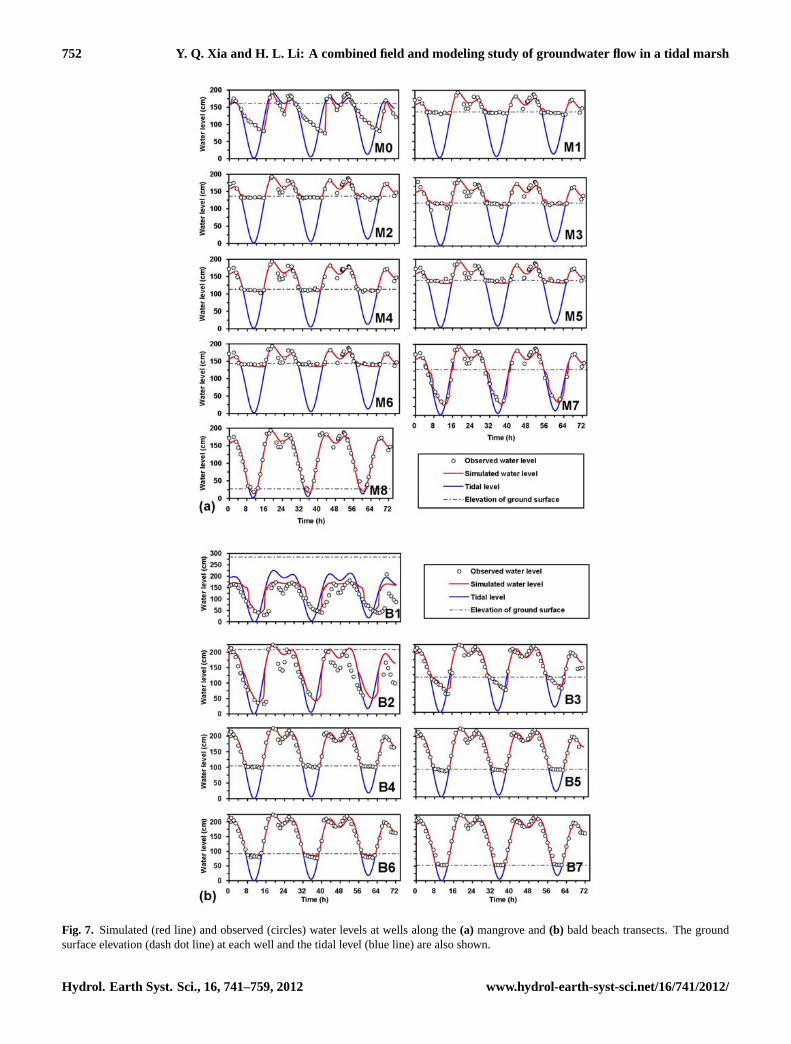
Fig. 7. Simulated (red line) and observed (circles) water levels at wells along the(a) mangrove and(b) bald beach transects. The groundsurface elevation (dash dot line) at each well and the tidal level (blue line) are also shown.
Hydrol. Earth Syst. Sci., 16, 741–759, 2012 www.hydrol-earth-syst-sci.net/16/741/2012/
Y. Q. Xia and H. L. Li: A combined field and modeling study of groundwater flow in a tidal marsh 753
Fig. 8. Average Darcy velocity (banded colorful contours) in the mangrove transect
calculated over the observation period of 3 days. Vectors with uniform length were
used to indicate the velocity direction only.
M0 M1 M2 M3 M4
M5 M6 M7
M8
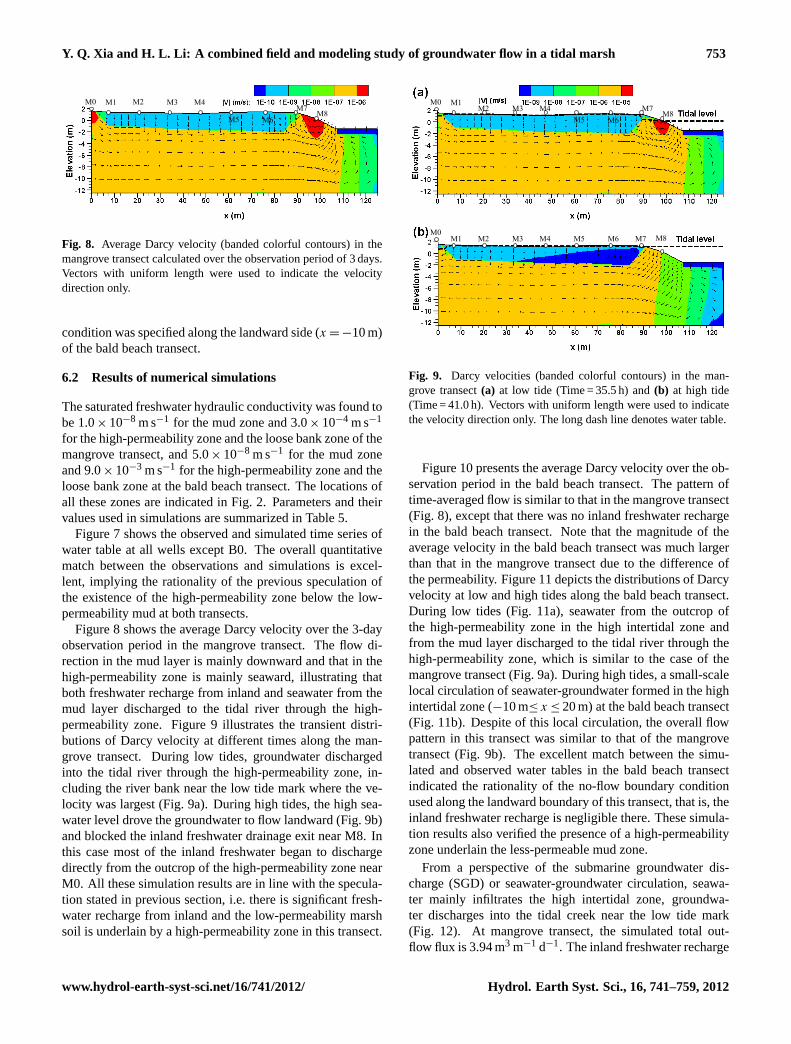
Fig. 8. Average Darcy velocity (banded colorful contours) in themangrove transect calculated over the observation period of 3 days.Vectors with uniform length were used to indicate the velocitydirection only.
condition was specified along the landward side (x = −10 m)of the bald beach transect.
6.2 Results of numerical simulations
The saturated freshwater hydraulic conductivity was found tobe 1.0× 10⁻⁸ m s−1 for the mud zone and 3.0× 10⁻⁴ m s−1
for the high-permeability zone and the loose bank zone of themangrove transect, and 5.0× 10⁻⁸ m s−1 for the mud zoneand 9.0× 10⁻³ m s−1 for the high-permeability zone and theloose bank zone at the bald beach transect. The locations ofall these zones are indicated in Fig. 2. Parameters and theirvalues used in simulations are summarized in Table 5.
Figure 7 shows the observed and simulated time series ofwater table at all wells except B0. The overall quantitativematch between the observations and simulations is excel-lent, implying the rationality of the previous speculation ofthe existence of the high-permeability zone below the low-permeability mud at both transects.
Figure 8 shows the average Darcy velocity over the 3-dayobservation period in the mangrove transect. The flow di-rection in the mud layer is mainly downward and that in thehigh-permeability zone is mainly seaward, illustrating thatboth freshwater recharge from inland and seawater from themud layer discharged to the tidal river through the high-permeability zone. Figure 9 illustrates the transient distri-butions of Darcy velocity at different times along the man-grove transect. During low tides, groundwater dischargedinto the tidal river through the high-permeability zone, in-cluding the river bank near the low tide mark where the ve-locity was largest (Fig. 9a). During high tides, the high sea-water level drove the groundwater to flow landward (Fig. 9b)and blocked the inland freshwater drainage exit near M8. Inthis case most of the inland freshwater began to dischargedirectly from the outcrop of the high-permeability zone nearM0. All these simulation results are in line with the specula-tion stated in previous section, i.e. there is significant fresh-water recharge from inland and the low-permeability marshsoil is underlain by a high-permeability zone in this transect.
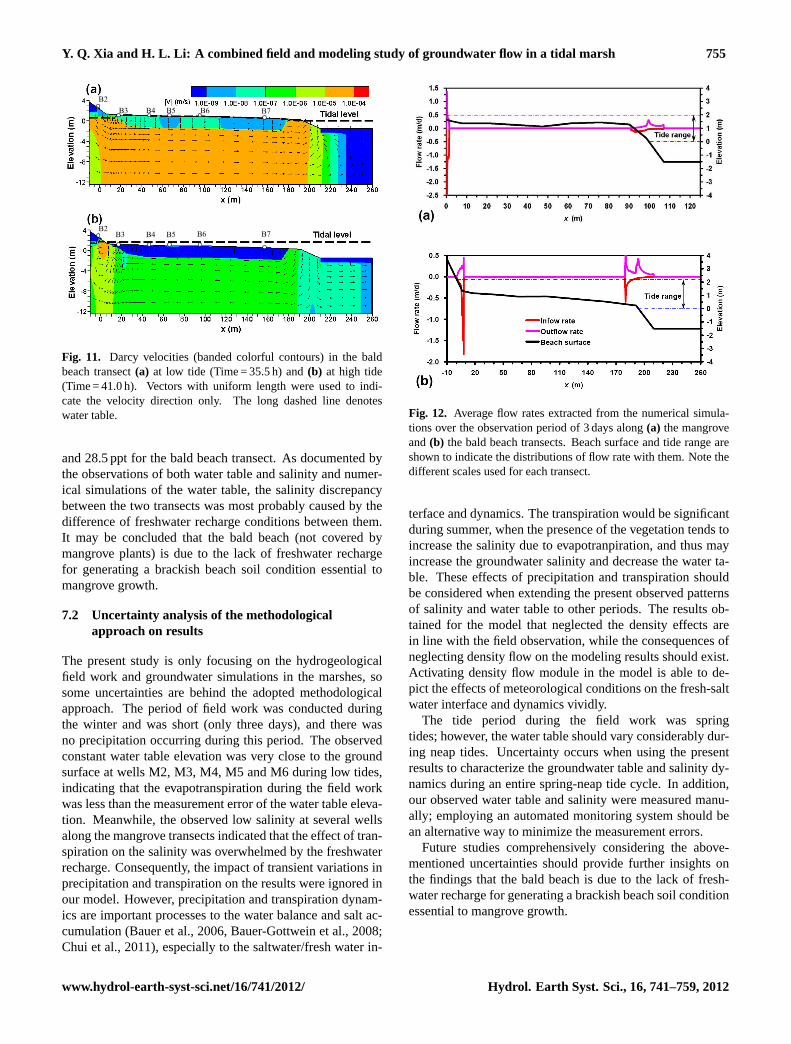
Fig. 9. Darcy velocities (banded colorful contours) in the mangrove transect (a) at low
tide (Time=35.5 h) and (b) at high tide (Time=41.0 h). Vectors with uniform length
were used to indicate the velocity direction only. The long dash line denotes water
table.
M0 M1 M2 M3 M4
M5 M6 M7
M8
M0 M1 M2 M3 M4 M5 M6 M7 M8
Fig. 9. Darcy velocities (banded colorful contours) in the man-grove transect(a) at low tide (Time = 35.5 h) and(b) at high tide(Time = 41.0 h). Vectors with uniform length were used to indicatethe velocity direction only. The long dash line denotes water table.
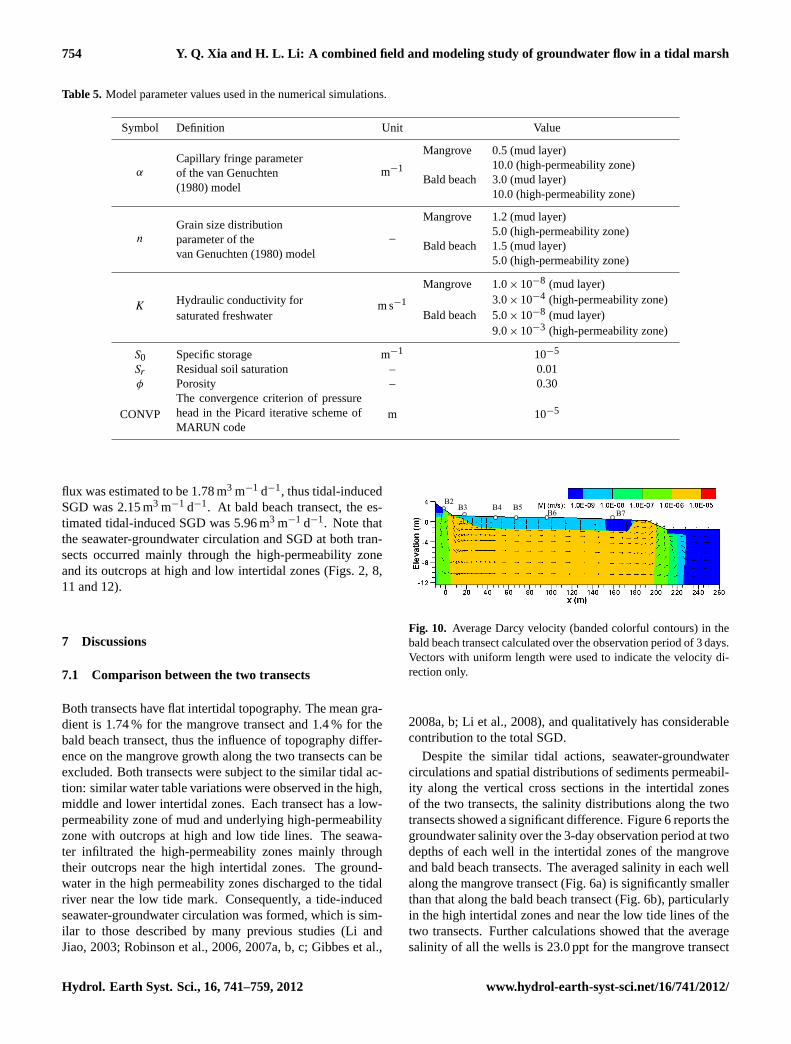
Figure 10 presents the average Darcy velocity over the ob-servation period in the bald beach transect. The pattern oftime-averaged flow is similar to that in the mangrove transect(Fig. 8), except that there was no inland freshwater rechargein the bald beach transect. Note that the magnitude of theaverage velocity in the bald beach transect was much largerthan that in the mangrove transect due to the difference ofthe permeability. Figure 11 depicts the distributions of Darcyvelocity at low and high tides along the bald beach transect.During low tides (Fig. 11a), seawater from the outcrop ofthe high-permeability zone in the high intertidal zone andfrom the mud layer discharged to the tidal river through thehigh-permeability zone, which is similar to the case of themangrove transect (Fig. 9a). During high tides, a small-scalelocal circulation of seawater-groundwater formed in the highintertidal zone (−10 m≤ x ≤ 20 m) at the bald beach transect(Fig. 11b). Despite of this local circulation, the overall flowpattern in this transect was similar to that of the mangrovetransect (Fig. 9b). The excellent match between the simu-lated and observed water tables in the bald beach transectindicated the rationality of the no-flow boundary conditionused along the landward boundary of this transect, that is, theinland freshwater recharge is negligible there. These simula-tion results also verified the presence of a high-permeabilityzone underlain the less-permeable mud zone.
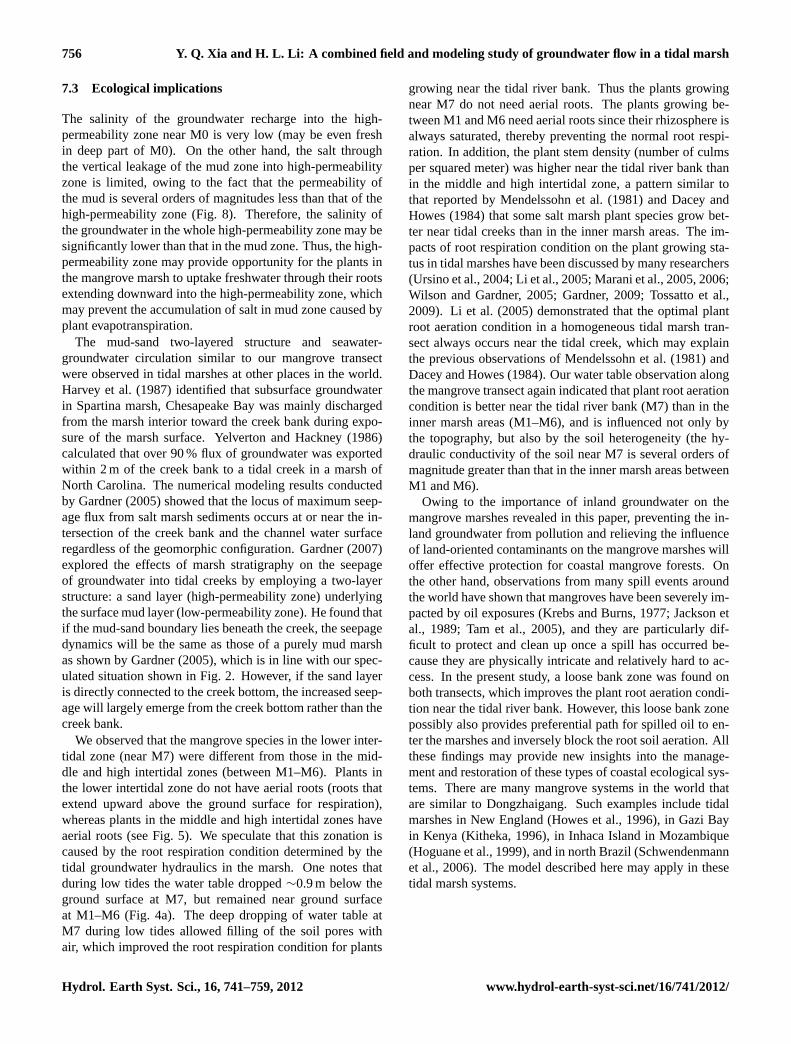
From a perspective of the submarine groundwater dis-charge (SGD) or seawater-groundwater circulation, seawa-ter mainly infiltrates the high intertidal zone, groundwa-ter discharges into the tidal creek near the low tide mark(Fig. 12). At mangrove transect, the simulated total out-flow flux is 3.94 m3 m−1 d−1. The inland freshwater recharge
www.hydrol-earth-syst-sci.net/16/741/2012/ Hydrol. Earth Syst. Sci., 16, 741–759, 2012
754 Y. Q. Xia and H. L. Li: A combined field and modeling study of groundwater flow in a tidal marsh
Table 5. Model parameter values used in the numerical simulations.
Symbol Definition Unit Value
α
Capillary fringe parameterm−1
Mangrove 0.5 (mud layer)
of the van Genuchten10.0 (high-permeability zone)
(1980) modelBald beach 3.0 (mud layer)
10.0 (high-permeability zone)
n
Grain size distribution–
Mangrove 1.2 (mud layer)
parameter of the5.0 (high-permeability zone)
van Genuchten (1980) modelBald beach 1.5 (mud layer)
5.0 (high-permeability zone)
KHydraulic conductivity for m s−1
Mangrove 1.0× 10⁻⁸ (mud layer)
saturated freshwater3.0× 10−4 (high-permeability zone)
Bald beach 5.0× 10⁻⁸ (mud layer)9.0× 10⁻³ (high-permeability zone)
S0 Specific storage m−1 10−5
Sr Residual soil saturation – 0.01φ Porosity – 0.30
CONVPThe convergence criterion of pressurehead in the Picard iterative scheme ofMARUN code
m 10−5
flux was estimated to be 1.78 m3 m−1 d−1, thus tidal-inducedSGD was 2.15 m3 m−1 d−1. At bald beach transect, the es-timated tidal-induced SGD was 5.96 m3 m−1 d−1. Note thatthe seawater-groundwater circulation and SGD at both tran-sects occurred mainly through the high-permeability zoneand its outcrops at high and low intertidal zones (Figs. 2, 8,11 and 12).
7 Discussions
7.1 Comparison between the two transects
Both transects have flat intertidal topography. The mean gra-dient is 1.74 % for the mangrove transect and 1.4 % for thebald beach transect, thus the influence of topography differ-ence on the mangrove growth along the two transects can beexcluded. Both transects were subject to the similar tidal ac-tion: similar water table variations were observed in the high,middle and lower intertidal zones. Each transect has a low-permeability zone of mud and underlying high-permeabilityzone with outcrops at high and low tide lines. The seawa-ter infiltrated the high-permeability zones mainly throughtheir outcrops near the high intertidal zones. The ground-water in the high permeability zones discharged to the tidalriver near the low tide mark. Consequently, a tide-inducedseawater-groundwater circulation was formed, which is sim-ilar to those described by many previous studies (Li andJiao, 2003; Robinson et al., 2006, 2007a, b, c; Gibbes et al.,
Fig. 10. Average Darcy velocity (banded colorful contours) in the bald beach transect
calculated over the observation period of 3 days. Vectors with uniform length were
used to indicate the velocity direction only.
B2 B3 B4 B5
B6 B7
Fig. 10. Average Darcy velocity (banded colorful contours) in thebald beach transect calculated over the observation period of 3 days.Vectors with uniform length were used to indicate the velocity di-rection only.
2008a, b; Li et al., 2008), and qualitatively has considerablecontribution to the total SGD.
Despite the similar tidal actions, seawater-groundwatercirculations and spatial distributions of sediments permeabil-ity along the vertical cross sections in the intertidal zonesof the two transects, the salinity distributions along the twotransects showed a significant difference. Figure 6 reports thegroundwater salinity over the 3-day observation period at twodepths of each well in the intertidal zones of the mangroveand bald beach transects. The averaged salinity in each wellalong the mangrove transect (Fig. 6a) is significantly smallerthan that along the bald beach transect (Fig. 6b), particularlyin the high intertidal zones and near the low tide lines of thetwo transects. Further calculations showed that the averagesalinity of all the wells is 23.0 ppt for the mangrove transect
Hydrol. Earth Syst. Sci., 16, 741–759, 2012 www.hydrol-earth-syst-sci.net/16/741/2012/
Y. Q. Xia and H. L. Li: A combined field and modeling study of groundwater flow in a tidal marsh 755
Fig. 11. Darcy velocities (banded colorful contours) in the bald beach transect (a) at
low tide (Time=35.5 h) and (b) at high tide (Time=41.0 h). Vectors with uniform
length were used to indicate the velocity direction only. The long dashed line denotes
water table.
B2 B3 B4 B5 B6 B7
B2 B3 B4 B5 B6 B7
Fig. 11. Darcy velocities (banded colorful contours) in the baldbeach transect(a) at low tide (Time = 35.5 h) and(b) at high tide(Time = 41.0 h). Vectors with uniform length were used to indi-cate the velocity direction only. The long dashed line denoteswater table.
and 28.5 ppt for the bald beach transect. As documented bythe observations of both water table and salinity and numer-ical simulations of the water table, the salinity discrepancybetween the two transects was most probably caused by thedifference of freshwater recharge conditions between them.It may be concluded that the bald beach (not covered bymangrove plants) is due to the lack of freshwater rechargefor generating a brackish beach soil condition essential tomangrove growth.
7.2 Uncertainty analysis of the methodologicalapproach on results
The present study is only focusing on the hydrogeologicalfield work and groundwater simulations in the marshes, sosome uncertainties are behind the adopted methodologicalapproach. The period of field work was conducted duringthe winter and was short (only three days), and there wasno precipitation occurring during this period. The observedconstant water table elevation was very close to the groundsurface at wells M2, M3, M4, M5 and M6 during low tides,indicating that the evapotranspiration during the field workwas less than the measurement error of the water table eleva-tion. Meanwhile, the observed low salinity at several wellsalong the mangrove transects indicated that the effect of tran-spiration on the salinity was overwhelmed by the freshwaterrecharge. Consequently, the impact of transient variations inprecipitation and transpiration on the results were ignored inour model. However, precipitation and transpiration dynam-ics are important processes to the water balance and salt ac-cumulation (Bauer et al., 2006, Bauer-Gottwein et al., 2008;Chui et al., 2011), especially to the saltwater/fresh water in-
Fig. 12. Average flow rates extracted from the numerical simulations over the
observation period of 3 days along (a) the mangrove and (b) the bald beach transects.
Beach surface and tide range are shown to indicate the distributions of flow rate with
them. Note the different scales used for each transect.
Fig. 12. Average flow rates extracted from the numerical simula-tions over the observation period of 3 days along(a) the mangroveand(b) the bald beach transects. Beach surface and tide range areshown to indicate the distributions of flow rate with them. Note thedifferent scales used for each transect.
terface and dynamics. The transpiration would be significantduring summer, when the presence of the vegetation tends toincrease the salinity due to evapotranpiration, and thus mayincrease the groundwater salinity and decrease the water ta-ble. These effects of precipitation and transpiration shouldbe considered when extending the present observed patternsof salinity and water table to other periods. The results ob-tained for the model that neglected the density effects arein line with the field observation, while the consequences ofneglecting density flow on the modeling results should exist.Activating density flow module in the model is able to de-pict the effects of meteorological conditions on the fresh-saltwater interface and dynamics vividly.
The tide period during the field work was springtides; however, the water table should vary considerably dur-ing neap tides. Uncertainty occurs when using the presentresults to characterize the groundwater table and salinity dy-namics during an entire spring-neap tide cycle. In addition,our observed water table and salinity were measured manu-ally; employing an automated monitoring system should bean alternative way to minimize the measurement errors.
Future studies comprehensively considering the above-mentioned uncertainties should provide further insights onthe findings that the bald beach is due to the lack of fresh-water recharge for generating a brackish beach soil conditionessential to mangrove growth.
www.hydrol-earth-syst-sci.net/16/741/2012/ Hydrol. Earth Syst. Sci., 16, 741–759, 2012
756 Y. Q. Xia and H. L. Li: A combined field and modeling study of groundwater flow in a tidal marsh
7.3 Ecological implications
The salinity of the groundwater recharge into the high-permeability zone near M0 is very low (may be even freshin deep part of M0). On the other hand, the salt throughthe vertical leakage of the mud zone into high-permeabilityzone is limited, owing to the fact that the permeability ofthe mud is several orders of magnitudes less than that of thehigh-permeability zone (Fig. 8). Therefore, the salinity ofthe groundwater in the whole high-permeability zone may besignificantly lower than that in the mud zone. Thus, the high-permeability zone may provide opportunity for the plants inthe mangrove marsh to uptake freshwater through their rootsextending downward into the high-permeability zone, whichmay prevent the accumulation of salt in mud zone caused byplant evapotranspiration.
The mud-sand two-layered structure and seawater-groundwater circulation similar to our mangrove transectwere observed in tidal marshes at other places in the world.Harvey et al. (1987) identified that subsurface groundwaterin Spartina marsh, Chesapeake Bay was mainly dischargedfrom the marsh interior toward the creek bank during expo-sure of the marsh surface. Yelverton and Hackney (1986)calculated that over 90 % flux of groundwater was exportedwithin 2 m of the creek bank to a tidal creek in a marsh ofNorth Carolina. The numerical modeling results conductedby Gardner (2005) showed that the locus of maximum seep-age flux from salt marsh sediments occurs at or near the in-tersection of the creek bank and the channel water surfaceregardless of the geomorphic configuration. Gardner (2007)explored the effects of marsh stratigraphy on the seepageof groundwater into tidal creeks by employing a two-layerstructure: a sand layer (high-permeability zone) underlyingthe surface mud layer (low-permeability zone). He found thatif the mud-sand boundary lies beneath the creek, the seepagedynamics will be the same as those of a purely mud marshas shown by Gardner (2005), which is in line with our spec-ulated situation shown in Fig. 2. However, if the sand layeris directly connected to the creek bottom, the increased seep-age will largely emerge from the creek bottom rather than thecreek bank.
We observed that the mangrove species in the lower inter-tidal zone (near M7) were different from those in the mid-dle and high intertidal zones (between M1–M6). Plants inthe lower intertidal zone do not have aerial roots (roots thatextend upward above the ground surface for respiration),whereas plants in the middle and high intertidal zones haveaerial roots (see Fig. 5). We speculate that this zonation iscaused by the root respiration condition determined by thetidal groundwater hydraulics in the marsh. One notes thatduring low tides the water table dropped∼0.9 m below theground surface at M7, but remained near ground surfaceat M1–M6 (Fig. 4a). The deep dropping of water table atM7 during low tides allowed filling of the soil pores withair, which improved the root respiration condition for plants
growing near the tidal river bank. Thus the plants growingnear M7 do not need aerial roots. The plants growing be-tween M1 and M6 need aerial roots since their rhizosphere isalways saturated, thereby preventing the normal root respi-ration. In addition, the plant stem density (number of culmsper squared meter) was higher near the tidal river bank thanin the middle and high intertidal zone, a pattern similar tothat reported by Mendelssohn et al. (1981) and Dacey andHowes (1984) that some salt marsh plant species grow bet-ter near tidal creeks than in the inner marsh areas. The im-pacts of root respiration condition on the plant growing sta-tus in tidal marshes have been discussed by many researchers(Ursino et al., 2004; Li et al., 2005; Marani et al., 2005, 2006;Wilson and Gardner, 2005; Gardner, 2009; Tossatto et al.,2009). Li et al. (2005) demonstrated that the optimal plantroot aeration condition in a homogeneous tidal marsh tran-sect always occurs near the tidal creek, which may explainthe previous observations of Mendelssohn et al. (1981) andDacey and Howes (1984). Our water table observation alongthe mangrove transect again indicated that plant root aerationcondition is better near the tidal river bank (M7) than in theinner marsh areas (M1–M6), and is influenced not only bythe topography, but also by the soil heterogeneity (the hy-draulic conductivity of the soil near M7 is several orders ofmagnitude greater than that in the inner marsh areas betweenM1 and M6).
Owing to the importance of inland groundwater on themangrove marshes revealed in this paper, preventing the in-land groundwater from pollution and relieving the influenceof land-oriented contaminants on the mangrove marshes willoffer effective protection for coastal mangrove forests. Onthe other hand, observations from many spill events aroundthe world have shown that mangroves have been severely im-pacted by oil exposures (Krebs and Burns, 1977; Jackson etal., 1989; Tam et al., 2005), and they are particularly dif-ficult to protect and clean up once a spill has occurred be-cause they are physically intricate and relatively hard to ac-cess. In the present study, a loose bank zone was found onboth transects, which improves the plant root aeration condi-tion near the tidal river bank. However, this loose bank zonepossibly also provides preferential path for spilled oil to en-ter the marshes and inversely block the root soil aeration. Allthese findings may provide new insights into the manage-ment and restoration of these types of coastal ecological sys-tems. There are many mangrove systems in the world thatare similar to Dongzhaigang. Such examples include tidalmarshes in New England (Howes et al., 1996), in Gazi Bayin Kenya (Kitheka, 1996), in Inhaca Island in Mozambique(Hoguane et al., 1999), and in north Brazil (Schwendenmannet al., 2006). The model described here may apply in thesetidal marsh systems.
Hydrol. Earth Syst. Sci., 16, 741–759, 2012 www.hydrol-earth-syst-sci.net/16/741/2012/
Y. Q. Xia and H. L. Li: A combined field and modeling study of groundwater flow in a tidal marsh 757
8 Summary and conclusions
In summary, this study showed that
1. the importance of freshwater to tidal marsh ecologi-cal systems is confirmed by quantitatively correlatingwater levels and salinity profiles from two transects inDongzhaigang mangrove marsh. Both the observed wa-ter tables and salinities at wells in inland and high inter-tidal zone indicated no inland freshwater recharge intothe bald beach transect. Salinity observations and nu-merical simulations demonstrated that significant fresh-water recharge occurred in the mangrove transect.
2. The two transects investigated here were found to have amud-sand two-layered structure: a surface zone of low-permeability mud and an underlying high-permeabilityzone that outcrops at the high and low tide lines. Themud-sand two-layered structure plays a key role inthe hydrological regime of the study areas. It is in-dicated that seawater infiltrates the high-permeabilityzone through its outcrop near the high intertidal zone,and discharges from the tidal river bank in the vicinityof the low tide line.
3. We quantitatively investigated the groundwater-seawater circulation dominated by the high-permeability zone of mud-sand structure tidal marsh,which provides considerable contribution to the totalsubmarine groundwater discharge (SGD).
4. To our knowledge, our work is the first paper to presentthe field data of groundwater flow and salinity in man-groves in China.
5. The last and most important aspect is the ecological im-plications arising from our study. this study suggeststhat the bald beach is most probably due to the lackof freshwater recharge for generating brackish condi-tions that result from mixing of seawater with fresh-water, because the mangroves would not survive inpure freshwater and high-salinity saltwater conditions.The existence of the high-permeability zone is a criti-cal factor for the mangrove development, because thehigh-permeability zone may provide opportunity for theplants in the mangrove marsh to uptake freshwater andoxygen through their roots extending downward intothe high-permeability zone, which may help limit thebuildup of salt in the root zone caused by evapotran-spiration and enhance salt removal, which may furtherincrease the production of marsh grasses and influencetheir spatial distribution.
Finally, there are many issues that have not been consideredhere but should be examined urgently. These include, e.g. thelong-term observations of precipitation, evapotranspiration,groundwater salinity and water table variations along the
mangrove transect, the quantifications and modeling of eco-hydrological feedback mechanisms based on these observa-tions (e.g. Bauer et al., 2006; Bauer-Gottwein et al. 2008),and the effects of the mixing and diffusion of solute insidethe observation well on the groundwater flow that are essen-tially three-dimensional or at least locally radial, i.e. the welleffects on the density-dependent groundwater flow near andwithin the observation wells.
Acknowledgements.This research is supported by the NationalNatural Science Foundation of China (NSFC, No. 40672167),NSFC Outstanding Young Scientist Grant (No. 41025009), andthe 111 Project (B08030). We are grateful to Zhiming Han(Hainan Geo-Environment Monitoring Institute) for his help for thefieldwork. The fieldwork was completed with the assistance frommany project team members including Shuang Liu from AnshanNormal University, Xiaolong Geng from Temple University,Yuchen Zhang, Fangxuan He, and Li Wang from Liaoning NormalUniversity, Shi Chen from China Coal Research Institute, YeTian, Chao Liu, Guohui Li, and Ying Yang from China Universityof Geosciences (Wuhan), Pingping Sun from China GeologicalSurvey, and Qiaona Guo from Hohai University. We gratefullyacknowledge Thomas Graf, Peter Bauer-Gottwein and Arnaut vanLoon, whose comments contributed to significant improvements inthe manuscript, and we thank Harrie-Jan Hendricks Franssen forhandling our manuscript.
Edited by: H.-J. Hendricks Franssen
References
Akamatsu, Y., Ikeda, S., and Toda, Y.: Transport of nutrients andorganic matter in a mangrove swamp, Estuar. Coast. Shelf S., 82,233–242, 2009.
Alber, M., Swenson, E. M., Adamowicz, S. C., and Mendelssohn, I.A.: Salt marsh dieback: An overview of recent events in the US,Estuar. Coast. Shelf S., 80, 1–11, 2008.
Bauer-Gottwein, P., Held, R. J., Zimmermann, S., Linn F., andKinzelbach W.: Coupled flow and salinity transport modellingin semi-arid environments: The Shashe River Valley, Botswana,J. Hydrol., 316, 163–183, 2006.
Bauer-Gottwein, P., Rasmussen, N. F., Feificova, D., and Trapp,S.: Phytotoxicity of salt and plant salt uptake: Modeling eco-hydrological feedback mechanisms, Water Resour. Res., 44,W04418,doi:10.1029/2007WR006067, 2008.
Bosire, J. O., Dahdouh-Guebas, F., Walton, M., Crona, B. I., Lewis,R. R., Field, C., Kairo, J. G., and Koedam, N.: Functionality ofrestored mangroves: A review, Aquat. Bot., 89, 251–259, 2008.
Boufadel, M. C.: A mechanistic study of nonlinear solute transportin a groundwater-surface water system under steady state andtransient hydraulic conditions, Water Resour. Res., 36, 2549–2565, 2000.
Boufadel, M. C., Suidan, M. T., and Venosa, A. D.: A numer-ical model for density-and-viscosity-dependent flows in two-dimensional variably saturated porous media, J. Contam. Hy-drol., 37, 1–20, 1999.
Boufadel, M. C., Xia, Y. Q., and Li, H. L.: Modeling solute trans-port and transient seepage in a laboratory beach under tidal influ-ence, Environ. Modell. Softw., 26, 899–912, 2011.
www.hydrol-earth-syst-sci.net/16/741/2012/ Hydrol. Earth Syst. Sci., 16, 741–759, 2012
758 Y. Q. Xia and H. L. Li: A combined field and modeling study of groundwater flow in a tidal marsh
Chapman, V. J.: Studies in salt marsh ecology: sections i to iii, J.Ecol., 26, 144–179, 1938.
Chapman, V. J.: Studies in salt marsh ecology: sections vi to vii, J.Ecol., 28, 118—152, 1940.
Chapman, V. J.: Wet Coastal Ecosystem, Eslevier Scientific Pub-lishing Company, Amsterdam, 1977.
Chui T. F. M., Low, S. Y., and Liong, S. Y.: An ecohydrologicalmodel for studying groundwater-vegetation interactions in wet-lands, J. Hydrol., 409, 291–304, 2011.
Clarke, L. D. and Hannon, N. J.: The mangrove swamp and saltmarsh communities of the Sydney District: III. Plant growth inrelation to salinity and waterlogging, J. Ecol., 58, 351–369, 1970.
Dacey, J. W. H. and Howes, B. L.: Water uptake controls watertable movement and sediment oxidation in short spartina marsh,Science, 224, 487–489, 1984.
Dittmar, T., Hertkorn, N., Kattner, G., and Lara, R. J.: Mangroves,a major source of dissolved organic carbon to the oceans, GlobalBiogeochem. Cy., 20, Gb1012,doi:10.1029/2005GB002570,2006.
Duke, N. C., Ball, M. C., and Ellison, J. C.: Factors influencing bio-diversity and distributional gradients in mangroves, Global Ecol.Biogeogr., 7, 27–47, 1998.
Duke, N. C., Meynecke, J. O., Dittmann, S., Ellison, A. M., Anger,K., Berger, U., Cannicci, S., Diele, K., Ewel, K. C., Field, C.D., Koedam, N., Lee, S. Y., Marchand, C., Nordhaus, I., andDahdouh-Guebas, F.: A world without mangroves, Science, 317,41–42, 2007.
Field, C. B., Osborn, J. G., Hoffman, L. L., Polsenberg, J. F., Ack-erly, D. D., Berry, J. A., Bjorkman, O., Held, A., Matson, P. A.,and Mooney, H. A.: Mangrove biodiversity and ecosystem func-tion, Global Ecol. Biogeogr., 7, 3–14, 1998.
Fu, G. A.: The mangroves of Dongzhai Gang Natural Reserve,Hainan, Guihaia, 15, 340–346, 1995 (in Chinese).
Gardner, L. R.: Role of geomorphic and hydraulic parameters ingoverning pore water seepage from salt marsh sediments, WaterResour. Res., 41, W07010,doi:10.1029/2004WR003671, 2005.
Gardner, L. R.: Role of stratigraphy in governing pore water seep-age from salt marsh sediments, Water Resour. Res., 43, W07502,doi:10.1029/2006WR005338, 2007.
Gardner, L. R.: Comment on “Spatial organization and ecohydro-logical interactions in oxygen-limited vegetation ecosystems”by Marco Marani et al., Water Resour. Res., 45, W05603,doi:10.1029/2007WR006165, 2009.
Gardner, L. R. and Porter, D. E.: Stratigraphy and geologic historyof a southeastern salt marsh basin, North Inlet, South Carolina,USA, Wetl. Ecol. Manag., 9, 371–385, 2001.
Gibbes, B., Robinson, C., Carey, H., Li, L., and Lockington, D.:Tidally driven pore water exchange in offshore intertidal sand-banks: Part I. Field measurements, Estuar. Coast. Shelf S., 79,121–132, 2008a.
Gibbes, B., Robinson, C., Li, L., Lockington, D., and Li, H. L.:Tidally driven pore water exchange within offshore intertidalsandbanks: Part II numerical simulations, Estuar. Coast. ShelfS., 80, 472–482, 2008b.
Gilman, E. L., Ellison, J., Duke, N. C., and Field, C.: Threats tomangroves from climate change and adaptation options: A re-view, Aquat. Bot., 89, 237–250, 2008.
Guo, H. P., Jiao, J. J., and Li, H. L.: Groundwater response to tidalfluctuation in a two-zone aquifer, J. Hydrol., 381, 364–371, 2010.
Guo, Q. N., Li, H. L., Boufadel, M. C., and Sharifi, Y.: Hydro-dynamics in a gravel beach and its impact on the Exxon Valdezoil, J. Geophys. Res., 115, C12077,doi:10.1029/2010JC006169,2010.
Harvey, J. W., Germann, P. F., and Odum, W. E.: Geomorphologicalcontrol of subsurface hydrology in the creekbank zone of tidalmarshes, Estuar. Coast. Shelf S., 25, 677–691, 1987.
Hemond, H. F. and Fifield, J. L.: Subsurface flow in a salt marshpeat, Limnol. Oceanogr., 27, 126–136, 1982.
Hoguane, A. M., Hill, A. E., Simpson, J. H., and Bowers, D. G.: Di-urnal and tidal variation of temperature and salinity in the PontaRasa Mangrove swamp, Mozambique, Estuar. Coast. Shelf S.,49, 251–264, 1999.
Howes, B. L., Weiske, P. K., Goehringer, D. D., and Teal., J.M.: Interception of freshwater and nitrogen transport from up-lands to coastal waters: the role of saltmarshes, in: EstuarineShores: Hydrological, Geomorphological and Ecological Inter-actions, edited by: Nordstrom, K. and Roman, C., Wiley Inter-science, Sussex, England, 287–310, 1996.
Hughes, C. E., Binning, P., and Willgoose, G. R.: Characterisationof the hydrology of an estuarine wetland, J. Hydrol., 211, 34–49,1998.
Jackson, J. B. C., Cubit, J. D., Keller, B. D., Batista, V., Burns,K., Caffey, H. M., Caldwell, R. L., Garrity, S. D., Getter, C. D.,Gonzalez, C., Guzman, H. M., Kaufmann, K. W., Knap, A. H.,Levings, S. C., Marshall, M. J., Steger, R., Thompson, R. C., andWeil, E.: Ecological Effects of a Major Oil Spill on PanamanianCoastal Marine Communities, Science, 243, 37–44, 1989.
Kitheka, J. U.: Water circulation and coastal trapping of brackishwater in a tropical mangrove-dominated bay in Kenya, Limnol.Oceanogr., 41, 169–176, 1996.
Kjerfve, B.: Manual for investigation of hydrological processes inmangrove ecosystems, UNESCO/UNDP Project, Research andits Application to the Management of the Mangroves of Asia andthe Pacific (RAS/86/120), 1990.
Krauss, K. W., Lovelock, C. E., McKee, K. L., Lopez-Hoffman, L.,Ewe, S. M. L., and Sousa, W. P.: Environmental drivers in man-grove establishment and early development: A review, Aquat.Bot., 89, 105–127, 2008.
Krebs, C. T. and Burns, K. A.: Long-term effects of an oil spillon populations of the salt-marsh crab uca pugnax, Science, 197,484–487, 1977.
Kristensen, E., Bouillon, S., Dittmar, T., and Marchand, C.: Organiccarbon dynamics in mangrove ecosystems: A review, Aquat.Bot., 89, 201–219, 2008.
Li, H. L. and Boufadel, M. C.: Long-term persistence of oil from theExxon Valdez spill in two-layer beaches, Nat. Geosci., 3, 96–99,2010.
Li, H. L. and Jiao, J. J.: Tide-induced seawater-groundwater circu-lation in a multi-layered coastal leaky aquifer system, J. Hydrol.,274, 211–224, 2003.
Li, H. L., Li, L., and Lockington, D.: Aeration for plant rootrespiration in a tidal marsh, Water Resour. Res., 41, W06023,doi:10.1029/2004WR003759, 2005.
Li, H. L., Boufadel, M. C., and Weaver, J. W.: Tide-inducedseawater-groundwater circulation in shallow beach aquifers, J.Hydrol., 352, 211–224, 2008.
Liu, J. G. and Diamond, J.: China’s environment in a globalizingworld, Nature, 435, 1179–1186, 2005.
Hydrol. Earth Syst. Sci., 16, 741–759, 2012 www.hydrol-earth-syst-sci.net/16/741/2012/
Y. Q. Xia and H. L. Li: A combined field and modeling study of groundwater flow in a tidal marsh 759
Lugo, A. E. and Snedaker, S. C.: The ecology of mangroves, An-nual Review of Ecology, Evolution, and Systematics (formerly,Annu. Rev. Ecol. Syst.), 5, 39–64, 1974.
Luther, G. W., III, Church, T. M., Scudlark, J. R., and Cosman, M.:Inorganic and organic sulfur cycling in salt-marsh pore waters,Science, 232, 746–749, 1986.
Marani, M., Ursino, N., and Silvestri, S.: Reply to comment byAlicia M. Wilson and Leonard Robert Gardner on “Subsurfaceflow and vegetation patterns in tidal environments”, Water Re-sour. Res., 41, W07022,doi:10.1029/2004WR003722, 2005.
Marani, M., Silvestri, S., Belluco, E., Ursino, N., Comerlati, A.,Tosatto, O., and Putti, M.: Spatial organization and ecohydrolog-ical interactions in oxygen-limited vegetation ecosystems, WaterResour. Res., 42, W06D06,doi:10.1029/2005WR004582, 2006.
Mendelssohn, I. A., McKee, K. L., and Patrick, W. H.: Oxygendeficiency in Spartina alterniflora roots: Metabolic adaptation toanoxia, Science, 214, 439–441, 1981.
Merritt, M. L.: Estimating hydraulic properties of the Floridianaquifer sytem by analysis of earth-tide, ocean-tide, and baromet-ric effects, Collier and Hendry Counties, Florida, Tallahassee,Florida, 69, 2004.
Montalto, F. A., Steenhuis, T. S., and Parlange, J. Y.: The hydrologyof Piermont Marsh, a reference for tidal marsh restoration in theHudson river estuary, New York, J. Hydrol., 316, 108–128, 2006.
Nagelkerken, I., Blaber, S. J. M., Bouillon, S., Green, P., Haywood,M., Kirton, L. G., Meynecke, J. O., Pawlik, J., Penrose, H. M.,Sasekumar, A., and Somerfield, P. J.: The habitat function ofmangroves for terrestrial and marine fauna: A review, Aquat.Bot., 89, 155–185, 2008.
Nuttle, W. K. and Harvey, J. W.: Fluxes of water and solute in acoastal wetland sediment. l. The contribution of regional ground-water discharge, J. Hydrol., 164, 89–107, 1995.
Pennings, S. C. and Callaway, R. M.: Salt marsh plant zonation:The relative importance of competition and physical factors,Ecology, 73, 681–690, 1992.
Robinson, C., Gibbes, B., and Li, L.: Driving mechanisms forgroundwater flow and salt transport in a subterranean estuary,Geophys. Res. Lett., 33, L03402,doi:10.1029/2005GL025247,2006.
Robinson, C., Gibbes, B., Carey, H., and Li, L.: Salt-freshwaterdynamics in a subterranean estuary over a spring-neap tidal cy-cle, J. Geophys. Res., 112, C09007,doi:10.1029/2006JC003888,2007a.
Robinson, C., Li, L., and Barry, D. A.: Effect of tidal forcing on asubterranean estuary, Adv. Water Resour., 30, 851–865, 2007b.
Robinson, C., Li, L., and Prommer, H.: Tide-induced recircula-tion across the aquifer-ocean interface, Water Resour. Res., 43,W07428,doi:10.1029/2006WR005679, 2007c.
Schwendenmann, L., Riecke, R., and Lara, R.: Solute dynamics ina North Brazilian mangrove: the influence of sediment perme-ability and freshwater input, Wetl. Ecol. Manag., 14, 463–475,2006.
Selvam, V.: Environmental classification of mangrove wetlands ofIndia, Curr. Sci., 84, 757–765, 2003.
Silvestri, S., Defina, A., and Marani, M.: Tidal regime, salinity andsalt marsh plant zonation, Estuar. Coast. Shelf S., 62, 119–130,2005.
Spalding, M., Blasco, F., and Field, C.: World mangrove atlas, In-ternational Society for Mangrove Ecosystems, Japan: Okinawa,178 pp., 1997.
Steudler, P. A. and Peterson, B. J.: Contribution of gaseous sulphurfrom salt marshes to the global sulphur cycle, Nature, 311, 455–457, 1984.
Tam, N. F. Y., Wong, T. W. Y., and Wong, Y. S.: A case study onfuel oil contamination in a mangrove swamp in Hong Kong, Mar.Pollut. Bull., 51, 1092–1100, 2005.
Tide table:http://www.coi.gov.cn, last access: 2 September 2007.Tossatto, O., Belluco, E., Silvestri, S., Ursino, N., Comerlati, A.,
Putti, M., and Marani, M.: Reply to comment by L. R. Gard-ner on “Spatial organization and ecohydrological interactions inoxygen-limited vegetation ecosystems”, Water Resour. Res., 45,W05604,doi:10.1029/2007WR006345, 2009.
Ursino, N., Silvestri, S., and Marani, M.: Subsurface flow and veg-etation patterns in tidal environments, Water Resour. Res., 40,W05115,doi:10.1029/2003WR002702, 2004.
Valiela, I. and Teal, J. M.: The nitrogen budget of a salt marshecosystem, Nature, 280, 652–656, 1979.
Valiela, I., Bowen, J. L., and York, J. K.: Mangrove forests: One ofthe world’s threatened major tropical environments, Bioscience,51, 807–815, 2001.
Wilson, A. M. and Gardner, L. R.: Comment on “Subsurface flowand vegetation patterns in tidal environments” by Nadia Ursino,Sonia Silvestri, and Marco Marani, Water Resour. Res., 41,W07021,doi:10.1029/2004WR003554, 2005.
Wilson, A. M. and Gardner, L. R.: Tidally driven groundwater flowand solute exchange in a marsh: Numerical simulations, WaterResour. Res., 42, W01405,doi:10.1029/2005WR004302, 2006.
Woodroffe, C. D., Thom, B. G., and Chappell, J.: Development ofwidespread mangrove swamps in mid-Holocene times in north-ern Australia, Nature, 317, 711–713, 1985.
Xia, Y. Q., Li, H. L., Boufadel, M. C., and Sharifi, Y.: Hydrody-namic factors affecting the persistence of the Exxon Valdez oilin a shallow bedrock beach, Water Resour. Res., 46, W10528,doi:10.1029/2010WR009179, 2010.
Xin, P., Jin, G., Li, L., and Barry, D. A.: Effects of crab burrows onpore water flows in salt marshes, Adv. Water Resour., 32, 439–449, 2009.
Ye, Y. and Lu, C.: Dynamics of CH4 in soil underAegicerasCorniculatummangrove at Changning estuary of Hainan Island,Journal of Tropical Oceanography, 20, 35–42, 2001 (in Chinese).
Yelverton, G. F. and Hackney, C. T.: Flux of dissolved organic car-bon and pore water through the substrate of a Spartina alternifloramarsh in North Carolina, Estuar. Coast. Shelf S., 22, 255–267,1986.
www.hydrol-earth-syst-sci.net/16/741/2012/ Hydrol. Earth Syst. Sci., 16, 741–759, 2012