
Transcriptome-guided amyloid imaging genetic analysis via a novel structured sparse learning...
8
BIOINFORMATICS Vol. 00 no. 00 2014 Pages 1–8 Transcriptome-Guided Amyloid Imaging Genetic Analysis via A Novel Structured Sparse Learning Algorithm Jingwen Yan 1,2 , Lei Du 2 , Sungeun Kim 2 , Shannon L. Risacher 2 , Heng Huang 3 , Jason H. Moore 4 , Andrew J. Saykin 2 , Li Shen 2* , and for the Alzheimer’s Disease Neuroimaging Initiative † 1 BioHealth, Indiana University School of Informatics & Computing, Indianapolis, IN, 46202, USA 2 Radiology & Imaging Sciences, Indiana University Sch. of Medicine, Indianapolis, IN, 46202, USA 3 Computer Science & Engineering, The University of Texas at Arlington, TX, 76019, USA 4 Genetics, Community & Family Medicine, Dartmouth Medical School, Lebanon, NH, 03756, USA Received on XXXXX; revised on XXXXX; accepted on XXXXX Associate Editor: XXXXXXX ABSTRACT Motivation: Imaging genetics is an emerging field that studies the influence of genetic variation on brain structure and function. The major task is to examine the association between genetic markers such as single nucleotide polymorphisms (SNPs) and quantitative traits (QTs) extracted from neuroimaging data. The complexity of these data sets have presented critical bioinformatics challenges that require new enabling tools. Sparse canonical correlation analysis (SCCA) is a bi-multivariate technique used in imaging genetics to identify complex multi-SNP-multi-QT associations. However, most of the existing SCCA algorithms are designed using the soft threshol- ding method, which assumes that the input features are independent from one another. This assumption clearly does not hold for the ima- ging genetic data. In this paper, we propose a new knowledge-guided SCCA algorithm (KG-SCCA) to overcome this limitation as well as improve learning results by incorporating valuable prior knowledge. Results: The proposed KG-SCCA method is able to model two types of prior knowledge: one as a group structure (e.g., linkage disequili- brium blocks among SNPs) and the other as a network structure (e.g., gene co-expression network among brain regions). The new model incorporates these prior structures by introducing new regularization terms to encourage weight similarity between grouped or connected features. A new algorithm is designed to solve the KG-SCCA model without imposing the independence constraint on the input features. We demonstrate the effectiveness of our algorithm with both synthetic and real data. For real data, using an Alzheimer’s disease (AD) coh- ort, we examine the imaging genetic associations between all SNPs in the APOE gene (i.e., top AD gene) and amyloid deposition measu- res among cortical regions (i.e., a major AD hallmark). In comparison with a widely used SCCA implementation, our KG-SCCA algorithm * To whom correspondence should be addressed: [email protected] † Data used in preparation of this article were obtained from the Alzhei- mer’s Disease Neuroimaging Initiative (ADNI) database (adni.loni.usc.edu). As such, the investigators within the ADNI contributed to the design and implementation of ADNI and/or provided data but did not par- ticipate in analysis or writing of this report. A complete listing of ADNI investigators can be found at: http://adni.loni.usc.edu/wp- content/uploads/how to apply/ADNI Acknowledgement List.pdf. produces not only improved cross-validation performances but also biologically meaningful results. Availability: Software is freely available upon request. Contact: [email protected] 1 INTRODUCTION Brain imaging genetics is an emerging field that studies the influe- nce of genetic variation on brain structure and function. Its major task is to examine the association between genetic markers such as single nucleotide polymorphisms (SNPs) and quantitative traits (QTs) extracted from multimodal neuroimaging data (e.g., anatomi- cal, functional and molecular imaging scans). Given the well-known importance of gene and imaging phenotype in brain function, brid- ging these two factors and exploring their connections would lead to a better mechanistic understanding of normal or disordered brain functions. The complexity of these data, however, have presen- ted critical bioinformatics challenges requiring new enabling tools. Early studies in imaging genetics typically focused on pairwise uni- variate analysis (Shen et al., 2010). Many recent studies turned to regression analysis for exploring the joint effect of multiple SNPs on single or few QTs (Hibar et al., 2011) and bi-multivariate analy- ses for revealing complex multi-SNPs-multi-QTs associations (Chi et al., 2013; Lin et al., 2014; Vounou et al., 2010; Wan et al., 2011). Canonical correlation analysis, a bi-multivariate method, has been applied to imaging genetics applications. It aims to find the best linear transformation for imaging and genetics features so that the highest correlation between imaging and genetic components can be achieved. Based on the assumption that a real imaging genetic signal typically involves a small number of SNPs and QTs, sparse canonical correlation analysis (SCCA) has also been applied in seve- ral imaging genetic studies by imposing the Lasso regularization term to yield sparse results (Chi et al., 2013; Lin et al., 2014; Wan et al., 2011). However, most existing SCCA algorithms are desi- gned using the soft thresholding technique, which assumes that the input features are independent from one another (Tibshirani, 1996). This assumption clearly does not hold for the imaging genetic data (e.g., the existence of the structural and functional networks in the c Oxford University Press 2014. 1
Transcript of Transcriptome-guided amyloid imaging genetic analysis via a novel structured sparse learning...
BIOINFORMATICS Vol. 00 no. 00 2014Pages 1–8
Transcriptome-Guided Amyloid Imaging Genetic Analysisvia A Novel Structured Sparse Learning AlgorithmJingwen Yan 1,2, Lei Du 2, Sungeun Kim 2, Shannon L. Risacher 2, HengHuang 3, Jason H. Moore 4, Andrew J. Saykin 2, Li Shen 2∗, and for theAlzheimer’s Disease Neuroimaging Initiative†1BioHealth, Indiana University School of Informatics & Computing, Indianapolis, IN, 46202, USA2Radiology & Imaging Sciences, Indiana University Sch. of Medicine, Indianapolis, IN, 46202, USA3Computer Science & Engineering, The University of Texas at Arlington, TX, 76019, USA4Genetics, Community & Family Medicine, Dartmouth Medical School, Lebanon, NH, 03756, USAReceived on XXXXX; revised on XXXXX; accepted on XXXXX
Associate Editor: XXXXXXX
ABSTRACTMotivation: Imaging genetics is an emerging field that studies theinfluence of genetic variation on brain structure and function. Themajor task is to examine the association between genetic markerssuch as single nucleotide polymorphisms (SNPs) and quantitativetraits (QTs) extracted from neuroimaging data. The complexity ofthese data sets have presented critical bioinformatics challenges thatrequire new enabling tools. Sparse canonical correlation analysis(SCCA) is a bi-multivariate technique used in imaging genetics toidentify complex multi-SNP-multi-QT associations. However, most ofthe existing SCCA algorithms are designed using the soft threshol-ding method, which assumes that the input features are independentfrom one another. This assumption clearly does not hold for the ima-ging genetic data. In this paper, we propose a new knowledge-guidedSCCA algorithm (KG-SCCA) to overcome this limitation as well asimprove learning results by incorporating valuable prior knowledge.Results: The proposed KG-SCCA method is able to model two typesof prior knowledge: one as a group structure (e.g., linkage disequili-brium blocks among SNPs) and the other as a network structure (e.g.,gene co-expression network among brain regions). The new modelincorporates these prior structures by introducing new regularizationterms to encourage weight similarity between grouped or connectedfeatures. A new algorithm is designed to solve the KG-SCCA modelwithout imposing the independence constraint on the input features.We demonstrate the effectiveness of our algorithm with both syntheticand real data. For real data, using an Alzheimer’s disease (AD) coh-ort, we examine the imaging genetic associations between all SNPsin the APOE gene (i.e., top AD gene) and amyloid deposition measu-res among cortical regions (i.e., a major AD hallmark). In comparisonwith a widely used SCCA implementation, our KG-SCCA algorithm
∗To whom correspondence should be addressed: [email protected]†Data used in preparation of this article were obtained from the Alzhei-mer’s Disease Neuroimaging Initiative (ADNI) database (adni.loni.usc.edu).As such, the investigators within the ADNI contributed to the designand implementation of ADNI and/or provided data but did not par-ticipate in analysis or writing of this report. A complete listingof ADNI investigators can be found at: http://adni.loni.usc.edu/wp-content/uploads/how to apply/ADNI Acknowledgement List.pdf.
produces not only improved cross-validation performances but alsobiologically meaningful results.Availability: Software is freely available upon request.Contact: [email protected]
1 INTRODUCTIONBrain imaging genetics is an emerging field that studies the influe-nce of genetic variation on brain structure and function. Its majortask is to examine the association between genetic markers suchas single nucleotide polymorphisms (SNPs) and quantitative traits(QTs) extracted from multimodal neuroimaging data (e.g., anatomi-cal, functional and molecular imaging scans). Given the well-knownimportance of gene and imaging phenotype in brain function, brid-ging these two factors and exploring their connections would leadto a better mechanistic understanding of normal or disordered brainfunctions. The complexity of these data, however, have presen-ted critical bioinformatics challenges requiring new enabling tools.Early studies in imaging genetics typically focused on pairwise uni-variate analysis (Shen et al., 2010). Many recent studies turned toregression analysis for exploring the joint effect of multiple SNPson single or few QTs (Hibar et al., 2011) and bi-multivariate analy-ses for revealing complex multi-SNPs-multi-QTs associations (Chiet al., 2013; Lin et al., 2014; Vounou et al., 2010; Wan et al., 2011).
Canonical correlation analysis, a bi-multivariate method, has beenapplied to imaging genetics applications. It aims to find the bestlinear transformation for imaging and genetics features so that thehighest correlation between imaging and genetic components canbe achieved. Based on the assumption that a real imaging geneticsignal typically involves a small number of SNPs and QTs, sparsecanonical correlation analysis (SCCA) has also been applied in seve-ral imaging genetic studies by imposing the Lasso regularizationterm to yield sparse results (Chi et al., 2013; Lin et al., 2014; Wanet al., 2011). However, most existing SCCA algorithms are desi-gned using the soft thresholding technique, which assumes that theinput features are independent from one another (Tibshirani, 1996).This assumption clearly does not hold for the imaging genetic data(e.g., the existence of the structural and functional networks in the
c© Oxford University Press 2014. 1
Yan et al
brain and the linkage disequilibrium (LD) blocks in the genome).Directly ignoring the covariance structure in the data will inevitablylimits the capability of yielding optimal results.
In this paper, we propose a new knowledge-guided SCCA algo-rithm (KG-SCCA) to overcome this limitation as well as to aim forimproving learning results by incorporating valuable prior know-ledge. The proposed KG-SCCA method is able to model two typesof prior knowledge: one as a group structure (e.g., LD blocks amongSNPs) and the other as a network structure (e.g., gene co-expressionnetwork among brain regions). The new model incorporates theseprior structures by introducing new regularization terms to encou-rage similarity between grouped or connected features. A new algo-rithm is designed to solve the KG-SCCA model without imposingthe independence constraint on the input features. We demonstratethe effectiveness of our algorithm with both synthetic and real data.For real data, using an Alzheimer’s disease (AD) cohort, we exa-mine the imaging genetic associations between all SNPs in theAPOE gene (i.e., top AD gene) and amyloid deposition measuresamong cortical regions (i.e., a major AD hallmark). In comparisonwith a widely used SCCA implementation in the PMA softw-are package (http://cran.r-project.org/web/packages/PMA/) (Wittenet al., 2009), our KG-SCCA algorithm produces improved cross-validation performances as well as biologically meaningful results.
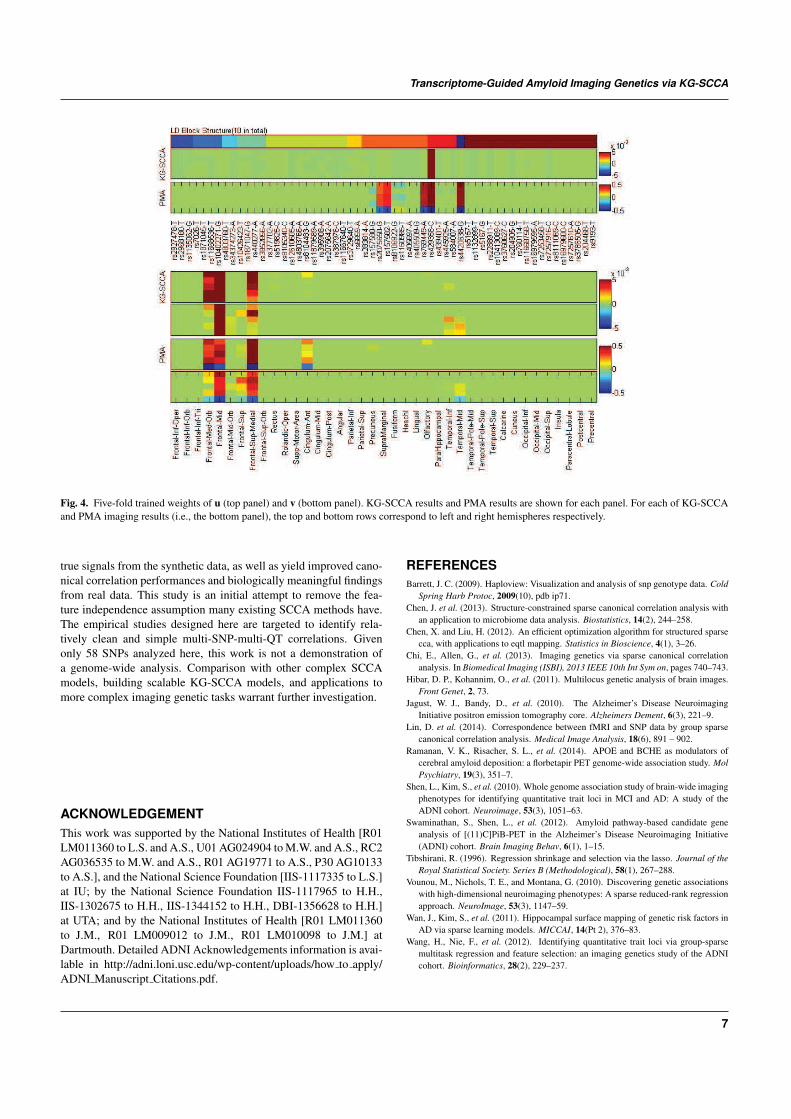
2 MATERIALS AND DATA SOURCESTo demonstrate the proposed KG-SCCA algorithm, we apply it to anamyloid imaging genetic analysis in the study of AD. Deposition ofamyloid-β in the cerebral cortex is a major hallmark in AD pathoge-nesis. Our prior studies (Swaminathan et al., 2012; Ramanan et al.,2014) performed univariate genetic association analyses of amy-loid measures in a few candidate cortical regions of interest (ROIs),and identified several promising hits including rs429358 in APOE,rs509208 in BCHE, and rs7551288 in DHCR24. In this work, usingthe proposed KG-SCCA algorithm, we perform a bi-multivariateanalysis to examine the association between all the available SNPs(58 in total) in the APOE gene (i.e., the top genetic risk factor forlate onset AD) and 78 ROIs across the entire cortex. We employtwo types of prior knowledge in this analysis: (1) a group stru-cture is imposed to the SNP data using the LD block information(see Fig. 4), and (2) a network structure is imposed to the amy-loid imaging data by computing an amyloid pathway-based geneco-expression network in the brain using Allen Human Brain Atlas(Zeng et al., 2012). Below, we first describe our amyloid imagingand genotyping data, and then discuss our method for creating theamyloid pathway-based gene co-expression network in the brain.
2.1 Imaging and Genotyping DataThe proposed algorithm, KG-SCCA, was empirically evaluatedusing the amyloid imaging and genotyping data obtained fromthe Alzheimer’s Disease Neuroimaging Initiative (ADNI) database(adni.loni.usc.edu). One goal of ADNI has been to testwhether serial magnetic resonance imaging (MRI), positron emis-sion tomography (PET), other biological markers, and clinicaland neuropsychological assessment can be combined to measurethe progression of mild cognitive impairment (MCI) and earlyAD. For up-to-date information, see www.adni-info.org. Pre-processed [18F]Florbetapir PET scans (i.e., amyloid imaging data)
Table 1. Participant characteristics.
Subjects AD MCI HC
Number 28 343 196Gender(M/F) 18/10 203/140 102/94Handedness(R/L) 23/5 309/34 178/18Age(mean±std) 75.23±10.66 71.92±7.47 74.77±5.39Education(mean±std) 15.61±2.74 15.99±2.75 16.46±2.65
were downloaded from LONI (adni.loni.usc.edu). Beforedownloading, images were averaged, aligned to a standard space, re-sampled to a standard image and voxel size, smoothed to a uniformresolution and normalized to a cerebellar gray matter (GM) refe-rence region resulting in standardized uptake value ratio (SUVR)images as previously described (Jagust et al., 2010). After down-loading, the images were aligned to each participant’s same visitMRI scan and normalized to the Montreal Neurological Institute(MNI) space as 2x2x2mm voxels using parameters from the MRIsegmentation. ROI level amyloid measurements were further extra-cted based on the MarsBaR AAL atlas. Genotype data of bothADNI-1 and ADNI-2/GO phases were also obtained from LONI(adni.loni.usc.edu). All the APOE SNPs were extractedbased on the quality controlled and imputed data combining twophases together. Only SNPs available in Illumina 610Quad and/orOmniExpress arrays were included in the analysis. As a result, wehad 58 SNPs located within 10 LD blocks (see Fig. 4) compu-ted using HaploView (Barrett, 2009). 568 non-Hispanic Caucasianparticipants with both complete amyloid measurements and APOESNPs were studied, including 28 AD, 343 MCI and 196 healthy con-trol (HC) subjects (Table 1). Using the regression weights derivedfrom the HC participants, amyloid and SNP measures were preadju-sted for removing the effects of the baseline age, gender, education,and handedness.
2.2 Amyloid Pathway-based Gene Co-expressionNetwork in the Brain
Since we examine cortical amyloid deposition in relation to gene-tic variation, we hypothesize that amyloid pathway-based geneco-expression profiles among cortical ROIs may provide valuableinformation in search for APOE-related amyloid distribution pat-tern in the cortex. Thus, we employed the brain transcriptome datafrom the Allen Human Brain Atlas (AHBA) (Zeng et al., 2012),coupled with 15 candidate genes from amyloid pathways studied in(Swaminathan et al., 2012), to create such a brain network.
Gene expression profiles across the whole human brain weredownloaded from Allen Institute for Brain Science. One of theirgoals is to advance the research and knowledge about neurobiolo-gical conditions, with extensive mapping of whole-genome geneexpression throughout the brain. Among various organisms, AHBAis one of the projects seeking to combine the genomics with the neu-roanatomy to better understand the connection between genes andbrain functioning. Gene expression profiles in 8 health human brainshave been released, including 2 full brains and 6 right hemispheres.Details can be found in www.brain-map.org.
Brain-wide expression data of all 15 amyloid-related candidategenes, reported in (Swaminathan et al., 2012), were extracted from
2
Transcriptome-Guided Amyloid Imaging Genetics via KG-SCCA
H0351-2001 H0351-2002 Combined Min
imu
m M
axim
um
Me
an
Std
Me
dia
n
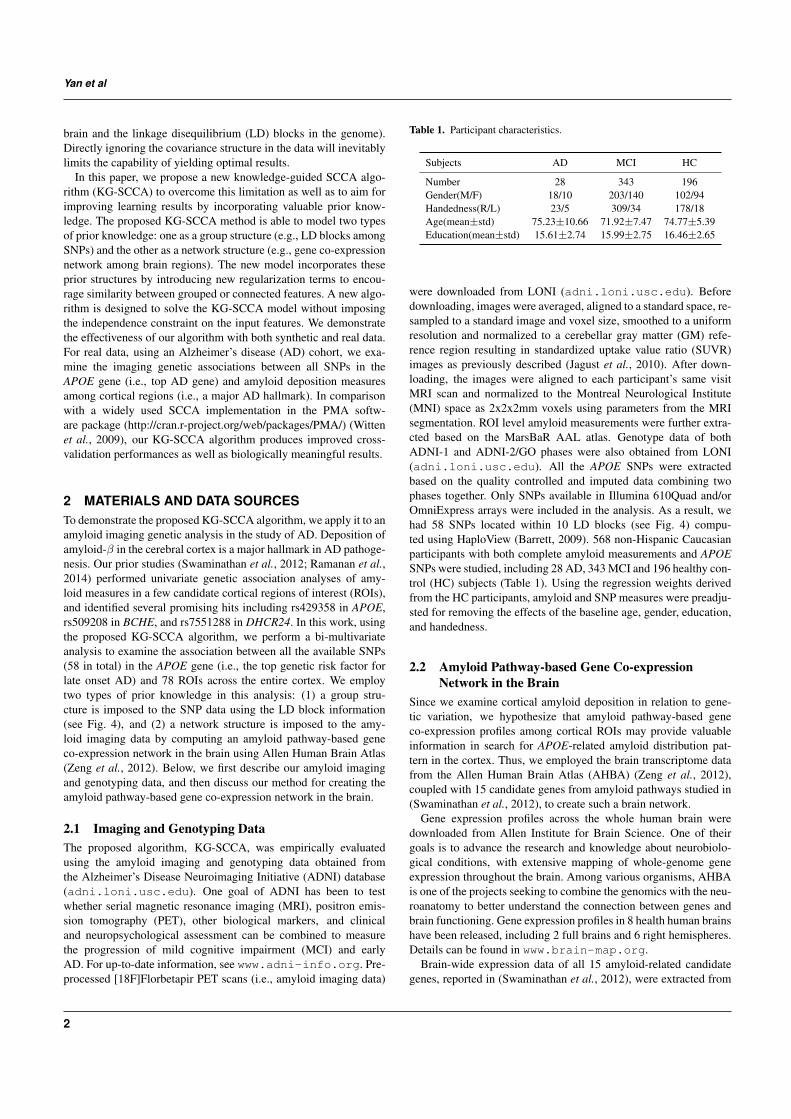
Fig. 1. Amyloid pathway-based gene co-expression networks among 78AAL cortical ROIs constructed from AHBA using different statistics (seedifferent rows) for two individuals and their combination.
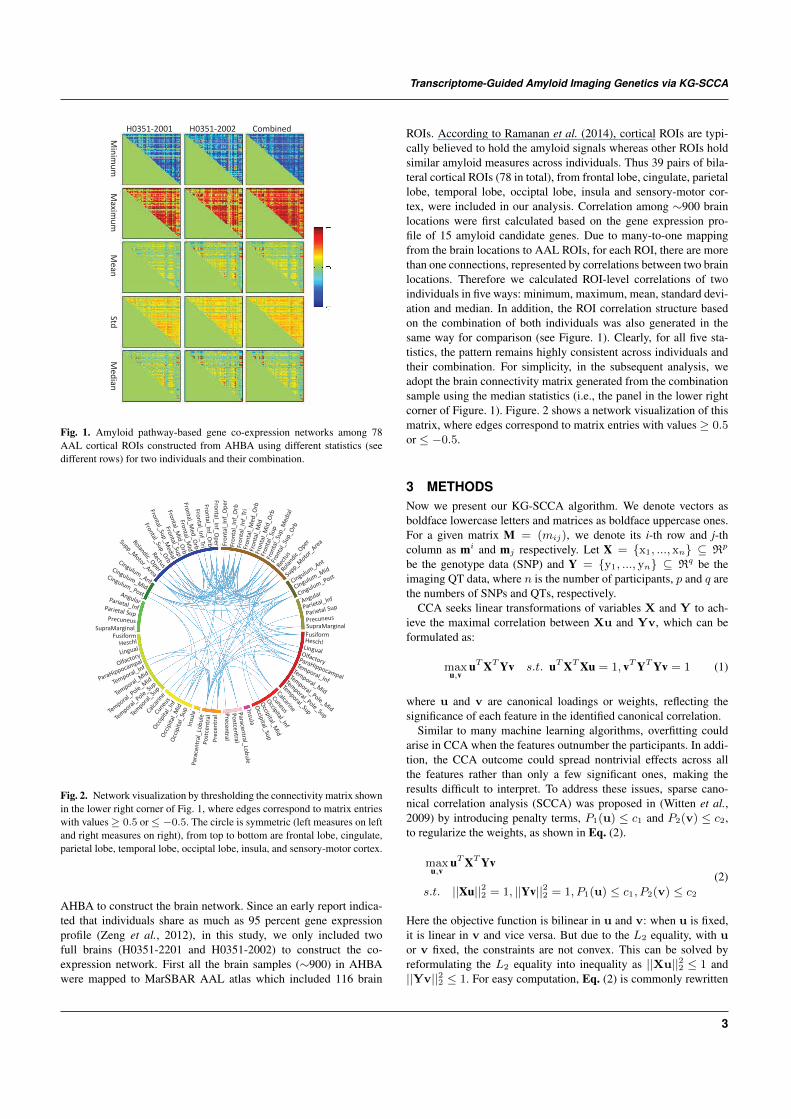
Fig. 2. Network visualization by thresholding the connectivity matrix shownin the lower right corner of Fig. 1, where edges correspond to matrix entrieswith values ≥ 0.5 or ≤ −0.5. The circle is symmetric (left measures on leftand right measures on right), from top to bottom are frontal lobe, cingulate,parietal lobe, temporal lobe, occiptal lobe, insula, and sensory-motor cortex.
AHBA to construct the brain network. Since an early report indica-ted that individuals share as much as 95 percent gene expressionprofile (Zeng et al., 2012), in this study, we only included twofull brains (H0351-2201 and H0351-2002) to construct the co-expression network. First all the brain samples (∼900) in AHBAwere mapped to MarSBAR AAL atlas which included 116 brain
ROIs. According to Ramanan et al. (2014), cortical ROIs are typi-cally believed to hold the amyloid signals whereas other ROIs holdsimilar amyloid measures across individuals. Thus 39 pairs of bila-teral cortical ROIs (78 in total), from frontal lobe, cingulate, parietallobe, temporal lobe, occiptal lobe, insula and sensory-motor cor-tex, were included in our analysis. Correlation among ∼900 brainlocations were first calculated based on the gene expression pro-file of 15 amyloid candidate genes. Due to many-to-one mappingfrom the brain locations to AAL ROIs, for each ROI, there are morethan one connections, represented by correlations between two brainlocations. Therefore we calculated ROI-level correlations of twoindividuals in five ways: minimum, maximum, mean, standard devi-ation and median. In addition, the ROI correlation structure basedon the combination of both individuals was also generated in thesame way for comparison (see Figure. 1). Clearly, for all five sta-tistics, the pattern remains highly consistent across individuals andtheir combination. For simplicity, in the subsequent analysis, weadopt the brain connectivity matrix generated from the combinationsample using the median statistics (i.e., the panel in the lower rightcorner of Figure. 1). Figure. 2 shows a network visualization of thismatrix, where edges correspond to matrix entries with values ≥ 0.5or ≤ −0.5.
3 METHODSNow we present our KG-SCCA algorithm. We denote vectors asboldface lowercase letters and matrices as boldface uppercase ones.For a given matrix M = (mij), we denote its i-th row and j-thcolumn as mi and mj respectively. Let X = {x1, ..., xn} ⊆ Rp
be the genotype data (SNP) and Y = {y1, ..., yn} ⊆ Rq be theimaging QT data, where n is the number of participants, p and q arethe numbers of SNPs and QTs, respectively.
CCA seeks linear transformations of variables X and Y to ach-ieve the maximal correlation between Xu and Yv, which can beformulated as:
maxu,v
uTXTYv s.t. uTXTXu = 1, vTYTYv = 1 (1)
where u and v are canonical loadings or weights, reflecting thesignificance of each feature in the identified canonical correlation.
Similar to many machine learning algorithms, overfitting couldarise in CCA when the features outnumber the participants. In addi-tion, the CCA outcome could spread nontrivial effects across allthe features rather than only a few significant ones, making theresults difficult to interpret. To address these issues, sparse cano-nical correlation analysis (SCCA) was proposed in (Witten et al.,2009) by introducing penalty terms, P1(u) ≤ c1 and P2(v) ≤ c2,to regularize the weights, as shown in Eq. (2).
maxu,v
uTXTYv
s.t. ||Xu||22 = 1, ||Yv||22 = 1, P1(u) ≤ c1, P2(v) ≤ c2(2)
Here the objective function is bilinear in u and v: when u is fixed,it is linear in v and vice versa. But due to the L2 equality, with uor v fixed, the constraints are not convex. This can be solved byreformulating the L2 equality into inequality as ||Xu||22 ≤ 1 and||Yv||22 ≤ 1. For easy computation, Eq. (2) is commonly rewritten
3

Yan et al
in its Lagrangian form.
maxu,v
uTXTYv− γ12||Xu||22−
γ22||Yv||22−β1P1(u)−β2P2(v) (3)
Witten et al. (2009) and Witten and Tibshirani (2009) exploredtwo penalty forms, L1 penalty and the chain structured fused Lassopenalty. L1 penalty imposes sparsity on both u and v, and assumesthat each canonical correlation involves only a few features from Xand Y. The fused Lasso penalty promotes the smoothness of weightvectors, and encourages neighboring features to be selected toge-ther. To incorporate other structures, group- and network-guidedpenalties were introduced (Chen and Liu, 2012; Chen et al., 2013).As mentioned earlier, most of these methods were designed usingthe soft thresholding technique, which was first proposed to solveLasso problem when the features were independent from each other(Tibshirani, 1996). This condition does not hold in imaging geneticsdata. Thus direct application of those methods into imaging geneticsstudies limits the capability of yielding optimal solutions. Below,we first present our KG-SCCA model and then present an effectiveKG-SCCA algorithm without using the soft thresholding strategy.
Brain has been studied as a complicated network. The SNP datahave structures like LD blocks. Given these prior knowledge, wepropose the following KG-SCCA model by introducing two penaltyterms for genetic loadings u and imaging loading v respectively.
P1 = ||u||G = β1
K1∑k1=1
√ ∑i∈πk1
u2i + θ1||u||1
= β1
K1∑k1=1
||uk1 ||2 + θ1||u||1,
(4)
P2 = ||v||N = β2∑
(i,j)∈Ei<j
τ(wij)||vi − sign(wij)vj ||22 + θ2||v||1
= β2||Cv||22 + θ2||v||1.In penalty P1(u), SNPs are partitioned into K1 groups Π1 ={πk1}
K1k1=1, such that {ui}
mk1i=1 ∈ πk1 , and mk1 is the number of
SNPs in πk1 . While the group term β1K1∑k1=1
||uk1 ||2 helps select all
the SNPs in relevant LD blocks, L1 penalty manages to suppressthose non-signals within selected LD blocks. The P1(u) penalty isessentially the group Lasso penalty applied to the CCA framework.
Penalty P2(v) applies the network-guided constraint to encou-rage the joint selection of “connected” features (i.e., their conne-ctivity matrix entry having a high weight) as well as uses L1 toimpose global sparsity. E is the set of all possible imaging QTpairs and |E| is the total number of QT pairs. C ∈ R|E|×q
is defined as follows. The row of C is indexed by all pairs(i, j) ∈ {(i, j)|i ∈ {1, ..., q} , j ∈ {1, ...q} , i<j}, C(i,j),i = wijand C(i,j),j = sign(wij)wij . τ(wij) provide the fusion effect thatpromotes similarity between vi and vj of related features. In thispaper we use τ(wij) = w2
ij . With sign(wij) we can have posi-tively related features being pulled together and on the other handthe negatively related features being fused with opposite direction.Thus, for strongly connected features with a large fusion effect, theytend to be jointly selected or jointly not selected.
In this work, as mentioned earlier, we formed the group structurefor the SNP data by partitioning them using LD blocks generated
Algorithm 1 Knowledge-Guided SCCA (KG-SCCA)Require:
X = {x1, ..., xn}, Y = {y1, ..., yn}, group and network structuresEnsure:
Canonical vectors u and v.
1: t = 1, Initialize ut ∈ Rp×1, vt ∈ Rq×1;2: while not converge do3: Calculate B1t = 1
γ1Yvt
4: Calculate the block diagonal matrix D1t and D2t;5: ut+1 = (XTX +
β1γ1
D1t +θ1γ1
D2t)−1XTB1t;
6: Scale ut+1 so that uTt+1XTXut+1 = 1;
7: Calculate B2t = 1γ2
Xut+1;8: Calculate the block diagonal matrix D4t;9: vt+1 = (YTY +
β2γ2
D3 +θ2γ2
D4t )−1YTB2t;
10: Scale vt+1 so that vTt+1YTYvt+1 = 1;
11: t = t + 1.12: end while
by HaploView (Barrett, 2009). We formed the network structure forthe amyloid imaging data by constructing amyloid pathway-basedgene co-expression network using AHBA. Since the model couldbe easily extended to estimate multiple canonical variables, we onlyfocus on creating the first pair of canonical variables in this paper.
We now present our algorithm to solve this model without usingsoft thresholding approach. By fixing u and v respectively, we willhave two convex problems shown in Eq. (5).
maxu
uTXTYv− γ12||Xu||22 − β1
K1∑k1=1
||uk1 ||2 − θ1||u||1
maxv
uTXTYv− γ22||Yv||22 −
β22||Cv||22 − θ2||v||1
(5)
Let B1 = 1γ1
Yv and B2 = 1γ2
Xu, the above problems can bereformulated to Eq. (6):
minu
1
2||Xu−B1||22 +
β1γ1
K1∑k1=1
||uk1 ||2 +θ1γ1||u||1
minv
1
2||Yv −B2||22 +
β22γ2||Cv||22 +
θ2γ2||v||1
(6)
Here, while u can be solved by the G-SMuRFS method propo-sed in (Wang et al., 2012), optimization of v can be achieved bythe network-guided L2,1 regression method proposed in (Yan et al.,2013). In both solutions, a smooth approximation has been estima-ted for group L2,1 and L1 terms by including an extremely smallvalue. The solution for u and v in each iteration step is as follows:
u = (XTX +β1γ1
D1 +θ1γ1
D2)−1XTB1,
v = (YTY +β2γ2
D3 +θ2γ2
D4)−1YTB2,
(7)
where D1 is a block diagonal matrix with the k-th diagonal blockas 1‖uk‖F
Ik; Ik is an identity matrix with size of mk; mk is thetotal feature number in group k; D2 is a diagonal matrix with thei-th diagonal element as 1
‖ui‖2; D3 = CTC is a matrix in which
each row integrates all the neighboring relationships (e.g., for thei-th row, it is the sum of all the rows in α whose i-th element is notzero); and D4 is a diagonal matrix with the i-th diagonal element as
4
Transcriptome-Guided Amyloid Imaging Genetics via KG-SCCA
1‖vi‖2
. Algorithm 1 summarizes the KG-SCCA optimization proce-dure. Further details on how to solve for two objectives in Eq. (6) areavailable in (Wang et al., 2012) and (Yan et al., 2013) respectively.
In Algorithm 1, six parameters γ1, γ2, β1, β2, θ1, θ2 need to betuned to control the global sparsity as well as structured group ornetwork constraints. Chen and Liu (2012) studied a similar pro-blem using a different method, and found that their results werequite insensitive to γ1, γ2 settings. Following their observation, weset γ1 and γ2 to 1 for simplicity. Nested cross-validation can beused for parameter selection but will be extremely time consumingfor the remaining 4 parameters. Thus, we followed the strategyproposed in (Lin et al., 2014): Parameters β1, β2 controlling stru-ctural constraints were first tuned without considering sparsity con-straints. Then based on the obtained optimal β1, β2, another nestedcross-validation was performed to acquire the optimal θ1, θ2.
4 EXPERIMENTAL RESULTS AND DISCUSSIONSWe performed comparative studies between the proposed KG-SCCA algorithm and a widely used SCCA implementation in thePMA package (http://cran.r-project.org/web/packages/PMA/) (Wit-ten et al., 2009). For PMA experiments, the SCCA parameters wereautomatically tuned using a permutation scheme provided in PMA.Below we report our empirical results using both synthetic data andreal imaging genetics data.
4.1 Results on Simulation DataSince it was not straightforward to manually construct a data setwith a network structure, we simulated group structures for bothdatasets and then converted them into network structures for onedataset by connecting all the pairs within each group. Synthetic data(n = 200,p = 200,q = 150) with diagonal block structure wasgenerated with the following procedure: 1) Random positive defi-nite covariance matrix M with non-overlapping group structure werecreated, where correlations range from 0.6 to 1 within group and areset to 0 between groups. 2) Data set X with covariance structure Mwas calculated through Cholesky decomposition. 3) Repeat Steps 1and 2 to generate another dataset Y. 4) With assigned canonical loa-dings of X, we calculated the first component Xu. 5) Given a desiredcorrelation between components, we calculated the second compo-nent Yv. 6) For simplicity, in this paper, only one group in Y wasassigned to have signals. Therefore, based on predefined canoni-cal loadings of Y and component Yv, final obtained group signals,added with some white noises (Signal to Noise Ratio (SNR) =0.5),will replace the data in original dataset Y. By repeating this pro-cedure we generated 7 datasets with correlation levels from 0.6 to1. The canonical loadings and group structure remained the sameacross all the datasets.
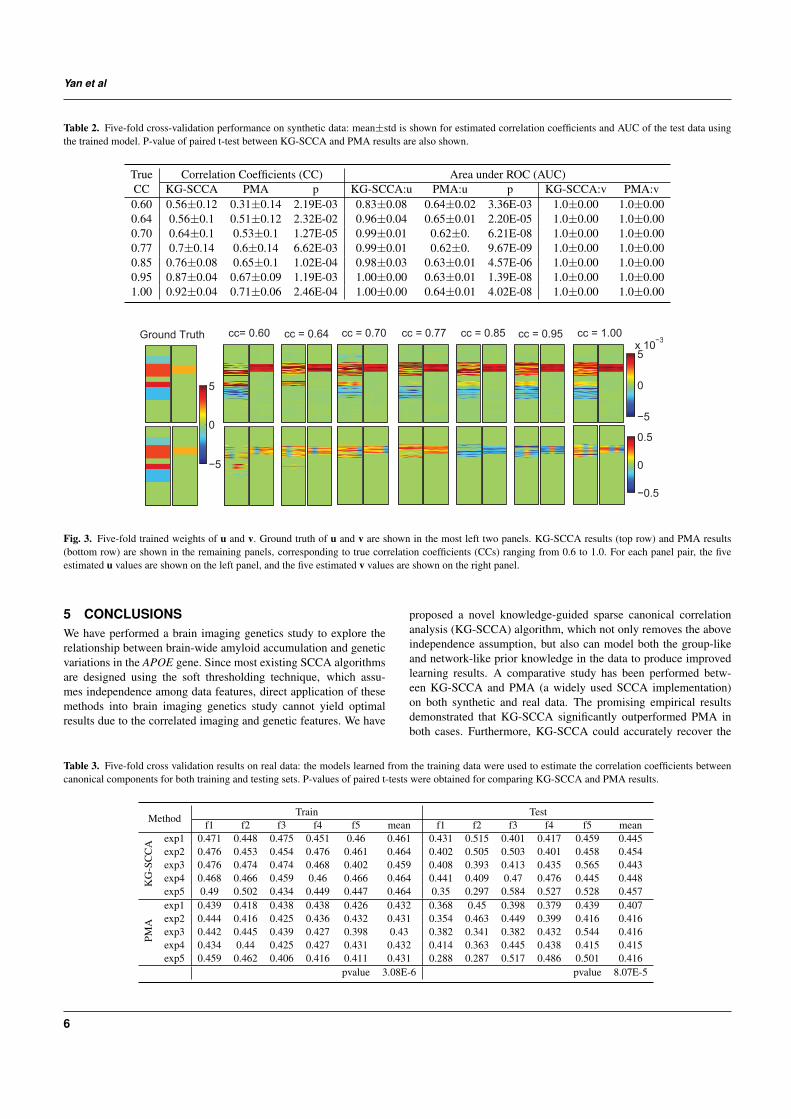
KG-SCCA and PMA have been both tested on all 7 datasets. Allthe regularization parameters were optimally tuned using a grid sea-rch from 10−2 to 102 through nested 5-fold cross-validation, asmentioned before. The true and estimated canonical loadings forboth X and Y were shown in Fig. 3. Due to the difference innormalization and optimization procedure, the weights yielded byKG-SCCA and PMA showed different scales. Yet the overall pro-file of the estimated u and v values from KG-SCCA kept consistentwith the ground truth across the entire range of tested correlation
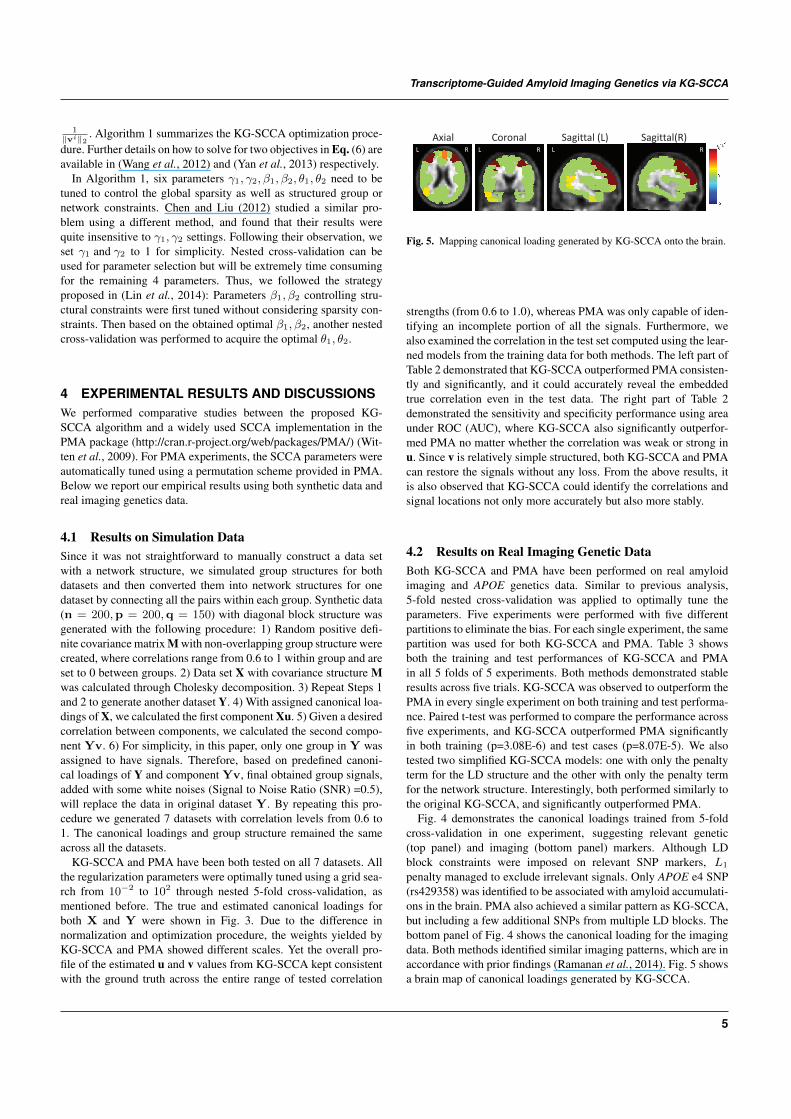
Fig. 5. Mapping canonical loading generated by KG-SCCA onto the brain.
strengths (from 0.6 to 1.0), whereas PMA was only capable of iden-tifying an incomplete portion of all the signals. Furthermore, wealso examined the correlation in the test set computed using the lear-ned models from the training data for both methods. The left part ofTable 2 demonstrated that KG-SCCA outperformed PMA consisten-tly and significantly, and it could accurately reveal the embeddedtrue correlation even in the test data. The right part of Table 2demonstrated the sensitivity and specificity performance using areaunder ROC (AUC), where KG-SCCA also significantly outperfor-med PMA no matter whether the correlation was weak or strong inu. Since v is relatively simple structured, both KG-SCCA and PMAcan restore the signals without any loss. From the above results, itis also observed that KG-SCCA could identify the correlations andsignal locations not only more accurately but also more stably.
4.2 Results on Real Imaging Genetic DataBoth KG-SCCA and PMA have been performed on real amyloidimaging and APOE genetics data. Similar to previous analysis,5-fold nested cross-validation was applied to optimally tune theparameters. Five experiments were performed with five differentpartitions to eliminate the bias. For each single experiment, the samepartition was used for both KG-SCCA and PMA. Table 3 showsboth the training and test performances of KG-SCCA and PMAin all 5 folds of 5 experiments. Both methods demonstrated stableresults across five trials. KG-SCCA was observed to outperform thePMA in every single experiment on both training and test performa-nce. Paired t-test was performed to compare the performance acrossfive experiments, and KG-SCCA outperformed PMA significantlyin both training (p=3.08E-6) and test cases (p=8.07E-5). We alsotested two simplified KG-SCCA models: one with only the penaltyterm for the LD structure and the other with only the penalty termfor the network structure. Interestingly, both performed similarly tothe original KG-SCCA, and significantly outperformed PMA.
Fig. 4 demonstrates the canonical loadings trained from 5-foldcross-validation in one experiment, suggesting relevant genetic(top panel) and imaging (bottom panel) markers. Although LDblock constraints were imposed on relevant SNP markers, L1
penalty managed to exclude irrelevant signals. Only APOE e4 SNP(rs429358) was identified to be associated with amyloid accumulati-ons in the brain. PMA also achieved a similar pattern as KG-SCCA,but including a few additional SNPs from multiple LD blocks. Thebottom panel of Fig. 4 shows the canonical loading for the imagingdata. Both methods identified similar imaging patterns, which are inaccordance with prior findings (Ramanan et al., 2014). Fig. 5 showsa brain map of canonical loadings generated by KG-SCCA.
5
Yan et al
Table 2. Five-fold cross-validation performance on synthetic data: mean±std is shown for estimated correlation coefficients and AUC of the test data usingthe trained model. P-value of paired t-test between KG-SCCA and PMA results are also shown.
True Correlation Coefficients (CC) Area under ROC (AUC)CC KG-SCCA PMA p KG-SCCA:u PMA:u p KG-SCCA:v PMA:v0.60 0.56±0.12 0.31±0.14 2.19E-03 0.83±0.08 0.64±0.02 3.36E-03 1.0±0.00 1.0±0.000.64 0.56±0.1 0.51±0.12 2.32E-02 0.96±0.04 0.65±0.01 2.20E-05 1.0±0.00 1.0±0.000.70 0.64±0.1 0.53±0.1 1.27E-05 0.99±0.01 0.62±0. 6.21E-08 1.0±0.00 1.0±0.000.77 0.7±0.14 0.6±0.14 6.62E-03 0.99±0.01 0.62±0. 9.67E-09 1.0±0.00 1.0±0.000.85 0.76±0.08 0.65±0.1 1.02E-04 0.98±0.03 0.63±0.01 4.57E-06 1.0±0.00 1.0±0.000.95 0.87±0.04 0.67±0.09 1.19E-03 1.00±0.00 0.63±0.01 1.39E-08 1.0±0.00 1.0±0.001.00 0.92±0.04 0.71±0.06 2.46E-04 1.00±0.00 0.64±0.01 4.02E-08 1.0±0.00 1.0±0.00
Ground Truth cc= 0.60 cc = 0.64 cc = 0.70 cc = 0.77 cc = 0.85 cc = 0.95 cc = 1.00
−5
0
5
−5
0
5x 10
−3
−0.5
0
0.5
Fig. 3. Five-fold trained weights of u and v. Ground truth of u and v are shown in the most left two panels. KG-SCCA results (top row) and PMA results(bottom row) are shown in the remaining panels, corresponding to true correlation coefficients (CCs) ranging from 0.6 to 1.0. For each panel pair, the fiveestimated u values are shown on the left panel, and the five estimated v values are shown on the right panel.
5 CONCLUSIONSWe have performed a brain imaging genetics study to explore therelationship between brain-wide amyloid accumulation and geneticvariations in the APOE gene. Since most existing SCCA algorithmsare designed using the soft thresholding technique, which assu-mes independence among data features, direct application of thesemethods into brain imaging genetics study cannot yield optimalresults due to the correlated imaging and genetic features. We have
proposed a novel knowledge-guided sparse canonical correlationanalysis (KG-SCCA) algorithm, which not only removes the aboveindependence assumption, but also can model both the group-likeand network-like prior knowledge in the data to produce improvedlearning results. A comparative study has been performed betw-een KG-SCCA and PMA (a widely used SCCA implementation)on both synthetic and real data. The promising empirical resultsdemonstrated that KG-SCCA significantly outperformed PMA inboth cases. Furthermore, KG-SCCA could accurately recover the
Table 3. Five-fold cross validation results on real data: the models learned from the training data were used to estimate the correlation coefficients betweencanonical components for both training and testing sets. P-values of paired t-tests were obtained for comparing KG-SCCA and PMA results.
MethodTrain Test
f1 f2 f3 f4 f5 mean f1 f2 f3 f4 f5 mean
KG
-SC
CA exp1 0.471 0.448 0.475 0.451 0.46 0.461 0.431 0.515 0.401 0.417 0.459 0.445
exp2 0.476 0.453 0.454 0.476 0.461 0.464 0.402 0.505 0.503 0.401 0.458 0.454exp3 0.476 0.474 0.474 0.468 0.402 0.459 0.408 0.393 0.413 0.435 0.565 0.443exp4 0.468 0.466 0.459 0.46 0.466 0.464 0.441 0.409 0.47 0.476 0.445 0.448exp5 0.49 0.502 0.434 0.449 0.447 0.464 0.35 0.297 0.584 0.527 0.528 0.457
PMA
exp1 0.439 0.418 0.438 0.438 0.426 0.432 0.368 0.45 0.398 0.379 0.439 0.407exp2 0.444 0.416 0.425 0.436 0.432 0.431 0.354 0.463 0.449 0.399 0.416 0.416exp3 0.442 0.445 0.439 0.427 0.398 0.43 0.382 0.341 0.382 0.432 0.544 0.416exp4 0.434 0.44 0.425 0.427 0.431 0.432 0.414 0.363 0.445 0.438 0.415 0.415exp5 0.459 0.462 0.406 0.416 0.411 0.431 0.288 0.287 0.517 0.486 0.501 0.416
pvalue 3.08E-6 pvalue 8.07E-5
6
Transcriptome-Guided Amyloid Imaging Genetics via KG-SCCA
Fig. 4. Five-fold trained weights of u (top panel) and v (bottom panel). KG-SCCA results and PMA results are shown for each panel. For each of KG-SCCAand PMA imaging results (i.e., the bottom panel), the top and bottom rows correspond to left and right hemispheres respectively.
true signals from the synthetic data, as well as yield improved cano-nical correlation performances and biologically meaningful findingsfrom real data. This study is an initial attempt to remove the fea-ture independence assumption many existing SCCA methods have.The empirical studies designed here are targeted to identify rela-tively clean and simple multi-SNP-multi-QT correlations. Givenonly 58 SNPs analyzed here, this work is not a demonstration ofa genome-wide analysis. Comparison with other complex SCCAmodels, building scalable KG-SCCA models, and applications tomore complex imaging genetic tasks warrant further investigation.
ACKNOWLEDGEMENTThis work was supported by the National Institutes of Health [R01LM011360 to L.S. and A.S., U01 AG024904 to M.W. and A.S., RC2AG036535 to M.W. and A.S., R01 AG19771 to A.S., P30 AG10133to A.S.], and the National Science Foundation [IIS-1117335 to L.S.]at IU; by the National Science Foundation IIS-1117965 to H.H.,IIS-1302675 to H.H., IIS-1344152 to H.H., DBI-1356628 to H.H.]at UTA; and by the National Institutes of Health [R01 LM011360to J.M., R01 LM009012 to J.M., R01 LM010098 to J.M.] atDartmouth. Detailed ADNI Acknowledgements information is avai-lable in http://adni.loni.usc.edu/wp-content/uploads/how to apply/ADNI Manuscript Citations.pdf.
REFERENCESBarrett, J. C. (2009). Haploview: Visualization and analysis of snp genotype data. Cold
Spring Harb Protoc, 2009(10), pdb ip71.Chen, J. et al. (2013). Structure-constrained sparse canonical correlation analysis with
an application to microbiome data analysis. Biostatistics, 14(2), 244–258.Chen, X. and Liu, H. (2012). An efficient optimization algorithm for structured sparse
cca, with applications to eqtl mapping. Statistics in Bioscience, 4(1), 3–26.Chi, E., Allen, G., et al. (2013). Imaging genetics via sparse canonical correlation
analysis. In Biomedical Imaging (ISBI), 2013 IEEE 10th Int Sym on, pages 740–743.Hibar, D. P., Kohannim, O., et al. (2011). Multilocus genetic analysis of brain images.
Front Genet, 2, 73.Jagust, W. J., Bandy, D., et al. (2010). The Alzheimer’s Disease Neuroimaging
Initiative positron emission tomography core. Alzheimers Dement, 6(3), 221–9.Lin, D. et al. (2014). Correspondence between fMRI and SNP data by group sparse
canonical correlation analysis. Medical Image Analysis, 18(6), 891 – 902.Ramanan, V. K., Risacher, S. L., et al. (2014). APOE and BCHE as modulators of
cerebral amyloid deposition: a florbetapir PET genome-wide association study. MolPsychiatry, 19(3), 351–7.
Shen, L., Kim, S., et al. (2010). Whole genome association study of brain-wide imagingphenotypes for identifying quantitative trait loci in MCI and AD: A study of theADNI cohort. Neuroimage, 53(3), 1051–63.
Swaminathan, S., Shen, L., et al. (2012). Amyloid pathway-based candidate geneanalysis of [(11)C]PiB-PET in the Alzheimer’s Disease Neuroimaging Initiative(ADNI) cohort. Brain Imaging Behav, 6(1), 1–15.
Tibshirani, R. (1996). Regression shrinkage and selection via the lasso. Journal of theRoyal Statistical Society. Series B (Methodological), 58(1), 267–288.
Vounou, M., Nichols, T. E., and Montana, G. (2010). Discovering genetic associationswith high-dimensional neuroimaging phenotypes: A sparse reduced-rank regressionapproach. NeuroImage, 53(3), 1147–59.
Wan, J., Kim, S., et al. (2011). Hippocampal surface mapping of genetic risk factors inAD via sparse learning models. MICCAI, 14(Pt 2), 376–83.
Wang, H., Nie, F., et al. (2012). Identifying quantitative trait loci via group-sparsemultitask regression and feature selection: an imaging genetics study of the ADNIcohort. Bioinformatics, 28(2), 229–237.
7

Yan et al
Witten, D. M. and Tibshirani, R. J. (2009). Extensions of sparse canonical correlationanalysis with applications to genomic data. Stat Appl Genet Mol Biol, 8, Article28.
Witten, D. M., Tibshirani, R., and Hastie, T. (2009). A penalized matrix decomposition,with applications to sparse principal components and canonical correlation analysis.Biostatistics, 10(3), 515–34.
Yan, J., Huang, H., et al. (2013). Network-guided sparse learning for predictingcognitive outcomes from mri measures. In MBIA, LNCS 8159, pages 150–158.
Zeng, H. et al. (2012). Large-scale cellular-resolution gene profiling in humanneocortex reveals species-specific molecular signatures. Cell, 149(2), 483–96.
8