Trace elements and cathodoluminescence of quartz in stockwork veins of Mongolian porphyry-style...
21
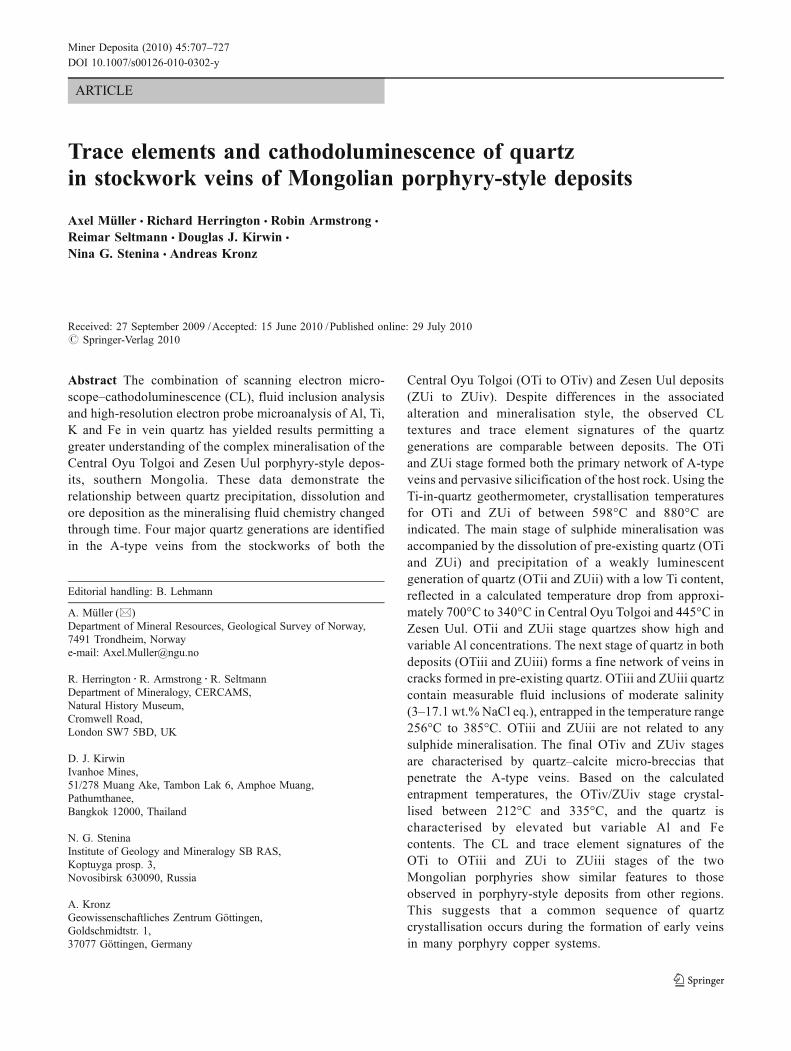
ARTICLE Trace elements and cathodoluminescence of quartz in stockwork veins of Mongolian porphyry-style deposits Axel Müller & Richard Herrington & Robin Armstrong & Reimar Seltmann & Douglas J. Kirwin & Nina G. Stenina & Andreas Kronz Received: 27 September 2009 / Accepted: 15 June 2010 / Published online: 29 July 2010 # Springer-Verlag 2010 Abstract The combination of scanning electron micro- scope–cathodoluminescence (CL), fluid inclusion analysis and high-resolution electron probe microanalysis of Al, Ti, K and Fe in vein quartz has yielded results permitting a greater understanding of the complex mineralisation of the Central Oyu Tolgoi and Zesen Uul porphyry-style depos- its, southern Mongolia. These data demonstrate the relationship between quartz precipitation, dissolution and ore deposition as the mineralising fluid chemistry changed through time. Four major quartz generations are identified in the A-type veins from the stockworks of both the Central Oyu Tolgoi (OTi to OTiv) and Zesen Uul deposits (ZUi to ZUiv). Despite differences in the associated alteration and mineralisation style, the observed CL textures and trace element signatures of the quartz generations are comparable between deposits. The OTi and ZUi stage formed both the primary network of A-type veins and pervasive silicification of the host rock. Using the Ti-in-quartz geothermometer, crystallisation temperatures for OTi and ZUi of between 598°C and 880°C are indicated. The main stage of sulphide mineralisation was accompanied by the dissolution of pre-existing quartz (OTi and ZUi) and precipitation of a weakly luminescent generation of quartz (OTii and ZUii) with a low Ti content, reflected in a calculated temperature drop from approxi- mately 700°C to 340°C in Central Oyu Tolgoi and 445°C in Zesen Uul. OTii and ZUii stage quartzes show high and variable Al concentrations. The next stage of quartz in both deposits (OTiii and ZUiii) forms a fine network of veins in cracks formed in pre-existing quartz. OTiii and ZUiii quartz contain measurable fluid inclusions of moderate salinity (3–17.1 wt.% NaCl eq.), entrapped in the temperature range 256°C to 385°C. OTiii and ZUiii are not related to any sulphide mineralisation. The final OTiv and ZUiv stages are characterised by quartz–calcite micro-breccias that penetrate the A-type veins. Based on the calculated entrapment temperatures, the OTiv/ZUiv stage crystal- lised between 212°C and 335°C, and the quartz is characterised by elevated but variable Al and Fe contents. The CL and trace element signatures of the OTi to OTiii and ZUi to ZUiii stages of the two Mongolian porphyries show similar features to those observed in porphyry-style deposits from other regions. This suggests that a common sequence of quartz crystallisation occurs during the formation of early veins in many porphyry copper systems. Editorial handling: B. Lehmann A. Müller (*) Department of Mineral Resources, Geological Survey of Norway, 7491 Trondheim, Norway e-mail: [email protected] R. Herrington : R. Armstrong : R. Seltmann Department of Mineralogy, CERCAMS, Natural History Museum, Cromwell Road, London SW7 5BD, UK D. J. Kirwin Ivanhoe Mines, 51/278 Muang Ake, Tambon Lak 6, Amphoe Muang, Pathumthanee, Bangkok 12000, Thailand N. G. Stenina Institute of Geology and Mineralogy SB RAS, Koptuyga prosp. 3, Novosibirsk 630090, Russia A. Kronz Geowissenschaftliches Zentrum Göttingen, Goldschmidtstr. 1, 37077 Göttingen, Germany Miner Deposita (2010) 45:707–727 DOI 10.1007/s00126-010-0302-y
-
Upload
independent -
Category
Documents
-
view
1 -
download
0
Transcript of Trace elements and cathodoluminescence of quartz in stockwork veins of Mongolian porphyry-style...
ARTICLE
Trace elements and cathodoluminescence of quartzin stockwork veins of Mongolian porphyry-style deposits
Axel Müller & Richard Herrington & Robin Armstrong &
Reimar Seltmann & Douglas J. Kirwin &
Nina G. Stenina & Andreas Kronz
Received: 27 September 2009 /Accepted: 15 June 2010 /Published online: 29 July 2010# Springer-Verlag 2010
Abstract The combination of scanning electron micro-scope–cathodoluminescence (CL), fluid inclusion analysisand high-resolution electron probe microanalysis of Al, Ti,K and Fe in vein quartz has yielded results permitting agreater understanding of the complex mineralisation of theCentral Oyu Tolgoi and Zesen Uul porphyry-style depos-its, southern Mongolia. These data demonstrate therelationship between quartz precipitation, dissolution andore deposition as the mineralising fluid chemistry changedthrough time. Four major quartz generations are identifiedin the A-type veins from the stockworks of both the
Central Oyu Tolgoi (OTi to OTiv) and Zesen Uul deposits(ZUi to ZUiv). Despite differences in the associatedalteration and mineralisation style, the observed CLtextures and trace element signatures of the quartzgenerations are comparable between deposits. The OTiand ZUi stage formed both the primary network of A-typeveins and pervasive silicification of the host rock. Using theTi-in-quartz geothermometer, crystallisation temperaturesfor OTi and ZUi of between 598°C and 880°C areindicated. The main stage of sulphide mineralisation wasaccompanied by the dissolution of pre-existing quartz (OTiand ZUi) and precipitation of a weakly luminescentgeneration of quartz (OTii and ZUii) with a low Ti content,reflected in a calculated temperature drop from approxi-mately 700°C to 340°C in Central Oyu Tolgoi and 445°C inZesen Uul. OTii and ZUii stage quartzes show high andvariable Al concentrations. The next stage of quartz in bothdeposits (OTiii and ZUiii) forms a fine network of veins incracks formed in pre-existing quartz. OTiii and ZUiii quartzcontain measurable fluid inclusions of moderate salinity(3–17.1 wt.% NaCl eq.), entrapped in the temperature range256°C to 385°C. OTiii and ZUiii are not related to anysulphide mineralisation. The final OTiv and ZUiv stagesare characterised by quartz–calcite micro-breccias thatpenetrate the A-type veins. Based on the calculatedentrapment temperatures, the OTiv/ZUiv stage crystal-lised between 212°C and 335°C, and the quartz ischaracterised by elevated but variable Al and Fecontents. The CL and trace element signatures of theOTi to OTiii and ZUi to ZUiii stages of the twoMongolian porphyries show similar features to thoseobserved in porphyry-style deposits from other regions.This suggests that a common sequence of quartzcrystallisation occurs during the formation of early veinsin many porphyry copper systems.
Editorial handling: B. Lehmann
A. Müller (*)Department of Mineral Resources, Geological Survey of Norway,7491 Trondheim, Norwaye-mail: [email protected]
R. Herrington : R. Armstrong : R. SeltmannDepartment of Mineralogy, CERCAMS,Natural History Museum,Cromwell Road,London SW7 5BD, UK
D. J. KirwinIvanhoe Mines,51/278 Muang Ake, Tambon Lak 6, Amphoe Muang,Pathumthanee,Bangkok 12000, Thailand
N. G. SteninaInstitute of Geology and Mineralogy SB RAS,Koptuyga prosp. 3,Novosibirsk 630090, Russia
A. KronzGeowissenschaftliches Zentrum Göttingen,Goldschmidtstr. 1,37077 Göttingen, Germany
Miner Deposita (2010) 45:707–727DOI 10.1007/s00126-010-0302-y
Keywords Copper porphyry . Quartz .
Cathodoluminescence . Fluid inclusion . Trace elements .
Mongolia
Introduction
Hypogene porphyry-style mineralisation is characterised bystockwork-hosted and disseminated sulphides that aretemporally and spatially related to the shallow (2–5 km)emplacement of magmas of intermediate to acidic compo-sition. The complexity of quartz veining in porphyry-styledeposit stockworks arises from the repeated precipitationand dissolution of quartz formed from episodicallyexsolved magmatic volatile phases (MVP) derived fromsubvolcanic intrusions (e.g. Hedenquist and Lowenstern1994; Bodnar 1995; Candela and Piccoli 1995; Harris andGolding 2002). Porphyry systems are typified by multiplestages of intrusion accompanied by numerous episodes ofMVP exsolution, resulting in repeated overprinting mineralis-ing events formed under differing physicochemical conditions(e.g. Guilbert and Lowell 1974; Carten et al. 1988; Fournier1999; Proffett 2003; Harris et al. 2003; Seedorff et al. 2005).One result of this is a complex succession of quartzcrystallisation, deformation and healing observed in thestockwork zones. In order to better classify the spatial andtemporal relationships of stockwork veining and associatedalteration, Gustafson and Hunt (1975) introduced classes ofveins termed A (early), B (transitional) and D (late) stage.The scheme was extended by Dilles and Einaudi (1992) toinclude a late C-type vein and by Arancibia and Clark (1996)to include an early M-type vein. Early A-veins are defined asirregular (wispy-looking), discontinuous and segmentedveins of quartz ± bornite ± chalcopyrite ± anhydriteassociated with a potassic alteration assemblage of K-feldspar and biotite (Gustafson and Hunt 1975). However,recent studies revealed that A-veins are commonly multi-generational with superimposed quartz generations that canbe related to B, C and D type events (e.g. Rusk and Reed2002; Müller et al. 2003; Rusk et al. 2006, 2008a).
The aim of the study is to better understand theevolutionary sequence of quartz crystallisation associatedmineralisations of A-type and other associated veins of thelate Devonian Central Oyu Tolgoi and early CarboniferousZesen Uul porphyry copper deposits in the south Gobiregion of Mongolia (Figs. 1 and 2). There classic A-typeveins are developed in porphyry stockworks, but they havebeen overprinted by multiple syn- and post-mineralisationevents.
Cathodoluminescence (CL) imaging was used to estab-lish quartz generations and relative chronology. Electronprobe microanalysis (EPMA) was then used to determinequartz trace element chemistry (specifically Al, K, Ti and
Fe). The variation in the distributions of these traceelements in quartz reflects changes in the P-T-X con-ditions of the quartz-depositing fluids (e.g. Wark andWatson 2006; Rusk et al. 2006, 2008a); thus, a systematicanalysis of trace element contents can be used to interpretconditions of crystal growth. The use of backscatteredelectron (BSE) imaging helped to establish the parage-netic relationships between ore mineral assemblages anddifferent quartz generations. Finally, fluid inclusionmicrothermometry was carried out on recognized quartzgenerations. The occurrence of fine-grained ore mineralinclusions within the quartz was also able to providedirect evidence for the genetic relationship between oreminerals and quartz (Wilkinson 2001).
This use of combined methods was essential becausepreserved and measurable fluid inclusions are rare in theveins. The rarity of measurable fluid inclusions is presumedto be due to the age of the two investigated Mongolianporphyries (ca. 370 and 330 Ma, respectively; Seltmannand Porter 2005) as the entire rock package has sufferedintense regional post-mineralisation folding (Wainwright etal. 2004). However, a few notable, well-preserved fluidinclusions were measured and these supplied supportingevidence for the precipitation temperatures of the latequartz generations.
Geology of deposits
The Central Oyu Tolgoi and Zesen Uul deposits arelocated respectively 600 and 500 km south of UlaanBaatar. Both deposits are hosted in the GurvansayhanTerrane (Fig. 1), which is located in the central-southernsection of the Kazakh–Mongol magmatic arc where ittrends roughly east–west (Gerel 1995, 1998; Jargalsaihan1996; Badarch et al. 2002; Fig. 1). The geology of the600×200-km triangular-shaped terrane is dominated bySilurian to Carboniferous clastic sedimentary rocks,carbonates, volcaniclastic sedimentary rocks and interme-diate to felsic volcanic rocks. This sequence is cut by asuite of Devonian granitoids and by Permo-Carboniferousdiorite, monzodiorite, granite, granodiorite and syenitebodies. The Permo-Carboniferous intrusions range in sizefrom narrow dykes to batholiths that are tens of kilometresacross (Perelló et al. 2001; Badarch et al. 2002). Theoriginal architecture of the sequence and the magmatic archave been disrupted by later intrusive masses, modified byboth mid- to late Palaeozoic accretion and Mesozoic thrustand sinistral strike-slip faulting and lastly masked byalluvium deposited on a mature erosional surface. This hasresulted in the current outcrop pattern of a complexsequence of imbricate thrust sheets, dismembered blocksand high strain zones (Badarch et al. 2002).
708 Miner Deposita (2010) 45:707–727
Central Oyu Tolgoi
The Central Oyu Tolgoi deposit is one of four discretemineralised zones in the Oyu Tolgoi exploration area,which are interpreted to constitute four separate porphyrycopper centres (Forster et al. 2003; Kirwin et al. 2003,
2005a; Khashgerel et al. 2008; Fig. 3a). These mineralisedcentres formed at 370 Ma and are among the largest andrichest known hypogene Cu–Au deposits in the world. Thegeology at Central Oyu Tolgoi is dominated by a Silurian–Devonian sequence of andesitic and basaltic lavas interbeddedwith fine- to coarse-grained, volcaniclastic sedimentary rocks(Perelló et al. 2001). The tentative hard rock stratigraphy is,from youngest to oldest: (1) dacite flow units, (2) basaltictuff and flow units, (3) upper sedimentary sequence, (4)lower sedimentary sequence, (5) dacitic pyroclastic units, (6)augite basalt flow and related breccias and (7) andesiticvolcaniclastic units (Ivanhoe Mines 2008). The sequence iscrosscut by variably altered and mineralised porphyriticquartz monzodiorite dykes that are genetically related to theCu–Au porphyry systems (Ivanhoe Mines 2008). Post-mineralisation syenitic granitoids and dykes of basalt,rhyolite and hornblende-biotite andesite occur throughoutthe district.
The Central Oyu Tolgoi deposit comprises a highsulphidation system developed above and partly telescopedonto an underlying centre of porphyry mineralisation(Fig. 3b). It consists of a multi-phase hydrothermal brecciacrosscutting an altered fine-grained quartz monzodiorite withporphyry-type alteration and mineralisation (Perelló et al.2001). Covellite and pyrite are developed within anupwardly flared zone of intense quartz–muscovitealteration with subordinate alunite, dickite and pyrophyl-lite (advanced argillic alteration; Forster et al. 2003). Inaddition, a supergene enriched chalcocite blanket andcopper oxide mineralisation some 20–60 m thick ispresent at depths varying from near surface to 150 m,which has been superimposed on the high sulphidationcovellite–pyrite mineralisation (Ivanhoe Mines 2008). Thechalcocite blanket occupies an area 1,300×600 m (Perelló
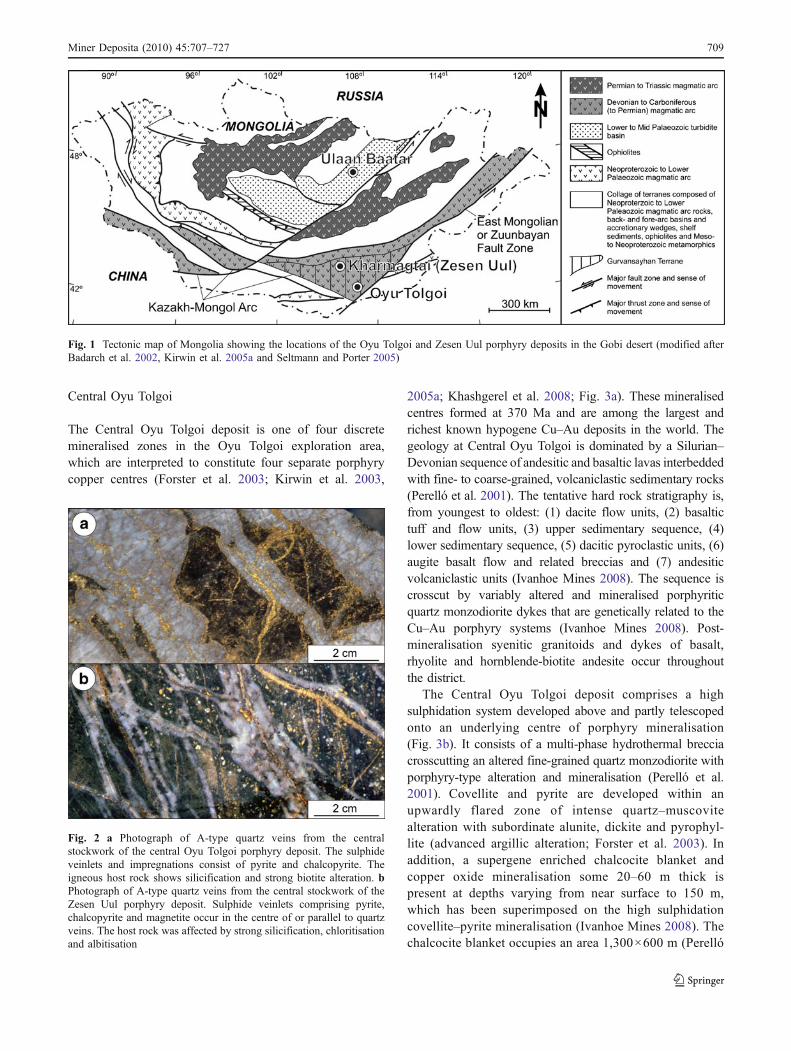
Fig. 2 a Photograph of A-type quartz veins from the centralstockwork of the central Oyu Tolgoi porphyry deposit. The sulphideveinlets and impregnations consist of pyrite and chalcopyrite. Theigneous host rock shows silicification and strong biotite alteration. bPhotograph of A-type quartz veins from the central stockwork of theZesen Uul porphyry deposit. Sulphide veinlets comprising pyrite,chalcopyrite and magnetite occur in the centre of or parallel to quartzveins. The host rock was affected by strong silicification, chloritisationand albitisation
Fig. 1 Tectonic map of Mongolia showing the locations of the Oyu Tolgoi and Zesen Uul porphyry deposits in the Gobi desert (modified afterBadarch et al. 2002, Kirwin et al. 2005a and Seltmann and Porter 2005)
Miner Deposita (2010) 45:707–727 709
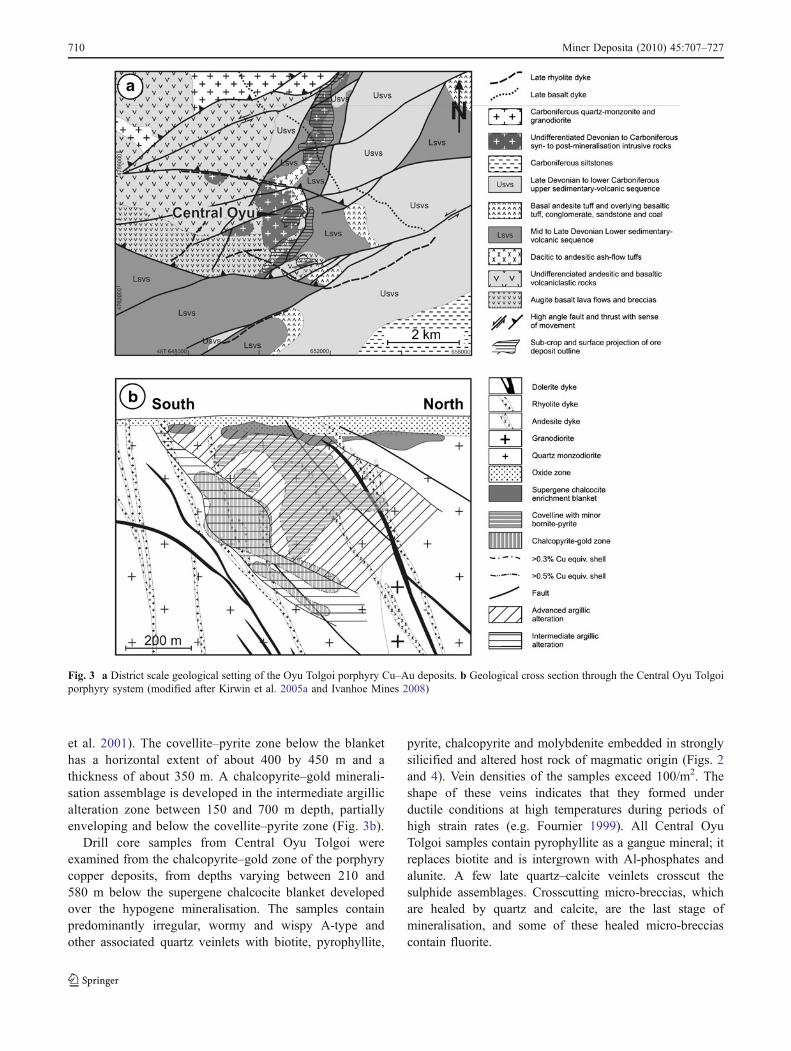
et al. 2001). The covellite–pyrite zone below the blankethas a horizontal extent of about 400 by 450 m and athickness of about 350 m. A chalcopyrite–gold minerali-sation assemblage is developed in the intermediate argillicalteration zone between 150 and 700 m depth, partiallyenveloping and below the covellite–pyrite zone (Fig. 3b).
Drill core samples from Central Oyu Tolgoi wereexamined from the chalcopyrite–gold zone of the porphyrycopper deposits, from depths varying between 210 and580 m below the supergene chalcocite blanket developedover the hypogene mineralisation. The samples containpredominantly irregular, wormy and wispy A-type andother associated quartz veinlets with biotite, pyrophyllite,
pyrite, chalcopyrite and molybdenite embedded in stronglysilicified and altered host rock of magmatic origin (Figs. 2and 4). Vein densities of the samples exceed 100/m2. Theshape of these veins indicates that they formed underductile conditions at high temperatures during periods ofhigh strain rates (e.g. Fournier 1999). All Central OyuTolgoi samples contain pyrophyllite as a gangue mineral; itreplaces biotite and is intergrown with Al-phosphates andalunite. A few late quartz–calcite veinlets crosscut thesulphide assemblages. Crosscutting micro-breccias, whichare healed by quartz and calcite, are the last stage ofmineralisation, and some of these healed micro-brecciascontain fluorite.
Fig. 3 a District scale geological setting of the Oyu Tolgoi porphyry Cu–Au deposits. b Geological cross section through the Central Oyu Tolgoiporphyry system (modified after Kirwin et al. 2005a and Ivanhoe Mines 2008)
710 Miner Deposita (2010) 45:707–727
Zesen Uul
Zesen Uul is one of four recognized gold–copper depositsin the Kharmagtai district (Fig. 5a). The Kharmagtaiexploration area is characterised by several high-grade,porphyry-hosted (monzodiorite) gold and copper mineraldeposits similar in style to the high-grade zones at theSouth West Oyu Tolgoi area (Kirwin et al. 2003, 2005a).The Kharmagtai area contains a Devonian siliciclasticsedimentary sequence that has been intruded by a numberof monzodiorite and diorite porphyry stocks (Kirwin et al.2005b). The inferred primary mineralogy of these intrusiverocks is consistent with a normal K-calc alkaline magmaticassociation. Arenaceous volcaniclastic units are composedof andesitic lava fragments and plagioclase and hornblendecrystals. Felsic ash crystal tuffs, reworked tuffaceous
sedimentary rocks, basaltic and andesitic volcanics havealso been mapped at Zesen Uul. Numerous tourmalinebreccia pipes are scattered throughout the district, thelargest of which has a diameter of 500 m (Kirwin et al.2005b).
The surface expression of copper mineralisation at ZesenUul is sparse, comprising a few subcrops of microdioritehosting rare quartz veins with traces of malachite andcopper wad (Kirwin et al. 2005b). The near surfacedimensions of the mineralised zone are approximately200×200 m. A drill section through the central part ofZesen Uul is illustrated in Fig. 5b. The copper mineralisa-tion occurs mainly as chalcopyrite with subordinateassociated pyrite in and around stockwork quartz veinsmostly hosted by monzodiorite. Mineralisation has beenoxidized with development of a supergene zone extendingto depths of 60 m below the surface.
The early A-type and associated veins hosting thesulphides are more planar than at Central Oyu Tolgoi, moretypical of stockwork veins found in porphyry depositselsewhere (e.g. Proffett 2003; Fig. 2b). The veins heredisplay distinct sulphide zones commonly in the centre ofthe quartz veins. There is a close correlation between thedensity of quartz veins and the tenor of copper–goldmineralisation. Some later chalcopyrite-rich sulphide veinspostdate the quartz stockwork event (Kirwin et al. 2005b).Magnetite occurs both in pre-sulphide quartz veins andwithin the sulphide-rich veins. The gold is found to bemainly hosted in chalcopyrite (Pollard and Taylor 2002)which commonly contains secondary micro-inclusions ofsilver tellurides, bismuthinite and native silver. Sometourmaline is associated with these copper-bearing quartzveins; however, most occurs associated with later pyrite-only
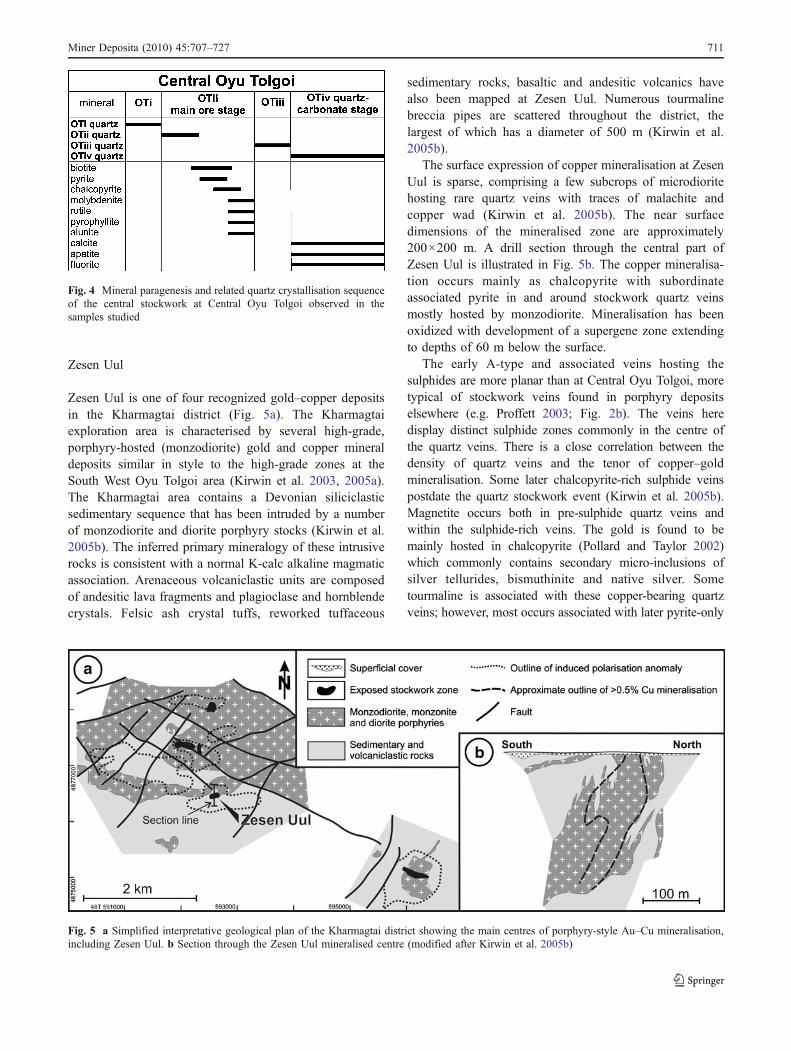
Fig. 4 Mineral paragenesis and related quartz crystallisation sequenceof the central stockwork at Central Oyu Tolgoi observed in thesamples studied
Fig. 5 a Simplified interpretative geological plan of the Kharmagtai district showing the main centres of porphyry-style Au–Cu mineralisation,including Zesen Uul. b Section through the Zesen Uul mineralised centre (modified after Kirwin et al. 2005b)
Miner Deposita (2010) 45:707–727 711
veins. Narrow zones (normally <10 m in width) ofhydrothermal tourmaline breccias contain quartz-veinedmonzodiorite clasts in a matrix of quartz, tourmaline, sericite,pyrite and minor chalcopyrite. Other tourmaline breccias inthe deposits are not accompanied by matrix sulphides(Kirwin et al. 2005a). Chalcopyrite and pyrite are overgrownby covellite, and the latter one is related to intense quartz–calcite veining.
Pervasive, selective potassic alteration of the rocksresulted in the limited textural destruction of the primaryporphyritic texture leaving a mineral assemblage of quartz–albite–chlorite–magnetite–pyrite. However, in the mostintensely potassic-altered zones, K-feldspar is commonand the textural destruction is almost complete. Propyliticor phyllic alteration commonly overprints the precursorpotassic assemblages.
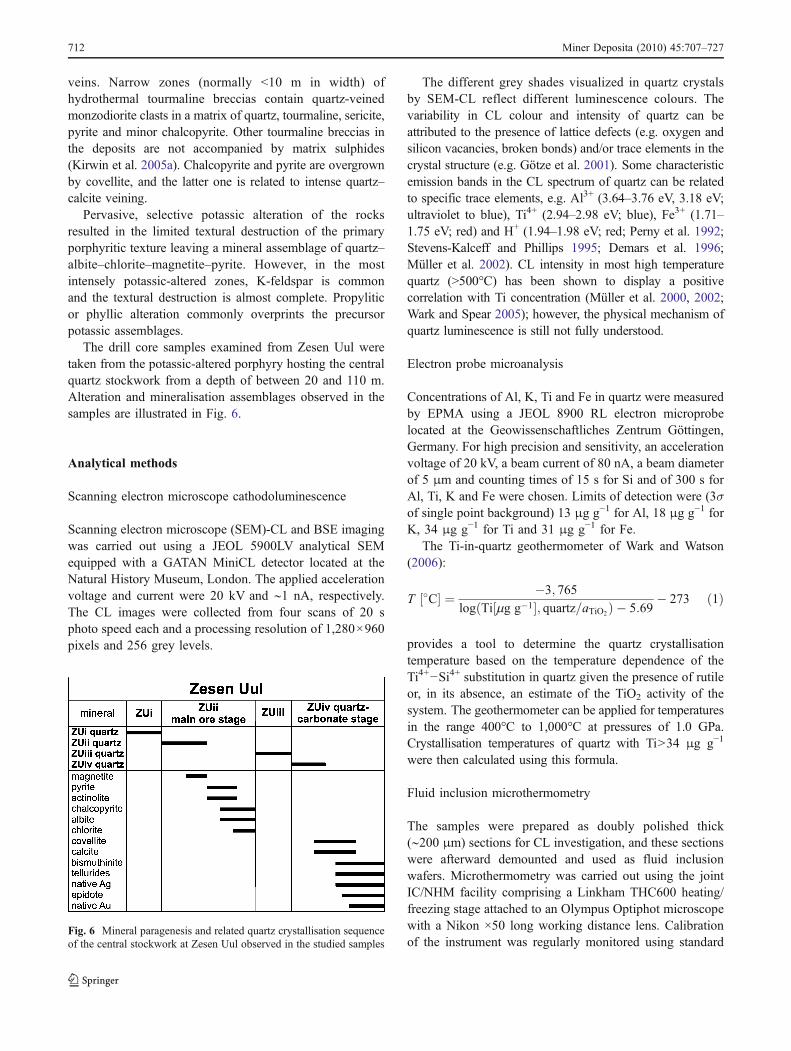
The drill core samples examined from Zesen Uul weretaken from the potassic-altered porphyry hosting the centralquartz stockwork from a depth of between 20 and 110 m.Alteration and mineralisation assemblages observed in thesamples are illustrated in Fig. 6.
Analytical methods
Scanning electron microscope cathodoluminescence
Scanning electron microscope (SEM)-CL and BSE imagingwas carried out using a JEOL 5900LV analytical SEMequipped with a GATAN MiniCL detector located at theNatural History Museum, London. The applied accelerationvoltage and current were 20 kV and ∼1 nA, respectively.The CL images were collected from four scans of 20 sphoto speed each and a processing resolution of 1,280×960pixels and 256 grey levels.
The different grey shades visualized in quartz crystalsby SEM-CL reflect different luminescence colours. Thevariability in CL colour and intensity of quartz can beattributed to the presence of lattice defects (e.g. oxygen andsilicon vacancies, broken bonds) and/or trace elements in thecrystal structure (e.g. Götze et al. 2001). Some characteristicemission bands in the CL spectrum of quartz can be relatedto specific trace elements, e.g. Al3+ (3.64–3.76 eV, 3.18 eV;ultraviolet to blue), Ti4+ (2.94–2.98 eV; blue), Fe3+ (1.71–1.75 eV; red) and H+ (1.94–1.98 eV; red; Perny et al. 1992;Stevens-Kalceff and Phillips 1995; Demars et al. 1996;Müller et al. 2002). CL intensity in most high temperaturequartz (>500°C) has been shown to display a positivecorrelation with Ti concentration (Müller et al. 2000, 2002;Wark and Spear 2005); however, the physical mechanism ofquartz luminescence is still not fully understood.
Electron probe microanalysis
Concentrations of Al, K, Ti and Fe in quartz were measuredby EPMA using a JEOL 8900 RL electron microprobelocated at the Geowissenschaftliches Zentrum Göttingen,Germany. For high precision and sensitivity, an accelerationvoltage of 20 kV, a beam current of 80 nA, a beam diameterof 5 μm and counting times of 15 s for Si and of 300 s forAl, Ti, K and Fe were chosen. Limits of detection were (3σof single point background) 13 μg g−1 for Al, 18 μg g−1 forK, 34 μg g−1 for Ti and 31 μg g−1 for Fe.
The Ti-in-quartz geothermometer of Wark and Watson(2006):
T �C½ � ¼ �3; 765
log Ti mg g�1½ �; quartz=aTiO2ð Þ � 5:69� 273 ð1Þ
provides a tool to determine the quartz crystallisationtemperature based on the temperature dependence of theTi4+−Si4+ substitution in quartz given the presence of rutileor, in its absence, an estimate of the TiO2 activity of thesystem. The geothermometer can be applied for temperaturesin the range 400°C to 1,000°C at pressures of 1.0 GPa.Crystallisation temperatures of quartz with Ti>34 μg g−1
were then calculated using this formula.
Fluid inclusion microthermometry
The samples were prepared as doubly polished thick(∼200 μm) sections for CL investigation, and these sectionswere afterward demounted and used as fluid inclusionwafers. Microthermometry was carried out using the jointIC/NHM facility comprising a Linkham THC600 heating/freezing stage attached to an Olympus Optiphot microscopewith a Nikon ×50 long working distance lens. Calibrationof the instrument was regularly monitored using standard
Fig. 6 Mineral paragenesis and related quartz crystallisation sequenceof the central stockwork at Zesen Uul observed in the studied samples
712 Miner Deposita (2010) 45:707–727
artificial inclusion wafers. The fluid inclusion studies werecarried out on the same samples as both the CL andmicroprobe analyses in order to directly relate the fluidinclusions to the individual quartz generations.
Results
Vein quartz textures visualized by SEM-CL
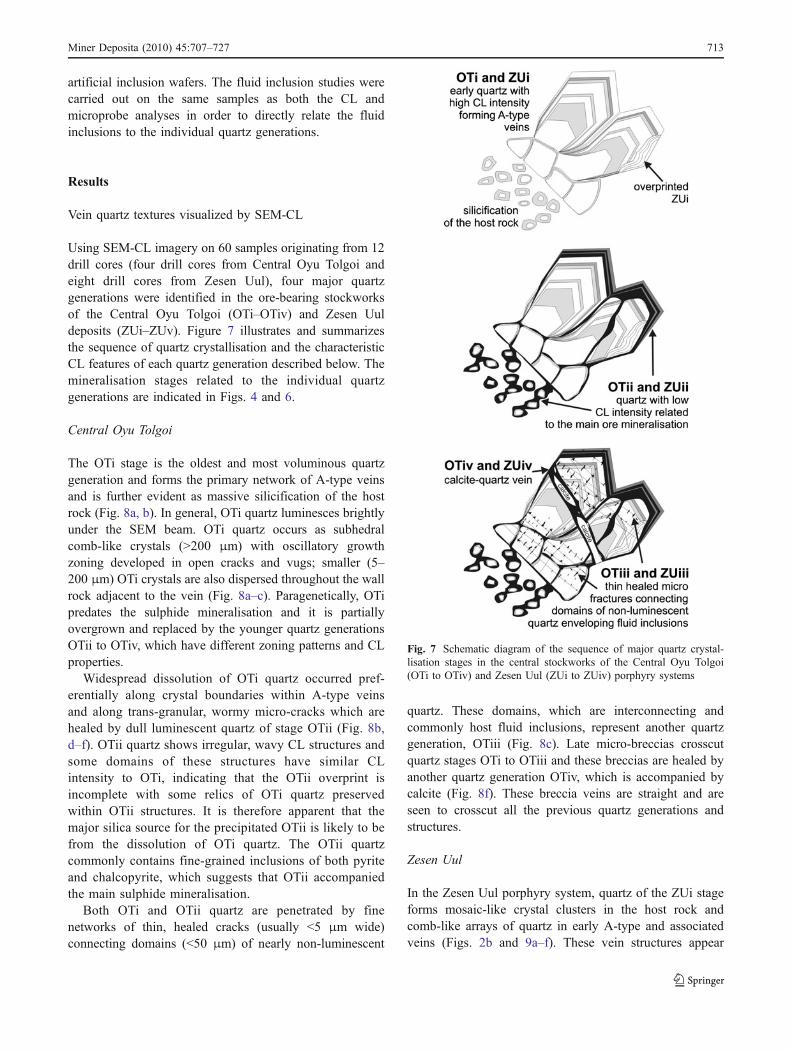
Using SEM-CL imagery on 60 samples originating from 12drill cores (four drill cores from Central Oyu Tolgoi andeight drill cores from Zesen Uul), four major quartzgenerations were identified in the ore-bearing stockworksof the Central Oyu Tolgoi (OTi–OTiv) and Zesen Uuldeposits (ZUi–ZUv). Figure 7 illustrates and summarizesthe sequence of quartz crystallisation and the characteristicCL features of each quartz generation described below. Themineralisation stages related to the individual quartzgenerations are indicated in Figs. 4 and 6.
Central Oyu Tolgoi
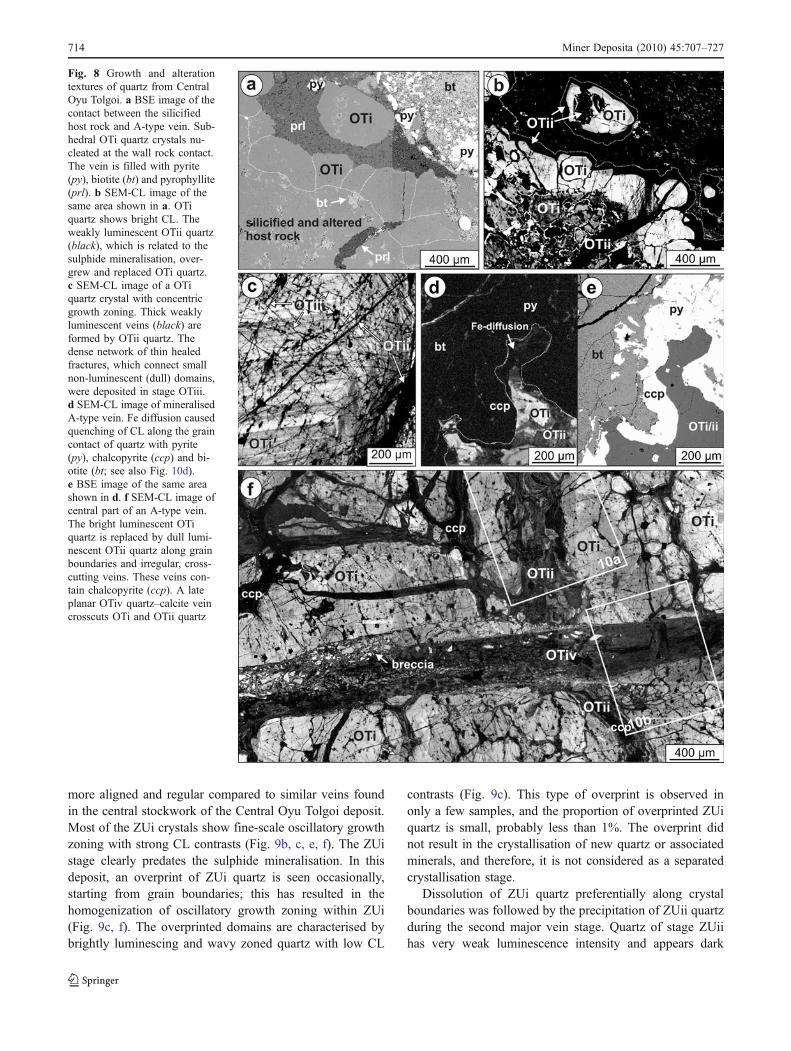
The OTi stage is the oldest and most voluminous quartzgeneration and forms the primary network of A-type veinsand is further evident as massive silicification of the hostrock (Fig. 8a, b). In general, OTi quartz luminesces brightlyunder the SEM beam. OTi quartz occurs as subhedralcomb-like crystals (>200 μm) with oscillatory growthzoning developed in open cracks and vugs; smaller (5–200 μm) OTi crystals are also dispersed throughout the wallrock adjacent to the vein (Fig. 8a–c). Paragenetically, OTipredates the sulphide mineralisation and it is partiallyovergrown and replaced by the younger quartz generationsOTii to OTiv, which have different zoning patterns and CLproperties.
Widespread dissolution of OTi quartz occurred pref-erentially along crystal boundaries within A-type veinsand along trans-granular, wormy micro-cracks which arehealed by dull luminescent quartz of stage OTii (Fig. 8b,d–f). OTii quartz shows irregular, wavy CL structures andsome domains of these structures have similar CLintensity to OTi, indicating that the OTii overprint isincomplete with some relics of OTi quartz preservedwithin OTii structures. It is therefore apparent that themajor silica source for the precipitated OTii is likely to befrom the dissolution of OTi quartz. The OTii quartzcommonly contains fine-grained inclusions of both pyriteand chalcopyrite, which suggests that OTii accompaniedthe main sulphide mineralisation.
Both OTi and OTii quartz are penetrated by finenetworks of thin, healed cracks (usually <5 μm wide)connecting domains (<50 μm) of nearly non-luminescent
quartz. These domains, which are interconnecting andcommonly host fluid inclusions, represent another quartzgeneration, OTiii (Fig. 8c). Late micro-breccias crosscutquartz stages OTi to OTiii and these breccias are healed byanother quartz generation OTiv, which is accompanied bycalcite (Fig. 8f). These breccia veins are straight and areseen to crosscut all the previous quartz generations andstructures.
Zesen Uul
In the Zesen Uul porphyry system, quartz of the ZUi stageforms mosaic-like crystal clusters in the host rock andcomb-like arrays of quartz in early A-type and associatedveins (Figs. 2b and 9a–f). These vein structures appear
Fig. 7 Schematic diagram of the sequence of major quartz crystal-lisation stages in the central stockworks of the Central Oyu Tolgoi(OTi to OTiv) and Zesen Uul (ZUi to ZUiv) porphyry systems
Miner Deposita (2010) 45:707–727 713
more aligned and regular compared to similar veins foundin the central stockwork of the Central Oyu Tolgoi deposit.Most of the ZUi crystals show fine-scale oscillatory growthzoning with strong CL contrasts (Fig. 9b, c, e, f). The ZUistage clearly predates the sulphide mineralisation. In thisdeposit, an overprint of ZUi quartz is seen occasionally,starting from grain boundaries; this has resulted in thehomogenization of oscillatory growth zoning within ZUi(Fig. 9c, f). The overprinted domains are characterised bybrightly luminescing and wavy zoned quartz with low CL
contrasts (Fig. 9c). This type of overprint is observed inonly a few samples, and the proportion of overprinted ZUiquartz is small, probably less than 1%. The overprint didnot result in the crystallisation of new quartz or associatedminerals, and therefore, it is not considered as a separatedcrystallisation stage.
Dissolution of ZUi quartz preferentially along crystalboundaries was followed by the precipitation of ZUii quartzduring the second major vein stage. Quartz of stage ZUiihas very weak luminescence intensity and appears dark
Fig. 8 Growth and alterationtextures of quartz from CentralOyu Tolgoi. a BSE image of thecontact between the silicifiedhost rock and A-type vein. Sub-hedral OTi quartz crystals nu-cleated at the wall rock contact.The vein is filled with pyrite(py), biotite (bt) and pyrophyllite(prl). b SEM-CL image of thesame area shown in a. OTiquartz shows bright CL. Theweakly luminescent OTii quartz(black), which is related to thesulphide mineralisation, over-grew and replaced OTi quartz.c SEM-CL image of a OTiquartz crystal with concentricgrowth zoning. Thick weaklyluminescent veins (black) areformed by OTii quartz. Thedense network of thin healedfractures, which connect smallnon-luminescent (dull) domains,were deposited in stage OTiii.d SEM-CL image of mineralisedA-type vein. Fe diffusion causedquenching of CL along the graincontact of quartz with pyrite(py), chalcopyrite (ccp) and bi-otite (bt; see also Fig. 10d).e BSE image of the same areashown in d. f SEM-CL image ofcentral part of an A-type vein.The bright luminescent OTiquartz is replaced by dull lumi-nescent OTii quartz along grainboundaries and irregular, cross-cutting veins. These veins con-tain chalcopyrite (ccp). A lateplanar OTiv quartz–calcite veincrosscuts OTi and OTii quartz
714 Miner Deposita (2010) 45:707–727
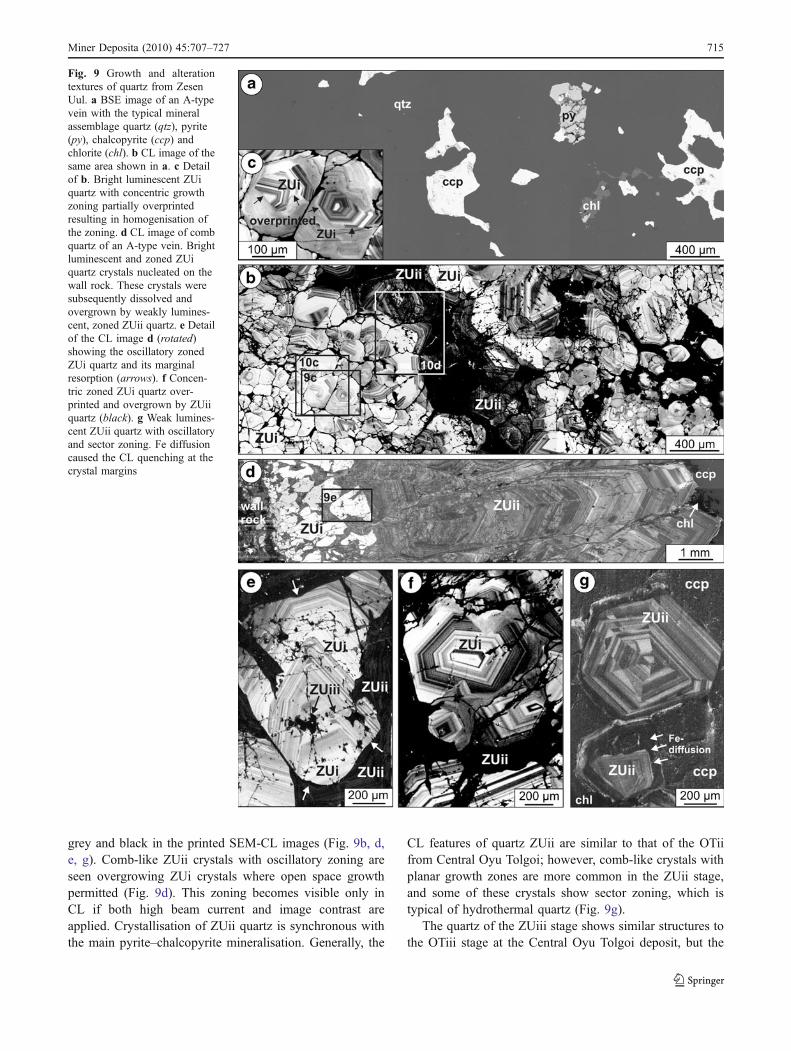
grey and black in the printed SEM-CL images (Fig. 9b, d,e, g). Comb-like ZUii crystals with oscillatory zoning areseen overgrowing ZUi crystals where open space growthpermitted (Fig. 9d). This zoning becomes visible only inCL if both high beam current and image contrast areapplied. Crystallisation of ZUii quartz is synchronous withthe main pyrite–chalcopyrite mineralisation. Generally, the
CL features of quartz ZUii are similar to that of the OTiifrom Central Oyu Tolgoi; however, comb-like crystals withplanar growth zones are more common in the ZUii stage,and some of these crystals show sector zoning, which istypical of hydrothermal quartz (Fig. 9g).
The quartz of the ZUiii stage shows similar structures tothe OTiii stage at the Central Oyu Tolgoi deposit, but the
Fig. 9 Growth and alterationtextures of quartz from ZesenUul. a BSE image of an A-typevein with the typical mineralassemblage quartz (qtz), pyrite(py), chalcopyrite (ccp) andchlorite (chl). b CL image of thesame area shown in a. c Detailof b. Bright luminescent ZUiquartz with concentric growthzoning partially overprintedresulting in homogenisation ofthe zoning. d CL image of combquartz of an A-type vein. Brightluminescent and zoned ZUiquartz crystals nucleated on thewall rock. These crystals weresubsequently dissolved andovergrown by weakly lumines-cent, zoned ZUii quartz. e Detailof the CL image d (rotated)showing the oscillatory zonedZUi quartz and its marginalresorption (arrows). f Concen-tric zoned ZUi quartz over-printed and overgrown by ZUiiquartz (black). g Weak lumines-cent ZUii quartz with oscillatoryand sector zoning. Fe diffusioncaused the CL quenching at thecrystal margins
Miner Deposita (2010) 45:707–727 715
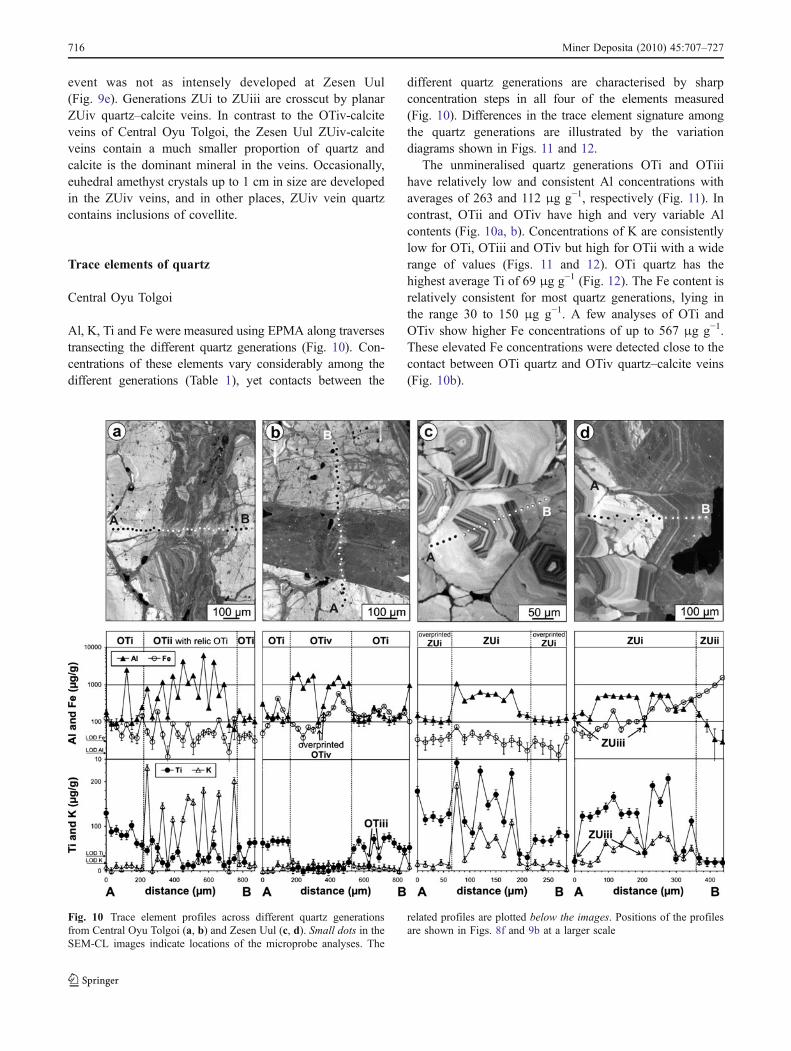
event was not as intensely developed at Zesen Uul(Fig. 9e). Generations ZUi to ZUiii are crosscut by planarZUiv quartz–calcite veins. In contrast to the OTiv-calciteveins of Central Oyu Tolgoi, the Zesen Uul ZUiv-calciteveins contain a much smaller proportion of quartz andcalcite is the dominant mineral in the veins. Occasionally,euhedral amethyst crystals up to 1 cm in size are developedin the ZUiv veins, and in other places, ZUiv vein quartzcontains inclusions of covellite.
Trace elements of quartz
Central Oyu Tolgoi
Al, K, Ti and Fe were measured using EPMA along traversestransecting the different quartz generations (Fig. 10). Con-centrations of these elements vary considerably among thedifferent generations (Table 1), yet contacts between the
different quartz generations are characterised by sharpconcentration steps in all four of the elements measured(Fig. 10). Differences in the trace element signature amongthe quartz generations are illustrated by the variationdiagrams shown in Figs. 11 and 12.
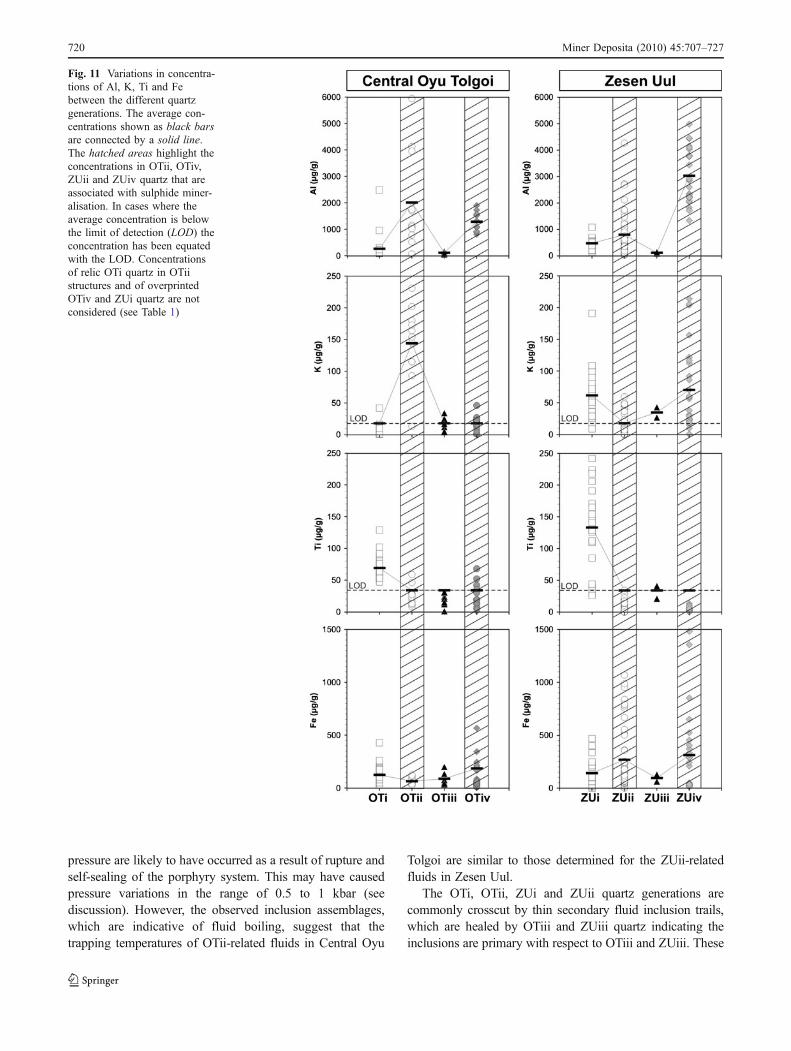
The unmineralised quartz generations OTi and OTiiihave relatively low and consistent Al concentrations withaverages of 263 and 112 μg g−1, respectively (Fig. 11). Incontrast, OTii and OTiv have high and very variable Alcontents (Fig. 10a, b). Concentrations of K are consistentlylow for OTi, OTiii and OTiv but high for OTii with a widerange of values (Figs. 11 and 12). OTi quartz has thehighest average Ti of 69 μg g−1 (Fig. 12). The Fe content isrelatively consistent for most quartz generations, lying inthe range 30 to 150 μg g−1. A few analyses of OTi andOTiv show higher Fe concentrations of up to 567 μg g−1.These elevated Fe concentrations were detected close to thecontact between OTi quartz and OTiv quartz–calcite veins(Fig. 10b).
Fig. 10 Trace element profiles across different quartz generationsfrom Central Oyu Tolgoi (a, b) and Zesen Uul (c, d). Small dots in theSEM-CL images indicate locations of the microprobe analyses. The
related profiles are plotted below the images. Positions of the profilesare shown in Figs. 8f and 9b at a larger scale
716 Miner Deposita (2010) 45:707–727
Table 1 Trace element concentrations of quartz generations of theCentral Oyu Tolgoi (COT samples) and Zesen Uul (ZU samples)porphyry deposits determined by EPMA
Sample qtzgener.
dist.(μm)
Al(μgg−1)
K(μgg−1)
Ti(μgg−1)
Fe(μgg−1)
COT226-573
OTi 0 182 <18 129 125
OTi 30 88 <18 88 89
OTi 60 92 <18 92 73
OTi 90 117 <18 80 43
OTi 120 2,483 <18 80 84
OTi 150 93 <18 102 40
OTi 180 119 <18 62 37
OTi 210 245 <18 58 144
OTii 240 785 231 46 55
OTi* 270 136 <18 68 <31
OTi* 300 430 27 52 188
OTii 330 1,151 145 <34 46
OTi* 360 136 <18 <34 <31
OTii 390 1,698 115 <34 89
OTi* 420 468 46 42 47
OTii 450 4,133 115 <34 32
OTii 480 1,094 164 <34 89
OTii 510 1,749 154 <34 <31
OTi* 540 468 21 35 37
OTii 570 5,948 180 <34 50
OTi* 600 236 23 <34 57
OTii 630 3,959 93 59 49
OTii 660 517 173 <34 112
OTii 690 1,026 <18 <34 38
OTi* 720 83 <18 <34 <31
OTii 750 64 202 <34 123
OTi 780 197 <18 53 37
OTi* 810 111 23 <34 43
OTi 840 135 <18 62 46
OTi 870 102 <18 64 31
COT226-573
OTi 0 304 <18 63 50
OTi 30 145 <18 56 80
OTi 60 131 <18 68 121
OTi 90 144 <18 66 428
OTi 120 104 <18 68 213
OTi 150 142 <18 66 110
OTiv 180 1,528 21 <34 86
OTiv 210 1,901 <18 <34 67
OTiv 240 812 <18 <34 38
OTiv 270 1,320 <18 <34 72
OTiv 300 1,729 19 <34 61
OTiv* 330 100 <18 <34 78
OTiv* 360 264 <18 <34 119
OTiv 390 891 <18 <34 166
OTiv 420 1,076 <18 <34 245
OTiv 450 1,578 <18 <34 567
Table 1 (continued)
Sample qtzgener.
dist.(μm)
Al(μgg−1)
K(μgg−1)
Ti(μgg−1)
Fe(μgg−1)
OTiv 480 917 <18 <34 344
OTiv 510 1,094 21 <34 213
OTi 540 122 <18 50 165
OTi 570 105 <18 68 135
OTi 600 106 <18 53 150
OTiii 630 118 <18 <34 134
OTi 660 244 <18 72 194
COT226-573
OTiii 690 164 <18 <34 200
OTi 720 140 <18 74 260
OTi 750 110 <18 76 184
OTi 780 116 <18 63 119
OTi 810 143 <18 52 142
OTi 840 234 42 47 172
OTi 870 956 <18 53 103
COT226-573
OTiii 0 45 22 <34 79
OTiii 0 163 25 <34 34
OTiii 0 124 34 <34 52
OTiii 0 89 <18 <34 76
OTiii 0 78 <18 <34 42
ZU003-107
ZUi* 0 151 <18 179 34
ZUi* 15 118 <18 114 29
ZUi* 30 112 <18 122 36
ZUi* 45 101 18 112 33
ZUi* 60 114 <18 128 42
ZUi 75 1,072 191 242 74
ZUi 90 371 25 110 36
ZUi 105 475 55 85 50
ZUi 120 638 100 224 36
ZUi 135 545 57 147 48
ZUi 150 569 75 171 38
ZUi 165 386 36 110 <31
ZUi 180 693 109 218 33
ZUi 195 165 18 38 <31
ZUi 210 150 <18 <34 <31
ZUi* 225 116 18 70 31
ZUi* 240 115 <18 66 <31
ZUi* 255 105 20 68 <31
ZUi* 270 110 <18 86 <31
ZUi* 285 127 <18 78 38
ZU003-73 ZUiii 0 136 27 <34 61
ZUi 23 173 20 122 47
ZUi 46 117 <18 120 42
ZUi 69 443 26 131 64
ZUi 92 511 63 141 77
ZUi 115 491 47 165 196
ZUi 138 465 60 126 62
ZUi 161 504 90 129 99
ZUi 184 457 68 129 100
Miner Deposita (2010) 45:707–727 717
Table 1 (continued)
Sample qtzgener.
dist.(μm)
Al(μgg−1)
K(μgg−1)
Ti(μgg−1)
Fe(μgg−1)
ZUiii 207 83 43 41 127
ZUi 230 557 64 191 222
ZUi 253 526 80 154 468
ZUi 276 508 72 206 212
ZUi 299 198 36 <34 247
ZUi 322 218 29 44 334
ZUi 345 385 51 112 400
ZUi 368 158 20 <34 514
ZUi 391 83 21 <34 667
ZUi 414 33 21 <34 952
ZUi 437 28 22 <34 1,541
ZU025-17 ZUii 0 239 7 0 6
ZU025-17 ZUii 15 39 <18 <34 <31
ZUii 30 49 <18 <34 <31
ZUii 45 70 <18 <34 <31
ZUii 60 70 <18 <34 <31
ZUii 75 147 <18 <34 <31
ZUii 90 126 <18 <34 <31
ZUii 105 178 <18 <34 <31
ZUii 120 189 <18 <34 <31
ZUii 135 312 <18 <34 <31
ZUii 150 1,030 22 <34 40
ZUii 165 2,113 42 <34 <31
ZU025-17 ZUii 0 67 <18 <34 1,574
ZUii 20 29 <18 <34 757
ZUii 40 96 <18 <34 502
ZUii 60 1,731 <18 <34 359
ZUii 80 152 <18 <34 241
ZUii 100 218 <18 <34 187
ZUii 120 59 <18 <34 152
ZUii 140 44 <18 <34 108
ZUii 160 105 <18 <34 94
ZUii 180 392 <18 <34 96
ZUii 200 661 <18 <34 86
ZUii 220 447 <18 <34 62
ZUii 240 140 <18 <34 65
ZUii 260 210 <18 <34 61
ZUii 280 4,260 <18 <34 98
ZUii 300 178 <18 <34 40
ZUii 320 106 <18 <34 53
ZUii 340 500 <18 <34 40
ZUii 360 8,659 <18 <34 89
ZUii 380 7,630 <18 <34 132
ZUii 400 336 <18 <34 81
ZUii 420 182 <18 <34 61
ZUii 440 1,713 <18 <34 57
ZUii 460 885 <18 <34 50
ZUii 480 1,092 <18 <34 48
Table 1 (continued)
Sample qtzgener.
dist.(μm)
Al(μgg−1)
K(μgg−1)
Ti(μgg−1)
Fe(μgg−1)
ZUii 500 142 <18 <34 47
ZUii 520 181 <18 <34 50
ZUii 540 865 <18 <34 63
ZUii 560 511 <18 <34 80
ZUii 580 1,263 <18 <34 67
ZUii 600 2,720 <18 <34 105
ZUii 620 2,676 <18 <34 91
ZUii 640 1,607 <18 <34 105
ZUii 660 1,194 <18 <34 135
ZUii 680 116 <18 <34 188
ZU025-17 ZUii 700 91 <18 <34 251
ZUii 720 102 <18 <34 357
ZUii 740 83 <18 <34 553
ZUii 760 95 <18 <34 986
ZU003-72 ZUii 0 270 <18 <34 229
ZUii 20 1,468 32 <34 225
ZUii 40 346 42 34 196
ZUii 60 523 37 <34 162
ZUii 80 195 <18 <34 162
ZUii 100 893 <18 <34 155
ZUii 120 366 50 <34 161
ZUii 140 181 <18 <34 123
ZUii 160 1,731 46 <34 184
ZUii 180 610 24 <34 176
ZUii 200 645 60 <34 243
ZUiv 220 2,027 25 <34 208
ZUiv 240 3,752 32 <34 242
ZUiv 260 2,595 <18 <34 285
ZUiv 280 2,073 38 <34 291
ZUiv 300 2,335 56 <34 315
ZUiv 320 2,308 23 <34 332
ZUiv 340 2,240 18 <34 372
ZUiv 360 1,817 <18 <34 404
ZUiv 380 1,332 <18 <34 453
ZUiv 400 1,711 22 <34 523
ZUiv 420 2,188 18 <34 650
ZUiv 440 2,849 204 <34 852
ZUiv 460 2,247 59 <34 1,483
ZUiv 480 2,202 61 <34 1,356
ZUii 500 573 47 <34 839
ZUii 520 541 48 <34 778
ZUii 540 349 20 <34 793
ZUii 560 743 <18 <34 1,069
ZUii 580 618 21 <34 1,503
ZU005-288
ZUiv 0 4,435 92 <34 49
ZUiv 20 4,976 157 <34 31
ZUiv 40 4,033 113 <34 <31
ZUiv 60 3,435 122 <34 <31
718 Miner Deposita (2010) 45:707–727
Zesen Uul
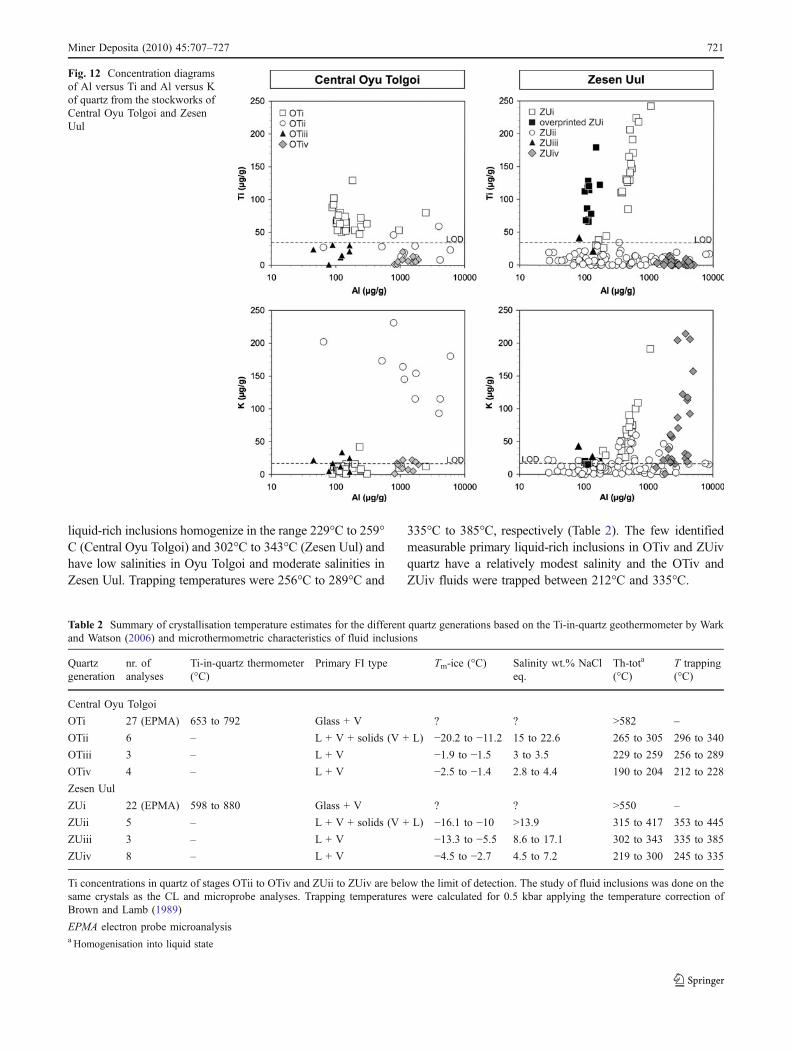
The ZUii and ZUiv quartz from the Zesen Uul veins aresimilar to OTii and OTiv quartz from the Central OyuTolgoi veins with high average Al contents of 795 and3,024 μg g−1, respectively, showing a widespread (Fig. 11).The Al contents of ZUi and ZUiii quartz are significantlylower. ZUi and ZUiv are characterised by high and variableconcentrations of K, leading to different distributionpatterns of K compared with the corresponding generationsof quartz OTi and OTiv at Central Oyu Tolgoi (Fig. 11).Concentrations of Ti in ZUi quartz are very high andvariable (Fig. 12); this is the quartz generation with thehighest average Ti content of 133 μg g−1. The average Ticontent in ZUii, ZUiii and ZUiv quartz is below the limit ofdetection (<34 μg g−1).
The overprinted ZUi shows slightly lower and moreconsistent concentrations of Ti, Al and K compared to ZUiindicating that the overprint has resulted in homogenizationof the element distribution (Fig. 10c). Some narrow, weaklyluminescent outer growth zones of ZUi (Fig. 10d) showboth low Ti (≤44 μg g−1) and Al (136 to 218 μg g−1)values. These zones are preferentially developed at themargin of ZUi quartz crystals where they pass into ZUiiquartz. In general, high Ti correlates with growth zones ofvery bright CL, whereas the total Al content shows nouniform correlation with CL intensity.
ZUii and ZUiv quartz containing high Al also show highconcentrations of Fe, albeit with a widespread in the data(Fig. 11). The profile in Fig. 10d illustrates that the highestFe concentrations occur in quartz close to the contact withFe-rich sulphide phases. In this case, the highest Feconcentrations are likely to be caused by diffusion of Fefrom the sulphide into the quartz as discussed by Penniston-
Dorland (2001). Analyses performed far away (>500 μm)from Fe-rich minerals do not show this effect.
Fluid inclusion microthermometry
Petrography and microthermometry were completed on80 fluid inclusions from the same samples that wereexamined using CL and EPMA. However, only 29 fluidinclusions could be related with certainty to the specificquartz generations analyzed. As mentioned above, fluidinclusions that can be utilised for thermometric studiesare rare and very small in both deposits compared toother porphyry systems. Therefore, the few data collectedare used here only to estimate the approximate crystal-lisation temperatures of the individual quartz generations(Table 2). Due to the limited number of fluid inclusionanalyses possible, the temperature ranges and salinitieslisted in Table 2 may not be truly representative of thevariability of the systems.
The paragenetic sequences of fluid inclusions hosted inthe different quartz generations from Central Oyu Tolgoiand Zesen Uul deposits are generally similar. OTi and ZUiquartz contain glassy, partially crystallised silicate meltinclusions, commonly with small daughter minerals such asbiotite and feldspar-like phases, together with a vapourphase/shrinkage bubble. These inclusions start to melt at675°C at 1 atm external pressure. Primary fluid inclusionsrelated to the overprinted ZUi quartz of Zesen Uul couldnot be identified.
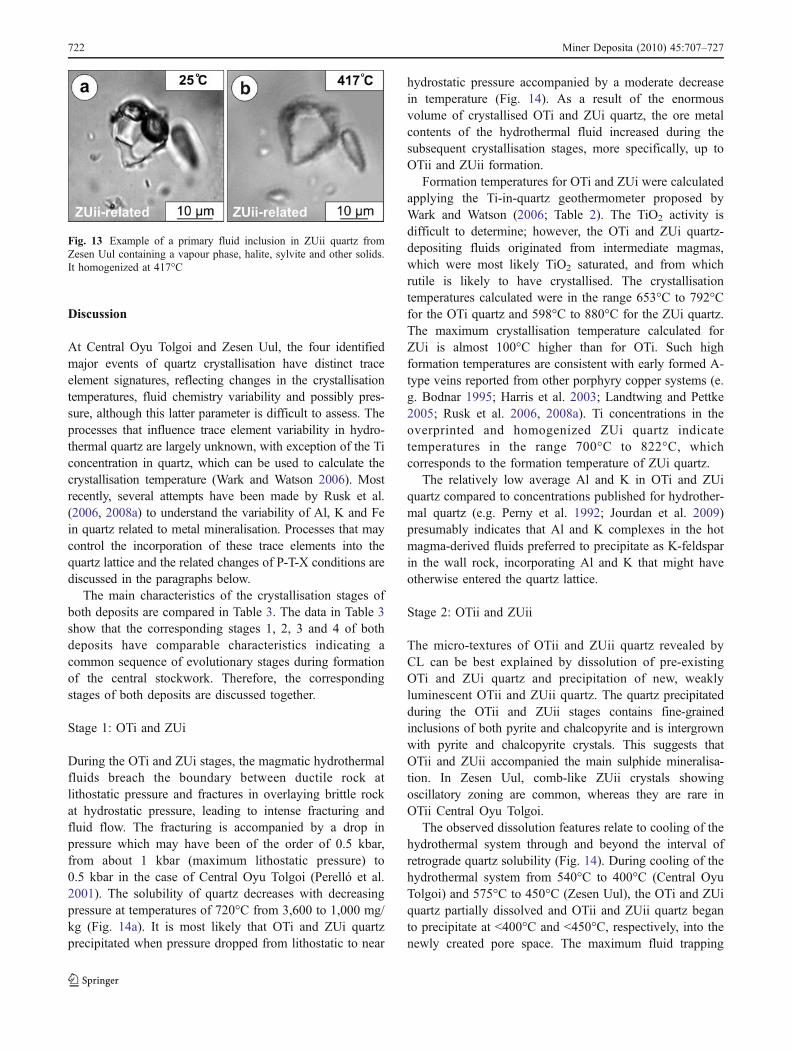
The OTii and ZUii quartz is seen to encapsulate chalcopy-rite and pyrite grains in the same regions where it hosts twotypes of primary fluid inclusions. These two inclusion typesare (1) liquid-rich inclusions that have high and very variablesalinities, some with daughter phases, together with (2)vapour-rich inclusions. It is tentatively suggested that thesolid-bearing and vapour-rich inclusions could be coexistingpairs trapped in a boiling fluid. Halite daughter crystals in theliquid-rich inclusions indicate very high salinities for manyprimary fluid inclusions in OTii and ZUii quartz. Most of theliquid-rich inclusions contain, in addition to halite, other solid,partially opaque phases that are suspected to be sulphides(Fig. 13). These inclusions record homogenizationtemperatures of 265°C to 305°C in the Central Oyu Tolgoisamples and 315°C to 417°C in the Zesen Uul samples. Thecorresponding trapping temperatures are 296°C to 340°C and353°C to 445°C, respectively, after applying a temperaturecorrection using the method of Brown and Lamb (1989). Apressure correction of 0.5 kbar was applied whichcorresponds approximately to the assumed pressure ofstockwork formation of both deposits (Perelló et al. 2001).The applied pressure correction is a simplified approximationbecause fluctuations between lithostatic and hydrostatic
Table 1 (continued)
Sample qtzgener.
dist.(μm)
Al(μgg−1)
K(μgg−1)
Ti(μgg−1)
Fe(μgg−1)
ZUiv 80 2,858 86 <34 42
ZUiv 100 2,913 71 <34 35
ZUiv 120 3,792 214 <34 32
ZUiv 140 3,771 24 <34 <31
ZUiv 160 4,030 19 <34 <31
ZUiv 180 4,145 29 <34 <31
ZUiv 200 4,448 206 <34 <31
ZUiv 220 4,101 117 <34 34
The concentrations were predominantly analyzed along traverses withdistances of 15 to 30 μm between the analysis spots
dist. distance, qtz gener. quartz generation, OTi* relic OTi in OTiistructures, OTiv* overprinted OTiv, ZUi* overprinted (homogenized)ZUi
Miner Deposita (2010) 45:707–727 719
pressure are likely to have occurred as a result of rupture andself-sealing of the porphyry system. This may have causedpressure variations in the range of 0.5 to 1 kbar (seediscussion). However, the observed inclusion assemblages,which are indicative of fluid boiling, suggest that thetrapping temperatures of OTii-related fluids in Central Oyu
Tolgoi are similar to those determined for the ZUii-relatedfluids in Zesen Uul.
The OTi, OTii, ZUi and ZUii quartz generations arecommonly crosscut by thin secondary fluid inclusion trails,which are healed by OTiii and ZUiii quartz indicating theinclusions are primary with respect to OTiii and ZUiii. These
Fig. 11 Variations in concentra-tions of Al, K, Ti and Febetween the different quartzgenerations. The average con-centrations shown as black barsare connected by a solid line.The hatched areas highlight theconcentrations in OTii, OTiv,ZUii and ZUiv quartz that areassociated with sulphide miner-alisation. In cases where theaverage concentration is belowthe limit of detection (LOD) theconcentration has been equatedwith the LOD. Concentrationsof relic OTi quartz in OTiistructures and of overprintedOTiv and ZUi quartz are notconsidered (see Table 1)
720 Miner Deposita (2010) 45:707–727
liquid-rich inclusions homogenize in the range 229°C to 259°C (Central Oyu Tolgoi) and 302°C to 343°C (Zesen Uul) andhave low salinities in Oyu Tolgoi and moderate salinities inZesen Uul. Trapping temperatures were 256°C to 289°C and
335°C to 385°C, respectively (Table 2). The few identifiedmeasurable primary liquid-rich inclusions in OTiv and ZUivquartz have a relatively modest salinity and the OTiv andZUiv fluids were trapped between 212°C and 335°C.
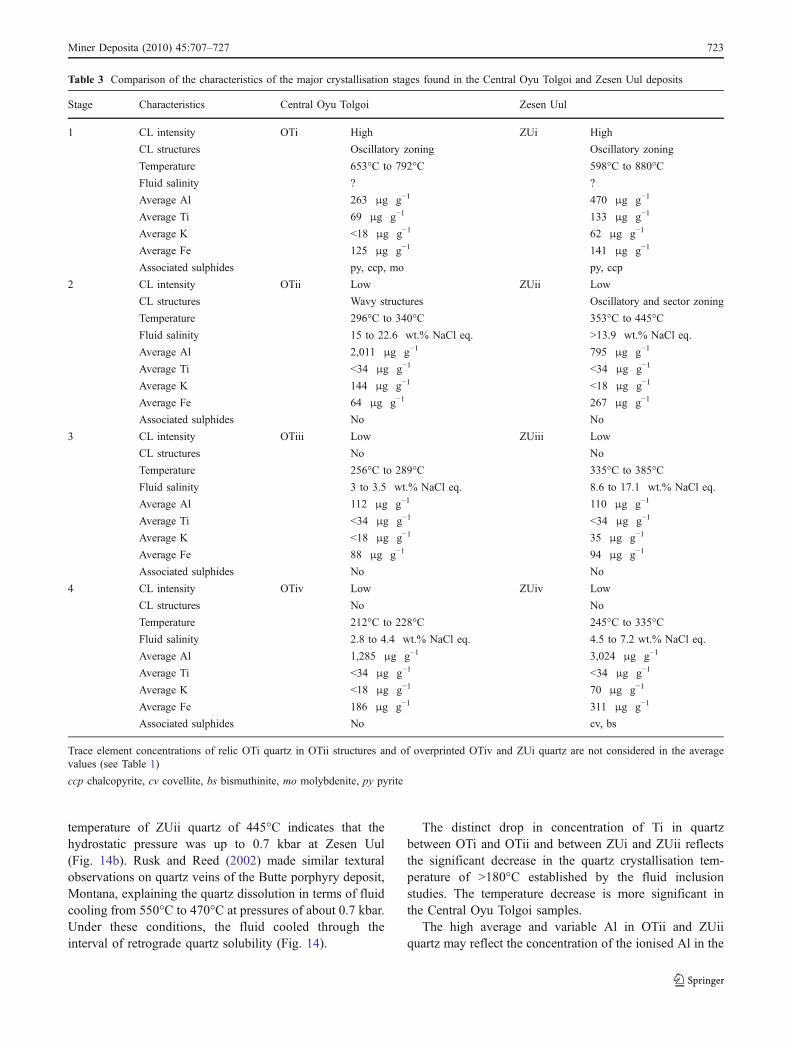
Table 2 Summary of crystallisation temperature estimates for the different quartz generations based on the Ti-in-quartz geothermometer by Warkand Watson (2006) and microthermometric characteristics of fluid inclusions
Quartzgeneration
nr. ofanalyses
Ti-in-quartz thermometer(°C)
Primary FI type Tm-ice (°C) Salinity wt.% NaCleq.
Th-tota
(°C)T trapping(°C)
Central Oyu Tolgoi
OTi 27 (EPMA) 653 to 792 Glass + V ? ? >582 –
OTii 6 – L + V + solids (V + L) −20.2 to −11.2 15 to 22.6 265 to 305 296 to 340
OTiii 3 – L + V −1.9 to −1.5 3 to 3.5 229 to 259 256 to 289
OTiv 4 – L + V −2.5 to −1.4 2.8 to 4.4 190 to 204 212 to 228
Zesen Uul
ZUi 22 (EPMA) 598 to 880 Glass + V ? ? >550 –
ZUii 5 – L + V + solids (V + L) −16.1 to −10 >13.9 315 to 417 353 to 445
ZUiii 3 – L + V −13.3 to −5.5 8.6 to 17.1 302 to 343 335 to 385
ZUiv 8 – L + V −4.5 to −2.7 4.5 to 7.2 219 to 300 245 to 335
Ti concentrations in quartz of stages OTii to OTiv and ZUii to ZUiv are below the limit of detection. The study of fluid inclusions was done on thesame crystals as the CL and microprobe analyses. Trapping temperatures were calculated for 0.5 kbar applying the temperature correction ofBrown and Lamb (1989)
EPMA electron probe microanalysisa Homogenisation into liquid state
Fig. 12 Concentration diagramsof Al versus Ti and Al versus Kof quartz from the stockworks ofCentral Oyu Tolgoi and ZesenUul
Miner Deposita (2010) 45:707–727 721
Discussion
At Central Oyu Tolgoi and Zesen Uul, the four identifiedmajor events of quartz crystallisation have distinct traceelement signatures, reflecting changes in the crystallisationtemperatures, fluid chemistry variability and possibly pres-sure, although this latter parameter is difficult to assess. Theprocesses that influence trace element variability in hydro-thermal quartz are largely unknown, with exception of the Ticoncentration in quartz, which can be used to calculate thecrystallisation temperature (Wark and Watson 2006). Mostrecently, several attempts have been made by Rusk et al.(2006, 2008a) to understand the variability of Al, K and Fein quartz related to metal mineralisation. Processes that maycontrol the incorporation of these trace elements into thequartz lattice and the related changes of P-T-X conditions arediscussed in the paragraphs below.
The main characteristics of the crystallisation stages ofboth deposits are compared in Table 3. The data in Table 3show that the corresponding stages 1, 2, 3 and 4 of bothdeposits have comparable characteristics indicating acommon sequence of evolutionary stages during formationof the central stockwork. Therefore, the correspondingstages of both deposits are discussed together.
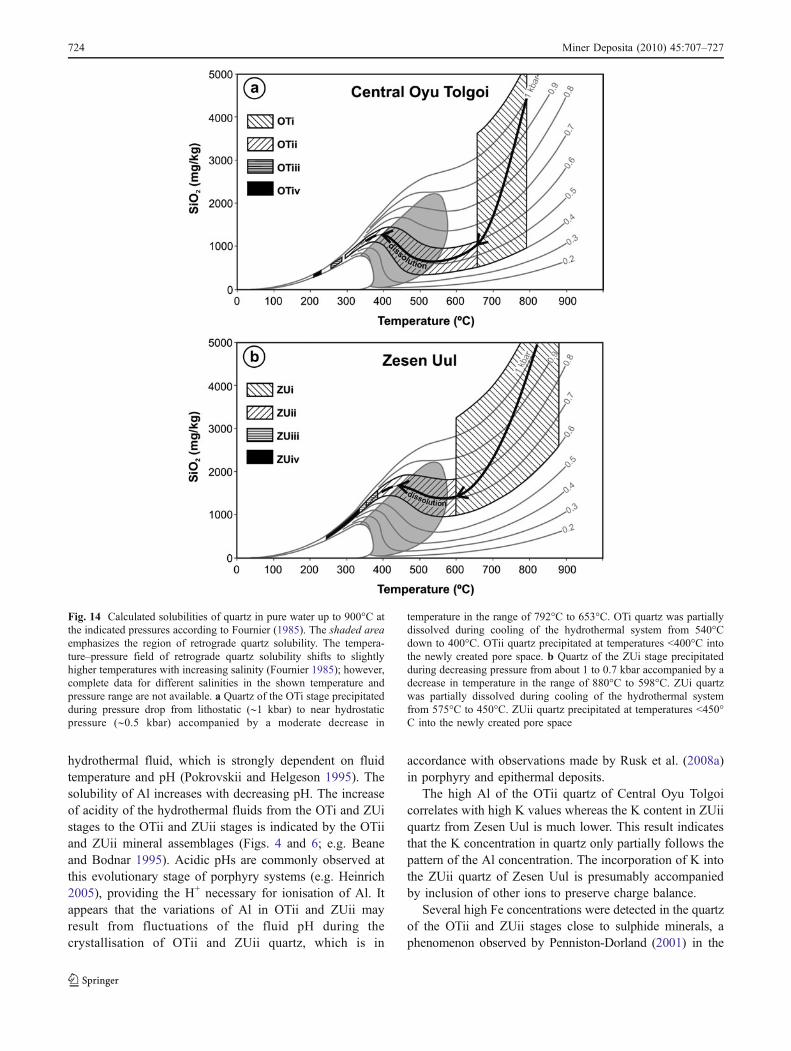
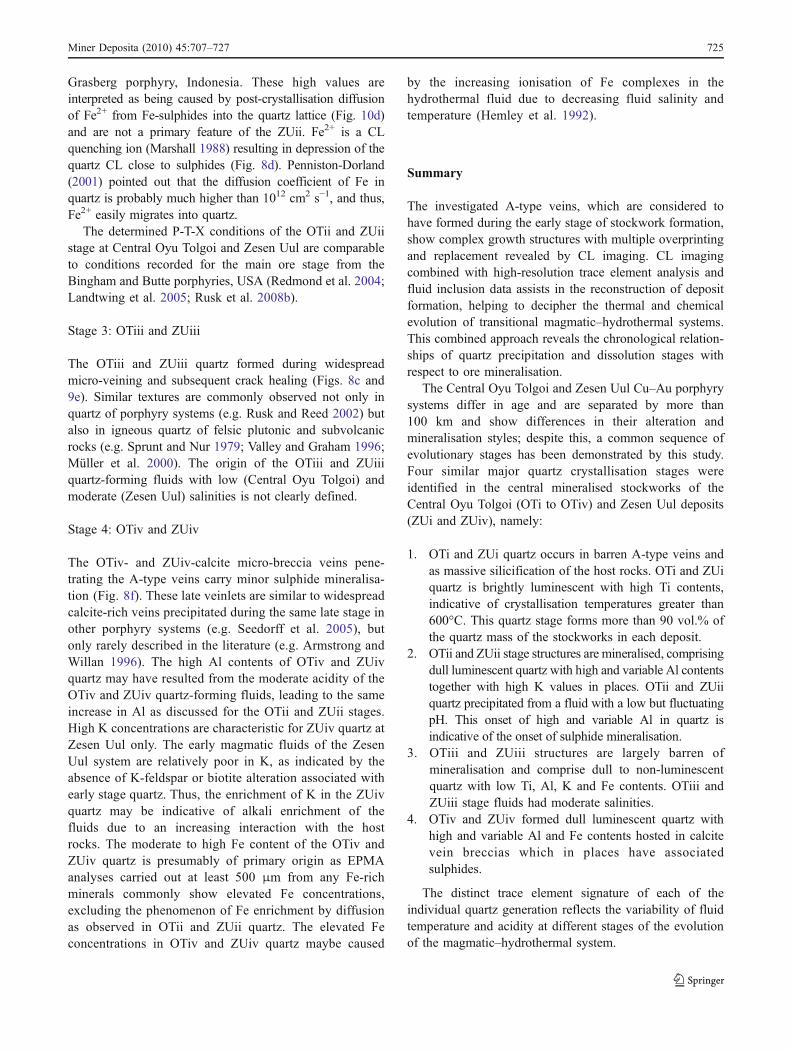
Stage 1: OTi and ZUi
During the OTi and ZUi stages, the magmatic hydrothermalfluids breach the boundary between ductile rock atlithostatic pressure and fractures in overlaying brittle rockat hydrostatic pressure, leading to intense fracturing andfluid flow. The fracturing is accompanied by a drop inpressure which may have been of the order of 0.5 kbar,from about 1 kbar (maximum lithostatic pressure) to0.5 kbar in the case of Central Oyu Tolgoi (Perelló et al.2001). The solubility of quartz decreases with decreasingpressure at temperatures of 720°C from 3,600 to 1,000 mg/kg (Fig. 14a). It is most likely that OTi and ZUi quartzprecipitated when pressure dropped from lithostatic to near
hydrostatic pressure accompanied by a moderate decreasein temperature (Fig. 14). As a result of the enormousvolume of crystallised OTi and ZUi quartz, the ore metalcontents of the hydrothermal fluid increased during thesubsequent crystallisation stages, more specifically, up toOTii and ZUii formation.
Formation temperatures for OTi and ZUi were calculatedapplying the Ti-in-quartz geothermometer proposed byWark and Watson (2006; Table 2). The TiO2 activity isdifficult to determine; however, the OTi and ZUi quartz-depositing fluids originated from intermediate magmas,which were most likely TiO2 saturated, and from whichrutile is likely to have crystallised. The crystallisationtemperatures calculated were in the range 653°C to 792°Cfor the OTi quartz and 598°C to 880°C for the ZUi quartz.The maximum crystallisation temperature calculated forZUi is almost 100°C higher than for OTi. Such highformation temperatures are consistent with early formed A-type veins reported from other porphyry copper systems (e.g. Bodnar 1995; Harris et al. 2003; Landtwing and Pettke2005; Rusk et al. 2006, 2008a). Ti concentrations in theoverprinted and homogenized ZUi quartz indicatetemperatures in the range 700°C to 822°C, whichcorresponds to the formation temperature of ZUi quartz.
The relatively low average Al and K in OTi and ZUiquartz compared to concentrations published for hydrother-mal quartz (e.g. Perny et al. 1992; Jourdan et al. 2009)presumably indicates that Al and K complexes in the hotmagma-derived fluids preferred to precipitate as K-feldsparin the wall rock, incorporating Al and K that might haveotherwise entered the quartz lattice.
Stage 2: OTii and ZUii
The micro-textures of OTii and ZUii quartz revealed byCL can be best explained by dissolution of pre-existingOTi and ZUi quartz and precipitation of new, weaklyluminescent OTii and ZUii quartz. The quartz precipitatedduring the OTii and ZUii stages contains fine-grainedinclusions of both pyrite and chalcopyrite and is intergrownwith pyrite and chalcopyrite crystals. This suggests thatOTii and ZUii accompanied the main sulphide mineralisa-tion. In Zesen Uul, comb-like ZUii crystals showingoscillatory zoning are common, whereas they are rare inOTii Central Oyu Tolgoi.
The observed dissolution features relate to cooling of thehydrothermal system through and beyond the interval ofretrograde quartz solubility (Fig. 14). During cooling of thehydrothermal system from 540°C to 400°C (Central OyuTolgoi) and 575°C to 450°C (Zesen Uul), the OTi and ZUiquartz partially dissolved and OTii and ZUii quartz beganto precipitate at <400°C and <450°C, respectively, into thenewly created pore space. The maximum fluid trapping
Fig. 13 Example of a primary fluid inclusion in ZUii quartz fromZesen Uul containing a vapour phase, halite, sylvite and other solids.It homogenized at 417°C
722 Miner Deposita (2010) 45:707–727
temperature of ZUii quartz of 445°C indicates that thehydrostatic pressure was up to 0.7 kbar at Zesen Uul(Fig. 14b). Rusk and Reed (2002) made similar texturalobservations on quartz veins of the Butte porphyry deposit,Montana, explaining the quartz dissolution in terms of fluidcooling from 550°C to 470°C at pressures of about 0.7 kbar.Under these conditions, the fluid cooled through theinterval of retrograde quartz solubility (Fig. 14).
The distinct drop in concentration of Ti in quartzbetween OTi and OTii and between ZUi and ZUii reflectsthe significant decrease in the quartz crystallisation tem-perature of >180°C established by the fluid inclusionstudies. The temperature decrease is more significant inthe Central Oyu Tolgoi samples.
The high average and variable Al in OTii and ZUiiquartz may reflect the concentration of the ionised Al in the
Table 3 Comparison of the characteristics of the major crystallisation stages found in the Central Oyu Tolgoi and Zesen Uul deposits
Stage Characteristics Central Oyu Tolgoi Zesen Uul
1 CL intensity OTi High ZUi High
CL structures Oscillatory zoning Oscillatory zoning
Temperature 653°C to 792°C 598°C to 880°C
Fluid salinity ? ?
Average Al 263 μg g−1 470 μg g−1
Average Ti 69 μg g−1 133 μg g−1
Average K <18 μg g−1 62 μg g−1
Average Fe 125 μg g−1 141 μg g−1
Associated sulphides py, ccp, mo py, ccp
2 CL intensity OTii Low ZUii Low
CL structures Wavy structures Oscillatory and sector zoning
Temperature 296°C to 340°C 353°C to 445°C
Fluid salinity 15 to 22.6 wt.% NaCl eq. >13.9 wt.% NaCl eq.
Average Al 2,011 μg g−1 795 μg g−1
Average Ti <34 μg g−1 <34 μg g−1
Average K 144 μg g−1 <18 μg g−1
Average Fe 64 μg g−1 267 μg g−1
Associated sulphides No No
3 CL intensity OTiii Low ZUiii Low
CL structures No No
Temperature 256°C to 289°C 335°C to 385°C
Fluid salinity 3 to 3.5 wt.% NaCl eq. 8.6 to 17.1 wt.% NaCl eq.
Average Al 112 μg g−1 110 μg g−1
Average Ti <34 μg g−1 <34 μg g−1
Average K <18 μg g−1 35 μg g−1
Average Fe 88 μg g−1 94 μg g−1
Associated sulphides No No
4 CL intensity OTiv Low ZUiv Low
CL structures No No
Temperature 212°C to 228°C 245°C to 335°C
Fluid salinity 2.8 to 4.4 wt.% NaCl eq. 4.5 to 7.2 wt.% NaCl eq.
Average Al 1,285 μg g−1 3,024 μg g−1
Average Ti <34 μg g−1 <34 μg g−1
Average K <18 μg g−1 70 μg g−1
Average Fe 186 μg g−1 311 μg g−1
Associated sulphides No cv, bs
Trace element concentrations of relic OTi quartz in OTii structures and of overprinted OTiv and ZUi quartz are not considered in the averagevalues (see Table 1)
ccp chalcopyrite, cv covellite, bs bismuthinite, mo molybdenite, py pyrite
Miner Deposita (2010) 45:707–727 723
hydrothermal fluid, which is strongly dependent on fluidtemperature and pH (Pokrovskii and Helgeson 1995). Thesolubility of Al increases with decreasing pH. The increaseof acidity of the hydrothermal fluids from the OTi and ZUistages to the OTii and ZUii stages is indicated by the OTiiand ZUii mineral assemblages (Figs. 4 and 6; e.g. Beaneand Bodnar 1995). Acidic pHs are commonly observed atthis evolutionary stage of porphyry systems (e.g. Heinrich2005), providing the H+ necessary for ionisation of Al. Itappears that the variations of Al in OTii and ZUii mayresult from fluctuations of the fluid pH during thecrystallisation of OTii and ZUii quartz, which is in
accordance with observations made by Rusk et al. (2008a)in porphyry and epithermal deposits.
The high Al of the OTii quartz of Central Oyu Tolgoicorrelates with high K values whereas the K content in ZUiiquartz from Zesen Uul is much lower. This result indicatesthat the K concentration in quartz only partially follows thepattern of the Al concentration. The incorporation of K intothe ZUii quartz of Zesen Uul is presumably accompaniedby inclusion of other ions to preserve charge balance.
Several high Fe concentrations were detected in the quartzof the OTii and ZUii stages close to sulphide minerals, aphenomenon observed by Penniston-Dorland (2001) in the
Fig. 14 Calculated solubilities of quartz in pure water up to 900°C atthe indicated pressures according to Fournier (1985). The shaded areaemphasizes the region of retrograde quartz solubility. The tempera-ture–pressure field of retrograde quartz solubility shifts to slightlyhigher temperatures with increasing salinity (Fournier 1985); however,complete data for different salinities in the shown temperature andpressure range are not available. a Quartz of the OTi stage precipitatedduring pressure drop from lithostatic (∼1 kbar) to near hydrostaticpressure (∼0.5 kbar) accompanied by a moderate decrease in
temperature in the range of 792°C to 653°C. OTi quartz was partiallydissolved during cooling of the hydrothermal system from 540°Cdown to 400°C. OTii quartz precipitated at temperatures <400°C intothe newly created pore space. b Quartz of the ZUi stage precipitatedduring decreasing pressure from about 1 to 0.7 kbar accompanied by adecrease in temperature in the range of 880°C to 598°C. ZUi quartzwas partially dissolved during cooling of the hydrothermal systemfrom 575°C to 450°C. ZUii quartz precipitated at temperatures <450°C into the newly created pore space
724 Miner Deposita (2010) 45:707–727
Grasberg porphyry, Indonesia. These high values areinterpreted as being caused by post-crystallisation diffusionof Fe2+ from Fe-sulphides into the quartz lattice (Fig. 10d)and are not a primary feature of the ZUii. Fe2+ is a CLquenching ion (Marshall 1988) resulting in depression of thequartz CL close to sulphides (Fig. 8d). Penniston-Dorland(2001) pointed out that the diffusion coefficient of Fe inquartz is probably much higher than 1012 cm2 s−1, and thus,Fe2+ easily migrates into quartz.
The determined P-T-X conditions of the OTii and ZUiistage at Central Oyu Tolgoi and Zesen Uul are comparableto conditions recorded for the main ore stage from theBingham and Butte porphyries, USA (Redmond et al. 2004;Landtwing et al. 2005; Rusk et al. 2008b).
Stage 3: OTiii and ZUiii
The OTiii and ZUiii quartz formed during widespreadmicro-veining and subsequent crack healing (Figs. 8c and9e). Similar textures are commonly observed not only inquartz of porphyry systems (e.g. Rusk and Reed 2002) butalso in igneous quartz of felsic plutonic and subvolcanicrocks (e.g. Sprunt and Nur 1979; Valley and Graham 1996;Müller et al. 2000). The origin of the OTiii and ZUiiiquartz-forming fluids with low (Central Oyu Tolgoi) andmoderate (Zesen Uul) salinities is not clearly defined.
Stage 4: OTiv and ZUiv
The OTiv- and ZUiv-calcite micro-breccia veins pene-trating the A-type veins carry minor sulphide mineralisa-tion (Fig. 8f). These late veinlets are similar to widespreadcalcite-rich veins precipitated during the same late stage inother porphyry systems (e.g. Seedorff et al. 2005), butonly rarely described in the literature (e.g. Armstrong andWillan 1996). The high Al contents of OTiv and ZUivquartz may have resulted from the moderate acidity of theOTiv and ZUiv quartz-forming fluids, leading to the sameincrease in Al as discussed for the OTii and ZUii stages.High K concentrations are characteristic for ZUiv quartz atZesen Uul only. The early magmatic fluids of the ZesenUul system are relatively poor in K, as indicated by theabsence of K-feldspar or biotite alteration associated withearly stage quartz. Thus, the enrichment of K in the ZUivquartz may be indicative of alkali enrichment of thefluids due to an increasing interaction with the hostrocks. The moderate to high Fe content of the OTiv andZUiv quartz is presumably of primary origin as EPMAanalyses carried out at least 500 μm from any Fe-richminerals commonly show elevated Fe concentrations,excluding the phenomenon of Fe enrichment by diffusionas observed in OTii and ZUii quartz. The elevated Feconcentrations in OTiv and ZUiv quartz maybe caused
by the increasing ionisation of Fe complexes in thehydrothermal fluid due to decreasing fluid salinity andtemperature (Hemley et al. 1992).
Summary
The investigated A-type veins, which are considered tohave formed during the early stage of stockwork formation,show complex growth structures with multiple overprintingand replacement revealed by CL imaging. CL imagingcombined with high-resolution trace element analysis andfluid inclusion data assists in the reconstruction of depositformation, helping to decipher the thermal and chemicalevolution of transitional magmatic–hydrothermal systems.This combined approach reveals the chronological relation-ships of quartz precipitation and dissolution stages withrespect to ore mineralisation.
The Central Oyu Tolgoi and Zesen Uul Cu–Au porphyrysystems differ in age and are separated by more than100 km and show differences in their alteration andmineralisation styles; despite this, a common sequence ofevolutionary stages has been demonstrated by this study.Four similar major quartz crystallisation stages wereidentified in the central mineralised stockworks of theCentral Oyu Tolgoi (OTi to OTiv) and Zesen Uul deposits(ZUi and ZUiv), namely:
1. OTi and ZUi quartz occurs in barren A-type veins andas massive silicification of the host rocks. OTi and ZUiquartz is brightly luminescent with high Ti contents,indicative of crystallisation temperatures greater than600°C. This quartz stage forms more than 90 vol.% ofthe quartz mass of the stockworks in each deposit.
2. OTii and ZUii stage structures are mineralised, comprisingdull luminescent quartz with high and variable Al contentstogether with high K values in places. OTii and ZUiiquartz precipitated from a fluid with a low but fluctuatingpH. This onset of high and variable Al in quartz isindicative of the onset of sulphide mineralisation.
3. OTiii and ZUiii structures are largely barren ofmineralisation and comprise dull to non-luminescentquartz with low Ti, Al, K and Fe contents. OTiii andZUiii stage fluids had moderate salinities.
4. OTiv and ZUiv formed dull luminescent quartz withhigh and variable Al and Fe contents hosted in calcitevein breccias which in places have associatedsulphides.
The distinct trace element signature of each of theindividual quartz generation reflects the variability of fluidtemperature and acidity at different stages of the evolutionof the magmatic–hydrothermal system.
Miner Deposita (2010) 45:707–727 725

CL patterns and related trace element variations seen inthis study of the Mongolian porphyries appear identical tothose described recently from other porphyry systems (e.g.Penniston-Dorland 2001; Rusk and Reed 2002; Landtwingand Pettke 2005; Redmond et al. 2004; Rusk et al. 2006,2008a), despite major differences in age of formation andgeological setting. Just as paragenetic studies have longrevealed consistent sequences of overprinting vein assemb-lages, trace element and textural studies of quartz, revealedby EPMA and CL, appear to support the idea that acommon sequence of quartz crystallisation exists at least forthe earliest vein stages (OTi to OTiii and ZUi to ZUiii).Detailed understanding of the strongly heterogeneousdistribution of trace elements within a parageneticallycomplex series of quartz generations assists in understand-ing the processes involved in the early evolution andmineralisation in porphyry copper systems.
Acknowledgements We thank the management of Ivanhoe MinesLtd. Mongolia for the financial support of the project and forproviding the drill core samples. This work was also supported bythe Deutsche Forschungsgemeinschaft (MU 1717/2-1), the NaturalHistory Museum of London and the Geological Survey of Norway.We are grateful to Chris Stanley for discussions and suggestions. Weappreciated the constructive reviews by Tim Baker, Anthony Harrisand Noel White which improved the quality of the manuscriptconsiderably.
References
Arancibia ON, Clark AH (1996) Early magnetite–amphibole–plagio-clase alteration-mineralization in the Island Copper porphyrycopper–gold–molybdenum deposit, British Columbia. Econ Geol91:402–438
Armstrong DC, Willan RCR (1996) Orthomagmatic quartz and post-magmatic carbonate veins in a reported porphyry copper deposit,Andean intrusive suite, Livingston Island, South ShetlandIslands. Miner Deposita 31:290–306
Badarch G, Cunningham DW, Windley BF (2002) A new terranesubdivision for Mongolia: implications for the Phanerozoiccrustal growth of Central Asia. J Asian Earth Sc 21:87–110
Beane RE, Bodnar RJ (1995) Hydrothermal fluids and hydrothermalalteration in porphyry copper deposits. In: Pierce FW, Bohm JG(eds) Porphyry copper deposits of the American Cordillera.Arizona Geol Soc Digest 20, Tucson, pp 83–93
Bodnar RJ (1995) Fluid-inclusion evidence for magmatic source formetals in porphyry copper deposits. In: Thompson JFH (ed)Magmas, fluids, and ore deposits. Mineralogical Association ofCanada, Short Course Series vol. 23. Mineralogical Associationof Canada, Ottawa, pp 139–152
Brown PE, Lamb WM (1989) P-V-T properties of fluids in the systemH2O±CO2±NaCl. New graphical presentations and implications forfluid inclusion studies. Geochim Cosmochim Acta 53:1209–1221
Candela PA, Piccoli PM (1995) Model ore-metal partitioning frommelts into vapor and vapor/brine mixtures. In: Thompson JFH(ed) Magmas, fluids, and ore deposits. Mineralogical Associationof Canada, Short Course Series Vol. 23. Mineralogical Associ-ation of Canada, Ottawa, pp 101–127
Carten RB, Geraghty EP, Walker BM, Shannon JR (1988) Cyclicdevelopment of igneous features and their relationship tohigh-temperature hydrothermal features in the Hendersonporphyry molybdenum deposit, Colorado. Econ Geol83:266–296
Demars C, Pagel M, Deloule E, Blanc P (1996) Cathodoluminescenceof quartz from sandstones: Interpretation of the UV range bydetermination of trace element distributions and fluid-inclusionP-T-X properties in authigenic quartz. Am Mineral 81:891–901
Dilles JH, Einaudi MT (1992) Wall-rock alteration and hydrothermalflow paths about the Ann-Mason porphyry copper deposit,Nevada—a 6 km vertical reconstruction. Econ Geol 87:1963–2001
Forster CN, Kirwin DJ, Kavalieris I, Crane D, Orssich C, Panther C,Garamjav D, Munkhbat TO, Niislelkhuu G (2003) Recentadvances in the understanding of the geology and mineralisationof the Oyu Tolgoi copper–gold porphyry deposits, south Gobi,Mongolia. Mongolian Geoscientist 21:36
Fournier RO (1985) The behavior of silica in hydrothermal solutions.In: Berger BR, Bethke PM (eds) Geology and geochemistry ofepithermal systems. Rev Econ Geol Vol. 2. Society of EconomicGeologists, Littleton, pp 45–61
Fournier RO (1999) Hydrothermal processes related to movement offluid from plastic to brittle rock in the magmatic–epithermalenvironment. Econ Geol 94:1193–1211
Gerel O (1995) Mineral resources of the western part of the Mongol–Okhotsk fold belt. Resour Geol Spec Issue 18:151–157
Gerel O (1998) Phanerozoic felsic magmatism and related mineralisa-tion in Mongolia. Bull Geol Surv Jpn 49:239–248
Götze J, Plötze M, Habermann D (2001) Origin, spectral character-istics and practical applications of the cathodoluminescence (CL)of quartz—a review. Min Pet 71:225–250
Guilbert JM, Lowell JD (1974) Variations in zoning patterns inporphyry ore deposits. Can Min Metall Bull 67(742):99–109
Gustafson LB, Hunt JP (1975) The porphyry copper deposit at ElSalvador, Chile. Econ Geol 70:857–912
Harris AC, Golding SD (2002) New evidence of magmatic-fluid-related phyllic alteration: implications for the genesis of porphyryCu deposits. Geology 30:335–338
Harris AC, Kamenetsky VS, White NC, van Achterbergh E, Ryan CG(2003) Melt inclusions in veins: linking magmas and porphyryCu deposits. Science 302:2109–2111
Hedenquist JW, Lowenstern JB (1994) The role of magmas in theformation of hydrothermal ore deposits. Nature 370:519–527
Heinrich CA (2005) The physical and chemical evolution of low-salinity magmatic fluids at the porphyry to epithermal transition:a thermodynamic study. Miner Deposita 39:864–889
Hemley JJ, Cygan GL, Fein JB, Robinson GR, D’Angelo WM (1992)Hydrothermal ore-forming processes in the light of studies inrock-buffered systems: I. Iron–copper–zinc–lead sulphide solu-bility relations. Econ Geol 87:1–22
Ivanhoe Mines (2008) Mongolia projects. http://www.ivanhoe-mines.com/s/Home.asp. Accessed 20th May 2008
Jargalsaihan D (1996) Mineral resources of Mongolia. In: JargalsaihanD, Kazmer M, Baras Z, Sanjaadorj D (eds) Guide to the geologyand mineral resources of Mongolia. Geological Exploration,Consulting and Services, Ulaanbaatar, pp 111–221
Jourdan A-L, Vennemann TW, Mullis J, Ramseyer K, Spiers CJ(2009) Evidence of growth and sector zoning in hydrothermalquartz from Alpine veins. Eur J Mineral 21:219–231
Khashgerel B-E, Kavalieris I, Hayashi K-I (2008) Mineralogy,textures, and whole-rock geochemistry of advanced argillicalteration: Hugo Dummett porphyry Cu–Au deposit, Oyu Tolgoimineral district, Mongolia. Miner Deposita 43:913–932
Kirwin DJ, Forster CN, Garamjav D (2003) The discovery history ofthe Oyu Tolgoi porphyry copper–gold deposit, South Gobi,
726 Miner Deposita (2010) 45:707–727
Mongolia. Proc. NewGenGold 2003 Conference, Perth, WA, pp130–146
Kirwin DJ, Forster CN, Kavalieris I, Crane D, Orssich C, Panther C,Garamjav D, Munkhbat TO, Niislelkhuu G (2005a) The OyuTolgoi copper–gold porphyry deposits, south Gobi, Mongolia. In:Seltmann R, Gerel O, Kirwin DJ (eds) Geodynamics andmetallogeny of Mongolia with a special emphasis on copperand gold deposits. SEG-IAGOD field trip, 14–16 August 2005,8th biennial SGA meeting. IAGOD Guidebook Series 11.CERCAMS/NHM, London, pp 155–168
Kirwin DJ, Wilson CC, Turmagnai D, Wolfe R (2005b) Explorationhistory, geology, and mineralisation of the Kharmagtai gold–copper porphyry district, South Gobi region, Mongolia. In:Seltmann R, Gerel O, Kirwin DJ (eds) Geodynamics andmetallogeny of Mongolia with a special emphasis on copperand gold deposits. SEG-IAGOD field trip, 14–16 August 2005,8th biennial SGA meeting. IAGOD Guidebook Series 11.CERCAMS/NHM, London, pp 175–191
Landtwing MR, Pettke T (2005) Relationships between SEM-cathodoluminescence response and trace-element compositionof hydrothermal vein quartz. Am Mineral 90:122–131
Landtwing MR, Pettke T, Halter WE, Heinrich CA, Redmond PB,Einaudi MT, Kunze K (2005) Copper deposition during quartzdissolution by cooling magmatic–hydrothermal fluids: the Bing-ham porphyry. Earth Planet Sci Lett 235:229–243
Marshall DJ (1988) Cathodoluminescence of geological materials.Unwin Hyman, Boston
Müller A, Seltmann R, Behr H-J (2000) Application of cathodolumi-nescence to magmatic quartz in a tin granite—case study fromthe Schellerhau Granite Complex, Eastern Erzgebirge, Germany.Miner Deposita 35:169–189
Müller A, Lennox P, Trzebski R (2002) Cathodoluminescence andmicro-structural evidence for crystallisation and deformationprocesses of granites in the Eastern Lachlan Fold Belt (SEAustralia). Contrib Mineral Petrol 143:510–524
Müller A, Armstrong R, Herrington R, Seltmann R (2003) Character-isation of quartz textures in porphyry copper ore deposits byscanning electron microscope–cathodoluminescence (SEM-CL).Mongolian Geoscientist 21:32–35
Penniston-Dorland SC (2001) Illumination of vein quartz textures in aporphyry copper ore deposits using scanned cathodolumines-cence: Grasberg Igneous Complex, Irian Jaya, Indonesia. AmMineral 86:652–666
Perelló J, CoxD,GaramjavD, Sanjdorj S, Diakov S, Schissel D,MunkhbatT-O, Oyun G (2001) Oyu Tolgoi, Mongolia: Siluro-Devonianporphyry Cu–Au–(Mo) and high-sulfidation Cu mineralisation witha Cretaceous chalcocite blanket. Econ Geol 96:1407–1428
Perny B, Eberhardt P, Ramseyer K, Mullis J, Pankrath R (1992)Microdistribution of Al, Li, and Na in α-quartz: possible causesand correlation with short-lived cathodoluminescence. AmMineral 77:534–544
Pollard PJ, Taylor RG (2002) Observations on the nature, associationsand paragenetic positioning of gold within selected samples fromthe Kharmagtai and OV3 Cu–Au deposits, South Gobi regionMongolia. Report to Ivanhoe Mines Ltd. (unpubl.)
Proffett JM (2003) Geology of the Bajo de la Alumbrera porphyrycopper–gold deposit, Argentina. Econ Geol 98:1535–1574
Pokrovskii VA, Helgeson HC (1995) Thermodynamic properties ofaqueous species and the solubilities of minerals at high pressuresand temperatures: the system Al2O3-H2O-NaCl. Am J Sci295:1255–1342
Redmond PB, Einaudi MT, Inan EE, Landtwing MR, Heinrich CA(2004) Copper deposition by fluid cooling in intrusion-centeredsystems: new insights from the Bingham porphyry ore deposit,Utah. Geology 32:217–220
Rusk BG, Reed M (2002) Scanning electron microscope–cathodolu-minescence analysis of quartz reveals complex growth historiesin veins from the Butte porphyry copper deposit, Montana.Geology 30:727–730
Rusk BG, Reed MH, Dilles JH, Kent AJR (2006) Intensity of quartzcathodoluminescence and trace element content in quartz fromthe porphyry copper deposit at Butte, Montana. Am Mineral91:1300–1312
Rusk BG, Lowers HA, Reed MH (2008a) Trace elements inhydrothermal quartz: relationships to cathodoluminescence tex-tures and insights into vein formation. Geology 36:547–550
Rusk BG, Reed MH, Dilles JH (2008b) Fluid inclusion evidence formagmatic–hydrothermal fluid evolution in the porphyry copper–molybdenum deposit at Butte, Montana. Econ Geol 103:307–334
Seedorff E, Dilles JH, Proffett JM Jr, Einaudi MT, Zurcher L, StavastWJA, Johnson DA, Barton MD (2005) Porphyry deposits:characteristics and origin of hypogene features. In: HedenquistJW, Thompson JFH, Goldfarb RJ, Richards JP (eds) EconomicGeology 100th Anniversary volume. Society of EconomicGeologists, Littleton, pp 251–298
Seltmann R, Porter TM (2005) The porphyry Cu–Au/Mo deposits ofcentral Eurasia. 1. Tectonic, geologic and metallogenetic settingand significant deposits. In: Porter TM (ed) Super porphyrycopper and gold deposits: a global perspective, vol 2. PGC,Adelaide, pp 467–512
Sprunt ES, Nur A (1979) Microcracking and healing in granites: newevidence from cathodoluminescence. Science 205:496–497
Stevens-Kalceff MA, Phillips MR (1995) Cathodoluminescencemicrocharacterization of the defect structure of quartz. PhysRev B 52:3122–3134
Valley JW, Graham CM (1996) Ion microprobe analysis of oxygenisotope ratios in quartz from Skye granite: healed micro-cracks,fluid flow, and hydrothermal exchange. Contrib Mineral Petrol124:225–234
Wainwright AJ, Tosdal RM, Forster C, Kavalieris I, Crane D, FindlayA, Kirwin D (2004) Structure and stratigraphy of the Oyu TolgoiCu–Au porphyry, Mongolia. Poster, Cordilleran Roundup 2004,http://www.mdru.ubc.ca/home/research/hd-ot-roundup_04_poster.pdf. Accessed 20 May 2008
Wark DA, Spear FS (2005) Titanium in quartz: cathodoluminescenceand thermometry. Geochim Cosmochim Acta Suppl 69:A592
Wark DA, Watson EB (2006) TitaniQ: a titanium-in-quartz geo-thermometer. Contrib Mineral Petrol 152:743–754
Wilkinson JJ (2001) Fluid inclusions in hydrothermal ore deposits.Lithos 55:229–272
Miner Deposita (2010) 45:707–727 727