Obsidian provenance studies in archaeology: A comparison between PIXE, ICP-AES and ICP-MS
Upload
uni-goettingenCategory
view
0download
0
Trace elements in quartz ndash a combined electron microprobe secondary ionmass spectrometry laser-ablation ICP-MS and cathodoluminescence study
AXEL MUumlLLER1 MICHAEL WIEDENBECK2 ALFONS M VAN DEN KERKHOF3 ANDREAS KRONZ3
and KLAUS SIMON3
1 Natural History Museum Dept Mineralogy Cromwell Road London SW7 5BD United Kingdom e-mailamuellernhmacuk
2 GeoForschungsZentrum Potsdam Telegrafenberg B127 D-14473 Potsdam Germany3 Geowissenschaftliches Zentrum Goumlttingen Goldschmidtstrasse 3 D-37077 Goumlttingen Germany
Abstract We present electron microprobe secondary ion mass spectrometry and laser ablation inductively coupled massspectrometry data for common trace elements (Li Al Ti Na K Fe) in quartz Our samples from both magmatic and hydrothermalenvironments all show heterogeneity at the single grain scale
Concentrations of Al and Ti determined by EPMA SIMS and LA-ICP-MS are in rough agreement and confirm the robustness ofthese analytical methods The highest precision data were obtained from SIMS but this is outweighed by the lack of a high qualityquartz reference sample for calibrating this technique Due to its large sampling volume laser ablation analyses gave only averagevalues for trace elements in zoned quartz Because of its better spatial resolution in conjunction with the ability to combine spotanalyses with cathodoluminescence imaging EPMA proved the most reliable in situ method for obtaining quantitative trace elementdata of quartz at concentrations in excess of a few 10rsquos of ppm and at the lt10 microm scale However our sample contained few elementsat such high concentration levels
We found in our samples a positive correlation between CL signature and the observed Ti contents for the samples investigatedIn particular blue luminescing zones were found to have elevated Ti concentrations as compared to other nearby domains Using amathematical spectral deconvolution we show the highly complex nature of CL emission ndash it appears that other trace element mightplay a less pronounced role in this process Our examples demonstrate the value of CL for documenting multi-phase alteration inquartz
In agreement with previously proposed models we confirm a significant correlation between mono- and tri-valent cationconcentrations in quartz A very strong correlation in alkali metal contents is particularly obvious Ti was found to be universallypresent in magmatic quartz but at much lower abundance in hydrothermal quartz
Key-words quartz trace elements cathodoluminescence electron microprobe mass spectrometry SIMS LA-ICP-MS
Introduction
The in situ trace element analysis of quartz is technicallydifficult and consequently the relationship between quartzchemistry and petrogenesis is virtually unknown The majorgoal of such analysis is to understand the crystal growthmechanisms and diffusion involved in magmatic hydro-thermal and metamorphic processes This investigation fo-cuses on rhyolitic granitic and hydrothermal quartz
Secondary ion mass spectrometry (SIMS Shimizu et al1978 Rovetta et al 1989 Perny et al 1992 Watt et al1997) laser-ablation inductively-coupled plasma-massspectrometry (LA-ICP-MS Larsen et al 2000 Flem et al2002) and wavelength-dispersive electron-probe micro-analysis (EPMA) are in situ micro-beam techniques whichare suitable for quantitative analysis of trace elements inquartz (Lowenstern amp Sinclair 1996 Morgan et al 1998
Mullis amp Ramseyer 1999 Muumlller et al 2000 Van denKerkhof et al 2001) These methods may provide in situ el-ement data with a high sensitivity and good spatial resolu-tion allowing for the quantitative determination of elementzoning within single crystals
Structural andor chemical variations within quartz crys-tals (eg crystal growth zones or alteration structures) canbe imaged with cathodoluminescence (CL) wavelength andintensity variations CL-contrasted growth zoning has beenreported both in hydrothermal quartz (eg Ramseyer et al1988 Ramseyer amp Mullis 1990 Perny et al 1992) and inmagmatic quartz (eg Schneider 1993 Watt et al 1997DrsquoLemos et al 1997 Muumlller et al 2000 Goumltze et al2001) Retrograde alteration may change the primary CLsignature We related the sampling spot position withgrowth zoning and neocrystallised domains imaged by CLwithin the quartz crystals
Eur J Mineral2003 15 747ndash763
DOI 1011270935-122120030015-07470935-1221030015-0747 $ 765
2003 E Schweizerbartrsquosche Verlagsbuchhandlung D-70176 Stuttgart
Quartz has an exceptionally stable atomic configurationof Si-O bonds that allows only a minimal amount of other el-ements into its structure Substitutional and interstitial traceelements may either replace Si or enter channels runningparallel to the c-axis respectively Al3+ for example is themost common substitutional trace element whereas Li+ H+K+ and Na+ are common interstitial elements which are re-quired for charge balancing (Bambauer 1961 Dennen1966 1967 Dennen et al 1970 Lehmann amp Bambauer1973 Lehmann 1975 Smith amp Steele 1984 Weil 1984)In addition to aluminium Ti4+ Fe3+ Ge4+ and P5+ are com-mon substitutes for Si4+ (eg Maschmeyer amp Lehmann1983 Goumltze et al 2001)
Besides structural impurities quartz frequently containssolid and fluid inclusions Possible gradational transitionsbetween structural impurities and inclusions are a matter ofdiscussion (Stenina et al 1988 Blankenburg et al 1994Stenina 1995 Simon 2001) The often unknown structuralstate of trace elements in the quartz lattice may complicatethe interpretation of measured trace element contents Infor-mation about structural defects can be obtained from bothFourier-transform infrared (FTIR) spectroscopy (eg Kats1962 Bambauer et al 1963 Aines amp Rossmann 1984Kronenberg et al 1986 Rovetta et al 1989 Bahadur1994) and electron paramagnetic resonance (EPR) (egWeil 1984 Goumltze amp Ploumltze 1997) However FTIR spec-troscopy is the only method that can define both the quanti-tative distribution and the speciation of water in quartzSpectra of quartz containing structural water in the form ofH+ OH- and H2O show distinct absorption bands between3000 and 3700 cm-1 According to Moiseev (1985) absolutedefect concentrations for Al and Ti can be calculated fromEPR intensities However EPR analysis does not provide insitu measurement of the intra-granular defect distributionIn this study we show that in situ micro-analysis providesbetter insights into the nature of crystal heterogeneity
The aims of this study are tondash evaluate the in situ micro-analytical methods SIMS EP-
MA LA-ICP-MS in determining trace elements in natu-ral quartz samples
ndash compare and explain the analytical results regarding thespatial resolution and limits of detection
ndash correlate CL and trace elements to define the causes ofCL
ndash determine which is the best analytical approach for deter-mining trace element contents in quartz
Analytical techniques
Electron probe micro-analysis (EPMA)
Trace element abundances of Al K Ti and Fe in quartzwere performed with a JEOL 8900 RL electron microprobeat the Geowissenschaftliches Zentrum Goumlttingen equippedwith 5 WD detectors and with a CL detector using an ex-tended wavelength range from 200 to 900 nm
SEM-CL images were collected with the JEOL electronmicroprobe system using slow beam scan rates of 20 s perimage at processing resolution of 1024x860 pixels and 256
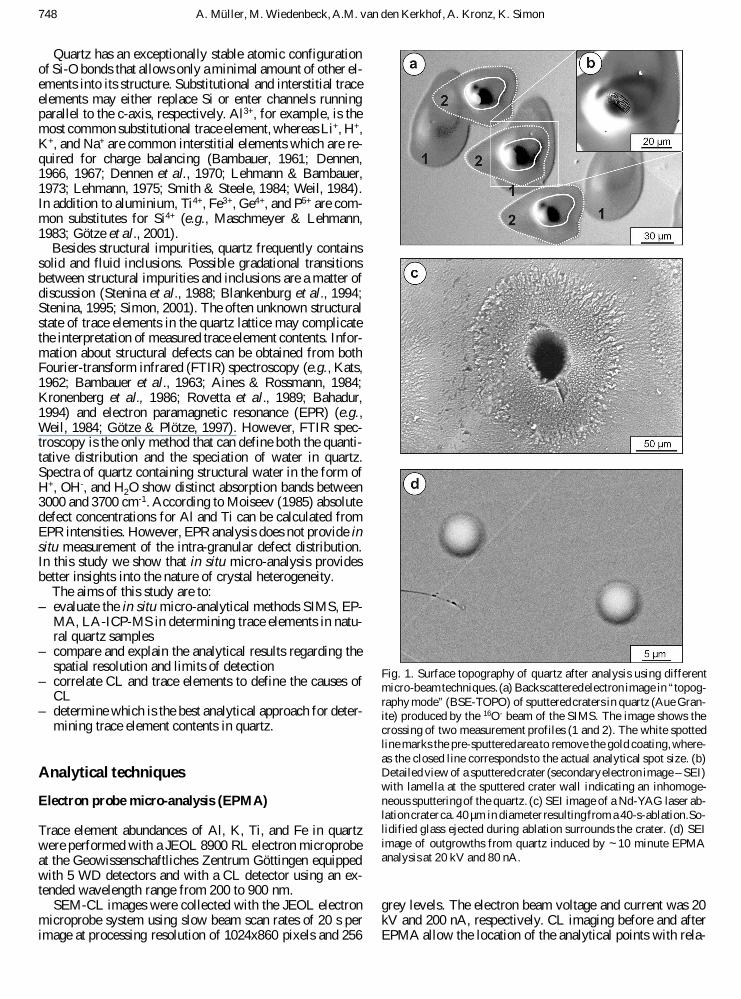
Fig 1 Surface topography of quartz after analysis using differentmicro-beamtechniques(a) Backscatteredelectron image in ldquotopog-raphy moderdquo (BSE-TOPO) of sputteredcraters in quartz (Aue Gran-ite) produced by the 16O- beam of the SIMS The image shows thecrossing of two measurement profiles (1 and 2) The white spottedline marks the pre-sputteredarea to remove the gold coatingwhere-as the closed line corresponds to the actual analytical spot size (b)Detailed view of a sputteredcrater (secondaryelectron image ndash SEI)with lamella at the sputtered crater wall indicating an inhomoge-neous sputteringof the quartz (c) SEI image of a Nd-YAG laser ab-lationcrater ca 40 microm in diameter resultingfrom a 40-s-ablationSo-lidified glass ejected during ablation surrounds the crater (d) SEIimage of outgrowths from quartz induced by ~ 10 minute EPMAanalysis at 20 kV and 80 nA
grey levels The electron beam voltage and current was 20kV and 200 nA respectively CL imaging before and afterEPMA allow the location of the analytical points with rela-
748 A Muumlller M Wiedenbeck AM van den Kerkhof A Kronz K Simon
Fig 2 (a) Calculated amount of emitted photons given as rZ-curves from quartz with 01 wt Al and 01 wt Ti and a density of265 gcm3 according to Newbury amp Myclebust (1995) For calcula-tion we use a accelerationvoltageof 20 kV a beam diameterof 5 micromand a take-offangle of 40deg (b) Cumulativeemission depthof X-raysfrom quartz (c) Cumulative interactionvolume in quartz
tion to CL structures Grey scale intensities along the mea-sured trace element profiles within quartz crystals were pro-cessed fromthe SEM-CL images using Optimas 60 software
The following standards were used for the analysis syn-thetic Al2O3 (5292 wt Al) orthoclase from LucerneSwitzerland (1218 wt K) synthetic TiO2 (5995 wt Ti)and haematite from Rio Marina Elba (6994 wt Fe) Forhigh precision and sensitivity a beam current of 80 nA abeam diameter of 5 microm (Fig 1) and counting times of 15 sfor Si and of 300 s for Al Ti K and Fe were chosen
Fig 3 Comparison of the sampling sizes of EPMA SIMS and LA-ICP-MS provided by our analytical conditions Thin dashed linesrepresent typical growth zoning observed in magmatic quartz phe-nocrysts
The sampling volume of the generated characteristic X-rays was calculated by using a Monte Carlo electron trajec-tory simulation program (Newbury amp Myclebust 1995)The program performs a calculation of the amount of gener-ated and emitted photons ( ) in a given phase with a knowncomposition and density (r) versus the penetration depth(Z) Emitted photons given as phi-rho-z ( rZ)-curves areshown in Fig 2a For calculation we assume quartz with 01wt Al and 01 wt Ti and a density of 265 g cm-3 Sameacceleration voltage (20 kV) and beam diameter (5 microm) likethe quantitative measurements were used for calculationThe take-off angle in our probe is 40deg We ran 200000 elec-tron trajectories to ensure a high precision The results areshown in Fig 2b and 2c 99 of the Al K - and Ti K -X-rays are emitting from a depth smaller than 27 microm and 100 are reached in a depth of approximately 325 microm for TiK and 345 microm for Al K Assuming a nearly hemispheri-cal interaction volume and 5 microm beam diameter hence thecalculation gives a total volume of less than 150 microm3 where99 of the characteristic X-rays emit from (Fig 2c 3) Afocussed beam would generate a much smaller exciting vol-ume but beam induced destruction (Fig 1d) of the quartzrequires to defocus the electron beam
Fig 4a documents the strong increase of the Al K signalduring the first two minutes of electron bombardment usinga focussed beam A strong decrease of the measured ab-sorbed current is also observable This phenomena is relatedto charging and destruction of the SiO2 structure After 2minutes the signal becomes stable Defocussing the beamminimises this effect using a 20 microm beam diameter elimi-nates it all together
The software of the quantitative EPMA analysis correctsthe background contribution (Bremsstrahlung) in a linearway Curvature in the background behaviour produces sys-tematic errors by calculating a too high averaged back-ground signal from the measurements on the left and rightside of the characteristic X-ray peak We calculated the con-tribution of the curved background behaviour by perform-ing precise scans near the measured X-ray lines of the traceelements While K K Ti K and Fe K show a highly line-ar behaviour the background of Al K and Na K is curvedThis curvature would lead to an ldquounder estimationrdquo of Al ofapproximately 50 ppm (Fig 4b) The analytical error was
Trace elements in quartz 749
Fig 4 (a) Drift of the Al K signal at 20 kV and 80 nA using beamdiameters of 3 microm and of 20 microm Note the strong decrease of the ab-sorbed current signal (Iabs) using the 3 microm beam diameter The signaldecrease gives evidence for charging effects on the sample surfaceThus the total X-ray signal (Iemitted) of Al K increases within thefirst two minutes of electron excitation For a beam diameter of 20microm the signalbehavesstablewithin the error of the countingstatistic(b) X-ray spectrum around the Al K line (wavelength Al K 8339 Aring) given as counts per 30 seconds per step was acquired on aAl-free quartz using 120 nA 20 kV and a beam diameter of 15 micromThe background signal (ldquoBremsstrahlungrdquo) shows a curved behav-iour which results in an underestimation of approximately 50 ppmAl when linear background fitting is applied Triangles indicate themeasured positions of the peak and the background
calculated by the counting statistic of peak and backgroundsignals following the Gauss law of error propagation Atlow element concentrations the background forms the mainpart of the total signal of the microprobe measurement Onthe other hand the background signal is nearly constant for agiven quartz matrix Therefore the absolute error of thecounting statistic is nearly constant The precision of theanalyses was 10 ppm absolute standard deviation for Al 6ppm for K 12 for Ti and 10 for Fe
Trace element measurements were carried out adjacent toeach SIMS crater Raw analysis were converted into con-centrations using the rZ matrix correction method ofArmstrong (1995) Limits of detection (LOD) listed in Table
1 were calculated with a confidence level of 95 on the ba-sis of the Studentrsquos t-distribution (Plesch 1982) from 60background measurements with the following equation
ILOD = tz (Pf) BG
where BG = standard deviation of the mean of the back-ground tz (Pf) = level of significance of the Studentrsquos t-dis-tribution for binomial limitation determined by the confi-dence level P and the degrees of freedom f = number ofbackground measurements minus 2 The level of signifi-cance amounts 2002 for 60 measurements
Due to the lack of suitable and certified homogeneousstandards which contain the measured elements in a rangecomparable to the analysed samples the absolute accuracyof the method could only be estimated Two important factsshould be taken into account
(1) Due to the constant matrix composition regarding themajor-elements net intensity to concentration ratios arestrictly linear (with a correlation R2-value over 998 )Hence the correction factor of the rZ matrix correctionbehaves nearly constant if the ranges of all element concen-trations are narrow
(2) Despite the fact that standards chosen for analysingAl K Ti and Fe were not ideal in consideration of the highamounts of the elements they are well characterised highlystoichiometric and produce a negligible error by countingstatistic during calibration Latter would be not the case ifstandards were used which contain the desirable elements intrace amounts On the other hand it has to be proven that ma-trix effects will not produce large systematic errors Regard-ing the differences of the total correction factors given instandards and quartz samples they do not exceed 12 However the ldquorealrdquo systematic errors derived by an inaccu-rate matrix correction factor must be much smaller Other-wise the correction of the raw values in complex mineralswould never lead to an accurate stoichiometry within a fewpercent relative error when the materials for standardisationand measurement would be different With no doubt the cor-rection factors in the trace ranges could be assumed to becorrect
In conclusion the largest source to produce systematicerrors in EPMA trace measurements are non linear back-ground behaviour and signal drift due to charging and sam-ple destruction during signal acquisition
Table 1 Limits of detection(LOD) for LA-ICP-MS and EPMA Thevalues are given in microg middot g-1
method EPMA LA-ICP-MS
Li nd 02Na 62 385Al 42 56K 10 ndTi 17 11Cr nd 12Mn nd 10Fe 21 27Ge nd 14
nd ndash not determined
750 A Muumlller M Wiedenbeck AM van den Kerkhof A Kronz K Simon
Secondary ion mass spectrometry (SIMS)
We used the Cameca ims 6f SIMS in Potsdam in order to as-sess trace element abundances Prior to SIMS measure-ments the samples are ultrasonically cleaned for five min-utes in ethanol dried briefly in an oven and subsequentlycoated with a ca 70 nm thick conductive high-purity Aufilm For each measurement a focussed 16O- ion beam re-moved between 2000 and 5000 microm3 of material from thepolished sample surface a small fraction of this material be-ing ionised during the lsquosputteringrsquo process the ions wereelectrostatically accelerated into a mass spectrometer usinga 7 kV extraction potential We used a nominally 125 kVprimary ion accelerating potential with a beam current of 40nA resulting in a ~30 microm diameter crater (Fig 1 3) Analy-ses were conducted either as individual spot analyses or asautomatic point profiles of a given step spacing of either 50and 100 microm
Prior to each analysis the sample surface was cleaned bypre-sputtering the sample for 4 minutes Each analysis con-sisted of 20 cycles of the peak-stepping sequence 6Li (10 sintegration time) 23Na (10 s) 27Al (10 s) 30Si (2 s) 39K (10s) 48Ti (10 s) and 54Fe (10 s) The detection limits could notbe directly defined due to the lack of a demonstrably lsquoblankrsquoquartz sample however based on our low dynamic back-ground of ~2 counts per minute and the lsquocleanrsquo nature of thequartz spectrum our detection limits can be safely assumedto be in the sub-ppm range (see also eg Zinner amp Crozaz(1986) for discussion of SIMS detection limits) Concerningthe accuracy of our SIMS quantitative data we were severe-ly limited by the lack of a well characterised demonstrablyhomogeneous reference sample Hence any errors in the as-signed elemental concentration of our primary standard willbe propagated systematic errors on the analyses of the sam-ples which we investigated We operated our mass spec-trometer at low mass resolution M M = 300 In order tosuppress isobaric molecular interferences we applied an en-ergy offset of 50 V The external precision of the analyseswas 6 ppm absolute standard deviation for 6Li 23 ppm for23Na 2 ppm for 27Al 13 ppm for 39K 3 ppm for 48Ti and 9ppm for 54Fe
The absolute abundance of each of these elements werecalculated by comparison with a reference sample of largenatural quartz crystal (Table 2) Calculated concentrationsrely on the assumption that the relative ion yields for aknown major element (in our case Si) and a trace elementare constant for a given matrix It is therefore necessary toclosely match both the chemical composition and the latticestructure of the reference lsquostandardrsquo and the sample In thisregard quartz is one of the easier phases to analyse due tothe fact that chemical solid solutions are essentially non-ex-istent for this phase For this study we made use of a sampleof Brazil quartz for which Li Al Ti and Fe concentrationshad been determined from solution by ICP AES and ICP-MS (Table 2) We did not possess reliable Na and K data forour reference sample and hence our SIMS measurementscan only provide relative abundances for these elements Wesuggest that the problem which were encountered with thesetwo alkali group elements might be related to the presenceof fluid inclusions which might be present in the Brazil peg-
Table 2 Trace element concentrationsof the Brazil quartz referencesample used for calibration of SIMS analyses The values are givenin microg middot g-1
element ICP AES(3g)
ICPGFZ Pots-dam (01 g)
ICP-MSGZG Goumlttin-gen (01 g)
value used
Li 44 12 (MS) 108 91Na 534 ndash ndash ndashAl 75 100 (AES) ndash 87K 228 ndash ndash ndashTi 10 lt20 (AES) ndash 10Fe 32 ndash ndash 32
from Schmidt amp Ziemann (2000)
matite crystal as these two element would be greatly con-centrated in such fluids thereby biasing the bulk concentra-tion data One might expect that the SIMS analyses of the al-kali element Li might also be similarly impacted though ourresults do not clearly suggest this (Table 3) Regarding theaccuracy of the data for Al Ti and Fe two lines of reasoningconstrain the magnitude of any systematic errors whichmight be present (1) the reproducibility between two inde-pendent bulk analyses for both Al and Ti were not extreme(see Table 2) and (2) the SIMS data are generally consistentto within a factor of two with the other techniques reportedhere Hence it seems likely that any systematic errors in-duced by the uncertainties in the composition of the refer-ence sample should not be larger than perhaps a factor of 05or 10 at the worst
This discussion clearly highlights the need for a suite ofhigh quality quartz reference samples which should be madeavailable to the SIMS community Only once a well charac-terised and demonstrably homogeneous set of samples is de-veloped will SIMS analytical accuracy be brought in linewith the techniquersquos superior precision smaller samplingsize and lower limits of detection
Laser ablation ndash inductively coupled plasma massspectrometry (LA-ICP-MS)
We used a laser-ablation microsampler coupled to an induc-tively coupled plasma mass spectrometer (LA-ICP-MS) FI-SONS PQ2+ at the Geowissenschaftliches Zentrum Goumlttin-gen A FISONS NdYAG UV-laser (266 nm) microprobewith a laser pulse repetition rate of 5 Hz was focused ontothe surface of a polished sample Using a laser beam energyof 225 mJ the middle aperture and an acquisition time of40 s the laser ablates craters 40 to 50 microm in diameter and be-tween 90 to 120 microm in depth The volume of ablated samplematerial amounts between 11 middot 105 and 24 middot 105 microm3 Theoptimal laser configuration was established through multi-ple test measurements and varying counting rates to reachlowest detection limits to avoid sample outbreak during ab-lation and to get smallest possible craters A laser beamwith larger diameter and higher energy ablates more materi-al and results in lower detection limits which are inverselyproportional to 3rd root of the ablation volume (Potts et al
Trace elements in quartz 751
1995) Nevertheless the risk that micro-inclusions withinthis volume are also ablated cannot be avoided and there-fore a compromise is necessary The ablated material wasentrained by a high purity Ar gas at a flow rate of 08-13 lmin Isotopic masses were analysed using a quadrupolemass filter
All data were calibrated against the external standardNIST SRM610 glass and the internal standard of the Si val-ue (467 x 105 ppm = stoechiometric concentration of Si inquartz) We used the values from Pearce et al (1997) for cal-culating the absolute concentrations in the quartz samplesReplicate analyses of the NIST SRM610 and NISTSRM612 glass standard were done under the same operatingconditions In terms of accuracy these analyses showed thatthe LA-ICP-MS values are within plusmn 12 of the concentra-tions given by Pearce et al (1997)
Eleven mass stations were analysed during each of theblank circles 7Li 23Na 27Al 29Si 30Si 49Ti 53Cr 55Mn 57Feand 72Ge The isotopes were chosen (1) to avoid possible in-terferences with other isobaric masses and (2) to obtain thehighest peak to background ratios The high sensitivity ofthe ICP-MS for most trace elements in quartz is demonstrat-ed by the low detection limits as listed in Table 1 The deter-mination of Na is a general problem of micro-beam analysisbecause its high volatility and abundance leads to an omni-present Na contamination The external precision of theanalyses was 4 ppm absolute standard deviation for 7Li 11ppm for 27Al 10 ppm for 49Ti 11 ppm for 53Cr 9 ppm for55Mn 9 ppm for 57Fe and 12 ppm for 72Ge
Optical cathodoluminescence
The CL emission of quartz was determined using a hot-cath-ode luminescence microscope (Neuser et al 1995) at an en-ergy of 14 keV and a filament current of 018 mA The spec-tral response of the luminescence was recorded with the tri-ple-grating (100 linesmm 1200 linesmm and 1800 linesmm) spectrograph TRIAX 320 equipped with a LN2-cooledCCD-detector The 100 linesmm grating was used to ac-quire an overview spectrum between 400 and 900 nm (31-14 eV) The 1200 linesmm grating provided detailed spec-tra from within 70 nm spectral range The sample surfacewas analysed over a diameter of 800 microm using a 20x040objective The integration time for spectrum acquisition was20 s for the 100 linesmm grating and 30 s for the 1200 linesmm grating The spectra were corrected for the total instru-ment response
The CL emission bands plotted as deconvoluted Gauss-ian curves were determined using the procedure of Muumlller etal (2002) The areas under each Gaussian curve were usedto estimate the percentage of the individual emission bandsof the total spectrum between 14 and 31 eV
Fourier-transform infrared (FTIR) spectroscopy
Transmission FTIR spectra of quartz were obtained usingthe Perkin Elmer 1760-X FTIR spectrometer by S Vaupel atthe University Goumlttingen The spectrometer operates with
Fig 5 SEM-CL images of quartz documenting the position of spotanalysismade by SIMS EPMA and LA-ICP-MS (a) Quartz pheno-cryst in the Aue Granite showing weakly developed concentricgrowth zoning overgrown by groundmass quartz which is free ofzoning The crystal is penetrated by non-luminescent domains ofneocrystallised(secondary)quartz (black) (b) Zoned quartz pheno-cryst of the Weinheim Rhyolite Dark areas correspondto red to red-dish brown CL-colours and bright areas correspond to blue to violetcolours (c) Pattern of secondaryCL structurestypicalwithin the Ha-kos megaquartz In addition to the homogeneous host quartz threegenerations of younger quartz may be readily distinguished(1) an-nealed domains with very weak CL associated with fluid inclusiontrails (2) bright luminescent linear trails some of which overprintpopulation (1) (3) narrow linear cracks annealed by non-lumines-cent quartz
an external microscope with a separate mercury-cadmium-telluride-detector The microscope is supplemented with avacuum sample chamber (Dewar K-770-T) which is re-quired for liquid N2-cooling of the sample and ray path(ndash190 to ndash194degC) to suppress interference with atmosphericH2O and CO2 The cooling resulted in a maximal signalnoise ratio of the detected spectra Moreover the spectrawere obtained at cryogenic temperatures to distinguish fluidinclusion water from crystallographic bounded water Thequartz wafer is penetrated by an electromagnetic UV beam(wavelength = 2-25 microm) The analysis were carried out ondoubly polished wafers 250 microm in thickness Prior to the
752 A Muumlller M Wiedenbeck AM van den Kerkhof A Kronz K Simon
Fig 6 CL spectra of quartz acquired after 05 2 and 7 minutes of electron exposure recorded with the 100 linesmm grating Also shown isthe calculatedbest-fit Gaussian population for the 7-min-spectra
measurement the wafers were cleaned with acetone anddried for 10 h at 110degC The spectra were acquired in a rangeof wave numbers between 5000 to 2000 cm-1 with 200 scansin the transmission modus The resolution of the measure-ments was 4 cm-1 The spot size of the beam on the samplewas 40 microm in diameter which allows the recording of severalspectra along a traverse within one crystal Backgroundmeasurements were conducted after each spectra The spec-trum processing was carried out on a PC for baseline correc-tion sample thickness correction and converting of thetransmission spectrum to the absorption spectrum
Sample petrography and cathodoluminescence
We studied three samples from three distinct geological en-vironments
Porphyritic biotite granite of Aue (Western ErzgebirgeGermany) is Upper Carboniferous in age and containsquartz phenocrysts up to 2-5 mm in size In CL these pheno-crysts show weakly contrasted concentric growth zonation(Fig 5a) The quartz has a bright unstable blue CL whichchanges over 2 minutes of electron irradiation to a violetred-brown (Fig 6a) The phenocrysts are cemented andovergrown by groundmass quartz which is free of growthzoning The crystals also contain non-luminescent neocry-
stallised domains of secondary quartz These domains occurpreferably around fluid inclusions which are typically con-nected by annealed cracks
Euhedral phenocrysts in the Lower Permian Weinheimrhyolite from the Southern Odenwald Mts (Germany) occurwithin a fine-grained groundmass These phenocrysts showcomplex zoning patterns (Fig 5b) which appear as shades ofblue and violet in CL (Fig 6b c) Microcrystalline ground-mass quartz (lt3 microm) is also present and shows dark red CLContraction cracks annealed with non-luminescent quartzare also visible
The hydrothermal megaquartz from the Hakos Moun-tains (Namibia) shows generally bright turquoise CL duringthe first 20 seconds of electron bombardment whichchanges into a violet to red-brown CL after one minute ofexposure (Fig 6d) The quartz exhibits a network of neocry-stallised (secondary) structures such as irregular weak lu-minescent domains and annealed cracks of different agesshapes and CL colours A typical CL pattern of secondarystructures is shown in Fig 5c Domains of annealed quartzcontain numerous fluid inclusions All quartz populationswithin the megacrystal have the same crystallographic ori-entation and cannot be distinguished by optical observationusing crossed nicols The quartz formation temperaturebased on fluid inclusion studies was determined to be be-tween 150 and 250degC (Behr amp Schmidt-Mumm 1987)
Trace elements in quartz 753
Table 3 Trace element concentrations (microg middot g-1) in quartz of the Aue Granite (Aue01-Aue32)of the Weinheim Rhyolite (Wein01-Wein13)and of the Hakos megaquartz (Hak01-Hak06)determinedby EPMA SIMS and LA-ICP-MS Relative abundancesratios are given as X30Simiddot 10-4 for Na and K SIMS analysis
EPMA SIMS LA-ICP-MS Al Ti K Fe Li Al 23Na
30Si
39K30Si
Ti Fe Li Al Ti Cr Mn Fe Ge
Aue01 212 36 10 34 64 325 386 664 75 25 408 248 53 lt12 51 55 14Aue02 222 42 lt10 36 65 297 143 127 73 20 ndash ndash ndash ndash ndash ndash ndashAue03 217 48 16 117 60 294 179 130 78 23 ndash ndash ndash ndash ndash ndash ndashAue04 199 63 lt10 31 48 244 170 123 84 22 287 207 80 lt12 24 27 lt14Aue05 217 60 24 21 51 238 106 068 79 16 ndash ndash ndash ndash ndash ndash ndashAue06 148 66 14 lt21 37 181 106 077 92 13 432 170 80 lt12 31 35 lt14Aue07 180 49 lt10 lt21 36 186 151 091 93 16 ndash ndash ndash ndash ndash ndash ndashAue08 74 17 lt10 lt21 16 135 192 149 11 11 ndash ndash ndash ndash ndash ndash ndashAue09 58 lt17 10 lt21 40 248 281 236 84 23 ndash ndash ndash ndash ndash ndash ndashAue10 152 46 15 lt21 15 170 985 432 55 17 272 154 45 lt12 11 lt27 lt14Aue11 106 29 lt10 lt21 22 205 469 197 85 19 ndash ndash ndash ndash ndash ndash ndashAue12 69 lt17 lt10 21 23 178 308 154 87 18 ndash ndash ndash ndash ndash ndash ndashAue13 164 48 lt10 lt21 23 188 370 196 85 21 ndash ndash ndash ndash ndash ndash ndashAue14 53 lt17 19 lt21 21 174 224 146 78 20 ndash ndash ndash ndash ndash ndash ndashAue15 138 58 lt10 lt21 28 186 180 128 79 19 316 152 72 lt12 45 49 20Aue16 145 41 14 lt21 29 194 177 129 83 20 331 163 68 lt12 31 lt27 lt14Aue17 159 51 lt10 lt21 40 268 187 147 96 33 ndash ndash ndash ndash ndash ndash ndashAue18 154 61 22 54 40 194 148 091 93 15 384 181 60 lt12 25 lt27 14Aue19 143 60 lt10 lt21 28 194 149 110 92 29 ndash ndash ndash ndash ndash ndash ndashAue20 164 21 lt10 lt21 34 248 232 149 57 53 ndash ndash ndash ndash ndash ndash ndashAue21 233 lt17 17 lt21 14 160 338 185 4 99 492 231 47 lt12 35 34 lt14Aue22 175 40 18 lt21 23 340 144 374 53 54 ndash ndash ndash ndash ndash ndash ndashAue23 154 40 18 lt21 23 230 653 489 53 50 ndash ndash ndash ndash ndash ndash ndashAue24 164 24 15 27 28 241 294 215 52 40 ndash ndash ndash ndash ndash ndash ndashAue25 180 37 lt10 lt21 36 275 328 271 52 42 520 212 63 lt12 45 48 lt14Aue26 191 33 18 lt21 30 256 501 328 57 36 ndash ndash ndash ndash ndash ndash ndashAue27 185 36 19 lt21 27 249 498 352 66 40 488 223 75 lt12 17 lt27 lt14Aue28 138 56 11 lt21 18 202 471 385 85 33 ndash ndash ndash ndash ndash ndash ndashAue29 143 54 20 lt21 20 206 399 212 84 29 ndash ndash ndash ndash ndash ndash ndashAue30 236 29 14 lt21 36 322 433 314 41 54 334 281 62 lt12 42 52 lt14Aue31 196 51 20 lt21 16 190 814 572 68 33 502 276 78 lt12 27 38 lt14Aue32 175 52 lt10 lt21 31 217 280 200 83 34 ndash ndash ndash ndash ndash ndash ndash
Wein01 152 32 lt10 65 29 212 205 187 73 41 ndash ndash ndash ndash ndash ndash ndashWein02 138 52 18 44 27 187 216 194 93 34 248 185 44 lt12 13 na lt14Wein03 149 52 10 36 12 193 243 211 101 34 226 174 34 lt12 lt10 na 20Wein04 147 48 12 26 14 189 239 215 98 36 465 180 44 lt12 13 na 25Wein05 143 50 13 lt21 11 187 219 198 98 34 292 186 25 lt12 17 na 16Wein06 138 49 20 lt21 11 178 252 218 94 34 ndash ndash ndash ndash ndash ndash ndashWein07 162 48 12 lt21 16 203 266 253 77 38 348 169 98 lt12 lt10 na 16Wein08 159 68 13 lt21 30 371 135 304 123 73 330 173 52 lt12 97 na lt14Wein09 275 79 75 92 36 392 260 334 127 78 562 171 75 lt12 12 na 56Wein10 175 60 14 21 45 266 638 756 100 55 437 169 100 lt12 lt10 na 37Wein11 154 34 lt10 lt21 34 190 270 231 32 35 259 171 79 lt12 lt10 na lt14Wein12 158 32 lt10 lt21 27 162 247 198 19 32 308 170 88 lt12 55 na lt14Wein13 191 39 lt10 lt21 19 225 153 103 53 107 ndash ndash ndash ndash ndash ndash ndash
Hak01 142 lt17 16 lt21 27 179 038 021 1 5 297 181 15 30 18 40 138Hak02 lt42 lt17 22 lt21 1 36 015 017 nd nd 295 169 16 42 44 72 117Hak03 136 lt17 17 lt21 35 174 024 009 1 5 258 179 18 34 22 44 98Hak04 131 lt17 19 lt21 27 120 017 005 1 4 282 183 19 36 30 58 128Hak05 lt42 lt17 15 lt21 37 178 019 006 1 6 272 156 20 30 18 30 144Hak06 lt42 lt17 lt10 lt21 1 9 019 011 nd nd 276 162 17 38 24 53 122
na ndash not analysed for nd ndash not detected
754 A Muumlller M Wiedenbeck AM van den Kerkhof A Kronz K Simon
Fig 7 Plots of secondary ion intensity as a function of sputter time (a) Analysis of quartz from the Aue Granite where an increase in 7Li anda decrease in 23Na
39K and 54Fe intensity with time were observedThis intensitychange is a general phenomenaof these measurements (b)Analysis of neocrystallisedquartz within a fluid inclusion trail in the Hakos megaquartz The sputter time of about 3000 s corresponds to adepth profiling of 10 microm
Results
Analyses were performed by EPMA for Al K Ti Fe bySIMS for Li Na Al K Ti and Fe and by LA-ICP-MS forLi Al Ti Cr Mn Fe and Ge (Table 3) These suites of ele-ments include the most important impurities typically foundin quartz
Comparison of EPMA SIMS and LA-ICP-MS data
A comparison of the element concentrations determined bythe three methods on the same sample domains frequentlyyielded obvious differences Such differences reflect smallscale heterogeneities in the samples surface contamination alteration which is especially detectable by SIMS uncer-tainties in the composition of the reference sample used forSIMS calibration or other analytical inaccuracies Further-more distances between the exact spot locations of the threetechniques occasionally reach up to 200 microm introducing therisk that quartz with genuinely different trace element con-centrations are being compared
The concentrations for Na (534 ppm) and K (228 ppm)for the Brazil quartz reference sample (Schmidt amp Ziemann2000) used for SIMS appear unrealistically high resultingin calculated Na and K contents for our sample in the rangetypical for feldspars This suggests that the bulk Na and Kdata of Schmidt amp Ziemann (2000) might reflect the pres-ence of Na- and K-rich inclusions Therefore we presentour SIMS Na and K data as relative 23Na+30Si+ and 39K+30Si+ ratios Furthermore the lack of reproducibility be-tween independent data sets (Table 2) for Li Al and Fe im-plies that the standard sample might possess significant het-erogeneities Clearly the lack of a well characterised quartzreference sample is a fundamental impediment for the SIMStrace element analysis of this phase
We frequently observed decreasing counting rates for NaK and Fe during the SIMS analysis (Fig 7a) despite the pre-
rastering of the analysis area prior to data collection Thismay indicate residual sample surface contamination or sur-face modification due to charging phenomena during theearlier CL imaging (eg Remond et al 1992) In such casesthe data were only assessed for the later part of the analysiswhere the relative secondary ion intensities had stabilisedIn contrast to Na K and Fe the count rate for Li frequentlyincreased as a function of time suggesting a mobilisation ofLi towards the sample surface during CL electron bombard-ment (Alley et al 1999) Sometimes the ion beam penetrat-ed into a fluid inclusion (Fig 7b) in such cases it was neces-sary to judiciously select which data collection cyclesshould be rejected from the final measurement averagesHowever the time-resolved measurements give informa-tion about the element abundances of fluid inclusions
In order to compare the data from the various micro-ana-lytical techniques Fig 8 plots the Al and Ti concentrationsdetermined by SIMS EPMA and LA-ICP-MS (collected inimmediate proximity see Fig 5) Ideally all points wouldplot on the dashed lines in which case all three methodswould have yielded the same absolute concentrations Un-fortunately this is not the case
In the case of Al the concentrations determined bySIMS EPMA and LA-ICP-MS show linear trends near the11 ratio line (Fig 8a b c) Al concentrations of the EPMAand LA-ICP-MS are in a good agreement For Al best isLA-ICP-MS EPMA especially taking error bars into ac-count (Fig 8d) The SIMS Al concentrations tend to be sys-tematically higher (up to 25 ) than for the EPMA and LA-ICP-MS concentrations The presence of systematicallyhigher Al concentrations determined by SIMS might be a re-flection of a too low Al value being assigned to the Brazilreference sample (see Table 2)
In the case of Ti we observe a different situation As forAl we find that SIMS tends to produce systematically high-er concentrations than EPMA (Fig 8d) The systematic er-ror mainly reflects the poor documented quartz referencesample used for SIMS Nevertheless a small systematic er-
Trace elements in quartz 755
Fig 8 Concentration plots of Al (a b and c) and of Ti (d e and f) in the Aue and Weinheim quartz samples determined by SIMS EPMAand LA-ICP-MS
756 A Muumlller M Wiedenbeck AM van den Kerkhof A Kronz K Simon
ror of EPMA between sample and standard measurementsshould be taken into account We also observe more scatterbetween the LA-ICP-MS SIMS and LA-ICP-MS EPMAvalues than is seen between the EPMA SIMS values Thedegree of scattering of Ti values is worse for the Weinheimsample than for the Aue sample which tend to plot closer tothe 11 ratio line (Fig 8e and f) We attribute the source ofthis effect to a sampling size phenomenon
The analysed volume of the quartz using LA-ICP-MSreaches up to ~1700 times the X-ray sampling volume of theEPMA According to this argument the LA-ICP-MS mea-surements ablated Ti-rich growth zones that were eitherstraddled by the laser or else which were not lsquoobviousspikesrsquo that could be confidently discerned at the time of da-ta assessment Finally the Ti data set from the Aue andWeinheim samples apparently behave systematically differ-ent (Fig 8e 8f) a phenomenon not observed for aluminium
As a second approach to assess our data we plotted theCL grey scale against the ppm concentrations measured byeach of the three analytical methods (Fig 9) The X-axis ofthis plot gives the integrated luminescence from 7 minutesof electron radiation whereby low total luminescence cor-relates strongly with a red-brown colour and high total lumi-nescence is always characterised by a blue hue We presentthis semi-quantitative comparison of CL and element con-centrations because the sample surface of about 500000microm2 from which the CL spectra were obtained includes 8sampling spots (see Fig 5) Relating individual CL emis-sion bands to element concentration from a much smallersampling spot is not meaningful in a heterogeneous lumi-nescent quartz For this reason we calculated the integratedgrey-scale value at the sampling point from SEM-CL im-ages made prior to element analysis This alternative ap-proach is limited to Al and Ti the only elements for whichwe obtained interpretable data from all three techniques
We find that EPMA yields systematically lower Al val-ues than those obtained from either SIMS and LA-ICP-MSExcept at the very highest Al concentrations we found nocorrelation between Al and the CL grey-scale value
In the case of Ti SIMS yielded systematically higherconcentrations as compared to EPMA Furthermore the Ticontents measured by both SIMS and EPMA show a linearcorrelation with the total CL emission intensity The highlysystematic difference in slopes seen between the two tech-niques might be indicative of SIMS calibration problems re-lated to the low Ti content of the Brazil reference sample(Table 2) Regarding the LA-ICP-MS results for Ti we ob-serve little or no correlation between determined concentra-tion and total CL emission We attribute the dramatic differ-ence between LA-ICP-MS and the other two techniques asresulting from the difference in sampling volume For Tithe comparatively poor spatial resolution averaged the Tisignal from a large potentially non-homogeneous volumeThis scattering is particularly noticeable in the case of thezoned quartz from the Weinheim rhyolite
In the Hakos megaquartz the Ti concentration determinedwith LA-ICP-MS is much higher than that determined usingSIMS Ti determined by LA-ICP-MS is relatively constantand amounts 177 plusmn 16 ppm The large volume of materialablated by the laser could have caused contamination with
Fig 9 Plot of CL grey scale intensityand the Al and Ti contentof thequartz from the Weinheim rhyolite determined by SIMS EPMAand LA-ICP-MS The grey scale reflects the intensity ratio of red(17-22 eV) versus blue emission (24-31 eV) The higher the blueemission intensity the greater the value of the grey scale Quartzwith high Ti correlates to violet to blue CL
small Ti-bearing inclusions SIMS measurements give con-centrations between 0 and 1 ppm
Trace element distributions
Key trace element concentrations as a function of profile po-sition are shown in Fig 10
The magmatic quartz of the Aue granite shows a reason-ably constant Al concentration of around 200 ppm expectAl-poor areas in low CL intensity neocrystallised domainsLate magmatic quartz that resembles unzoned secondaryovergrowth (first 3 measurements in the quartz of the AueGranite Fig 5a 10) shows distinctly higher Li concentra-tions which are correlated with moderately elevated Alcontents Non-luminescent neocrystallised regions whichoverprint both the zoned and non-luminescent quartz aredepleted in Ti Furthermore we detected an increase in theFe-content at the core of the zoned crystal corresponding toan area of weak CL emission however other bands of weakCL do not show this feature The elevated Fe-content sug-
Trace elements in quartz 757
Fig
10
SIM
San
dE
PM
Atr
ace
elem
entp
rofi
les
for
Li
Al
KT
ian
dF
ein
quar
tzfr
omth
eA
ueG
rani
tean
dfr
omth
eW
einh
eim
Rhy
olit
eT
hepo
siti
onof
prof
iles
issh
own
inF
ig5
aan
d5b
res
pect
ivel
yT
hebo
ttom
diag
ram
sgi
veth
ere
lati
vein
tens
ity
ofca
thod
olum
ines
cenc
ein
grey
valu
esL
owgr
eyva
lues
corr
espo
ndto
red-
brow
nC
L-c
olou
rsan
dhi
ghgr
eyva
lues
corr
e-sp
ond
tovi
olet
tobl
ueco
lour
s
758 A Muumlller M Wiedenbeck AM van den Kerkhof A Kronz K Simon
gests that the core of the zoned domain may have crystalli-sed in a distinct geochemical environment Given that highFe are restricted to the crystal core this feature may be a re-cord an early stage of magma crystallisation
Quartz from the Weinheim rhyolite yielded the highest Ticoncentration of the three samples which we studied aver-aging ~65 ppm with a maximum of 127 ppm The pattern forTi as noted above (Fig 9b) shows the strongest correlationwith the CL grey scale intensity The Weinheim quartz alsocontains elevated concentrations of Al K and Fe and thesevalues are much more constant than seen in our other sam-ples The band showing the highest CL emission (Fig 10)which is not associated with the crystal core shows extremeconcentrations for all these elements This sample containsneither fluid inclusions nor neocrystallised domains sug-gesting that the trace element pattern which we observe re-flects original magmatic processes
The Hakos megaquartz contains unaltered zones whichare homogeneous in Li Al Ti Na and K They yield abso-lute concentrations that in general are lower than in ourother two samples ICP-MS analyses of these large regionsdetected elevated Mn and Cr concentrations and both theseelements were found to correlate with the Fe abundanceLikewise quadrivalent Ge which substitutes for Si is alsoenriched in the megaquartz (3-16 ppm) However time-re-solved SIMS measurements (Fig 7b) clearly show that oth-er than Li Ge is enriched in the fluid inclusions Such rela-tively bright CL-emission zones are intersected by threegenerations of younger quartz which appear as distinctstructures in our CL image (Fig 5c) First irregular bandshaving weak CL intensity are visible and these have highlydepleted trace element contents (Table 3) A second quartzgeneration appearing as bright straight lines in the CL im-age are associated with cracks which may be associatedwith late fluid flow A third generation appearing as veryfine bands of weak CL-emission are seen to crosscut allother structures We were unable to measure the trace ele-ment contents of these second and third overprinting gener-ations due to their narrowness relative to the sampling sizeof our analytical techniques
Discussion
Analytical issues
Our comparative study demonstrates the relative strengthsand limitations of the three in situ analytical techniqueswhich we employed EPMA has the obvious advantage ofthe smallest sampling volume Furthermore data reductionprocedures and quantitative calibration methods for thistechnique are well established The ability to rapidly switchbetween CL imaging and EPMA is a second strong advan-tage of this technique The main limitation encountered byEPMA is the extreme care needed when analysing elementsat very low abundances and the fact that for many elementseven long counting times coupled with a detailed back-ground characterisation will not achieve the required sensi-tivity
Regarding SIMS the main strength of the technique is its
high sensitivity allowing for many elements to be deter-mined at the low ppm level However this advantage issomewhat compromised by a lower spatial resolution com-pared to EPMA a fact that can be critical if finely zoned fea-tures or alteration domains need to be analysed Anotherdrawback associated with ion probe analysis is the absenceof well characterised quartz reference samples
LA-ICP-MS analyses combine the strengths of relativelystraight forward calibration procedures with low detectionlimits The ability to calibrate quantitative analyses againsta glass reference sample is a major advantage relative toSIMS However laser ablation has the disadvantage of sig-nificantly poorer spatial resolution compared to both EPMAand SIMS (Fig 1 3) In large homogeneous samples thislimitation is not important but in zoned material the resultsmay be averaging of multiple domains with distinct compo-sitions Recent developments in laser technology offer thehope of overcoming this handicap (eg Flem et al 2002)
Al defects
The abundance of the alkali elements Li Na and K are cor-related in all three of our samples (Fig 11) Furthermore weobserve a clear though somewhat weaker correlation be-tween Li+ and K+ and both Al and Fe The correlation of Naversus Al is less pronounced These observations fit with thegeneral assumption that mostly Li+ and K+ act as chargecompensators for Al3+ and Fe3+
Fig 12 shows examples FTIR absorption spectra of theinvestigated quartz Due to the different sample preparationprocedures the spectra were recorded from other quartzcrystals of the Hakos Weinheim and Aue samples thanthese used for the trace element analysis However the spec-tra give an idea about the kind of structural Al and Li defectsrelated to the presence of hydrogen The associated sharpabsorption bands at 3365 and 3305 cm-1 attributed to hydro-gen-compensated aluminium defects (marked as ldquoAl-Hrdquo inFig 12) are the most significant peaks in the hydroxyl bandBoth bands are found in all three spectra and are most in-tense in the quartz from the Weinheim rhyolite The mega-quartz shows a high intensity of the 3474 cm-1 band whichwas assigned by Kats (1962) to proton-compensated alu-minium defect perturbed by Li+ (marked as ldquoLi-Hrdquo in Fig12) This band is also present at very low intensity in thespectra of the Aue and Weinheim samples Both the quartzof the Aue granite and of the Weinheim rhyolite are charac-terised by the broad absorption bands at ~3110 and3220 cm-1 Both bands are caused by the symmetricalstretching vibrations of unfrozen molecular water (markedas ldquoO-Hrdquo in Fig 12 Aines amp Rossman 1984) Unfrozenmolecular water at ~ndash190degC indicate structural bond waterand water-bearing micropores within the analysed samplevolume but not molecular water of visible fluid inclusionsAll three samples contain hydrogen-compensated Al and Lidefects independently from the crystallisation environment
Stenina et al (1988) and Stenina (1995) suggested thatAl along with Li Na and K is enriched in sub-microscopicwater-bearing defect clusters in the form of 2[SiO3]+ ndash H2Ondash M+ ndash 2[M3+O4]- (M+ = Li+ K+ and Na+ M3+ = mostly Al3+
Trace elements in quartz 759
Fig 11 SIMS trace element variation diagramsDue to the lack of a good reference sample for Na and K the results for these two elementsare given as measured X30Si ratios
and Fe3+ see Fig 13) Previous studies showed that Al Feand alkali metals tend to form minute atomic clusters whichare incorporated along specific growth axes and this is es-pecially true for low-temperature quartz (Pfenninger 1961Flicstein amp Schieber 1974 Siebers 1986 Ramseyer ampMullis 1990 Brouard et al 1995) Investigations of hydro-gen isotopes by Simon (2001) documented two H-reservoirsin quartz (i) fluid inclusions and (ii) structurally-bound wa-ter in small homogeneously distributed clusters and bub-bles According to Simonrsquos (2001) model such micro-clus-
ters should be accompanied by high Al3+ and K+ Na+ Li+
abundances The lower D values in smaller fluid inclu-sions point to structurally-bound water occurring as OH-
brought about by a high surfacevolume ratio Whether Aland Fe and their charge compensators Li Na and K arestructural impurities or represent micro-clusters can not beestablished from our data set However the relative highabundance of hydrogen-compensated Al defects and struc-tural bond water molecules observed by the FTIR may indi-cate the existence of such micro-clusters We assume that a
760 A Muumlller M Wiedenbeck AM van den Kerkhof A Kronz K Simon
Fig 12 IR-absorption spectra of the (a) Hakos megaquartz (b)quartz from the Weinheim rhyolite and (c) quartz from the Auegranite recorded at ~ndash190degC
Fig 13 Generalised schematic structure of an impurity cluster inquartz in which large amounts of Al Fe and interstitialK Na and Liions are concentratedSuch a cluster would representa transitionbe-tween structural defects and inclusions
continuous transition exists between structural impuritiesmicro-clusters and inclusions
In our study Al showed no obvious correlation with CLHowever Ramseyer amp Mullis (1990) and Perny et al(1992) assumed that the high Al and Li concentrations resultin the unstable blue CL sometimes seen in hydrothermalquartz Some of the bright blue luminescent growth zones ofthe Weinheim phenocryst are enriched in Al and Li but alsocontain elevated Ti Fe K and Na concentrations (Fig 10700-900 microm of the profile) As discussed above Al and itscharge compensating ions cause a number of structural de-fects which influence the CL properties of quartz but these
mechanisms are too complex to be correlated directly withtrace element signatures
Ti defects
Titanium which substitutes for Si shows a relatively poorcorrelation with Al and shows no correlation with othertrace elements (Fig 11e f) The lack of correlation with oth-er elements may be explained by the fact that Ti occursmainly in the quadrivalent state in our samples which re-quires no charge compensation by interstitial cations How-ever the quartz of the relative Ti-rich Aue granite and of theWeinheim rhyolite contains paramagnetic [TiO4Li+]0 de-fects (Muumlller 2000) The heterogeneous distribution of Ti isclearly related to the growth zoning in both the Aue graniteand in the Weinheim rhyolite Stable blue luminescentgrowth zones show highest Ti Previous studies showed thatrhyolitic quartz phenocrysts possess variations in Ti be-tween growth zones (lt5 microm Fig 5b Muumlller et al 2000)EPMA gives the most realistic Ti contents based on qualityof correlation with CL zoning (Fig 9b) The correlation ofCL structures with the Ti distribution implies structural po-sition of Ti in the quartz lattice There is no evidence for Ti-containing micro-inclusions
We found Ti in both igneous quartz samples but ob-served less Ti in quartz of hydrothermal origin This resultsupports earlier observations by Sprunt (1981) and Bruhn etal (1996) High Ti concentrations were also found by Vanden Kerkhof et al (1996) in quartz from granulites Causedby its large ion radius (r = 069 Aring) Ti4+ usually forms six-fold coordinated octahedra with O2- High crystallisationtemperatures gt500degC are necessary in order to fit the Ti4+ into the four-fold coordinated quartz lattice (Blankenburg etal 1994) The uptake of gt50 ppm of Ti may be also limitedby the stability field of high-quartz This supports the gener-al idea that the stable blue to violet luminescent quartz formsat higher temperatures than quartz with red-brown lumines-cence (eg Bruhn et al 1996) Concerning the mechanismof CL activation these results do not unequivocally provethat the CL emission is activated by Ti (Bruhn et al 1996)
Other defects
Gerler (1990) showed that Ge concentrations determined byINAA correlate with Cl Br and the salinity of fluid inclu-sions According to Schroumln (1969) Ge uptake into the quartzlattice is increased by the presence of halogens in hydrother-mal low-temperature solutions The extremely high salinityof primary fluid inclusions of up to 68 wt in the Hakosquartz (Behr amp Schmidt-Mumm 1987) may have stimulat-ed Ge uptake However in the case of the Hakos quartz theGe is enriched in fluid inclusions (Fig 7b)
Conclusions
Our comparison of the three micro-analytical techniquessuggests that EPMA and SIMS provided that they can be
Trace elements in quartz 761
properly calibrated are suited for the study of Al and Ti inzoned quartz crystals LA-ICP-MS also yields interpretabledata however such analyses average trace element contentsover vastly larger volumes The previously reported concen-tration values for the Brazil quartz reference sample used forcalibrating our secondary ion yields likely need further re-finement The development of a homogeneous and welldocumented quartz reference sample will be a crucial futurestep essential for improving SIMS-based trace elementanalyses of this phase
Ti contents were found to be related to blue luminescentgrowth zones in the igneous quartz of the Aue and Wein-heim samples However these results do not prove that thestable blue CL emission is activated by Ti For Li Al Fe Liand K no association with CL zoning is seen However ne-ocrystallised quartz with very low luminescence intensity isdepleted in all these elements Hydrogen-compensated Aland Li defects are present in all three quartz types in differ-ent quantities Nevertheless most Li in igneous quartz isprobably bond to paramagnetic [TiO4Li+]0 defects More-over structural molecular water andor sub-microscopicwater-bearing defect-clusters seem to be common in igne-ous quartz The combination of quantitative in situ elementanalyses and with spectroscopic methods providing infor-mation about the nature of structural defects will improveour understanding of the petrogenetic significance of traceelements in quartz
Acknowledgements We thank Hans-Juumlrgen Behr ReimarSeltmann and Chris Stanley for stimulating discussion Weare also most grateful for helpful reviews by Frank Poitras-son and Rune B Larsen This contribution was supported byDFG through the grant MU 17172-1
References
Aines RD amp Rossman GR (1984) Water in minerals A peak inthe infrared J Geophys Res 89B6 4059-4071
Alley TG Brueck SRJ WiedenbeckM (1999) SIMS study ofspace charge formation in thermally poled fused silica J ApplPhys 8612 6634-6640
Armstrong JT (1995)CITZAF A packageof correctionprogramsfor the quantitative electron microbeam x-ray analysis of thickpolishedmaterials thin films and particlesMicrobeamAnalysis4 177-200
Bahadur H (1994) Sweeping and irradiation effects on hydroxyldefects in crystalline natural quartz IEEE Trans Ultras Ferro-el Frequ Control 416 820-833
Bambauer HU (1961) Spurenelementgehalt und -Farbzentren inQuarzen aus Zerrkluumlften der Schweizer Alpen SchweizMineralPetrogr Mitt 41 335-369
Bambauer HU Brunner GO Laves F (1963) Merkmale desOH-Spektrums alpiner Quarze (3micro-Gebiet) Schweiz MineralPetrogr Mitt 43 259-268
Behr H-J amp Schmidt-Mumm A (1987) The role of sedimentaryand tectonic brines in the Damara Orogen Namibia Appl Geo-chemistry 2 535-542
Blankenburg H-J Goumltze J Schulz J (1994) QuarzrohstoffeDeutscher Verlag fuumlr Grundstoffindustrie Leipzig-Stuttgart296pp
Brouard S Breton J Girardet G (1995) Small alkali metal clus-ters on (001) quartz surface adsorptionand diffusion J Molecu-lar Struct (Theochem) 334 145-153
Bruhn F BruckschenP Meijer J StephanA RichterDK Vei-zer J (1996)Cathodoluminescence investigationsand trace-ele-ment analysis of quartz by micro-PIXE implications for diage-netic and provenance studies in sandstone Can Mineral 341223-1232
DrsquoLemos RS Kearsley AT Pembroke JW Watt GR WrightP (1997)Complex quartz growth histories in granite revealedbyscanning cathodoluminescence techniques Geol Mag 134459-552
Dennen WH (1966) Stoichiometric substitution in natural quartzGeochim Cosmochim Acta 30 1235-1241
ndash (1967)Trace elements in quartzas indicatorsof provenanceGeolSoc Amer Bull 78 125-130
DennenWH BlackburnWH QuesadaA (1970)Aluminium inquartz as a geothermometer Contrib Mineral Petrol 27 332-342
Flem B Larsen RB Grimstvedt A Mansfeld J (2002) In situanalysisof trace elements in quartz by using laser ablation induc-tively coupled plasma mass spectrometry Chemical Geol 182237-247
Flicstein J amp Schieber M (1974) Microsegregation of impuritiesin hydrothermally-grown quartz crystals J Cryst Growth 2425 603-609
Gerler J (1990) Geochemische Untersuchungen an hydrotherma-len metamorphengranitischenund pegmatitischenQuarzen undderen Fluumlssigkeitseinschluumlssen PhD Thesis University Goumlttin-gen 169 pp
Goumltze J amp Ploumltze M (1997) Investigationof trace element distri-bution in detrital quartz by electron paramagnetic resonance(EPR) Eur J Mineral 9 529-537
Goumltze J Ploumltze M Habermann D (2001) Origin spectral char-acteristics and practical applicationsof the cathodoluminescence(CL) of quartz ndash a review Min Petr 71 225-250
Kats A (1962) Hydrogen in alpha-quartz Philips Res Repts 17133-279
Kronenberg AK Kirby SH Aines RD Rossmann GR(1986)Solubility and diffusionaluptake of hydrogen in quartz athigh water pressures implications for hydrolytic weakening inthe laboratory and within the earth Tectonophysics 172 255-271
Larsen RB Polve M Juve G (2000) Granite pegmatite quartzfrom Evje-Iveland trace element chemistry and implications forthe formation of high-purity quartz Norges Geol Unders Bull436 57-65
Lehmann G (1975) On the colour centres of iron in amethyst andsynthetic quartz a discussionAm Mineral 60 335-337
Lehmann G amp BambauerHV (1973)Quarzkristalleund ihre Far-ben Angew Chem 7 281-289
Lowenstern JB amp Sinclair WD (1996) Exsolved magmatic fluidand ist role in the formation of comb-layered quartz at the Creta-ceous Logtung W-Mo deposit Yukon Territory Canad Trans-act Roy Soc Edinburgh Earth Sciences 87 291-303
Maschmeyer D amp Lehmann G (1983) A trapped-hole centrecausing rose coloration of natural quartz Z Kristallogr 163181-196
MoiseevBM (1985)Natural radiationprocessesin mineralsNed-ra Moscow (in Russian)
Morgan GB London D Luedke RG (1998) Petrochemistryoflate Miocene peraluminoussilicic volcanic rocks from the Moro-cocala field Bolivia J Petrol 39 601-632
762 A Muumlller M Wiedenbeck AM van den Kerkhof A Kronz K Simon
Muumlller A (2000)Cathodoluminescence and characterisation of de-fect structures in quartz with applications to the study of graniticrocks Unpubl PhD Thesis University Goumlttingen 230 pp
Muumlller A Seltmann R Behr H-J (2000) Application of catho-doluminescence to magmatic quartz in a tin granite ndash case studyfrom the Schellerhau Granite Complex Eastern ErzgebirgeGer-many Mineralium Deposita 35 169-189
Muumlller A Lennox P Trzebski R (2002) Cathodoluminescenceand micro-structuralevidence for crystallisationand deformationprocesses of granites in the Eastern Lachlan Fold Belt (SE Aus-tralia) Contrib Mineral Petrol 143 510-524
Mullis J amp Ramseyer K (1999) Growth related Al-uptake in fis-sure quartz Central Alps Switzerland Terra Nostra 996 209
Neuser RD Bruhn F Goumltze J Habermann D Richter DK(1995) Kathodolumineszenz Methodik und Anwendung ZblGeol Palaumlont Teil 1 1995 287-306
Newbury DE amp Myklebust RL (1995) NIST Micro MC A us-errsquos guide to the NIST Microanalysis Monte Carlo electron tra-jectory simulation Program Microbeam Analysis 4 165-175
PearceNJG PerkinsWT Westgate JA GortonMP JacksonSE Neal CR Chenery SR (1997)A compilationof new andpublished major and trace element data for NIST SRM 610 and612 partially certified glass reference materials GeostandardsNewsletter 21 115-144
Perny B Eberhardt P Ramseyer K Mullis J Pankrath R(1992) Microdistributionof aluminium lithium and sodium in aquartz possible causes and correlation with short lived cathodo-luminescenceAm Mineral 77 534-544
Pfenninger H (1961) Diffusion von Kationen und Abscheidungvon Metallen in Quarz unter elektrischer Feldeinwirkung PhDThesis University Zuumlrich
Plesch R (1982)Auswerten und Pruumlfen in der Roumlntgenspektrome-trie G-I-T Verlag Ernst Giebeler Darmstadt 147 pp
Potts PJ Bowles JFW Reed SJB Cave MR (1995) Micro-probe techniques in the earth sciences The Mineralogy SocietySeries vol 6 Chapman and Hall London 419 pp
Ramseyer K Baumann J Matter A Mullis J (1988) Cathodo-luminescence colours of -quartz Min Mag 52 669-677
Ramseyer K amp Mullis J (1990) Factors influencing short-livedblue cathodoluminescence of -quartz Am Mineral 75 791-800
Remond G Cesbron F ChapoulieR OhnenstetterD Rouques-Carmes C SchvoererM (1992)Cathodoluminescence appliedto the microcharacterization of mineral materials a present statusin experimentation and interpretation Scanning Microsc 6123-69
RovettaMR Blacic JD HervigRL Holloway JR (1989)Anexperimentalstudy of hydroxyl in quartz using infrared spectros-copy and ion microprobe techniquesJ Geophys Res 94 5840-5850
Schmidt C amp Ziemann MA (2000) In-situ spectroscopy ofquartza pressure sensor for hydrothermaldiamond-anvilcell ex-
periments at elevated temperatures Am Mineral 85 1725-1735
Schneider N (1993) Das lumineszenzaktive Strukturinventar vonQuarzphaumlnokristenin RhyolithenGoumlttingerArb Geol Palaumlont60 81 pp
Schroumln W (1969) Zur Geochemie des Germaniums FreibergerForschungshefte C246 9-65
Shimizu N Semet MO Allegre CB (1978) Geochemical ap-plications of quantitative ion-microprobe analysis GeochimCosmochim Acta 42 1321-1334
Siebers FB (1986) InhomogeneVerteilung von Verunreinigungenin gezuumlchteten und natuumlrlichen Quarzen als Funktion der Wachs-tumsbedingungen und ihr Einfluszlig auf kristallphysikalische Ei-genschaften PhD Thesis Ruhr-Universitaumlt Bochum 133 pp
Simon K (2001)Does D from fluid inclusion in quartz reflect theoriginal hydrothermal fluid Chemical Geol 177 483-495
Smith JV amp Steele IM (1984) Chemical substitution in silicapolymorphsN Jb Miner Mh 1984 137-144
Sprunt ES (1981)Causes of quartz cathodoluminescence coloursScanning Electron Microscopy 1981 525-535
Stenina NG (1995) Energy aspect in the formation of graniticmagma and ore deposits In ldquoMineral deposits from their originto their environmental impactsrdquo Pa Iumlsava J K Iumlribek B IumlZak Keds Balkema Rotterdam pp 539-542
Stenina NG Sotnikov VI Korolyuk VN Kovaleva LT(1988) Microstructural features of hydrothermal vein quartz asan indicator of mineralizationGeokhimiya 5 641-653 (Englishtranslation)
Van den Kerkhof AM Scherer T Riganti A (1996) Cathodolu-minescence and EPR analysis of Archean quarzites from theNondweni Greenstone Belt South Africa In ldquoAbstracts SLMSInternationalConference on Cathodoluminescencerdquo Nancy 75
Van den Kerkhof AM Kronz A Simon K (2001)Trace elementredistribution in metamorphic quartz and fluid inclusion modifi-cation observations by cathodoluminescence XVI ECROFIPorto 2001 Fac Ciencias Porto Dep Geol Memoria 7 447-450
Watt GR Wright P GallowayS McLean C (1997)Cathodolu-minescence and trace element zoning in quartz phenocrysts andxenocrystsGeochim Cosmochim Acta 61 4337-4348
Weil JA (1984)A review of electron spin spectroscopyand its ap-plication to the study of paramagnetic defects in crystallinequartz Phys Chem Minerals 10 149-165
Zinner E amp Crozaz G (1986) A method for the quantitative mea-surement of rare earth elements in the ion microprobe Int JMass Spect Ion Process 69 17-38
Received 24 April 2002Modified version received 20 October 2002Accepted 26 March 2003
Trace elements in quartz 763
Quartz has an exceptionally stable atomic configurationof Si-O bonds that allows only a minimal amount of other el-ements into its structure Substitutional and interstitial traceelements may either replace Si or enter channels runningparallel to the c-axis respectively Al3+ for example is themost common substitutional trace element whereas Li+ H+K+ and Na+ are common interstitial elements which are re-quired for charge balancing (Bambauer 1961 Dennen1966 1967 Dennen et al 1970 Lehmann amp Bambauer1973 Lehmann 1975 Smith amp Steele 1984 Weil 1984)In addition to aluminium Ti4+ Fe3+ Ge4+ and P5+ are com-mon substitutes for Si4+ (eg Maschmeyer amp Lehmann1983 Goumltze et al 2001)
Besides structural impurities quartz frequently containssolid and fluid inclusions Possible gradational transitionsbetween structural impurities and inclusions are a matter ofdiscussion (Stenina et al 1988 Blankenburg et al 1994Stenina 1995 Simon 2001) The often unknown structuralstate of trace elements in the quartz lattice may complicatethe interpretation of measured trace element contents Infor-mation about structural defects can be obtained from bothFourier-transform infrared (FTIR) spectroscopy (eg Kats1962 Bambauer et al 1963 Aines amp Rossmann 1984Kronenberg et al 1986 Rovetta et al 1989 Bahadur1994) and electron paramagnetic resonance (EPR) (egWeil 1984 Goumltze amp Ploumltze 1997) However FTIR spec-troscopy is the only method that can define both the quanti-tative distribution and the speciation of water in quartzSpectra of quartz containing structural water in the form ofH+ OH- and H2O show distinct absorption bands between3000 and 3700 cm-1 According to Moiseev (1985) absolutedefect concentrations for Al and Ti can be calculated fromEPR intensities However EPR analysis does not provide insitu measurement of the intra-granular defect distributionIn this study we show that in situ micro-analysis providesbetter insights into the nature of crystal heterogeneity
The aims of this study are tondash evaluate the in situ micro-analytical methods SIMS EP-
MA LA-ICP-MS in determining trace elements in natu-ral quartz samples
ndash compare and explain the analytical results regarding thespatial resolution and limits of detection
ndash correlate CL and trace elements to define the causes ofCL
ndash determine which is the best analytical approach for deter-mining trace element contents in quartz
Analytical techniques
Electron probe micro-analysis (EPMA)
Trace element abundances of Al K Ti and Fe in quartzwere performed with a JEOL 8900 RL electron microprobeat the Geowissenschaftliches Zentrum Goumlttingen equippedwith 5 WD detectors and with a CL detector using an ex-tended wavelength range from 200 to 900 nm
SEM-CL images were collected with the JEOL electronmicroprobe system using slow beam scan rates of 20 s perimage at processing resolution of 1024x860 pixels and 256
Fig 1 Surface topography of quartz after analysis using differentmicro-beamtechniques(a) Backscatteredelectron image in ldquotopog-raphy moderdquo (BSE-TOPO) of sputteredcraters in quartz (Aue Gran-ite) produced by the 16O- beam of the SIMS The image shows thecrossing of two measurement profiles (1 and 2) The white spottedline marks the pre-sputteredarea to remove the gold coatingwhere-as the closed line corresponds to the actual analytical spot size (b)Detailed view of a sputteredcrater (secondaryelectron image ndash SEI)with lamella at the sputtered crater wall indicating an inhomoge-neous sputteringof the quartz (c) SEI image of a Nd-YAG laser ab-lationcrater ca 40 microm in diameter resultingfrom a 40-s-ablationSo-lidified glass ejected during ablation surrounds the crater (d) SEIimage of outgrowths from quartz induced by ~ 10 minute EPMAanalysis at 20 kV and 80 nA
grey levels The electron beam voltage and current was 20kV and 200 nA respectively CL imaging before and afterEPMA allow the location of the analytical points with rela-
748 A Muumlller M Wiedenbeck AM van den Kerkhof A Kronz K Simon
Fig 2 (a) Calculated amount of emitted photons given as rZ-curves from quartz with 01 wt Al and 01 wt Ti and a density of265 gcm3 according to Newbury amp Myclebust (1995) For calcula-tion we use a accelerationvoltageof 20 kV a beam diameterof 5 micromand a take-offangle of 40deg (b) Cumulativeemission depthof X-raysfrom quartz (c) Cumulative interactionvolume in quartz
tion to CL structures Grey scale intensities along the mea-sured trace element profiles within quartz crystals were pro-cessed fromthe SEM-CL images using Optimas 60 software
The following standards were used for the analysis syn-thetic Al2O3 (5292 wt Al) orthoclase from LucerneSwitzerland (1218 wt K) synthetic TiO2 (5995 wt Ti)and haematite from Rio Marina Elba (6994 wt Fe) Forhigh precision and sensitivity a beam current of 80 nA abeam diameter of 5 microm (Fig 1) and counting times of 15 sfor Si and of 300 s for Al Ti K and Fe were chosen
Fig 3 Comparison of the sampling sizes of EPMA SIMS and LA-ICP-MS provided by our analytical conditions Thin dashed linesrepresent typical growth zoning observed in magmatic quartz phe-nocrysts
The sampling volume of the generated characteristic X-rays was calculated by using a Monte Carlo electron trajec-tory simulation program (Newbury amp Myclebust 1995)The program performs a calculation of the amount of gener-ated and emitted photons ( ) in a given phase with a knowncomposition and density (r) versus the penetration depth(Z) Emitted photons given as phi-rho-z ( rZ)-curves areshown in Fig 2a For calculation we assume quartz with 01wt Al and 01 wt Ti and a density of 265 g cm-3 Sameacceleration voltage (20 kV) and beam diameter (5 microm) likethe quantitative measurements were used for calculationThe take-off angle in our probe is 40deg We ran 200000 elec-tron trajectories to ensure a high precision The results areshown in Fig 2b and 2c 99 of the Al K - and Ti K -X-rays are emitting from a depth smaller than 27 microm and 100 are reached in a depth of approximately 325 microm for TiK and 345 microm for Al K Assuming a nearly hemispheri-cal interaction volume and 5 microm beam diameter hence thecalculation gives a total volume of less than 150 microm3 where99 of the characteristic X-rays emit from (Fig 2c 3) Afocussed beam would generate a much smaller exciting vol-ume but beam induced destruction (Fig 1d) of the quartzrequires to defocus the electron beam
Fig 4a documents the strong increase of the Al K signalduring the first two minutes of electron bombardment usinga focussed beam A strong decrease of the measured ab-sorbed current is also observable This phenomena is relatedto charging and destruction of the SiO2 structure After 2minutes the signal becomes stable Defocussing the beamminimises this effect using a 20 microm beam diameter elimi-nates it all together
The software of the quantitative EPMA analysis correctsthe background contribution (Bremsstrahlung) in a linearway Curvature in the background behaviour produces sys-tematic errors by calculating a too high averaged back-ground signal from the measurements on the left and rightside of the characteristic X-ray peak We calculated the con-tribution of the curved background behaviour by perform-ing precise scans near the measured X-ray lines of the traceelements While K K Ti K and Fe K show a highly line-ar behaviour the background of Al K and Na K is curvedThis curvature would lead to an ldquounder estimationrdquo of Al ofapproximately 50 ppm (Fig 4b) The analytical error was
Trace elements in quartz 749
Fig 4 (a) Drift of the Al K signal at 20 kV and 80 nA using beamdiameters of 3 microm and of 20 microm Note the strong decrease of the ab-sorbed current signal (Iabs) using the 3 microm beam diameter The signaldecrease gives evidence for charging effects on the sample surfaceThus the total X-ray signal (Iemitted) of Al K increases within thefirst two minutes of electron excitation For a beam diameter of 20microm the signalbehavesstablewithin the error of the countingstatistic(b) X-ray spectrum around the Al K line (wavelength Al K 8339 Aring) given as counts per 30 seconds per step was acquired on aAl-free quartz using 120 nA 20 kV and a beam diameter of 15 micromThe background signal (ldquoBremsstrahlungrdquo) shows a curved behav-iour which results in an underestimation of approximately 50 ppmAl when linear background fitting is applied Triangles indicate themeasured positions of the peak and the background
calculated by the counting statistic of peak and backgroundsignals following the Gauss law of error propagation Atlow element concentrations the background forms the mainpart of the total signal of the microprobe measurement Onthe other hand the background signal is nearly constant for agiven quartz matrix Therefore the absolute error of thecounting statistic is nearly constant The precision of theanalyses was 10 ppm absolute standard deviation for Al 6ppm for K 12 for Ti and 10 for Fe
Trace element measurements were carried out adjacent toeach SIMS crater Raw analysis were converted into con-centrations using the rZ matrix correction method ofArmstrong (1995) Limits of detection (LOD) listed in Table
1 were calculated with a confidence level of 95 on the ba-sis of the Studentrsquos t-distribution (Plesch 1982) from 60background measurements with the following equation
ILOD = tz (Pf) BG
where BG = standard deviation of the mean of the back-ground tz (Pf) = level of significance of the Studentrsquos t-dis-tribution for binomial limitation determined by the confi-dence level P and the degrees of freedom f = number ofbackground measurements minus 2 The level of signifi-cance amounts 2002 for 60 measurements
Due to the lack of suitable and certified homogeneousstandards which contain the measured elements in a rangecomparable to the analysed samples the absolute accuracyof the method could only be estimated Two important factsshould be taken into account
(1) Due to the constant matrix composition regarding themajor-elements net intensity to concentration ratios arestrictly linear (with a correlation R2-value over 998 )Hence the correction factor of the rZ matrix correctionbehaves nearly constant if the ranges of all element concen-trations are narrow
(2) Despite the fact that standards chosen for analysingAl K Ti and Fe were not ideal in consideration of the highamounts of the elements they are well characterised highlystoichiometric and produce a negligible error by countingstatistic during calibration Latter would be not the case ifstandards were used which contain the desirable elements intrace amounts On the other hand it has to be proven that ma-trix effects will not produce large systematic errors Regard-ing the differences of the total correction factors given instandards and quartz samples they do not exceed 12 However the ldquorealrdquo systematic errors derived by an inaccu-rate matrix correction factor must be much smaller Other-wise the correction of the raw values in complex mineralswould never lead to an accurate stoichiometry within a fewpercent relative error when the materials for standardisationand measurement would be different With no doubt the cor-rection factors in the trace ranges could be assumed to becorrect
In conclusion the largest source to produce systematicerrors in EPMA trace measurements are non linear back-ground behaviour and signal drift due to charging and sam-ple destruction during signal acquisition
Table 1 Limits of detection(LOD) for LA-ICP-MS and EPMA Thevalues are given in microg middot g-1
method EPMA LA-ICP-MS
Li nd 02Na 62 385Al 42 56K 10 ndTi 17 11Cr nd 12Mn nd 10Fe 21 27Ge nd 14
nd ndash not determined
750 A Muumlller M Wiedenbeck AM van den Kerkhof A Kronz K Simon
Secondary ion mass spectrometry (SIMS)
We used the Cameca ims 6f SIMS in Potsdam in order to as-sess trace element abundances Prior to SIMS measure-ments the samples are ultrasonically cleaned for five min-utes in ethanol dried briefly in an oven and subsequentlycoated with a ca 70 nm thick conductive high-purity Aufilm For each measurement a focussed 16O- ion beam re-moved between 2000 and 5000 microm3 of material from thepolished sample surface a small fraction of this material be-ing ionised during the lsquosputteringrsquo process the ions wereelectrostatically accelerated into a mass spectrometer usinga 7 kV extraction potential We used a nominally 125 kVprimary ion accelerating potential with a beam current of 40nA resulting in a ~30 microm diameter crater (Fig 1 3) Analy-ses were conducted either as individual spot analyses or asautomatic point profiles of a given step spacing of either 50and 100 microm
Prior to each analysis the sample surface was cleaned bypre-sputtering the sample for 4 minutes Each analysis con-sisted of 20 cycles of the peak-stepping sequence 6Li (10 sintegration time) 23Na (10 s) 27Al (10 s) 30Si (2 s) 39K (10s) 48Ti (10 s) and 54Fe (10 s) The detection limits could notbe directly defined due to the lack of a demonstrably lsquoblankrsquoquartz sample however based on our low dynamic back-ground of ~2 counts per minute and the lsquocleanrsquo nature of thequartz spectrum our detection limits can be safely assumedto be in the sub-ppm range (see also eg Zinner amp Crozaz(1986) for discussion of SIMS detection limits) Concerningthe accuracy of our SIMS quantitative data we were severe-ly limited by the lack of a well characterised demonstrablyhomogeneous reference sample Hence any errors in the as-signed elemental concentration of our primary standard willbe propagated systematic errors on the analyses of the sam-ples which we investigated We operated our mass spec-trometer at low mass resolution M M = 300 In order tosuppress isobaric molecular interferences we applied an en-ergy offset of 50 V The external precision of the analyseswas 6 ppm absolute standard deviation for 6Li 23 ppm for23Na 2 ppm for 27Al 13 ppm for 39K 3 ppm for 48Ti and 9ppm for 54Fe
The absolute abundance of each of these elements werecalculated by comparison with a reference sample of largenatural quartz crystal (Table 2) Calculated concentrationsrely on the assumption that the relative ion yields for aknown major element (in our case Si) and a trace elementare constant for a given matrix It is therefore necessary toclosely match both the chemical composition and the latticestructure of the reference lsquostandardrsquo and the sample In thisregard quartz is one of the easier phases to analyse due tothe fact that chemical solid solutions are essentially non-ex-istent for this phase For this study we made use of a sampleof Brazil quartz for which Li Al Ti and Fe concentrationshad been determined from solution by ICP AES and ICP-MS (Table 2) We did not possess reliable Na and K data forour reference sample and hence our SIMS measurementscan only provide relative abundances for these elements Wesuggest that the problem which were encountered with thesetwo alkali group elements might be related to the presenceof fluid inclusions which might be present in the Brazil peg-
Table 2 Trace element concentrationsof the Brazil quartz referencesample used for calibration of SIMS analyses The values are givenin microg middot g-1
element ICP AES(3g)
ICPGFZ Pots-dam (01 g)
ICP-MSGZG Goumlttin-gen (01 g)
value used
Li 44 12 (MS) 108 91Na 534 ndash ndash ndashAl 75 100 (AES) ndash 87K 228 ndash ndash ndashTi 10 lt20 (AES) ndash 10Fe 32 ndash ndash 32
from Schmidt amp Ziemann (2000)
matite crystal as these two element would be greatly con-centrated in such fluids thereby biasing the bulk concentra-tion data One might expect that the SIMS analyses of the al-kali element Li might also be similarly impacted though ourresults do not clearly suggest this (Table 3) Regarding theaccuracy of the data for Al Ti and Fe two lines of reasoningconstrain the magnitude of any systematic errors whichmight be present (1) the reproducibility between two inde-pendent bulk analyses for both Al and Ti were not extreme(see Table 2) and (2) the SIMS data are generally consistentto within a factor of two with the other techniques reportedhere Hence it seems likely that any systematic errors in-duced by the uncertainties in the composition of the refer-ence sample should not be larger than perhaps a factor of 05or 10 at the worst
This discussion clearly highlights the need for a suite ofhigh quality quartz reference samples which should be madeavailable to the SIMS community Only once a well charac-terised and demonstrably homogeneous set of samples is de-veloped will SIMS analytical accuracy be brought in linewith the techniquersquos superior precision smaller samplingsize and lower limits of detection
Laser ablation ndash inductively coupled plasma massspectrometry (LA-ICP-MS)
We used a laser-ablation microsampler coupled to an induc-tively coupled plasma mass spectrometer (LA-ICP-MS) FI-SONS PQ2+ at the Geowissenschaftliches Zentrum Goumlttin-gen A FISONS NdYAG UV-laser (266 nm) microprobewith a laser pulse repetition rate of 5 Hz was focused ontothe surface of a polished sample Using a laser beam energyof 225 mJ the middle aperture and an acquisition time of40 s the laser ablates craters 40 to 50 microm in diameter and be-tween 90 to 120 microm in depth The volume of ablated samplematerial amounts between 11 middot 105 and 24 middot 105 microm3 Theoptimal laser configuration was established through multi-ple test measurements and varying counting rates to reachlowest detection limits to avoid sample outbreak during ab-lation and to get smallest possible craters A laser beamwith larger diameter and higher energy ablates more materi-al and results in lower detection limits which are inverselyproportional to 3rd root of the ablation volume (Potts et al
Trace elements in quartz 751
1995) Nevertheless the risk that micro-inclusions withinthis volume are also ablated cannot be avoided and there-fore a compromise is necessary The ablated material wasentrained by a high purity Ar gas at a flow rate of 08-13 lmin Isotopic masses were analysed using a quadrupolemass filter
All data were calibrated against the external standardNIST SRM610 glass and the internal standard of the Si val-ue (467 x 105 ppm = stoechiometric concentration of Si inquartz) We used the values from Pearce et al (1997) for cal-culating the absolute concentrations in the quartz samplesReplicate analyses of the NIST SRM610 and NISTSRM612 glass standard were done under the same operatingconditions In terms of accuracy these analyses showed thatthe LA-ICP-MS values are within plusmn 12 of the concentra-tions given by Pearce et al (1997)
Eleven mass stations were analysed during each of theblank circles 7Li 23Na 27Al 29Si 30Si 49Ti 53Cr 55Mn 57Feand 72Ge The isotopes were chosen (1) to avoid possible in-terferences with other isobaric masses and (2) to obtain thehighest peak to background ratios The high sensitivity ofthe ICP-MS for most trace elements in quartz is demonstrat-ed by the low detection limits as listed in Table 1 The deter-mination of Na is a general problem of micro-beam analysisbecause its high volatility and abundance leads to an omni-present Na contamination The external precision of theanalyses was 4 ppm absolute standard deviation for 7Li 11ppm for 27Al 10 ppm for 49Ti 11 ppm for 53Cr 9 ppm for55Mn 9 ppm for 57Fe and 12 ppm for 72Ge
Optical cathodoluminescence
The CL emission of quartz was determined using a hot-cath-ode luminescence microscope (Neuser et al 1995) at an en-ergy of 14 keV and a filament current of 018 mA The spec-tral response of the luminescence was recorded with the tri-ple-grating (100 linesmm 1200 linesmm and 1800 linesmm) spectrograph TRIAX 320 equipped with a LN2-cooledCCD-detector The 100 linesmm grating was used to ac-quire an overview spectrum between 400 and 900 nm (31-14 eV) The 1200 linesmm grating provided detailed spec-tra from within 70 nm spectral range The sample surfacewas analysed over a diameter of 800 microm using a 20x040objective The integration time for spectrum acquisition was20 s for the 100 linesmm grating and 30 s for the 1200 linesmm grating The spectra were corrected for the total instru-ment response
The CL emission bands plotted as deconvoluted Gauss-ian curves were determined using the procedure of Muumlller etal (2002) The areas under each Gaussian curve were usedto estimate the percentage of the individual emission bandsof the total spectrum between 14 and 31 eV
Fourier-transform infrared (FTIR) spectroscopy
Transmission FTIR spectra of quartz were obtained usingthe Perkin Elmer 1760-X FTIR spectrometer by S Vaupel atthe University Goumlttingen The spectrometer operates with
Fig 5 SEM-CL images of quartz documenting the position of spotanalysismade by SIMS EPMA and LA-ICP-MS (a) Quartz pheno-cryst in the Aue Granite showing weakly developed concentricgrowth zoning overgrown by groundmass quartz which is free ofzoning The crystal is penetrated by non-luminescent domains ofneocrystallised(secondary)quartz (black) (b) Zoned quartz pheno-cryst of the Weinheim Rhyolite Dark areas correspondto red to red-dish brown CL-colours and bright areas correspond to blue to violetcolours (c) Pattern of secondaryCL structurestypicalwithin the Ha-kos megaquartz In addition to the homogeneous host quartz threegenerations of younger quartz may be readily distinguished(1) an-nealed domains with very weak CL associated with fluid inclusiontrails (2) bright luminescent linear trails some of which overprintpopulation (1) (3) narrow linear cracks annealed by non-lumines-cent quartz
an external microscope with a separate mercury-cadmium-telluride-detector The microscope is supplemented with avacuum sample chamber (Dewar K-770-T) which is re-quired for liquid N2-cooling of the sample and ray path(ndash190 to ndash194degC) to suppress interference with atmosphericH2O and CO2 The cooling resulted in a maximal signalnoise ratio of the detected spectra Moreover the spectrawere obtained at cryogenic temperatures to distinguish fluidinclusion water from crystallographic bounded water Thequartz wafer is penetrated by an electromagnetic UV beam(wavelength = 2-25 microm) The analysis were carried out ondoubly polished wafers 250 microm in thickness Prior to the
752 A Muumlller M Wiedenbeck AM van den Kerkhof A Kronz K Simon
Fig 6 CL spectra of quartz acquired after 05 2 and 7 minutes of electron exposure recorded with the 100 linesmm grating Also shown isthe calculatedbest-fit Gaussian population for the 7-min-spectra
measurement the wafers were cleaned with acetone anddried for 10 h at 110degC The spectra were acquired in a rangeof wave numbers between 5000 to 2000 cm-1 with 200 scansin the transmission modus The resolution of the measure-ments was 4 cm-1 The spot size of the beam on the samplewas 40 microm in diameter which allows the recording of severalspectra along a traverse within one crystal Backgroundmeasurements were conducted after each spectra The spec-trum processing was carried out on a PC for baseline correc-tion sample thickness correction and converting of thetransmission spectrum to the absorption spectrum
Sample petrography and cathodoluminescence
We studied three samples from three distinct geological en-vironments
Porphyritic biotite granite of Aue (Western ErzgebirgeGermany) is Upper Carboniferous in age and containsquartz phenocrysts up to 2-5 mm in size In CL these pheno-crysts show weakly contrasted concentric growth zonation(Fig 5a) The quartz has a bright unstable blue CL whichchanges over 2 minutes of electron irradiation to a violetred-brown (Fig 6a) The phenocrysts are cemented andovergrown by groundmass quartz which is free of growthzoning The crystals also contain non-luminescent neocry-
stallised domains of secondary quartz These domains occurpreferably around fluid inclusions which are typically con-nected by annealed cracks
Euhedral phenocrysts in the Lower Permian Weinheimrhyolite from the Southern Odenwald Mts (Germany) occurwithin a fine-grained groundmass These phenocrysts showcomplex zoning patterns (Fig 5b) which appear as shades ofblue and violet in CL (Fig 6b c) Microcrystalline ground-mass quartz (lt3 microm) is also present and shows dark red CLContraction cracks annealed with non-luminescent quartzare also visible
The hydrothermal megaquartz from the Hakos Moun-tains (Namibia) shows generally bright turquoise CL duringthe first 20 seconds of electron bombardment whichchanges into a violet to red-brown CL after one minute ofexposure (Fig 6d) The quartz exhibits a network of neocry-stallised (secondary) structures such as irregular weak lu-minescent domains and annealed cracks of different agesshapes and CL colours A typical CL pattern of secondarystructures is shown in Fig 5c Domains of annealed quartzcontain numerous fluid inclusions All quartz populationswithin the megacrystal have the same crystallographic ori-entation and cannot be distinguished by optical observationusing crossed nicols The quartz formation temperaturebased on fluid inclusion studies was determined to be be-tween 150 and 250degC (Behr amp Schmidt-Mumm 1987)
Trace elements in quartz 753
Table 3 Trace element concentrations (microg middot g-1) in quartz of the Aue Granite (Aue01-Aue32)of the Weinheim Rhyolite (Wein01-Wein13)and of the Hakos megaquartz (Hak01-Hak06)determinedby EPMA SIMS and LA-ICP-MS Relative abundancesratios are given as X30Simiddot 10-4 for Na and K SIMS analysis
EPMA SIMS LA-ICP-MS Al Ti K Fe Li Al 23Na
30Si
39K30Si
Ti Fe Li Al Ti Cr Mn Fe Ge
Aue01 212 36 10 34 64 325 386 664 75 25 408 248 53 lt12 51 55 14Aue02 222 42 lt10 36 65 297 143 127 73 20 ndash ndash ndash ndash ndash ndash ndashAue03 217 48 16 117 60 294 179 130 78 23 ndash ndash ndash ndash ndash ndash ndashAue04 199 63 lt10 31 48 244 170 123 84 22 287 207 80 lt12 24 27 lt14Aue05 217 60 24 21 51 238 106 068 79 16 ndash ndash ndash ndash ndash ndash ndashAue06 148 66 14 lt21 37 181 106 077 92 13 432 170 80 lt12 31 35 lt14Aue07 180 49 lt10 lt21 36 186 151 091 93 16 ndash ndash ndash ndash ndash ndash ndashAue08 74 17 lt10 lt21 16 135 192 149 11 11 ndash ndash ndash ndash ndash ndash ndashAue09 58 lt17 10 lt21 40 248 281 236 84 23 ndash ndash ndash ndash ndash ndash ndashAue10 152 46 15 lt21 15 170 985 432 55 17 272 154 45 lt12 11 lt27 lt14Aue11 106 29 lt10 lt21 22 205 469 197 85 19 ndash ndash ndash ndash ndash ndash ndashAue12 69 lt17 lt10 21 23 178 308 154 87 18 ndash ndash ndash ndash ndash ndash ndashAue13 164 48 lt10 lt21 23 188 370 196 85 21 ndash ndash ndash ndash ndash ndash ndashAue14 53 lt17 19 lt21 21 174 224 146 78 20 ndash ndash ndash ndash ndash ndash ndashAue15 138 58 lt10 lt21 28 186 180 128 79 19 316 152 72 lt12 45 49 20Aue16 145 41 14 lt21 29 194 177 129 83 20 331 163 68 lt12 31 lt27 lt14Aue17 159 51 lt10 lt21 40 268 187 147 96 33 ndash ndash ndash ndash ndash ndash ndashAue18 154 61 22 54 40 194 148 091 93 15 384 181 60 lt12 25 lt27 14Aue19 143 60 lt10 lt21 28 194 149 110 92 29 ndash ndash ndash ndash ndash ndash ndashAue20 164 21 lt10 lt21 34 248 232 149 57 53 ndash ndash ndash ndash ndash ndash ndashAue21 233 lt17 17 lt21 14 160 338 185 4 99 492 231 47 lt12 35 34 lt14Aue22 175 40 18 lt21 23 340 144 374 53 54 ndash ndash ndash ndash ndash ndash ndashAue23 154 40 18 lt21 23 230 653 489 53 50 ndash ndash ndash ndash ndash ndash ndashAue24 164 24 15 27 28 241 294 215 52 40 ndash ndash ndash ndash ndash ndash ndashAue25 180 37 lt10 lt21 36 275 328 271 52 42 520 212 63 lt12 45 48 lt14Aue26 191 33 18 lt21 30 256 501 328 57 36 ndash ndash ndash ndash ndash ndash ndashAue27 185 36 19 lt21 27 249 498 352 66 40 488 223 75 lt12 17 lt27 lt14Aue28 138 56 11 lt21 18 202 471 385 85 33 ndash ndash ndash ndash ndash ndash ndashAue29 143 54 20 lt21 20 206 399 212 84 29 ndash ndash ndash ndash ndash ndash ndashAue30 236 29 14 lt21 36 322 433 314 41 54 334 281 62 lt12 42 52 lt14Aue31 196 51 20 lt21 16 190 814 572 68 33 502 276 78 lt12 27 38 lt14Aue32 175 52 lt10 lt21 31 217 280 200 83 34 ndash ndash ndash ndash ndash ndash ndash
Wein01 152 32 lt10 65 29 212 205 187 73 41 ndash ndash ndash ndash ndash ndash ndashWein02 138 52 18 44 27 187 216 194 93 34 248 185 44 lt12 13 na lt14Wein03 149 52 10 36 12 193 243 211 101 34 226 174 34 lt12 lt10 na 20Wein04 147 48 12 26 14 189 239 215 98 36 465 180 44 lt12 13 na 25Wein05 143 50 13 lt21 11 187 219 198 98 34 292 186 25 lt12 17 na 16Wein06 138 49 20 lt21 11 178 252 218 94 34 ndash ndash ndash ndash ndash ndash ndashWein07 162 48 12 lt21 16 203 266 253 77 38 348 169 98 lt12 lt10 na 16Wein08 159 68 13 lt21 30 371 135 304 123 73 330 173 52 lt12 97 na lt14Wein09 275 79 75 92 36 392 260 334 127 78 562 171 75 lt12 12 na 56Wein10 175 60 14 21 45 266 638 756 100 55 437 169 100 lt12 lt10 na 37Wein11 154 34 lt10 lt21 34 190 270 231 32 35 259 171 79 lt12 lt10 na lt14Wein12 158 32 lt10 lt21 27 162 247 198 19 32 308 170 88 lt12 55 na lt14Wein13 191 39 lt10 lt21 19 225 153 103 53 107 ndash ndash ndash ndash ndash ndash ndash
Hak01 142 lt17 16 lt21 27 179 038 021 1 5 297 181 15 30 18 40 138Hak02 lt42 lt17 22 lt21 1 36 015 017 nd nd 295 169 16 42 44 72 117Hak03 136 lt17 17 lt21 35 174 024 009 1 5 258 179 18 34 22 44 98Hak04 131 lt17 19 lt21 27 120 017 005 1 4 282 183 19 36 30 58 128Hak05 lt42 lt17 15 lt21 37 178 019 006 1 6 272 156 20 30 18 30 144Hak06 lt42 lt17 lt10 lt21 1 9 019 011 nd nd 276 162 17 38 24 53 122
na ndash not analysed for nd ndash not detected
754 A Muumlller M Wiedenbeck AM van den Kerkhof A Kronz K Simon
Fig 7 Plots of secondary ion intensity as a function of sputter time (a) Analysis of quartz from the Aue Granite where an increase in 7Li anda decrease in 23Na
39K and 54Fe intensity with time were observedThis intensitychange is a general phenomenaof these measurements (b)Analysis of neocrystallisedquartz within a fluid inclusion trail in the Hakos megaquartz The sputter time of about 3000 s corresponds to adepth profiling of 10 microm
Results
Analyses were performed by EPMA for Al K Ti Fe bySIMS for Li Na Al K Ti and Fe and by LA-ICP-MS forLi Al Ti Cr Mn Fe and Ge (Table 3) These suites of ele-ments include the most important impurities typically foundin quartz
Comparison of EPMA SIMS and LA-ICP-MS data
A comparison of the element concentrations determined bythe three methods on the same sample domains frequentlyyielded obvious differences Such differences reflect smallscale heterogeneities in the samples surface contamination alteration which is especially detectable by SIMS uncer-tainties in the composition of the reference sample used forSIMS calibration or other analytical inaccuracies Further-more distances between the exact spot locations of the threetechniques occasionally reach up to 200 microm introducing therisk that quartz with genuinely different trace element con-centrations are being compared
The concentrations for Na (534 ppm) and K (228 ppm)for the Brazil quartz reference sample (Schmidt amp Ziemann2000) used for SIMS appear unrealistically high resultingin calculated Na and K contents for our sample in the rangetypical for feldspars This suggests that the bulk Na and Kdata of Schmidt amp Ziemann (2000) might reflect the pres-ence of Na- and K-rich inclusions Therefore we presentour SIMS Na and K data as relative 23Na+30Si+ and 39K+30Si+ ratios Furthermore the lack of reproducibility be-tween independent data sets (Table 2) for Li Al and Fe im-plies that the standard sample might possess significant het-erogeneities Clearly the lack of a well characterised quartzreference sample is a fundamental impediment for the SIMStrace element analysis of this phase
We frequently observed decreasing counting rates for NaK and Fe during the SIMS analysis (Fig 7a) despite the pre-
rastering of the analysis area prior to data collection Thismay indicate residual sample surface contamination or sur-face modification due to charging phenomena during theearlier CL imaging (eg Remond et al 1992) In such casesthe data were only assessed for the later part of the analysiswhere the relative secondary ion intensities had stabilisedIn contrast to Na K and Fe the count rate for Li frequentlyincreased as a function of time suggesting a mobilisation ofLi towards the sample surface during CL electron bombard-ment (Alley et al 1999) Sometimes the ion beam penetrat-ed into a fluid inclusion (Fig 7b) in such cases it was neces-sary to judiciously select which data collection cyclesshould be rejected from the final measurement averagesHowever the time-resolved measurements give informa-tion about the element abundances of fluid inclusions
In order to compare the data from the various micro-ana-lytical techniques Fig 8 plots the Al and Ti concentrationsdetermined by SIMS EPMA and LA-ICP-MS (collected inimmediate proximity see Fig 5) Ideally all points wouldplot on the dashed lines in which case all three methodswould have yielded the same absolute concentrations Un-fortunately this is not the case
In the case of Al the concentrations determined bySIMS EPMA and LA-ICP-MS show linear trends near the11 ratio line (Fig 8a b c) Al concentrations of the EPMAand LA-ICP-MS are in a good agreement For Al best isLA-ICP-MS EPMA especially taking error bars into ac-count (Fig 8d) The SIMS Al concentrations tend to be sys-tematically higher (up to 25 ) than for the EPMA and LA-ICP-MS concentrations The presence of systematicallyhigher Al concentrations determined by SIMS might be a re-flection of a too low Al value being assigned to the Brazilreference sample (see Table 2)
In the case of Ti we observe a different situation As forAl we find that SIMS tends to produce systematically high-er concentrations than EPMA (Fig 8d) The systematic er-ror mainly reflects the poor documented quartz referencesample used for SIMS Nevertheless a small systematic er-
Trace elements in quartz 755
Fig 8 Concentration plots of Al (a b and c) and of Ti (d e and f) in the Aue and Weinheim quartz samples determined by SIMS EPMAand LA-ICP-MS
756 A Muumlller M Wiedenbeck AM van den Kerkhof A Kronz K Simon
ror of EPMA between sample and standard measurementsshould be taken into account We also observe more scatterbetween the LA-ICP-MS SIMS and LA-ICP-MS EPMAvalues than is seen between the EPMA SIMS values Thedegree of scattering of Ti values is worse for the Weinheimsample than for the Aue sample which tend to plot closer tothe 11 ratio line (Fig 8e and f) We attribute the source ofthis effect to a sampling size phenomenon
The analysed volume of the quartz using LA-ICP-MSreaches up to ~1700 times the X-ray sampling volume of theEPMA According to this argument the LA-ICP-MS mea-surements ablated Ti-rich growth zones that were eitherstraddled by the laser or else which were not lsquoobviousspikesrsquo that could be confidently discerned at the time of da-ta assessment Finally the Ti data set from the Aue andWeinheim samples apparently behave systematically differ-ent (Fig 8e 8f) a phenomenon not observed for aluminium
As a second approach to assess our data we plotted theCL grey scale against the ppm concentrations measured byeach of the three analytical methods (Fig 9) The X-axis ofthis plot gives the integrated luminescence from 7 minutesof electron radiation whereby low total luminescence cor-relates strongly with a red-brown colour and high total lumi-nescence is always characterised by a blue hue We presentthis semi-quantitative comparison of CL and element con-centrations because the sample surface of about 500000microm2 from which the CL spectra were obtained includes 8sampling spots (see Fig 5) Relating individual CL emis-sion bands to element concentration from a much smallersampling spot is not meaningful in a heterogeneous lumi-nescent quartz For this reason we calculated the integratedgrey-scale value at the sampling point from SEM-CL im-ages made prior to element analysis This alternative ap-proach is limited to Al and Ti the only elements for whichwe obtained interpretable data from all three techniques
We find that EPMA yields systematically lower Al val-ues than those obtained from either SIMS and LA-ICP-MSExcept at the very highest Al concentrations we found nocorrelation between Al and the CL grey-scale value
In the case of Ti SIMS yielded systematically higherconcentrations as compared to EPMA Furthermore the Ticontents measured by both SIMS and EPMA show a linearcorrelation with the total CL emission intensity The highlysystematic difference in slopes seen between the two tech-niques might be indicative of SIMS calibration problems re-lated to the low Ti content of the Brazil reference sample(Table 2) Regarding the LA-ICP-MS results for Ti we ob-serve little or no correlation between determined concentra-tion and total CL emission We attribute the dramatic differ-ence between LA-ICP-MS and the other two techniques asresulting from the difference in sampling volume For Tithe comparatively poor spatial resolution averaged the Tisignal from a large potentially non-homogeneous volumeThis scattering is particularly noticeable in the case of thezoned quartz from the Weinheim rhyolite
In the Hakos megaquartz the Ti concentration determinedwith LA-ICP-MS is much higher than that determined usingSIMS Ti determined by LA-ICP-MS is relatively constantand amounts 177 plusmn 16 ppm The large volume of materialablated by the laser could have caused contamination with
Fig 9 Plot of CL grey scale intensityand the Al and Ti contentof thequartz from the Weinheim rhyolite determined by SIMS EPMAand LA-ICP-MS The grey scale reflects the intensity ratio of red(17-22 eV) versus blue emission (24-31 eV) The higher the blueemission intensity the greater the value of the grey scale Quartzwith high Ti correlates to violet to blue CL
small Ti-bearing inclusions SIMS measurements give con-centrations between 0 and 1 ppm
Trace element distributions
Key trace element concentrations as a function of profile po-sition are shown in Fig 10
The magmatic quartz of the Aue granite shows a reason-ably constant Al concentration of around 200 ppm expectAl-poor areas in low CL intensity neocrystallised domainsLate magmatic quartz that resembles unzoned secondaryovergrowth (first 3 measurements in the quartz of the AueGranite Fig 5a 10) shows distinctly higher Li concentra-tions which are correlated with moderately elevated Alcontents Non-luminescent neocrystallised regions whichoverprint both the zoned and non-luminescent quartz aredepleted in Ti Furthermore we detected an increase in theFe-content at the core of the zoned crystal corresponding toan area of weak CL emission however other bands of weakCL do not show this feature The elevated Fe-content sug-
Trace elements in quartz 757
Fig
10
SIM
San
dE
PM
Atr
ace
elem
entp
rofi
les
for
Li
Al
KT
ian
dF
ein
quar
tzfr
omth
eA
ueG
rani
tean
dfr
omth
eW
einh
eim
Rhy
olit
eT
hepo
siti
onof
prof
iles
issh
own
inF
ig5
aan
d5b
res
pect
ivel
yT
hebo
ttom
diag
ram
sgi
veth
ere
lati
vein
tens
ity
ofca
thod
olum
ines
cenc
ein
grey
valu
esL
owgr
eyva
lues
corr
espo
ndto
red-
brow
nC
L-c
olou
rsan
dhi
ghgr
eyva
lues
corr
e-sp
ond
tovi
olet
tobl
ueco
lour
s
758 A Muumlller M Wiedenbeck AM van den Kerkhof A Kronz K Simon
gests that the core of the zoned domain may have crystalli-sed in a distinct geochemical environment Given that highFe are restricted to the crystal core this feature may be a re-cord an early stage of magma crystallisation
Quartz from the Weinheim rhyolite yielded the highest Ticoncentration of the three samples which we studied aver-aging ~65 ppm with a maximum of 127 ppm The pattern forTi as noted above (Fig 9b) shows the strongest correlationwith the CL grey scale intensity The Weinheim quartz alsocontains elevated concentrations of Al K and Fe and thesevalues are much more constant than seen in our other sam-ples The band showing the highest CL emission (Fig 10)which is not associated with the crystal core shows extremeconcentrations for all these elements This sample containsneither fluid inclusions nor neocrystallised domains sug-gesting that the trace element pattern which we observe re-flects original magmatic processes
The Hakos megaquartz contains unaltered zones whichare homogeneous in Li Al Ti Na and K They yield abso-lute concentrations that in general are lower than in ourother two samples ICP-MS analyses of these large regionsdetected elevated Mn and Cr concentrations and both theseelements were found to correlate with the Fe abundanceLikewise quadrivalent Ge which substitutes for Si is alsoenriched in the megaquartz (3-16 ppm) However time-re-solved SIMS measurements (Fig 7b) clearly show that oth-er than Li Ge is enriched in the fluid inclusions Such rela-tively bright CL-emission zones are intersected by threegenerations of younger quartz which appear as distinctstructures in our CL image (Fig 5c) First irregular bandshaving weak CL intensity are visible and these have highlydepleted trace element contents (Table 3) A second quartzgeneration appearing as bright straight lines in the CL im-age are associated with cracks which may be associatedwith late fluid flow A third generation appearing as veryfine bands of weak CL-emission are seen to crosscut allother structures We were unable to measure the trace ele-ment contents of these second and third overprinting gener-ations due to their narrowness relative to the sampling sizeof our analytical techniques
Discussion
Analytical issues
Our comparative study demonstrates the relative strengthsand limitations of the three in situ analytical techniqueswhich we employed EPMA has the obvious advantage ofthe smallest sampling volume Furthermore data reductionprocedures and quantitative calibration methods for thistechnique are well established The ability to rapidly switchbetween CL imaging and EPMA is a second strong advan-tage of this technique The main limitation encountered byEPMA is the extreme care needed when analysing elementsat very low abundances and the fact that for many elementseven long counting times coupled with a detailed back-ground characterisation will not achieve the required sensi-tivity
Regarding SIMS the main strength of the technique is its
high sensitivity allowing for many elements to be deter-mined at the low ppm level However this advantage issomewhat compromised by a lower spatial resolution com-pared to EPMA a fact that can be critical if finely zoned fea-tures or alteration domains need to be analysed Anotherdrawback associated with ion probe analysis is the absenceof well characterised quartz reference samples
LA-ICP-MS analyses combine the strengths of relativelystraight forward calibration procedures with low detectionlimits The ability to calibrate quantitative analyses againsta glass reference sample is a major advantage relative toSIMS However laser ablation has the disadvantage of sig-nificantly poorer spatial resolution compared to both EPMAand SIMS (Fig 1 3) In large homogeneous samples thislimitation is not important but in zoned material the resultsmay be averaging of multiple domains with distinct compo-sitions Recent developments in laser technology offer thehope of overcoming this handicap (eg Flem et al 2002)
Al defects
The abundance of the alkali elements Li Na and K are cor-related in all three of our samples (Fig 11) Furthermore weobserve a clear though somewhat weaker correlation be-tween Li+ and K+ and both Al and Fe The correlation of Naversus Al is less pronounced These observations fit with thegeneral assumption that mostly Li+ and K+ act as chargecompensators for Al3+ and Fe3+
Fig 12 shows examples FTIR absorption spectra of theinvestigated quartz Due to the different sample preparationprocedures the spectra were recorded from other quartzcrystals of the Hakos Weinheim and Aue samples thanthese used for the trace element analysis However the spec-tra give an idea about the kind of structural Al and Li defectsrelated to the presence of hydrogen The associated sharpabsorption bands at 3365 and 3305 cm-1 attributed to hydro-gen-compensated aluminium defects (marked as ldquoAl-Hrdquo inFig 12) are the most significant peaks in the hydroxyl bandBoth bands are found in all three spectra and are most in-tense in the quartz from the Weinheim rhyolite The mega-quartz shows a high intensity of the 3474 cm-1 band whichwas assigned by Kats (1962) to proton-compensated alu-minium defect perturbed by Li+ (marked as ldquoLi-Hrdquo in Fig12) This band is also present at very low intensity in thespectra of the Aue and Weinheim samples Both the quartzof the Aue granite and of the Weinheim rhyolite are charac-terised by the broad absorption bands at ~3110 and3220 cm-1 Both bands are caused by the symmetricalstretching vibrations of unfrozen molecular water (markedas ldquoO-Hrdquo in Fig 12 Aines amp Rossman 1984) Unfrozenmolecular water at ~ndash190degC indicate structural bond waterand water-bearing micropores within the analysed samplevolume but not molecular water of visible fluid inclusionsAll three samples contain hydrogen-compensated Al and Lidefects independently from the crystallisation environment
Stenina et al (1988) and Stenina (1995) suggested thatAl along with Li Na and K is enriched in sub-microscopicwater-bearing defect clusters in the form of 2[SiO3]+ ndash H2Ondash M+ ndash 2[M3+O4]- (M+ = Li+ K+ and Na+ M3+ = mostly Al3+
Trace elements in quartz 759
Fig 11 SIMS trace element variation diagramsDue to the lack of a good reference sample for Na and K the results for these two elementsare given as measured X30Si ratios
and Fe3+ see Fig 13) Previous studies showed that Al Feand alkali metals tend to form minute atomic clusters whichare incorporated along specific growth axes and this is es-pecially true for low-temperature quartz (Pfenninger 1961Flicstein amp Schieber 1974 Siebers 1986 Ramseyer ampMullis 1990 Brouard et al 1995) Investigations of hydro-gen isotopes by Simon (2001) documented two H-reservoirsin quartz (i) fluid inclusions and (ii) structurally-bound wa-ter in small homogeneously distributed clusters and bub-bles According to Simonrsquos (2001) model such micro-clus-
ters should be accompanied by high Al3+ and K+ Na+ Li+
abundances The lower D values in smaller fluid inclu-sions point to structurally-bound water occurring as OH-
brought about by a high surfacevolume ratio Whether Aland Fe and their charge compensators Li Na and K arestructural impurities or represent micro-clusters can not beestablished from our data set However the relative highabundance of hydrogen-compensated Al defects and struc-tural bond water molecules observed by the FTIR may indi-cate the existence of such micro-clusters We assume that a
760 A Muumlller M Wiedenbeck AM van den Kerkhof A Kronz K Simon
Fig 12 IR-absorption spectra of the (a) Hakos megaquartz (b)quartz from the Weinheim rhyolite and (c) quartz from the Auegranite recorded at ~ndash190degC
Fig 13 Generalised schematic structure of an impurity cluster inquartz in which large amounts of Al Fe and interstitialK Na and Liions are concentratedSuch a cluster would representa transitionbe-tween structural defects and inclusions
continuous transition exists between structural impuritiesmicro-clusters and inclusions
In our study Al showed no obvious correlation with CLHowever Ramseyer amp Mullis (1990) and Perny et al(1992) assumed that the high Al and Li concentrations resultin the unstable blue CL sometimes seen in hydrothermalquartz Some of the bright blue luminescent growth zones ofthe Weinheim phenocryst are enriched in Al and Li but alsocontain elevated Ti Fe K and Na concentrations (Fig 10700-900 microm of the profile) As discussed above Al and itscharge compensating ions cause a number of structural de-fects which influence the CL properties of quartz but these
mechanisms are too complex to be correlated directly withtrace element signatures
Ti defects
Titanium which substitutes for Si shows a relatively poorcorrelation with Al and shows no correlation with othertrace elements (Fig 11e f) The lack of correlation with oth-er elements may be explained by the fact that Ti occursmainly in the quadrivalent state in our samples which re-quires no charge compensation by interstitial cations How-ever the quartz of the relative Ti-rich Aue granite and of theWeinheim rhyolite contains paramagnetic [TiO4Li+]0 de-fects (Muumlller 2000) The heterogeneous distribution of Ti isclearly related to the growth zoning in both the Aue graniteand in the Weinheim rhyolite Stable blue luminescentgrowth zones show highest Ti Previous studies showed thatrhyolitic quartz phenocrysts possess variations in Ti be-tween growth zones (lt5 microm Fig 5b Muumlller et al 2000)EPMA gives the most realistic Ti contents based on qualityof correlation with CL zoning (Fig 9b) The correlation ofCL structures with the Ti distribution implies structural po-sition of Ti in the quartz lattice There is no evidence for Ti-containing micro-inclusions
We found Ti in both igneous quartz samples but ob-served less Ti in quartz of hydrothermal origin This resultsupports earlier observations by Sprunt (1981) and Bruhn etal (1996) High Ti concentrations were also found by Vanden Kerkhof et al (1996) in quartz from granulites Causedby its large ion radius (r = 069 Aring) Ti4+ usually forms six-fold coordinated octahedra with O2- High crystallisationtemperatures gt500degC are necessary in order to fit the Ti4+ into the four-fold coordinated quartz lattice (Blankenburg etal 1994) The uptake of gt50 ppm of Ti may be also limitedby the stability field of high-quartz This supports the gener-al idea that the stable blue to violet luminescent quartz formsat higher temperatures than quartz with red-brown lumines-cence (eg Bruhn et al 1996) Concerning the mechanismof CL activation these results do not unequivocally provethat the CL emission is activated by Ti (Bruhn et al 1996)
Other defects
Gerler (1990) showed that Ge concentrations determined byINAA correlate with Cl Br and the salinity of fluid inclu-sions According to Schroumln (1969) Ge uptake into the quartzlattice is increased by the presence of halogens in hydrother-mal low-temperature solutions The extremely high salinityof primary fluid inclusions of up to 68 wt in the Hakosquartz (Behr amp Schmidt-Mumm 1987) may have stimulat-ed Ge uptake However in the case of the Hakos quartz theGe is enriched in fluid inclusions (Fig 7b)
Conclusions
Our comparison of the three micro-analytical techniquessuggests that EPMA and SIMS provided that they can be
Trace elements in quartz 761
properly calibrated are suited for the study of Al and Ti inzoned quartz crystals LA-ICP-MS also yields interpretabledata however such analyses average trace element contentsover vastly larger volumes The previously reported concen-tration values for the Brazil quartz reference sample used forcalibrating our secondary ion yields likely need further re-finement The development of a homogeneous and welldocumented quartz reference sample will be a crucial futurestep essential for improving SIMS-based trace elementanalyses of this phase
Ti contents were found to be related to blue luminescentgrowth zones in the igneous quartz of the Aue and Wein-heim samples However these results do not prove that thestable blue CL emission is activated by Ti For Li Al Fe Liand K no association with CL zoning is seen However ne-ocrystallised quartz with very low luminescence intensity isdepleted in all these elements Hydrogen-compensated Aland Li defects are present in all three quartz types in differ-ent quantities Nevertheless most Li in igneous quartz isprobably bond to paramagnetic [TiO4Li+]0 defects More-over structural molecular water andor sub-microscopicwater-bearing defect-clusters seem to be common in igne-ous quartz The combination of quantitative in situ elementanalyses and with spectroscopic methods providing infor-mation about the nature of structural defects will improveour understanding of the petrogenetic significance of traceelements in quartz
Acknowledgements We thank Hans-Juumlrgen Behr ReimarSeltmann and Chris Stanley for stimulating discussion Weare also most grateful for helpful reviews by Frank Poitras-son and Rune B Larsen This contribution was supported byDFG through the grant MU 17172-1
References
Aines RD amp Rossman GR (1984) Water in minerals A peak inthe infrared J Geophys Res 89B6 4059-4071
Alley TG Brueck SRJ WiedenbeckM (1999) SIMS study ofspace charge formation in thermally poled fused silica J ApplPhys 8612 6634-6640
Armstrong JT (1995)CITZAF A packageof correctionprogramsfor the quantitative electron microbeam x-ray analysis of thickpolishedmaterials thin films and particlesMicrobeamAnalysis4 177-200
Bahadur H (1994) Sweeping and irradiation effects on hydroxyldefects in crystalline natural quartz IEEE Trans Ultras Ferro-el Frequ Control 416 820-833
Bambauer HU (1961) Spurenelementgehalt und -Farbzentren inQuarzen aus Zerrkluumlften der Schweizer Alpen SchweizMineralPetrogr Mitt 41 335-369
Bambauer HU Brunner GO Laves F (1963) Merkmale desOH-Spektrums alpiner Quarze (3micro-Gebiet) Schweiz MineralPetrogr Mitt 43 259-268
Behr H-J amp Schmidt-Mumm A (1987) The role of sedimentaryand tectonic brines in the Damara Orogen Namibia Appl Geo-chemistry 2 535-542
Blankenburg H-J Goumltze J Schulz J (1994) QuarzrohstoffeDeutscher Verlag fuumlr Grundstoffindustrie Leipzig-Stuttgart296pp
Brouard S Breton J Girardet G (1995) Small alkali metal clus-ters on (001) quartz surface adsorptionand diffusion J Molecu-lar Struct (Theochem) 334 145-153
Bruhn F BruckschenP Meijer J StephanA RichterDK Vei-zer J (1996)Cathodoluminescence investigationsand trace-ele-ment analysis of quartz by micro-PIXE implications for diage-netic and provenance studies in sandstone Can Mineral 341223-1232
DrsquoLemos RS Kearsley AT Pembroke JW Watt GR WrightP (1997)Complex quartz growth histories in granite revealedbyscanning cathodoluminescence techniques Geol Mag 134459-552
Dennen WH (1966) Stoichiometric substitution in natural quartzGeochim Cosmochim Acta 30 1235-1241
ndash (1967)Trace elements in quartzas indicatorsof provenanceGeolSoc Amer Bull 78 125-130
DennenWH BlackburnWH QuesadaA (1970)Aluminium inquartz as a geothermometer Contrib Mineral Petrol 27 332-342
Flem B Larsen RB Grimstvedt A Mansfeld J (2002) In situanalysisof trace elements in quartz by using laser ablation induc-tively coupled plasma mass spectrometry Chemical Geol 182237-247
Flicstein J amp Schieber M (1974) Microsegregation of impuritiesin hydrothermally-grown quartz crystals J Cryst Growth 2425 603-609
Gerler J (1990) Geochemische Untersuchungen an hydrotherma-len metamorphengranitischenund pegmatitischenQuarzen undderen Fluumlssigkeitseinschluumlssen PhD Thesis University Goumlttin-gen 169 pp
Goumltze J amp Ploumltze M (1997) Investigationof trace element distri-bution in detrital quartz by electron paramagnetic resonance(EPR) Eur J Mineral 9 529-537
Goumltze J Ploumltze M Habermann D (2001) Origin spectral char-acteristics and practical applicationsof the cathodoluminescence(CL) of quartz ndash a review Min Petr 71 225-250
Kats A (1962) Hydrogen in alpha-quartz Philips Res Repts 17133-279
Kronenberg AK Kirby SH Aines RD Rossmann GR(1986)Solubility and diffusionaluptake of hydrogen in quartz athigh water pressures implications for hydrolytic weakening inthe laboratory and within the earth Tectonophysics 172 255-271
Larsen RB Polve M Juve G (2000) Granite pegmatite quartzfrom Evje-Iveland trace element chemistry and implications forthe formation of high-purity quartz Norges Geol Unders Bull436 57-65
Lehmann G (1975) On the colour centres of iron in amethyst andsynthetic quartz a discussionAm Mineral 60 335-337
Lehmann G amp BambauerHV (1973)Quarzkristalleund ihre Far-ben Angew Chem 7 281-289
Lowenstern JB amp Sinclair WD (1996) Exsolved magmatic fluidand ist role in the formation of comb-layered quartz at the Creta-ceous Logtung W-Mo deposit Yukon Territory Canad Trans-act Roy Soc Edinburgh Earth Sciences 87 291-303
Maschmeyer D amp Lehmann G (1983) A trapped-hole centrecausing rose coloration of natural quartz Z Kristallogr 163181-196
MoiseevBM (1985)Natural radiationprocessesin mineralsNed-ra Moscow (in Russian)
Morgan GB London D Luedke RG (1998) Petrochemistryoflate Miocene peraluminoussilicic volcanic rocks from the Moro-cocala field Bolivia J Petrol 39 601-632
762 A Muumlller M Wiedenbeck AM van den Kerkhof A Kronz K Simon
Muumlller A (2000)Cathodoluminescence and characterisation of de-fect structures in quartz with applications to the study of graniticrocks Unpubl PhD Thesis University Goumlttingen 230 pp
Muumlller A Seltmann R Behr H-J (2000) Application of catho-doluminescence to magmatic quartz in a tin granite ndash case studyfrom the Schellerhau Granite Complex Eastern ErzgebirgeGer-many Mineralium Deposita 35 169-189
Muumlller A Lennox P Trzebski R (2002) Cathodoluminescenceand micro-structuralevidence for crystallisationand deformationprocesses of granites in the Eastern Lachlan Fold Belt (SE Aus-tralia) Contrib Mineral Petrol 143 510-524
Mullis J amp Ramseyer K (1999) Growth related Al-uptake in fis-sure quartz Central Alps Switzerland Terra Nostra 996 209
Neuser RD Bruhn F Goumltze J Habermann D Richter DK(1995) Kathodolumineszenz Methodik und Anwendung ZblGeol Palaumlont Teil 1 1995 287-306
Newbury DE amp Myklebust RL (1995) NIST Micro MC A us-errsquos guide to the NIST Microanalysis Monte Carlo electron tra-jectory simulation Program Microbeam Analysis 4 165-175
PearceNJG PerkinsWT Westgate JA GortonMP JacksonSE Neal CR Chenery SR (1997)A compilationof new andpublished major and trace element data for NIST SRM 610 and612 partially certified glass reference materials GeostandardsNewsletter 21 115-144
Perny B Eberhardt P Ramseyer K Mullis J Pankrath R(1992) Microdistributionof aluminium lithium and sodium in aquartz possible causes and correlation with short lived cathodo-luminescenceAm Mineral 77 534-544
Pfenninger H (1961) Diffusion von Kationen und Abscheidungvon Metallen in Quarz unter elektrischer Feldeinwirkung PhDThesis University Zuumlrich
Plesch R (1982)Auswerten und Pruumlfen in der Roumlntgenspektrome-trie G-I-T Verlag Ernst Giebeler Darmstadt 147 pp
Potts PJ Bowles JFW Reed SJB Cave MR (1995) Micro-probe techniques in the earth sciences The Mineralogy SocietySeries vol 6 Chapman and Hall London 419 pp
Ramseyer K Baumann J Matter A Mullis J (1988) Cathodo-luminescence colours of -quartz Min Mag 52 669-677
Ramseyer K amp Mullis J (1990) Factors influencing short-livedblue cathodoluminescence of -quartz Am Mineral 75 791-800
Remond G Cesbron F ChapoulieR OhnenstetterD Rouques-Carmes C SchvoererM (1992)Cathodoluminescence appliedto the microcharacterization of mineral materials a present statusin experimentation and interpretation Scanning Microsc 6123-69
RovettaMR Blacic JD HervigRL Holloway JR (1989)Anexperimentalstudy of hydroxyl in quartz using infrared spectros-copy and ion microprobe techniquesJ Geophys Res 94 5840-5850
Schmidt C amp Ziemann MA (2000) In-situ spectroscopy ofquartza pressure sensor for hydrothermaldiamond-anvilcell ex-
periments at elevated temperatures Am Mineral 85 1725-1735
Schneider N (1993) Das lumineszenzaktive Strukturinventar vonQuarzphaumlnokristenin RhyolithenGoumlttingerArb Geol Palaumlont60 81 pp
Schroumln W (1969) Zur Geochemie des Germaniums FreibergerForschungshefte C246 9-65
Shimizu N Semet MO Allegre CB (1978) Geochemical ap-plications of quantitative ion-microprobe analysis GeochimCosmochim Acta 42 1321-1334
Siebers FB (1986) InhomogeneVerteilung von Verunreinigungenin gezuumlchteten und natuumlrlichen Quarzen als Funktion der Wachs-tumsbedingungen und ihr Einfluszlig auf kristallphysikalische Ei-genschaften PhD Thesis Ruhr-Universitaumlt Bochum 133 pp
Simon K (2001)Does D from fluid inclusion in quartz reflect theoriginal hydrothermal fluid Chemical Geol 177 483-495
Smith JV amp Steele IM (1984) Chemical substitution in silicapolymorphsN Jb Miner Mh 1984 137-144
Sprunt ES (1981)Causes of quartz cathodoluminescence coloursScanning Electron Microscopy 1981 525-535
Stenina NG (1995) Energy aspect in the formation of graniticmagma and ore deposits In ldquoMineral deposits from their originto their environmental impactsrdquo Pa Iumlsava J K Iumlribek B IumlZak Keds Balkema Rotterdam pp 539-542
Stenina NG Sotnikov VI Korolyuk VN Kovaleva LT(1988) Microstructural features of hydrothermal vein quartz asan indicator of mineralizationGeokhimiya 5 641-653 (Englishtranslation)
Van den Kerkhof AM Scherer T Riganti A (1996) Cathodolu-minescence and EPR analysis of Archean quarzites from theNondweni Greenstone Belt South Africa In ldquoAbstracts SLMSInternationalConference on Cathodoluminescencerdquo Nancy 75
Van den Kerkhof AM Kronz A Simon K (2001)Trace elementredistribution in metamorphic quartz and fluid inclusion modifi-cation observations by cathodoluminescence XVI ECROFIPorto 2001 Fac Ciencias Porto Dep Geol Memoria 7 447-450
Watt GR Wright P GallowayS McLean C (1997)Cathodolu-minescence and trace element zoning in quartz phenocrysts andxenocrystsGeochim Cosmochim Acta 61 4337-4348
Weil JA (1984)A review of electron spin spectroscopyand its ap-plication to the study of paramagnetic defects in crystallinequartz Phys Chem Minerals 10 149-165
Zinner E amp Crozaz G (1986) A method for the quantitative mea-surement of rare earth elements in the ion microprobe Int JMass Spect Ion Process 69 17-38
Received 24 April 2002Modified version received 20 October 2002Accepted 26 March 2003
Trace elements in quartz 763
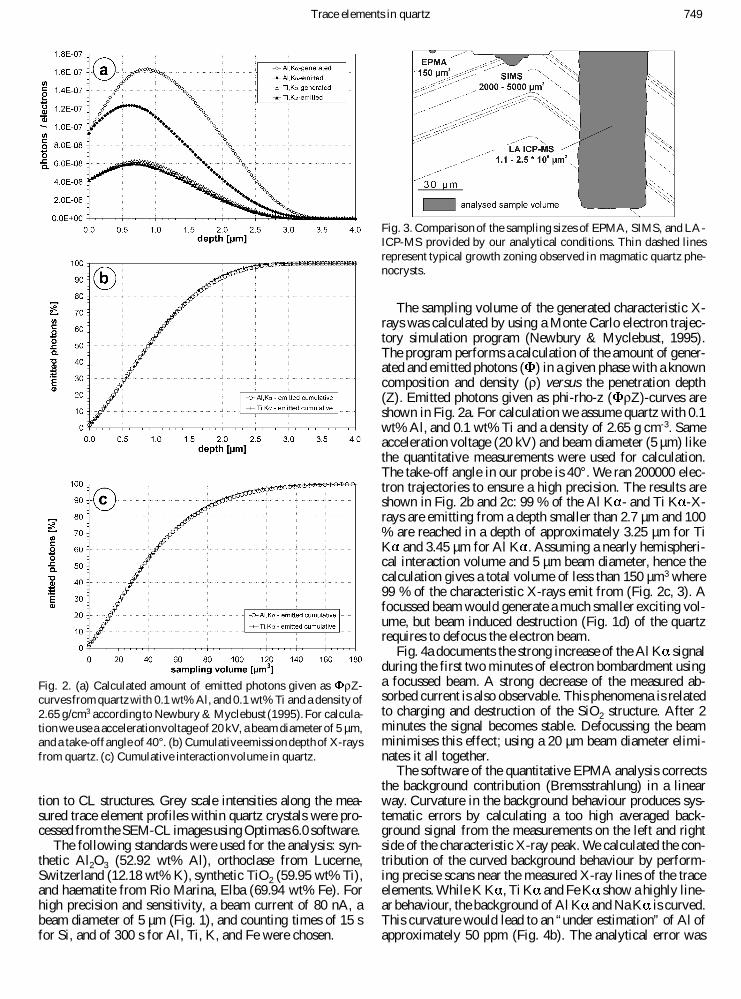
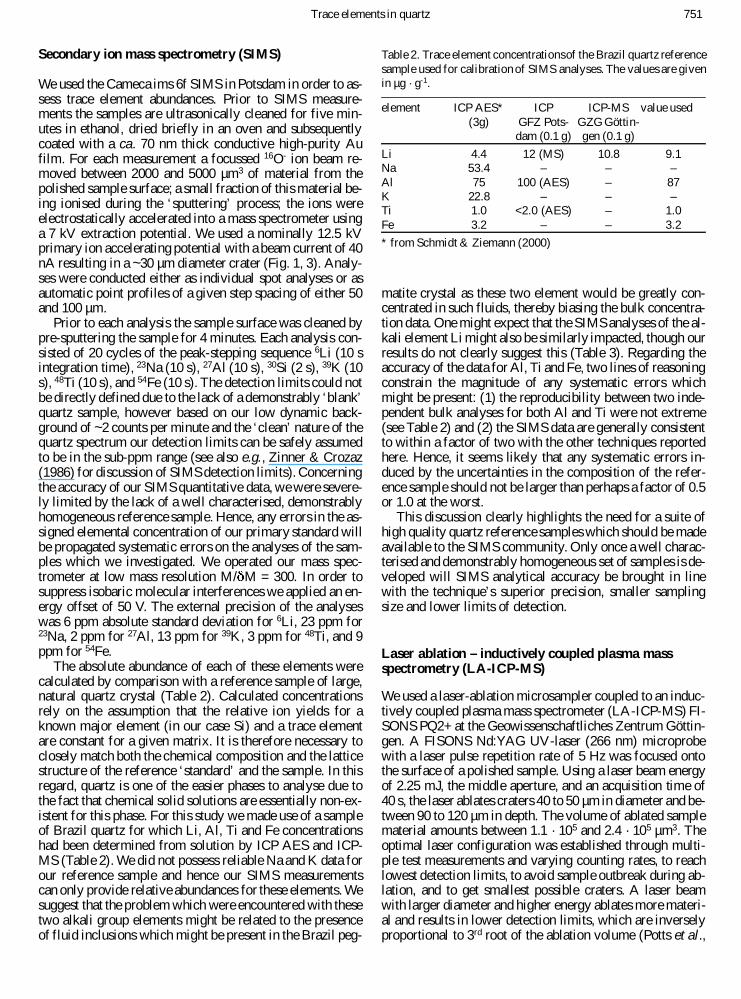
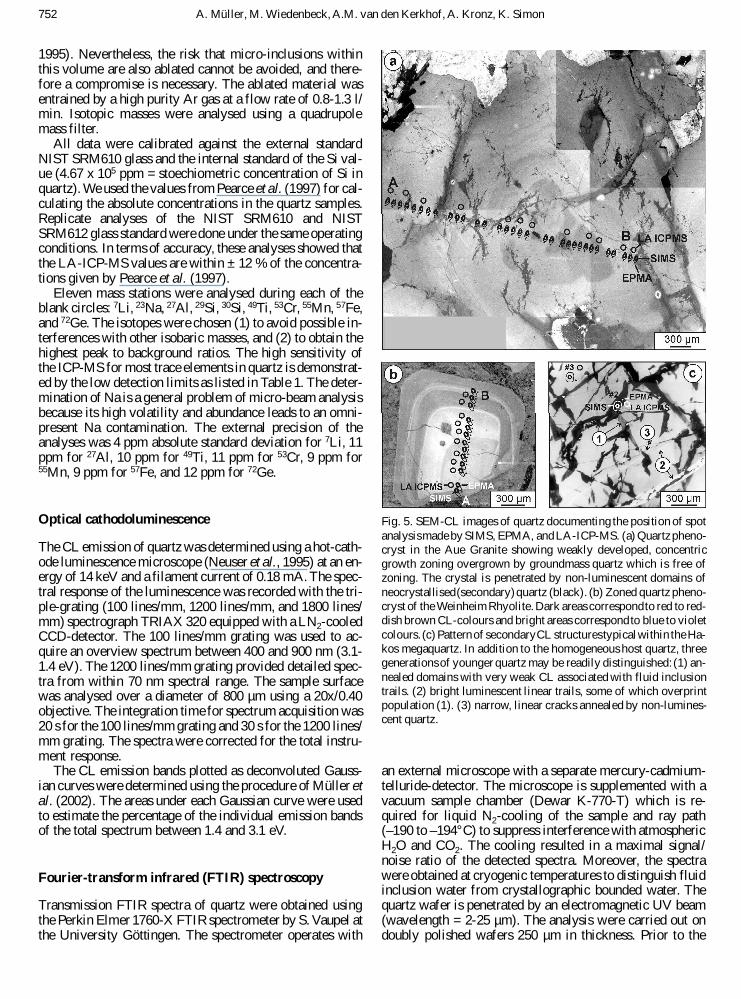
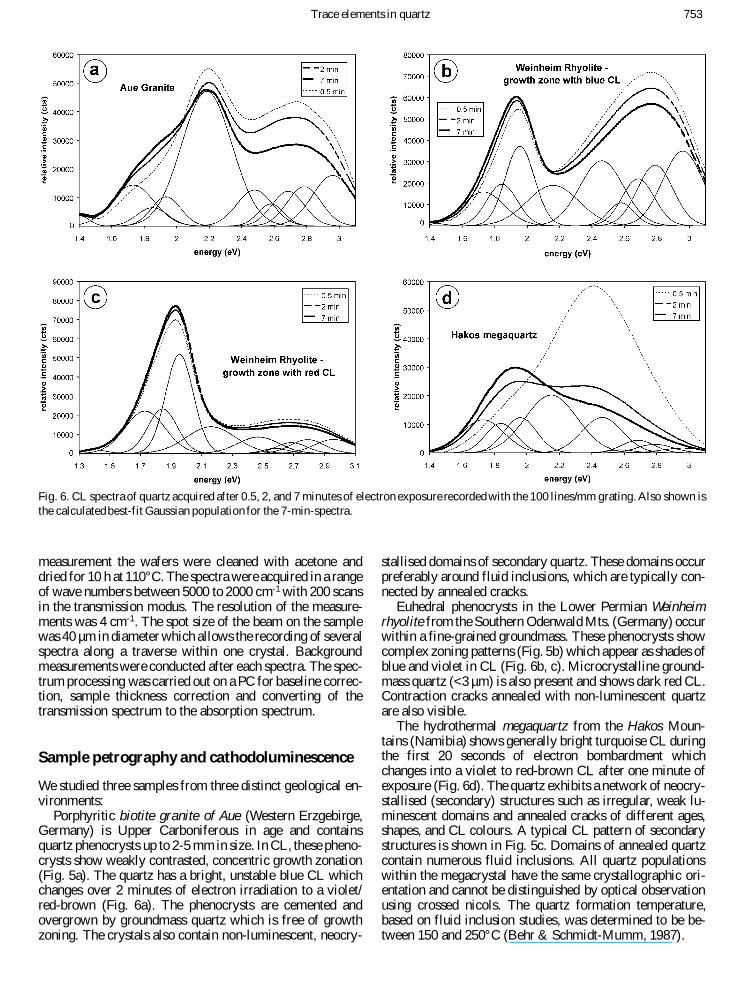
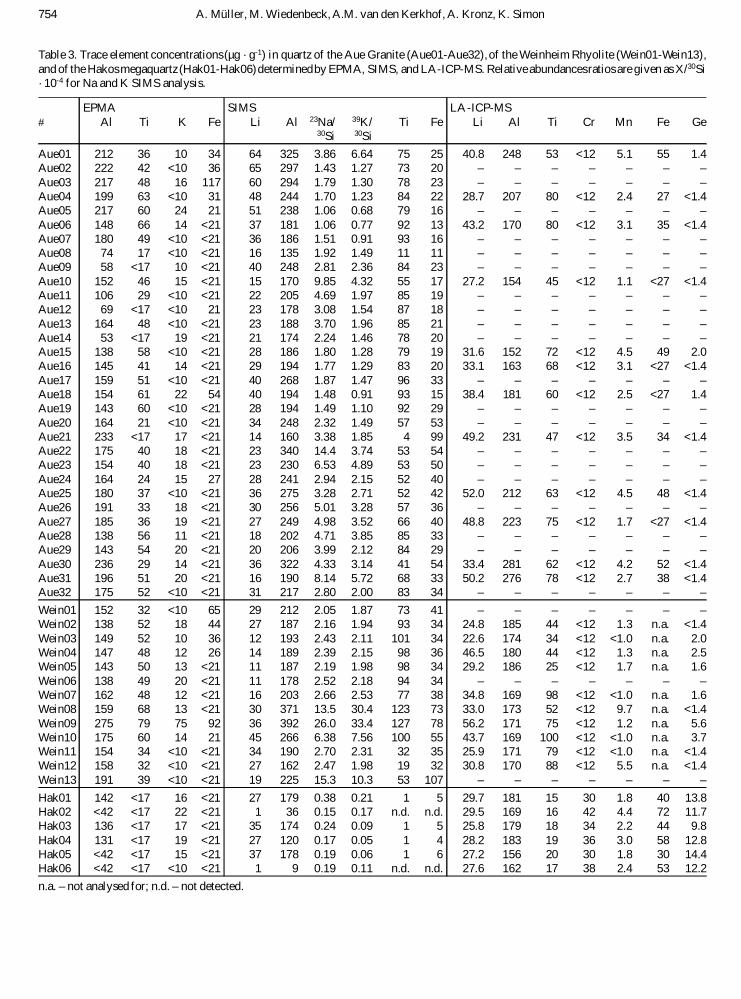
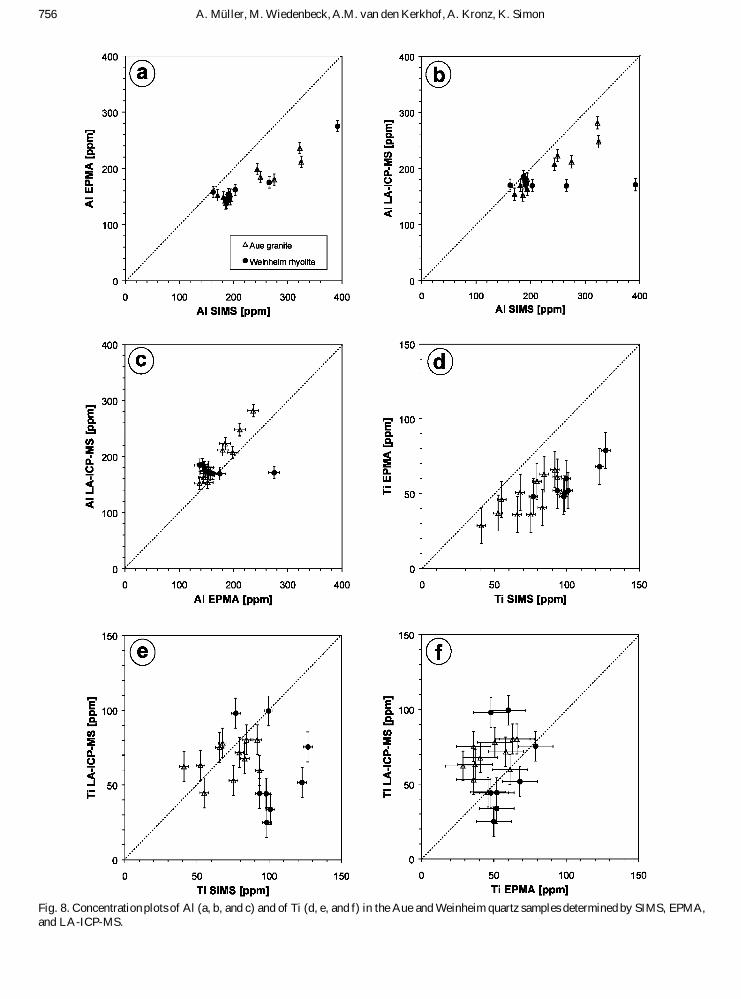
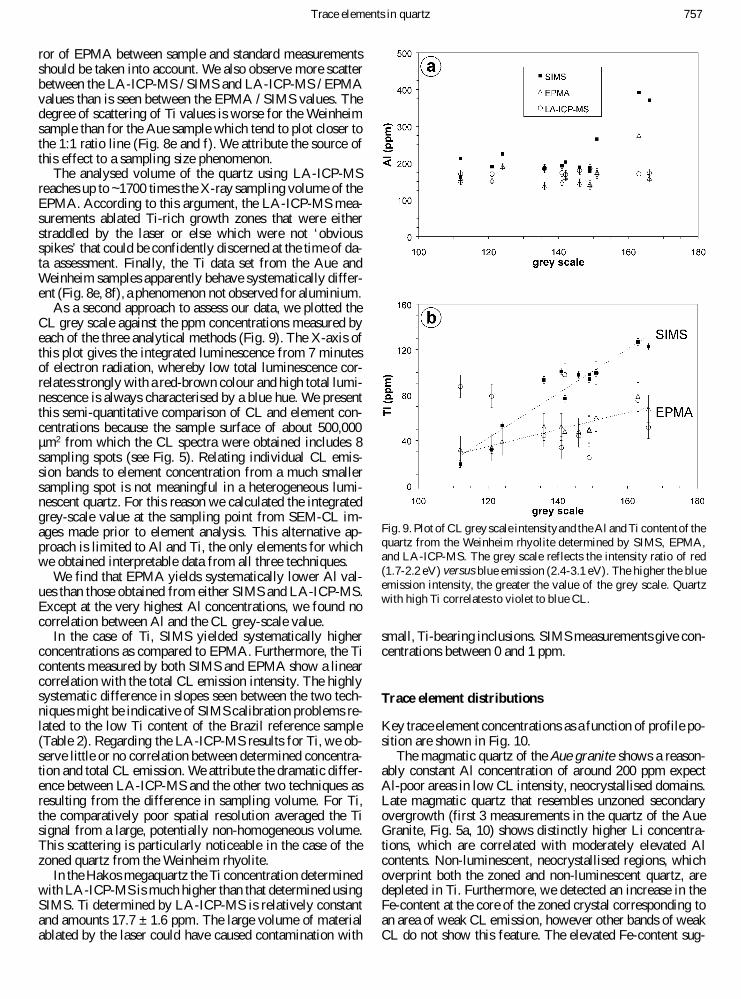
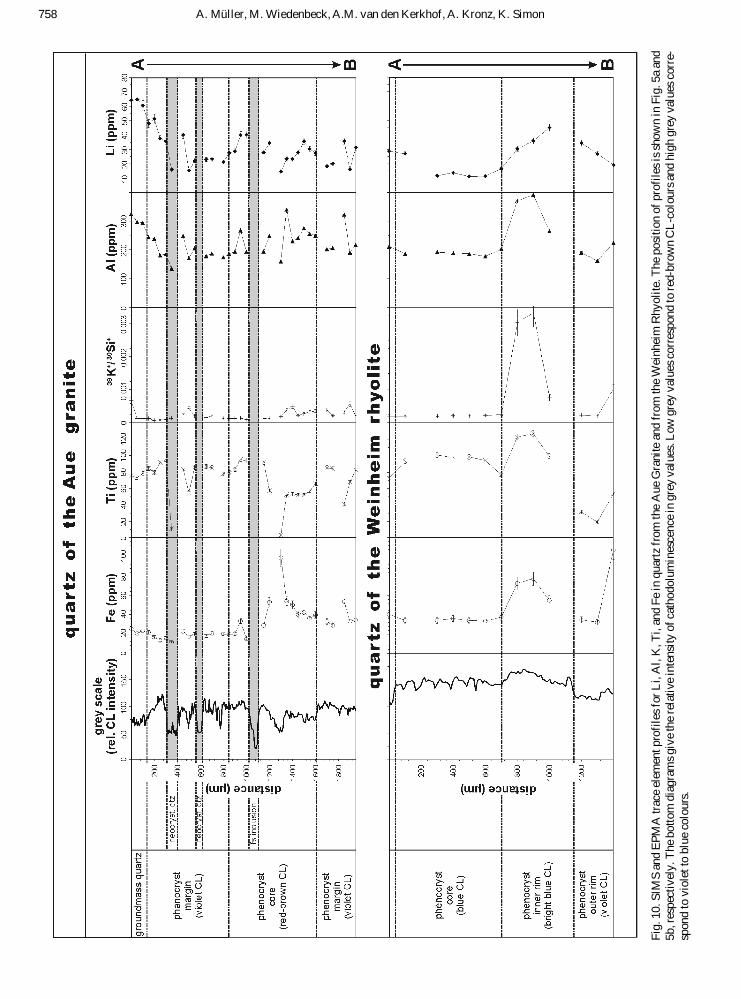
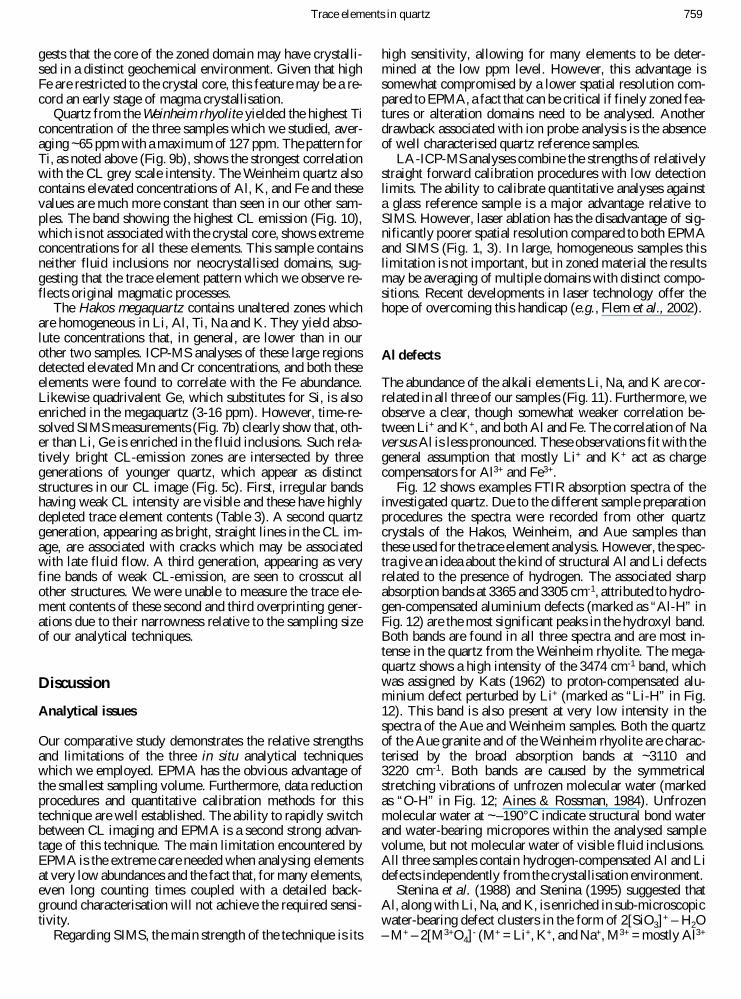
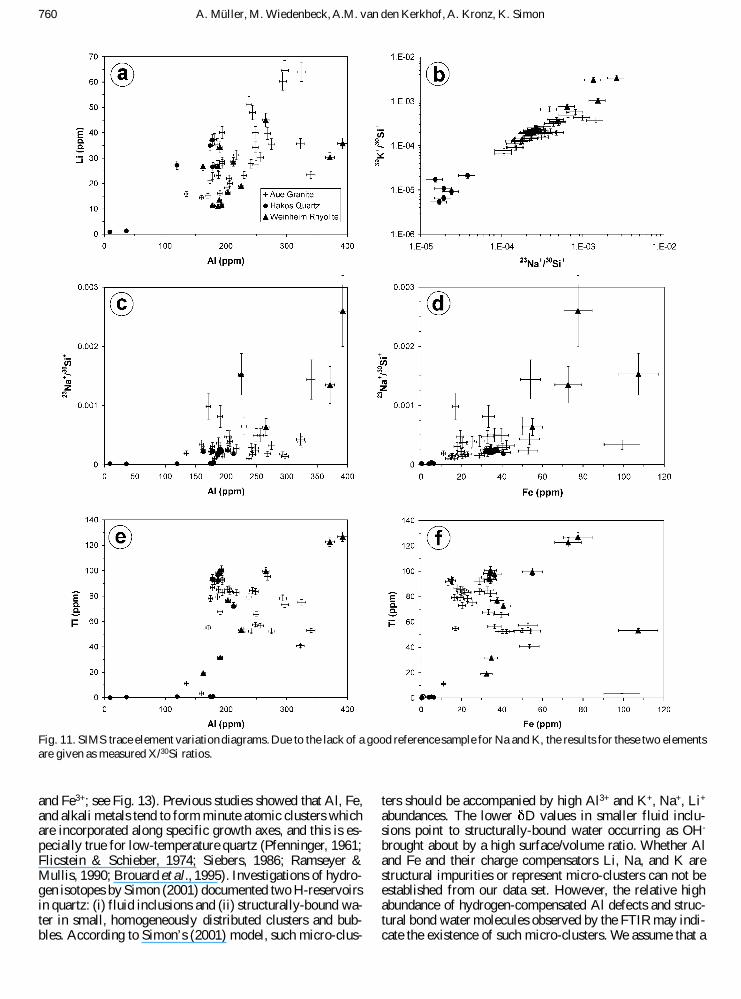
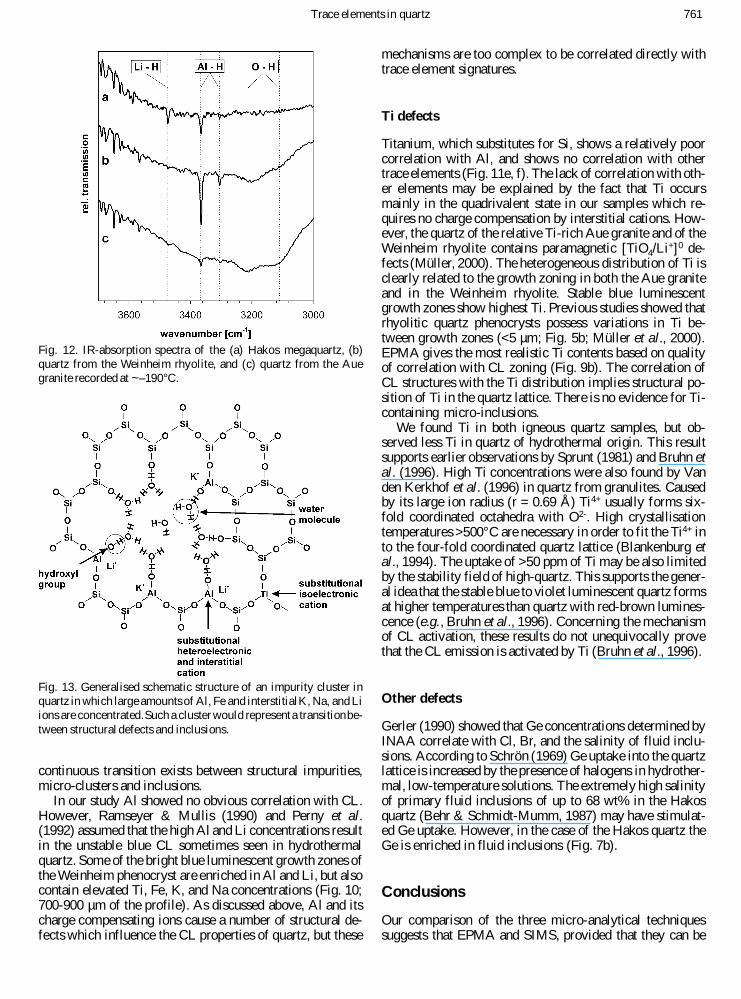
Copyright © 2022 FDOKUMEN