Forest Condition in Europe - 2018 Technical Report of ICP ...
96
BFW-Dokumentation 25/2018 Forest Condition in Europe 2018 Technical Report of ICP Forests Report under the UNECE Convention on Long-Range Transboundary Air Pollution (CLRTAP) ALEXA MICHEL, WALTER SEIDLING & ANNE-KATRIN PRESCHER (Eds.)
-
Upload
khangminh22 -
Category
Documents
-
view
1 -
download
0
Transcript of Forest Condition in Europe - 2018 Technical Report of ICP ...

20040622_oceans_web.psd
BFW-Dokumentation25/2018
Bundesforschungszentrum für WaldSeckendorff-Gudent-Weg 81131 Wien, Österreich
http://bfw.ac.at
ISSN 1811-3044 ISBN 978-3-903258-08-2
C
Press law responsibility:DI Dr Peter MayerAustrian Research and Training Centre forForests, Natural Hazards and Landscape (BFW)Seckendorff-Gudent-Weg 81131 Vienna, AustriaPhone: +43-1-878380
Cover photo: Montane European beech (Fagus sylvatica L.)forest stand on the Lontovž intensive monitoringplot in central Slovenia by Lado Kutnar
Contact:Alexa Michel, Walter Seidling andAnne-Katrin Prescher (Eds.)Programme Co-ordinating Centre (PCC)of ICP ForestsThünen Institute of Forest EcosystemsAlfred-Möller-Str. 1, Haus 41/4216225 Eberswalde, Germanyhttp://icp-forests.net
Reproduction is authorised provided the source is acknowledged.
Chlorine-free and climate-neutral - For the benefit of the environment
opyright 2018 by BFW
Impressum
Forest Condition in Europe2018 Technical Report of ICP Forests
Report under the UNECE Conventionon Long-Range Transboundary Air Pollution(CLRTAP)
ALEXA MICHEL, WALTER SEIDLING & ANNE-KATRIN PRESCHER (Eds.)


Forest Condition in Europe 2018 Technical Report of ICP Forests
Report under the UNECE Convention on Long-range Transboundary Air Pollution (Air Convention)
Alexa Michel, Walter Seidling, and Anne-Katrin Prescher (editors)

Acknowledgem
We wish to thaand financial sInstitute for the
We would likeDevelopment i6th Scientific Co
We would like and for its publ
For more than of many dedicaespecially to tUNECE region. Focal Centres (
Contact
Programme CoWalter SeidlingThünen InstitutAlfred-Möller-S16225 EberswaEmail: pcc-icpf
Recommended
Michel A, SeidlUNECE ConvenResearch Centr
BFW-DokumenISBN 978-3ISSN 1811-FDK 181.45
United NationsConvention on International C
http://icp-fore
ments
ank the Federal support of the Ie partial funding
e to express ouin Forestry (INConference and 3
to also express lication with the
30 years the sucated individuals.he participatingFor a complete
(NFC), please ref
-ordinating Ceng, Head te of Forest EcosStr. 1, Haus 41/4alde, Germany forests@thuenen
d citation
ling W, Prescherntion on Long-rare for Forests. 92
ntation 25/2018-903258-08-2 3044 5:531:97:(4)
s Economic ComLong-range Tra
Co-operative Pro
ests.net
Ministry of FoodICP Forests as wg of the ICP Fore
r sincere gratitCDS) “Marin Dră33rd Task Force M
our appreciatioe Austrian Resea
ccess of ICP Fore. We would like g countries for te list of all counfer to the annex
tre of ICP Forest
systems 42
n.de
r A-K, editors (2ange Transboun2 p.
8
mission for Euroansboundary Air gramme on Asse
d and Agriculturewell as the Uniests Programme
ude to Ovidiu Băcea” and the RMeeting of ICP F
n for valuable carch and Training
ests depends onto hereby expretheir ongoing contries that are pat the end of th
ts
018) Forest Condary Air Pollutio
ope (UNECE) Pollution (Air Coessment and Mo
e (BMEL) and alited Nations Eco Co-ordinating C
Badea and his Romanian Minisorests in Buchar
comments fromg Centre for For
n the continuousess again our sinommitment and
participating in Ihis document.
ndition in Europon (Air Convent
onvention, formonitoring of Air P
ll participating conomic CommisCentre.
colleagues fromstry of Environmrest, 15–19 May
the ICP Forests rests, Natural Ha
s support from 4ncere gratitude td co-operation iICP Forests with
e: 2018 Techniction). BFW-Doku
erly CLRTAP) Pollution Effects
ountries for thession for Europe
m the National ment, Waters any 2017.
community on dazards and Lands
42 participating to everyone invon forest ecosys
h their responsib
cal Report of ICPmentation 25/2
s on Forests (ICP
e continued imple (UNECE) and
Institute for Rend Forests for
draft versions ofscape (BFW).
countries and tholved in the ICP stem monitoringble Ministries a
P Forests. Repor2018. Vienna: BF
P Forests)
lementation the Thünen
esearch and hosting the
f this report
he expertise Forests and
g across the nd National
rt under the FW Austrian

2018 Technical Report of ICP Forests | 3
SUMMARY The International Co-operative Programme on Assessment and Monitoring of Air Pollution Effects on Forests (ICP Forests) is one of the most diverse programmes within the Working Group on Effects (WGE) under the UNECE Convention on Long-range Transboundary Air Pollution (Air Convention, formerly CLRTAP). To provide a regular overview of the programme’s activities, the ICP Forests Programme Co-ordinating Centre (PCC) yearly publishes an ICP Forests Technical Report which summarises research highlights and provides an opportunity for all participating countries to report on their national ICP Forests activities. The PCC also invites all ICP Forests Expert Panels, Working Groups, and Committees to publish a comprehensive chapter on their most recent results from regular data evaluations.
This 2018 Technical Report presents results from up to 31 of the 42 countries participating in ICP Forests. Part A presents research highlights from the June–December 20171 reporting period, including:
− a review of 20 scientific publications for which ICP Forests data and/or the ICP Forests infrastructure were used;
− a list of the presentations at the 6th ICP Forests Scientific Conference in Bucharest, 15–17 May 2017;
− a list of all 43 research projects using ICP Forests data/infrastructure and ongoing for at least one month between June and December 2017.
Part B focuses on regular evaluations from within the programme. This year the Technical Report includes chapters on:
− atmospheric throughfall deposition in European forests in 2016;
− homogenising volume calculations within the tree growth survey;
− tree crown condition in 2017;
Part C includes national reports on ICP Forests activities from the participating countries.
1 The reporting period for Part A used to cover the months between ICP Forests Task Force Meetings (June to May). With this year’s Technical Report we have started to change the reporting period to a yearly coverage from January to December. To not repeat any information given in the last report, this year the reporting period of Part A only covers the time between June and December 2017.
Online supplementary material complementing Chapter 7 on Tree Crown Condition in 2017 is available at http://icp-forests.net/page/icp-forests-technical-report.
For contact information of all authors and persons responsible in this programme, please refer to the annex at the end of this document. For more information on the ICP Forests programme, we kindly invite you to visit the ICP Forests website2.
Following is a summary of the presented results from regular evaluations in ICP Forests (Part B).
Studying the effects of atmospheric pollution to forest ecosystems requires an evaluation of air quality and of the amount of pollutants carried to the forests by atmospheric deposition. In 2016, the chemical composition of atmospheric throughfall deposition was measured on 276 Level II permanent plots with a focus on acidifying, buffering, and eutrophying compounds.
High throughfall deposition of nitrate was mainly found in central Europe (Germany, Switzerland), Denmark, and Belgium, while for ammonium high deposition was also found in northern Italy. The area of high deposition is smaller for sulphate, including some plots in Germany and Poland. High values were also measured in Belgium, but they are partially due to deposition of marine aerosol, and they are less evident after sea-salt correction. High deposition in southern Italy may be related to local anthropogenic sources and to volcanic contribution.
Calcium, potassium, and magnesium deposition can buffer the acidifying effect of atmospheric deposition. High values of calcium throughfall deposition were reported for southern Europe, where it is often related to the deposition of Saharan dust, and for Eastern Europe. The correction for the marine contribution does not affect its spatial pattern. On the contrary, for magnesium, the number of sites with the highest values is markedly reduced by the sea salt correction.
Tree growth is a key ecological parameter and a highly important response variable when studying forest ecosystems. In ICP Forests a comparison of tree volume data across countries, however, is difficult because every country uses a different equation to calculate species-specific volume increment. To evaluate the magnitude of this issue the volume
2 http://icp-forests.net

4 | 2018 Technical Report of ICP Forests
equations for four species provided by eight countries were compared. The main idea was to test whether one volume calculation function could be used on a Europe-wide level instead of country-specific equations.
The authors conclude that it is possible to find volume equations which can be used as a standardized approach for calculations across ICP Forests plots. However, this is mainly true for Scots pine (Pinus sylvestris L.), Norway spruce (Picea abies (L.) H.KARST.), and silver birch (Betula pendula ROTH), but not for European beech (Fagus sylvatica L.). Other species still need to be assessed to allow a uniform approach.
The chapter on tree crown condition presents results from the assessments carried out on the large-scale, representative, transnational monitoring network (Level I) of ICP Forests in 2017, as well as long-term trends for the main species and species groups.
The transnational defoliation survey in 2017 was conducted on 5 496 plots in 26 countries. In total, 101 779 trees were assessed in the field for defoliation. The overall mean defoliation for all species was 21.7% in 2017; there was a slight increase in defoliation for both conifers and broadleaves in comparison with 2016. Broadleaved trees showed a higher
mean defoliation than coniferous trees (22.7% vs. 20.7%). Among the main tree species and tree species groups, evergreen oaks and deciduous temperate oaks displayed the highest mean defoliation (28.1% and 23.9%, respectively). Norway spruce had the lowest mean defoliation (20.2%) followed by Austrian pine and common beech with 20.5% each. The strongest increase in defoliation from 2016 to 2017 occurred in evergreen oaks (+2.9%) while common beech had the largest decrease in defoliation (-1.5%) but overall, the differences in defoliation between 2016 and 2017 are not very large.
In 2017, damage cause assessments were carried out on 100 436 trees on 5 358 plots in 25 countries. On 47 948 trees (47.7%) at least one symptom of damage was found, and 595 trees (0.6%) were dead. On 1 091 plots no damage was found on any tree.
Insects were the predominant cause of damage and responsible for 26.9% of all recorded damage symptoms. Almost half of the symptoms caused by insects were attributed to defoliators (49.0%), the most frequent of all specified damage causes.
Abiotic agents were the second major causal agent group responsible for 19.1% of all damage symptoms. Within this agent group, more than half of the symptoms (58.4%) were attributed to drought, while snow and ice caused 7.3%, wind 6.7%, and frost 5.0% of the symptoms.

2018 Technical Report of ICP Forests | 5
CONTENTS
1 INTRODUCTION 6 AK MICHEL, W SEIDLING, A-K PRESCHER
PART A – ICP FORESTS RELATED RESEARCH HIGHLIGHTS
2 REVIEW OF ICP FORESTS RELATED PUBLICATIONS (JUNE – DECEMBER 2017) 12 A-K PRESCHER
3 PRESENTATIONS AT THE 6TH ICP FORESTS SCIENTIFIC CONFERENCE, BUCHAREST, MAY 2017 15
4 ONGOING RESEARCH PROJECTS USING ICP FORESTS DATA / INFRASTRUCTURE 17 PART B – REPORTS ON INDIVIDUAL SURVEYS IN ICP FORESTS
5 ATMOSPHERIC DEPOSITION IN EUROPEAN FORESTS IN 2016 22 A MARCHETTO, P WALDNER, A VERSTRAETEN
6 HOMOGENISING THE VOLUME CALCULATION WITHIN THE TREE GROWTH SURVEY 32 T LEVANIČ, TGM SANDERS, I KRÜGER, F SKONIECZNY
7 TREE CROWN CONDITION IN 2017 38 N POTOČIĆ, V TIMMERMANN, M OGNJENOVIĆ
PART C – NATIONAL REPORTS
8 NATIONAL REPORTS OF PARTICIPATING COUNTRIES IN ICP FORESTS 54 REPRESENTATIVES OF THE PARTICIPATING COUNTRIES IN ICP FORESTS
ANNEX
CONTACTS 83
ONLINE SUPPLEMENTARY MATERIAL complementing Chapter 7 on Tree Crown Condition in 2017 is available at http://icp-forests.net/page/icp-forests-technical-report

6 | 2018 Technical Report of ICP Forests
1 INTRODUCTION Alexa K Michel, Walter Seidling, Anne-Katrin Prescher
The International Co-operative Programme on Assessment and Monitoring of Air Pollution Effects on Forests (ICP Forests) was established in 1985 with the aim to collect, compile, and evaluate data on forest ecosystems across the UNECE region and monitor their condition and performance over time. ICP Forests is led by Germany, and its Programme Co-ordinating Centre is based at the Thünen Institute of Forest Ecosystems in Eberswalde. It is one of eight subsidiary groups (six ICPs, a joint Task Force with WHO, and the Joint Expert Group on Dynamic Modelling) that report to the Working Group on Effects (WGE) under the UNECE Convention on Long-range Transboundary Air Pollution (Air Convention, formerly CLRTAP) on the effects of air pollution on a wide range of ecosystems, materials, and human health.
ICP Forests monitors forest condition at two intensity levels: The Level I monitoring is based on around 4 900 observation plots (as at 2017) on a systematic transnational grid of 16 x 16 km throughout Europe and beyond to gain insight into the geographic and temporal variations in forest condition while the Level II intensive monitoring comprises around 590 plots (as at 2016, Table 1-1) in selected forest ecosystems with the aim to clarify cause-effect relationships between environmental drivers and forest ecosystem responses. Quality assurance and quality control procedures are co-ordinated by committees within the programme, and the ICP Forests Manual1 ensures a standard approach for data collection in forest monitoring among the 42 participating countries.
Programme highlights June–December 20172
Important activities and developments of ICP Forests since the 2017 Task Force Meeting:
− The Executive Body (EB) of the Convention on Long-range Transboundary Air Pollution requests the use of the term Air Convention instead of LRTAP Convention or CLRTAP whenever referring to the Convention.
− Support of the Working Group on Effects under the Air Convention during the implementation of the new (2016)
1 http://icp-forests.net/page/icp-forests-manual
2 The reporting period for Part A used to cover the months between ICP Forests Task Force Meetings (June to May). With this year’s Technical Report we have started to change the reporting period to a yearly coverage from January to December. To not repeat any information given in the last report, this year the reporting period of Part A only covers the time between June and December 2017.
National Emission Ceilings (NEC) Directive of the European Commission. It can be expected that the new NEC Directive may at least in EU member states have a stabilizing effect for the intensive monitoring Level II network.
− A long-lasting co-operation was again intensified and future scientific collaborations were discussed during two meetings between the Acid Deposition Monitoring Network in East Asia (EANET) and ICP Forests. The head of the Programme Co-ordinating Centre, Walter Seidling, and Hiroyuki Sase from the Asia Center for Air Pollution Research (ACAP) representing the Network Center for EANET met in Hanover, Germany, in June 2017. Mr Sase also met with the chair of ICP Forests, Marco Ferretti, in Niigata, Japan, in October 2017.
− With more than 30 oral presentations and posters, the ICP Forests community presented their results and research on topics such as nitrogen and sulphur deposition, carbon sequestration, biodiversity, tropospheric ozone and many more at the 125th Anniversary Congress of the International Union of Forest Research Organizations (IUFRO) in Freiburg, Germany, 18–22 September 2017, with over 2 000 participants.
− The data unit at the Programme Co-ordinating Centre (PCC) of ICP Forests is constantly improving the data management, data availability and usability, and information flow within the programme and to the scientific community and the public. The following developments of the data unit were recently accomplished: ‒ free set of master data to be approved at the next
Task Force meeting ‒ concept for a new ICP Forests website ‒ changes to the data policy, data portal, and data
model (database structure).
With the Strategy and the Manual, ICP Forests defines its aims and ways of implementation. As part of the WGE, however, ICP Forests is first and foremost obliged and indebted to contribute to the biannual workplan of the Air Convention which sets the objectives and deliverables of all bodies under the Convention. The joint 2018–2019 workplan (WP) for the further implementation of the Convention for EMEP (European Monitoring and Evaluation Programme), the WGE and the other subsidiary bodies of the Air Convention was adopted by the Executive Body at its 37th meeting on 11–14 December 2017 (draft version available: ECE/EB.AIR/2017/13).
3 http://www.unece.org/index.php?id=43519

2018 Technical Report of ICP Forests | 7
Following is a list with the respective tasks and deliverables expected of ICP Forests in 2018–2019:
WP item
Description
1.1 Improving tools to assess air pollution and its effects in the ECE region
1.1.1 Monitoring and modelling tools
1.1.1.19
Levels and effects of ground-level ozone in forests (continuation of monitoring ozone concentration and visible foliar injury at Level II plots according to the ICP Forests Manual)
1.1.1.20 Integrated studies on effects of ground-level ozone on tree growth, carbon sequestration and forest health, including estimates of ozone fluxes, at least for the most important tree species
1.1.1.21 Nitrogen (N) deposition and its effects on forest vegetation (monitoring activities according to the ICP Forests Manual)
1.1.1.22 Integrated studies on N deposition effects on tree growth, carbon sequestration, biodiversity, soil and foliar chemistry or mycorrhizas
1.1.1.23 Heavy metals (HM) in forest ecosystems: evaluation of available data to achieve an estimation of HM deposition and accumulation in soils, foliage and litterfall
1.1.1.24 Integrated studies on HMs in forests
1.1.4 Tools to account for global-scale issues in air quality assessment 1.1.4.1 Global-regional modelling and evaluation deposition
workshop (2019)
1.4 Improving the functioning of WGE and EMEP and their subsidiary bodies
1.4.1 Analyse effects monitoring networks within WGE to improve integrated working and reporting
1.4.3 Develop a common portal to enable integrated assessments and to assist Parties in their implementation of air pollution strategies
This 2018 Technical Report of ICP Forests, its online supplement, and other information on the programme can be downloaded from the ICP Forests website1. Please send your comments and suggestions to [email protected]; we highly appreciate your feedback.
1 http://icp-forests.net/page/icp-forests-technical-report
Participants at the 33rd Task Force Meeting of ICP Forests in Bucharest, 18–19 May 2017, representing 24 countries

8 | 2018 Technical Report of ICP Forests
Table 1-1: Overview of the number of Level II plots used in different surveys by the participating countries in 2016 as submitted to the ICP Forests database by 31 August 2018.
Air quality Crown condition
Deposition Foliage Ground vegetation
Groundvegetation biomass
Growth and yield
Leaf area index
Litterfall Meteorology Ozone Phenology Soil Soil solution
Austria 15 15 6 6 Belgium 5 13 9 5 5 5 4 Bulgaria 4 4 4 3 3 4 2 1 3 Croatia 7 7 5 4 2 2 4 Cyprus 1 4 2 2 2 Czechia 16 7 7 7 11 7 7 Denmark 4 4 3 4 4 2 4 Estonia 6 6 1 1 5 Finland 14 12 5 12 2 14 12 France 13 93 25 12 6 11 13 15 87 14 Germany 30 80 84 47 31 13 38 40 67 76 14 48 5 75 Greece 4 2 2 4 4 3 2 2 Hungary 8 Italy 29 11 7 Latvia 1 2 3 3 3 Lithuania 3 9 3 3 1 9 3 3 Norway 3 3 3 Poland 12 138 12 12 Romania 4 12 5 4 3 3 4 3 5 Serbia 5 5 4 5 5 5 5 3 Slovakia 8 7 6 4 Slovenia 9 10 4 4 Spain 14 14 14 14 14 14 14 14 14 5 Switzerland 7 18 14 18 9 9 Turkey 52 UK 5 4 3 4 4 4 Total 103 545 256 84 46 13 90 72 139 187 73 183 19 183

Part A ICP FORESTS RELATED RESEARCH HIGHLIGHTS

10 | 2018 Technical Report of ICP Forests
2 REVIEW OF ICP FORESTS RELATED PUBLICATIONS (JUNE ‒ DECEMBER 2017)Anne-Katrin Prescher
Between June and December 2017, data that had either originated from the ICP Forests database or from ICP Forests plots were part of several international, peer-reviewed publications in various research areas, thereby expanding the scope of scientific findings even beyond air pollution effects. The following review includes all 20 English online and in print publications that have been reported to the ICP Forests Programme Co-ordinating Centre and added to the list of ICP Forests publications on the programme’s website1. For a general overview of the findings in different research areas, this year’s publications have been assigned to four sections:
− the effect of climate change on forest ecosystems
− nutrient cycling in forests
− current status of forest ecosystems
− improving modelling and assessments.
Publications already listed in the previous 2017 Technical Report are not again included. For a list of all 20 ICP Forests publications in this reporting period, please refer to the end of this chapter.
The effect of climate change on forest ecosystems
The predicted changes in climate and extreme weather events will affect forest ecosystems. These effects may include heat and water stress, a higher vulnerability to pests or a change in species composition. In a regional study in Mediterranean oak forests in Andalusia, Duque-Lazo and Navarro-Cerrillo (2017) modelled the current distribution of the xylophage beetle Cerambyx ‘‘complex” by using the Kernel Density Estimation approach and symptoms and damages data of the regional Level I plots. They found that tree diameter and frequency of oak trees, but also number of days with a mean temperature above 30°C were important variables to describe the distribution. Based on this potential habitat suitability, predicted future climatic conditions might increase the risk of the establishment of new populations of xylophage beetles.
Two publications look at the consequences of climate warming and plant phenology. Consistently warm temperatures in spring reduce the amount of days with chilling temperatures for essential dormancy phases of temperate, perennial plants below the thresholds required in phenological models for budburst.
1 http://icp-forests.net/page/publications
Only the consideration of photoperiod elongation in spring might compensate for this effect on budburst.
Analysing the date of budburst at 16 Fagus sylvatica sites and 34 Quercus petraea sites in France, including 36 sites of the French Level II programme RENECOFOR, Gauzere et al. (2017) compared four different phenological models that are accounting for a photoperiod effect. Their results confirm that models integrating a photoperiod cue were better simulating budburst dates for beech than for oak. They modelled that the compensatory effect of photoperiod may maintain a trend towards earlier budburst dates up to the end of 2100.
Looking at the effect of increasing temperatures on reproductive effort, Caignard et al. (2017) found a significant increase in seed production of temperate oak with increasing temperatures. Their results are based on 14 years of seed production data at 28 French Level II plots. They conclude that even though global warming may enhance oak reproductive effort, the frequency and synchronization of mast seeding production may be affected by climate change as well.
Studying the effects of climate change and nitrogen (N) deposition on the habitat suitability of plant species, Dirnböck et al. (2017) used a modelling approach and data of 18 forest sites of the Austrian ICP Forests and ICP Integrated Monitoring network. Climate change was found to be the main driver of a decrease in habitat suitability. The modelled scenarios resulted in an increase in the occurrence of thermophilic plant species and a decrease in cold-tolerant species. By increased immobilisation of N in woody biomass, soil N is expected to be depleted, thereby increasing the probability of oligotrophic species. Climate change effects on tree growth, thus, can lead to an offset of eutrophication from N deposition.
Regarding the effects of climate change, N deposition and ozone (O3) exposure on carbon (C) sequestration, De Vries et al. (2017) determined the effects of past and expected future changes in European forests for the period 1900–2050 using empirical modelling. Within the study, ICP Forests data was used to check the plausibility of the soil C pools modelling results, around 6000 Level I plots were included. Comparing an “interactive model” (interactions between drivers are considered) and a “multiplicative model” (combined effect is the product of individual drivers), predictions of the multiplicative model were more plausible in view of literature information and observations. Compared to 1900, the modelled European average total C sequestration between 1950 and 2000

2018 Technical Report of ICP Forests | 11
increased by 21% (interactive model) and 41% (multiplicative model), however this growth increase is predicted to decline in the period 2000-2050. The large soil C pool changes in the past are mainly due to increased N deposition and CO2 increase, the smaller changes in the future are due to increased CO2 and temperature, to a lesser extent to decreased O3 exposure, and to the counteracting effect of decreased N deposition.
De Marco et al. (2017) studied the effect of O3 concentration and O3 metrics AOT40 (Accumulated Ozone over Threshold of 40 ppb) and POD0 (Phytotoxic Ozone Dose without threshold limitation) on crown defoliation in Romania. Using Level I defoliation data of Picea abies, Fagus sylvatica and Quercus sp, and air pollution data modelled on a 12 km grid with the three-dimensional model CHIMERE, they computed Random Forest and Generalised Regression Models to identify the relative effect of O3 in combination with climatic factors, orographic conditions and N pollutants. The analysis emphasised that O3 concentration was the most important factor for defoliation in F. sylvatica and P. abies, and the second most important factor in Quercus sp. However, the effect of POD0 on defoliation was low in all species, as POD0 never exceeded the critical level suggested by previous literature for forest protection.
Nutrient cycling in forests
Nitrogen and phosphorus (P) are essential nutrients for plant growth but also for micro-organisms. The deficiency or surplus of these nutrients in the forest ecosystem can have a large effect on ecosystem processes. Looking at the response of European beech forests to different soil P stocks, Lang et al. (2017) used five German Level II sites along a P geosequence. They observed a P mobilization from primary and secondary minerals by plants and soil organisms in P-rich but acid soils (acquisition strategy), whereas in P-poor soils plants and soil organisms sustain their P demand from the organic matter rich forest floor and soil horizons (recycling strategy). This indicates an adjustment of plant–microorganism–soil feedbacks to soil P availability. Thus, P deficiency in beech forest ecosystems is not just due to a low P supply, but depends on supply-specific plant–microorganism–soil interactions.
Zederer et al. (2017) studied the microbial biomass P (PMB) and the stoichiometric relationships to microbial biomass C (CMB) and microbial biomass N (NMB) in forest floor horizons and the effect of tree species. Investigating five sites in central and northern Germany with adjacent beech and spruce stands, including three Level II sites, they determined forest floor mean stocks of PMB and total P of around 27 and 100 kg ha-1, respectively. They found no tree species effect on P stocks, but PMB, CMB and NMB contents were higher under beech than under spruce. Further, small ranges of C/PMB ratios in relation to wide soil organic carbon (SOC)/total P ratios of the litter used as microbial substrate indicate a relatively strict homeostatic regulation of the forest floor microbial biomass stoichiometry.
Whereas the deficiency of plant-available nitrate (NO3-) or
ammonium (NH4+) in the soil can significantly decrease plant
growth, the surplus can lead to increased N leaching. Fleck et al. (2017) modelled the effect of three forest management scenarios on NO3
- concentrations in seepage water for four regions in the North German Lowland. As input data, soil data of the two German National Forest Soil Inventories (NFSI I and NFSI II) were used. The simulations (1990-2070) showed a long-lasting increase of NO3
--concentrations in seepage water from forest soils in the model regions due to a decrease in soil organic matter stocks and reduced seepage water fluxes under climate change. The biodiversity scenario with preferential treatment of potential natural vegetation and reduction in harvest volume mainly kept NO3
--concentrations in seepage water below the legal thresholds, but the climate protection scenario with fast-growing, coniferous trees and higher harvest volume increased concentrations strongly.
Next to the N and P, calcium (Ca) is a crucial nutrient for plants. Looking at mainly pine, spruce and birch dominated forests, Berg et al. (2017) studied the pattern in Ca concentration in foliage related to climate and soil properties, and its dynamics in decomposing litter. Sampling and analysing data from different sites in Finland, Sweden, Denmark, Germany, France and Canada including several ICP Forests sites, they found negative relationships of initial Ca concentration to mean annual precipitation for all species, and a positive relationship to extractable Ca in the upper mineral soil across species. In decomposing litter, Ca concentration followed a negative quadratic function and net release rates were linear to initial Ca concentration.
Current status of forest ecosystems
Monitoring the status of forest ecosystems under air pollution is one of ICP Forests’ main tasks. In Estonia, oil-shaleburning power plants are the main sources of heavy metals (HM) which also may affect forest ecosystems. Napa et al. (2017) analysed the heavy metal content in needles, litterfall, fine roots and soil organic horizons at six coniferous stands of the ICP Forests and ICP Integrated Monitoring network in Estonia. They found the highest concentrations of contaminant HM (lead (Pb), cadmium (Cd), chromium (Cr) and nickel (Ni)) in the soil organic horizons, whereas biogenic HM (zinc (Zn) and copper (Cu)) showed highest concentrations in fine roots indicating active root uptake of these microelements from soil organic layers.
Next to studying the effect of high air pollution, studying the impact of decreasing N inputs and the potential recovery of the forest ecosystems are also in focus of research. Verstraeten et al. (2017) studied whether the forest N status in northwest Europe did yet start to improve and to what extent such a potential improvement might be due to decreased N deposition, based on soil-solution and foliage data at five Belgian Level II sites. Between 2005 and 2014, the ratio of dissolved organic N to
12 | 2018 Technical Report of ICP Forests
total dissolved N (DON/TDN) increased in the O horizon and mineral soil indicating an improvement in forest N status, however NO3
-concentrations remained high. Foliar N/P and N concentrations did not change between 1999 and 2013 showing that biotic recovery appeared to be lagging behind.
The ICP Forests Level I monitoring features the assessment of tree species, defoliation, damages and mortality on a regular grid. Based on this data, tree species distributions and regional patterns in defoliation can be identified. Tikhonova et al. (2017) assessed the tree species diversity pattern in northwestern Russia and determined the natural and anthropogenic key factors of these observed patterns, using Level I tree data along a latitudinal gradient ranging from forest-tundra in the north to broadleaved-coniferous forests in the south. Their results show that only Scots pine, birch and Norway spruce have the potential to grow throughout the study area. The locally maximum tree species diversity varied from 1-3 species in the north to 5–7 species in the south. Further, they found recent wildfire events had only little effect on tree diversity in the study area.
Kumbasli et al. (2017) used the ICP Forests Manual to assess the defoliation rate of tree crowns. They studied the general condition in pure oak forests In Northern Turkish Thrace and related defoliation to different geological parent materials, regions, oak species and stand types. They found that 47% of the trees exhibited defoliation and that regions with high water deficit, medium diameter forests and sessile oak stands showed the highest defoliation rates.
The current status of mean deadwood volume at more than 3200 ICP Forests Level I plots was calculated and mapped by Puletti et al. (2017). Considering standing dead trees, lying dead trees, snags, stumps and coarse woody debris, they found that most plots have a deadwood volume lower than 50 m3 ha−1, with a few forests reaching a maximum of 300 m3 ha−1. Forests with higher deadwood volume are concentrated in central Europe, mountainous and high-forest management regions, whereas lower volumes are found in coppices-derived forest systems (Great Britain, Mediterranean region).
Improving modelling and assessments
To assess the parametric uncertainty in process-based models used for forest management decisions, Augustynczik et al. (2017) used Bayesian inference to determine the parametric model uncertainty. Propagating it with economic uncertainty to forest productivity, they found that both sources of uncertainty had a large effect on forest productivity. Management plans with increased thinning intensity were most robust against these and climate change uncertainties. They conclude that systematic quantification of uncertainties is crucial for designing suitable management plans under climate change.
Two publications studied how sampling of different variables can get more efficient and cost-effective by analyzing the minimum number of sampling points or observations to guarantee sufficient data quality. Marchi et al. (2017) carried out an exploratory analysis of forest parameters from Italian Level II plots testing the estimation error of basal area (A) per plot and of its periodic increment (ΔA). They used two different sub-sampling strategies both on a vertical (using a decreasing tree height threshold) and a horizontal range (using boot-strapping and increasing number of sample sub-squares). The results show that the use of both methodologies led to low predictive power when estimating ΔA directly. However, the indirect estimation of ΔA may allow for a sensible cost reduction with a controlled error that should be set a-priori to select the adequate number of sub-squares to be randomly sampled.
Looking at the minimum number of daily observations in air temperature, relative humidity and precipitation to adequately represent meteorological conditions for further forest resource management, Ferrara et al. (2017) used the meteorological dataset of 13 Italian Level II plots. With increasing the number of daily observations, descriptive and inferential statistical methods were used to evaluate the amount of variability. Monthly or seasonal statistics can be proficiently estimated for air temperature and relative humidity with a proportion of missing values higher than 50%, but precipitation requires a much higher amount of observations.
Within the UNECE Air Convention, the European Monitoring and Evaluation Programme (EMEP) and the Working Group on Effects (WGE) including its six International Cooperative Programmes work under one umbrella. Considering data of ICP Vegetation, EMEP and ICP Forests, Schröder et al. (2017) investigated the statistical meaning of N and HM concentrations of the European moss survey and whether moss indicates a similar atmospheric deposition as modelled deposition (EMEP), tree foliage and natural surface soil (ICP Forests) at the European and country level. They found significant correlations between N and HM concentrations in moss and modelled atmospheric deposition, and concentrations in leaves, needles and soil. Cd and Pb concentrations in leaves and needles (ICP Forests Level II) and atmospheric deposition (EMEP) show element- and specimen-specific variation, whereas Cd and Pb concentrations in organic surface soil layers collected on German Level II plots and modelled atmospheric deposition show weak layer-specific correlations. Schröder et al. (2017) conclude that moss surveys should complement forest deposition monitoring and impact assessments.
Looking at the programme itself, Bussotti and Pollastrini (2017) verified in an opinion article, whether and to what extent the current ICP Forests Level I monitoring is suitable for assessing the changes in structure and species composition of forests under climate change. They conclude that a focus shift from the conditions of individual trees to the community is needed.
2018 Technical Report of ICP Forests | 13
Further, they suggest adding indicators i.e. as the measurement of woody understory mortality, tree ring analysis and regeneration assessment while reducing the assessment frequency to 3–5 years.
List of ICP Forests related scientific publications (June – December 2017)
Augustynczik ALD, Hartig F, Minunno F, Kahle H-P, Diaconu D, Hanewinkel M, Yousefpour R (2017) Productivity of Fagus sylvatica under climate change – A Bayesian analysis of risk and uncertainty using the model 3-PG. For Ecol Manag 401:192–206. doi: 10.1016/j.foreco.2017.06.061
Berg B, Johansson M-B, Liu C, Faituri M, Sanborn P, Vesterdal L, Ni X, Hansen K, Ukonmaanaho L (2017) Calcium in decomposing foliar litter – A synthesis for boreal and temperate coniferous forests. For Ecol Manag 403:137–144. doi: 10.1016/j.foreco.2017.08.022
Bussotti F, Pollastrini M (2017) Observing Climate Change Impacts on European Forests: What Works and What Does Not in Ongoing Long-Term Monitoring Networks. Front Plant Sci 8. doi: 10.3389/fpls.2017.00629
Caignard T, Kremer A, Firmat C, Nicolas M, Venner S, Delzon S (2017) Increasing spring temperatures favor oak seed production in temperate areas. Sci Rep 7. doi: 10.1038/s41598-017-09172-7
De Marco A, Vitale M, Popa I, Anav A, Badea O, Silaghi D, Leca S, Screpanti A, Paoletti E (2017) Ozone exposure affects tree defoliation in a continental climate. Sci Total Environ 596–597:396–404. doi: 10.1016/j.scitotenv.2017.03.135
de Vries W, Posch M, Simpson D, Reinds GJ (2017) Modelling long-term impacts of changes in climate, nitrogen deposition and ozone exposure on carbon sequestration of European forest ecosystems. Sci Total Environ 605–606:1097–1116. doi: 10.1016/j.scitotenv.2017.06.132
Dirnböck T, Djukic I, Kitzler B, Kobler J, Mol-Dijkstra JP, Posch M, Reinds GJ, Schlutow A, Starlinger F, Wamelink WG (2017) Climate and air pollution impacts on habitat suitability of Austrian forest ecosystems. PloS One 12:e0184194
Duque-Lazo J, Navarro-Cerrillo RM (2017) What to save, the host or the pest? The spatial distribution of xylophage insects within the Mediterranean oak woodlands of Southwestern Spain. For Ecol Manag 392:90–104. doi: 10.1016/j.foreco.2017.02.047
Ferrara C, Marchi M, Fares S, Salvati L (2017) Sampling strategies for high quality time-series of climatic variables in forest resource assessment. IForest - Biogeosciences For 10:739–745. doi: 10.3832/ifor2427-010
Fleck S, Ahrends B, Sutmöller J, Albert M, Evers J, Meesenburg H (2017) Is Biomass Accumulation in Forests an Option to Prevent Climate Change Induced Increases in Nitrate Concentrations in the North German Lowland? Forests 8:219. doi: 10.3390/f8060219
Gauzere J, Delzon S, Davi H, Bonhomme M, Garcia de Cortazar-Atauri I, Chuine I (2017) Integrating interactive effects of chilling and photoperiod in phenological process-based models. A case study with two European tree species: Fagus sylvatica and Quercus petraea. Agric For Meteorol 244–245:9–20. doi: 10.1016/j.agrformet.2017.05.011
Kumbasli M, Makineci E, Keten A, Beskardes V, Özdemir E (2017) Effects of parent material, stand type and oak species on defoliation of coppice-originated oak (Quercus spp.) forests in Northern Turkish Thrace. Bosque Valdivia 38:299–306. doi: 10.4067/S0717-92002017000200007
Lang F, Krüger J, Amelung W, Willbold S, Frossard E, Bünemann EK, Bauhus J, Nitschke R, Kandeler E, Marhan S, Schulz S, Bergkemper F, Schloter M, Luster J, Guggisberg F, Kaiser K, Mikutta R, Guggenberger G, Polle A, Pena R, Prietzel J, Rodionov A, Talkner U, Meesenburg H, von Wilpert K, Hölscher A, Dietrich HP, Chmara I (2017) Soil phosphorus supply controls P nutrition strategies of beech forest ecosystems in Central Europe. Biogeochemistry 136:5–29. doi: 10.1007/s10533-017-0375-0
Marchi M, Ferrara C, Bertini G, Fares S, Salvati L (2017) A sampling design strategy to reduce survey costs in forest monitoring. Ecol Indic 81:182–191. doi: 10.1016/j.ecolind.2017.05.011
Napa Ü, Ostonen I, Kabral N, Kriiska K, Frey J (2017) Biogenic and contaminant heavy metal pollution in Estonian coniferous forests. Reg Environ Change 17:2111–2120. doi: 10.1007/s10113-017-1206-5
Puletti N, Giannetti F, Chirici G, Canullo R (2017) Deadwood distribution in European forests. J Maps 13:733–736. doi: 10.1080/17445647.2017.1369184

14 | 2018 Technical Report of ICP Forests
Schröder W, Nickel S, Schönrock S, Schmalfuß R, Wosniok W, Meyer M, Harmens H, Frontasyeva MV, Alber R, Aleksiayenak J, Barandovski L, Blum O, Carballeira A, Dam M, Danielsson H, De Temmermann L, Dunaev AM, Godzik B, Hoydal K, Jeran Z, Karlsson GP, Lazo P, Leblond S, Lindroos J, Liiv S, Magnússon SH, Mankovska B, Núñez-Olivera E, Piispanen J, Poikolainen J, Popescu IV, Qarri F, Santamaria JM, Skudnik M, Špirić Z, Stafilov T, Steinnes E, Stihi C, Suchara I, Thöni L, Uggerud HT, Zechmeister HG (2017) Bioindication and modelling of atmospheric deposition in forests enable exposure and effect monitoring at high spatial density across scales. Ann For Sci 74. doi: 10.1007/s13595-017-0621-6
Tikhonova E, Tikhonov G, Shevchenko N, Knyazeva S, Plotnikova A, Lukina N, Shashkov M (2017) Tree diversity patterns along the latitudinal gradient in the northwestern Russia. For Ecosyst 4. doi: 10.1186/s40663-017-0114-y
Verstraeten A, Neirynck J, Cools N, Roskams P, Louette G, De Neve S, Sleutel S (2017) Multiple nitrogen saturation indicators yield contradicting conclusions on improving nitrogen status of temperate forests. Ecol Indic 82:451–462. doi: 10.1016/j.ecolind.2017.07.034
Zederer DP, Talkner U, Spohn M, Joergensen RG (2017) Microbial biomass phosphorus and C/N/P stoichiometry in forest floor and A horizons as affected by tree species. Soil Biol Biochem 111:166–175. doi: 10.1016/j.soilbio.2017.04.009

2018 Technical Report of ICP Forests | 15
3 PRESENTATIONS AT THE 6TH ICP FORESTS SCIENTIFIC CONFERENCE, BUCHAREST, 16–17 MAY 2017The 6th ICP Forests Scientific Conference Air pollution, climate change and forest ecosystems: evidence for effects, adaptation, and mitigation was hosted by the Romanian Ministry of Environment, Waters and Forests and the National Institute for Research and Development in Forestry “Marin Drăcea” in Bucharest, 15–17 May2017 with 76 participants from 27 countries.
After three decades of monitoring by ICP Forests, long-term data series provide a unique asset for the evaluation of status, trends and processes in European forest ecosystems. Hence, the 6th ICP Forests Scientific Conference offered the possibility to present results from all forest related monitoring and research infrastructures.
The conference addressed scientists and experts from ICP Forests, the wider UNECE community under and beyond the Working Group on Effects (WGE), partners and stakeholders, and interested scientists and experts from related fields. Especially, researchers using ICP Forests data in their projects, evaluations, and modelling exercises were invited.
The main topics were:
− The impact of nitrogen, ozone, and their interactions on forest ecosystems
− Nutrient and biogeochemical cycling
− Heavy metals in forests
− Climate change, air pollution effects and interactions
The following list includes all oral and poster presentations at the 6th ICP Forests Scientific Conference. All conference abstracts are available from the ICP Forests website1.
Apostol EN, Sidor C [Poster] Spring phenology in relation to global warming in Quercus species
Araminienė V, Stakėnas V, Girgždienė R, Varnagirytė-Kabašinskienė I [Presentation] Development of forest vegetation under ozone exposure in Lithuania: study of visible ozone injury
Barbu I, Curca M, Carmen I [Poster] Influence of relief on the chemical characteristics of snowfall in the northern Carpathians
1 http://www.icp-forests.net/page/icp-forests-other-publications
Bégin C, Savard MM, Marion J, Thiffault É, Pinno B [Presentation] Boron and other nutrients dynamics in tree-rings as indicators of forest disturbances in the Lower Athabasca Oil Sands region, Northeastern Alberta, Canada
Brown N, Broadmeadow S, Parnell SR, Denman S, Vanguelova E [Presentation] Climate, deposition and soil type are strong predisposition factors to acute oak decline in England and Wales
Ciuvăt AL, Deleanu E, Ionescu M [Poster] Foliar nutrition of Norway spruce (Picea abies [L.] Karst), European beech (Fagus sylvatica L.) and sessile oak (Quercus petraea) from ICP Forests intensive monitoring network in the Romanian Carpathian Mountains
Clarke N, Timmermann V [Presentation] Effects of sea salt episodes on heavy metal concentrations in soil solution and needles at Norwegian Level II plots
Curca M, Barbu I, Carmen I [Poster] Trends in the atmospheric deposition in three representative forest ecosystem in southern Romania
Dinca L, Guiman G, Greavu V, Crisan V, Braga C [Poster] Temporal variability of soil moisture at different soil depths from six years of records in three Romanian Level II monitoring plots
Galić Z [Poster] Extreme temperature events in black walnut stands in January 2017
García Gómez H, Izquieta-Rojano S, Aguillaume L, González-Fernández I, Valiño F, Rábago I, Santamaría JM, Elustondo D, Àvila A, Alonso R [Presentation] Atmospheric concentration and deposition of reactive nitrogen in Spanish forests of Quercus ilex: relevant results
Gottardini E, Bettini D, Calderisi M, Cristofolini F, Cristofori A, Pollastrini M, Zuliani F, Ferretti M [Presentation] Leaf traits: a tool to assess forest health and vitality
Greve M, Block J, Schüler G, Werner W [Presentation] Use of long term element budgets to identify driving sources for soil acidification and to monitor the effects of forest liming
Guerrieri R, Peñuelas J, Mencuccini M [Presentation] Combining multiple isotopes and metagenomic to delineate the role of canopy nitrification at ICP Forest sites
Vitalie Gulca, Victor Sfecla, Jorje Alcazar [Poster] Course syllabus “The impact of climate change on forest”
Jochheim H, Brunet-Navarro P [Poster] Mitigation potential of forest management and wood products use – Simulation study for intensive monitoring plots of Brandenburg, Germany
16 | 2018 Technical Report of ICP Forests
König N, Fortmann H, Schönfelder E, Klinck U, Meesenburg H [Presentation] Evaluation of soil acidification at long-term monitoring sites over the last 50 years and effects of liming
Markovic M, Rajkovic S [Poster] Injuries to living trees at the sample plots in central Serbia
Michopoulos P, Kostakis MG, Thomaidis NS, Pasias IN, Kaberi H, Iliakis S [Presentation] The use of lead isotopes to quantify anthropogenic pollution in soil of a mountainous fir ecosystem
Neagu S [Poster] Carpathian forests’ vitality and potential vulnerabilities
Nussbaumer A, Waldner P, Braun S et al. [Presentation] Mast behaviour in European forest tree species
Popa I, Leca S, Badea O [Presentation] Stem diameter variability inferred from band girth and point dendrometers in ICP Forests Level II in Romania
Rademacher P, Schmidt M, Hartmann H, Schlepphorst R, Murach D [Presentation] Nutrition of fast growing tree species and effects of land use change on agricultural soils
Rajkovic S, Markovic M [Poster] Biofungicides in order to prevent ecoproblems
Raspe S, Dietrich H-P, Köhler D, Schubert A, Stiegler J [Presentation] Nitrogen budget of Bavarian Level II plots from 25 years of measurement
Remy E, Wuyts K, Boeckx P, Gundersen P, Verheyen K [Presentation] Nitrogen cycling and sequestration in temperate forest edges
Salemaa M, Merilä P, Lindroos A-J, Mäkipää R, Smolander A [Presentation] Importance of bryophytes and their cyanobacteria in boreal forest N-budget
Schaap M, Banzhaf S, Scheuschner T, Hendriks C, Kranenburg R, Nagel HD, Segers AJ, Wichink Kruit R, Builtjes PJH [Presentation] Atmospheric nitrogen deposition to terrestrial ecosystems across Germany
Solly E, Haeni M, Hug C, Waldner P, Walthert L, Rigling A, Sutter F, Vollenweider P, Hagedorn F, Gessler A [Presentation] Does regional drought intensity trigger mortality patterns of Scots pine in inner-Alpine dry valleys of Switzerland?
Sousa-Silva R, Van Meerbeek K, Van de Peer T, Sioen G, Laurent C, Ponette Q, Verheyen K, Muys B [Presentation] Does tree diversity matter for defoliation trends of oak and beech?
Thimonier A, Waldner P, Schmitt M, Hug C, Etzold S [Poster] Interaction of biotic processes with nutrient cycling and tree growth in an oak-hornbeam forest stand in Switzerland
Ukonmaanaho L, Forsius M, Arvola L, Hartman M, Starr M [Poster] Linkages between riparian zone and stream water DOC concentration and quality in relation to land use
Werner W, Eghdami H, Prescher A-K [Presentation] The magnitude of ozone fluxes in German forests – does latitude matter?
Zhiyanski M, Nedkov S, Sokolovska M, Georgieva M, Mirchev P, Georgiev G, Yaneva R [Presentation] Assessment and mapping the dynamics of health status and soil properties in forest ecosystems from central Balkan region

2018 Technical Report of ICP Forests | 17
4 ONGOING RESEARCH PROJECTS USING ICP FORESTS DATA / INFRASTRUCTUREICP Forests welcomes scientists from within and outside the ICP Forests community to use ICP Forests data for research purposes. Data applicants must fill out a data request form and send it to the Programme Co-ordinating Centre of ICP Forests thereby consenting to the ICP Forests Data Policy. For more information, please refer to the ICP Forests website1.
The following list provides an overview of all the 43 projects using ICP Forests data and/or infrastructure and that were ongoing for at least one month between June and December 2017. In this period, 7 new projects have started (s. ID number with *). All past and present ICP Forests data uses are listed on the ICP Forests website2.
ID Name of Applicant
Institution Project Title External/Internal3
14 John Caspersen
Swiss Federal Institute for Forest, Snow and Landscape Research WSL
Global Forest Monitoring External
25 Dr. Nicole Augustin
University of Bath Spatial-temporal modelling of defoliation in European forests
External
55 Ivan Janssen University of Antwerp Effects of phosphorus limitations on Life, Earth system andSociety (IMBALANCE-P)
External
63 Jesus San-Miguel
European Commission - Joint Research Centre
Distribution maps of forest tree species External
67 Dr. Stefan Fleck
Northwest German Forest Research Institute (NW-FVA)
LAI-estimations with allometry, litter collections, and optical measurements in relation to stand properties and microclimate
Internal
68 Shengwei Shi College of Forestry, Northwest A & F University, China
Modeling dissolved organic carbon in forest soils using a TRIPLEX-DOC model
External
73 Christopher Reyer
Potsdam Institute for Climate Impact Research (PIK)
COST Action FP 1304 Towards robust projections of European forests under climate change (PROFOUND)
External
76 Karin Hansen IVL Swedish Environmental Research Institute
Atmospheric Deposition: EMEP - ICP Forests comparisons of level, trend and canopy exchange
Internal
79 Peter Waldner
Swiss Federal Institute for Forest, Snow and Landscape Research WSL
Nitrate leaching risk mapping (NitLeach) Internal
81 Robert Weigel
Ernst-Moritz-Arndt-University (Greifswald)
"The ecological and biogeochemical importance of snow cover for temperate forest ecosystems" and "Phenotypic plasticity and local adaptation in beech provenances (Fagus sylvatica)"
External
1 http://icp-forests.net 2 http://icp-forests.net/page/project-list 3 Internal Evaluations can be initialized by the Chairperson of ICP Forests, the Programme Co-ordinating Centre, the Expert Panel Chairs and/or other bodies under the
LRTAP Convention. Different rights and obligations apply to internal vs. external data users.

18 | 2018 Technical Report of ICP Forests
ID Name of Applicant
Institution Project Title External/Internal3
84 Yasmina Loozen
Utrecht University, Faculty of Geosciences
Taking a remote look at canopy nitrogen to improve global climate models
External
85 Sietse van der Linde
Imperial College London & Royal Botanic Garden, Kew
Large-scale diversity, distribution and fate of Europe's forest mycorrhizas
Internal
87 Valerio Avitabile
Wageningen University GlobBiomass External
88 Axel Göttlein Technical University Munich Specification of biogeochemical thresholds for the cultivation of important forest tree species in the face of climate change
External
90 Mathias Neumann
University of Natural Resources and Life Sciences
FORMIT – Forest management strategies to enhance the mitigation potential of European forests
External
91 Peter Waldner
Swiss Federal Institute for Forest,Snow and Landscape Research WSL
Seed C 2 – Carbon allocation to fruits and seeds in European forests as a function of climate, atmospheric deposition and nutrient supply
Internal
94 Hrvoje Marjanović
Croatian Forest Research Institute Estimating and Forecasting Forest Ecosystem Productivity by Integrating Field Measurements, Remote Sensing and Modelling
External
95 Gaia Vaglio Laurin
University of Tuscia Very high resolution monitoring of EU forest ecosystems: understanding advancements now possible by means of new satellite remote sensing data
External
96 Myriam Legay Office National des Forêts IKSMaps: Providing precalculated future distribution maps for the main French forestry species through IKS model
External
98 Susanne Brandl
Bavarian State Institute of Forestry Alterations in the lifetime of forest stands: Economic consequences of climate change for forestry enterprises. Management options for optimizing risk-return ratios under a changing climate
External
100 Dr. Michael Kessler
Institute of Systematic and Evolutionary Botany, University of Zurich, Switzerland
Understanding global patterns of fern diversity and diversification
External
101 Dr. Ulrich Matthes
Rhineland-Palatinate Centre of Excellende for Climate Change Impacts
Adapting forestry to climate change in Rhineland-Palatinate (Germany)
External
102 Jean-Pierre Wigneron
ISPA, Institut National de la Recherche Agronomique (INRA), Bordeaux
Evaluating the use of passive microwave products (soil moisture and vegetation optical depth) to monitor drought impacts on forests
External
104 J. Julio Camarero
Instituto Pirenaico de Ecología (IPE, CSIC)
Exploring whether functional diversity confer resistance and resilience to drought in forests
External
105 Bart Muys KU Leuven FORBIO Climate - Adaptation potential of biodiverse forests in the face of climate change
External
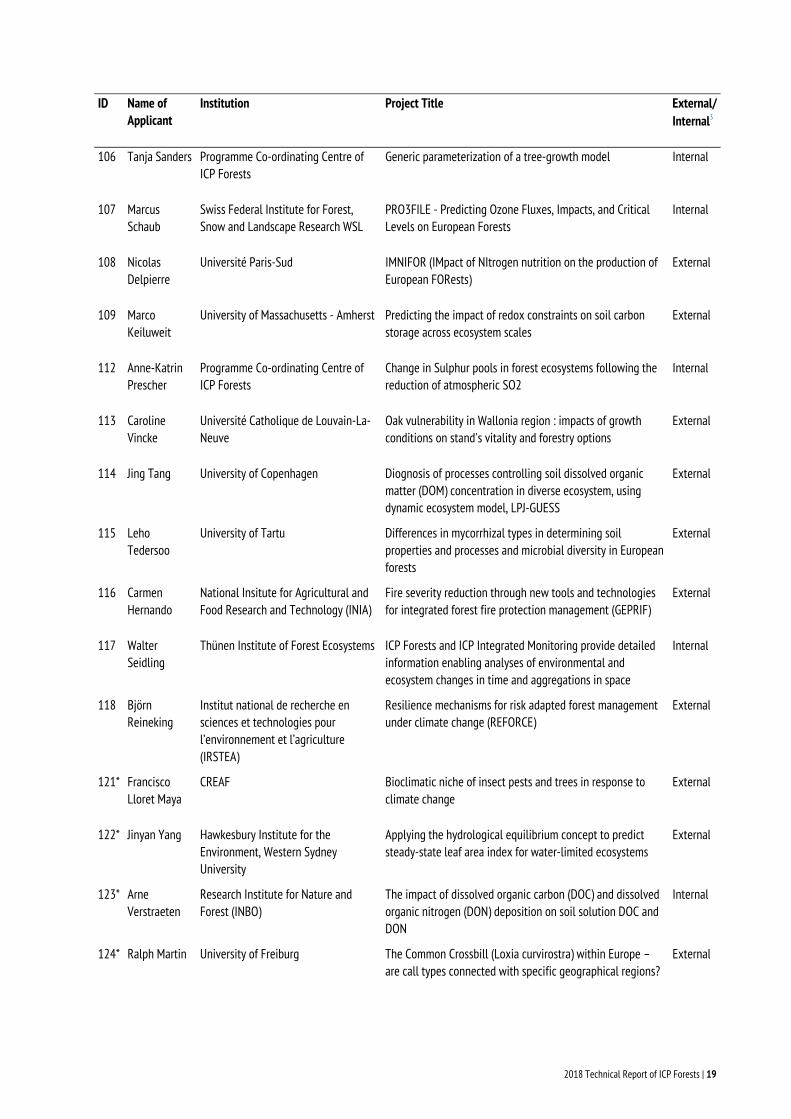
2018 Technical Report of ICP Forests | 19
ID Name of Applicant
Institution Project Title External/Internal3
106 Tanja Sanders Programme Co-ordinating Centre of ICP Forests
Generic parameterization of a tree-growth model Internal
107 Marcus Schaub
Swiss Federal Institute for Forest, Snow and Landscape Research WSL
PRO3FILE - Predicting Ozone Fluxes, Impacts, and Critical Levels on European Forests
Internal
108 Nicolas Delpierre
Université Paris-Sud IMNIFOR (IMpact of NItrogen nutrition on the production of European FORests)
External
109 Marco Keiluweit
University of Massachusetts - Amherst Predicting the impact of redox constraints on soil carbon storage across ecosystem scales
External
112 Anne-Katrin Prescher
Programme Co-ordinating Centre of ICP Forests
Change in Sulphur pools in forest ecosystems following the reduction of atmospheric SO2
Internal
113 Caroline Vincke
Université Catholique de Louvain-La-Neuve
Oak vulnerability in Wallonia region : impacts of growth conditions on stand's vitality and forestry options
External
114 Jing Tang University of Copenhagen Diognosis of processes controlling soil dissolved organic matter (DOM) concentration in diverse ecosystem, using dynamic ecosystem model, LPJ-GUESS
External
115 Leho Tedersoo
University of Tartu Differences in mycorrhizal types in determining soil properties and processes and microbial diversity in European forests
External
116 Carmen Hernando
National Insitute for Agricultural and Food Research and Technology (INIA)
Fire severity reduction through new tools and technologies for integrated forest fire protection management (GEPRIF)
External
117 Walter Seidling
Thünen Institute of Forest Ecosystems ICP Forests and ICP Integrated Monitoring provide detailed information enabling analyses of environmental and ecosystem changes in time and aggregations in space
Internal
118 Björn Reineking
Institut national de recherche en sciences et technologies pour l’environnement et l’agriculture (IRSTEA)
Resilience mechanisms for risk adapted forest management under climate change (REFORCE)
External
121* Francisco Lloret Maya
CREAF Bioclimatic niche of insect pests and trees in response to climate change
External
122* Jinyan Yang Hawkesbury Institute for the Environment, Western Sydney University
Applying the hydrological equilibrium concept to predict steady-state leaf area index for water-limited ecosystems
External
123* Arne Verstraeten
Research Institute for Nature and Forest (INBO)
The impact of dissolved organic carbon (DOC) and dissolved organic nitrogen (DON) deposition on soil solution DOC and DON
Internal
124* Ralph Martin University of Freiburg The Common Crossbill (Loxia curvirostra) within Europe – are call types connected with specific geographical regions?
External

20 | 2018 Technical Report of ICP Forests
ID Name of Applicant
Institution Project Title External/Internal3
125* Tanja Sanders Thünen Institute of Forest Ecosystems, Eberswalde
Extending trait-based dynamic global vegetation model (LPJmL-FIT) to temperate forests
Internal
126* Joep Langeveld
Utrecht University (department of Geochemistry)
Modeling global carbon flows in groundwater systems External
128* Yongshuo Fu University of Antwerp and Beijing Normal University
Understanding tree phenology in relation to climate External

PART B
REPORTS ON INDIVIDUAL SURVEYS IN ICP FORESTS

22 | 2018 Technical Report of ICP Forests
5 ATMOSPHERIC DEPOSITION IN EUROPEAN FORESTS IN 2016 Aldo Marchetto, Peter Waldner, Arne Verstraeten
5.1 Summary
Studying the effects of atmospheric pollution to forest ecosystems requires an evaluation of air quality and of the amount of pollutants carried to the forests by atmospheric deposition. Pollutant flux towards ecosystems through deposition mainly follows two pathways: wet deposition of compounds dissolved in rain and snow and dry deposition of particulate matter through gravity or filtration, for example by forest canopy.
Pollutant deposition shows a relatively high local variability, related to the distribution of pollutant sources and the local topography, and in-situ measurement is needed to obtain accurate evaluations and to validate model estimates.
In 2016, the chemical composition of atmospheric deposition was measured in 276 Level II permanent plots. In this report, we focus on acidifying, buffering, and eutrophying compounds.
High throughfall deposition of nitrate was mainly found in central Europe (Germany, Switzerland), Denmark, and Belgium, while for ammonium high deposition was also found in northern Italy. The area of high deposition is smaller for sulphate, including some plots in Germany and Poland. High values were also measured in Belgium, but they are partially due to deposition of marine aerosol, and they are less evident after sea-salt correction. High deposition in southern Italy may be related to local anthropogenic sources and to volcanic contribution.
Calcium, potassium, and magnesium deposition can buffer the acidifying effect of atmospheric deposition. High values of calcium throughfall deposition were reported for southern Europe, where it is often related to the deposition of Saharan dust, and for Eastern Europe. The correction for the marine contribution does not affect its spatial pattern. On the contrary, for magnesium, the number of sites with the highest values is markedly reduced by the sea salt correction.
5.2 Introduction
The atmosphere contains a large number of substances of natural and anthropogenic origin. A large part of them can settle, or be adsorbed to receptor surfaces, or be included in rain
and snow and finally reach land surface as wet and dry deposition.
Among these substances, in the last two centuries human activities led to a dramatic increase in the deposition of nitrogen and sulphur compounds.
Sulphur deposition almost completely occurs in the form of sulphate (SO4
2-), deriving from marine aerosol and from the interaction in the atmosphere between water and sulphur dioxide (SO2) forming sulphuric acid.
SO2 emission derives from volcanoes, forest fires and the combustion of fossil fuels, mainly sulphur containing coal and oil. Following industrial and economic development, SO2 emission increased since the early 19th century until the 1980s, causing an increase in the deposition of sulphate and in deposition acidity, which can be partly buffered by the deposition of base cations, mainly calcium (Ca2+) and magnesium (Mg2+).
As a consequence of the application of the CLRTAP protocol and of economic transformation, SO2 emission in the countries participating in ICP Forests markedly decreased in the last decades (EEA 2016) resulting in a downward trend in sulphate deposition and a similar decrease in deposition acidity (Waldner et al. 2014)
Natural sources of reactive nitrogen in the atmosphere are mainly restricted to the decomposition of the nitrogen gas molecule (N2) during lightning. However, human activities cause the emission of a large amount of nitrogen oxides (NOx), released during combustion processes, and of ammonia (NH3) deriving from agriculture and farming. They are found in atmospheric deposition in the form of nitrate (NO3
-) and ammonium (NH4
+).
N compounds have two effects on the ecosystem: They are important plant nutrients with strong effects on plant production and metabolism (e.g., Silva et al. 2015), all forest processes (e.g., Meunier et al. 2016) and biodiversity (e.g., Bobbink et al. 2010), but they can also reinforce soil acidification (Bobbink and Hettelingh 2011).
Emission and deposition of both sulphur and nitrogen are recently decreasing, but the trend for nitrogen is less evident than for SO4
2-(Waldner et al. 2014; EEA 2016).

2018 Technical Report of ICP Forests | 23
5.3 Materials and methods
Atmospheric throughfall and bulk deposition is collected in the ICP Forests permanent plots under the tree canopy (throughfall samplers, Figure 5-1) and in a nearby clearance (open field samplers), respectively. The latter samplers are intended to estimate the intensity of wet deposition, i.e. the amount of pollutants carried by rain and snow. The former samplers are intended to estimate total deposition, including dry deposition due to particulate matter collected by the tree canopy.
However, a tree canopy interacts with atmospheric deposition, for example by the uptake of ammonium ions and the release of potassium, magnesium, and calcium ions and organic compounds, affecting the composition of throughfall deposition.
In the case of beech, a significant component of atmospheric deposition captured by tree crown flows along the smooth bark and tree trunks, and is therefore sampled by stemflow collectors installed on beech plots.
Sampling, analysis and quality control procedures are harmonized on the basis of the ICP Forests Manual (Clarke et al. 2016). Quality control and assurance include laboratory ring-tests, use of control chart and performing conductivity and ion balance checks on all samples (König et al. 2016). In calculating ion balance, the charge of organic compounds was considered proportional to the dissolved organic carbon (DOC) content following Mosello et al. (2005, 2008).
In this report, we report on the annual throughfall deposition of the year 2016, collected on 250 permanent plots. Data from 26 further plots, collected following the ICP Forests Manual, were kindly provided by the Swedish Throughfall Monitoring Network (SWETHRO).
Figure 5-1: Throughfall deposition samplers in a forest in Italy
Plots were excluded if the duration of sampling covered less than 90% (329 days) of the year or if both the conductivity and ion balance checks were passed for less than 30% of the analysis of the year. For the Swedish data, DOC values were not available and the ion balance check was not performed.
As the deposition of marine aerosol represents an important contribution to the total deposition of suphate, calcium and magnesium, a sea-salt correction was applied, subtracting from the deposition fluxes the marine contribution, calculated as a fraction of the chloride deposition according to the ICP Modelling & Mapping Manual (CLRTAP 2004).
5.4 Results
The uneven distribution of emission sources and receptors and the complex orography of part of Europe result in a marked spatial variability of the measured throughfall deposition on the ICP Forests Level II plot network. However, on a broader scale, regional patterns in throughfall deposition arose similar to those reported for earlier years. In the case of nitrate, high throughfall deposition was mainly found in central Europe (part of Germany, Denmark, Belgium, and Switzerland), while the lower values, below 1 kg N ha-1 y-1, were found in Sweden, France, Slovakia, and Estonia (Figure 5-2).
The central European area of high ammonium throughfall deposition is larger, including parts of Belgium, Germany, Poland, Switzerland, and Italy (Figure 5-3). Low values, below 1 kg N ha-1 y-1, were found again in Finland and France, but also in parts of Switzerland and Italy.
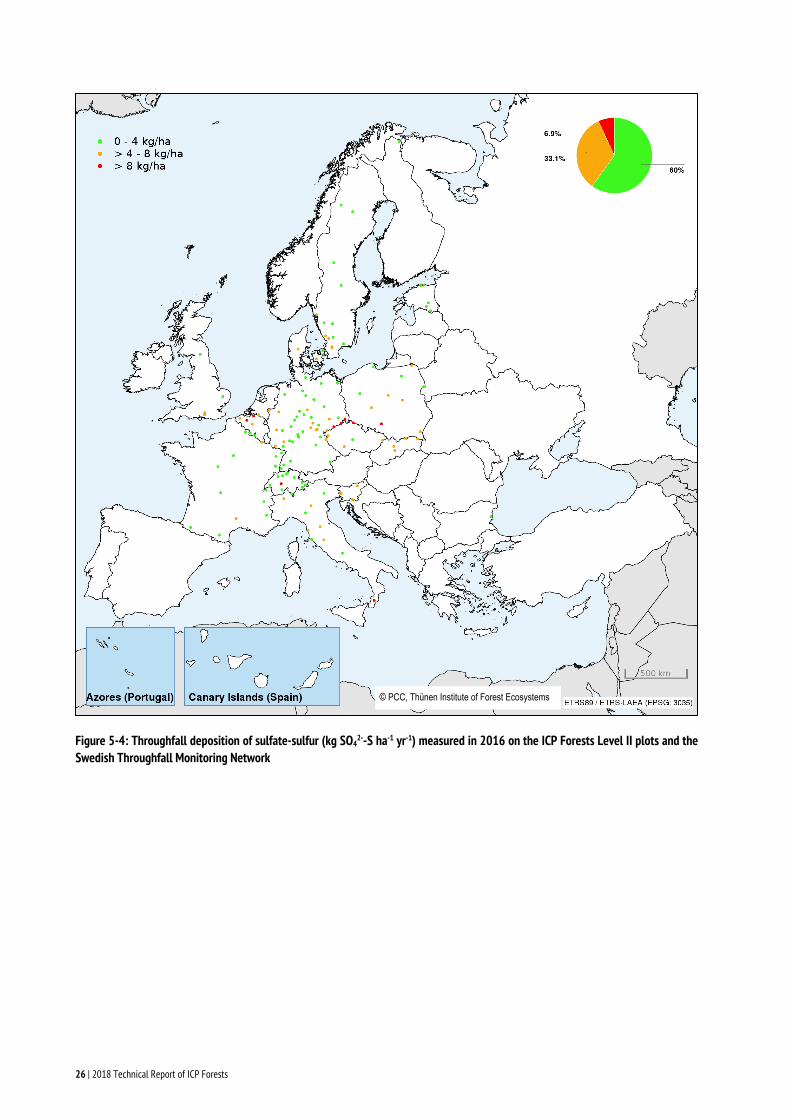
The area with higher throughfall deposition of sulphate is smaller than for the nitrogen compounds (Figure 5-4), including parts of Germany and Poland. Further plots with high sulphate throughfall deposition were found in Belgium, where the influence of marine aerosol accounted for around one half of sulphate throughfall deposition (Figure 5-5). The highest sulphate throughfall deposition was recorded in southern Italy, related to the influence of anthropogenic emission, volcanic activity and marine aerosol. The lowest sulphate throughfall deposition (below 1 kg S ha-1 y-1) was measured at specific sites in Sweden, Switzerland, and France.
Calcium and magnesium are also analyzed in the ICP Forests deposition monitoring network, because their deposition can buffer the acidifying effect of other compounds in atmospheric deposition, and can decelerate or prevent soil acidification. High values of calcium throughfall deposition are reported in southern Europe, (Italy, Slovenia, France and Switzerland) mainly related to the deposition of Saharan dust, and in Eastern Europe (Figure 5-6). The correction for the marine contribution

24 | 2018 Technical Report of ICP Forests
does not affect their spatial pattern and gives only minor changes in throughfall deposition (data not shown).
On the contrary, in the case of magnesium, the distribution of the highest values, including a large portion of southern and central Europe and parts of Sweden (Figure 5-7), is markedly reduced by the sea salt correction indicating that larger parts are from maritime origin (Figure 5-8).
Figure 5-2: Throughfall deposition of nitrate-nitrogen (kg NO3--N ha-1 yr-1) measured in 2016 on the ICP Forests Level II plots and
the Swedish Throughfall Monitoring Network
© PCC, Thünen Institute of Forest Ecosystems

2018 Technical Report of ICP Forests | 25
Figure 5-3: Throughfall deposition of ammonium-nitrogen (kg NH4+-N ha-1 yr-1) measured in 2016 on the ICP Forests Level II plots
and the Swedish Throughfall Monitoring Network
© PCC, Thünen Institute of Forest Ecosystems
26 | 2018 Technical Report of ICP Forests
Figure 5-4: Throughfall deposition of sulfate-sulfur (kg SO42--S ha-1 yr-1) measured in 2016 on the ICP Forests Level II plots and the
Swedish Throughfall Monitoring Network
© PCC, Thünen Institute of Forest Ecosystems

2018 Technical Report of ICP Forests | 27
Figure 5-5: Throughfall deposition of sea-salt corrected sulfate-sulfur (kg SO42--S ha-1 yr-1) measured in 2016 on the ICP Forests
Level II plots and the Swedish Throughfall Monitoring Network
© PCC, Thünen Institute of Forest Ecosystems

28 | 2018 Technical Report of ICP Forests
Figure 5-6: Throughfall deposition of calcium (kg Ca2+ ha-1 yr-1) measured in 2016 on the ICP Forests Level II plots and the Swedish Throughfall Monitoring Network
© PCC, Thünen Institute of Forest Ecosystems

2018 Technical Report of ICP Forests | 29
Figure 5-7: Throughfall deposition of magnesium (kg Mg2+ ha-1 yr-1) measured in 2016 on the ICP Forests Level II plots and the Swedish Throughfall Monitoring Network
© PCC, Thünen Institute of Forest Ecosystems

30 | 2018 Technical Report of ICP Forests
Figure 5-8: Throughfall deposition of sea-salt corrected magnesium (kg Mg2+ ha-1 yr-1) measured in 2016 on the ICP Forests Level II plots and the Swedish Throughfall Monitoring Network
© PCC, Thünen Institute of Forest Ecosystems

2018 Technical Report of ICP Forests | 31
5.5 References
Bobbink R, Hettelingh JP, eds (2011) Review and revision of empirical critical loads and dose-response relationships. Coordination Centre for Effects, National Institute for Public Health and the Environment (RIVM)
Bobbink R, Hicks K, Galloway J, Spranger T, Alkemade R, Ashmore M, Bustamante M, Cinderby S, Davidson E, Dentener F, Emmett B, Erisman JW, Fenn M, Gilliam F, Nordin A, Pardo L, De Vries W (2010) Global assessment of nitrogen deposition effects on terrestrial plant diversity: a synthesis. Ecol Appl 20:3059
Clarke N, Žlindra D, Ulrich E, Mosello R, Derome J, Derome K, König N, Lövblad G, Draaijers GPJ, Hansen K, Thimonier A, Waldner P (2016) Part XIV: Sampling and Analysis of Deposition. In: UNECE ICP Forests Programme Co-ordinating Centre (ed): Manual on methods and criteria for harmonized sampling, assessment, monitoring and analysis of the effects of air pollution on forests. Thünen Institute of Forest Ecosystems, Eberswalde, Germany, 32 p + Annex [http://www.icp-forests.org/manual.htm]
CLRTAP (2004) Manual on methodologies and criteria for modelling and mapping critical loads and levels of air pollution effects, risks and trends. Convention on Long-range Transboundary Air Pollution, pp 251
EEA (2016) Emissions of the main air pollutants in Europe — European Environment Agency, Copenhagen, Denmark. [https://www.eea.europa.eu/data-and-maps/indicators/main-anthropogenic-air-pollutant-emissions/]
König N, Kowalska A, Brunialti G, Ferretti M, Clarke N, Cools N, Derome J, Derome K, De Vos B, Fuerst A, Jakovljevič T, Marchetto A, Mosello R, O’Dea P, Tartari GA, Ulrich E (2016) Part XVI: Quality Assurance and Control in Laboratories. In: UNECE ICP Forests Programme Co-
ordinating Centre (ed): Manual on methods and criteria for harmonized sampling, assessment, monitoring and analysis of the effects of air pollution on forests. Thünen Institute of Forest Ecosystems, Eberswalde, Germany, 46 p. + Annex [http://www.icp-forests.org/manual.htm]
Meunier CL, Gundale MJ, Sánchez IS, Liess A (2016) Impact of nitrogen deposition on forest and lake food webs in nitrogen-limited environments. Glob Change Biol 22: 164–179
Mosello R, Amoriello M, Amoriello T, Arisci S, Carcano A, Clarke N, Derome J, Koenig N, Tartari G, Ulrich E (2005) Validation of chemical analyses of atmospheric deposition in forested European sites. J Limnol 64:93–102
Mosello R, Amoriello T, Benham S, Clarke N, Derome J, Derome K, Genouw G, Koenig N, Orrù A, Tartari G, Thimonier A, Ulrich E, Lindroos A (2008) Validation of chemical analyses of atmospheric deposition on forested sites in Europe: 2. DOC concentration as an estimator of the organic ion charge. J Limn 67:1–14
Silva LCR, Gómez-Guerrero A, Doane TA, Horwath WR (2015) Isotopic and nutritional evidence for species- and site-specific responses to N deposition and elevated CO2 in temperate forests. J Geophys Res Biogeosci 120:1110–1123
Waldner P, Marchetto A, Thimonier A, Schmitt M, Rogora M, Granke O, Mues V, Hansen K, Pihl Karlsson G, Žlindra D, Clarke N, Verstraeten A, Lazdins A, Schimming C, Iacoban C, Lindroos AJ, Vanguelova E, Benham S, Meesenburg H, Nicolas M, Kowalska A, Apuhtin V, Napa U, Lachmanová Z, Kristoefel F, Bleeker A, Ingerslev M, Vesterdal L, Molina J, Fischer U, Seidling W, Jonard M, O’Dea P, Johnson J, Fischer R, Lorenz M (2014) Detection of temporal trends in atmospheric deposition of inorganic nitrogen and sulphate to forests in Europe. Atmos Environ 95:363–374
32 | 2018 Technical Report of ICP Forests
6 HOMOGENISING VOLUME CALCULATIONS WITHIN THE GROWTH SURVEY Tom Levanič, Tanja GM Sanders, Inken Krüger, Florian Skonieczny
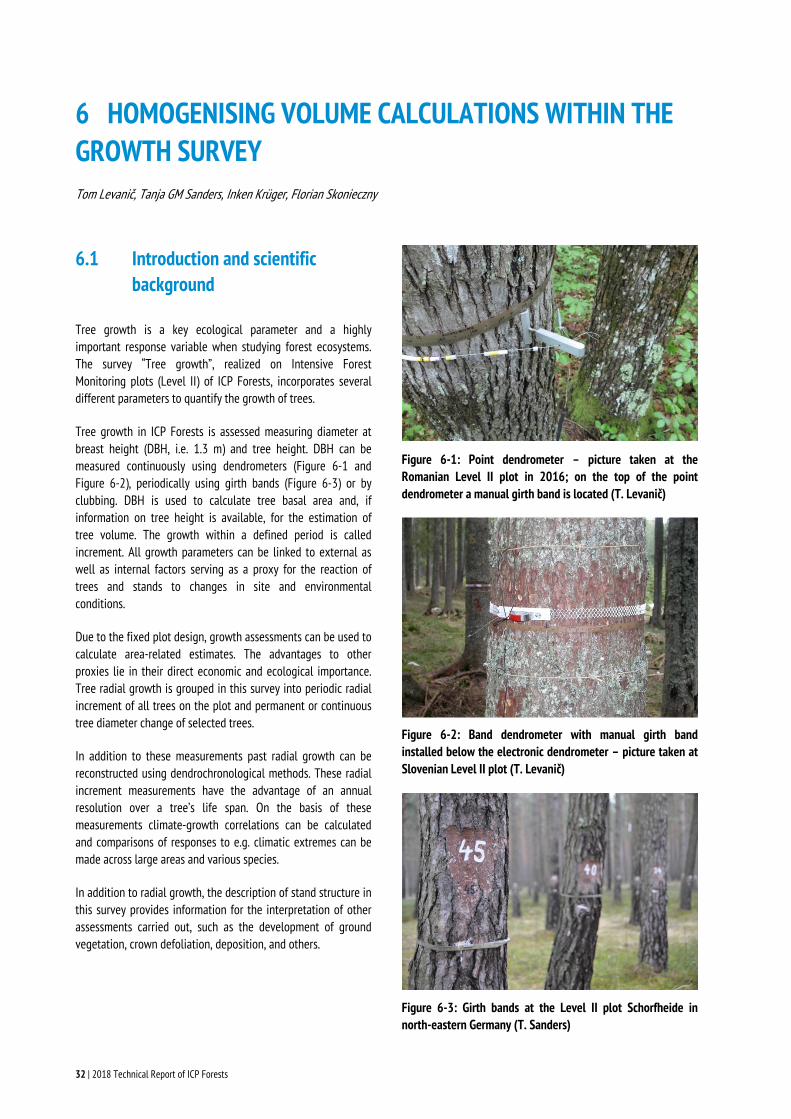
6.1 Introduction and scientific background
Tree growth is a key ecological parameter and a highly important response variable when studying forest ecosystems. The survey “Tree growth”, realized on Intensive Forest Monitoring plots (Level II) of ICP Forests, incorporates several different parameters to quantify the growth of trees.
Tree growth in ICP Forests is assessed measuring diameter at breast height (DBH, i.e. 1.3 m) and tree height. DBH can be measured continuously using dendrometers (Figure 6-1 and Figure 6-2), periodically using girth bands (Figure 6-3) or by clubbing. DBH is used to calculate tree basal area and, if information on tree height is available, for the estimation of tree volume. The growth within a defined period is called increment. All growth parameters can be linked to external as well as internal factors serving as a proxy for the reaction of trees and stands to changes in site and environmental conditions.
Due to the fixed plot design, growth assessments can be used to calculate area-related estimates. The advantages to other proxies lie in their direct economic and ecological importance. Tree radial growth is grouped in this survey into periodic radial increment of all trees on the plot and permanent or continuous tree diameter change of selected trees.
In addition to these measurements past radial growth can be reconstructed using dendrochronological methods. These radial increment measurements have the advantage of an annual resolution over a tree’s life span. On the basis of these measurements climate-growth correlations can be calculated and comparisons of responses to e.g. climatic extremes can be made across large areas and various species.
In addition to radial growth, the description of stand structure in this survey provides information for the interpretation of other assessments carried out, such as the development of ground vegetation, crown defoliation, deposition, and others.
Figure 6-1: Point dendrometer – picture taken at the Romanian Level II plot in 2016; on the top of the point dendrometer a manual girth band is located (T. Levanič)
Figure 6-2: Band dendrometer with manual girth band installed below the electronic dendrometer – picture taken at Slovenian Level II plot (T. Levanič)
Figure 6-3: Girth bands at the Level II plot Schorfheide in north-eastern Germany (T. Sanders)

Over the lrepeatedly parametersthe calculacalculate vis particulacarbon stor
However, oof volumdevelopmecalculate sproblem, wEurope-widcompared
Figure 6-4
last 10 years 53y (Figure 6-4). Os. Some of themation of tree v
volume per tree arly important forage, and carbon
one of the diffice data across
ent, every couspecies-specific when one wande level. To evathe volume eq
4: Level II plots w
35 plots were aOn each plot wm (DBH and heivolume. Therefand subsequen
or the calculation sequestration.
culties of the sus countries. Dntry defined i
volume incremts to compare
aluate the magnquations for fou
where tree grow
assessed, 321 oe collect a numight) are also ufore, it is posstly per plot. Then of the growing
rvey is the compDue to a hisits own equatment. This cangrowing stocks
nitude of this issur species provi
wth was assesse
of them mber of sed for ible to e latter g stock,
parison storical tion to n be a s on a sue we ded by
eisuin
Thvoleinnore
ThdaCzst
ed between 200
© PCC,
ght countries ubmitted their vestigated spec
he main idea iolume calculatiovel instead of formation is not
ot reported; hoelated to site pro
he data pool usatabase extractezech Republic, Aate – Brandenb
08 and 2018
Thünen Institute of F
20
after a requeequations bu
ies.
n the backgrouon function coucountry specifict a mandatory pawever, it is th
oductivity and ch
ed for this comed for six countriAustria and Sweurg from the ICP
Forest Ecosystems
018 Technical Repor
est in 2017. ut these do
und was to tesuld be used onc equations. Moarameter and as
he most importahanges of it in ti
mparative study ies (Germany, Sleden) and one P Forests databa
rt of ICP Forests | 33
More countriesnot cover the
st whether onea Europe-wide
oreover, volumes such it is oftenant informationime and space.
was the growthlovenia, Estonia,German federal
ase.
3
s e
e e e n n
h , l

34 | 2018 Technical Report of ICP Forests
6.2 Comparison of volume equations
Several countries provided their species-specific equations for volume calculation for this comparison study. In the following graphs the country name stands for these specific equations; however, in Germany two approaches were used: Germany stands for the German Federal States using the model BWinPro, while the Federal State of Brandenburg is using a different approach. One data set, compiling submissions from all countries participating in the study, was used. Volumes were then calculated using country-specific equations on a complete data set for four tree species (European beech (Fagus sylvatica L.), silver birch (Betula pendula ROTH), Scots pine (Pinus sylvestris L.) and Norway spruce (Picea abies (L.) H.KARST.) and compared to volumes calculated for each country with their own country-specific equations (referred to as “Reported values”).
Figure 6-5 is presenting calculated volumes for the entire data pool using volume calculation equations used by the countries
for four different tree species and compared to reported values. Differences between country-specific equations for volume calculations are relatively small and statistically non-significant and seem to be very close to the reported values. However, there are obviously Level II plots with trees of extreme dimensions and such plots may be not representative of an average population (Figure 6-5).
To compare the effect of the various equations, the calculated volume is plotted against the measured height (Figure 6-6). The measurement of height has a greater uncertainty and (more or less) stagnates for mature trees due to e.g. hydraulic limitations while DBH (and volume) continues to increase. The ratio between height and DBH here might be more defined by hydraulic limits and species-specific maximum heights at each site. Therefore, the input curve describing the possible height growth within each equation or model varies between countries, which is shown by the widening of the range at the larger volumes and/or decreasing height (Figure 6-6).
Figure 6-5: Comparison of the use of country-specific volume equations for four species using one standardized data set from all countries as well as reported values
0.0
0.5
1.0
1.5
2.0
n = 990
calc
ulat
ed v
olum
e [m
³]
countriesSweden
Estonia
Slovenia
Czech Republic
Brandenburg
Germany
Reported values
Betula pendula
0
5
10
15
20
n = 8963
calc
ulat
ed v
olum
e [m
³] countries
Slovenia
Czech Republic
Brandenburg
Austria
Germany
Reported values
Fagus sylvatica
0
5
10
15
n = 12207
calc
ulat
ed v
olum
e [m
³]
countriesSweden
Estonia
Slovenia
Czech Republic
Brandenburg
Austria
Germany
Reported values
Pinus sylvestris
0
2
4
6
n = 9919
calc
ulat
ed v
olum
e [m
³]
countriesSweden
Estonia
Slovenia
Czech Republic
Brandenburg
Austria
Germany
Reported values
Picea abies

2018 Technical Report of ICP Forests | 35
Figure 6-6: Comparison of the effect on height vs. volume (reported values are those provided by the countries during data submission)
The most important result is that in general the compared equations do not vary significantly for the investigated tree species. Differences observed in the calculated volume sums including all trees of the respective species (Table 6-1 to Table 6-4) are dependent on the equation in the higher height class and the species: for Scots pine the Austrian equation gives the highest calculated volume while the Slovenian equation seems to provide the best match for the various submitted data sets (Table 6-1).
In the case of Picea abies, a majority of country specific equations performed well, with the Austrian equation having the largest difference between the calculated and reported value and the Czech equations having the lowest difference (Table 6-2).
While the volumes of the two coniferous tree species can be calculated with one standard approach with a difference to the reported values below 1%, European beech shows a large variance of around 6% for the Czech calculation method which is the closest match to the reported values (Table 6-3).
Silver birch is not a very common tree species in central and southern Europe, therefore it is no surprise that the Estonian volume calculation equation provides the best match for silver birch (Table 6-4). The majority of volume equations somehow underestimate the volume, while German BDatPro slightly overestimates it, as is also the case with Estonia.
Figure 6-7 summarizes the comparison of the precision of the various equations in predicting tree volume. The lower values show a higher precision which is explained by the variability of the equation in the larger height classes. It is visible from the results that volume estimates for both conifer species (Picea abies and Pinus sylvestris) are not very variable between the countries and all country-specific formulas perform similarly. The biggest differences in volume calculations are for European beech. This is not a surprise and is connected with the shape of the beech stem which is far more complex than conifer stems.
10
20
30
0.0 0.5 1.0calculated volume [m³]
heig
ht
countriesSweden
Estonia
Slovenia
Czech Republic
Brandenburg
Germany
Reported values
Betula pendula
0
10
20
30
40
0 2 4 6 8calculated volume [m³]
heig
ht
countries
Slovenia
Czech Republic
Brandenburg
Austria
Germany
Reported values
Fagus sylvatica
10
20
30
40
50
0 2 4 6calculated volume [m³]
heig
ht
countriesSweden
Estonia
Slovenia
Czech Republic
Brandenburg
Austria
Germany
Reported values
Pinus sylvestris
10
20
30
40
0 1 2 3 4 5calculated volume [m³]
heig
htcountries
Sweden
Estonia
Slovenia
Czech Republic
Brandenburg
Austria
Germany
Reported values
Picea abies
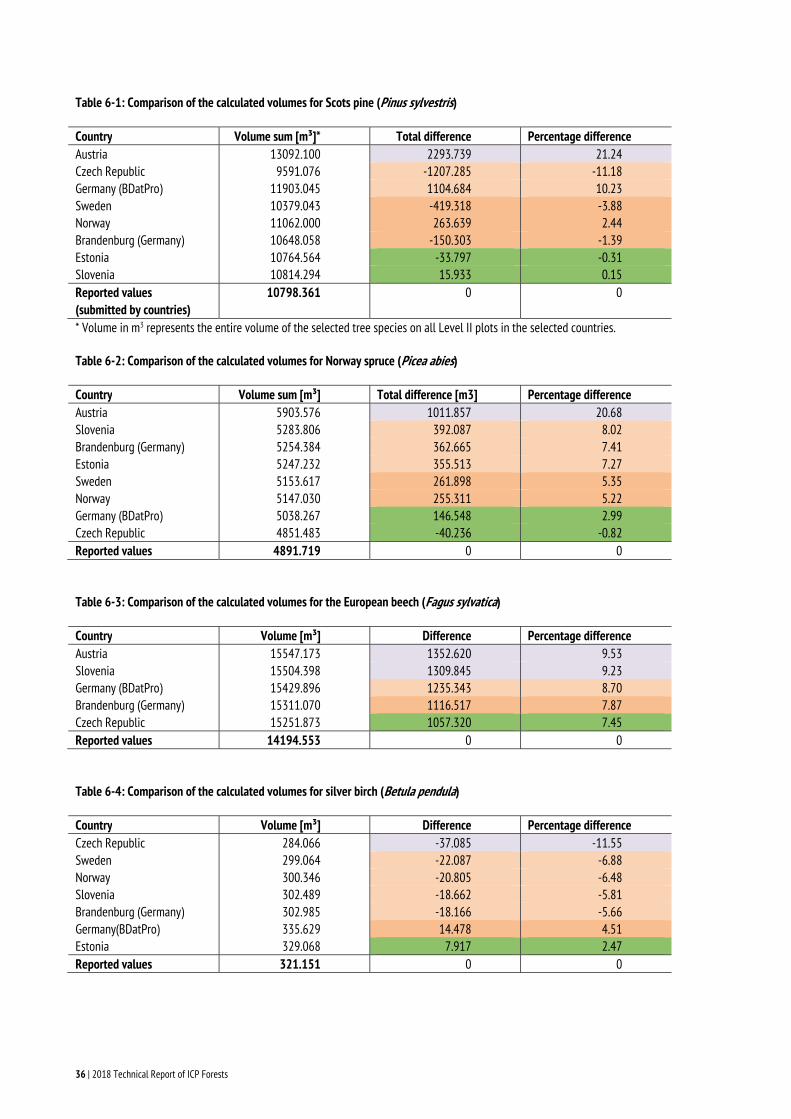
36 | 2018 Technical Report of ICP Forests
Table 6-1: Comparison of the calculated volumes for Scots pine (Pinus sylvestris)
Country Volume sum [m³]* Total difference Percentage difference Austria 13092.100 2293.739 21.24 Czech Republic 9591.076 -1207.285 -11.18 Germany (BDatPro) 11903.045 1104.684 10.23 Sweden 10379.043 -419.318 -3.88 Norway 11062.000 263.639 2.44 Brandenburg (Germany) 10648.058 -150.303 -1.39 Estonia 10764.564 -33.797 -0.31 Slovenia 10814.294 15.933 0.15 Reported values (submitted by countries)
10798.361 0 0
* Volume in m3 represents the entire volume of the selected tree species on all Level II plots in the selected countries.
Table 6-2: Comparison of the calculated volumes for Norway spruce (Picea abies)
Country Volume sum [m³] Total difference [m3] Percentage difference Austria 5903.576 1011.857 20.68 Slovenia 5283.806 392.087 8.02 Brandenburg (Germany) 5254.384 362.665 7.41 Estonia 5247.232 355.513 7.27 Sweden 5153.617 261.898 5.35 Norway 5147.030 255.311 5.22 Germany (BDatPro) 5038.267 146.548 2.99 Czech Republic 4851.483 -40.236 -0.82 Reported values 4891.719 0 0
Table 6-3: Comparison of the calculated volumes for the European beech (Fagus sylvatica)
Country Volume [m³] Difference Percentage difference Austria 15547.173 1352.620 9.53 Slovenia 15504.398 1309.845 9.23 Germany (BDatPro) 15429.896 1235.343 8.70 Brandenburg (Germany) 15311.070 1116.517 7.87 Czech Republic 15251.873 1057.320 7.45 Reported values 14194.553 0 0
Table 6-4: Comparison of the calculated volumes for silver birch (Betula pendula)
Country Volume [m³] Difference Percentage difference Czech Republic 284.066 -37.085 -11.55 Sweden 299.064 -22.087 -6.88 Norway 300.346 -20.805 -6.48 Slovenia 302.489 -18.662 -5.81 Brandenburg (Germany) 302.985 -18.166 -5.66 Germany(BDatPro) 335.629 14.478 4.51 Estonia 329.068 7.917 2.47 Reported values 321.151 0 0
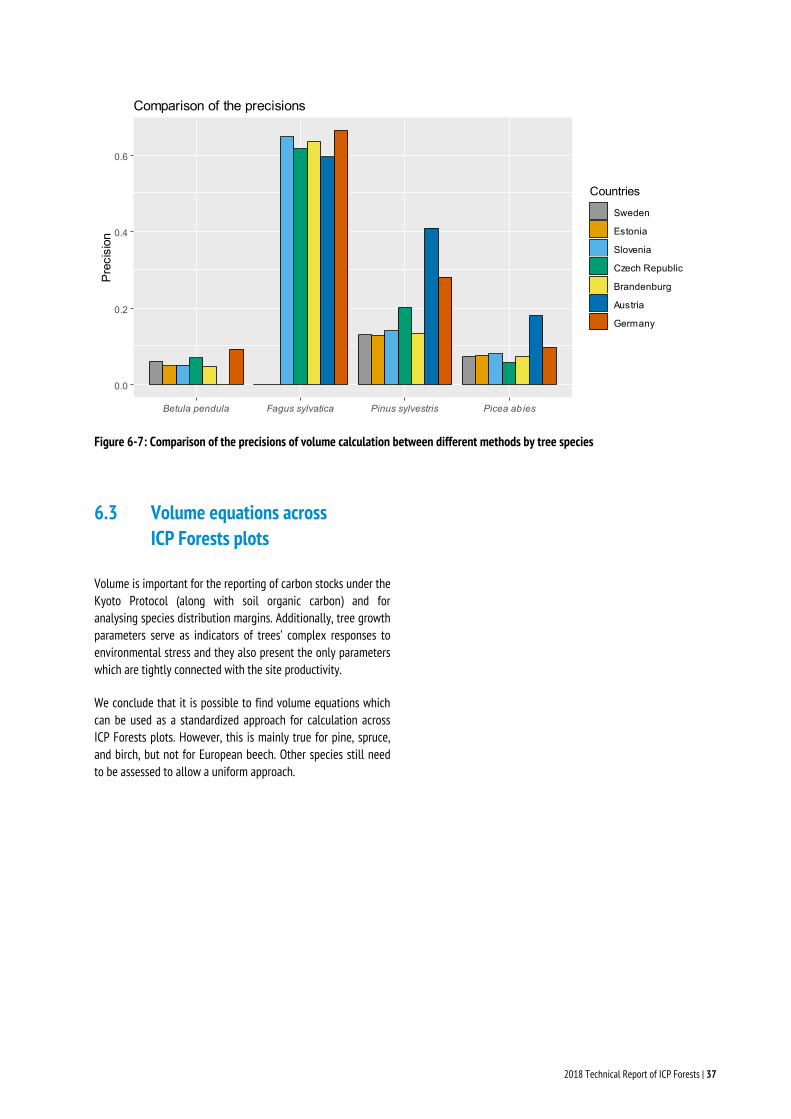
2018 Technical Report of ICP Forests | 37
Figure 6-7: Comparison of the precisions of volume calculation between different methods by tree species
6.3 Volume equations across ICP Forests plots
Volume is important for the reporting of carbon stocks under the Kyoto Protocol (along with soil organic carbon) and for analysing species distribution margins. Additionally, tree growth parameters serve as indicators of trees’ complex responses to environmental stress and they also present the only parameters which are tightly connected with the site productivity.
We conclude that it is possible to find volume equations which can be used as a standardized approach for calculation across ICP Forests plots. However, this is mainly true for pine, spruce, and birch, but not for European beech. Other species still need to be assessed to allow a uniform approach.
0.0
0.2
0.4
0.6
Betula pendula Fagus sylvatica Pinus sylvestris Picea ab ies
Prec
isio
n
Countries
Sweden
Estonia
Slovenia
Czech Republic
Brandenburg
Austria
Germany
Comparison of the precisions

38 | 2018 Technical Report of ICP Forests
7 TREE CROWN CONDITION IN 2017 Nenad Potočić, Volkmar Timmermann, Mladen Ognjenović
7.1 Introduction and scientific background
Tree crown defoliation and occurrence of biotic and abiotic damage are important indicators of forest health. As such, they are considered within the Criterion 2, “Forest health and vitality”, one of the six criteria adopted by Forest Europe (formerly the Ministerial Conference on the Protection of Forests in Europe – MCPFE) to provide information for sustainable forest management in Europe1.
Defoliation surveys are conducted in combination with detailed assessments of biotic and abiotic damage causes. Unlike assessments of tree damage, which can in some instances trace the tree damage to a single cause, defoliation is an unspecific parameter of tree vitality, which can be affected by a number of anthropogenic and natural factors. Combining the assessment of damage symptoms and their causes with observations of defoliation allows for a better insight into the condition of trees, and the interpretation of the state of European forests and its trends in time and space is made easier.
This chapter presents results from the crown condition assessments on the large-scale, representative, transnational monitoring network (Level I) of ICP Forests carried out in 2017, as well as long-term trends for the main species and species groups.
7.2 Methods of the 2017 survey
The assessment of tree condition in the transnational Level I network is conducted according to European-wide, harmonized methods described in the ICP Forests Manual by Eichhorn et al. (2016, see also Eichhorn and Roskams 2013). Regular national calibration trainings of the survey teams and international cross-comparison courses (ICCs) ensure the quality of the data and comparability across the participating countries (e.g. Dobbertin et al. 1997, Eickenscheidt 2015).
1http://www.foresteurope.org/docs/MC/MC_lisbon_resolution_annex1.pdf
Defoliation Defoliation is the key parameter of tree condition within forest monitoring describing a loss of needles or leaves in the assessable crown compared to a local reference tree in the field or an absolute, fully foliated reference tree from a photo guide. Defoliation is estimated in 5% steps, ranging from 0% (no defoliation) to 100% (dead tree). Defoliation values are grouped into five classes (Table 7-1). In the maps presenting the mean plot defoliation and in Table 7-4, class 2 is subdivided into class 2-1 (> 25–40%) and class 2-2 (> 40–60% defoliation).
Table 7-1: Defoliation classes
Defoliation class Needle/leaf loss Degree of defoliation
0 up to 10% None 1 > 10–25% Slight
(warning stage) 2 > 25–60% Moderate 3 > 60–< 100% Severe 4 100% Dead Table 7-2 shows countries and the number of plots assessed for crown condition parameters from 2008 to 2017, and the total number of sample trees submitted in 2017. The number of trees used for analyses differs from the number of submitted trees due to the application of various data selection procedures. Both the number of plots and the number of trees vary in the course of time, for example due to mortality or changes in the sampling design.
Damage cause assessments The damage cause assessment of trees consists of three major parts. For a detailed description, please refer to Eichhorn et al. (2016) and Timmermann et al. (2016).
− Symptom description Three main categories indicate which parts of a tree are affected: (a) leaves/needles; (b) branches, shoots, buds and fruits; and (c) stem and collar. A further specification of the affected part along with a symptom description is given.
− Determination of the damage cause (causal agents / factors) The main groups of causal agents are insects, fungi, abiotic factors, game and grazing, direct action of man, fire and atmospheric pollutants. In each group, a more detailed description is possible through a hierarchical coding system.

2018 Technical Report of ICP Forests | 39
Table 7-2: Number of plots assessed for crown condition parameters from 2008 to 2017 in countries with at least one Level I crown condition survey since 2008, and total number of sample trees submitted in 2017
Country
Plots2008 2009 2010 2011 2012 2013 2014 2015 2016 2017
Trees 2017
Andorra 3 3 3 3 3 11 11 12
Austria 135
Belarus 400 409 410 416 373 377
Belgium 26 26 9 9 8 8 8 8 53 53 562
Bulgaria 98 159 159 159 159 159 159 159 159 160 5588
Croatia 84 83 83 92 100 105 103 95 99 99 2376
Cyprus 15 15 15 15 15 15 15 15
Czechia 136 133 132 136 135 138 136 136 135 3375
Denmark 19 16 17 18 18 18 18 18 17 17 399
Estonia 92 92 97 98 97 96 96 97 98 98 2406
Finland 475 886 932 717 785
France 508 500 532 544 553 550 545 542 533 527 10719
Germany 423 412 411 404 415 417 422 424 421 416 9968
Greece 97 98 57 47 23 36 853
Hungary 72 73 71 72 74 68 68 67 67 66 1481
Ireland 31 32 29 20
Italy 236 252 253 253 245 247 244 234 246 247 5522
Latvia 92 207 207 203 203 115 116 116 115 115 1754
Lithuania 70 72 75 77 77 79 81 81 82 82 1958
Luxembourg 4 4 4 4 4 3 72
Rep. of Moldova 9 216
Montenegro 49 49 49 49 49 49 1176
Netherlands 11 11
Norway 481 487 491 496 496 618 687 554 629 630 5234
Poland 453 376 374 367 369 364 365 361 353 352 7012
Romania 227 239 242 241 236 241 242 243 246 6081
Russian Fed. 365 288 295
Serbia 123 122 121 119 121 121 128 127 127 126 2928
Slovakia 108 108 108 109 108 108 107 106 103 103 4561
Slovenia 44 44 44 44 44 44 44 44 44 44 1084
Spain 607 620 620 620 620 620 620 620 620 14880
Sweden 857 830 640 609 740 842 839 701 618 2208
Switzerland 48 48 48 47 47 47 47 47 47 47 1050
Turkey 396 560 554 563 578 583 531 591 586 598 13905
United Kingdom 76
TOTAL 5057 7292 7521 6807 6189 5795 5697 5343 5555 5496 107368

40 | 2018 Technical Report of ICP Forests
− Quantification of symptoms (damage extent) The extent is the estimated damage to a tree, specifying the percentage of affected leaves/needles, branches or stem circumference due to the action of the causal agent or factor.
Additional parameters Several other tree, stand and site parameters are assessed, providing additional information for analysis of the crown condition data. For the full information, please refer to Eichhorn et al. (2016). Analysis of these parameters is not within the scope of this report.
Tree species For the analyses in this report, the results for the four most abundant species are shown separately in figures and tables. Fagus sylvatica is analysed together with F. sylvatica ssp. moesiaca. Some species belonging to the Pinus and Quercus genus were combined into species groups as follows:
− Mediterranean lowland pines (Pinus brutia, P. halepensis, P. pinaster, P. pinea)
− Deciduous temperate oaks (Quercus petraea and Q. robur)
− Deciduous (sub-) Mediterranean oaks (Quercus cerris, Q. frainetto, Q. pubescens, Q. pyrenaica)
− Evergreen oaks (Quercus coccifera, Q. ilex, Q. rotundifolia, Q. suber).
On all Level I plots assessed for defoliation in 2017, Pinus sylvestris was the most abundant tree species (16.5% of all trees), followed by Picea abies (12.0%), Fagus sylvatica (11.7%), Pinus nigra (5.1%), Quercus petraea (4.3%), Q. robur (4.2%), Q. ilex (3.7%), Q. cerris (3.2%), Pinus brutia (3.0%) Pinus halepensis (2.4%), Betula pubescens (2.3%), Quercus pubescens (2.2%), Abies alba (2.1%), Betula pendula (2.0%) and Pinus pinaster (1.9%). Most Level I plots with crown condition assessments contained one (48.3%) or two to three (38.8%) tree species per plot. On 10.7% of plots four to five tree species were assessed, and only 2.2% of the plots featured more than five tree species. In 2017, 50.3% of the assessed trees were broadleaves and 49.7% conifers. The species percentages differ slightly for damage assessments, as selection of trees for assessments in participating countries varies.
Statistical analyses For calculations, selection procedures were applied in order to include only correctly coded trees in the sample (Tables 7-4 and 7-5). For the calculation of the mean plot defoliation of all species, only plots with a minimum number of three trees were analysed. For analyses at species level, three trees per species had to be present per plot. These criteria are consistent with earlier evaluations (e.g. Wellbrock et al. 2014, Becher et al.
2014) and partly explain the discrepancy between the number of trees in Table 7-3 and in the online supplementary material1.
Trends in defoliation were calculated according to Sen (1968) and their significance tested by the non-parametric Mann-Kendall test (tau). These methods are appropriate for monotonous, single-direction trends without the need to assume any particular distribution of the data. Due to their focus on median values and corresponding robustness against outliers (Sen 1968, Drápela & Drápelová 2011, Curtis & Simpson 2014), the results are less affected by single trees or plots with unusually high or low defoliation. The regional Sen’s slopes for Europe were calculated according to Helsel & Frans (2006). For both the calculation of Mann-Kendall’s tau and the plot-related as well as the regional Sen’s slopes, the rkt package (Marchetto 2015) was used.
Figures 7-2a-j show (1) the annual mean defoliation per plot, (2) the mean across plots and (3) the trend of defoliation based on the regional Sen’s slope calculations for the period 1998–2017. For the Mann-Kendall test, a significance level of p ≤ 0.05 was applied. All Sen’s slope calculations and yearly over-all mean defoliation values were based on consistent plot selections with a minimum of three trees per species and per plot. Maps of defoliation trends for the period 2011–2017 can be found in the online supplementary material1. For all trend calculations plots were included if assessments were available for at least 80% of the period of interest. All queries and statistical analyses were conducted in R/RStudio software environment (R Core Team 2016).
National surveys In addition to the transnational surveys, national surveys are conducted in many countries, relying on denser national grids and aiming at the documentation of forest condition and its development in the respective country (Table 7-3). Since 1986, various densities of national grids (1x1 km to 32x32 km) have been used due to differences in the size of forest area, structure of forests and forest policies. The results of defoliation assessments on national grids are presented in the online supplementary material1. Comparisons between the national surveys of different countries should be made with great care because of differences in species composition, site conditions, and methods applied.
1 http://icp-forests.net/page/icp-forests-technical-report

2018 Technical Report of ICP Forests | 41
Table 7-3: Information on the monitoring design for the national crown condition surveys in the participating countries in 2017
Country Total area (1000 ha)
Forest area (1000 ha)
Area surveyed
(1000 ha)
Coniferous forest
(1000 ha)
Broadleaf forest
(1000 ha)
Grid size (km x km)
No. of sample
plots
No. of sample
treesAlbania No data available for 2017
Andorra 47 18 18 15 2 4x4 12 288
Austria No data available for 2017
Belarus No data available for 2017
Belgium-Flanders 1351 146 146 4x4 71 1538
Belgium-Wallonia 1684 555 224 260 varying 45 375
Bulgaria 11100 4231 4231 1259 2972 4x4/16x16 160 5588
Croatia 5654 16x16 99 2376
Cyprus 925 298 138 172 0 16x16 15 360
Czechia 7887 2666 2666 1956 710 16x16 135 5060
Denmark 4310 624 300 292 varying 336 1765
Estonia 4510 2312 2312 1164 1148 16x16 98 2406
Finland No data available for 2017
France 54883 15840 13100 4041 9884 532 10812
Germany 35721 16x16 416 10002
Greece 13195 6513 6513 1430 5083 16x16 36 855
Hungary 9300 1939 1939 202 1737 16x16 77 1844
Ireland No data available for 2017
Italy 30128 10345 6323 1664 4659 16x16 247 4783
Latvia 6459 3223 3223 1403 1820 16x16 115 1741
Lithuania 6529 2190 2058 1145 913 4x4/16x16 1031 6057
Luxembourg 259 91 86 27 59 4x4 50 1200
FYRO Macedonia No data available for 2017
Rep. of Moldova 3384 401 375 8 367 2x2 618 14233
Montenegro 1381 827 827 207 620 16x16 49 1176
Netherlands No data available for 2017
Norway 32376 12100 12100 7184 4916 3x3 1763 9774
Poland 31268 9215 9215 6315 2900 8x8 2009 40180
Portugal No data available for 2017
Romania 23839 6233 6233 1873 4360 16x16 245 5877
Russian Fed. No data available for 2017
Serbia 8836 2360 1868 179 2181 4x4/16x16 130 2923
Slovakia 4904 2014 2014 768 1246 16x16 103 3737
Slovenia 2014 1248 1248 16x16 44 1056
Spain 49880 18289 15872 6767 10059 16x16 620 14880
Sweden 40800 28132 17415 14806 1285 varying 3452 7965
Switzerland 4129 1279 778 501 47 1044
Turkey 77846 21537 9057 13158 8379 16x16 598 13792
Ukraine No data available for 2017
United Kingdom No data available for 2017
TOTAL 13 153 173 687

42 | 2018 Technical Report of ICP Forests
7.3 Results of the transnational crown condition survey
Defoliation
The transnational defoliation survey in 2017 was conducted on 5 496 plots in 26 countries (Table 7-2). In total, 101 779 trees were assessed in the field for defoliation (Table 7-4).
The overall mean defoliation for all species was 21.7% in 2017; there was a slight increase in defoliation for both conifers and broadleaves in comparison with 2016 (Table 7-4). Broadleaved trees showed a higher mean defoliation than coniferous trees (22.7% vs. 20.7%). Correspondingly, conifers had a higher frequency of trees in the defoliation classes ‘none’ or ‘slight’ (77.8%) than broadleaves (72.7%) and a lower frequency of dead trees (0.5 vs. 0.6%).
Among the main tree species and tree species groups, evergreen oaks and deciduous temperate oaks displayed the highest mean defoliation (28.1% and 23.9%, respectively). Norway spruce had the lowest mean defoliation (20.2%) followed by Austrian pine
and common beech with 20.5% each. Scots pine had the highest percentage (79.5%) of trees with ≤ 25% defoliation, while evergreen oaks had the lowest (60.8%). The strongest increase in defoliation from 2016 to 2017 occurred in evergreen oaks (+2.9%) while common beech had the largest decrease in defoliation (-1.5%) but overall, the differences in defoliation between 2016 and 2017 are not very large.
Mean defoliation of all species at plot level in 2017 is shown in Figure 7-1. Almost three quarters (70.9%) of all plots had a mean defoliation up to 25%, and only 0.8 % of the plots showed severe defoliation (more than 60%). Plots with mean defoliation over 40% were primarily located in southern (Mediterranean) France, northern Italy, parts of Spain, south Wallonia, southwest Croatia, western Bulgaria and the Czech Republic. Plots with low mean defoliation were found across Europe, but mainly in south-eastern Norway, Estonia, Latvia, northern Germany, Romania, central Serbia and Turkey.
The following sections describe the species-specific mean plot defoliation in 2017 and the over-all trend and yearly mean plot defoliation from 1995 to 2017. For maps on defoliation of individual tree species in 2017, please refer to the online supplementary material1.
Table 7-4: Percentage of trees assessed in 2017 according to defoliation classes 0-4 (class 2 subdivided), mean defoliation for the main species or species groups (change from 2016 in parentheses) and the number of trees in each group. Dead trees were included when calculating mean defoliation.
Main species or species groups Class 0 0-10
Class 1>10-25
Class 2-1>25-40
Class 2-2>40-60
Class 3>60
Class 4 dead
Mean defoliation
No. of trees
Common beech (Fagus sylvatica) 35.7 40.0 16.6 5.1 2.6 0.2 20.5 (-1.5) 12 247Deciduous temperate oaks 23.5 44.2 23.0 6.9 2.4 0.3 23.9 (+0.2) 9 063Dec. (sub-) Mediterranean oaks 30.7 44.6 16.6 5.6 2.6 0.4 21.3 (+1.0) 8 007Evergreen oaks 4.8 56.0 27.2 8.5 3.5 0.2 28.1 (+2.9) 4 607Other broadleaves 31.7 43.6 14.9 5.6 4.2 1.3 22.9 (+0.4) 17 263Scots pine (Pinus sylvestris) 26.2 53.3 14.3 4.2 2.0 0.6 21.2 (+0.4) 17 286Norway spruce (Picea abies) 36.7 38.0 17.7 5.5 2.0 0.5 20.2 (-0.1) 12 497Austrian pine (Pinus nigra) 35.2 42.5 14.7 5.2 2.4 0.2 20.5 (+0.5) 5 303Mediterranean lowland pines 17.9 58.9 16.8 5.0 1.4 0.5 22.5 (+0.9) 8 229Other conifers 41.5 38.8 13.6 4.1 2.1 0.3 18.6 (-0.2) 7 277TOTAL Broadleaves 28.6 44.1 18.1 6.0 3.2 0.6 22.7 (+0.2) 51 187Conifers 30.6 47.2 15.5 4.7 1.9 0.5 20.7 (+0.3) 50 592All species 29.4 45.4 16.7 5.3 2.6 0.5 21.7 (+0.3) 101 779
1 http://icp-forests.net/page/icp-forests-technical-report

2018 Technical Report of ICP Forests | 43
Figure 7-1: Mean plot defoliation of all species in 2017
© PCC, Thünen Institute of Forest Ecosystems

44 | 2018 Technical Report of ICP Forests
Figures 7-2 a-e: Over-all trend (orange line) and annual mean defoliation across plots (black line) at Level I plots from 1998–2017; points represent annual plot mean values, for clarity these are not interconnected from year to year: (a) Scots pine (regional Sen’s slope = 0.064, p = 0.381) (b) Norway spruce (regional Sen’s slope = 0.070, p = 0.035) (c) Austrian pine (regional Sen’s slope = 0.230, p = 0.010) (d) Mediterranean lowland pines (regional Sen’s slope = 0.371, p < 0.001) (e) other conifers (regional Sen’s slope = 0.081, p < 0.001)

2018 Technical Report of ICP Forests | 45
Figures 7-2 f-j: Over-all trend (orange line) and annual mean defoliation across plots (black line) at Level I plots from 1998–2017; points represent annual plot mean values, for clarity these are not interconnected from year to year: (f) Common beech (regional Sen’s slope = 0.118, p < 0.012) (g) Deciduous temperate oaks (regional Sen’s slope = 0.065, p = 0.347) (h) Deciduous (sub-) Mediterranean oaks (regional Sen’s slope = 0.003, p < 0.871) (i) Evergreen oaks (regional Sen’s slope = 0.329, p < 0.001) (j) other broadleaves (regional Sen’s slope = 0.283, p < 0.001)

46 | 2018 Technical Report of ICP Forests
Scots pine
Scots pine (Pinus sylvestris) was the most frequently assessed tree species in the Level I network in 2017. It has a wide ecological niche due to its ability to grow on dry and nutrient poor soils and has frequently been used for reforestation. Scots pine is found over large parts of Europe from northern Scandinavia to the Mediterranean region and from Spain to Turkey (and is also distributed considerably beyond the UNECE region).
More than three-fourths of the Scots pine plots (79.0%) showed no or only slight defoliation (≤ 25% defoliation; please refer to the online supplementary material1, Figure S1-1). Defoliation on 20.6% of the plots was moderate (>25-60% defoliation) and on 0.4% of the plots severe. Plots with the lowest mean defoliation were primarily found in southern Norway, eastern Germany, Estonia and northern Turkey, whereas plots with comparably high defoliation were located in Czechia, western Slovakia, south-eastern France, and western Bulgaria.
There has been no significant over-all trend in mean plot defoliation for Scots pine for the past 20 years (Figure 7-2a). The mean defoliation across plots showed some fluctuation at the beginning and at the end of the chosen reporting period, with slightly increasing mean defoliation values since 2013.
Norway spruce
Norway spruce (Picea abies) is the second most frequently assessed species on the Level I plots. The area of its distribution within the participating countries ranges from Scandinavia to northern Italy and from north-eastern Spain to Romania. Favouring cold and humid climate, Norway spruce at the southern edge of its distribution area is found only at higher elevations. Norway spruce is very common in forest plantations effectively enlarging its natural distribution range.
In 2017, 68.8% of the Norway spruce plots had mean defoliation less than or equal to 25% (please refer to the online supplementary material1, Figure S1-2). As much as 27.8% of all Norway spruce plots showed a defoliation of up to 10%. Defoliation on 30.5% of the plots was moderate (>25-60% defoliation) and severe defoliation was recorded on only 0.7% of the plots. Plots with low mean defoliation were found e.g. in Norway, Romania and scattered across central Europe. Clusters of plots with high mean defoliation values were mainly found in Slovenia, south-west Germany, and throughout Norway and Sweden.
The over-all 20-year trend in mean plot defoliation of Norway spruce has been slightly increasing and significant (Figure 7-2b). The annual mean values did not deviate much from the trend line except in 2013.
Austrian (Black) pine
Austrian pine (Pinus nigra) is one of the most important native conifers in southern Europe, growing predominantly in mountain areas from Spain in the west to Turkey in the east, with scattered occurrences as far north as central France and northern Hungary. This species can grow in both dry and humid habitats with considerable tolerance for temperature fluctuations. Two subspecies are recognized, along with a number of varieties, adapted to different environmental conditions.
In general, Austrian pine shows very good vitality, with mean defoliation of up to 25% on 76.4% of the plots (please refer to the online supplementary material1, Figure S1-3). Defoliation was moderate on 23.2% of the plots (>25-60% defoliation) and severe on 0.4% of the plots. Plots with less than 10% mean defoliation were mostly located in Turkey. Plots with higher defoliation were mostly located in parts of France, Spain, Croatia, Hungary, and Bulgaria.
The over-all 20-year trend in defoliation of Austrian pine has been increasing on average by 2.3 percentage points every 10 years with high statistical significance (Figure 7-2c). From 2011 to 2014 the annual mean plot defoliation was lower than the trend, but in the last two years defoliation has again been increasing (the large deviation in 2015 was caused by a lack of data from Spain).
Mediterranean lowland pines
Four pine species are included in the group of Mediterranean lowland pines: Aleppo pine (Pinus halepensis), maritime pine (P. pinaster), stone pine (P. pinea), and Turkish pine (P. brutia). Most plots dominated by Mediterranean lowland pines are located in Spain, France, and Turkey, but they are also important species in other Mediterranean countries. Aleppo and maritime pine are more abundant in the western parts, and Turkish pine in the eastern parts of this area.
In 2017, 71.8% of Mediterranean lowland pine plots had mean defoliation of up to 25% (please refer to the online supplementary material1, Figure S1-4), while 10% of plots had defoliation up to 10%. Most of them were located in Turkey and Spain. Plots with moderate to severe mean defoliation values (>40% defoliation) were mostly located in the proximity to the coastline of the Mediterranean Sea.
For Mediterranean lowland pines there has been an average increase in the trend of mean plot defoliation of almost 4 percentage points every 10 years, and this trend is highly significant (Figure 7-2d). The deviations from the trend are similar to those of Austrian pine.
1 http://icp-forests.net/page/icp-forests-technical-report

2018 Technical Report of ICP Forests | 47
Common beech
Common beech (Fagus sylvatica) is the most frequently assessed deciduous tree species within the ICP Forests monitoring programme. It is found on Level I plots from southern Scandinavia in the North to southernmost Italy, and from the Atlantic coast of northern Spain in the West to the Bulgarian Black Sea coast in the East.
In 2017, there were as much as 25.7% of common beech plots with less than 10% mean plot defoliation, a considerable improvement from last year. Most of them were located in Romania and Serbia (please refer to the online supplementary material1, Figure S1-5). On almost half of the monitored plots (45.9%), trees were slightly defoliated (>10–25% defoliation). There were 7.0% of plots with mean defoliation >40–60%, and 1.3% with severe defoliation (>60%). Plots with severe defoliation were predominantly located in southern and western France, central and southern Germany, and northern Italy, with a noticeable gradient of increasing defoliation from east to west.
The over-all 20-year trend in mean plot defoliation of common beech has been slightly but significantly increasing by 1.2 percentage points every 10 years (Figure 7-2e). There were two larger deviations from this trend, in 2004 and 2016. In 2004, the annual over-all mean defoliation was higher than the trend as a result of the drought in the preceding year which affected large parts of Europe (Ciais et al. 2005, Seidling 2007, Seletković et al. 2009). In 2017, the mean value was again close to the trendline.
Deciduous temperate oaks
Deciduous temperate oaks include pedunculate and sessile oak (Quercus robur and Q. petraea) and their hybrids. They cover a large geographical area in the UNECE region: from southern Scandinavia to southern Italy and from the northern coast of Spain to the eastern parts of Turkey.
In 2017, mean defoliation was up to 25% on more than half of the plots (58.5%), moderate mean defoliation (>25–60% defoliation) was recorded on 41.1% of plots and severe defoliation (more than 60% defoliation) on 0.5% of the plots (please refer to the online supplementary material1, Figure S1-6). Plots with severe defoliation were located mostly in France, and plots with moderate mean defoliation were scattered throughout Europe.
There has been no significant over-all trend in mean plot defoliation for deciduous temperate oaks in the past 20 years. Generally the changes in the defoliation status are not very fast for deciduous temperate oaks and it typically takes several years for their crown to recover. A good example is the increase of oak defoliation in the drought year 2003, followed by a delayed recovery (Figure 7-2f).
Deciduous (sub-) Mediterranean oaks
The group of deciduous (sub-) Mediterranean oaks includes Turkey oak (Quercus cerris), Hungarian or Italian oak (Q. frainetto), downy oak (Q. pubescens) and Pyrenean oak (Q. pyrenaica). The range of distribution of these oaks is confined to southern Europe, as indicated by their common names.
In 2017, 20.8% of the plots had mean defoliation of up to 10%, and further 46.6% had between 10 and 25% defoliation, yielding a total of 67.4% of the plots with defoliation up to 25%, an improvement compared to the previous year. Almost a third (32.5%) of plots showed moderate mean defoliation, and only 0.2% severe (please refer to the online supplementary material1, Figure S1-7). Plots with lower mean defoliation were located predominantly in the east of the UNECE region, while plots with higher mean defoliation were found in the west, mostly in south-eastern France.
There has been no significant over-all trend in mean plot defoliation for deciduous (sub-) Mediterranean oaks for the past 20 years (Figure 7-2g). Mean plot defoliation values have generally been increasing until 2008, but after that the values have been below or close to the trendline.
Evergreen oaks
The group of evergreen oaks consists of kermes oak (Quercus coccifera), holm oak (Q. ilex), Q. rotundifolia and cork oak (Q. suber). The occurrence of this species group as a typical element of the sclerophyllous woodlands is confined to the Mediterranean basin.
A considerable worsening of the condition of evergreen oaks was recorded in 2017: only on 54.2% of the plots mean defoliation was up to 25% (please refer to the online supplementary material1, Figure S1-8). Moderate defoliation was recorded on 44.1% of plots. The majority of plots with defoliation over 40% were located in southern France, Corsica, and throughout Spain.
Evergreen oaks showed a highly significant increase in the over-all trend of mean plot defoliation of 3.3 percentage points every ten years (Figure 7-2h), which is the highest increase of all analysed species or species groups. The defoliation development pattern for evergreen oaks is characterized by several larger deviations from the trendline, however the mean plot value in 2015 results from the lack of assessments on Spanish plots. In 2017 the over-all plot mean for evergreen oaks has again increased over the trendline.
1 http://icp-forests.net/page/icp-forests-technical-report

48 | 2018 Technical Report of ICP Forests
Damage causes
In 2017, damage cause assessments were carried out on 100 436 trees in 5 358 plots and 25 countries. On 47 948 trees (47.7%) at least one symptom of damage was found, and 595 trees (0.6%) were dead. In total, 68 894 observations of damage were recorded with potentially multiple damage symptoms per tree. On 1 091 plots no damage was found on any tree. The percentage of dead trees is somewhat larger than in the defoliation survey due to the differences in datasets (i.e. not all trees are assessed for both defoliation and damage symptoms).
The number of damage symptoms on any individual tree can be more than one, therefore the number of cases analysed varies depending on the parameter. The average number of recorded damage symptoms per assessed tree was higher for the broadleaved tree species and species groups than for the conifers (Table 7-5). It was highest for evergreen oaks with 1.18 and lowest for Norway spruce with 0.38 symptoms per tree.
Table 7-5: Number of recorded damage symptoms, number of assessed trees and their ratio for the main tree species and species groups. Multiple damage symptoms per tree and dead trees are included.
Main species or species groups N damage symptoms
N trees Ratio
Common beech (Fagus sylvatica) 9 256 10 906 0.85Deciduous temperate oaks 7 810 8 513 0.92Dec. (sub-) Mediterranean oaks 7 121 8 013 0.89Evergreen oaks 5 444 4 609 1.18Other broadleaves 14 252 19 229 0.74Scots pine (Pinus sylvestris) 8 825 16 827 0.52Norway spruce (Picea abies) 4 414 11 663 0.38Austrian pine (Pinus nigra) 3 025 5 306 0.57Mediterranean lowland pines 5 231 8 250 0.63Other conifers 3 516 7 120 0.49TOTAL Broadleaves 43 883 51 270 0.86Conifers 25 011 49 166 0.51ALL SPECIES 68 894 100 436 0.69
Figure 7-3: Percentage of recorded damage symptoms, affecting different parts of a tree. Multiple affected parts per tree were possible. Dead trees are not included (n=68 299)

2018 Technical Report of ICP Forests | 49
Symptom description and damage extent
Most of the reported damage symptoms were observed on the leaves of broadleaved trees (35.4%), followed by twigs and branches (24.4%), and stems (18.3%; Figure 7-3). Needles were also often affected (16.2%), while roots, collar, shoots, buds and fruits were less frequently affected.
More than half (53.0%) of all recorded damage symptoms had an extent of up to 10%, 38.7% had an extent between 10% and 40%, and 8.3% of the symptoms covered more than 40% of the affected part of a tree.
Causal agents and factors responsible for the observed damage symptoms
Insects were the predominant cause of damage and responsible for 26.9% of all recorded damage symptoms (Figure 7-4). Almost half of the symptoms caused by insects were attributed to defoliators (49.0%), the most frequent of all specified damage causes. Leaf miners were responsible for 15.2%, wood borers for 14.3%, and gallmakers for 6.1% of the damage caused by insects.
Abiotic agents were the second major causal agent group responsible for 19.1% of all damage symptoms. Within this agent group, more than half of the symptoms (58.4%) were attributed to drought, while snow and ice caused 7.3%, wind 6.7%, and frost 5.0% of the symptoms.
The third major identified cause of tree damage were fungi with 10.5% of all damage symptoms. Of those, 20.9% showed signs of decay and root rot fungi, followed by canker (20.0%), needle cast and needle rust fungi (14.5%), blight (10.6%) and powdery mildew (9.8%).
Direct action of man, which includes silvicultural operations and mechanical damage from vehicles, accounted for 4.1% of all recorded damage symptoms. The damaging agent group ‘Game and grazing’ was of minor importance (1.1%). Fire caused 0.6% of all damage symptoms. The agent group ‘Atmospheric pollutants’ refers here only to local incidents mainly in connection with factories, power plants, etc. Visible symptoms of direct atmospheric pollution impact, however, were very rare (0.01% of all damage symptoms). Other causal agents were responsible for 9.1% of all reported damage symptoms. Apart from these identifiable causes of damage symptoms, a considerable amount of symptoms (28.6%) could not be identified in the field.
Figure 7-4: Number of damage symptoms according to agent groups and specific agents/factors. Multiple damage symptoms per tree were possible, and dead trees are included (n=68 892). (1) Visible symptoms of direct atmospheric pollution impact only

50 | 2018 Technical Report of ICP Forests
The occurrence of damaging agent groups differed between major species or species groups (Figure 7-5). Insects were the most important damaging agent group for common beech (causing 41.5% of all damage), deciduous temperate oaks (42.0%), deciduous (sub-) Mediterranean oaks (30.9%), and Austrian pine (26.6%), while insect damage was not so common in Scots pine (9.5%) and Norway spruce (6.3%). Abiotic factors caused by far the most damage in evergreen oaks and Mediterranean lowland pines (48.2% each). Fungi were important damaging agents for Austrian pine (17.5%), Scots pine (14.2%), evergreen oaks (12.4%) and deciduous temperate oaks (12.0%). Direct action of man was of little importance in general; it had the highest impact on Norway spruce (12.6%) and Scots pine (8.1%). Damage from game and grazing played a minor role for all species and species groups except for Norway spruce (9.2%). Fire affected mostly Mediterranean conifer species – 1.1% of Austrian pine and 1% of Mediterranean lowland pine trees were affected. The percentage of recorded but unidentified damage symptoms was quite low in evergreen oaks (9.7%) but large for Norway spruce (45.7%), deciduous (sub-) Mediterranean oaks (34.6%), Scots pine (33.5%), and common beech (30.1%).
The most important specific damaging agents for common beech were mining insects (causing 24.4% of the damage symptoms), followed by defoliators (12.7%), drought (4.3%), and frost (3.7%). Defoliators were also frequently causing damage on deciduous temperate oaks (21.0%), while powdery mildew (7.4%), borers (5.2%), and drought (3.6%) were also significant. For deciduous (sub-) Mediterranean oaks, defoliators (12.4%) were the most common damaging agents, followed by drought (9.5%), borers (7.9%), and gallmakers (5.1%). Drought was by far the most important damaging agent for evergreen oaks (44.8%), but also borers (12.6%), decay and root rot fungi (8.4%) and defoliators (5.8%) had a large impact on these oak species.
Most damage symptoms in Scots pine were caused by competition (12.2%), followed by Viscum album (7.4%) and needle cast/needle rust fungi (6.5%). For Norway spruce, mechanical/vehicle damage (4.8%) was most important. Defoliators were causing most damage (21.6%) on Austrian pine trees, but V. album (12.6%), drought (9.4%), needle cast/needle rust fungi (9.1%) and blight (6.8%) also caused considerable damage. Mediterranean lowland pines were mostly affected by drought (39.5%) and defoliators (10.6%).
Figure 7-5: Percentage of damage symptoms by agent group for each main tree species and species group. (1) Visible symptoms of direct atmospheric pollution impact only

2018 Technical Report of ICP Forests | 51
Regional importance of the different agent groups
Damage caused by insects in 2017 was observed on 1 937 European Level I plots, which corresponds to 36% of all plots with damage assessments. With a few exceptions (Czechia and Sweden), a high proportion of plots in each country was affected by this agent group throughout Europe.
Damage caused by abiotic agents was reported from 1 802 Level I plots (34%) throughout Europe. Countries most affected by abiotic agents were Spain, Slovenia, and Montenegro.
The agent group ‘Fungi’ was responsible for damage on 1 290 European Level I plots (24%) in 2017 and was frequently occurring in many countries, most notably in Estonia, southern Poland, Slovenia, Montenegro, parts of Serbia and Bulgaria, and Spain. Very low occurrence of damage by fungi was observed in Turkey, Switzerland, Czechia, Latvia, Denmark, Sweden, and Norway.
The damaging agent group ‘Direct action of man’ refers mainly to impacts of silvicultural operations, mechanical/vehicle damage, forest harvesting or resin tapping. This agent group
impacted trees on 957 plots (18%) most frequently occurring in parts of Eastern Europe and Germany.
Damage caused by game and grazing in 2017 was most frequently observed in the Baltic countries, with the rest of the observations scattered throughout Europe. In total, 274 Level I plots (5%) had trees damaged by this agent group.
There were only 48 plots (1%) with damage inflicted by fire, most of them located in Spain.
For maps showing incidents of various agent groups, please refer to the online supplementary material1.
Dead trees and causes of death
There were only 595 (0.6%) dead trees in the damage assessment 2017. The main cause of death to both conifer and broadleaved trees were abiotic factors (Figure 7-6), followed by fungi. Insects were a major cause of death for conifers. A large part of the damaging agents causing tree death could not be identified with certainty.
Figure 7-6: Percentage of damaging agent groups causing death of broadleaved and coniferous trees in 2017 (n = 595)
1 http://icp-forests.net/page/icp-forests-technical-report

52 | 2018 Technical Report of ICP Forests
7.4 Conclusions
In 2017, the mean defoliation was somewhat higher than in 2016, increasing by 0.2% to 22.7% for broadleaved and by 0.3% to 20.7% for coniferous species.
The defoliation of Scots pine and Norway spruce has been on the rise since 2013. For both species a large share of damage symptoms could not be assigned to specific damage agents, complicating the interpretation of defoliation assessments.
After last year’s high value, the defoliation of beech improved in 2017. The major identified causes of damage on beech in 2017 were mining insects and defoliators.
Mediterranean lowland pines and evergreen oaks had the strongest increasing trend in defoliation. The highest mean defoliation in 2017 and the highest increase from 2016 was observed in evergreen oaks, and the major cause of damage was drought.
The average number of recorded damage symptoms per assessed tree was lower for conifers than for broadleaves. Insects, abiotic causes and fungi were the most common damage agent groups, comprising altogether more than half of all damage records.
7.5 References
Becher G, Lorenz M, Haelbich H, Mues V (2014) Tree crown condition and damage causes. In: Michel A, Seidling W, Lorenz M, Becher G (eds) Forest Condition in Europe: 2013 Technical Report of ICP Forests, Thünen Working Paper 19:10–54
Ciais P, Reichstein M, Viovy N, Granier A, Oge´e J, Allard V, Aubinet M, Buchmann N, Bernhofer C, Carrara A, Chevallier F, De Noblet N, Friend AD, Friedlingstein P, Grünwald T, Heinesch B, Keronen P, Knohl A, Krinner G, Loustau D, Manca G, Matteucci G, Miglietta F, Ourcival JM, Papale D, Pilegaard K, Rambal S, Seufert G, Soussana JF, Sanz MJ, Schulze ED, Vesalla T, Valentini R (2005) Europe-wide reduction in primary productivity caused by the heat and drought in 2003. Nature 437:529–533
Curtis CJ, Simpson GL (2014) Trends in bulk deposition of acidity in the UK, 1988-2007, assessed using additive models. Ecol Indic 37:274–286
Dobbertin M, Landmann G, Pierrat JC, Müller-Edzards C (1997) Quality of crown condition data. In: Müller-Edzards C, De Vries W, Erisman JW (eds) Ten years of monitoring forest condition in Europe. UNECE, EU, Brussels, Geneva, 7–22
Drápela K, Drápelová I (2011) Application of Mann-Kendall test and the Sen’s slope estimate for trend detection in deposition data from Bílý Kříž (Beskydy Mts., the Czech Republic) 1997-2010. Beskydy (Brno) 4(2):133146
Eichhorn J, Roskams P (2013) Assessment of Tree Condition. In: Ferretti M, Fischer R (eds) Forest Monitoring – Methods for terrestrial investigations in Europe with an overview of North America and Asia. Elsevier, Amsterdam, 139–167
Eichhorn J, Roskams P, Potočić N, Timmermann V, Ferretti M, Mues V, Szepesi A, Durrant D, Seletković I, Schröck HW, Nevalainen S, Bussotti F, Garcia P, Wulff S (2016) Part IV: Visual Assessment of Crown Condition and Damaging Agents. In: UNECE ICP Forests Programme Coordinating Centre (ed.): Manual on methods and criteria for harmonized sampling, assessment, monitoring and analysis of the effects of air pollution on forests. Thünen Institute of Forest Ecosystems, Eberswalde, Germany, 54 p. ISBN: 978-3-86576-162-0. [http://icp-forests.net/page/icp-forests-manual]
Eickenscheidt N (2015) Results of the International Cross-Comparison Course in Witzenhausen, Germany, 11–13 June 2014
Helsel DR, Frans LM (2006) Regional Kendall test for trend. Environ Sci Technol 40(13):4066–4073
Marchetto A (2015) rkt: Mann-Kendall Test, Seasonal and Regional Kendall Tests. R package version 1.4. https://CRAN.R-project.org/package=rkt
R Core Team (2016) A language and environment for statistical computing. R Foundation for Statistical Computing. Vienna [http://www.R-project.org/]
Seidling W (2007) Signals of summer drought in crown condition data from the German Level I network. Eur J For Res 126:529–544
Seletković I, Potočić N, Ugarković D, Jazbec A, Pernar R, Seletković A, Benko M (2009) Climate and relief properties influence crown condition of Common beech (Fagus sylvatica L.) on Medvednica massif. Periodicum Biologorum Vol 111(4):435–442
Sen PK (1968) Estimates of the regression coefficient based on Kendall’s tau. J Am Stat Assoc 63:1379–1389.
Timmermann V, Potočić N, Sanders T, Trotzer S, Seidling W (2016) Tree crown condition and damage causes. In: Michel A, Seidling W (eds). Forest Condition in Europe: 2016 Technical Report of ICP Forests. BFW-Dokumentation 23/2016, Vienna, pp. 20–59
Wellbrock N, Eickenscheidt N, Haelbich H (2014) Tree crown condition and damage causes. In: Michel A, Seidling W (eds) Forest Condition in Europe: 2014 Technical Report of ICP Forests, BFW-Dokumentation 18/2014, Vienna, pp. 11–71

PART C
NATIONAL REPORTS OF PARTICIPATING COUNTRIES IN ICP FORESTS

54 | 2018 Technical Report of ICP Forests
8 NATIONAL REPORTS OF ICP FORESTS PARTICIPATING COUNTRIESAll participating countries in ICP Forests were invited to submit summary reports on their ICP Forests activities instead of reports only on their national crown condition survey. Many countries have taken this opportunity to highlight recent developments and major achievements from their many national ICP Forests activities.
All written reports have been slightly edited primarily for consistency and are presented below. The responsibility for the national reports remains with the National Focal Centres and not with the ICP Forests Programme Co-ordinating Centre. For contact information of the National Focal Centres, please refer to the annex.
Belgium
Belgium Flanders
National Focal Centre
Peter Roskams, Research Institute for Nature and Forest (INBO)
Main activities/developments
The Level I survey in Flanders is designed by means of a 4 x 4 km grid. In 2017, crown condition assessments were performed on 852 broadleaves and 686 conifers in 71 plots. The more important coniferous species are Pinus sylvestris (n = 505) and Pinus nigra subsp. laricio (n = 171). The main broadleaved species are Quercus robur (n = 362), Fagus sylvatica (n = 116), Quercus rubra (n = 91) and Populus sp. (n = 48). A subset with ‘other broadleaves’ consists of 13 species with a total of 235 trees, e.g. Alnus glutinosa, Fraxinus excelsior, Betula pendula… There are almost no ‘other conifers’ (n=10).
Long-term intensive forest monitoring (Level II) was continued in 5 plots. Data analysis revealed a.o. the impact of decreasing atmospheric deposition on soil solution chemistry in Flemish forests. Further steps were taken by the University of Antwerp in cooperation with INBO to upgrade the Level II plot in Brasschaat, which is equipped with a measuring tower for gaseous components, in order to meet the criteria of an ICOS Class-I-site.
Major results/highlights
In Level I, the mean defoliation was 24.1%, 21.1% of the trees were in defoliation classes 2-4, and 17.6% showed moderate defoliation. In 2.3% of the trees more than 60% of the crown was defoliated. The mortality rate was 1.2%. 9.0% of the trees in the survey were considered as healthy and 69.9% were in a warning stage (defoliation class 1).
The share of trees with more than 25% defoliation was higher than the mean in Pinus nigra (35.1%), Quercus robur (24.8%) and the subset with ‘other broadleaves’ (31.0%). Fagus sylvatica had the lowest defoliation score with 10.4% of the trees classified as being damaged. Crown condition was also better than the mean in Quercus rubra, Pinus sylvestris and Populus sp. The share of damaged trees for these species amounted to 17.6%, 13.1% and 12.4%. Mortality was high in the subset with broadleaves. Dieback of Quercus robur was noticed in several plots, dieback of Alnus glutinosa in one plot. From 2012 on, dead oaks and alders were reported every year.
Defoliators caused more than 10% defoliation on 14.6% of the Quercus robur trees, while 8.0% of Q. robur showed severe discolouration caused by Microsphaera alphitoides (>10% of the leaves). Discolouration by fungal infection was also noticed on Pinus nigra. Dothistroma septosporum caused brown discolouration in combination with needle loss. The cause of dead shoots, twigs or branches was often unknown. In one plot crown dieback on Alnus glutinosa was caused by Phytophthora alni. In several plots infection by Hymenoscyphus fraxineus resulted in dead shoots, twigs and branches on Fraxinus excelsior.
A slight increase in defoliation and the share of damaged trees was observed. Mean defoliation decreased significantly only for Fagus sylvatica (- 7.4 percentage points). Contrary to 2016 there was almost no seed production on beech. A significant increase in defoliation was registered in Pinus sylvestris (+ 1.0 percentage points), Quercus robur (+ 1.8 percentage points), Quercus rubra (+ 2.2 percentage points) and ‘other broadleaves’ (+ 2.3 percentage points). Pinus nigra and Populus sp. showed non-significant changes in defoliation (+ 0.3 and + 0.4 percentage points).
Additional plots were selected to monitor the crown condition of Fraxinus excelsior and the impact of Hymenoscyphus fraxineus in Flanders. 252 ash trees in 29 plots have been assessed yearly since 2014. A serious deterioration of the health status was noticed. Mean defoliation increased from 28.8% in 2014 to 43.0% in 2017, while the share of damaged trees

2018 Technical Report of ICP Forests | 55
almost doubled (from 32.1% to 59.1%). 6.7% of the sample trees died and every year new dead trees were noticed.
Since the 1980’s the acidifying and eutrophying depositions in Flanders decreased considerably. Analysis of the data collected in 5 ICP Forests Level II plots revealed the impact of the decreasing depositions on soil solution chemistry. It was shown that the abiotic nitrogen status started to improve and acidification slowed down during the past two decades. However, N depositions are still far above the critical loads for ectomycorrhiza and epiphytic lichens. The generally observed tendency of increased dissolved organic carbon (DOC) and nitrogen (DON) mobility is likely a direct result of lowered ionic strength and partly rise in pH. Abiotic recovery is delayed by a simultaneous decrease in the deposition of base cations (Ca2+, K+ and Mg2+) and sulphate desorption. Biotic recovery is lagging behind on the changes in soil solution chemistry, as indicated by the stable but unbalanced tree mineral nutrition. Acidification and eutrophication will likely continue to produce after-effects for many decades.
National publications/reports published with regard to ICP Forests data and/or plots
Sioen G, Verschelde P, Roskams P (2017) Bosvitaliteitsinventaris 2016. Resultaten uit het bosvitaliteitsmeetnet (Level I). Rapporten van het Instituut voor Natuur- en Bosonderzoek 2017 (15). Instituut voor Natuur- en Bosonderzoek, Brussel (in Dutch). https://pureportal.inbo.be/portal/files/12937745/Sioen etal 2017 Bosvitaliteitsinventaris2016.pdf
Verstraeten A, Neirynck J, Genouw G, Cools N, Roskams P, Hens M (2017) Corrigendum to “Impact of declining atmospheric deposition on forest soil solution chemistry in Flanders, Belgium.” [Atmos Environ 62C (2012) 50–63]. Atmos Environ 170: 334–335. doi: 10.1016/j.atmosenv.2017.10.030
Verstraeten, A., Neirynck J., Cools N., Roskams P., Louette G., De Neve S. and Sleutel S., 2017. Multiple nitrogen saturation indicators yield contradicting conclusions on improving nitrogen status of temperate forests. Ecological Indicators 82:451-462. doi: 10.1016/j.ecolind.2017.07.034
Verstraeten A, Neirynck J, Cools N, Roskams P, Louette G, De Neve S, Sleutel S (2017) Response of temperate forest N status to long-term recovery from acidification and decreasing atmospheric N deposition. IUFRO 125th Anniversary Congress 2017, 18–22 September 2017, Freiburg, Germany
Verstraeten, A. Pollen distribution causes the spring peak in throughfall dissolved organic carbon (DOC) in beech (Fagus sylvatica L.) / common oak (Quercus robur L.) forests. 33rd ICP Forests Task Force meeting, 18–19 May 2017, Bucharest, Romania
Outlook
The Level I crown condition assessments will be continued as well as the additional survey on the condition of Fraxinus excelsior. The Level II program will be continued.
Peter Roskams, Geert Sioen, Arne Verstraeten (INBO)
Belgium Wallonia
National Focal Centre
Elodie Bay, SPW – Public Service of Wallonia
Main activities/developments
In 2017, the data were collected in 8 plots for Level II/III and in 45 plots for Level I.
Major results/highlights
The vegetation period has started with rude frost in April. The climate during the rest of the vegetation period was dry. These conditions did not affect oaks which continue to show an average defoliation decrease of 2% per year since 2013. On the opposite, top of the beeches continue to degrade (2% more defoliation per year since 2013). Douglas-firs are still affected by Swiss rust which causes needle loss.
National publications/reports published with regard to ICP Forests data and/or plots
See our annual reporting on forest health (in French) which includes ICP Forest data on http://owsf.environnement.wallonie.be Data are also included in the Walloon Regional Environmental Report (in French) on http://etat.environnement.wallonie.be
Bulgaria
National Focal Centre
Genoveva Popova, Executive Environment Agency (ExEA)
Main activities/developments
The National Programme for Forest Ecosystems Monitoring is operationalized as part of the National System for Environmental Monitoring and implemented on two levels, namely, the large-scale monitoring (Level I) and the intensive

56 | 2018 Technical Report of ICP Forests
monitoring (Level II). The National System is managed by the Ministry of Environment and Water through the Executive Environment Agency and all activities of the Programme are carried out in accordance with the International Co-operative Programme (ICP) Forests Manual.
The Level I network is organized around large-scale monitoring of forest ecosystems and consists of 160 permanent sampling plots, grouped across 10 regions to cover the territory of the country. The criteria for the sampling plots are in line with requirements for environmental monitoring and the forest inventory, such as representativeness of forest biotypes, covering protected areas of the Nature 2000 network and priority habitats that are protected, and maintaining an even distribution of observation plots by tree species and origin in accordance with the distribution of forested areas in the country. In 2017, a new sample plot of Castanea sativa trees was planted and added to the Level I national grid. More than 5 000 trees are monitored annually.
In 2017, the Level II forest ecosystem monitoring programme is implemented in four permanent sample plots in Vitinya, Staro Oryahovo, Yundola and Rojen. The sample plots are representative as regards the main tree species and environmental conditions, cover a minimum area of 0.25 ha and are homogeneous in species composition. They are also clearly separated and include a 10 m buffer zone. Level II monitoring is focused on collecting information on air pollution and other natural and anthropogenic stress factors affecting forests in the long term and gaining a better understanding of cause-and-effect relationships in forest ecosystems. The information from Level II monitoring provides additional and valuable information about development of health condition monitoring in forests and planning and taking measures to reduce impacts. Data also contribute to science-based concepts concerning the implementation of sustainable forest management.
All data collected through the forest monitoring system are integrated into the National System for Environmental Monitoring, which incorporates a module on forests. The information in that database is not publicly available but it is foreseen that a new platform currently under development will make all information available to the public by the end of 2018.
Major results/highlights
In 2017, observations of the extent of crown defoliation and discoloration, biotic and abiotic damages, and other stress factors were carried out on 5 588 trees in 160 permanent sample plots. The assessment covered four coniferous tree species (Pinus sylvestris L., Pinus nigra Arn., Picea abies L. and Abies alba Mill.), as well as eight deciduous species (Fagus sylvatica L., Quercus frainetto Ten., Quercus petraea (Matt.) Liebl., Quercus cerris, Quercus rubra L., Tilia platyphillos Scop., Carpinus betulus L. and Castanea sativa Mill). The total number
of observed coniferous trees was 2 422 (42%) and of deciduous – 3 166 (58%). In relation to the extent of defoliation, the observed coniferous and deciduous trees had retained their rate compared to the previous year – 72.3% of the monitored trees showed ‘none’ or ‘slight’ defoliation (≤ 25%). There was a decrease in the percentage of severely-defoliated and dead trees – 5.0% in 2017 compared to 6.5% in 2016. The previously observed trend of deciduous trees species in better condition than coniferous ones continued in 2017, with defoliation of up to 25% observed in 80.1% of deciduous trees and 63.0% of coniferous.
With regards to the determined biotic factors, it was found that the bark beetle (Ips acuminatus) caused serious damage to the coniferous tree stands in the monitored sample plots. The presence of the fungus Heterobasidion annosum was observed in both the Pinus sylvestris and Pinus nigra stands. The pathogens Dothistroma pini, Sphaeropsis sapinea and Cyclaneusma minus, which caused damage to needles and shoots, pose a threat to the monitored tree stands. The described biotic damages have not led to significant changes in tree health compared with the previous year.
In some plots of Fagus sylvatica, the number of healthy and slightly-damaged trees was associated with the negative effects of different abiotic (wet snow, ice, wind) and biotic agents (Nectria spp., Ascodichaena rugosa, Fomes fomentarius, Orchestes fagi, Mikiola fagi, Hartigiola annulipes etc.) that caused damages to stems, branches and leaves. The negative anthropogenic impact was still visible in 2017. The risk of pathogen penetration and development of snowfall-damaged trees is still very high.
National publications/reports published with regard to ICP Forests data and/or plots
Kadinov G, Ananieva K, Gesheva, Doncheva – Boneva M, Doncheva S, Bezlova D (2017) Visible Foliar Injury and Response of Antioxidant Defense System in Beech (Fagus sylvatica L.) to Acute Ozone Exposure Under Controlled Conditions. J. Genetics and Plant Physiology 7(1-2):34–48
Pavlova E, Pavlov D, Doncheva-Boneva M, Bencheva S, Dojchev D, Kuzmanova R, Kadinov G (2017) Forest Ekosystems, Biologikal indikators, West Balkan Moundain, Sophia, Dvangard Prima, 79 p. ISBN 978-619-160-807-2
Mirchev P, Georgiev G, Bencheva S, Georgieva M, Doychev D, Zaphirov N (2017) Forest protection problems in coniferous plantations in Bulgaria. In: National conference with international participation on "Prospects and guidelines for the management of artificial coniferous forests" 28–29 January 2016, Kyustendil, 89–112. ISBN 978-954-8944-52-6. (In Bulgarian, English summary)

2018 Technical Report of ICP Forests | 57
Georgieva M, Hlebarska S (2017) A review of Sphaeropsis sapinea occurrence on Pinus spp. in Bulgaria. Bioscience and Biotechnology
Dobreva M, Georgieva M, Dermendzhiev P, Velinov V, Nachev R, Georgiev G (2017) First record of Sirococcus conigenus on Norway spruce in Bulgaria. Silva balcanica 17(2)
Dobreva M., Georgieva M, Dermendzhiev P, Nachev R, Velinov V, Terziev P, Georgiev G (2017) Fungal pathogens on Pinus spp. in the region of Forest protection station Plovdiv during the period 2013–2016 Forest science 16 (1): 103–116. (In Bulgarian, English summary)
Mirchev P, Georgiev G, Georgieva M, Zaemdzhikova G, Matova M (2017) Risks at enlargement of pine processionary moth (Thaumetopoea pityocampa) range in Bulgaria. Plant protection 10, “Blagoev" Ltd. – Sofia, 10–12.
Georgieva M, Hlebarska S (2017) Dothistroma pini – a danger fungal pathogen on pine trees. Plant protection 10, “Blagoev" Ltd. – Sofia, 13-15.
Doychev D, Topalov P, Zaemdzhikova G, Sakalian V, Georgiev G (2017) Host plants of xylophagous longhorn beetles (Coleoptera: Cerambycidae) in Bulgaria. Acta zoologica bulgarica 69 (4):511–528
Mirchev P, Georgiev G, Tsankov G (2017) Long-term studies on egg parasitoids of pine processionary moth (Thaumetopoea pityocampa) in a new locality in Bulgaria. Journal of the Research Entomological Society, 19 (3):15–25
Georgiev G (2017) High aggressive bark beetles attacking vital trees. Third age 40 (4): 7
National Report on the State and Protection of the Environment 2015. http://eea.government.bg/bg/soer/2015/forest
Outlook
Regarding the development of the ICP Forests infrastructure in the near future, we foresee a gradual expansion of the Level II network, as well as the inclusion of Level II sample plots in the LTER network. In this regard we have contacted the coordinator of LTER for Bulgaria and have taken the necessary steps.
Impact of Cryphonectria parasitica on the health status of chestnut (Castanea sativa Mill.) stands in Belasitsa Mountain. Isolation of virulent strains of the pathogen. Analysis of the vegetative compatibility between isolated Bulgarian strains and established European strains. Elaboration of a distribution map of the established pathogenic strains.
Assessment of the harmful impact and spread of the most important fungal pathogens causing damages on Pinus spp. plantations in Bulgaria. The identification of the pathogens and the determination of their specific ecological features will allow the development of integrated measures for limiting their
negative effects and dissemination. The implementation of the project will reveal the actual distribution of the highly damaging fungal pathogens.
Croatia
National Focal Centre
Nenad Potočić, Croatian Forest Research Institute
Main activities/developments
In 2017, NFC Croatia celebrated 30 years of active participation in the ICP Forests programme.
Major results/highlights
Level I Ninety-nine sample plots (2 376 trees) on the 16 x 16 km grid network were included in the survey 2017 - 2013 broadleaved trees and 363 conifers.
The percentage of trees of all species within classes 2-4 keeps getting smaller: In 2017 (25.6%) it was lower than in 2016 (28.5%), in 2015 (29.7%), and in 2014 (31.5%).The percentage of broadleaves in classes 2-4 (23.9%) was also somewhat smaller than in 2016 (24.7%), and for conifers a major decrease was recorded in comparison with the year 2016 (35.0% vs. 51.0%) and 2015 (55.9%). The results from several previous years are also closer to 50%: 49.7% in 2014 and 48.3% in 2013.
Defoliation of both black pine and silver fir, although still high, has dramatically improved in 2017: from 62.8% in 2016 to 45.4% in 2017 for pine and from 64.2% to 50.5% of trees in classes 2-4 for fir. The deterioration of crown condition of narrow-leaved ash continues: The percentage of trees in classes 2-4 increased from 23.6% in 2013, through 49.1% in 2014, and 62.5% in 2015 to 72.2% in 2016 and 75.0% in 2017. The ubiqituous presence of Stereonychus fraxini, coupled with an increasing impact of Hymenoschyphus fraxineus (Chalara fraxinea) in the last few years seems to be causing increased deterioration of ash health. For pubescent oak, in 2017 we recorded the lowest number of trees in classes 2-4 ever, only 22.9%; and significantly lower defoliation in comparison with 2016 was recorded in Aleppo pine (14.1% vs. 31.0%) and common beech (15.5% vs. 21.3%).
The largest number of damages was recorded on leaves (42.5% of all recorded damage), followed by branches, shoots and buds (34.0%), and finally on the trunk and butt end (23.5%). Most of forest tree damage is caused by insects (24.8% of all damage), especially defoliators (13.6%) and leaf miners (4.6%). Next are

58 | 2018 Technical Report of ICP Forests
abiotic agents with 11.5% of all damage, the most significant agent being drought with 4.7%. Damage caused by fungi accounts for 5.5% of all damage, while direct human activity accounts for 3.9% of all damage to forest trees. Most of the damage (69.6%) falls into the extent category 1 (0-10%).
Level II Annual defoliation values on our intensive monitoring plots primarily depend on local climate parameters, as well as on biotic and abiotic factors. Damage from the beech leaf-mining weevil – Rhynchaenus fagi was recorded on plot 105, on 38 out of 39 surveyed beech trees, but not on plot 103, where it was recorded in 2016. A grave problem for our pedunculate oak stands is Corythuca arcuata. Damage in the form of leaf chlorosis as a consequence of oak lace bug attack was found on plot 109 in 2015, 2016 and 2017 on all trees. Dieback of lesser or higher intensity was recorded on all Aleppo pine trees on plot 111, caused by Lophodermium fungi.
Symptoms suggesting oxidative stress caused by high ground-level ozone concentrations were again found on Ligustrum vulgare on plot 108 (Poreč) in 2017.
After ice-storm damages from 2014 that changed stand structure, higher values of radial increment of silver fir on plot 106 (Lividraga) were recorded in 2015, 2016 and 2017, reflecting the nearly halved growing stock on the plot.
National publications/reports published with regard to ICP Forests data and/or plots
Potočić N, editor (2017) 30 Years of ICP Forests in Croatia. Radovi Izvanredno izdanje/Supplement 11, Jastrebarsko, 56 pp.
Potočić N, Seletković I, Jakovljević T, Marjanović H, Indir K, Medak J, Lacković N, Ognjenović M, Laslo A (2017) Oštećenost šumskih ekosustava Republike Hrvatske – izvješće za 2016. godinu. Hrvatski šumarski institut. www.icp.sumins.hr
Outlook
Average crown defoliation (all species) in Croatia in the period from 1998 to 2017 has a positive trend (slope 0.25, p<0.05), despite the significant improvement (value below the trendline) recorded in 2017. For most species the trends are not significant (common beech, pedunculate oak, Aleppo pine, pubescent oak) and for some the trend has reversed (a negative trend for silver fir is recorded for the first time in 2017). On the other hand, the trends are still positive and with a rather big slope for Austrian pine (0.83), despite a significant decrease of defoliation in 2017, and for narrow-leafed ash (1.03), whose average defoliation has in the last four years greatly deviated from the trend, making narrow-leafed ash currently the most damaged tree species in Croatia.
Cyprus
National Focal Centre
Andreas Christou, Ministry of Agriculture, Natural Resources and Environment, Research Section – Department of Forests
Report on 2017 national crown condition survey
The annual assessment of crown condition was conducted on 15 Level I plots, during the period May – June 2017. The assessment covered the main forest ecosystems of Cyprus and a total of 360 trees (Pinus brutia, Pinus nigra and Cedrus brevifolia) were assessed. Defoliation, discoloration and the damaging agents were recorded.
A comparison of the results of the conducted survey with those of the previous year (2016) shows an increase of 4.8% in class 0 (not defoliated) and 6.5% in class 1 (moderately defoliated). A decrease of 9.9% in class 2 (severely defoliated), 1.1% in class 3, and 0.3% in class 4 has been observed.
From the total number of trees assessed (362 trees), 20.3% of them were not defoliated, 56.1% were slightly defoliated, 21.9% were moderately defoliated and 1.7% were severely defoliated.
In the case of Pinus brutia, 18.3% of the sample trees showed no defoliation, 55.3% were slightly defoliated, 24.7% were moderately defoliated and 1.7% were severely defoliated. For Pinus nigra, 27.8% of the sample trees showed no defoliation, 63.9% showed slight defoliation and 8.3% were moderately defoliated. For Cedrus brevifolia, 33.3% of the sample trees showed no defoliation, 54.2% were slightly defoliated, 8.3% were moderately defoliated and 4.2% were severely defoliated.
A discoloration has been observed as well. From the total number of trees assessed (360 trees), 64.2% of them were not discolorated and 35.8% were slightly discolorated.
From the total number of sample trees surveyed, 41.9% showed signs of insect attacks and 4.4% showed signs of attacks by “other agents, T8” (lichens and dead branches). Also, 11.9% showed signs of both factors (insect attacks and other agents).
The major abiotic factors causing defoliation in some plots during 2017, were the combination of the climatic with the edaphic conditions which resulted to secondary attacks by Leucaspis spp. and defoliator insects to half of the trees.

2018 Technical Report of ICP Forests | 59
Czech Republic
National Focal Centre
Bohumír Lomský, Forestry and Game Management Research Institute (FGMRI)
Main activities/developments
The International Cross-Comparison Course Crown Condition for Central Europe was organized in the Czech Republic last year (June 6–9, 2017). The course took place in the region of Southern Moravia, where five European tree species were included in the assessment: spruce, pine, oak, beech, and birch. The assessment was1 done on 10 plots in total, on each of them on 20 selected trees from the fixed and free assessment position. Besides Czech participants, 18 foreign guests from 9 countries participated in the course.
The new locality allows us to compare selected tree species at very different site conditions, e.g. aeolian sands, floodplain forests, mountain locations, and hence it is representative for a broader range of central European forest ecosystems. It is planed to keep the assessment plots for the organization of future ICCs.
Major results/highlights
This year the higher mortality of forest tree species appeared as a result of the adverse development of meteorological conditions (high temperatures, uneven distribution of rainfall) during the growing seasons of 2015 and 2016. An increased incidence of trees with severe defoliation (class 3) was found out in the majority of conifer species almost in the whole territory of the country, mainly in northern Moravia where the weakened spruce stands were affected by a bark beetle calamity. The incidence of pine dieback was also high. Pine was attacked by various biotic pests at medium and lower locations, mainly in the Polabí lowland and in the Jihomoravské úvaly Natural Forest Area. Broadleaved stands were influenced by leaf-eating insects to a larger extent at lower locations and the increased rate of ash dieback (Chalara fraxinea) was observed in common ash (Fraxinus excelsior) stands.
In conifer species the most pronounced changes were found out in European larch (Larix decidua). In the younger category (stands below 59 years of age) there was a moderate decrease in class 0 (0-10%) defoliation from 18.8% in 2016 to 13.2% in 2017 and at the same time class 1 (>10-25%) and class 2 (>25-60%) defoliation increased. In older pine (Pinus sylvestris) stands class 3 (>60-99%) and class 4 (100%) defoliation moderately increased while defoliation of classes 0-2 decreased.
In broadleaves in the group of younger oak (Quercus sp.) stands, class 0 and class 1 defoliation slightly decreased while class 2 defoliation increased at the same time. In younger birch stands, class 0 defoliation distinctly increased from 15.3% in 2016 to 23.7% in 2017 with a simultaneous decrease in class 1 and class 2 defoliation. In older oak stands there was a moderate increase in class 1 defoliation and a decrease in class 2 defoliation. In older beech (Fagus sylvatica) stands class 0 defoliation markedly increased from 26.1% in 2016 to 34.6% in 2017 when there was a simultaneous decrease in class 1 and class defoliation.
National publications/reports published with regard to ICP Forests data and/or plots
See our national annual reporting on forest condition (in Czech and English) which includes ICP Forest data on http://www.vulhm.cz/en/msl_download
Outlook
The National Forest Centre (NFC) prepares the annual report Forest Condition Monitoring in the Czech Republic for 2017. This yearbook will summarize the recent results of the ICP Forests programme.
Denmark
National Focal Centre
Morten Ingerslev, Department of Geosciences and Natural Resource Management, University of Copenhagen. Email: [email protected]
Main activities/developments
Participation in the 2017 Photo crown condition ICC course.
Forest health monitoring on Level I and Level II plots, and on National Forest Inventory sample plots, including national ICC course for NFI teams on crown condition and biotic damage assessment.
Installation of phenology camera on new intensive spruce plot. Phenology observations on two existing beech and oak plots have already yielded interesting results, with patterns slowly emerging.
NCC decision to resubmit QC crown condition and biotic damage data from all Danish monitoring plots since 1989 to the ICP Forest database, in order to make the data available for future studies. This work is ongoing and partly prompted by two ICP Forests related fruiting studies (Nussbaumer et al.) which

60 | 2018 Technical Report of ICP Forests
revealed the advantage of longer time series of fruiting observations.
QAQC in the laboratories have been improved notably in the last year by changing procedures for handling and preparation of water samples. The major focus point here has been to decrease the time span from sampling to analysis of especially pH and conductivity, but also element analysis. At the same time we have tried to minimize different risks for water sample contamination. By comparison with previous procedures we can see it has been worth the effort giving better data and decreasing the need for extra analysis.
Major results/highlights
The national crown condition survey showed a stable or slightly decreased defoliation for most species. The general forest health is satisfactory apart from ash suffering from ash dieback, and decline of oak in areas with high ground water levels and heavy clay soils. 2017 was amongst the years with the highest precipitation recorded in Denmark, continuing the trend of wetter growth seasons wich can impact the forest condition both positively and negatively depending on site conditions.
National publications/reports published with regard to ICP Forests data and/or plots
Callesen I, Jørgensen BB, Fischer L, Larsen HME, Ravn HP, Susgaard Filsø S, Bjerager P, Thomsen IM (2017) Egens sundhedsproblemer på grundvandsnære jorde. [Health problems in oak on soils with high ground water.] In Danish. Department of Geosciences and Natural Resource Management, Frederiksberg, 90 pp
Filsø SS, Jørgensen BB, Thomsen IM, Callesen I (2017) Påvirker ekstremnedbør sundheden i stilkeg? Topografiens betydning. [Does extreme precipitation influence the health of common oak? Importance of topography] Skoven 49(2):87–91
Nord-Larsen T, Johannsen VK, Arndal M F, Riis-Nielsen T, Thomsen I. M., Suadicani K, Jørgensen BB (2017) Skove og plantager 2016: [Forest statistics 2016.] Department of Geosciences and Natural Resource Management, University of Copenhagen. http://static-curis.ku.dk/portal/files/186153734/SkoveogPlantager2016_samlet_6_jeal.pdf
Skovsgaard JP, Wilhelm GJ, Thomsen IM, Metzler B, Kirisits T, Havrdová, L, Enderle, R, Dobrowolska, D, Cleary M, Clark J (2017) Silvicultural strategies for Fraxinus excelsior in response to dieback caused by Hymenoscyphus fraxineus. Forestry 90:455–472. doi: 10.1093/forestry/cpx012
Outlook
We are compiling our findings both on a national and international level and in the coming year we will work on presenting these on our institute homepage in an interactive maner. We are continuing the work on QAQC in the laboratories to insure the best practice, with regard to sample handling, preparation, and analysis.
Estonia
National Focal Centre
Estonian Environment Agency
Main activities/developments
The Level I forest monitoring network was used to assess the health status of 2 406 trees. 1 484 Scots pines (Pinus sylvestris), 579 Norway spruces (Picea abies) and 343 deciduous species, mainly Silver birches (Betula pendula) were assessed. The observation period lasted from July 12 to November 8, 2017.
The Estonian national Level I and Level II crown condition monitoring group participated in the Photo ICC 2017.
On Level II the following forest monitoring activities were carried out in 2017: (1) chemical analyses of the deposition water collected throughout the year on 6 sample plots; (2) chemical analyses of soil solution collected during 9 months of the year (from March to November) on 5 sample plots; (3) from one plot analyses of the litterfall were collected according to ICP Forests requirements; (4) foliar samples were collected on all Level II sample plots.
Major results/highlights
Level I The total share of not defoliated trees (56.2%) was 6.3% higher than in 2016. The share of not defoliated conifers (54.4%) was lower than the share of not defoliated broadleaves (66.5%) in 2017.
The share of trees in classes 2 to 4 (moderately defoliated to dead) was 5.2% in 2017 and 6.4% in 2016. The share of conifers and broadleaves in defoliation classes 2 to 4 was 5.5% and 3.2% accordingly.
Since 2016 Norway spruce has become the most defoliated tree species in Estonia, mostly because of the aging of spruce plots.
The share of not defoliated pines (defoliation class 0) was 54.8% in 2017, 3.1% higher than in 2016. The share of pines in

2018 Technical Report of ICP Forests | 61
classes 2 to 4 (moderately defoliated to dead) was 4.9%, slightly lower than in 2016.
However, the long-term trend of Scots pine defoliation since 2009 has improved. In 2009, the share of not defoliated pine trees was 38% compared to 54.8% in 2017.
A long-term increase of defoliation of Norway spruce may be observed. The share of not defoliated trees (defoliation class 0) was 63.7% in 2010 and 53.5% in 2017. The share of not defoliated trees was higher, 74.4%, in younger stands with the age up to 60 years and 37.7% in older stands.
Compared to several last years there has been a significant decrease in the condition of broadleaves during 2015 and 2016. The defoliation of broadleaves improved in 2017.
The defoliation of Silver birches has improved 10.4% in 2017. The share of not defoliated Silver birches was 58.4% in 2017 and 48% in 2016.
Numerous factors determine the condition of forests. Climatic factors, disease and insect damage as well as other natural factors have an impact on tree vitality. All trees included in the crown condition assessment on Level I plots are also regularly assessed for damage.
In 2017, 6.3% of the trees observed had some insect damages, 17.9% had symptoms of fungi (mainly Scots pines). Overall 35% of trees had no identificable symptoms of any disease.
Visible damage symptoms recorded on Scots pine were mainly attributed to pine shoot blight (pathogen Gremmeniella abietina). Symptoms of shoot blight were recorded on 16% of the observed pine trees in 2017, compared to 22% in 2016. Norway spruces mostly suffered due to root rot (pathogen Heterobasidion parviporum) ‒ characteristic symptoms of the disease were observed on 5% of the sample trees.
No substantial storm damages and forest fires occurred in 2017.
Level II The annual average pH of the precipitation was varying mainly between 5 and 6. Long-term observations show some slight increase of pH since 2012. The content of analysed chemical elements and compounds in precipitation water was low. Generally, the amount of precipitation in 2017 was lower than in 2016.
The pH of the soil solution varied between 3.7 and 6.3 throughout the observation period. The content (concentration) of the nutrition elements and chemical compounds dissolved in the soil water of pine stands was in most cases also below the level of 2.5 mg·l-1. In 2017, similar to the past years, the content of Ca2+ and Cl- in soil solution was considerably higher in all
spruce sample plots than the mentioned level. The concentration of Mg2+, Na+, K+, and SO4-S in a spruce stand at Karepa was essentially higher than the level of 2.5 mg·l-1.
The results of litterfall collected in 2016 did not show any significant trends of different elements. Rather high values could be detected in different fractions of litterfall.
National publications/reports published with regard to ICP Forests data and/or plots
Annual publications/reports:
Yearbook Forest, Chapter 5 – Condition of forest, The Estonian Environment Agency, Tallinn 2017
FOREST MONITORING, Report of the survey 2017. Vladislav Apuhtin, Endla Asi, Heino Õunap, Tiiu Timmusk, The Estonian Environment Agency, Tartu 2017
Outlook
The forest monitoring activity in Estonia will continue for both levels (Level I and Level II) and no significant changes are planned for 2018.
Finland
National Focal Centre
Päivi Merilä, Natural Resources Institute Finland (Luke)
Main activities/developments
The year 2017 was the 22nd year of ICP Forests Level II activities in Finland. Twelve plots were monitored for atmospheric deposition, soil solution chemistry, litterfall, and meteorology. Crown condition assessment and foliar sampling for element analyses were carried out on 10 plots. In addition, tree increment was monitored using girth bands by manual recordings (10 plots) and by electronic devices (five plots). Observations of tree phenology continued on two plots in Punkaharju (eastern Finland). Laboratory analyses for soil samples taken in 2016 were carried out in 2017. The monitoring data for the year 2015 was submitted to the ICP Forests database.
Two Level II plots located in Juupajoki, central Finland were clear-cut in 2017; the cutting occurred in March on Scots pine plot nr. 10, and in June on Norway spruce plot nr. 11. Following the conventional forest management practices in Finland, the soil of both plots was prepared by scalping, followed by regeneration by seeding on the pine plot and by planting on the spruce plot. The dominant tree species on these plots thus

62 | 2018 Technical Report of ICP Forests
remained the same as before the clear-cutting. The monitoring activities on these two plots will continue providing data on the effect of clear cutting and regeneration activities on the parameters monitored.
ICP Forests Expert Panel chair Pasi Rautio (EP Foliage and Litterfall), co-chair Liisa Ukonmaanaho (EP Foliage and Litterfall), and co-chair Tiina M. Nieminen (EP Soil and Soil Solution) continued in their posts and contributed to the work of the Programme Co-ordinating Group of ICP Forests.
National publications/reports published with regard to ICP Forests data and/or plots
Data gathered from the Finnish Level II plots contributed to the following refereed articled published in 2017:
Berg B, Johansson M-B, Liu C., Faituri M, Sanborn P, Vesterdal L, Ni X, Hansen K, Ukonmaanaho L (2017) Calcium in decomposing foliar litter: A synthesis for boreal and temperate coniferous forests. Forest Ecol Manag 403:137–144
Lehtonen A, Linkosalo T, Peltoniemi M, Sievänen R, Mäkipää R, Tamminen P, Salemaa M, Nieminen T, Tupek B, Heikkinen J, Komarov A (2016) Forest soil carbon stock estimates in a nationwide inventory: evaluating performance of the ROMULv and Yasso07 models in Finland. Geosci Model Develop 9 11:4169–4183
Ostonen I, Truu M, Helmisaari H-S, Lukac M, Borken W, Vanguelova E, Godbold DL, Lõhmus K, Zang U, Tedersoo L, Preem J-K, Rosenvald K, Aosaar J, Armolaitis K, Frey J, Kabral N, Kukumägi M, Leppälammi-Kujansuu J, Lindroos A-J, Merilä P, Napa Ü, Nöjd P, Parts K, Uri V, Varik M, Truu J (2017) Adaptive root foraging strategies along a boreal–temperate forest gradient. New Phytologist 215(3):977–991
Schröder W, Nickel S, Schonrock S, Schmalfss R, Wosniok W, Meyer M, Harmens H, Frontasyeva M, Alber R, Aleksiayenak J, Barandovski L, Blum O, Carballeira A, Dam M, Danielsson H, De Temmermann L, Dunaev A, Godzik B, Hoydal K, Jeran Z, Karlsson GP, Lazo P, Leblond S, Lindroos J, Liiv S, Magnusson S, Mankovska B, Nunez-Olivera E, Piispanen J, Poikolainen J, Popescu IV, Qarri F, Santamaria JM, Skudnik M, Spiric Z, Stafilov T, Steinnes E, Stihi C, Suchara I, Thoni L, Uggerud HT, Zechmeister H (2017) Bioindication and modelling of atmospheric deposition in forests enable exposure and effect monitoring at high spatial density across scales. Ann For Sci 74:31
Vuorenmaa J, Augustaitis A, Beudert B, Clarke N, De Wit HA, Dirnböck T, Frey J, Forsius M, Indriksone I, Kleemola S, Kobler J, Kram P, Lindroos A-J, Lundin L, Ruoho-Airola T, Ukonmaanaho L, Vana M (2017) Long-term sulphate and
inorganic nitrogen mass balance budgets in European ICP Integrated Monitoring catchments (1990–2012). Ecological Indicators 76:15–29
Outlook
Besides acitivities directly linked to the ICP Forests programme, the intensive Finnish forest monitoring data and infrastructure is increasingly utilized by national and international research projects related e.g. with climate change, biogeochemistry, biodiversity and atmospheric deposition. This is beneficial and increases the value of long-term monitoring. However, continuity and development of the activities would require a solid commitment for supply of resources.
France
National Focal Centre
Fabien Caroulle, Ministère de l’Agriculture, de l’Agroalimentaire et de la Forêt – Level I
Manuel Nicolas, Office National des Forêts – Level II
Main activities/developments
Monitoring activities were continued on the 102 plots of the Level II network (RENECOFOR). In detail, assessments (phenology, health, annual growth) and samplings on trees (foliar nutrition) were performed on all of these plots, while atmospheric deposition, meteo, soil solution and litterfall have been monitored only on a subset of plots.
As a new development, permanent dendrometers were installed from 2016 to 2017 on all the plots where adult sample trees were available (i.e. excluding the plots destroyed by storms in 1999 and that were still covered by young trees). In total nearly 3 400 trees were equipped throughout 95 plots. The aim is to reliably measure the growth of all these trees every year (even trees growing slowly), instead of every five years. Yearly growth will usefully complement the health and phenology data that have already been collected every year on the same trees, to better understand their responses to climate variations. Since their circumference is to be read from the permanent dendrometers by the local foresters in charge of every plot, an intercomparison exercise was systematically performed with them. In total, 96.2% of the 9 714 compared measurements were correct, though most of the foresters had no previous experience with such instruments. This was also an opportunity to draw their attention on various causes of error and on the usefulness of cross-checking the results with a second independent observer.

2018 Technical Report of ICP Forests | 63
In addition, the RENECOFOR network collaborated with INRA to participate in the worldwide “Tea bag index” experiment (see http://www.teatime4science.org/). Both green tea and rooibos tea bags were buried for 3 months at two different depths in order to evaluate how fast organic matters are decomposed. Thanks to the contribution of the local foresters, this could be performed simultaneously in all the Level II plots throughout France, from the beginning of June to the beginning of September. Laurent Augusto and Nicolas Fanin (INRA) prepared the materials and then received, dried and weighed the content of all the collected tea bags (n = 1 104). Results will be analysed in 2018.
Finally a conference was organized and held October 11–13, 2017 celebrating the 25th anniversary of the RENECOFOR network. Presentations were given to review the 25 years of knowledge acquired according to the following thematic sessions:
− How do forest trees respond to climate variations?
− What role do forests play in sequestering carbon from the atmosphere?
− Acidification and nutrient cycling in forest ecosystems
− Dynamics of persistent pollutants in forests
− Studying and monitoring forest biodiversity
− Monitoring forests at pan-European level
− What could be the future perspectives for monitoring forests?
More than 300 people attended this event, including foresters, scientists, policy makers, teachers, students… The conference was in French, but non-French speakers (Marco Ferretti, Nils König, and Marcus Schaub from the ICP Forests) were also able to present results thanks to a simultaneous translation. Videos, abstracts and pictures of the conference are available on the RENECOFOR’s webpages (direct link: http://www.onf.fr/renecofor/sommaire/colloque/preambule/@@index.html).
Major results/highlights
The Level II data are freely extracted from the RENECOFOR’s database on the request of researchers. They have been used for various purposes, as depicted by the PhD theses and articles published since 2017 in peer-reviewed journals (cf. list below).
Fruit production has become of high interest for scientists. Indeed it is a crucial step in the life cycle that may condition the ability of tree species to adapt to environmental changes. Also the occurrence of high production events synchronized among trees raises questions: Can it be due to variations in climate conditions or to the limitation of any resources or to a strategy developped e.g. against predators? Different studies used the litterfall data collected from 1994 to 2007 on all the 102 RENECOFOR plots to investigate the variations in fruit
production. Caignard et al. (2017) evidenced that the oak acorn production significantly increases with spring temperature, both on the RENECOFOR plots and on an experiment set up along an altitudinal gradient in the Pyrenees. While looking for the main drivers of the spatio-temporal variations of fruit production among a large set of possible factors, Lebourgeois et al. (2018) confirmed that temperature variables play a major role, for both oak and beech. But the best models found are different for the two species and also involve some other factors. For beech, the fruit production is highly synchronized between plots every 2 years, consistently with the amount of pollen in the air, and it is negatively related with the growth of the same year. For oak, it is poorly synchronized between plots, apparently not limited by the amount of pollen, but enhanced by high carbon inputs in late summer and positively correlated with the growth of the same year. However, fruit production is highly variable and rather poorly explained by empirical models. To better understand the mechanisms behind such dynamics, 12 RENECOFOR oak plots have given support to measure fruit production by individual tree since 2012 and helped to develop a process-based model (Venner et al. 2016).
Leaf phenology is also an important component of the tree response to climate variations. The data collected since 1997 in all the RENECOFOR plots have been used to improve process-based models in several studies and once again by Gauzere et al. (2017). In addition, the data collected by individual tree since 2009 were used to document the variations within stands (Delpierre et al. 2017). This study showed that individual phenological ranks mostly repeat from year to year among trees of a given population, though ranks of leaf unfolding tend to repeat more than those of leaf senescence. Also, leaf phenology is correlated with individual growth in a given tree population: Trees tend to grow more if they are early-leafers in the case of beech stands, and if they enter senescence later in the case of oak stands.
Climate change challenges the ability of forests to adapt, but also to mitigate the net emission of carbon dioxide into the atmosphere. The soil sampling repeated twice on all the RENECOFOR plots revealed a significant increase of their soil organic C stocks within 15 years, at a mean rate of +0.35 t/ha/yr (Jonard et al. 2017). Compared to their initial amount, the relative annual increase was about 4‰, which has been a target internationally promoted since the Paris Climate Conference in 2015 (COP21). Even if the plots are not quantitatively representative of French forest soils, the large range of ecological conditions they are covering makes this result highly valuable. Concerning the carbon sequestered into tree biomass, RENECOFOR data were also helpful to better account for environmental controls of C allocation when simulating forest growth with the process-based model CASTANEA (Guillemot et al. 2017).
64 | 2018 Technical Report of ICP Forests
In addition to climate change, atmospheric pollutions can still impact forest ecosystems. In his PhD thesis, Simon Rizzetto (2017) further developed the modelling of biogeochemical cycling in order to simulate the combined impacts of climate change and N deposition to forest soil chemistry and to the composition of the ground vegetation. RENECOFOR plots and archived samples were also used to search for bioindicators of deposition of persistant pollutants. Agnan et al. (2017) evaluated the sensitivity of lichen species to the metal deposition accumulated in lichen biomass. In her PhD thesis, Sara Negro (2017) showed that the polycyclic aromatic hydrocarbons measured in archived foliar samples can be used to trace back the variations of their atmospheric deposition.
Finally, besides the atmospheric conditions, some biological factors also influence forest ecosystems, like the density of wild ungulate populations (which increased in France for the last decades). Boulanger et al. (2018) evaluated the impact of these populations by comparing the temporal variation of the ground vegetation composition inside and outside the fenced central part of RENECOFOR plots. Differences were already significant after 10 years. Outside, forest ungulates maintained a higher species richness in the herbaceous layer (+15%), while the shrub layer was 17% less rich, and the plant communities became more light-demanding. Inside, shrub cover increased, often to the benefit of bramble (Rubus fruticosus agg.). However, ungulates tend to favour ruderal, hemerobic, epizoochorous and non-forest species. To sum up, they increase plant species richness in forest but to the benefit of non-forest species.
National publications/reports published with regard to ICP Forests data and/or plots
Agnan Y, Probst A, Séjalon-Delmas N (2017) Evaluation of lichen species resistance to atmospheric metal pollution by coupling diversity and bioaccumulation approaches: A new bioindication scale for French forested areas. Ecol Indicat 72:99–110. doi 10.1016/j.ecolind.2016.08.006
Ascoli D, Maringer J, Hacket-Pain A, Conedera M, Drobyshev I, Motta R, Cirolli M, Kantorowicz W, Zang C, Schueler S, Croisé L, Piussi P, Berretti R, Palaghianu C, Westergren M, Lageard JGA, Burkart A, Gehrig Bichsel R, Thomas PA, Beudert B, Övergaard R, Vacchiano G (2017) Two centuries of masting data for European beech and Norway spruce across the European continent (data paper). Ecol 98(5):1473. doi:10.1002/ecy.1785
Boulanger V, Dupouey JL, Archaux F, Badeau V, Baltzinger C, Chevalier R, Corcket E, Dumas Y, Forgeard F, Mårell A, Montpied P, Paillet Y, Picard JF, Saïd S, Ulrich E (2018) Ungulates increase forest plant species richness to the benefit of non-forest specialists. Glob Change Biol 24(2):485–495. doi: 10.1111/gcb.13899
Caignard T, Kremer A, Firmat C, Nicolas M, Venner S, Delzon S (2017) Increasing spring temperatures favor oak seed
production in temperate areas. Sci Rep 7(1): 1–8. doi:10.1038/s41598-017-09172-7
Delpierre N, Guillemot J, Dufrêne E, Cecchini S, Nicolas M (2017 Tree phenological ranks repeat from year to year and correlate with growth in temperate deciduous forests. Agri For Meteo 234–235:110. doi: 10.1016/j.agrformet.2016.12.008
Fernandez-Martinez M, Vicca S, Janssens IA, Espelta JP, Peñuelas J (2017) The role of nutrients, productivity and climate in determining tree fruit production in European forests. New Phytol 213(2):669–679. doi: 10.1111/nph.14193 (online 08/09/2016)
Gauzere J, Delzon S, Davi H, Bonhomme M, Garcia de Cortazar-Atauri I, Chuine I (2017) Integrating interactive effects of chilling and photoperiod in phenological process-based models: A case study with two European tree species: Fagus sylvatica and Quercus petraea. Agri For Meteo 244: 9–20. doi:10.1016/j.agrformet.2017.05.011
Guillemot J, François C, Hmimina G, Dufrêne E, Martin-StPaul NK, Soudani KMG, Ourcival J-M, Delpierre N (2017) Environmental control of carbon allocation matters for modelling forest growth. New Phytol. 214(1):180–193. doi: 10.1111/nph.14320
Jonard M, Nicolas M, Coomes DA, Caignet I, Saenger A, Ponette Q (2017) Forest soils in France are sequestering substantial amounts of carbon. Sci Total Environ 574:616–628. doi: 10.1016/j.scitotenv.2016.09.028
Lebourgeois F, Delpierre N, Dufrêne E, Cecchini S, Macé S, Croisé L, Nicolas M (2018) Assessing the roles of temperature, carbon inputs and airborne pollen as drivers of fructification in European temperate deciduous forests. Eur J For Res. doi: 10.1007/s10342-018-1108-1
Negro S (2017) Rôle des écosystèmes forestiers dans le transfert des HAP de l'atmosphère aux sols : étude des placettes du réseau RENECOFOR. Thèse de doctorat, Université Grenoble Alpes, 270 p
Rizzetto S (2017) Prédiction de la sensibilité biogéochimique et écologique des écosystèmes forestiers français aux dépôts atmosphériques azotés dans un contexte de changement global. Thèse de doctorat, Université de Toulouse, 374 p
Venner S, Siberchicot A, Pélisson PF, Schermer E, Bel-Venner MC, Nicolas M, Débias F, Miele V, Sauzet S, Boulanger V, Delzon S (2016) Fruiting strategies of perennial plants: a resource budget model to couple mast seeding to pollination efficiency and resource allocation strategies. American Naturalist 188(1):66-75. doi: 10.1086/686684
Outlook
The French Level II network (RENECOFOR) will reach its initially defined 30-yr horizon in 2022. The conference organized for its

2018 Technical Report of ICP Forests | 65
25th anniversary in 2017 successfully drew the attention on its usefulness and on the need for long-term forest monitoring. This will depend on our ability to motivate new political commitments for its future funding. It is also the opportunity to reconsider the design of the network to technically ensure its very long-term suitability and to possibly adapt it to new priorities.
Germany
National Focal Centre
Sigrid Strich, Federal Ministry of Food and Agriculture Scientific support: Thünen Institute of Forest Ecosystems
Main activities/developments
Germany continued its assessment at Level I and II. The 2017 crown condition survey took place on 416 Level I plots with a total number of 10 002 sample trees. Level II data has been submitted for 89 plots.
Major results/highlights
Crown condition In summer 2017, 23% of the forest area was classified as damaged (defoliation > 25% or damage classes 2 to 4), compared to 28% in 2016. 43% (2016: 41%) were in the warning stage and 34% (2016: 31%) showed no sign of defoliation. Mean crown defoliation decreased from 21.2% to 19.7%.
Picea abies: The percentage of damage classes 2 to 4 decreased from 31% to 25%. 39% (2016: 34%) of the trees were in the warning stage. The share of trees without defoliation was 36% (2016: 35%). Mean crown defoliation decreased from 21.0% to 19.7%.
Pinus sylvestris: In 2017 the share of damage classes 2 to 4 was 14%, the same as in 2016. 49% were in the warning stage (2016: 51%). 37% (2016: 35%) showed no defoliation. Mean crown defoliation almost did not change: 17.4% against 17.5% in the previous year.
Fagus sylvatica: Crown condition significantly improved compared to 2016. The share of trees in the damage classes 2 to 4 decreased from 52% to 31%. 44% (2016: 36%) were in the warning stage. The share showing no defoliation increased from 12% to 25%. Mean crown defoliation decreased from 28.6% to 22.5%.
Quercus petraea and Q. robur: The share of damaged trees increased from 28% to 32%. The share of trees in the warning
stage was 43% (2016: 48%). The share without defoliation was 25% (2016: 24%) Mean crown defoliation increased from 21.4% to 22.9%.
Intensive monitoring Long-term analysis of phenological data from plot level observations show a trend towards an earlier start of spring flushing in spruce and beech by 0.8 and 0.6 days per year, respectively for the years 1998 to 2015. The largest difference in single tree observation is also found in spruce where 100% of the trees showed a two to eight days earlier budburst compared to 2010 (mean: five days). For beech 83% of the trees started up to four days earlier (mean: two days); going align with a slightly earlier (mean: one, range zero to five days) autumn colouring of leaves, the vegetation period of beech shows a lengthening by about two days for 69% of the trees, and a shortening by about two days for 31%. Oak trees showed a later bud burst going align with later leaf colouring which lead to a prolongation of the vegetation period by about two days in 80% of the trees; 20% showed a shortening by about a day.1
This goes in line with the analysis of the meteorological data showing an increase of the mean annual temperature by 1°C on all analysed 76 plots compared to the long-term mean of the reference period. Precipitaion decreased on 12% and increased on 49% of the plots, the rest showed no change.
National publications/reports published with regard to ICP Forests data and/or plots
Please refer to this page: http://blumwald.thuenen.de/level-ii/literatur/
More information on the environmental monitoring of forests in Germany (in German language) can be found at: https://www.bmel.de/DE/Wald-Fischerei/Forst-Holzwirtschaft/Zustandserhebungen/InventurenErhebungen-node.html
Outlook
The Federal Government is preparing the national implementation of the new EU NEC Directive (DIRECTIVE (EU) 2016/2284 OF THE EUROPEAN PARLIAMENT AND OF THE COUNCIL of 14 December 2016 on the reduction of national emissions of certain atmospheric pollutants). The national forest soil inventory and the intensive monitoring on Level II plots are expected to become a key source of information for monitoring and reporting effects of air pollution under Article 9 and 10 of the directive, while many details are still open and need to be settled by 2019.
1 Based on an analysis by Stephan Raspe, LWF

66 | 2018 Technical Report of ICP Forests
Greece
National Focal Centre
Dr Panagiotis Michopoulos Hellenic Agricultural Organization – DEMETER, Institute of Mediterranean Forest Ecosystems (www.fria.gr)
Main activities/developments and major results/highlights
Level I plots Crown condition assessment For the assessment of the crown condition, data was collected from 36 plots representing a 36% percentage of the total number of the Level I plots in our country. More specifically, in 2017 the number of trees counted was 855, whereas in 2016 the number of trees was 539. From the 855 trees, 274 were conifers and 581 broadleaves.
The following table shows the results of the crown assessment for all tree species.
Crown assessment (Level I plots)
All tree species
Conifer species
Broadleaf species
No defoliation 51.2% 27.0% 62.7%
Slight defoliation 28.5% 40.9% 22.7%
Moderate defoliation 16.3% 31.0% 9.3%
Severe defoliation 1.6% 0.7% 2.1%
Dead trees 2.3% 0.4% 3.3%
It was found that 79.8% of all trees belonged to the classes “No defoliation” and “Slight defoliation”. The corresponding values were 67.9% and 85.4% for conifers and broadleaves, respectively. The major damage causes in conifers were needle loss, insects, European mistletoe and abiotic factors. With regard to broadleaves, the most important agents were leaf loss, insect attack and abiotic factors.
Level II plots In Greece, there are four Level II plots. Plot 1 having an evergreen broadleaved vegetation (mainly Q.ilex), plot 2 with deciduous oak (Q. frainetto), plot 3 with beech (F.sylvatica) and plot 4 with Bulgarian fir (A. borisii regis). Full scale activities take place in plots 1 and 4.
From the assessment of the meteorological data, it was found that the average monthly air temperature values were particularly high in all plots in February and April 2016.
With regard to rainfall, in all plots the average annual rain height for 2016 ranged above the average annual value (derived from the last 44 years). It must be mentioned, however, that in December in the maquis plot the amount of rain was only 4 mm and in the fir plot it was 37 mm. These values have been recorded as the lowest from 1973 until today.
Crown condition assessment (Level II plots) The crown assessment in 2016 in the four Level II plots took place on a total number of 166 trees (34 conifers and 133 broadleaves). The results showed that there was an improvement in tree health in comparison with the results of the last two previous years (see the following table).
Crown assessment (Level II plots)
Spec
ies
Year
No
defo
liatio
n
Slig
ht
defo
liatio
n
Mod
erat
e de
folia
tion
Seve
re
defo
liatio
n
Dead
tree
s
Conifers 2014 47.1% 20.6% 23.5% 2.9% 5.9% 2015 38.2% 23.5% 32.4% 2.9% 2.9%
2016 29.4% 47.1% 17.6% 5.9% 0.0% Broadleaves 2014 48.5% 41.2% 7.4% 2.2% 0.7%
2015 47.1% 35.3% 10.3% 4.4% 2.9% 2016 43.2% 41.7% 9.8% 5.3% 0.0%
Deposition The next table shows the deposition fluxes (bulk and throughfall) of the major ions in the maquis and fir plots in 2016. The amount of rain for 2016 was higher in the fir plot and as a result, this fact contributed to the fluxes magnitude. In both plots, the fluxes of Mg and K were higher in throughfall due to leaching. The K enrichment in throughfall was much higher in the fir plot. The high surface of needle foliage in the fir plot played a major role to this fact. The same happened with the sulfate ion. However, with regard to sulfate, dry deposition was the main cause of throughfall enrichment (and not leaching). In both plots, the inorganic N had lower fluxes in throughfall. This means direct absorption of N by foliage in both plots.
Fluxes (kg ha-1 yr-1) of major ions in deposition (throughfall and bulk) in two forest plots
Plots Dep. Ca Mg K SO42- -S NH4+ -N
NO3- -N
mm
Maquis T 27.3 5.17 27.4 17.5 1.29 3.09 976
“ B 31.5 3.74 10.2 13.3 2.76 3.72 1365
Fir T 38.6 6.14 36.2 20.4 2.18 3.25 1403
“ B 34.6 3.26 7.14 16.5 3.77 3.30 1801
Litterfall The oak plot had the highest fluxes in foliar litterfall for all major nutrients in 2016, whereas the maquis plot had the

2018 Technical Report of ICP Forests | 67
lowest with the exception of P (s. table below). For the non foliar litter the fir plot had by far the highest amounts of all nutrients. For the oak and beech plots situated on acidic soils, the non foliar litter of Ca, Mg and K plays a significant role in supplying the soil with base cations. It is recommended that the remains after felling stay on soils to decompose.
Fluxes (kg ha-1 yr-1) of major nutrients in litterfall in four forest plots in 2016
Foliar Ca Mg K S N P
Maquis 44.8 4.53 5.39 4.05 35.5 1.69
Oak 78.2 9.69 14.8 10.8 56.8 2.93
Beech 57.0 6.34 5.10 4.40 42.4 1.40
Fir 60.0 3.69 6.06 3.44 39.7 2.77
Non Foliar Ca Mg K S N P
Maquis 12.4 1.62 4.46 1.20 14.3 0.78
Oak 23.6 2.12 4.80 1.62 18.7 1.11
Beech 13.6 1.14 2.96 1.00 10.4 0.73
Fir 23.1 2.19 5.20 2.46 21.4 1.65
Evaluation of growth characteristics Our work focused on the determination of the best non-linear function describing the relation between height and diameter, the estimation of the decline in growth and the relation of this decline with regional climatic conditions in the fir, oak and beech forests. Among others, our observation of growth decline can be interpreted more broadly in terms of medium-or long-term decreased timber production and/or value of forest products, especially when considering sustainably managed forests.
National publications/reports published with regard to ICP Forests data and/or plots
Daskalakou E, Koulelis P, Karantzalou P, Michopoulos P, Kaoukis K, Bourletsikas A (2017) Monitoring and evaluation of growth characteristics on ICP-Forests intensive monitoring plots of Greece. 18th Panhellenic Forestry Congress & International Workshop, Edessa, Greece
Kaoukis K, Bourletsikas A, Tsagari C, Baloutsos G, Karetsos G (2017) Trend analysis of long-lasting air temperature and precipitation time series of a mountain forest meteorological station. 18th Panhellenic Forestry Congress & International Workshop, Edessa, Greece
Karavoltsos S, Fotiadis F, Michopoulos P, Sakellari A, Plavsic P, Bourletsikas A, Kaoukis K, Thomaidis NS, Dassenakis M (2017) Organic complexation of copper in throughfall and open field bulk deposition: Influence of the tree canopy of Mediterranean forest ecosystems. Chemosph 167:28–35
Michopoulos P, Bourletsikas A, Kaoukis K, Grigoratos T, Samara C (2017) Nutrients in litterfall and forest floor in
two adjacent forest ecosystems in the area of Ossa. 18th Panhellenic Greek Forestry Congress & International Workshop, Edessa, Greece
Michopoulos M, Kostakis G, Thomaidis NS, Pasias IN, Kaberi H, Iliakis S (2017) The use of lead isotopes to quantify anthropogenic pollution in soil of a mountainous fir ecosystem. 6th Environmental Congress of Macedonia, Thessaloniki, Greece
Hungary
National Focal Centre
László Kolozs, National Food Chain Safety Office
Main activities/developments
Level I is the large-scale health condition monitoring coordinated and carried out by the experts of the Forestry Directorate. The annual survey includes 78 permanent sample plots with a total of 1 872 sample trees on the 16 x 16 km grid.
In 2017, 77 permanent plots (one plot was a clearcut) with a total of 1 844 sample trees were included in the crown condition assessment. The survey was carried out between 15 July and 15 August. The percenatage of broadleaves was 90.6% while the percenatege of conifers was 9.4%.
Major results/highlights
Level I From the total number of sample trees surveyed, only 29.9% were without visible damage. The proportion of the not defoliated trees has decreased compared to the previous years. The percentage of slightly defoliated trees was 29.1%, and the percentage of all trees within defoliation classes 2-4 (moderately damaged, severely damaged and dead) was 41%. In Hungary - based on the ICP Forests manual - the dead trees remain in the sample while they are standing, but the newly (in the surveyed year) died trees can be separated. The rate of trees that died in 2017 was 0.6% of all trees. The mean defoliation slightly increased from 25.3% to 28.8%.
Negative alteration was observed in respect of the defoliation rates by most of the species. Pinus nigra or black pine has been the most defoliated and damaged tree species in recent years but in 2017 Quercus robur or pedunculate oak showed the biggest decline in health condition: only 3.8% of the sample trees were in the healthy category (defoliation class 1) and most of the observed damages were caused by fungi (mostly Microsphaera quercina).

68 | 2018 Technical Report of ICP Forests
Although the damage caused by insects (25.3% for all sample trees) and fungi (21.3%) was dominant in general, the rates of the damaging agents showed differences in proportions between the tree species. The number of abiotic damages increased from 13% to 20.9% and most of the observed damages were caused by periods of drought and long-term heatwaves during summer. The rate of the damages with unknown origins (12.6%) had decreased compared to the previous years.
The rates of the damages caused by direct action of man (6.7%) and other biotic agents (7.7%) have not changed significantly. Game damage was generally of low frequency (4.5%) but in some tree species groups (poplars, beech, robinia and hornbeam) it appeared more often.
The fire damage was not really common in the assessed stands (1%).
National publications/reports published with regard to ICP Forests data and/or plots
“Erdeink egészségi állapota 2017-ben” The annual national report on the health condition of the Hungarian forest which includes ICP Forests plot data is available (in Hungarian) online at http://portal.nebih.gov.hu/-/emmr-kiadvanyok-jelentesek
Italy
National Focal Centre
Giancarlo Papitto, Carabinieri Corps – Office for Studies and Projects
Report on 2017 national crown condition survey
The survey of Level I in 2017 took into consideration the condition of the crown of 4 783 selected trees in 247 plots belonging to the EU network on a 16 x 16 km grid. The results given below relate to the distribution of frequencies of the indicators used, especially transparency - which in our case we use for the indirect assessment of defoliation and the presence of biotic agents and abiotic factors causing damage. For the damage assessment, we did not analyse the frequency of affected trees and each tree may have multiple symptoms and agents.
Defoliation data are reported according to the usual categorical system (class 0: 0-10%; class 1: >10-25%; class 2: >25-60%; class 3: >60%; class 4: tree dead): most trees (78.4%) are included in the classes 1 to 4; 38.8% are included in the classes 2 to 4.
By analyzing the sample for groups of species, conifers and broadleaves, it appears that conifers have a lower transparency than deciduous trees: 43.7% of conifers and 13.4% of broadleaves are in the class 0 of transparency, while 22.3% of conifers and 44.9% of broadleaves are included in the classes 2 to 4.
For a survey of the frequency distribution of the parameter for transparency, species were divided into two age categories (<60 and ≥60 years). Among the young conifers (<60 years), Pinus pinea has (97.5%) of trees in the classes 2 to 4, Picea abies and Pinus sylvestris have respectively (16.1%) and (20.9%) of trees in the classes 2 to 4, Pinus nigra and Larix decidua have respectively (25.0%) and (18.0%) of trees in the classes 2 to 4.
Among the old conifers (≥60 years), among the species which appear to be with worse quality of foliage are Pinus nigra (28.0%), Larix decidua (23.5%) and Picea abies (13.1%) of trees in the classes 2 to 4, while Abies alba (14.9%) and Pinus cembra (3.2%) are conifers in better condition.
Among the young broadleaves (<60 years), Castanea sativa, Quercus pubescens and Ostrya carpinifolia have respectively (70.5%), (53.7%) and (52.5%) of trees in the classes 2 to 4, while Quercus cerris and Fagus sylvatica, have a frequency range between (25.0%) and (34.2%) in classes 2 to 4.
Among the old broadleaves (≥60 years) in the classes 2 to 4, Castanea sativa has (66.1%), Quercus pubescens (60.9%), Ostrya carpinifolia (70.8%), Fagus sylvatica (52.5%), while Quercus ilex (19.7%) has the lowest level of defoliation of trees in the classes 2 to 4.
Starting from 2005, a new methodology for a deeper assessment of damage factors (biotic and abiotic) was introduced. The main results are summarized below.
Most of the observed symptoms were attributed to insects (16.4%), subdivided into defoliators (13.1%) and galls (0.9%). Following were symptoms attributed to fungi (3.4%), the most significant are attributable to “dieback and canker fungi” (2.1%). From those assigned to abiotic agents, the most significant are attributable to the high temperatures recorded in summer: droughts (10.5%) and frosts (2.3%).
Latvia
National Focal Centre
Uldis Zvirbulis, Latvian State Forest Research Institute Silava

2018 Technical Report of ICP Forests | 69
Main activities/developments
Latvia continued assessment at Level I and II plots. The forest condition survey 2017 in Latvia was carried out on 115 Level I NFI plots. The major results of 2017 are based on data from this dataset.
Level II: All measurements and sampling were done on a regular basis, including: annual crown condition assessment (2 sample plots), continuous measurements of tree growth (3 sample plots), seasonal soil solution sampling (3 sample plots), continuous sampling of deposition (3 sample plots), seasonal monitoring of air quality (1 sample plot), continuous sampling of litterfall (1 litterfall).
Major results/highlights
In total, defoliation of 1 741 trees was assessed, of which 77% were conifers and 23% were broadleaves. Of all tree species, 11.4% were not defoliated, 83.3% were slightly defoliated and 5.3% were moderately defoliated to dead. Compared to 2016, the proportion of not defoliated trees has increased by 3.4%, the proportion of slightly defoliated trees has decreased by 3.1%, but the proportion of moderately defoliated to dead trees has decreased by 0.4%. In 2017, the proportion of not defoliated conifers was by 8.0% higher than that of not defoliated broadleaves, the proportion of slightly defoliated broadleaves was by 8.2% higher than that of slightly defoliated conifers. Proportion of trees in defoliation classes 2-4 for conifers was 0.1% higher than for broadleaves.
Mean defoliation of Pinus sylvestris was 19.9% (20.3% in 2016). The share of moderately damaged to dead trees constituted 4.8% (5.9% in 2016). Mean defoliation of Picea abies was 19.1% (18.2% in 2016). The share of moderately damaged to dead trees for spruce constituted 6.0% (2.7% in 2016). The mean defoliation level of Betula spp. was 20.7% (20.6% in 2016), showing insignificant increase of the defoliation level. The share of trees in defoliation classes 2-4 was 5.2% (compared to 8.3% in 2016).
Visible damage symptoms were observed to a smaller extent than in the previous year – 17.8% of the assessed trees (19.3% of the assessed trees in 2016). Most frequently recorded damages were still caused by direct action of men (34.5%; 34.5% in 2016), animals (24.2%; 22.8% in 2016), fungi (11.3%; 9.3% in 2016), abiotic factors (12.3%; 12.9% in 2016) and insects (11.0%; 17.1% in 2016) and unknown causes – for 6.8% (2.7% in 2016). The distribution of damage causes was similar to last year. Proportion of insect damages has continuously decreased. Proportion of damages by European pine sawfly Neodiprion sertifer has decreased compared to 2016. The greatest share of trees with damage symptoms was recorded for Picea abies (25.7%) and the smallest for Betula spp. (14.1%).
National publications/reports published with regard to ICP Forests data and/or plots
Petaja G, Lupikis A, Lazdins A (2017) Changes in forest floor and tree vegetation in the Level II monitoring plot in Valgunde Parish. Research for rural development 1:47–54
Outlook
Currently, Latvia has 115 Level I plots and 3 sample plots in Level II monitoring and it is planned to maintain those sample plots also in future. There are no plans for significant changes or improvements in the next year.
Lithuania
National Focal Centre
Marijus Eigirdas, Lithuania State Forest Survey Service
Main activities/developments
In 2017, forest condition survey was carried out on 1 031 sample plots from which 82 plots were on the transnational Level I grid and 949 plots on the National Forest Inventory grid. In total 6 057 sample trees representing 19 tree species were assessed. The main tree species assessed were Pinus sylvestris, Picea abies, Betula pendula, Betula pubescens, Populus tremula, Alnus glutinosa, Alnus incana, Fraxinus excelsior, and Quercus robur.
Major results/highlights
During one year the mean defoliation of all tree species slightly decreased up to 22.1% (22.4% in 2016). 16% of all sample trees were not defoliated (class 0), 63% were slightly defoliated and 21% were assessed as moderately defoliated, severely defoliated and dead (defoliation classes 2-4).
Mean defoliation of conifers slightly decreased up to 22.2% (22.3% in 2016) and slightly decreased for broadleaves up to 21.9% (22.7% in 2016).
Pinus sylvestris is a dominant tree species in Lithuanian forests and comprises about 36% of all sample trees annually. Mean defoliation of Pinus sylvestris slightly decreased up to 23.0% (23.1% in 2016), while in 2008–2015 a slightly increasing trend in defoliation was observed.
Populus tremula had the lowest mean defoliation and the lowest share of trees in defoliation classes 2-4 since 2006. Mean defoliation of Populus tremula was 18.9% (19.1% in 2016) and the proportion of trees in defoliation classes 2-4 was 7.4% compared with 9.5% in 2016.

70 | 2018 Technical Report of ICP Forests
Fraxinus excelsior condition remained the worst among all observed tree species. This tree species had the highest defoliation since 2000. Mean defoliation decreased to 32.5% (42.5% in 2016). The share of trees in defoliation classes 2-4 decreased to 41% (62% in 2016).
24% of all sample trees had some kind of identifiable damage symptom. The most frequent damage was caused by abiotic agents (about 7%) in the period of 2011–2017. The highest share of damage symptoms was assessed for Fraxinus excelsior (50%), Alnus incana (35%) and Populus tremula (38%), the least for Betula sp. (17%) and Alnus glutinosa (16%).
In general, the mean defoliation of all tree species has varied inconsiderably from 1997 to 2017 and the growing conditions of Lithuanian forests can be defined as relatively stable.
Outlook
In 2018 one Level II plot was moved to a new location and all assessments in the corresponding plot are planned to be performed according to ICP Forests manual requirements this year.
Pollution deposition surveys, carried out since 2000, show that sulphur deposition under tree crowns has constantly decreased since 2000. The amount of sulphur deposition with under crown precipitation has decreased from 10 to 4 kg ha-1 yr-1, while sulphur deposition in an open area fluctuates between 8 to 3 kg ha-1 yr-1.
Meanwhile, average nitrate deposition (NO3–N) both in an open area and under tree crowns is fluctuating from 5 to 7 kg ha-1 yr-1. Average ammonium deposition in the forest per year equals to around 4-5 kg ha-1, while in an open area it reaches nearly 4 kg ha-1 yr-1.
Luxembourg
National Focal Centre
Elisabeth Freymann, Administration de la nature et des forêts
Report on 2017 national crown condition survey
In 2017, the national forest condition survey was based on a 4 x 4 km grid, which included 1 200 sample trees on 52 permanent plots. On average over all tree species, 29.6% of the sample trees were showing no defoliation, 30.3% were assessed as damaged (classes 2-4), and 40.1% were in the warning stage. For conifers 17.7% were in defoliation classes 2-4, 30.9% were slightly defoliated, and 51.4% were not defoliated. 45.6% of beaches were assessed as damaged (classes 2-4), 43.2% were
slightly defoliated, and 11.2% showed no signs of defoliation. For oaks and other broadleaves 23.4% showed no defoliation, 46.8% were in warning stage and 29.8 % showed no defoliation.
Republic of Moldova
National Focal Centre
Valeriu Caisîn, Ion Cvasov, Forest Research and Management Institute (ICAS)
Report on 2017 national crown condition survey
The health status of forests in the Republic of Moldova in 2017 was conducted on 618 permanent plots of the national 2 x 2 km network. From a total number of 14 233 trees, 14 172 trees were broadleaves (99.6%) and 61 trees were conifers (0.4%).
The percentage of damaged trees (defoliation class 2-4) increased by 2.2% compared with the previous year. At the same time, the percentage of trees with class 0 decreased by 0.7% and makes up 34.7%.
According to the data obtained this year, the percentage of trees with 2-4 defoliation class for all broadleaves was 28.7%. Among the main species, the most affected were Quercus robur (34.6%), Fraxinus excelsior (30%), Carpinus betulus (27.7%) and Robinia pseudoacacia (27%). The least affected species were Quercus pubescens (8.6%) and Populus alba (13.3%). From the total number of conifer trees a percentage of 19.6% was classified as damaged (defoliation classes 2-4). Broadleaves were more affected than conifers, the share of broadleaved trees in the defoliation classes 1-4 was 65.3% compared to 36% for conifers.
In general in the Republic of Moldova the mean defoliation of all tree species manifested a slight improvement during the last years of trees health status assessments.
Outlook
The monitoring of the forests in the Republic of Moldova will continue with the assessment of the crown condition at Level I on the 2 x 2 km network and at the same time uploading the data according to the European 16x16km network.
Forest monitoring activities for this year on Level II were based on collecting foliar and soil samples from 10 plots. In lack of a specialized laboratory, we are planning to make chemical analyses of foliar chemistry, soil solution chemistry and atmospheric deposition in common with colleges from the National Institute for Research and Development in Forestry (INCDS) „Marin Drăcea”.

2018 Technical Report of ICP Forests | 71
Norway
National Focal Centre
Volkmar Timmermann, Norwegian Institute of Bioeconomy Research (NIBIO)
Main activities/developments
The department of Forest Health at NIBIO is responsible for the forest monitoring in Norway and works in close cooperation with the departments of Terrestrial Ecology, Forest and Climate and the National Forest Inventory (NFI). Norway is represented in 6 Expert Panels (Soil, Foliage, Crown, Growth, Vegetation and Deposition), in the Working Group QA/QC, and is holding the co-chair in EP Crown. In 2017 we participated in the joint Expert Panel meeting in Zagreb (March), ICP Forests Scientific Conference and Task Force meeting in Bucharest (May), the IUFRO 125th Anniversary Congress in Freiburg (September), and the IUFRO Tokyo conference (October). Level I In 2017, the Norwegian national forest monitoring was conducted on 2 579 observation plots on a systematic grid of 3 x 3 km in forested areas of the country. The plots are part of the NFI, which also is responsible for crown condition assessments. Defoliation assessments were carried out on 10 739 trees (Norway spruce and Scots pine) on 1 866 plots, damage assessments on 19 578 trees (all species) on all plots. A national field calibration course with 25 participants from the NFI was arranged for the monitoring. In 2017, 630 plots were part of the transnational ICP Forests Level I grid (16 x 16 km = 1 plot pr. 256 km2), and crown and damage data for 5 234 trees belonging to 22 species were reported to the ICP Forests database.
Level II At our three Level II sites, the following surveys are conducted: crown condition and damage, tree growth, foliar chemistry, ground vegetation, soil solution chemistry and atmospheric deposition. Chemical analyses are carried out in-house. Ambient air quality (incl. ozone) is measured at two plots, and meteorology at one by the Norwegian Institute for Air Research (NILU). Data from the Level II surveys carried out by NIBIO are reported to ICP Forests annually.
We also reported soil solution and throughfall data from 2 plots (Birkenes and Langtjern) to ICP IM.
Major results/highlights
2017 was the fifth year in Norway with the revised sampling design for Level I where annually one fifth of the NFI plots are monitored with five year revision intervals on the plots, following the rotation of the NFI. From 2013 on we have carried out defoliation assessments only for Picea abies and Pinus sylvestris, while damage assessments are carried out for all tree species present on the plots. This design produces good estimates of average national crown condition; however estimates of regional crown condition are probably less accurate. In 2017, the mean defoliation for Picea abies was 17.5%, and 14.6% for Pinus sylvestris. Defoliation increased for both spruce and pine in 2017, and especially for spruce with an increase of 3 percentage points compared to 2016.
Of all the coniferous trees, 45.7% were rated not defoliated in 2017, which is a decrease of 4.4 percentage points compared to the year before. 46.6% of all Norway spruce trees were not defoliated, which is a decrease of about 4 percentage points compared to the year before. 44.6% of the Pinus sylvestris trees were rated as not defoliated which is a decrease of 3 percentage points.
We observed 7.1% discoloured trees for Picea abies, an increase of one percentage point, and 2.6% for Pinus sylvestris, a decrease of 0.5 percentage points compared to the year before.
The mean mortality rate for the conifers was 0.2% in 2017 with 0.3% for spruce and 0.1% for pine.
In general, the observed crown condition values result from interactions between climate, pests, pathogens and general stress. According to the Norwegian Meteorological Institute the temperature in the summer months of 2017 (June–August) were close to the normal mean temperature (standard reference period 1961–1990) on average for the whole country, while September was considerably warmer with 2.1 °C higher than normal. The lowest summer temperature was observed in the mountains in southern Norway with 0.5 °C to 1 °C below the normal mean, while western Norway had an increased summer temperature of about 1 °C higher than normal. Precipitation was about 30% above normal in June on average for the country, and there was exceptionally much precepitation in central Norway (Trøndelag) and in south-west Norway (Rogaland, Agder and Telemark) with more than 200% of the normal. July and August had about 20% more rain than normal. In sum, the precipitation was 130% of the normal for the 3 most important months (June to August) for the drought sensitive Norway spruce. The last part of the summer is normally not so crucial for growth and mortality for conifers in Norway. There are of course large climatic variations between regions in Norway, ranging from latitudes of 58 to 71°N.

72 | 2018 Technical Report of ICP Forests
National publications/reports published with regard to ICP Forests data and/or plots
Timmermann V, Andreassen K, Clarke N, Flø D, Magnusson C, Nordbakken J-D, Røsberg I, Solheim H, Thunes KH Wollebæk G, Økland B, Aas W (2017) Skogens helsetilstand i Norge. Resultater fra skogskadeovervåkingen i 2016. [The state of health of Norwegian forests. Results from the national forest damage monitoring 2016.] NIBIO Report 3(107): 80 pp. ISBN 978-82-17-01926-8
Outlook
In 2018, we are planning to restart our northernmost Level II site (Svanhovd, closed down in 2004), located close to the Russian border at 68°27’ N.
An ICOS C-flux tower will be installed at one of our Level II sites (Hurdal) during 2018, where also NILU has one of their EMEP sites, opening up for a broad collaboration between ICOS, EMEP and ICP Forests.
Poland
National Focal Centre
Jerzy Wawrzoniak and Pawel Lech, Forest Research Institute
Report on 2017 national crown condition survey
In 2017, the forest condition survey was carried out on 2009 plots (grid 8 km x 8 km).
Forest condition (all species total) remained almost at the same level compared to the previous year. The average total defoliation of all species amounted to 22.8%, of coniferous trees in total to 22.7%, of deciduous trees in total to 22.9%. The percentage of healthy trees (with defoliation of up to 10%) of all species amounted to 10.0%, and the percentage of damaged trees (with defoliation of over 25%) to 20.2%.
Deciduous species were characterized by a higher proportion of healthy trees (13.7%) and a higher proportion of damaged trees (23.3%) than coniferous species (respectively: 7.9% and 18.4%). The proportion of trees from the early warning class (slightly damaged trees, with defoliation of between 11% and 25%) amounted to: for all species 69.8%, for coniferous species 73.7%, and for deciduous species 63.1%.
With regard to the three main coniferous species, Abies alba remained the species with the lowest defoliation (21.2% trees in class 0, 17.4% trees in classes 2-4, mean defoliation amounting
to 20.7%). Pinus sylvestris was characterized by a lower share of trees in class 0 (6.9%), almost the same share of trees in classes 2-4 (17.9%) and a higher mean defoliation (22.7%) than Abies alba. Otherwise Picea abies was characterized by quite a high share of trees in class 0 (12.0%), but as well a higher share of trees in classes 2-4 (25.6%) and a higher mean defoliation (24.4%) compared to Pinus sylvestris and Abies alba.
In 2017 as in the previous survey, the highest defoliation amongst broadleaved trees was observed in Quercus spp. A share of 3.8% of oak trees was without any symptoms of defoliation and 36.2% was in defoliation classes 2-4, the mean defoliation amounted to 26.1%. A little better condition was observed for Betula spp. (7.3% trees without defoliation, 27.6% damage trees (classes 2-4) and the mean defoliation amounted to 25.0%). Fagus sylvatica remained the broadleaved species with the lowest defoliation. In 2017 a share of 32.7% of beech trees was without any symptoms of defoliation, only 7.1% was in defoliation classes 2-4, the mean defoliation amounted to 16.7%. Alnus spp. was more defoliated (13.8% trees without defoliation, 13.3% trees in classes 2-4, the mean defoliation amounted to 20.8%) than Fagus sylvatica. Damage of Fagus sylvatica decreased compared to the previous year. The share of trees without any symptoms of defoliation increased by 8.4 percent points, the share of trees defoliated by more than 25% decreased by 1.7 percent points.
In 2017, discolouration (classes 1-4) was observed on 1.1% of the conifers and on 2.5% of the broadleaves.
Romania
National Focal Centre
Ovidiu Badea, National Institute for Research and Development in Forestry (INCDS) „Marin Drăcea”
Main activities/developments
In 2017, Romania hosted the 33rd ICP Forests Task Force Meeting and the 6th ICP Forests Scientific Conference.
In accordance with the ICP Forests activities the Romanian forest monitoring experts participated in the following events:
− The IUFRO’s 125th Anniversary Congress in Freiburg, Germany
− The Combined Expert Pannel Meeting in Zagreb, Croatia
− The International Cross-Comparison Course on Crown Condition Assessment (ICC 2017 Czech Republic)

2018 Technical Report of ICP Forests | 73
− The 13th ICP Forests Intercalibration Course of the Expert Panel on Ambient Air Quality in Trento, Italy
− The National Cross-Comparison Course on Crown Condition Assessment in Brașov, Romania
Within the Life+ MOTTLES Project, in Rome, Italy, a training course in accordance with the ICP Forests methodology on crown and soil condition assessments and continuous and permanent growth measurements was organized.
Several forest monitoring research collaborations with different Romanian forestry enterprises were also established during the National Conferences „Promoting the transfer of knowledge and research in effective collaboration between research organizations and economic units in the forestry sector” and "Realities and perspectives on the transfer of research results obtained by the Romanian research and development institutes”, Bucharest, Romania.
The forest monitoring data collection and analysis was carried out at both Level I and Level II monitoring networks as follows:
− Annual crown condition assessments on Level I plots (245 permanent plots)
− Forest monitoring activities on Level II plots: crown condition assessments (12 plots); continuous and permanent measurements of tree stem variation (4 plots); collecting foliar samples for broadleaves and conifers (12 plots); phenological observations (4 plots); collecting of leaves and LAI measurements (4 plots); ground vegetation assessments (12 plots); collecting of atmospheric deposition (4 plots); air quality measurements (4 plots); meteorological measurements (4 plots)
− Chemical analysis for deposition samples, air pollutants passive samples (O3, NO2, NH3) and foliar nutrients
− Elaborating of the annual national reports: The Annual Report of the Romanian Environment Status in 2016, The Annual Report of the Romanian Forest Status in 2016, ICP Forests Technical Report 2016
− Validating and submitting the database for all monitoring activities (Level I and Level II)
Major results/highlights
The forest condition survey in Romania was carried out in 2017 on the 16 x 16 km transnational Level I grid net, during 15 July and 15 September.
From the total number of 5 880 assessed trees, in 245 permanent plots, 1 092 trees were conifers (18.6%) and 4 788 broadleaves (81.4%), 51.9% were rated as healthy (defoliation class 0), 33.9% as slightly defoliated (class 1), 12.8% as
moderately defoliated (class 2), 1.3% as severely defoliated (class 3) and 0.2% were dead (class 4).
The overall share of damaged trees (defoliation classes 2-4) was 14.2%, 0.7 percent higher than in 2016. As in previous years the relative increased values of the precipitation regime registered in the southwest part of Romania led to a slight improvement of the health status of xerophyte oaks.
For conifers a percentage of 10.7% of the assessed trees were classified as damaged (classes 2-4), 0.4 percent higher than in 2016. Picea abies was the least affected coniferous species with a share of damaged trees of 9%, whereas Abies alba had 13.5%.
For broadleaves, 15.0% of the trees were recorded as damaged (classes 2-4), 0.7 percent higher than in 2016. Among the main broadleaves species, Fagus sylvatica and Quercus cerris had the lowest share of damaged trees (10.9% and 12.2% respectively). For all Quercus spp. (Q. petraea, Q. cerris, Q. robur, and Q. frainetto) a share of 21.7% from the total number of the assessed trees, was damaged. Fraxinus excelsior was the most affected broadleaved species (32.1%) due to defoliating insects and fungi damages recorded in the northeastern part of the country.
Damage symptoms were reported for 21.9% of the conifers and 32.4% of the broadleaves respectively. The most important causes of damage were attributed to defoliators and xylophages insects (62%) and fungi (9%). In general, the intensity of the visible damage symptoms for the conifers is higher than for broadleaves.
National publications/reports published with regard to ICP Forests data and/or plots
Popa I, Badea O, Silaghi D (2017) Influence of climate on tree health evaluated by defoliation in the ICP level I network (Romania). doi: 10.3832/ifor2202-009. iForest-Biogeosciences and Forestry 10:554–560
De Marco A, Vitale M, Popa I, Anav A, Badea O, Silaghi D, Leca Ș, Screpanti A, Paoletti E (2017) Ozone exposure affects tree defoliation in a continental climate.. Volumes 596–597:396–404. doi: 10.1016/j.scitotenv.2017.03.135
Paoletti E, Materassi A, Fasano G, Hoshika Y, Carriero G, Silaghi D, Badea O (2017) A new-generation 3D ozone FACE (Free Air Controlled Exposure). Scie Total Environ 575:1407–1414. doi: 10.1016/j.scitotenv.2016.09.217
Dick J, Orenstein D, Holzer J, Wohner C. et al. (2018) What is socio-ecological research delivering? A literature survey across 25 international LTSER platforms. Sci Total Environ 622–623:1225–1240. doi: 10.1016/j.scitotenv.2017.11.324,

74 | 2018 Technical Report of ICP Forests
Outlook
The forest monitoring activity in Romania is supported by several research projects as Nucleu Progam - GENERESERV (financed by the Romanian Ministry of Research and Innovation) or the Life+ Mottles project.
A revision of the research infrastructure (field equipment and laboratory instruments) has already been started and will continue in 2018.
Dr. Ovidiu Badea, Dr. Stefan
Serbia
National Focal Centre
Radovan Nevenic, Insitute of Forestry
Report on 2017 national crown condition survey
In the region of the Republic of Serbia, the ICP Forests 16 x 16 km grid consists of 101 sampling plots and an additional 4 x 4 km grid with 29 new plots. Altogether the number of plots is 130 (not including in assessment: AP Kosovo and Metohija). Observations at Level I were performed according to the ICP Forests Manual of Methods.
During 2017, the researchers of the NFC Serbia – Institute of Forestry with collaborators from other institutions in Serbia, have worked on all sampling points and made visual assessments of the crown condition and collected all other necessary field data.
The total number of trees assessed on all sampling points was 2 923 trees, of which 326 were conifer trees and a considerably higher number i.e. 2 597 were broadleaf trees. The conifer tree species are: Abies alba, number of trees and percentage of individual tree species 62 (19.0%), Picea abies 145 (44.5%), Pinus nigra 67 (20.6%), Pinus sylvestris 52 (15.9%) and the most represented broadleaf tree species are: Carpinus betulus, number of trees and percentage of individual tree species 107 (4.1%), Fagus moesiaca 839 (32.3%), Quercus cerris 533 (20.5%), Quercus frainetto 395 (15.2%), Quercus petraea 199 (7.7 %) and other species 524 (20.2%).
The results of the available data processing and the assessment of the degree of defoliation of individual conifer and broadleaf species (%) are: Abies alba (None 83.9, Slight 11.3, Moderate 3.2, Severe 1.6 and Dead 0.0); Picea abies (None 91.7, Slight 4.8, Moderate 1.4, Severe 2.1 and Dead 0.0); Pinus nigra (None 34.3, Slight 19.4, Moderate 37.3, Severe 9.0 and Dead 0.0);
Pinus sylvestris (None 96.2, Slight 3.8, Moderate 0.0, Severe 0.0 and Dead 0.0).
The degree of defoliation calculated for all conifer trees is as follows: no defoliation 79.1% trees, slight defoliation 8.9% trees, moderate 8.9% trees, severe defoliation 3.1% trees and dead 0.0% trees.
Individual tree species defoliation (%) are: Carpinus betulus (None 8.,0, Slight 11.2, Moderate 1.9, Severe 0.9, Dead 0.0); Fagus moesiaca (None 77.2, Slight 13.0, Moderate 8.5, Severe 1.3, Dead 0.0); Quercus cerris (None 69.8, Slight 22.1, Moderate 7.2, Severe 0.9, Dead 0.0); Quercus frainetto (None 80.2, Slight 14.2, Moderate 5.1, Severe 0.5, Dead 0.0); Quercus petraea (None 54.8, Slight 32.2, Moderate 11.0, Severe 1.5, Dead 0.5) and the rest (None 51.5, Slight 23.5, Moderate 20.6, Severe 4.0, Dead 0.4).
Degree of defoliation calculated for all broadleaf species is as follows: no defoliation 69.6% trees, slight defoliation 18.6% trees, moderate 10.0%, severe defoliation 1.7 % trees and dead 0.1 % trees.
The data above show the presence of sample trees with moderate and severe degrees of defoliation, but this does not always signify the reduction of vitality score caused by the effect of adverse agents (climate stress, insect pests, pathogenic fungi). This may only be a temporary phase of natural variability of crown density.
Slovakia
National Focal Centre
Pavel Pavlenda, National Forest Centre – Forest Research Institute Zvolen
Main activities/developments
Crown condition assessment at Level I plots (16 x 16 km grid) was done in 2017 as usually - within 4 weeks of July and August (3 teams in parallel).
Activities related with intensive monitoring are going on 7 Level II monitoring plots with standard frequency twice per month. Defoliation, increment, atmospheric deposition and meteorology are monitored at all these Level II plots but other surveys are limited only to selected plots.
Additional sources of funding are needed for data evaluation and so several research project proposals are prepared and submitted every year at national level. In last years project

2018 Technical Report of ICP Forests | 75
proposals focused at carbon balance, ozone injury and drought effect on forests were granted.
Current research activities focus also on nutrient pools and nutrient balance in forest ecosystems as supporting basis for elaboration of Forest Bioenergy Guidelines (soil sustainability aspects).
Major results/highlights
The 2017 national crown condition survey was carried out on 103 Level I plots of the 16 x 16 km grid. The assessments covered 4 426 trees, 3 737 of which being assessed as dominant or co-dominant trees according to Kraft. Of the 3 737 assessed trees, 31.9% were damaged (defoliation classes 2-4). The respective figures were 41.6% for conifers and 26.0% for broadleaves. Compared to 2016, the share of trees defoliated more than 25% decreased by 8.4 percentage points. Mean defoliation for all tree species together was 24.5%, with 27.7% for conifers and 22.6% for broadleaves. Results show that crown condition in the Slovak Republic is worse than on European average.
In the years 2006–2014 contionuous increase of mean defoliation was detected for the main broadleaved tree species (beech, oak, hornbeam). In 2013, the mean defoliation of broadleaved tree species was for the first time as high as of conifers. In 2015–2016 the mean defoliation decreased again to the level as before 2009. In 2017, the highest mean defoliaton was detected for black locust (38.9%), ash (38.7%) and Scots pine (32.9%).
The recorded fluctuation of defoliation depends mostly on meteorological conditions.
As a part of the crown condition survey, damage types were assessed. 28.2% of all sampling trees (4 426) had some kind of damage symptoms. The highest proportion of trees with damage symptoms was assessed for Scots pine (42% of trees), oak (40%), and hornbeam (33%).
The most important damage was caused by fungi (11.0% of all trees), insects (10.2%) and felling (9.7%). The strongest correlation between damage and defoliation was detected for the presence of epiphytes. 82% of trees damaged by epiphytes (mistletoe) revealed defoliation above 25%.
National publications/reports published with regard to ICP Forests data and/or plots
Sitková Z, Pavlenda P (eds) (2017) Long-term ecological research and monitoring of forests: current knowledge and challenges for the future. Proceedings of the conference held in Zvolen, Nov 7-8, 2017, NFC-FRI Zvolen, 150 pp. (in Slovak) http://www.nlcsk.org/EkoMon
Outlook
Monitoring of forests is a part of the Environmental Monitoring System of the Slovak Republic (one of ten partial monitoring systems such as air quality monitoring, meteorological monitoring, food quality monitoring etc.) based on the decision of the Government of the Slovak Republic. So the routine data collection is supported by this national legislation. The new NEC Directive can be an impulse for better support for forest monitoring also from the environmental sector.
Slovenia
National Focal Centre
dr. Mitja Skudnik, prof. dr. Tom Levanič, Daniel Žlindra, dr. Primož Simončič, Slovenian Forestry Institute (SFI)
Main activities/developments
Similar to previous years also in 2017 the Slovenian national forest health inventory was carried out on 44 systematically arranged sample plots (grid 16 x 16 km) (Level I). The assessment encompassed 1 056 trees, 367 coniferous and 689 broadleaved trees. The sampling scheme and the assessment method was the same as in the previous years (at each location four M6 (six-tree) plots).
In 2017 foliar assessment was carried out on all Slovenian Level II plots. Also, on all plots the phenological observations were carried out and growth with mechanical dendrometers was monitored. Deposition and soil solution monitoring was performed on four Level II core plots and on five additional plots the ambient air quality monitoring (ozone) was done with passive samplers and ozone injuries assessed.
Major results/highlights
Crown Condition
− The mean defoliation of all tree species was estimated at 27.5%. Compared to last year the situation deteriorated by 0.8%.
− Mean defoliation in 2017 for coniferous trees was 28.6%. In 2016 it was 27.8%.
− Mean defoliation in 2017 for broadleaved trees was 26.9%. In 2016 it was 26.1%.
− The share of trees with more than 25% defoliation (damaged trees) in 2017 increased compared to 2016 from 33.8% to 37.0%.

76 | 2018 Technical Report of ICP Forests
− The percentage of damaged broadleaved trees increased from 31.1% in 2016 to 35.1% in 2017.
− The percentage of damaged coniferous trees increased from 38.5% in 2016 to 40.6% in 2017. In 2017 the coniferous forests were still strongly damaged by insects.
− In 2016 and 2017 the share of damaged conifers is higher than the share of damaged broadleaves. Although the percentage of damaged broadleaves increased significantly since 2016.
− The defoliation of conifers in 2017 remains on a very high level. The main reason is the bark beetle outbreak in summer 2016. In 2017 the coniferous forests are still strongly damaged by insects.
Ozone
− Average ozone concentrations in the growing season of 2017 were 29 to 78 μg/m3 on monitored plots and 2 to 15 μg/m3 higher than in 2016. Just on 3 out of 9 plots the average 14-days ozone concentration did not ascend over 80 μg/m3 during the growing season.
− The highest average 14-days concentration was 111 μg/m3 and on average 78 μg/m3 on the most ozone-polluted plot.
Deposition
− On all four Level II core plots N (nitrate, ammonium) and S (sulphate) pollutants in bulk and throughfall deposition slightly increased or stagnated in 2017 according to the previous two years.
National publications/reports published with regard to ICP Forests data and/or plots
Ferlan M, Grah A, Jevšenak J, Levanič T, Ogris N, Planinšek Š, Rupel M, Simončič P (avtor, urednik), Sinjur I, Skudnik M (author, editor), VOCHL S (author, editor), Žlindra D, Žlogar J (2017) Monitoring report on the state of forests in the year 2016: in accordance with the Rules on forest protection (2009). Ljubljana: Slovenian Forestry Institute. VIII, 74 str., ilustr. http://sl.gozdis.si/data/publikacije/StanjeGozdov2016.pdf, http://dirros.openscience.si/IzpisGradiva.php?id=8100, [COBISS.SI-ID 4876454].
Ferlan M, Kutnar L, Levanič T, Skudnik M, Vilhar U, Žlindra D, Simončič P (2016) Proposal of methodology for monitoring forest state in y. 2017: proposal of methodology in accordance with the Rules on forest protection (2009) and international obligations (Convention UNECE CLRTAP). Ljubljana: Slovenian Forestry Institute. 25 str., ilustr. [COBISS.SI-ID 4656038]
Skudnik M (2017) Obremenjenost slovenskih gozdov z dušikovimi spojinami = Pollution of Slovenian forests with nitrogen compounds. V: LIPIČ, Karel (ed.), RIŽNAR, Klavdija (ed.), GRILC, Viktor. Odpadki in emisije v sistemu krožnega gospodarstva : jubilejno 20. strokovno posvetovanje 2017, Moravske Toplice, Hotel Ajda, 30. in 31. marec 2017. Ljubljana: Zveza ekoloških gibanj Slovenije, p. 237-241. [COBISS.SI-ID 4723110]
Vilhar U, De Groot M, Žust A, Skudnik M, Simončič P (2018) Predicting phenology of European beech in forest habitats. IForest 11: 41–47. doi:10.3832/ifor1820-010
Outlook
Current financing allows maintenance of the existing infrastructure and meeting the basic requirements of the ICP Forests reporting.
Spain
National Focal Centre
Ana González and Belén Torres, Technical Officer, Forest Inventory and Statistics Department
Elena Robla, Head of Forest Inventory and Statistics Department
Ministry of Agriculture and Fishing, Food and Environment of Spain
Main activities/developments
Spanish forest damage monitoring comprises:
− European large-scale forest condition monitoring (Level I): 14 880 trees on 620 plots
− European intensive and continuous monitoring of forest ecosystems (Level II): 14 plots
Level I and Level II surveys were been carried out successfully in 2017.
Main activities were:
− May 2017: National Intercalibration Course.
− June 2017: Training course for specialists in forest monitoring.
− October 2017: International Cross-comparison Course 2017 (Photo ICC)
− Others: Continuously updating the website (http://www.mapama.gob.es/es/desarrollo-rural/temas/politica-forestal/inventario-cartografia/redes-europeas-seguimiento-bosques/default.aspx)
2018 Technical Report of ICP Forests | 77
Major results/highlights
Level I Results obtained in 2017 show a general deterioration in the health condition of trees compared to 2016. The number of healthy trees decreased (72.2% compared to 78.2% in 2016) and of trees damaged increased (26% of the trees with defoliation higher than 25%, while in 2016 this percentage was 18%).
The number of dead or missing trees has slightly decreased, although in a smaller proportion than expected (3% in 2017 versus 3.8% in 2016), due to results of missing trees in 2016 corresponding to a two years period, as in 2015 there was no Level I survey in Spain. The mortality of trees is mainly due to felling operations, like sanitary cuts and forest harvesting processes, as well as to decline processes related to isolated water shortages.
General deterioration observed affects both conifers and broadleaves species, and is a little bit more evident in this last group, as the percentage of healthy trees decreased (70.7% compared to 77.2% in 2016), also increasing considerably the percentage of damaged trees. Meanwhile, in the case of conifers, the percentage of healthy trees also decreased (73.8% compared to 79.2% in 2016).
Level II Results of Level II are complex and diverse. A summary can be obtained by consulting the publications mentioned in the next chapter.
National publications/reports published with regard to ICP Forests data and/or plots
Level I1
− Forest Damage Inventory 2017 (Inventario de Daños Forestales 2017)
− Maintenance and Data Collection. European large-scale forest condition monitoring (Level I) in Spain: 2017 Results. (Mantenimiento y toma de datos de la Red Europea de seguimiento a gran escala de los Bosques en España (Red de Nivel I): Resultados 2017).
Level II2
1http://www.mapama.gob.es/es/desarrollo-rural/temas/politica-forestal/inventario-cartografia/redes-europeas-seguimiento-bosques/red_nivel_l_resultados.aspx
2http://www.mapama.gob.es/es/desarrollo-rural/temas/politica-forestal/inventario-cartografia/redes-europeas-seguimiento-bosques/red_nivel_ll_resultados.aspx
− European intensive and continuous monitoring of forest ecosystems, Level II. 2016 Report. (Red europea de seguimiento intensivo y continuo de los ecosistemas forestales, Red de Nivel II).
Spanish versions are available for download.
Outlook
Nowadays data from ICP Forests monitoring provide very useful information to fulfil the international requirements of climate change information. Litter, deadwood and soil surveys are (and are going to be in the near future) the main source of data to assess the variation of carbon in these forestry pools.
Moreover, regional surveys are being carried out by different autonomous communities in Spain. The challenge is to assess whether they fulfill the ICP Forests Manuals or not, and if so, to evaluate the possibility of integrating the data sets into the national databases. The result would be a considerable increase of the Spanish sample. The National Institute for Agricultural and Food Research and Technology (INIA) is beginning a research:
− to collect all the information available related to regional surveys
− to analyse and harmonize it on a national level.
Sweden
National Focal Centre
Lars Lundin, Swedish University of Agricultural Sciences
Report on 2017 national crown condition survey
An annual monitoring of the most important sources of forest damage is carried out by the Swedish National Forest Inventory (NFI). The national results are based on assessment of the main tree species Norway spruce (Picea abies) and Scots pine (Pinus sylvestris) in the National Forest Inventory (NFI), and concern, as previously, only forest of thinning age or older. In total, 7 965 trees on 4 511 sample plots were assessed. The Swedish NFI is carried out on permanent as well as on temporary sample plots. The permanent sample plots, which represent about 60 percent of the total sample, are remeasured every 5th year.
The proportion of trees with more than 25% defoliation is for Norway spruce 19.5% and for Scots pine 11.4%. A reduced number of defoliated Norway spruce is noticed during the last three years. In northern Sweden an improvement in defoliation is seen during recent years. In all of Sweden, defoliation in Scots pine has decreased during the last two years after a five year

78 | 2018 Technical Report of ICP Forests
period of deterioration. There are some large temporal changes seen in defoliation levels at regional level. However the majority of changes during recent years are minor.
There is still damage caused by Ips typographus in central Sweden. However, the bark beetle populations have decreased and it seems that the outbreak will phase out. In northern Sweden problems with resin top disease (Cronartium flaccidum) still occur in young pine stands. In the same area damage by pine twisting rust (Melampsora pinitorqua) also has increased. Multi damage to pines occurs, damage by resin top disease, pine twisting rust and browsing by moose. Diplodia pinea has been found in several pine stands in southern Sweden. This pathogen is new for Sweden and it is important to follow the development of the damage caused by Diplodia.
Overall however the most important biotic damage problems are, as previously, due to pine weevil (Hylobius abietis) (in young forest plantations), browsing by ungulates - mainly moose (in young forest), and root rot caused by Heterobasidion annosum.
Switzerland
National Focal Centre
Arthur Gessler, Peter Waldner, Marcus Schaub Swiss Federal Research Institute WSL
Main activities/developments
The regular monitoring activities and data analyses on the Level I and Level II plots included in 2017 the regular bi-annual foliage sampling of main tree species in August (broadleaves) and October (conifers) on all Level II plots. Regarding the growth inventory we switched from the synchronized 5 year scheme to a rotating scheme and carried out this inventory on three Level II plots in the dormancy period 2017/2018. In addition to the national corwn condition training course in June, 7 field experts also participated in the International Photo Intercalibration Course 2017.
Besides, particular emphasis was put on the following topics:
− The 12th ICP Forests EP and Intercalibration Course of the EP on Ambient Air Quality has been held in Brasov, Romania on 12-15 September 2016 with 19 experts from 9 countries attending.
− The proposal PRO3FILE - Predicting Ozone Fluxes, Impacts and Critical Levels on European Forests has been funded by the Swiss Federal Office for the Environment and aims
at assessing ozone effects on forest growth and makes use of approx. 200 long-term monitoring plots across Europe where ozone concentrations have been measured since 2000, in parallel to meteorological, forest and vegetation variables.
− The study on the effects of climate and impacts of site quality, air quality and climate on growth of European forest ecosystems is completed and the manuscript submitted (Etzold et al.).
− We have started to combine visual assessments of crown condition by experts in the field with image analysis based on deep machine learning algorithms and will continue to include remote sensing products into this approach.
− We started to test the use of Ion Exchange Resin (IER) Columns to measure throughfall and bulk deposition on one of our Level II sites.
Major results/highlights
In 2017, the defoliation increased again after it had been decreasing from 2014 to 2016 (see also BAFU/OFEV 2017). The proportion of "significantly damaged trees1" with defoliation scores between 30% and 100% (class 2-4) increased from 25.3% in 2016 to 33.7% in 2017. The basis for this data is the crown assessment for a total of 1044 trees on 47 plots of the 16x16 km grid in 2017. (The grid includes two further forest plots that currently have no assessable trees.) The percentage observed in 2017 is in the upper range of the most recent period (2005 to 2017), where the average of significantly damaged trees amounted to 26.5% of all trees assessed. The proportion of slightly defoliated trees (class 1) decreased slightly between 2016 and 2017, whereas the moderately defoliated ones (class 2) increased from 13.5% to 21.5%. Moreover, the proportion of not defoliated trees decreased between 2016 (19.4%) and 2017 (12.5%).
In a first test we applied deep machine learning algorithms to crown photographs of various tree species for which defoliation has been assessed. The algorithm was trained on a subset of photos and then used to estimate defoliation on another subset. The algorithm-based prediction was comparably accurate and had a comparable error as the human estimates.
National publications/reports published with regard to ICP Forests data and/or plots
Van der Voort et al. (2017) investigated the molecular dynamics of carbon with the use of soil samples and data from Swiss
1 Trees showing unexplained defoliation subtracting the percentage of defoliation due to known causes such as insect or frost damage, excluding dead trees.

2018 Technical Report of ICP Forests | 79
Level II and other plots. Walthert & Meier (2017) studied tree species distribution on several hundred sites including the Swiss Level I and II plots. Cailleret et al. (2017) synthesized knowledge on growth before mortality.
Van der Voort T S, Zell C I, Hagedorn F, Feng X, McIntyre C P, Haghipour N, Graf Pannatier E, Eglinton T I (2017) Diverse soil carbon dynamics expressed at the molecular Level. Geophysical Research Letters, 44 (23):11,840-11,850. doi: 10.1002/2017GL076188
Walthert L, Meier E S (2017) Tree species distribution in temperate forests is more influenced by soil than by climate. Ecology and Evolution, 7 (22):9473-9484. doi:10.1002/ece3.3436
Cailleret M, Jansen S, Robert E M R, Desoto L, Aakala T, Antos J A, Beikircher B, Bigler C, Bugmann H, Caccianiga M, Cada V, Camarero J J, Cherubini P, Cochard H, Coyea M R, Cufar K, Das A J, Davi H, Delzon S, Dorman M, Gea-Izquierdo G, Gillner S, Haavik L J, Hartmann H, Heres A-M, Hultine K R, Janda P, Kane J M, Kharuk V I, Kitzberger T, Klein T, Kramer K, Lens F, Levanic T, Linares Calderon J C, Lloret F, Lobo-Do-Vale R, Lombardi F, López Rodríguez R, Mäkinen H, Mayr S, Mészáros I, Metsaranta J M, Minunno F, Oberhuber W, Papadopoulos A, Peltoniemi M, Petritan A M, Rohner B, Sangüesa-Barreda G, Sarris D, Smith J M, Stan A B, Sterck F, Stojanovic D B, Suarez M L, Svoboda M, Tognetti R, Torres-Ruiz J M, Trotsiuk V, Villalba R, Vodde F, Westwood A R, Wyckoff P H, Zafirov N, Martínez-Vilalta J (2017) A synthesis of radial growth patterns preceding tree mortality. Glob Change Biol 23 (4):1675–1690. doi: 10.1111/gcb.13535
OFEV (2017) Annuaire La forêt et le bois 2017. Office federal de L’environment OFEV, Berne [French]
BAFU (2017) Jahrbuch Wald und Holz 2017. Bundesamt für Umwelt, Bern [German]
Outlook
− Future developments of the ICP Forests infrastructure in Switzerland
• Upgrading the core technology of the meteorological stations on the Level II plots (as pairs of stations within and outside the forests)
• Prototypes of an online data portal for near real-time access to selected Swiss datasets
• Establishment of a phenocam network
• Deep machine learning, image analyses and remote sensing
− Planned research projects, expected results
• Master thesis on Deep Machine Learning, image analyses and remote sensing
• Post-Doc project on biodiversity effects on defoliation patterns
Turkey
National Focal Centre
Sıtkı Öztürk, Ministry of Forestry and Water Works, General Directorate of Forestry
Main activities/developments
Participation in the ICP Forests monitoring network in order to monitor the health of forests in our country and Level I Level II programs were implemented based on the observation sites.
As of 2016:
− Every year, 608 Level I and 52 Level II observation areas, "Crown status and damage assessment visual assessment" work is done and annual reports are published.
− Preparations were completed in order to be able to carry out the classified analyses in which 680 Level I and 52 Level II observation areas suitable for taking soil samples from the 850 observation sites that are set up to cover the forest areas were taken in 2015.
− Analyses of 52 level 2 leaf samples were taken.
− In the 52 Level II observation areas, all the measurements for the first 5 years on the tree growth and the production were completed. Second 5-year measurements will be made in 2020.
− Intensive monitoring was planned for 18 of the 52 Level II observation sites and precipitation, debris, soil solution, phenological observations and air quality sampling were started to be studied.
− The installation of an automatic meteorology observation station has been completed in 51 Level II observation areas and meteorological data has begun to be received.
− Each year, 52 Level II observation areas are monitored for ozone damage. No ozone damage was found.
− A laboratory was established in İzmir for the analysis of the samples taken from the observation areas in the Directorate of Aegean Forestry Research Institute. All requirements are completed, activated. Required applications for ring tests

80 | 2018 Technical Report of ICP Forests
− The collected data are stored in the national database and the reports are taken from the data base.
− Data are provided for the National Forest Inventory conducted by the Forestry Administration and Planning Department.
Major results/highlights
− Ozone Damage was encountered in the Level II observation areas of 18, 27, 28, 51, 53 within the scope of air quality monitoring made in 2017.
− Every year, there are a total of 21 456 selected trees in the area of 612 Level I and 52 Level II observation, 20 leaves and 43 tree species.
− 29 kinds of insects, fungi, viruses and so on. Monitoring is being done.
National publications/reports published with regard to ICP Forests data and/or plots
Forest Ecosystems Monitoring Level I and Level II Programmes in Turkey. Prepared by: Ali TEMERİT, Umut ADIGÜZEL, Yücel FIRAT, H. Serdar KİP, Mehmet BİLGİ. National focal Centre, ISBN: 978-975-8273-92-8
Health State of Forests in Turkey (2008-2012). Prepared by: Sıtkı ÖZTÜRK, Prof. Dr. Doğanay TOLUNAY, Ahmet KARAKAŞ, Dr. Celal TAŞDEMİR, Fatih AYTAR, Umut ADIGÜZEL, Mehmet Emin AKKAŞ. National focal Centre, ISBN: 978-605-4610-44-0
Monitoring of forest ecosystems crown status evaluation photo catalog. Prepared by: Sıtkı ÖZTÜRK. National focal Centre, ISBN: 978-605-393-038-9
Turkey Oaks Diagnosis and Diagnosis Guide. Prepared by: Sıtkı ÖZTÜRK. National focal Centre, ISBN: 978-975-8273-92-8
Some botanical characteristics of maple (Acer) species naturally occurring in Turkey. Prepared by: Sıtkı ÖZTÜRK, National focal Centre, General Directorate of Forestry, Journal of forestry research Year: 2016/2 A Volume: 1 Issue: 4, ISSN: 2149-0783
Outlook
Future developments of the ICP Forest infrastructure In 2015–2017, deposition and soil solution working ringtest were entered and positive results were obtained. Analysis studies are continuing.
The needle-leaf working ringtest entered in 2017 is expected.
The application for the soil working ringtest is expected in 2018.
Samples sent from observation areas in the laboratory
− 7 000 unstructured soil samples, 14 000 volume weight and skeleton analyses,
− A total of 1 428 age-dry weight analyses of 325 needle-leaf samples and 1 103 rash samples were performed.
Planned research projects, expected results The health status report will be prepared in 2018 by using of the results obtained.
The sampling works for the deposition, soil solution, rash sample and phenological observations were started and samples were started to be procured.
Tender for air quality sampling was made for the year 2018 and started with sampling with passive sampling method and the obtained data will be reported at the end of 2018.
Data from automatic meteorology observation stations installed at Level II observation sites will be reported at the end of 2018.
United Kingdom
National Focal Centre
Suzanne Benham, Forest Research
Main activities/developments
The Level II plot network has been maintained during 2017. Monitoring activities continue at 5 sites. Sample collections for deposition, soil solution, and litterfall have been carried out. Monthly growth recording using permanent girth tapes continues and foliage samples were taken from each of the 5 sites as part of the biennial sampling. Instrumentation has been replaced within the plot previously clear felled, and replanting is scheduled for spring 2018.
Greenhouse gas collars previously installed at our Sitka spruce site (919, Coalburn) continue in order to establish a soil GHG emission baseline prior to the eventual harvesting of the crop. At the beginning of 2017 gas collars have been located in drainage ditches within the site in order to further our aim of quantifying the impact of harvesting on soil GHG emissions.
The quantification of deadwood biomass and carbon stocks from a subset of UK ICP Level II sites plus all UK Biosoil plots has been undertaken. A PhD studentship is working on quantifying the release of carbon (as CO2 and DOC) from deadwood. Tea bags were installed in order to calculate decomposition rates.

2018 Technical Report of ICP Forests | 81
Soil enzyme analysis has also been performed on soils collected under deadwood in comparison to bare soils.
A new protocol was designed and implemented on site 512 in order to identify and quantify the earth worm community within the deadwood and the soils below.
A part-time PhD over the next six years will investigate the efflux of CO2 from mature oak stems, what drives this, how much it contributes to overall forest ecosystem respiration, and the influence of elevated atmosphere CO2 concentration.
The main research focus this year has been concentrated on the declining health of oak in the UK.
Major results/highlights
ICP Forests data has been used to support predisposition modelling and mapping related to tree health.
During 2013 and 2014 extensive surveys were undertaken, which systematically visited 544 oak woodlands across England and Wales to investigate the extent to which Acute Oak Decline (AOD) is influenced by environmental predisposition factors traditionally associated with oak decline. The relationships with soil type, climatic factors and pollutant deposition, notably atmospheric nitrogen has been assessed and validated to produce detailed risk maps. This spatial study re-emphasises the importance of predisposition factors in decline syndromes and suggests avenues for future management and mitigation.
National publications/reports published with regard to ICP Forests data and/or plots
Brown N, Vanguelova E, Parnell S, Broadmeadow S, Denman S (2017) Predisposition of forests to biotic disturbance: Predicting the distribution of Acute Oak Decline using environmental factors. For Ecol Manag 407(1):145-154. doi:10.1016/j.foreco.2017.10.054
Transfer PhD report by Vicky Strutter, Reading University. Deadwood carbon stock fluxes and relation to soil enzyme activities.
Action oak health review, Defra UK
Shelter belts for Ammonia abatement review CEH/SEPA project UK
Outlook
Future development
− Funding remains under tight constraints in the UK. From the original network of 10 monitoring sites monitoring obligations under ICP Forests continue at 5 sites.
− Continual monitoring activities at the remaining 5 sites have been suspended but we continue to keep a watching
brief on these sites. Dendrochronology discs have been taken from these sites during final thinning, and we will carry out final crop measurements etc. at felling time. With current funding levels we have no plans to expand our monitoring activities beyond this.
Planned research projects, expected results
− Analysis of vegetation change over 25 years at Level II plots
− Nutrient accounting
• Long term nutrient flux change over monitoring period
• Nutrient budgets of all Level II sites • Nutrient translocation of masting • Nutrient from masting and their release to soils • Soil nutrient stocks at Biosoil plots

ANNEX

2018 Technical Report of ICP Forests | 83
ANNEX CONTACTS
UNECE and ICP Forests
UNECE – LRTAP Convention
Krzysztof Olendrzynski United Nations Economic Commission for Europe – LRTAP Convention Secretariat Palais des Nations, 8-14, avenue de la Paix 1211 Geneva 10, SWITZERLAND Phone: +41 22 917 23 58 Email: [email protected]
ICP Forests Lead Country
Sigrid StrichFederal Ministry of Food and Agriculture - Ref. 535 Postfach 14 02 70 53107 Bonn, GERMANY Phone: +49 228 99 529-41 30 Email: [email protected], [email protected]
ICP ForestsChairperson
Marco Ferretti Swiss Federal Research Institute WSL Zürcherstr. 111 8093 Birmensdorf, SWITZERLAND Phone: +41 44 739 22 51 Email: [email protected]
ICP Forests Programme Co-ordinating Centre (PCC)
Walter Seidling, Head of PCC Thünen Institute of Forest Ecosystems Alfred-Möller-Str. 1, Haus 41/42 16225 Eberswalde, GERMANY Phone: +49 3334 3820-338 Email: [email protected] http://icp-forests.net
Expert panels, working groups, and other coordinating institutions
Expert Panel on Soil and Soil Solution
Bruno De Vos, Chair Research Institute for Nature and Forest (INBO) – Environment & Climate Unit Gaverstraat 4 9500 Geraardsbergen, BELGIUM Phone: +32 54 43 71 20 Email: [email protected]
Nathalie Cools, Co-chair Research Institute for Nature and Forest (INBO) Gaverstraat 4 9500 Geraardsbergen, BELGIUM Phone: + 32 54 43 61 75 Email: [email protected]
Tiina Nieminen, Co-chair Natural Resources Institute Finland (LUKE)Latokartanonkaari 9 00790 Helsinki, FINLAND Phone: +358 40 80 15 457 Email: [email protected]
Expert Panelon Foliar Analysis and Litterfall
Pasi Rautio, Chair Natural Resources Institute Finland (LUKE) PO Box 16, Eteläranta 55 96301, Rovaniemi, FINLAND Phone: +358 50 391 4045 Email: [email protected] Liisa Ukonmaanaho, Co-chair LitterfallNatural Resources Institute Finland (LUKE)Latokartanonkaari 9 00790 Helsinki, FINLAND Phone: +358 29 53 25 115 Email: [email protected]
Expert Panelon Forest Growth
Tom Levanič, Chair Slovenian Forestry Institute (SFI) Večna pot 2 1000 Ljubljana, SLOVENIA Phone: +386 1200 78 44 Email: [email protected]

84 | 2018 Technical Report of ICP Forests
Expert Panel on Forest Growth (cont.)
Tanja Sanders, Co-chair Thünen Institute of Forest Ecosystems Alfred-Möller-Str. 1, Haus 41/42 16225 Eberswalde, GERMANY Phone: +49 3334 3820-339 Email: [email protected]
Expert Panel on Deposition
Arne Vestraeten, Chair Research Institute Nature and Forests (INBO) Gaverstraat 4 9500 Geraardsbergen, BELGIUM Email: [email protected] Daniel Žlindra, Co-chair Slovenian Forestry Institute (SFI) Gozdarski Inštitut Slovenije GIS Večna pot 2 1000 Ljubljana, SLOVENIA Phone: +38 6 12 00 78 00 Email: [email protected] Peter Waldner, Co-chair Swiss Federal Institute for Forest, Snow and Landscape Research WSL Zürcherstr. 111 8903 Birmensdorf, SWITZERLAND Phone: +41 44 739 2502 Email: [email protected]
Expert Panel on Ambient Air Quality
Marcus Schaub, Chair Swiss Federal Institute for Forest, Snow and Landscape Research WSL Zürcherstr. 111 8903 Birmensdorf, SWITZERLAND Phone: +41 44 739 25 64 Email: [email protected] Elena Gottardini, Co-chair Fondazione Edmund Mach Via Mach 1 38010 San Michele all'Adige, ITALY Phone: +39 0461 615 362 Email: [email protected]
Expert Panel on Crown Condition and Damage Causes
Nenad Potočić, Chair Croatian Forest Research Institute (CFRI) Cvjetno naselje 41 10450 Jastrebarsko, CROATIA Phone: +385 162 73 027 Email: [email protected]
Volkmar Timmermann, Co-chair Norwegian Institute of Bioeconomy Research (NIBIO) P.O. Box 115 1431 Ås, NORWAY Phone: +47 971 59 901 Email: [email protected]
Expert Panel on Biodiversity and Ground Vegetation Assessment
Roberto Canullo, Chair Camerino University Dept. of Environmental Sciences Via Pontoni, 5 62032 Camerino, ITALY Phone: +39 0737 404 503/5 Email: [email protected]
Expert Panel on Meteorology, Phenology and Leaf Area Index
Stephan Raspe, Chair Bayerische Landesanstalt für Wald und Forstwirtschaft (LWF) Hans-Carl-von-Carlowitz-Platz 1 85354 Freising, GERMANY Phone: +49 81 61 71 49 21 Email: [email protected] Stefan Fleck, Co-chair (LAI) Thünen Institute of Forest Ecosystems Alfred-Möller-Str. 1, Haus 41/42 16225 Eberswalde, GERMANY Phone: +49 3334 3820-376 Email: [email protected]
Forest Soil Coordinating Centre (FSCC)
Nathalie Cools, Chair Research Institute for Nature and Forest (INBO) Gaverstraat 4 9500 Geraardsbergen, BELGIUM Phone: + 32 54 43 61 75 Email: [email protected]
Forest Foliar Coordinating Centre (FFCC)
Alfred Fürst, Chair Austrian Research Centre for Forests (BFW) Seckendorff-Gudent-Weg 8 1131 Wien, AUSTRIA Phone: +43 1878 38-11 14 Email: [email protected]
Quality Assurance Committee
Anna Kowalska, Co-chair Forest Research Institute (FRI) Sekocin Stary ul. Braci Lesnej 3 05090 Raszyn, POLAND Phone: +48 22 71 50 657 Email: [email protected]

2018 Technical Report of ICP Forests | 85
WG on Quality Assurance and Quality Control in Laboratories
Alfred Fürst, Chair Austrian Research Centre for Forests (BFW) Seckendorff-Gudent-Weg 8 1131 Wien, AUSTRIA Phone: +43 1878 38-11 14 Email: [email protected] Anna Kowalska, Co-chair Forest Research Institute Sękocin Stary, 3 Braci Leśnej Street 05-090 Raszyn, POLAND Phone: +48 22 71 50 300 Email: [email protected]
Scientific Committee
Marcus Schaub, Chair Swiss Federal Research Institute WSL Zürcherstr. 111 8903 Birmensdorf, SWITZERLAND Phone: +41 44 739 25 64 Email: [email protected] Lars Vesterdal, Co-Chair University of Copenhagen, Department of Geosciences and Natural Resource Management Rolighedsvej 23, 1958 Frederiksberg C, DENMARK Phone: +45 35 33 16 72 Email: [email protected]
Ministries (Min) and National Focal Centres (NFC)
Albania (Min)
Ministry of the Environment, Forests and Water Administration (MEFWA) Dep. of Biodiversity and Natural Resources Management Rruga e Durrësit, Nr. 27, Tirana, ALBANIA Phone: +355 42 70 621, +355 42 70 6390 Email: [email protected]
(NFC)
National Environment Agency Bulevardi "Bajram Curri", Tirana, ALBANIA Phone: +355 42 64 903 and +355 42 65 299/64 632 | Email: [email protected], [email protected] Julian Beqiri (Head of Agency), Kostandin Dano (Head of Forestry Department)
Andorra (Min, NFC)
Ministeri de Turisme I Medi Ambient Departament de Medi Ambient C. Prat de la Creu, 62-64, 500 Andorra la Vella, Principat d'Andorra, ANDORRA Phone: +376 87 57 07 Email: [email protected], [email protected] Silvia Ferrer, Anna Moles
Austria (Min)
Bundesministerium für Land- und Forstwirtschaft, Umwelt und Wasserwirtschaft, Abt. IV/2 Stubenring 1, 1010 Wien, AUSTRIA Phone: +43 1 71 100 72 14 | Email: [email protected] Vladimir Camba
(NFC) Austrian Research Centre for Forests (BFW)Seckendorff-Gudent-Weg 8, 1131 Wien, AUSTRIA Phone: +43 1 878 38 13 30 Email: [email protected] Ferdinand Kristöfel
Belarus(Min)
Ministry of Forestry of the Republic of Belarus Myasnikova st. 39, 220048 Minsk, BELARUS Phone +375 17 200 46 01 Email: [email protected] Petr Semashko
(NFC) Forest inventory republican unitary company "Belgosles" Zheleznodorozhnaja St. 27 220089 Minsk, BELARUS Phone: +375 17 22 63 053 Email: [email protected] Valentin Krasouski

86 | 2018 Technical Report of ICP Forests
Belgium Wallonia (Min)
Service public de Wallonie (SPW), Direction générale opérationnelle Agriculture, Ressources naturelles et Environnement (DGARNE), Département de la Nature et des Forêts - Direction des Ressources Forestières Avenue Prince de Liège 15, 5100 Jambes, BELGIUM Phone: +32 81 33 58 42, +32 81 33 58 34 Email: [email protected] Didier Marchal
Wallonia (NFC for Level I)
Environment and Agriculture Department/Public Service of Wallonia Avenue Maréchal Juin, 23, 5030 Gembloux, BELGIUM PHONE: +32 81 626 452 Email: [email protected] Elodie Bay
Wallonia (NFC for Level II)
Earth and Life Institute / Environmental Sciences (ELI-e) Université catholique de Louvain Croix du Sud, 2 - L7.05.09, 1348 Louvain-La-Neuve, BELGIUM Phone: +32 10 47 25 48 Email: [email protected] Hugues Titeux
Flanders (Min)
Vlaamse Overheid (Flemish Authorities)Agency for Nature and Forest (ANB) Koning Albert II-laan 20, 1000 Brussels, BELGIUM Phone: +32 2 553 81 22 | Email: [email protected] Carl De Schepper
Flanders (NFC)
Research Institute for Nature and Forest(INBO) Gaverstraat 4, 9500 Geraardsbergen, BELGIUM Phone: +32 54 43 71 15 Email: [email protected] Peter Roskams
Bulgaria (Min)
Ministry of Environment and Water National Nature Protection Service 22, Maria Luiza Blvd., 1000 Sofia, BULGARIA Phone: + 359 2 940 61 12 | Email: [email protected] Penka Stoichkova
(NFC)
Executive Environment Agency at the Ministry of Environment and Water Monitoring of Lands, Biodiversity and Protected Areas Department 136 Tzar Boris III Blvd., P.O. Box 251, 1618 Sofia, BULGARIA Phone: +359 2 940 64 86 Email: [email protected] Genoveva Popova
Canada(Min, NFC)
Natural Resources Canada 580 Booth Str., 12th Floor, Ottawa, Ontario K1A 0E4, CANADA Phone: +1613 947 90 60 Email: [email protected] Pal Bhogal
Québec(Min, NFC)
Ministère des Forêts, de la Faune et des Parcs – Direction de la recherche forestière 2700, rue Einstein, bureau BRC. 102, Ste. Foy Quebec G1P 3W8, CANADA Phone: +1 418 643 79 94 Ext. 65 33 Email: [email protected] Rock Ouimet
Croatia(Min, NFC)
Croatian Forest Research Institute Cvjetno naselje 41, 10450 Jastrebarsko, CROATIA Phone: +385 1 62 73 027 Email: [email protected] Nenad Potočić
Cyprus(Min, NFC)
Ministry of Agriculture Natural Resources and Environment Research Section - Department of Forests Louki Akrita 26, 1414-Nicosia, CYPRUS Phone: +357 22 81 94 90 Email: [email protected] Andreas Christou
Czechia(Min)
Ministry of Agriculture of the Czech Republic Forest Management Tešnov 17, 117 05 Prague 1, CZECH REPUBLIC Phone: +420 221 81 2677 Email: [email protected] Tomáš Krejzar

2018 Technical Report of ICP Forests | 87
(NFC) Forestry and Game ManagementResearch Institute (FGMRI) Strnady 136, 252 02 Jíloviště, CZECH REPUBLIC Phone: +420 257 89 22 21 Email: [email protected] Bohumír Lomský
Denmark (Min)
Ministry of Environment and Food; Environmental Protection Agency Haraldsgade 53, 2100 Copenhagen 0, DENMARK Phone: +45 72 54 40 00 Email: [email protected] Pernille Karlog
(NFC) University of Copenhagen Department of Geosciences and Natural Resource Management Rolighedsvej 23, 1958 Frederiksberg C, DENMARK Phone: +45 35 33 18 97 Email: [email protected] Morten Ingerslev
Estonia (Min)
Ministry of the Environment Forest Department Narva mnt 7a, 15172 Tallinn, ESTONIA Phone: +27 26 26 0726 Email: [email protected] Maret Parv, Head of Forest Department
(NFC) Estonian Environment Agency (EEIC)Mustamäe tee 33, Tallinn 10616, ESTONIA Phone:+372 733 93 97 Email: [email protected] Endla Asi
Finland (Min)
Ministry of Agriculture and ForestryForest Department Hallituskatu 3 A, P.O.Box 30, 00023 Government, FINLAND Phone: +358 9 160 523 19 Email: [email protected] Teemu Seppä
(NFC) Natural Resources Institute Finland (LUKE)Oulu Unit PO Box 413, 90014 Oulun yliopisto, FINLAND Phone: +358 29 532 4061 Email: [email protected] Päivi Merilä
France(Min) (NFC for Level I)
Ministère de l‘Agriculture, de l’Agroalimentaire et de la Forêt Direction générale de l'alimentation Département de la santé des forêts 251, rue de Vaugirard, 75732 Paris cedex 15, FRANCE Phone: +33 1 49 55 51 03 | Email: [email protected], [email protected] Frédéric Delport, Fabien Caroulle (crown data)
(NFC for Level II)
Office National des Forêts Direction forêts et risques naturels Département recherché développement innovation - Bâtiment B Boulevard de Constance, 77300 Fontainebleau, FRANCE Phone: +33 1 60 74 92 -28 Email: [email protected] Manuel Nicolas (Level II)
Germany(Min, NFC)
Bundesministerium für Ernährung und Landwirtschaft (BMEL) - Ref. 535 Rochusstr. 1, 53123 Bonn, GERMANY Phone: +49 228 99 529-41 30 Email: [email protected] Sigrid Strich
Greece(Min)
Hellenic Republic – Ministry of Environment, Energy and Climate Change (MEECC) – General Secretariat MEEC General Directorate for the Development & Protection of Forest and Rural Environment – Directorate for the Planning and Forest Policy Development of Forest Resources 31 Chalkokondyli, 10164 Athens, GREECE Phone: +30 210 212 45 97, -75 | Email: [email protected], [email protected] Konstantinos Dimopoulos, Director General; Panagiotis Drougas
(NFC) Hellenic Agricultural Organization “DEMETER” Institute of Mediterranean Forest Ecosystems and Forest Products Technology Terma Alkmanos, 11528 Ilissia, Athens, GREECE Phone: +30 210 77 84 850, -240 Email: [email protected] Panagiotis Michopoulos
88 | 2018 Technical Report of ICP Forests
Hungary (Min)
Ministry of Agriculture Department of Forestry and Game Management Kossuth Lajos tér 11, 1055 Budapest, HUNGARY Phone: +36 1 7953911 Email: [email protected] András Szepesi
(NFC) National Food Chain Safety Office, Forestry Directorate Frankel Leó út 42-44, 1023 Budapest, HUNGARY Phone: +36 1 37 43 220 Email: [email protected] László Kolozs
Ireland (Min)
Department of Agriculture, Food and the Marine, Forest Service Mayo West, Michael Davitt House, Castlebar, Co. Mayo, IRELAND Phone: +353 94 904 29 25 Email: [email protected] Orla Fahy
(NFC) University College Dublin (UCD) UCD Soil Science, UCD School of Agriculture and Food Science Belfield, Dublin 4, IRELAND Phone: +353 1 7167744 Email: [email protected] Thomas Cummins
Italy (Min, NFC)
Comando Unità Tutela Forestale, Ambientale e Agroalimentare Carabinieri Carabinieri Corps – Office for Studies and Projects Via Giosuè Carducci 5, 00187 Roma, ITALY Phone: +39 06 466 567 163 Email: [email protected] Giancarlo Papitto
Latvia (Min)
Ministry of Agriculture Forest Department Republikas laukums 2, Riga 1981, LATVIA Phone: +371 670 27 285 Email: [email protected] Lasma Abolina
(NFC) Latvian State Forest Research Institute„Silava” 111, Rigas str, Salaspils, 2169, LATVIA Phone: +371 67 94 25 55 Email: [email protected] Uldis Zvirbulis
Liechtenstein(Min, NFC)
Amt für Umwelt (AU) Dr. Grass-Str. 12, Postfach 684, 9490 Vaduz, FÜRSTENTUM LIECHTENSTEIN Phone: +423 236 64 02 Email: [email protected] Olivier Nägele
Lithuania (Min)
Ministry of Environment Dep. of Forests and Protected Areas A. Juozapaviciaus g. 9, 2600 Vilnius, LITHUANIA Phone: +370 2 72 36 48 Email: [email protected] Valdas Vaičiūnas
(NFC) Lithuania State Forest Survey ServicePramones ave. 11a, 51327 Kaunas, LITHUANIA Phone: +370 37 49 02 90 Email: [email protected] Albertas Kasperavicius
Luxembourg(Min, NFC)
Administration de la nature et des forêtsService des forêts 16, rue Eugène Ruppert, 2453 Luxembourg, LUXEMBOURG Phone: +352 402 20 12 09 Email: [email protected] Elisabeth Freymann
Former Yugoslav Republic of Macedonia (FYROM) (Min)
Ministry of Agriculture, Forestry and Water Economy, Dep. for Forestry and Hunting 2 Leninova Str., 1000 Skopje, FORMER YUGOSLAV REP. OF MACEDONIA Phone: +398 2 312 42 98 Email: [email protected] Vojo Gogovski
(NFC) Ss. Cyril and Methodius University Faculty of Forestry Department of Forest and Wood ProtectionBlvd. Goce Delcev 9, 1000 Skopje, FORMER YUGOSLAV REP. OF MACEDONIA Phone: +389 2 313 50 03 150 Email: [email protected], [email protected] Nikola Nikolov, Srdjan Kasic
Republic of Moldova (Min, NFC)
Agency Moldsilva 124 bd. Stefan cel Mare, 2001 Chisinau, REPUBLIC OF MOLDOVA Phone: +373 22 27 23 06 Email: [email protected] Dumitru Galupa

2018 Technical Report of ICP Forests | 89
Montenegro (Min)
Ministry of Agriculture, Forestry and Water Management Rimski trg 46, PC "Vektra" 81000 Podgorica, MONTENEGRO Phone: +382 (20) 482 109 Email: [email protected] Ranko Kankaras
(NFC) University of Montenegro, Faculty of Biotechnology Mihaila Lalića 1, 81000 Podgorica, MONTENEGRO Email: [email protected] Darko Dubak
The Netherlands (Min, NFC)
Ministry for Health, Welfare and SportThe National Institute for Public Health and the Environment (RIVM) Antonie van Leeuwenhoeklaan 9 3721 MA Bilthoven, THE NETHERLANDS Phone: + 31 (0)30 274 2520 Email: [email protected] Esther J.W. Wattel-Koekkoek
Norway (Min)
Norwegian Environment AgencyP.O. Box 5672 Torgarden, 7485 Trondheim, NORWAY Phone: +47 73 58 05 00 Email: [email protected] Gunnar Carl Skotte
(NFC) Norwegian Institute of Bioeconomy Research (NIBIO) P.O.Box 115, 1431 ÅS, NORWAY Phone: +47 971 59 901 Email: [email protected] Volkmar Timmermann
Poland (Min)
Ministry of the Environment Department of Forestry Wawelska Str. 52/54, 00922 Warsaw, POLAND Phone: +48 22 579 25 50 | Email: [email protected] Edward Lenart
(NFC) Forest Research Institute Sękocin Stary, 3 Braci Leśnej Street, 05-090 Raszyn, POLAND Phone: +48 22 715 06 57 Email: [email protected], [email protected] Jerzy Wawrzoniak, Pawel Lech
Portugal(Min, NFC)
Instituto da Conservação de Natureza e das Florestas (ICNF) - Departamento de Gestão de Áreas Classificadas, Públicas e de Proteção Florestal Avenida da República, 16 a 16B, 1050-191 Lisboa, PORTUGAL Phone: +351 213 507 900 Email: [email protected] Maria da Conceição Osório de Barros
Romania(Min)
Ministry of Environment, Waters and Forests Waters, Forests and Pisciculture Dept. Bd. Magheru 31, Sect. 1, 010325, Bucharest, ROMANIA Phone: +40 213 160 215 Email: [email protected] Claudiu Zaharescu
(NFC) National Institute for Research and Development in Forestry (INCDS) Bd. Eroilor 128 077190 Voluntari, Judetul Ilfov, ROMANIA Phone: +40 21 350 32 38 Email: [email protected], [email protected] Badea, Romica Tomescu
Russian Federation (Min)
Ministry of Natural Resources of the Russian Federation 4/6, Bolshaya Gruzinskaya Str. Moscow D-242, GSP-5, 123995, RUSSIAN FEDERATION Phone: +7 495 254 48 00 Email: [email protected] Igor A. Korolev
(NFC) Centre for Forest Ecology and Productivityof the Russian Academy of Sciences Profsouznaya str., 84/32, 117997 Moscow, RUSSIAN FEDERATION Phone: +7 495 332 29 17 | Email: [email protected] Natalia V. Lukina
Serbia(Min)
Ministry of Agriculture and Environment Protection Directorate of Forests SIV 3, Omladinskih brigada 1, 11070 Belgrade, SERBIA Phone: +381 11 311 76 37 Email: [email protected] Sasa Stamatovic

90 | 2018 Technical Report of ICP Forests
(NFC)
Institute of Forestry Kneza Viseslava 3, 11000 Belgrade, SERBIA Phone: +381 11 35 53 454 Email: [email protected]; [email protected] Ljubinko Rakonjac
Slovakia (Min)
Ministry of Agriculture of the Slovak Republic Dobrovičova 12, 81266 Bratislava, SLOVAKIA Phone: +421 2 59 26 63 08 Email: [email protected] Henrich Klescht
(NFC) National Forest Centre - Forest Research Institute ul. T.G. Masaryka 22, 962 92 Zvolen, SLOVAKIA Phone: +421 45 531 42 02 Email: [email protected] Pavel Pavlenda
Slovenia (Min)
Ministry of Agriculture, Forestry and Food (MKGP) Dunajska 56-58, 1000 Ljubljana, SLOVENIA Phone: +386 1 478 90 38 Email: [email protected], [email protected] Janez Zafran, Robert Režonja
(NFC) Slovenian Forestry Institute (SFI) Večna pot 2, 1000 Ljubljana, SLOVENIA Phone: +386 1 200 78 00 Email: [email protected], [email protected], [email protected] Mitja Skudnik, Primož Simončič, Marko Kovač
Spain (Min)
Directorate General of Rural Development and Forest Policy - Ministry of Agriculture, Fishing and Food of Spain Gran Vía de San Francisco, 4-6, 6ª pl., 28005 Madrid, SPAIN Email: [email protected] José Manuel Jaquotot Saenz de Miera
(NFC) Forest Inventory and Statistics Department - Directorate General of Rural Development and Forest Policy Gran Vía de San Francisco, 4-6, 5ª pl., 28005 Madrid, SPAIN Phone: +34 91 347 5835, -5831 Email: [email protected], [email protected], [email protected] Elena Robla, Belén Torres, Ana González
Sweden(Min, NFC)
Swedish University of Agricultural Sciences – Institutionen för vatten och miljö Box 7050, 750 07 Uppsala, SWEDEN Phone: +46 18 671070, +46 70 3736243 Email: [email protected] Lars Lundin
Switzerland(Min)
Department of the Environment, Transport, Energy and Communications (DETEC), Federal Office for the Environment (FOEN), Forest Division 3003 Bern, SWITZERLAND Phone: +41 58 462 05 18 Email: [email protected] Sabine Augustin
(NFC) Swiss Federal Institute for Forest, Snow and Landscape Research WSL Zürcherstr. 111, 8903 Birmensdorf, SWITZERLAND Phone: +41 44 739 25 02 Email: [email protected] Peter Waldner
Turkey (Min)
General Directorate of Forestry Foreign Relations, Training and Research Department Beştepe Mahallesi Söğütözü Caddesi No: 8/1 06560 Yenimahalle-Ankara, TURKEY Phone: +90 312 296 17 03 Email: [email protected] Ahmet Karakaş
(NFC) General Directorate of Forestry Department of Forest Pests Fighting Beştepe Mahallesi Söğütözü Caddesi No: 8/1 06560 Yenimahalle-Ankara, TURKEY Phone: +90 312 296 Email: [email protected], [email protected] Sıtkı Öztürk

2018 Technical Report of ICP Forests | 91
Ukraine (Min)
State Committee of Forestry of the Ukrainian Republic 9a Shota Rustaveli, 01601 KIEV, UKRAINE Phone: +380 44 235 55 63 Email: [email protected] Viktor P. Kornienko
(NFC) Ukrainian Research Institute of Forestry and Forest Melioration (URIFFM) Laboratory of Forest Monitoring and Certification Pushkinska Str. 86, 61024 Kharkiv, UKRAINE Phone: +380 57 707 80 57 Email: [email protected] Igor F. Buksha
United Kingdom (Min, NFC)
Centre for Ecosystem, Society and Biosecurity – Forest Research Alice Holt Lodge, Wrecclesham Farnham Surrey GU10 4LH, UNITED KINGDOM Phone: +44 300 067 5620 | Email: [email protected] Sue Benham
United States of America (NFC)
USDA Forest Service Pacific Southwest Research Station 4955 Canyon Crest Drive Riverside, CA 92507, USA Phone: +1 951 680 15 62 Email: [email protected] Andrzej Bytnerowicz

92 | 2018 Technical Report of ICP Forests
Authors
Inken Krüger Thünen Institute of Forest Ecosystems Alfred-Möller-Str. 1, Haus 41/42, 16225 Eberswalde, GERMANY Email: [email protected]
Tom Levanič Slovenian Forestry Insitute (SFI) Večna pot 2, 1000 Ljubljana, SLOVENIA Email: [email protected]
Aldo Marchetto National Research Council (CNR), Institute of Ecosystem Study (ISE) Largo Tonolli 50, 28922 Verbania (VB), ITALY Email: [email protected]
Alexa K. Michel Programme Co-ordinating Centre (PCC) of ICP Forests, Thünen Institute of Forest Ecosystems Alfred-Möller-Str. 1, Haus 41/42, 16225 Eberswalde, GERMANY Email: [email protected]
Mladen Ognjenović Croatian Forest Research Institute Cvjetno naselje 41, 10450 Jastrebarsko, CROATIA Email: [email protected]
Nenad Potočić Croatian Forest Research Institute Cvjetno naselje 41, 10450 Jastrebarsko, CROATIA Email: [email protected]
Anne-Katrin Prescher Programme Co-ordinating Centre (PCC) of ICP Forests Thünen Institute of Forest Ecosystems Alfred-Möller-Str. 1, Haus 41/42, 16225 Eberswalde, GERMANY Email: [email protected]
Tanja GM Sanders Thünen Institute of Forest Ecosystems Alfred-Möller-Str. 1, Haus 41/42, 16225 Eberswalde, GERMANY Email: [email protected]
Walter Seidling Programme Co-ordinating Centre (PCC) of ICP Forests Thünen Institute of Forest Ecosystems Alfred-Möller-Str. 1, Haus 41/42, 16225 Eberswalde, GERMANY Email: [email protected]
Florian Skonieczny Thünen Institute of Forest Ecosystems Alfred-Möller-Str. 1, Haus 41/42, 16225 Eberswalde, GERMANY Email: [email protected]
Volkmar Timmermann Norwegian Institute of Bioeconomy Research (NIBIO) P.O. Box 115, 1431 Ås, NORWAY Email: [email protected]
Arne Verstraeten Research Institute Nature and Forests (INBO) Gaverstraat 4, 9500 Geraardsbergen, BELGIUM Email: [email protected]
Peter Waldner Swiss Federal Institute for Forest, Snow and Landscape Research WSL Zürcherstr. 111, 8903 Birmensdorf, SWITZERLAND Email: [email protected]


20040622_oceans_web.psd
BFW-Dokumentation25/2018
Bundesforschungszentrum für WaldSeckendorff-Gudent-Weg 81131 Wien, Österreich
http://bfw.ac.at
ISSN 1811-3044 ISBN 978-3-903258-08-2
C
Press law responsibility:DI Dr Peter MayerAustrian Research and Training Centre forForests, Natural Hazards and Landscape (BFW)Seckendorff-Gudent-Weg 81131 Vienna, AustriaPhone: +43-1-878380
Cover photo: Montane European beech (Fagus sylvatica L.)forest stand on the Lontovž intensive monitoringplot in central Slovenia by Lado Kutnar
Contact:Alexa Michel, Walter Seidling andAnne-Katrin Prescher (Eds.)Programme Co-ordinating Centre (PCC)of ICP ForestsThünen Institute of Forest EcosystemsAlfred-Möller-Str. 1, Haus 41/4216225 Eberswalde, Germanyhttp://icp-forests.net
Reproduction is authorised provided the source is acknowledged.
Chlorine-free and climate-neutral - For the benefit of the environment
opyright 2018 by BFW
Impressum
Forest Condition in Europe2018 Technical Report of ICP Forests
Report under the UNECE Conventionon Long-Range Transboundary Air Pollution(CLRTAP)
ALEXA MICHEL, WALTER SEIDLING & ANNE-KATRIN PRESCHER (Eds.)