Condition Based Maintenance (CBM) - CiteSeerX
25
Condition Based Maintenance (CBM) By- S.K.Sethiya Secy.toCME/WCR/JBP Abstract: In a continuous growing global market Productivity is playing a key role to stay competitive, for any manufacturing company. Productivity can be achieved through availability and availability can be increased through adopting the efficient maintenance practices, by focusing on different types of maintenance and strategies. Condition based Maintenance or predictive maintenance, uses primarily non destructive testing techniques, visual inspection, and performance data to assess machinery condition. It replaces arbitrarily timed maintenance tasks with appropriate maintenance task at only when warranted by equipment condition. Condition-monitoring maintenance task intervals must be properly understood and task intervals should be determined based on the expected P-F interval. The P-F interval governs the frequency with which the predictive task must be done. Technological advances are accepted and applied to CBM systems, which includes improved knowledge of failure mechanisms, advancements in failure forecasting techniques, advancements in monitoring and sensor devices, advancements in diagnostic and prognostic software, acceptance of communication protocols, developments in maintenance software applications and computer networking technologies. The measurement precision and sensitivity of the CM technique being used need to be understood because they affect the reaction time available to reduce or eliminate the consequences of the functional failure. Condition- monitoring maintenance tasks must be applicable and cost effective. The aim of this paper is to give brief introduction of various CBM techniques, selection of condition monitoring techniques and understanding of P-F interval, Advancement in CBM, Standardization of CBM system, CBM approach on rail vehicles, advantages &disadvantages of CBM. Introduction Today, most maintenance actions are carried out by either the predetermined preventive- or the corrective approach. The predetermined preventive approach has fixed maintenance intervals in order to prevent components, sub-systems or systems to degrade. Corrective maintenance is performed after an obvious fault or breakdown has occurred. Both approaches have
-
Upload
khangminh22 -
Category
Documents
-
view
2 -
download
0
Transcript of Condition Based Maintenance (CBM) - CiteSeerX

Condition Based Maintenance (CBM)
By- S.K.Sethiya Secy.toCME/WCR/JBP
Abstract:
In a continuous growing global market Productivity is playing a key role to stay competitive, for any manufacturing company. Productivity can be achieved through availability and availability can be increased through adopting the efficient maintenance practices, by focusing on different types of maintenance and strategies. Condition based Maintenance or predictive maintenance, uses primarily non destructive testing techniques, visual inspection, and performance data to assess machinery condition. It replaces arbitrarily timed maintenance tasks with appropriate maintenance task at only when warranted by equipment condition. Condition-monitoring maintenance task intervals must be properly understood and task intervals should be determined based on the expected P-F interval. The P-F interval governs the frequency with which the predictive task must be done. Technological advances are accepted and applied to CBM systems, which includes improved knowledge of failure mechanisms, advancements in failure forecasting techniques, advancements in monitoring and sensor devices, advancements in diagnostic and prognostic software, acceptance of communication protocols, developments in maintenance software applications and computer networking technologies. The measurement precision and sensitivity of the CM technique being used need to be understood because they affect the reaction time available to reduce or eliminate the consequences of the functional failure. Condition-monitoring maintenance tasks must be applicable and cost effective. The aim of this paper is to give brief introduction of various CBM techniques, selection of condition monitoring techniques and understanding of P-F interval, Advancement in CBM, Standardization of CBM system, CBM approach on rail vehicles, advantages &disadvantages of CBM. Introduction
Today, most maintenance actions are carried out by either the predetermined preventive- or the corrective approach. The predetermined preventive approach has fixed maintenance intervals in order to prevent components, sub-systems or systems to degrade. Corrective maintenance is performed after an obvious fault or breakdown has occurred. Both approaches have

shown to be costly in many applications due to lost production, cost of keeping spare parts, quality deficiencies etc. Basically, predictive maintenance or Condition Based Maintenance (CBM) differs from preventive maintenance by basing maintenance need on the actual condition of the machine rather than on some preset schedule. As the preventive maintenance is time-based and activities such as changing lubricant are based on time, like calendar time or equipment run time. For example, most people change the engine oil in their car/jeep at every 3,000 to 5,000 KMs vehicles traveled. No concern is given to the actual condition and performance capability of the oil. This methodology would be analogous to a preventive maintenance task. If on the other hand, the operator of the car discounted the vehicle run time and had the oil analyzed at some periodicity to determine its actual condition and lubrication properties, he/she may be able to extend the oil change until the vehicle had traveled 10,000 KMs. This is the fundamental difference between predictive maintenance and preventive maintenance, whereby predictive maintenance is used to define needed maintenance task based on quantified material/equipment condition. Condition Based Maintenance (CBM) or predictive maintenance is a technology that strives to identify incipient faults before they become critical which enables more accurate planning of the preventive maintenance. It may also be defined as Maintenance actions based on actual condition obtained from in-situ, non-invasive tests, operating and condition measurement. Or “CBM is a set of maintenance actions based on real-time or near-real time assessment of equipment condition which is obtained from embedded sensors and/or external tests & measurements taken by portable equipment.” CBM or predictive maintenance is the means of improving productivity, product quality and overall effectiveness of manufacturing and production plants. CBM or Predictive maintenance is not vibration monitoring or thermal imaging or lubricating oil analysis or any of the other nondestructive testing techniques, as predictive maintenance tools. Rather, it is a philosophy or attitude that simply stated uses the actual operating condition of plant equipment and systems to optimize total plant operation. A comprehensive predictive maintenance management program utilizes a combination of the most cost-effective tools, i.e. thermal imaging, vibration monitoring, tribology, and other nondestructive testing methods, to obtain the actual operating condition of critical plant systems and based on this factual data all maintenance activities on an as-needed basis are scheduled. Including CBM or predictive maintenance in a comprehensive maintenance management program will provide the ability to optimize the availability of

process machinery and greatly reduce the cost of maintenance. It will also provide the means to improve product quality, productivity and profitability. The maintenance organization in a company probably has one of the most important functions, looking after assets and keeping track of equipment in order to secure productivity. A company with no or a poor maintenance organization will loose a lot of money due to lost production capacity, cost of keeping spare parts, quality deficiencies, damages for absent or late deliveries etc. A relationship between failure rate versus change in maintenance philosophy is showing decline trend as illustrated in figure below, also representing the strengths and weaknesses of the different maintenance types.
The addition of a comprehensive predictive maintenance program can and will provide factual data on the actual operating condition of critical assets, including their efficiency, as well as the actual mechanical condition of each machine-train and the operating efficiency of each process system. Instead of relying on industrial or in-plant average-life statistics, i.e. mean-time-to-failure, to schedule maintenance activities, predictive maintenance uses direct monitoring of the mechanical condition, system efficiency and other indicators to determine the actual mean-time-to-failure or loss of efficiency for each machine-train and system in the plant. This data provides maintenance management the factual data needed for effective planning and scheduling maintenance activities.

The CM data collected is used in one of the following ways to determine the condition of the equipment and to identify the precursors of failure:
• Trend Analysis. Reviewing data to see if a machine is on an obvious and immediate “downward slide” toward failure. For trending purposes, a minimum of three monitoring points before failure may reasonably be expected are recommended. Three data points allow one to determine whether equipment condition depreciates linearly.
• Pattern Recognition. Looking at the data and realizing the causal relationship between certain events and machine failure. For example, noticing that after machine x is used in a certain production run, component ax fails due to stresses unique to that run.
• Tests against Limits and Ranges. Setting alarm limits (based on professional intuition) and seeing if they are exceeded.
• Statistical Process Analysis. If published failure data on a certain machine/ component exists, comparing failure data collected on site with the published data to verify/disprove ,use that published data. General Condition-monitoring(CM) Categories Brief descriptions of some general CM categories are given below, in view to provide an introduction to different types of CM tasks. i) Temperature Measurement. Temperature measurement (e.g., temperature-indicating paint, thermography) helps detect potential failures related to a temperature change in equipment. Measured temperature changes can indicate problems such as excessive mechanical friction (e.g., faulty bearings, inadequate lubrication), degraded heat transfer (e.g., fouling in a heat exchanger) and poor electrical connections (e.g., loose, corroded or oxidized connections). The following table outlines the more common types of measurement with comments on applications and a brief technical description of the method.
Thermal Measurement Summary Table

Method Description Applications
Point temperatu
re
Usually a thermocouple or RTD. Often ‘imbedded’, can be provided
as an encapsulated sensor for permanent fit.
Can be used on all accessible surfaces.
Walk around versions take time to settle and are less robust than the
pyrometer.
Area Pyromete
r
Measures the emitted IR radiation from a surface. Often with a Laser
sight or area indicator.
Very good for walk around temperature checks on machines
and panels.
Temperature Paint / Stickers
Chemical indicators calibrated to change colour at a specific
temperature.
Great for inspection rounds.
Thermography
Hand held still or video camera sensitive to emitted IR.
The ultimate, high-resolution thermal
picture. Camera costs £10k up, service £500
per day.
Camera use and interpretation does
require ‘good’ training.
ii) Dynamic Monitoring. Dynamic monitoring (e.g., spectrum analysis, shock pulse analysis) involves measuring and analyzing energy emitted from mechanical equipment in the form of waves such as vibration, pulses and acoustic effects. Measured changes in the vibration

characteristics from equipment can indicate problems such as wear, imbalance, misalignment and damage.
The following table outlines the more common types of measurement with comments on applications and a brief technical description of the method.
Single Value Method Summary
Method Description Applications
ISO Filtered Velocity
2Hz – 1kHz filtered Velocity
Works as a general condition indicator.
SPM Carpet and Peak related to the demodulation of a
sensor resonance around 30kHz.
One of the better single value bearing indicator methods. Some problems on larger bearings and gear units.
Acoustic Emission
Distress & dB, demodulates a 100kHz
carrier which is sensitive to stress waves.
Better general indicator than ISO velocity, without the ISO comfort zone.
Vibration Meters / pens
Combine velocity, bearing and acceleration
techniques (sometimes include thermal)
Look for ISO Velocity, envelope & high frequency acceleration for best performance.
4-20mA sensors
Filtered data converted to DCS/PLC compatible
signal.
ISO velocity version available, envelope version still awaited.Can be used to ‘home in’ on specific problems by special order.

iii) Oil Analysis. Oil analysis (e.g., ferrography, particle counter testing) can be performed on different types of oils such as lubrication, hydraulic or insulation oils. It can indicate problems such as machine degradation (e.g., wear), oil contamination, improper oil consistency (e.g., incorrect or improper amount of additives) and oil deterioration.
The science of oil analysis falls into 4 main areas, which are listed below:
• Fluid Physical Properties (Viscosity, appearance)
• Fluid Chemical Properties (TBN, TAN, additives, contamination, % water)
• Fluid Contamination (ISO Cleanliness, Ferrography, Spectroscopy, dissolved gases(Transformer )
• Machine Health (wear metals associated with plant components) iv) Corrosion Monitoring. Corrosion monitoring (e.g., coupon testing, corrometer testing) helps provide an indication of the extent of corrosion, the corrosion rate and the corrosion state (e.g., active or passive corrosion state) of material. v) Nondestructive Testing. Nondestructive testing involves performing tests (e.g., x-ray, ultrasonic) that are noninvasive to the test subject. Many of the tests can be performed while the equipment is online. vi) Electrical Testing and Monitoring. Electrical condition-monitoring techniques (e.g., high potential testing, power signature analysis) involve measuring changes in system properties such as resistance, conductivity, dielectric strength and potential. Some of the problems that these techniques will help detect are electrical insulation deterioration, broken motor rotor bars and a shorted motor stator lamination. vii) Observation and Surveillance. Observation and surveillance condition-monitoring techniques (e.g., visual, audio and touch inspections) are based on human sensory capabilities. They can serve as a supplement to other condition-monitoring techniques. These techniques will help detect problems such as loose/worn parts, leaking equipment, poor electrical/pipe connections, steam leaks, pressure relief valve leaks and surface roughness changes.
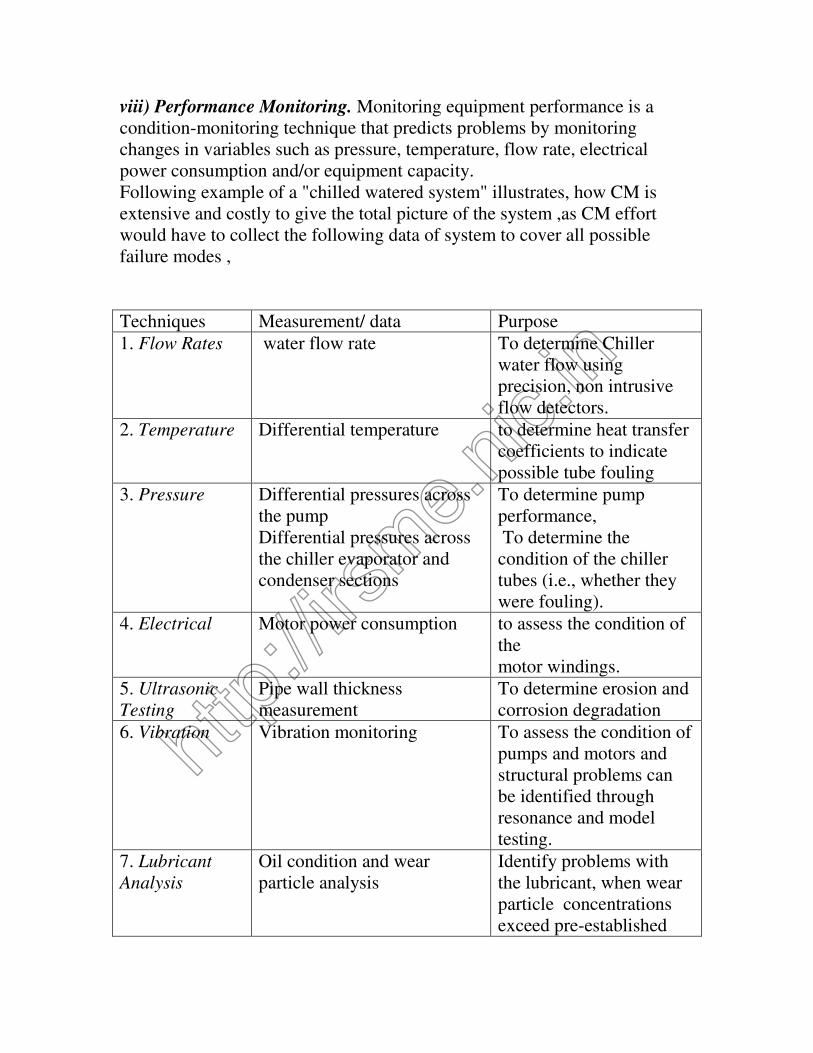
viii) Performance Monitoring. Monitoring equipment performance is a condition-monitoring technique that predicts problems by monitoring changes in variables such as pressure, temperature, flow rate, electrical power consumption and/or equipment capacity. Following example of a "chilled watered system" illustrates, how CM is extensive and costly to give the total picture of the system ,as CM effort would have to collect the following data of system to cover all possible failure modes ,
Techniques Measurement/ data Purpose 1. Flow Rates water flow rate To determine Chiller
water flow using precision, non intrusive flow detectors.
2. Temperature Differential temperature to determine heat transfer coefficients to indicate possible tube fouling
3. Pressure Differential pressures across the pump Differential pressures across the chiller evaporator and condenser sections
To determine pump performance, To determine the condition of the chiller tubes (i.e., whether they were fouling).
4. Electrical Motor power consumption to assess the condition of the motor windings.
5. Ultrasonic
Testing Pipe wall thickness measurement
To determine erosion and corrosion degradation
6. Vibration Vibration monitoring To assess the condition of pumps and motors and structural problems can be identified through resonance and model testing.
7. Lubricant
Analysis Oil condition and wear particle analysis
Identify problems with the lubricant, when wear particle concentrations exceed pre-established

limits. 8. Fiber Optics Fiber optic inspections To determine component
wear, tube fouling, etc.
9. Thermography
Thermography scans To identify high temperature conditions in motor control centers and electrical distribution junction boxes, failing conductor insulation, Piping insulation.
10. Eddy
Current Eddy current testing To determine and locate
leaking tubes.
11. Airborne
Ultrasonics Airborne ultrasonics testing To indicate air leakage
from control system piping and compressors.
Selection of Condition-monitoring Technique The following points should be considered for guidance prior to assigning a CM task so that an effective and technically/economically feasible approach can be chosen. 1 .Condition Being Detected
The condition or operating performance of the equipment must be understood so that the point of onset of failure can be defined. Also, parameter(s) that can be measured /observed and represent the equipment’s condition must be understood so that an appropriate CM task can be selected. 2. P-F Interval
Although many failure modes are not age-related, most of them give some sort of warning that they are in the process of occurring or about to occur. The frequency of predictive maintenance tasks has nothing to do with the frequency of failure and nothing to do with the criticality of the item. The frequency of any form of condition-based maintenance is based on the fact that most failures do not occur instantaneously, and that it is often possible to detect the fact that the failure is occurring during the final stages of deterioration If evidence can be found that something is in the final stages of a failure, it may be possible to take action to prevent it from failing completely and/or to avoid the consequences.

Figure "A" illustrates this general process. It is called the P-F curve, because it shows how a failure starts and deteriorates to the point at which it can be detected (the potential failure point "P"). Thereafter, if it is not detected and suitable action taken, it continues to deteriorate - usually at an accelerating rate - until it reaches the point of functional failure (Point "F").
In practice, there are many ways of determining whether failures are in the process of occurring (e.g., hot spots showing deterioration of furnace refractories or electrical insulation, vibrations indicating imminent bearing failure, increasing level of contaminants in lubricating oil). If a potential failure is detected between Point P and Point F, it may be possible to take action to prevent the functional failure (or at least to minimize the effects). Tasks designed to detect potential failure are known as condition-monitoring tasks. The amount of time (or the number of stress cycles) which elapse between the point where a potential failure occurs and the point where it deteriorates into a functional failure Or the warning period during which CM tasks can be used to detect the onset of a failure is known as the P-F interval, as shown in Figure"A". The P-F interval governs the frequency with which the predictive task must be done. The checking interval must be significantly less than the P-F interval if we wish to detect the potential failure before it becomes a functional failure. The P-F interval can be measured in any units relating to exposure to stress (running time, units of output, stop-start cycles, etc), but it is most often measured in terms of elapsed time. For different failure modes, the P-F interval can vary from fractions of a second to several decades.
The amount of time needed to respond to any potential failures which are discovered also influences condition-based task intervals. In general, these responses consist of any or all of the following take action to avoid the consequences of the failure

• plan corrective action so that it can be done without disrupting production and/or other maintenance activities
• organise the resources needed to rectify the failure.
The amount of time needed for these responses also varies, from a matter of hours (say until the end of an operating cycle or the end of a shift), minutes (to clear people from a building which is falling down) or even seconds (to shut down a machine or process which is running out of control) to weeks or even months (say until a major shutdown).Unless there is a good reason to do otherwise, it is usually sufficient to select a checking interval equal to half the P-F interval. This ensures that the task will detect the potential failure before the functional failure occurs, while providing a net interval of at least half the P-F interval to do something about it. However, it is sometimes necessary to select a checking interval which is some other fraction of the P-F interval. For instance, Figure "C" shows how a P-F interval of 9 months and a checking interval of 1 month give a nett P-F interval of 8 months. This is sometimes known as the available P-F interval
Determining Condition-monitoring Maintenance Task Intervals
Condition-monitoring maintenance task intervals must be determined based on the expected P-F interval. The following sources may be referred to as an aid to determine the P-F interval: i) Expert opinion and judgment (e.g., manufacturer’s recommendations) ii) Published information about condition-monitoring tasks (e.g., RCM texts, Manuals) iii) Historical data (e.g., current condition-monitoring task intervals)

The interval for a condition-monitoring task should not be set at more than half the expected P-F interval and should be adjusted based on the following considerations:
i) Reduce the task interval if the P-F interval minus the task interval (based on 1/2 [P-F interval]) does not provide sufficient time to implement corrective actions.
ii) Reduce the task interval if there is low confidence in the “guesstimate” of the expected P-F.
iii) Reduce the task interval for higher risk failure modes. iv) Set the task interval at half the expected P-F interval (or slightly above)
for lower risk failure modes. Initial Condition-monitoring Task Intervals
Because few organizations will have detailed knowledge about the equipment failure mode P-F interval, the following guidelines can be used to establish initial condition-monitoring task intervals: i) If an existing condition-monitoring task is being performed and has proven to be effective (e.g., no unexpected failures have occurred), use the existing task interval as the initial default task interval. ii) If an existing condition-monitoring task is being performed and some functional failures have occurred, adjust the task interval downward based on the experience. iii) If there is no existing condition-monitoring task being performed or a new condition monitoring task is being proposed, the task interval will have to be based on the team’s estimate of the P-F interval and guidelines as given in above Para (I to iv). The following questions can help the team estimate the P-F interval: • How quickly can the condition deteriorate and result in a functional failure? Will it deteriorate in minutes, hours, days, weeks, months or years? • What is the capability of the condition-monitoring task in detecting the onset of failure? High or low? • How confident is the team in its judgment?
3 Measurement Precision/Sensitivity
The measurement precision and sensitivity of the CM technique being used need to be understood because they affect the reaction time available to reduce or eliminate the consequences of the functional failure. Take the

example of using ultrasonic testing versus human auditory sense as a CM approach. If both of these CM techniques were used in the same service, ultrasonic testing will provide more precision and sensitivity (e.g., can detect less intense noises). Therefore, it will consistently provide more reaction time once the onset of failure is detected. Of course, other variables (e.g., economic, available resources) might drive the use of the human auditory sense.
4. Skills
CM techniques require varying skill levels, so this must be taken into consideration when selecting tasks. An investment might have to be made to train personnel, or outside sources might need to be contracted to perform the tasks.
5. Resources versus the Risk
The risk of the equipment functional failure must also be taken into account when assigning CM tasks. Risk is the combination of the effect and the likelihood of an undesired event. Effects may include safety, health, economic, environmental or other types of potential losses. Likelihood addresses the probability of a single occurrence of the undesired event (e.g., equipment failures) or the average frequency of occurrence of the undesired event. For example, a machine that fails twice per year causing Rs.100,000 in lost production per failure event has the same risk as a machine that fails 10 times per year causing Rs20,000 in lost production per event. Over a year’s time, the failure of each machine results in Rs.200,000 in lost production. The economic risk associated with operating these two machines is equal. Using this example, the risk of operating the two machines is reduced to an annual cost (Rs. per year). If the risk of a functional failure is less than the cost of the CM task, then it might not be economically feasible to perform the task.
6. Environment, Location and Portability
The physical feasibility to perform a CM task must also be considered. For example, equipment located in hazardous environments may preclude human inspections. Also, some CM techniques might not be feasible because the equipment being observed is located in tight areas, or the measuring equipment being used might be cumbersome and difficult to transport to certain areas. 7. CBM Task Applicability and Effectiveness

The following considerations must be made for a condition-monitoring maintenance task to be considered applicable and effective. i) Onset of failure must be detectable. There must be some measurable parameter that can detect the deterioration in the equipment’s condition. In addition, maintenance personnel must be able to establish limits to determine when corrective action is needed. ii) Reasonably consistent P-F interval. The P-F interval must be consistent enough to ensure that corrective actions are not implemented prematurely or that failure occurs before corrective actions are implemented. iii) Practical interval in which condition-monitoring tasks can be performed.
The P-F interval must be sufficient to permit a practical task interval. For example, a failure with a P-F interval of minutes or hours is probably not a good candidate for a condition-monitoring maintenance task. iv) Sufficient warning so that corrective actions can be implemented. The P-F interval must be long enough to allow corrective actions to be implemented. This can be determined by subtracting the task interval from the expected P-F interval and then judging whether sufficient time remains to take necessary corrective actions. v) Reduces the probability of failure (and therefore the risk) to an
acceptable level. The tasks must be carried out at an interval so that the probability of failure allows an acceptable risk level to be achieved. Agreed-upon risk acceptance criteria should be determined and recorded. vi) Must be cost-effective. The cost of undertaking a task over a period of time should be less than the total cost of the consequences of failure. 8.Establishing CBM Task Action Limits
Establishing task action limits helps to ensure that condition-monitoring tasks are effective in detecting and/or preventing the failure. The actions may involve any of the following: i) Re performing the condition-monitoring task to verify the results ii) Altering the task interval to ensure closer monitoring of the equipment iii) Initiating corrective actions to prevent the impending equipment failure
Advancements in CBM Technologies
Customer demands for improvements in quality, productivity, inventory control, and expenditure on plant and machinery leads to advancement in CBM systems. Technological advances are accepted and applied to CBM systems, which includes improved knowledge of failure mechanisms, advancements in failure forecasting techniques, advancements in monitoring

and sensor devices, advancements in diagnostic and prognostic software, acceptance of communication protocols, developments in maintenance software applications and computer networking technologies to name a few.
To aid the performance of CBM systems; fuzzy logic, neural networks and the application of Dempster Shafer theory are designed. Capabilities of CBM system are judged on their ability to accurately diagnose failure conditions and then predict (prognose) remaining working life before machine / process failure.
Intelligent CBM
Intelligent CBM means a CBM system capable of understanding and making decisions without human intervention. Technologies making this possible include: sensors with built in intelligence (SMART Sensors) capable of transmitting relatively rich, high grade information; re-programmable on-line sensors, designed to be reconfigured with new rules in the event that detectable recognisable patterns change; algorithms, fuzzy logic and neural networking, designed to analyse trends within recovered sensory data, and produce decisions on the likelihood of failure of monitored plant items; artificial intelligence algorithms capable of providing proxy data as a substitute for failing or a failed sensor, whilst the malfunctioning sensor is repaired.
Further intelligence is possible through integration of a CBM system with a companies computerised purchasing system, thus automating parts ordering.
As technological advancements have fed into CBM so the method of deploying CBM systems and integrating them with other business systems has changed. Two recognised deployments are: Localised CBM, and Remote CBM.
Localised CBM
Localised CBM is an independent predictive maintenance practice, likely to be undertaken within immediate proximity of the components being monitored, by a maintenance engineer (technician) or operator. A typical procedure involves taking and recording CBM data at periodic intervals in order to determine the condition of the component being monitored, and then deciding whether the condition of the component is acceptable or not.
Remote CBM

Remote CBM systems can be either standalone or networked to another business system. Remote CBM involves monitoring the condition of a component at a location away from the immediate vicinity of the component in question. Monitoring will be undertaken automatically or manually depending upon the systems capabilities at intermittent time periods. Diagnosing the condition of the component may be either automatic or manual, again depending upon the systems capabilities. Wireless sensors present opportunities for placing sensors in difficult-to-reach locations, electrically noisy environments, and mobile applications where wire cannot be installed. Presenting CBM information through web pages accessible by Internet browsers is given the name ‘Internet CBM’, or ‘E-Monitoring Machine Health System’. Internet CBM takes remote CBM to another level, i.e. providing global remote capabilities. Since browsers reside on many platforms, Internet CBM systems may be accessed by multiple users working on any type of operating system. This presents the opportunity for employees to monitor their machinery whilst away from the factory, i.e. overseas on business calls. Unauthorised access to an Internet CBM system is prevented with the inclusion of user name and password access on the index web page for the web site. User name and password access may also be used to control access rights onto specific web pages and degree of user system interaction.
Interaction can be made between users and the Internet CBM system by using Active Server Pages (ASPs). ASPs, programmed using VBScript and JavaScript working behind the scenes within the Web server, offer flexibility to system designers. They carry out programmed instructions within the web server, define how the HTML is assembled and presented to users, providing users with the power to interact with the user interface and make choice selections. Vibration or process levels may now easily be transmitted over the Web and presented to the end user as gauges, reporting the condition of the remote machine in real time. Also graphs can be displayed showing performance trends, and tables of performance parameters, anomalies, and diagnosed faults.
Standardization of CBM systems
A standard for smart transducer interface for sensors and actuators (IEEE 1451), a standardization proposal in CBM architecture (OSA-CBM) and a standardization proposal in communication between different CBM modules (MIMOSA)is given below. CBM community would achieve the followings by using these standards;

• Interchangeable hardware and software components.
• More technological choices for users.
• More rapid technology development.
• Reduced prices.
• Improved ease of upgrading of system components. IEEE 1451
At the basic level of condition based maintenance there is sensors or other devices to pick up the data needed for analyzing the health of an asset. This is often referred to as a distributed measurement and control system (DMC). Due to the customers problem of integrating different vendor products (transducer, sensors and actuators) when networking, a standard for the hardware interconnection level is needed. But there is also need for standards in the software module of the transducers to achieve network interoperability at the network-node level. The developing and using industries of DMC systems are moving away from proprietary standards in hardware and software towards de facto standardized open systems approaches. Looking to develop a standardized interface to network smart sensors, the National Institute of Standards and Technology (NIST) started to work together with the Institute of Electrical and Electronics Engineers (IEEE) in the middle of the 1990’s. To achieve easy installation and upgrading of sensors one should link them together like personal computers via a local area network (LAN). Through this connection one will be able to connect many sensors via a single cable or bus. This will mean that sensors can be detached without affecting other sensor nodes. The IEEE 1451 standards for smart transducer interface for sensors and actuators purpose is to achieve common interfaces for connecting transducers to microprocessor-based systems, instruments and field networks in a network-independent fashion. The IEEE 1451-standard is divided into four sub-standards viz. IEEE 1451.1 and IEEE 1451.2; IEEE P1451.3 and IEEE P1451.4 OSA-CBM
OSA-CBM is an abbreviation for Open System Architecture for Condition Based Maintenance and is a proposal for a de facto non-proprietary standard. In the mission statement from the OSA-CBM organization (www.osacbm.org) it is declared that the standard proposal shall cover the whole range of functions of a CBM system, for both hardware and software components. The benefits of such a standard would according to the organization be:
• Improved ease of upgrading for system components

• A broader supplier community
• More rapid technology development
• Reduced prices
The OSA-CBM proposed standard divides a CBM system into seven interconnected different layers. Layer 1 Sensor Module: The sensor module provides the CBM system with digitized sensor or transducer data. The signal module could be built on the IEEE 1451 standard. Layer 2 Signal Processing: The signal processing module receives signals and data from the sensor module or other signal processing modules. The output from the signal processing module includes digitally filtered sensor data, frequency spectra, virtual sensor signals and other CBM features. The signal processing module could consist of AI-ESTATE (Artificial Intelligence and Expert System Tie to Automatic Test Equipment. Layer 3 Condition Monitor: The condition monitor receives data from the sensor module s, the signal processing module s and other condition monitors. Its primary focus is to compare data with expected values (e.g. normal vibration, high vibration, hazardous vibration). The condition monitor should also be able to generate alerts based on preset operational limits. This can be a very useful function for fast fault developments. Layer 4 Health Assessment: The health assessment module receives data from different condition monitors or from other health assessment modules. The primary focus of the health assessment module is to prescribe if the health in the monitored component, sub-system or system has degraded. The health

assessment module should be able to generate diagnostic records and propose fault possibilities. The diagnosing should be based upon trends in the health history, operational status and loading and maintenance history. Layer 5 Prognostics: The prognostic module should have the possibility to take account into data from all the prior layers. The primary focus of the prognostic module is to calculate the future health of an asset, with account taken to the future usage profiles. The module should report the future health status of a specified time or the remaining useful life (RUL). Layer 6 Decision Support: The decision support module receives data from the health assessment module and the prognostic module. Its primary focus is to generate recommended actions and alternatives. The actions can be of the maintenance sort but also how to run the asset until the current mission is completed without occurrence of breakdown. Layer 7 Presentation: The presentation module should present data from all previous modules The most important layers to present would of course be the data from the health assessment, prognostic and decision support modules as well as alerts generated from the condition monitors. But the
ability to lock even further down in the layer should be a possibility. The presentation module could be built in into a regular machine interface.
The seven layers in OSA-CBM standard proposal
MIMOSA
The Machinery Information Management Open System Alliance, MIMOSA, was founded in 1994 and introduced in the September issue 1995 of Sound and Vibration. In December 1996 the non-for-profit organization was incorporated. MIMOSA’s purpose and goal is to develop open conventions for information exchange between plant and machinery maintenance information systems. The development of MIMOSA CRIS (Common Relational Information Schema) has been openly published at their website (www.mimosa.org). The CRIS provides coverage of the information (data)

that will be managed within a CBM system; this is done by a relational database schema for machinery maintenance information. CBM approach on rail vehicles
A certain amount of difficulties must be circumvented when applying the condition based maintenance technique on a moving system, such as a rail vehicle. Compared to an ordinary engineering industry, the degradation and maintenance will be connected to the geographical location. In an engineering industry, the analysis and diagnosing can take place in a stationary system, using real time data from the machinery. In the rail industry this data must be sent to a maintenance centre (see figure). There exist a few alternatives how to do this. One alternative is to look at the rail vehicle as a machine, and let the analysis and diagnosing take place on board, were only refined information of the condition leaves the vehicle. Another is to collect real time data at the vehicle and let the analysis and diagnosing take place at a maintenance centre, this means that a large amount of data must be transmitted to a central database. This transmit could either use GSM technique or wirelessly at train stations (Bluetooth, infrared etc.).
The communications between the rail vehicle, maintenance centre and
service
Main layers in the on rail vehicle CBM system For an easy explanation how a whole CBM system, from the sensors that measures data to the maintenance centre who writes work orders, could work, can be divide it into different layers. Sensor Module: To monitor the condition of a rail vehicle the use of sensors will be inevitable, but we can also see the immense value of monitoring the control and communication system, as well as using a global positioning system (GPS). The sensors will collect data from chosen components, sub-systems and systems, which most likely will be monitored by trend. The control and communication system, which is the “backbone” of the vehicle, will be monitored in the same purpose. The GPS will always tell the exact

position of the vehicle, which renders the possibility to tie a fault to a geographical location. This enables identification of fault symptoms that are related to outer circumstances. Today, micro system has made it possible to transfer digitally filtered signals directly from the sensors. The research and development within the sensor industry is strong and only time will tell how intelligent the sensors can get. Development in the technology shows that it will be possible to even put trend monitoring equipment in the sensors. This would of course decrease the communications between the different layers. The communication between the sensors and data collectors should for practical and financial reasons be wireless, the cabling cost can average from $60 to $6000 per meter. It can also, if necessary, be out of two-way communication, for calibration and gradation purposes. Intelligent system: No matter where one chooses to perform analysis of the measured data, there will be a large need for knew advanced technique. To process all the information coming from the monitored components, sub-systems or systems there needs to be software capable of handling complex (non-linear) relations and from normal operation deviating trends. The technique that makes this a possibility is Artificial Intelligence (AI), a technique that has been developed during a number of decades. Neural Networks, Fuzzy Logics, Case Based Reasoning and Expert Systems, just to mention a few, are today existing methods that could work for this type of application. Which method to use for diagnosing the condition and predict the remaining useful life depends on what’s being monitored and how the monitoring is done? For the prediction of remaining useful life; algorithms, historic data, historic condition, mission history, failure history, maintenance history, model information and spare assets must be taken into account. The intelligent system should be programmed and have the functions to answer the following questions:
• Where does fault symptom exist (what component, sub-system or system)
• The cause of the failure symptom
• How long before breakdown or irreversible fault
• The consequent of component, sub-system or system failure
• Recommended maintenance action To process all data that can be measured from a rail vehicle will demand powerful software, but it would be a mistake to completely remove the human as a factor in maintenance planning. A large amount of information of a vehicles condition can and will always be found within the service personnel and operators that have a day-to-day contact with the asset.

Human interface on rail vehicle: On the rail vehicle all information that is necessary for safety reasons should be presented to the operator. To some extent, this means that the operator can change hers or his driving routines, e.g. prolong breaking distance, to mitigate incipient faults diagnosed by the intelligent system. Maintenance centre: In charge of maintenance planning of the vehicles the maintenance centre will probably work with some sort of planning software (e.g. Maximo). The centre should have access to all the measured data and of course all the refined information. With the information from the intelligent system as well as service and operators fault reports the maintenance planner will work out the best possible preventive maintenance schedule and work orders for a whole fleet of vehicles. After any maintenance actions have been executed a feedback-loop to the intelligent system should be made for evaluation purposes. On board – off board
Compared to an engineering industry, a rail vehicle must have a system divided into one on board and one off board location. On the vehicles there will be placed sensors and other measuring equipment, one or more temporary databases and in some cases condition monitors (comparing the real time data with historic for faults with fast development). The analysis and prediction functions will most likely be place off board in the maintenance centre. The technique of transferring large amount of real time data is today not longer an immoderate problem and with this concept the cost of computer power on the rail vehicle can be kept lower. Possibilities with a CBM system on rail vehicles
Rail vehicles are such large and complex system so it would be impossible to monitor every component. This means that one have to focus its attentions on what to measure. Safety critical functions (for both operation and human) are already today a lot of the times monitored and should of course always be. But the large incentives of implementation of CBM technique is the savings in increased process availability and more effectively preventive maintenance execution. When deciding what to monitor one should look on process critical functions and maintenance actions that is carried out non-effectively. The list of possible functions and components to monitor could be made long, here follows a few:
• Harmful currents/voltages
• Flat wheel detection
• Brakes
• Door systems

• Wheel bearings
• Filters
• Water and air pressure
• Rotating parts
• Derailment Implementation of a CBM system
The key word for a successful implementation of a CBM system on rail vehicles is probably long term planning. Long before making reality of the monitoring and analysis of the process one has to be very clear of what is being monitored and how this is being done. To really start making money of the new way of planning the maintenance actions one also has to look over the way maintenance is planned today. All that is not working according to the original plan needs to be fixed before any major changes is being done. On a rail vehicle or other large systems another keyword is probably small scale. To believe that every failure possibility can be monitored right away is a dangerous thought. There is no meaning of rushing into a situation one is not familiar with in order to save a few more dollars. Narrow down the failure possibilities to monitor to just a few. Chose them after failure rates, safety critical reasons (operational and human) and maintenance budget related actions (the faults that cost a lot of money to maintain). From these three categories one should start with faults that are well documented. Difficulties of CBM system on rail vehicles
The differences of implementing a CBM system in an engineering industry and on a rail vehicle are quite large. A stationary process machine is always bolted to a heavy foundation, whilst a rail vehicle always is on the move with only the rail track as a foundation. A rail vehicle is also exposed for large differences in operating conditions during the year’s seasons. False alarms: That the CBM system doesn’t cause false alarms is probably the most decisive parameter that the new technique will be accepted by the end-users. False alarm will most likely raise the maintenance budget instead of lowering it. The whole concept of CBM systems is that it is based on a high reliability. To avoid false alarms a good implementation plan is needed (see above). Running-in: When which components, sub-systems or systems have been decided to monitor one need to establish what is normal operation and what is not. Measurements and readings must be collected if they do not already exist. This might take some time and it is important to let it. If rushing into

trust for a CBM system all too soon, one will probably experience unnecessary false alarms. The human factor: As always with new technique the human factor might be a problem, there will always be reactionary persons that think “the way we are doing it is working just fine”. The technique, profits, possibilities, incentives etc. must be presented before starting a new maintenance approach. Maintenance planning: When moving away from the time based or operational based maintenance planning toward the condition based planning a lot of problems will most likely occur. The planning will move from static (intervals) to dynamic (intervals). Today, the intervals time length can almost be decided when constructing a new rail vehicle. With CBM, the intervals length and frequencies will change from time to time. Maintenance planners will have to put more trust in the computerized maintenance management systems (CMMS) that automatically will take traffic plans, spare parts, maintenance schedules, work orders etc. into account. In the year 2002 two case studies were made in Sweden on the door system of the C20 Metro & on the door system of an airport ground transportation vehicle, show that it was possible to design, built and implement a predictive maintenance system on the door system without major design changes and without significant investment. It is possible to use the same technical approach of CBM on rail vehicles as it is in an engineering industry.
Advantages
Studies have estimated that a properly functioning of CBM or predictive maintenance program can provide a savings of 8% to 12% over preventive maintenance program alone. Independent surveys indicate the following industrial average savings resultant from initiation of a functional predictive maintenance program: • Reduction in maintenance costs: 25% to 30% • Elimination of breakdowns: 70% to 75% • Reduction in equipment or process downtime: 35% to 45% • Increase in production: 20% to 25%. • Increased component operational life/availability. • Allows for preemptive corrective actions. • Decrease in costs for parts and labor. • Better product quality. • Improved worker and environmental safety.

• Improved worker moral. • Energy savings. Disadvantages
• Diagnostic equipment being costly has increased the investment. • Staff training increased the investment. • Management can not see readily potential Savings.
References:
• Articles available on Internet " RCM" by -ALDON
• "Reliability centered maintenance" by -Alan Pride available on Internet
• A paper on Tech Design of Condition based maintenance system –by Marcus Bengtsson. available on Internet
• Guides notes on RCM-by ABS, Hunston, USA. available on Internet
• Condition Based Maintenance on Rail Vehicles – Possibilities for a more effective maintenance strategy By -Bengtsson Marcus ,available on Internet
AUTHOR:
S.K.Sethiya, presently working as Secretary to CME, West Central Railway at Jabalpur, is a graduate Mechanical engineer from Govt. Engineering College Jabalpur having in depth knowledge and experience of Rolling stock including Diesel Electric locomotives of Indian Railways.