REVIEW OF ECONOMIC ISSUES ASSOCIATED WITH CBM DEVELOPMENT
15
REVIEW OF ECONOMIC ISSUES ASSOCIATED WITH CBM DEVELOPMENT BY ROGER COUPAL 1 MAY, 2005 Central to the conflicts surrounding CBM development are the economics of gas production and water disposal. From 2000 to 2003 PRB gas production reached over $3.648 billion in value with almost 40% of it occurring in 2003. Gas production produces substantial tax revenues that fund public services for local governments and public institutions in the region, for the state, and the nation. Water produced with the gas is a by-product managed with surface runoff, infiltration ponds, or in some cases re-injection. Some argue that water disposal can represent a loss of an important resource in an arid region like the PRB. Or if the water is of poor quality it can cause damage to pastures and intermittent streambeds, which then can represent a loss in economic value to affected surface owners. So the benefits of CBM development including labor income and tax revenues needs to be compared with the costs of that development, including but not limited to the cost of water lost and the cost of environmental impacts related to poor quality water. Technologies for the management, treatment, and use of CBM co-produced water continue to advance, and environmental regulations evolve as federal, state, and local governments are given new responsibilities in protecting environmental quality. However, little information has been collected on how CBM development and regulations affect socioeconomic conditions in the communities and throughout the state. For example, the costs and future economic implications of the loss of water remain unknown. Also, the economic losses to ranches without mineral rights have not been determined. Finally, estimates of how much money stays in Wyoming versus how much leaves with energy developers and their employees do not yet exist. The economic studies can be divided into two categories: industry level studies (operator level) which identify the benefits and costs to firms, and second, regional level studies. The latter identifies the benefits and costs to an identified region (e.g. Powder River Basin economies, State of Wyoming, etc.). Industry studies evaluate net returns to the industry under alternative water management regimes. If the rate of return is equal to or higher than the industry standard under a particular water management regime, this would mean that it is economically feasible for the industry to adopt the practice. If the rate of return is lower then it is not economically feasible. Such a study does not address spillover effects to other parts of the regional economy, nor the opportunity cost of water as an input for future economic development. Regional studies take into account the broader benefits and costs to residents in the region, and should attempt to include spillover costs, and opportunity costs of water. This approach does not address firm level profitability of alternative water management regimes. 1 University of Wyoming Department of Agricultural and Applied Economics, Dept. 3354, 1000 E. University Ave., Laramie, WY 82071. 1
Transcript of REVIEW OF ECONOMIC ISSUES ASSOCIATED WITH CBM DEVELOPMENT

REVIEW OF ECONOMIC ISSUES ASSOCIATED WITH CBM DEVELOPMENT BY ROGER COUPAL1
MAY, 2005
Central to the conflicts surrounding CBM development are the economics of gas
production and water disposal. From 2000 to 2003 PRB gas production reached over $3.648 billion in value with almost 40% of it occurring in 2003. Gas production produces substantial tax revenues that fund public services for local governments and public institutions in the region, for the state, and the nation. Water produced with the gas is a by-product managed with surface runoff, infiltration ponds, or in some cases re-injection. Some argue that water disposal can represent a loss of an important resource in an arid region like the PRB. Or if the water is of poor quality it can cause damage to pastures and intermittent streambeds, which then can represent a loss in economic value to affected surface owners. So the benefits of CBM development including labor income and tax revenues needs to be compared with the costs of that development, including but not limited to the cost of water lost and the cost of environmental impacts related to poor quality water.
Technologies for the management, treatment, and use of CBM co-produced water continue to advance, and environmental regulations evolve as federal, state, and local governments are given new responsibilities in protecting environmental quality. However, little information has been collected on how CBM development and regulations affect socioeconomic conditions in the communities and throughout the state. For example, the costs and future economic implications of the loss of water remain unknown. Also, the economic losses to ranches without mineral rights have not been determined. Finally, estimates of how much money stays in Wyoming versus how much leaves with energy developers and their employees do not yet exist.
The economic studies can be divided into two categories: industry level studies (operator level) which identify the benefits and costs to firms, and second, regional level studies. The latter identifies the benefits and costs to an identified region (e.g. Powder River Basin economies, State of Wyoming, etc.). Industry studies evaluate net returns to the industry under alternative water management regimes. If the rate of return is equal to or higher than the industry standard under a particular water management regime, this would mean that it is economically feasible for the industry to adopt the practice. If the rate of return is lower then it is not economically feasible. Such a study does not address spillover effects to other parts of the regional economy, nor the opportunity cost of water as an input for future economic development. Regional studies take into account the broader benefits and costs to residents in the region, and should attempt to include spillover costs, and opportunity costs of water. This approach does not address firm level profitability of alternative water management regimes.
1 University of Wyoming Department of Agricultural and Applied Economics, Dept. 3354, 1000 E. University Ave., Laramie, WY 82071.
1
Economic studies for CBM gas development for the Powder River Basin have for the most part not addressed comprehensive questions both from the industry level and the regional level. This review will summarize three industry level studies that evaluated the cost of alternative water management strategies, the economic sections of two environmental impact statements, and two studies that attempted to frame the issue of gas versus water in more complete economic framework.
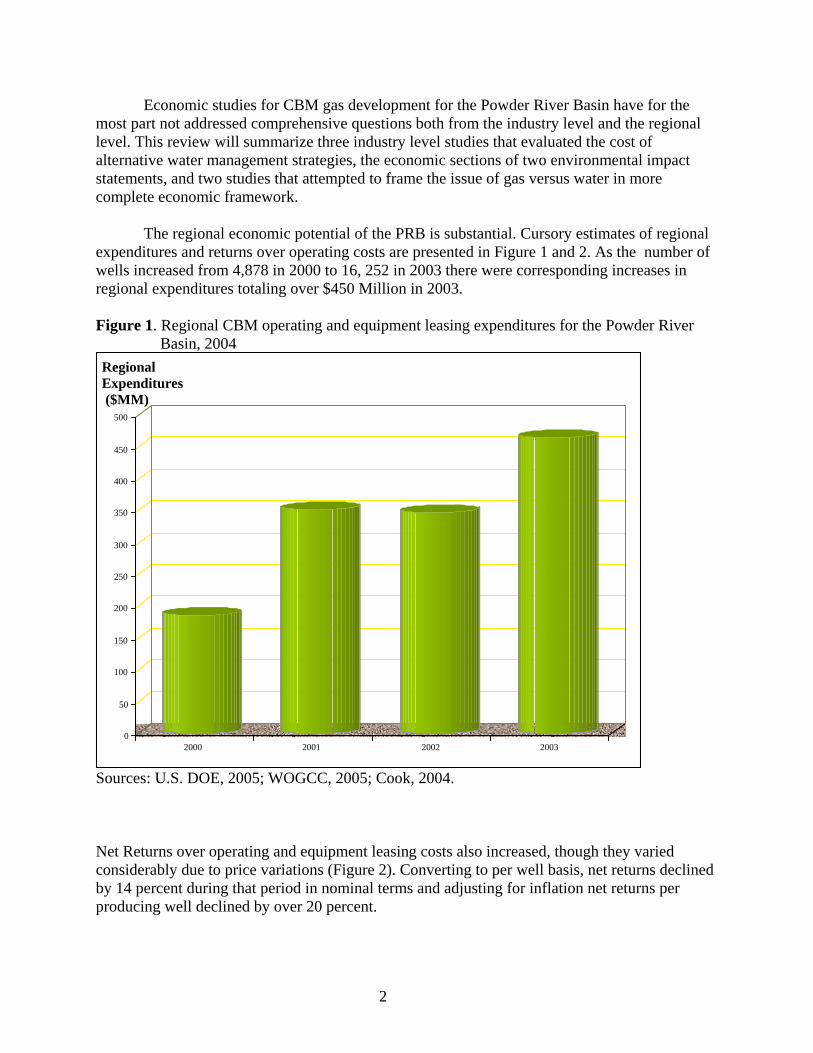
The regional economic potential of the PRB is substantial. Cursory estimates of regional expenditures and returns over operating costs are presented in Figure 1 and 2. As the number of wells increased from 4,878 in 2000 to 16, 252 in 2003 there were corresponding increases in regional expenditures totaling over $450 Million in 2003. Figure 1. Regional CBM operating and equipment leasing expenditures for the Powder River
Basin, 2004
0
50
100
150
200
250
300
350
400
450
500
2000 2001 2002 2003
Regional Expenditures ($MM)
Sources: U.S. DOE, 2005; WOGCC, 2005; Cook, 2004. Net Returns over operating and equipment leasing costs also increased, though they varied considerably due to price variations (Figure 2). Converting to per well basis, net returns declined by 14 percent during that period in nominal terms and adjusting for inflation net returns per producing well declined by over 20 percent.
2

Figure 2. Net returns over operating and equipment leasing costs and average annual price of
methane per mcf, 2000 – 2003.
0.000
200.000
400.000
600.000
800.000
1000.000
1200.000
2000 2001 2002 2003
year
Net
Ret
urns
($M
M)
0
0.5
1
1.5
2
2.5
3
3.5
4
4.5
Ave
. Pric
e pe
r MCF
Net Revenue($MM) Average price per MCF
Sources: U.S. DOE, 2005.
During this same period over 2 billion barrels of water were produced (Figure 3). The rate of water production has been declining since the play started, which may have to do with the inherent age of wells, and the areas within the Powder River Basin where development is occurring. The value of the water depends upon the quality of the water and its location relative to potential demand. If water is sufficient quality but at significant distance to potential users then the cost of transporting the water to users will devalue the water relative to other sources. If the quality of the water is such that it would incur substantial treatment to be useful for a potential user then that would also devalue the water relative to other sources. Ongoing studies of both quality and quantity of water produced will improve our understanding of the supply side. What we know little of is potential demand. Table 3 attempts to place some bounds on the value of that water from a demand side. The agricultural value is estimated from a study on the irrigation use on the Wind River and inflated to current dollars. Based upon this study we provide a floor value of $65 per acre-foot ($0.0015 per ft3). It is important to stress that this assumes the water is of sufficient quality for agricultural use. If not then the value would lower
3
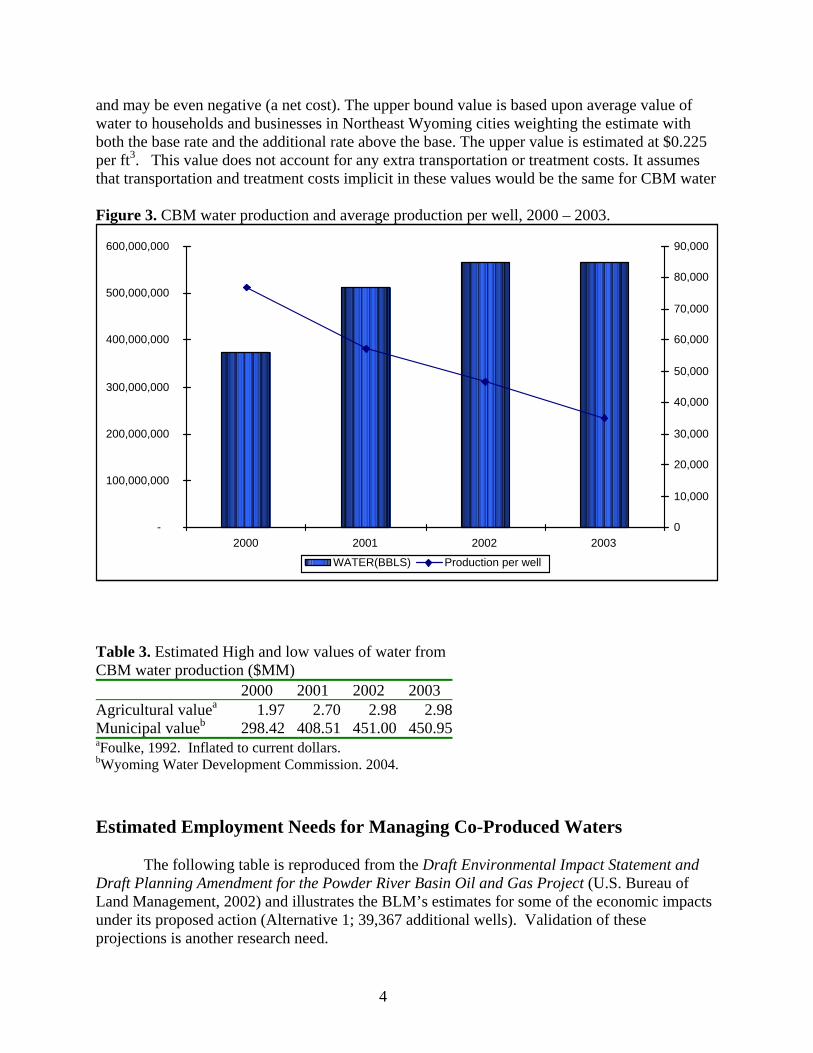
and may be even negative (a net cost). The upper bound value is based upon average value of water to households and businesses in Northeast Wyoming cities weighting the estimate with both the base rate and the additional rate above the base. The upper value is estimated at $0.225 per ft3. This value does not account for any extra transportation or treatment costs. It assumes that transportation and treatment costs implicit in these values would be the same for CBM water Figure 3. CBM water production and average production per well, 2000 – 2003.
-
100,000,000
200,000,000
300,000,000
400,000,000
500,000,000
600,000,000
2000 2001 2002 20030
10,000
20,000
30,000
40,000
50,000
60,000
70,000
80,000
90,000
WATER(BBLS) Production per well
Table 3. Estimated High and low values of water from CBM water production ($MM)
2000 2001 2002 2003 Agricultural valuea 1.97 2.70 2.98 2.98Municipal valueb 298.42 408.51 451.00 450.95aFoulke, 1992. Inflated to current dollars. bWyoming Water Development Commission. 2004. Estimated Employment Needs for Managing Co-Produced Waters
The following table is reproduced from the Draft Environmental Impact Statement and Draft Planning Amendment for the Powder River Basin Oil and Gas Project (U.S. Bureau of Land Management, 2002) and illustrates the BLM’s estimates for some of the economic impacts under its proposed action (Alternative 1; 39,367 additional wells). Validation of these projections is another research need.
4
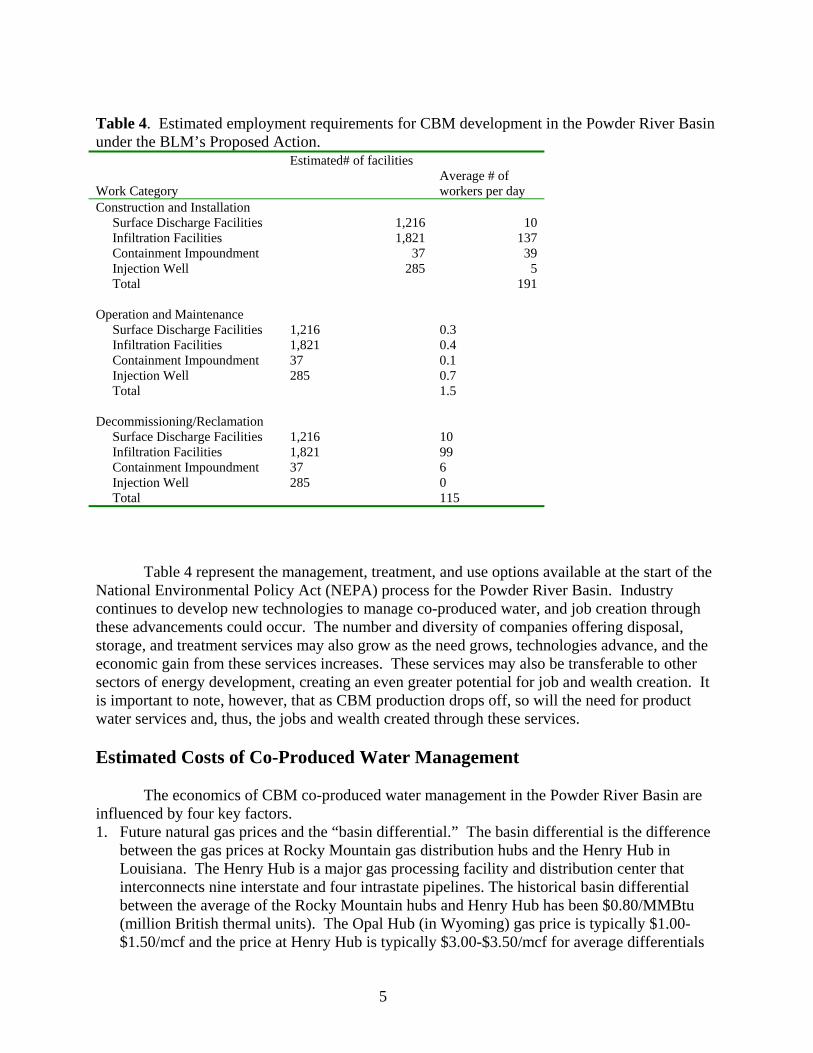
Table 4. Estimated employment requirements for CBM development in the Powder River Basin under the BLM’s Proposed Action. Work Category
Estimated# of facilities Average # of workers per day
Construction and Installation Surface Discharge Facilities 1,216 10 Infiltration Facilities 1,821 137 Containment Impoundment 37 39 Injection Well 285 5 Total 191 Operation and Maintenance
Surface Discharge Facilities 1,216 0.3 Infiltration Facilities 1,821 0.4 Containment Impoundment 37 0.1 Injection Well 285 0.7 Total 1.5 Decommissioning/Reclamation
Surface Discharge Facilities 1,216 10 Infiltration Facilities 1,821 99 Containment Impoundment 37 6 Injection Well 285 0 Total 115
Table 4 represent the management, treatment, and use options available at the start of the National Environmental Policy Act (NEPA) process for the Powder River Basin. Industry continues to develop new technologies to manage co-produced water, and job creation through these advancements could occur. The number and diversity of companies offering disposal, storage, and treatment services may also grow as the need grows, technologies advance, and the economic gain from these services increases. These services may also be transferable to other sectors of energy development, creating an even greater potential for job and wealth creation. It is important to note, however, that as CBM production drops off, so will the need for product water services and, thus, the jobs and wealth created through these services. Estimated Costs of Co-Produced Water Management
The economics of CBM co-produced water management in the Powder River Basin are influenced by four key factors. 1. Future natural gas prices and the “basin differential.” The basin differential is the difference
between the gas prices at Rocky Mountain gas distribution hubs and the Henry Hub in Louisiana. The Henry Hub is a major gas processing facility and distribution center that interconnects nine interstate and four intrastate pipelines. The historical basin differential between the average of the Rocky Mountain hubs and Henry Hub has been $0.80/MMBtu (million British thermal units). The Opal Hub (in Wyoming) gas price is typically $1.00-$1.50/mcf and the price at Henry Hub is typically $3.00-$3.50/mcf for average differentials
5
of $1.50-$2.00. This difference in hub gas prices is due to high gas transportation costs (for example, the cost of compression) and other market conditions (U.S. DOE, 2002). This differential means profitability can be reduced depending on the water management technique selected.
2. Differences in the amount of gas versus the amount of water produced from a well (U.S. DOE, 2002).
3. The capital and operation and maintenance (O&M) costs for drilling and operating deeper wells (300-3,000 feet below ground) of different gas and water productivity (U.S. DOE, 2002).
4. The water management or treatment option selected by the operator (U.S. DOE, 2002).
Several papers have been produced using economic models to estimate the costs of various CBM water management, treatment and use options. Two of these publications were reviewed and compared to determine the range of costs for some of the more plausible options.
The analytical question addressed in both studies is whether CBM industries generate sufficient returns to pay for CBM water treatment and management. If the discounted rate of return for a particular water treatment option is higher than the industry average rate of return, then the option is economically feasible.
It is important to recognize that these studies do not address the issue of whether communities gain in the long run. Draining a resource that will be an important factor in future economic development is an opportunity cost that policy makers need to consider against the short-term benefit of local and state tax revenues. These benefit/cost issues are not addressed in these studies or in the CBM literature in general and indicate an area worthy of additional study.
All studies use a discounted cash flow modeling approach from an industry perspective. Revenues and costs are evaluated over the life of the CBM field. The assumptions used in the different models are presented in Tables 5, 6 and 7.
6
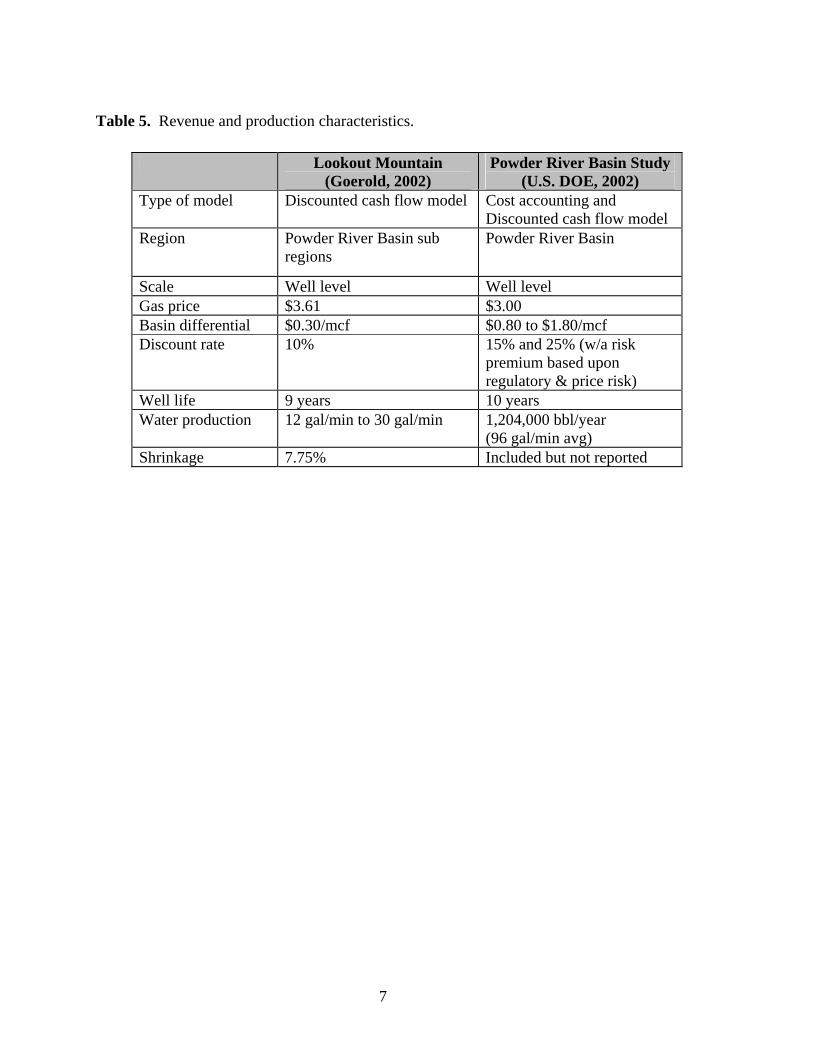
Table 5. Revenue and production characteristics.
Lookout Mountain (Goerold, 2002)
Powder River Basin Study (U.S. DOE, 2002)
Type of model Discounted cash flow model Cost accounting and Discounted cash flow model
Region Powder River Basin sub regions
Powder River Basin
Scale Well level Well level Gas price $3.61 $3.00 Basin differential $0.30/mcf $0.80 to $1.80/mcf Discount rate 10% 15% and 25% (w/a risk
premium based upon regulatory & price risk)
Well life 9 years 10 years Water production 12 gal/min to 30 gal/min 1,204,000 bbl/year
(96 gal/min avg) Shrinkage 7.75% Included but not reported
7

Table 6. Cost characteristics.
Lookout Mountain (Goerold, 2002)
Powder River Basin Study (US DOE, 2002)
Operating Costs $0.41 per mcf $0.258 / mcf Water Treatment Costs
Capital Costs Storage ponds NA NA (incorporated in infiltration
impoundment alternative) Surface Discharge $300 per well $1,400 /well Infiltration Impoundment
NA $10,300/well
Shallow Injection $6,350 per well $15,150/well Deep injection $62,500 per well $35,200/well for treated water. Un-
treated water not included because the authors viewed this as a waste of resources.
Reverse osmosis $77.14 per barrel of water
$19,600 per well.
Water O&M Costs Storage ponds Surface Discharge $0.004 per barrel $0.02/barrel Infiltration Impoundment
$0.06/barrel
Shallow Injection $0.045 per barrel $0.06/barrel Deep injection $0.095 per barrel $0.14/barrel for deep injection of
treated water, and $0.24/barrel for trucking.
Reverse osmosis $0.033 per barrel $0.03 per barrel
8
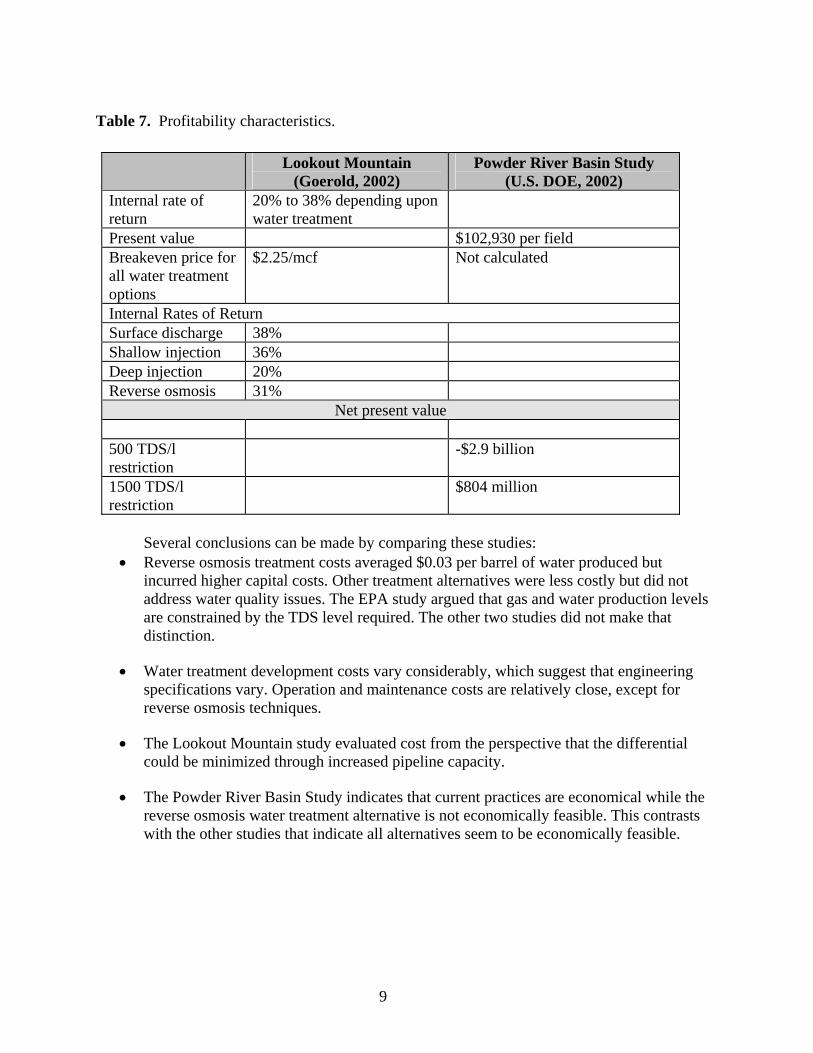
Table 7. Profitability characteristics.
Lookout Mountain (Goerold, 2002)
Powder River Basin Study (U.S. DOE, 2002)
Internal rate of return
20% to 38% depending upon water treatment
Present value $102,930 per field Breakeven price for all water treatment options
$2.25/mcf Not calculated
Internal Rates of Return Surface discharge 38% Shallow injection 36% Deep injection 20% Reverse osmosis 31%
Net present value 500 TDS/l restriction
-$2.9 billion
1500 TDS/l restriction
$804 million
Several conclusions can be made by comparing these studies:
• Reverse osmosis treatment costs averaged $0.03 per barrel of water produced but incurred higher capital costs. Other treatment alternatives were less costly but did not address water quality issues. The EPA study argued that gas and water production levels are constrained by the TDS level required. The other two studies did not make that distinction.
• Water treatment development costs vary considerably, which suggest that engineering specifications vary. Operation and maintenance costs are relatively close, except for reverse osmosis techniques.
• The Lookout Mountain study evaluated cost from the perspective that the differential could be minimized through increased pipeline capacity.
• The Powder River Basin Study indicates that current practices are economical while the reverse osmosis water treatment alternative is not economically feasible. This contrasts with the other studies that indicate all alternatives seem to be economically feasible.
9
Regional and community impacts
As described in the introduction of this section, the industry studies reviewed above evaluate water from the prospect of the economics of the industry. These studies do not evaluate the benefits to local and state residents. A peer reviewed, regional or community impact analysis has not been attempted for the Powder River Basin. The Powder River Basin Study included net present values of tax revenues to states. However, opportunity costs were not included as a counter to tax revenues so net present value (NPV) estimates will be positive, as expected.
Two studies reviewed below do attempt to get at the issue of regional net benefits, but at starkly different approaches, which limit their usefulness in providing a region-wide estimate of benefits and costs. The first study by Coupal and Peck (2003), evaluate the benefits and costs of an added CBM field to the entire PRB development. As such it does not account for overall water supply capacity constraints that may occur with water production in the entire PRB region. The second study by Skov and Meyers (2004) covers the PRB region as a whole, but uses what it calls precautionary economic analysis in selective manner to criticize development. Both studies are critiqued and limitations on PRB water management policy are discussed.
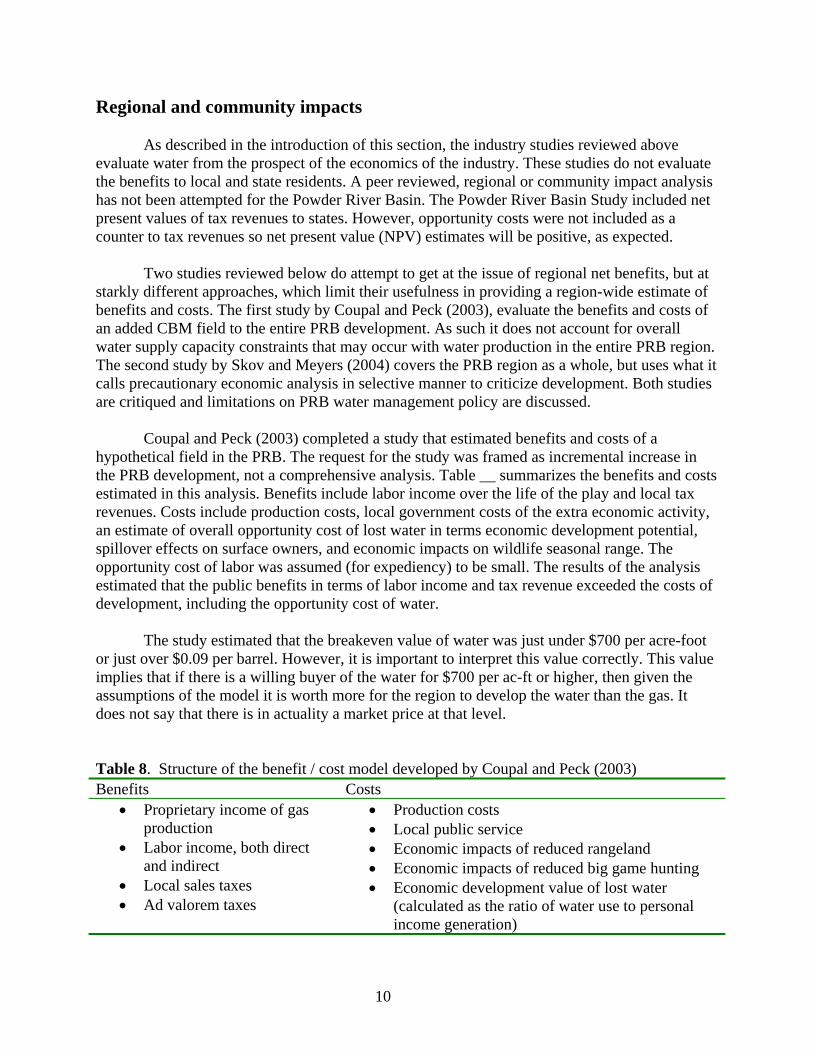
Coupal and Peck (2003) completed a study that estimated benefits and costs of a hypothetical field in the PRB. The request for the study was framed as incremental increase in the PRB development, not a comprehensive analysis. Table __ summarizes the benefits and costs estimated in this analysis. Benefits include labor income over the life of the play and local tax revenues. Costs include production costs, local government costs of the extra economic activity, an estimate of overall opportunity cost of lost water in terms economic development potential, spillover effects on surface owners, and economic impacts on wildlife seasonal range. The opportunity cost of labor was assumed (for expediency) to be small. The results of the analysis estimated that the public benefits in terms of labor income and tax revenue exceeded the costs of development, including the opportunity cost of water.
The study estimated that the breakeven value of water was just under $700 per acre-foot or just over $0.09 per barrel. However, it is important to interpret this value correctly. This value implies that if there is a willing buyer of the water for $700 per ac-ft or higher, then given the assumptions of the model it is worth more for the region to develop the water than the gas. It does not say that there is in actuality a market price at that level. Table 8. Structure of the benefit / cost model developed by Coupal and Peck (2003) Benefits Costs
• Proprietary income of gas production
• Labor income, both direct and indirect
• Local sales taxes • Ad valorem taxes
• Production costs • Local public service • Economic impacts of reduced rangeland • Economic impacts of reduced big game hunting • Economic development value of lost water
(calculated as the ratio of water use to personal income generation)
10

There are several important limitations to this study that limit its usefulness in the current debate over CBM water. As stated above the study was designed as an incremental analysis, or the benefits and costs of an additional CBM field. If one moves to a region-wide estimate to cover the entire Powder River Basin there may supply capacity issues on water use and larger wildlife impacts since migratory herds will be more constrained to where they can move. Another issue is the measurement of the wildlife impact itself. The study assumed the wildlife (and hunting) will move away or the herds will decline. While this may be conventional wisdom among Game and Fish biologists and wildlife researchers, to date there is no actual scientific study to support the negative effects on wildlife.
Another limitation concerns the benefits of CBM water to some surface landowners. The study did not have time to evaluate surface owners that might be benefiting from CBM water. The region is in a long term drought and water can be used for stockwater and other agricultural operations. A more complete study would need to incorporate those surface owners that are damaged by CBM water and those that are benefiting from CBM water.
Finally, probably the most important qualification of the study is the lack of geographic or spatial content for the demand for CBM water. Considerable heterogeneity in both quantity and quality affect its potential demand. Where potential users are, what the use might be, and when they might want the water needs to be matched with the spatial heterogeneity of the supply side. The quality of the water varies depending upon where in the PRB it is being removed and which coal seam it is being removed from. A more comprehensive economic study would need to consider this geographical problem.
The second regional study reviewed here is an analysis by Skov and Myers (2004) using what is known as the precautionary principle for making environmental decisions. The authors define the motive as stated in the Wingspread Conference of 1998:
“Where an activity raises threats of harm to the environment or human health, precautionary measures should be taken even if some cause and effect relationships are not fully established scientifically”.
They attempt to apply the principle to CBM development in the Powder River Basin. The authors focus three issues that fall out of the precautionary principle: Uncertainty in CBM development’s environmental impacts, fairness in terms of winners and losers, and social efficiency issues in terms of the degree of subsidization that occurs and opportunity costs. 1. Water quality and quantity
The authors refer to Department of Interior concerns about water shortages in the western United States. The PRB has been suffering from a long term drought (as has much of the State.) The drought conditions focus policy makers concerns on appropriate use of all water sources. The document only asserts that there will be a shortage in the Powder River Basin, but does not validate assertion. The question that is not addressed is to what degree are communities in the region economically constrained by water supply. Moreover the authors fail to account for geographical heterogeneity issue the previously discussed. Some of those coal seams produce
11
water that would be expensive to treat for potable water standards. The authors refer to a population growth projection of 17% to 36% in thirty years, which is consistent with State Government forecasts, but do not provide the evidence that communities will be constrained by water supply as growth continues. To really address the issue of lost water resources one needs to evaluate communities potential for expanding their water budgets.
The second water related issue is a re-statement of water quality concerns. This issue has been analyzed in detail in other studies, and is summarized in other sections of this document. So there is no need to re-visit the details of these other sections. The quality of CBM water can be a problem with the sodic soils characteristic in this region for pastures and intermittent streams, as well as for regular streams. 2. Value of the water
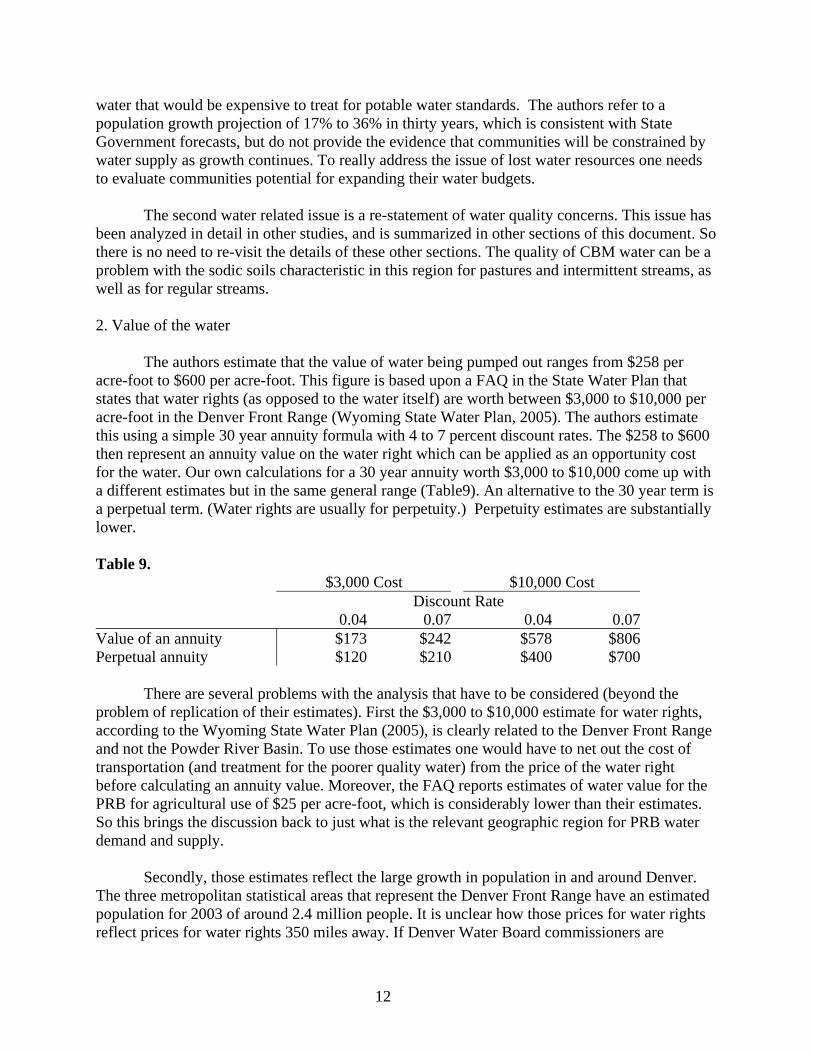
The authors estimate that the value of water being pumped out ranges from $258 per acre-foot to $600 per acre-foot. This figure is based upon a FAQ in the State Water Plan that states that water rights (as opposed to the water itself) are worth between $3,000 to $10,000 per acre-foot in the Denver Front Range (Wyoming State Water Plan, 2005). The authors estimate this using a simple 30 year annuity formula with 4 to 7 percent discount rates. The $258 to $600 then represent an annuity value on the water right which can be applied as an opportunity cost for the water. Our own calculations for a 30 year annuity worth $3,000 to $10,000 come up with a different estimates but in the same general range (Table9). An alternative to the 30 year term is a perpetual term. (Water rights are usually for perpetuity.) Perpetuity estimates are substantially lower. Table 9. $3,000 Cost $10,000 Cost Discount Rate 0.04 0.07 0.04 0.07 Value of an annuity $173 $242 $578 $806 Perpetual annuity $120 $210 $400 $700
There are several problems with the analysis that have to be considered (beyond the problem of replication of their estimates). First the $3,000 to $10,000 estimate for water rights, according to the Wyoming State Water Plan (2005), is clearly related to the Denver Front Range and not the Powder River Basin. To use those estimates one would have to net out the cost of transportation (and treatment for the poorer quality water) from the price of the water right before calculating an annuity value. Moreover, the FAQ reports estimates of water value for the PRB for agricultural use of $25 per acre-foot, which is considerably lower than their estimates. So this brings the discussion back to just what is the relevant geographic region for PRB water demand and supply.
Secondly, those estimates reflect the large growth in population in and around Denver. The three metropolitan statistical areas that represent the Denver Front Range have an estimated population for 2003 of around 2.4 million people. It is unclear how those prices for water rights reflect prices for water rights 350 miles away. If Denver Water Board commissioners are
12
actually considering trying to get PRB water then Front Range water rights prices might be relevant.
Finally, underlying this discussion is the presumption that regional communities are constrained by water supply. Most community water systems are not drawing from CBM seams, and given the quality of the water that comes from some of those seams and the short term nature of the supply, it is doubtful there will be a large future demand for a portion of CBM water. 3. Fiscal issues and subsidies Federal level subsidies The authors list subsidies and tax breaks that the oil and gas industry receives. The argument here is that most of these tax breaks would not occur or be necessary if CBM were not developed. Reported subsidies include:
• Section 29 Tax Credit – a credit for alternative fuels for wells drilled before 1993. • Deduction of percentage depletion versus cost depletion • Expensing development costs
Research subsidies of direct benefit to oil and gas producers:
• Department of Energy fossil fuels research: From 2001-03 $1.5 billion o In 2004 $26.6 million for “natural gas technologies”
• Estimated research subsidies to CBM development over the next 5 years: $11 million State level subsidies
The study’s review of state subsidies confuses tax reductions with subsidies, government
streamlining of permitting processes, and University research with subsidies. Some of these are less subsidies than government policy decisions (e.g. tax reductions, permit process streamlining, etc.) It is doubtful that the overall all cost of all these government policy changes and University research really come close to the tax revenues and grants supplied by the oil and gas industry, which would then legitimately define a subsidization.
The above example of the precautionary principle requires some further discussions. The precautionary principle as an operating concept has inherent problems and has its critics2. The principle as usually applied, claims to balance risk, with economic efficiency issues. This analysis does not do that. The evaluation of risk, in this case the risk of running out of water is not balanced with the risk associated with substantially depressed economies from the loss of gas production, the fiscal losses in providing education and public services, and the poverty that comes with it. So to be balanced as the principle claims to require there should have been more discussion comparison of the risks associated with non-development, or poverty-based development, that would come with non-mineral development. It is important to consider that there are risks inherent in development and risks inherent in not developing. 2 Julian Morris of the International Policy Network was quoted as saying "If someone had evaluated the risk of fire right after it was invented they may well have decided to eat their food raw". http://www.policynetwork.net/main/index.php
13
Summary
The industry studies and regional studies reviewed in this section are clearly inadequate for answering even the most basic policy question related to CBM water management. With the extensive technical and physical science based analysis that has already been done by industry, academics, government, and NGOs, it is surprising how little we know of the social and economic implications of this conflict. So a more comprehensive set of studies social and economic studies is needed. The studies need to consider the tax implications, alternative water management strategies, costs, and regional water budget issues.
14
Literature Cited Cook, L. March, 2004. Minerals Update. Wyoming State Geological Survey, University of
Wyoming, Laramie. Vol. 79. Coupal R., and D. Peck. 2003. Coalbed Methane Development in the Powder River Basin,
Northeast Wyoming: A Regional Investment Analysis. Unpublished report for Johnson and Campbell Counties, Wyoming. Department of Agricultural and Applied Economics, University of Wyoming, Laramie.
Foulke, T. 1992. Economic impact of an instream flow proposal using federally reserved water
rights on the Wind River. Master’s Thesis, Department of Agricultural and Applied Economics, University of Wyoming.
Goerold, W. T. 2002. “Powder River Basin Coalbed Methane Financial Model” presented at the
University of Colorado’s (CU) Natural Resources Law Center Coalbed Methane Conference, Boulder, Colorado, April 4-5, 2002.
Skov, J., and N. Myers. June, 2004. Easy Money, Hidden Costs, Applying Precautionary
Economic Analysis to Coalbed Methane in the Powder River Basin. Science and Environmental Health Network. WWW.sehn.org.
U.S. Bureau of Land Management (BLM). 2002. Draft Environmental Impact Statement and Draft Planning Amendment for the Powder River Basin Oil and Gas Project. WY-070-02-065. Buffalo, WY.
U.S. Department of Energy (DOE). 2002. Powder River Basin Coalbed Methane Development
and Produced Water Management Study. U.S. Department of Energy. Office of Fossil Energy and National Energy Technology Laboratory Strategic Center for Natural Gas. November, 2002. pp. 1-3.
U.S. Department of Energy (DOE). April, 2005. Costs and Indices for Domestic Oil and Gas
Field Equipment and Production Operations. U.S. Department of Energy web site: http://www.eia.doe.gov/pub/oil_gas/natural_gas/data_publications/cost_indices_equipment_production/current/coststudy.html
Wyoming Oil & Gas Conservation Commission website. www.wogcc.state.wy.us. Accessed
May, 2005. Wyoming State Water Plan. April 2005. http://waterplan.state.wy.us/FAQ/FAQ.html. Wyoming Water Development Commission. 2004. Water System Survey Report. State of
Wyoming, Cheyenne, WY.
15