Shengmai Suppressed Vascular Tension in Umbilical Arteries and Veins of Human and Sheep

ORIGINAL PAPER
Mineralogy, geochemistry, and origin of hydrothermalmanganese veins at Wadi Maliek, Southern EasternDesert, Egypt
Ibrahim A. Salem & Mohamed E. Ibrahim &
Mohamed Abd El Monsef
Received: 30 November 2009 /Accepted: 7 September 2010# Saudi Society for Geosciences 2010
Abstract The present work deals with the geology,mineralogy, geochemistry, and origin of the metagabbroic-hosted manganese deposits at Wadi Maliek in the southernEastern Desert of Egypt. The manganese veins are found inthe shear zones and channel ways of the fault planes withinthe metagabbroic rocks pointing to those hydrothermalsolutions carrying manganese and iron load penetratingalong these fractures. These faults are striking N 80° E–S80° W with dipping 65°. These veins vary in thicknessfrom 15 cm up to 125 cm wide; each vein may showdifference in thickness from bottom to top. Microscopicexaminations, X-ray diffraction, infrared spectral, differen-tial thermal (DTA), thermogravimetric (TGA), and ESEM-EDAX analyses revealed that the manganese mineralsconsist mainly of pyrolusite, psilomelane, and ramsdellite.Goethite and hematite are the common iron minerals.Petrographically, the manganese deposits can be classifiedinto three ore types based on the predominance ofmanganese and iron minerals: manganese, manganese–iron,and iron ore types. The geochemistry of Maliek depositsindicated that the total averages of some major oxides inmanganese, manganese–iron, and iron ore types arerespectively as follows: SiO2 (15.64%, 11.52%, and20.58%), MnO (39.9%, 17.81%, and 0.77%), FeO*(7.13%, 33.31%, and 37.08%), CaO (5.89%, 5.82%, and5.32%), and Na2O (1.04%, 1.61%, and 1.53%). With regardto trace elements, the Maliek manganese deposits are rich in
Zn, Ba, Pb, Sr, and V. Based on the geological, mineral-ogical, and geochemical results, the studied manganesedeposits are considered to be precipitated from hydrother-mal solution.
Keywords Petrography . X-ray diffraction . Infraredspectra . DTA and TG . ESEM .Hydrothermal .WadiMaliek . Southern eastern desert . Egypt
Introduction
The manganese deposits in Egypt are widely distributed inthe Eastern Desert and Sinai; among the localities, theseareas were selected for the present study. The geology,mineralogy, and geochemistry of manganese deposits ofEgypt have been previously studied by several workers;among them are El Shazly (1957), Atia et al. (1976), ElAgami et al. (1999), Salem et al. (2001), and Ibrahim et al.(2006). El Shazly (1957) reported that the origin ofmanganese deposits in G. Elba is due to the weatheringprocesses of Precambrian rocks and supergene deposition infissures which are accompanied by replacement along thewalls of these fissures. Atia et al. (1976) studied themineralogy of manganese deposits of Halaib area, SouthEastern Desert. They reported that the principal manganeseminerals are pyrolusite, cryptomelane, psilomelane, rams-dellite, hollandite, vernadite, and lithiophorite. Associatedminerals are hematite, goethite, and pyrite with smallamounts of quartz, calcite, and barite as gangue minerals.El Agami et al. (1999) concluded that the manganesedeposits of G. Elba occurs in the form of veins ofhydrothermal nature that are localized along the NW-trending tensional fracture within the Precambrian granite,acidic volcanic rocks, and Miocene sedimentary rocks. The
I. A. Salem :M. Abd El Monsef (*)Geology Department, Faculty of Science, Tanta University,Tanta, Egypte-mail: [email protected]
M. E. IbrahimNuclear Materials Authority,Cairo, Egypt
Arab J GeosciDOI 10.1007/s12517-010-0195-1

characteristic association of W, Mo, Pb, Au, and Ag and thewall-rock alteration at the site of vein deposits insure theepigenetic origin. Salem et al. (2001) studied the mineral-ogy, geochemistry, and origin of manganese deposits ofAbu Ramad area, South Eastern Desert. They found that themanganese deposits occur as veins, veinlets, pockets, andlenses within the Precambrian pink granite and the Mioceneand post-Miocene deposits. According to geochemical andmineralogical data, they suggested the hydrothermal originof these deposits. Ibrahim et al. (2006) showed that the Mnore of G. Elba occurs as veins or fracture filling the cuttingacross the structure of the host rocks (Miocene sedimentaryand monzogranites), indicating epigenetic mineralization.Gabel Elba manganese ore can be classified into two maintypes: manganese vein type and manganese hosted inclastic rocks; both ores contain high concentrations ofMnO and low in SiO2, Al2O3, MgO, CaO, Na2O, K2O, and
P2O5 and highly enriched in Sr, Ba, Pb, V, and Zn whileMo, Zr, Nb, and Y are recorded in less concentrations.
This paper studies the geological, mineralogical, andgeochemical characteristics of the manganese veins associ-ated with the metagabbroic rocks in an attempt to revealtheir genesis. To achieve the aim of study, about 50 sampleswere collected from the metagabbroic rocks, and associatedmanganese veins are subjected to microscopic examination.Mineralogical studies for the manganese ore (including X-ray diffraction (XRD) analysis, infrared absorption spectra,thermal analyses, and environmental scanning electronmicroscope) were done. In order to relate the bullgeochemistry of each sample to its mineralogy, majoroxides and trace element analyses were carried out at theLaboratory of Nuclear Materials Authority, Qatameia,Cairo. SiO2, TiO2, Al2O3, and P2O5 were determined byusing spectrophotometer. Na2O and K2O were measured by
Fig. 1 Geologic map of WadiMaliek (modified afterEGSMA 1997)
Arab J Geosci

the flame photometric technique. Fe2O3, FeO, MgO, MnO,and CaO were determined by titration methods and LOIwas determined gravimetrically at a temperature of 1,000°C.Cr, Co, Ni, Cu, Zn, Zr, Rb, Ba, Sr, Ga, and V concentrationswere measured using X-rays fluorescence by Philips Xunique II machine.
Wadi Maliek lies at the intersection of 35° 08′ E longitudeand 24° 08′ N latitude. The manganese veins are cutting thePrecambrian metagabbroic rocks at Wadi Maliek. Themetagabbroic rocks occur as an elongated mass, with itslong axis (16 km) trending NW–SE. They cover a surfacearea of about 100 km2. This rock is bounded from thewestern part by the granodiorite rocks, with knife sharpcontacts; from the eastern part, the metagabbroic rocks aresurrounded by mappable sedimentary beds of Miocene age(Fig. 1). The metagabbroic rocks exhibit moderate reliefand mesocratic to melanocratic color and vary in size fromfine- to medium-grained. The structural patterns for thestudied area are mainly governed by fractures.
Two sets of regional fractures have been recognized thatare generally trending in the NW–SE and NE–SWdirections. Along the contact between metagabbroic rocksand manganese veins, this outcrop exhibits a perfectcataclased appearance with high amount of brecciationand deformations in the zones around manganese veins thatindicate the deposition within fissures and channel ways ofthe fault planes. The metagabbroic rocks are cut by fewacidic dykes trending in the NW–SE direction.
Metagabbroic rocks
Petrography of metagabbroic rocks
In hand specimens, the metagabbroic rocks are fine- tomedium-grained, hard, massive, equigranular, and grayishgreen to dark green in color. Under the polarizing microscope,the metagabbroic rocks show different textures (blasto-ophitic, blasto-subophitic, hypidiomorphic, and granoblastictextures). These rocks are essentially composed of horn-blende, actinolite, plagioclase, quartz, augite, epidote, andchlorite with some iron oxides, sulfides, and apatite that arerecorded as accessories. The variation of mineral assemblagesas well as different types of textures may indicate theheterogeneous nature for these rocks. The microscopicinvestigation of the metagabbros revealed the following rocks.Petrographically, the metagabbroic rocks are classified intofour types as follows: (1) normal metagabbro, (2) quartzmetagabbro, (3) diorite, and (4) amphibolite.
Normal metagabbro is essentially composed of horn-blende, actinolite, augite, and plagioclase with smallamount of epidote, chlorite, and apatite (Fig. 2a). Quartzmetagabbro is essentially composed of hornblende, actin-olite, augite, plagioclase, and quartz with small amount ofepidote and chlorite (Fig. 2b). Diorite is mainly composedof hornblende, plagioclase, quartz, and chlorite (Fig. 2c).Amphibolite is mainly composed of hornblende, actinolite,plagioclase, and epidote (Fig. 2d).
Fig. 2 Photomicrographs show-ing: a normal metagabbroshowing highly sassuritized pla-gioclase (CN). b Scatteredquartz grains within quartzmetagabbro (CN). c Dioriteexhibits hypidiomorphic texture(CN). d Amphibolite showinggranoblastic texture (CN)
Arab J Geosci
Geochemistry of metagabbroic rocks
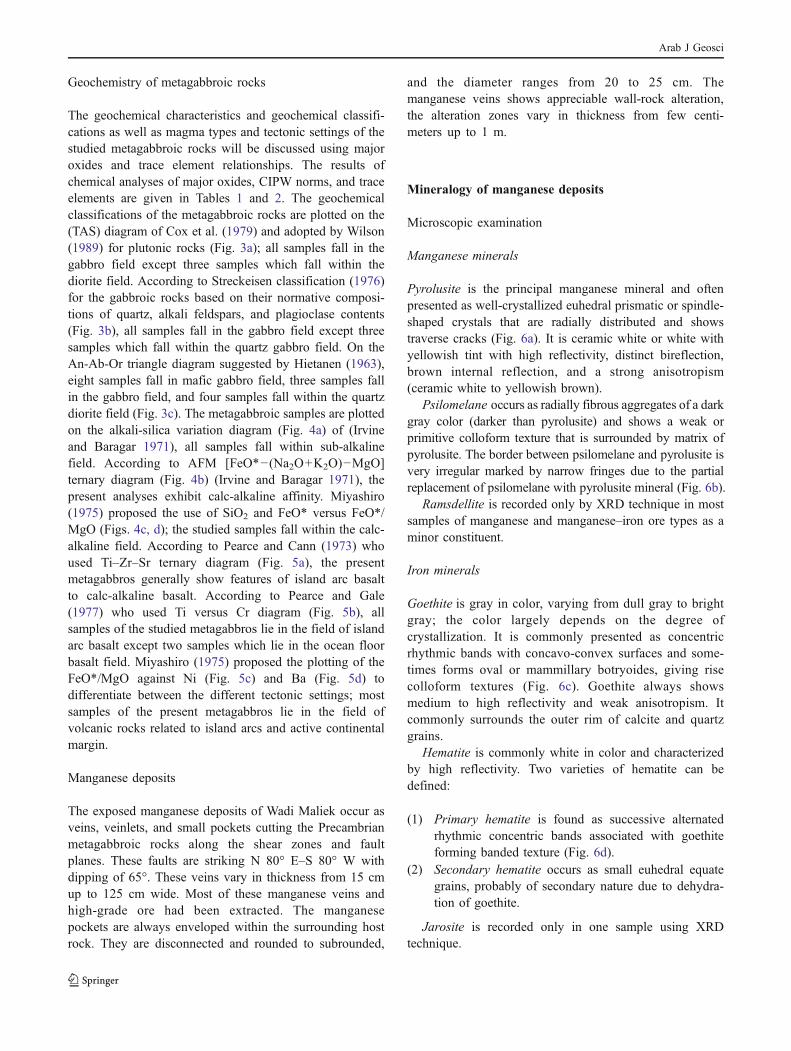
The geochemical characteristics and geochemical classifi-cations as well as magma types and tectonic settings of thestudied metagabbroic rocks will be discussed using majoroxides and trace element relationships. The results ofchemical analyses of major oxides, CIPW norms, and traceelements are given in Tables 1 and 2. The geochemicalclassifications of the metagabbroic rocks are plotted on the(TAS) diagram of Cox et al. (1979) and adopted by Wilson(1989) for plutonic rocks (Fig. 3a); all samples fall in thegabbro field except three samples which fall within thediorite field. According to Streckeisen classification (1976)for the gabbroic rocks based on their normative composi-tions of quartz, alkali feldspars, and plagioclase contents(Fig. 3b), all samples fall in the gabbro field except threesamples which fall within the quartz gabbro field. On theAn-Ab-Or triangle diagram suggested by Hietanen (1963),eight samples fall in mafic gabbro field, three samples fallin the gabbro field, and four samples fall within the quartzdiorite field (Fig. 3c). The metagabbroic samples are plottedon the alkali-silica variation diagram (Fig. 4a) of (Irvineand Baragar 1971), all samples fall within sub-alkalinefield. According to AFM [FeO*−(Na2O+K2O)−MgO]ternary diagram (Fig. 4b) (Irvine and Baragar 1971), thepresent analyses exhibit calc-alkaline affinity. Miyashiro(1975) proposed the use of SiO2 and FeO* versus FeO*/MgO (Figs. 4c, d); the studied samples fall within the calc-alkaline field. According to Pearce and Cann (1973) whoused Ti–Zr–Sr ternary diagram (Fig. 5a), the presentmetagabbros generally show features of island arc basaltto calc-alkaline basalt. According to Pearce and Gale(1977) who used Ti versus Cr diagram (Fig. 5b), allsamples of the studied metagabbros lie in the field of islandarc basalt except two samples which lie in the ocean floorbasalt field. Miyashiro (1975) proposed the plotting of theFeO*/MgO against Ni (Fig. 5c) and Ba (Fig. 5d) todifferentiate between the different tectonic settings; mostsamples of the present metagabbros lie in the field ofvolcanic rocks related to island arcs and active continentalmargin.
Manganese deposits
The exposed manganese deposits of Wadi Maliek occur asveins, veinlets, and small pockets cutting the Precambrianmetagabbroic rocks along the shear zones and faultplanes. These faults are striking N 80° E–S 80° W withdipping of 65°. These veins vary in thickness from 15 cmup to 125 cm wide. Most of these manganese veins andhigh-grade ore had been extracted. The manganesepockets are always enveloped within the surrounding hostrock. They are disconnected and rounded to subrounded,
and the diameter ranges from 20 to 25 cm. Themanganese veins shows appreciable wall-rock alteration,the alteration zones vary in thickness from few centi-meters up to 1 m.
Mineralogy of manganese deposits
Microscopic examination
Manganese minerals
Pyrolusite is the principal manganese mineral and oftenpresented as well-crystallized euhedral prismatic or spindle-shaped crystals that are radially distributed and showstraverse cracks (Fig. 6a). It is ceramic white or white withyellowish tint with high reflectivity, distinct bireflection,brown internal reflection, and a strong anisotropism(ceramic white to yellowish brown).
Psilomelane occurs as radially fibrous aggregates of a darkgray color (darker than pyrolusite) and shows a weak orprimitive colloform texture that is surrounded by matrix ofpyrolusite. The border between psilomelane and pyrolusite isvery irregular marked by narrow fringes due to the partialreplacement of psilomelane with pyrolusite mineral (Fig. 6b).
Ramsdellite is recorded only by XRD technique in mostsamples of manganese and manganese–iron ore types as aminor constituent.
Iron minerals
Goethite is gray in color, varying from dull gray to brightgray; the color largely depends on the degree ofcrystallization. It is commonly presented as concentricrhythmic bands with concavo-convex surfaces and some-times forms oval or mammillary botryoides, giving risecolloform textures (Fig. 6c). Goethite always showsmedium to high reflectivity and weak anisotropism. Itcommonly surrounds the outer rim of calcite and quartzgrains.
Hematite is commonly white in color and characterizedby high reflectivity. Two varieties of hematite can bedefined:
(1) Primary hematite is found as successive alternatedrhythmic concentric bands associated with goethiteforming banded texture (Fig. 6d).
(2) Secondary hematite occurs as small euhedral equategrains, probably of secondary nature due to dehydra-tion of goethite.
Jarosite is recorded only in one sample using XRDtechnique.
Arab J Geosci

Tab
le1
Chemical
analysisdata
(major
oxides
andno
rmativecompo
sitio
ns)forthestud
iedmetagabbros
Rocktype
Amph
ibolite
Normal
metagabbro
Quartzmetagabbro
Diorite
Sam
pleno
.11
1225
5257
5859
2931
321
548
956
Major
oxides
(wt.%
)
SiO
247
.547
.447
.347
.145
.643
.448
46.57
43.6
52.9
50.2
51.8
56.6
55.3
56.5
TiO
20.6
0.8
1.8
0.6
0.4
0.2
0.7
1.13
0.2
0.9
0.9
0.5
1.1
11.1
Al 2O3
1010
.511
9.4
108.9
9.8
13.56
13.9
14.5
13.2
11.5
1413
.714
Fe 2O3
1.4
1.65
1.83
1.53
1.47
1.47
1.61
2.21
1.28
1.46
1.5
1.29
1.55
1.49
1.53
FeO
6.57
7.69
7.71
7.26
7.14
7.32
7.55
10.26
6.32
6.61
6.84
6.13
6.89
6.67
6.81
MnO
0.1
0.1
nd0.1
0.1
0.1
0.1
0.23
0.1
0.1
0.1
0.1
0.1
0.1
0.1
MgO
19.6
21.4
12.9
21.6
24.2
30.7
24.5
12.94
259.7
13.2
13.2
7.7
7.7
7.8
CaO
12.7
8.7
15.6
10.9
9.2
6.9
6.9
10.68
8.3
10.3
10.8
13.2
7.7
87.7
Na 2O
0.7
0.8
10.7
0.9
0.3
nd1.47
0.7
2.3
1.7
1.5
32.7
3
K2O
0.1
ndnd
ndnd
0.1
0.1
0.33
nd0.4
0.5
nd0.5
0.6
0.5
P2O5
ndnd
ndnd
ndnd
nd0.09
nd0.1
0.2
ndnd
20.2
Total
99.27
99.04
99.14
99.19
99.01
99.39
99.26
99.47
99.4
99.27
99.14
99.22
99.14
99.26
99.24
CIPW
norm
s
Qz
0.00
0.00
0.00
0.00
0.00
0.00
0.00
0.00
0.00
2.15
0.00
0.00
8.10
10.42
8.16
Or
0.60
0.00
0.00
0.00
0.00
0.60
0.60
1.96
0.00
2.38
2.98
0.00
2.98
3.58
2.98
Ab
5.96
6.83
8.52
5.96
7.68
2.55
0.00
12.49
5.95
19.58
14.49
12.78
25.58
22.99
25.55
An
24.00
25.27
25.72
22.66
23.45
22.76
26.61
29.55
34.96
28.23
27.11
24.81
23.43
23.63
23.40
Di
31.32
14.54
41.83
25.28
17.95
9.24
6.25
18.76
5.13
18.23
20.59
32.89
12.24
3.67
11.26
Hy
10.78
25.97
6.41
15.21
8.20
6.87
44.27
12.25
4.64
25.35
22.68
25.41
23.30
27.23
23.87
Ol
24.17
23.44
11.39
27.51
39.80
55.46
18.59
19.41
47.08
0.00
7.79
1.27
0.00
0.00
0.00
Mt
2.04
2.42
2.68
2.24
2.15
2.14
2.34
3.22
1.86
2.13
2.19
1.89
2.26
2.17
2.24
Il1.15
1.53
3.45
1.15
0.77
0.38
1.34
2.16
0.38
1.72
1.72
0.96
2.11
1.91
2.11
Ap
0.00
0.00
0.00
0.00
0.00
0.00
0.00
0.20
0.00
0.22
0.44
0.00
0.00
4.40
0.44
Total
100.00
100.00
100.00
100.00
100.00
100.00
100.00
100.00
100.00
100.00
100.00
100.00
100.00
100.00
100.00
ndno
tdetected
Arab J Geosci
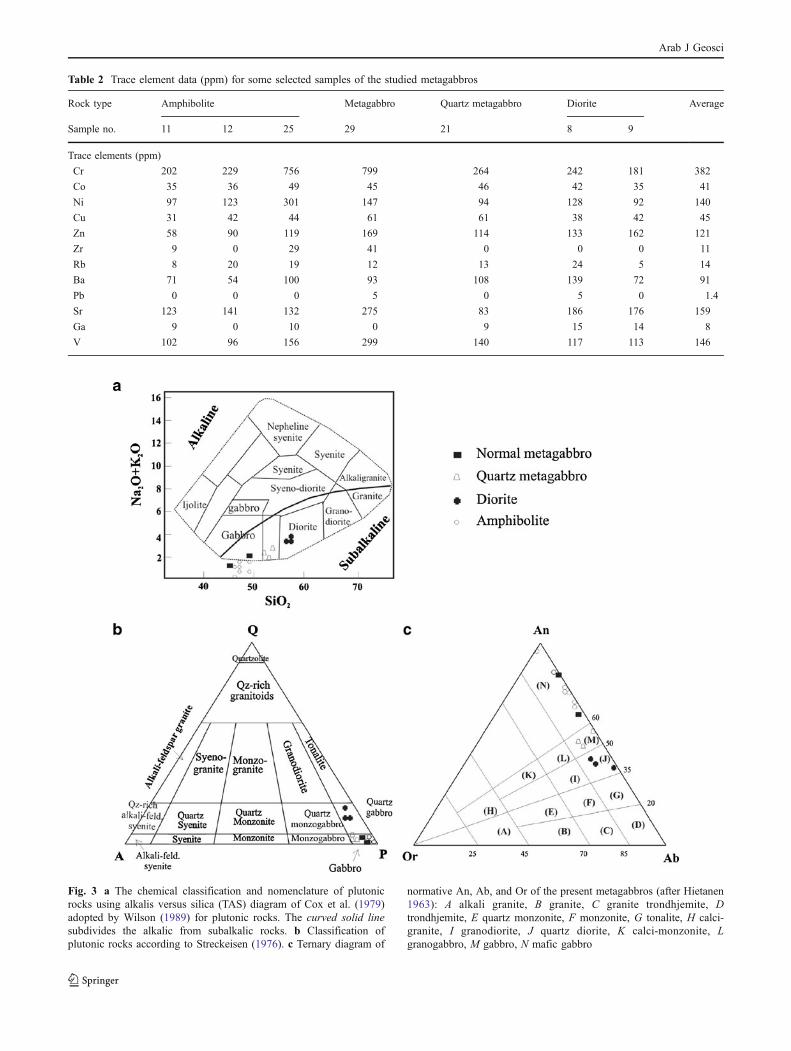
Table 2 Trace element data (ppm) for some selected samples of the studied metagabbros
Rock type Amphibolite Metagabbro Quartz metagabbro Diorite Average
Sample no. 11 12 25 29 21 8 9
Trace elements (ppm)
Cr 202 229 756 799 264 242 181 382
Co 35 36 49 45 46 42 35 41
Ni 97 123 301 147 94 128 92 140
Cu 31 42 44 61 61 38 42 45
Zn 58 90 119 169 114 133 162 121
Zr 9 0 29 41 0 0 0 11
Rb 8 20 19 12 13 24 5 14
Ba 71 54 100 93 108 139 72 91
Pb 0 0 0 5 0 5 0 1.4
Sr 123 141 132 275 83 186 176 159
Ga 9 0 10 0 9 15 14 8
V 102 96 156 299 140 117 113 146
Fig. 3 a The chemical classification and nomenclature of plutonicrocks using alkalis versus silica (TAS) diagram of Cox et al. (1979)adopted by Wilson (1989) for plutonic rocks. The curved solid linesubdivides the alkalic from subalkalic rocks. b Classification ofplutonic rocks according to Streckeisen (1976). c Ternary diagram of
normative An, Ab, and Or of the present metagabbros (after Hietanen1963): A alkali granite, B granite, C granite trondhjemite, Dtrondhjemite, E quartz monzonite, F monzonite, G tonalite, H calci-granite, I granodiorite, J quartz diorite, K calci-monzonite, Lgranogabbro, M gabbro, N mafic gabbro
Arab J Geosci
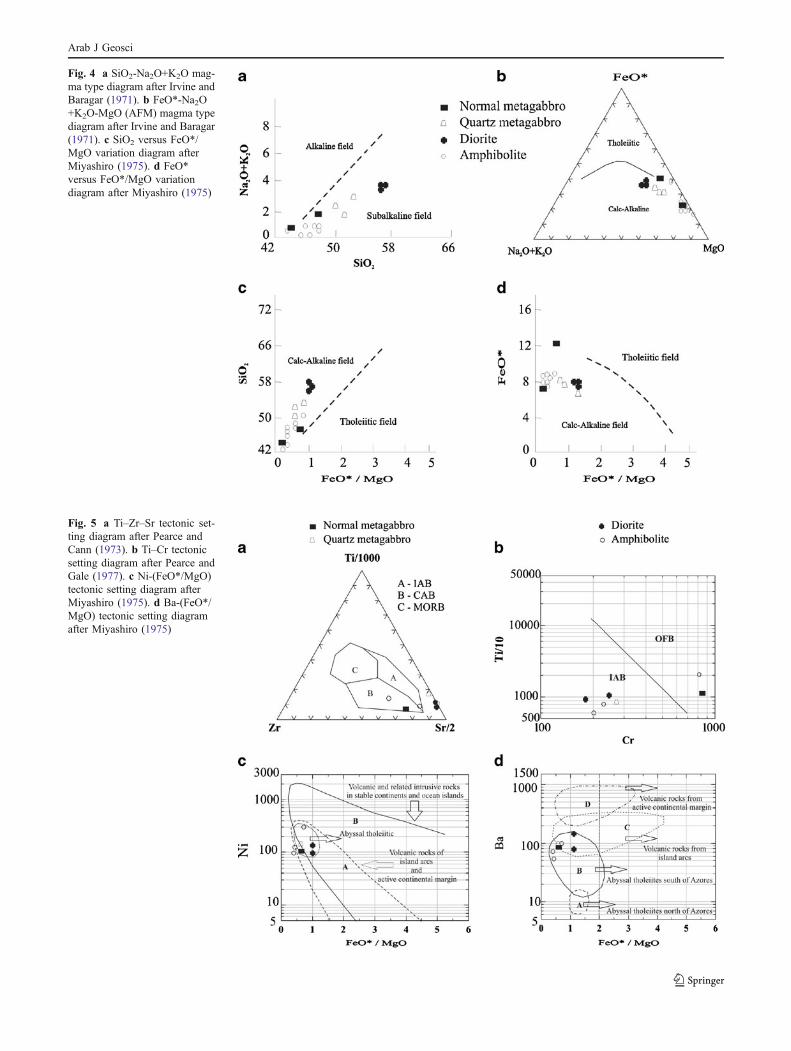
Fig. 4 a SiO2-Na2O+K2O mag-ma type diagram after Irvine andBaragar (1971). b FeO*-Na2O+K2O-MgO (AFM) magma typediagram after Irvine and Baragar(1971). c SiO2 versus FeO*/MgO variation diagram afterMiyashiro (1975). d FeO*versus FeO*/MgO variationdiagram after Miyashiro (1975)
Fig. 5 a Ti–Zr–Sr tectonic set-ting diagram after Pearce andCann (1973). b Ti–Cr tectonicsetting diagram after Pearce andGale (1977). c Ni-(FeO*/MgO)tectonic setting diagram afterMiyashiro (1975). d Ba-(FeO*/MgO) tectonic setting diagramafter Miyashiro (1975)
Arab J Geosci

Gangue minerals
Calcite forms mainly irregular or sometimes oval patches,filling the vugs within manganese and iron matrix. Calciteis always colorless with distinct twinklining (Fig. 6e).
Quartz occurs as veinlets and well-developed crystals,filling vugs or interstitial spaces of manganese and ironminerals. It is always crushed due to deformation.
Chlorite occurs as fibrous grains within ore minerals. Itis colorless with abnormal ink blue interference color.
Apatite is recorded as accessory mineral in few samplesscattering within manganese and iron matrix. It alwaysoccurs as colorless, euhedral aggregates. Apatite is com-monly found as rod-like grains with high relief and parallelextinction (Fig. 7a).
Plagioclase and mica are recorded as rare constituents(<1%). They may be derived from surrounding countryrocks as a result of assimilation or metasomatism during
ascending of hot aqueous solution rich in manganese andiron load.
Ore textures
The microscopic examination for the textural variations ofthe Maliek manganese ore revealed the presence of open-space filling, colloform, banded, and replacement textures.
1. Open-space filling texture is described as the depositionof younger minerals along vugs, fractures, and cracksof the older ones. It is indicated by the presence ofquartz and calcite within manganese and iron minerals.
2. Colloform texture is indicated by concentric rhythmicbands with concavo-convex surfaces, in which thecurvature is always convex towards the younger surface.Sometimes, it is observed as spheroid, mammillary, orbotryoidal forms (Pettijohn 1975). This type of texture
Fig. 6 Photomicrographs show-ing: a euhedral prismatic orspindle-shaped crystals of pyro-lusite (light brown) surroundedby goethite (gray) (RL).b Radially fibrous aggregatesof psilomelane (dark gray)enclosed hematite crystals(white) (RL). c Mammillaryshape of goethite forming collo-form texture (RL). d Successivealternated rhythmic concentricbands of hematite and goethiteforming banded texture (PL). eOval to irregular patches ofcalcite (CN)
Arab J Geosci
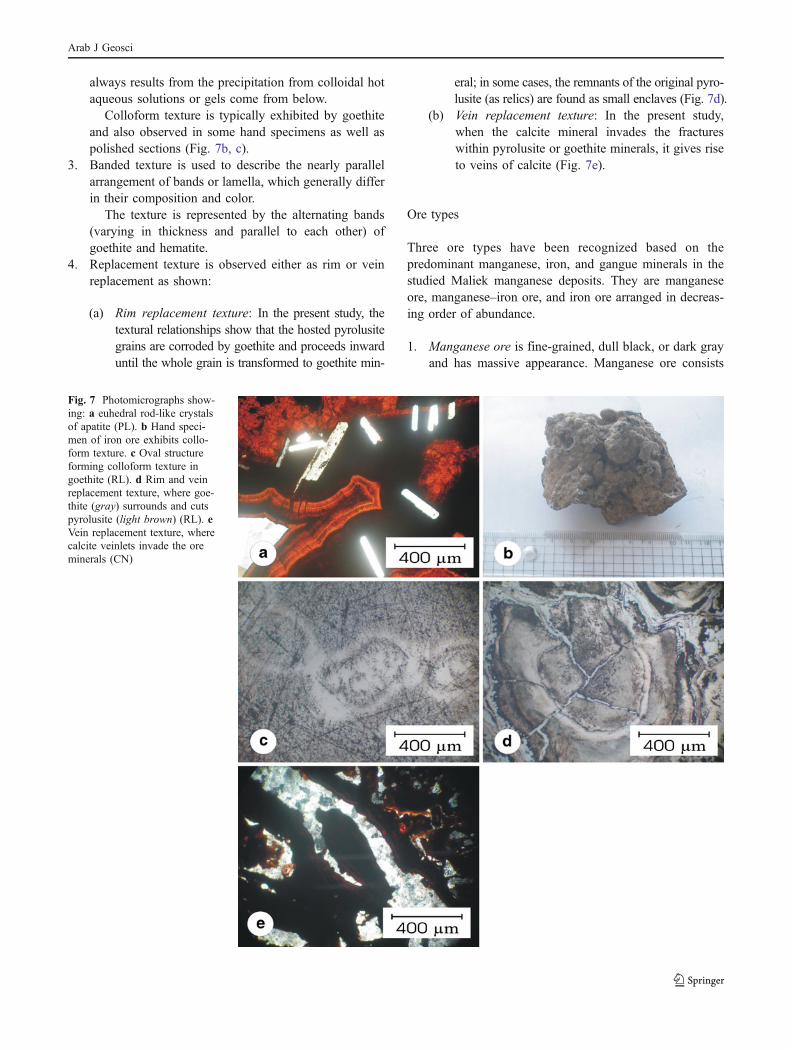
always results from the precipitation from colloidal hotaqueous solutions or gels come from below.
Colloform texture is typically exhibited by goethiteand also observed in some hand specimens as well aspolished sections (Fig. 7b, c).
3. Banded texture is used to describe the nearly parallelarrangement of bands or lamella, which generally differin their composition and color.
The texture is represented by the alternating bands(varying in thickness and parallel to each other) ofgoethite and hematite.
4. Replacement texture is observed either as rim or veinreplacement as shown:
(a) Rim replacement texture: In the present study, thetextural relationships show that the hosted pyrolusitegrains are corroded by goethite and proceeds inwarduntil the whole grain is transformed to goethite min-
eral; in some cases, the remnants of the original pyro-lusite (as relics) are found as small enclaves (Fig. 7d).
(b) Vein replacement texture: In the present study,when the calcite mineral invades the fractureswithin pyrolusite or goethite minerals, it gives riseto veins of calcite (Fig. 7e).
Ore types
Three ore types have been recognized based on thepredominant manganese, iron, and gangue minerals in thestudied Maliek manganese deposits. They are manganeseore, manganese–iron ore, and iron ore arranged in decreas-ing order of abundance.
1. Manganese ore is fine-grained, dull black, or dark grayand has massive appearance. Manganese ore consists
Fig. 7 Photomicrographs show-ing: a euhedral rod-like crystalsof apatite (PL). b Hand speci-men of iron ore exhibits collo-form texture. c Oval structureforming colloform texture ingoethite (RL). d Rim and veinreplacement texture, where goe-thite (gray) surrounds and cutspyrolusite (light brown) (RL). eVein replacement texture, wherecalcite veinlets invade the oreminerals (CN)
Arab J Geosci

mainly of manganese mineral masses with negligibleamount of iron minerals. The ore consists mainly ofpyrolusite (70 vol%) together with psilomelane (12 vol%) and ramsdellite (4 vol%) associated with smallamount of hematite (6 vol%) of the whole compositionof the ore (Fig. 8a). Regarding the gangue minerals,quartz (5 vol%), calcite (2 vol%), and plagioclase(<1 vol%) are observed as veinlets or filling vugs ofmanganese minerals.
2. Manganese–iron ore is fine-grained and black withreddish or brownish tint and characterized by thepresence of equivalent amount of manganese and ironminerals. This type is softer than pure manganese typeand harder than pure iron type. The ore consists ofgoethite (40 vol%) and pyrolusite (25 vol%) as well asramsdellite (3 vol%), hematite (4 vol%), and jarosite(3 vol%) that are detected and strengthened by XRDtechnique (Fig. 8b). Regarding the gangue minerals,
Fig. 8 Photomicrographs showing: a manganese ore (RL). b Manganese–iron ore (RL). c Iron ore (RL)
Fig. 9 X-ray charts formanganese ore type of Maliekdeposits
Arab J Geosci
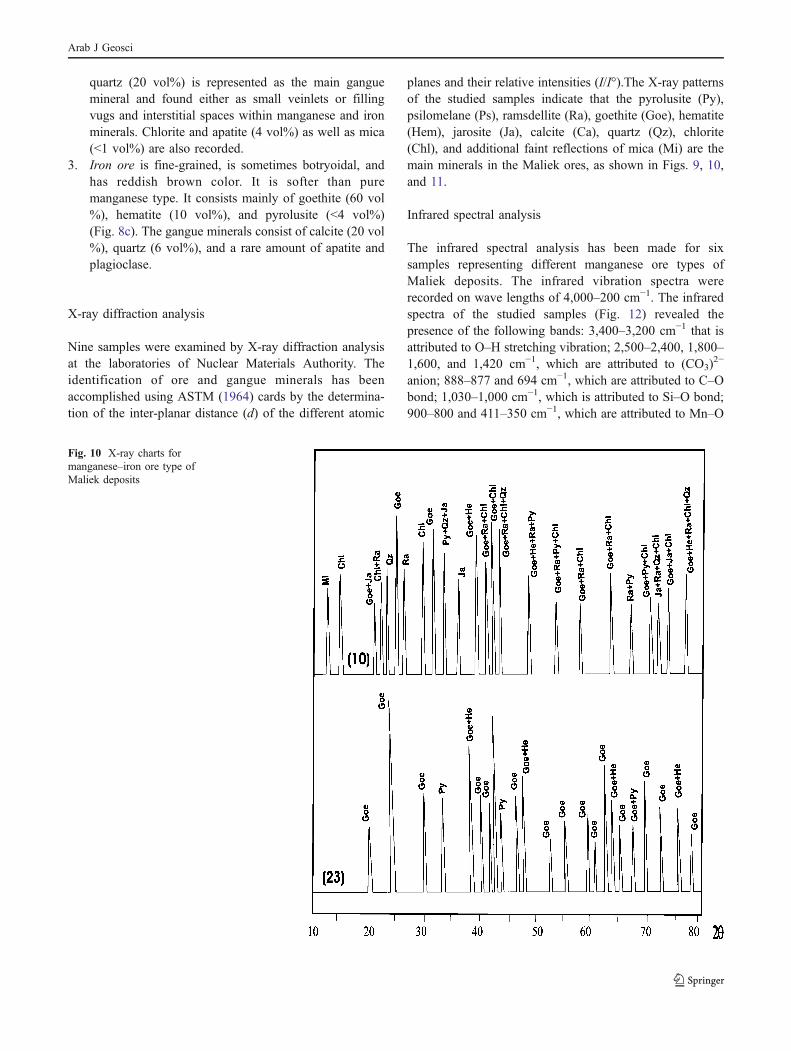
quartz (20 vol%) is represented as the main ganguemineral and found either as small veinlets or fillingvugs and interstitial spaces within manganese and ironminerals. Chlorite and apatite (4 vol%) as well as mica(<1 vol%) are also recorded.
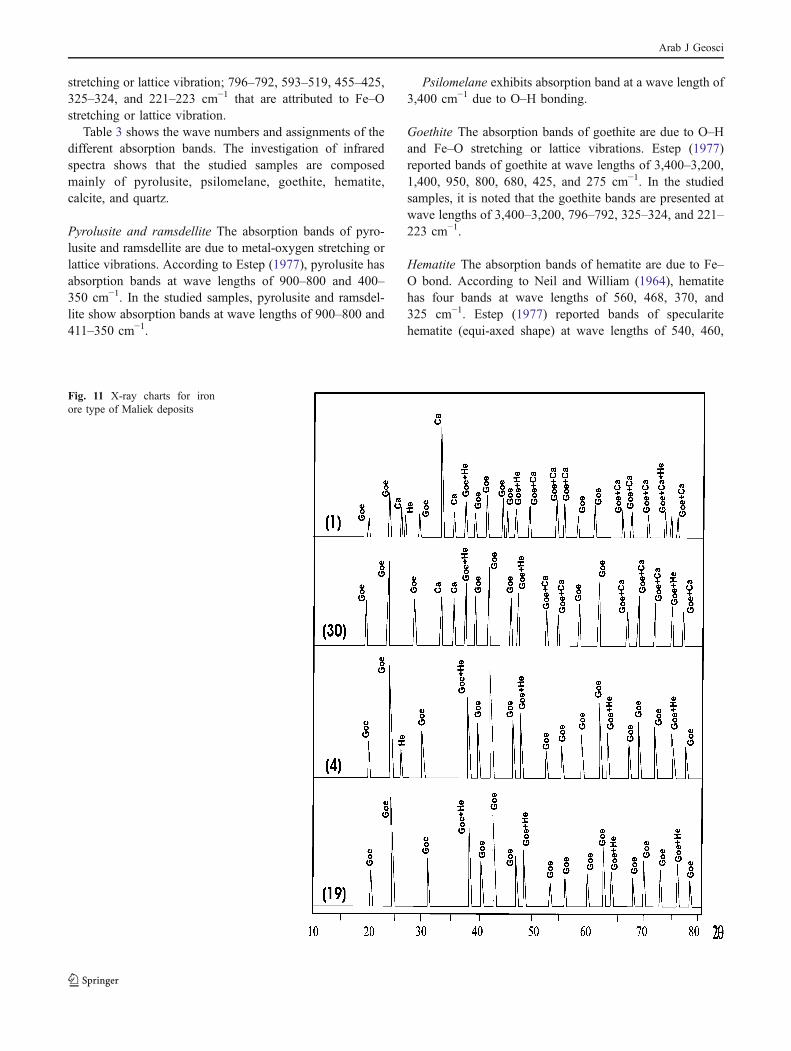
3. Iron ore is fine-grained, is sometimes botryoidal, andhas reddish brown color. It is softer than puremanganese type. It consists mainly of goethite (60 vol%), hematite (10 vol%), and pyrolusite (<4 vol%)(Fig. 8c). The gangue minerals consist of calcite (20 vol%), quartz (6 vol%), and a rare amount of apatite andplagioclase.
X-ray diffraction analysis
Nine samples were examined by X-ray diffraction analysisat the laboratories of Nuclear Materials Authority. Theidentification of ore and gangue minerals has beenaccomplished using ASTM (1964) cards by the determina-tion of the inter-planar distance (d) of the different atomic
planes and their relative intensities (I/I°).The X-ray patternsof the studied samples indicate that the pyrolusite (Py),psilomelane (Ps), ramsdellite (Ra), goethite (Goe), hematite(Hem), jarosite (Ja), calcite (Ca), quartz (Qz), chlorite(Chl), and additional faint reflections of mica (Mi) are themain minerals in the Maliek ores, as shown in Figs. 9, 10,and 11.
Infrared spectral analysis
The infrared spectral analysis has been made for sixsamples representing different manganese ore types ofMaliek deposits. The infrared vibration spectra wererecorded on wave lengths of 4,000–200 cm−1. The infraredspectra of the studied samples (Fig. 12) revealed thepresence of the following bands: 3,400–3,200 cm−1 that isattributed to O–H stretching vibration; 2,500–2,400, 1,800–1,600, and 1,420 cm−1, which are attributed to (CO3)
2−
anion; 888–877 and 694 cm−1, which are attributed to C–Obond; 1,030–1,000 cm−1, which is attributed to Si–O bond;900–800 and 411–350 cm−1, which are attributed to Mn–O
Fig. 10 X-ray charts formanganese–iron ore type ofMaliek deposits
Arab J Geosci
stretching or lattice vibration; 796–792, 593–519, 455–425,325–324, and 221–223 cm−1 that are attributed to Fe–Ostretching or lattice vibration.
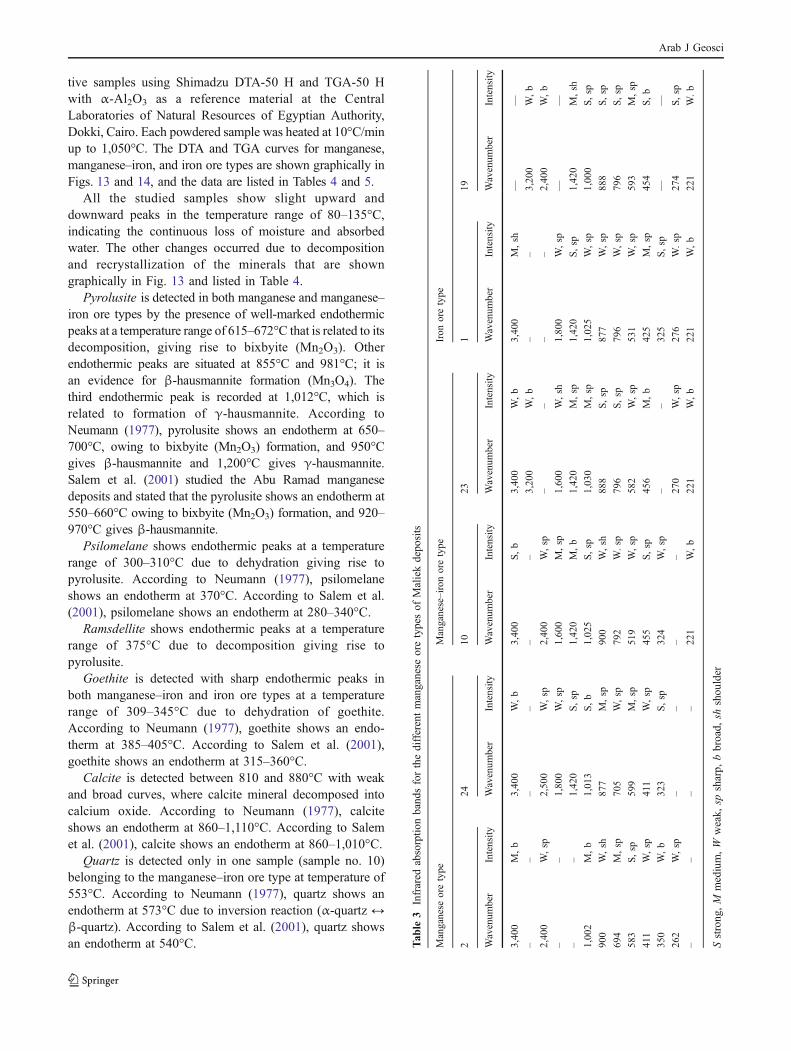
Table 3 shows the wave numbers and assignments of thedifferent absorption bands. The investigation of infraredspectra shows that the studied samples are composedmainly of pyrolusite, psilomelane, goethite, hematite,calcite, and quartz.
Pyrolusite and ramsdellite The absorption bands of pyro-lusite and ramsdellite are due to metal-oxygen stretching orlattice vibrations. According to Estep (1977), pyrolusite hasabsorption bands at wave lengths of 900–800 and 400–350 cm−1. In the studied samples, pyrolusite and ramsdel-lite show absorption bands at wave lengths of 900–800 and411–350 cm−1.
Psilomelane exhibits absorption band at a wave length of3,400 cm−1 due to O–H bonding.
Goethite The absorption bands of goethite are due to O–Hand Fe–O stretching or lattice vibrations. Estep (1977)reported bands of goethite at wave lengths of 3,400–3,200,1,400, 950, 800, 680, 425, and 275 cm−1. In the studiedsamples, it is noted that the goethite bands are presented atwave lengths of 3,400–3,200, 796–792, 325–324, and 221–223 cm−1.
Hematite The absorption bands of hematite are due to Fe–O bond. According to Neil and William (1964), hematitehas four bands at wave lengths of 560, 468, 370, and325 cm−1. Estep (1977) reported bands of specularitehematite (equi-axed shape) at wave lengths of 540, 460,
Fig. 11 X-ray charts for ironore type of Maliek deposits
Arab J Geosci

and 360 cm−1. In the studied samples, it is noted that thehematite bands are presented at wave lengths of 593–519and 455–425 cm−1.
Calcite The absorption bands of calcite are due to thefundamental internal vibration for carbonate anion CO3
2−
and C–O bond. Neil and William (1964) mentioned thatcarbonate anion is found at wave lengths of 1,900–1,820,1,750–1,860, 1,480–1,420, and 1,090–1,020 cm−1. Estep(1977) reported bands of calcite at 2,470, 1,800, 1,420, 850,690, 400, and 220 cm−1. In the studied samples, it is notedthat the calcite bands are presented at wave lengths of2,500–2,400, 1,800–1,600, 1,420, 888–877, and 694 cm−1.
Quartz The absorption bands of quartz are due to Si–Obond. Neil and William (1964) mentioned that SiO2 (α-quartz) is found at wave lengths of 775, 639, 510, 485,362, and 257 cm−1. Estep (1977) reported bands ofquartz at 1,070, 780, 675, 500, 440, 375, and 360 cm−1.In the studied samples, it is noted that the only strongband of quartz is presented at the wave length range1,030–1,000 cm−1.
Thermal analyses
The differential thermal analysis (DTA) and thermogravi-metric analysis (TGA) were carried out for six representa-
Fig. 12 Infrared absorptionbands for the differentmanganese ore types of Maliekdeposits
Arab J Geosci
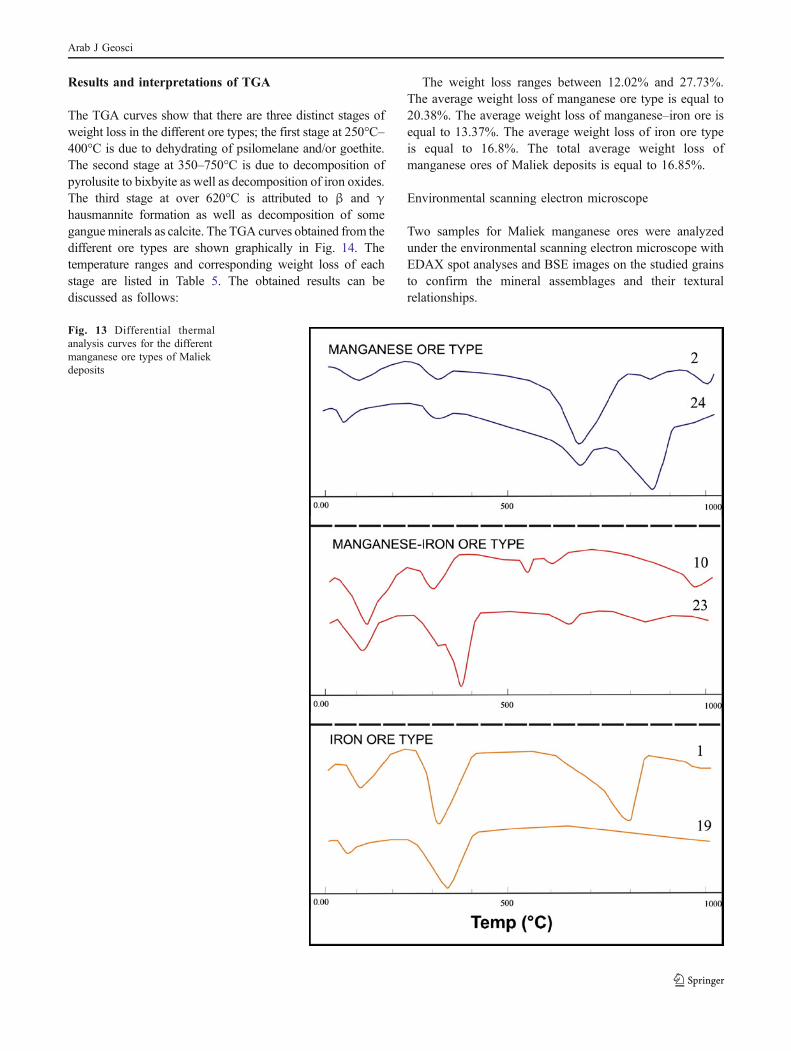
tive samples using Shimadzu DTA-50 H and TGA-50 Hwith α-Al2O3 as a reference material at the CentralLaboratories of Natural Resources of Egyptian Authority,Dokki, Cairo. Each powdered sample was heated at 10°C/minup to 1,050°C. The DTA and TGA curves for manganese,manganese–iron, and iron ore types are shown graphically inFigs. 13 and 14, and the data are listed in Tables 4 and 5.
All the studied samples show slight upward anddownward peaks in the temperature range of 80–135°C,indicating the continuous loss of moisture and absorbedwater. The other changes occurred due to decompositionand recrystallization of the minerals that are showngraphically in Fig. 13 and listed in Table 4.
Pyrolusite is detected in both manganese and manganese–iron ore types by the presence of well-marked endothermicpeaks at a temperature range of 615–672°C that is related to itsdecomposition, giving rise to bixbyite (Mn2O3). Otherendothermic peaks are situated at 855°C and 981°C; it isan evidence for β-hausmannite formation (Mn3O4). Thethird endothermic peak is recorded at 1,012°C, which isrelated to formation of γ-hausmannite. According toNeumann (1977), pyrolusite shows an endotherm at 650–700°C, owing to bixbyite (Mn2O3) formation, and 950°Cgives β-hausmannite and 1,200°C gives γ-hausmannite.Salem et al. (2001) studied the Abu Ramad manganesedeposits and stated that the pyrolusite shows an endotherm at550–660°C owing to bixbyite (Mn2O3) formation, and 920–970°C gives β-hausmannite.
Psilomelane shows endothermic peaks at a temperaturerange of 300–310°C due to dehydration giving rise topyrolusite. According to Neumann (1977), psilomelaneshows an endotherm at 370°C. According to Salem et al.(2001), psilomelane shows an endotherm at 280–340°C.
Ramsdellite shows endothermic peaks at a temperaturerange of 375°C due to decomposition giving rise topyrolusite.
Goethite is detected with sharp endothermic peaks inboth manganese–iron and iron ore types at a temperaturerange of 309–345°C due to dehydration of goethite.According to Neumann (1977), goethite shows an endo-therm at 385–405°C. According to Salem et al. (2001),goethite shows an endotherm at 315–360°C.
Calcite is detected between 810 and 880°C with weakand broad curves, where calcite mineral decomposed intocalcium oxide. According to Neumann (1977), calciteshows an endotherm at 860–1,110°C. According to Salemet al. (2001), calcite shows an endotherm at 860–1,010°C.
Quartz is detected only in one sample (sample no. 10)belonging to the manganese–iron ore type at temperature of553°C. According to Neumann (1977), quartz shows anendotherm at 573°C due to inversion reaction (α-quartz ↔β-quartz). According to Salem et al. (2001), quartz showsan endotherm at 540°C. T
able
3Infrared
absorptio
nband
sforthedifferentmanganese
oretypesof
Maliekdepo
sits
Manganese
oretype
Manganese–ironoretype
Iron
oretype
224
1023
119
Wavenum
ber
Intensity
Wavenum
ber
Intensity
Wavenum
ber
Intensity
Wavenum
ber
Intensity
Wavenum
ber
Intensity
Wavenum
ber
Intensity
3,400
M,b
3,400
W,b
3,400
S,b
3,400
W,b
3,400
M,sh
——
––
––
––
3,200
W,b
––
3,200
W,b
2,400
W,sp
2,500
W,sp
2,400
W,sp
––
––
2,400
W,b
––
1,800
W,sp
1,600
M,sp
1,600
W,sh
1,800
W,sp
——
––
1,420
S,sp
1,420
M,b
1,420
M,sp
1,420
S,sp
1,420
M,sh
1,002
M,b
1,013
S,b
1,025
S,sp
1,030
M,sp
1,025
W,sp
1,000
S,sp
900
W,sh
877
M,sp
900
W,sh
888
S,sp
877
W,sp
888
S,sp
694
M,sp
705
W,sp
792
W.sp
796
S,sp
796
W,sp
796
S,sp
583
S,sp
599
M,sp
519
W,sp
582
W,sp
531
W,sp
593
M,sp
411
W,sp
411
W,sp
455
S,sp
456
M,b
425
M,sp
454
S,b
350
W,b
323
S,sp
324
W,sp
––
325
S,sp
——
262
W,sp
––
––
270
W,sp
276
W.sp
274
S,sp
––
––
221
W,b
221
W,b
221
W,b
221
W.b
Sstrong
,M
medium,W
weak,
spsharp,
bbroad,
shshou
lder
Arab J Geosci
Results and interpretations of TGA
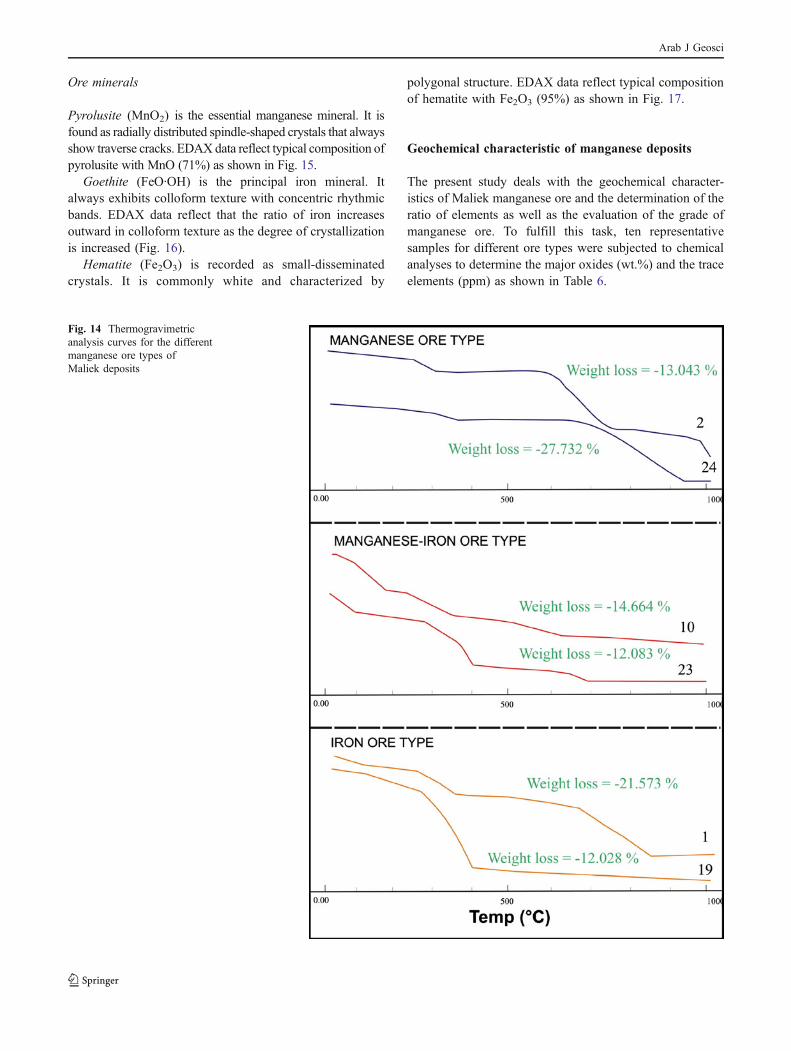
The TGA curves show that there are three distinct stages ofweight loss in the different ore types; the first stage at 250°C–400°C is due to dehydrating of psilomelane and/or goethite.The second stage at 350–750°C is due to decomposition ofpyrolusite to bixbyite as well as decomposition of iron oxides.The third stage at over 620°C is attributed to β and γhausmannite formation as well as decomposition of somegangueminerals as calcite. The TGA curves obtained from thedifferent ore types are shown graphically in Fig. 14. Thetemperature ranges and corresponding weight loss of eachstage are listed in Table 5. The obtained results can bediscussed as follows:
The weight loss ranges between 12.02% and 27.73%.The average weight loss of manganese ore type is equal to20.38%. The average weight loss of manganese–iron ore isequal to 13.37%. The average weight loss of iron ore typeis equal to 16.8%. The total average weight loss ofmanganese ores of Maliek deposits is equal to 16.85%.
Environmental scanning electron microscope
Two samples for Maliek manganese ores were analyzedunder the environmental scanning electron microscope withEDAX spot analyses and BSE images on the studied grainsto confirm the mineral assemblages and their texturalrelationships.
Fig. 13 Differential thermalanalysis curves for the differentmanganese ore types of Maliekdeposits
Arab J Geosci
Ore minerals
Pyrolusite (MnO2) is the essential manganese mineral. It isfound as radially distributed spindle-shaped crystals that alwaysshow traverse cracks. EDAXdata reflect typical composition ofpyrolusite with MnO (71%) as shown in Fig. 15.
Goethite (FeO·OH) is the principal iron mineral. Italways exhibits colloform texture with concentric rhythmicbands. EDAX data reflect that the ratio of iron increasesoutward in colloform texture as the degree of crystallizationis increased (Fig. 16).
Hematite (Fe2O3) is recorded as small-disseminatedcrystals. It is commonly white and characterized by
polygonal structure. EDAX data reflect typical compositionof hematite with Fe2O3 (95%) as shown in Fig. 17.
Geochemical characteristic of manganese deposits
The present study deals with the geochemical character-istics of Maliek manganese ore and the determination of theratio of elements as well as the evaluation of the grade ofmanganese ore. To fulfill this task, ten representativesamples for different ore types were subjected to chemicalanalyses to determine the major oxides (wt.%) and the traceelements (ppm) as shown in Table 6.
Fig. 14 Thermogravimetricanalysis curves for the differentmanganese ore types ofMaliek deposits
Arab J Geosci

Fig. 15 EDAX spot analysisand close-up views showing thespindle-shaped crystals ofpyrolusite
Table 5 The total weight loss due to heating up to 1,050°C for the different manganese ore types in Maliek deposits
Ore type Sample no. Wt Loss due tomoisture (°C)
First stage (°C) Second stage (°C) Third stage (°C) Total wt.% loss
Manganese ore 2 20–250 250–320 600–750 750–960 13.043
24 20–300 300–360 360–620 620–790 and 790–890 27.732
Manganese–iron ore 10 30–180 180–260 260–350 350–630 630–1,000 14.664
23 20–100 100–280 280–400 400–680 680–1,000 12.083
Iron ore 1 30–120 120–270 270–360 360–640 640–850 21.573
19 30–280 280–400 400–1,000 12.028
Table 4 The temperature degrees of manganese, iron, and associated minerals during thermal reactions detected in DTA in Maliek deposits
0re Type Manganese ore Manganese–iron ore Iron ore
Sample no. 2 24 10 23 1 19
Heat effect Endo Exo Endo Exo Endo Exo Endo Exo Endo Exo Endo Exo
Moisture 109.79 84.4 134.9 106 103.15 93.34
Pyrolusite 668.94 671.32 615.76 660.51
Β-hausmannite 855.11 981.82
γ-hausmannite 1,012.1
Psilomelane 306.84 301.54
Ramsdellite 374.26
Goethite 309.25 313.96 315.17 344.91
Calcite 877.13 812.68
Quartz 553.24
Arab J Geosci

Fig. 17 EDAX spot analyses and close-up view showing polygonal structure of hematite (white) surrounded by goethite (gray)
Fig. 16 EDAX spot analyses and close-up view showing colloform texture in goethite
Arab J Geosci

The geochemistry of different manganese ore types ofMaliek deposits revealed that the manganese ore type isrich in SiO2, MnO, MgO, and CaO and poor in TiO2,Al2O3, FeO, Na2O, K2O, and P2O5. The manganese–ironore type is rich in FeO, MnO, CaO, and P2O5 and poor inTiO2, Al2O3, MgO, Na2O, and K2O. The iron ore type isrich in SiO2, FeO, CaO, and P2O5 and poor in TiO2, Al2O3,MgO, Na2O, and K2O. The total averages of some majoroxides in manganese, manganese–iron, and iron ore typesare presented, respectively, as SiO2 (15.64%, 11.52%, and20.58%), MnO (39.9%, 17.81%, and 0.77%), FeO*(7.13%, 33.31%, and 37.08%), Al2O3 (4.48%, 6.22%, and8.08%), TiO2 (0.13%, 0.12%, and 0.25%), CaO (5.89%,5.82%, and 5.32%), and Na2O (1.04%, 1.61%, and 1.53%).
Regarding trace elements, the manganese ore type isrich in Cu, Zn, Ba, Pb, Sr, and V and poor in Co, Ni, Zr,Rb, and Ga. The manganese–iron ore type is rich in Cr,Co, Zn, Ba, Pb, Sr, and V and poor in Cu, Ni, Zr, Rb, andGa. The iron ore type is rich in Cr, Co, Zn, Ba, Pb, and Vand poor in Cu, Ni, Zr, Rb, Sr, and Ga. Trace elementsare presented with averages of total concentrations inmanganese, manganese–iron, and iron ore types, respec-tively as: Ba (6,402, 6,523, and 3,063 ppm), Cu (116, 34,and 36 ppm), Zn (246, 211, and 404 ppm), Pb (64, 129,and 153 ppm), Sr (263, 293, and 47 ppm), and V (393,514, and 312 ppm).
Figure 18a illustrates the binary diagram between Co+Niand As+Cu+Pb+Zn (in weight percent) after Nicholson
Table 6 Chemical analysis data (major oxides and trace elements) for different manganese ore types of Maliek deposits
Ore type Manganese ore type Manganese–iron ore type Iron ore type
Sample 2 24 28 Average 23 10 Average 1 4 30 15 19 Average
Major oxides (wt.%)
SiO2 19.37 11.01 16.53 15.64 15.16 7.86 11.51 10.78 28.96 24.03 26.71 12.42 20.58
TiO2 0.12 0.13 0.15 0.13 0.11 0.13 0.12 0.19 0.11 0.58 0.15 0.23 0.25
Al2O3 5.89 2.98 4.56 4.48 10.34 2.11 6.22 2.82 8.51 11.47 10.53 7.11 8.08
Fe2O3 0.86 3.13 1.30 1.76 4.53 6.61 5.57 6.01 5.11 5.48 6.23 8.27 6.22
FeO 4.29 5.83 6.52 5.54 23.01 33.59 28.3 30.49 25.94 27.42 31.64 41.96 31.49
FeO* 5.06 8.65 7.70 7.13 27.09 39.54 33.31 35.9 30.54 32.35 37.25 49.4 37.08
MnO 44.71 29.56 45.45 39.9 20.21 15.42 17.81 1.12 1.03 0.92 0.39 0.4 0.77
MgO 7.11 15.1 7.93 10.04 4.03 4.2 4.11 5.04 7.06 6.25 5.14 7.06 6.11
CaO 5.92 4.75 7 5.89 5.6 6.04 5.82 15.4 4.2 2.8 1.4 2.8 5.32
Na2O 0.98 1.13 1 1.04 1.2 2.02 1.61 1.46 1.51 1.46 1.63 1.63 1.53
K2O 0.11 0.15 0.15 0.14 0.16 0.27 0.215 0.16 0.22 0.27 0.27 0.22 0.22
P2O5 0.04 0.22 0.12 0.13 0.89 0.46 0.67 0.64 0.84 0.53 0.61 1.02 0.72
LOI 10.53 25.95 9.22 15.23 12.18 17.23 14.70 22.3 13.2 15.2 12.75 12.03 15.09
Mn/Fe 10.3 3.41 6.92 6.66 0.87 0.45 0.66 0.04 0.04 0.03 0.01 0.01 0.02
Total 100 100 100 100 97.42 95.94 96.6 96.41 96.69 96.41 97.45 95.15 96.4
Trace elements (ppm)
Cr 104 54 102 86 151 284 217 38 131 216 149 154 137
Co 14 31 12 19 182 142 162 136 291 137 274 264 220
Ni 31 19 34 28 25 28 26 14 18 66 23 27 29
Cu 270 42 36 116 44 24 34 40 16 73 28 23 36
Zn 206 285 247 246 182 240 211 531 265 686 317 224 404
Zr 13 nd 31 14 18 35 26 nd 15 18 8 12 10
Rb 11 14 10 11 5 9 7 8 7 19 13 8 11
Ba 5,761 2,720 10,725 6,402 5,180 9,866 7,523 11,789 1,091 585 236 1,615 3,063
Pb 33 100 60 64 122 136 129 152 201 79 158 179 153
Sr 226 138 426 263 135 451 293 103 30 79 14 13 47
Ga 4 nd nd 1.33 nd nd nd nd nd 4 nd 2 1.2
V 531 247 403 393 403 626 514 192 513 347 328 184 312
nd not detected
Arab J Geosci

(1990) who classified the manganese deposits into hydro-thermal and non-hydrothermal (hydrogenous) types. Withplotting the data, the studied ore belongs to hydrothermaltype. The Al–Mn–Fe triangle diagram after Bonatti et al.(1972) shows that the studied manganese deposits fall inthe fields of manganese nodules and East Pacific Mn–Fenodules and around them (Fig. 18b). Such deposits arecharacteristic of hydrothermal origin. According to Sugisakiet al. (1987), the (Cu+Ni+Co)*10, Fe2O3, and MnO (wt.%)triangle diagram shows that the Maliek manganese depositsfall in hydrothermal field (Fig. 18c). According to Cretar etal. (1982), on the (Cu+Ni+Co)*10, Fe, and Mn (wt.%)triangle diagram, when Maliek manganese deposits wereplotted on the graph, it appeared that the deposits fall inhydrothermal field (Fig. 18d).
Dorokhin et al. (1969) classified the grades ofmanganese ore deposits according to the total manganesecontent into four categories, namely (1) high grade A(>50% MnO2), (2) high grade B (40–50% MnO2), (3)medium grade (35–40% MnO2), and (4) low grade (<35%MnO2). Accordingly, the manganese ore type of Maliekdeposits (av. 39.9% MnO2) lies in the field of mediumgrade, the manganese–iron ore type (av. 17.8% MnO2)
and the iron ore type (av. 0.77% MnO2) are of low grade.The harmful elements as phosphorous are presented innegligible amounts, which do not affect the quality of theore.
Summary and conclusions
Based on the geological, mineralogical, and geochemicalresults of the present study, the following genetic consid-erations can be postulated as evidences for the hydrother-mal origin of Maliek manganese deposits:
1. The Maliek manganese deposits are mainly hostedwithin the metagabbroic rocks of Precambrian age.Petrographically, the metagabbroic rocks are classifiedinto four types as follows: (1) normal metagabbro, (2)quartz metagabbro, (3) diorite, and (4) amphibolite.The geochemical analyses of the studied metagabbroicrocks exhibit calc-alkaline magma related to island arcsystem.
2. The manganese deposits occur as veins, veinlets, andsmall pockets. The manganese veins were developed
Fig. 18 a (Co+Ni) versus(As+Cu+Pb+V+Zn) in weightpercent after Nicholson (1990).b (Al–Mn–Fe) triangle diagramsafter Bonatti et al. (1972). c(Cu+Ni+Co)–Fe2O3–MnOtriangle diagram after Sugisakiet al. (1987). d (Cu+Ni+Co)–Fe–Mn triangle diagram afterCretar et al. (1982)
Arab J Geosci

along shear zones and channel ways of the faultplanes. The wall-rock alteration at the site of manga-nese veins insures the epigenetic nature of thedeposits.
3. The Maliek manganese deposits could be mineralog-ically classified into three ore types: (a) manganeseore, (b) manganese–iron ore, and (c) iron ore. Themicroscopic examination together with XRD tech-nique, infrared spectral, differential thermal, andthermogravimetric analyses revealed that the manga-nese minerals consist mainly of pyrolusite, psilome-lane, and ramsdellite. Goethite and hematite are thecommon iron minerals, while jarosite occurs as minorconstituent. Calcite, quartz, apatite, and chlorite arethe essential gangue minerals, whereas plagioclaseand mica are recorded as rare constituents.
4. The presence of colloform texture, shrinkage cracks,and amorphous materials support colloidal transportof thermal water.
5. According to Dorokhin et al. (1969) and based on thetotal manganese content, the manganese ore (39.9%MnO2) lies in the field of medium grade, and themanganese–iron ore (17.8% MnO2) and the iron ore(0.77% MnO2) lie in the field of low grade.
6. The presence of both pure manganese and pure ironore types indicates the complete separation of Fe fromMn during deposition, assuring the hydrothermalnature of the deposits (Cretar et al. 1982; Shah andKhan 1999). The fractionation of Mn compoundsfrom the Fe compounds suggests spatial variations inEh and/or pH conditions upon the site of deposition ofthe two types (Panagos and Varnavas 1984).
7. In general, the relationship (0.1<Mn/Fe<10) is relatedto hydrothermal deposits, whereas the hydrogenousdeposits ratio is closer to unity (Rona 1978). TheMaliek manganese deposits show that Mn/Fe ratioranges from 0.01 to 10.3, typical to hydrothermalorigin.
8. Ti is an essentially immobile element in hydrothermalsolution and has long been recognized as an indicatorof detrital sedimentation rates. The low concentrationof TiO2 with an average of 0.16% in the studiedmanganese ores confirms their non-detrital origin, andthey are more likely precipitated from hydrothermalsolution (Arrhenius and Tsai 1981).
9. The deposits are rich in Ba, Sr, V, Pb, and Zn andmainly depleted in Co, Cu, and Ni contents thatemphasizes the hydrothermal origin of these deposits(Hewitt et al. 1963; Nicholson 1992).
10. These deposits have mesothermal to epithermal naturedue to that the higher tendency of iron minerals to beprecipitated in deeper and hotter zones (Hewitt andFleischer 1960).
References
Arrhenius G, Tsai AG (1981) Structure, phase transformation andprebiotic catalysis in marine manganate minerals. Scripps InstOceanogr Ref Ser 81:1–19
ASTM (1964) Methods of emission spectrochemical analysis, 4th edn.ASTM, Philadelphia
Atia AM, Hegab OA,Morsy AM (1976) Contribution to the mineralogy ofmanganese deposits of Halaib, South Eastern Desert, Egypt. Bull FacSci Mansoura Univ Mansoura Egypt 6:459–474
Bonatti E, Kramer T, Rydell HS (1972) Classification and genesis ofsubmarine iron–manganese deposits in ferromanganese depositson the ocean floor. In: Horn DR (ed) Classification and genesis ofsubmarine iron–manganese deposits in ferromanganese depositson the ocean floor. Natural Science Foundation, Washington, pp149–166
Cox KG, Bell JD, Pankhurst RJ (1979) The interpretation of igneousrocks. Allen and Unwin, London, 450
Cretar DA, Namson J, Chyi MS, DA Williams F (1982) Manganif-erous cherts of the Franciscan assemblage: 1. General geology,ancient and modern analogues and implications for hydrothermalconvictions at ocean spreading center. Econ Geol 77:519–540
Dorokhin IV, Bogachero EN,Druzhiniv AV, Soboleviski VI, Gorbunov EV(1969) Economic mineral deposits. Higher School, Moscow, 368
El Agami NI, Abu Baker MA, Ibrahim ME, Rashad MA (1999)Mineralogical and geochemical studies on some mineralizations inHalaib area, South EasternDesert, Egypt. Egy Jour Geol 43(1):27–38
El Shazly EM (1957) Classification of Egyptian mineral deposits.Egypt Jour Geol 1:1–20
Estep PA (1977) Infrared spectroscopy. In: Zassuman J (ed) Physicalmethods in determinative mineralogy. Academic, New York, p 720
Hewitt DF, Fleischer M (1960) Deposits of the manganese oxides.Econ Geol 55:1–55
Hewitt DF, Fleischer M, Conkln N (1963) Deposits of the manganeseoxides. Supplement. Econ Geo 58:1–50
Hietanen AA (1963) On the facies series in the various types ofmetamorphism. Jour Geol 75:187–214
Ibrahim ME, Saleh GM, Drawish MS, Khalaf MA (2006) Mineralogyand geochemistry of some mineralization associated with Elbaring complex, South Eastern Desert. In: Egypt Inter Con OnGeochem. Alex Univ Egypt I, pp 99–115
Irvine TN, Baragar WR (1971) A guide to the chemical classificationof the common volcanic rocks. Can Jour Earth Sci 8:523–548
Miyashiro A (1975) Metamorphism and metamorphic belts. GeorgeAllen Unwin, London, 429
Neil TM, William LB (1964) Infrared absorption study of metaloxides in the low frequency region (700–240 cm−1). SpectrochimActa 20:799–808
Neumann BS (1977) Thermal technique. In: Zassuman J (ed) Physicalmethods in determinative mineralogy. Academic, New York, p 720
Nicholson K (1990) Stratiform manganese mineralization nearInverness, Scotland: a Devonian sublacustrine hot-spring depos-it? Miner Deposita 25:126–131
Nicholson K (1992) Contrasting mineralogical–geochemical signa-tures of manganese oxides: guides to metallogenesis. Econ Geol87:1253–1264
Panagos AG, Varnavas SP (1984) On the genesis of some manganesedeposits from eastern Greece. In: Wauschkuhn A (ed) Syngenesisand epigenesis in the formation of mineral deposits. Spriger,Berlin, pp 553–561
Pearce JA, Cann JR (1973) Tectonic setting of basic volcanic rocksdetermined using trace element analysis. Earth Planet Sci Lett19:290–300
Pearce JA, Gale GH (1977) Identification of ore deposition environ-ment from trace elements geochemistry of associated igneous
Arab J Geosci

host rocks. Volcanogenic processes in the ore genesis. Spec PublGeol Soc Lond 7:14–42
Pettijohn FG (1975) Sedimentary rocks, 3rd edn. Harper & Row, NewYork, p 628
Rona PA (1978) Criteria for recognition of hydrothermal mineraldeposits in oceanic crust. Econ Geol 73:135–160
Salem IA, El Kalioubi BA, Abu El Laban SA (2001) Mineralogy,geochemistry and origin of manganese deposits of Abu Ramadarea, Southern Eastern Desert, Egypt. In: 5th Intern. Conf onGeoch Alex Univ Egypt, pp 441–467
Shah MT, Khan A (1999) Geochemistry and origin of Mn-deposits inthe Waziristan ophiolite complex, North Waziristan, Pakistan.Miner Deposita 34:697–704
Streckeisen A (1976) To each plutonic rock its proper name. Earth SciRev 12:1–13
Sugisaki R, Ohashi M, Sugitami K, Suzuki K (1987) Compositionalvariations in manganese micronodules: a possible indicator ofsedimentary environments. Jour Geol 95:433–545
Wilson M (1989) Igneous petrogenesis. Harper Collins Academic,London, p 466
Arab J Geosci
Copyright © 2022 FDOKUMEN