Flash Flood Modeling Using HEC-RAS (2D) model on Wadi ...
16
J. Egypt. Acad. Soc. Environ. Develop., 22 (1):17-32 (2021) (D-Environmental Studies) E.mail: [email protected] ISSN 1110-8770 www.jades.journals.ekb.eg eISSN 2314-5471 (online) Flash Flood Modeling Using HEC-RAS (2D) model on Wadi Reem in the western region, Kingdom of Saudi Arabia Mahmoud Abdelshafy 1 and Alaa Mostafa 2 1- Egyptian Environmental Affairs Agency (EEAA) Email: [email protected] 2- Geology Department, Faculty of Science, Assiut Branch, Al-Azhar University, Egypt Email: [email protected] ABSTRACT Various infrastructures in Saudi Arabia are affecting by floods and rainfall that may damage constructions at urban areas due to water flows in the main valleys and streams. Asser Region in western Saudi Arabia is characterized by its high rainfall intensity that leads to flash floods. The present study aims to evaluate and identify potential floods in coastal areas of Wadi Reem basin and to show the urban areas exposed to flooding with flood water in the coastal city. Runoff calculation is an important part of regional runoff forecast and water resources evaluation model. The Soil Conservation Service (SCS) curve number (CN) model developed by the U.S. Department of Agriculture National Resources Conversion Service (NRCS) is the most popular and widely applied model for direct runoff estimation. The current work used HEC-RAS (2D) in order to simulate Flood map depth and velocity in Wadi Reem coastal areas. Watershed and its stream was delineated using digital elevation model (DEM) and morphological parameters calculated using Watershed Modeling System (WMS). Rainfall frequency analysis was performed for selected three rainfall gages using annual maximums of 24-h rainfall. This study deals with geographic information systems (GIS), hydrologic modeling (water modeling system, WMS), and hydraulic modeling (Hydrologic Engineering Center River Analysis System, HEC- RAS) to evaluate the impact of flash flood hazards on Wadi Reem coastal area. Keywords: Flash flood, Wadi Reem, Morphological parameters, HEC-HMS Modeling and HEC-RAS 2D Model. INTRODUCTION Flooding is common natural disaster with a devastating and widespread effect responsible for economic losses and mortality (Teng et al., 2017). Flood causes about third of all natural disasters in the world. Geographic Information Systems (GIS) and digital elevation models (DEM) are now commonly used for flood analysis and flood risk prediction. Floods are considered as one of the most common disasters and probably the most devastating (Baoyin and Hailin, 2009). Between 1998 and 2017, floods affected more than two billion people worldwide and flood together with storms and droughts contributed to 80–90% of the worldwide natural disasters in the last ten years (WHO, 2020). The western region of Saudi Arabia is characterized by low altitude-flat coastal plain bounded from the east with a chain of high rugged mountains of the Arabian Shield oriented North-Northwest to South-Southeast. Many of the major cities and villages along the coastal Received March 26, 2021 Accepted: May 20, 2021
-
Upload
khangminh22 -
Category
Documents
-
view
1 -
download
0
Transcript of Flash Flood Modeling Using HEC-RAS (2D) model on Wadi ...

J. Egypt. Acad. Soc. Environ. Develop., 22 (1):17-32 (2021) (D-Environmental Studies)
E.mail: [email protected] ISSN 1110-8770
www.jades.journals.ekb.eg eISSN 2314-5471 (online)
Flash Flood Modeling Using HEC-RAS (2D) model on Wadi Reem in the western region,
Kingdom of Saudi Arabia
Mahmoud Abdelshafy1 and Alaa Mostafa
2
1- Egyptian Environmental Affairs Agency (EEAA)
Email: [email protected]
2- Geology Department, Faculty of Science, Assiut Branch, Al-Azhar University, Egypt
Email: [email protected]
ABSTRACT
Various infrastructures in Saudi Arabia are affecting by floods and rainfall that may
damage constructions at urban areas due to water flows in the main valleys and streams. Asser
Region in western Saudi Arabia is characterized by its high rainfall intensity that leads to flash
floods. The present study aims to evaluate and identify potential floods in coastal areas of Wadi
Reem basin and to show the urban areas exposed to flooding with flood water in the coastal city.
Runoff calculation is an important part of regional runoff forecast and water resources evaluation
model. The Soil Conservation Service (SCS) curve number (CN) model developed by the U.S.
Department of Agriculture National Resources Conversion Service (NRCS) is the most popular
and widely applied model for direct runoff estimation. The current work used HEC-RAS (2D) in
order to simulate Flood map depth and velocity in Wadi Reem coastal areas. Watershed and its
stream was delineated using digital elevation model (DEM) and morphological parameters
calculated using Watershed Modeling System (WMS). Rainfall frequency analysis was
performed for selected three rainfall gages using annual maximums of 24-h rainfall. This study
deals with geographic information systems (GIS), hydrologic modeling (water modeling system,
WMS), and hydraulic modeling (Hydrologic Engineering Center River Analysis System, HEC-
RAS) to evaluate the impact of flash flood hazards on Wadi Reem coastal area.
Keywords: Flash flood, Wadi Reem, Morphological parameters, HEC-HMS Modeling and
HEC-RAS 2D Model.
INTRODUCTION
Flooding is common natural disaster with a devastating and widespread effect responsible
for economic losses and mortality (Teng et al., 2017). Flood causes about third of all natural
disasters in the world. Geographic Information Systems (GIS) and digital elevation models
(DEM) are now commonly used for flood analysis and flood risk prediction. Floods are
considered as one of the most common disasters and probably the most devastating (Baoyin and
Hailin, 2009). Between 1998 and 2017, floods affected more than two billion people worldwide
and flood together with storms and droughts contributed to 80–90% of the worldwide natural
disasters in the last ten years (WHO, 2020).
The western region of Saudi Arabia is characterized by low altitude-flat coastal plain
bounded from the east with a chain of high rugged mountains of the Arabian Shield oriented
North-Northwest to South-Southeast. Many of the major cities and villages along the coastal
Received March 26, 2021
Accepted: May 20, 2021

18
Mahmoud Abdelshafy and Alaa Mostafa
plain are situated along or at the mouth of these wadis. Due to the aridity of the area and lack of
long-term strategic planning, most of the population tends to settle along wadi courses and sides.
Flash floods along these wadis caused severe damages to lives and properties in the past
(Subyani et al., 2009).
Most parts of Saudi Arabia are classified as hot and dry (Köppen, 1936), where rainfall is
irregular and the climate is characterized by high temperatures (Al-Jerash, 1985; Al-Taher,
1994). However, the south-western region of the country is classified as semi-arid (Köppen,
1936).This region is characterized by having rainfall throughout the year, where the topography
enhances local convective rain (Al-Mazroui, 1998; Abdullah and Al-Mazroui, 1998).
The main objective of this study is to estimate the direct runoff of wadi Reem watershed
and to generate Flood map depth and velocity using HEC-RAS 2D Model.
METHODOLOGY AND DATA Methodology and Data used in this work as shown in Figure (1).
Fig. 1:Flowchart showing the methodology
adopted in the current work.
1. WMS model
The study of morphometric basin characteristics in western Saudi Arabia is based on the
DEM data. All the drainage basins and networks as well as their morphometric characteristics
were extracted using the watershed modeling system (WMS, V.10.1) through the drainage
module by selecting “Compute Basins Data”, where the morphological properties of the basins
were calculated automatically. These properties can be shown in the “Display option”. This
system provided most of the morphometric parameters of the studied basins and their stream

19
Flash Flood Modeling Using HEC-RAS (2D) model on Wadi Reem in the western region,
Kingdom of Saudi Arabia
attributes with the assumption that the flow accumulation threshold is 0.2 (Strahler 1952; Ally et
al., 1980).
2. Hydrologic Modeling In this study HEC-HMS Model was selected for the run off forecasting which play a key
role in early flood warning. Program was developed by the US Army Corps of Engineers
Hydrologic Engineering Center (HEC) and is the replacement for HEC-1 (Feldman, 1995).
3. Hydraulic Modeling
The hydraulic modeling software, Hydraulic Engineering Center-River Analysis System
(HEC-RAS 5.0.4) is widely used open source hydraulic flow analysis programmer developed by
the United States Army Corps of Engineers-Hydrologic Engineering Center (Hydrologic
Engineering Centre, 2008, 2016). The model is available for 1D and 2D modeling. In this study a
2D HEC-RAS model was used.
RESULTS AND DISCUSSION
Study area and Location
The Wadi Reem catchment area is located in Asseer Region, Saudi Arabia, between
latitudes 17°42'15.51"N to 18°16'20.05"N (North) and longitudes 41°59'35.68"E to
42°22'35.04"E (East) (Fig. 2).
Fig. 2: Location Map of Wadi
Reem basin.

20
Mahmoud Abdelshafy and Alaa Mostafa
The study area basin is surrounded by high mountains from east and the north. Reem
basin can be divided into three main topographic features; The Red Sea coastal plain (Tihamah),
the Hills, and the Scarp of Hijaz Mountains. Tihamah area is a flatted land located in the East
and North East of wadi Reem basin, and its width is about 33 km and its elevation varies from 0
level to 300 m above sea level. The hills are area which sloping slightly at west of the Scarp
Mountains and the elevation of the hills varies from 400 m to 1,139 m above sea level (Fig. 3).
Fig. 3: Digital elevation
map (DEM) of Wadi
Reem basin.
Morphological characteristics
Basic parameters such as area, perimeter, elevation, slope, width, length of watershed
and stream length could be extracted directly from the DEM using WMS Softwear. The Wadi
Reem drainage basin has an area 205.42 km2 and the main morphological parameters of Wadi
Reem basin are shown in Figure (4) and Table (1).

21
Flash Flood Modeling Using HEC-RAS (2D) model on Wadi Reem in the western region,
Kingdom of Saudi Arabia
Fig. 4: Wadi Reem basin delineation
extracted directly from DEM Using WMS
Softwear.
Table 1: The morphological characteristics of Wadi Reem basin.
Parameter Units Wadi Reem
Basin Area (A) km2 996.85
Basin overland Slope (BS) m/m 0.238
Mean basin elevation (AVEL) m 419.57
Basin length (L) m 65348.95
Basin Perimeter (P) m 301841.38
Maximum Stream Lengh (MSL) m 103740.41
Maximum Stream Slope (MSS) (watercourse) average slope m/m 0.0086
Basin length along main channel from outlet to upstream boundary (MFD) m 104750.18
Average overland flow distance (AOFD) m 475.36
Basin slope along main channel from outlet to upstream boundary (MFS) m/m 0.012
Length along main channel from outlet to point opposite centroid (CSD) m 49357.99
Slope along main channel from outlet to point opposite centroid (CSS) m/m 0.0075
Distance from Centroid to stream (CTOSTR) 766.92
Shape Factor m^2/
m^2
4.28

22
Mahmoud Abdelshafy and Alaa Mostafa
Geology and Land use
Interpretation of the geological maps (GM-70C and GM-75C) (1:250,000-scale) acquired
from the Saudi Geological Survey database for the study area revealed the rock types in The
Wadi Reem Basin area and is shown in Figure (5).
Fig. 5:Geological map of the
Wadi Reem basin.
Based on field observation and the supervised classification of Setinal-2 satellite image
results showed that there are seven types of land use/land cover in the studied basins, namely:
Mixed forest or shrupland, Mixed cropland vegetation and shrups, Cropland and Pasture,
Farmlands, Mixed Urban or Built-up Land, Rocky areas and Desert areas as shown in Figure (6).
The land use classification of Wadi Reem basin is given in (Table 2) shows that 23.08% of land
is used as Mixed forest or shrupland, 16.96% land is used as Mixed cropland vegetation and
shrups, 3.06% land is used as Cropland and Pasture, 8.08% of land is used as Farmlands, 3.55%
land is used as Mixed Urban or Built-up Land, 5.08% land is used as Rocky areas and 40.1%
land is used as Desert areas.

23
Flash Flood Modeling Using HEC-RAS (2D) model on Wadi Reem in the western region,
Kingdom of Saudi Arabia
Fig. 6 :Land use map of the
Wadi Reem basin.
Table (2): Classification of Land Use types and their spatial coverage in Wadi Reem basin.
Land Use classification Area (km2) Percentage of Area %
Mixed forest or shrupland 230.13 23.08
Mixed cropland vegetation and shrups 169.14 16.96
Cropland and Pasture 30.54 3.06
Farmlands 80.56 8.08
Mixed Urban or Built-up Land 35.43 3.55
Rocky areas 50.67 5.08
Desert areas 400.12 40.1
SUM 996.85 100
Hydrologic soil maps and Curve Number
The SCS model categorizes soil types into four groups which are A, B, C and D, in
accordance with their infiltration rate (Sindhu et al., 2013). CN is the curve number, a
dimensionless number that range from 0-100, which is drawn from a table provided by the SCS
handbook of Hydrology depending on the HSG, land use /land cover, and Antecedent moisture
condition (AMC) (Songara et al., 2015; Satheeshkumar et al., 2017; Amutha and Porchelvan,
2009). The hydrologic soil groups (HSG) in the study basins included four types of Hydrologic
soil Group four groups which are A, B, C and D, in accordance with their infiltration rate
24
Mahmoud Abdelshafy and Alaa Mostafa
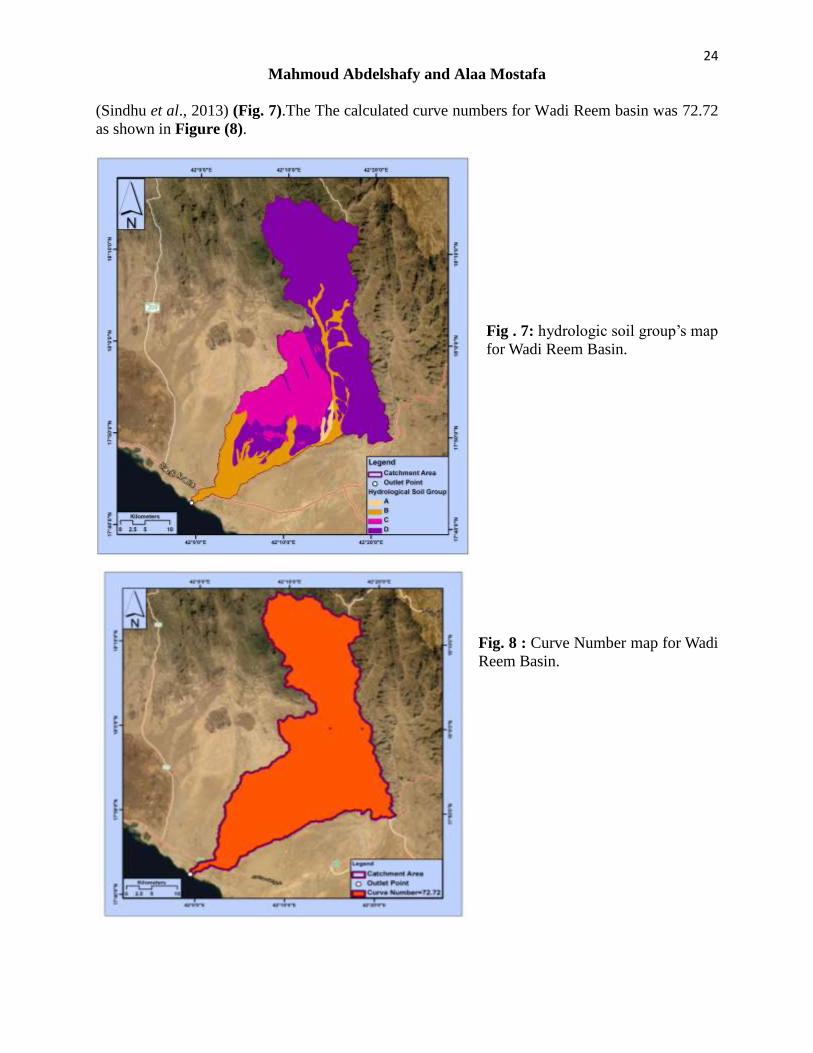
(Sindhu et al., 2013) (Fig. 7).The The calculated curve numbers for Wadi Reem basin was 72.72
as shown in Figure (8).
Fig . 7: hydrologic soil group’s map
for Wadi Reem Basin.
Fig. 8 : Curve Number map for Wadi
Reem Basin.

25
Flash Flood Modeling Using HEC-RAS (2D) model on Wadi Reem in the western region,
Kingdom of Saudi Arabia
Rainfall station data
It was found that Wadi Reem is affected by three meteorological stations and these
stations are operated by the Ministry of Water and Electricity (MOWE), according to the
Thiessen polygons as shown in Figure (9). Theses rainfall station data as the following; Rajal
Almaa (SA116), Alhabil (SA144) and Aldarb (SA102), The records also revealed that these
stations cover a period of 44 years, 46 years and 39 years, respectively (Figs.10-12).
The depth of the rain was determined in various return periods (5, 10, 25, 50, and 100
years) using the Hyfran-Plus (Hyfran, 1998) and various statistical distributions, such as normal,
log-normal, Gamma, Gumbel, and log-Pearson type III, used to verify the results. It was
concluded that the method (Normal) is the most suitable for Rajal Almaa (SA116), the method
(Gamma) is the most suitable for Alhabil (SA144) and method (Log-Pearson type 3) is the most
suitable for Aldarb (SA102) (Fig. 13) and (Table 3).
Fig. 9: Rain
gages weight
from all station
affecing on
wadi Reem
basin.
Fig. 10: Maximum
annual daily
rainfall of Rajal
Almaa (SA116)
station from 1968
to 2019.

26
Mahmoud Abdelshafy and Alaa Mostafa
Fig. 11: Maximum
annual daily rainfall
of Alhabil (SA144)
station from 1971
to 2019.
Fig. 12: Maximum
annual daily rainfall
of Aldarb (SA102)
station from 1966 to
2005.
Fig. (13): Probability distribution curve of
Rajal Almaa (SA116), Alhabil (SA144) and
Aldarb (SA102) using Normal, Gamma and
Log-Pearson type 3 distributions.

27
Flash Flood Modeling Using HEC-RAS (2D) model on Wadi Reem in the western region,
Kingdom of Saudi Arabia
Table (3): The results at different return periods of extreme rainfall events.
100
years
50
years
25
years
10
years
5
years
Statistical
distribution
The series of daily
rainfall
92.2 87 81.3 72.5 64.2 Normal Rajal Almaa
(SA116)
132 117 102 81.2 64.3 Gamma Alhabil (SA144)
80.6 75.2 68.6 57.5 46.5 Log-Pearson
type 3 Aldarb (SA102)
Hydrologic Modeling
HEC-HMS is widely used as a rainfall runoff modeling tool, and it uses separate sub
models to represent each component of the runoff process, including models that compute
rainfall losses, runoff generation, base flow, and channel routing (Du et al., 2012).
After the completion of the basin model with WMS, the model was exported into HEC-
HMS project file as shown in Figure (14); this figure shows the schematic representation of the
basin model in HEC-HMS contains the hydrologic elements. After steps of the calibration and
validation, we can have the runoff generated by the model after creating simulation run and view
the results as 740.1 m3/s for 100 Year return period as shown in Figure (15).
Fig. 14:schematic representation of the basin model of Reem in HEC-HMS.

28
Mahmoud Abdelshafy and Alaa Mostafa
Fig. 15: Outlet Hydrograph created by HEC-HMS for 100-year Return period
Hydraulic Modeling using 2D HEC-RAS Model
The most important parameters for the HEC-RAS hydraulic model are geometric and
flow data. The geometric data have been developed by drawing the stream of Wadi Reem system
schematically with flow direction. This was done by using the button of river reach of the HEC-
RAS, the methods explain in details in software manual (U.S. Army Corp of Engineers, 2010).
Flood Depth
The maximum flood depth maps were generated by the 2D model by taking into
consideration the maximum depth for each mesh cell. It is concluded that water levels inside the
existing natural channel inundated and flooded over this channel and the existing natural channel
did not drainage all the water out site the built up and residential area from the north and these
area may be affected by flood as shown in Figure (16).
29
Flash Flood Modeling Using HEC-RAS (2D) model on Wadi Reem in the western region,
Kingdom of Saudi Arabia
Fig. 16: Flood waters depth and flooded areas simulated by HEC-RAS2D model
for 100-year of Reem.
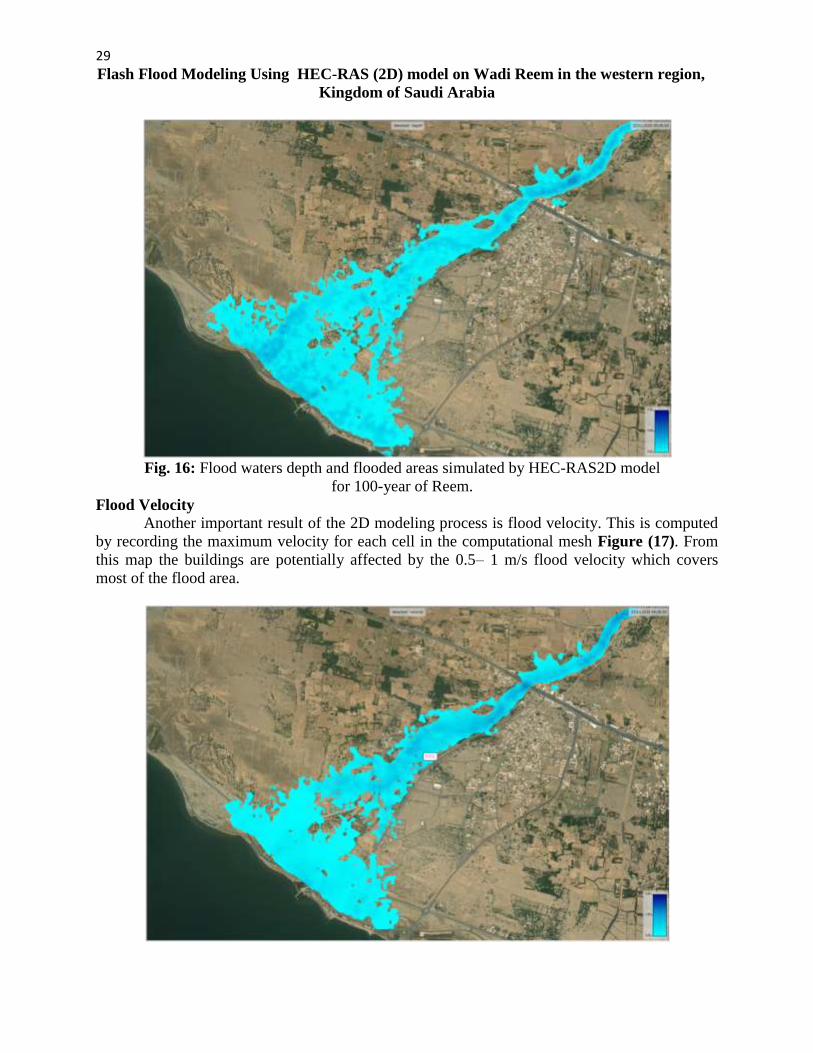
Flood Velocity
Another important result of the 2D modeling process is flood velocity. This is computed
by recording the maximum velocity for each cell in the computational mesh Figure (17). From
this map the buildings are potentially affected by the 0.5– 1 m/s flood velocity which covers
most of the flood area.

30
Mahmoud Abdelshafy and Alaa Mostafa
Fig. 17: Flood velocityderived from HEC-RAS 2D model for 100-year of Wadi Reem.
Flood Hazard Assessment
The flood velocity was not taken in this basin because it is below the limit. To generate
the flood hazard categories, the water depth for each flood extent was classified according to the
Japanese criteria of the Ministry of Land Infrastructure and Transport and the flood hazard map
is shown in Figure (18).it in noticed that the high risk areas are shown in orange color and dark
Blue, these regions are closer to the wadi bed. They are dangerous during floods as the water
level can reach up to 4 m. They mainly occupy the congested areas near the roads.
Fig . (18):Flood Hazard map of Wadi Reem based on flood depth classification according to the
MLIT derived from HEC-RAS 2D modelling.
Conclusion
The study concludes the following; the watershed of Wadi Reem and its stream delineation
process were carried out with the aid of Watershed Modeling System (WMS) software. In the
present study, the CN values found to be 72.72; Hydrologic modeling was carried out by HEC-
HMS program that simulated rainfall-runoff process using curve number model. The HEC-HMS
model was selected because it can investigate the applicability of hydrologic modeling in arid
and semi-arid regions, in order to simulate rainfall-runoff through the employing of HEC-HMS
model using Soil Conservation Services, Curve Number and SCS Unit Hydrograph. For 100-year
return period, hydrograph results indicate that; the hydrograph volume is about 38193654 cubic
meters with a peak discharge of about 740.1 m3/s for Wadi Reem Basin.
This study discusses the implementation of 2D model that shows the flood water depth,
spread, and velocity based on the hydraulic modeling of the HEC-RAS program for urban
developing areas. The study also provides 2D model of the flood water inflow spread, velocity,

31
Flash Flood Modeling Using HEC-RAS (2D) model on Wadi Reem in the western region,
Kingdom of Saudi Arabia
and depth, as these characteristics are not available in the one-dimensional flood water inflow
model.
The results of HE-RAS 2D Model indicated that; the main channel of Wadi Reem basin
has not the capacity to carry the 100-year return period peak flood Hydrograph and the flood
inundated in these wadis with different depths and velocities.
REFERENCES
Aaron, C. and Venkatesh, M. (2009). Effect of topographic data, geometric configuration and
modeling approach on flood inundation mapping. J. Hydrology, 377: 131-142.
Abdel Rahman, A.A. (2006). Hydrogeological and geophysical assessment of the reclaimed
areas in Sohag, Nile Valley, Egypt. Ph.D.Thesis, Geol. Dept., Fac. Sci., Ain Shams
University, Cairo, Egypt.
Abdullah, M.A. and Al-Mazroui, M. (1998). Climatological study of the southwestern region of
Saudi Arabia. I. Rainfall analysis. Climate Res., 9: 213–223.
Aghazadeh, N. and Mogaddam, A.A. (2010). Assessment of groundwater quality and its
suitability for drinking and agricultural uses in the Oshnavieh area, Northwest of Iran. J.
Environ. Protection, 1: 30-40.
Aljerash, M.A. (1985). Climatic subdivisions in Saudi Arabia: an application of principal
component analysis. Int. J. Climatol. 5: 307–323.
Ally, W.M.; Dawdy, D.R. and Schaake, J.C. (1980). Parametric deterministic urban watershed
model. J. Hydraul. Div., ASCE 106(5): 679–690.
Almazroui, M. (1998). Climatological study over the southwestern region of the Kingdom of
Saudi Arabia with special reference to rainfall distribution. M.Sc Thesis, Department of
Meteorology, Faculty of Meteorology, Environment and Arid Land Agriculture, King
Abdulaziz University, Jeddah, Saudi Arabia.
Altaher, A.A. (1994). Drought and human adjustment in Saudi Arabia. Geol. J., 33: 411–422.
Amutha, R. and Porchelvan, P. (2009). Estimation of surface runoff in Malattar sub-watershed
using SCS-CN method. J. Indian Society of Remote Sensing, 37(2): 291–304.
Baoyin, H. and Hailin, Z. (2009). GIS-based risk evaluation for regional disaster. J. Environ.
Technol. and Engin., 2(3): 87-91.
Du, J. ; Qian, L. et al. (2012). Assessing the effects of urbanization on annual runoff and flood
events using an integrated hydrological modeling system for Qinhuai River basin, China.
J. Hydrology, 464:127-139. At: http://folk.uio.no/chongyux/papers_SCI/jhydrol_30.pdf>
Feldman, A.D. (1995). HEC-1 flood hydrograph package, Comput. Models Watershed Hydrol.,
119–150.
Hyfran, M. (1998). Developed by INRS-Eau with Collaboration of Hydro-Québec Hydraulic
Service (Department Hydrology). in the Framework of Hydro-Québec/CRSNG Statistical
Hydrology Chair Located at INRS-Eau. At: http://www.wrpllc.com/books/hyfran.html.
Hydrologic Engineering Centre (2008): HEC-RAS, River Analysis System Hydraulic Reference
Manual.
Hydrologic Engineering Center (2016): HEC-HEC-RAS 5.0 Hydraulic Reference Manual.
Köppen, W. (1936). Das Geographisca System der Klimate. Handbuch der Klimatologie: In:
Köppen, W., Geiger, G. (Eds.), C. Gebr. Borntraeger, Vol. 1, pp. 1–44.
McColl, C. and Aggett, G. (2007). Land-use forecasting and hydrologic model integration for
improved land-use decision support. J. Environ. Mmanag., 84(4): 494-512. At:http://

32
Mahmoud Abdelshafy and Alaa Mostafa
www.sciencedirect.com/ science/article/pii/ S0301479706001915
Ouyang, N.L.; Lu, S.L.; Wu, B.F.; Zhu, J.J. and Wang, H. (2011). Wetland restoration suitability
evaluation at the watershed scale- A case study in upstream of the Yongdinghe River.
Procedia Environmental Science, 10: 1926–1932.
Satheeshkumar, S.; Venkateswaran, S. and Kannan, R. (2017). Rainfall–runoff estimation using
SCS–CN and GIS approach in the Pappiredipatti watershed of the Vaniyar sub basin,
South India. Modeling Earth Systems and Environment, 3(1): 24.
Sindhu, D.; Shivakumar, B.L. and Ravikumar, A.S. (2013). Estimation of Surface Runoff in
Nallur Amanikere Watershed Using Scs-Cn Method, 404–409.
Singh, L.K.; Jha, M.K., and Chowdary, V.M. (2017). Multi- criteria analysis and GIS modeling
for identifying prospective water harvesting and artificial recharge sites for sustainable
water supply. J. Cleaner Production, 142: 1436–1456.
Songara, J. C.; Joshipura, H.T.K.N.M. and Prakash, I. (2015). Estimation of Surface Runoff of
Machhu Dam III Chatchment Area, Morbi, Gujarat, India, using Curve Number Method
and GIS. International Journal of Advance Engineering and Research Development
(IJAERD)3(03): 2038–2043.
Strahler, A.N. (1964). Quantitative geomorphology of drainage basins and channel networks.
Handbook of Applied Hydrology. McGraw HillBook Company, New York, 411.
Subyani, A.; Qari, M.H.; Matsah, M.E.; Al-Modayan, A.A. and Al-Ahmadi, F.S. (2009).
Utilizing remote sensing and GIS techniques to evaluate and reduce hydrological and
environmental hazards in some wadis, western Saudi Arabia. King Abdulaziz City for
Sciences and Technology, Project No. APR 25/101.
Teng, J.; Jakeman, A.J.; Vaze, J.; Croke, B.F.W.; Dutta, D.; Kim, S. (2017). Flood inundation
modelling: A review of methods, recent advances and uncertainty analysis. Environ.
Model. Softw., 90: 201–216.
U.S. Army Corp of Engineers, (2010). River analysis system, “Version 4.1, Hydrology
Engineering Center, Davis CA 95616.
Viji, R.; Prasanna, P.R. and Ilangovan, R. (2015). Modified SCS-CN and Green-Ampt Methods
in Surface Runoff Modelling for the Kundahpallam Watershed, Nilgiris, Western Ghats,
India. Aquatic Procedia, 4: 677–684.
WHO (2020). World Health Organisation - Flood [WWW Document]. URL (accessed 4.29.20).
بالونطقة الغشبية ، الوولكة العشبية السعودية علي وادى سين HEC-RAS (2D) نوزجو هياه السيول باستخذام نوورج
هحوود هحوذ عبذالشافي هحوذ1
عالء هصطفي هحوذ عبذالشحين ، 2
يصش-جبص شئ انجئخ -1
2- (فشع أسط ) لسى انجنجب ثكهخ انؼهو جبؼخ االصش
الوستخلص تحذذ لخ سلى أيك .(WMS)ثشبيج ظبو زجخ انب استخذاو ناد سى يسبساد االدخ ة انحض انبئدساسخ تى
انز حبك ػهخ جشب طل HEC-HMSتى تفز انزجخ انذسنجخ ثاسطخ ثشبيج كب ؛ 72.72نتك (CN)انح
ػبو ، 100ثبنسجخ نفتشح انؼدح انت تجهغ . SCS Hydrographاأليطبس ف انبطك انمبحهخ شج انمبحهخ ثبستخذاو سلى انح حذح
/ يتش يكؼت 740.1 يتش يكؼت يغ رسح تصشف حان 38193654تشش تبئج انذسغشاف إن أ ؛ حجى انذسغشاف حان
تفز رج ثبئ األثؼبد ضح ػك يب انفضب اتشبسب سشػتب ثبء ػه ر انذساسخ يبلشخ تى ف .ثبخ نحض اد انشى
تفش انذساسخ أضب رجب ثبئ األثؼبد التشبس تذفك يب . نبطك انتطش انحضشHEC-RASانزجخ انذسنكخ نجشبيج
-HEأشبسد تبئج رج .انفضب سشػتب ػمب ، حث إ ز انخصبئص غش يتفشح ف رج تذفك يب انفضب أحبد انجؼذ
RAS 2D ػبو انفضب 100 إن أ انمبح انشئسخ نحض اد انشى نس نذب انمذسح ػه حم ذسغشاف رسح انفضب نفتشح
. ػذ بخ اناد ثأػبق سشػبد يختهفخغش يسبحخ ي االساض