
1 CLOs' Trading Activity and Performance Yun Lou HEC Paris ...
52
1 CLOs’ Trading Activity and Performance * Yun Lou HEC Paris 1, Rue de la Libération 78351 Jouy en Josas Cedex, France [email protected] Maria Loumioti USC Leventhal School of Accounting 3660 Trousdale Parkway Los Angeles, CA 90089-0441, US [email protected] Florin P. Vasvari London Business School Regents Park, Sussex Place London, NW1 4SA, U.K. [email protected] April 2014 Preliminary and Incomplete. Please do not quote or distribute without permission. Abstract: We explore the extent to which loan trading by collateralized loan obligations (CLOs), the dominant type of institutional lenders in the syndicated loan market, reveals private information about borrowers and how this trading activity affects CLOs’ future performance. Using detailed CLO trading data, we develop proxies for CLOs’ private information about borrowers and validate these measures by documenting that they predict future loan and borrower performance. Controlling for current performance, we find that our proxy for CLOs’ private information predicts the CLO’s asset quality and market value of assets one year ahead. The positive relation between information–based trading and future performance is higher for CLOs whose managers execute more timely trades and receive higher management fees. However, we find that CLOs with large managers underperform. Our evidence highlights that CLOs not only collect, produce and disseminate private information about loan borrowers but they also actively use this information to trade strategically and enhance their performance. Keywords: Collateralized loan obligations, syndicated loans, private information, market efficiency, sell- side analysts. * We appreciate the helpful comments received from seminar participants at London Business School and USC Leventhal School of Accounting. We gratefully acknowledge the financial support of Labex ECODEC, the London Business School RAMD Fund and the USC Leventhal School of Accounting. We thank Yin Wang for his excellent research assistance. All errors are our own.
-
Upload
khangminh22 -
Category
Documents
-
view
2 -
download
0
Transcript of 1 CLOs' Trading Activity and Performance Yun Lou HEC Paris ...

1
CLOs’ Trading Activity and Performance *
Yun Lou
HEC Paris
1, Rue de la Libération
78351 Jouy en Josas Cedex, France
Maria Loumioti
USC Leventhal School of Accounting
3660 Trousdale Parkway
Los Angeles, CA 90089-0441, US
Florin P. Vasvari
London Business School
Regents Park, Sussex Place
London, NW1 4SA, U.K.
April 2014
Preliminary and Incomplete. Please do not quote or distribute without permission.
Abstract: We explore the extent to which loan trading by collateralized loan obligations (CLOs), the dominant type
of institutional lenders in the syndicated loan market, reveals private information about borrowers and
how this trading activity affects CLOs’ future performance. Using detailed CLO trading data, we develop
proxies for CLOs’ private information about borrowers and validate these measures by documenting that
they predict future loan and borrower performance. Controlling for current performance, we find that our
proxy for CLOs’ private information predicts the CLO’s asset quality and market value of assets one year
ahead. The positive relation between information–based trading and future performance is higher for
CLOs whose managers execute more timely trades and receive higher management fees. However, we
find that CLOs with large managers underperform. Our evidence highlights that CLOs not only collect,
produce and disseminate private information about loan borrowers but they also actively use this
information to trade strategically and enhance their performance.
Keywords: Collateralized loan obligations, syndicated loans, private information, market efficiency, sell-
side analysts.
* We appreciate the helpful comments received from seminar participants at London Business School and USC
Leventhal School of Accounting. We gratefully acknowledge the financial support of Labex ECODEC, the London
Business School RAMD Fund and the USC Leventhal School of Accounting. We thank Yin Wang for his excellent
research assistance. All errors are our own.

2
1. Introduction
In August 2013, five regulatory bodies, including the Securities Exchange Committee (SEC),
re-proposed credit risk retention rules under the Dodd–Frank Act on Collateralized Loan
Obligations (CLOs), which require CLO collateral managers to hold CLO securities with a value
equal to at least 5 percent of the fair value of the CLO.1 While the risk retention rule intends to
align CLO investors’ and collateral managers’ interests by restricting lax credit standards and
risk shifting to low quality loans, the re-proposal has raised significant concerns by collateral
managers, banks and the US Chamber of Commerce.2 Indeed, the Loan Syndicate and Trading
Association (LSTA) asserts that this rule will result in a reduction of CLO issuance by 75 percent
which will increase interest costs for companies by $3.2 billion (LSTA, 2013). The LSTA posits
that CLO managers already maintain “skin in the game” by actively managing CLOs through the
life of the securitization, and because they are required to meet strict performance standards.
In this paper, we attempt to contribute to this discussion by exploring how CLOs deal
with credit risk in their portfolio and which CLO characteristics predict effective risk
management. CLO managers use their experience in collateral sourcing, credit research and risk
management to generate significant private information on the quality and performance of a
syndicated loan and the issuing borrower. In addition, they are entitled to receive proprietary
information from borrowers as a result of their membership in bank lending syndicates. Although
1 CLOs are special purpose vehicles typically set up by an investment bank that transfers a pool of syndicated loans
to the balance sheet of the CLO. The CLO finances itself by issuing notes and equity to capital markets. These notes
are divided into different classes (i.e., tranches) with each tranche entitled to different levels of interest payments
and exposures to losses in the collateral loan pool. CLOs have been the largest buyers of speculative grade (or
leveraged) corporate loans with a market share of above 50 percent over the last few years: Standard and Poor’s
(2014) indicates that CLOs have been investing annually in syndicated loans about $100 billion before the credit
crisis and over $50 billion after the crisis. 2 For example, in March 2014 the US Chamber of Commerce in its letter to SEC argues that “the proposed risk
retention rule could hamper the future formation of collateral loan obligations (CLO) and consequently raise
financing costs for businesses” and “call(s) regulators to reconsider the proposed rule and work with the industry to
develop a form of risk retention that would work for CLOs.” Thirty–one leveraged borrowers, including Community
Health, HCA, and West Corporation, signed the letter.

3
prior work has provided significant evidence on the quality of securitized loans (Benmelech,
Dlugosz and Ivashina, 2012), there is no empirical evidence on whether CLO managers’
informational advantage enhances the effectiveness of their credit management activities and
determines CLOs’ future performance. We measure the extent to which CLOs’ trading activities
reveal private information about borrowers and investigate how CLO managers use their
proprietary information flow to enhance CLOs’ future performance.
We overcome the empirical challenge of capturing CLOs’ use of private information and
when this information is released by using a novel dataset which provides details on the trading
activities initiated by CLOs in the secondary loan market. The data allows us to observe the
exact date as well as the size and the direction of a trade (i.e., a sale or purchase of a syndicated
loan). It also provides monthly information on important characteristics of the CLOs, the CLO
manager and the CLOs’ portfolio structure and credit quality. Our sample includes 1,233 unique
syndicated loans, issued by 720 US public companies, which are actively traded by CLOs
between 2008 and 2013 and have loan specific data available.
We expect that CLO collateral managers trade strategically and their activity reveals
significant private information about the loan issuing firms. CLOs have been historically the
dominant institutional investor in the corporate loan market thus allowing their managers to
acquire private information on a large and diversified pool of borrowers. They are likely to use
this information when trading to improve the performance of the CLOs they manage and obtain
higher fees. Also, unlike other institutional investors in the syndicated loan market, CLO
managers obtain unrestricted access to the full set of information provided by the borrower to the
lead bank in the syndicate due to the fact that most CLOs do not invest in public securities.3
3 Lead banks typically require material non-public information on an ongoing basis, such as company projections
and future earnings. Banks in the syndicate together with CLOs that only invest in loans are bound by confidentiality

4
Moreover, some of the CLO managers are backed by large private equity firms giving them
access to these firms’ screening, transactional and operational expertise. Such access increases
CLO managers’ information set on a significant proportion of the loans in the CLO pools,
especially on the leveraged loans which finance private equity transactions.
However, several factors are likely to limit the informativeness of CLO trades. First,
CLO managers might struggle to timely and efficiently process the large amount of information
they receive. A CLO includes a large number of loans issued by 100 to 150 loan issuers from 15-
25 industries and the average CLO manager controls 16 CLO vehicles. Second, CLO managers
might have limited access to private information relative to loan originating banks. The
informational advantage of the lead banks in a syndicate over junior syndicate participants,
including CLOs, has been highlighted by prior work (e.g., Sufi, 2007; Ball, Bushman and
Vasvari, 2008). This advantage is often due to banks’ long-term relations with borrowers or
related to banks’ incentives in disposing low quality loans to securitized loan pools. Thus, CLO
collateral managers may “free-ride” on banks’ information collection and monitoring effort
without conducting their own search to root out credit problems early. Third, previous studies
suggest that CLO managers may primarily rely on loan ratings issued by credit rating agencies
when trading individual loans or managing the credit risk of the loan portfolio instead of
engaging in their own screening and information collection activities (e.g., Benmelech, Dlugosz
and Ivashina, 2012; Ayotte and Bolton, 2009; Benmelech and Dlugosz, 2009). These ratings
reflect the judgment and analysis of rating agencies which have developed common rating
agreements and have access to additional information that can be used to perform credit analysis and manage
portfolios (e.g., Coffey, 2007). Institutional investors that participate in syndicated loans but also invest in public
markets receive only a subset of the borrower information available. If these investors are involved in the origination
or renegotiation of a loan, then trading restrictions are enforced with respect to that loan or borrower (“Chinese
walls” should be in place between teams that are involved in the loan origination/amendment and trading teams).
Also, these institutional investors are restricted from trading on borrower’s stock for a certain time period.
5
methodologies for corporate loans.4 Finally, CLO managers might just trade loans for liquidity
reasons, to pass collateral quality tests and covenants, without relying on borrower specific
information. In sum, these arguments indicate that CLOs might be less sophisticated and
informed lenders, raising questions whether CLO managers actively trade syndicated loans based
on private information.
We start our analysis by measuring the private information underlying CLO trades. We
develop predictive models of CLOs’ decision to either purchase or sell a syndicated loan where
we control for public information available prior to the trade date such as recent changes in the
credit quality of the loan traded or the borrower, violations of CLO covenants, traded loan
characteristics, borrower stock returns prior to the loan trading month, debt market conditions as
well as CLO manager, month and industry fixed effects. We aggregate the residuals of these two
models, which are at the CLO-loan-month level, at either the loan-month or CLO-month level
depending on our analyses. Our first private information proxy captures the total private
information released at the CLO-month level and is the sum of the absolute residuals in the
purchase and sale predictive models. Our second measure is the difference between the residual
in the sales model minus the residual in the purchase model and reflects the extent of bad private
information underlying the trade. Negative private information is likely to be more relevant to
investors in the syndicated loan market given their asymmetric payoffs (e.g., Easton, Monahan
and Vasvari, 2009). 5
4 Credit rating agencies correlate the rating categories they use with the banks’ internal credit rating systems while
taking into account the loan underwriting criteria and loan’s unique characteristics (Kohler, 1998). 5 Consistent with our expectations, the residuals from the loan sale and purchase predictive models are negatively
correlated (-0.40), suggesting that CLO loan trades reveal either good or bad information for borrowers in a given
month. Also, the standard deviation of private information on a loan is 0.06, thus, does not significantly vary across
CLOs in a given month.

6
We provide a battery of tests to validate our private information proxies. First, we find
that CLOs are more likely to trade during the 30-day period before borrowers announce their
quarterly earnings performance. Second, we document that our proxy for bad private
information, which captures the direction of the information, predicts future changes in the
performance of the loan traded and is positively (negatively) associated with future loan rating
downgrades (upgrades), defaults and price decreases. We also find that this proxy for private
information predicts borrower’s subsequent profitability and interest coverage ratio, controlling
for current performance. Overall, these analyses indicate that our empirical measures capture
private information about the borrower that is available to CLO managers on a timely basis in
advance of public disclosures.
In our next set of analyses, we investigate whether CLOs’ private information and
timeliness of trading is positively related to CLO future performance. We focus on two
performance dimensions of a CLO: the riskiness of the loan collateral pool and the changes in
the market value of the loan portfolio. We first document that CLOs that trade on more private
information have fewer loans in default or in the very risky CCC rated group, greater collateral
cushions for the senior and junior notes and better average loan ratings one year ahead.
Similarly, CLOs that trade on more private information have greater market value one year
ahead. We also find that CLOs that trade more timely relative to other CLOs trading the same
loans during the same month, show better performance one year ahead (higher quality and
market value of the loan pool). Also, the positive relation between the private information used
to trade and future performance metrics is stronger when a CLO trades more timely.
We further investigate whether the impact of private information-based trading on future
performance is a function of CLO manager’s characteristics. We first look at CLO managers’

7
level of sophistication which we proxy by the level of senior and junior fees paid to the manager.
We expect that managers that charge higher fees have greater reputation and sophistication
relative to the other managers. We find that CLO managers that receive higher fees outperform
one year ahead and, most importantly, show incremental performance improvements when
trading on more private information. We also assess whether the magnitude of assets under
management affects CLO managers’ performance and find that large manager deals
underperform consistent with their limited ability to process the large information set about their
borrowers. Also, we do not find any evidence that the assets under management impact the
association between private information underlying CLO trades and future CLO performance.
Our findings add to the current literature across few dimensions. First, we provide and
validate novel measures of proprietary information about borrowers which suggest that CLOs are
trading timely on information that is not available to public market participants. We thus
contribute to the prior research on price discovery mechanisms in equity markets (Acharya and
Johnson, 2007; Bushman, Smith and Wittenberg-Moerman, 2010), by offering direct evidence
on the importance of CLOs’ trading activities as a source of private information for equity
markets. Further, while previous studies have documented that institutional investors that are
members of lending syndicates use borrowers’ proprietary information to trade in stock markets
(e.g., Massoud et al., 2011; Ivashina and Sun, 2011), we show that CLOs use private information
in the syndicated loan market to trade strategically and enhance their performance. In particular,
our study complements Bushman, Smith and Wittenberg-Moerman (2010) who show that early
access to private information by syndicate lenders accelerates price discovery in the stock
market. We add to their study by identifying direct measures that capture both the timing of the
release and the extent of private information that CLO managers possess. In addition, our

8
findings suggest that capturing the directional effect of the private information released by CLO
trades could significantly improve the success of an equity trading strategy relying on this
information.
Second, our research provides unique evidence on the determinants of CLOs’
performance. According to a report by JP Morgan (Laughlin, 2013), CLO equity holders
received annual returns of 17 percent over the period from 2006 to 2011. Similarly, Standard and
Poor’s (2014) highlights that CLOs have experienced solid performance over the last 20 years
reporting only small losses.6 Despite this impressive performance statistics, there is no empirical
evidence we are aware of that investigates drivers of these returns. We demonstrate that one
reason why some CLO vehicles perform well is their informational advantage relative to other
investors in the syndicated loan market. Our results highlight that CLO managers are actively
managing their portfolio risks by taking advantage of the private information they possess. We
also provide new evidence on CLO manager’s characteristics that are associated with better
performance. Overall, we do not find support of lax credit management standards by CLOs
whose trades reveal more private information about borrowers. We provide evidence that
managers of these CLOs focus on maximizing asset quality and minimizing credit risk exposure
and are able to effectively deal with credit problems before they are reflected in loan ratings and
prices.
The rest of the paper is organized as follows. Section 2 provides an overview of CLO
trading activities and strategies. Section 3 describes the data and sample selection. Section 4
describes our proxy for CLO private information and presents the validation tests. Section 5
presents the research design and the results. Section 6 concludes the paper.
6 According to Loan Syndications and Trading Association and Bloomberg, CLO net losses accounted for less than
6% during the 2008-2010 credit crisis, and only 1% of the underlying CLO collateral defaulted.

9
2. Institutional background on CLOs and their trading activities
A cash flow collateralized loan obligation (CLO) is a structured finance product that invests
in a diversified pool of highly leveraged, non-investment grade corporate loans (“CLO assets or
loans”) and issues multiple classes of notes (“CLO notes”) collateralized by the cash payments
generated from these loans. Given this structure, CLOs allow banks to enhance credit risk
exposure, manage their balance sheet and reduce regulatory capital requirements.
Structuring a CLO involves several key periods. In the first stage, an investment bank or
commercial bank with an investment arm (“CLO arranger”) enters into an agreement with an
investment management firm (“CLO collateral manager”) to structure the CLO vehicle and
syndicate the underlying loan pool. During the pre-closing period, the arranging bank together
with the CLO collateral manager initiates the “warehousing” process. Warehousing may involve
the purchase of leveraged loans from the open market or the transfer of a loan portfolio from the
bank’s balance sheet. Warehousing takes place prior to the CLO closing date and, very often, the
loan pool acquisition is financed using a bridge facility from the sponsoring bank. The CLO set
up process is often completed after the CLO closing date (i.e., the date the CLO becomes
effective) and the issuance of the CLO notes.
Next follows the “ramp-up period” which can last between 60 and 180 days. In this
period, the CLO arranger contacts credit rating agencies to evaluate the credit risk of the
corporate loan pool used as collateral and confirm the rating and pricing of the CLO notes and
equity tranches issued to outside investors. Some forms of credit enhancement in a CLO
structure are necessary to obtain the desired credit ratings for the most highly rated notes issued.
The types of credit enhancements used by CLOs are essentially “internal” credit enhancements
provided by the underlying assets themselves via subordination, asset diversification, excess

10
spread, cash collateral accounts, debt cushion and interest coverage, however, CLOs might also
rely on external parties to provide financial guarantees. CLO notes typically have different
interest rates and projected weighted average lives, thus, different credit ratings to appeal to
different investors’ risk preferences.
Once a CLO structure becomes effective, it enters the “reinvestment period,” which
usually lasts between five to seven years (the average life of a typical CLO is about twelve
years). During this period, the cash flows received from interest and principal repayments or loan
sales can be reinvested by purchasing additional loans. CLO managers are expected to actively
manage the credit risk of their portfolio and use their discretion in trading loans both to take
advantage of relative value opportunities but also to realize capital gains in relation to the
evolving credit quality of the loans in the pool. There are certain significant constraints that limit
a CLO’s flexibility to trade. First, a CLO can trade only up to twenty percent of the portfolio par
value per year, which alleviates investors’ reinvestment risks related to asset substitution.
Second, CLO managers’ trading decisions are constrained by certain covenants and compliance
tests, which determine the minimum value and quality of the underlying assets based on loan
ratings from credit rating agencies (Appendix A). Finally, the remaining years in a CLO’s life
cover the “amortization period” during which all cash flows received are used to pay down CLO
notes. Some anecdotal evidence suggests that even after the CLO reinvestment period ends, CLO
managers keep changing the portfolio structure and reinvest (e.g., Barclays Capital, 2002).
CLO managers receive flat senior management fees, paid before the most senior tranche
of debt receives a return or is paid, and junior management fees which are paid after the debt
tranches are paid but before the equity tranche. One of the junior management fees (i.e., the
incentive fee) is typically paid only once the equity tranche achieves a certain hurdle rate. This
11
fee incentivizes the CLO manager to deliver a minimum level of returns to the equity investors.
Violation of CLO’s compliance tests is a sign of a drop in the collateral quality and will likely
have negative consequences with respect to the returns obtained by junior classes of CLO note
investors and equity holders.7 It also affects negatively CLO managers’ reputation and, to some
extent, their compensation. As a result, CLO managers may seek to maintain a high level of
diversification and asset quality throughout the reinvestment period (exposures to different
borrowers, industries, regions or types of loans) to limit the impact of defaults in the pool that
trigger covenant violations.
In sum, CLO managers can use discretion in the implementation of their investment
objectives by determining the loans sold and purchased, timing transactions, choosing the quality
of the collateral and deciding whether a defaulted loan should be worked out or not. Thus, the
expertise and quality of a CLO manager is a key determinant of the magnitude of investors’
returns.
3. Data and Sample selection
We hand-collect data on securitized CLO loans from the CLO-i database provided by
Creditflux. Creditflux is a global news platform covering structured investment issuance and
performance in the corporate loan market since January 2008. Creditflux retrieves this
information from monthly CLO trustee reports that disclose CLO vehicles and collateral
performance to investors. We focus on three datasets that CLO-i covers: CLO monthly holdings,
CLO monthly performance and CLO transactions.
7 The major or controlling equity holders can ask the CLO trustee to require the manager to liquidate collateral
assets and thus can force a payback. They can also request liquidation of the entire CLO portfolio. However, in
distressed markets, when the covenants are more likely to be violated, the market value of the collateral assets is
significantly below their par value making investors reluctant to force a suboptimal liquidation.
12
Our primary dataset of CLO holdings includes 7,723 unique borrowers, 571 CLOs and
5,791,930 observations at the CLO-loan tranche-reporting month level covering the period from
January 2008 to December 2013.8 The average CLO size is $400 million, and the average CLO
exposure to an individual securitized corporate loan is less than one percent. The average
coverage length of a CLO in our sample is 38 months. CLO-i provides complete information on
CLO managers, bank arrangers, closing and reinvestment dates, CLO notes and monthly
collateral portfolio structures. The data on CLO collateral portfolio structure cover borrowers’
names as well as loan types, ratings, balances, maturities and default events.
The CLO monthly performance dataset includes information on compliance tests for 536
unique CLO vehicles, such as senior and junior overcollateralization tests, weighted average
rating factors as well as CCC-rated and default loan buckets. CLO-i provides detailed
information on covenant triggers that allows us to estimate compliance test violations.
The dataset of CLO transactions covers 355,250 loan sales and purchases initiated by 539
CLOs from January 2008 to December 2013. These are not unique loan-date transactions since
CLOs may sell tranches of the same loan to different institutional investors or buy tranches of the
same loan within the same day or short window from different sellers. We omit multiple sales or
purchases of the same loan from a CLO that occur within a four-day window, and are left with
302,233 unique trades. Data on CLO transactions cover loan or tranche characteristics, the trade
direction, the transaction date, the face amount and the price.
To identify syndicated loans and obtain details on loan and borrower characteristics, we
hand match CLO-i with LPC DealScan and Compustat. This process yields a sample of 3,557
unique syndicated corporate loans issued by 2,018 unique borrowers. When we require complete
8 CLO-i does not provide unique identifiers for loan tranches. Coding loan tranches at the borrower – loan type
(primary and/or secondary) – loan maturity level yields between 47,160 (lower bound) and 133,541 (upper bound)
unique loan tranches. CLOs in our sample hold less than five percent of their assets in bond securities.

13
information on loan ratings and that the borrower is a publicly listed firm, our sample drops to
1,882 unique loans (938 unique borrowers). This process restricts our CLO holdings sample to
1,174,334 observations at the CLO-loan-reporting month level. We merge our CLO holdings
sample with the population of CLO trades and exclude 649 loans that are never traded in the
period 2008-2013 or are not uniquely identified in the CLO transaction dataset. Since loan trade
and CLO portfolio reporting dates are different, we match loan trades to the most recent portfolio
reporting date after the actual trading date. Our final sample of CLO monthly holdings includes
1,233 loans issued by 720 publicly listed borrowers in the period between January 2000 and
March 2013 and held by 536 unique CLO vehicles (1,106,584 observations at the CLO-loan-
month level). Our sample of CLO trades includes 123,045 unique transactions (80,916 purchases
and 42,129 sales). While our sample selection criteria significantly restrict the number of
observations, our final sample includes 66 percent of the securitized corporate loan volume
disclosed by CLOs in trustees’ reports. We summarize the sample selection process in Table 1,
Panel A.
Panel B of Table 1 reports univariate statistics for securitized loan trading and holdings.
The average loan is traded 6 times per month, i.e. tranches or sub-tranches of the same loan are
traded six times per month. The average CLO trades about 9 times per month. The mean
(median) loan amount traded is $1.5 (1) million per transaction, the mean (median) selling price
is 94.6 (99.8) and the mean (median) purchase price is 96.6 (99.1), suggesting that CLOs sell
loans that underperform and buy better quality loans, i.e. loans that trade closer to par. The mean
(median) holding period of a loan in a CLO portfolio is 10 (7) consecutive months, and the mean
(median) CLO includes 93 (90) loans in its monthly portfolio.

14
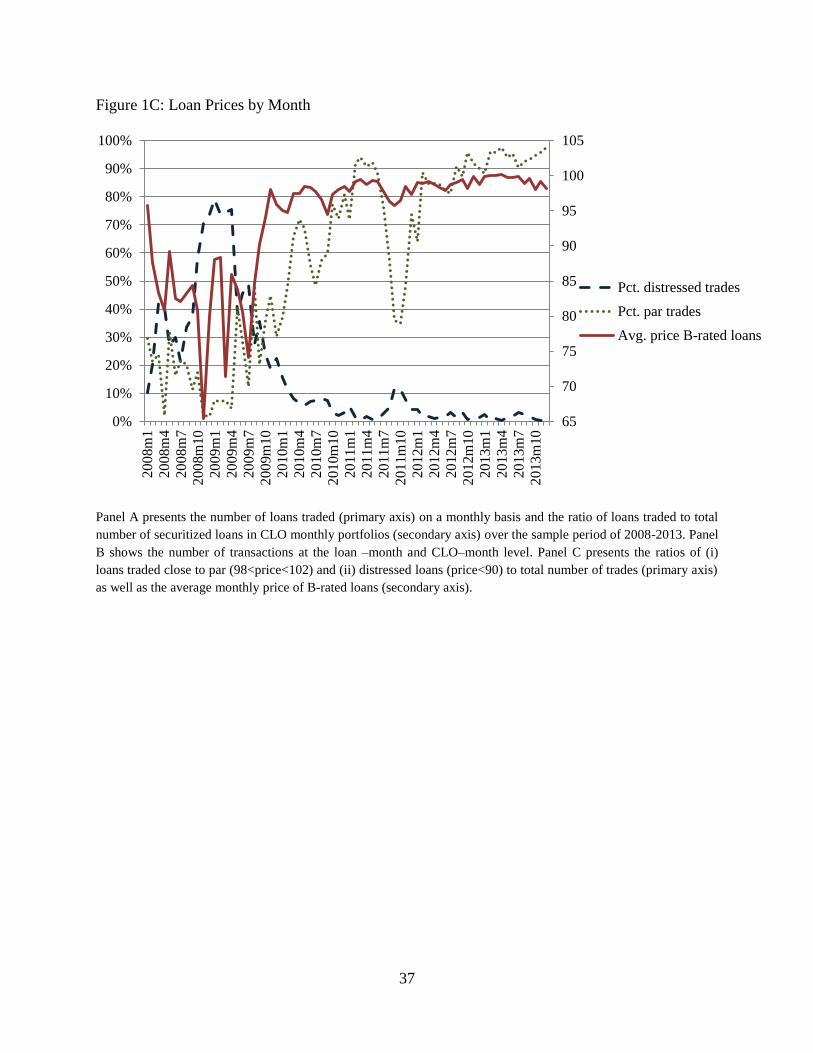
Figure 1 shows CLOs’ trading behavior over time. Fifty-two percent of the loans in our
sample are traded on average every month. Loan trading by CLOs is relatively stable over time,
but drastically drops around August 2011 and August 2012 in response to the low liquidity of
financial institutions and the heightened concerns about a potentially severe market crash caused
by the European sovereign credit crisis. Loan pricing has significantly increased over our sample
period with eighty percent of securitized loans trading at distress levels during the credit crisis
(i.e. loans priced below 90) and about ninety percent of loans trading close to par in the
following years (i.e., loans priced above 98 and below 102).
4. Proxy for CLO private information and Validation tests
4.1. CLO private information
We attempt to capture CLOs’ private information by exploring their trading activity at the
CLO–loan–month level. We develop a probabilistic model of a CLO’s decision to sell or buy
securitized loans where we control for a comprehensive set of characteristics about loans,
borrowers and CLOs as well as conditions in the syndicated loan market:
Probability(Sale= 1)= α + β1*Loan Rating +β2*Loan Rating Downgrades_180dayslag
+β3*Loan Rating Upgrades_180dayslag +β4*Borrower
Defaults_180dayslag + β5*Distressed Loan +β6*CLO WARF Violation
+β7*CLO OC Violation +β8*CLO CCC Bucket +β9*CLO Manager FE
+β10*Δ(Borrower CFO)q-5,q-1 +β11*Δ(Borrower Leverage)q-5,q-1
+β12*Loan Spread +β13*Loan Maturity +β14*Loan Financial Covenants
+β15*Stock Returns_180dayslag +β16*Bid-ask spread_180dayslag
+β17*Industry FE +β18*Month FE
(Model 1a)

15
Probability(Purchase= 1)= α + β1*Loan Rating +β2*Loan Rating Downgrades_180dayslag
+β3*Loan Rating Upgrades_180dayslag +β4*Borrower
Defaults_180dayslag + β5*Distressed Loan +β6*CLO WARF Violation
+β7*CLO OC Violation +β8*CLO CCC Bucket +β9*CLO Manager FE
+β10*Δ(Borrower CFO)q-5,q-1 +β11*Δ(Borrower Leverage)q-5,q-1
+β12*Loan Spread +β13*Loan Maturity +β14*Loan Financial Covenants
+β15*Stock Returns_180dayslag +β16*Bid-ask spread_180dayslag
+β17*Industry FE +β18*Month FE
(Model 1b)
The dependent variable Sale (Purchase) is a binary variable that equals one if a loan is
sold (purchased) by a CLO in the month, and zero if a loan is kept by the CLO (if the manager of
a CLO manages loans from a borrower in another CLO vehicle, but decided not to purchase
these loans).
We use various proxies for observed loan performance and riskiness. First, we control for
loan rating in the reporting month prior to the loan trade (Loan Rating) as a proxy for loan
riskiness. The rating is defined as the most conservative loan rating among S&P, Moody’s or
Fitch ratings and we set it equal to 1 for AAA, the highest rating, and 25 for D the lowest rating
in our sample. Second, we use past loan performance captured by loan rating downgrades
(Previous Loan Rating Downgrades) or upgrades (Previous Loan Rating Upgrades). These
variables take the value one if the loan was downgraded (or upgraded) by two or more notches in
the 180-day period before the CLO reporting month with the loan trade, and zero otherwise. We
also control for past borrowers’ defaults on their securitized loans (Previous Borrower Defaults),
defined as one if a borrower defaulted on his securitized loans in the 180-day period before the
CLO reporting month with the loan trade, and zero otherwise. Third, we control for loan price,
defined as one if the loan was priced below 90, and zero otherwise (Distressed Loan). We expect
that the probability of loan sales is positively (negatively) related to previous loan rating
downgrades (upgrades), defaults and distress. Also, we expect that the probability of a loan

16
purchase is negatively (positively) related to previous loan rating downgrades and defaults
(upgrades and distress).
We control for CLO’s performance using CLO compliance test violations
(overcollateralization and the weighted average rating factor) and portfolio credit risk in the CLO
reporting month. More specifically, the overcollateralization test violation measure is defined as
a binary variable that equals one if the senior overcollateralization test is violated in the reporting
month, and zero otherwise (CLO OC Violation). We use the weighted average rating factor
(WARF) violations to proxy for the collateral quality test compliance, which is defined as a
binary variable that equals one if the portfolio weighted-average rating is above the WARF
trigger, and zero otherwise (CLO WARF Violation). Further, we use the percentage of CCC-rated
loans in the CLO portfolio in the reporting month as a proxy for portfolio credit risk (CLO CCC
Bucket). We expect that the probability of a loan sale will be positively related to compliance test
violations and the percentage of CCC-rated loans in a CLO’s portfolio. Finally, CLO manager’s
portfolio management objectives and philosophy significantly affect CLO’s trading strategy. We
attempt to capture these different qualitative characteristics across CLOs in our model by
including CLO manager fixed effects.
We also expect that CLO managers’ secondary trade activity is influenced by
developments in the primary loan market, such as institutional loan issuance and demand
pressure. We attempt to capture primary loan market characteristics over time in our model by
including month fixed effects.
We use two proxies for borrower’s financial performance: (i) the change in operating
cash flows to total assets (Borrower CFO) between the last fiscal quarter prior to the CLO

17
reporting month and four quarters before, and (ii) the change in total liabilities to total assets
(Borrower Leverage) between the last fiscal quarter prior to the CLO reporting month and four
quarters before. We expect that loans issued by borrowers with deteriorating financial
performance are more likely to be sold by CLOs. We control for CLOs’ trading on public signals
using two proxies to capture borrowers’ public information environment and transparency: (i)
market-adjusted stock returns in the 180 days period prior to the loan trade (Stock
Returns_180dayslag), and (ii) the average daily bid-ask equity spread in the 180 days period
prior to the loan trade (Bid–ask spread_180dayslag).
Finally, we control for the following loan characteristics: (i) the natural logarithm of loan
maturity in months (Loan Maturity), (ii) the natural logarithm of the original loan LIBOR-spread
(Loan Spread), and (iii) the number of financial or net worth covenants (Loan Financial
Covenants). A detailed description of the variables we use in our predictive models of loan
trading is included in Appendix A.
Panel A of Table 3 reports the results of the tests on the determinants of CLO loan sales
and purchases. Consistent with our expectations, we find that loan rating, past loan performance
and CLO compliance tests are important drivers of collateral managers’ decision to sell or
purchase a loan, suggesting that collateral managers are more likely to sell underperforming
loans. In addition, collateral managers are likely to trade by selling distressed loans. We find no
statistically significant evidence that borrowers’ public information environment and
transparency affect collateral managers’ decision to buy or sell a loan. Overall, the results
suggest that CLO managers use their discretion in selling off bad quality loans to manage credit
risk in line with the interests of CLOs’ investors.

18
Using the residuals from Model 1a and Model 1b, we develop two variations of the proxy
for CLO private information. First, we aggregate the absolute values of the residuals at the CLO-
month level to proxy for total private information that a CLO acquires in a reporting month
(CLO Private Information –Total Information). To alleviate the concern that our proxy is driven
by the size of the CLO, we deflate total private information by the number of loans held in the
CLO’s monthly portfolio (CLO Private Information –Total Information by collateral). Second,
since high values of the residual from Model 1a (1b) reflects bad (good) news arrival, we
develop a proxy for the direction of private information (good vs. bad news) by subtracting from
the residual in Model 1a the residual from Model 1b (CLO Private Information –Bad news).
High positive values in CLO Private Information –Bad news reflect bad information arrival,
whereas low negative values in CLO Private Information –Bad news reflect good information
arrival. We then average the CLO Private Information –Bad news at the loan–month and
borrower–quarter level when running validation tests predicting future loan and borrower
performance.9
Panel B of Table 3 reports the summary statistics for our CLO private information
proxies. The mean (median) total information at the CLO–month level is 54.7 (51.5), while when
we deflate total information to the number of loans in the CLO collateral monthly portfolio the
mean (median) total information by collateral asset is 0.74 (0.77). The mean (median) CLO
private information at the loan–month level is -0.03 (0.05), suggesting that while CLO trading
activity reveals good information on securitized loans there is significant variation in the type of
private information that CLOs own or acquire from borrowers.
9 The standard deviation of CLO private information –Bad news at the loan–month level is 0.06. Moreover, current
month private information for a loan predicts 70 percent of the variation of next month’s private information,
suggesting that our proxy does not significantly varies across CLOs and by month.

19
Finally, an important point is that we do not attempt to delineate key channels that CLOs
use to acquire private information. While CLOs will have access to borrowers’ private
information as participants in the loan syndicate, CLOs are likely to use alternative proprietary
channels to acquire private information and root out credit problems before they are reflected in
loan prices and ratings.
4.2. Proxy validation
To validate our proxy for CLO private information we test whether it predicts future loan
and borrower performance. We use several proxies for loan performance: (i) a binary variable
that equals one if the loan rating was downgraded by two or more notches within a 90-day period
after the CLO reporting month, and zero otherwise (Future Loan Rating Downgrade), (ii) a
binary variable that equals one if the loan rating was upgraded by two or more notches within a
90-day period after the CLO reporting month, and zero otherwise (Future Loan Rating
Upgrade), (iii) a binary variable that equals one if the borrower defaulted on the loan within a
90-day window after the CLO reporting month, and zero otherwise (Future Loan Default), and
(iv) the difference between the loan price in the 90 days period following the trade date minus
the price on the trade date, divided by the loan price on the trade date (Future Loan Returns). We
employ two proxies for borrower’s financial performance: (i) the operating income (EBITDA) to
total assets in the fiscal quarter immediately after the CLO trade quarter (ROAq+1), and (ii) the
interest coverage defined as operating income (EBITDA) to interest expense in the fiscal quarter
immediately after the CLO trade quarter (Interest Coverageq+1).
Panel A of Table 4 reports the results of the tests on the relation between CLO private
information and future loan performance. We find that our proxy for bad news arrival predicts
20
future loan downgrades and upgrades, defaults and loan returns after controlling for loan rating,
previous rating changes, borrower’s financial performance and loan characteristics. More
specifically, an increase by one standard deviation in our proxy for CLO private information
increases (decreases) the probability of a material loan rating downgrade (upgrade) by 1 percent
(1.6 percent). The unconditional probability of a material loan rating downgrade (upgrade) in the
90 day period after the trade reporting month is 10 percent (6 percent). If a loan rating is
downgraded by two or more notches in the period before the trade, the probability of a material
loan rating downgrade (upgrade) in the future increases (decreases) by 13 percent (9 percent).
Moreover, we find that our proxy for CLO private information predicts future loan defaults,
controlling for past loan performance. An increase by one standard deviation in our proxy for
bad news arrival increases the probability of a loan default in the 90 day period after the trade by
1 percent. The unconditional probability of a loan default is 4 percent. Finally, our proxy for bad
news arrival predicts future loan returns: an increase by one standard deviation in our proxy for
bad news arrival decreases future loan returns by 0.2 percent. The mean value of loan returns in
the 90 day period after the trade is 1.3 percent. We control for net sales in our specifications,
defined as total monthly loan sales minus purchases that could be considered as an alternative
proxy for CLO private information. The assumption is that a loan being purchased more times
than sold is a signal of good news arrival. However, we find that our proxy for CLO private
information is likely a better measure for CLO private information.
Panel B of Table 4 reports the results of the tests on the relation between CLO private
information and borrower’s future financial performance. We find that our proxy for CLO
private information revealing bad news for borrowers predicts the next two quarters’ return on
assets and interest coverage. An increase by one standard deviation in our proxy for bad news

21
arrival decreases next quarter’s ROA and interest coverage by 0.3 and 0.1 percent respectively.
The mean ROA and interest coverage is 2 percent and 1.3. An increase by one standard deviation
in our proxy for bad news arrival decreases ROA and interest coverage two quarter’s after the
CLO trade by 0.4 and 0.1 percent.
Finally, in support of the results above, we find that CLOs’ trading clusters in the 30 day
period prior to quarterly earnings announcements (see Figure 2). This finding suggests that CLOs
obtain and exploit private information about borrowers before some of it publicly disclosed via
earnings announcements. Overall, the tests in this section provide strong evidence consistent
with the residuals from the predictive models on CLO trading capturing CLOs’ private
information about borrowers.
5. Research design and Results
5.1. Research Design for CLO performance tests
To test whether CLOs’ trade informativeness predicts future CLO performance we use an
OLS model, where the dependent variable is CLO performance one year ahead.
CLO Performancem+12 = α + β1*CLO Total Informationm +β2*CLO Private Information –Bad
Newsm +β3*Default Bucketm +β4*CCC Bucketm +β5*JnrOCm
+β6*SnrOCm +β7*WARFm + β8*Month FE
(Model 2)
The variable of interest is CLO Total Information, defined as the sum of the absolute
values of the residuals from Model 1a and 1b at the CLO–month level divided by the number of
loans in the collateral portfolio. The coefficient of interest is β1, and we expect CLO total
22
information to be positively related to CLO future performance. We control for the direction of
the news (good vs. bad) to alleviate the concern that our primary effect of interest is driven by
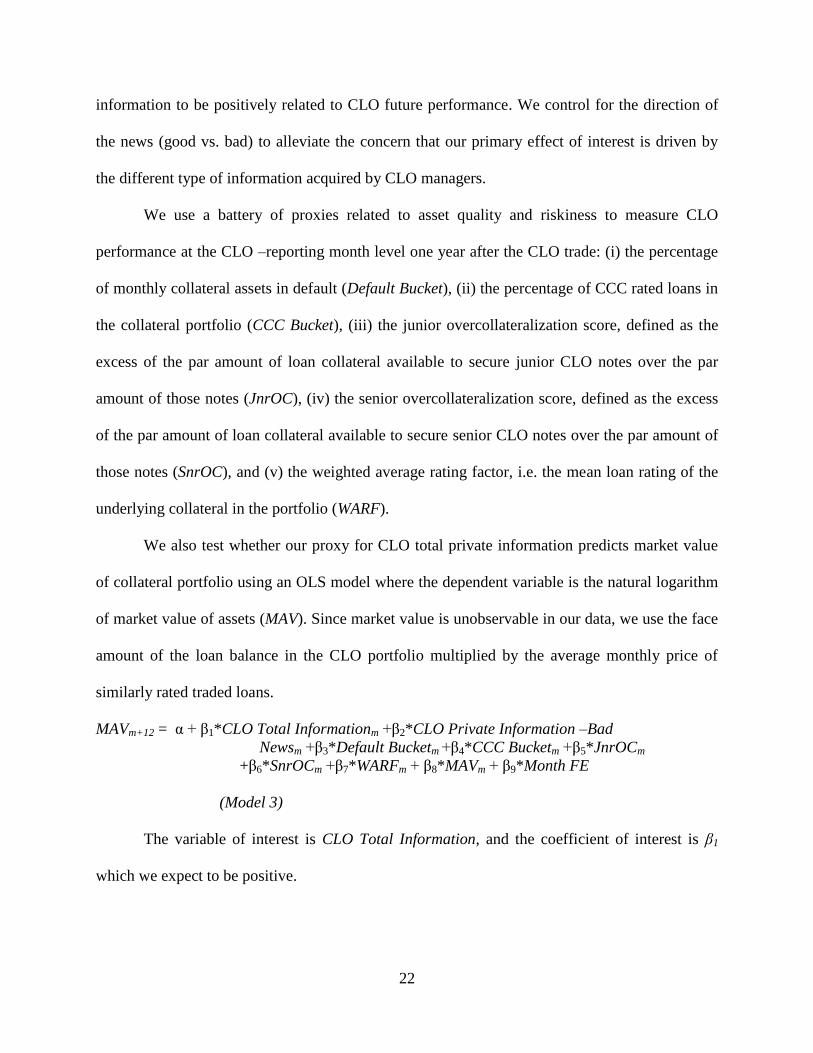
the different type of information acquired by CLO managers.
We use a battery of proxies related to asset quality and riskiness to measure CLO
performance at the CLO –reporting month level one year after the CLO trade: (i) the percentage
of monthly collateral assets in default (Default Bucket), (ii) the percentage of CCC rated loans in
the collateral portfolio (CCC Bucket), (iii) the junior overcollateralization score, defined as the
excess of the par amount of loan collateral available to secure junior CLO notes over the par
amount of those notes (JnrOC), (iv) the senior overcollateralization score, defined as the excess
of the par amount of loan collateral available to secure senior CLO notes over the par amount of
those notes (SnrOC), and (v) the weighted average rating factor, i.e. the mean loan rating of the
underlying collateral in the portfolio (WARF).
We also test whether our proxy for CLO total private information predicts market value
of collateral portfolio using an OLS model where the dependent variable is the natural logarithm
of market value of assets (MAV). Since market value is unobservable in our data, we use the face
amount of the loan balance in the CLO portfolio multiplied by the average monthly price of
similarly rated traded loans.
MAVm+12 = α + β1*CLO Total Informationm +β2*CLO Private Information –Bad
Newsm +β3*Default Bucketm +β4*CCC Bucketm +β5*JnrOCm
+β6*SnrOCm +β7*WARFm + β8*MAVm + β9*Month FE
(Model 3)
The variable of interest is CLO Total Information, and the coefficient of interest is β1
which we expect to be positive.

23
We explore cross-sectional variations in the relation between CLO private information
and future performance focusing on timeliness of trades and collateral manager’s reputation and
size. We focus on CLO WARF, Senior OC, market asset value and default bucket as proxies for
CLO performance. We proxy timeliness of trades with a binary variable that equals one if the
CLO trades on average before the median trading date in a calendar month, and zero if it trades
after this date (Timeliness of Trades). We expect that CLOs with more private information that
execute more timely trades will outperform their peers. We use the sum of collateral manager’s
junior and senior management fees as proxy for CLO reputation (Total Fees). We expect that
CLOs with more informative trades run by reputable managers will outperform their peers, since
managers will have higher incentives to conduct due diligence on the underlying loan pool and
acquire proprietary information. We use the natural logarithm of total CLOs’ principal balance
managed by a collateral manager as proxy for CLO manager size (Assets under Management).
We expect that large manager CLOs with more informative trades will outperform their peers,
since managers are likely to have greater experience and have developed more private
information channels in the corporate loan market.
5.2 Summary statistics
Table 2 reports the summary statistics for the variables used in the estimation of CLO
private information, in the validation tests of our proxy for CLO private information, and in the
analyses of CLOs’ future performance. The mean (median) probability of a loan sale and
purchase is 0.04 (0.00) and 0.09 (0.00) respectively, suggesting that the CLO portfolio structure
is relatively stable over time. The mean (median) loan rating is B (B), the mean (median)
LIBOR-spread is 296 b.p. (308 b.p.) while the mean (median) loan maturity is approximately 6
(6.1) years. The average number of financial covenants is 2.14 for the loans in our sample.

24
Consistent with credit rating agencies’ becoming more conservative during the recent
financial crisis, loan rating downgrades are more frequent than loan rating upgrades in our
sample, with 19 and 11 percent (10 and 6 percent) of securitized loans on average being
downgraded and upgraded respectively by two or more notches in the 180-day period preceding
CLO trades (in the 90-day period following a CLO trade). Further, the mean (median)
probability of a borrower’s default is 0.10 (0.00) during the 180-day period before the CLO trade.
As a result of the recent financial turmoil, 34 (38) percent of the CLOs in our sample violated the
senior overcollateralization (WARF) compliance test. The mean (median) percentage of CCC-
rated loans in a CLO portfolio is 0.07 (0.06). In terms of borrower specific information, the
average size of the companies in our sample is $2.5 billion. The mean (median) return on assets
is 0.02 (0.02), the mean (median) interest coverage is 1.32 (0.54), the mean (median) quarterly
leverage is 0.83 (0.84) while the mean (median) market-to-book value of equity is 3.74 (5.00).
Thus, the average borrower in our sample is highly leveraged and exhibits low profitability. The
mean (median) volatility of operating cash flows is 0.35 (0.38).
In terms of CLO performance metrics, the mean (median) percentage of loans in the
defaulted and the risky CCC-rated bucket is 2 percent and 7 percent (1 percent and 6 percent)
respectively. The mean (median) senior overcollateralization, i.e. cash flows in excess of the par
value of CLO senior notes, is 11 percent (10 percent) while the mean (median) junior
overcollateralization, i.e. cash flows in excess of the par value of CLO junior notes, is 4 percent
(3 percent). The mean (median) weighted average rating score is 2601 (2598) and the mean
(median) fair value of CLO assets is $257 million ($205 million). The mean (median) managers’
fees are 53 basis points (50 basis points), which consists of senior fees of 30-40 basis points and
junior fees of 10-20 basis points. The mean (median) collateral managers’ assets under

25
management are $6.7 billion ($5.9 billion). Finally, the probability of a CLO’s trading timely in
advance of other CLOs is 33 percent.
Untabulated univariate correlations between the CLO total private information proxy and
CLO performance metrics suggest that our proxy is negatively correlated to future percentage of
CCC-rated loans (-0.16) and loans in default in the collateral portfolio (-0.35) as well as to the
WARF score (-0.28). Our proxy is positively correlated to future junior and senior
overcollateralization score (0.08 and 0.29 respectively) and to CLO fair asset value (0.10).
Moreover, our proxy for total private information is positively correlated to collateral managers’
fees (0.05) and trading timeliness (0.09) and negatively correlated to collateral manager’s size (-
0.02).
5.3 CLO performance results
Panel A of Table 5 presents the results for tests on the relation between CLO private
information and the quality and riskiness of loans owned by CLOs one year ahead. In the first
two columns, we use the percentage of defaulted and CCC rated loans in the loan portfolio to
proxy for the quality of collateralized assets. We find that a higher level of private information
leads to a lower percentage of defaulted and CCC rated loans at one year ahead. This is
consistent with the argument that CLOs use private information to their own advantage by
trading strategically and reducing the riskiness of loans in their portfolios. In the next two
columns, we investigate whether the total amount of private information affects the junior and
senior overcollateralization score at one year ahead. The coefficient of Total Information is
positive and insignificant for the test on junior overcollateralization score, however, its
coefficient is positive and statistically significant when the senior overcollateralization score is

26
used as the dependent variable (p–value<0.01). In the last column, we find that the total amount
of private information is also negatively related to CLOs’ weighted average rating factor at one
year ahead, suggesting that CLOs actively use private information to improve the credit quality
of the loans in their portfolios. Interestingly, the coefficient of CLO Private Information –Bad
News is insignificant throughout our specifications, suggesting that managers are able to
effectively manage credit risks, i.e. it is the total amount of private information rather than the
direction of private information that predicts future CLO performance.
Panel B of Table 5 reports the results for the effect of CLO private information on the
market value of loans managed by CLOs one year ahead. We find that the amount of total private
information that CLOs trade on is positively associated with the market value of their loans at
one year ahead. An increase by one standard deviation in the total amount of private information
increases by 3 percent portfolio market value one year ahead, suggesting that CLOs’ trading on
private information increases investors’ returns. Overall, our results suggest that CLOs use their
informational advantage to enhance their performance.
5.4 CLO performance and Timeliness of trades
Table 6 reports the results for the tests on the effect of the timeliness of trading on CLOs’
future performance. Similar to Table 5, we use the quality and the market value of loans
managed by CLOs to proxy for CLO performance. We find that CLOs executing more timely
trades exhibit lower portfolio riskiness and higher asset value and quality one year ahead. More
importantly, when we interact Total Information with Timeliness of Trading, we find that the
effect of private information on CLOs’ future performance is stronger for CLOs that also trade

27
fast on their information, suggesting that timing trading decisions further allows CLOs to benefit
from their informational advantage.
5.5 CLO performance and CLO manager’s characteristics
We investigate the extent to which CLO collateral managers’ reputation and size
determine the relation between private information and future CLO performance. We expect that
more sophisticated and reputable CLO managers, i.e. managers that receive higher fees, are
likely to exert greater effort in collecting private information and trade on their informational
advantage. Moreover, we expect that large manager CLOs are likely to outperform their peers
and trade on more private information, since their managers have greater experience and access
to multiple information channels.
Table 7 presents the results for the tests on the relation between collateral managers’ fees,
private information and CLO future performance. The results suggest that CLOs that offer higher
management fees have lower percentage of defaulted loans, greater senior overcollateralization
score and asset quality and higher asset market value. In addition, we find that management fees
amplify the effect of CLOs’ private information on future performance, presumably because
managers have higher incentives to collect, verify and trade on private information about their
borrowers, thus, enhance CLO performance. The findings are consistent with the fact that senior
and junior fees are likely to provide strong incentives to CLO managers to prevent the
deterioration of credit quality of the non-equity tranches of CLOs (Jacobs and Radomyslsky,
2012).
Table 8 reports the results for the tests on the relation between collateral manager’s size,
CLO private information and its future performance. The variable Assets under Management is

28
the size of CLO vehicles managed by collateral managers. CLO managers that are trusted with
larger CLO vehicles are more likely to collect and trade on private information to enhance future
CLO performance, thus, their reputation. However, our findings suggest that large manager
CLOs underperform their peers, presumably because these managers are less likely to timely
collect and process private information for a large and highly diversified set of loans and
borrowers. Also, the coefficient of the interaction term between Total Information and Assets
under Management is insignificant throughout all columns. Thus, we provide evidence that
collateral managers managing a small number of CLOs are more likely to exhibit higher
performance and trade strategically using their informational advantage.
5.6 Robustness tests
We perform a series of robustness tests to investigate the sensitivity of our main results.
First, we use the net number of notch changes in loan ratings (notch upgrades minus
downgrades) to proxy for loan rating downgrades and upgrades. Second, we control for S&P
credit-watch issues (“positive”, “negative”, and “no material change”) from Capital IQ that
proxy for borrowers’ future credit outlook. Third, we split our sample in trades during the credit
downturn (2008-2010) and trades in the credit upturn (2011-2013) to alleviate any bias from the
different levels of risk tolerance that investors and collateral managers had in these periods.
Finally, our results hold when we derive our proxies for CLO private information after
controlling for CLO fixed effects in Model 1. Overall, we find that our results remain similar
after performing all these tests.

29
6. Conclusions
In this paper, we explore the extent to which CLOs, the most important type of institutional
investors in the leveraged loan market, trade on borrower–specific private information and
whether their trading activity predicts future CLO performance. We overcome the empirical
challenge of capturing private information and when this information is released by using a novel
dataset which provides complete information on CLO monthly portfolio holdings, CLO
compliance tests and loan transactions. While we expect that CLO managers are likely to trade
strategically and use their informational advantage to generate higher investors’ returns, CLOs’
highly diversified and large structures, overreliance on credit ratings and on banks’ monitoring
effort are likely to deter CLO managers from collecting or timely trading on private information.
We develop predictive models of CLOs’ decision to either purchase or sell an individual
loan where we control for observable loan, CLO and borrower performance in the period before
the trade. We use the residuals from the predictive models and we develop two proxies for
private information: bad news arrival and total information available. We validate our proxies
and find that our proxy for bad news private information predicts future deterioration in loan
ratings, defaults and prices. Further, our proxy for private information related to bad news
predicts worse future borrower’s financial performance, controlling for current performance. In
addition, we find that CLOs are more likely to trade in the 30-day period before quarterly
earnings announcements. We then explore the effect of trading on private information on future
CLO performance, proxied by asset quality and riskiness. We find that total private information
predicts higher future CLO performance one year ahead controlling for current performance, and
this effect is greater for CLOs that trade more timely, offer higher management fees and are
managed by small investment management firms.

30
Overall, we provide evidence that CLOs trade strategically on private information and
use their informational advantage to enhance their performance and comply to covenant tests.
However, there is significant cross-sectional variation in CLO characteristics that determine the
relation between trading on private information and future performance. Interestingly,
management fees and collateral managers’ scope play a significant role in how effectively
managers deal with credit risk. The findings add to the debate on the recently introduced risk
retention requirements by CLO managers, showing that CLOs use their informational advantage
to comply to covenant tests and effectively manage the credit risk of their portfolios. Also,
market–driven mechanisms, such as management fees, are likely to mitigate moral hazard
between investors and collateral managers.
Our study has certain limitations. While we provide evidence consistent with the
interpretation that CLOs’ trading activities capture private information about borrowers over
future loan and borrower performance, we cannot directly observe whether CLO managers
acquired this information directly from loan lead arrangers, used alternative means of acquiring
such information, or they uncover this information through a more superior analysis of publicly
available information compared to other investors. While we try to delineate channels of private
information acquisition by controlling for CLO’s reputation and sophistication, we refrain from
making suggestions on the source of the private information that CLOs use when trading in the
secondary loan market. In addition, since data coverage starts in 2008, we cannot observe CLO
trades during the securitization boom. While we attempt to provide evidence on the trades during
the economic upturn between 2011 and 2013, we will not be able to infer that CLO trading
activities were informative during the credit bubble, when CLO managers had more incentives to
speculate.

31
References
Acharya, V. V., Johnson, T. C., 2007. Insider Trading in Credit Derivatives. Journal of Financial
Economics 84 (1), 110–141.
Ayotte, K., Bolton, P., 2009. Covenant Lite Lending, Liquidity and Standardization of Financial
Contracts. Working paper.
Ball, R., Bushman, R.M., Vasvari, F.P., 2008. The Debt-Contracting Value of Accounting
Information and Loan Syndicate Structure. Journal of Accounting Research 46 (2), 247–287.
Benmelech, E., Dlugosz, J., 2009. The Alchemy of CDO Credit Ratings. Journal of Monetary
Economics 56, 617-634.
Benmelech, E., Dlugosz, J., Ivashina, V., 2012. Securitization without Adverse Selection: The
Case of CLOs. Journal of Financial Economics 106 (1), 91–113.
Bushman, R.M., Smith, A.J., Wittenberg-Moerman, R., 2010. Price Discovery and
Dissemination of Private Information by Loan Syndicate Participants. Journal of Accounting
Research 48 (5), 921–972.
Easton, P.D., Monahan, S.J., Vasvari, F.P, 2009. Initial Evidence on the Role of Accounting
Earnings in the Bond Market. Journal of Accounting Research 47 (3), 721-766
Ivashina, V., Sun, Z., 2011. Institutional Demand Pressure and the Cost of Corporate Loans.
Journal of Financial Economics 99 (3), 500–522.
Ivashina, V., Sun, Z., 2011. Institutional Stock Trading on Loan Market Information. Journal of
Financial Economics 100 (2), 284–303.
Jacobs, A., Radomyslsky, E., 2012. Primer and Analysis of U.S. CLO Fees – Part 1. Moody’s
Analytics Research White Paper.
Kohler, K., 1998. Collateralized Loan Obligations: A Powerful New Portfolio Management Tool
for Banks. Mayer, Brown & Platt.
Laughglin, L.S., 2013. A Boom-time Debt Product is Back with a Vengeance. CNNMoney.

32
Massoud, N., Nandy, D., Saunders, A., Song, K., 2011. Do Hedge Funds Trade on Private
Information? Evidence from Syndicated Lending and Short-selling. Journal of Financial
Economics 99 (3), 477-499.
Standard &Poor's, 2014. A Guide to the US Loan Market -Leveraged Commentary.
Sufi, A., 2007. Information Asymmetry and Financing Arrangements: Evidence from Syndicated
Loans. The Journal of Finance 62 (2), 629–668.
The Barclays Capital CDO and Structured Funds Group. March 2002. Guide to Cash Flow
Collateralized Debt Obligations.

33
APPENDIX A
Glossary for CLO terms
CCC bucket: Percentage of loans in the CLO portfolio rated as CCC by certified rating
agencies.
Collateral: Highly leveraged syndicated loans in CLO portfolio whose cash flows are used as
collateral to CLO bonds. Also referred to as “CLO assets.”
Interest coverage: Ratio of the amount of interest collected from a CLO’s loan assets to the
amount of interest due on a note class and the note classes senior to it. The ratio is computed for
each class of notes issued by the CLO.
Overcollateralization (OC): The excess of the par amount of loan collateral available to secure
one or more classes of notes over the par amount of those notes. For each note class, the OC ratio
is estimated as the ratio of the par amount of a CLO’s assets to the outstanding par amount of
that note class and the note classes senior to it.
WAS (Weighted average spread): Weighted average of the loan spreads over LIBOR with the
weights being the loan par amounts.
Waterfall: Sequence in which payments must be made to the holders of various note classes and
to other parties in the CLO. The payments are usually separated into collections from interest and
collections from principal. Payments are made first from interest and then from the loan principal
if collections from interest are insufficient. When interest coverage tests are breached, the
priority of payments changes to divert any available cash to either pay down the notes or reinvest
in collateral until all interest coverage tests are met. The typical sequence of payments in a CLO
waterfall schedule in the order or priority is as follows: taxes (if any), administrative expenses,
trustee fee, senior management fee, senior note holders, mezzanine note holders, subordinated
note holders, subordinated management fee, equity investors.
WARF (Weighted averaged recovery rating factor): It is a collateral quality test calculated
based on the loan recovery ratings assigned by credit rating agencies on the loans that are
included in the underlying CLO collateral base. The collateral manager needs to meet a
minimum average recovery rate which is greater than or equal to the number set forth at the time
of the CLO setup.
Weighted average maturity: It is a collateral quality test calculated based on the loans’
amortization schedule which captures the expected remaining average life of the collateral pool,
and not the legal final maturity. The expected remaining average life may change significantly,
due to changes in interest rates or the performance of the underlying collateral. The collateral
manager needs to make sure that, on the measurement date, the weighted average maturity of the
collateral interests is less than a stated maturity (typically of five years or less).

34
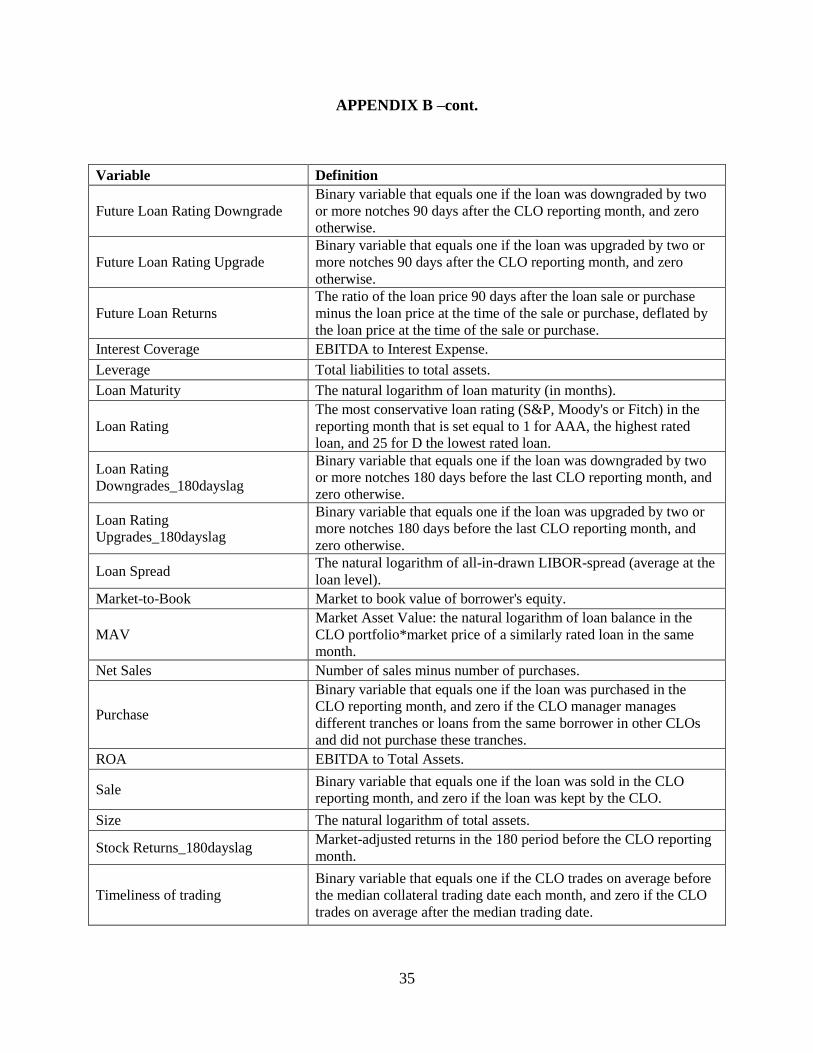
APPENDIX B
Variable Definition
Variable Definition
Assets under Management The natural logarithm of CLOs’ total principal balance managed by
the same collateral manager.
Bid-ask spread_180dayslag The average bid-ask spread in the 180 period before the CLO
reporting month.
Borrower D(CFO) The difference in operating cash flows to total assets between the
quarter before CLO reporting date and four quarters before.
Borrower D(Leverage) The difference in total liabilities to total assets between the quarter
before CLO reporting date and four quarters before.
Borrower Defaults_180dayslag
Binary variable that equals one if the borrower defaulted on
securitized loans 180 days before the last CLO reporting month, and
zero otherwise.
Cash Flow Volatility The standard deviation of operating cash flows in the previous four
fiscal quarters to total assets.
CLO CCC Bucket The percentage of CCC rated loans that the CLO reports (by
reporting month).
CLO Default Bucket The percentage of defaulted loans that the CLO reports (by reporting
month).
CLO Jnr OC CLO junior overcollateralization score in the reporting month.
CLO OC Violation
Binary variable that equals one if the CLO violated the
overcollateralization compliance test in the reporting month, and zero
otherwise.
CLO Private Information -Bad
News
The average (Residual Model 1+(-Residual Model 2)) from CLOs
decision to trade a loan in a certain month.
CLO Private Information -Total
News Abs(Residual Model 1)+Abs(Residual Model 2)
CLO Private Information -Total
News by collateral
[Abs(Residual Model 1)+Abs(Residual Model 2)]/ number of loans
in the CLO monthly portfolio.
CLO Snr OC CLO senior overcollateralization score in the reporting month.
CLO WARF CLO weighted average rating factor in the reporting month.
CLO WARF Violation Binary variable that equals one if the CLO violated the WARF
compliance test in the CLO reporting month, and zero otherwise.
Total Fees Senior plus Junior Fees.
Distressed Loan Binary variable that equals one if the loan was traded below 90 at the
reporting month, and zero otherwise.
Financial Loan Covenant The number of loan financial covenants (incl. net worth covenants).
Future Loan Default
Binary variable that equals one if the borrower defaulted on the loan
in a 90 day period after the CLO reporting month, and zero
otherwise.
35
APPENDIX B –cont.
Variable Definition
Future Loan Rating Downgrade
Binary variable that equals one if the loan was downgraded by two
or more notches 90 days after the CLO reporting month, and zero
otherwise.
Future Loan Rating Upgrade
Binary variable that equals one if the loan was upgraded by two or
more notches 90 days after the CLO reporting month, and zero
otherwise.
Future Loan Returns
The ratio of the loan price 90 days after the loan sale or purchase
minus the loan price at the time of the sale or purchase, deflated by
the loan price at the time of the sale or purchase.
Interest Coverage EBITDA to Interest Expense.
Leverage Total liabilities to total assets.
Loan Maturity The natural logarithm of loan maturity (in months).
Loan Rating
The most conservative loan rating (S&P, Moody's or Fitch) in the
reporting month that is set equal to 1 for AAA, the highest rated
loan, and 25 for D the lowest rated loan.
Loan Rating
Downgrades_180dayslag
Binary variable that equals one if the loan was downgraded by two
or more notches 180 days before the last CLO reporting month, and
zero otherwise.
Loan Rating
Upgrades_180dayslag
Binary variable that equals one if the loan was upgraded by two or
more notches 180 days before the last CLO reporting month, and
zero otherwise.
Loan Spread The natural logarithm of all-in-drawn LIBOR-spread (average at the
loan level).
Market-to-Book Market to book value of borrower's equity.
MAV
Market Asset Value: the natural logarithm of loan balance in the
CLO portfolio*market price of a similarly rated loan in the same
month.
Net Sales Number of sales minus number of purchases.
Purchase
Binary variable that equals one if the loan was purchased in the
CLO reporting month, and zero if the CLO manager manages
different tranches or loans from the same borrower in other CLOs
and did not purchase these tranches.
ROA EBITDA to Total Assets.
Sale Binary variable that equals one if the loan was sold in the CLO
reporting month, and zero if the loan was kept by the CLO.
Size The natural logarithm of total assets.
Stock Returns_180dayslag Market-adjusted returns in the 180 period before the CLO reporting
month.
Timeliness of trading
Binary variable that equals one if the CLO trades on average before
the median collateral trading date each month, and zero if the CLO
trades on average after the median trading date.

36
Figure 1
Loan Trading and Loan Prices
Figure 1A: Loan Trading by Month
Figure 1B: Number of Trades by Loan
0%
10%
20%
30%
40%
50%
60%
70%
80%
0
50
100
150
200
250
300
350
400
450
20
08m
1
2008m
5
2008m
9
2009m
1
2009m
5
2009m
9
2010m
1
2010m
5
2010m
9
2011m
1
2011m
5
2011m
9
2012m
1
2012m
5
2012m
9
2013m
1
2013m
5
2013m
9
Loans traded by month
Pct of universe that trades
0
2
4
6
8
10
12
14
16
2008m
1
2008m
5
2008m
9
2009m
1
2009m
5
2009m
9
2010m
1
2010m
5
2010m
9
2011m
1
2011m
5
2011m
10
2012m
2
2012m
6
2012m
10
2013m
2
2013m
6
2013m
10
Transactions by loan/month
Transactions by CLO
deal/month
37
Figure 1C: Loan Prices by Month
Panel A presents the number of loans traded (primary axis) on a monthly basis and the ratio of loans traded to total
number of securitized loans in CLO monthly portfolios (secondary axis) over the sample period of 2008-2013. Panel
B shows the number of transactions at the loan –month and CLO–month level. Panel C presents the ratios of (i)
loans traded close to par (98<price<102) and (ii) distressed loans (price<90) to total number of trades (primary axis)
as well as the average monthly price of B-rated loans (secondary axis).
65
70
75
80
85
90
95
100
105
0%
10%
20%
30%
40%
50%
60%
70%
80%
90%
100%20
08m
1
20
08m
4
20
08m
7
2008m
10
20
09m
1
20
09m
4
20
09m
7
2009m
10
20
10m
1
20
10m
4
20
10m
7
2010m
10
20
11m
1
20
11m
4
20
11m
7
2011m
10
20
12m
1
20
12m
4
20
12m
7
2012m
10
20
13m
1
20
13m
4
20
13m
7
2013m
10
Pct. distressed trades
Pct. par trades
Avg. price B-rated loans

38
Figure 2
CLO Trading around Quarterly Earnings Announcements
Figure 2 presents the frequency of CLO trading activity around quarterly earnings reporting date for a sample of
123,045 unique transactions of 1,233 loans issued by 720 unique borrowers.
0
1,000
2,000
3,000
4,000
5,000
6,000
7,000
(-60,-50] (-50,-40] (-40,-30] (-30,-20] (-20,-10] (-10,0] (0,10] (10,20] (20,30]
CLO Sales around 10Qs
0
2,000
4,000
6,000
8,000
10,000
12,000
(-60,-50] (-50,-40] (-40,-30] (-30,-20] (-20,-10] (-10,0] (0,10] (10,20] (20,30]
CLO Purchases around 10Qs

39
Table 1
Sample Selection and Descriptive Statistics
Panel A: Sample selection
Number of observations by CLO
reporting month
Number of
unique trades Number of loans
CLO-i universe 5,791,930 302,233
CLO-i –DealScan merge 3,644,767 190,736 3,557
CLO-i –DealScan –
Compustat merge 1,106,584 123,045 1,233
Panel B: Descriptive statistics on CLO portfolio holdings and trading activity
Variables (per month) N Mean S.D. Min 0.25 Median 0.75 Max
Loan holdings
CLO principal amount (in $m) 536 399.56 299.37 26.14 143.00 400.50 500.00 3,529.75
Number of loans in CLO portfolio 1,106,582 92.93 36.86 21.00 67.00 90.00 113.00 241.00
Mean holding period (months) 1,106,582 9.89 9.38 1.00 2.00 7.00 15.00 41.00
Loan trading
Number of trades by loan 1,106,582 5.89 10.04 0.00 0.00 3.00 8.00 38.00
Number of sales by loan 1,106,582 2.11 3.26 0.00 0.00 1.00 3.00 12.00
Number of purchases by loan 1,106,582 3.78 6.89 0.00 0.00 1.00 5.00 26.00
Number of trades by a CLO 1,106,582 8.48 6.19 0.00 5.00 9.00 13.00 45.00
Number of sales by a CLO 1,106,582 3.06 3.38 0.00 1.00 2.00 5.00 13.00
Number of purchases by a CLO 1,106,582 5.42 4.46 0.00 3.00 4.00 10.00 17.00
Mean face amount –Sales (in $m) 42,129 1.47 1.37 0.08 0.50 1.00 2.00 6.28
Mean price –Sales 42,129 95.70 8.28 71.50 96.00 99.75 100.00 101.00
Mean face amount –Purchases (in
$m) 80,916 1.56 1.36 0.08 0.55 1.00 2.00 6.28
Mean price -Purchases 80,916 96.79 5.57 71.50 96.13 99.13 100.00 101.00

40
Table 2
Summary Statistics
Panel A: Predictive model
Variable N Mean S.D. Min P25 Median P75 Max
Sale 1,106,582 0.04 0.19 0.00 0.00 0.00 0.00 1.00
Purchase 892,005 0.09 0.29 0.00 0.00 0.00 0.00 1.00
Loan Rating 1,106,582 14.74 2.22 1.00 14.00 15.00 15.00 25.00
Loan Rating Downgrades_180dayslag 1,106,582 0.19 0.39 0.00 0.00 0.00 0.00 1.00
Loan Rating Upgrades_180dayslag 1,106,582 0.11 0.25 0.00 0.00 0.00 0.00 1.00
Borrower Defaults_180dayslag 1,106,582 0.10 0.13 0.00 0.00 0.00 0.00 1.00
Distressed Loan 1,106,582 0.11 0.31 0.00 0.00 0.00 0.00 1.00
CLO WARF Violation 1,106,582 0.38 0.48 0.00 0.00 0.00 1.00 1.00
CLO OC Violation 1,106,582 0.34 0.47 0.00 0.00 0.00 1.00 1.00
CLO CCC Bucket 1,106,582 0.07 0.06 0.00 0.03 0.06 0.10 3.61
Borrower D(Leverage) 1,106,582 0.00 0.09 -0.27 -0.03 -0.01 0.02 0.28
Borrower D(CFO) 1,106,582 0.01 0.05 -0.15 -0.02 0.00 0.02 0.12
Loan Spread 1,106,582 5.69 0.35 3.86 5.42 5.73 5.93 6.40
Loan Maturity 1,106,582 4.26 0.17 1.79 4.20 4.29 4.37 5.58
Financial Loan Covenants 1,106,582 2.14 1.10 0.00 2.00 2.00 3.00 7.00
Stock Returns_180dayslag 1,106,582 0.02 0.15 -0.59 0.02 0.02 0.02 0.61
Bid–ask spread_180dayslag 1,106,582 -3.17 1.20 -6.46 -3.54 -3.54 -2.10 0.60

41
Panel B: Validation tests
Variable N Mean S.D. Min 0.25 Median 0.75 Max
Future Loan Default 36,795 0.04 0.32 0.00 0.00 0.00 0.00 1.00
Future Loan Rating Downgrade 36,795 0.10 0.25 0.00 0.00 0.00 0.00 1.00
Future Loan Rating Upgrade 36,795 0.06 0.37 0.00 0.00 0.00 0.00 1.00
Future Loan Returns 36,795 1.32 7.01 -24.00 0.90 2.35 3.50 18.00
Interest Coverage 8,449 1.32 2.57 -1.74 -0.34 0.54 2.28 6.82
ROA 10,683 0.02 0.01 -0.02 0.02 0.02 0.02 0.10
Leverage 10,683 0.83 0.19 0.45 0.76 0.84 0.84 1.40
Net Sales (by month) 36,795 -0.76 4.07 -21.00 -1.00 0.00 0.00 8.00
Net Sales (by quarter) 10,683 -1.82 6.99 -23.00 -2.00 0.00 0.00 10.00
Cash Flow Volatility 10,683 0.35 0.13 0.10 0.27 0.38 0.38 0.70
Market-to-Book 10,683 3.74 1.73 0.00 1.92 5.00 5.00 5.00
Assets 10,683 7.91 0.83 6.15 7.72 7.93 7.96 9.81

42
Panel C: CLO performance
Variable N Mean S.D. Min 0.25 Median 0.75 Max
CCC Bucket 7,345 0.07 0.05 0.01 0.04 0.06 0.10 0.18
Junior OC 7,345 0.04 0.04 0.01 0.02 0.03 0.05 0.17
Senior OC 7,345 0.11 0.06 0.03 0.08 0.10 0.13 0.32
Default Bucket 7,345 0.02 0.03 0.00 0.00 0.01 0.04 0.09
WARF 7,345 7.87 0.16 4.36 7.80 7.87 7.94 9.75
Collateral Manager's Fees 5,350 0.53 0.1 0.20 0.50 0.50 0.50 1.00
Assets under Management 7,345 8.50 0.89 5.70 7.88 8.59 9.30 9.59
MAV 8,756 5.07 0.44 2.67 4.78 5.05 5.33 6.60
Timeliness of trading 7,467 0.33 0.47 0.00 0.00 0.00 1.00 1.00
Variables are described in Appendix B. The values of continuous variables are winsorized at 1% and 99%.

43
Table 3
CLO Collateral Transactions – Predictive Model
Panel A: Securitized loan sales and purchases – predictive model
Sale Purchase
Variable dF/dx z-stat. dF/dx z-stat.
Loan Rating 0.005 *** 12.60 -0.021 ***
-16.67
Loan Rating Downgrades_180dayslag 0.009 *** 3.95 -0.006 ***
-2.73
Loan Rating Upgrades_180dayslag -0.005 -1.21 -0.001 0.67
Borrower Defaults_180dayslag 0.019 *** 3.97 0.002
1.58
Distressed Loan 0.011 *** 4.22 -0.033 ***
3.89
CLO WARF Violation -0.001 -1.45 -0.011 *** -8.63
CLO OC Violation 0.004 *** 6.48 0.004 ***
3.84
CLO CCC Bucket 0.012 *** 2.61 0.005
0.48
Borrower D(Leverage) -0.005 -0.48 0.084 ***
2.46
Borrower D(CFO) -0.022 * -1.89 -0.004
-0.08
Loan Spread -0.010 *** -2.93 -0.007
-0.99
Loan Maturity -0.010 ** -2.05 -0.006
-0.44
Financial Loan Covenants 0.002 * 1.73 0.001
0.43
Stock Returns_180dayslag -0.008
-1.64 -0.006 -0.42
Bidask spread_180dayslag 0.000 -0.44 0.000 -0.09
CLO Manager –Month –Industry FE YES YES
N= 1,106,582 N= 892,005
pseudo-R2= 0.12 pseudo-R
2= 0.06

44
Table 3 – cont.
Panel B: Descriptive statistics of proxies for CLO private information
Variable N Mean S.D. Min P25 Median P75 Max
CLO Private Information -Bad News 36,795 -0.03 0.54 -4.10 -0.13 0.05 0.17 4.08
CLO Private Information -Total
News 13,926 54.74 35.7 0.79 25.55 51.52 78.81 141.33
CLO Private Information -Total
News by collateral 13,926 0.74 0.33 0.00 0.56 0.77 0.94 3.05
Panel A reports the results for the effect of CLO, loan, credit market and borrower characteristics on a CLO’s
decision to sell or purchase a loan, using probit models. In the first specification, the dependent variable is Sale,
defined as a binary variable that equals one if the loan was sold in the CLO reporting month, and zero if the loan
was kept by the CLO. In the second specification, the dependent variable is Purchase defined as binary variable that
equals one if the loan was purchased in the CLO reporting month, and zero if the CLO manager manages different
tranches or loans from the same borrower in other CLOs and did not purchase these tranches. Marginal effects are
reported. Independent variables are defined in Appendix B. The values of the continuous variables are winsorized at
1% and 99%. Standard errors are corrected for heteroskedasticity and clustered at the loan level. ***Significant at
1%, ** 5% and * 10% level, two-tailed tests. Panel B provides the univariate statistics of the proxies for CLO
private information obtained from the predictive model presented in Panel A.

45
Table 4
Validation Tests
Panel A: CLO private information and future loan performance
Future Loan Rating
Downgrade
Future Loan Rating
Upgrade Future Loan Default
Future Loan
Returns
Variable dF/dx z-stat. dF/dx z-stat. dF/dx z-stat. Coeff. t-stat.
CLO Private Information -Bad News 0.019 ***
2.51 -0.030 ***
-10.40 0.014 ***
3.61 -0.292 **
-2.13
Net Sales 0.005 *** 4.47 0.000
-1.18 -0.001 *** -2.80 0.005
0.25
Loan Rating 0.028 *** 4.99 0.014 ***
5.21 0.015 *** 8.09 -0.950 ***
-4.75
Previous Loan Rating Downgrades 0.136 *** 6.06 -0.065 ***
-3.15 0.154 *** 6.28 -3.193 ***
-6.15
Previous Loan Rating Upgrades -0.089 *** -7.50 0.095 ***
9.37 -0.025 *** -8.21 7.197 ***
9.42
Borrower D(CFO) -0.034 -0.45 -0.055 -0.91 -0.027 -0.69 -0.725 -0.46
Borrower D(Leverage) -0.023 -0.59 -0.060 *** -2.66 -0.008
-0.43 -0.102 -0.10
Loan Spread 0.001 0.09 -0.001
-0.09 0.000 0.05 -0.337
-1.58
Loan Maturity -0.086 *** -5.75 -0.009
-0.68 -0.002 -0.29 1.448 ***
2.71
Financial Loan Covenant 0.001 0.24 -0.001
-0.43 0.001 0.53 -0.009
-0.13
Constant
1.089 ***
3.97
Month –Industry FE YES YES YES YES
N= 36,795 N= 36,795 N= 36,795 N= 36,795
pseudo-R2= 0.21 pseudo-R
2= 0.15 pseudo-R
2= 0.51 R
2= 0.26
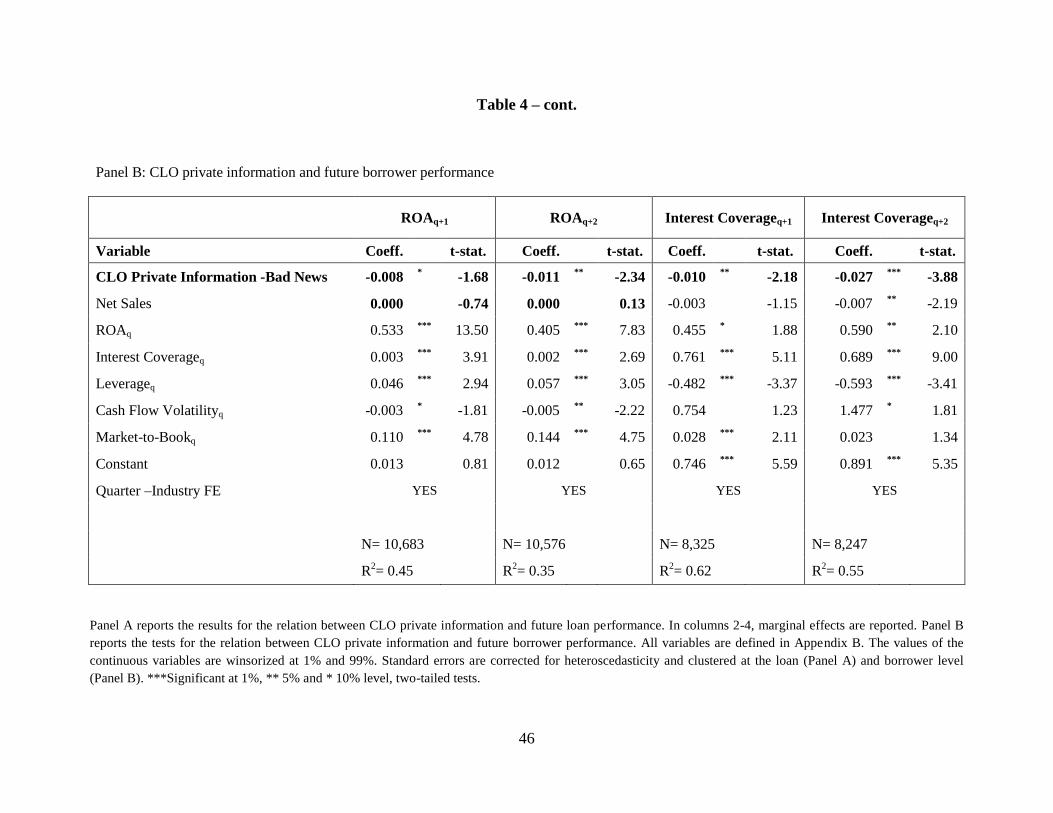
46
Table 4 – cont.
Panel B: CLO private information and future borrower performance
ROAq+1 ROAq+2 Interest Coverageq+1 Interest Coverageq+2
Variable Coeff. t-stat. Coeff. t-stat. Coeff. t-stat. Coeff. t-stat.
CLO Private Information -Bad News -0.008 * -1.68 -0.011
** -2.34 -0.010
** -2.18 -0.027
*** -3.88
Net Sales 0.000 -0.74 0.000
0.13 -0.003 -1.15 -0.007 **
-2.19
ROAq 0.533 *** 13.50 0.405 ***
7.83 0.455 * 1.88 0.590 **
2.10
Interest Coverageq 0.003 *** 3.91 0.002 ***
2.69 0.761 *** 5.11 0.689 ***
9.00
Leverageq 0.046 *** 2.94 0.057 ***
3.05 -0.482 *** -3.37 -0.593 ***
-3.41
Cash Flow Volatilityq -0.003 * -1.81 -0.005 **
-2.22 0.754 1.23 1.477 * 1.81
Market-to-Bookq 0.110 *** 4.78 0.144 ***
4.75 0.028 *** 2.11 0.023
1.34
Constant 0.013 0.81 0.012 0.65 0.746 ***
5.59 0.891 *** 5.35
Quarter –Industry FE YES YES YES YES
N= 10,683 N= 10,576 N= 8,325 N= 8,247
R2= 0.45 R
2= 0.35 R
2= 0.62 R
2= 0.55
Panel A reports the results for the relation between CLO private information and future loan performance. In columns 2-4, marginal effects are reported. Panel B
reports the tests for the relation between CLO private information and future borrower performance. All variables are defined in Appendix B. The values of the
continuous variables are winsorized at 1% and 99%. Standard errors are corrected for heteroscedasticity and clustered at the loan (Panel A) and borrower level
(Panel B). ***Significant at 1%, ** 5% and * 10% level, two-tailed tests.

47
Table 5: Impact of CLO Private Information on CLO Future Performance
Panel A: CLO private information and future asset quality
Default Bucketm+12 CCC Bucketm+12 Jnr OC Cushionm+12 Snr OC Cushionm+12 WARFm+12
Variable Coeff. t-stat. Coeff. t-stat. Coeff. t-stat. Coeff. t-stat. Coeff. t-stat.
Total Informationm -0.005 ***
-5.05 -0.006 * -1.74 0.002
1.28 0.025
*** 2.66 -0.017
*** -3.22
CLO Private
Information -Bad
Newsm
0.002 0.86 -0.452
-0.84 0.001
0.32 -0.041
-1.56 0.013
1.26
Default Bucketm 0.661 *** 13.86 0.246 ***
3.19 -0.151 *** -3.20 -0.824 **
-2.07 0.377 ** 2.26
CCC Bucketm 0.044 ** 2.21 0.553 ***
13.38 -0.085 *** 3.14 -0.761 ***
-3.93 0.092 0.98
JnrOCm -0.106 *** -4.68 5.270
0.95 -0.701 *** 14.79 0.055
0.14 0.028 0.19
SnrOCm -0.038 *** -4.47 1.553
0.90 0.023 * 1.73 0.856 ***
5.86 -0.072 *** -2.41
WARFm 0.014 *** 3.00 -3.045
-1.11 0.002 0.20 -0.035
-0.57 0.472 *** 7.59
Constant -0.078 ** -2.06 0.036
0.63 -0.028
-0.13 0.499 1.06 4.055 ***
8.65
Month FE YES YES YES YES YES
N= 7,345 N= 7,345 N= 7,345 N= 7,345 N= 7,345
R2= 0.61 R
2= 0.56 R
2= 0.53 R
2= 0.41 R
2= 0.49

48
Table 5 – cont.
Panel B: CLO private information and future market asset value (MAV)
MAVm+12
Variable Coeff. t-stat.
Total Informationm 0.065 ***
2.49
CLO Private Information -Bad Newsm -0.064 * -1.80
MAVm 0.848 *** 36.61
Loan Ratingm 0.019 0.96
CCC Bucketm -0.047 -0.20
Default Bucketm 0.150 0.31
WARFm 0.046 0.61
JnrOCm 0.039 1.51
SnrOCm 0.139 * 1.76
Constant 0.016 0.03
Month FE YES
N= 8,756
R
2= 0.62
Panel A of Table 5 reports the results for the impact of CLO private information at a given month on the quality of
loans managed by CLOs at one year ahead. Panel B of Table 5 presents the results for the impact of CLO private
information on the market asset value of loans owned by CLOs at one year ahead. All variables are defined in
Appendix B. The values of the continuous variables are winsorized at 1% and 99%. Standard errors are corrected for
heteroskedasticity and are clustered at the CLO level. ***Significant at 1%, ** 5% and * 10% level, two-tailed tests.

49
Table 6
Timeliness of CLO Trading and CLO Future Performance
Default Bucketm+12 Snr. OC Cushionm+12 WARFm+12 MAVm+12
Variable Coeff. t-stat. Coeff. t-stat. Coeff. t-stat. Coeff. t-stat.
Total Informationm -0.005 ***
-5.12 0.063 ***
4.57 -0.020 ***
-2.58 0.055 ***
2.42
Timeliness of Trading -0.002 ***
-2.61 0.035 ***
5.62 -0.012 ***
-4.70 0.030 ***
3.52
Total Informationm*Timeliness of
Tradingm -0.003
*** -2.76 0.048
*** 2.69 -0.014
** -1.94 0.034
*** 3.21
CLO Private Information -Bad Newsm 0.002 0.64 -0.024
-0.99 0.017
0.91 -0.065
* -1.89
Default Bucketm 0.659 *** 13.83 -0.836 **
-2.21 0.452 *** 2.70 0.480
1.09
CCC Bucketm 0.045 *** 2.26 -0.701 ***
-3.72 0.051 0.56 -0.082
-0.39
JnrOCm -0.106 *** -4.71 -0.074
-0.20 0.045 0.31 -0.024 *
-1.73
SnrOCm -0.037 *** -4.33 0.856 ***
5.77 -0.085 *** -2.77 0.149 ***
2.76
WARFm 0.014 *** 3.06 0.017
0.29 0.486 *** 7.72 0.090
1.37
MAVm
0.819 ***
39.20
Constant -0.081 ** -2.17 0.287
0.63 3.923 *** 8.39 -0.243
-0.45
Month FE YES YES YES YES
N= 6,160 N= 6,160 N= 7,345 N= 7,467
R2= 0.63 R
2= 0.41 R
2= 0.49 R
2= 0.64
Table 6 reports the results for the relation between timeliness of CLO trading and CLO performance at one year ahead. All variables are defined in the Appendix B.
The values of the continuous variables are winsorized at 1% and 99%. Standard errors are corrected for heteroskedasticity and are clustered at the CLO level.
***Significant at 1%, ** 5% and * 10% level, two-tailed tests.

50
Table 7
Collateral Management Fees and CLO Future Performance
Default Bucketm+12 Snr. OC Cushionm+12 WARFm+12 MAVm+12
Variable Coeff. t-stat. Coeff. t-stat. Coeff. t-stat. Coeff. t-stat.
Total Informationm -0.017 **
-2.08 0.040 ***
4.14 -0.015 **
-2.14 0.035 1.03
Total Fees -0.036 **
-2.28 0.235 ***
3.12 0.013 0.31 0.355
*** 2.86
Total Fees*Total Informationm -0.048 **
-2.07 0.400 **
2.22 -0.180 **
-2.03 0.160 **
2.25
CLO Private Information -Bad Newsm 0.007 0.84 -0.037
-1.45 0.027 1.05 -0.093 *
-1.92
Default Bucketm 0.813 *** 16.93 -0.479 *
-1.80 0.220 0.94 -2.125 ***
-2.85
CCC Bucketm -0.009 -0.17 -0.341 **
-2.21 -0.026 -0.27 0.333
1.43
JnrOCm 0.086 0.95 0.093
1.11 -0.077 -0.32 1.982 ***
3.62
SnrOCm -0.044 * -1.72 0.795 ***
13.54 -0.185 *** -2.91 0.762 ***
3.51
WARFm 0.027 ** 2.33 0.061
1.25 0.465 *** 5.03 0.082
0.88
MAVm
0.799 ***
22.68
Constant -0.119 -1.07 0.524
1.29 3.911 *** 5.71 0.138 ***
0.21
Month FE YES YES YES YES
N= 5,350 N= 5,350 N= 5,350 N= 5,350
R2= 0.63 R
2= 0.56 R
2= 0.50 R
2= 0.67
Table 7 presents the results of how the level of collateral management fees influences the relation between CLO private information and CLO future performance at
one year ahead. All variables are defined in Appendix B. The values of the continuous variables are winsorized at 1% and 99%. Standard errors are corrected for
heteroskedasticity and are clustered at the CLO level. ***Significant at 1%, ** 5% and * 10% level, two-tailed tests.
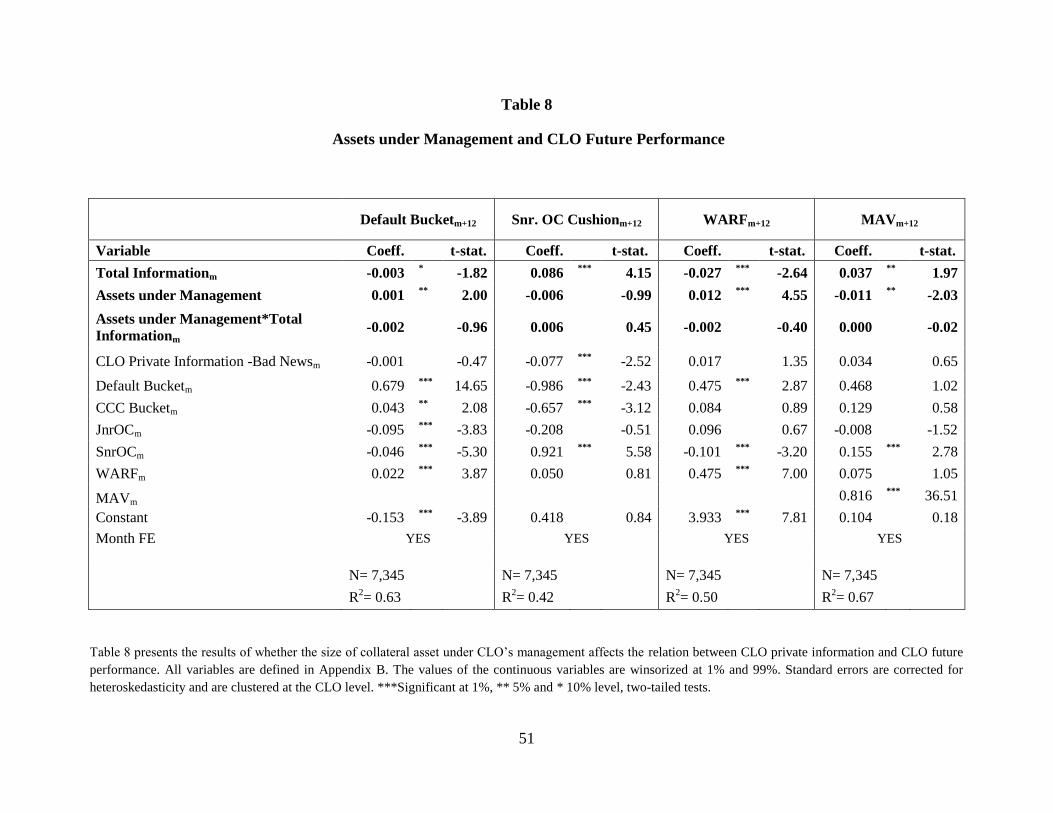
51
Table 8
Assets under Management and CLO Future Performance
Default Bucketm+12 Snr. OC Cushionm+12 WARFm+12 MAVm+12
Variable Coeff. t-stat. Coeff. t-stat. Coeff. t-stat. Coeff. t-stat.
Total Informationm -0.003 * -1.82 0.086
*** 4.15 -0.027
*** -2.64 0.037
** 1.97
Assets under Management 0.001 **
2.00 -0.006 -0.99 0.012
*** 4.55 -0.011
** -2.03
Assets under Management*Total
Informationm -0.002
-0.96 0.006
0.45 -0.002
-0.40 0.000
-0.02
CLO Private Information -Bad Newsm -0.001 -0.47 -0.077 ***
-2.52 0.017 1.35 0.034
0.65
Default Bucketm 0.679 *** 14.65 -0.986 ***
-2.43 0.475 *** 2.87 0.468
1.02
CCC Bucketm 0.043 ** 2.08 -0.657 ***
-3.12 0.084 0.89 0.129
0.58
JnrOCm -0.095 *** -3.83 -0.208
-0.51 0.096 0.67 -0.008
-1.52
SnrOCm -0.046 *** -5.30 0.921 ***
5.58 -0.101 *** -3.20 0.155 ***
2.78
WARFm 0.022 *** 3.87 0.050
0.81 0.475 *** 7.00 0.075
1.05
MAVm
0.816 ***
36.51
Constant -0.153 *** -3.89 0.418
0.84 3.933 *** 7.81 0.104
0.18
Month FE YES YES YES YES
N= 7,345 N= 7,345 N= 7,345 N= 7,345
R2= 0.63 R
2= 0.42 R
2= 0.50 R
2= 0.67
Table 8 presents the results of whether the size of collateral asset under CLO’s management affects the relation between CLO private information and CLO future
performance. All variables are defined in Appendix B. The values of the continuous variables are winsorized at 1% and 99%. Standard errors are corrected for
heteroskedasticity and are clustered at the CLO level. ***Significant at 1%, ** 5% and * 10% level, two-tailed tests.

52