Lou/C Obesity-resistant Rat Exhibits Hyperactivity, Hypermetabolism, Alterations in White Adipose...
11
Lou/C Obesity-resistant Rat Exhibits Hyperactivity, Hypermetabolism, Alterations in White Adipose Tissue Cellularity, and Lipid Tissue Profiles Christophe Soulage, Bader Zarrouki, Anisio Francesco Soares, Michel Lagarde, and Alain Geloen Universite ´ de Lyon 1, Lyon F-69003, France; Institut National de la Sante ´ et de la Recherche Me ´dicale, Unite ´ 870, Institut Fe ´de ´ratif de Recherche 62, Hospices Civils de Lyon, and Institut National de la Recherche Agronomique, Unite ´ Mixte de Recherche 1235, Lyon F-69008, France; and Institut National des Sciences Applique ´es-Lyon, Re ´gulations Me ´taboliques Nutrition et Diabe `tes, Villeurbanne F-6921, France Lou/C obesity-resistant rat constitutes an original model to understand the phenomena of overweight and obesity. The aim of the present study was to identify metabolic causes for the outstanding leanness of Lou/C rat. To this end, the meta- bolic profiles (food intake, energy expenditure, and physical activity) and the cellular characteristics of white adipose tis- sue (lipogenesis, lipolysis, cellularity, and lipid composition) in 30-wk-old Lou/C rats were compared with age-matched Wistar rats. Lou/C rats exhibited a lower body weight (45%), reduced adiposity (80%), increased locomotor activity (95%), and higher energy expenditure (11%) than Wistar rats. Epididymal adipose tissue of Lou/C rat was twice lower than that of Wistar rat due to both a reduction in both adi- pocyte size (25%) and number (three times). Basal lipolysis and sensitivity to noradrenaline were similar; however, the responsiveness to noradrenaline was lower in adipocytes from Lou/C compared with that from Wistar rats. Lipidomic analysis of plasma, adipose tissue, and liver revealed pro- found differences in lipid composition between the two strains. Of note, the desaturation indexes (ratio C16:1/C16:0 and C18:1/C18:0) were lower in Lou/C, indicating a blunted activity of -9-desaturase such as stearoyl-coenzyme A-de- saturase-1. Increased physical activity, increased energy ex- penditure, and white adipose tissue cellularity are in good agreement with previous observations suggesting that a higher sympathetic tone in Lou/C could contribute to its life- long leanness. (Endocrinology 149: 615– 625, 2008) O BESITY HAS BECOME the most common metabolic and nutritional disorder in industrial countries, and represents one of the most prevalent risk factors for the development of common chronic metabolic diseases such as atherosclerosis and diabetes. Most of the genetic studies in the field of human obesity have been focused on genes and polymorphisms associated with an obese phenotype. Con- siderably less attention has been paid to understand why certain people remain thin, and do not develop obesity, in the Western country obesogenic environment. In human popu- lations, thinness has a strong genetic component, and inher- itance of a thin body mass constitutes a strong protective factor that counteracts the development of obesity induced by environmental factors (1, 2). Many genetic manipulations and crossbreedings have created animal models of obesity providing an insight into the molecular mechanisms that affect energy balance and contribute to fat accretion. In con- trast, few animal models are available to understand the leanness and the resistance to obesity. The present study was performed on a valuable model of obesity resistance, the Lou/C rat. The Lou/C rat, an inbred strain of Wistar origin is considered both as an obesity-resistant rat (3) and as a model of successful aging (4). Indeed, whereas the Wistar rats develop spontaneous obesity with increasing age (5), the Lou/C rats exhibit lighter body weight and lower adipose tissue accretion regardless of age (6). Interestingly, the Lou/C rat exhibits a longer life expectancy than most of the other laboratory rat strains (4), and develops fewer metabolic and neuroendocrine age-related disturbances (7). Several studies have been conducted to understand the endocrine determinants of low adiposity of the Lou/C rat (3, 7, 8). To date, however, the exact mechanisms responsible for the outstanding leanness of the Lou/C rats remain unknown. Surprisingly, no data are available in the literature concern- ing the characteristics of white adipose tissue (WAT) of Lou/C rat. The aims of the present study were to investigate thoroughly the energy balance, and to characterize the cel- lularity and the metabolic properties of the WAT in obesity- resistant Lou/C rat. To this end, 6-month-old Lou/C rats were compared with age-matched Wistar rats. Understand- ing the determinants of the outstanding leanness of Lou/C may yield important and complementary findings to the study of obesity models. Materials and Methods Animals Eleven-week-old male Wistar and Lou/C rats were purchased from Harlan (Gannat, France) and were raised in the Institut National des First Published Online November 15, 2007 Abbreviations: CoA, Coenzyme A; eWAT, epididymal white adipose tissue; FAS, fatty acid synthetase; iBAT, interscapular brown adipose tissue; ingWAT, inguinal white adipose tissue; KRB, Krebs-Ringer bi- carbonate; LPL, lipoprotein lipase; MUFA, monounsaturated fatty acid; NEFA, nonesterified fatty acid; RQ, respiratory quotient; rWAT, retro- peritoneal white adipose tissue; SCD-1, stearoyl-coenzyme A-dehydro- genase-1; WAT, white adipose tissue. Endocrinology is published monthly by The Endocrine Society (http:// www.endo-society.org), the foremost professional society serving the endocrine community. 0013-7227/08/$15.00/0 Endocrinology 149(2):615– 625 Printed in U.S.A. Copyright © 2008 by The Endocrine Society doi: 10.1210/en.2007-0317 615
Transcript of Lou/C Obesity-resistant Rat Exhibits Hyperactivity, Hypermetabolism, Alterations in White Adipose...

Lou/C Obesity-resistant Rat Exhibits Hyperactivity,Hypermetabolism, Alterations in White Adipose TissueCellularity, and Lipid Tissue Profiles
Christophe Soulage, Bader Zarrouki, Anisio Francesco Soares, Michel Lagarde, and Alain Geloen
Universite de Lyon 1, Lyon F-69003, France; Institut National de la Sante et de la Recherche Medicale, Unite 870, InstitutFederatif de Recherche 62, Hospices Civils de Lyon, and Institut National de la Recherche Agronomique, Unite Mixte deRecherche 1235, Lyon F-69008, France; and Institut National des Sciences Appliquees-Lyon, Regulations MetaboliquesNutrition et Diabetes, Villeurbanne F-6921, France
Lou/C obesity-resistant rat constitutes an original model tounderstand the phenomena of overweight and obesity. Theaim of the present study was to identify metabolic causes forthe outstanding leanness of Lou/C rat. To this end, the meta-bolic profiles (food intake, energy expenditure, and physicalactivity) and the cellular characteristics of white adipose tis-sue (lipogenesis, lipolysis, cellularity, and lipid composition)in 30-wk-old Lou/C rats were compared with age-matchedWistar rats. Lou/C rats exhibited a lower body weight (�45%),reduced adiposity (�80%), increased locomotor activity(�95%), and higher energy expenditure (�11%) than Wistarrats. Epididymal adipose tissue of Lou/C rat was twice lowerthan that of Wistar rat due to both a reduction in both adi-pocyte size (�25%) and number (three times). Basal lipolysis
and sensitivity to noradrenaline were similar; however, theresponsiveness to noradrenaline was lower in adipocytesfrom Lou/C compared with that from Wistar rats. Lipidomicanalysis of plasma, adipose tissue, and liver revealed pro-found differences in lipid composition between the twostrains. Of note, the desaturation indexes (ratio C16:1/C16:0and C18:1/C18:0) were lower in Lou/C, indicating a bluntedactivity of �-9-desaturase such as stearoyl-coenzyme A-de-saturase-1. Increased physical activity, increased energy ex-penditure, and white adipose tissue cellularity are in goodagreement with previous observations suggesting that ahigher sympathetic tone in Lou/C could contribute to its life-long leanness. (Endocrinology 149: 615–625, 2008)
OBESITY HAS BECOME the most common metabolicand nutritional disorder in industrial countries, and
represents one of the most prevalent risk factors for thedevelopment of common chronic metabolic diseases such asatherosclerosis and diabetes. Most of the genetic studies inthe field of human obesity have been focused on genes andpolymorphisms associated with an obese phenotype. Con-siderably less attention has been paid to understand whycertain people remain thin, and do not develop obesity, in theWestern country obesogenic environment. In human popu-lations, thinness has a strong genetic component, and inher-itance of a thin body mass constitutes a strong protectivefactor that counteracts the development of obesity inducedby environmental factors (1, 2). Many genetic manipulationsand crossbreedings have created animal models of obesityproviding an insight into the molecular mechanisms thataffect energy balance and contribute to fat accretion. In con-trast, few animal models are available to understand theleanness and the resistance to obesity. The present study was
performed on a valuable model of obesity resistance, theLou/C rat. The Lou/C rat, an inbred strain of Wistar originis considered both as an obesity-resistant rat (3) and as amodel of successful aging (4). Indeed, whereas the Wistarrats develop spontaneous obesity with increasing age (5), theLou/C rats exhibit lighter body weight and lower adiposetissue accretion regardless of age (6). Interestingly, theLou/C rat exhibits a longer life expectancy than most of theother laboratory rat strains (4), and develops fewer metabolicand neuroendocrine age-related disturbances (7). Severalstudies have been conducted to understand the endocrinedeterminants of low adiposity of the Lou/C rat (3, 7, 8). Todate, however, the exact mechanisms responsible for theoutstanding leanness of the Lou/C rats remain unknown.Surprisingly, no data are available in the literature concern-ing the characteristics of white adipose tissue (WAT) ofLou/C rat. The aims of the present study were to investigatethoroughly the energy balance, and to characterize the cel-lularity and the metabolic properties of the WAT in obesity-resistant Lou/C rat. To this end, 6-month-old Lou/C ratswere compared with age-matched Wistar rats. Understand-ing the determinants of the outstanding leanness of Lou/Cmay yield important and complementary findings to thestudy of obesity models.
Materials and MethodsAnimals
Eleven-week-old male Wistar and Lou/C rats were purchased fromHarlan (Gannat, France) and were raised in the Institut National des
First Published Online November 15, 2007Abbreviations: CoA, Coenzyme A; eWAT, epididymal white adipose
tissue; FAS, fatty acid synthetase; iBAT, interscapular brown adiposetissue; ingWAT, inguinal white adipose tissue; KRB, Krebs-Ringer bi-carbonate; LPL, lipoprotein lipase; MUFA, monounsaturated fatty acid;NEFA, nonesterified fatty acid; RQ, respiratory quotient; rWAT, retro-peritoneal white adipose tissue; SCD-1, stearoyl-coenzyme A-dehydro-genase-1; WAT, white adipose tissue.Endocrinology is published monthly by The Endocrine Society (http://www.endo-society.org), the foremost professional society serving theendocrine community.
0013-7227/08/$15.00/0 Endocrinology 149(2):615–625Printed in U.S.A. Copyright © 2008 by The Endocrine Society
doi: 10.1210/en.2007-0317
615

Sciences Appliquees animal house until use. Rats were kept at 24 � 1C on a 12-h light, 12-h dark cycle (light on from 0600–1800 h), with freeaccess to food [3.2 kcal/g, 65% carbohydrates, 11% fat, 24% proteins(wt/wt), AO3, SAFE, Augy, France] and tap water. Body weights weremeasured weekly at the same time for up to 30 wk. All experiments wereperformed according to the guidelines laid down by the French Min-istere de l’Agriculture and European Union Council Directive for theCare and Use of Laboratory Animals (No. 02889).
Food and water consumption
Rats were housed individually in metabolic cages for 1 wk, fed adlibitum with standard diet, and given free access to water. Food andwater consumption were measured twice daily the last 5 d as the dif-ference between the amount given and that removed from the cage. Thespillage of food was considered in the calculation of the food intake.
Actimetry
Locomotor activity was quantified using cages (0.30-m length �0.20-m length � 0.17-m height; surface: 0.06 m2; volume: 0.01 m3)equipped with horizontal infrared beams (Imetronic, Pessac, France)placed 3 cm above the floor of each activity cage to detect horizontallocomotor activity. Beam interruptions were identified via an electricalinterface, accumulated and recorded over 30-min intervals using a per-sonal computer.
Energy expenditure measurement
Energy expenditure was measured by indirect calorimetry at 26 � 1C, the thermoneutrality for rats. Oxygen and carbon dioxide concen-trations in downstream exhaust gas were successively measured in fivedifferent cages. To avoid errors resulting from sequential changes fromone cage to another, common parts of the system were rinsed for 90 secafter which gas exchanges were measured for 40 sec. A computer-controlled system of three-way valves allowed sequential analysis of thefive cages every 11 min. One cage was left vacant, and served as ref-erence for measuring ambient O2 and CO2. Air samples were pumpedat a constant flow rate, controlled within strict limits by a mass flow-meter (precision � 1%, Tylan, FM 380; Tylan General, San Diego, CA),and directed to a paramagnetic oxygen analyzer (range 0–100%, timedelay � 3 sec; Klogor, Lannion, France) and an infrared carbon dioxideanalyzer (range 0–1%, time delay � 3 sec, Gascard I; Edinburgh Sensors,Edinburgh Instruments Ltd., Livingston, UK) after being dried on apermapure system and calcium chloride, which were changed twicedaily. The system was calibrated daily with pure nitrogen to set up thezero and with a standard gas mixture containing 20.5% O2 (accuracy20.44–20.56%), 0.5% CO2 (accuracy 0.495–0.505%), and 79% nitrogen toset up the sensitivity. The measuring system was found to be accuratewithin �1% by bleeding a known rate of CO2 and N2, as well as a knownrate of O2 and N2. Analog signals from the analyzers and mass flowmeterwere digitized with an interface card and stored in a desktop computer.After a period of acclimatization of 24 h, O2 and CO2 concentrations weremeasured continuously over 24 h. Thirty minutes were required tocalibrate the system, clean the cages, change food and water, and weighthe animals. The total quantities of O2 consumed and CO2 produced inoccupied cages minus O2 and CO2 concentrations in the empty referencecage, multiplied by the airflow through the cages yielded the respiratorygas exchange of animals. Energy expenditure was calculated accordingto the Depocas and Hart method (9). The 24-h energy expenditurerecords were divided into energy expended during quiescent (day) oractive (night) phase of the animals. The respiratory quotient (RQ) wascalculated as the ratio between CO2 production and O2 consumption.The body temperature was measured using a thermocouple thermom-eter (BAT-12; Harvard Apparatus, Les Ulis Cedex, France), the colonictemperature being taken as representative of body temperature. Thecolonic temperature was measured rectally at a depth of 3 cm. Fivemeasurements were performed over a 30-min period, and the mean ofthese values was taken as the body temperature.
Blood sampling and tissue dissection
Rats were killed with CO2 between 0900 and 1000 h. Blood wasrapidly withdrawn from puncture of the vena cava on heparinized
tubes. Blood samples were centrifuged (1 min, 5000 � g), and plasmawas collected and frozen in liquid nitrogen. Epididymal (eWAT), ret-roperitoneal (rWAT), inguinal (ingWAT) WATs, and interscapularbrown adipose tissue (iBAT) were rapidly removed and cleaned. Aportion of epididymal fat pad was immediately used for isolation ofadipocytes, whereas the remaining tissues were snap frozen in liquidnitrogen and stored at �80 C until use.
Isolation of adipocytes
Adipocytes were isolated from 1- to 2-g epididymal fat pad by amodification of the Rodbell’s original procedure (10). Adipose tissueswere weighed, minced, and digested in a 20-ml polystyrene vial con-taining 10 ml Krebs-Ringer bicarbonate (KRB) buffer, 25 mm HEPES, 6mm glucose (pH 7.40) (KRB buffer), with 1.8 mg/ml collagenase (typeII, C6885; Sigma, Saint Quentin Fallavier, France) and 1% of fatty acidfree BSA (Sigma). The vial was shaken at 50 cycles/min at 37 C. Theresulting cell suspension was filtered through a nylon mesh (250 �m)and washed three times with 5 ml KRB buffer 1% BSA and three timeswith KRB buffer containing 4% BSA. Adipocytes were then resuspendedin KRB buffer 4% BSA, and a sample of the final cellular suspension wascounted in a hemacytometer.
Adipose tissue cellularity
Cell size and number of adipocytes in epididymal adipose tissue weredetermined as described by Briquet-Laugier et al. (11). Briefly, micro-photographs of isolated adipocytes were acquired from a light micro-scope equipped with a CCD camera, and 800-1000 cell diameters weremeasured using Axiocam software (Axiocam; Leica, Bron, France) (12,13). The mean fat cell volume was calculated, and the fat cell number wascalculated by dividing the tissue lipid content, estimated by lipid ex-traction using the method of Folch et al. (14), by the mean adipocyteweight (calculated by multiplying the mean adipocyte volume by thetriacylglycerol density, namely 0.915).
In vitro lipolysis measurement
Aliquots of the cell suspension (75,000 cells) were distributed in 2-mlpolystyrene vials containing KRB buffer 4% BSA with or without nor-adrenaline (-arterenol hydrochloride; Sigma) at various concentrations(final concentration ranging between 10�9 and 5 � 10�6 m). The finalvolume was 1 ml. Adipocytes were incubated with gentle shaking (50cycles per minute) for 1 h. The reaction was stopped by placing vials onmelting ice. The floating adipocytes were discarded by aspiration, andlipolysis was quantified by measuring the release of extracellular glyc-erol using a kit (Glycerin assay; Roche Molecular Biochemicals, BurgessHill, UK). Each incubation was run in quadruplicate, and the results arethe means of five to seven separate experiments performed on differentdays. Data are expressed as �mol glycerol release in 1 h/million cells andas percentage of the maximal response (10�6 m noradrenaline). Vmax andEC50 were calculated from the fitting of the dose-response curve ofnoradrenaline-stimulated lipolysis using JMP 5.1 software (Abacus Con-cepts, Berkeley, CA) for Macintosh. Vmax (responsiveness) representedthe maximal stimulation of lipolysis. EC50 (an index of sensitivity) wasdefined as the concentration of noradrenaline inducing one half of themaximal response. The lipolytic activity of the isolated adipocytes wastested using 10�6 m isoproterenol (�-adrenergic agonist), 10�6 m BRL37344 (�3-adrenergic agonist), and 5 � 10�5 m IBMX (phosphodiester-ase inhibitor). Antilipolytic responsiveness was explored on 10�6 mnoradrenaline-stimulated lipolysis using 10�6 and 10�3 m clonidine(�2-adrenergic agonist).
Antilipolytic effect of insulin
Aliquots of the cell suspension (75,000 cells) were distributed inpolystyrene vials containing KRB buffer 4% BSA with 10�6 m noradren-aline and with or without insulin at various concentrations (final con-centrations: 25, 100, 500, and 1000 �U/ml). The final volume was 1 ml.Adipocytes were incubated with gentle shaking (50 cycles per minute)for 1 h. The reaction was stopped by placing vials on melting ice. Thefloating adipocytes were discarded by aspiration, and lipolysis wasquantified by measuring the release of extracellular glycerol using a kit
616 Endocrinology, February 2008, 149(2):615–625 Soulage et al. • Energy Balance and Adiposity in Lou/C Rat

(Glycerin assay). Each incubation was run in quadruplicate, and theresults are the means of five to seven separate experiments performedon different days.
In vivo lipogenesis
In vivo lipogenesis measurement was performed as described byFeingold and Grunfeld (15). Each rat was injected ip with 12 mCi/kg[3H] water (GE Healthcare, Orsay, France; original specific activity 50mCi/ml diluted to 5 mCi/ml in saline) between 0900 and 1100 h. Exactly1 h later, each animal was deeply anesthetized with pentobarbital (60mg/kg ip), and 2 ml blood was withdrawn from heart puncture andused to measure the plasma [3H] water specific activity. Liver, epidid-ymal, retroperitoneal, and inguinal white fat pads were rapidly re-moved, weighed, and frozen in liquid nitrogen. Total lipids were ex-tracted with chloroform-ethanol (2:1 vol/vol), saponified with 5 nNaOH (80 C, 1 h), and the digitonin-precipitable sterols were isolatedas described by Lowenstein et al. (16). Fatty acids were extracted fromthe same samples with 12 ml diethyl ether after acidification with 12 nH2SO4, followed by a second extraction with diethyl ether. The radio-activity was measured by liquid scintillation counting. The rates of fattyacid and cholesterol synthesis were calculated as micromoles of [3H]water incorporated into fatty acids or digitonin-precipitable sterols.
Plasma parameters
Triglycerides (Triglycerides PAP; BioMerieux, Marcy l’Etoile,France), nonesterified fatty acids (NEFAs) (NEFA-C; Wako, Neuss, Ger-many), and cholesterol (Cholesterol RTU; BioMerieux) were assayedusing commercially available kits. Plasma glucose was assayed using theglucose oxidase method as previously described. Plasma insulin con-centration was determined with a double antibody RIA (CIS Bio Intl., Gifsur Yvette, France) according to the manufacturer’s recommendations.All assays were performed at least in duplicate.
Fatty acid profiling
Plasma, liver, and rWAT were subjected to fatty acid profile analyses.Briefly, tissues were broken, and the total lipids were extracted usingchloroform-ethanol (2:1 vol/vol) with heptadecanoic acid (C17:0) as aninternal standard. Lipids were transmethylated using BF3 and methanolin a sealed vial under nitrogen at 100 C for 90 min. Fatty acid methylesters obtained were extracted with isooctane and used for gas chro-matography. Separation and quantification of fatty acid methyl esterswere achieved with gas chromatography using a gas chromatograph(Agilent Technologies, Massy, France) with a silica column (60 m � 0.25mm) and a flame-ionization detector.
RT-PCR analysis
The expression of some key genes related to lipid metabolism wasmeasured using RT-PCR analysis. Briefly, total RNA was extracted usingSigma Tri Reagent. After RT of 1 mg total RNA using the OneStepQIAGEN kit (QIAGEN, Inc., Valencia, CA), PCR was performed on aPrimus thermocycler (Nyxor, Paris, France). Semiquantitative RT-PCRanalysis was performed for fatty acid synthetase (FAS), lipoproteinlipase (LPL), or stearoyl-coenzyme A-dehydrogenase-1 (SCD-1) using�-actin as a control to normalize gene expression. Primer sequences areshown in Table 1, and PCR conditions for LPL, FAS, and SCD-1 can besent upon request.
Statistical analysis
The data are expressed as mean � sem. Statistical analyses wereperformed with StatView 4.5 software for Windows (Abacus Concepts)and JMP 5.1 (Abacus Concepts) for Macintosh. The body weights, foodintake, locomotion, and energy expenditure values for the Wistar andLou/C rats were compared using two-way ANOVA with one between-subject factor (strain) and one within-subject factor (time). When ap-propriate, individual comparisons were made with post hoc Fisher’s leastsignificant difference test. Data concerning the energy expenditure areexpressed in relation to the metabolic size as kg0.67 to standardize fordifferences in body weight (17) and were subjected to two-way ANOVAwith one between-subject factor (strain) and one within-subject factor(time). For simple comparison between the two strains, Student’s t testwas used. Lipogenesis data are expressed as mean � sd and werecompared using the Mann-Whitney U test. Adipocyte size distributionswere compared using a Smirnov test. Differences were considered sig-nificant when P � 0.05.
ResultsLou/C rats exhibited a lower body weight and loweradiposity than Wistar rats
Lou/C rats and age-matched Wistar rats were raised for20 wk in our animal house, and body weights were moni-tored weekly. The evolution of the body weights of Lou/Cand Wistar rats is depicted in Fig. 1. At each age, the Lou/Crats exhibited a lower body weight than the Wistar rats. TheANOVA indicated a main effect of age (P � 0.001), a maineffect of strain (P � 0.001), as well as an age vs. strain in-teraction (P � 0.001). At the time of euthanasia, the Lou/Crats exhibited a 45% (P � 0.0001) lower body weight thantheir Wistar counterparts. The daily weight gain (absolute orrelative) was significantly lower in Lou/C than in Wistar rats(�55%; P � 0.005). Biometric data are shown in Table 2. Themeasurement of retroperitoneal fat tissue accretion is a direct
100
150
200
250
300
350
400
450
500
11 12 13 14 15 16 17 18 19 20 21 22 23 24 25 26 27 28 29 30
Bod
y w
eigh
t, g
***
Age, weeks
FIG. 1. Body weights of male Wistar (�) and Lou/C (●) rats withincreasing age. Data are expressed as mean � SEM. At each age, Lou/Crats exhibit a significant lower body weight than age-matched Wistar(P � 0.005, two-way ANOVA, Lou/C vs. Wistar; n � 10 in each strain).
TABLE 1. Sequence of primers for semiquantitative PCR
Target Accession no. Forward (5�--3�) Reverse (5�--3�)
FAS NM_017332 GCC TCA CTC CGA GGA ACA AAC A CCC GGC ATT CAG AAT AGT GGC ALPL NM_012598 TCA TCA ACT GGC TGG AGG AAG TAT GCC TTG CTG GGG TTT TCTSCD1 NM_139192 GCT GAG AAG CTG GGT GAT GTT C ATC TCA AGA AGG TGC TGA CGA�-Actin V_01217 AAC ACC CCA GCC ATG TAC GTA G GAA CCG CTC ATT GCC GAT AGT
Soulage et al. • Energy Balance and Adiposity in Lou/C Rat Endocrinology, February 2008, 149(2):615–625 617

indication of obesity in rats (5). A striking difference wasobserved in fat pad weights between Lou/C and Wistar rats.The amounts of iBAT (�60%; P � 0.0003), eWAT (�80%; P �0.0001), rWAT (�85%; P � 0.0001), and ingWAT (�62%; P �0.009) were significantly lower in Lou/C than in Wistar rats.The Lee index is a common marker of body mass in rats.According to the difference observed in WAT accretion, wenoticed a lower Lee index in Lou/C compared with Wistarrats (�6%; P � 0.0002).
Lou/C rats exhibited a particular energy balance and ahigher physical activity
To investigate whether changes in energy balance couldaccount for the lower adiposity observed in Lou/C rats,metabolic rate, locomotor activity, and food intake were mea-sured. The daily energy expenditure, corrected per metabolicbody mass and expressed as J/min�kg0.67, is depicted in Table3. The Lou/C rats exhibited higher energy expenditure thantheir Wistar counterparts during both the quiescent (day,�13%; P � 0.05) and the active phase (night, �9%; P � 0.05)of the animals. No difference in RQ was noticed between thetwo strains. The colonic temperature, taken as representativeof body temperature, did not differ between the two strains.The daily cumulative locomotor activity of Lou/C andWistar rat is depicted in Fig. 2. Locomotor activity, estimatedby interrupted infrared beams, was significantly enhanced inthe Lou/C rat. The number of movements observed duringthe active (light off) and quiescent phase (light on) was in-creased respectively by 87 (P � 0.005) and 102% (P � 0.005)
in Lou/C compared with Wistar rats. The food intake ofLou/C and Wistar rat is depicted in Table 4. The daily foodintake was higher in Lou/C rats than in their Wistar coun-terparts (�17%; P � 0.005). A striking difference was noticedin the amount of food ingested during the active phase(�24%; P � 0.01), whereas no difference was detected in theamount of food ingested during the quiescent phase. Nodifference was observed in the daily partition (quiescent vs.active phase) of the food intake. Metabolic efficiency wascalculated as the total body mass gain divided by the totalamount of food eaten by the same animal. Metabolic effi-ciency was 6.58 � 0.57% in Wistar and 4.81 � 0.24% in Lou/Crats (P � 0.05). In good agreement, the relative water intakewas also higher in the Lou/C strain than in the Wistar strain(�45%; P � 0.01).
Plasma parameters
Blood metabolic parameters for Wistar and Lou/C rats areshown in Table 5. As previously described, the plasma glu-cose concentration, insulin, and NEFA were similar in bothstrains. However, triglyceride concentration was lowest in
0
2000
4000
6000
8000
10000
12000
14000
16000
18000
0 2 4 6 8 10 12 14 16 18 20 22 24
Cum
ulat
ive
loco
mot
or a
ctiv
ity
WistarLou/C
Night time Night timeDay time
FIG. 2. Daily locomotor activity in 30-wk-old Wistar and Lou/C rats.Interval measurements were taken every 30 min for 24 h as describedin Materials and Methods. The data represent the number of times thelight beams were broken due to animal movements. The data areexpressed as mean � SEM (n � 8 in each group). Note that locomotoractivity was higher in Lou/C than in Wistar rats (P � 0.005, two-wayANOVA, Lou/C vs. Wistar).
TABLE 2. Biometric data and adipose tissue weights of 30-wk-oldWistar and Lou/C rats involved in the study
Wistar (n � 9) Lou/C (n � 10) P value
Biometric dataBody weight (g) 461.9 � 13.0 309.8 � 6.0 �0.001Length (cm) 24.6 � 0.2 22.9 � 0.2 �0.001Lee index (�103) 314.1 � 1.9 295.4 � 1.4 �0.001Body temperature (C) 37.01 � 0.15 37.33 � 0.10 NS
Daily weight gainMass (g/d) 1.70 � 0.13 0.78 � 0.06 �0.001Relative (g/100 g�d) 0.38 � 0.02 0.27 � 0.02 �0.005
Tissue weightsrWAT (g) 10.97 � 0.88 1.57 � 0.14 �0.001eWAT (g) 7.20 � 0.85 1.40 � 0.08 �0.001ingWAT (g) 10.29 � 1.65 3.87 � 0.42 �0.01iBAT (g) 0.80 � 0.06 0.32 � 0.03 �0.005Liver (g) 15.43 � 0.50 10.47 � 0.47 �0.001
All results are mean � SEM. The Lee index was calculated bydividing the cubic root of the body weight by the ano-nasal length.Differences between Wistar and Lou/C were estimated using Stu-dent’s t test. NS, Not significant.
TABLE 3. Daily energy expenditure in 30-wk-old Wistar andLou/C rats
Wistar (n � 10) Lou/C (n � 8) P value
Energy expenditure 10 824 h (J/min�kg0.67) 227.5 � 4.3 250.2 � 3.9 �0.05Day (J/min�kg0.67) 195.9 � 4.8 221.8 � 4.3 �0.05Night (J/min�kg0.67) 256.6 � 4.3 280.7 � 3.4 �0.05
RQ 0.909 � 0.012 0.913 � 0.008 NS
All results are mean � SEM. Differences between Wistar and Lou/Cwere estimated using Student’s t test. NS, Not significant.
TABLE 4. Food and water intake in 30-wk-old Wistar and Lou/Crats
Wistar (n � 9) Lou/C (n � 10) P value
Food intake (kcal/100g)24 h 16.1 � 0.5 18.8 � 0.6 �0.005Nighttime 9.7 � 0.5 12.1 � 0.5 �0.01Daytime 5.8 � 0.2 5.4 � 0.5 NS% daytimea 38.7 � 2.2 34.8 � 2.8 NS
Water intake (g/100g)24 h 6.0 � 0.6 8.7 � 0.5 �0.01Nighttime 3.8 � 0.3 5.3 � 0.5 �0.05Daytime 2.20 � 0.3 3.4 � 0.2 �0.02% daytimea 35.7 � 3.6 39.0 � 3.5 NS
Nighttime from 1800–0600 h. All results are mean � SEM. Differ-ences between Wistar and Lou/C were estimated using Student’s ttest. NS, Not significant.
a The percentage of the daily intake ingested during the daytime.
618 Endocrinology, February 2008, 149(2):615–625 Soulage et al. • Energy Balance and Adiposity in Lou/C Rat

Lou/C, whereas cholesterol concentration was found to behigher in Lou/C than in Wistar rats.
Lou/C rats presented some alterations in WAT cellularity
A 5-fold difference was observed in the weight of epidid-ymal fat pad between Lou/C and Wistar rats. To investigatewhether changes in WAT accretion were due to a reductionin the number of adipocytes, a decrease in triglyceride ac-cumulation in adipocytes, or both, we performed a cytolog-ical analysis of eWAT. The cellular characteristics of eWATin Lou/C and Wistar rats are shown in Fig. 3. The frequencydistributions of adipocyte diameters were biphasic in Wistaras well as in Lou/C rats. The mean adipocyte diameters were129.0 � 9.1 �m in Wistar and 102.3 � 4.39 �m in Lou/C rat(P � 0.01). The number of adipocytes per epididymal fat padwere 7.10 � 0.78 and 2.30 � 0.46 million in Wistar and Lou/Crat, respectively. Thus, the reduction in WAT accretion inLou/C results from both a hypotrophia (i.e. a reduction in thevolume of adipocytes) and to a hypoplasia (i.e. a reductionin the number of white adipocytes).
Metabolic potentialities of WAT from Lou/C rat
Figure 4A shows the dose-response effect of noradrenalineon the lipolysis of adipocytes isolated from epididymal ad-ipose deposits in Wistar and Lou/C rats with a higher re-sponse of the former. When results are expressed as thepercentage of the maximal stimulation for noradrenaline (i.e.5 � 10�5 m) (Fig. 4B), no significant difference was observedbetween the two strains. Pharmacodynamic parameters ofthe noradrenaline-stimulated lipolysis (V0, VMAX, and EC50)were calculated from the fitting of the dose-response curve(Fig. 4A), as described in Materials and Methods. V0 representsthe basal level of lipolysis in the absence of noradrenalinestimulation, VMAX (responsiveness) the maximal stimulationof lipolysis with noradrenaline. EC50, a common index ofsensitivity, is defined as the concentration of noradrenalineinducing one half of the maximal response. No differencewas observed in basal lipolysis or in noradrenaline sensitiv-ity indicated by similar EC50 values for noradrenaline. How-ever, the responsiveness (VMAX) to noradrenaline was sig-nificantly lower in adipocytes isolated from Lou/C WATthan in those isolated from Wistar rat WAT (Table 6). Thelipolytic activity of the isolated adipocytes was tested usingthe �-adrenergic agonist isoproterenol (10�6 m) and thehighly selective �3-adrenergic agonist BRL 37344 (10�6 m).The lipolytic potencies of isoproterenol were similar in thetwo strains, whereas agonist BRL 37344 induced a strongerstimulation of lipolysis in Lou/C rats. The use of the phos-
phodiesterase inhibitor IBMX (5 � 10�5 m) resulted in bothstrains in a submaximal stimulation of lipolysis (Fig. 5). An-tilipolytic responsiveness was explored on 10�6 m noradren-aline-stimulated adipocytes using the �2-adrenergic agonistclonidine (Fig. 6). The 10�6 m clonidine failed to show anyantilipolytic activity in either strain under our experimentalconditions. However, 10�3 m clonidine resulted in a 30%inhibition of noradrenaline-stimulated lipolysis in Lou/C,whereas it remained unaltered in Wistar rat. Therefore, theefficiency of �2-adrenergic agonist was greater in Lou/Cthan Wistar rats. Insulin induced a dose-dependent inhibi-tion of the noradrenaline-stimulated lipolysis, but no differ-ence was observed between the two strains (Fig. 7). Together,these results indicate that apart from a greater �2-adrenergicefficiency in Lou/C rats, there is no major modification in the
0
2
4
6
8
10
12
14
16
18
20
0 5 0 1 00 15 0 2 00 25 0 3 00
Di am et er, µm
Fr e q
ue nc
y, %
Wi star Lo u/ C
0
2
4
6
8
10
Adi
pocy
te n
umbe
r, .1
06ce
lls Wistar
Lou/C
**
A
B
FIG. 3. A, Frequency distribution of adipocyte diameters in 30-wk-oldWistar and Lou/C rat epididymal fat pad. B, Number of adipocytes inepididymal white fat pad of Wistar and Lou/C rats. For both strains,individual measurements were performed on 800–1000 isolated adi-pocytes. Results are expressed as mean � SEM from five rats in eachstrain. Note that adipocyte size distributions were different betweenthe two strains (P � 0.001, Smirnov test, Lou/C vs. Wistar). *, P �0.05; **, P � 0.01, significant difference between the two strainsestimated using Student’s t test.
TABLE 5. Plasma parameters in 30-wk-old Wistar and Lou/Crats
Wistar (n � 10) Lou/C (n � 8) P value
Triglycerides (mM) 1.95 � 0.21 0.77 � 0.10 �0.005NEFA (mM) 0.58 � 0.04 0.62 � 0.16 NSCholesterol (mM) 1.57 � 0.10 2.51 � 0.15 �0.001Glucose (mM) 5.80 � 0.30 6.24 � 0.14 NSInsulin (ng/ml) 2.21 � 0.32 1.79 � 0.14 NS
All results are mean � SEM. Differences between Wistar and Lou/Cwere estimated using Student’s t test. NS, Not significant.
Soulage et al. • Energy Balance and Adiposity in Lou/C Rat Endocrinology, February 2008, 149(2):615–625 619

lipolytic potencies of isolated adipocytes from Lou/C orWistar rats.
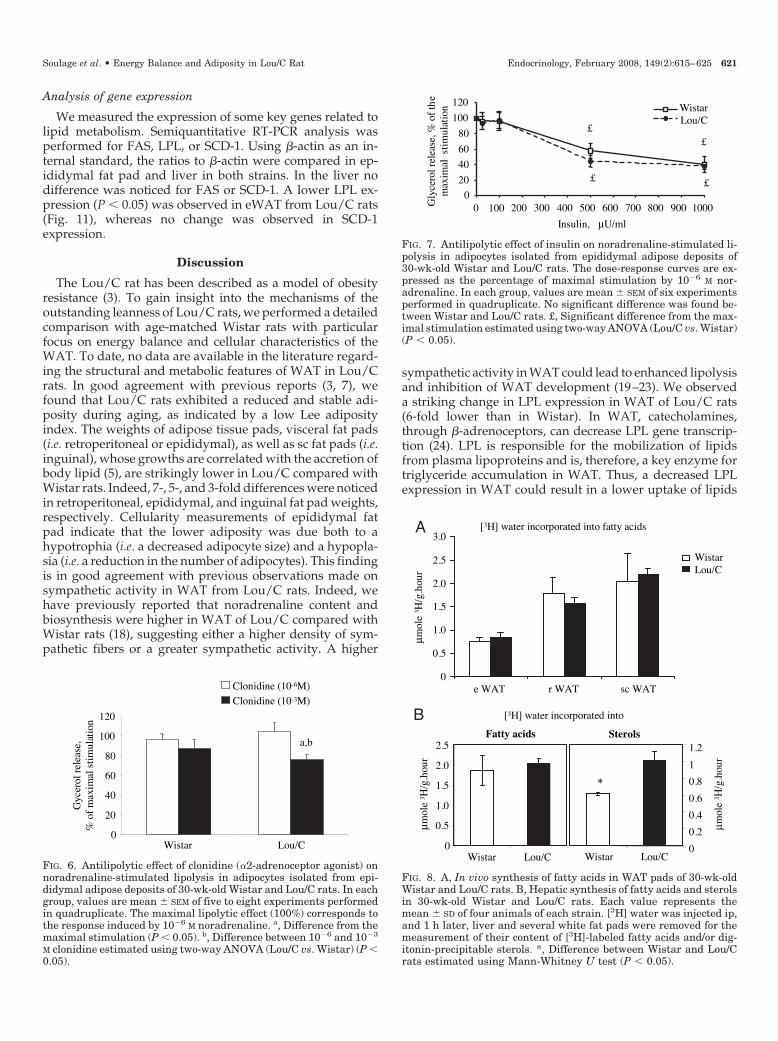
In rat, white adipose cells produce a significant amount oflipids rather than importing them all from the liver. There-fore, a reduced lipogenesis in WAT could contribute to themodest fat accretion noticed in Lou/C rat. Thus, we per-formed an in vivo lipid biosynthesis experiment with [3H]water as a tracer. Wistar and Lou/C rats were given a doseof [3H] water, and 1 h later, liver and several white adiposefat pads were excised, and the content of [3H]-labeled fattyacids was measured in liver and adipose tissue, whereas thecontent of [3H]-labeled digitonin-precipitable sterols was as-sayed in the liver. No difference was noticed in fatty acidbiosynthesis rate between the two strains (Fig. 8A). However,a 1.6-fold increase in sterol synthesis (P � 0.05) was observedin the liver of Lou/C rats compared with their Wistar coun-terparts (Fig. 8B).
Lou/C rats exhibited profound changes in tissuelipid composition
We investigated changes in lipid metabolism betweenLou/C and Wistar rats using a comprehensive lipid profil-ing. Table 7 represents the differences observed within entirefatty acid families in plasma (an index of lipid exchange),liver (the site of lipid biosynthesis), and WAT (the main siteof lipid storage) in Lou/C and Wistar rats. The most strikingchanges are a higher proportion of saturated fatty acids inplasma, liver, and WAT from Lou/C rats with a reciprocaldecrease in monounsaturated fatty acid (MUFA) proportion,except in WAT. In plasma and WAT, a decrease in n-3 with-out significant alteration in n-6 fatty acids was observed,whereas in plasma, the n-3 decrease was associated with anincrease in n-6 fatty acids leading to an altered n-6/n-3 ratio.The “heat map” presented in Fig. 9 summarizes the differ-ences observed in individual fatty acid composition of totallipids extracted from plasma, WAT, and liver of Lou/C andWistar rats. In plasma from Lou/C rats, the general trendwas a decrease in the content of several classes of fatty acids.Indeed, we observed significant decreases in 16:1n-7 (palmi-toleic), 18:1n-7 (vaccenic), 18:1n-9 (oleic), 18:3n-3 (�-linole-nic), 20:5n-3 (eicosapentaenoic), 18:2n-6 (linoleic), 20:2n-6,and 20:3n-6 (dihomo-�-linolenic), whereas increases wereobserved for downstream members of n-6 fatty acids, i.e.20:4n-6 (arachidonic), 22:4n-6, and 22:5n-6. Large alterationsof lipid composition were also observed in the liver fromLou/C rats. We noticed a decrease of 16:1n-7, 18:1n-7, 16:1n-9(hexadecenoic), 18:3n-3, 18:2n-6, 20:2n-6, and 20:3n-6 and anincrease of 18:0 (stearic), 20:5n-3, 22:5n-3, 20:4n-6, and 22:4n-6. In contrast to what was observed in plasma and liver,fewer changes occurred in the Lou/C WAT. The most strik-ing change was an increase in saturated fatty acid propor-tions, whereas few alterations were observed in other classesof fatty acids (i.e. decrease in 18:1n-7 and 18:3n-3). The de-saturation indexes were calculated for the C16 and C18 fattyacids. Interestingly, the ratio of the MUFAs to saturated fattyacids was significantly lower in tissues from Lou/C than intissue from Wistar rats (Fig. 10).
0
0. 5
1. 0
1. 5
2. 0
2. 5
3. 0
-5 -6 -7 -8 -9 Ba
Wi star Lo u/ C *
* * *
L og( [N or adre na li ne ])
Gl y
c ero
l rel
ease
, µ m
o l/ 1
0 6
ce lls
.h
0
20
40
60
80
10 0
12 0
-5-6 -7 -8 -9 Ba
Wi star Lo u/ C
L og( [N or adre na li ne ])
Gl y
c ero
l rel
ease
, % o
f
max
imal
stim
ul at
io n
A
B
FIG. 4. Dose-response curves of noradrenaline-stimulated lipolysis ofadipocytes isolated from epididymal adipose deposits of 30-wk-oldWistar and Lou/C rats. The dose response-curves are expressed in�mol glycerol released from 106 cells in 1 h (A) or as the percentageof maximal stimulation by 5 � 10�6 M noradrenaline (B). In eachgroup, values are mean � SEM of five experiments performed in qua-druplicate. *, Significant difference between Wistar and Lou/C ratsestimated using two-way ANOVA (P � 0.05). Ba, Baseline.
ISO 10-6 BRL 10-6 IBMX 5.10-3
Gly
cero
l rel
ease
, %
of
max
imal
sti
mul
atio
n
WistarLou/C*
*
020406080
100120140160
FIG. 5. Effect of various agonists on lipolytic response of isolatedadipocytes from 30-wk-old Wistar and Lou/C rats. The maximal li-polytic effect (100%) corresponds to the response induced by 10�6 Mnoradrenaline. The data are the mean � SEM from five to eight an-imals per group. *, Difference between Wistar and Lou/C rats esti-mated using Student’s t test (P � 0.01). BRL, BRL 37344 (�3 agonist);IBMX, 3-isobutyl-1-methylxanthine (phosphodiesterase inhibitor);ISO, isoproterenol (� agonist).
TABLE 6. Basal and noradrenaline stimulated lipolysis inisolated epididymal adipocytes of 30-wk-old Wistar and Lou/C rats
Wistar Lou/C P value
V0 (�mol glycerol/106 cells�h) 0.24 � 0.06 0.16 � 0.06 NSVmax (�mol glycerol/106 cells�h) 2.41 � 0.40 1.01 � 0.08 �0.01EC50 (nM) 69 � 10 63 � 12 NS
V0, Vmax, and EC50 were calculated from the fitting of the dose-response curve (Fig. 4) with a computerized program as described inMaterials and Methods. Differences between Wistar and Lou/C ratswere assessed using Student’s t test. NS, Not significant.
620 Endocrinology, February 2008, 149(2):615–625 Soulage et al. • Energy Balance and Adiposity in Lou/C Rat
Analysis of gene expression
We measured the expression of some key genes related tolipid metabolism. Semiquantitative RT-PCR analysis wasperformed for FAS, LPL, or SCD-1. Using �-actin as an in-ternal standard, the ratios to �-actin were compared in ep-ididymal fat pad and liver in both strains. In the liver nodifference was noticed for FAS or SCD-1. A lower LPL ex-pression (P � 0.05) was observed in eWAT from Lou/C rats(Fig. 11), whereas no change was observed in SCD-1expression.
Discussion
The Lou/C rat has been described as a model of obesityresistance (3). To gain insight into the mechanisms of theoutstanding leanness of Lou/C rats, we performed a detailedcomparison with age-matched Wistar rats with particularfocus on energy balance and cellular characteristics of theWAT. To date, no data are available in the literature regard-ing the structural and metabolic features of WAT in Lou/Crats. In good agreement with previous reports (3, 7), wefound that Lou/C rats exhibited a reduced and stable adi-posity during aging, as indicated by a low Lee adiposityindex. The weights of adipose tissue pads, visceral fat pads(i.e. retroperitoneal or epididymal), as well as sc fat pads (i.e.inguinal), whose growths are correlated with the accretion ofbody lipid (5), are strikingly lower in Lou/C compared withWistar rats. Indeed, 7-, 5-, and 3-fold differences were noticedin retroperitoneal, epididymal, and inguinal fat pad weights,respectively. Cellularity measurements of epididymal fatpad indicate that the lower adiposity was due both to ahypotrophia (i.e. a decreased adipocyte size) and a hypopla-sia (i.e. a reduction in the number of adipocytes). This findingis in good agreement with previous observations made onsympathetic activity in WAT from Lou/C rats. Indeed, wehave previously reported that noradrenaline content andbiosynthesis were higher in WAT of Lou/C compared withWistar rats (18), suggesting either a higher density of sym-pathetic fibers or a greater sympathetic activity. A higher
sympathetic activity in WAT could lead to enhanced lipolysisand inhibition of WAT development (19–23). We observeda striking change in LPL expression in WAT of Lou/C rats(6-fold lower than in Wistar). In WAT, catecholamines,through �-adrenoceptors, can decrease LPL gene transcrip-tion (24). LPL is responsible for the mobilization of lipidsfrom plasma lipoproteins and is, therefore, a key enzyme fortriglyceride accumulation in WAT. Thus, a decreased LPLexpression in WAT could result in a lower uptake of lipids
0
20
40
60
80
100
120
Wistar
Gyc
erol
rel
ease
, %
of
max
imal
sti
mul
atio
n
Clonidine (10-6M)Clonidine (10-3M)
Lou/C
a,b
FIG. 6. Antilipolytic effect of clonidine (�2-adrenoceptor agonist) onnoradrenaline-stimulated lipolysis in adipocytes isolated from epi-didymal adipose deposits of 30-wk-old Wistar and Lou/C rats. In eachgroup, values are mean � SEM of five to eight experiments performedin quadruplicate. The maximal lipolytic effect (100%) corresponds tothe response induced by 10�6 M noradrenaline. a, Difference from themaximal stimulation (P � 0.05). b, Difference between 10�6 and 10�3
M clonidine estimated using two-way ANOVA (Lou/C vs. Wistar) (P �0.05).
0
20
40
60
80
100
120
0 100 200 300 400 500 600 700 800 900 1000
Insulin, µU/ml
Gly
cero
l rel
ease
, % o
f th
e m
axim
al s
tim
ulat
ion Wistar
Lou/C£
£
££
FIG. 7. Antilipolytic effect of insulin on noradrenaline-stimulated li-polysis in adipocytes isolated from epididymal adipose deposits of30-wk-old Wistar and Lou/C rats. The dose-response curves are ex-pressed as the percentage of maximal stimulation by 10�6 M nor-adrenaline. In each group, values are mean � SEM of six experimentsperformed in quadruplicate. No significant difference was found be-tween Wistar and Lou/C rats. £, Significant difference from the max-imal stimulation estimated using two-way ANOVA (Lou/C vs. Wistar)(P � 0.05).
[3H] water incorporated into fatty acids
0
0.5
1.0
1.5
2.0
2.5
3.0
e WAT r WAT sc WAT
µmol
e 3 H
/g.h
our
WistarLou/C
0
0.5
1.0
1.5
2.0
2.5
Wistar Lou/C
µmol
e 3 H
/g.h
our
Fatty acids
0
0.2
0.4
0.6
0.8
1
1.2Sterols
µmol
e 3 H
/g.h
our
*
[3H] water incorporated into
Wistar Lou/C
A
B
FIG. 8. A, In vivo synthesis of fatty acids in WAT pads of 30-wk-oldWistar and Lou/C rats. B, Hepatic synthesis of fatty acids and sterolsin 30-wk-old Wistar and Lou/C rats. Each value represents themean � SD of four animals of each strain. [3H] water was injected ip,and 1 h later, liver and several white fat pads were removed for themeasurement of their content of [3H]-labeled fatty acids and/or dig-itonin-precipitable sterols. *, Difference between Wistar and Lou/Crats estimated using Mann-Whitney U test (P � 0.05).
Soulage et al. • Energy Balance and Adiposity in Lou/C Rat Endocrinology, February 2008, 149(2):615–625 621

in the WAT and participate in the modest WAT accretionobserved in Lou/C rats.
Energy accumulation, i.e. increased adiposity, results fromthe strict difference between energy intake and energy ex-penditure. Therefore, we thoroughly compared the meta-bolic profiles of Lou/C and Wistar rats through the mea-surements of caloric intake, energy expenditure, andphysical activity. Some discrepancies exist in the literatureregarding the caloric intake of Lou/C rats. Several authorsreported that Lou/C rats exhibit a spontaneous 40% reduc-tion in caloric intake and, therefore, presented Lou/C strainas a spontaneous model of caloric restriction (3, 8, 25, 26).Other investigators did not observe any reduction in foodintake when compared with obesity prone strains Wistar orFischer F344 rats (7, 27, 28). These discrepancies result mainlyfrom differences in the expression of caloric intake, namelywhether these results were normalized for body mass ormetabolic mass (kg 0.67). In the present study, we observeda slightly higher food intake in Lou/C compared with age-matched Wistar rats when results were normalized for thebody mass. Lou/C rats exhibited a 11% increase in dailyenergy expenditure compared with Wistar rats due to in-creases in energy expenditure in both quiescent (�13%) andactive (�10%) phases. The RQ was very similar in the two
strains excluding a large difference in metabolic fuel utili-zation, and indicated the oxidation of both carbohydratesand lipids as energy substrates. Lou/C rats showed a de-crease in feed efficiency, as estimated by the ratio of totalbody mass gain divided by total amount of food consumedby the same animal. This ratio is significantly lower in Lou/Crats, suggesting the occurrence of futile cycles in the meta-bolic pathways. Locomotor activity was significantly in-
-25-50-75-100% 0% 25 50 75 100%
18:0
20:0
22:0
24:0
16:1
n-7
18:1
n-7
16:1
n-9
18:1
n-9
20:1
n-9
20:3
n-9
22:1
n-9
24:1
n-9
18:3
n-3
20:5
n-3
22:5
n-3
22:6
n-3
18:2
n-6
18:3
n-6
20:2
n-6
20:3
n-6
20:4
n-6
22:2
n-6
22:4
n-6
22:5
n-6
Saturated n-7 n-9 n-3 n-6
16:0
rWAT a ab b c
LIVER a aa b bc cc c c c c
PLASMA b c c a b c c c c a c
FIG. 9. Analysis of fatty acid composition. “Heat map” showing in-dividual fatty acid proportion in total lipid extracts from plasma, liver,and rWAT of 30-wk-old Lou/C rats. The fatty acid composition wasdetermined using gas chromatography coupled to a flame-ionizationdetector. Quantitative data were used to calculate the percent in-crease (green) or decrease (yellow to red) in Lou/C compared withWistar rats (n � 7 in each group). Significant differences were ana-lyzed using the Student’s t test with color denoting P � 0.05. Differ-ences not reaching P � 0.05 are shown in black. Statistical signifi-cance: a, P � 0.05, b, P � 0.01, and c, P � 0.005.
rWAT
0.000,050.10
0.15
0.200.250.300.35
Wistar Lou/C0
2
4
6
8
10
12
*
Wistar Lou/C
Liver
0.00
0.04
0.08
0.12
0.16
***
0,0
0,2
0,4
0,6
*
Plasma
C16 :1 (n-7)/C16 :0 C18 :1 (n-9)/C18 :0
0.00
0.04
0.08
0.12
0.16
0.20
***
0,00,10,20,30,40,50,60,70,80,9
***
FIG. 10. Lipid desaturation indexes in plasma, liver, and rWAT from30-wk-old Wistar and Lou/C rats. Saturated and MUFAs in plasma,liver, and rWAT were measured by gas chromatography coupled witha flame-ionization detector. Index of desaturation corresponds to theratio between the proportions of MUFAs and saturated fatty acids.Data are expressed as mean � SEM from seven in each group. *, P �0.05; **, P � 0.005, difference between Wistar and Lou/C rats esti-mated using the Student’s t test. C16:0, Palmitic acid; C16:1n-7,palmitoleic acid; C18:0, stearic acid; C18:1n-9, oleic acid.
TABLE 7. Fatty acid composition of total lipids extracted from plasma, liver, or rWAT of 30-wk-old Wistar and Lou/C rats
Tissue Strain SFA MUFA PUFA n-6 n-3 n-6/n-3
Wistar 39.1 � 0.6 19.1 � 1.1 41.7 � 1.0 36.1 � 1.0 5.5 � 0.2 6.6 � 0.3Plasma Lou/C 42.7 � 0.5 11.8 � 0.5 45.5 � 0.3 40.9 � 0.3 4.5 � 0.1 9.2 � 0.3
P value a b c b b b
Wistar 28.7 � 0.5 37.0 � 1.5 34.3 � 1.9 32.2 � 1.9 2.0 � 0.2 16.0 � 1.2rWAT Lou/C 34.9 � 0.5 35.6 � 0.8 29.5 � 1.1 28.1 � 1.1 1.4 � 0.1 20.6 � 1.5
P value b ns ns ns b nsWistar 40.9 � 0.8 16.0 � 0.8 43.1 � 0.3 34.7 � 0.3 8.3 � 0.2 4.2 � 0.1
Liver Lou/C 44.5 � 0.5 12.3 � 0.6 43.2 � 0.4 34.7 � 0.4 8.5 � 0.15 4.1 � 0.1P value c c ns ns ns ns
Data are expressed as mean � SEM for seven rats in each strain. Fatty acid compositions are expressed in percentage (%) of total fatty acidcontent. Differences between Wistar and Lou/C rats were estimated using the Student’s t test. ns, Not significant; PUFA, polyunsaturated fattyacids; SFA, saturated fatty acids.
a P � 0.01.b P � 0.005.c P � 0.05.
622 Endocrinology, February 2008, 149(2):615–625 Soulage et al. • Energy Balance and Adiposity in Lou/C Rat

creased in Lou/C compared with Wistar rats and may con-tribute to some extent to a higher energy dissipation (29).Thus, the lower adiposity observed in Lou/C rats could bepartly explained by a higher locomotor activity associatedwith a higher energy expenditure. However, during the qui-escent phase, the metabolic rate was higher in Lou/C thanin Wistar rats, suggesting that the higher daily energy ex-penditure cannot totally be explained by an increased phys-ical activity. We previously reported that Lou/C rats exhib-ited a selective increase in noradrenaline content andcatecholamine biosynthesis activity in iBAT (7, 18), the main
site of facultative thermogenesis in rodents. Obese rats, suchas Zucker fatty rats, exhibit a blunted sympathetic activity inBAT that results in its reduced thermogenic function and, inthis way, contributes to the development of obesity (30–32).We may hypothesize that a higher sympathetic tone inLou/C rats, resulting in an enhanced thermogenic function,could account for the higher metabolic rate observed in thisstrain. An alternative hypothesis is that the reduced fat dep-osition decreases the body isolation, increases heat dissipa-tion, and increases heat loss. In search of additional factorsto explain the modest fat deposition in Lou/C rats, we in-vestigated the metabolic potentialities of their white adipo-cytes. Indeed, a reduced adiposity could result from an in-creased lipolytic activity, a lower lipogenic activity, or both.To test these hypotheses, we measured the lipolysis on iso-lated adipocytes, whereas lipogenesis was measured in vivousing tritiated water. No difference was noticed in lipidbiosynthesis activity (lipogenesis) measured through the in-corporation of in [3H] water in fatty acids in liver or WAT.However, in good agreement with the higher plasma cho-lesterol concentrations, a significant increase in hepatic ste-rologenesis was observed in Lou/C rats. The lipolysis, i.e. thecapacity to hydrolyze triglycerides and release glycerol, wasmeasured in isolated epididymal adipocytes, in the basalstate, and after stimulation with noradrenaline. The resultinglipolysis revealed neither changes in the basal productionrate of glycerol, nor in noradrenaline sensitivity as indicatedby similar EC50 values between the two strains. However, wenoticed a strong decrease in noradrenaline responsiveness inadipocytes from Lou/C rats as indicated by the bluntedVMAX value. This decreased responsiveness without de-creased sensitivity could result from a smaller size of Lou/Cadipocytes and, thus, a reduced number of noradrenalinebinding sites. Indeed, when results are expressed as percent-age of the VMAX, no difference was noted. Thus, an increasedlipid mobilization could not explain the difference observedin adiposity between the two strains. Lafontan and Berlan(33) reported that the bigger the adipocytes are, the more theypossess antilipolytic �2-adrenoceptors. Thus, with an intactsensitivity to noradrenaline, the small size of adipocytes fromLou/C rats could result from a decreased number of �2-adrenoceptors. Surprisingly, the antilipolytic �2-adrenergicresponsiveness was enhanced in Lou/C rats becauseclonidine produced a significant inhibition of noradrenaline-stimulated lipolysis. The use of the highly selective �3-ad-renergic agonist BRL 37344 led to a higher lipolytic activityin Lou/C adipocytes than in Wistar ones, suggesting a higherdensity and/or higher affinity of �3-adrenergic receptors onLou/C adipocytes. In the present study, several adiposedepots have been dissected out, however, for practical rea-sons, it has not been possible to perform the lipolysis mea-surements on each depot. Because lipolysis measurementswere restricted to epididymal fat pad, we cannot exclude thatthe regional differences exist between adipose deposits.
We used a comprehensive lipid profiling to characterizethe lipid metabolism in liver and WAT of obese-resistantLou/C rats. This lipidomic analysis of tissues and plasmafrom Lou/C and Wistar rats reveals profound differences inlipid metabolism between the two strains. Fatty acid com-position in Lou/C (plasma, WAT, and liver) rats is charac-
0
0.1
0.2
0.3
0.4
0.5
0.6
0.7
0.8
Liver WAT
mR
NA
leve
l, A
U
FASWistarLou/C
0
0.2
0.4
0.6
0.8
1.0
1.2
1.4
1.6
1.8
Liver WAT
mR
NA
leve
l, A
U
WistarLou/C
SCD-1
0
0.1
0.2
0.3
0.4
0.5
0.6
0.7
0.8
0.9
WAT
mR
NA
leve
l, A
U
LPL
**
A
B
C
FIG. 11. Gene expression in liver and rWAT. FAS (A), SCD-1 (B), andLPL (C) expression in 30-wk-old Wistar and Lou/C rats (n � 5 pergroup) were measured using semiquantitative RT-PCR. Quantifica-tion of RT-PCR was performed by scanning densitometry using �-ac-tin as a control to normalize gene expression. **, Difference betweenWistar and Lou/C rats estimated using the Student’s t test (P � 0.01).AU, Arbitrary units.
Soulage et al. • Energy Balance and Adiposity in Lou/C Rat Endocrinology, February 2008, 149(2):615–625 623

terized by an increased content of saturated fatty acids anda decreased content in monosaturated fatty acids. The serumfatty acid composition has predicted the risk of diabetes,cardiovascular diseases, (34) and metabolic syndrome (35,36). Indeed, the fatty acid composition in individuals withinsulin resistance is characterized by high concentrations ofpolyunsaturated fatty acids (18:2n-6) and a proportionallyhigher level of palmitoleic (16:1n-7) and di-homo-�-linolenic(20:3n-6) acids (36). In plasma Lou/C rats, 18:2n-6 was founddecreased compared with Wistar rat, which is consistentwith the increase observed in man with metabolic syndromesince Lou/C rat showed an improved insulin sensitivity (7).Plasma concentrations of 16:1n-7 and 20:3n-6 have beenfound decreased in Lou/C compared with Wistar rats, whichcan be observed in insulin-resistant patients, suggesting thatthese fatty acids do not account for insulin sensitivity inLou/C rats. Other findings have suggested a physiologicaland pathological role of fatty acid composition on proteinhandling that is proposed to be relevant to insulin sensitivity(37). Indeed, acyl-coenzyme A synthase-1 ligates NEFA tocoenzyme A (CoA) and directs fatty acids primarily intotriglyceride synthetic pathways (38). Its expression was as-sociated negatively with adipose tissue 16:0 and positivelywith NEFA 16:1 (37). Adipose tissue 16:0 content was pos-itively related to insulin sensitivity (homeostatic model as-sessment index). Fatty acid transport protein expression wascorrelated with adipose tissue 20:4 n-6, which in turn posi-tively correlated with insulin sensitivity (homeostatic modelassessment index). Although these data obtained in Lou/Crats are in good agreement with results from human beings,they do not allow the identification of causal relationships;nevertheless, they suggest a link between fatty acids, ACS1,and fatty acid transport protein expression levels and insulinresistance. Genetic differences in fatty acid desaturasesmight predispose to obesity. SCDs convert some saturatedfatty acids into MUFAs and represent the rate-limiting stepin MUFA biosynthesis in vivo. The natural substrates of theseenzymes are palmitoyl-CoA (16:0) and stearoyl-CoA (18.0),which are converted into palmitoleoyl-CoA (16:1n-7) andoleoyl-CoA (18:1n-9), respectively. Although several iso-forms of SCD exist in rodents, only SCD-1 is expressed inliver and WAT. There is now accumulating evidence thatSCD-1 plays a crucial role in lipid metabolism and bodyweight control (39, 40). Indeed, mice with SCD-1 inactivation,either using knockout mutation or RNA interference, exhib-ited a hypermetabolism, hyperactivity, reduced adiposity,and resistance to diet-induced obesity (41–44). Interestingly,Lou/C rats share several metabolic characteristics with SCD-1-deficient animals, namely hypermetabolism, increased lo-comotor activity, reduced adiposity, and resistance to obe-sity. In good agreement, the lipid profiling reveals that inplasma and liver from Lou/C rats, there were lower MUFAsthan Wistar rats, and that C16 and C18 desaturation indexeswere significantly blunted, suggesting a defect in the SCDpathways. This would imply that the particular metabolismand outstanding leanness of Lou/C rats might result from aninherited deficiency in SCD-1. To explore this hypothesis, wemeasured the relative expression of the SCD-1 gene in WATand liver of both strains. Surprisingly, we failed to find anydifference in the level of SCD-1 expression in liver or WAT
of Lou/C compared with Wistar rats. This finding excludesa genetic deficiency in SCD-1 in the Lou/C strain. However,the changes in C18 and C16 desaturation index reportedpreviously clearly indicate a defect in SCD-1 activity. Thesedifferences could result from different levels of SCD-1 en-zymatic activity and regulations. However, these points needfurther exploration.
Despite extensive literature, the present study constitutesthe first description of cellularity and metabolic properties ofWAT in Lou/C obesity-resistant rats. The outstanding lean-ness and the modest fat accretion observed in the Lou/Cstrain might result from systemic differences between thetwo strains rather than from white adipocyte metabolic char-acteristics. The increased physical activity and higher energyexpenditure observed in Lou/C rats can partly explain thelower adiposity observed in these rats. Whether differencesin sympathetic activity in Lou/C tissues involved in energyregulation could account for the leanness of Lou/C rats re-mains to be explored.
Acknowledgments
Received March 7, 2007. Accepted November 5, 2007.Address all correspondence and requests for reprints to: Dr. Chris-
tophe Soulage, U-870 Institut National de la Sante et de la RechercheMedicale, Unite 1235 Institut National de la Recherche Agronomique,Institut National des Sciences Appliquees-Lyon, Universite Claude Ber-nard Lyon, Hospices Civils de Lyon, Regulations Metaboliques, Nutri-tion et Diabetes, Building Louis Pasteur (406), F-69621 Villeurbannecedex, France. E-mail: [email protected].
This work was supported by Institut National de la Sante et de laRecherche Medicale, l’Institut Multidisciplinaire de Biochimie des Lipi-des, and Region Rhone-Alpes. A.F.S. was a recipient Capes Brazil (No.0159 026). B.Z. was supported by a grant from the French “Ministere del’Education Nationale, de la Recherche et de la Technologie.”
Disclosure Statement: The authors have nothing to declare.
References
1. Costanzo PR, Schiffman SS 1989 Thinness—not obesity—has a genetic com-ponent. Neurosci Biobehav Rev 13:55–58
2. Bulik CM, Allison DB 2001 The genetic epidemiology of thinness. Obes Rev2:107–115
3. Couturier K, Servais S, Koubi H, Sempore B, Sornay-Mayet MH, Cottet-Emard JM, Lavoie JM, Favier R 2002 Metabolic characteristics and bodycomposition in a model of anti-obese rats (Lou/C). Obes Res 10:188–195
4. Alliot J, Boghossian S, Jourdan D, Veyrat-Durebex C, Pickering G, Meynial-Denis D, Gaumet N 2002 The LOU/c/jall rat as an animal model of healthyaging? J Gerontol A Biol Sci Med Sci 57:B312–B320
5. Newby FD, DiGirolamo M, Cotsonis GA, Kutner MH 1990 Model of spon-taneous obesity in aging male Wistar rats. Am J Physiol 259(6 Pt 2):R1117–R1125
6. Veyrat-Durebex C, Alliot J 1997 Changes in pattern of macronutrient intakeduring aging in male and female rats. Physiol Behav 62:1273–1278
7. Perrin D, Soulage C, Pequignot JM, Geloen A 2003 Resistance to obesity inLou/C rats prevents ageing-associated metabolic alterations. Diabetologia46:1489–1496
8. Mitchell SE, Nogueiras R, Rance K, Rayner DV, Wood S, Dieguez C, Wil-liams LM 2006 Circulating hormones and hypothalamic energy balance: reg-ulatory gene expression in the Lou/C and Wistar rats. J Endocrinol 190:571–579
9. Depocas F, Hart JS 1957 Use of the Pauling oxygen analyzer for measurementof oxygen consumption of animals in open-circuit systems and in a short-lag,closed-circuit apparatus. J Appl Physiol 10:388–392
10. Rodbell M 1963 Effects of hormones on glucose metabolism and lipolysis.J Biol Chem 239:375–380
11. Briquet-Laugier V, Dugail I, Ardouin B, Le Liepvre X, Lavau M, Quignard-Boulange A 1994 Evidence for a sustained genetic effect on fat storage capacityin cultured adipose cells from Zucker rats. Am J Physiol 267(3 Pt 1):E439–E446
12. Smith U, Sjostrom L, Bjornstorp P 1972 Comparison of two methods fordetermining human adipose cell size. J Lipid Res 13:822–824
13. Bjornheden T, Jakubowicz B, Levin M, Oden B, Eden S, Sjostrom L, LonnM 2004 Computerized determination of adipocyte size. Obes Res 12:95–105
624 Endocrinology, February 2008, 149(2):615–625 Soulage et al. • Energy Balance and Adiposity in Lou/C Rat

14. Folch J, Lees M, Sloane-Stanley GH 1957 A simple method for the isolationand purification of total lipids from animal tissues. J Biol Chem 226:497–509
15. Feingold KR, Grunfeld C 1987 Tumor necrosis factor-� stimulates hepaticlipogenesis in the rat in vivo. J Clin Invest 80:184–190
16. Lowenstein JM, Brunengraber H, Wadke M 1975 Measurement of rates oflipogenesis with deuterated and tritiated water. Methods Enzymol 35:279–287
17. Heusner AA 1985 Body size and energy metabolism. Annu Rev Nutr 5:267–29318. Perrin D, Mamet J, Geloen A, Morel G, Dalmaz Y, Pequignot JM 2003
Sympathetic and brain monoaminergic regulation of energy balance in obesity-resistant rats (Lou/C). Auton Neurosci 109:1–9
19. Cousin B, Casteilla L, Lafontan M, Ambid L, Langin D, Berthault MF,Penicaud L 1993 Local sympathetic denervation of white adipose tissue in ratsinduces preadipocyte proliferation without noticeable changes in metabolism.Endocrinology 133:2255–2262
20. Foster MT, Bartness TJ 2006 Sympathetic but not sensory denervation stim-ulates white adipocyte proliferation. Am J Physiol Regul Integr Comp Physiol291:R1630–R1637
21. Shi H, Song CK, Giordano A, Cinti S, Bartness TJ 2005 Sensory or sympa-thetic white adipose tissue denervation differentially affects depot growth andcellularity. Am J Physiol Regul Integr Comp Physiol 288:R1028–R1037
22. Bowers RR, Festuccia WT, Song CK, Shi H, Migliorini RH, Bartness TJ 2004Sympathetic innervation of white adipose tissue and its regulation of fat cellnumber. Am J Physiol Regul Integr Comp Physiol 286:R1167–R1175
23. Youngstrom TG, Bartness TJ 1998 White adipose tissue sympathetic nervoussystem denervation increases fat pad mass and fat cell number. 1998. Am JPhysiol Regul Integr Comp Physiol 275(5 Pt 2):R1488–R1493
24. Raynolds MV, Awald PD, Gordon DF, Gutierrez-Hartmann A, Rule DC,Wood WM, Eckel RH 1990 Lipoprotein lipase gene expression in rat adipo-cytes is regulated by isoproterenol and insulin through different mechanisms.Mol Endocrinol 4:1416–1422
25. Kappeler L, Zizzari P, Grouselle D, Epelbaum J, Bluet-Pajot MT 2004 Plasmaand hypothalamic peptide-hormone levels regulating somatotroph functionand energy balance in fed and fasted states: a comparative study in four strainsof rats. J Neuroendocrinol 16:980–988
26. Couturier K, Servais S, Koubi H, Sempore B, Cottet-Emard JM, Guigas B,Lavoie JM, Favier R 2004 Metabolic and hormonal responses to exercise in theanti-obese Lou/C rats. Int J Obes Relat Metab Disord 28:972–978
27. Abdoulaye D, Wetzler S, Goubern M, Helies JM, Fromentin G, Tome D,Larue Achagiotis C 2006 Comparison of energy balance in two inbred strainsof rats: Fischer F344 prone to obesity and Lou rats resistant to obesity. PhysiolBehav 87:245–250
28. Helies JM, Diane A, Langlois A, Larue-Achagiotis C, Fromentin G, Tome D,Mormede P, Marissal-Arvy N 2005 Comparison of fat storage between Fischer344 and obesity-resistant Lou/C rats fed different diets. Obes Res 13:3–10
29. Girardier L, Clark MG, Seydoux J 1995 Thermogenesis associated with spon-taneous activity: an important component of thermoregulatory needs in rats.J Physiol 488(Pt 3):779–787
30. York DA, Marchington D, Holt SJ, Allars J 1985 Regulation of sympathetic
activity in lean and obese Zucker (fa/fa) rats. Am J Physiol 249(3 Pt 1):E299–E305
31. Rehorek A, Kerecsen L, Muller F 1987 Measurement of tissue catecholaminesof obese rats by liquid chromatography and electrochemical detection. BiomedBiochim Acta 46:823–827
32. Blouquit MF, Geloen A, Koubi H, Edwards D, Gripois D 1993 Decreasednorepinephrine turnover rate in the brown adipose tissue of pre-obese fa/faZucker rats. J Dev Physiol 19:247–251
33. Lafontan M, Berlan M 1995 Fat cell �2-adrenoceptors: the regulation of fat cellfunction and lipolysis. Endocr Rev 16:716–738
34. Wang L, Folsom AR, Eckfeldt JH 2003 Plasma fatty acid composition andincidence of coronary heart disease in middle aged adults: the AtherosclerosisRisk in Communities (ARIC) Study. Nutr Metab Cardiovasc Dis 13:256–266
35. Tremblay AJ, Despres JP, Piche ME, Nadeau A, Bergeron J, Almeras N,Tremblay A, Lemieux S 2004 Associations between the fatty acid content oftriglyceride, visceral adipose tissue accumulation, and components of theinsulin resistance syndrome. Metabolism 53:310–317
36. Warensjo E, Riserus U, Vessby B 2005 Fatty acid composition of serum lipidspredicts the development of the metabolic syndrome in men. Diabetologia48:1999–2005
37. Gertow K, Rosell M, Sjogren P, Eriksson P, Vessby B, de Faire U, HamstenA, Hellenius ML, Fisher RM 2006 Fatty acid handling protein expression inadipose tissue, fatty acid composition of adipose tissue and serum, and mark-ers of insulin resistance. Eur J Clin Nutr 60:1406–1413
38. Coleman RA, Lewin TM, Van Horn CG, Gonzalez-Baro MR 2002 Do long-chain acyl-CoA synthetases regulate fatty acid entry into synthetic versusdegradative pathways? J Nutr 132:2123–2126
39. Cohen P, Ntambi JM, Friedman JM 2003 Stearoyl-CoA desaturase-1 and themetabolic syndrome. Curr Drug Targets Immune Endocr Metabol Disord3:271–280
40. Dobrzyn P, Dobrzyn A, Miyazaki M, Cohen P, Asilmaz E, Hardie DG,Friedman JM, Ntambi JM 2004 Stearoyl-CoA desaturase 1 deficiency increasesfatty acid oxidation by activating AMP-activated protein kinase in liver. ProcNatl Acad Sci USA 101:6409–6414
41. Ntambi JM, Miyazaki M, Stoehr JP, Lan H, Kendziorski CM, Yandell BS,Song Y, Cohen P, Friedman JM, Attie AD 2002 Loss of stearoyl-CoA desatu-rase-1 function protects mice against adiposity. Proc Natl Acad Sci USA 99:11482–11486
42. Jiang G, Li Z, Liu F, Ellsworth K, Dallas-Yang Q, Wu M, Ronan J, Esau C,Murphy C, Szalkowski D, Bergeron R, Doebber T, Zhang BB 2005 Preventionof obesity in mice by antisense oligonucleotide inhibitors of stearoyl-CoAdesaturase-1. J Clin Invest 115:1030–1038
43. Gutierrez-Juarez R, Pocai A, Mulas C, Ono H, Bhanot S, Monia BP, RossettiL 2006 Critical role of stearoyl-CoA desaturase-1 (SCD1) in the onset of diet-induced hepatic insulin resistance. J Clin Invest 116:1686–1695
44. Sampath H, Miyazaki M, Dobrzyn A, Ntambi JM 2007 Stearoyl-CoA de-saturase-1 mediates the pro-lipogenic effects of dietary saturated fat. J BiolChem 282:2483–2493
Endocrinology is published monthly by The Endocrine Society (http://www.endo-society.org), the foremost professional society serving theendocrine community.
Soulage et al. • Energy Balance and Adiposity in Lou/C Rat Endocrinology, February 2008, 149(2):615–625 625