ONTARIO TISSUE PAPER INDUSTRY - MPAC
44
ONTARIO TISSUE PAPER INDUSTRY Economic Obsolescence Analysis As of January 1, 2015 Prepared for Municipal Property Assessment Corporation
-
Upload
khangminh22 -
Category
Documents
-
view
2 -
download
0
Transcript of ONTARIO TISSUE PAPER INDUSTRY - MPAC

ONTARIO TISSUE PAPER INDUSTRY Economic Obsolescence Analysis As of January 1, 2015 Prepared for
Municipal Property Assessment Corporation
American Appraisal Canada, Inc. 3300 Bloor Street West, Centre Tower, Suite 2250, Toronto, ON M8X 2X3 tel 416-593-4050/fax 416-593-5168
Leading / Thinking / Performing
May 19, 2015 Mr. Paul Campbell Director Valuation and Customer Relations, Business Properties Municipal Property Assessment Corporation 1340 Pickering Parkway, Suite 101 Pickering, ON L1V OC4 Dear Mr. Campbell: At your request, American Appraisal Canada, Inc. prepared the attached report concerning the estimation of economic obsolescence in the Ontario tissue paper industry as of January 1, 2015. While we understand that our report may be used by MPAC as an input to establish the current value of land as at January 1, 2016, the information required to calculate economic obsolescence at that future date has not yet been revealed. Our report and conclusions can be updated when such information becomes available. Economic events and/or changes in the relative competitiveness of the subject industry between January 1, 2015 and January 1, 2016, may lead to a concluded rate of economic obsolescence different to that cited in this report. If you have any questions or if there is anything else we can do for you, please contact either of us at 416-593-3409 or 416-593-3408. Sincerely, James A. Skinner MBA, CPA, CA, CBV Michael A. Smith, MBA, CFA, CBV Vice President and Senior Managing Director Director

ONTARIO TISSUE PAPER INDUSTRY Economic Obsolescence Analysis As of January 1, 2015 Prepared for
Municipal Property Assessment Corporation

Table of Contents
Leading / Thinking / Performing i
Table of Contents EXECUTIVE SUMMARY ............................................................................................................................... 1
INTRODUCTION ......................................................................................................................................... 2
Purpose and Scope of Work ............................................................................................................ 2 Economic Obsolescence.................................................................................................................. 3
ECONOMIC CONDITIONS ............................................................................................................................ 4
Canada ............................................................................................................................................. 4 United States .................................................................................................................................... 8
THE ONTARIO TISSUE PAPER INDUSTRY .................................................................................................. 12
Forest Products in Ontario ............................................................................................................. 12 Tissue Paper Industry Overview .................................................................................................... 12 Existence of Economic Obsolescence ........................................................................................... 18
QUANTIFICATION OF ECONOMIC OBSOLESCENCE ..................................................................................... 20
Utilization Analysis ......................................................................................................................... 20 Gross Margin Analysis ................................................................................................................... 21 Return-on-Capital Analysis ............................................................................................................ 22 Price-to-Book Ratio Analysis ......................................................................................................... 23 Wood Fibre Cost Analysis .............................................................................................................. 24 Correlation and Conclusion for the Ontario Tissue Paper Industry ............................................... 26
CONCLUSION .......................................................................................................................................... 27
Exhibits A Economic Obsolescence Summary
B Utilization Analysis
C Gross Margin Analysis
D Return-on-Capital Analysis
E Price-to-Book Ratio Analysis
F Assumptions and Limiting Conditions

Executive Summary
Leading / Thinking / Performing 1
May 19, 2015 Municipal Property Assessment Corporation 1340 Pickering Parkway, Suite 101 Pickering, ON L1V OC4
EXECUTIVE SUMMARY American Appraisal Canada, Inc. (“American Appraisal”) was retained by the Municipal Property Assessment Corporation (“MPAC”) to complete an economic obsolescence analysis pertaining to the Ontario tissue paper industry (the “Industry”) as of January 1, 2015 (the “Effective Date”). We submit our findings in this narrative report. The purpose of this study was to determine, at the Industry level, if economic obsolescence was applicable to the real property of firms operating in the Industry and to express our estimate of the quantum of any such obsolescence. It is entirely inappropriate to use this report for any purpose other than the one stated. Only the signed client of record, MPAC, is the intended user of, and may rely on, American Appraisal’s report. No third party shall have the right of reliance on this report, and neither receipt nor possession of the report by any third party shall create any express or implied third-party beneficiary rights. Based on the information and analysis summarized in this report, it is our view that economic obsolescence in the Ontario tissue paper industry at January 1, 2015 was reasonably estimated as follows:
Industry
Economic Obsolescence at
Jan. 1, 2015
Ontario Tissue Paper 13.0%

Introduction
Leading / Thinking / Performing 2
INTRODUCTION
Purpose and Scope of Work MPAC is responsible for classifying and valuing all real property within the Province of Ontario in compliance with the Assessment Act and regulations established by the Government of Ontario. As required by the Province’s legislation, assessed value is based on Current Value. The Assessment Act defines Current Value in the following manner:
“in relation to land, the amount of money the fee simple, if unencumbered, would realize if sold at arm’s length by a willing seller to a willing buyer; (“valeur actuelle”)”
This means the price a property might reasonably be expected to sell for, in its current condition, on the open market. In order to achieve MPAC’s desired goal of equitability, the process of Current Value assessment parallels the intent of market value; its objective is to quantify the way in which location, physical characteristics and demand impact the value of a given real property. This is readily achievable when transaction data is available to compare a subject property to similar properties in the same market area. The more unique a property is, however, the more difficult it becomes to achieve and to be seen to achieve the objective of equitability amongst the Province’s taxpayers. Current Value assessment of special purpose manufacturing plants, including those operating in the Industry, is particularly challenging because of their inevitable uniqueness. We understand that MPAC relies upon the cost approach to assess special purpose manufacturing facilities, applied in the following manner:
i. land value is based on highest and best use as though vacant; ii. cost new of improvements is derived using MPAC’s Automated Cost System; iii. physical depreciation is based upon specific MPAC guidelines; and iv. functional obsolescence is estimated using MPAC guidelines.
MPAC has advised American Appraisal that it is contemplating refinement of this determination of value through the inclusion of a deduction for economic obsolescence (“EO”). Accordingly, our analysis resulted in an estimate of the EO that may be broadly present within the Ontario tissue paper industry. Our estimate of EO may not be applicable to specific facilities, but has been provided at the Industry level and may or may not apply to individual tax payers. The primary sources of information used in our investigation included the following:
Statistics Canada;
Industry Canada;

Introduction
Leading / Thinking / Performing 3
North American Wood Fibre Review;
RISI, Inc.;
Standard & Poor’s Capital IQ database;
Standard & Poor’s Industry Surveys – Paper & Forest Products;
Ontario Ministry of Natural Resources and Forestry;
Board of Governors of the Federal Reserve System;
United States Census Bureau;
regulatory filings of publicly traded industry participants; and
other information as described in the relevant sections of this report.
We understand that MPAC expected, and accordingly we confirm that this analysis was performed, using data and information that was publicly available and that our analysis has been performed without the benefit of inspecting any real property locations in the subject Industry.
Economic Obsolescence Economic obsolescence, also referred to as external obsolescence, is defined as:
“a form of depreciation or loss in value of usefulness of a property caused by factors external to the property. These may include such things as the economics of the industry; availability of financing; loss of material and/or labor sources; passage of new legislation; changes in ordinances; increased cost of raw materials, labor or utilities (without an offsetting increase in product price); reduced demand for the product; increased competition; inflation or high interest rates; or similar factors.”1
The economic principles of supply, demand, and competition drive the loss in value associated with EO. Typically, EO cannot be reduced by capital investments, but it can change and even decline to zero through changing economic conditions.
1 Valuing Machinery and Equipment: The Fundamentals of Appraising Machinery and Technical Assets, Second Edition, American Society of Appraisers, 2005.

Economic Conditions
Leading / Thinking / Performing 4
ECONOMIC CONDITIONS A sound analysis of economic obsolescence must consider current and prospective economic conditions, in both the national economies in which the subject Industry operates, and in the Industry itself. The major variables reviewed in order to evaluate the overall state of a national economy include, among others, the current level of and changes in the real gross domestic product (“GDP”), interest rates, unemployment rates and inflation. Given the impact of both the Canadian and U.S. economies on the Industry analyzed, an overview of those economies for the last several years, as well as a consideration of forecast data follows.
Canada
Gross Domestic Product
GDP measures the value of all final goods and services produced in a given economy. Two measures of GDP are currently quoted, nominal and real GDP. Due to inflationary pressures, nominal GDP will tend to increase over time, thus preventing analysts from obtaining an accurate picture of the overall economy. As a result, a more accurate measure of economic growth is obtained using real GDP. Real GDP removes the effects of inflation from nominal GDP, thereby increasing comparability and consistency. The following excerpts are from the Bank of Canada’s January 2015 Monetary Policy Report.
Oil prices have plummeted over the past six months. Lower oil prices are expected to boost global economic growth while widening the divergences among economies. These developments are taking place against the backdrop of a modest pickup in global growth. Within this mixed global picture, the main area of strength is the United States, Canada’s largest trading partner. Economic growth in the United States is expected to become increasingly self-sustaining, further propelled by the large positive impact from oil-price declines, despite the drag from the appreciation of the U.S. dollar. In other advanced economies, particularly the euro area and Japan, growth is expected to remain weak despite additional policy stimulus, as the headwinds from deleveraging and uncertainty dissipate gradually. Those headwinds are also expected to temper the positive effects of lower oil prices on advanced economies. In the rest of the world, GDP growth is expected to be held back by the negative effects of lower oil prices on oil-exporting countries; however, growth should strengthen gradually through 2016 as foreign demand in advanced economies picks up and growth-enhancing structural reforms are implemented. Taking these various countervailing factors into account, the Bank of Canada (the “Bank”) anticipates a pickup in global economic growth to about 3.5% over the next two years. The oil price shock is occurring against a backdrop of solid and more broadly-based growth in Canada in recent quarters. Outside the energy sector, we are beginning to see the anticipated sequence of increased foreign demand, stronger exports, improved business confidence and

Economic Conditions
Leading / Thinking / Performing 5
investment, and employment growth. However, there is considerable uncertainty about the speed with which this sequence will evolve and how it will be affected by the drop in oil prices. Although there is considerable uncertainty around the outlook, the Bank is projecting real GDP growth will slow to about 1.5% and the output gap to widen in the first half of 2015. The negative impact of lower oil prices will gradually be mitigated by a stronger U.S. economy, a weaker Canadian dollar, and the Bank’s monetary policy response. The Bank expects Canada’s economy to gradually strengthen in the second half of this year, with real GDP growth averaging 2.1% in 2015 and 2.4% in 2016. The economy is expected to return to full capacity around the end of 2016, a little later than was expected in October.
Historical and forecast Canadian real GDP growth for 2006 to 2016 (projected) is shown below.
Year Annual Change
(%)
2006 2.8
2007 2.2
2008 0.7
2009 -2.8
2010 3.2
2011 2.5
2012 1.7
2013 2.0
2014* 2.4
2015* 2.1
2016* 2.4
*Estimated Sources: Bank of Canada & Statistics
Canada
Consumer Prices and Inflation Rates Compiled monthly by Statistics Canada, the Consumer Price Index (“CPI”) tracks retail price inflation (or deflation) for products sold to consumers. The rate of price inflation in the general economy directly influences pricing trends in the consumer goods market.
Both total CPI and core inflation have hovered near 2% in recent quarters, about 1 percentage point higher than a year earlier. The increase in core inflation over the past year is largely due to some sector-specific factors and the temporary effects of a lower Canadian dollar. Even without these factors, there has been a small upward drift in underlying inflation, consistent with the recent trend shown by alternative measures of core inflation.

Economic Conditions
Leading / Thinking / Performing 6
Core inflation is expected to ease through the middle of 2015 as the temporary boost to inflation from sector-specific factors falls out of the inflation data. Thereafter, core inflation is expected to remain fairly steady, at close to 2 per cent, as the downward pressure arising from excess supply and retail competition gradually dissipates and the upward pressure from the pass through of the depreciation of the dollar fades. Based on the assumption of oil prices at USD 60, total CPI inflation is projected to fall sharply and to be below the inflation-control range during 2015. Given the magnitude of the shock to oil prices, there is an exceptional amount of uncertainty about the profile for total CPI. For example, if the base-case scenario were to assume that oil prices were 10% higher (lower), total CPI inflation would be higher (lower) by 0.3 percentage points over the coming year. As the economy reaches and remains at full capacity by around the end of 2016, both core and total CPI are projected to be about 2% on a sustained basis.
Historical and forecast Canadian CPI growth rates for 2006 to 2016 (projected) are shown below.
Year CPI (%)
2006 2.0
2007 2.2
2008 2.3
2009 0.3
2010 1.8
2011 2.9
2012 1.5
2013 1.2
2014* 2.0
2015* 1.1
2016* 2.1
*Estimated Sources: Statistics Canada and
Consensus Economic Forecasts
Credit Conditions and Interest Rates According to the Bank’s Financial System Review – December 2014:
The unexpectedly slow global recovery has meant that monetary conditions in advanced economies, including Canada, have been very stimulative for much longer than envisioned in the aftermath of the financial crisis. Interest rate expectations and yields on long-term government bonds in advanced economies have continued to fall since June, reaching near-

Economic Conditions
Leading / Thinking / Performing 7
historical lows in Japan and the euro area, as the Bank of Japan and the European Central Bank continue to inject exceptional liquidity. Market rates suggest that the first rise in U.S. policy rates has been pushed back to the second half of 2015, in part reflecting concerns about spillovers to the United States from weakened growth prospects elsewhere in the world. Yields on Canadian long-term government bonds have followed their foreign counterparts: 10-year yields have declined by about 35 basis points since the June FSR and are now only about 35 basis points off their all-time lows. In addition, yields on provincial government bonds have also declined to near-historical lows. Corporate bond yields remain historically low, as fairly heavy issuance has been met by very strong investor demand. Overall business lending conditions have also continued to ease, owing to strong competition among financial institutions and capital markets. Borrowing costs for Canadian households remain at very low levels. Interest rates on 5-year mortgages have declined further over the past year, owing to both lower funding costs—proxied by the Canadian-dollar 5-year swap rate—and a 30-basis-point reduction in implied spreads. The Bank of Canada announced on December 3, 2014 that it was maintaining its target for the overnight rate at 1%. The target for the overnight rate is the average interest rate that the Bank wants to see in the marketplace for one-day (or "overnight") loans between financial institutions. Changes in this rate influence other interest rates, such as those for consumer loans and mortgages. The Bank Rate was correspondingly 1.25% and the deposit rate 0.75%.
Unemployment According to Statistics Canada, the nation’s unemployment rate remained at 6.6% in December, as gains in full-time work were offset by losses in part-time. Employment gains in 2014 amounted to 186,000 jobs, with increases in the second half of the year accounting for most of the growth. Provincially, unemployment declined in Prince Edward Island and was little changed in the other provinces. There were fewer people working in accommodation and food services as well as ‘other services’ in December. At the same time, employment increased in agriculture, public administration and natural resources. The number of self-employed people, as well as private and public sector employees was virtually unchanged in December. Historical and forecast Canadian unemployment rates were:

Economic Conditions
Leading / Thinking / Performing 8
Year Unemployment
Rate (%)
2006 6.3
2007 6.1
2008 6.2
2009 8.3
2010 8.0
2011 7.4
2012 7.3
2013 7.1
2014 6.9
2015* 6.4
2016* 6.3
*Estimated Source: Statistics Canada and RBC
Economics Research forecasts
United States
In this analysis, we examine the general economic climate that existed in the U.S. at the end of the fourth quarter of 2014. This summary provides an overview of some selected economic factors that prevailed at that time as well as a discussion of the factors that are crucial over an extended time period.
Gross Domestic Product
The Bureau of Economic Analysis reported that the nation's economy—as indicated by GDP—grew at an annual rate of 2.6% in the fourth quarter of 2014. This was below forecasts, as a survey conducted by Bloomberg found that the median forecast of economists was a 3.0% rate. This was also a deceleration from the third quarter, when GDP grew at a 5.0% rate—the fastest quarterly pace in 11 years. GDP is the total market value of goods and services produced in the U.S. economy and is generally considered the most comprehensive measure of economic growth. For all of 2014, the economy grew 2.4% from the year before, the biggest advance since 2010, following a 2.2% expansion in 2013. Consumer spending, private inventory investment, exports, business investment, state and local government spending, and residential fixed investment all made positive contributions to the fourth-quarter GDP rate. Federal government spending made a negative contribution to GDP, while imports, which are a subtraction in the calculation of GDP, increased.
Consumer Prices and Inflation Rates According to the Bureau of Economic Analysis, the price index for gross domestic purchases decreased 0.3% in the fourth quarter of 2014, compared with an increase of 1.4% in the previous quarter. The price index for gross domestic purchases measures prices paid by U.S.

Economic Conditions
Leading / Thinking / Performing 9
residents. Excluding food and energy prices, the price index for gross domestic purchases rose 0.7% in the fourth quarter, compared with an increase of 1.6% in the previous quarter. The U.S. Department of Labor reported that the Consumer Price Index fell 0.4% in December, on a seasonally adjusted basis, its largest decline since December 2008. Over the last 12 months, CPI has risen 0.8%. CPI is a measure of a basket of products and services—including housing, electricity, food, and transportation—and is used as a measure of inflation. CPI is comprised of three main indexes: the food index, the energy index, and the all items less food and energy index (also known as “Core CPI”). Core CPI, a measure of inflation that excludes volatile food and energy costs, was unchanged in December but up 1.6% over the past 12 months. The indexes for shelter, medical care, tobacco, and personal care all rose. Offsetting these increases were declines in the indexes for apparel, airline fares, used cars and trucks, alcoholic beverages, and household furnishings and operations. The U.S. Department of Labor reported that the Producer Price Index (“PPI”) fell 0.3% in December, on a seasonally adjusted basis. December was PPI’s steepest decline since October 2011. Over the last 12 months, PPI has risen 1.1%. PPI is a gauge of inflation in the manufacturing process that can be a precursor to inflation in consumer prices. PPI for final demand is comprised of two main indexes: final demand services and final demand goods. In December, the 0.3% decline in PPI was the result of a decrease in the index for final demand goods, which fell 1.2%. In contrast, prices for final demand services moved up 0.2%.
Interest Rates The Federal Open Market Committee (“FOMC”) met twice during the fourth quarter of 2014, issuing a statement from each meeting. At both meetings, the FOMC reaffirmed its desire to keep its target for the federal funds rate near zero. The FOMC’s goal with these decisions is to support its continued progress toward maximum employment and price stability. The FOMC noted that it will remain patient in deciding on whether to raise interest rates but will assess all available information in making that determination going forward. The federal funds rate is the interest rate at which a commercial bank lends immediately available funds in balances at the Federal Reserve to another commercial bank. The FOMC establishes a target rate and expands or contracts the money supply with the aim that the federal funds rate, a market rate, will approximate the target rate. The FOMC found that economic activity was expanding at a moderate pace. It found that labor market conditions had improved, as job gains remained solid and the unemployment rate declined. Additionally, a range of labor market indicators suggested that underutilization of labor resources continued to diminish. The FOMC stated that the housing market recovery remained slow, but household spending and business spending rose. Inflation remained below the FOMC’s longer-run objective, due in part to declining energy prices. The FOMC also determined that the time had come to end its asset purchase program since there had been a substantial improvement in the outlook for the labor market since the inception of the

Economic Conditions
Leading / Thinking / Performing 10
program. Further, the FOMC continued to see sufficient underlying strength in the broader economy. During the fourth quarter of 2014, the Board of Governors of the Federal Reserve left the discount rate unchanged, at 0.75%. The discount rate is the interest rate a commercial bank is charged to borrow funds, typically for a short period, directly from a Federal Reserve Bank. The board of directors of each Reserve Bank establishes the discount rate every 14 days, subject to the approval of the Board of Governors.
Unemployment The U.S. Department of Labor reported that job creation continued in December, with 252,000 new jobs being created. This came after 261,000 and 353,000 new jobs were created in October and November, respectively. Employment gains have now exceeded 200,000 jobs a month for 11 straight months, the longest stretch since the 19 months that ended in March 1995. Job growth averaged 246,000 per month in 2014, compared with an average monthly gain of 194,000 in 2013. Total employment rose by 2.95 million in 2014, the most in any calendar year since 1999. The unemployment rate (also known as the U3 unemployment rate) fell 0.2 percentage point to a six-and-a-half-year low of 5.6% in December. The annual average unemployment rate fell 1.2 percentage points between 2013 and 2014, the largest decline since 1984. The number of unemployed persons declined by 383,000 in December to 8.7 million. In 2014, the number of unemployed persons declined by approximately 1.7 million. The U3 unemployment rate is the official unemployment rate per the International Labour Organization definition and occurs when people who have actively looked for work within the past four weeks are still without jobs. The labor-force participation rate edged down 0.2 percentage point in December to 62.7%. The labor-force participation rate has remained within a narrow range of 62.7% to 62.9% since April. The employment-population ratio—the share of the working-age population with a job—was unchanged in December for the third consecutive month at 59.2%. However, the employment-population ratio rose by 0.6 percentage point in 2014. The number of unemployed persons who have been out of work for 27 weeks or more was essentially unchanged in December at 2.8 million, or 31.7% of the total unemployed. Over the past 12 months, the number of long-term unemployed has declined by 1.1 million. The average unemployment duration decreased slightly in December to 32.8 weeks from 33.0 weeks in November.
Economic Outlook Consensus Economics Inc., publisher of Consensus Forecasts—USA, reports that the consensus of U.S. forecasters is that real GDP will increase at a seasonally adjusted annual rate of 2.8% in both the first and second quarters of 2015. Every month, Consensus Economics surveys a panel of 30 prominent U.S. economic and financial forecasters for their predictions on a range of variables, including future growth, inflation, current account and budget balances, and interest rates. The forecasters expect GDP to grow 3.0% in 2015, 3.0% in 2016, and 2.8% in 2017.

Economic Conditions
Leading / Thinking / Performing 11
They forecast personal consumption will increase at a rate of 3.0% in both the first and second quarters of 2015. They expect personal consumption to increase 2.8% in both 2015 and 2016. These forecasters believe unemployment will average 5.7% in the first quarter of 2015 and 5.6% in the second quarter. They believe unemployment will average 5.5% in 2015. They also believe consumer prices will rise at a rate of 0.9% in the first quarter of 2015 and 1.6% in the second quarter. They expect consumer prices to increase 1.3% in 2015 and 2.1% in 2016. They expect producer prices to increase at a rate of 0.7% in the first quarter of 2015 and 1.1% in the second quarter. The forecasters anticipate producer prices will rise 0.9% in 2015. The most recent release of The Livingston Survey (the Survey) predicts fairly steady output growth through the end of 2015. The Survey, conducted by the Federal Reserve Bank of Philadelphia, is the oldest continuous survey of economists' expectations. It summarizes the forecasts of economists from industry, government, banking, and academia. The participants project real GDP to grow at an annual rate of 2.9% in the first half of 2015 and 2.7% in the second half of 2015. They believe GDP will grow 2.5% annually over the next 10 years. The Survey forecasted the unemployment rate to be 5.6% in June 2015, before declining to 5.4% in December 2015. The forecasters in the Survey expect CPI inflation to be 1.4% in 2015 and 2.1% in 2016. The Survey expects CPI to average 2.3% over the next 10 years. The Survey expects PPI inflation to be 1.1% in 2015 and 1.5% in 2016.

The Ontario Tissue Paper Industry
Leading / Thinking / Performing 12
THE ONTARIO TISSUE PAPER INDUSTRY
Forest Products in Ontario According to data provided by the Ontario Forest Industries Association, Ontario’s forests cover approximately 800,000 km2; comprising 17% of Canada’s forests. The province has four distinct forest regions; the boreal forest in the north and, at its uppermost reaches, the boreal-barrens, and further south the deciduous and Great Lakes/St. Lawrence forest regions. Of these, the boreal forest is by far the largest, covering 550,000 km2 (close to 50% of the province) and accounting for 76% of Ontario woodlands. Characterized by needle bearing coniferous trees such as spruce and jack pine, and leaf bearing deciduous trees such as poplar and birch, the boreal forest is the primary source of raw material for the forest products industry.
89% of Ontario’s forests are publicly owned (88% by the Province, 1% federally), with the 11% balance being privately held. Ontario’s forestry industry has long been a key component of the province’s economy, and according to most recently available data from Natural Resources Canada, generates annual revenues of approximately $10.58 billion, divided between forestry and logging (8.9% of total revenues), pulp and paper manufacturing (62.1%), and wood products manufacturing (28.9%). Industry participants range from local sawmills and small scale logging operators with a few employees, to integrated multi-national companies with thousands of employees.
Tissue Paper Industry Overview Tissue is a general term indicating a class of papers which are characteristically gauzy in texture, and in some cases, fairly transparent.
The Production Process
There are generally two stages involved in manufacturing tissue products: tissue roll production and converting. In tissue roll production, paper machines are used to make a base sheet which, in turn, is

The Ontario Tissue Paper Industry
Leading / Thinking / Performing 13
transformed into a parent roll. The parent roll is then converted into a finished product using specialized winder equipment. The primary raw material used in the production of tissue paper is pulp, which can be produced from either virgin wood fibre or recycled waste paper. Pulp arriving at a tissue manufacturing facility, in the case of recycled waste paper, first enters a bleaching plant where the pulp undergoes a chemical process, transforming it into a pure-white product suitable for the production of tissue paper. Upon completion of the bleaching stage, the pulp is mixed with water, producing a solution known as paper stock, consisting of up to 99.5% water and 0.5% fibre. The paper stock is sprayed onto a series of mesh screens which then enter the drying stage, transforming the paper stock into a series of thin sheets of paper. The initial drying stage is conducted via a mechanical press, which reduces the water content to approximately 50%. At this point, any incremental pressure required to remove additional water content would crush the paper fibre and reduce the quality of the end product. Therefore, the paper stock undergoes a secondary drying process whereby water is removed via evaporation. The large energy requirements of the secondary drying stage make it the most expensive part of the tissue paper production process. As the paper stock dries, shrinkage also begins to occur, increasing the strength of the paper, and, depending on the drying technology employed, enhancing softness and bulk. Once the water content has been reduced to approximately 5%, the sheets of paper are smoothed and ‘creped’, a process through which the paper is softened and a pattern is embossed to enhance the aesthetic qualities of the tissue. In the case of single recrepe manufacturing, the tissue is creped twice to maximize softness and bulk. The main manufacturing processes utilized by the tissue industry are wet crepe (“WC”), light dry crepe (“LDC”), single recrepe (“SRC”) and through-air-dried (“TAD”) technologies, as summarized below. Wet Crepe production is the primary technology used in the away-from-home (“AFH”) market segment and is typically employed in lower grade, lower priced products including napkins and low grade paper towels. Recycled material is the main fibre input. Light Dry Crepe is the main technology in the consumer market segment and produces a better quality of paper than wet crepe. The quality of the end product varies significantly depending on the amount of virgin pulp used in combination with recycled fibre. Most private label products use the LDC process. Single Recrepe is similar to LDC, but can achieve superior softness and bulk as the paper is creped a second time. This process has the ability to use lower cost recycled fibre and/or wood pulp if desired. Through-Air-Dried technology, unlike the above papermaking processes, does not use water as the carrying medium for the fibre. Instead, fibres are carried and formed to the structure of paper by air.
The Ontario Tissue Paper Industry
Leading / Thinking / Performing 14
Less pressure is applied to the sheet during the drying stage, preventing bulk loss. TAD is used for high quality, high softness products. The final stage of manufacturing is known as converting. In this stage, the large parent rolls are slit and rewound, or folded, into the final sizes and formats sold to the consumer, and final packaging takes place.
Market Segmentation
The North American tissue industry is typically segmented between (i) the consumer market, which consists of the supply of products such as bathroom tissue, facial tissue, paper towels and napkins to end-consumers through traditional retail channels such as grocery stores, mass merchandisers, club stores, drug stores and convenience stores; and (ii) the away-from-home market, which consists primarily of the supply of bathroom tissue, facial tissue, paper towels and napkins to commercial users in a variety of industries such as food service, property management, healthcare, manufacturing, education and lodging. The Canadian consumer tissue market is mature in nature and has exhibited stable underlying demand, largely due to the non-discretionary nature of its products. Demand tends to be primarily supported by overall population growth and high rates of household penetration. The relative stability of sales and profitability in the Canadian tissue market has been driven by industry concentration, overall marketing and trade expenditure levels remaining relatively stable, price levels tending to track underlying commodity costs, and limited capacity additions. Additionally, there are relatively high barriers to entry which reduces the threat of new entrants, and limited substitutes exist for tissue products. According to ACNielsen data, total consumer tissue retail sales (excluding napkins), were approximately $1.55 billion in 2014. The Canadian consumer tissue market is relatively concentrated and dominated by five suppliers, namely Kruger Products L.P. (“KPLP”), J.D. Irving Ltd., Procter & Gamble (“P&G”), Kimberly-Clark and Cascades, Inc. Management of KPLP estimates Canadian tissue industry capacity utilization to be above 90%. The U.S. consumer tissue market is likewise mature and stable in nature, essentially supported by the same factors as the Canadian consumer market. According to ACNielsen data and KPLP estimates, total consumer tissue retail sales (excluding napkins), were approximately USD 15.9 billion in 2014. This market is concentrated at the top and dominated by Georgia Pacific, P&G and Kimberly-Clark. The private label portion of the U.S. tissue market continues to grow. The main private label manufacturers in the U.S. include KPLP, Clearwater Paper, Cascades, First Quality Tissue, Georgia-Pacific and Kimberly-Clark. The North American AFH tissue market is comprised of all tissue products used outside of the home, including tissue products sold directly to commercial customers, general or specialized distributors and wholesalers, and building services contractors. Distributors resell tissue products bundled with other merchandise to end-users, such as commercial office buildings, hotels, restaurants, hospitals,

The Ontario Tissue Paper Industry
Leading / Thinking / Performing 15
schools and other operators of public facilities. According to RISI and KPLP estimates, the AFH market represents approximately 30% of all North American tissue product consumption. In Canada, the AFH business is relatively concentrated among KPLP, Kimberly-Clark and Cascades. In the Canadian market, we note that manufacturers’ sales of sanitary paper products (NAICS 322291) significantly exceed pre-recession levels and have been growing slowly since 2009. According to RISI statistics, U.S. tissue demand has been growing at a compound annual rate of 1% to 2% per annum since 1998.
Chart 1
Source: Statistics Canada
Canadian tissue producers are not generally fully integrated with respect to their own pulp needs, and therefore purchase some pulp at market prices. Historically, producers have been able to pass along any increases in their input costs to end users, usually with a six to nine month lag time. Accordingly, there is typically a correlation between pulp prices and end product pricing.

The Ontario Tissue Paper Industry
Leading / Thinking / Performing 16
Chart 2
Source: RISI, Inc.
From their 2009 lows shown in Chart 2, the prices of all parent roll grades subsequently recovered, but we do note a recent downward trend in the price of parent rolls made from recycled fibres (“RCF”s), with low quality recycled rolls falling $49/ton in December 2014 to breach their 2009 low. Please note that bleached kraft pulp (“BKP”) prices represent an average net price for contract BKP tonnage, assuming a 50/50 mix of northern bleached softwood kraft (“NBSK”) and northern bleached hardwood kraft (“NBHK”). In addition to the broader industry demand drivers already mentioned, parent roll and tissue product production in Ontario is also a function of domestic market and U.S. export demand, the Canadian dollar (“CAD”) to U.S. dollar (“USD”) foreign exchange rate, and tissue paper and converted product prices. According to Statistics Canada, 94.0% of Ontario’s 2014 exports in NAICS code 322291 – Sanitary Paper Product Manufacturing, were destined for the United States. With export revenues denominated in U.S. dollars, and labour and certain other input costs paid in Canadian dollars, the profitability of exporting Ontario mills has been eroded over the years by an appreciating domestic currency. From the following chart, we can see that the Canadian dollar has appreciated in value from approximately USD 0.64 in 2002 to a 2014 year-to-date average of USD 0.9103. The exchange rate has eased somewhat in recent years, down from its 2011 high (average annual rate) of USD 1.0114. At the Effective Date, the Canadian dollar exchange rate stood at USD 0.8620.

The Ontario Tissue Paper Industry
Leading / Thinking / Performing 17
Chart 3
Source: Board of Governors of the Federal Reserve System
Ontario’s exports to the U.S. of manufactured products in NAICS code 322291 have grown considerably since 1992, but fell in 2010 and 2011. Please note that while Ontario’s export data is available to 2014, Industry Canada has advised American Appraisal that a classification change in 2012 grouped additional products into NAICS code 322291. Therefore, data from 2012 and later years is not comparable to the pre-2012 data, and cannot be restated for purposes of direct comparison. We do note however, that the new sanitary paper products classification for 2013 and 2014 experienced double-digit export growth from Ontario.

The Ontario Tissue Paper Industry
Leading / Thinking / Performing 18
Chart 4
Source: Industry Canada
Although mature and stable in nature, the North American and Ontario tissue industries are still highly competitive. Industry success factors include price and product quality, softness/strength in the bathroom and facial tissue categories, and absorbency strength in paper towels. The importance assigned by consumers to product quality, increases at the high end of the tissue market.
Existence of Economic Obsolescence The existence of EO in an industry may be indicated by one or more of the following factors:
reduced demand for the industry’s products;
overcapacity in the industry;
dislocation of raw material supplies;
increasing cost of raw materials, labour, utilities, or transportation, while the selling price of the product remains fixed or increases at a much lower rate;
government regulations that require capital expenditures to be made with little or no return on the new investment; and
environmental considerations that require capital expenditures to be made with little or no return on the new investment.
The fact that U.S. demand for Ontario-produced tissue paper has been increasing over time was previously noted (see Chart 4). While parent roll prices initially rallied from their 2009 lows, prices have weakened across the board since May 2013, especially those of lower quality RCF rolls which have breached their 2009 low (see Chart 2).

The Ontario Tissue Paper Industry
Leading / Thinking / Performing 19
While capacity utilization can be quite volatile from month to month, tissue industry operating rates (based on available U.S. data) have rebounded from the recessionary lows. We note that the dip in December 2014 utilization is due to the start-up of Cascades’ second tissue paper machine at the St. Helens mill in Oregon, rather than to any decline in demand.
Chart 5
Source: RISI, Inc. According to RISI, additional expected capacity changes in North America at the Effective Date included:
Company
Location Furnish Date Tons
Double Tree/Royal Paper Gila Bend, AZ Virgin Q1: 2015 32,000 Orchids Paper Products Pryor, OK Recycled Q1: 2015 30,000 First Quality Tissue Anderson, SC Virgin Q4: 2015 70,000 Von Drehle Corporation Natchez, MS R&V Q4: 2015 35,000 St. Croix Tissue Baileyville, ME Virgin Q4: 2015 66,000 First Quality Tissue Anderson, NC Virgin Q1: 2016 75,000 St. Croix Tissue Baileyville, ME Virgin Q2: 2016 66,000 Undisclosed Undisclosed Virgin 2016 70,000 Undisclosed Undisclosed Virgin 2016 80,000 Proctor & Gamble Box Elder, UT Virgin 2016 80.000 First Quality Tissue Lock Haven, PA Virgin Q4: 2016 70,000
Quantification of Economic Obsolescence
Leading / Thinking / Performing 20
In summary, a steady decline in RCF parent roll prices over the past 19 months and the lower profitability of selected publicly traded guideline companies (see Exhibits C and D) suggests the existence of some level of Industry EO. Support for a moderate level of Industry EO is provided by historically increasing U.S. export demand, and the superior performance of virgin parent roll prices. Although planned capacity additions will have the short-term effect of depressing the North American industry utilization rate, such additions reflect the optimism of tissue manufacturers as to the industry’s longer-term outlook. On balance, the evidence supports the existence of a moderate level of EO in the Industry.
QUANTIFICATION OF ECONOMIC OBSOLESCENCE
Utilization Analysis One method used to quantify EO is to review the subject asset’s utilization. If the asset is being utilized at less than 100% or whatever is the industry norm, then EO may exist because demand in the industry is substantially less than available supply. Mathematically, this is based on the relationship whereby EO equals actual utilized capacity (demand) divided by maximum capacity (supply) with the result taken to an exponent (scale factor), subtracted from 1. The scale factor is a relationship of cost to capacity, which reflects the concept that as capacity increases, the cost of construction increases at a different, typically slower, rate. Typically, when a specific scale factor is not known, a value of 0.68 is used for manufacturing facilities based on data published in engineering and construction texts.
EO = 1 – (Demand/Capacity) 0.68 We researched industry sources and were able to obtain Canadian pulp, paper and paper product manufacturing (aggregated as NAICS code 322), and U.S. tissue paper industry utilization rates to the Effective Date. We also investigated other data sources including capacity utilization data for Canadian and U.S. tissue mills and converting facilities contained in the current annual reports of publicly traded paper products companies. We selected a 90% Demand/Capacity ratio for use in our valuation, based primarily on the year end ratio of the U.S. tissue paper industry. While average U.S. capacity utilization for 2014 remained stable at 94%, it ended the year at 90% as newly installed capacity entered production. A 90% ratio was additionally supported by the operating rates observed for Canadian facilities, specifically, the St. Catherines, ON facilities of Clearwater Paper, and the facilities of Cascades Inc. which are primarily Canadian. We note that the 90% utilization rate selected also approximated that of the overall Canadian pulp, paper and paper product manufacturing industry. EO was then calculated as follows: EO = 1 – (Demand/Capacity) 0.68 EO = 1 – (0.90) 0.68

Quantification of Economic Obsolescence
Leading / Thinking / Performing 21
EO = 6.9% The results of our Utilization Analysis are presented in Exhibit B. High utilization rates by themselves, however, are not necessarily indicative of low EO when it comes to an analysis of the tissue paper industry. The pulp and paper industry generally, is highly capital intensive and characterized by significant fixed costs. A large paper machine, for example, can cost between USD 300 million and USD 500 million to construct, and building a large integrated pulp and paper facility can require an investment of more than USD 1 billion. This significant fixed cost base encourages producers to run their facilities at high operating rates to reduce their capital cost per ton and generate cash. Because building a paper mill and/or converting facility is an extremely capital intensive proposition, operators make every effort to keep their mills running continuously, with sufficient downtime to perform scheduled maintenance, make repairs, and address any pricing and inventory situations. Consequently, utilization analysis should be used in conjunction with profitability-based and other methodologies to reliably estimate Industry EO.
Gross Margin Analysis The study of company or industry returns by comparing gross profit margins over time can also provide a useful measure of EO. Simply put, gross margin is a company’s revenues less its cost of goods sold, where cost of goods sold is defined to include the direct costs attributable to the production of the goods sold by a company. This amount includes the cost of the materials used in creating a product, along with the direct labour costs used in its production, but excludes indirect expenses such as distribution and sales force costs. If gross margins have been declining or are currently lower than in the past, EO may be present even if capacity utilization is high. EO can be measured using the formula:
EO = Benchmark GM % – Current GM % Benchmark GM %
Our gross margin analysis is presented in Exhibit C. In the gross margin analysis, a review was made of the relationship of the gross margin percentages realized by a universe of selected guideline companies in the 12 months to December 31, 2014, versus their returns during a period of time when profitability in the tissue industry was considered to be normal. 2009 to 2014 represents the most recent period over which industry gross profit margins were considered to be normal. In selecting the guideline companies, we used the following sources: OneSource database
Standard and Poor’s Capital IQ database

Quantification of Economic Obsolescence
Leading / Thinking / Performing 22
We searched the Onesource database for companies using the keyword “tissue”. We then reviewed the identified companies for a focus on, or significant exposure to the tissue paper industry (since some were integrated paper products companies) and ideally significant exposure to foreign currency risk. Of the companies reviewed, 5 were selected as being most suitable for use in our analysis including: Clearwater Paper Corporation (CLW - NYSE)
Kimberly-Clark de Mexico SAB de CV (KIMBER A - BMV)
Kruger Paper Products L.P. (n.a.)
Orchids Paper Products Company (TIS - AMEX)
Wausau Paper Corporation (WPP - NYSE)
Please note that while Kruger Paper Products L.P. is not itself publicly traded, its historical financial statements are available through the filings of publicly traded KP Tissue Inc. (KPT – TSX) which owns an equity interest in KPLP. EO for each of the guideline companies was calculated using the following formula:
EO = 2009 to 2014 Avg. GM % – Current GM % 2009 to 2014 Avg. GM %
Industry EO, calculated using the median EO of the selected guideline companies, was estimated to be 5.2%.
Return-on-Capital Analysis An additional approach to quantifying EO is a return-on-capital analysis (“ROCA”). In such an analysis, the relationship of earnings is compared to the magnitude of investment used to generate those earnings. In the ROCA, a review was made of the relationship of the percent earned on total capital by each of our 5 selected guideline companies in the 12 months to December 31, 2014, versus their returns during a period of time when profitability in the tissue industry was considered to be normal. Again, we selected 2009 to 2014 for use in our analysis. Percent earned on total capital is defined as “a company’s return on its stockholders’ equity and long-term debt obligations.” The summation of long-term debt and stockholders’ equity represents the total invested capital of a business enterprise. When the economics of the industry are good, the return on capital will be high; when poor, low. Hence, a return on capital analysis can be a meaningful indicator of economic obsolescence.

Quantification of Economic Obsolescence
Leading / Thinking / Performing 23
Recall that EO can be determined for each of the guideline companies using the following formula:
EO = 2009 to 2014 Avg. ROC % – Current ROC % 2009 to 2014 Avg. ROC %
Using the median of the guideline companies, EO based on a ROCA was estimated to be 16.9%. Please see Exhibit D for calculations.
Price-to-Book Ratio Analysis Another method for estimating the EO present in a given asset or industry, is to analyze investors’ perception of the investment in that industry using common stock prices. The ratio of price paid for common stock relative to its book value may be indicative of the investors’ perception of the obsolescence present in the investment. Book value of the stock relates to original capital contributed to the firm in exchange for the stock, plus retained earnings that have accumulated since the initial investment. From a legal perspective, stockholders own the firm in which they have invested. From an investor’s viewpoint, stock ownership is considered to represent a net ownership position in the firm’s assets. At any point in time, if the total value of all assets is considered and a deduction is made for all liabilities, the net amount is representative of the value of the aggregate value of the common stock (as per the balance sheet identity Assets - Liabilities = Shareholder’s Equity). Thus, an investor purchasing shares of common stock is making a decision on the value of the total assets. Book value of common stocks of publically held companies is calculated with reasonable consistency for most publicly traded companies due to accounting regulations. The regulations involve not only the general methodology used in the calculations, but also regulate the type of data available to investors. Due to the consistency of reporting, the book values can be useful as a benchmark for certain types of measurements. The selection of our guideline companies has been previously described. For each of the guideline companies we obtained Effective Date; i) stock price data, ii) number of shares issued and outstanding, and iii) book value of equity from the Capital IQ database. From this information we were able to calculate Effective Date price-to-book (“PTB”) ratios for each of the guideline companies. For baseline comparison purposes, a PTB ratio was available from Bloomberg for the S&P 500 Equal Weight Industrials Index. A comparison of equity PTB value ratios for general industrial stocks versus the Industry was possible, using this data. The results of our PTB analysis are shown in Exhibit E, with EO estimated using the formula:
EO = S&P 500 Equal Weight Industrials – Tissue Industry S&P 500 Equal Weight Industrials

Quantification of Economic Obsolescence
Leading / Thinking / Performing 24
EO = (3.62 – 3.58) / 3.62 = 1.2% Economic obsolescence was calculated using the median PTB ratio of the guideline companies, in light of the significant variation in individual guideline company ratios. This relationship is indicative of investors’ relative valuation of tissue industry assets when compared with general industrial stocks. Owners of general industrial stocks appear willing to pay about 1.2% more for such stocks than they would pay for stock in the tissue paper industry, based on the PTB value ratio. PTB ratio analysis is useful primarily as a broad indication of the existence of EO in a given industry, rather than as a specific estimate of its quantum. We note that PTB ratios can be impacted by much more than investors’ perceptions of EO, including a company’s capital structure, the extent of analyst coverage, stock trading liquidity, dividend policy, the existence of stock repurchasing programs etc. Additionally, unavoidable differences exist in the size, growth, profitability and risk of the guideline companies versus Ontario tissue facilities.
Wood Fibre Cost Analysis Wood cost is a significant determinant of the competiveness of pulp and paper mills. According to Wood Resources International, this cost typically varies between 40% and 65% of total cash costs depending on product grade. Consequently, an analysis of the average fibre cost for Ontario mills versus the average fibre cost for competing North American regions can be used to estimate Industry EO. This same approach to estimating EO has been employed by the Ontario Assessment Review Board (“ARB”), an independent adjudicative tribunal whose main function is to hear appeals from taxpayers who believe that their properties have been incorrectly assessed or classified. American Appraisal obtained quarterly wood fibre prices for the period from Q3 2007 through Q4 2014 from the North American Wood Fibre Review (“NAWFR”). Price data was obtained for both softwood and hardwood wood chips and roundwood, with data available for each of the following North American regions:
Please note that beginning in Q4 2011, the data provider aggregates Ontario and Quebec as ‘Eastern Canada’, whereas in prior periods both provinces are separately identified. Consequently, ‘Eastern Canada’ data (used as the best proxy for Ontario fibre costs after Q4 2011), will tend to somewhat
United States Canada Northwest British Columbia Lake States Alberta Northeast Ontario Southeast Quebec South Central Maritimes

Quantification of Economic Obsolescence
Leading / Thinking / Performing 25
overstate actual Ontario costs due to the aggregation with Quebec which has historically been a higher cost region than Ontario. According to the NAWFR, publication of hardwood wood chip costs for Ontario was suspended in Q1 2012 due to the minimal volumes generated. NAWFR also notes that while softwood roundwood prices are provided for Eastern Canada, this source is a relatively small component of the region’s total wood fibre consumption. Considering the above, and the fact that pulp and paper mills typically resort to higher priced roundwood only in the absence of the availability of lower priced chips, we believe that that most relevant comparison for the purpose of estimating Industry EO is that of Ontario softwood chips versus the North American average (excluding Ontario) for such chips. We note that the cost of Eastern Canadian softwood chips has become significantly more competitive in recent years due in part to a weakening of the CAD versus the USD, with Eastern Canadian and North American softwood chip costs drawing close to parity at the Effective Date. Prices in the following chart are quoted in USD per oven-dry metric tonnes (“odmt”), and chip prices are for residual chips and do not include chips manufactured from roundwood.
Chart 6
Source: North American Wood Fibre Review
Industry EO was estimated based on the average excess cost of Ontario over North American softwood chips from Q3 2007 to Q4 2014. An average excess cost over a number of years was employed, in order to provide a sufficiently reliable representative sample. EO = (Ontario Average Chip Cost / North American Average Chip Cost) - 1

Quantification of Economic Obsolescence
Leading / Thinking / Performing 26
EO = 23.4% In other words, Ontario fibre costs as measured by the cost of softwood chips have been, on average, 23.4% more expensive than the North American average over the observation period. This figure is somewhat overstated by the previously mentioned issue of the combination of Ontario with higher-cost Quebec into an Eastern Canada aggregate beginning in Q4 2011.
Correlation and Conclusion for the Ontario Tissue Paper Industry Application of the multiple analyses of EO as described above resulted in the following indicators for the Ontario tissue paper industry:
Method
Economic Obsolescence
Utilization Analysis 6.9% Gross Margin Analysis 5.2% Return-on-Capital Analysis 16.9% Price-to-Book Ratio Analysis 1.2% Wood Fibre Cost Analysis 23.4%
The concluded EO rate for the Industry was 13.0% based on the average of the rates indicated by utilization, gross margin, return-on-capital and fibre cost analyses. EO estimated using a price-to-book analysis was used more as a broad indicator of the existence of Industry EO, and to widen our analysis beyond utilization, profit and cost based methodologies.

Conclusion
Leading / Thinking / Performing 27
CONCLUSION Based on the information and analysis summarized in this report, it is our view that EO in the Ontario tissue paper industry at January 1, 2015 was reasonably estimated as follows:
Industry
Economic Obsolescence at
Jan. 1, 2015
Ontario Tissue Paper 13.0%
We reserve the right, but will be under no obligation, to review all calculations referred to in this report and, if considered necessary by us, to revise our estimates in the light of any new facts, trends or changing conditions existing at any date prior to or at the Effective Date, which become apparent to us subsequent to the date of this report. The engagement of, and compensation for, American Appraisal and its employees was not contingent on the development or reporting of predetermined values or a direction in value that favors the cause of the client; the amount of the value estimates; the attainment of stipulated results; nor the occurrence of a subsequent event directly related to the intended use of this appraisal. This report represents American Appraisal’s impartial and unbiased analysis, estimates, and conclusions limited only by the Terms and Conditions which were part of our Letter of Engagement, and the Assumptions and Limiting Conditions which are part of this report. Neither American Appraisal nor its employees who were assigned to this engagement (including their immediate family members) have any substantial interest, direct or indirect, in MPAC or in any party directly or indirectly controlling or, controlled by or, under direct or indirect common control with MPAC. We also confirm we are not connected with MPAC or any party directly or indirectly controlling or, controlled by or, under direct or indirect common control of MPAC as an officer, employee, promoter, underwriter, trustee, partner, director or persons performing similar functions. Respectfully submitted,
No third party shall have the right of reliance on this report, and neither receipt nor possession of this report by any third party shall create any express or implied third-party beneficiary rights.
718-104

Leading / Thinking / Performing (1 Page)
Exhibit A Economic Obsolescence Summary

Exhibit AEconomic Obsolescence Analysis of the Ontario Tissue Paper Industry
As of January 1, 2015
MethodEconomic
Obsolescence
(1) Utilization Analysis 6.9%(2) Gross Margin Analysis 5.2%(3) Return-on-Capital Analysis 16.9%(4) Price-to-Book Ratio Analysis 1.2%(5) Fibre Cost Analysis 23.4%
Selected Range 5.2% to 23.4%
(6) Selected Obsolescence Rate 13.0%
Notes:(1) See Exhibit B.(2) See Exhibit C.(3) See Exhibit D.(4) See Exhibit E. (5)
(6) Based on the average rate indicated by utilization, gross margin, return-on-capital and fibre cost analyses.
Municipal Property Assessment Corporation
Economic Obsolescence Summary
Based on a cost comparison of Ontario softwood chips versus the North American average (excluding Ontario) for the period Q3 2007 through Q4 2014. Source is North American Wood Fiber Review.
American Appraisal Page 1

Leading / Thinking / Performing (1 Page)
Exhibit B Utilization Analysis

Municipal Property Assessment Corporation Exhibit BEconomic Obsolescence Analysis of the Ontario Tissue Paper IndustryUtilization AnalysisAs of January 1, 2015
Total Capacity Total Production Total ProductionOwner Facility Location Products (tons) (tons) Total Capacity
(1) Cascades, Inc. Various Tissue Papers 93.0%
(2) Clearwater Paper Corporation Various Tissue manufacturing 652,000 615,000 94.3%Tissue converting 462,000 333,000 72.1%
1,114,000 948,000 85.1%
Clearwater Totals Include: St. Catherines, ON TAD tissue 20,000 18,000 90.0%Machine-glazed tissue 24,000 22,000 91.7%
(3) Orchids Paper Products Company Pryor, OK Paper mill 57,000 54,349 95.3%Converting 70,000 51,250 73.2%
127,000 105,599 83.1%
(2) Wausau Paper Middletown, OH Tissue 120,000 114,500 95.4%Harrodsburg, KY Tissue 70,000 60,800 86.9%Harrodsburg, KY Converted tissue 214,000 182,700 85.4%
404,000 358,000 88.6%
(4) 2014 U.S. Tissue Paper Industry Operating Rate 90.0%
(5) 2014 Average Canadian Capacity Utilization Rate (NAICS 322) 90.9%
(6) Selected Demand/Capacity 90.0%
EO = 1 - (Demand/Capacity) 0.686.9%
Notes:(1)
(2) Source is form 10-K for the fiscal year ended December 31, 2014.(3) Paper mill production for 2014 was impacted by the decommissioning of 2 older paper machines in September 2014.
(4) Source: RISI. While average capacity utilization for the year remained stable at 94%, it ended the year at 90% as newly installed capacity entered production.(5) Source is Statistics Canada. NAICS code 322 comprises establishments primarily engaged in the manufacture of pulp, paper and paper products.(6)
Capacity utilization rate is defined by Cascades as manufacturing internal and external shipments / practical capacity. Excludes discontinued operations and Specialty Products Group manufacturing activities.
Selected demand/capacity is based primarily on the 2014 year end U.S. tissue paper industry operating rate, with additional consideration given to the operating rates observed for Canadian facilities, specifically, the St. Catherines ON facilities of Clearwater, and the facilities of Cascades Inc. which are primarily Canadian.
American Appraisal Page 1

Leading / Thinking / Performing (1 Page)
Exhibit C Gross Margin Analysis
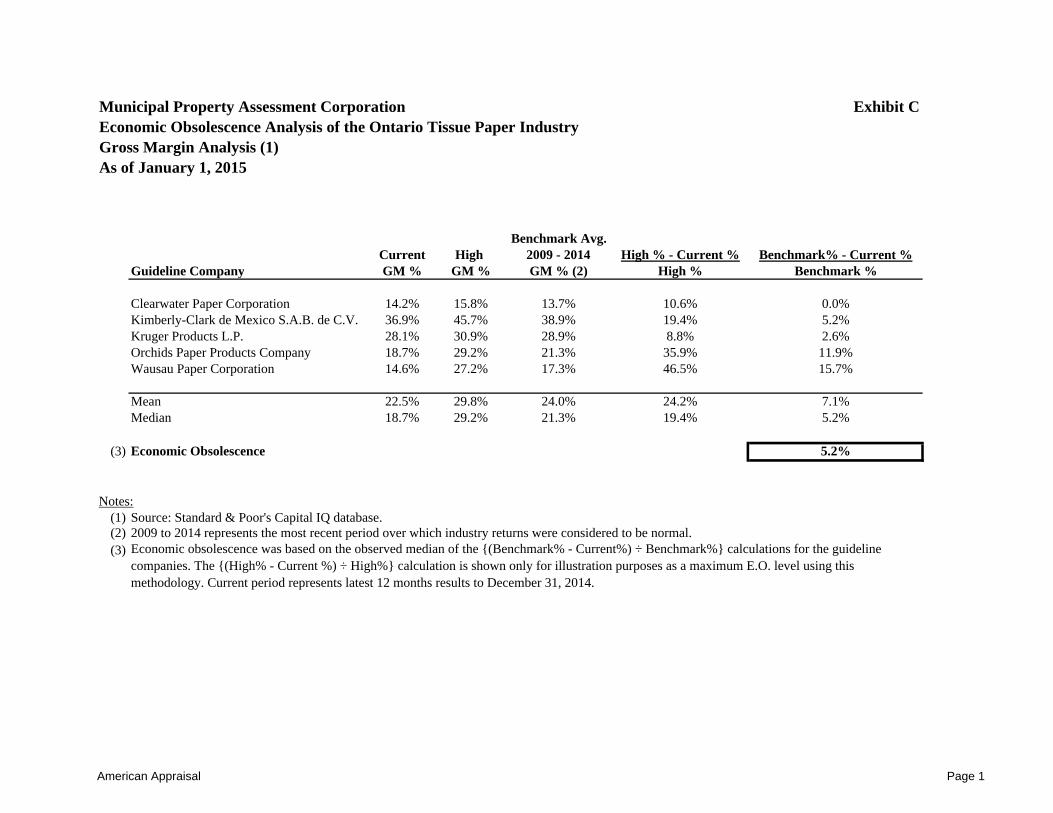
Municipal Property Assessment Corporation Exhibit CEconomic Obsolescence Analysis of the Ontario Tissue Paper IndustryGross Margin Analysis (1)As of January 1, 2015
Benchmark Avg.Current High 2009 - 2014 High % - Current % Benchmark% - Current %
Guideline Company GM % GM % GM % (2) High % Benchmark %
Clearwater Paper Corporation 14.2% 15.8% 13.7% 10.6% 0.0%Kimberly-Clark de Mexico S.A.B. de C.V. 36.9% 45.7% 38.9% 19.4% 5.2%Kruger Products L.P. 28.1% 30.9% 28.9% 8.8% 2.6%Orchids Paper Products Company 18.7% 29.2% 21.3% 35.9% 11.9%Wausau Paper Corporation 14.6% 27.2% 17.3% 46.5% 15.7%
Mean 22.5% 29.8% 24.0% 24.2% 7.1%Median 18.7% 29.2% 21.3% 19.4% 5.2%
(3) Economic Obsolescence 5.2%
Notes:(1) Source: Standard & Poor's Capital IQ database.(2) 2009 to 2014 represents the most recent period over which industry returns were considered to be normal.(3) Economic obsolescence was based on the observed median of the {(Benchmark% - Current%) ÷ Benchmark%} calculations for the guideline
companies. The {(High% - Current %) ÷ High%} calculation is shown only for illustration purposes as a maximum E.O. level using this methodology. Current period represents latest 12 months results to December 31, 2014.
American Appraisal Page 1

Leading / Thinking / Performing (1 Page)
Exhibit D Return-on-Capital Analysis

Municipal Property Assessment Corporation Exhibit DEconomic Obsolescence Analysis of the Ontario Tissue Paper IndustryReturn-on-Capital Analysis (1)As of January 1, 2015
Benchmark Avg.Current High 2009 - 2014 High % - Current % Benchmark% - Current %
Guideline Company ROC % ROC % ROC % (2) High % Benchmark %
Clearwater Paper Corporation 7.8% 18.4% 9.5% 57.7% 18.3%Kimberly-Clark de Mexico S.A.B. de C.V. 17.2% 23.0% 20.6% 25.2% 16.3%Kruger Products L.P. 7.2% 10.4% 7.9% 30.8% 8.8%Orchids Paper Products Company 8.3% 18.0% 10.0% 53.6% 16.9%Wausau Paper Corporation 0.3% 23.4% 4.7% 98.8% 93.8%
Mean 8.2% 18.6% 10.6% 53.2% 30.8%Median 7.8% 18.4% 9.5% 53.6% 16.9%
(3) Economic Obsolescence 16.9%
Notes:(1) Source: Standard & Poor's Capital IQ database.(2) 2009 to 2014 represents the most recent period over which industry returns were considered to be normal.(3) Economic obsolescence was based on the observed median of the {(Benchmark% - Current%) ÷ Benchmark%} calculations for the guideline
companies. The {(High% - Current %) ÷ High%} calculation is shown only for illustration purposes as a maximum E.O. level using this methodology. Current period represents latest 12 months results to December 31, 2014.
American Appraisal Page 1

Leading / Thinking / Performing (1 Page)
Exhibit E Price-to-Book Ratio Analysis

Municipal Property Assessment Corporation Exhibit EEconomic Obsolescence Analysis of the Ontario Tissue Paper IndustryPrice-to-Book Ratio AnalysisAs of January 1, 2015
Guideline Company P/B Ratio
(1) Clearwater Paper Corporation 2.69(1) Kimberly-Clark de Mexico S.A.B. de C.V. 16.25(2) Kruger Products L.P. n.a.(1) Orchids Paper Products Company 2.54(1) Wausau Paper Corporation 4.46
Mean (excluding Kimberly-Clark de Mexico) 3.23 Median 3.58
(3) S&P 500 Equal Weight Industrials Index 3.62
(4) EO = (Industrials - Tissue) / Industrials 1.2%
Notes:(1)
(2) Kruger Products L.P. is not a publicly traded entity.(3) Source: Bloomberg.(4)
Stock Price/Book Value ratios are calculated using Effective Date closing prices and the most recently available regulatory filings of the guideline companies.
Economic obsolescence is calculated using the median Stock Price/Book Value ratio of the guideline companies, in light of the significant variation in individual guideline company ratios.
American Appraisal Page 1

Leading / Thinking / Performing (2 Pages
Exhibit F Assumptions and Limiting Conditions

Leading / Thinking / Performing 1
ASSUMPTIONS AND LIMITING CONDITIONS
This service was performed with the following general assumptions and limiting conditions. To the best of our knowledge, all data, including historical financial data, if any, relied upon in reaching opinions and conclusions or set forth in this report are true and accurate. Although gathered from sources that we believe are reliable, no guarantee is made nor liability assumed for the truth or accuracy of any data, opinions, or estimates furnished by others that have been used in this analysis. No responsibility is assumed for matters legal in nature. No investigation has been made of the title to or any liabilities against the property appraised. We have assumed that the owner’s claim is valid, the property rights are good and marketable, and there are no encumbrances that cannot be cleared through normal processes, unless otherwise stated in the report. The value or values presented in this report are based upon the premises outlined herein. The date of value to which the conclusions and opinions expressed apply is set forth in the report. The value opinion presented therein is based on the status of the economy and on the purchasing power of the currency stated in the report as of the date of value. This report has been made only for the use or uses stated, and it is neither intended nor valid for any other use. Possession of this report or any copy thereof does not carry with it the right of publication. No portion of this report (especially any conclusion, the identity of any individuals signing or associated with this report or the firms with which they are connected, or any reference to the professional associations or organizations with which they are affiliated or the designations awarded by those organizations) shall be disseminated to third parties through prospectus, advertising, public relations, news, or any other means of communication without the written consent and approval of American Appraisal. Areas, dimensions, and descriptions of property, if any, used in this analysis have not been verified, unless stated to the contrary in the report. Any areas, dimensions, and descriptions of property included in the report are provided for identification purposes only, and no one should use this information in a conveyance or other legal document. Plans, if any, presented in the report are intended only as aids in visualizing the property and its environment. Although the material was prepared using the best available data, it should not be considered as a survey or scaled for size. Unless stated to the contrary in the report, no environmental impact study has been ordered or made. Full compliance with all applicable laws and governmental regulations is assumed unless otherwise stated, defined, and considered in the report. We have also assumed responsible ownership and that all required licenses, consents, or other legislative or administrative authority from any applicable
Leading / Thinking / Performing 2
government or private entity organization either have been or can be obtained or renewed for any use that is relevant to this analysis. The value estimate contained within the report specifically excludes the impact of substances such as asbestos, urea-formaldehyde foam insulation, other chemicals, toxic wastes, or other potentially hazardous materials or of structural damage or environmental contamination resulting from earthquakes or other causes, unless stated to the contrary in the report. It is recommended that the reader of the report consult a qualified structural engineer and/or industrial hygienist for the evaluation of possible structural/environmental defects, the existence of which could have a material impact on value.