Effect of Kaolin Mineralogy on the Activation Process - MDPI
8
Proceeding Paper Thermal Activation of Kaolin: Effect of Kaolin Mineralogy on the Activation Process † Dimitra Kosmidi *, Chrysa Panagiotopoulou, Panagiotis Angelopoulos and Maria Taxiarchou Citation: Kosmidi, D.; Panagiotopoulou, C.; Angelopoulos, P.; Taxiarchou, M. Thermal Activation of Kaolin: Effect of Kaolin Mineralogy on the Activation Process. Mater. Proc. 2021, 5, 18. https://doi.org/10.3390/ materproc2021005018 Academic Editor: Konstantinos Simeonidis Published: 17 November 2021 Publisher’s Note: MDPI stays neutral with regard to jurisdictional claims in published maps and institutional affil- iations. Copyright: © 2021 by the authors. Licensee MDPI, Basel, Switzerland. This article is an open access article distributed under the terms and conditions of the Creative Commons Attribution (CC BY) license (https:// creativecommons.org/licenses/by/ 4.0/). Laboratory of Metallurgy, Department of Mining and Metallurgical Engineering, National and Technical University of Athens, 9, Iroon Polytechniou, GR-157 80 Zografos, Greece; [email protected] (C.P.); [email protected] (P.A.); [email protected] (M.T.) * Correspondence: [email protected] † Presented at the International Conference on Raw Materials and Circular Economy (RawMat2021), Athens, Greece, 5–9 September 2021. Abstract: Kaolin is an industrial mineral used in a wide variety of applications due to its crystalline structure, mineral and elemental composition. After kaolin undergoes heat treatment in a specific temperature range, metakaolin, which exhibits a strong pozzolanic reaction, is formed. This paper examines the effects of different kaolin qualities on the thermal activation process of metakaolin production. The qualities of kaolin depend on the impurities they contain, such as mica, feldspar and quartz. In this study, four different samples of kaolin are investigated. Each sample was heat treated in a lab-scale rotary kiln in order to study the chemical, structural and morphological changes that occurred and their influence on pozzolanic activity. The parameters being considered in the experimental process were the temperature and the duration of the treatment. Thus, the calcination process for each of the four kaolin types was carried out at 600, 650 and 700 ◦ C for 3 h. The occurred changes were monitored using XRD, FTIR and DTA analysis. Additionally, the reactivity of all thermally treated samples was evaluated based on the Chapelle test. The results showed that the fewer the impurities, the easier the transformation of the material to metakaolin. The optimum result was the metakaolin, which originated from the purest quality of kaolin and was comparable to the commercial product. Finally, the pozzolanic activity of the thermally activated samples also depended on the purity of the kaolin. Keywords: kaolin; metakaolin; thermal activation; pozzolanic activity; mineralogy 1. Introduction Kaolinite is a layered silicate mineral with the chemical composition Al 2 Si 2 O 5 (OH) 4 . It is commonly referred to as “China Clay” because it was first discovered at Kao-Lin, in China. The term kaolin is used to describe a group of relatively common clay minerals dominated by kaolinite and derived primarily from the alteration of alkali feldspar and micas [1]. Kaolin is a white, soft, plastic clay mainly composed of fine-grained plate-like particles [2]. It is a unique industrial mineral, as it is used in a wide variety of applications due to its physical and chemical properties. The most important of these are the production of ceramics and cement, pigments, coating films and filling applications [3]. The controlled calcination process of kaolin at an appropriate temperature and du- ration transforms the crystalline kaolinite into an amorphous material, which is called metakaolin [4]. Metakaolin is a cementitious material with very high pozzolanic reactivity and has several applications, particularly in the construction industry, which is among its largest users. The main advantage of metakaolin is its capability of improving the mechanical properties and durability of concrete when used as a partial replacement of cement [5]. The reactivity of metakaolin depends on several factors. The most important of them are the clay minerals contained in the raw material, the crystallinity of the raw kaolinite and the thermal activation conditions [6,7]. Mater. Proc. 2021, 5, 18. https://doi.org/10.3390/materproc2021005018 https://www.mdpi.com/journal/materproc
-
Upload
khangminh22 -
Category
Documents
-
view
0 -
download
0
Transcript of Effect of Kaolin Mineralogy on the Activation Process - MDPI

Proceeding Paper
Thermal Activation of Kaolin: Effect of Kaolin Mineralogy onthe Activation Process †
Dimitra Kosmidi *, Chrysa Panagiotopoulou, Panagiotis Angelopoulos and Maria Taxiarchou
�����������������
Citation: Kosmidi, D.;
Panagiotopoulou, C.; Angelopoulos,
P.; Taxiarchou, M. Thermal Activation
of Kaolin: Effect of Kaolin Mineralogy
on the Activation Process. Mater. Proc.
2021, 5, 18. https://doi.org/10.3390/
materproc2021005018
Academic Editor:
Konstantinos Simeonidis
Published: 17 November 2021
Publisher’s Note: MDPI stays neutral
with regard to jurisdictional claims in
published maps and institutional affil-
iations.
Copyright: © 2021 by the authors.
Licensee MDPI, Basel, Switzerland.
This article is an open access article
distributed under the terms and
conditions of the Creative Commons
Attribution (CC BY) license (https://
creativecommons.org/licenses/by/
4.0/).
Laboratory of Metallurgy, Department of Mining and Metallurgical Engineering, National and TechnicalUniversity of Athens, 9, Iroon Polytechniou, GR-157 80 Zografos, Greece; [email protected] (C.P.);[email protected] (P.A.); [email protected] (M.T.)* Correspondence: [email protected]† Presented at the International Conference on Raw Materials and Circular Economy (RawMat2021), Athens,
Greece, 5–9 September 2021.
Abstract: Kaolin is an industrial mineral used in a wide variety of applications due to its crystallinestructure, mineral and elemental composition. After kaolin undergoes heat treatment in a specifictemperature range, metakaolin, which exhibits a strong pozzolanic reaction, is formed. This paperexamines the effects of different kaolin qualities on the thermal activation process of metakaolinproduction. The qualities of kaolin depend on the impurities they contain, such as mica, feldsparand quartz. In this study, four different samples of kaolin are investigated. Each sample was heattreated in a lab-scale rotary kiln in order to study the chemical, structural and morphological changesthat occurred and their influence on pozzolanic activity. The parameters being considered in theexperimental process were the temperature and the duration of the treatment. Thus, the calcinationprocess for each of the four kaolin types was carried out at 600, 650 and 700 ◦C for 3 h. The occurredchanges were monitored using XRD, FTIR and DTA analysis. Additionally, the reactivity of allthermally treated samples was evaluated based on the Chapelle test. The results showed that thefewer the impurities, the easier the transformation of the material to metakaolin. The optimumresult was the metakaolin, which originated from the purest quality of kaolin and was comparableto the commercial product. Finally, the pozzolanic activity of the thermally activated samples alsodepended on the purity of the kaolin.
Keywords: kaolin; metakaolin; thermal activation; pozzolanic activity; mineralogy
1. Introduction
Kaolinite is a layered silicate mineral with the chemical composition Al2Si2O5(OH)4.It is commonly referred to as “China Clay” because it was first discovered at Kao-Lin, inChina. The term kaolin is used to describe a group of relatively common clay mineralsdominated by kaolinite and derived primarily from the alteration of alkali feldspar andmicas [1]. Kaolin is a white, soft, plastic clay mainly composed of fine-grained plate-likeparticles [2]. It is a unique industrial mineral, as it is used in a wide variety of applicationsdue to its physical and chemical properties. The most important of these are the productionof ceramics and cement, pigments, coating films and filling applications [3].
The controlled calcination process of kaolin at an appropriate temperature and du-ration transforms the crystalline kaolinite into an amorphous material, which is calledmetakaolin [4]. Metakaolin is a cementitious material with very high pozzolanic reactivityand has several applications, particularly in the construction industry, which is amongits largest users. The main advantage of metakaolin is its capability of improving themechanical properties and durability of concrete when used as a partial replacement ofcement [5]. The reactivity of metakaolin depends on several factors. The most importantof them are the clay minerals contained in the raw material, the crystallinity of the rawkaolinite and the thermal activation conditions [6,7].
Mater. Proc. 2021, 5, 18. https://doi.org/10.3390/materproc2021005018 https://www.mdpi.com/journal/materproc

Mater. Proc. 2021, 5, 18 2 of 8
However, the optimization of calcination conditions regarding the influence of processparameters on the pozzolanic activity of metakaolin is not so easy to achieve. There are awide variety of kaolin ores, with huge differences in their composition and structure. Asa result, there is not only one optimal combination of temperature and time duration forthermal activation [8].
For this research, samples of kaolin of various qualities with different mineralogycharacteristics were thermally activated in order to evaluate the influence of the rawmaterial impurities on the obtained metakaolin and its properties.
2. Materials and Methods2.1. Materials
The examined materials were 4 kaolin minerals of different purities. These materialsoriginated from kaolin deposits in Cornwall, UK. The kaolin which had the highest purity(>95% kaolinite) was called Supreme; there was also medium to high purity kaolin, theSpeswhite, and a medium to low quality kaolin, the Polwhite B. Finally, Polwhite E kaolinhad the lowest purity (75% kaolinite), and the contained impurities included mica, feldsparand quartz.
2.2. Methods
Thermal activation of the four kaolin samples was carried out in a lab-scale rotarykiln. The duration of the calcination process was 3 h, while the examined temperatureswere: 600, 650 and 700 ◦C. After every thermal treatment, the calcined sample remained inthe kiln in order to slowly cool down to room temperature.
2.3. Testing and Analysis Techniques2.3.1. X-ray Diffraction (XRD)
The mineralogy of both the raw and heat-treated samples was examined using aBruker D8 Focus diffractometer in the 2θ range 5–70◦ (step size: 0.02◦ 2θ). Data analysiswas performed by the Profex software.
2.3.2. Fourier-Transform Infrared Spectroscopy (FTIR)
The FTIR measurements were performed on a Perkin Elmer Spectrum 100 spectrome-ter using a ZnSe ATR crystal. All the samples were measured within the wave range of4000–650 cm−1.
2.3.3. Thermal Analysis (TG-DTA/DSC)
DTA analysis was applied in order to investigate the thermal behavior of the samples.For the measurements, a Labsys TG-DTA/DSC by Setaram was used. The samples wereheated in the range between 20 ◦C and 900 ◦C with a heating rate of 20 ◦C in a Heatmosphere and using a platinum (Pt) crucible.
2.3.4. Chapelle Test—Reactivity
The pozzolanic activity of the samples was assessed using the modified Chapelletest according to the NF P18-513 standard [9]. This test allows the quantification of fixedCa(OH)2, which is consumed by 1 g of metakaolin sample when mixed with 2 g of CaO.The suspension was boiled at 90 ◦C for 16 h under continuous stirring, and after that,was cooled to room temperature. Finally, an amount of the solution was filtered and thentitrated using HCl in order to define the consumed Ca(OH)2 [10].
3. Results and Discussion
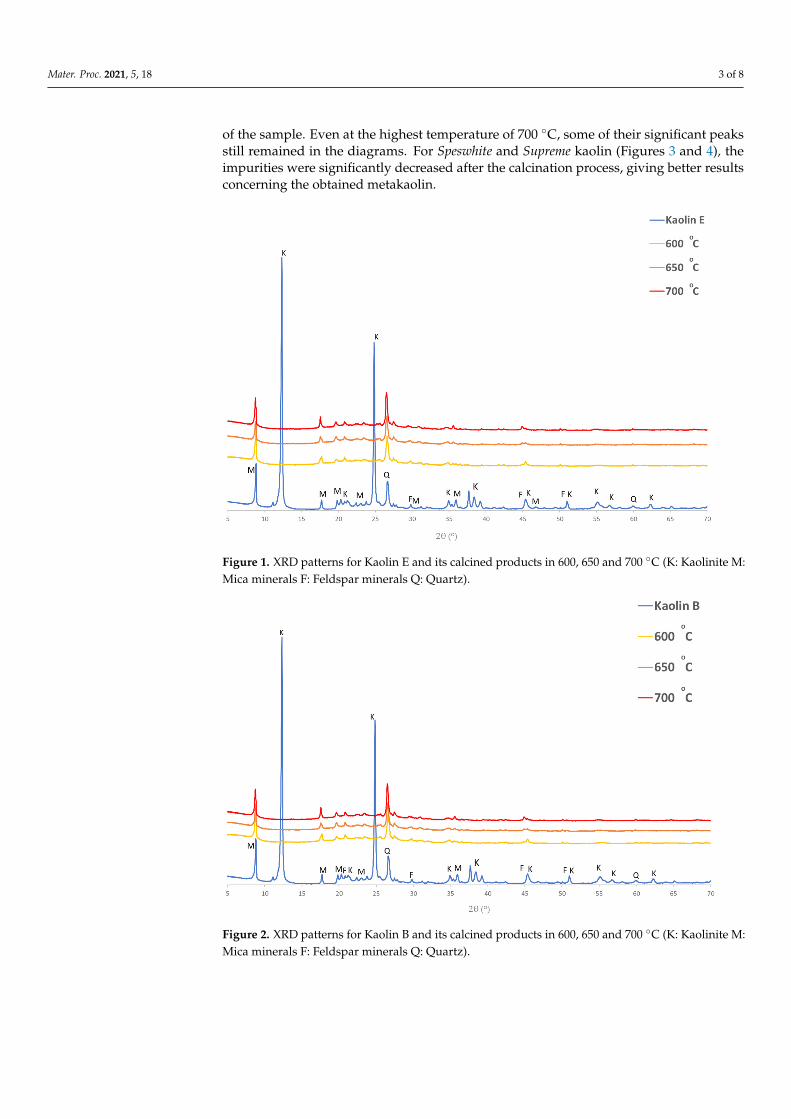
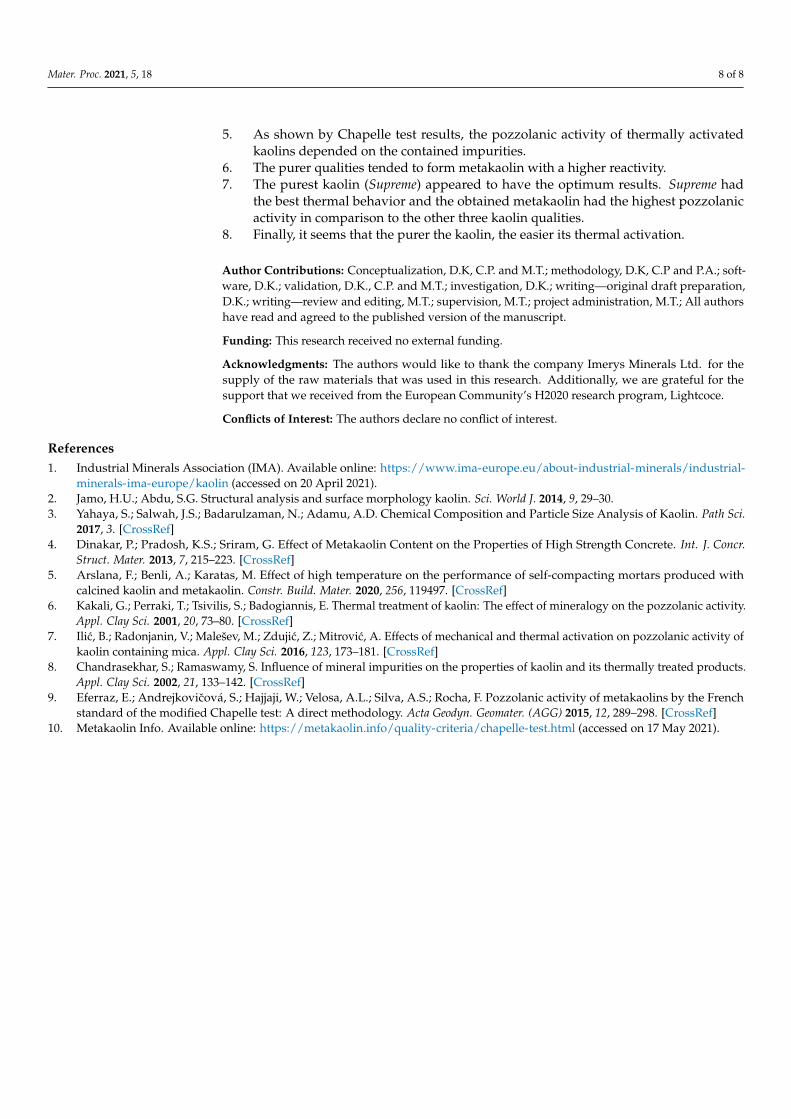
In the XRD results show the effect of kaolin mineralogy in the formation of metakaolin.Kaolin E and kaolin B (Figures 1 and 2) seemed to have the lowest purity, as they containedquantities of mica minerals (Biotite, Phlogopite, Muscovite), feldspar minerals (Albite,Microcline) and Quartz. All these minerals seemed to delay the complete transformation
Mater. Proc. 2021, 5, 18 3 of 8
of the sample. Even at the highest temperature of 700 ◦C, some of their significant peaksstill remained in the diagrams. For Speswhite and Supreme kaolin (Figures 3 and 4), theimpurities were significantly decreased after the calcination process, giving better resultsconcerning the obtained metakaolin.
Mater. Proc. 2021, 5, 18 3 of 5
3. Results and Discussion In the XRD results show the effect of kaolin mineralogy in the formation of
metakaolin. Kaolin E and kaolin B (Figures 1 and 2) seemed to have the lowest purity, as they contained quantities of mica minerals (Biotite, Phlogopite, Muscovite), feldspar minerals (Albite, Microcline) and Quartz. All these minerals seemed to delay the complete transformation of the sample. Even at the highest temperature of 700 °C, some of their significant peaks still remained in the diagrams. For Speswhite and Supreme kaolin (Figures 3 and 4), the impurities were significantly decreased after the calcination process, giving better results concerning the obtained metakaolin.
Figure 1. XRD patterns for Kaolin E and its calcined products in 600, 650 and 700 °C (K: Kaolinite M: Mica minerals F: Feldspar minerals Q: Quartz).
Figure 1. XRD patterns for Kaolin E and its calcined products in 600, 650 and 700 ◦C (K: Kaolinite M:Mica minerals F: Feldspar minerals Q: Quartz).
Mater. Proc. 2021, 5, 18 3 of 5
3. Results and Discussion In the XRD results show the effect of kaolin mineralogy in the formation of
metakaolin. Kaolin E and kaolin B (Figures 1 and 2) seemed to have the lowest purity, as they contained quantities of mica minerals (Biotite, Phlogopite, Muscovite), feldspar minerals (Albite, Microcline) and Quartz. All these minerals seemed to delay the complete transformation of the sample. Even at the highest temperature of 700 °C, some of their significant peaks still remained in the diagrams. For Speswhite and Supreme kaolin (Figures 3 and 4), the impurities were significantly decreased after the calcination process, giving better results concerning the obtained metakaolin.
Figure 1. XRD patterns for Kaolin E and its calcined products in 600, 650 and 700 °C (K: Kaolinite M: Mica minerals F: Feldspar minerals Q: Quartz).
Figure 2. XRD patterns for Kaolin B and its calcined products in 600, 650 and 700 ◦C (K: Kaolinite M:Mica minerals F: Feldspar minerals Q: Quartz).

Mater. Proc. 2021, 5, 18 4 of 8
Mater. Proc. 2021, 5, 18 4 of 5
Figure 2. XRD patterns for Kaolin B and its calcined products in 600, 650 and 700 °C (K: Kaolinite M: Mica minerals F: Feldspar minerals Q: Quartz).
Figure 3. XRD patterns for Kaolin Speswhite and its calcined products in 600, 650 and 700 °C (K: Kaolinite M: Mica minerals Q: Quartz).
Figure 4. XRD patterns for Kaolin Supreme and its calcined products in 600, 650 and 700 °C (K: Kaolinite M: Mica minerals Q: Quartz).
According to the displayed curves from FTIR, there was a significant difference between the raw kaolins and the calcined samples.
At all temperatures, there was a noticeable reduction in the appearance of the kaolinite bands and in their intensity, probably because of the transformation occurrence. The curves corresponding to the calcined samples were quite similarly independent of the
Figure 3. XRD patterns for Kaolin Speswhite and its calcined products in 600, 650 and 700 ◦C (K:Kaolinite M: Mica minerals Q: Quartz).
Mater. Proc. 2021, 5, 18 4 of 5
Figure 2. XRD patterns for Kaolin B and its calcined products in 600, 650 and 700 °C (K: Kaolinite M: Mica minerals F: Feldspar minerals Q: Quartz).
Figure 3. XRD patterns for Kaolin Speswhite and its calcined products in 600, 650 and 700 °C (K: Kaolinite M: Mica minerals Q: Quartz).
Figure 4. XRD patterns for Kaolin Supreme and its calcined products in 600, 650 and 700 °C (K: Kaolinite M: Mica minerals Q: Quartz).
According to the displayed curves from FTIR, there was a significant difference between the raw kaolins and the calcined samples.
At all temperatures, there was a noticeable reduction in the appearance of the kaolinite bands and in their intensity, probably because of the transformation occurrence. The curves corresponding to the calcined samples were quite similarly independent of the
Figure 4. XRD patterns for Kaolin Supreme and its calcined products in 600, 650 and 700 ◦C (K:Kaolinite M: Mica minerals Q: Quartz).
According to the displayed curves from FTIR, there was a significant differencebetween the raw kaolins and the calcined samples.
At all temperatures, there was a noticeable reduction in the appearance of the kaolinitebands and in their intensity, probably because of the transformation occurrence. The curvescorresponding to the calcined samples were quite similarly independent of the calcinationtemperature, but they still had some low intensity bands, probably due to the impurities’existence (Figures 5–7). Finally, as can be clearly observed, the Supreme kaolin (Figure 8)appeared to have the desired curves even from 600 ◦C.

Mater. Proc. 2021, 5, 18 5 of 8
Mater. Proc. 2021, 5, 18 5 of 5
calcination temperature, but they still had some low intensity bands, probably due to the impurities’ existence (Figures 5–7). Finally, as can be clearly observed, the Supreme kaolin (Figure 8) appeared to have the desired curves even from 600 °C.
Figure 5. FTIR spectra of Kaolin E and its calcined products at 600, 650 and 700 °C.
Figure 6. FTIR spectra of Kaolin B and its calcined products at 600, 650 and 700 °C.
Figure 5. FTIR spectra of Kaolin E and its calcined products at 600, 650 and 700 ◦C.
Mater. Proc. 2021, 5, 18 5 of 5
calcination temperature, but they still had some low intensity bands, probably due to the impurities’ existence (Figures 5–7). Finally, as can be clearly observed, the Supreme kaolin (Figure 8) appeared to have the desired curves even from 600 °C.
Figure 5. FTIR spectra of Kaolin E and its calcined products at 600, 650 and 700 °C.
Figure 6. FTIR spectra of Kaolin B and its calcined products at 600, 650 and 700 °C.
Figure 6. FTIR spectra of Kaolin B and its calcined products at 600, 650 and 700 ◦C.

Mater. Proc. 2021, 5, 18 6 of 8Mater. Proc. 2021, 5, 18 6 of 5
Figure 7. FTIR spectra of Kaolin Speswhite and its calcined products at 600, 650 and 700 °C.
Figure 8. FTIR spectra of Kaolin Supreme and its calcined products at 600, 650 and 700 °C.
Figure 9 presents the DTA curves of the raw materials. First of all, the release of the absorbed water occurred for temperatures below 100 °C. Within the temperature range of 450–700 °C, for all the kaolin qualities, there was a characteristic endothermic peak (560–580 °C) which revealed that the dihydroxylation of kaolinite was achieved. All the received DTA curves did not seem to have huge differences between them. The slope of the DTA curve corresponded to the dehydroxylation process. These curves were generally sharper (greater absolute value of slope) for the well-crystallized materials [6]. Finally, the kaolinite transformation of the Supreme and Speswhite kaolin seemed to be completed at lower temperatures (~640 °C) than the other two qualities (~700 °C).
Figure 7. FTIR spectra of Kaolin Speswhite and its calcined products at 600, 650 and 700 ◦C.
Mater. Proc. 2021, 5, 18 6 of 5
Figure 7. FTIR spectra of Kaolin Speswhite and its calcined products at 600, 650 and 700 °C.
Figure 8. FTIR spectra of Kaolin Supreme and its calcined products at 600, 650 and 700 °C.
Figure 9 presents the DTA curves of the raw materials. First of all, the release of the absorbed water occurred for temperatures below 100 °C. Within the temperature range of 450–700 °C, for all the kaolin qualities, there was a characteristic endothermic peak (560–580 °C) which revealed that the dihydroxylation of kaolinite was achieved. All the received DTA curves did not seem to have huge differences between them. The slope of the DTA curve corresponded to the dehydroxylation process. These curves were generally sharper (greater absolute value of slope) for the well-crystallized materials [6]. Finally, the kaolinite transformation of the Supreme and Speswhite kaolin seemed to be completed at lower temperatures (~640 °C) than the other two qualities (~700 °C).
Figure 8. FTIR spectra of Kaolin Supreme and its calcined products at 600, 650 and 700 ◦C.
Figure 9 presents the DTA curves of the raw materials. First of all, the release of theabsorbed water occurred for temperatures below 100 ◦C. Within the temperature rangeof 450–700 ◦C, for all the kaolin qualities, there was a characteristic endothermic peak(560–580 ◦C) which revealed that the dihydroxylation of kaolinite was achieved. All thereceived DTA curves did not seem to have huge differences between them. The slope ofthe DTA curve corresponded to the dehydroxylation process. These curves were generallysharper (greater absolute value of slope) for the well-crystallized materials [6]. Finally, thekaolinite transformation of the Supreme and Speswhite kaolin seemed to be completed atlower temperatures (~640 ◦C) than the other two qualities (~700 ◦C).

Mater. Proc. 2021, 5, 18 7 of 8Mater. Proc. 2021, 5, 18 7 of 5
Figure 9. DTA curves of raw materials.
Finally, Table 1 presents the reactivity results (Chapelle test) of the calcined samples. Considering that the reactivity of commercial metakaolin is 1880 mg CaOH2, the nearest value to this corresponded to the purest kaolin, Supreme. All the other values were far lower than the Supreme kaolin, although the purer qualities tended to have higher reactivity values.
Concerning the temperature effect, it can be noticed that for the purest qualities, the transformation began even at 600 °C. As the impurities increased, the transformation required temperatures of at least 650 °C or higher.
Table 1. Chapelle test results for the raw materials and the calcined samples.
Kaolin Quality 600 °C 650 °C 700 °C mg of CaOH2
Kaolin E 1421 1522 1576 Kaolin B 1492 1542 1602
Speswhite 1567 1607 1676 Supreme 1724 1767 1782
4. Conclusions The conclusions obtained from this research can be summarized as follows:
1. The conditions of the thermal activation are built upon the mineralogical characteristics of the raw material. Specifically, samples with less impurities need calcination at lower temperatures in order to be activated.
2. The XRD and FTIR results showed that for all the kaolin qualities, the transformation to metakaolin started even at 600 °C, which is the lowest temperature that was investigated.
3. Particularly in the low purity calcined samples, only the impurities seemed to be present at higher temperatures.
4. The DTA curves revealed that the two purer qualities (Supreme and Speswhite) had a better crystallinity than the other samples.
5. As shown by Chapelle test results, the pozzolanic activity of thermally activated kaolins depended on the contained impurities.
6. The purer qualities tended to form metakaolin with a higher reactivity.
Figure 9. DTA curves of raw materials.
Finally, Table 1 presents the reactivity results (Chapelle test) of the calcined samples.Considering that the reactivity of commercial metakaolin is 1880 mg CaOH2, the near-est value to this corresponded to the purest kaolin, Supreme. All the other values werefar lower than the Supreme kaolin, although the purer qualities tended to have higherreactivity values.
Table 1. Chapelle test results for the raw materials and the calcined samples.
Kaolin Quality 600 ◦C 650 ◦C 700 ◦C
mg of CaOH2
Kaolin E 1421 1522 1576
Kaolin B 1492 1542 1602
Speswhite 1567 1607 1676
Supreme 1724 1767 1782
Concerning the temperature effect, it can be noticed that for the purest qualities, thetransformation began even at 600 ◦C. As the impurities increased, the transformationrequired temperatures of at least 650 ◦C or higher.
4. Conclusions
The conclusions obtained from this research can be summarized as follows:
1. The conditions of the thermal activation are built upon the mineralogical characteris-tics of the raw material. Specifically, samples with less impurities need calcination atlower temperatures in order to be activated.
2. The XRD and FTIR results showed that for all the kaolin qualities, the transformationto metakaolin started even at 600 ◦C, which is the lowest temperature that wasinvestigated.
3. Particularly in the low purity calcined samples, only the impurities seemed to bepresent at higher temperatures.
4. The DTA curves revealed that the two purer qualities (Supreme and Speswhite) had abetter crystallinity than the other samples.
Mater. Proc. 2021, 5, 18 8 of 8
5. As shown by Chapelle test results, the pozzolanic activity of thermally activatedkaolins depended on the contained impurities.
6. The purer qualities tended to form metakaolin with a higher reactivity.7. The purest kaolin (Supreme) appeared to have the optimum results. Supreme had
the best thermal behavior and the obtained metakaolin had the highest pozzolanicactivity in comparison to the other three kaolin qualities.
8. Finally, it seems that the purer the kaolin, the easier its thermal activation.
Author Contributions: Conceptualization, D.K, C.P. and M.T.; methodology, D.K, C.P and P.A.; soft-ware, D.K.; validation, D.K., C.P. and M.T.; investigation, D.K.; writing—original draft preparation,D.K.; writing—review and editing, M.T.; supervision, M.T.; project administration, M.T.; All authorshave read and agreed to the published version of the manuscript.
Funding: This research received no external funding.
Acknowledgments: The authors would like to thank the company Imerys Minerals Ltd. for thesupply of the raw materials that was used in this research. Additionally, we are grateful for thesupport that we received from the European Community’s H2020 research program, Lightcoce.
Conflicts of Interest: The authors declare no conflict of interest.
References1. Industrial Minerals Association (IMA). Available online: https://www.ima-europe.eu/about-industrial-minerals/industrial-
minerals-ima-europe/kaolin (accessed on 20 April 2021).2. Jamo, H.U.; Abdu, S.G. Structural analysis and surface morphology kaolin. Sci. World J. 2014, 9, 29–30.3. Yahaya, S.; Salwah, J.S.; Badarulzaman, N.; Adamu, A.D. Chemical Composition and Particle Size Analysis of Kaolin. Path Sci.
2017, 3. [CrossRef]4. Dinakar, P.; Pradosh, K.S.; Sriram, G. Effect of Metakaolin Content on the Properties of High Strength Concrete. Int. J. Concr.
Struct. Mater. 2013, 7, 215–223. [CrossRef]5. Arslana, F.; Benli, A.; Karatas, M. Effect of high temperature on the performance of self-compacting mortars produced with
calcined kaolin and metakaolin. Constr. Build. Mater. 2020, 256, 119497. [CrossRef]6. Kakali, G.; Perraki, T.; Tsivilis, S.; Badogiannis, E. Thermal treatment of kaolin: The effect of mineralogy on the pozzolanic activity.
Appl. Clay Sci. 2001, 20, 73–80. [CrossRef]7. Ilic, B.; Radonjanin, V.; Malešev, M.; Zdujic, Z.; Mitrovic, A. Effects of mechanical and thermal activation on pozzolanic activity of
kaolin containing mica. Appl. Clay Sci. 2016, 123, 173–181. [CrossRef]8. Chandrasekhar, S.; Ramaswamy, S. Influence of mineral impurities on the properties of kaolin and its thermally treated products.
Appl. Clay Sci. 2002, 21, 133–142. [CrossRef]9. Eferraz, E.; Andrejkovicová, S.; Hajjaji, W.; Velosa, A.L.; Silva, A.S.; Rocha, F. Pozzolanic activity of metakaolins by the French
standard of the modified Chapelle test: A direct methodology. Acta Geodyn. Geomater. (AGG) 2015, 12, 289–298. [CrossRef]10. Metakaolin Info. Available online: https://metakaolin.info/quality-criteria/chapelle-test.html (accessed on 17 May 2021).