mineral, fluid and thermal evolution in veins from late orogenic ...
199
MINERAL, FLUID AND THERMAL EVOLUTION IN VEINS FROM LATE OROGENIC COAL BASINS OF THE CANTABRIAN ZONE (VARISCAN, NW SPAIN) INAUGURAL-DISSERTATION zur Erlangung der Doktorwürde der Naturwissenschaftlich-Mathematischen Gesamtfakultät der Ruprecht-Karls-Universität Heidelberg vorgelegt von Ldo. Geología Fernando Ayllón aus Santander (Spanien) -2003-
-
Upload
khangminh22 -
Category
Documents
-
view
3 -
download
0
Transcript of mineral, fluid and thermal evolution in veins from late orogenic ...
MINERAL, FLUID AND THERMAL EVOLUTION INVEINS FROM LATE OROGENIC COAL BASINS OF THE
CANTABRIAN ZONE (VARISCAN, NW SPAIN)
INAUGURAL-DISSERTATIONzur
Erlangung der Doktorwürdeder
Naturwissenschaftlich-Mathematischen Gesamtfakultätder
Ruprecht-Karls-UniversitätHeidelberg
vorgelegt von
Ldo. Geología Fernando Ayllón
aus Santander (Spanien)
-2003-
Gutachter 1: Priv. Doz. Dr. Laurence N. Warr
Geologisch-Paläontologisches Institut, Ruprecht-Karls-Universität,
Im Neunheimer Feld 234, D-69120, Heidelberg, Deutschland
Gutachter 2: Univ. Ass. Dr. Ronald J. Bakker
Institut für Geowissenschaften, Abt. Mineralogie und Petrologie, Montan-Universität
Leoben, Peter-Tunner Str. 5, A-8700, Leoben, Österreich
Tag der Promotionsprüfung: 2003
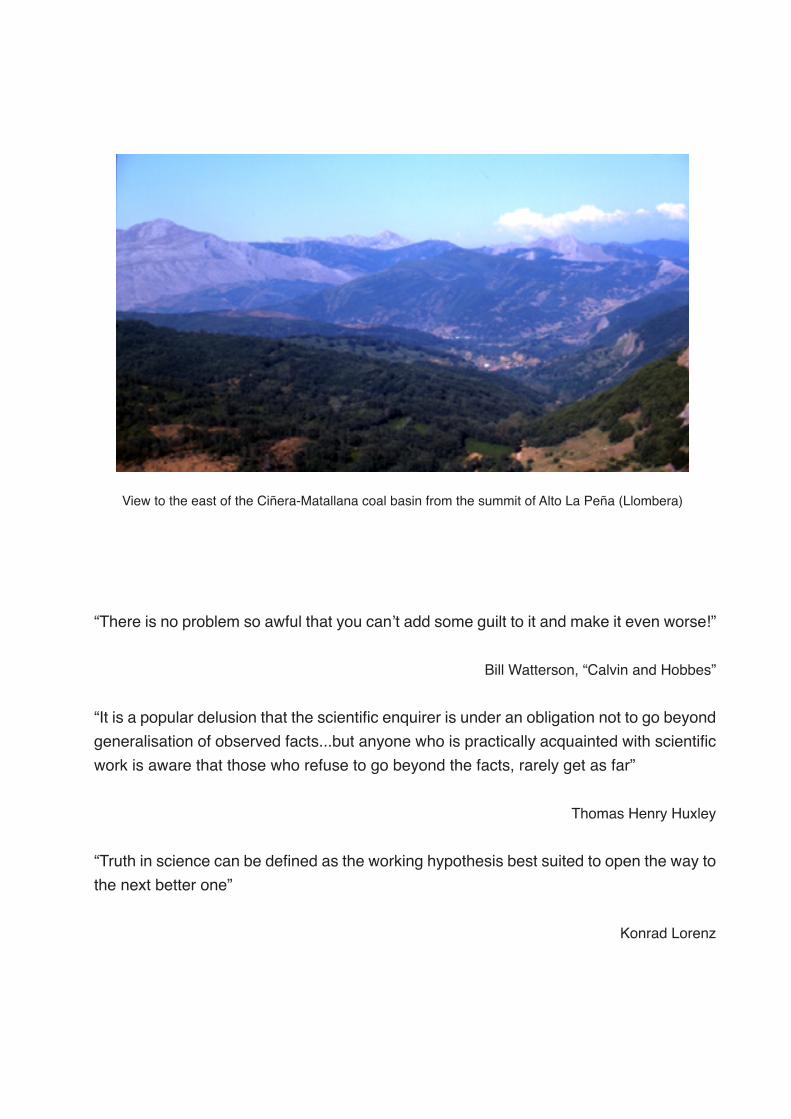
View to the east of the Ciñera-Matallana coal basin from the summit of Alto La Peña (Llombera)
“There is no problem so awful that you can’t add some guilt to it and make it even worse!”
Bill Watterson, “Calvin and Hobbes”
“It is a popular delusion that the scientific enquirer is under an obligation not to go beyond
generalisation of observed facts...but anyone who is practically acquainted with scientific
work is aware that those who refuse to go beyond the facts, rarely get as far”
Thomas Henry Huxley
“Truth in science can be defined as the working hypothesis best suited to open the way to
the next better one”
Konrad Lorenz

Para Ana,
por mantener siempre viva mi ilusión
ACKNOWLEDGEMENTS
I would like to thank in these lines all the people who in many different ways have madethis work possible and these four years of life in Heidelberg a wonderful experience.
In first place to my supervisors Laurence Warr and Ronald Bakker for their support,friendship and interest in this project. Above all for the many interesting discussions inwhich I have learnt so much about science and many other things. They have been aconstant example of dedication to work and they are responsible for any good that thisthesis may contain and for none of the mistakes.
To those who have helped in the completion of the work. To Ramón Valle for makingthe most fortunate telephone call. To Martin Feely for giving the best recommendation. ToCovadonga Brime, Fernando Álvarez, Susana García and Fernando Bastida for their trust,help and good advice in the initial stages of the work, always the most difficult ones. To theDFG Graduierten Kolleg Program 273 “Fluid-Rock Interaction” for the three years of funding.To Odile Wallerath for preparing all my samples. To Michael Joachimski for measuring thestable isotopes of my carbonates and showing me Erlangen. To all the people of theMineralogy Department at the University of Leoben for their friendliness, interest and fruitfuldiscussions during my three long stays in Austria: Larryn, Johann, Oskar, Eugen, Harry,Paolo, Alistair and Kreshimir. To Roswitha Marioth for reading and correcting the finalversion of the manuscript.
To all the personal, undergraduates and PhD students at the Geological Institutefor all those shared happy moments. My roommates: Kai, Karsten and Thomas. And Hei-ko, Anja, Michael, Axel, Jana, Birgit, Gesine, Christina, Fabio, Jochen, Bernd, Agnes,Helga, Rainer, Edilma, Jens, Oliver, Claudia, Rike, Utz, Joe, Frank, Marcelo, Gerson,Martin, Aung Moe, Jörn and Peter. Zbynek, Marta, Francis and Juan deserve specialmention, simply for being so great.
To my flatmates Christian and Myriel for making my life at home easy and pleasant.To the “football gang”: Andreas, Eichkorn, Martin, Mathias, Alex, Sven, Gayus, Gregor andmany others... for reminding me each Monday that there is more to life than just work. Toother friends who have helped in different moments: Verena, Nils, Carlo, Oliver, Pedro,Heiko and Karine, Oscar, Bet, Berta and Rocío. To the best brotherhood of old friendsfrom Santander, who always kept in touch and never doubted that I would get it finished:Javier, Ángel, Roberto, Saúl y Jose Antonio.
And last but not least to my parents, Fernando and Amparo, and my sister Sarito fortheir unconditional support, for phoning everyday and for always being there when I neededthem most.
AGRADECIMIENTOS
Quisiera en estas líneas agradecer a todos aquellos que de muy diversas maneras hancontribuido a hacer posible este trabajo y a que mis cuatro años de vida en Heidelberghayan sido una experiencia inolvidable.
En primer lugar a mis supervisores Laurence Warr y Ronald Bakker por su apoyo,amistad e interés en este proyecto. Sobre todo por las muchas discusiones en las quetanto he aprendido sobre ciencia y otras muchas cosas. Ellos han sido un constanteejemplo de dedicación al trabajo y son responsables de los aciertos que esta tesis puedacontener y de ninguno de sus errores.
A la gente que ha ayudado en la consecución del trabajo. A Ramón Valle por hacerla llamada telefónica más oportuna. A Martin Feely por dar la mejor recomendación. ACovadonga Brime, Fernando Álvarez, Susana García y Fernando Bastida por su confianza,ayuda y consejos en las etapas iniciales de este trabajo, siempre las más difíciles. AlPrograma del DFG, Graduiertenkolleg 273 “Fluid-Rock Interaction” por los tres años debeca y financiación. A Odile Walerath por preparar todas mis muestras. A Michael M.Joachimski por medir los isótopos de mis carbonatos y mostrarme Erlangen. A la gentedel departamento de Mineralogía de la Universidad de Leoben, por su simpatía, interés yfructíferas discusiones durante mis tres largas estancias en Austria: Larryn, Johann, Os-kar, Eugen, Harry, Paolo, Alistair y Kreshimir. A Roswitha Marioth por leer y corregir laversión final del manuscrito.
A todo el personal, estudiantes y doctorandos del Instituto de Geología por todoslos buenos momentos compartidos. Cada uno sabe lo que le toca. Mis compañeros dedespacho: Kai, Karsten y Thomas. Y Heiko, Anja, Michael, Axel, Jana, Birgit, Gesine,Christina, Fabio, Jochen, Bernd, Agnes, Helga, Edilma, Jens, Oliver, Claudia, Rike, Utz,Joe, Frank, Marcelo, Gerson, Martin, Aung Moe, Jörn y Peter. Zbynek, Marta, Francis yJuan merecen mención aparte simplemente por ser así de geniales.
A mis compañeros de piso Christian y Myriel, por hacerme fácil y agradable la vidaen casa. A la entrañable “banda del futbol”: Andreas, Eichkorn, Martin, Mathias, Alex,Sven, Gayus, Gregor y otros muchos..., por recordarme cada lunes que la vida consisteen mucho más que el trabajo. A otros amigos que también han ayudado en distintosmomentos: Verena, Nils, Carlo, Oliver, Heiko y Karine, Pedro, Oscar, Bet, Berta y Rocío.A la mejor cofradía de amigos de Santander, que mantuvieron el contacto y nunca dudaronde que conseguiría terminar: Javier, Ángel, Roberto, Saúl y Jose Antonio.
Y por último a mis padres, Fernando y Amparo, y a mi hermana Sarito por su apoyoincondicional, por llamar cada día y por estar siempre ahí cuando lo he necesitado.
DANKSAGUNG
An dieser Stelle möchte ich allen danken, die auf verschiedenen Wegen diese Arbeitermöglicht haben und mir die vier Jahre in Heidelberg unvergesslich machten.
In erster Linie meinen Betreuern Laurence Warr und Ronald Bakker für ihren Rück-halt, ihre Freundschaft und ihr Interesse an diesem Projekt. Vor allem für die vielen Dis-kussionen, durch die ich so viel über Wissenschaft und vieles mehr gelernt habe. Sie sindfür den Erfolg und nicht für die Fehler dieser Arbeit verantwortlich.
An alle, die zum direkten Erfolg dieser Arbeit beigetragen haben. Ramón Valle, derden wichtigsten Telefonanruf tätigte und Martin Feely für die beste Empfehlung. CovadongaBrime, Fernando Álvarez, Susana García und Fernando Bastida für ihr Vertrauen, Hilfeund Ratschläge während der Anfänge dieser Arbeit, die immer am schwierigsten sind.Dem DFG Graduiertenkolleg Programm 273 “Einwirkung fluider Phasen auf Locker- undFestgesteine” für die dreijährige Finanzierung meiner Arbeit. Odile Wallerath für die Anfer-tigung aller meiner Proben. Michael M. Joachimski für die Isotopenmessungen derKarbonatproben und die Führung durch Erlangen. Den Mitarbeitern der Abteilung Minera-logie und Petrologie der Montan Universität Leoben für ihre Sympathie, Interesse undfruchtbaren Diskussionen während meiner drei langen Aufenthalte in Österreich: Larryn,Johann, Oskar, Eugen, Harry, Paolo, Alistair y Kreshimir. Roswitha Marioth für die Durch-sicht meiner Arbeit.
An das ganze Personal, den Studenten und Doktoranden des Geologisch-Paläon-tologischen Institutes für die schöne gemeinsame Zeit. Meinen Zimmerkollegen: Kai, Car-sten und Thomas. Heiko, Anja, Michael, Axel, Jana, Birgit, Gesine, Christina, Fabio, Jo-chen, Bernd, Agnes, Helga, Edilma, Jens, Oliver, Claudia, Rike, Utz, Joe, Frank, Marcelo,Gerson, Martin, Aung Moe, Jörn und Peter. Zbynek, Marta, Francis und Juan möchte icherwähnen, da sie so genial sind.
Meinen Mitbewohnern Christian und Myriel, weil sie mir das Leben zuHause ein-fach und bequem gemacht haben. Der Fussballgang: Andreas, Eichkorn, Martin, Matthi-as, Alex, Sven, Gayus, Gregor und vielen anderen, die mich jeden Montag daran erinnerthaben, dass es im Leben noch mehr gibt, als nur Arbeit. Den Freunden, die mir in ver-schiedensten Momenten geholfen haben: Verena, Nils, Carlo, Oliver, Heiko und Karine,Pedro, Oscar, Bet, Berta und Rocío.Meinen besten Freunden in Santander, die mit mir inVerbindung blieben und nie daran zweifelten, dass ich jemals fertig werde: Javier, Ángel,Roberto, Saúl y Jose Antonio.
Zuletzt möchte ich meinen Eltern, Fernando und Amparo, sowie meiner SchwesterSarito für ihre bedingungslose Unterstützung und ihre täglichen Anrufe danken und dafür,
dass sie immer für mich da waren.
a) ich erkläre hiermit, daß ich die vorgelegte Dissertation selbst verfaßt und mich dabei
keiner anderen als der von mir ausdrücklich bezeichneten Quellen und Hilfen bedient
habe,
b) ich erkläre hiermit, daß ich keiner anderen Stelle ein Prufüngsverfahren beantragt
bzw. die Dissertation in dieser oder anderer Form bereits anderweitig als Prüfungsarbeit
verwendet oder einer anderen Fakultät als Dissertation vorgelegt habe.
Heidelberg, den 17/02/2003
Contents
CONTENTS
ABSTRACT
LIST OF ABBREVIATIONS
CHAPTER 1: INTRODUCTION
1.1. THEME, OBJECTIVES AND STRUCTURE OF THE WORK 1
1.2. FLUID-ROCK INTERACTION AND STEPHANIAN BASINS IN THE
CANTABRIAN ZONE 4
1.2.1. Geology and thermal evolution of the Cantabrian Zone 4
1.2.2. Thermal “anomalies” in Stephanian rocks 6
1.2.3. Significance of fluids in the thermal evolution of the
Cantabrian Zone 6
1.2.4. Associated projects at the University of Heidelberg 8
CHAPTER 2: GEOLOGICAL SETTING AND FIELD RELATIONS
2.1. INTRODUCTION 9
2.2. SABERO BASIN 9
Stratigraphy 9
Structural outline 10
2.3. CIÑERA-MATALLANA BASIN 12
Stratigraphy 12
Structural outline 13
2.4. IGNEOUS ROCKS 15
2.4.1. Diorite intrusions 15
2.4.2. Pyroclastic tonsteins 16
2.5. PALAEOTHERMAL CONDITIONS 17
2.6. VEIN OCCURRENCE IN THE STEPHANIAN ROCKS 18
CHAPTER 3: ANALYTICAL METHODS
3.1. PETROGRAPHY 25
3.1.1. Transmitted and reflected light microscopy 25
3.1.2. Carbonate staining 25
3.1.3. Cathodoluminescence 26
Contents
3.1.4. SEM imaging and EDX identification 26
3.2. FLUID INCLUSIONS 28
3.2.1. Microthermometry 28
3.2.2. Raman Microspectrometry 31
3.2.3. Combined Raman and microthermometry 32
3.2.4. Thermodynamic calculations and computer programs 32
3.3. X-RAY DIFFRACTION (XRD) 33
Powder preparates 33
Texture preparates 34
Kaolin polytype identification 34
3.4. STABLE ISOTOPE ANALYSIS 34
Principles 34
Analytical procedure 35
CHAPTER 4: VEIN MINERALOGY AND TEXTURAL RELATIONS
4.1. VEINS IN CLASTIC SEDIMENTARY ROCKS 37
4.1.1.Mineral phases 37
Quartz (qtz1) 37
Saddle dolomite (dolm) 37
Ferroan blocky calcite (cal2) 42
Sulphides (py) 42
Late calcite (cal3) 43
Authigenic clay minerals (kln) 43
4.1.2. Mineralisation history 47
4.1.3. Features of mineral growth 48
4.2. VEINS IN DIORITES 49
CHAPTER 5: FLUID INCLUSION ANALYSIS
5.1. FLUID INCLUSIONS IN VEINS FROM THE CLASTIC SEDIMENTARY
ROCKS 51
5.1.1. Relict calcite (cal1) inclusions 52
5.1.2. Vein quartz (qtz1) inclusions 52
5.1.3. Blocky calcite (cal2) inclusions 64
5.2. FLUID INCLUSIONS IN VEINS FROM THE DIORITES 68
5.3. FLUID SYSTEMS AND TRAPPING CONDITIONS (P-T-V-X) 71
5.3.1. Primary H2O-CH4-CO2-NaCl system in vein quartz (qtz1) 72
Aqueous-rich inclusions 72
Vapour-rich inclusions 72
Contents
Fluid immiscibility and pressure calculations 75
5.3.2. Secondary H2O-NaCl-CaCl2-CH4 system invein quartz (qtz1) 79
5.3.3. Primary H2O-NaCl-CaCl2-CH4 system in (cal2) 80
5.3.4. Primary H2O-CH4-CO2-NaCl system in (qtz2) 82
5.4. THE SEQUENCE OF FLUID EVENTS 83
CHAPTER 6: ORIGIN OF MINERAL PHASES AND FLUID SOURCES
6.1. QUARTZ PRECIPITATION AND ORGANIC DERIVED BASINAL FLUIDS 87
6.2. SADDLE DOLOMITE AND MATURATION OF THE CLASTIC ROCKS 89
6.3. THE ASSOCIATION OF DEDOLOMITISATION AND VEIN CALCITE 92
6.4. LATE CALCITE AND KAOLINITE CRYSTALLISATION 95
6.5. IMPLICATIONS FOR THE MINERAL SEQUENCE 99
6.6. HYDROTHERMAL ALTERATION AND QUARTZ GROWTH IN DIORITES 100
CHAPTER 7: FLUID INCLUSION RE-EQUILIBRATION
7.1. DEFINITION OF RE-EQUILIBRATION 103
7.2. RE-EQUILIBRATION TEXTURES IN VEIN QUARTZ 106
Scalloped inclusion walls 106
Annular-ring textures 106
Hairy textures 108
Haloes 108
Decrepitation clusters 108
Necking down 108
7.3. CONDITIONS AND MECHANISMS OF RE-EQUILIBRATION 109
7.4. CAUSES OF FLUID INCLUSION RE-EQUILIBRATION IN THE CIÑERA-
MATALLANA BASIN 110
Mechanical stress 111
Decompression 112
Heating 112
CHAPTER 8: FLUID-TEMPERATURE DISTRIBUTION AND VEINEVOLUTION
8.1. FLUID P-T-X DATA 115
8.2. A MARINE ORIGIN FOR THE VEIN CALCITE (cal2) 119
8.3. FLUID AND THERMAL EVOLUTION OF THE STUDIED VEINS 120
Contents
CHAPTER 9: DISCUSSION AND TECTONO-THERMAL HISTORY
9.1. IMPLICATIONS OF RE-EQUILIBRATION FOR HEAT TRANSMISSION 127
9.1.1. Factors affecting heat transmission 127
9.1.2. Evidence of fluid activity 128
9.1.3. The role of the diorites 129
Conductive temperature gradients away from the intrusive bodies 129
Effect of water saturation 131
9.1.4. Mechanism of heat transmission 132
9.1.5. Implications 134
9.2. TIMING OF VEIN FORMATION AND BASIN EVOLUTION 135
CONCLUSIONS 141
LITERATURE LIST 143
LIST OF FIGURES 159
LIST OF TABLES 161
APPENDIX 163
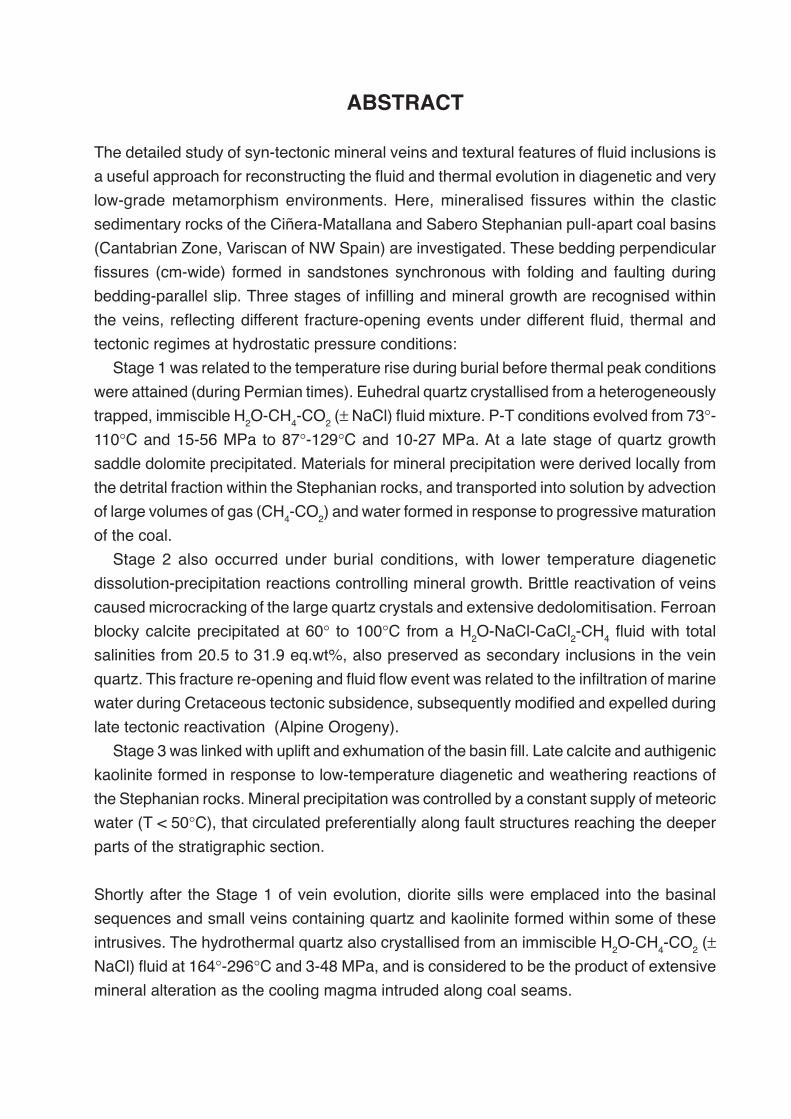
ABSTRACT
The detailed study of syn-tectonic mineral veins and textural features of fluid inclusions is
a useful approach for reconstructing the fluid and thermal evolution in diagenetic and very
low-grade metamorphism environments. Here, mineralised fissures within the clastic
sedimentary rocks of the Ciñera-Matallana and Sabero Stephanian pull-apart coal basins
(Cantabrian Zone, Variscan of NW Spain) are investigated. These bedding perpendicular
fissures (cm-wide) formed in sandstones synchronous with folding and faulting during
bedding-parallel slip. Three stages of infilling and mineral growth are recognised within
the veins, reflecting different fracture-opening events under different fluid, thermal and
tectonic regimes at hydrostatic pressure conditions:
Stage 1 was related to the temperature rise during burial before thermal peak conditions
were attained (during Permian times). Euhedral quartz crystallised from a heterogeneously
trapped, immiscible H2O-CH4-CO2 (± NaCl) fluid mixture. P-T conditions evolved from 73°-110°C and 15-56 MPa to 87°-129°C and 10-27 MPa. At a late stage of quartz growth
saddle dolomite precipitated. Materials for mineral precipitation were derived locally from
the detrital fraction within the Stephanian rocks, and transported into solution by advection
of large volumes of gas (CH4-CO2) and water formed in response to progressive maturation
of the coal.
Stage 2 also occurred under burial conditions, with lower temperature diagenetic
dissolution-precipitation reactions controlling mineral growth. Brittle reactivation of veins
caused microcracking of the large quartz crystals and extensive dedolomitisation. Ferroan
blocky calcite precipitated at 60° to 100°C from a H2O-NaCl-CaCl2-CH4 fluid with total
salinities from 20.5 to 31.9 eq.wt%, also preserved as secondary inclusions in the vein
quartz. This fracture re-opening and fluid flow event was related to the infiltration of marine
water during Cretaceous tectonic subsidence, subsequently modified and expelled during
late tectonic reactivation (Alpine Orogeny).
Stage 3 was linked with uplift and exhumation of the basin fill. Late calcite and authigenic
kaolinite formed in response to low-temperature diagenetic and weathering reactions of
the Stephanian rocks. Mineral precipitation was controlled by a constant supply of meteoric
water (T < 50°C), that circulated preferentially along fault structures reaching the deeper
parts of the stratigraphic section.
Shortly after the Stage 1 of vein evolution, diorite sills were emplaced into the basinal
sequences and small veins containing quartz and kaolinite formed within some of these
intrusives. The hydrothermal quartz also crystallised from an immiscible H2O-CH4-CO2 (±NaCl) fluid at 164°-296°C and 3-48 MPa, and is considered to be the product of extensive
mineral alteration as the cooling magma intruded along coal seams.
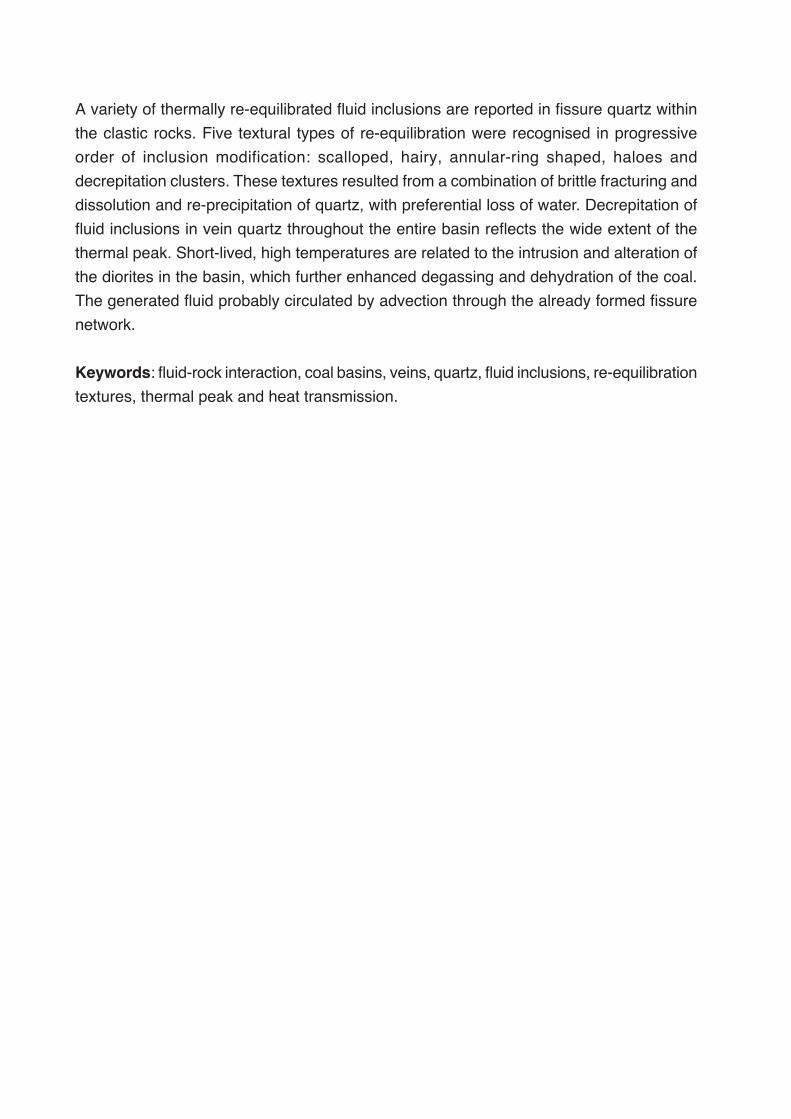
A variety of thermally re-equilibrated fluid inclusions are reported in fissure quartz within
the clastic rocks. Five textural types of re-equilibration were recognised in progressive
order of inclusion modification: scalloped, hairy, annular-ring shaped, haloes and
decrepitation clusters. These textures resulted from a combination of brittle fracturing and
dissolution and re-precipitation of quartz, with preferential loss of water. Decrepitation of
fluid inclusions in vein quartz throughout the entire basin reflects the wide extent of the
thermal peak. Short-lived, high temperatures are related to the intrusion and alteration of
the diorites in the basin, which further enhanced degassing and dehydration of the coal.
The generated fluid probably circulated by advection through the already formed fissure
network.
Keywords: fluid-rock interaction, coal basins, veins, quartz, fluid inclusions, re-equilibration
textures, thermal peak and heat transmission.
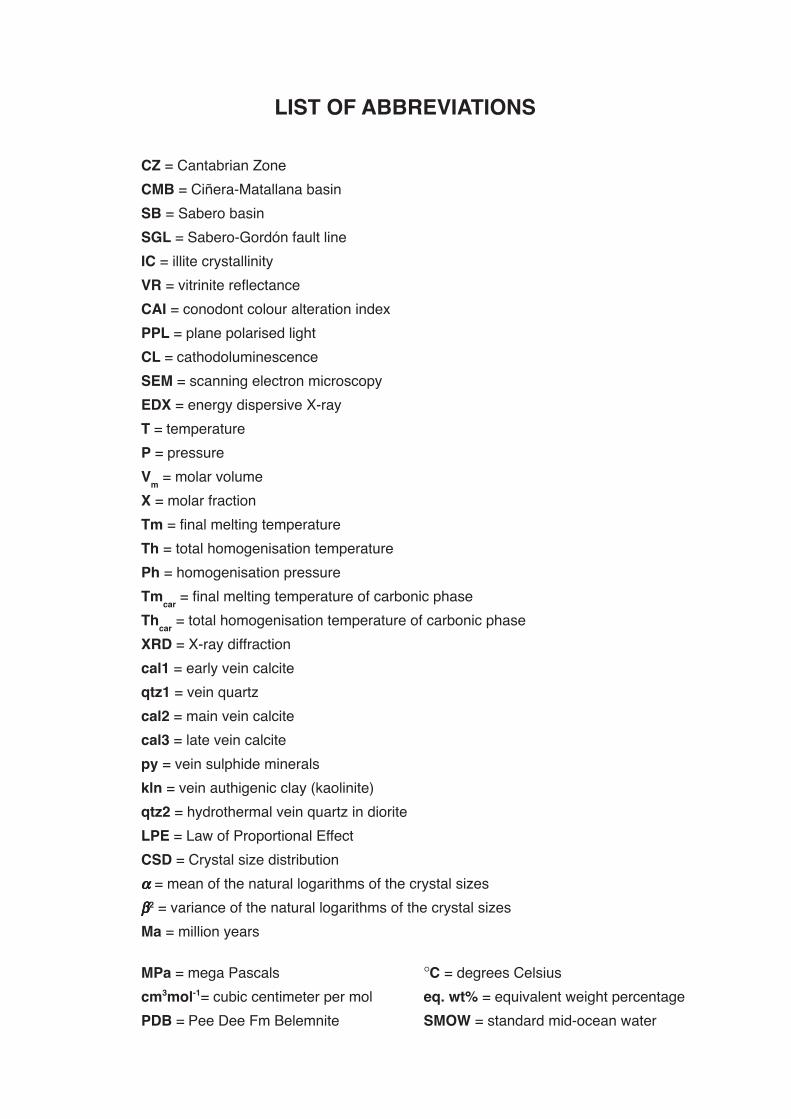
LIST OF ABBREVIATIONS
CZ = Cantabrian Zone
CMB = Ciñera-Matallana basin
SB = Sabero basin
SGL = Sabero-Gordón fault line
IC = illite crystallinity
VR = vitrinite reflectance
CAI = conodont colour alteration index
PPL = plane polarised light
CL = cathodoluminescence
SEM = scanning electron microscopy
EDX = energy dispersive X-ray
T = temperature
P = pressure
Vm = molar volume
X = molar fraction
Tm = final melting temperature
Th = total homogenisation temperature
Ph = homogenisation pressure
Tmcar
= final melting temperature of carbonic phase
Thcar
= total homogenisation temperature of carbonic phase
XRD = X-ray diffraction
cal1 = early vein calcite
qtz1 = vein quartz
cal2 = main vein calcite
cal3 = late vein calcite
py = vein sulphide minerals
kln = vein authigenic clay (kaolinite)
qtz2 = hydrothermal vein quartz in diorite
LPE = Law of Proportional Effect
CSD = Crystal size distribution
ααααα = mean of the natural logarithms of the crystal sizes
βββββ2 = variance of the natural logarithms of the crystal sizes
Ma = million years
MPa = mega Pascals °C = degrees Celsius
cm3mol-1= cubic centimeter per mol eq. wt% = equivalent weight percentage
PDB = Pee Dee Fm Belemnite SMOW = standard mid-ocean water

Chapter1: Introduction
1
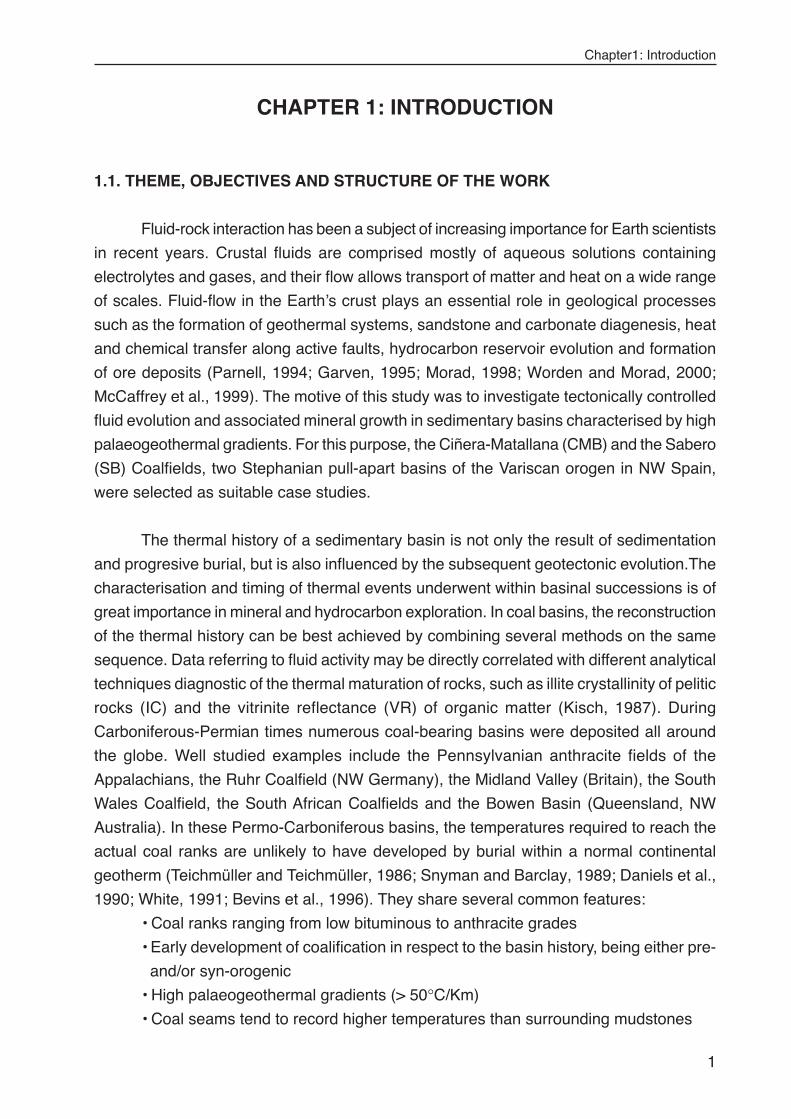
CHAPTER 1: INTRODUCTION
1.1. THEME, OBJECTIVES AND STRUCTURE OF THE WORK
Fluid-rock interaction has been a subject of increasing importance for Earth scientists
in recent years. Crustal fluids are comprised mostly of aqueous solutions containing
electrolytes and gases, and their flow allows transport of matter and heat on a wide range
of scales. Fluid-flow in the Earth’s crust plays an essential role in geological processes
such as the formation of geothermal systems, sandstone and carbonate diagenesis, heat
and chemical transfer along active faults, hydrocarbon reservoir evolution and formation
of ore deposits (Parnell, 1994; Garven, 1995; Morad, 1998; Worden and Morad, 2000;
McCaffrey et al., 1999). The motive of this study was to investigate tectonically controlled
fluid evolution and associated mineral growth in sedimentary basins characterised by high
palaeogeothermal gradients. For this purpose, the Ciñera-Matallana (CMB) and the Sabero
(SB) Coalfields, two Stephanian pull-apart basins of the Variscan orogen in NW Spain,
were selected as suitable case studies.
The thermal history of a sedimentary basin is not only the result of sedimentation
and progresive burial, but is also influenced by the subsequent geotectonic evolution.The
characterisation and timing of thermal events underwent within basinal successions is of
great importance in mineral and hydrocarbon exploration. In coal basins, the reconstruction
of the thermal history can be best achieved by combining several methods on the same
sequence. Data referring to fluid activity may be directly correlated with different analytical
techniques diagnostic of the thermal maturation of rocks, such as illite crystallinity of pelitic
rocks (IC) and the vitrinite reflectance (VR) of organic matter (Kisch, 1987). During
Carboniferous-Permian times numerous coal-bearing basins were deposited all around
the globe. Well studied examples include the Pennsylvanian anthracite fields of the
Appalachians, the Ruhr Coalfield (NW Germany), the Midland Valley (Britain), the South
Wales Coalfield, the South African Coalfields and the Bowen Basin (Queensland, NW
Australia). In these Permo-Carboniferous basins, the temperatures required to reach the
actual coal ranks are unlikely to have developed by burial within a normal continental
geotherm (Teichmüller and Teichmüller, 1986; Snyman and Barclay, 1989; Daniels et al.,
1990; White, 1991; Bevins et al., 1996). They share several common features:
• Coal ranks ranging from low bituminous to anthracite grades
• Early development of coalification in respect to the basin history, being either pre-
and/or syn-orogenic
• High palaeogeothermal gradients (> 50°C/Km)
• Coal seams tend to record higher temperatures than surrounding mudstones
Chapter 1: Introduction
2
In the Pennsylvania, South Wales and the Bowen Basins, such characteristics have
been interpreted to result from the flow of high temperature fluids along coal seams and
tectonic structures (Daniels et al., 1990; Gayer et al., 1991, 1997 & 1998; Uysal et al.,
2000). The fluid flow is envisaged to have been driven by orogenic compression or
associated with magmatic activity, which constitutes one of the main agents of thermal
maturation and coalification.
The importance of tectonic structures in focussing the flow and distribution of crustal
fluids, especially at shallow burial depths, has been widely recognised (Sibson, 1994;
McCaffrey et al., 1999). During dilation of the crust major fluid migration occurs along
extensional faults. Strike-slip fault systems also provide a major control on cross-formational
fluid flow, allowing interactions between otherwise separate flow regimes (Muchez and
Sintubin, 1997). Such different fluid systems are likely to leave an imprint in the rock
record, associated with the extensional activity. In a compressional tectonic regime, fluids
are considered to migrate upward and laterally, often along thrust faults, from the orogenic
wedges into adjacent foreland basins (Oliver, 1986; Garven, 1995). As a consequence of
rock deformation, mineral veins are usually formed in both extensional and compressional
regimes (Fitches, 1987; Fisher and Byrne, 1990; Swierczeswska et al., 2000). The mineral
phases contained in such fissures typically precipitate from a range of different fluid events,
often with distinct compositions and varying confining pressures and temperatures (Muchez
et al., 1995; Svensen et al., 2001).
Fluid inclusions preserved in minerals represent the only reliable source of obtaining
direct information regarding fluid composition and the conditions of mineral forming solutions
(Roedder, 1984). The importance of fluid inclusions in the study of fluid-related cementation
in clastic sequences and the transition from diagenesis to very low-grade metamorphism
has been widely recognised (Burrus, 1987a; Burley et al., 1989; Walderhaug, 1994; Frey
et al., 1980; Mullis et al., 1994). Determining the preserved fluid composition and fluid
pressure-temperature (P-T) conditions is of key importance in discriminating between
internal and external fluid sources within the basin sequences and allows the possible
mechanisms of heat and mass transfer to be evaluated. Despite the importance of fluid
inclusion studies, only a few investigations of mineral veins within coal basins have been
published. The results of Kisch and Van den Kerkhof (1991) in the Pennsylvania anthracite
fields and of Alderton and Bevins (1996) in South Wales imply that:
• Fluid systems trapped within the vein mineral inclusions were generated mostly
from the thermal maturation of the basinal rocks
• Peak fluid temperatures and pressures are slightly lower than those inferred from
coal rank indicators
Chapter1: Introduction
3
This investigation focuses on the study of the tectonic-related vein mineralisations
present in the Ciñera-Matallana and Sabero basins. The characterisation of mineral-fluid
compositions and fluid conditions within these fissures provides an excellent record of the
different fluid systems that circulated within the basinal successions. Special attention is
given to the description and understanding of processes in these strike-slip basins, which
have undergone the transition from diagenesis to very-low grade metamorphism. The
main objectives of this dissertation are to:
• establish the field relations between fluid-related mineralisations and deformation-
induced structures
• describe the mineral growth sequence
• characterise the composition and P-T conditions of the mineral-related fluid systems
• discuss the possible origin of minerals and fluids
• evaluate the role of the fluids in the thermal history of the basinal rocks with this
pull-apart setting, particularly in relation to the anomalously high palaeogeothermal
gradients
The framework of the thesis is structured as follows:
-Chapter 2 provides a brief description of the geological features of the CMB and SB and
the field relations of the sampled veins.
-Chapter 3 is a detailed explanation of the different analytical methods applied in this
study, in order to provide the background to the results and interpretation.
-Chapter 4 presents a description of the different mineral phases found within the veins,
the mineral growth sequence and the features of crystallisation.
-Chapter 5 characterises in detail the fluid inclusion types preserved in the different vein
minerals. Several fluid systems are interpreted and the fluid trapping conditions and their
relative timing is unravelled.
-Chapter 6 integrates the obtained mineral and fluid data with information available from
previous studies to assess the processes responsible for the formation of the different
fluid systems and the precipitated minerals.
-Chapter 7 focuses on the re-equilibration textures of fluid inclusions in vein quartz of the
CMB, formed as a consequence of changes in the temperature and pressure conditions in
the fissure environment following quartz crystallisation.
-Chapter 8 outlines the distribution of fluid temperatures within the basin sequences and
summarises the fluid-thermal-mineral evolution within the veins.
-Chapter 9 discusses the fluid-thermal history of the basins and presents a tectonothermal
reconstruction of events
Chapter 1: Introduction
4
1.2. FLUID-ROCK INTERACTION AND STEPHANIAN BASINS IN THE
CANTABRIAN ZONE
1.2.1. Geology and thermal evolution of the Cantabrian Zone
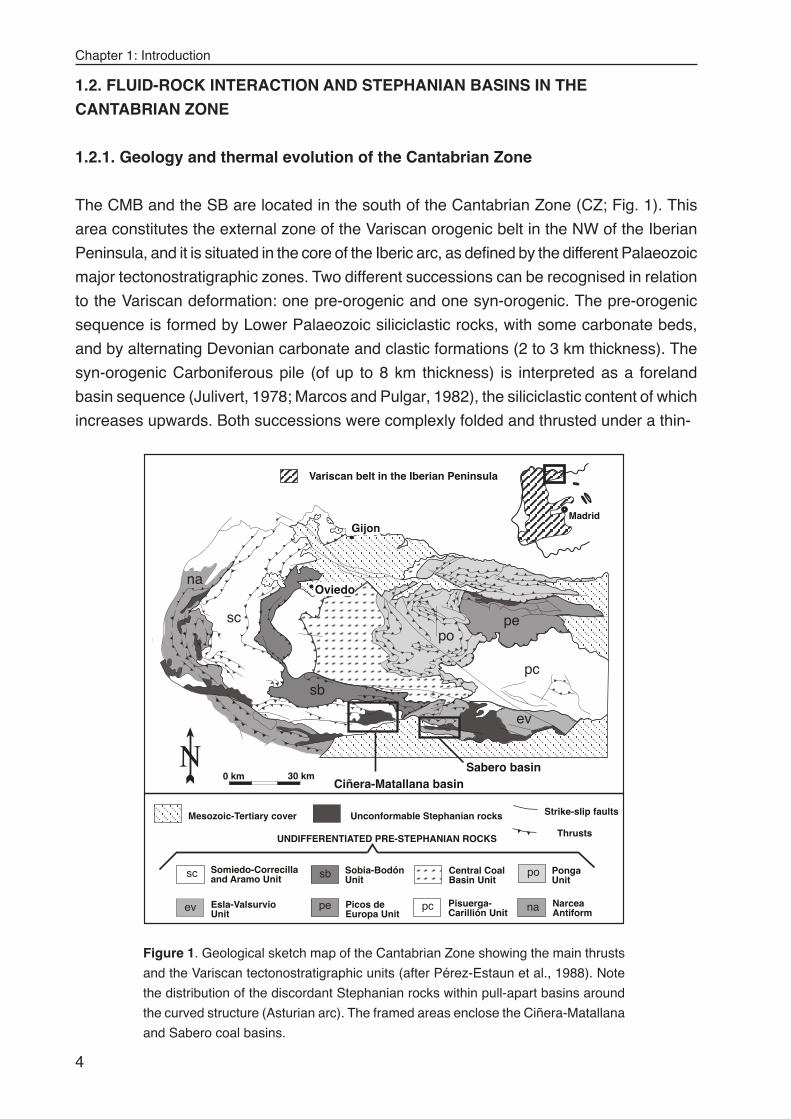
The CMB and the SB are located in the south of the Cantabrian Zone (CZ; Fig. 1). This
area constitutes the external zone of the Variscan orogenic belt in the NW of the Iberian
Peninsula, and it is situated in the core of the Iberic arc, as defined by the different Palaeozoic
major tectonostratigraphic zones. Two different successions can be recognised in relation
to the Variscan deformation: one pre-orogenic and one syn-orogenic. The pre-orogenic
sequence is formed by Lower Palaeozoic siliciclastic rocks, with some carbonate beds,
and by alternating Devonian carbonate and clastic formations (2 to 3 km thickness). The
syn-orogenic Carboniferous pile (of up to 8 km thickness) is interpreted as a foreland
basin sequence (Julivert, 1978; Marcos and Pulgar, 1982), the siliciclastic content of which
increases upwards. Both successions were complexly folded and thrusted under a thin-
Madrid
Variscan belt in the Iberian Peninsula
Oviedo
30 km0 kmCiñera-Matallana basin
Thrusts
Strike-slip faults
UNDIFFERENTIATED PRE-STEPHANIAN ROCKS
Central CoalBasin Unit
Somiedo-Correcillaand Aramo Unit
Sobia-BodónUnit
PongaUnit
NarceaAntiform
Pisuerga-Carillión Unit
Unconformable Stephanian rocksMesozoic-Tertiary cover
Esla-ValsurvioUnit
Gijon
Picos deEuropa Unit
Ν
sc sb
pcpe
po
ev
sc
sb
pe
pc
ev
po
na
na
Sabero basin
Figure 1. Geological sketch map of the Cantabrian Zone showing the main thrusts
and the Variscan tectonostratigraphic units (after Pérez-Estaun et al., 1988). Note
the distribution of the discordant Stephanian rocks within pull-apart basins around
the curved structure (Asturian arc). The framed areas enclose the Ciñera-Matallana
and Sabero coal basins.
Chapter1: Introduction
5
skinned tectonic regime between Westphalian B and Stephanian times (Julivert, 1971).
The tectonic transport directions of the different tectonostratigraphic units converge towards
the centre of the arc (Pérez-Estaún et al., 1988).
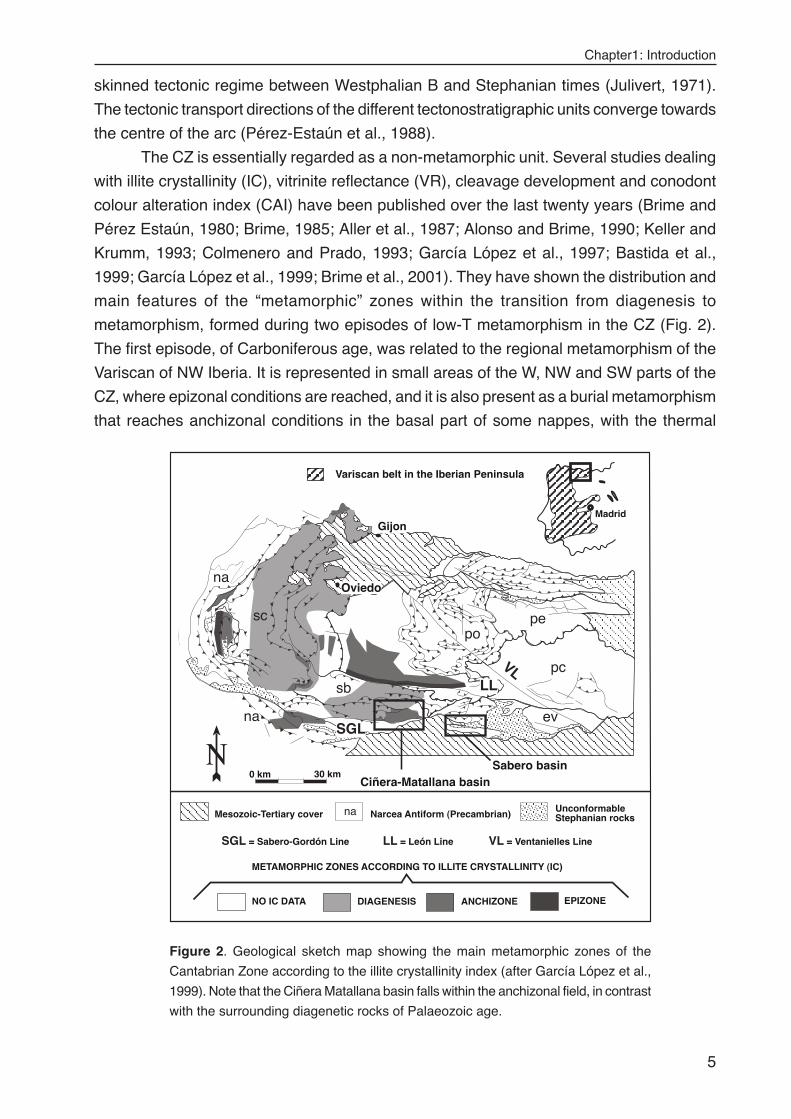
The CZ is essentially regarded as a non-metamorphic unit. Several studies dealing
with illite crystallinity (IC), vitrinite reflectance (VR), cleavage development and conodont
colour alteration index (CAI) have been published over the last twenty years (Brime and
Pérez Estaún, 1980; Brime, 1985; Aller et al., 1987; Alonso and Brime, 1990; Keller and
Krumm, 1993; Colmenero and Prado, 1993; García López et al., 1997; Bastida et al.,
1999; García López et al., 1999; Brime et al., 2001). They have shown the distribution and
main features of the “metamorphic” zones within the transition from diagenesis to
metamorphism, formed during two episodes of low-T metamorphism in the CZ (Fig. 2).
The first episode, of Carboniferous age, was related to the regional metamorphism of the
Variscan of NW Iberia. It is represented in small areas of the W, NW and SW parts of the
CZ, where epizonal conditions are reached, and it is also present as a burial metamorphism
that reaches anchizonal conditions in the basal part of some nappes, with the thermal
Madrid
na
Variscan belt in the Iberian Peninsula
Oviedo
30 km0 kmCiñera-Matallana basin
METAMORPHIC ZONES ACCORDING TO ILLITE CRYSTALLINITY (IC)
Narcea Antiform (Precambrian)Mesozoic-Tertiary cover
Gijon
Ν
sc
sb
pe
pc
ev
po
na
na
Sabero basin
UnconformableStephanian rocks
ANCHIZONENO IC DATA DIAGENESIS EPIZONE
SGL
LL
VL
SGL = Sabero-Gordón Line LL = León Line VL = Ventanielles Line
Figure 2. Geological sketch map showing the main metamorphic zones of the
Cantabrian Zone according to the illite crystallinity index (after García López et al.,
1999). Note that the Ciñera Matallana basin falls within the anchizonal field, in contrast
with the surrounding diagenetic rocks of Palaeozoic age.
Chapter 1: Introduction
6
peak occurring prior to their emplacement. The second episode, of late-Variscan/ Permian
age, occurs in two different forms: a diastathermal metamorphism, mainly developed in
the central and in the southeastern parts; and a local contact metamorphism associated
with small igneous intrusions. Many of these areas that approach very-low to low-grade
metamorphic conditions are localised in the vicinity of major strike-slip faults.
1.2.2. Thermal “anomalies” in Stephanian rocks
Stephanian coal-bearing clastic sequences rest unconformably over the older Palaeozoic
rocks and were deposited in small pull-apart basins with faulted margins (see Fig. 1). The
age of these basins young towards the west-northwest, from uppermost Westphalian-
Stephanian A (Guardo) to Stephanian C (Villablino, Rengos). In the south and south-west
of the CZ these basins are distributed along strike-slip, deep reaching faults, formed as a
consequence of transtensional movements which migrated westward with time during the
late stages of the orogeny.
The basin sediments generally have high VR indexes (Fig. 3), which in many
occasions are higher than the Carboniferous foreland and intrathrust coal basins in the
same region. Many are intruded by small igneous sills and dykes. In their study of the rank
distribution in the coal basins of the CZ, Colmenero and Prado (1993) consider the rank to
depend on the structural location of the coalfields. The highest ranks being linked to
hydrothermal heat flows related to the presence of major deep faults. Porosity and the
degree of compaction of the Stephanian sediments play an important role in the coalification
process. Relatively uncompacted and uncemented sediment would facilitate fluid circulation,
whereby heat transfer would be more effective under these conditions (Duddy et al., 1994).
Therefore, any related fluid activity that may reflect anomalous thermal gradients can be
expected to have left an imprint upon the stephanian clastic deposits, either during or after
their deposition.
1.2.3. Significance of fluids in the thermal evolution of the Cantabrian Zone
The role of fluids in the thermal processes related to low-T metamorphism in the Cantabrian
Zone has been suggested to be of importance. They have been invoked as the most likely
agents for heat transfer, at least in the second metamorphic episode of the CZ. Raven and
Van der Pluijm (1986), based on a general study of CAI for the whole CZ, postulated that
hydrothermal fluids circulated through the deep-reaching strike-slip faults (mainly the Leon
Line, the Sabero-Gordón Line and the Ventanielles-Cardaño Line), associated with igneous
activity, and were the main cause of heating. Studies dealing with small polymineralic ore
deposits and large-scale dolomitization also indicate the significance of fluid flow. All
published investigations relate the large variety of Palaeozoic small ore deposits in the
south of the CZ with fault systems or with small-scale magmatisc intrusions (Paniagua et
Chapter1: Introduction
7
al., 1988, 1988a 1993, 1995, 1997; Paniagua, 1998; Luque-Cabal, 1990; Crespo et al.,
2000). Large-scale dolomitization, affecting largely Namurian limestones, is also interpreted
to be linked to fracture-controlled fluid flow along steep systems associated with thrusts
and/or with strike-slip faults (Gómez Fernández et al., 2000; Spiro et al., 1995; Tornos and
Spiro, 2000; Grimmer, 2000; Gasparrini et al., 2001, 2002). Such case studies provide the
only direct evidence of fluid activity in the Carboniferous of the CZ, in the form of fluid
inclusion and stable isotope data. Mineralisation took place in the late Variscan (293-262
Ma, absolute dating results for ore deposits), associated with an extensional stress regime,
and is regarded as shallow/-epithermal, with fluid temperatures ≤ 100-300°C and pressures
< 500 bars (mainly hydrostatic conditions). Up to the present day, no investigations dealing
with fluid compositions and the conditions within the Palaeozoic sedimentary sequence
and the discordant Stephanian rocks (other than ore deposits) have been undertaken.
Madrid
Variscan belt in the Iberian Peninsula
Oviedo
30 km0 kmCiñera-Matallana basin
Thrusts
Strike-slip faults
VOLATILE MATTER (%) IN COAL BASINS
10-18Low Volatile
> 40Bituminous
30- 35Bituminous
< 4Peranthracites4-10
Anthracites
Narcea Antiform (Precambrian)Mesozoic-Tertiary cover
35- 40Bituminous
Gijon
18- 30Coking coals
Ν
sc
sb
pe
pc
ev
po
na
Sabero basin
na
na
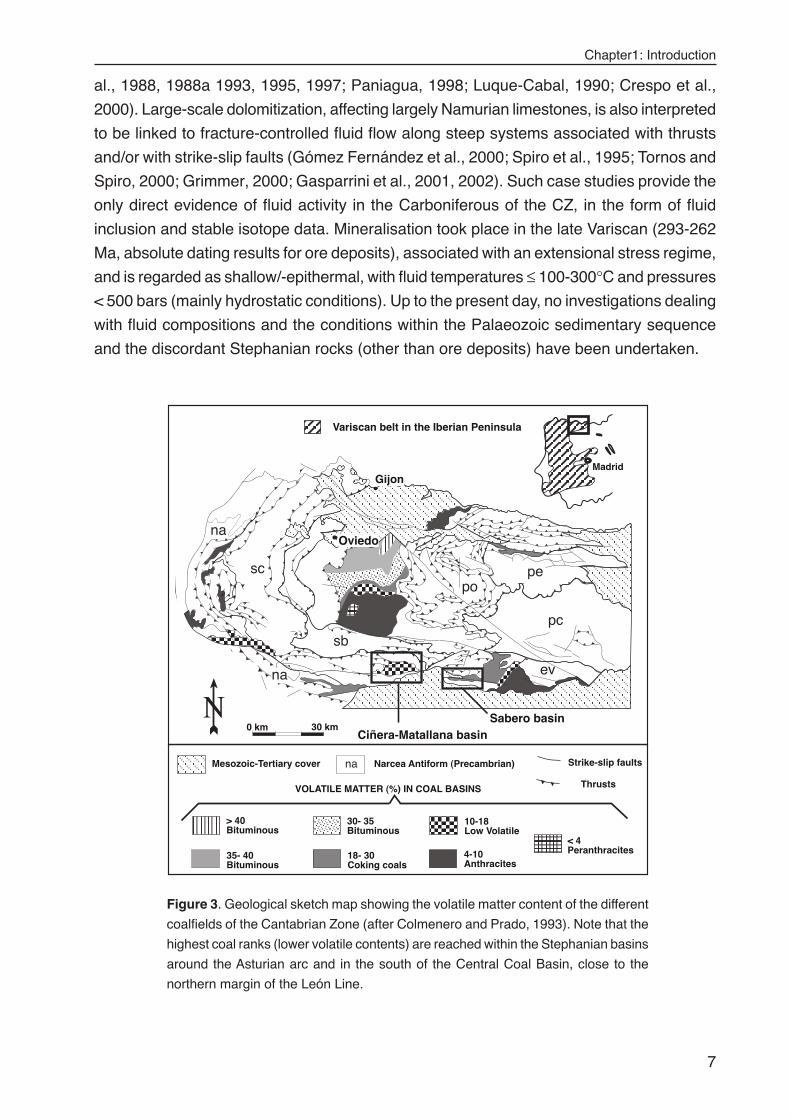
Figure 3. Geological sketch map showing the volatile matter content of the different
coalfields of the Cantabrian Zone (after Colmenero and Prado, 1993). Note that the
highest coal ranks (lower volatile contents) are reached within the Stephanian basins
around the Asturian arc and in the south of the Central Coal Basin, close to the
northern margin of the León Line.
Chapter 1: Introduction
8
1.2.4. Associated projects at the University of Heidelberg
This investigation was undertaken within the framework of the Graduiertenkolleg Program
on Fluid-Rock Interaction (GRK 273). A variety of PhD projects have been running during
the last years at the University of Heidelberg concerning the study of fluid-rock interaction
processes and the thermal evolution of the Palaeozoic sequence in the southern part of
the Cantabrian Zone. A list of the PhD contributions directly relevant to this study are given
as follows:
• “Paläotemperatur-Anomalien in spät-Variskischen Kohlebecken am Beispiel des
Ciñera-Matallana Beckens, Kantabrisches Gebirge, NW Spanien” (2002) by Kai
Frings. This project, complementary with the one presented here, focused on the
study of the IC, VR and anisotropy of the magnetic susceptibility (AMS) of the
Ciñera-Matallana basin.
• “Fluidassoziierte Brekzien als Monitor dolomitisierender und dedolomitisierender
Lösungströme in der Kantabrischen Zone (Nordspanien)” (2000) by Jörg Grimmer.
• “Large-scale hydrothermal dolomitization in the SW of the Cantabrian Zone (NW
Spain): timing, controls and origin of the dolomitising fluids” (2003) by Marta
Gasparrini.
• “Spätdiagenetische Prozesse in den Karbonaten der unterdevonischen La Vid
Gruppe, Kantabrisches Gebirge (NW Spanien)” (2002) by Jochen Schneider
Published work by the author regarding the subject of this thesis includes:
• Ayllón F, Bakker RJ, Warr LN (2003) Re-equilibration of fluid inclusions in diagenetic-
anchizonal rocks of the Ciñera-Matallana coal basin (NW Spain). Geofluids, 3,
49-68.
• Ayllón F, Bakker RJ, Warr LN (2001) Heterogeneous trapping and re-equilibration
of fluid inclusions in diagenetic/anchizonal rocks, Ciñera-Matallana coal basin (NW
Spain). XVI ECROFI European Current Research on Fluid Inclusions, Porto 2001.
Abstracts (Noronha F, Doria A, Guedes A; Eds). Faculdade de Ciencias do Porto,
Departamiento de Geologia, Memoria 7, 11-14. University of Porto.
• Ayllón F, Bakker RJ, Warr LN and Brime C (2000) A fluid inclusion study of syn-
deformation carbonate-quartz veins in the Stephanian rocks of the Cantabrian
Zone, NW Spain”. DMG 2000, Heidelberg (Germany). European Journal of
Mineralogy, 12, No. 1, 6.
Chapter 2: Geological setting
9
CHAPTER 2: GEOLOGICAL SETTING AND FIELD RELATIONS
2.1. INTRODUCTION
The Sabero (SB) and Ciñera-Matallana (CMB) basins were selected as field areas for this
study. These pull-apart, intramontane coal basins are located along the Sabero-Gordón
fault line, one of the major, E-W trending, strike-slip fault systems of the Cantabrian Zone
(Fig. 2). They were deposited during the later stages of the Variscan Orogeny (Stephanian)
and subsidence was accompanied by igneous activity. Both areas are thought to have
been connected during Stephanian to early Permian times, in a similar way as the SB is
linked with the eastern border of the Guardo-Cervera late Westphalian coalfield. The precise
extension of the original basin is unknown (Martínez-García, 1990; and references within).
An extensive literature is available concerning different aspects of the geology of the area
(Wagner and Artieda, 1970; Wagner, 1971; Galán et al., 1978; Heward, 1978; Knight,
1983; Méndez Cecilia, 1985; Marschik, 1991; Bieg and Burger, 1992; Villegas, 1996; Knight
et al., 2000). Coal mining has been taking place for about a century and it is still active in
the CMB. The relative small size of these coalfields is to some degree compensated by
good exposure (abandoned open cast mines and trenches are common place), which
allows for detailed sampling and field work.
2.2. SABERO BASIN
The sequence of this coalfield is exclusively continental except for some thin horizons of
marine origin. On the basis of fossil flora, sedimentation occurred during the late Stephanian
A (Barruelian) and continued up to the middle Stephanian B (300-296 Ma). The basin
forms a structurally isolated unit, elongated E-W for 11-10 km and up to 3-4 km wide in the
N-S direction (Fig. 4). The total thickness of the succession is in excess of 2000 m, and is
composed of conglomerates, sandstones, shales and siltstones, with intercalated coal
seams.
Stratigraphy
Knight (1983) has subdivided the succession into eight lithostratigraphical units, four of
which are mappable as formations. The depositional environment of the sediments was
that of alluvial fans and associated facies, with sediment provenance coming mostly from
the south throughout the whole sequence. The two youngest units (Única and Perla beds)
are restricted to the western end of the basin and a thrust level bounds its base (Casetas
Chapter 2: Geological setting
10
thrust fault).
Alejico beds (0-300m): located in a small synform in the NE corner of the basin, older
strata are more folded than the younger ones, possibly reflecting early syn-sedimentary
deformation. Steep fluvial conglomerates evolve to a fluvial flood plain with coal seams of
limited extension.
Raposa Fm (100-600 m): comprised of sand-bearing shales, sandstones with some small
coal seams and seat-earth horizons. A marine interval is present immediately above the
basal conglomerate. It represents the continuation of the palaeotopographic infill of a broad
valley with onlap towards the west.
Gonzalo Fm (100-140 m): grey-blue shales with ostracodes and lamelibranquia, lacustrine
shales, medium grained sandstones with cross-lamination, ripples and cross-stratification
(turbiditic features).
Sucesiva Fm (60-155m): two coal seams mark the base and the top of the formation,
respectively, with shales and sandstone between,containing cross-stratification and seat-
earth horizons. The facies evolves from lacustrine to fluviatile flood plain.
Quemadas Fm (up to 300 m): it represents an increase in subsidence and widespread
flooding. Blue lacustrine shales at the base evolve into alternations of sandstones and
shales. Black limolites and argillites with rich bivalve fauna form the top level, representing
a restricted marine environment.
Herrera beds (over 200 m): they occupy the faulted core of the Sabero syncline and are
bounded by two major faults (La Llama and Olleros). They contain the thickest coal seams
of the basin and have been object of intense exploitation, though their outcrop is rather
restricted. According to Knight et al (2000),“the principal mined sequence has suffered
intense tectonic deformation, with at least three major thrust fault repetitions of the main
seams and apparent subsequent refolding in association with latter fault movements”.
Ùnica beds (230-250 m): coarsening upwards lake infill, with up to five thin coal seams
deposited in a flood-plain environment. In the upper parts of the sequence, thick and
extensive in-river sandstones were formed.
Perla Beds (up to 550 m): thick, siltstone-dominated sequence with some substantial
fluviatile sandstones in the upper part, rootlet beds, occasional lacustrine intervals and
only one widespread identifiable coal seam (middle of the unit). Available outcrops are
limited.
Structural outline
The present day limits of the coalfield are a reflection of the tectonic structure and do not
represent the original basin outline. The basin has been folded and thrusted into an
asymmetrical syncline with a thrusted southern limb (cross sections in Fig. 4). Two principal
areas are distinguished, divided by the Casetas thrust. In the east, a west plunging syncline
(synclinorium) is reflected by the occurrence in the north and south of the area of the same
Chapter 2: Geological setting
11
sequences younging towards the centre of the coalfield. The Herrera beds occupy the
tightly compressed core of the structure. The northern limb has a constant dip toward the
south of 60-70° and is relatively undisturbed, but to the south the structure becomes more
complicated with the presence of several minor synclines and small south-dipping thrusts.
The hanging wall of the Casetas thrust, which contains the two youngest units of the
basin, occupies the western part of the coalfield. It has a rather complex structure and is
not well resolved. A steep (65°) south-dipping, E-W oriented major feature, La Llama fault
(associated to the Sabero-Gordón Line), crosscuts the coalfield and also displaces
PERLA BEDS
UNICA BEDS
HERRERA BEDS
QUEMADAS FM
SUCESIVA FM
GONZALO FM
RAPOSA FM
ALEJICO BEDS
0 m
ST
EP
HA
NIA
N B
ST
EP
HA
NIA
N A
400 m
800 m
1200 m
1600 m
2000 m
1000
m
III IV
La Llama Fault
Olleros Fault
I II
La Llama Fault
Llama deColle
EslaRiver
Sabero
N
QUATERNARY
PALAEOZOIC (undiff.)
CRETACEOUS (undiff.)
DIORITE ( )
TONSTEIN HORIZONS
2 km
I
II
III
IV
2000 m
(2)
(2)
(2)
(4)
MARINE BAND
( )
12
1
2
Casetas thrust
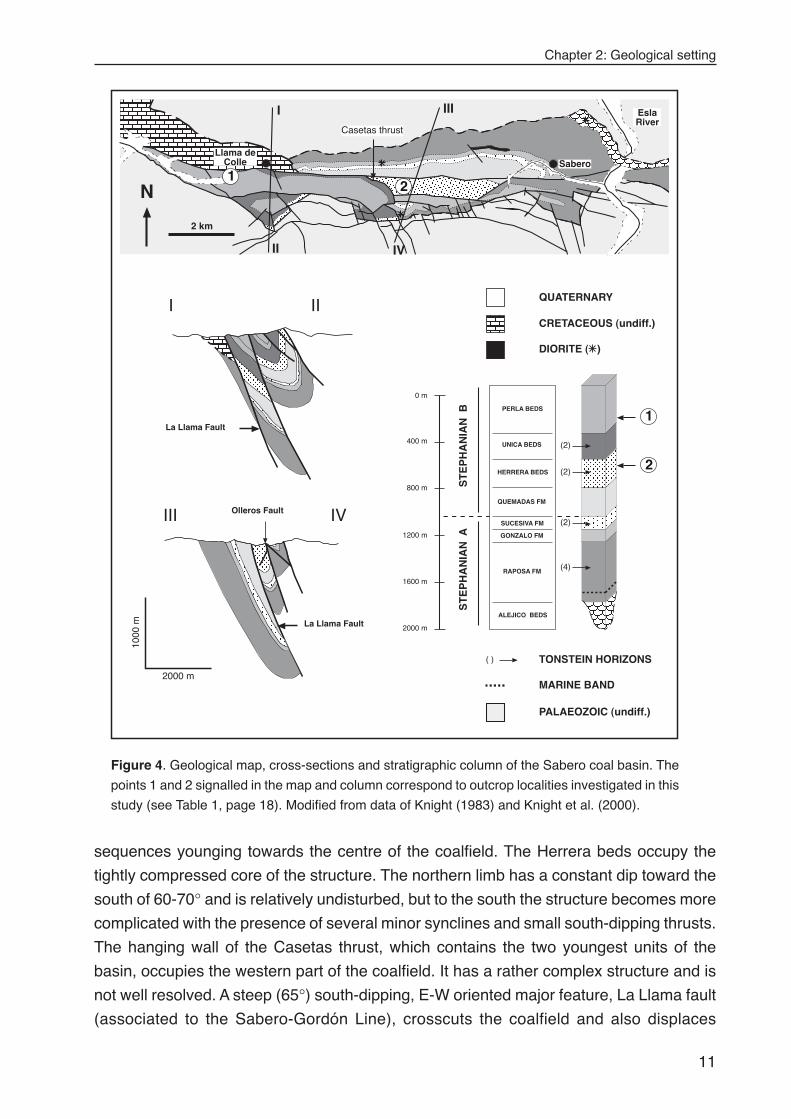
Figure 4. Geological map, cross-sections and stratigraphic column of the Sabero coal basin. The
points 1 and 2 signalled in the map and column correspond to outcrop localities investigated in this
study (see Table 1, page 18). Modified from data of Knight (1983) and Knight et al. (2000).
Chapter 2: Geological setting
12
unconformably overlying Cretaceous rocks in the west. During its latest movement in the
Alpine orogeny this fault acted as a thrust plane, producing a downthrow displacement of
about 400 m to the north (Helmig, 1965).
2.3. CIÑERA-MATALLANA BASIN
This small pull-apart basin forms a complex half-graben structure, extending 12 km (E-W)
along strike and 6 km across (Fig. 5). The preserved 1500 meters thick basin fill consists
of clastic continental rocks: conglomerates, sandstones and shales, with intercalated coal
seams; constituting a coarsening upwards sequence. On the basis of the fossil flora the
sediments have been dated as Stephanian B (298-294 Ma). Transtensional, syn-
sedimentary movements along the strike-slip Sabero-Gordón fault zone (SGL) controlled
the basin subsidence (Wagner, 1971; Villegas, 1996). This is reflected in great lateral
facies changes and thickness variations in the two basal formations (San Francisco and
Pastora). Tectono-sedimentary conditions were more stable during the deposition of the
upper sequences, which, in general, show good lateral continuity.
Stratigraphy
Six formations are identified in the coalfield (after Wagner, 1971; Heward, 1978; and Villegas,
1996). Most of the boundary levels between formations are marked by coal seams.
San Francisco Fm (0-400 m): constitutes the first palaeo-valley fill during the initial stages
of basin formation and is mainly formed by torrential conglomerates and coarse-grained
sandstones, with some thin coal seams of minor extent and of variable thickness. Its
occurrence is restricted to the northeastern and western margins of the basin.
Pastora Fm (85-200m): swamp facies with important coal deposits in the western side of
the basin (up to 20 m), intercalated with fluviatile coarse grained sandstones and
conglomerates with major and abrupt lateral facies changes. In the central parts of the
palaeovalley an elongated lake formed, depositing organic rich shales. Six tonstein horizons
(kaolinitized ash layers) have been identified in this formation.
Cascajo-Roguera (150-175 m): the base of this formation is an excellent stratigraphic
marker, constituted by organic rich shales characterised by the presence of the fossil
Leaia baenschiana (phyllopod), as well as fish scales and floating plant debris. The
deposition of this sequence reflects the expansion of the lacustrine facies throughout the
basin, and the termination of major coal accumulations. The sequence is made up largely
of sand-bearing shales and fine-grained sandstones. The upper parts of this formation
shows fluviatile (plane parallel and cross stratification) and swamp facies.
San José Fm (75-90 m): very regular thickness and abundant fossil content. Formed by
immature sandstone beds with frequently interbedded organic-rich lacustrine shales. Five
Chapter 2: Geological setting
13
coal seams (four at the top of the sequence) occur, each 50 to 60 cm thick. The upper coal
seam forms an excellent stratigraphic marker, with abundant and characteristic fossil flora.
Bienvenidas Fm (350-380 m): this formation does not markedly vary from the previous
San José. Thicker sandstones packets with channelled bases and transported plant debris,
and fluviatile conglomerates are common. Up to five intercalated coal seams (30 to 120
cm thick) can be recognised.
Matallana Fm (up to 275 m): facies dominantly fluviatile. Thick (tens of meters) coarse-
grained sandstone beds with abundant plant debris (including tree trunks), alternating
with carbonaceous shales, seat-earth horizons and some faunal-bearing lacustrine levels.
It contains three coal seams with good lateral continuity, between 70-100 cm in thickness.
Structural outline
As for the SB, the present day limits of the coalfield are mostly due to the tectonic structure
and do not reflect the shape of the original basin. The western half of the basin contains
three main eastward plunging synclines (cross section I-II, Fig. 5), with vertical to steeply
south-dipping axial planes and shallow E-W oriented axes plunging towards the east.
These are separated by poorly developed anticlines formed along pre-existing, complexly
faulted, horst blocks. In the eastern part of the basin, the structure is simpler and the
synclines tend to merge into a large synclinorium with shallower dipping limbs (cross section
III-IV, Fig. 5). Fault planes strike preferentially E-W in direction. As a result of late Variscan
compressive/transpressive deformation, metre- to decametre-scale thrusts and folds were
formed. In many cases the coal beds acted as detachment horizons and are strongly
sheared, such as the coal-rich Pastora Formation. In some localities the discordant surface
between Stephanian and older Palaeozoic rocks also acted as principal slip planes. The
Sabero-Gordón fault was reactivated during the Alpine uplift of the Cantabrian Mountains
in Miocene times, and caused renewed deformation of the Stephanian rocks (Alonso et
al., 1995; Villegas, 1996; Pulgar et al., 1999). Many of the observed south-dipping thrusts
are considered to have been formed during this period.
Chapter 2: Geological setting
14
Torio River
Llombera
Santa Lucia
Vega de Gordon
3 kmN
1500 m
1000 m
500 m
0 m
MATALLANA
BIENVENIDAS
SAN JOSE
CASCAJO -
ROGUERA
PASTORA
SANFRANCISCO
ST
EP
HA
NIA
N B
STEPHANIAN (undiff.)
PALAEOZOIC (undiff.)
QUATERNARY
DIORITE
HulanoSyncline
MatallanaSyncline
IVIIILlomberaSyncline
2000
m
2000 m
LlomberaSynclineMatallana
Syncline
VegacerveraSyncline
III TablizaAnticline
12
( )
TONSTEIN HORIZONS
12
11
15
15
(6)
87 6
5
49 3
10
14
13
11
87
4
9
3
10
14
13
56
( )
I
II
III
IV
SABERO - GORDÓN FAULT LINESABERO - GORDÓN FAULT LINE
Vegacervera Correcillas
Villalfeide
Matallana de Torio
THRUST
DIRECT FAULT
La Valenciana
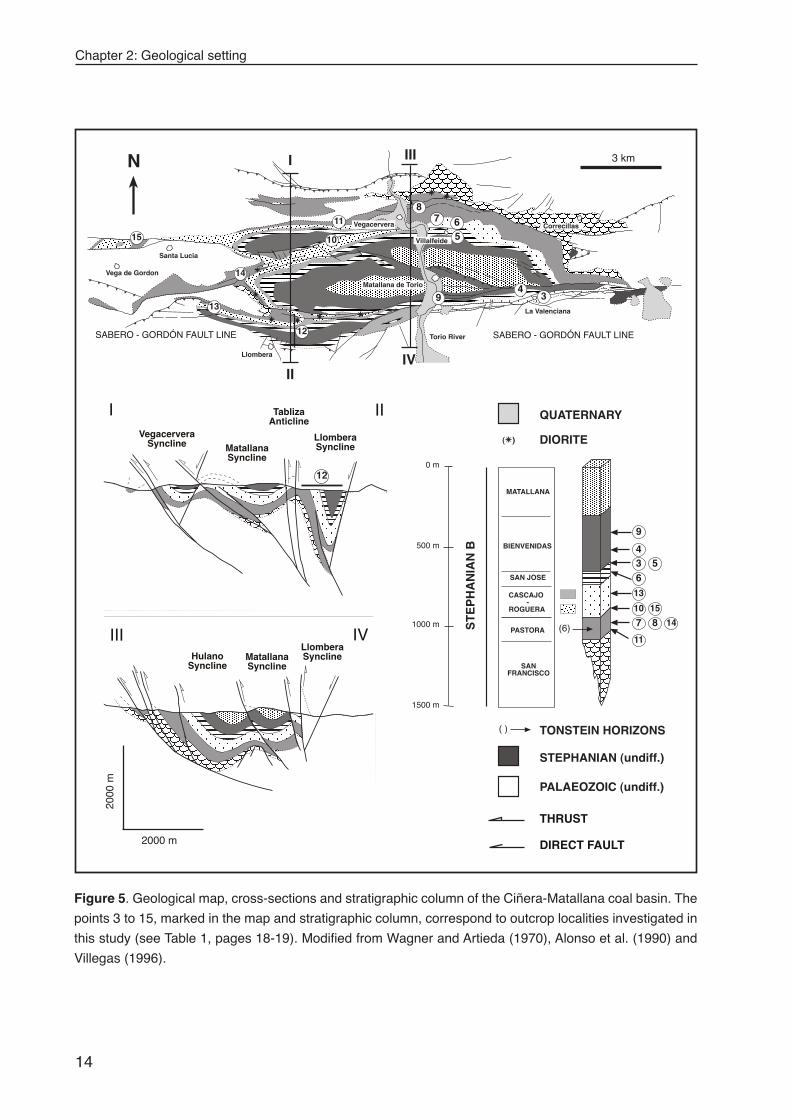
Figure 5. Geological map, cross-sections and stratigraphic column of the Ciñera-Matallana coal basin. The
points 3 to 15, marked in the map and stratigraphic column, correspond to outcrop localities investigated in
this study (see Table 1, pages 18-19). Modified from Wagner and Artieda (1970), Alonso et al. (1990) and
Villegas (1996).
Chapter 2: Geological setting
15
2.4. IGNEOUS ROCKS
2.4.1. Diorite intrusions
Sedimentation in the Stephanian basins was followed by the intrusion of magmatic sills
and dykes ranging from 1 to 15 meters in thickness, locally reaching up to 20 m in the SB
and up to 30 m in the CMB (Knight, 1983 and Méndez Cecilia, 1985). In both coalfields
these rocks are located preferentially within the basal formations: from San Francisco to
the top of San José in the CMB and in the Alejico, Raposa, Sucesiva and Gonzalo formations
of the SB. In the SB the igneous rocks are exposed along the northern and southern
boundaries of the coalfield, occasionally following preferred horizons for distances of up to
1 km (mapped sill in Fig. 4). The outcrops in the south, where the magmatic material
intruded through sandstones, show the best preservation of the original igneous mineralogy
and textures. In the CMB the intrusive rocks crop out along the southern flank of the
Matallana Syncline, within the hinge zone and in the southern flank of the Tabliza anticline
as well as on the NE side of the basin (Bardaya mine, Fig. 5). Sills and dykes have also
been encountered at depth in both Stephanian sequences in open cast and underground
mine workings, and in exploration boreholes within the CMB (Knight, 1983, Méndez Cecilia,
1985; Villegas, 1996).
The intrusive rocks of both basins have mineralogical and chemical affinities with
the igneous rocks located in other Stephanian coalfields of the CZ and in Palaeozoic
rocks of the Palentian Zone. Although these rocks have not yet been dated, associated
magmatic activity and ore deposits within the CZ are of Permian age, ranging from 293 to
262 Ma. (Loeschke, 1982; Corretgé and Suárez, 1990; Crespo et al., 2000 and references
within). In several localities it can be observed that they were folded and faulted together
with the Stephanian sediments. They are dioritic in composition (being slightly more basic
in the SB), with microporfidic textures, and are locally more acidic where assimilation of
the country rock occurred. The primary mineralogy, when recognisable, comprises a
plagioclase groundmass (andesine/oligoclase), with hornblende, pyroxene and biotite
phenocrysts. Characteristically they preferentially penetrated along coal beds, assimilating
wall rock and producing metric thick, natural coke aureoles (Fig. 6). In these cases the
intrusive bodies were completely altered to a pale coloured assemblage of carbonates,
quartz, iron oxides, epidote, actinolite, chlorite, sericite and kaolinite. The alteration minerals
pseudomorphose the original magmatic textures, though quartz also occurs in crosscutting
joints in some of the more altered sills (see chapter 4). The resulting rock is deeply weathered
when exposed.
Chapter 2: Geological setting
16
2.4.2. Pyroclastic tonsteins
Sixteen tonstein horizons have been described in the two Stephanian coalfields (Bieg and
Burger, 1992; Knight et al, 2000). These bands have served as the means of resolving
structural and stratigraphic problems, especially important in the SB. Their character,
compositions and petrographical features are very similar and entirely consistent with a
pyroclastic origin. The main constituent is kaolinite, both as matrix and as fragmentary
crystals and phenocrysts (pseudomorphs of biotite and feldspar). A common source area
for these volcanic ashes has been proposed, although good correlation between both
basins has not been achieved. The ten horizons in the SB (Fig. 4) occur as kaolinite coal-
tonsteins. In the CMB there are a total of six bands, all within the Pastora Fm (Fig. 5);
three kaolinite tonsteins, one kaolinite/illite transition tonstein and two illite tonsteins (illite
forms the pseudomorphs).
There is no exclusive relation between the tonsteins character, the degree of
diagenesis and the coal rank. Many factors may influence the mineral transformations in
the volcanic ashes: hydrothermal metasomatism, temperature rise, original composition,
chemical and biochemical processes (Bohor and Triplehorn, 1993). The degree of kaolinite
to illite transformation appears depending on deformation, with alteration intensity
increasing in areas of tectonic compression.
Cascajo-Roguera Fm
Pastora Fm
Diorite coke
coke
2 m
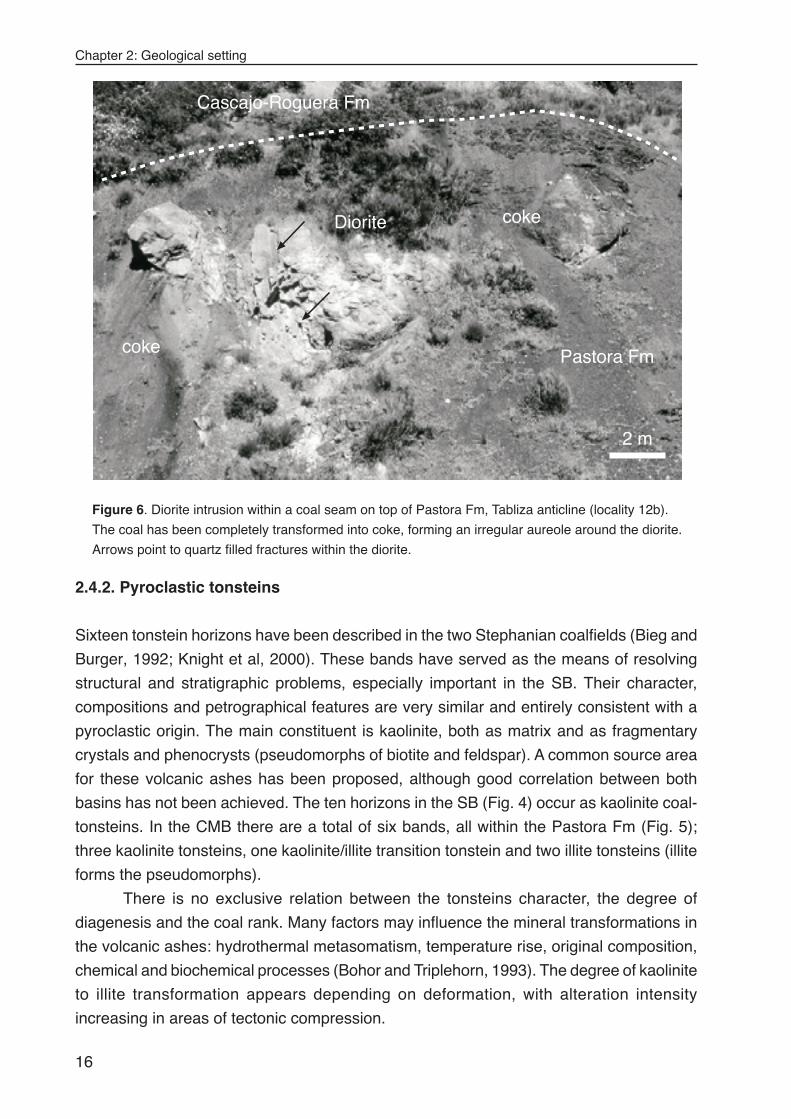
Figure 6. Diorite intrusion within a coal seam on top of Pastora Fm, Tabliza anticline (locality 12b).
The coal has been completely transformed into coke, forming an irregular aureole around the diorite.
Arrows point to quartz filled fractures within the diorite.
Chapter 2: Geological setting
17
2.5. PALAEOTHERMAL CONDITIONS
Only data concerning the volatile content of coal is available for the SB (Fig. 3). The
values oscillate between 30 and 18 % volatiles (coking coals), which is well into the
catagenesis level of organic matter maturation and within the diagenetic domain (Barnes
et al., 1990). Recent investigations on the tonstein mineralogy and illite crystallinity of
pelitic rocks (Knight et al., 2000; Frings pers. com.) confirm the predominantly diagenetic
character of these rocks and the lower thermal gradients experienced in this coalfield with
respect to those of other Stephanian basins.
In CMB basin the metamorphic grade of the sedimentary rocks determined by illite
crystallinity (IC) indicates high diagenetic to local upper anchizonal grade conditions (Galán
et al., 1978; Frings, 2002), which is generally higher than the diagenetic conditions of the
surrounding Palaeozoic sequence (Fig. 2; García López et al., 1999). Low volatile coals
(10-18 % volatile matter) and semiantracites constitute the coal seams, which corresponds
with the transition between the catagenesis and metagenesis stages of organic matter
maturation. Under these conditions the generation of dry gas (essentially methane) and
progressive moisture loss from the coal is expected. According to Méndez Cecilia (1985),
there exists a general increase in the thermal maturation of the coal seams with stratigraphic
depth. Mean vitrinite reflectance values increase from 1.3% in the Matallana Formation to
2% in the San Francisco Fm. However the highest reflectance values (up to 2.6%) were
recorded in the Pastora Formation, due to the fact that this formation contains most of the
igneous sills/dykes present in the coalfield. Based on these data a palaeogeothermal
gradient of 60 to 70°C/km was proposed for the Stephanian basin, similar to other
Stephanian coal basins across the Cantabrian Zone. In the Palaeozoic basement estimated
palaeogeothermal gradients are only about 35°C/km (Brime et al., 2001).
Chapter 2: Geological setting
18
Locality Samples Position Formation Description Vein Mineralogy
1a 1, 2, 3, 4,5
N 42°50.733´W 05°15.827´840 mSouth of SG Line
Perla Beds(mine N of Veneros)
Thrusted section (coal beds arethe slip planes) with veins inassociated extensional fracturesystems
(qtz1)cal2dolm (relicts)kaolinitepyrite/chalcopyrite
1b 6 N 42°50.162´W 05°15.881´865 m
Perla Beds(mine N of Veneros)
Fracture in vertical sst bedsbesides sheared coal seam
dolmcal2kaolinitepyrite/chalcopyrite
2 7, 8, 9, 10 N 42°49´51.3´´W 05°12´00.6´´1183 m
Herrera Beds(South of Sotillos deSabero)
Veins associated with fracturesin sst beds besides shearedcoal seam
(qtz1)cal2dolmkaolinite
3 23, 24, 25 N 42°51´35´´W 05°28´33´´1120 m
San José(La Valencianamine)
Faulted section with numeroussheared coal beds andassociated veining.
qtz1cal2dolm (relicts)kaolinite
4 26 N 42°51´44´´W 05°28´59´´1275 m
Bienvenidas/San José(La ValencianaValley)
Fractures cut by a bedding-parallel normal fault plane inalternating sst and coal beds
cal1qtz1cal2dolm (relicts)kaolinite
5 28 N 42°52.698´W 05°30.880´1050 m
Limit San José-Bienvenidas
Fracture system in homoclinalfold in sst
qtz1cal2dolm (relicts)
6 29, 30 N 42°52´52´´W05°30´43´´1060 m
San José Veins associated with a verticaldipping fault
cal2dolm (relicts)kaolinite
7 31 N 42°53.006´W 05°31.187´1000 m
Pastora Veins in fracture systemperpendicular to bedding in sst
qtz1dolm (altered)
8 32, 33, 34 N 42° 53´23.8´´W 05°31´50.7´´1205 m
Pastora Fractures associated with faultpropagation folds in sst bedsalternated with coal seams
qtz1cal2dolm (relicts)cal3kaolinite
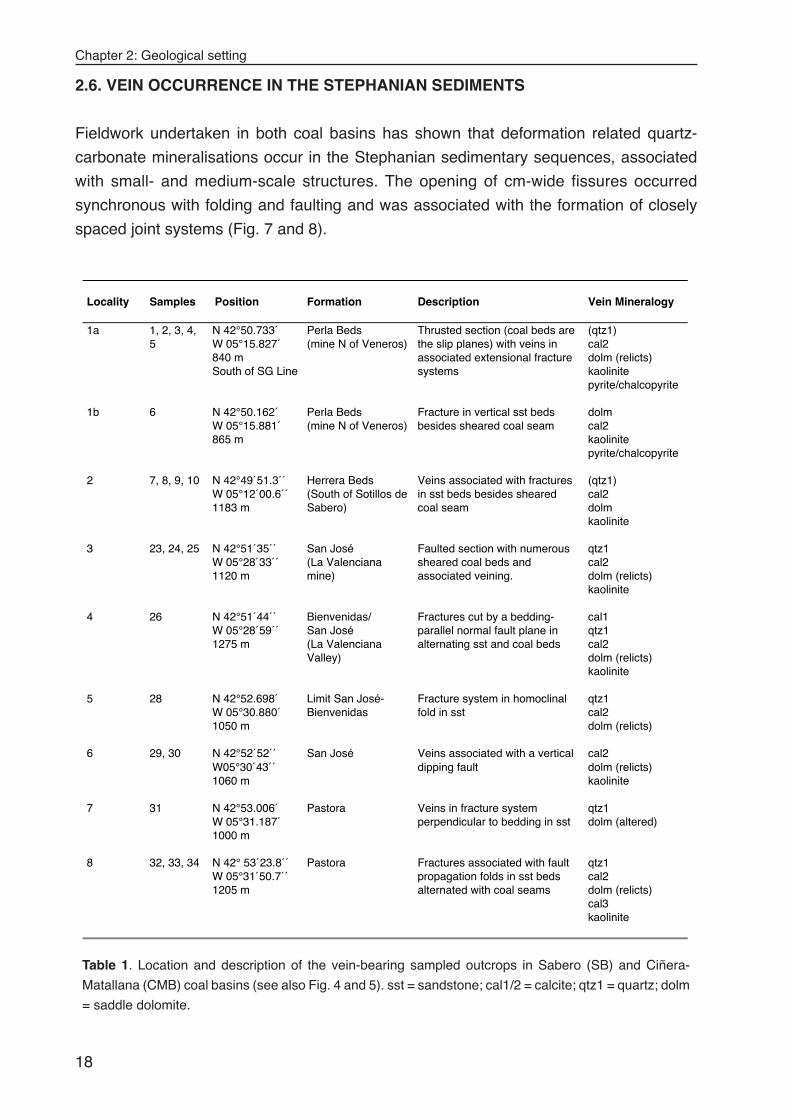
Table 1. Location and description of the vein-bearing sampled outcrops in Sabero (SB) and Ciñera-
Matallana (CMB) coal basins (see also Fig. 4 and 5). sst = sandstone; cal1/2 = calcite; qtz1 = quartz; dolm
= saddle dolomite.
2.6. VEIN OCCURRENCE IN THE STEPHANIAN SEDIMENTS
Fieldwork undertaken in both coal basins has shown that deformation related quartz-
carbonate mineralisations occur in the Stephanian sedimentary sequences, associated
with small- and medium-scale structures. The opening of cm-wide fissures occurred
synchronous with folding and faulting and was associated with the formation of closely
spaced joint systems (Fig. 7 and 8).
Chapter 2: Geological setting
19
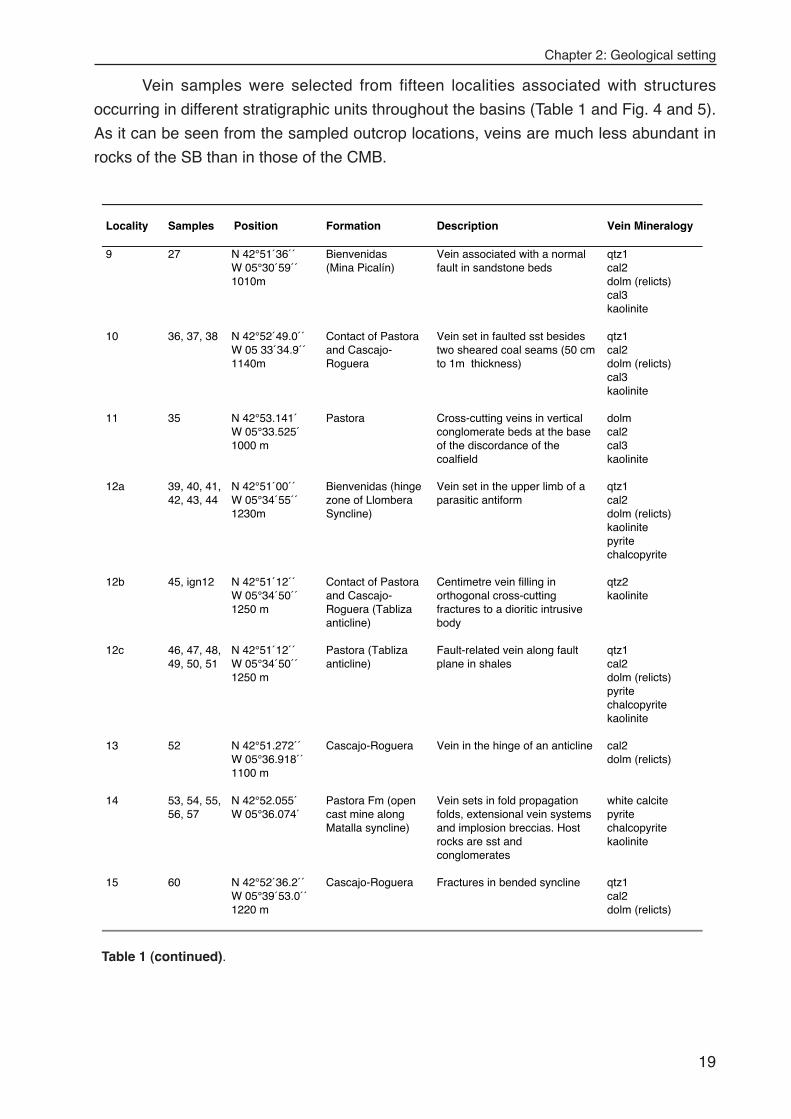
Locality Samples Position Formation Description Vein Mineralogy
9 27 N 42°51´36´´W 05°30´59´´1010m
Bienvenidas(Mina Picalín)
Vein associated with a normalfault in sandstone beds
qtz1cal2dolm (relicts)cal3kaolinite
10 36, 37, 38 N 42°52´49.0´´W 05 33´34.9´´1140m
Contact of Pastoraand Cascajo-Roguera
Vein set in faulted sst besidestwo sheared coal seams (50 cmto 1m thickness)
qtz1cal2dolm (relicts)cal3kaolinite
11 35 N 42°53.141´W 05°33.525´1000 m
Pastora Cross-cutting veins in verticalconglomerate beds at the baseof the discordance of thecoalfield
dolmcal2cal3kaolinite
12a 39, 40, 41,42, 43, 44
N 42°51´00´´W 05°34´55´´1230m
Bienvenidas (hingezone of LlomberaSyncline)
Vein set in the upper limb of aparasitic antiform
qtz1cal2dolm (relicts)kaolinitepyritechalcopyrite
12b 45, ign12 N 42°51´12´´W 05°34´50´´1250 m
Contact of Pastoraand Cascajo-Roguera (Tablizaanticline)
Centimetre vein filling inorthogonal cross-cuttingfractures to a dioritic intrusivebody
qtz2kaolinite
12c 46, 47, 48,49, 50, 51
N 42°51´12´´W 05°34´50´´1250 m
Pastora (Tablizaanticline)
Fault-related vein along faultplane in shales
qtz1cal2dolm (relicts)pyritechalcopyritekaolinite
13 52 N 42°51.272´´W 05°36.918´´1100 m
Cascajo-Roguera Vein in the hinge of an anticline cal2dolm (relicts)
14 53, 54, 55,56, 57
N 42°52.055´W 05°36.074´
Pastora Fm (opencast mine alongMatalla syncline)
Vein sets in fold propagationfolds, extensional vein systemsand implosion breccias. Hostrocks are sst andconglomerates
white calcitepyritechalcopyritekaolinite
15 60 N 42°52´36.2´´W 05°39´53.0´´1220 m
Cascajo-Roguera Fractures in bended syncline qtz1cal2dolm (relicts)
Table 1 (continued).
Vein samples were selected from fifteen localities associated with structures
occurring in different stratigraphic units throughout the basins (Table 1 and Fig. 4 and 5).
As it can be seen from the sampled outcrop locations, veins are much less abundant in
rocks of the SB than in those of the CMB.
Chapter 2: Geological setting
20
1 m
Coaly shale
Sandstone
N S
30 cm
1
1
2
Vein
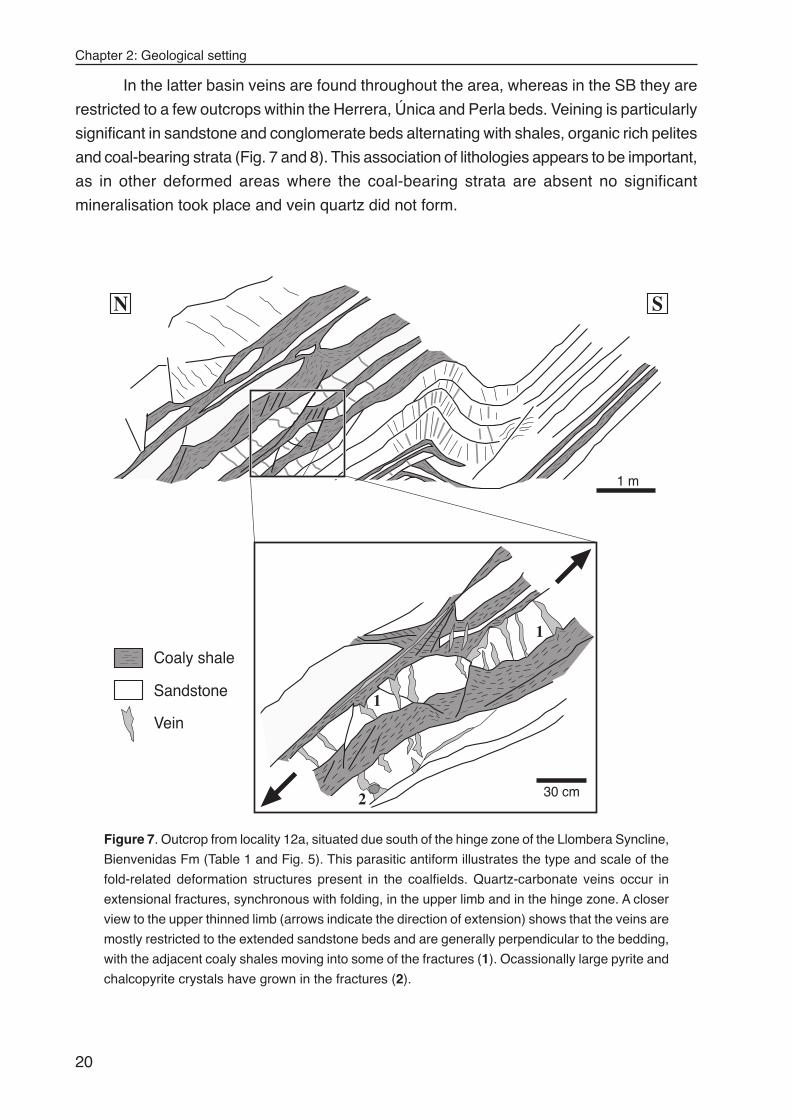
Figure 7. Outcrop from locality 12a, situated due south of the hinge zone of the Llombera Syncline,
Bienvenidas Fm (Table 1 and Fig. 5). This parasitic antiform illustrates the type and scale of the
fold-related deformation structures present in the coalfields. Quartz-carbonate veins occur in
extensional fractures, synchronous with folding, in the upper limb and in the hinge zone. A closer
view to the upper thinned limb (arrows indicate the direction of extension) shows that the veins are
mostly restricted to the extended sandstone beds and are generally perpendicular to the bedding,
with the adjacent coaly shales moving into some of the fractures (1). Ocassionally large pyrite and
chalcopyrite crystals have grown in the fractures (2).
In the latter basin veins are found throughout the area, whereas in the SB they are
restricted to a few outcrops within the Herrera, Única and Perla beds. Veining is particularly
significant in sandstone and conglomerate beds alternating with shales, organic rich pelites
and coal-bearing strata (Fig. 7 and 8). This association of lithologies appears to be important,
as in other deformed areas where the coal-bearing strata are absent no significant
mineralisation took place and vein quartz did not form.
Chapter 2: Geological setting
21
2 m
Coal
a
b
2 m
N S
Coaly shale Sandstone Vein
N S
Sandstone
Vein
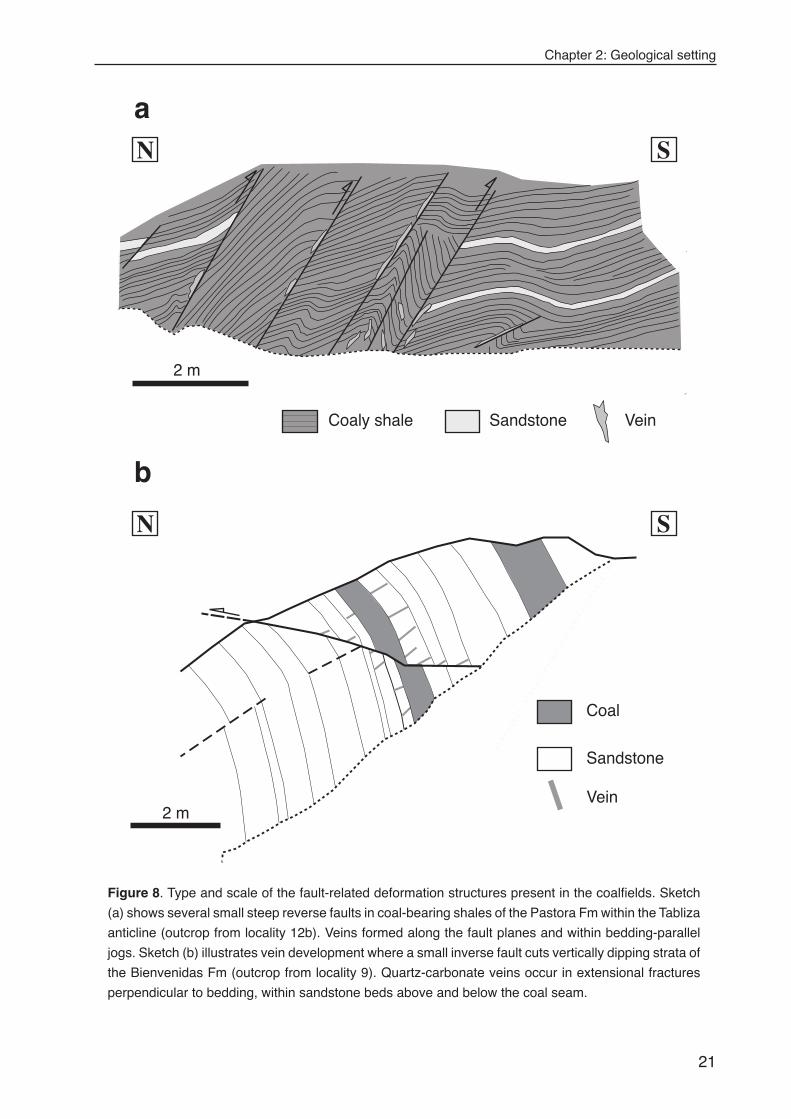
Figure 8. Type and scale of the fault-related deformation structures present in the coalfields. Sketch
(a) shows several small steep reverse faults in coal-bearing shales of the Pastora Fm within the Tabliza
anticline (outcrop from locality 12b). Veins formed along the fault planes and within bedding-parallel
jogs. Sketch (b) illustrates vein development where a small inverse fault cuts vertically dipping strata of
the Bienvenidas Fm (outcrop from locality 9). Quartz-carbonate veins occur in extensional fractures
perpendicular to bedding, within sandstone beds above and below the coal seam.
Chapter 2: Geological setting
22
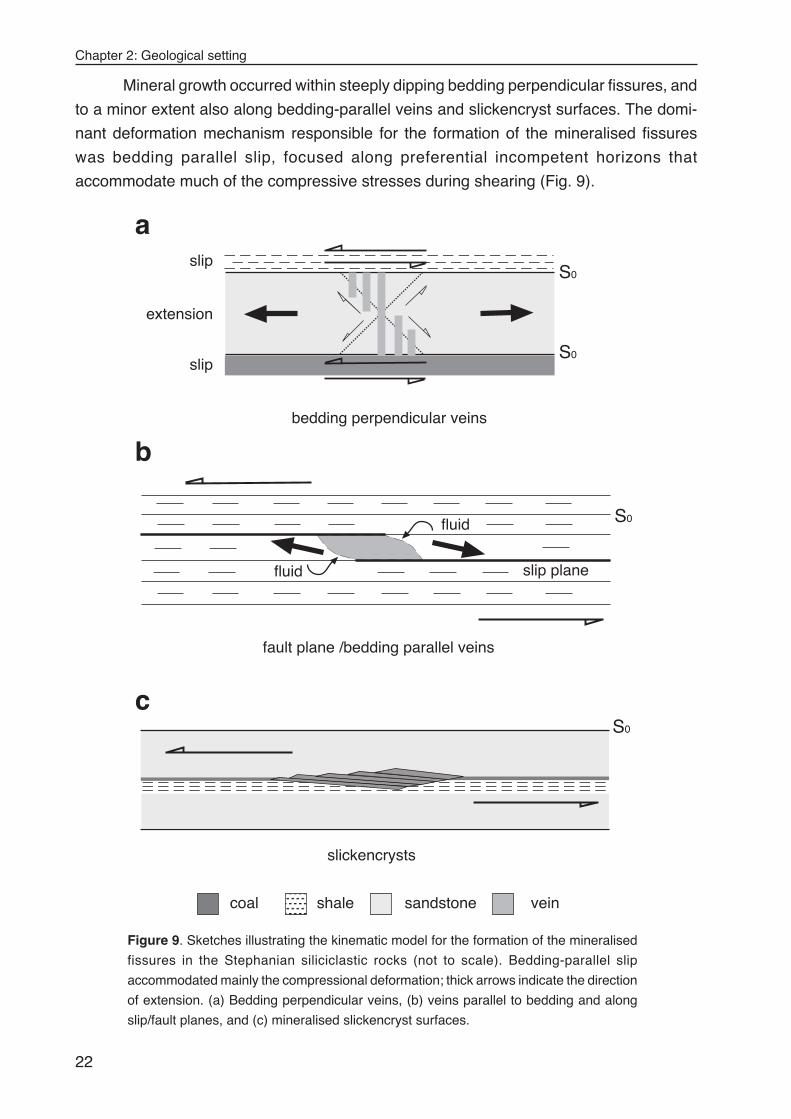
Mineral growth occurred within steeply dipping bedding perpendicular fissures, and
to a minor extent also along bedding-parallel veins and slickencryst surfaces. The domi-
nant deformation mechanism responsible for the formation of the mineralised fissures
was bedding parallel slip, focused along preferential incompetent horizons that
accommodate much of the compressive stresses during shearing (Fig. 9).
bedding perpendicular veins
fault plane /bedding parallel veins
fluid
fluid
slickencrysts
S0
S0
S0
a
b
c
coal sandstoneshale vein
slip
extension
slipS0
slip plane
Figure 9. Sketches illustrating the kinematic model for the formation of the mineralised
fissures in the Stephanian siliciclastic rocks (not to scale). Bedding-parallel slip
accommodated mainly the compressional deformation; thick arrows indicate the direction
of extension. (a) Bedding perpendicular veins, (b) veins parallel to bedding and along
slip/fault planes, and (c) mineralised slickencryst surfaces.
Chapter 2: Geological setting
23
In coal-basin setting, the slip horizons are along the coal seams and the shales
(see Cole et al., 1991; Frodsham and Gayer, 1997). The intercalated and more competent
sandstone beds undergo horizontal extension and develop sub-vertical fractures as a
consequence (Fig. 9a). The presence of conjugated joint systems in many of the deformed
outcrops, even in those without veins, is also consistent with this mechanism of formation.
In many occasions mobilisation of under and overlaying shale and coal into the fissures
can be observed (see detail in Fig. 7). Bedding-parallel veins, formed mostly within pelitic
rocks, and mineralised slickencryst surfaces within fault planes, represent dilational jogs
within detachment planes formed by rotation and sliding during slip motions (Fig. 9b and
9c).

Chapter 2: Geological setting
24
Chapter 3: Analytical methods
25
CHAPTER 3: ANALYTICAL METHODS
This investigation is based on the study of 60 vein samples selected from 15 localities
(Table 1). The veins were collected retaining their orientation in order to estimate kinematic
directions of mineral growth, according to the method of Paschier and Trouw (1998). Rock
sections were cut perpendicular to bedding and retaining portions of the wall rock to
document the relations vein mineral-host rock. Table A1 (Appendix) gives a detailed list of
the analytical methods applied to the sample material, which are summarised as follows.
3.1. PETROGRAPHY
3.1.1. Transmitted and reflected light microscopy
Petrographic microscopy of rock samples was the first step of this analytical study. Thin
sections (30 µm and 60-50 µm) from vein samples were analysed in detail under transmitted
and reflected light for mineral identification and fluid inclusion petrographic relations.
Sections were also used for cathodoluminescence (CL) and scanning electron microscopy
(SEM) analyses. Double polished (100-120 µm) sections for fluid inclusion
microthermometry were only prepared from the same rock slice, when inclusions were
first observed and characterised in thin section.
3.1.2. Carbonate staining
The optical properties of calcite (CaCO3) and dolomite (MgCa(CO3)2) are similar and
therefore may prove difficult to distinguish optically. A simple chemical staining technique
was employed to differentiate calcite from dolomite and the ferrous iron (Fe+2) content of
both minerals. Two staining solutions were prepared following the procedure described by
Dickson (1965):
• Solution A: 100 ml HCl 1.5% (15 ml of pure acid brought to 1 litre with water)
mixed with 0.2 gr. of Alizarin red-S. This solution serves to distinguish calcite from
dolomite.
• Solution B: 100 ml HCl 1.5% mixed with 2 grams of Potassium Ferricyanide. This
solution is used to distinguish ferroan from non-ferroan minerals.
Both solutions were mixed together in a ratio of A/B = 3/2. 60 rock slabs (47 veins from
Stephanian rocks) were prepared and polished using 400 µm powder. Samples were
immersed in the mixture of the two solutions for 30 to 45 seconds, agitating them slightly
to remove the small gas bubbles from the surface. Afterwards, the stained slabs were
Chapter 3: Analytical methods
26
washed under running water for a few seconds and then dried. The colours formed after
staining are (Adams et al., 1984): (1) Calcite = pink to red-brown; (2) Ferroan calcite =
mauve to blue; (3) Dolomite = colourless; (4) Ferroan dolomite = very pale blue. During
staining only the crystals exposed at the surface react with the staining solution, and the
intensity of the colour is partly related to the intensity of the etching with acid. Fine-grained
crystal fabrics with many crystal boundaries tend to etch more rapidly and thus show
deeper colours than coarse crystal fabrics with fewer crystal boundaries.
3.1.3. Cathodoluminescence
The principle of cathodoluminesce is based on the known property of many mineral species,
non-luminescent in the pure state, to luminescence when “activated” under electron
bombardment by the presence of small concentrations of impurities (Pagel et al., 2000).
The term “cathodoluminescence microscopy” refers to the microscopic observation of
minerals and rocks in thin section while under electron bombardment (Barker and Koop,
1991). In this study, cathodoluminescence properties of vein calcite and dolomite have
been investigated in order to obtain extra information concerning the growth relations and
history of the carbonate minerals. Luminescence of calcite and dolomite is attributed to
the presence of Mn2+ as an activator ion, whereas Fe2+ is believed to be the most important
quencher ion (Machel and Burton, 1991; Machel et al., 1991).
Observations were performed with a Citl cold cathode apparatus of the type CCL
8200mk3 at the Geological-Palaeontological Institute, University Heidelberg (Germany).
Thin sections (30 µm) were placed on a glass tray supported on an X-Y bearing carriage
in a vacuum chamber with an upper window for microscopic observations. An electron
beam is generated and deflected on the specimen by means of an obliquely arranged
gun. Beam voltage of 20 kV and current of 400 to 600 A were used. Transmitted light and
cathodoluminescence images were photographed in 200 ASA film with an AGFA RSX (II)
camera. Observations and photographic recording were performed in a darkened room,
under a red photographic “safe light”, which provides illumination without disturbing the
essential “night vision”.
3.1.4. SEM imaging and EDX identification
Scanning electron microscopy (SEM) images from minerals were obtained using a LEO-
32 facility, housed at the Institute of Environmental Geochemistry, University Heidelberg.
For more detailed information on the method and technical descriptions the reader is
referred to Welton (1984) and references within. Previous to analysis the thin sections (30
to 60 µm) were coated with carbon by vacuum evaporation. The coating allows a clear
image to be obatined, acting as an insulating material, minimising interference from
evaporating substances and increasing secondary element emission. For study, sections
Chapter 3: Analytical methods
27
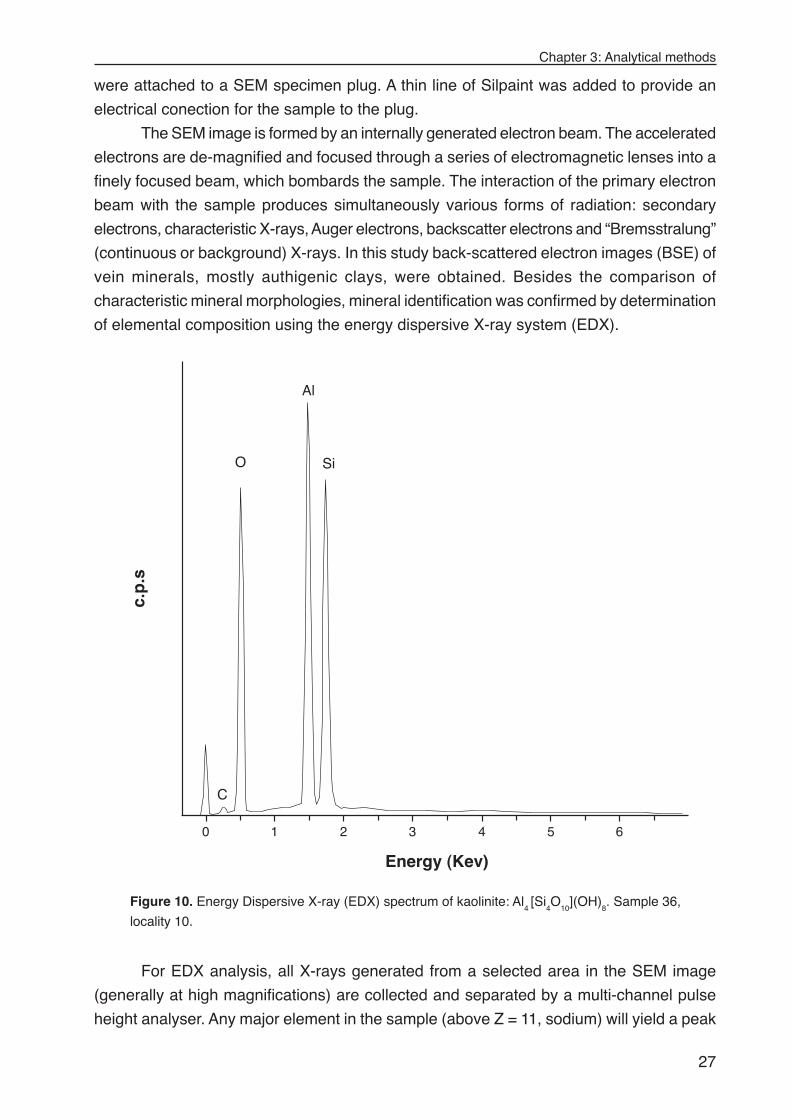
were attached to a SEM specimen plug. A thin line of Silpaint was added to provide an
electrical conection for the sample to the plug.
The SEM image is formed by an internally generated electron beam. The accelerated
electrons are de-magnified and focused through a series of electromagnetic lenses into a
finely focused beam, which bombards the sample. The interaction of the primary electron
beam with the sample produces simultaneously various forms of radiation: secondary
electrons, characteristic X-rays, Auger electrons, backscatter electrons and “Bremsstralung”
(continuous or background) X-rays. In this study back-scattered electron images (BSE) of
vein minerals, mostly authigenic clays, were obtained. Besides the comparison of
characteristic mineral morphologies, mineral identification was confirmed by determination
of elemental composition using the energy dispersive X-ray system (EDX).
For EDX analysis, all X-rays generated from a selected area in the SEM image
(generally at high magnifications) are collected and separated by a multi-channel pulse
height analyser. Any major element in the sample (above Z = 11, sodium) will yield a peak
O
Al
Si
C
1 2 3 4 5 60
Energy (Kev)
c.p
.s
Figure 10. Energy Dispersive X-ray (EDX) spectrum of kaolinite: Al4 [Si
4O
10](OH)
8. Sample 36,
locality 10.
Chapter 3: Analytical methods
28
on the graph at its unique energy level. The element identification is done automatically by
the computer, lining up the peak apex with the energy scale at the bottom of the graph and
then comparing the obtained number with X-ray energy reference values. The relative
concentrations of the elements are then compared with the chemical formula of the
suspected mineral, as the peak heights are roughly proportional to their concentration
(Fig. 10).
3.2. FLUID INCLUSIONS
Fluid inclusion analysis forms the core of the investigations undertaken in this study. There
exists an extensive body of scientific literature dedicated to the study of fluid inclusions in
minerals. For an introduction to the basic principles of the method and further information
on the different analytical techniques applied here the reader is referred to Hollister and
Crawford (1981), Roedder (1984), Shepherd et al. (1985) and Andersen et al. (2001).
Goldstein and Reynolds (1994) and Mullis (1987) provide more specific insights on the
study of fluid inclusions applied in diagenetic and low-temperature metamorphism
environments.
Inclusions preserved in minerals represent entrapped portions of fluids present during
different stages of the rock evolution. Therefore, they constitute the only direct means of
characterising the fluid phases involved in geological processes. The first and more
important step, before any analytical technique is applied, is to evaluate the textural
relationships between fluid inclusions and the host mineral at room temperature. This
evaluation leads to the selection and grouping of inclusions into assemblages or
associations that can be further investigated (Goldstein and Reynolds, 1994; van den
Kerkhof and Hein, 2001). As a general rule, inclusions may form either contemporaneously
with precipitation of a certain mineral (primary) and/or after its crystallisation is partially
(pseudosecondary) or totally completed (secondary). Analytical procedures and
interpretation of the data obtained allow better definition of each group and further constrain
the properties of each association of inclusions. Linking the various generations of fluid
inclusions preserved in rocks with the mineralogical evolution is a key approach in
elucidating fluid-rock interaction and rock history.
3.2.1. Microthermometry
Thermometric analysis (microthermometry) is the most popular and widely used non-
destructive analytical technique for studying fluid inclusions. The method relies on careful
observation and recognition of the phase changes that take place in inclusions during
heating or cooling. Depending upon fluid composition this may involve solid-, liquid- and
vapour-phase transformations. By accurately measuring the temperature at which these
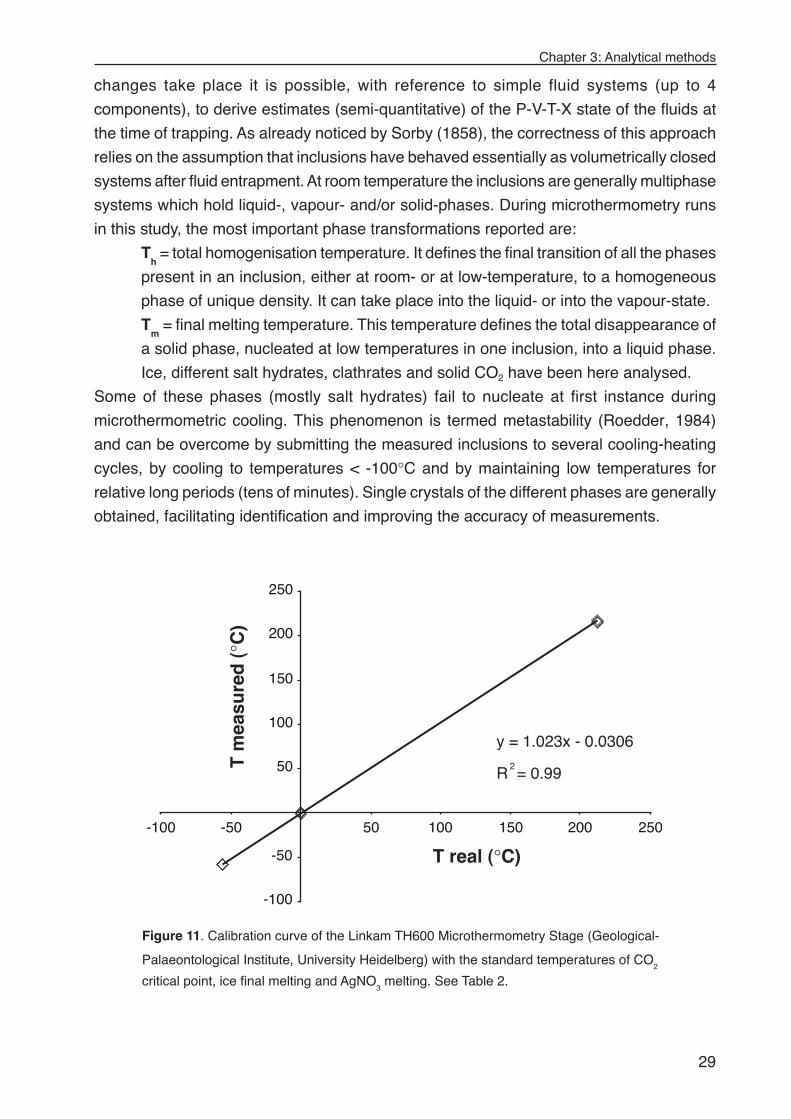
Chapter 3: Analytical methods
29
changes take place it is possible, with reference to simple fluid systems (up to 4
components), to derive estimates (semi-quantitative) of the P-V-T-X state of the fluids at
the time of trapping. As already noticed by Sorby (1858), the correctness of this approach
relies on the assumption that inclusions have behaved essentially as volumetrically closed
systems after fluid entrapment. At room temperature the inclusions are generally multiphase
systems which hold liquid-, vapour- and/or solid-phases. During microthermometry runs
in this study, the most important phase transformations reported are:
Th = total homogenisation temperature. It defines the final transition of all the phases
present in an inclusion, either at room- or at low-temperature, to a homogeneous
phase of unique density. It can take place into the liquid- or into the vapour-state.
Tm = final melting temperature. This temperature defines the total disappearance of
a solid phase, nucleated at low temperatures in one inclusion, into a liquid phase.
Ice, different salt hydrates, clathrates and solid CO2 have been here analysed.
Some of these phases (mostly salt hydrates) fail to nucleate at first instance during
microthermometric cooling. This phenomenon is termed metastability (Roedder, 1984)
and can be overcome by submitting the measured inclusions to several cooling-heating
cycles, by cooling to temperatures < -100°C and by maintaining low temperatures for
relative long periods (tens of minutes). Single crystals of the different phases are generally
obtained, facilitating identification and improving the accuracy of measurements.
-100
-50
50
100
150
200
250
-100 -50 50 100 150 200 250
y = 1.023x - 0.0306
R = 0.99
T real (°C)
T m
easu
red
(°C
)
2
Figure 11. Calibration curve of the Linkam TH600 Microthermometry Stage (Geological-
Palaeontological Institute, University Heidelberg) with the standard temperatures of CO2
critical point, ice final melting and AgNO3 melting. See Table 2.
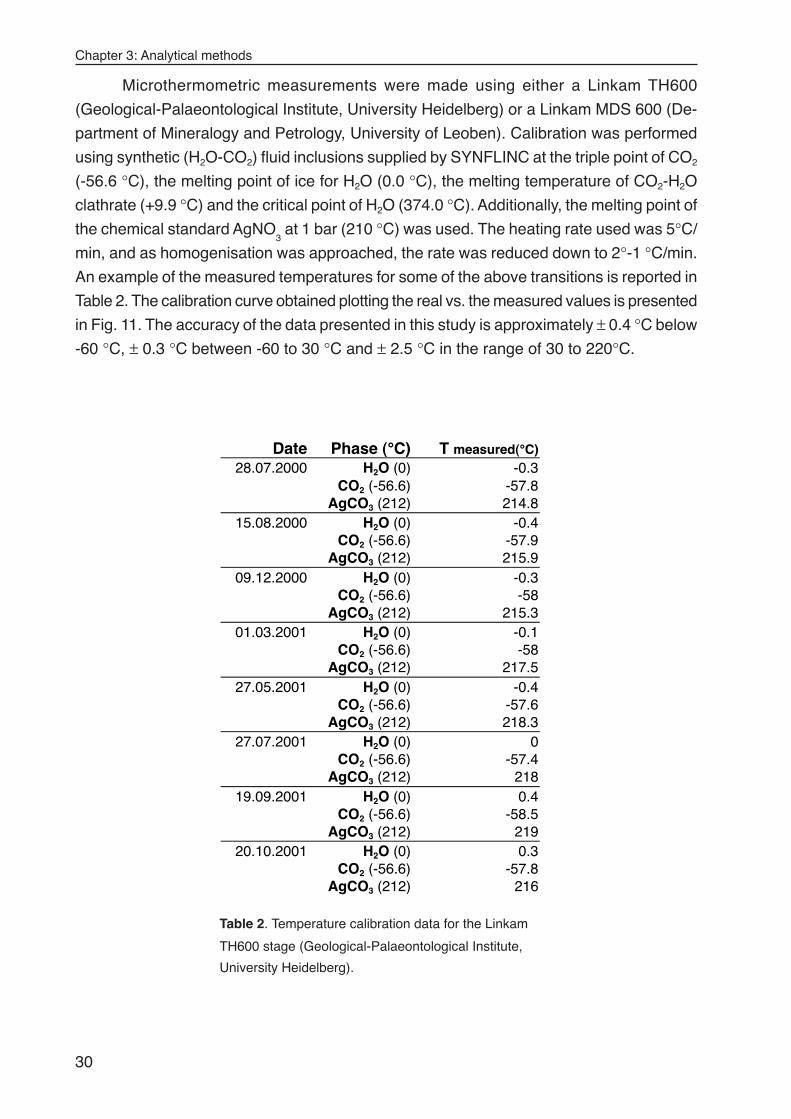
Chapter 3: Analytical methods
30
Microthermometric measurements were made using either a Linkam TH600
(Geological-Palaeontological Institute, University Heidelberg) or a Linkam MDS 600 (De-
partment of Mineralogy and Petrology, University of Leoben). Calibration was performed
using synthetic (H2O-CO2) fluid inclusions supplied by SYNFLINC at the triple point of CO2
(-56.6 °C), the melting point of ice for H2O (0.0 °C), the melting temperature of CO2-H2O
clathrate (+9.9 °C) and the critical point of H2O (374.0 °C). Additionally, the melting point of
the chemical standard AgNO3 at 1 bar (210 °C) was used. The heating rate used was 5°C/
min, and as homogenisation was approached, the rate was reduced down to 2°-1 °C/min.
An example of the measured temperatures for some of the above transitions is reported in
Table 2. The calibration curve obtained plotting the real vs. the measured values is presented
in Fig. 11. The accuracy of the data presented in this study is approximately ± 0.4 °C below
-60 °C, ± 0.3 °C between -60 to 30 °C and ± 2.5 °C in the range of 30 to 220°C.
Date Phase (°C) T measured(°C)28.07.2000 H2O (0) -0.3
CO2 (-56.6) -57.8AgCO3 (212) 214.8
15.08.2000 H2O (0) -0.4CO2 (-56.6) -57.9
AgCO3 (212) 215.909.12.2000 H2O (0) -0.3
CO2 (-56.6) -58AgCO3 (212) 215.3
01.03.2001 H2O (0) -0.1CO2 (-56.6) -58
AgCO3 (212) 217.527.05.2001 H2O (0) -0.4
CO2 (-56.6) -57.6AgCO3 (212) 218.3
27.07.2001 H2O (0) 0CO2 (-56.6) -57.4
AgCO3 (212) 21819.09.2001 H2O (0) 0.4
CO2 (-56.6) -58.5AgCO3 (212) 219
20.10.2001 H2O (0) 0.3CO2 (-56.6) -57.8
AgCO3 (212) 216
Table 2. Temperature calibration data for the Linkam
TH600 stage (Geological-Palaeontological Institute,
University Heidelberg).
Chapter 3: Analytical methods
31
3.2.2. Raman Microspectrometry
Energy changes in a beam of light interacting with, for example, a fluid contained in an
inclusion, are induced by the inelastic collisions of vibrating polyatomic molecules or
molecular groups: this is called the Raman scattering effect. Molecular groups have a
number of vibrational modes corresponding to specific energy states of the molecule in
question. Raman scattering is a weak effect (10-3 to 10-6 of the irradiated light energy), and
thus a monochromatic laser beam is normally required to study it. The interaction of the
incident light with the vibrational modes in the sample causes losses and gains of energy
in the incident beam, referred to as Stokes and anti-Stokes scattering, respectively. A
Stokes Raman spectrum is a plot of the intensity of scattering vs. the energy loss, expressed
in wave numbers relative to the source (∆ν cm-1, the Raman shift), i.e., the changes in
wave number compared to that of incident light. The peaks in the spectrum correspond to
the energies of the vibrational modes of different species in the sample. This technique is
non-destructive, but the laser may induce reactions in the inclusions or the mineral analysed,
if organic phases are present (such as petroleum). Details on the theory of Raman scattering
and its application in Earth sciences can be found in the reviews by McMillan (1989),
McMillan and Hofmeister (1988) and Roberts and Beattie (1995). Gardiner and Graves
(1989) is a useful handbook for practical Raman spectrometry.
Gas, liquid and solid phases in fluid inclusions were analysed by a Raman microprobe
LABRAM-800 at the Department of Mineralogy and Petrology, University of Leoben. Two
different wavelengths for the excitation laser radiation were used: 632.8 nm (red laser) for
measurements on calcite and 532.2 nm (green laser) for quartz. The less energetic red
laser source is used to avoid fluorescence in calcite, and because the penetration depth of
the red laser is smaller, only fluid inclusions close to the surface can be analysed. Mole
fractions of gas species in the inclusion’s vapour phase were calculated using a formula
derived from Placzek’s polarizability theory (Dubessy et al., 1989; Burke, 2001):
Xa = [Aa / (σσσσσa)] / ∑ [Ai
/ (σσσσσi)]
Xa, Aa and σa are, respectively, the molar fraction, the peak area and the Raman cross-
section for species a; Ai and σi are the appropriate values for all species present in any
given fluid inclusion. σCH4 = 7.5; σCO2 = 2.5 (sum of the two peaks); σC2H6 = 13; σC3H8 = 18.
Values are taken from Table 2 in Burke (2001). The instrument efficiency number is taken
as unity for all components. Raman values for identified gas phases, salt hydrates and
minerals can be found in the appendix.
Chapter 3: Analytical methods
32
3.2.3. Combined Raman and microthermometry
Accurate identification of ice, salt hydrates (e.g. hydrohalite) and clathrate crystals, formed
in fluid inclusions during cooling runs (down to -196 °C), was achieved following the method
described by Dubessy et al. (1982), Samson and Walker (2000) and Bakker (2001a). A
Linkam stage (TMS 93) was attached to the Raman microprobe. Recognition of the types
of salt hydrates allows determination of the components dissolved in undersaturated fluid
inclusions. This method also enables accurate estimation of the true melting temperatures
of phases that are difficult to establish, for example, eutectic melting temperatures.
3.2.4. Thermodynamic calculations and computer programs
The bulk fluid composition and density of fluid inclusions are obtained by the following
approach. First, microthermometry (clathrate and ice melting temperatures) and Raman
microspectrometry data are used to determine the compositions of the aqueous and vapour
phases at relatively low temperatures, treating each as a separate subsystem of a typical
fluid inclusion. Second, a reference P-T condition is specified, at which the relationship
between fluid composition and density (or molar volume) is known. Finally, the compositional
information of each phase is combined via mass- and volume-balance equations, all valid
for the reference P-T condition. These were calculated using the computer packages
“CLATHRATES“ (Bakker, 1997), including the programs ICE and CURVES, and “FLUIDS“
(Bakker, 2001b), including AQSO1, AQSO2, BULK and ISOC. The extra observational
data required for this last step is the volume fraction of the vapour bubbles, estimated from
video images by measuring area percentages at room temperature.
For measurements involving clathrate melting temperatures, the programs ICE and
CURVES were used. The equation of state from Duan et al. (1992a,b) was applied to
calculate the fugacity of CH4 and CO2 at clathrate melting temperatures. The quadruple
point Q1 for several gas compositions and the low density of a vapour-like CH4-rich gas
mixture were calculated with CURVES. The programs AQSO1 and AQSO2 were used to
calculate salinities in binary H2O-NaCl systems (Bodnar, 1993) and ternary H2O-NaCl-
CaCl2 systems (Naden, 1996), respectively. Bulk fluid properties of individual fluid inclusions
were calculated using the program BULK. For the pure H2O system the equations of Haar
et al. (1984) and Wagner and Pruss (1993) have been adopted, and for mixtures of CO2-
CH4 homogenisation conditions the model of Thiery et al. (1994) was applied, which
combines the equations of state according to Soave (1972) and Lee and Kesler (1975). In
complex H2O-CH4-CO2-NaCl mixtures, the Henry constant according to Rettich et al. (1981)
and Carroll et al. (1991) was used to calculate CH4 and CO2 solubilities, respectively.
Setzmann and Wagner (1991) equation was adopted for pure CH4 isochore calculations
and Krumgalz et al. (1996) to calculate the density of electrolyte bearing aqueous solutions.
Chapter 3: Analytical methods
33
3.3. X-RAY DIFFRACTION
X-ray diffraction (XRD) is the scattering of X-ray electromagnetic radiation by the electrons
around the nuclei of the atoms composing the unit cell of a crystal/mineral phase. The
wavelength of X-rays and the structural spacing of crystals have both dimensions about
10-8 cm. The diffraction pattern produces a spectrum characteristic for each mineral phase.
A full description of X-ray diffraction methodology, analytical settings and applications can
be found in Brindley and Brown (1980) and Moore and Reynolds (1997).
To generate diffraction spectra high-energy electrons are released from a heated
filament in a Röntgen X-ray tube and bombard a Cu anode, which reacts by emitting X-
rays. The resulting radiation emerges from a thin, beryllium window, focused to produce a
sub-parallel beam and then directed to the sample. When the crystals in the sample reach
an appropriate angle, they will diffract the X-rays according to Bragg´s Law :
nλ λ λ λ λ = 2d sin θθθθθ
Where n = integral number of wavelengths; λλλλλ = wavelength of the X-rays; d =
lattice spacing (in angstroms); and θθθθθ = angle of diffraction. The diffracted beams pass first
to a crystal monochromator, having the function of filtering the unwanted radiation, and
then enters the detector. In the resulting spectrum of the X-ray diffraction pattern the hori-
zontal scale is calibrated in °2θ and the vertical scale displays the intensity of the diffracted
radiation.
X-ray diffraction (XRD) measurements were performed at the Geological-
Palaeontological Institute, University Heidelberg, in order to aid determination of the mineral
paragenesis of the vein material made by standard petrographic microscopy. All X-ray
determinations were carried out on a Bragg-Brentano-Diffractometer of the type Sie-
mens D 500, with a Cu Röntgen X-ray tube (CuKα) and graphite monochromator operated
at 40 kV and 30 mA. For the purpose of mineral identification diffraction patterns were
compared with a set of standard patterns compiled by the Joint Committee on Powder
Diffraction Standards (JCPDS).
Powder preparates
Duplicate powder samples were prepared from the same slabs of rock used to make thin
and double polished sections. Rock pieces of vein minerals and host rock were initially
crushed by hand using a metal mortar to reduce the samples to mm-fragments. The material
was then grounded with a tungsten disc mill, and reduced to a powder of 600-µm grain
size. The powder so obtained was scanned in the 2θ range from 2 ° to 50° with increments
of 0.02°[2θ]/sec, using aperture diaphragms of 1° and a detector slit of 0.15°.
Chapter 3: Analytical methods
34
Texture preparates
The mm-sized rock fragments were also used for preparation of textured slides. Material
was ultrasonically treated for 3 hours in a water bath at 35 kHz. The < 2µm clay fraction
was separated by centrifugation. X-ray slides (3 x 3 cm) were prepared by the pipette-on-
slide method, keeping the specimen thickness as constant as possible (> 5 mg/cm2).
Measurements were performed using the same conditions as for random powder samples.
Kaolin polytype identification
For determination of the kaolin mineral polytype 10 representative texture samples were
heated between 460 and 540°C at intervals of 20°C. Samples were maintained in the
oven for one hour at each temperature and after every step they were extracted and
irradiated at room temperature. The X-ray slides were scanned in the 2θ range from 2° to20° with increments of 0.02°[2θ]/sec.
3.4. STABLE ISOTOPE ANALYSIS
Principles
For a complete description of the foundations, analytical techniques and applications of
stable isotopes the reader is referred to Hoefs (1997), Sharp (1999) and Valley et al.
(1986), and references therein. Isotopes are atoms whose nuclei contain the same number
of protons but a different number of neutrons. The atomic weight of each naturally occurring
element is the average of the weights contributed by its various isotopes. The term stable
refers to those isotopes that are not radioactive. In most cases, one stable isotope is
predominant, the others being present only in trace amounts. Certain differences exist in
physicochemical properties due to isotope mass differences. The chemical properties of
molecules differing only in isotopic substitution are qualitatively the same, but quantitatively
different. These differences in chemical properties can lead to considerable isotope effects
in chemical reactions.
The partitioning of stable isotopes between two substances or two phases of the
same substance with different isotope ratios is referred to as isotope fractionation. The
main phenomena producing isotope fractionations are isotope exchange reactions and
kinetic processes; the latter depend primarily on differences in reaction rates of isotopic
molecules. Other factors are the chemical composition and the crystal structure.
Fractionation mechanisms are specific for any given element.
Mass spectrometry methods are the most effective means of measuring isotope
abundance. A mass spectrometer separates charged atoms and molecules by their mass
Chapter 3: Analytical methods
35
as they move through magnetic and/or electrical fields. The accuracy with which absolute
isotope abundance can be measured is substantially poorer than the precision with which
relative differences in the isotope abundance between two samples can be determined.
Nevertheless, the determination of absolute isotope ratios from standards is very important,
because these numbers form the basis for the calculation of the relative differences, the δ-
values. The δ-values can reflect the fractionation mechanisms and processes predominant
for each specific element during geological evolution.
In carbonate minerals and rocks oxygen isotope ratio (δ18O) provides a useful tool
for the study of water/rock interaction, as this ratio shifts for both phases away from their
initial values during interaction. Carbon isotope ratios (δ13C) can be used to trace the
carbon source and the carbonate evolution during diagenesis and very low-temperature
metamorphism.
Analytical procedure
Measurements of the stable isotopes δ13C and δ18O in both dolomite and calcite were
performed in the Institute of Geology, University of Erlangen-Nürnberg. Powder preparations
were obtained by drilling the vein carbonate crystals from polished rock slabs (400 µm).
The powder was poured directly into the glass containers of the carrousel preparation line.
The carbonate powders were reacted with 100% phosphoric acid (density >1.9 g/cm3);
Wachter and Hayes, 1985) at 75°C in an online carbonate preparation line (Carbo-Kiel -
single sample acid bath) connected to a Finnigan Mat 252 mass-spectrometer. All values
are reported in per mil relative to V-PDB Standard (Cretaceous belemnite of the Pee Dee
formation) by assigning a δ13C value of +1.95‰ and a δ18O value of -2.2‰ to NBS19
(equivalent Marble Standard). Values for oxygen are reported as well in per mil relative to
SMOW (Standard Mean Ocean Water). Oxygen isotopic compositions of dolomites were
corrected using the fractionation factors given by Rosenbaum and Sheppard (1986).
Reproducibility was checked by replicate analysis of laboratory standards and is better
than ± 0.02 for δ13C and ± 0.04 for δ18O (1σ). Though in the studied samples vein calcite
contains entrapped fragments of dolomite, these do not represent more than 5-10 vol. %
of the total (estimated from thin section). The short reaction time (10 minutes) and low
temperature of the phosphoric acid (75°C) lead to conclude that no significant amount of
dolomite derived δ18O and δ13C was incorporated in the measured CO2 (gas). Therefore,
the obtained isotopic values are considered to be representative for the calcite phase.

Chapter 3: Analytical methods
36
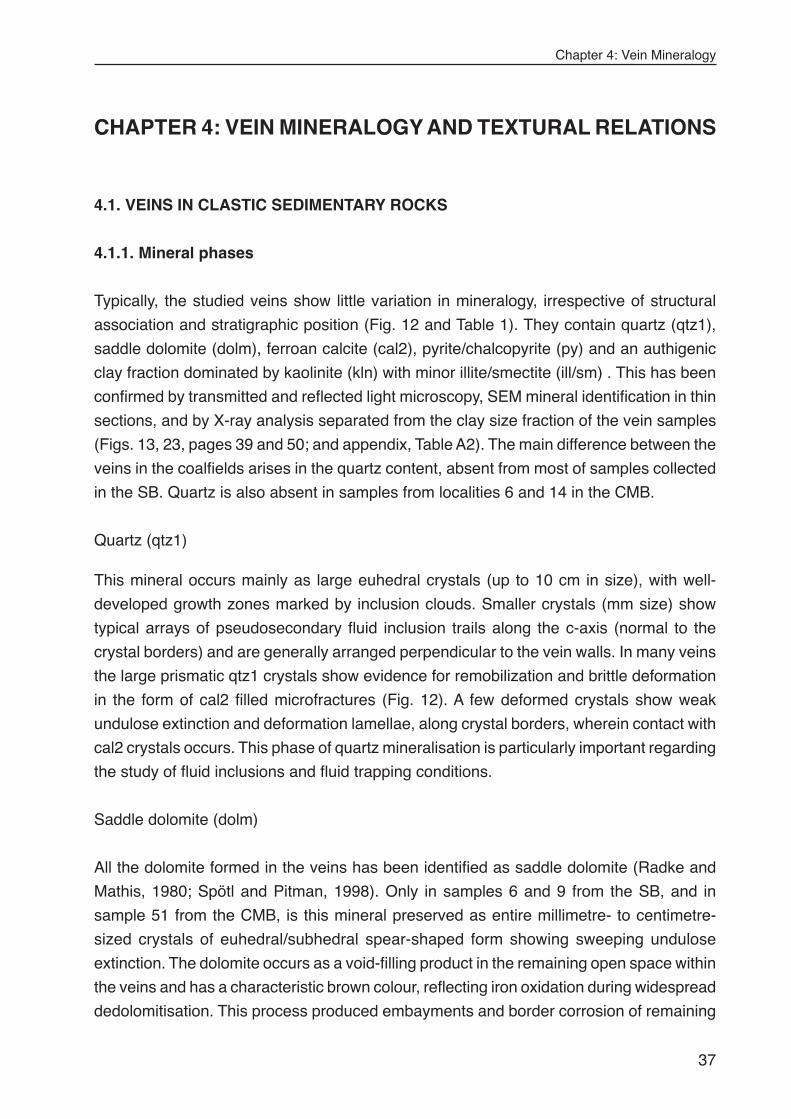
Chapter 4: Vein Mineralogy
37
CHAPTER 4: VEIN MINERALOGY AND TEXTURAL RELATIONS
4.1. VEINS IN CLASTIC SEDIMENTARY ROCKS
4.1.1. Mineral phases
Typically, the studied veins show little variation in mineralogy, irrespective of structural
association and stratigraphic position (Fig. 12 and Table 1). They contain quartz (qtz1),
saddle dolomite (dolm), ferroan calcite (cal2), pyrite/chalcopyrite (py) and an authigenic
clay fraction dominated by kaolinite (kln) with minor illite/smectite (ill/sm) . This has been
confirmed by transmitted and reflected light microscopy, SEM mineral identification in thin
sections, and by X-ray analysis separated from the clay size fraction of the vein samples
(Figs. 13, 23, pages 39 and 50; and appendix, Table A2). The main difference between the
veins in the coalfields arises in the quartz content, absent from most of samples collected
in the SB. Quartz is also absent in samples from localities 6 and 14 in the CMB.
Quartz (qtz1)
This mineral occurs mainly as large euhedral crystals (up to 10 cm in size), with well-
developed growth zones marked by inclusion clouds. Smaller crystals (mm size) show
typical arrays of pseudosecondary fluid inclusion trails along the c-axis (normal to the
crystal borders) and are generally arranged perpendicular to the vein walls. In many veins
the large prismatic qtz1 crystals show evidence for remobilization and brittle deformation
in the form of cal2 filled microfractures (Fig. 12). A few deformed crystals show weak
undulose extinction and deformation lamellae, along crystal borders, wherein contact with
cal2 crystals occurs. This phase of quartz mineralisation is particularly important regarding
the study of fluid inclusions and fluid trapping conditions.
Saddle dolomite (dolm)
All the dolomite formed in the veins has been identified as saddle dolomite (Radke and
Mathis, 1980; Spötl and Pitman, 1998). Only in samples 6 and 9 from the SB, and in
sample 51 from the CMB, is this mineral preserved as entire millimetre- to centimetre-
sized crystals of euhedral/subhedral spear-shaped form showing sweeping undulose
extinction. The dolomite occurs as a void-filling product in the remaining open space within
the veins and has a characteristic brown colour, reflecting iron oxidation during widespread
dedolomitisation. This process produced embayments and border corrosion of remaining
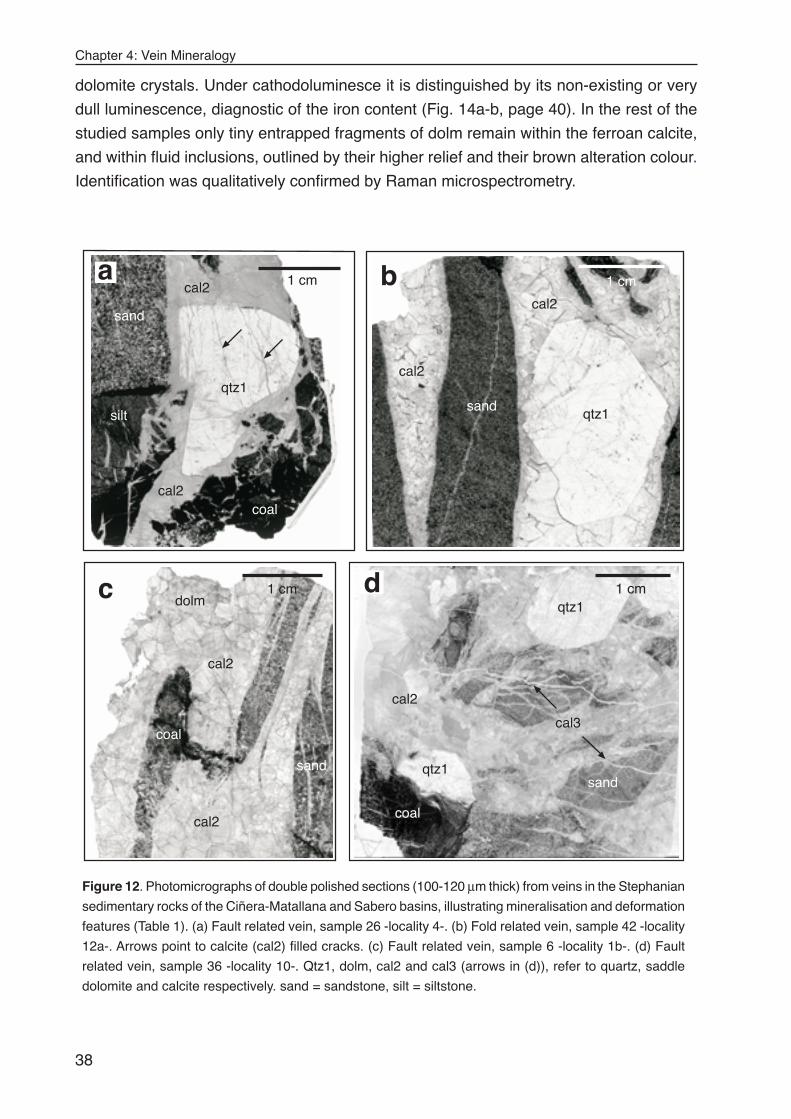
Chapter 4: Vein Mineralogy
38
dolomite crystals. Under cathodoluminesce it is distinguished by its non-existing or very
dull luminescence, diagnostic of the iron content (Fig. 14a-b, page 40). In the rest of the
studied samples only tiny entrapped fragments of dolm remain within the ferroan calcite,
and within fluid inclusions, outlined by their higher relief and their brown alteration colour.
Identification was qualitatively confirmed by Raman microspectrometry.
cal2
cal2
dolmc
coal
sand
1 cm
qtz1
cal2
cal2
sand
silt
coal
1 cma
cal2
cal2
qtz1sand
b 1 cm
cal2
cal3
qtz1
qtz1
coal
sand
1 cmd
Figure 12. Photomicrographs of double polished sections (100-120 µm thick) from veins in the Stephanian
sedimentary rocks of the Ciñera-Matallana and Sabero basins, illustrating mineralisation and deformation
features (Table 1). (a) Fault related vein, sample 26 -locality 4-. (b) Fold related vein, sample 42 -locality
12a-. Arrows point to calcite (cal2) filled cracks. (c) Fault related vein, sample 6 -locality 1b-. (d) Fault
related vein, sample 36 -locality 10-. Qtz1, dolm, cal2 and cal3 (arrows in (d)), refer to quartz, saddle
dolomite and calcite respectively. sand = sandstone, silt = siltstone.
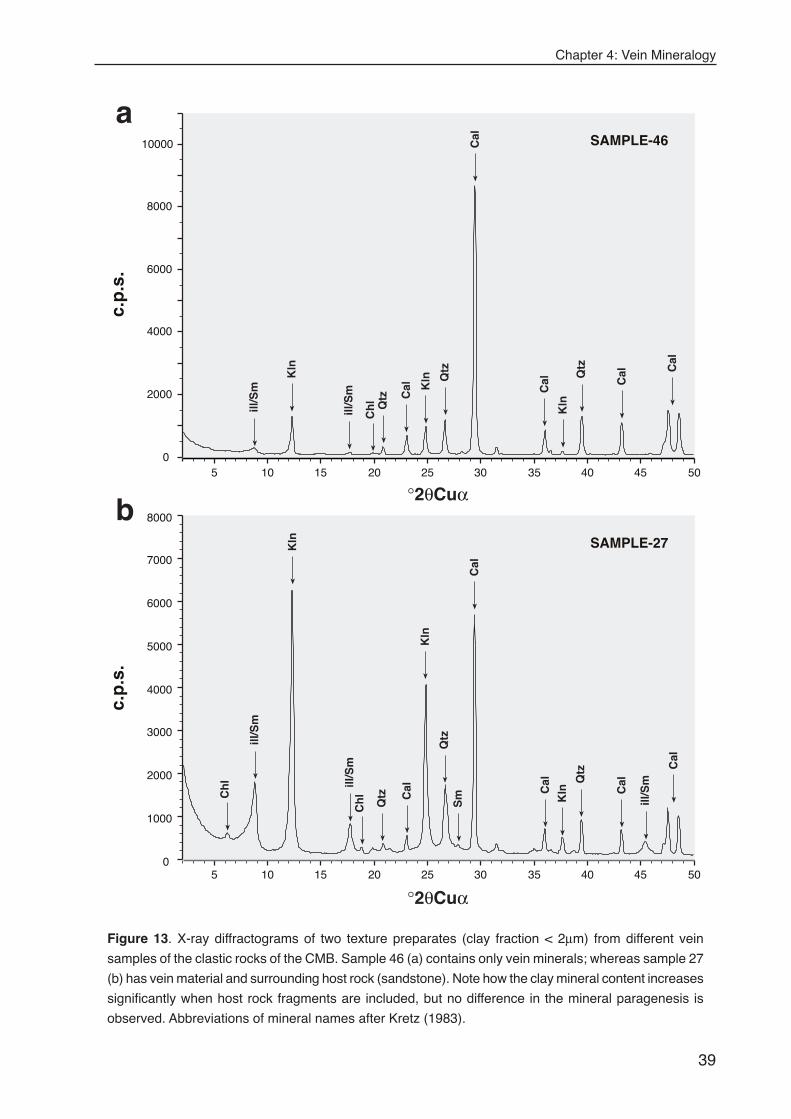
Chapter 4: Vein Mineralogy
39
c.p
.s.
°2θCuα
0
1000
2000
3000
4000
5000
6000
7000
8000
5 10 15 20 25 30 35 40 45 50
°2θCuα
c.p
.s.
0
2000
4000
6000
8000
10000
5 10 15 20 25 30 35 40 45 50
Kln
Ch
l
ill/S
m
Qtz
Kln
Ch
lill
/Sm
Kln
Sm
Cal
Qtz C
al Cal
Cal
Cal
ill/S
mQtz
Kln
ill/S
m
Qtz
Kln
Kln
Cal
Qtz C
al Cal C
alQtz Cal
Ch
l
SAMPLE-27
SAMPLE-46
a
b
ill/S
m
Figure 13. X-ray diffractograms of two texture preparates (clay fraction < 2µm) from different vein
samples of the clastic rocks of the CMB. Sample 46 (a) contains only vein minerals; whereas sample 27
(b) has vein material and surrounding host rock (sandstone). Note how the clay mineral content increases
significantly when host rock fragments are included, but no difference in the mineral paragenesis is
observed. Abbreviations of mineral names after Kretz (1983).
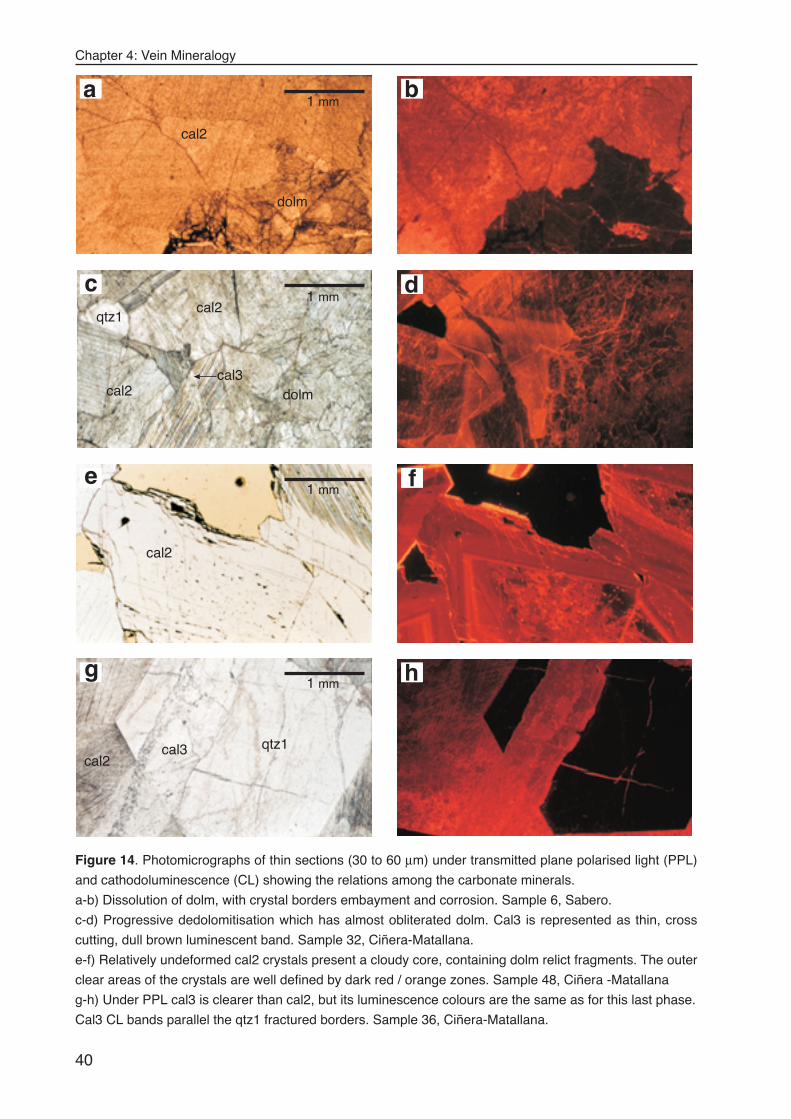
Chapter 4: Vein Mineralogy
40
b
d
f
h
cal3 qtz1cal2
g
cal2
e
qtz1cal2
c
dolmcal3
cal2
cal2
dolm
a1 mm
1 mm
1 mm
1 mm
Figure 14. Photomicrographs of thin sections (30 to 60 µm) under transmitted plane polarised light (PPL)
and cathodoluminescence (CL) showing the relations among the carbonate minerals.
a-b) Dissolution of dolm, with crystal borders embayment and corrosion. Sample 6, Sabero.
c-d) Progressive dedolomitisation which has almost obliterated dolm. Cal3 is represented as thin, cross
cutting, dull brown luminescent band. Sample 32, Ciñera-Matallana.
e-f) Relatively undeformed cal2 crystals present a cloudy core, containing dolm relict fragments. The outer
clear areas of the crystals are well defined by dark red / orange zones. Sample 48, Ciñera -Matallana
g-h) Under PPL cal3 is clearer than cal2, but its luminescence colours are the same as for this last phase.
Cal3 CL bands parallel the qtz1 fractured borders. Sample 36, Ciñera-Matallana.
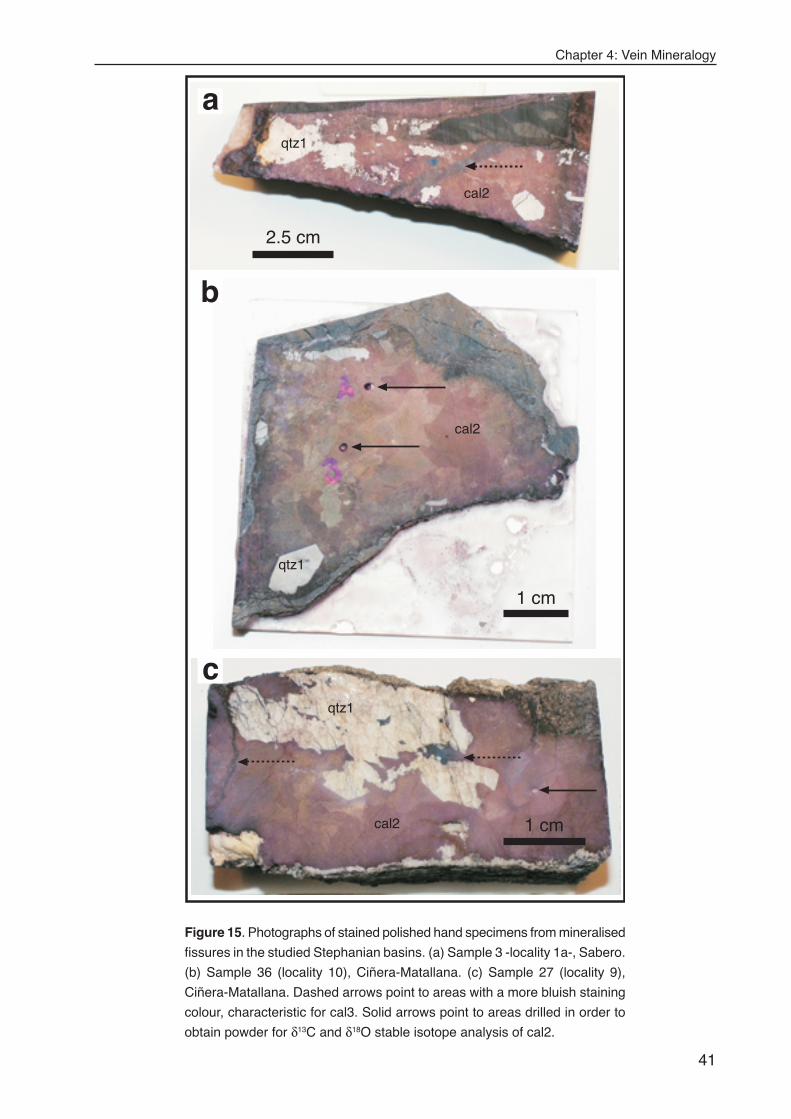
Chapter 4: Vein Mineralogy
41
1 cm
b
2.5 cm
a
qtz1
cal2
qtz1
cal2
1 cm
cqtz1
cal2
Figure 15. Photographs of stained polished hand specimens from mineralised
fissures in the studied Stephanian basins. (a) Sample 3 -locality 1a-, Sabero.
(b) Sample 36 (locality 10), Ciñera-Matallana. (c) Sample 27 (locality 9),
Ciñera-Matallana. Dashed arrows point to areas with a more bluish staining
colour, characteristic for cal3. Solid arrows point to areas drilled in order to
obtain powder for δ13C and δ18O stable isotope analysis of cal2.
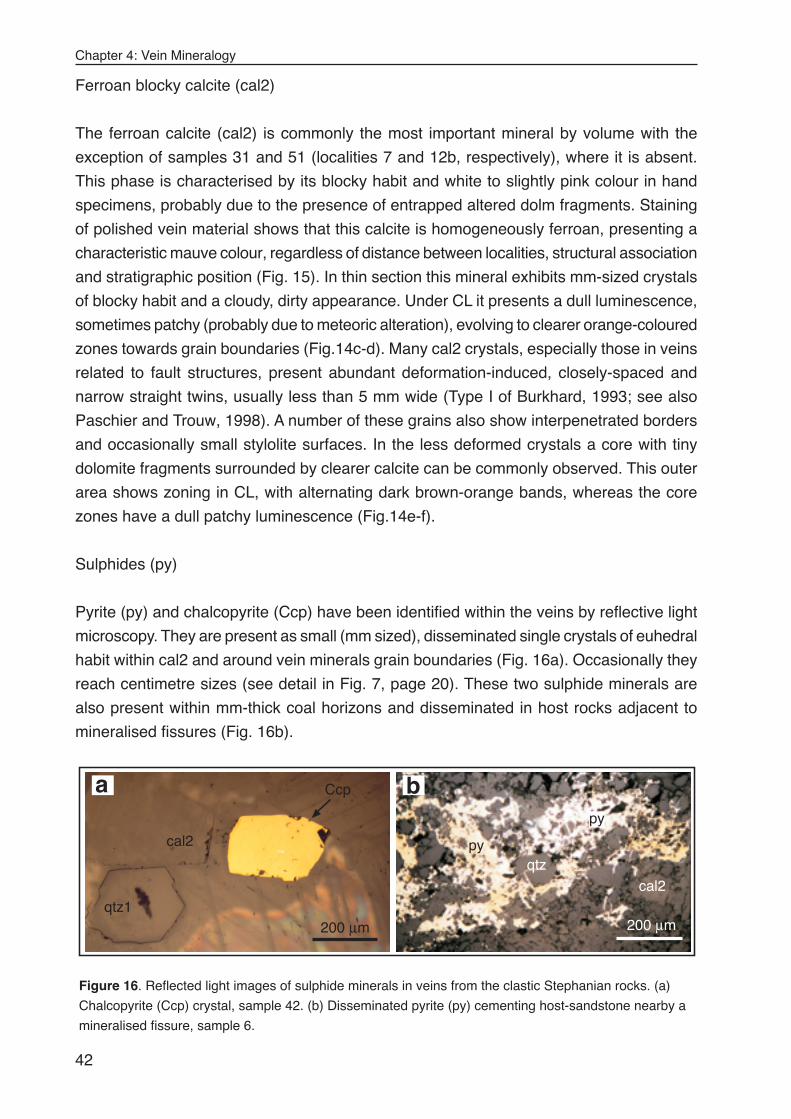
Chapter 4: Vein Mineralogy
42
Ferroan blocky calcite (cal2)
The ferroan calcite (cal2) is commonly the most important mineral by volume with the
exception of samples 31 and 51 (localities 7 and 12b, respectively), where it is absent.
This phase is characterised by its blocky habit and white to slightly pink colour in hand
specimens, probably due to the presence of entrapped altered dolm fragments. Staining
of polished vein material shows that this calcite is homogeneously ferroan, presenting a
characteristic mauve colour, regardless of distance between localities, structural association
and stratigraphic position (Fig. 15). In thin section this mineral exhibits mm-sized crystals
of blocky habit and a cloudy, dirty appearance. Under CL it presents a dull luminescence,
sometimes patchy (probably due to meteoric alteration), evolving to clearer orange-coloured
zones towards grain boundaries (Fig.14c-d). Many cal2 crystals, especially those in veins
related to fault structures, present abundant deformation-induced, closely-spaced and
narrow straight twins, usually less than 5 mm wide (Type I of Burkhard, 1993; see also
Paschier and Trouw, 1998). A number of these grains also show interpenetrated borders
and occasionally small stylolite surfaces. In the less deformed crystals a core with tiny
dolomite fragments surrounded by clearer calcite can be commonly observed. This outer
area shows zoning in CL, with alternating dark brown-orange bands, whereas the core
zones have a dull patchy luminescence (Fig.14e-f).
Sulphides (py)
Pyrite (py) and chalcopyrite (Ccp) have been identified within the veins by reflective light
microscopy. They are present as small (mm sized), disseminated single crystals of euhedral
habit within cal2 and around vein minerals grain boundaries (Fig. 16a). Occasionally they
reach centimetre sizes (see detail in Fig. 7, page 20). These two sulphide minerals are
also present within mm-thick coal horizons and disseminated in host rocks adjacent to
mineralised fissures (Fig. 16b).
200 µm
cal2qtz
py
py
200 µmqtz1
cal2
Ccp ba
Figure 16. Reflected light images of sulphide minerals in veins from the clastic Stephanian rocks. (a)
Chalcopyrite (Ccp) crystal, sample 42. (b) Disseminated pyrite (py) cementing host-sandstone nearby a
mineralised fissure, sample 6.
Chapter 4: Vein Mineralogy
43
Late calcite (cal3)
A third calcite type, cal3, is recognised within small veins cutting the host rock and the
whole vein assemblage (Fig. 12d and Fig. 14g-h). These clear crystals are only weakly
twinned and virtually inclusion-free. In the stained polished vein samples, cal3 is
characterised by a more bluish colour (see Fig. 15), but crystals do not show distinct CL
features and have essentially the same luminescence colours as cal2. This phase is present
in samples in which the vein minerals are more deformed, particularly those associated
with fault structures.
Authigenic clay minerals (kln)
Within the clay fraction, kaolin group minerals are by far the most important. The kaolin
phase occurs as microporous clusters of authigenic crystals filling volumes between crystal
boundaries (calcite-calcite, but also cal2-qtz1 and mineral-host rock). This mineral is also
present intergrowing with cal3 and generally it replaces both qtz1 and cal2 (Fig. 17). The
mineral habit observed under transmitted light microscopy and SEM consists of vermicular
crystals, comprised of disorderly appearing stacks of thin euhedral plates. Smaller crystals
of blocky morphologies are also common and many times they surround vermicular crystals.
The kaolin clusters are also characterised by a dark blue luminescence colour under CL
(Fig. 18). This phase is specially abundant in fault related veins, along cal2-host rock
contact surfaces and fissure walls, within pore spaces in vein minerals and as haloes
around entrapped host-rock fragments. The kaolin present in the veins is always in the
form of the low temperature polytype kaolinite. Though small crystal size make it impossible
to distinguish the kaolin polytypes based on optical properties, the dominant crystal
morphologies described above are those typical of the low temperature kaolinite variety
(Ehrenberg et al., 1993). This is confirmed by the disappearance of the 7.14 Å XRD peak
at temperatures ≤ 500°C (Fig. 19 and Table 3). Dickite, the high temperature polytype,
resists temperatures up to 550-650°C (Brown and Brindley, 1980; and references within).
The remaining peak intensity in some of the samples at 520-540°C (all < 10% of the initial
intensity) is attributed to the presence of minor ammounts of chlorite.
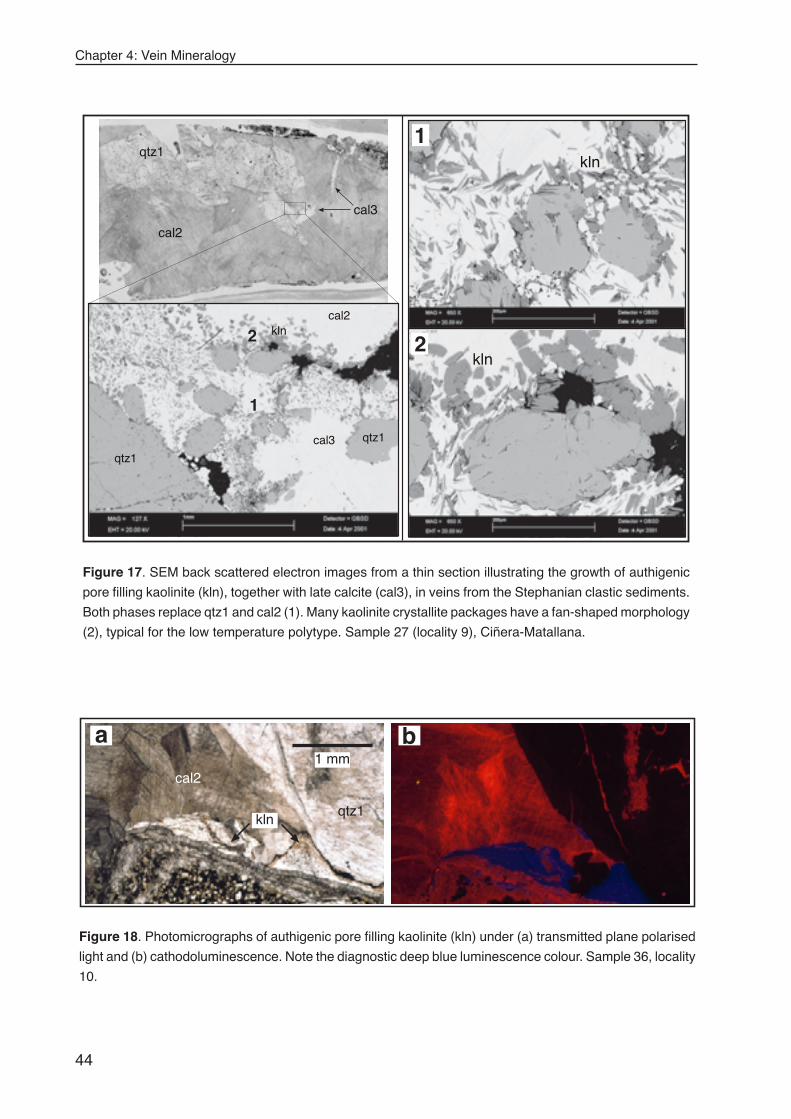
Chapter 4: Vein Mineralogy
44
1
2
qtz1
cal2
cal3
qtz1
cal2
cal3
kln
qtz1
1
2kln
kln
Figure 17. SEM back scattered electron images from a thin section illustrating the growth of authigenic
pore filling kaolinite (kln), together with late calcite (cal3), in veins from the Stephanian clastic sediments.
Both phases replace qtz1 and cal2 (1). Many kaolinite crystallite packages have a fan-shaped morphology
(2), typical for the low temperature polytype. Sample 27 (locality 9), Ciñera-Matallana.
1 mm
qtz1
cal2
kln
ba
Figure 18. Photomicrographs of authigenic pore filling kaolinite (kln) under (a) transmitted plane polarised
light and (b) cathodoluminescence. Note the diagnostic deep blue luminescence colour. Sample 36, locality
10.
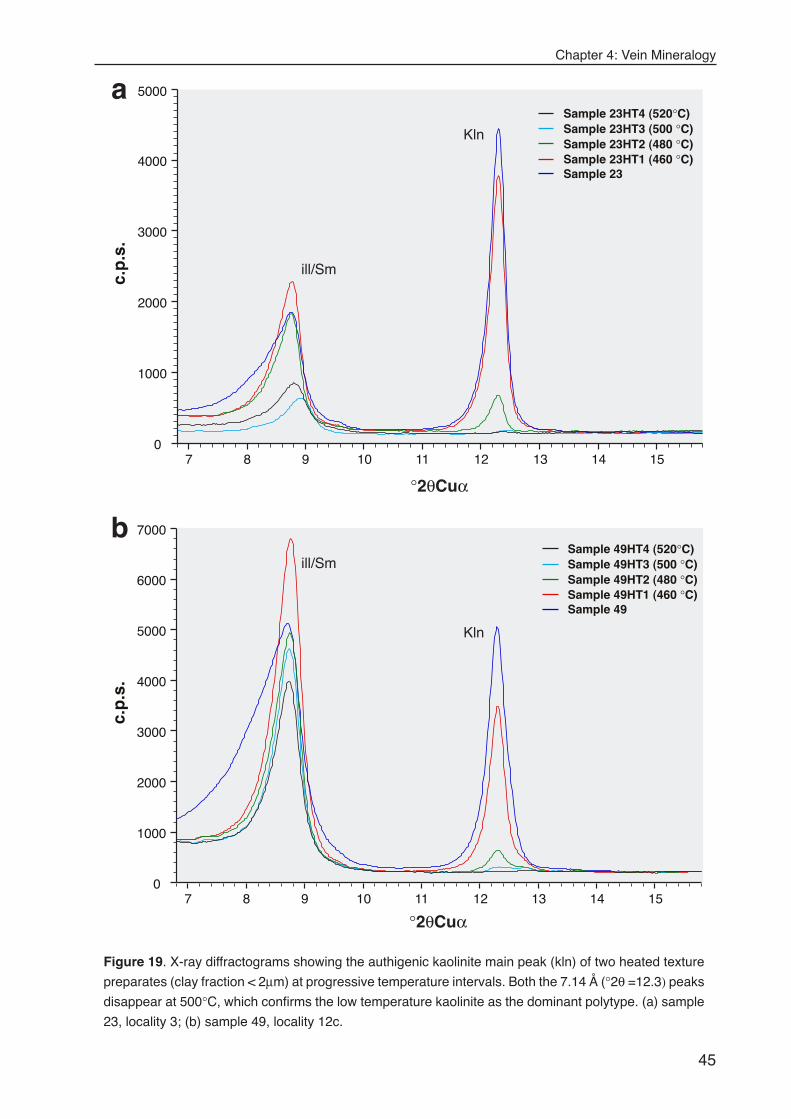
Chapter 4: Vein Mineralogy
45
Sample 49HT1 (460 °C)Sample 49
Sample 49HT2 (480 °C)Sample 49HT3 (500 °C)Sample 49HT4 (520°C)
0
1000
2000
3000
4000
5000
6000
7000
7 8 9 10 11 12 13 14 15
c.p
.s.
°2θCuα
Sample 23HT1 (460 °C)Sample 23
Sample 23HT2 (480 °C)Sample 23HT3 (500 °C)Sample 23HT4 (520°C)
0
1000
2000
3000
4000
5000
7 8 9 10 11 12 13 14 15
c.p
.s.
°2θCuα
ill/Sm
Kln
ill/Sm
Kln
a
b
Figure 19. X-ray diffractograms showing the authigenic kaolinite main peak (kln) of two heated texture
preparates (clay fraction < 2µm) at progressive temperature intervals. Both the 7.14 Å (°2θ =12.3) peaks
disappear at 500°C, which confirms the low temperature kaolinite as the dominant polytype. (a) sample
23, locality 3; (b) sample 49, locality 12c.
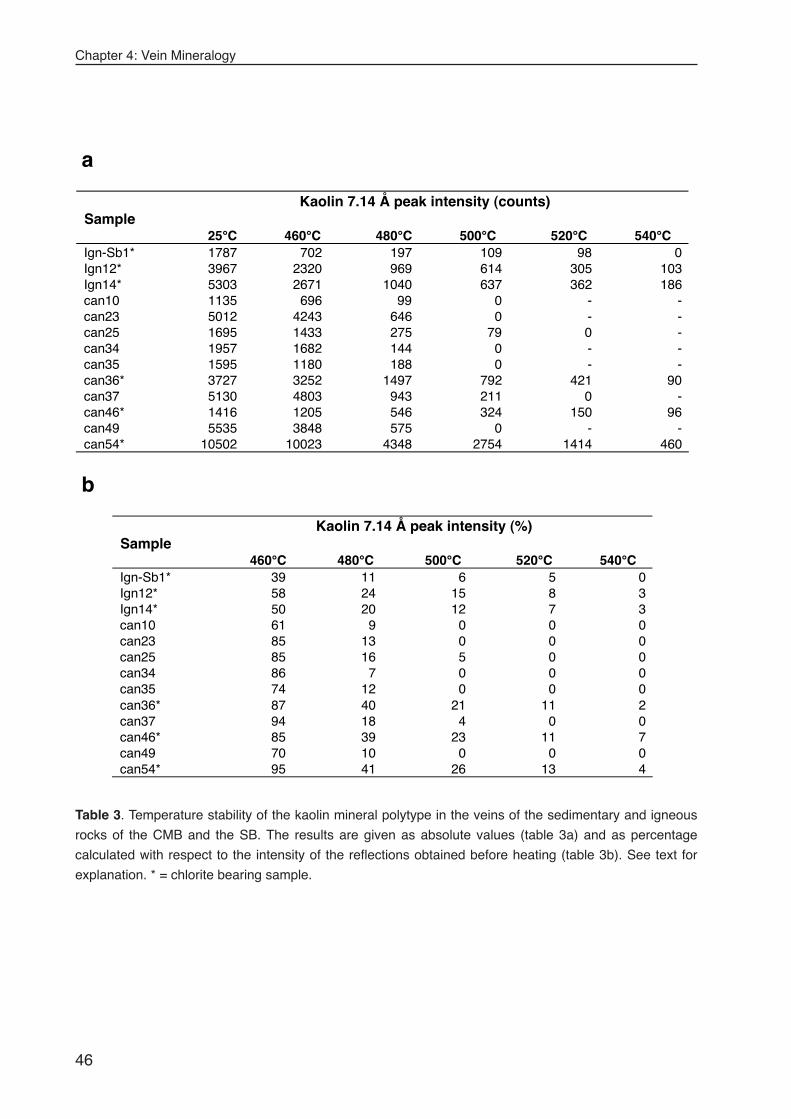
Chapter 4: Vein Mineralogy
46
a
SampleKaolin 7.14 Å peak intensity (counts)
25°C 460°C 480°C 500°C 520°C 540°CIgn-Sb1* 1787 702 197 109 98 0Ign12* 3967 2320 969 614 305 103Ign14* 5303 2671 1040 637 362 186can10 1135 696 99 0 - -can23 5012 4243 646 0 - -can25 1695 1433 275 79 0 -can34 1957 1682 144 0 - -can35 1595 1180 188 0 - -can36* 3727 3252 1497 792 421 90can37 5130 4803 943 211 0 -can46* 1416 1205 546 324 150 96can49 5535 3848 575 0 - -can54* 10502 10023 4348 2754 1414 460
b
SampleKaolin 7.14 Å peak intensity (%)
460°C 480°C 500°C 520°C 540°CIgn-Sb1* 39 11 6 5 0Ign12* 58 24 15 8 3Ign14* 50 20 12 7 3can10 61 9 0 0 0can23 85 13 0 0 0can25 85 16 5 0 0can34 86 7 0 0 0can35 74 12 0 0 0can36* 87 40 21 11 2can37 94 18 4 0 0can46* 85 39 23 11 7can49 70 10 0 0 0can54* 95 41 26 13 4
Table 3. Temperature stability of the kaolin mineral polytype in the veins of the sedimentary and igneous
rocks of the CMB and the SB. The results are given as absolute values (table 3a) and as percentage
calculated with respect to the intensity of the reflections obtained before heating (table 3b). See text for
explanation. * = chlorite bearing sample.
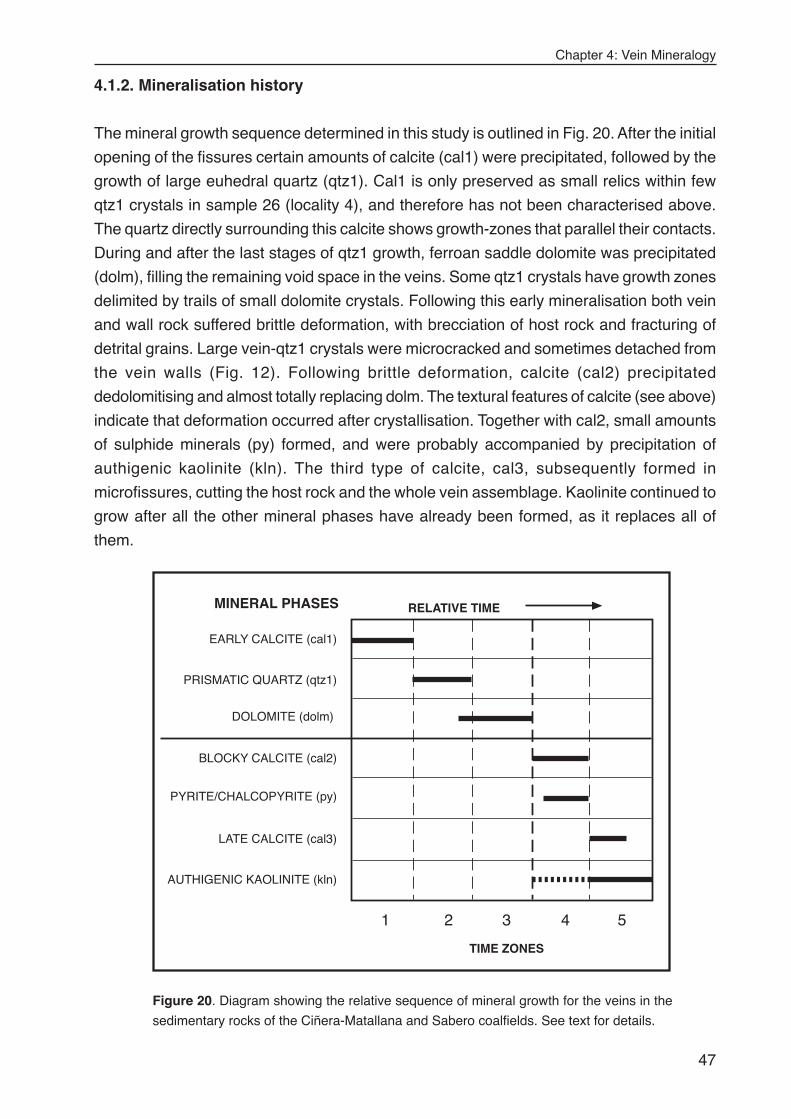
Chapter 4: Vein Mineralogy
47
4.1.2. Mineralisation history
The mineral growth sequence determined in this study is outlined in Fig. 20. After the initial
opening of the fissures certain amounts of calcite (cal1) were precipitated, followed by the
growth of large euhedral quartz (qtz1). Cal1 is only preserved as small relics within few
qtz1 crystals in sample 26 (locality 4), and therefore has not been characterised above.
The quartz directly surrounding this calcite shows growth-zones that parallel their contacts.
During and after the last stages of qtz1 growth, ferroan saddle dolomite was precipitated
(dolm), filling the remaining void space in the veins. Some qtz1 crystals have growth zones
delimited by trails of small dolomite crystals. Following this early mineralisation both vein
and wall rock suffered brittle deformation, with brecciation of host rock and fracturing of
detrital grains. Large vein-qtz1 crystals were microcracked and sometimes detached from
the vein walls (Fig. 12). Following brittle deformation, calcite (cal2) precipitated
dedolomitising and almost totally replacing dolm. The textural features of calcite (see above)
indicate that deformation occurred after crystallisation. Together with cal2, small amounts
of sulphide minerals (py) formed, and were probably accompanied by precipitation of
authigenic kaolinite (kln). The third type of calcite, cal3, subsequently formed in
microfissures, cutting the host rock and the whole vein assemblage. Kaolinite continued to
grow after all the other mineral phases have already been formed, as it replaces all of
them.
AUTHIGENIC KAOLINITE (kln)
MINERAL PHASES RELATIVE TIME
TIME ZONES
EARLY CALCITE (cal1)
PRISMATIC QUARTZ (qtz1)
BLOCKY CALCITE (cal2)
DOLOMITE (dolm)
LATE CALCITE (cal3)
1 2 3 4 5
PYRITE/CHALCOPYRITE (py)
Figure 20. Diagram showing the relative sequence of mineral growth for the veins in the
sedimentary rocks of the Ciñera-Matallana and Sabero coalfields. See text for details.
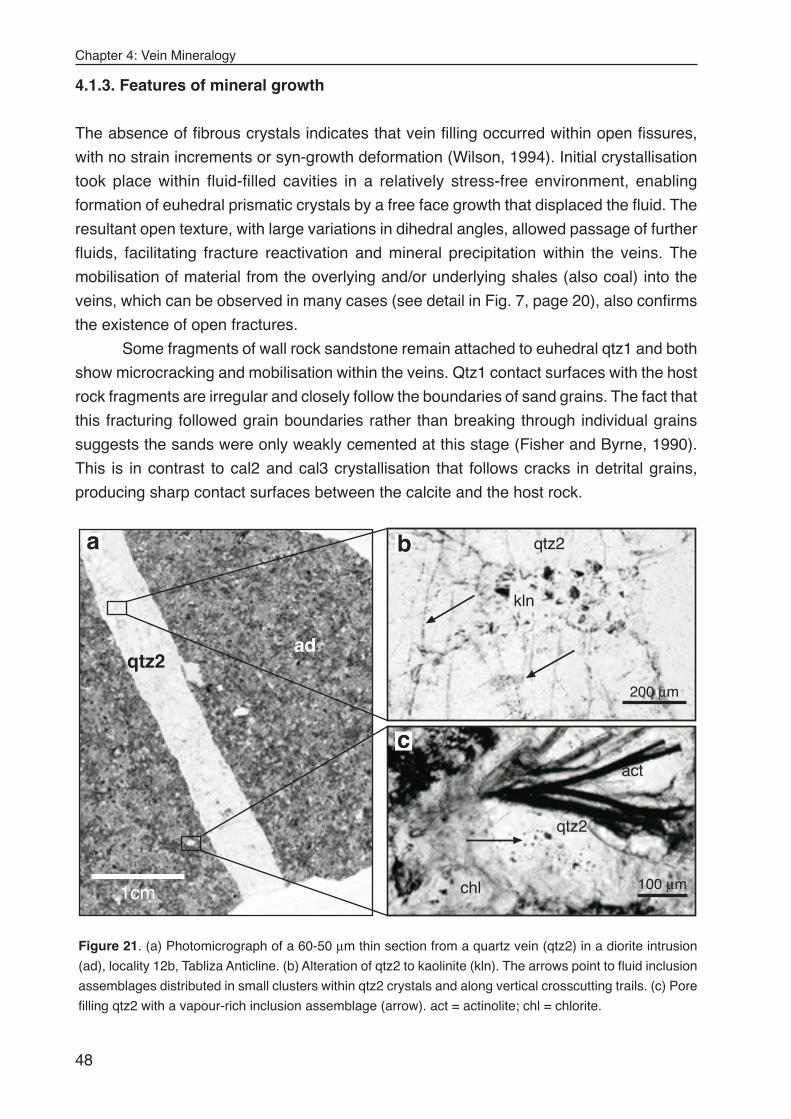
Chapter 4: Vein Mineralogy
48
4.1.3. Features of mineral growth
The absence of fibrous crystals indicates that vein filling occurred within open fissures,
with no strain increments or syn-growth deformation (Wilson, 1994). Initial crystallisation
took place within fluid-filled cavities in a relatively stress-free environment, enabling
formation of euhedral prismatic crystals by a free face growth that displaced the fluid. The
resultant open texture, with large variations in dihedral angles, allowed passage of further
fluids, facilitating fracture reactivation and mineral precipitation within the veins. The
mobilisation of material from the overlying and/or underlying shales (also coal) into the
veins, which can be observed in many cases (see detail in Fig. 7, page 20), also confirms
the existence of open fractures.
Some fragments of wall rock sandstone remain attached to euhedral qtz1 and both
show microcracking and mobilisation within the veins. Qtz1 contact surfaces with the host
rock fragments are irregular and closely follow the boundaries of sand grains. The fact that
this fracturing followed grain boundaries rather than breaking through individual grains
suggests the sands were only weakly cemented at this stage (Fisher and Byrne, 1990).
This is in contrast to cal2 and cal3 crystallisation that follows cracks in detrital grains,
producing sharp contact surfaces between the calcite and the host rock.
qtz2
1cm
ad
kln
200 µm
qtz2
qtz2
act
chl 100 µm
a b
c
Figure 21. (a) Photomicrograph of a 60-50 µm thin section from a quartz vein (qtz2) in a diorite intrusion
(ad), locality 12b, Tabliza Anticline. (b) Alteration of qtz2 to kaolinite (kln). The arrows point to fluid inclusion
assemblages distributed in small clusters within qtz2 crystals and along vertical crosscutting trails. (c) Pore
filling qtz2 with a vapour-rich inclusion assemblage (arrow). act = actinolite; chl = chlorite.
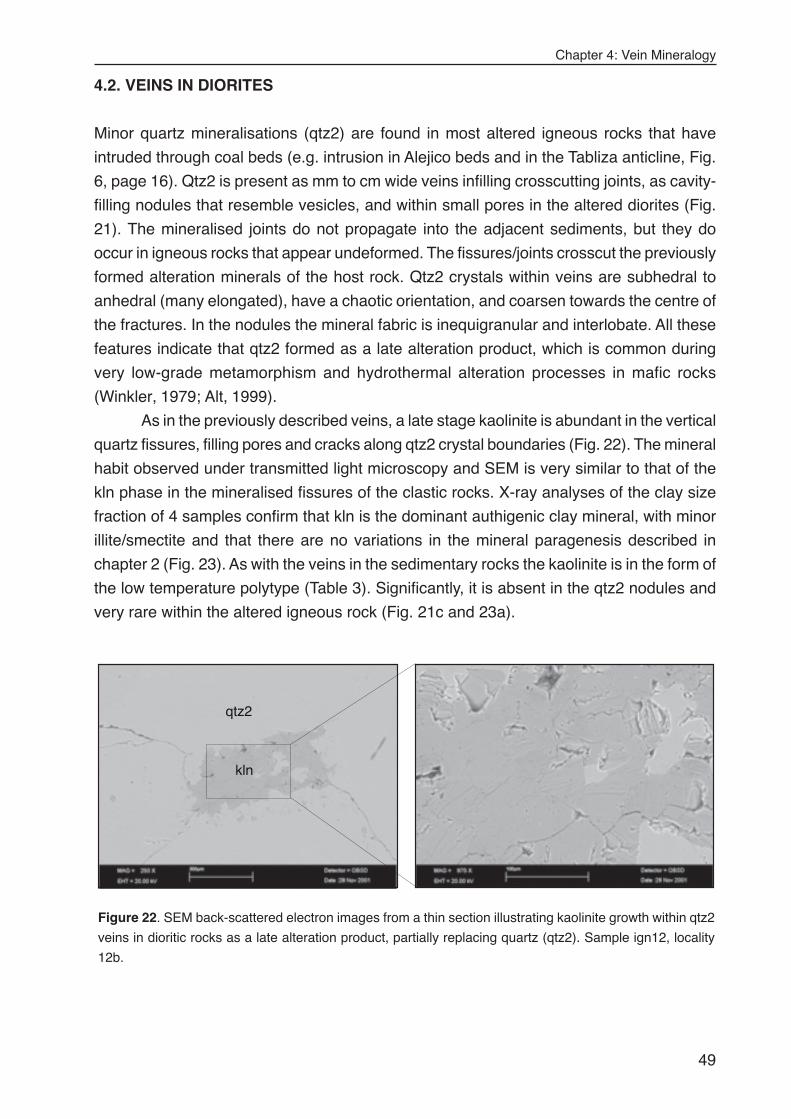
Chapter 4: Vein Mineralogy
49
4.2. VEINS IN DIORITES
Minor quartz mineralisations (qtz2) are found in most altered igneous rocks that have
intruded through coal beds (e.g. intrusion in Alejico beds and in the Tabliza anticline, Fig.
6, page 16). Qtz2 is present as mm to cm wide veins infilling crosscutting joints, as cavity-
filling nodules that resemble vesicles, and within small pores in the altered diorites (Fig.
21). The mineralised joints do not propagate into the adjacent sediments, but they do
occur in igneous rocks that appear undeformed. The fissures/joints crosscut the previously
formed alteration minerals of the host rock. Qtz2 crystals within veins are subhedral to
anhedral (many elongated), have a chaotic orientation, and coarsen towards the centre of
the fractures. In the nodules the mineral fabric is inequigranular and interlobate. All these
features indicate that qtz2 formed as a late alteration product, which is common during
very low-grade metamorphism and hydrothermal alteration processes in mafic rocks
(Winkler, 1979; Alt, 1999).
As in the previously described veins, a late stage kaolinite is abundant in the vertical
quartz fissures, filling pores and cracks along qtz2 crystal boundaries (Fig. 22). The mineral
habit observed under transmitted light microscopy and SEM is very similar to that of the
kln phase in the mineralised fissures of the clastic rocks. X-ray analyses of the clay size
fraction of 4 samples confirm that kln is the dominant authigenic clay mineral, with minor
illite/smectite and that there are no variations in the mineral paragenesis described in
chapter 2 (Fig. 23). As with the veins in the sedimentary rocks the kaolinite is in the form of
the low temperature polytype (Table 3). Significantly, it is absent in the qtz2 nodules and
very rare within the altered igneous rock (Fig. 21c and 23a).
qtz2
kln
Figure 22. SEM back-scattered electron images from a thin section illustrating kaolinite growth within qtz2
veins in dioritic rocks as a late alteration product, partially replacing quartz (qtz2). Sample ign12, locality
12b.
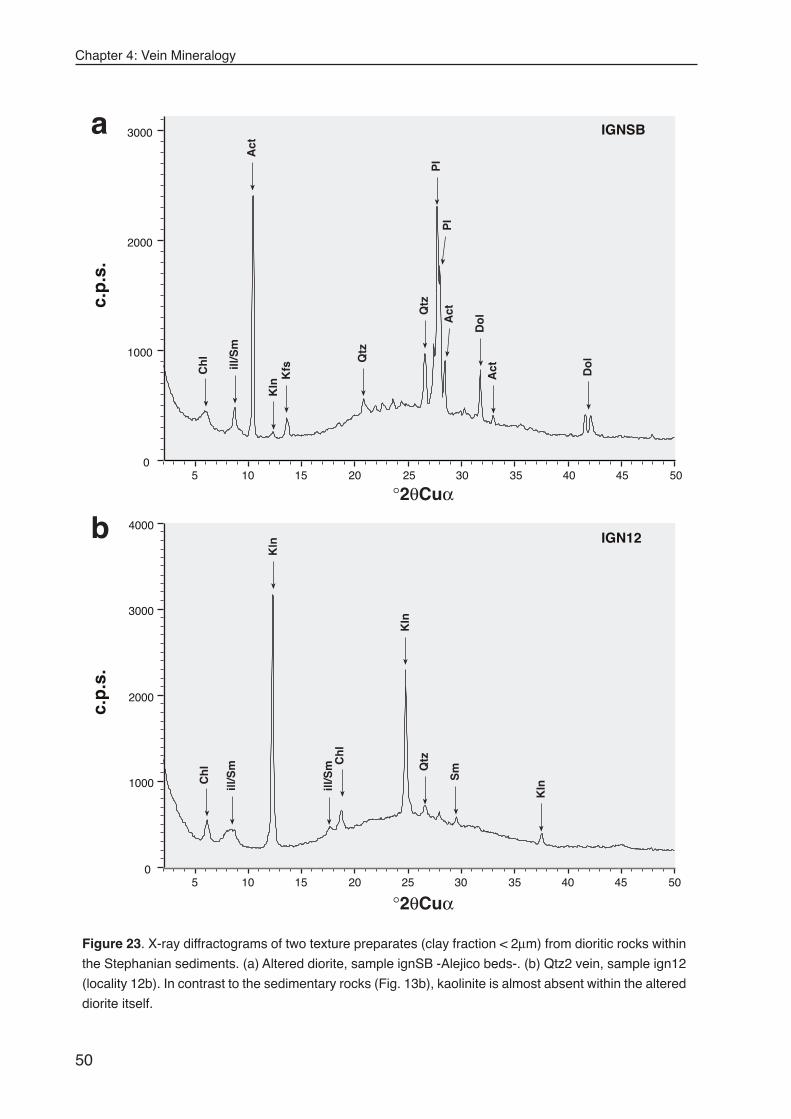
Chapter 4: Vein Mineralogy
50
0
1000
2000
3000
4000
5 10 15 20 25 30 35 40 45 50
IGN12
0
1000
2000
3000
5 10 15 20 25 30 35 40 45 50
IGNSB
c.p
.s.
°2θCuα
c.p
.s.
°2θCuα
Kln
Ch
l
ill/S
m Qtz
Kln
Ch
lill
/Sm
Kln
Kln
Ch
l
ill/S
m
Qtz
Act
Qtz
Pl
Act
Pl
Act
Do
l
Do
l
Kfs
Sm
a
b
Figure 23. X-ray diffractograms of two texture preparates (clay fraction < 2µm) from dioritic rocks within
the Stephanian sediments. (a) Altered diorite, sample ignSB -Alejico beds-. (b) Qtz2 vein, sample ign12
(locality 12b). In contrast to the sedimentary rocks (Fig. 13b), kaolinite is almost absent within the altered
diorite itself.
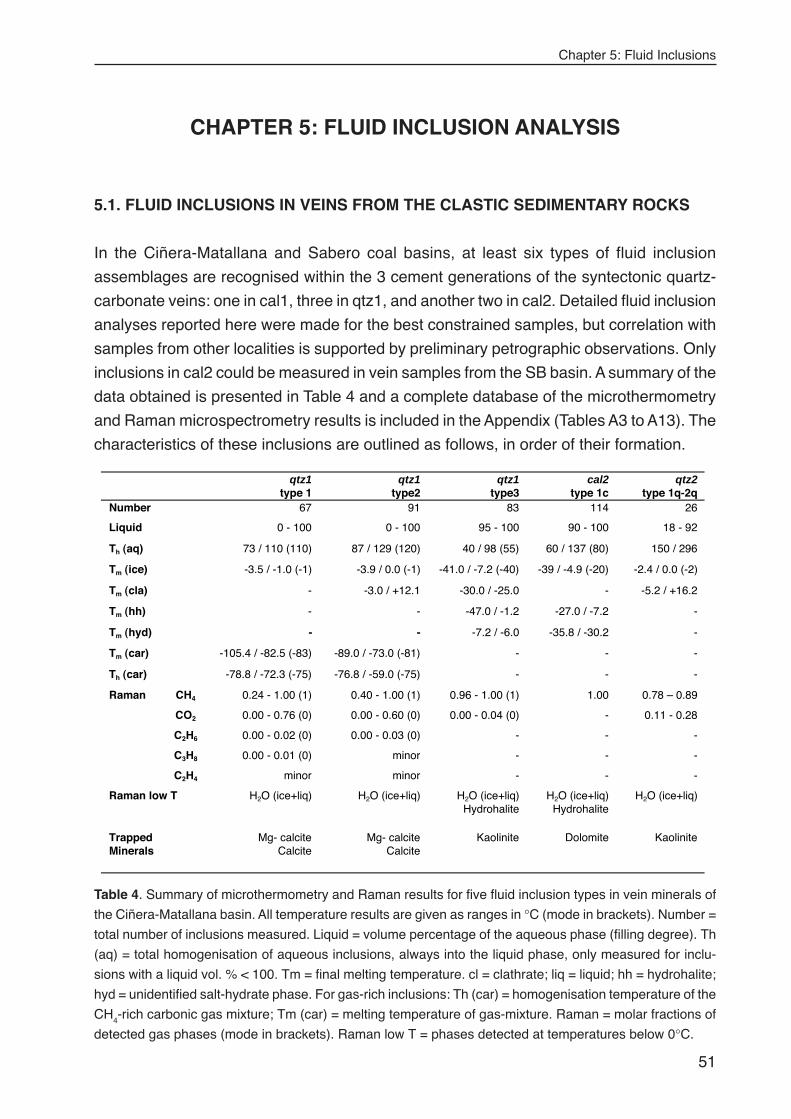
Chapter 5: Fluid Inclusions
51
CHAPTER 5: FLUID INCLUSION ANALYSIS
5.1. FLUID INCLUSIONS IN VEINS FROM THE CLASTIC SEDIMENTARY ROCKS
In the Ciñera-Matallana and Sabero coal basins, at least six types of fluid inclusion
assemblages are recognised within the 3 cement generations of the syntectonic quartz-
carbonate veins: one in cal1, three in qtz1, and another two in cal2. Detailed fluid inclusion
analyses reported here were made for the best constrained samples, but correlation with
samples from other localities is supported by preliminary petrographic observations. Only
inclusions in cal2 could be measured in vein samples from the SB basin. A summary of the
data obtained is presented in Table 4 and a complete database of the microthermometry
and Raman microspectrometry results is included in the Appendix (Tables A3 to A13). The
characteristics of these inclusions are outlined as follows, in order of their formation.
qtz1type 1
qtz1type2
qtz1type3
cal2type 1c
qtz2type 1q-2q
Number 67 91 83 114 26
Liquid 0 - 100 0 - 100 95 - 100 90 - 100 18 - 92
Th (aq) 73 / 110 (110) 87 / 129 (120) 40 / 98 (55) 60 / 137 (80) 150 / 296
Tm (ice) -3.5 / -1.0 (-1) -3.9 / 0.0 (-1) -41.0 / -7.2 (-40) -39 / -4.9 (-20) -2.4 / 0.0 (-2)
Tm (cla) - -3.0 / +12.1 -30.0 / -25.0 - -5.2 / +16.2
Tm (hh) - - -47.0 / -1.2 -27.0 / -7.2 -
Tm (hyd) - - -7.2 / -6.0 -35.8 / -30.2 -
Tm (car) -105.4 / -82.5 (-83) -89.0 / -73.0 (-81) - - -
Th (car) -78.8 / -72.3 (-75) -76.8 / -59.0 (-75) - - -
Raman CH4
CO2
C2H6
C3H8
C2H4
0.24 - 1.00 (1)
0.00 - 0.76 (0)
0.00 - 0.02 (0)
0.00 - 0.01 (0)
minor
0.40 - 1.00 (1)
0.00 - 0.60 (0)
0.00 - 0.03 (0)
minor
minor
0.96 - 1.00 (1)
0.00 - 0.04 (0)
-
-
-
1.00
-
-
-
-
0.78 – 0.89
0.11 - 0.28
-
-
-
Raman low T H2O (ice+liq) H2O (ice+liq) H2O (ice+liq)Hydrohalite
H2O (ice+liq)Hydrohalite
H2O (ice+liq)
TrappedMinerals
Mg- calciteCalcite
Mg- calciteCalcite
Kaolinite Dolomite Kaolinite
Table 4. Summary of microthermometry and Raman results for five fluid inclusion types in vein minerals of
the Ciñera-Matallana basin. All temperature results are given as ranges in °C (mode in brackets). Number =
total number of inclusions measured. Liquid = volume percentage of the aqueous phase (filling degree). Th
(aq) = total homogenisation of aqueous inclusions, always into the liquid phase, only measured for inclu-
sions with a liquid vol. % < 100. Tm = final melting temperature. cl = clathrate; liq = liquid; hh = hydrohalite;
hyd = unidentified salt-hydrate phase. For gas-rich inclusions: Th (car) = homogenisation temperature of the
CH4-rich carbonic gas mixture; Tm (car) = melting temperature of gas-mixture. Raman = molar fractions of
detected gas phases (mode in brackets). Raman low T = phases detected at temperatures below 0°C.
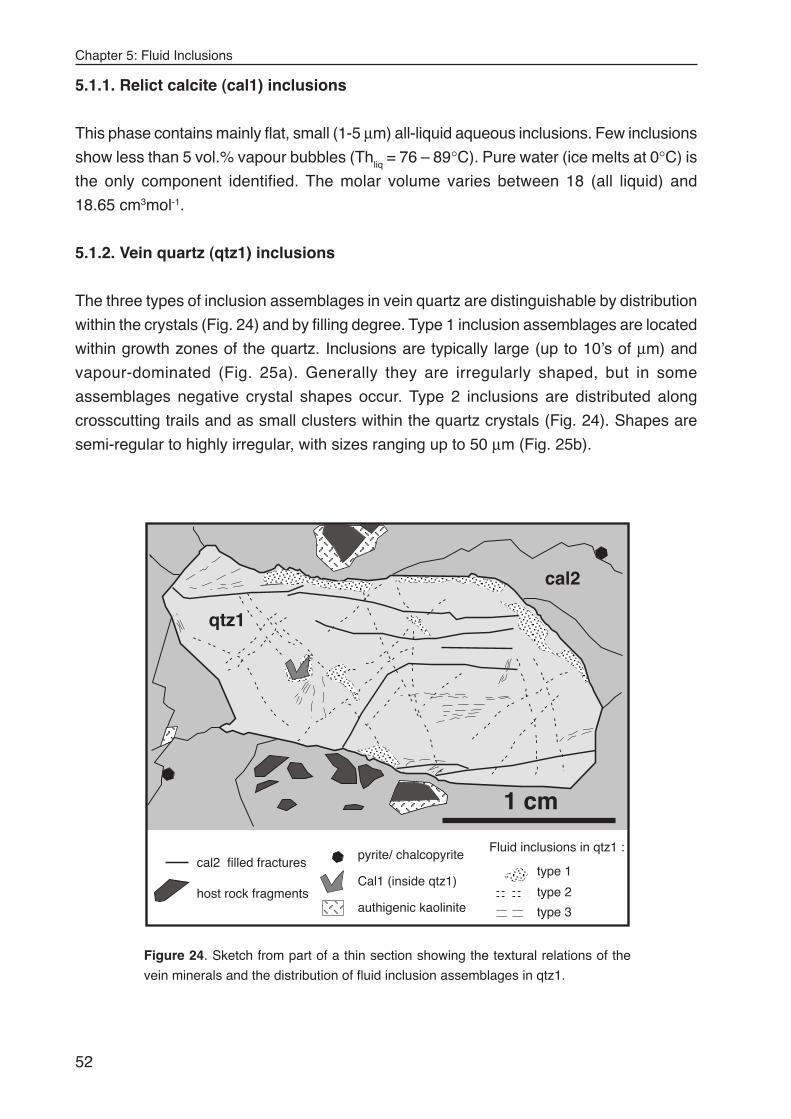
Chapter 5: Fluid Inclusions
52
5.1.1. Relict calcite (cal1) inclusions
This phase contains mainly flat, small (1-5 µm) all-liquid aqueous inclusions. Few inclusions
show less than 5 vol.% vapour bubbles (Thliq = 76 – 89°C). Pure water (ice melts at 0°C) is
the only component identified. The molar volume varies between 18 (all liquid) and
18.65 cm3mol-1.
5.1.2. Vein quartz (qtz1) inclusions
The three types of inclusion assemblages in vein quartz are distinguishable by distribution
within the crystals (Fig. 24) and by filling degree. Type 1 inclusion assemblages are located
within growth zones of the quartz. Inclusions are typically large (up to 10’s of µm) and
vapour-dominated (Fig. 25a). Generally they are irregularly shaped, but in some
assemblages negative crystal shapes occur. Type 2 inclusions are distributed along
crosscutting trails and as small clusters within the quartz crystals (Fig. 24). Shapes are
semi-regular to highly irregular, with sizes ranging up to 50 µm (Fig. 25b).
cal2
qtz1
1 cm
pyrite/ chalcopyrite
Cal1 (inside qtz1)
authigenic kaolinite
type 1
Fluid inclusions in qtz1 :
type 2
type 3
cal2 filled fractures
host rock fragments
Figure 24. Sketch from part of a thin section showing the textural relations of the
vein minerals and the distribution of fluid inclusion assemblages in qtz1.
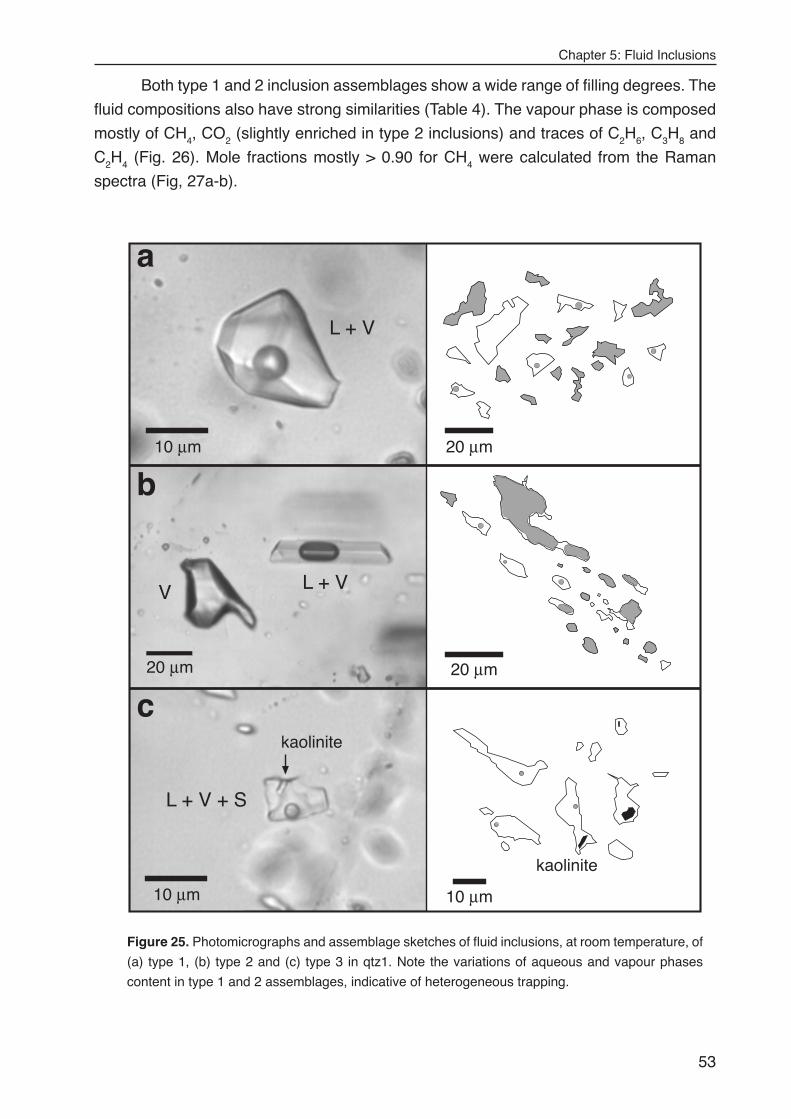
Chapter 5: Fluid Inclusions
53
Both type 1 and 2 inclusion assemblages show a wide range of filling degrees. The
fluid compositions also have strong similarities (Table 4). The vapour phase is composed
mostly of CH4, CO2 (slightly enriched in type 2 inclusions) and traces of C2H6, C3H8 and
C2H4 (Fig. 26). Mole fractions mostly > 0.90 for CH4 were calculated from the Raman
spectra (Fig, 27a-b).
20 µm
a
10 µm
20 µm
b
20 µm
10 µm
c
10 µm
L + V
L + VV
L + V + S
kaolinite
kaolinite
Figure 25. Photomicrographs and assemblage sketches of fluid inclusions, at room temperature, of
(a) type 1, (b) type 2 and (c) type 3 in qtz1. Note the variations of aqueous and vapour phases
content in type 1 and 2 assemblages, indicative of heterogeneous trapping.
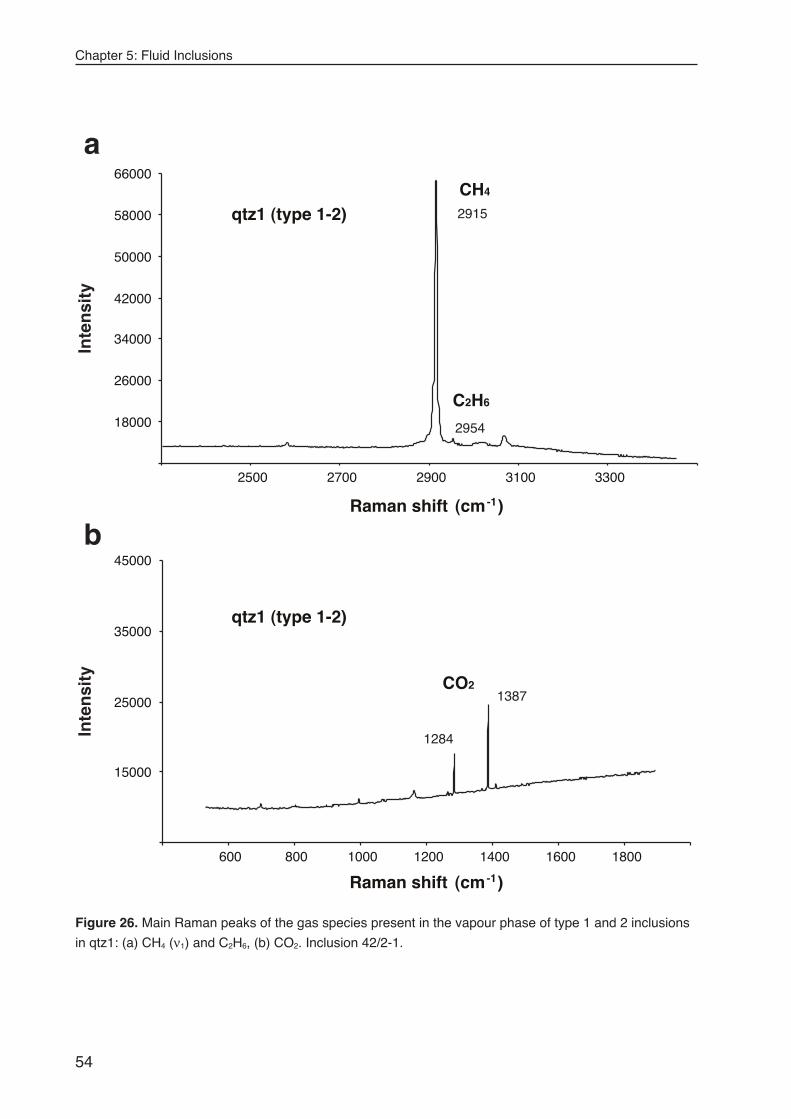
Chapter 5: Fluid Inclusions
54
qtz1 (type 1-2)
18000
26000
34000
42000
50000
58000
66000
2500 2700 2900 3100 3300
2915
2954
CH4
C2H6
a
qtz1 (type 1-2)
15000
25000
35000
45000
600 800 1000 1200 1400 1600 1800
1387
1284
b
CO2
Raman shift (cm-1)
Raman shift (cm-1)
Inte
nsi
tyIn
ten
sity
Figure 26. Main Raman peaks of the gas species present in the vapour phase of type 1 and 2 inclusions
in qtz1: (a) CH4 (ν1) and C2H6, (b) CO2. Inclusion 42/2-1.
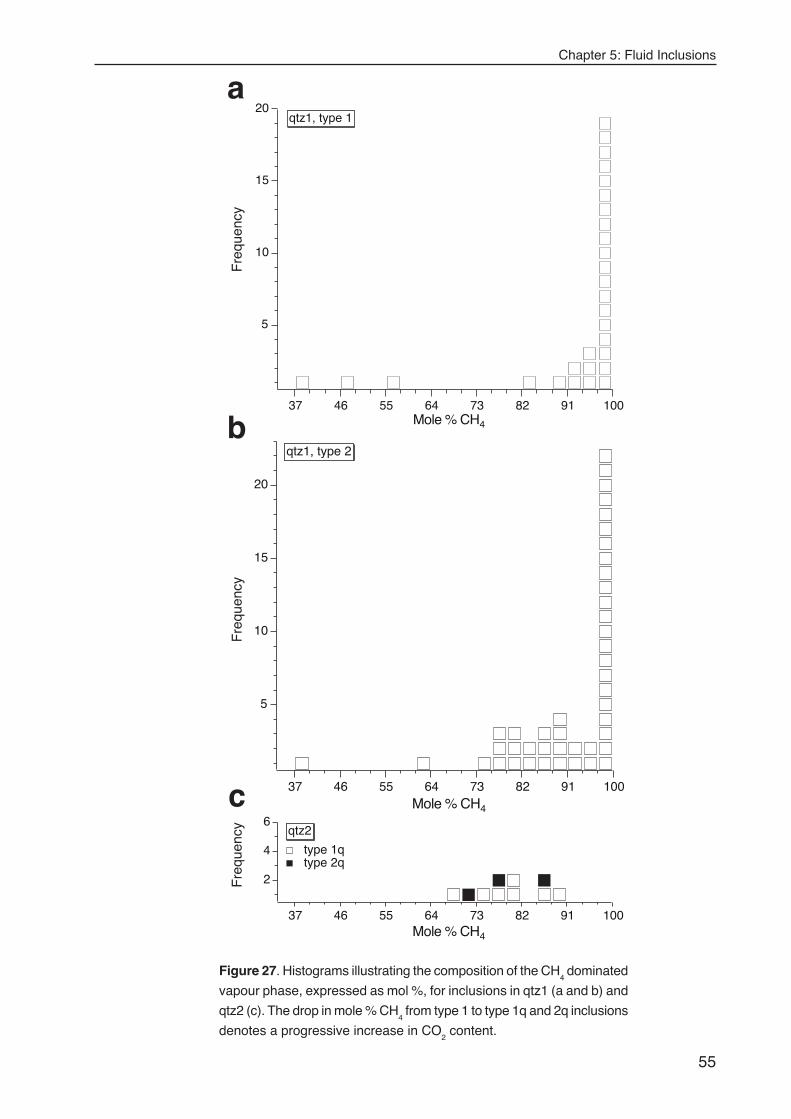
Chapter 5: Fluid Inclusions
55
20
15
10
5
10091827364554637Mole % CH4
qtz1, type 1
20
15
10
5
10091827364554637Mole % CH4
qtz1, type 2
6
4
2
10091827364554637Mole % CH4
qtz2
type 1q type 2q
a
b
c
Fre
quen
cyF
requ
ency
Fre
quen
cy
Figure 27. Histograms illustrating the composition of the CH4 dominated
vapour phase, expressed as mol %, for inclusions in qtz1 (a and b) and
qtz2 (c). The drop in mole % CH4 from type 1 to type 1q and 2q inclusions
denotes a progressive increase in CO2 content.
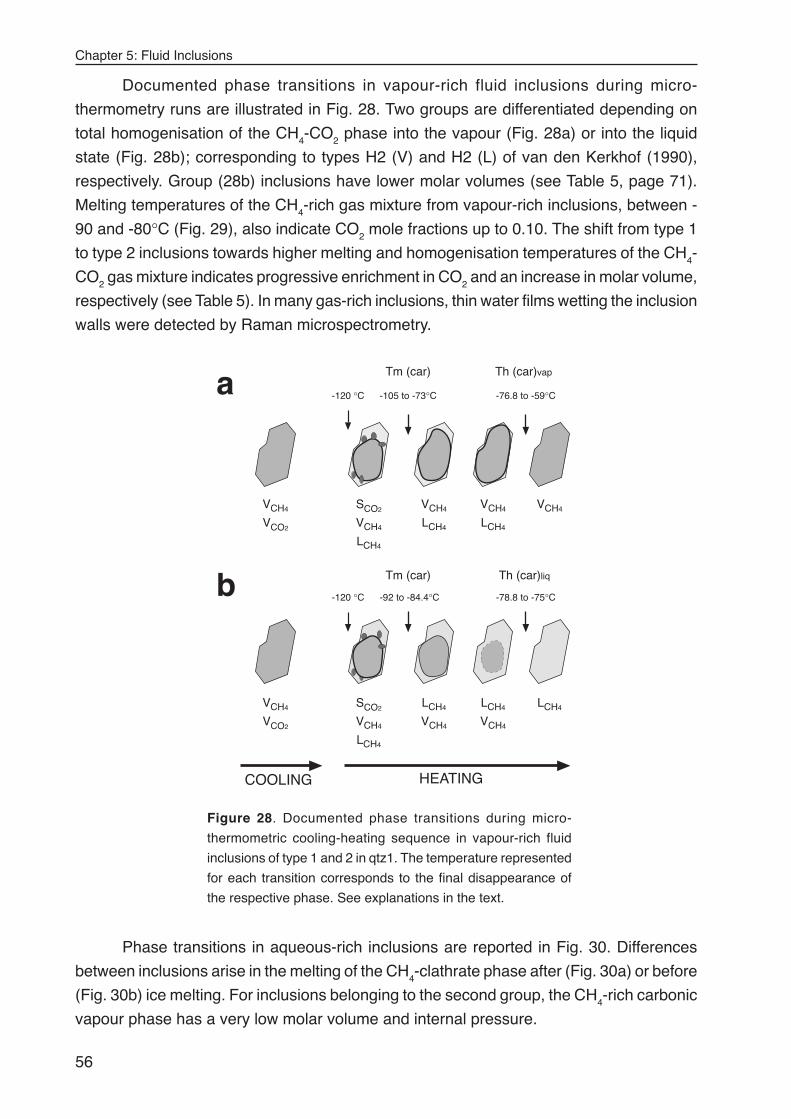
Chapter 5: Fluid Inclusions
56
Documented phase transitions in vapour-rich fluid inclusions during micro-
thermometry runs are illustrated in Fig. 28. Two groups are differentiated depending on
total homogenisation of the CH4-CO2 phase into the vapour (Fig. 28a) or into the liquid
state (Fig. 28b); corresponding to types H2 (V) and H2 (L) of van den Kerkhof (1990),
respectively. Group (28b) inclusions have lower molar volumes (see Table 5, page 71).
Melting temperatures of the CH4-rich gas mixture from vapour-rich inclusions, between -
90 and -80°C (Fig. 29), also indicate CO2 mole fractions up to 0.10. The shift from type 1
to type 2 inclusions towards higher melting and homogenisation temperatures of the CH4-
CO2 gas mixture indicates progressive enrichment in CO2 and an increase in molar volume,
respectively (see Table 5). In many gas-rich inclusions, thin water films wetting the inclusion
walls were detected by Raman microspectrometry.
Phase transitions in aqueous-rich inclusions are reported in Fig. 30. Differences
between inclusions arise in the melting of the CH4-clathrate phase after (Fig. 30a) or before
(Fig. 30b) ice melting. For inclusions belonging to the second group, the CH4-rich carbonic
vapour phase has a very low molar volume and internal pressure.
HEATING
SCO2
Th (car)vapTm (car)
Th (car)liqTm (car)
-78.8 to -75°C-92 to -84.4°C
-105 to -73°C -76.8 to -59°C-120 °C
-120 °C
VCH4
LCH4
SCO2
VCH4
LCH4
VCH4
LCH4
VCH4
LCH4
VCH4
LCH4
VCH4
LCH4
VCH4
LCH4
COOLING
b
VCO2
VCH4
VCO2
VCH4
a
Figure 28. Documented phase transitions during micro-
thermometric cooling-heating sequence in vapour-rich fluid
inclusions of type 1 and 2 in qtz1. The temperature represented
for each transition corresponds to the final disappearance of
the respective phase. See explanations in the text.
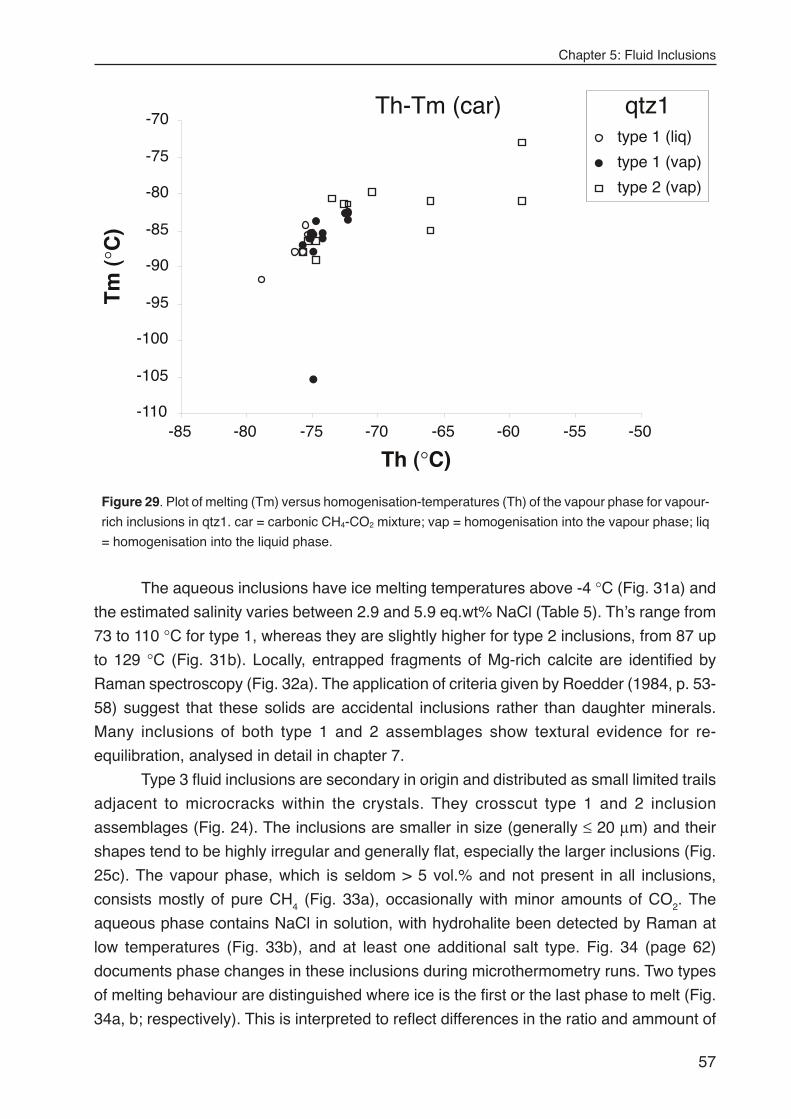
Chapter 5: Fluid Inclusions
57
The aqueous inclusions have ice melting temperatures above -4 °C (Fig. 31a) and
the estimated salinity varies between 2.9 and 5.9 eq.wt% NaCl (Table 5). Th’s range from
73 to 110 °C for type 1, whereas they are slightly higher for type 2 inclusions, from 87 up
to 129 °C (Fig. 31b). Locally, entrapped fragments of Mg-rich calcite are identified by
Raman spectroscopy (Fig. 32a). The application of criteria given by Roedder (1984, p. 53-
58) suggest that these solids are accidental inclusions rather than daughter minerals.
Many inclusions of both type 1 and 2 assemblages show textural evidence for re-
equilibration, analysed in detail in chapter 7.
Type 3 fluid inclusions are secondary in origin and distributed as small limited trails
adjacent to microcracks within the crystals. They crosscut type 1 and 2 inclusion
assemblages (Fig. 24). The inclusions are smaller in size (generally ≤ 20 µm) and their
shapes tend to be highly irregular and generally flat, especially the larger inclusions (Fig.
25c). The vapour phase, which is seldom > 5 vol.% and not present in all inclusions,
consists mostly of pure CH4 (Fig. 33a), occasionally with minor amounts of CO2. The
aqueous phase contains NaCl in solution, with hydrohalite been detected by Raman at
low temperatures (Fig. 33b), and at least one additional salt type. Fig. 34 (page 62)
documents phase changes in these inclusions during microthermometry runs. Two types
of melting behaviour are distinguished where ice is the first or the last phase to melt (Fig.
34a, b; respectively). This is interpreted to reflect differences in the ratio and ammount of
Th-Tm (car) qtz1
-110
-105
-100
-95
-90
-85
-80
-75
-70
-85 -80 -75 -70 -65 -60 -55 -50
Th (°C)
type 1 (liq)
type 1 (vap)
type 2 (vap)
Tm
(°C
)
Figure 29. Plot of melting (Tm) versus homogenisation-temperatures (Th) of the vapour phase for vapour-
rich inclusions in qtz1. car = carbonic CH4-CO2 mixture; vap = homogenisation into the vapour phase; liq
= homogenisation into the liquid phase.
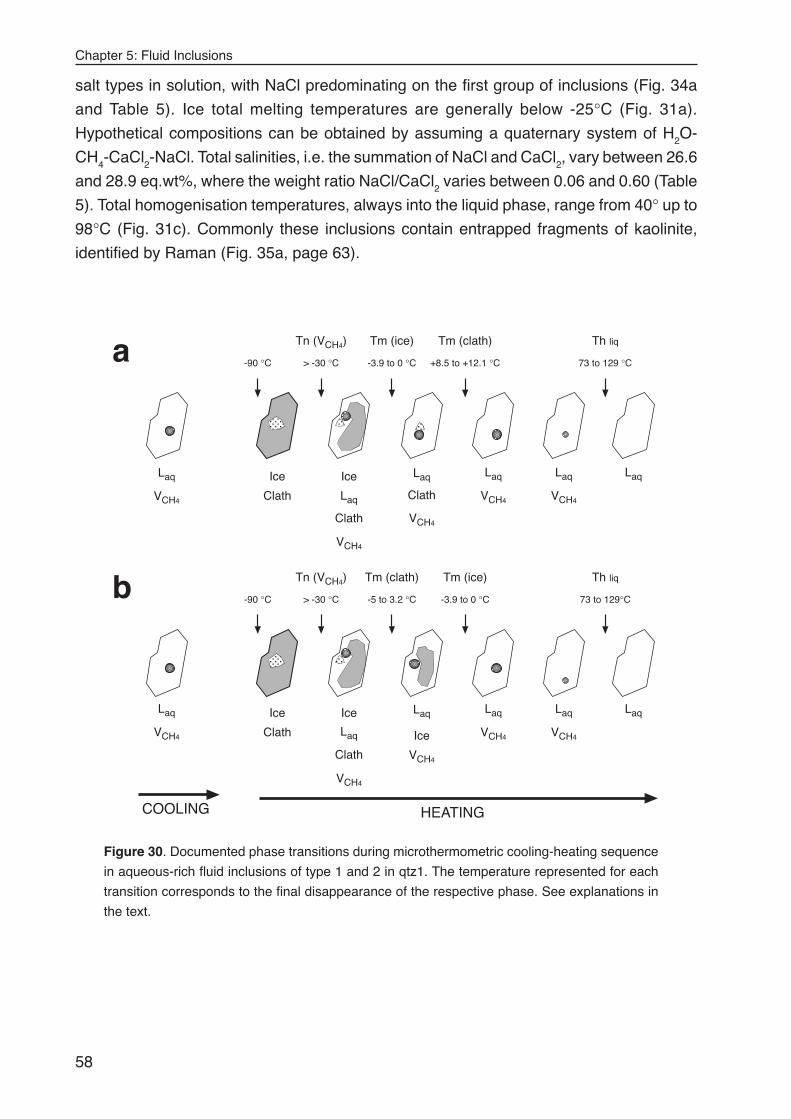
Chapter 5: Fluid Inclusions
58
HEATING
b
Clath
Th liq
73 to 129°C
Tm (clath)
-5 to 3.2 °C
Tm (ice)
-3.9 to 0 °C
Tn (VCH4)
> -30 °C
Laq
Laq
VCH4
Clath
Ice
Ice
Ice
VCH4
Laq Laq Laq
VCH4VCH4
-90 °C
Clath
Th liq
73 to 129 °C
Tm (clath)
+8.5 to +12.1 °C
Tm (ice)
-3.9 to 0 °C
Tn (VCH4)
> -30 °C
Laq
Laq
VCH4
Clath
Ice Ice
VCH4
Laq Laq Laq
VCH4VCH4
-90 °C
Clath
a
Laq
VCH4
Laq
VCH4
COOLING
Figure 30. Documented phase transitions during microthermometric cooling-heating sequence
in aqueous-rich fluid inclusions of type 1 and 2 in qtz1. The temperature represented for each
transition corresponds to the final disappearance of the respective phase. See explanations in
the text.
salt types in solution, with NaCl predominating on the first group of inclusions (Fig. 34a
and Table 5). Ice total melting temperatures are generally below -25°C (Fig. 31a).
Hypothetical compositions can be obtained by assuming a quaternary system of H2O-
CH4-CaCl2-NaCl. Total salinities, i.e. the summation of NaCl and CaCl2, vary between 26.6
and 28.9 eq.wt%, where the weight ratio NaCl/CaCl2 varies between 0.06 and 0.60 (Table
5). Total homogenisation temperatures, always into the liquid phase, range from 40° up to
98°C (Fig. 31c). Commonly these inclusions contain entrapped fragments of kaolinite,
identified by Raman (Fig. 35a, page 63).
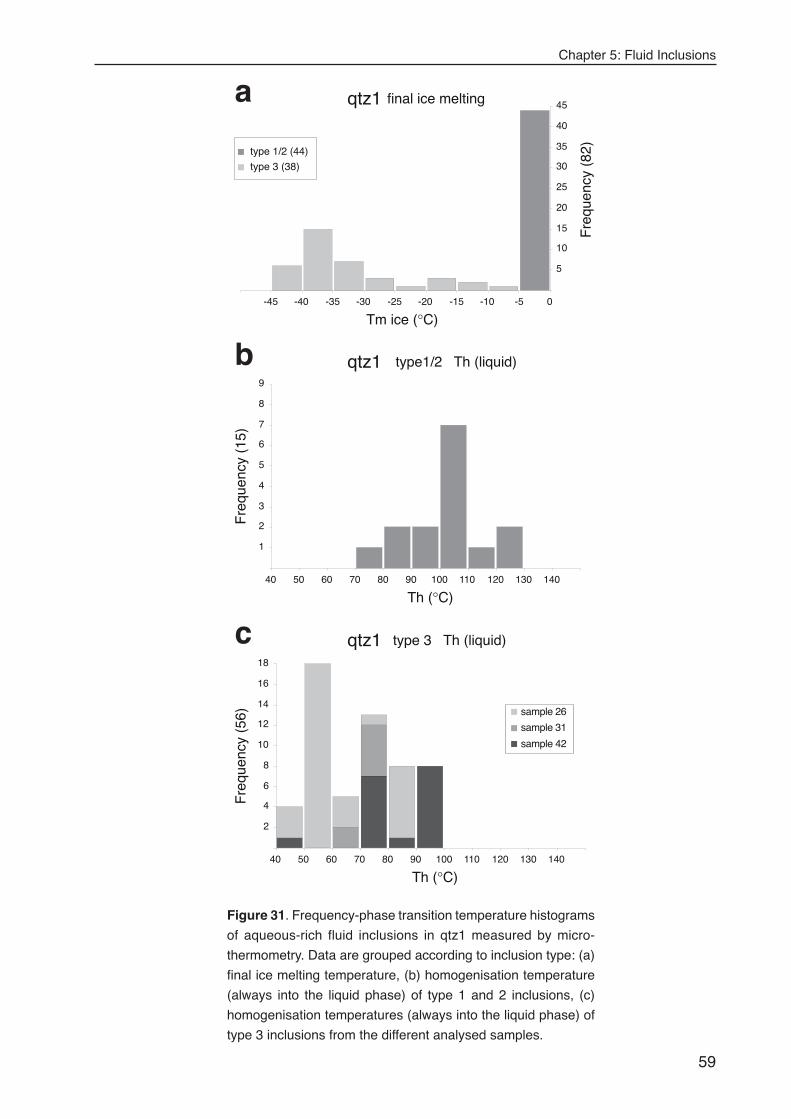
Chapter 5: Fluid Inclusions
59
2
4
6
8
10
12
14
16
18
40 50 60 70 80 90 100 110 120 130 140
Th (°C)
Fre
quen
cy (
56) sample 26
sample 31
sample 42
c
a
5
10
15
20
25
30
35
40
45
0-5-10-15-20-25-30-35-40-45
Tm ice (°C)
Fre
quen
cy (
82)
type 1/2 (44)
type 3 (38)
1
2
3
4
5
6
7
8
9
40 50 60 70 80 90 100 110 120 130 140
Th (°C)
Fre
quen
cy (
15)
b
qtz1 final ice melting
qtz1 type1/2 Th (liquid)
qtz1 type 3 Th (liquid)
Figure 31. Frequency-phase transition temperature histograms
of aqueous-rich fluid inclusions in qtz1 measured by micro-
thermometry. Data are grouped according to inclusion type: (a)
final ice melting temperature, (b) homogenisation temperature
(always into the liquid phase) of type 1 and 2 inclusions, (c)
homogenisation temperatures (always into the liquid phase) of
type 3 inclusions from the different analysed samples.
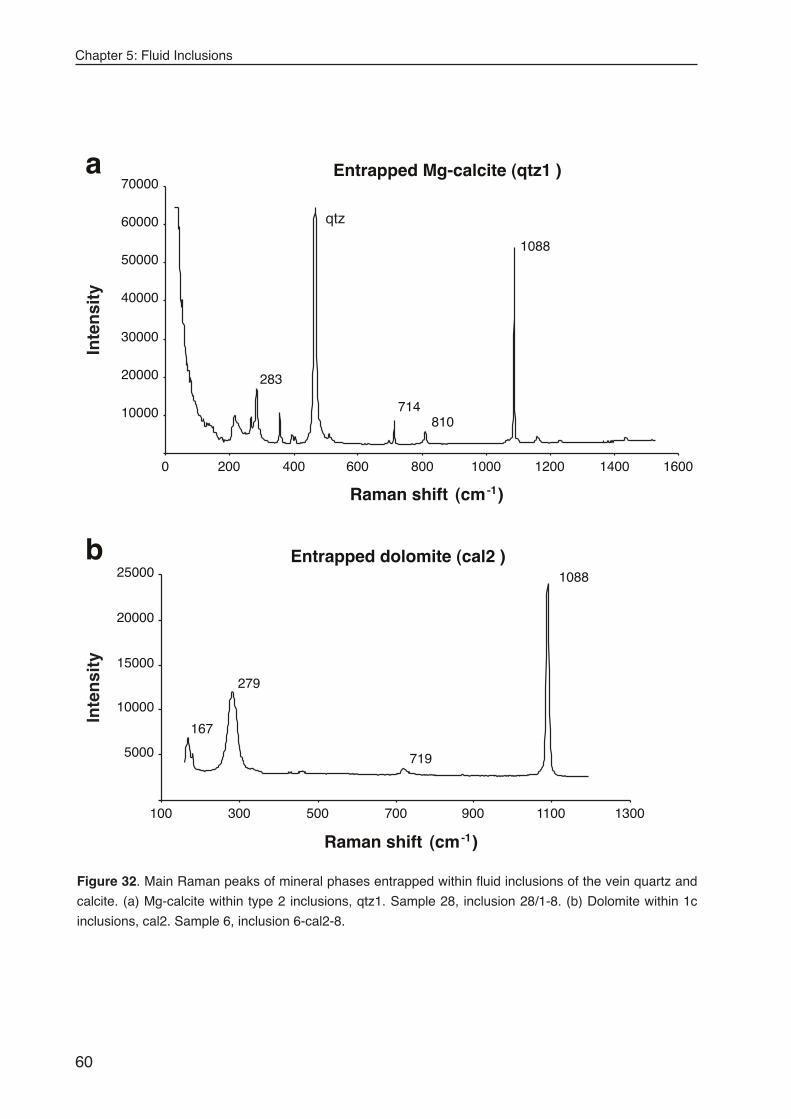
Chapter 5: Fluid Inclusions
60
Entrapped dolomite (cal2 )
5000
10000
15000
20000
25000
100 300 500 700 900 1100 1300
167
279
719
1088
b
Entrapped Mg-calcite (qtz1 )
10000
20000
30000
40000
50000
60000
70000
0 200 400 600 800 1000 1200 1400 1600
1088
714
283
810
a
Raman shift (cm-1)
Raman shift (cm-1)
qtz
Inte
nsi
tyIn
ten
sity
Figure 32. Main Raman peaks of mineral phases entrapped within fluid inclusions of the vein quartz and
calcite. (a) Mg-calcite within type 2 inclusions, qtz1. Sample 28, inclusion 28/1-8. (b) Dolomite within 1c
inclusions, cal2. Sample 6, inclusion 6-cal2-8.
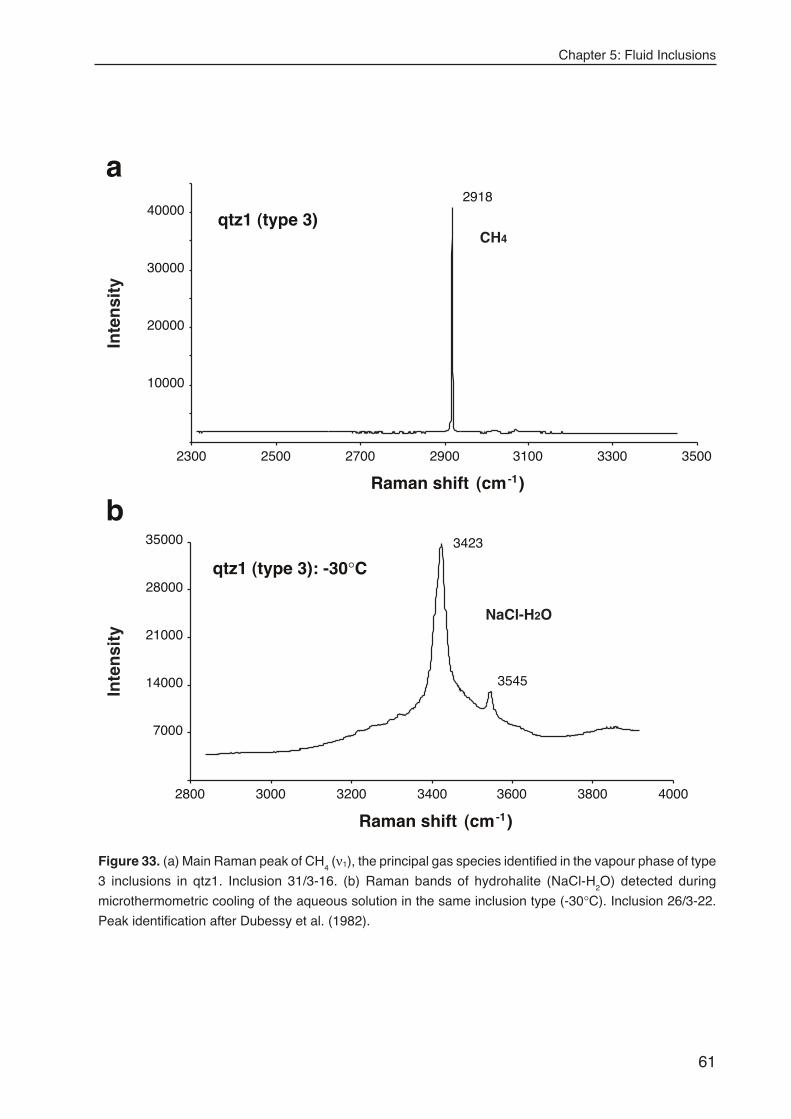
Chapter 5: Fluid Inclusions
61
10000
20000
30000
40000
2300 2500 2700 2900 3100 3300 3500
CH4
2918
qtz1 (type 3)
a
7000
14000
21000
28000
35000
2800 3000 3200 3400 3600 3800 4000
3423
3545
NaCl-H2O
qtz1 (type 3): -30°C
b
Raman shift (cm-1)
Raman shift (cm-1)
Inte
nsi
tyIn
ten
sity
Figure 33. (a) Main Raman peak of CH4 (ν1), the principal gas species identified in the vapour phase of type
3 inclusions in qtz1. Inclusion 31/3-16. (b) Raman bands of hydrohalite (NaCl-H2O) detected during
microthermometric cooling of the aqueous solution in the same inclusion type (-30°C). Inclusion 26/3-22.
Peak identification after Dubessy et al. (1982).
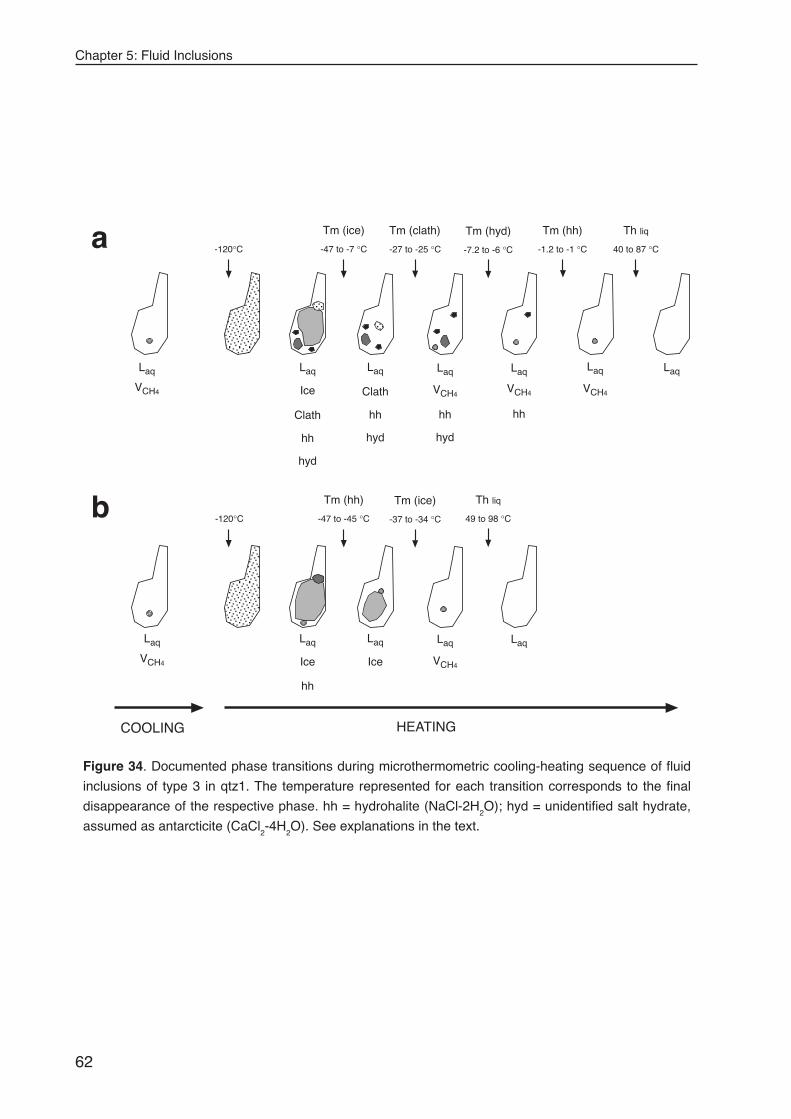
Chapter 5: Fluid Inclusions
62
HEATING
Laq
Ice
Clath
hh
hyd
Laq
VCH4
Laq
VCH4
Laq
VCH4
LaqLaq
Clath
hh
hyd
Tm (ice)
-47 to -7 °C
Tm (clath)
-27 to -25 °C
Tm (hyd)
-7.2 to -6 °C
Tm (hh)
-1.2 to -1 °C
Th liq
40 to 87 °C
hh
hyd
hh
Laq
Ice
hh
Laq
VCH4
LaqLaq
Ice
Tm (hh)
-47 to -45 °C
Tm (ice)
-37 to -34 °C
Th liq
49 to 98 °C
COOLING
Laq
VCH4
Laq
VCH4
-120°C
-120°C
a
b
Figure 34. Documented phase transitions during microthermometric cooling-heating sequence of fluid
inclusions of type 3 in qtz1. The temperature represented for each transition corresponds to the final
disappearance of the respective phase. hh = hydrohalite (NaCl-2H2O); hyd = unidentified salt hydrate,
assumed as antarcticite (CaCl2-4H
2O). See explanations in the text.
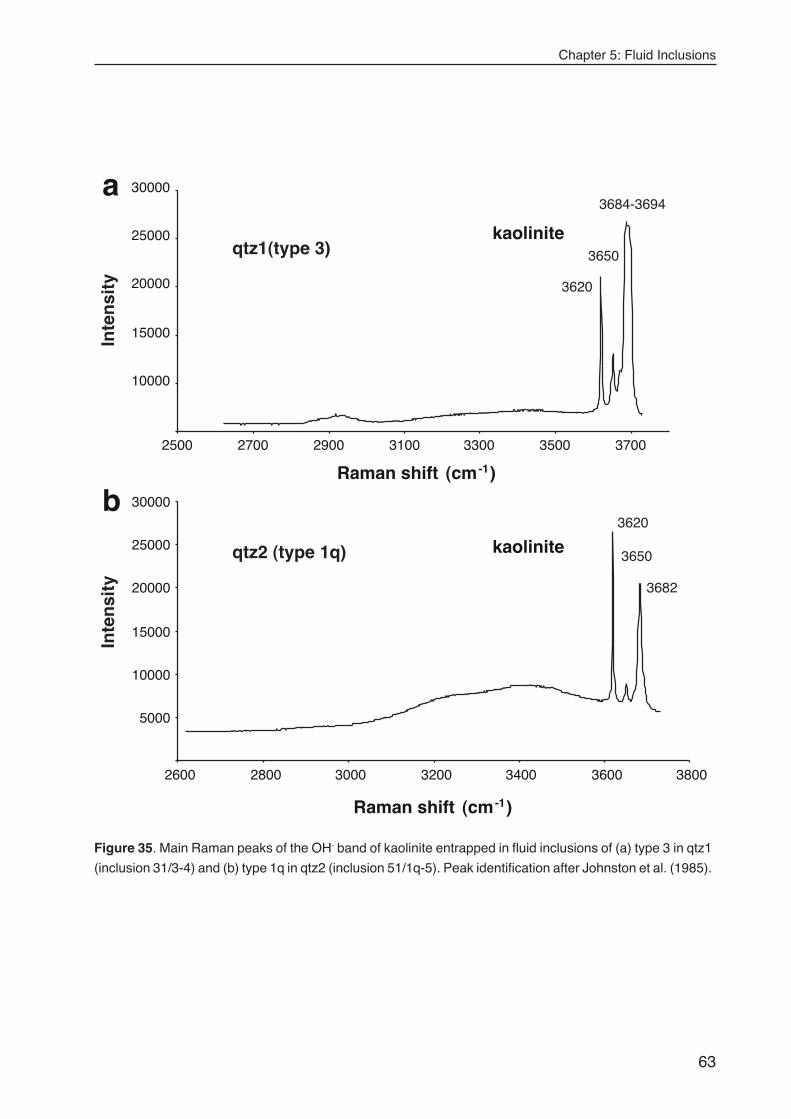
Chapter 5: Fluid Inclusions
63
5000
10000
15000
20000
25000
30000
2600 2800 3000 3200 3400 3600 3800
3620
3682
3650qtz2 (type 1q) kaolinite
b
a
qtz1(type 3)
10000
15000
20000
25000
30000
2500 2700 2900 3100 3300 3500 3700
kaolinite
3620
3650
3684-3694
Raman shift (cm-1)
Raman shift (cm-1)
Inte
nsi
tyIn
ten
sity
Figure 35. Main Raman peaks of the OH- band of kaolinite entrapped in fluid inclusions of (a) type 3 in qtz1
(inclusion 31/3-4) and (b) type 1q in qtz2 (inclusion 51/1q-5). Peak identification after Johnston et al. (1985).
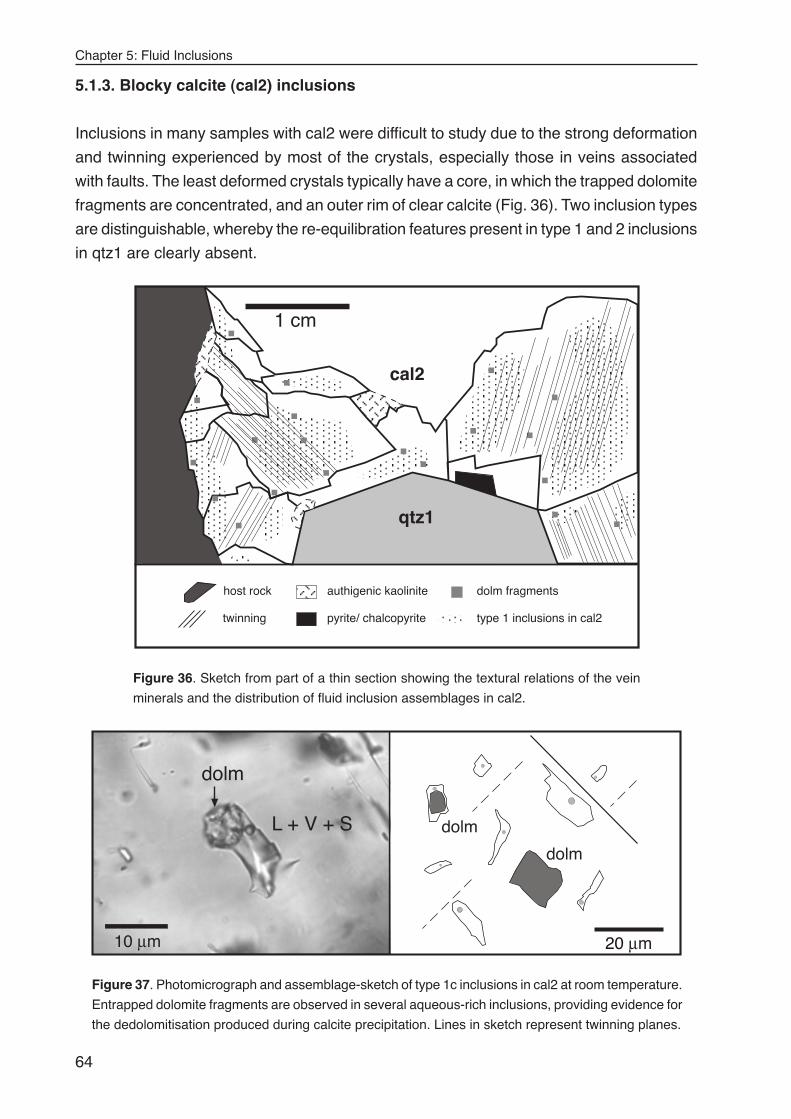
Chapter 5: Fluid Inclusions
64
5.1.3. Blocky calcite (cal2) inclusions
Inclusions in many samples with cal2 were difficult to study due to the strong deformation
and twinning experienced by most of the crystals, especially those in veins associated
with faults. The least deformed crystals typically have a core, in which the trapped dolomite
fragments are concentrated, and an outer rim of clear calcite (Fig. 36). Two inclusion types
are distinguishable, whereby the re-equilibration features present in type 1 and 2 inclusions
in qtz1 are clearly absent.
qtz1
cal2
authigenic kaolinitehost rock dolm fragments
pyrite/ chalcopyrite
1 cm
twinning type 1 inclusions in cal2
Figure 36. Sketch from part of a thin section showing the textural relations of the vein
minerals and the distribution of fluid inclusion assemblages in cal2.
L + V + S
dolm
20 µm10 µm
dolm
dolm
Figure 37. Photomicrograph and assemblage-sketch of type 1c inclusions in cal2 at room temperature.
Entrapped dolomite fragments are observed in several aqueous-rich inclusions, providing evidence for
the dedolomitisation produced during calcite precipitation. Lines in sketch represent twinning planes.
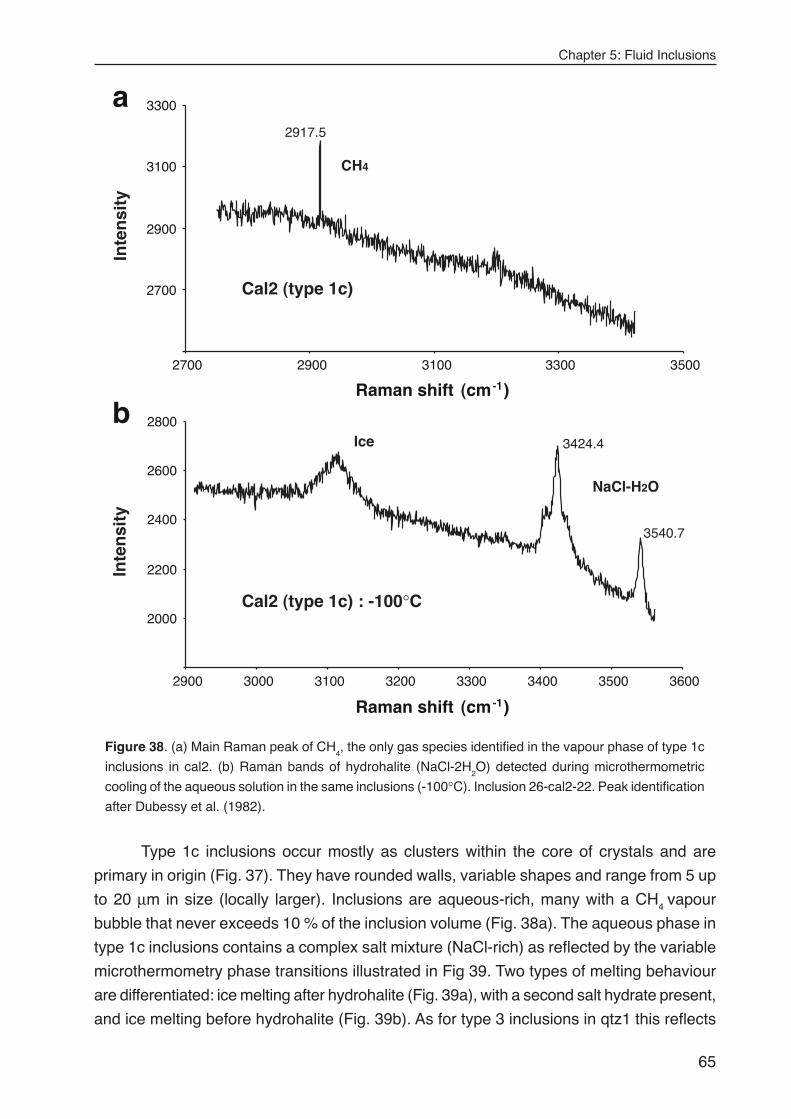
Chapter 5: Fluid Inclusions
65
Type 1c inclusions occur mostly as clusters within the core of crystals and are
primary in origin (Fig. 37). They have rounded walls, variable shapes and range from 5 up
to 20 µm in size (locally larger). Inclusions are aqueous-rich, many with a CH4 vapour
bubble that never exceeds 10 % of the inclusion volume (Fig. 38a). The aqueous phase in
type 1c inclusions contains a complex salt mixture (NaCl-rich) as reflected by the variable
microthermometry phase transitions illustrated in Fig 39. Two types of melting behaviour
are differentiated: ice melting after hydrohalite (Fig. 39a), with a second salt hydrate present,
and ice melting before hydrohalite (Fig. 39b). As for type 3 inclusions in qtz1 this reflects
2700
2900
3100
3300
2700 2900 3100 3300 3500
CH4
Cal2 (type 1c)
2000
2200
2400
2600
2800
2900 3000 3100 3200 3300 3400 3500 3600
Ice
NaCl-H2O
Cal2 (type 1c) : -100°C
b
a
Raman shift (cm-1)
Raman shift (cm-1)
Inte
nsi
ty2917.5
Inte
nsi
ty
3424.4
3540.7
Figure 38. (a) Main Raman peak of CH4, the only gas species identified in the vapour phase of type 1c
inclusions in cal2. (b) Raman bands of hydrohalite (NaCl-2H2O) detected during microthermometric
cooling of the aqueous solution in the same inclusions (-100°C). Inclusion 26-cal2-22. Peak identification
after Dubessy et al. (1982).
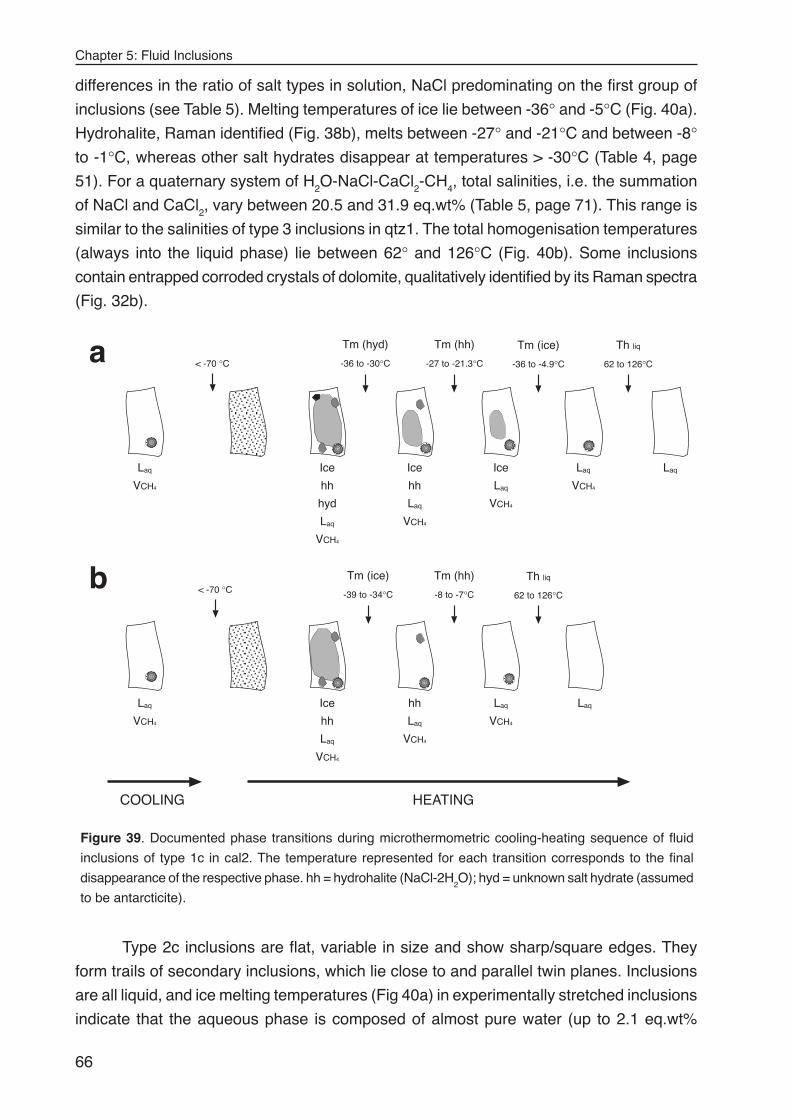
Chapter 5: Fluid Inclusions
66
differences in the ratio of salt types in solution, NaCl predominating on the first group of
inclusions (see Table 5). Melting temperatures of ice lie between -36° and -5°C (Fig. 40a).
Hydrohalite, Raman identified (Fig. 38b), melts between -27° and -21°C and between -8°to -1°C, whereas other salt hydrates disappear at temperatures > -30°C (Table 4, page
51). For a quaternary system of H2O-NaCl-CaCl2-CH4, total salinities, i.e. the summation
of NaCl and CaCl2, vary between 20.5 and 31.9 eq.wt% (Table 5, page 71). This range is
similar to the salinities of type 3 inclusions in qtz1. The total homogenisation temperatures
(always into the liquid phase) lie between 62° and 126°C (Fig. 40b). Some inclusions
contain entrapped corroded crystals of dolomite, qualitatively identified by its Raman spectra
(Fig. 32b).
Type 2c inclusions are flat, variable in size and show sharp/square edges. They
form trails of secondary inclusions, which lie close to and parallel twin planes. Inclusions
are all liquid, and ice melting temperatures (Fig 40a) in experimentally stretched inclusions
indicate that the aqueous phase is composed of almost pure water (up to 2.1 eq.wt%
Tm (ice)
-39 to -34°C
Tm (hh)
-8 to -7°C
Th liq
62 to 126°C< -70 °C
Tm (hyd)
-36 to -30°C
Tm (hh)
-27 to -21.3°C
Tm (ice)
-36 to -4.9°C< -70 °C
Th liq
62 to 126°C
Ice
hh
hyd
Laq
Ice Ice
hh
hh
VCH4
VCH4
VCH4
VCH4
VCH4
VCH4
Laq
Laq
Laq
Laq
Laq Laq
Laq
Ice
hh
Laq
VCH4
HEATINGCOOLING
VCH4
Laq
VCH4
Laq
a
b
Figure 39. Documented phase transitions during microthermometric cooling-heating sequence of fluid
inclusions of type 1c in cal2. The temperature represented for each transition corresponds to the final
disappearance of the respective phase. hh = hydrohalite (NaCl-2H2O); hyd = unknown salt hydrate (assumed
to be antarcticite).
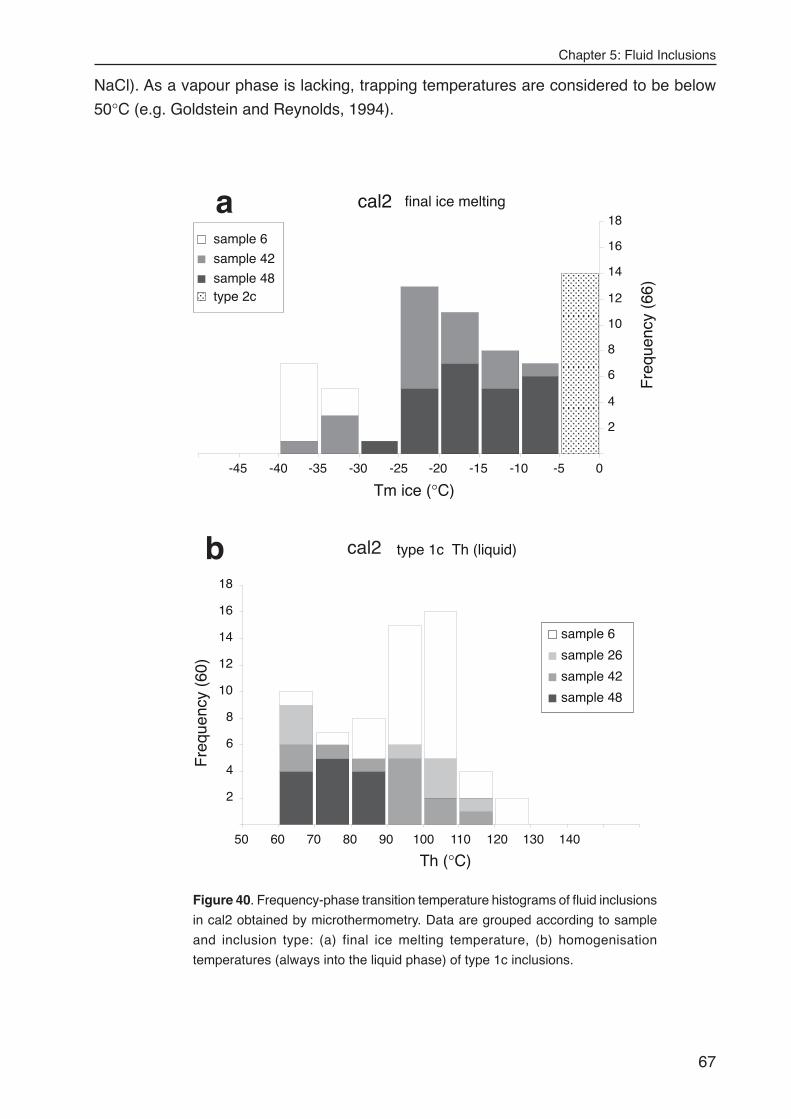
Chapter 5: Fluid Inclusions
67
NaCl). As a vapour phase is lacking, trapping temperatures are considered to be below
50°C (e.g. Goldstein and Reynolds, 1994).
type 1c Th (liquid)
2
4
6
8
10
12
14
16
18
50 60 70 80 90 100 110 120 130 140
Th (°C)
Fre
quen
cy (
60)
sample 6
sample 26
sample 42
sample 48
b cal2
cal2 final ice melting
2
4
6
8
10
12
14
16
18
0-5-10-15-20-25-30-35-40-45
Tm ice (°C)
Fre
quen
cy (
66)
sample 6
sample 42
sample 48type 2c
a
Figure 40. Frequency-phase transition temperature histograms of fluid inclusions
in cal2 obtained by microthermometry. Data are grouped according to sample
and inclusion type: (a) final ice melting temperature, (b) homogenisation
temperatures (always into the liquid phase) of type 1c inclusions.
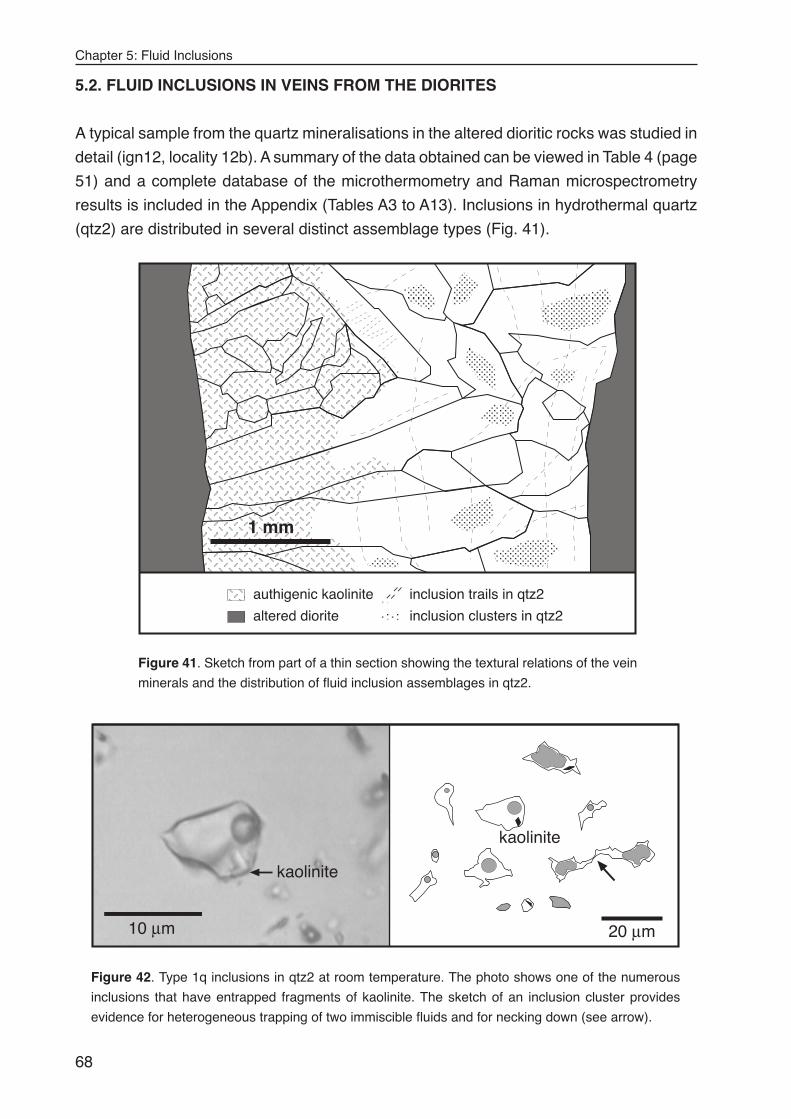
Chapter 5: Fluid Inclusions
68
5.2. FLUID INCLUSIONS IN VEINS FROM THE DIORITES
A typical sample from the quartz mineralisations in the altered dioritic rocks was studied in
detail (ign12, locality 12b). A summary of the data obtained can be viewed in Table 4 (page
51) and a complete database of the microthermometry and Raman microspectrometry
results is included in the Appendix (Tables A3 to A13). Inclusions in hydrothermal quartz
(qtz2) are distributed in several distinct assemblage types (Fig. 41).
authigenic kaolinite inclusion trails in qtz2
altered diorite inclusion clusters in qtz2
1 mm
Figure 41. Sketch from part of a thin section showing the textural relations of the vein
minerals and the distribution of fluid inclusion assemblages in qtz2.
20 µm10 µm
kaolinite
kaolinite
Figure 42. Type 1q inclusions in qtz2 at room temperature. The photo shows one of the numerous
inclusions that have entrapped fragments of kaolinite. The sketch of an inclusion cluster provides
evidence for heterogeneous trapping of two immiscible fluids and for necking down (see arrow).
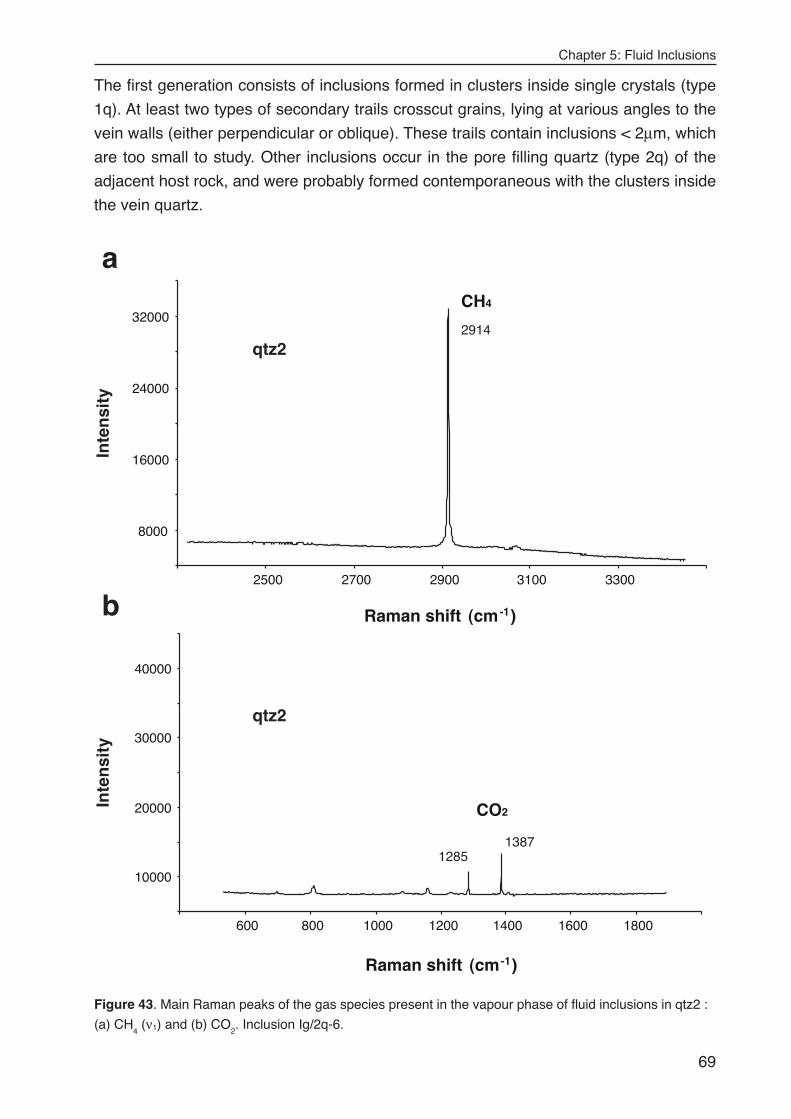
Chapter 5: Fluid Inclusions
69
The first generation consists of inclusions formed in clusters inside single crystals (type
1q). At least two types of secondary trails crosscut grains, lying at various angles to the
vein walls (either perpendicular or oblique). These trails contain inclusions < 2µm, which
are too small to study. Other inclusions occur in the pore filling quartz (type 2q) of the
adjacent host rock, and were probably formed contemporaneous with the clusters inside
the vein quartz.
qtz2
8000
16000
24000
32000
2500 2700 2900 3100 3300
2914
a
b
qtz2
10000
20000
30000
40000
600 800 1000 1200 1400 1600 1800
13871285
CH4
CO2
Raman shift (cm-1)
Raman shift (cm-1)
Inte
nsi
tyIn
ten
sity
Figure 43. Main Raman peaks of the gas species present in the vapour phase of fluid inclusions in qtz2 :
(a) CH4 (ν1) and (b) CO
2. Inclusion Ig/2q-6.
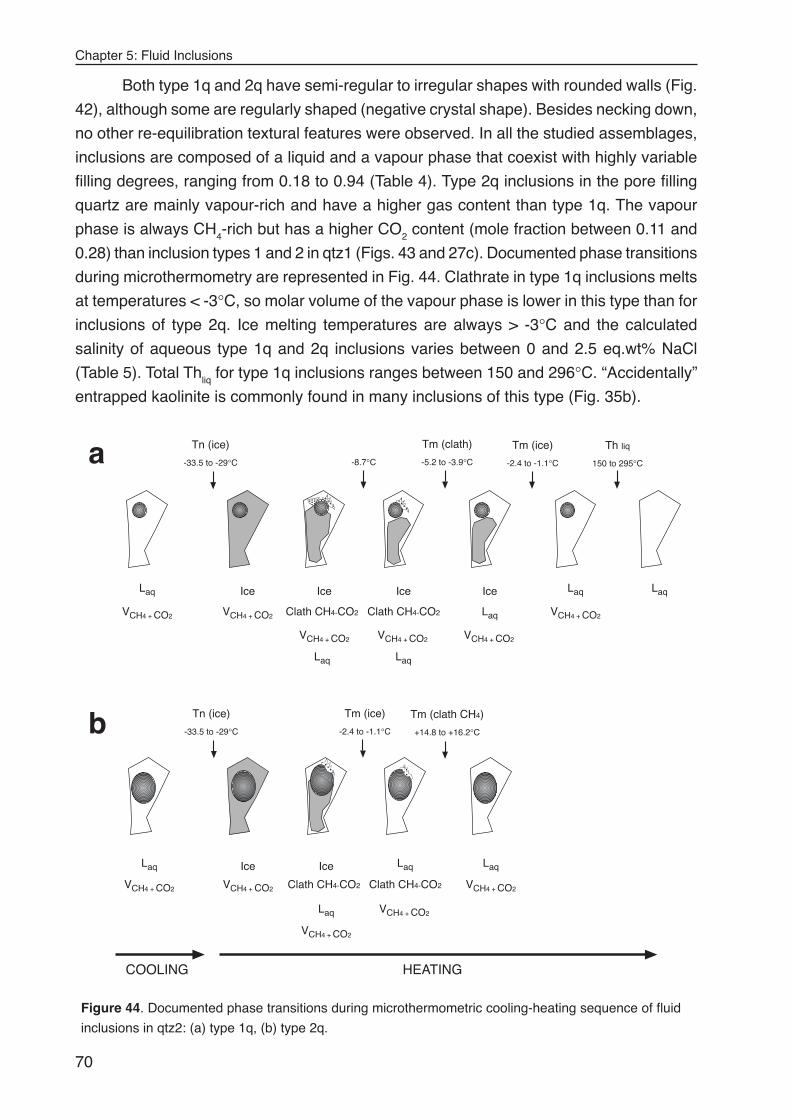
Chapter 5: Fluid Inclusions
70
Both type 1q and 2q have semi-regular to irregular shapes with rounded walls (Fig.
42), although some are regularly shaped (negative crystal shape). Besides necking down,
no other re-equilibration textural features were observed. In all the studied assemblages,
inclusions are composed of a liquid and a vapour phase that coexist with highly variable
filling degrees, ranging from 0.18 to 0.94 (Table 4). Type 2q inclusions in the pore filling
quartz are mainly vapour-rich and have a higher gas content than type 1q. The vapour
phase is always CH4-rich but has a higher CO2 content (mole fraction between 0.11 and
0.28) than inclusion types 1 and 2 in qtz1 (Figs. 43 and 27c). Documented phase transitions
during microthermometry are represented in Fig. 44. Clathrate in type 1q inclusions melts
at temperatures < -3°C, so molar volume of the vapour phase is lower in this type than for
inclusions of type 2q. Ice melting temperatures are always > -3°C and the calculated
salinity of aqueous type 1q and 2q inclusions varies between 0 and 2.5 eq.wt% NaCl
(Table 5). Total Thliq for type 1q inclusions ranges between 150 and 296°C. “Accidentally”
entrapped kaolinite is commonly found in many inclusions of this type (Fig. 35b).
Laq
Laq Laq
VCH4 + CO2
VCH4 + CO2VCH4 + CO2 VCH4 + CO2
Ice Ice Ice
Clath CH4-CO2Clath CH4-CO2
-8.7°C
Tm (clath)
-5.2 to -3.9°C
Th liq
150 to 295°C
Tn (ice)
-33.5 to -29°C
Laq Laq
Tm (ice)
-2.4 to -1.1°C
Laq
VCH4 + CO2 VCH4 + CO2
Ice
a
b
Laq
VCH4 + CO2
VCH4 + CO2
VCH4 + CO2
Ice
Clath CH4-CO2Clath CH4-CO2
Tm (ice)
-2.4 to -1.1°C
Tm (clath CH4)
+14.8 to +16.2°C
HEATING
Laq
Laq
Tn (ice)
-33.5 to -29°C
Laq
VCH4 + CO2
COOLING
VCH4 + CO2
Ice
Figure 44. Documented phase transitions during microthermometric cooling-heating sequence of fluid
inclusions in qtz2: (a) type 1q, (b) type 2q.
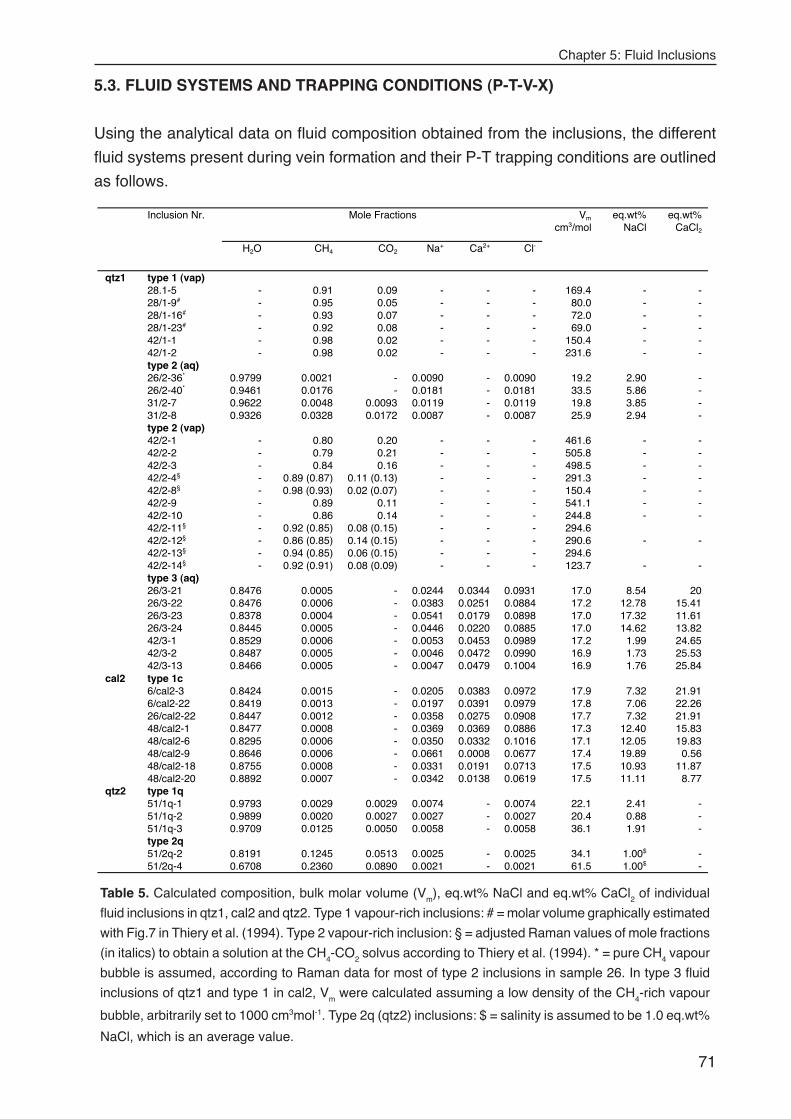
Chapter 5: Fluid Inclusions
71
5.3. FLUID SYSTEMS AND TRAPPING CONDITIONS (P-T-V-X)
Using the analytical data on fluid composition obtained from the inclusions, the different
fluid systems present during vein formation and their P-T trapping conditions are outlined
as follows.
Table 5. Calculated composition, bulk molar volume (Vm), eq.wt% NaCl and eq.wt% CaCl
2 of individual
fluid inclusions in qtz1, cal2 and qtz2. Type 1 vapour-rich inclusions: # = molar volume graphically estimated
with Fig.7 in Thiery et al. (1994). Type 2 vapour-rich inclusion: § = adjusted Raman values of mole fractions
(in italics) to obtain a solution at the CH4-CO
2 solvus according to Thiery et al. (1994). * = pure CH
4 vapour
bubble is assumed, according to Raman data for most of type 2 inclusions in sample 26. In type 3 fluid
inclusions of qtz1 and type 1 in cal2, Vm were calculated assuming a low density of the CH
4-rich vapour
bubble, arbitrarily set to 1000 cm3mol-1. Type 2q (qtz2) inclusions: $ = salinity is assumed to be 1.0 eq.wt%
NaCl, which is an average value.
Inclusion Nr. Mole Fractions Vm
cm3/moleq.wt%
NaCleq.wt%
CaCl2
H2O CH4 CO2 Na+ Ca2+ Cl-
qtz1 type 1 (vap)28.1-5 - 0.91 0.09 - - - 169.4 - -28/1-9# - 0.95 0.05 - - - 80.0 - -28/1-16# - 0.93 0.07 - - - 72.0 - -28/1-23# - 0.92 0.08 - - - 69.0 - -42/1-1 - 0.98 0.02 - - - 150.4 - -42/1-2 - 0.98 0.02 - - - 231.6 - -type 2 (aq)26/2-36* 0.9799 0.0021 - 0.0090 - 0.0090 19.2 2.90 -26/2-40* 0.9461 0.0176 - 0.0181 - 0.0181 33.5 5.86 -31/2-7 0.9622 0.0048 0.0093 0.0119 - 0.0119 19.8 3.85 -31/2-8 0.9326 0.0328 0.0172 0.0087 - 0.0087 25.9 2.94 -type 2 (vap)42/2-1 - 0.80 0.20 - - - 461.6 - -42/2-2 - 0.79 0.21 - - - 505.8 - -42/2-3 - 0.84 0.16 - - - 498.5 - -42/2-4§ - 0.89 (0.87) 0.11 (0.13) - - - 291.3 - -42/2-8§ - 0.98 (0.93) 0.02 (0.07) - - - 150.4 - -42/2-9 - 0.89 0.11 - - - 541.1 - -42/2-10 - 0.86 0.14 - - - 244.8 - -42/2-11§ - 0.92 (0.85) 0.08 (0.15) - - - 294.642/2-12§ - 0.86 (0.85) 0.14 (0.15) - - - 290.6 - -42/2-13§ - 0.94 (0.85) 0.06 (0.15) - - - 294.642/2-14§ - 0.92 (0.91) 0.08 (0.09) - - - 123.7 - -type 3 (aq)26/3-21 0.8476 0.0005 - 0.0244 0.0344 0.0931 17.0 8.54 2026/3-22 0.8476 0.0006 - 0.0383 0.0251 0.0884 17.2 12.78 15.4126/3-23 0.8378 0.0004 - 0.0541 0.0179 0.0898 17.0 17.32 11.6126/3-24 0.8445 0.0005 - 0.0446 0.0220 0.0885 17.0 14.62 13.8242/3-1 0.8529 0.0006 - 0.0053 0.0453 0.0989 17.2 1.99 24.6542/3-2 0.8487 0.0005 - 0.0046 0.0472 0.0990 16.9 1.73 25.5342/3-13 0.8466 0.0005 - 0.0047 0.0479 0.1004 16.9 1.76 25.84
cal2 type 1c6/cal2-3 0.8424 0.0015 - 0.0205 0.0383 0.0972 17.9 7.32 21.916/cal2-22 0.8419 0.0013 - 0.0197 0.0391 0.0979 17.8 7.06 22.2626/cal2-22 0.8447 0.0012 - 0.0358 0.0275 0.0908 17.7 7.32 21.9148/cal2-1 0.8477 0.0008 - 0.0369 0.0369 0.0886 17.3 12.40 15.8348/cal2-6 0.8295 0.0006 - 0.0350 0.0332 0.1016 17.1 12.05 19.8348/cal2-9 0.8646 0.0006 - 0.0661 0.0008 0.0677 17.4 19.89 0.5648/cal2-18 0.8755 0.0008 - 0.0331 0.0191 0.0713 17.5 10.93 11.8748/cal2-20 0.8892 0.0007 - 0.0342 0.0138 0.0619 17.5 11.11 8.77
qtz2 type 1q51/1q-1 0.9793 0.0029 0.0029 0.0074 - 0.0074 22.1 2.41 -51/1q-2 0.9899 0.0020 0.0027 0.0027 - 0.0027 20.4 0.88 -51/1q-3 0.9709 0.0125 0.0050 0.0058 - 0.0058 36.1 1.91 -type 2q51/2q-2 0.8191 0.1245 0.0513 0.0025 - 0.0025 34.1 1.00$ -51/2q-4 0.6708 0.2360 0.0890 0.0021 - 0.0021 61.5 1.00$ -
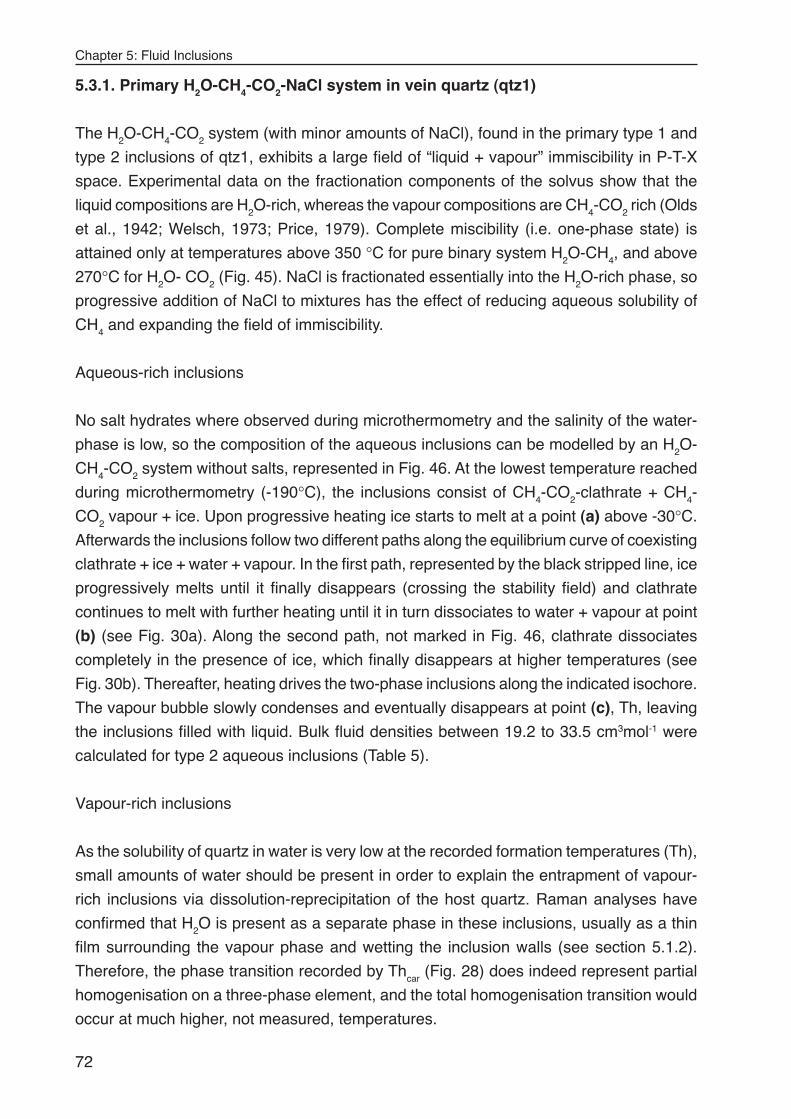
Chapter 5: Fluid Inclusions
72
5.3.1. Primary H2O-CH4-CO2-NaCl system in vein quartz (qtz1)
The H2O-CH4-CO2 system (with minor amounts of NaCl), found in the primary type 1 and
type 2 inclusions of qtz1, exhibits a large field of “liquid + vapour” immiscibility in P-T-X
space. Experimental data on the fractionation components of the solvus show that the
liquid compositions are H2O-rich, whereas the vapour compositions are CH4-CO2 rich (Olds
et al., 1942; Welsch, 1973; Price, 1979). Complete miscibility (i.e. one-phase state) is
attained only at temperatures above 350 °C for pure binary system H2O-CH4, and above
270°C for H2O- CO2 (Fig. 45). NaCl is fractionated essentially into the H2O-rich phase, so
progressive addition of NaCl to mixtures has the effect of reducing aqueous solubility of
CH4 and expanding the field of immiscibility.
Aqueous-rich inclusions
No salt hydrates where observed during microthermometry and the salinity of the water-
phase is low, so the composition of the aqueous inclusions can be modelled by an H2O-
CH4-CO2 system without salts, represented in Fig. 46. At the lowest temperature reached
during microthermometry (-190°C), the inclusions consist of CH4-CO2-clathrate + CH4-
CO2 vapour + ice. Upon progressive heating ice starts to melt at a point (a) above -30°C.
Afterwards the inclusions follow two different paths along the equilibrium curve of coexisting
clathrate + ice + water + vapour. In the first path, represented by the black stripped line, ice
progressively melts until it finally disappears (crossing the stability field) and clathrate
continues to melt with further heating until it in turn dissociates to water + vapour at point
(b) (see Fig. 30a). Along the second path, not marked in Fig. 46, clathrate dissociates
completely in the presence of ice, which finally disappears at higher temperatures (see
Fig. 30b). Thereafter, heating drives the two-phase inclusions along the indicated isochore.
The vapour bubble slowly condenses and eventually disappears at point (c), Th, leaving
the inclusions filled with liquid. Bulk fluid densities between 19.2 to 33.5 cm3mol-1 were
calculated for type 2 aqueous inclusions (Table 5).
Vapour-rich inclusions
As the solubility of quartz in water is very low at the recorded formation temperatures (Th),
small amounts of water should be present in order to explain the entrapment of vapour-
rich inclusions via dissolution-reprecipitation of the host quartz. Raman analyses have
confirmed that H2O is present as a separate phase in these inclusions, usually as a thin
film surrounding the vapour phase and wetting the inclusion walls (see section 5.1.2).
Therefore, the phase transition recorded by Thcar (Fig. 28) does indeed represent partial
homogenisation on a three-phase element, and the total homogenisation transition would
occur at much higher, not measured, temperatures.
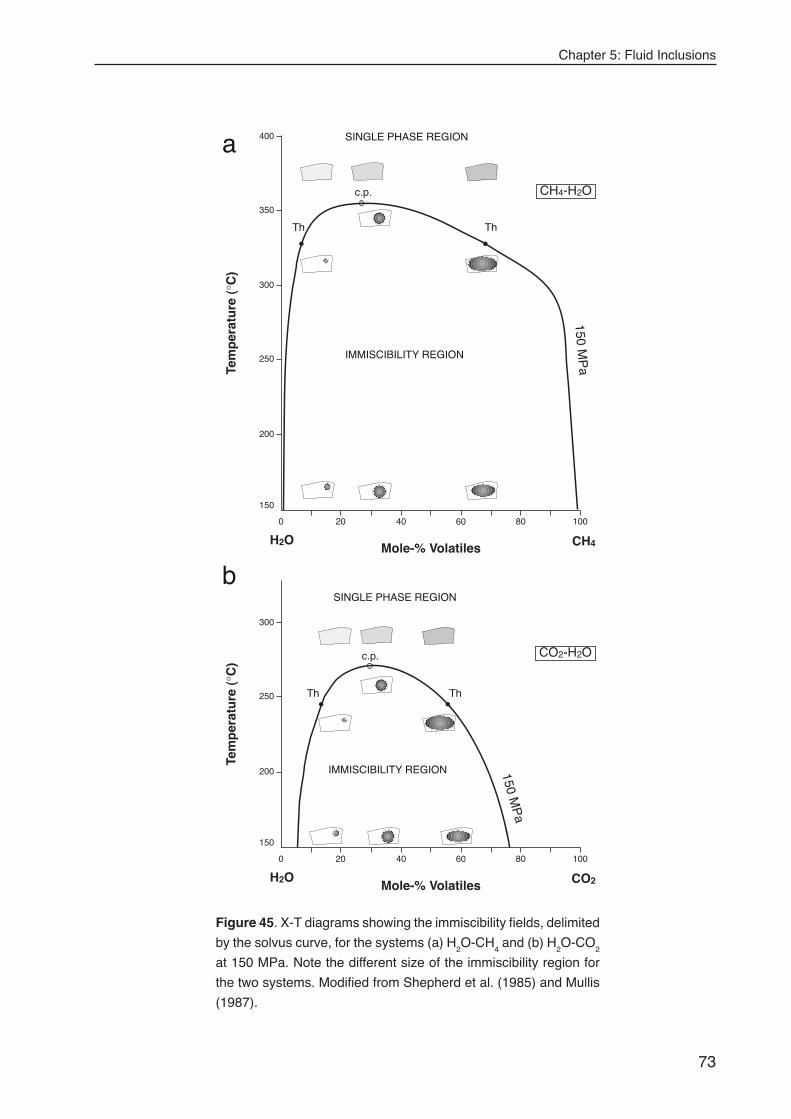
Chapter 5: Fluid Inclusions
73
Mole-% Volatiles
20 40 60 80 1000
150
200
250
300
350
400
Tem
per
atu
re (
°C)
CH4
CH4-H2O
H2O
c.p.
Th Th
SINGLE PHASE REGION
150 MP
a
IMMISCIBILITY REGION
Mole-% Volatiles
20 40 60 80 1000
150
200
250
300
Tem
per
atu
re (
°C)
CO2H2O
CO2-H2Oc.p.
Th Th
150 MP
a
a
bSINGLE PHASE REGION
IMMISCIBILITY REGION
Figure 45. X-T diagrams showing the immiscibility fields, delimited
by the solvus curve, for the systems (a) H2O-CH
4 and (b) H
2O-CO
2
at 150 MPa. Note the different size of the immiscibility region for
the two systems. Modified from Shepherd et al. (1985) and Mullis
(1987).
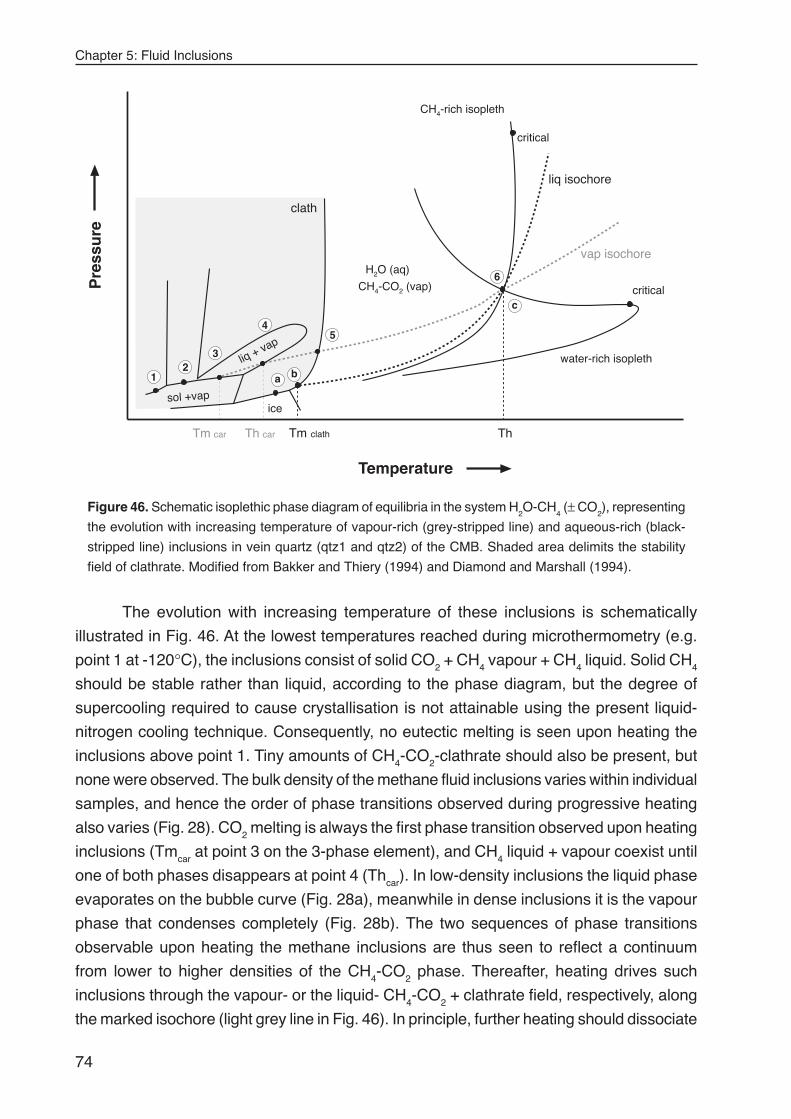
Chapter 5: Fluid Inclusions
74
The evolution with increasing temperature of these inclusions is schematically
illustrated in Fig. 46. At the lowest temperatures reached during microthermometry (e.g.
point 1 at -120°C), the inclusions consist of solid CO2 + CH4 vapour + CH4 liquid. Solid CH4
should be stable rather than liquid, according to the phase diagram, but the degree of
supercooling required to cause crystallisation is not attainable using the present liquid-
nitrogen cooling technique. Consequently, no eutectic melting is seen upon heating the
inclusions above point 1. Tiny amounts of CH4-CO2-clathrate should also be present, but
none were observed. The bulk density of the methane fluid inclusions varies within individual
samples, and hence the order of phase transitions observed during progressive heating
also varies (Fig. 28). CO2 melting is always the first phase transition observed upon heating
inclusions (Tmcar at point 3 on the 3-phase element), and CH4 liquid + vapour coexist until
one of both phases disappears at point 4 (Thcar). In low-density inclusions the liquid phase
evaporates on the bubble curve (Fig. 28a), meanwhile in dense inclusions it is the vapour
phase that condenses completely (Fig. 28b). The two sequences of phase transitions
observable upon heating the methane inclusions are thus seen to reflect a continuum
from lower to higher densities of the CH4-CO2 phase. Thereafter, heating drives such
inclusions through the vapour- or the liquid- CH4-CO2 + clathrate field, respectively, along
the marked isochore (light grey line in Fig. 46). In principle, further heating should dissociate
critical
critical
Th
water-rich isopleth
CH4-rich isopleth
liq isochore
vap isochore
CH4-CO2 (vap)
clath
ice
liq + vap
H2O (aq)
Tm car Th car Tm clath
3
4
1
5
2
6
sol +vap
c
ba
Temperature
Pre
ssu
re
Figure 46. Schematic isoplethic phase diagram of equilibria in the system H2O-CH
4 (± CO
2), representing
the evolution with increasing temperature of vapour-rich (grey-stripped line) and aqueous-rich (black-
stripped line) inclusions in vein quartz (qtz1 and qtz2) of the CMB. Shaded area delimits the stability
field of clathrate. Modified from Bakker and Thiery (1994) and Diamond and Marshall (1994).
Chapter 5: Fluid Inclusions
75
clathrate to a discrete water phase plus CH4-CO2 liquid/vapour (e.g. Tmclath at point 5).
Similarly, final homogenisation of the inclusions via dissolution of the water in the volatile
vapour or liquid should occur at higher temperature along the isochores (e.g. Th at point
6). In practice, however, neither Tmclath nor Th transitions have been observed in the
methane-rich inclusions from the CMB vein quartz.
Based on the Raman analyses and the above considerations on H2O content, it is
assumed that the V-X properties of all the analysed vapour-rich inclusions of type 1 and 2
in qtz1 can be modelled to a first approximation by binary CH4-CO2 mixtures. With the
reduced thermodynamic variance of this system, the TmCO2 (Tmcar) and ThCH4 (Thcar)
measurements permit both the composition and molar volume of the inclusions to be
calculated (Table 5). Molar volumes of the vapour-rich fluid range from 69 to 231.59
cm3mol-1 for type 1 inclusions, and from 123.68 to 541.09 cm3mol-1 for type 2 inclusions
(Table 5, page 71).
Fluid immiscibility and pressure calculations
The petrographic evidence for partial contemporaneity of aqueous and methane fluid
inclusions implies that two immiscible, conjugate fluids existed and were heterogeneously
trapped in the veins of the clastic Stephanian rocks during qtz1 precipitation. The immiscible
fluids comprised a low salinity aqueous solution and a CH4-rich vapour phase. Mechanical
mixtures of the coexisting liquid and vapour phases in the veins result in fluid inclusion
assemblages with variable bulk compositions and densities, which are intermediate with
respect to the pure end members. Such mixtures exhibit a range of homogenisation
pressures and temperatures that are always higher than the end-member inclusions (Fig.
45). The fact that many coeval intermediate inclusion assemblages are present is strong
evidence in support of heterogeneously trapped immiscible fluids. A further consequence
of the P-T-V-X behaviour of fluid inclusion assemblages trapped on the solvus (Fig. 45) is
that their respective temperatures and pressures of total homogenisation will be identical
to the pressures and temperatures of entrapment in the vein environment (Ramboz et al.,
1982; Diamond, 1990 and 2001). Moreover, internal pressures of vapour-rich and liquid-
rich inclusions in immiscible systems are the same at trapping (Mullis, 1979; Diamond and
Marshall, 1994). This is represented by the crossing of the “vapour” and “liquid” isochores
at the same Th as shown in Fig. 46. Therefore, the P-T conditions of formation for type 1
and 2 fluid inclusions can be obtained at the intersection of the isochores calculated for
vapour-rich inclusions with the measured Th in coeval aqueous-rich inclusions. The fluid
pressures at formation conditions were relatively low, ranging from 15 to 56 MPa for type
1 and from 10 to 27 MPa for type 2 (Fig. 47).
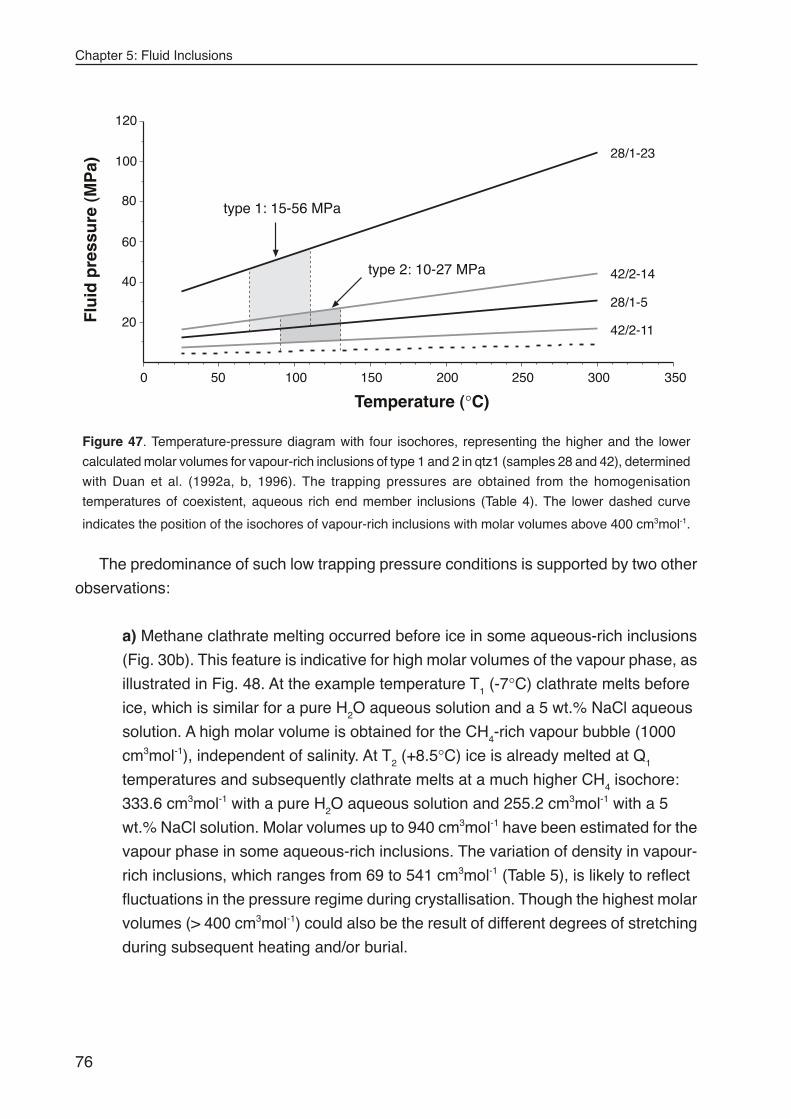
Chapter 5: Fluid Inclusions
76
The predominance of such low trapping pressure conditions is supported by two other
observations:
a) Methane clathrate melting occurred before ice in some aqueous-rich inclusions
(Fig. 30b). This feature is indicative for high molar volumes of the vapour phase, as
illustrated in Fig. 48. At the example temperature T1 (-7°C) clathrate melts before
ice, which is similar for a pure H2O aqueous solution and a 5 wt.% NaCl aqueous
solution. A high molar volume is obtained for the CH4-rich vapour bubble (1000
cm3mol-1), independent of salinity. At T2 (+8.5°C) ice is already melted at Q1
temperatures and subsequently clathrate melts at a much higher CH4 isochore:
333.6 cm3mol-1 with a pure H2O aqueous solution and 255.2 cm3mol-1 with a 5
wt.% NaCl solution. Molar volumes up to 940 cm3mol-1 have been estimated for the
vapour phase in some aqueous-rich inclusions. The variation of density in vapour-
rich inclusions, which ranges from 69 to 541 cm3mol-1 (Table 5), is likely to reflect
fluctuations in the pressure regime during crystallisation. Though the highest molar
volumes (> 400 cm3mol-1) could also be the result of different degrees of stretching
during subsequent heating and/or burial.
Flu
id p
ress
ure
(M
Pa)
28/1-23
28/1-5
42/2-14
42/2-11
0 50 100 150 200 250 300 350
Temperature (°C)
20
40
60
80
100
120
type 1: 15-56 MPa
type 2: 10-27 MPa
Figure 47. Temperature-pressure diagram with four isochores, representing the higher and the lower
calculated molar volumes for vapour-rich inclusions of type 1 and 2 in qtz1 (samples 28 and 42), determined
with Duan et al. (1992a, b, 1996). The trapping pressures are obtained from the homogenisation
temperatures of coexistent, aqueous rich end member inclusions (Table 4). The lower dashed curve
indicates the position of the isochores of vapour-rich inclusions with molar volumes above 400 cm3mol-1.
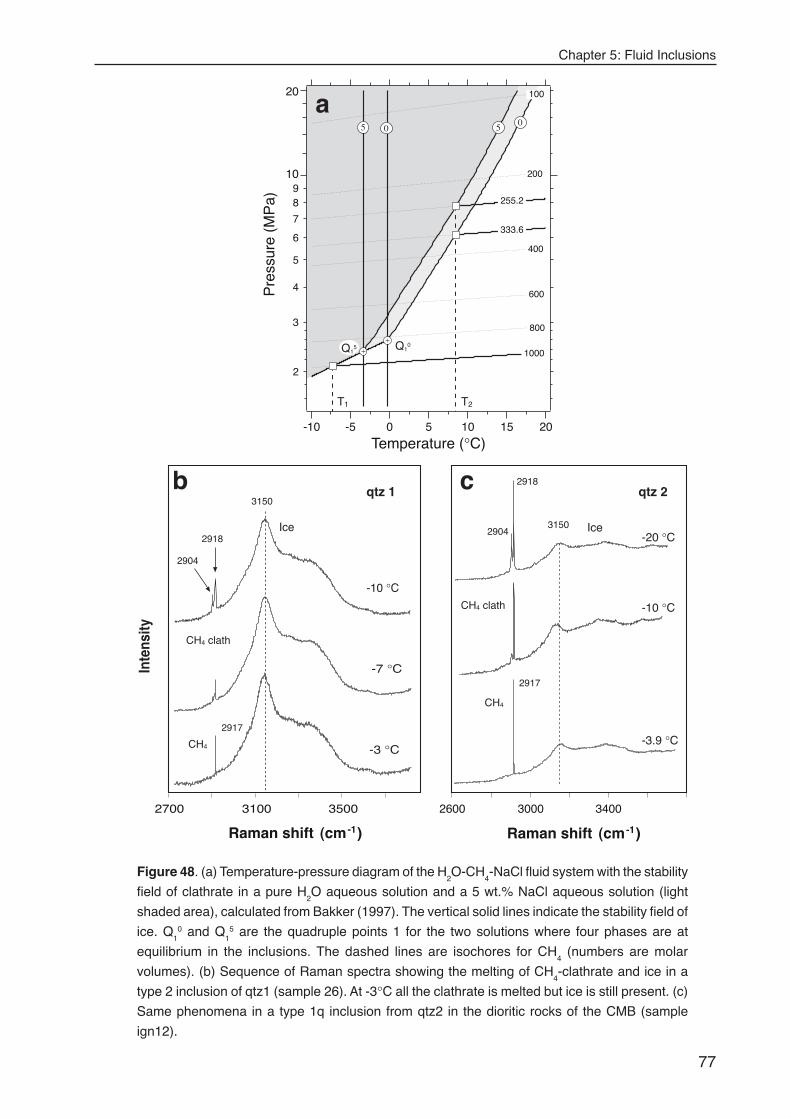
Chapter 5: Fluid Inclusions
77
Ice
-10 °C
2700 3100 3500
-3 °C
Inte
nsity
3150
2917
b c
Q10
T2T1
2
3
4
5
6
7
89
10
20
20151050-5-10
Temperature (°C)
1000
800
600
400
200
100
255.2
333.6
5 0 5 0
Pre
ssur
e (M
Pa)
Q15
a
Raman shift (cm-1) Raman shift (cm-1)
3150
2917
CH4
CH4
CH4 clath
CH4 clath
2600 3000 3400
Ice
qtz 2
-20 °C
-3.9 °C
-10 °C
2904
2918
-7 °C
qtz 1
2904
2918
Figure 48. (a) Temperature-pressure diagram of the H2O-CH
4-NaCl fluid system with the stability
field of clathrate in a pure H2O aqueous solution and a 5 wt.% NaCl aqueous solution (light
shaded area), calculated from Bakker (1997). The vertical solid lines indicate the stability field of
ice. Q1
0 and Q15 are the quadruple points 1 for the two solutions where four phases are at
equilibrium in the inclusions. The dashed lines are isochores for CH4 (numbers are molar
volumes). (b) Sequence of Raman spectra showing the melting of CH4-clathrate and ice in a
type 2 inclusion of qtz1 (sample 26). At -3°C all the clathrate is melted but ice is still present. (c)
Same phenomena in a type 1q inclusion from qtz2 in the dioritic rocks of the CMB (sample
ign12).
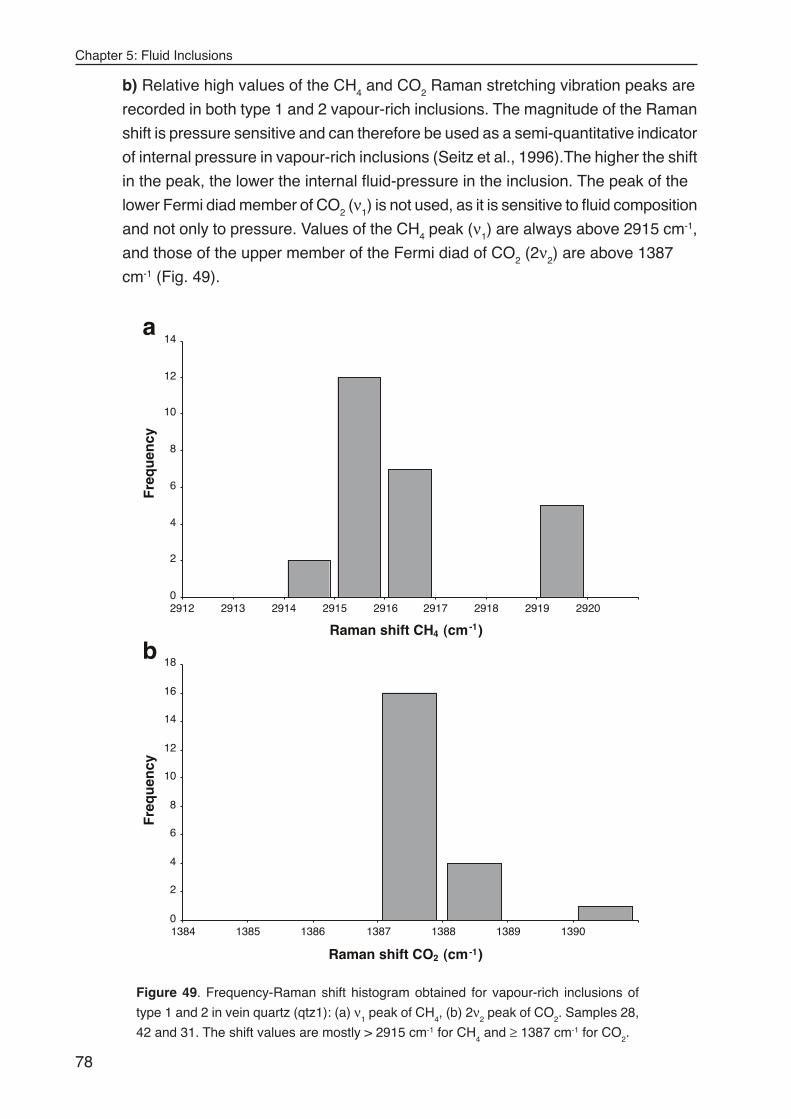
Chapter 5: Fluid Inclusions
78
b) Relative high values of the CH4 and CO2 Raman stretching vibration peaks are
recorded in both type 1 and 2 vapour-rich inclusions. The magnitude of the Raman
shift is pressure sensitive and can therefore be used as a semi-quantitative indicator
of internal pressure in vapour-rich inclusions (Seitz et al., 1996).The higher the shift
in the peak, the lower the internal fluid-pressure in the inclusion. The peak of the
lower Fermi diad member of CO2 (ν1) is not used, as it is sensitive to fluid composition
and not only to pressure. Values of the CH4 peak (ν1) are always above 2915 cm-1,
and those of the upper member of the Fermi diad of CO2 (2ν2) are above 1387
cm-1 (Fig. 49).
0
2
4
6
8
10
12
14
16
18
1384 1385 1386 1387 1388 1389 1390
Fre
qu
ency
0
2
4
6
8
10
12
14
2912 2913 2914 2915 2916 2917 2918 2919 2920
Fre
qu
ency
a
b
Raman shift CO2 (cm-1)
Raman shift CH4 (cm-1)
Figure 49. Frequency-Raman shift histogram obtained for vapour-rich inclusions of
type 1 and 2 in vein quartz (qtz1): (a) ν1 peak of CH
4, (b) 2ν
2 peak of CO
2. Samples 28,
42 and 31. The shift values are mostly > 2915 cm-1 for CH4 and ≥ 1387 cm-1 for CO
2.
Chapter 5: Fluid Inclusions
79
This indicates that these inclusions have fluid internal pressures well below 10 MPa
at room temperature, according to projections shown in Figs. 1 and 2 of Seitz et
al. (1996). Nevertheless, due to considerable analytical error associated with these
estimates the results can only be used qualitatively to support the low trapping
pressures estimated above. Peak magnitudes in the vapour phase of aqueous-rich
inclusions are generally above 2917 cm-1 for CH4, but factors that influence the
peak shift have not been investigated for these type of inclusions.
5.3.2. Secondary H2O-NaCl-CaCl2-CH4 system in vein quartz (qtz1)
As seen from the petrographic evidence, a H2O-NaCl-CaCl2-CH4 fluid was trapped in the
vein quartz (qtz1) after its crystallisation. This system was not formed by heterogeneous
trapping of two immiscible fluids, but from a relatively homogeneous brine with certain
amounts of CH4, detected by Raman in both the aqueous- and vapour-phases. The
occasional detection of CO2 in some type 3 inclusions is attributed to contamination during
formation, as the inclusions in which this phase was detected always cut type 1 and 2
assemblages. The absence of vapour rich inclusions confirms that no methane rich end
member was present during fluid trapping. As temperature falls below the bubble point
curve of the system, a small vapour bubble nucleates in fluid inclusions. The presence of
methane-bearing clathrates in these aqueous inclusions requires a minimum pressure
roughly equal to that of the Q1 point (2.7 MPa and 0°C in a salt free system). The melting
of this phase before ice indicates that methane concentrations should be below 0.06 mol%
(Dubessy et al., 2001). The high total salinity of the aqueous phase, 26.6 to 28.9 eq.wt%,
also favours that the concentration of dissolved methane is low and imposes a problem in
order to calculate the appropriate bubble point curve as it increases the immiscibility field
(Fig. 50). The calculated methane concentration is below 0.01 mol% (Table 5). Therefore,
Th can only be used as a minimum entrapment temperature for the fluid and no accurate
pressure calculation can be made from equations of state or isopleth projections (Bakker,
1999).
The Th-Tm projection of fluid inclusion data, separately for each sample, shows
that leakage and refilling, and/or stretching didnot affect the studied secondary inclusions.
Besides, these plots outline straight away the differences of this fluid system with respect
to the primary H2O-CH4-CO2-NaCl system (Fig. 51). Calculated bulk fluid densities vary
between 16.9 and 17.2 cm3mol-1 (Table 5).
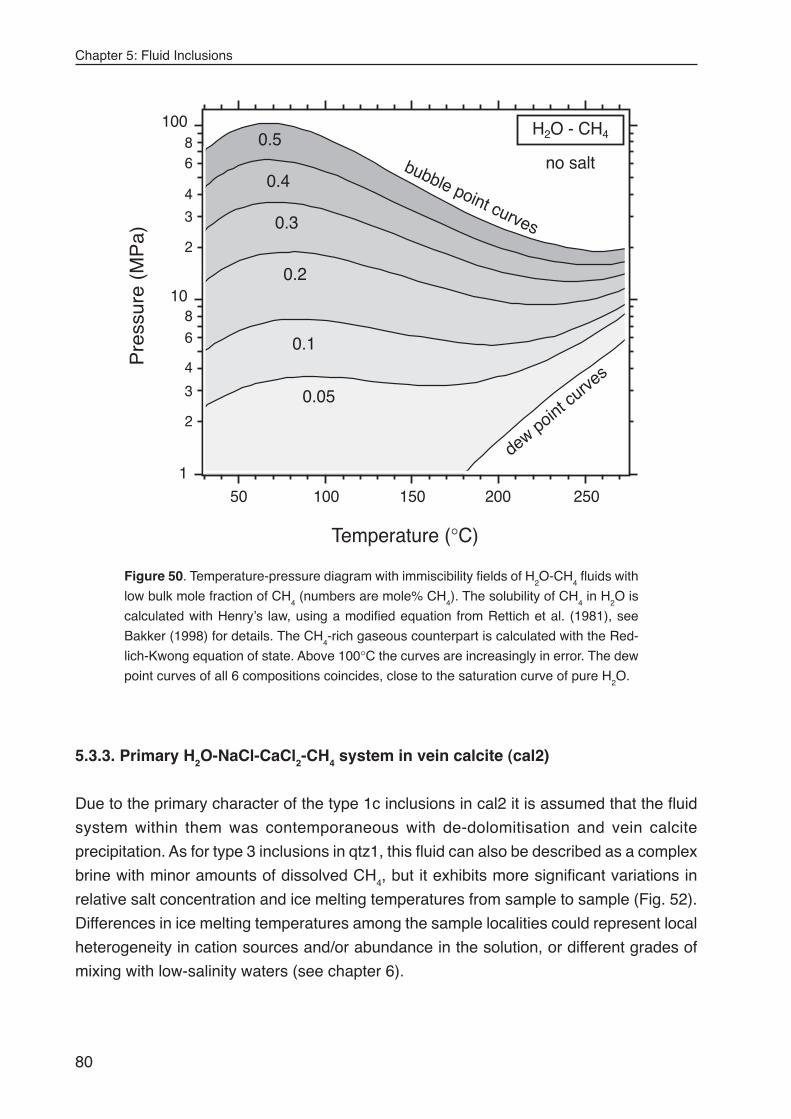
Chapter 5: Fluid Inclusions
80
5.3.3. Primary H2O-NaCl-CaCl2-CH4 system in vein calcite (cal2)
Due to the primary character of the type 1c inclusions in cal2 it is assumed that the fluid
system within them was contemporaneous with de-dolomitisation and vein calcite
precipitation. As for type 3 inclusions in qtz1, this fluid can also be described as a complex
brine with minor amounts of dissolved CH4, but it exhibits more significant variations in
relative salt concentration and ice melting temperatures from sample to sample (Fig. 52).
Differences in ice melting temperatures among the sample localities could represent local
heterogeneity in cation sources and/or abundance in the solution, or different grades of
mixing with low-salinity waters (see chapter 6).
dew point curve
s
bubble point curves
1
10
100
2
4
6
8
3
2
3
4
68
50 100 150 200 250
0.05
0.1
0.2
0.3
0.4
0.5H2O - CH4
Temperature (°C)
Pre
ssur
e (M
Pa)
no salt
Figure 50. Temperature-pressure diagram with immiscibility fields of H2O-CH
4 fluids with
low bulk mole fraction of CH4 (numbers are mole% CH
4). The solubility of CH
4 in H
2O is
calculated with Henry’s law, using a modified equation from Rettich et al. (1981), see
Bakker (1998) for details. The CH4-rich gaseous counterpart is calculated with the Red-
lich-Kwong equation of state. Above 100°C the curves are increasingly in error. The dew
point curves of all 6 compositions coincides, close to the saturation curve of pure H2O.
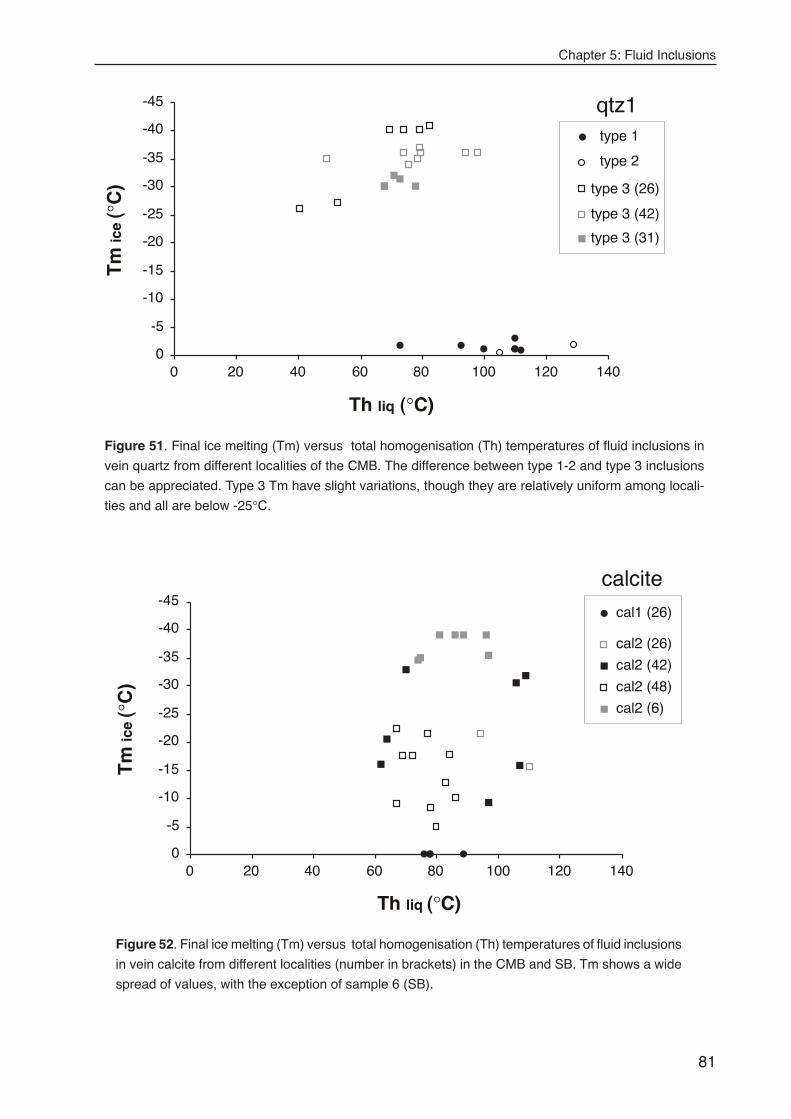
Chapter 5: Fluid Inclusions
81
Tm
ice
(°C
)qtz1-45
-40
-35
-30
-25
-20
-15
-10
-5
00 20 40 60 80 100 120 140
Th liq (°C)
type 1
type 3 (26)
type 3 (42)
type 3 (31)
type 2
Figure 51. Final ice melting (Tm) versus total homogenisation (Th) temperatures of fluid inclusions in
vein quartz from different localities of the CMB. The difference between type 1-2 and type 3 inclusions
can be appreciated. Type 3 Tm have slight variations, though they are relatively uniform among locali-
ties and all are below -25°C.
-45
-40
-35
-30
-25
-20
-15
-10
-5
00 20 40 60 80 100 120 140
Th liq (°C)
cal1 (26)
cal2 (26)
cal2 (42)
cal2 (48)
cal2 (6)
Tm
ice
(°C
)
calcite
Figure 52. Final ice melting (Tm) versus total homogenisation (Th) temperatures of fluid inclusions
in vein calcite from different localities (number in brackets) in the CMB and SB. Tm shows a wide
spread of values, with the exception of sample 6 (SB).
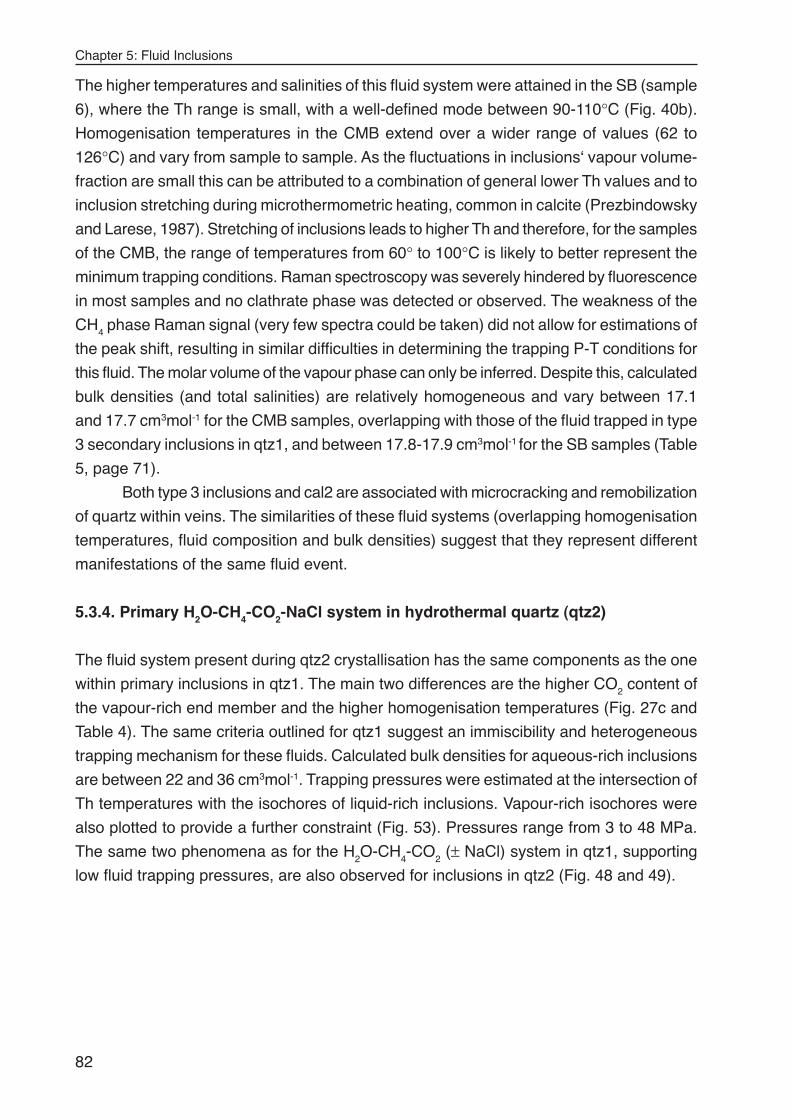
Chapter 5: Fluid Inclusions
82
The higher temperatures and salinities of this fluid system were attained in the SB (sample
6), where the Th range is small, with a well-defined mode between 90-110°C (Fig. 40b).
Homogenisation temperatures in the CMB extend over a wider range of values (62 to
126°C) and vary from sample to sample. As the fluctuations in inclusions‘ vapour volume-
fraction are small this can be attributed to a combination of general lower Th values and to
inclusion stretching during microthermometric heating, common in calcite (Prezbindowsky
and Larese, 1987). Stretching of inclusions leads to higher Th and therefore, for the samples
of the CMB, the range of temperatures from 60° to 100°C is likely to better represent the
minimum trapping conditions. Raman spectroscopy was severely hindered by fluorescence
in most samples and no clathrate phase was detected or observed. The weakness of the
CH4 phase Raman signal (very few spectra could be taken) did not allow for estimations of
the peak shift, resulting in similar difficulties in determining the trapping P-T conditions for
this fluid. The molar volume of the vapour phase can only be inferred. Despite this, calculated
bulk densities (and total salinities) are relatively homogeneous and vary between 17.1
and 17.7 cm3mol-1 for the CMB samples, overlapping with those of the fluid trapped in type
3 secondary inclusions in qtz1, and between 17.8-17.9 cm3mol-1 for the SB samples (Table
5, page 71).
Both type 3 inclusions and cal2 are associated with microcracking and remobilization
of quartz within veins. The similarities of these fluid systems (overlapping homogenisation
temperatures, fluid composition and bulk densities) suggest that they represent different
manifestations of the same fluid event.
5.3.4. Primary H2O-CH4-CO2-NaCl system in hydrothermal quartz (qtz2)
The fluid system present during qtz2 crystallisation has the same components as the one
within primary inclusions in qtz1. The main two differences are the higher CO2 content of
the vapour-rich end member and the higher homogenisation temperatures (Fig. 27c and
Table 4). The same criteria outlined for qtz1 suggest an immiscibility and heterogeneous
trapping mechanism for these fluids. Calculated bulk densities for aqueous-rich inclusions
are between 22 and 36 cm3mol-1. Trapping pressures were estimated at the intersection of
Th temperatures with the isochores of liquid-rich inclusions. Vapour-rich isochores were
also plotted to provide a further constraint (Fig. 53). Pressures range from 3 to 48 MPa.
The same two phenomena as for the H2O-CH4-CO2 (± NaCl) system in qtz1, supporting
low fluid trapping pressures, are also observed for inclusions in qtz2 (Fig. 48 and 49).
Chapter 5: Fluid Inclusions
83
5.4. THE SEQUENCE OF FLUID EVENTS
Calculated fluid P-T conditions during the different stages of vein mineral growth represented
by the recognised fluid systems are showed in Fig. 54. Characterisation of the veins as
open fissures, their widespread distribution throughout the whole sediment sequence and
basin and the low pressures of fluid entrapment (< 60 MPa), together with the absence of
recognisable pressure trends with depth, indicate that hydrostatic pressure conditions
prevailed during fissure formation and mineral precipitation. Fluid events and their
associated characteristics and timing within these rocks are illustrated schematically in
Fig. 55.
Following sedimentation in the Ciñera-Matallana basin, an early period of deformation
and fracturing took place and small amounts of calcite (cal1) crystallised from a temperate,
low salinity aqueous fluid at shallow depths within open fractures, which were predestined
to host subsequent vein mineralisations. In the open fissures, quartz (qtz1) precipitated as
large euhedral crystals in the presence of an immiscible fluid mixture, composed of a low
salinity aqueous solution and a CH4-rich vapour phase. Both fluid end-members were
trapped heterogeneously in the large quartz crystals as type 1 and 2 fluid inclusions.
20
40
60
80
100
120
140
160
100 150 200 250 300 350 400
Temperature (°C)
51/1q1
51/1q2
51/2q4
251°C/31 MPa302°C/48MPa
164°C/3MPa
Flu
id p
ress
ure
(M
Pa)
Figure 53. Temperature-pressure diagram showing the isochores calculated for 3 fluid inclusions in qtz2.
Assuming fluid immiscibility in the system H2O-CH
4-CO
2-NaCl, the intersection of the isochore for the
vapour-rich inclusion with the other two, aqueous-rich, determines the upper range of pressures and
temperatures of trapping (coincident with the Th measured for those inclusions). The lower value represents
the minimum entrapment pressure corresponding to the lower range of Thliq
.
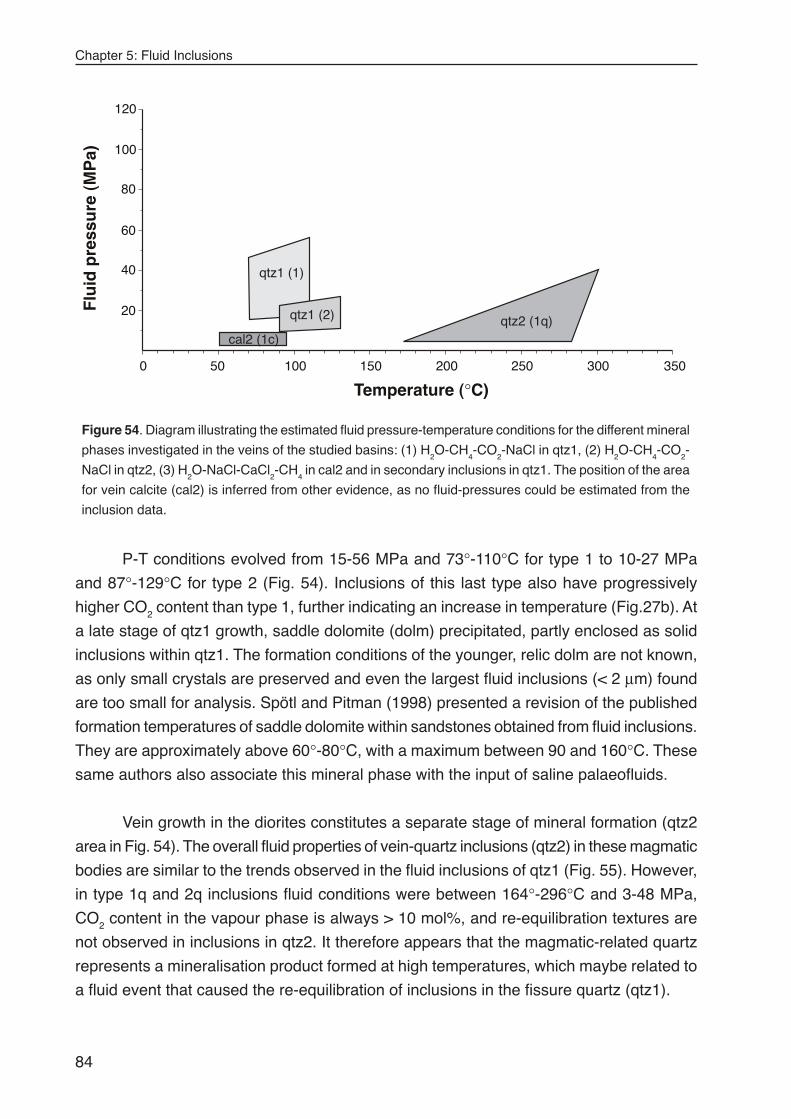
Chapter 5: Fluid Inclusions
84
P-T conditions evolved from 15-56 MPa and 73°-110°C for type 1 to 10-27 MPa
and 87°-129°C for type 2 (Fig. 54). Inclusions of this last type also have progressively
higher CO2 content than type 1, further indicating an increase in temperature (Fig.27b). At
a late stage of qtz1 growth, saddle dolomite (dolm) precipitated, partly enclosed as solid
inclusions within qtz1. The formation conditions of the younger, relic dolm are not known,
as only small crystals are preserved and even the largest fluid inclusions (< 2 µm) found
are too small for analysis. Spötl and Pitman (1998) presented a revision of the published
formation temperatures of saddle dolomite within sandstones obtained from fluid inclusions.
They are approximately above 60°-80°C, with a maximum between 90 and 160°C. These
same authors also associate this mineral phase with the input of saline palaeofluids.
Vein growth in the diorites constitutes a separate stage of mineral formation (qtz2
area in Fig. 54). The overall fluid properties of vein-quartz inclusions (qtz2) in these magmatic
bodies are similar to the trends observed in the fluid inclusions of qtz1 (Fig. 55). However,
in type 1q and 2q inclusions fluid conditions were between 164°-296°C and 3-48 MPa,
CO2 content in the vapour phase is always > 10 mol%, and re-equilibration textures are
not observed in inclusions in qtz2. It therefore appears that the magmatic-related quartz
represents a mineralisation product formed at high temperatures, which maybe related to
a fluid event that caused the re-equilibration of inclusions in the fissure quartz (qtz1).
Flu
id p
ress
ure
(M
Pa)
0 50 100 150 200 250 300 350
Temperature (°C)
20
40
60
80
100
120
cal2 (1c)
qtz1 (1)
qtz2 (1q)qtz1 (2)
Figure 54. Diagram illustrating the estimated fluid pressure-temperature conditions for the different mineral
phases investigated in the veins of the studied basins: (1) H2O-CH
4-CO
2-NaCl in qtz1, (2) H
2O-CH
4-CO
2-
NaCl in qtz2, (3) H2O-NaCl-CaCl
2-CH
4 in cal2 and in secondary inclusions in qtz1. The position of the area
for vein calcite (cal2) is inferred from other evidence, as no fluid-pressures could be estimated from the
inclusion data.
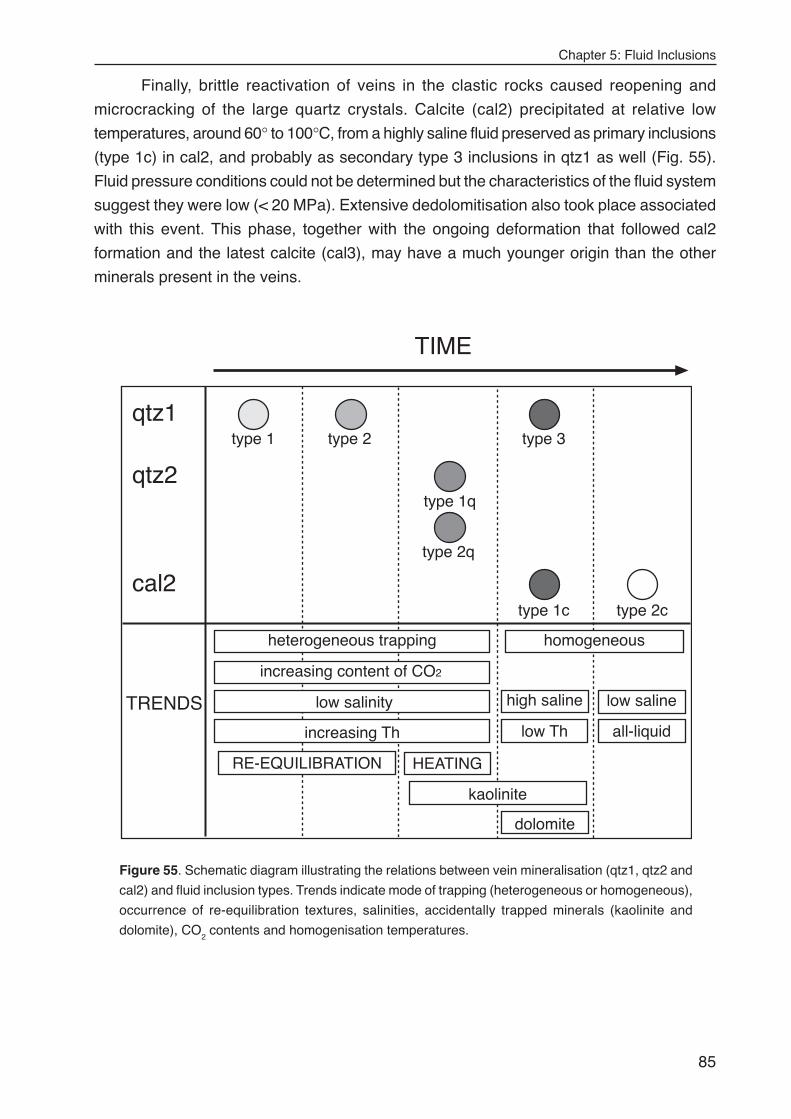
Chapter 5: Fluid Inclusions
85
qtz1
cal2
qtz2
TRENDS
type 1 type 2 type 3
type 1q
type 2q
type 1c type 2c
heterogeneous trapping homogeneous
RE-EQUILIBRATION
increasing content of CO2
high salinelow salinity low saline
kaolinite
dolomite
increasing Th low Th all-liquid
TIME
HEATING
Figure 55. Schematic diagram illustrating the relations between vein mineralisation (qtz1, qtz2 and
cal2) and fluid inclusion types. Trends indicate mode of trapping (heterogeneous or homogeneous),
occurrence of re-equilibration textures, salinities, accidentally trapped minerals (kaolinite and
dolomite), CO2 contents and homogenisation temperatures.
Finally, brittle reactivation of veins in the clastic rocks caused reopening and
microcracking of the large quartz crystals. Calcite (cal2) precipitated at relative low
temperatures, around 60° to 100°C, from a highly saline fluid preserved as primary inclusions
(type 1c) in cal2, and probably as secondary type 3 inclusions in qtz1 as well (Fig. 55).
Fluid pressure conditions could not be determined but the characteristics of the fluid system
suggest they were low (< 20 MPa). Extensive dedolomitisation also took place associated
with this event. This phase, together with the ongoing deformation that followed cal2
formation and the latest calcite (cal3), may have a much younger origin than the other
minerals present in the veins.

Chapter 5: Fluid Inclusions
86
Chapter 6: Origin of Mineral Phases
87
CHAPTER 6: ORIGIN OF MINERAL PHASES AND FLUIDSOURCES
After investigating the fluid types and trapping conditions associated with fissure mineral
formation this chapter addresses the nature and possible sources of the fluid systems and
minerals responsible for forming the studied veins. The aim here is to assess if the
mineralisng fluids had a intrabasinal origin, i.e. derived from thermal maturation and
dewatering of the basin rocks, or if they were externally-derived fluids, transported into the
basin by fluid flow. In addition to the mineral, fluid chemistry and petrographic evidence,
new data on carbonate stable isotopic composition and on the crystal growth mechanism
of clay minerals are presented in this chapter. Each vein mineral phase and the co-exist-
ing fluids are treated separately within the time framework determined by the petrographic
research and the fluid inclusion analysis. Potential mineral precipitation mechanisms are
also discussed, which may be influenced by several interrelated factors: silica and car-
bonate sources, thermal history, transport mechanism, pore pressure history and local
variations in lithology.
6.1. QUARTZ PRECIPITATION AND ORGANIC-DERIVED BASINAL FLUIDS
The level of organic matter maturation reached in the sediments of the CMB, according to
the published data, falls largely within the catagenesis state in transition to the metagenesis
zone. According to the review in Barnes et al. (1990), catagenesis occurs at temperatures
from 50° to 150°C and pressures from 30 to 100 MPa. These conditions are largely
coincident with the estimations of fluid P-T for the primary inclusions in the studied vein
quartz. Within this P-T range the components of the fluid system H2O-CH4-CO2 (with traces
of C2H4, C2H6 and C3H8, and minor NaCl), present during quartz formation and from which
quartz precipitated, could be largely derived from the thermal maturation of the organic
matter in the coal seams. At this level of maturation coal macerals undergo a significant
reduction in water content and volatiles, fully coincident with the generation of gas. Coal
bed volume-reduction due to compaction processes also enhances fluid generation as
well (Barnes et al., 1990). For temperatures > 80°C degradation of simple organic
compounds (e.g. acetate) follows the reaction:
CH3COOH + water →→→→→ CH4 + CO2 + carboxylic acid anions
Early carbonate precipitation is possible under these conditions (Morad, 1998), as reflected
Chapter 6: Origin of Mineral Phases
88
by the early calcite relics (cal1) preserved within vein quartz. At T ≥100°C thermal
degradation of carboxylic acids progressively produces more CH4 and CO2 and
consequently a pH decrease (increase in ρCO2) which also inhibits carbonate precipitation
(Morad, 1998). The predominance of CH4 over CO2 in the vapour phase of the fluid system
in qtz1 primary inclusions also reflects these conditions. CO2 is generated preferentially at
much higher temperatures related to thermal cracking reactions in the formation of meta-
anthracites and coke. The solubility of quartz in water increases as result of:
••••• complexing by organic compounds, such as those produced during coal maturation
(Bennet and Siegel, 1987; Fein, 2000)
••••• low salinity of the water, as reflected by the low salinity of the aqueous phase in
primary fluid inclusions of qtz1 (Renard et al., 2000; and references within)
Sources of silica external to the basinal rocks are very unlikely in this setting. There
exist three main arguments supporting an internal origin for the quartz brought into solution:
••••• most quartz-rich lithologies in the CMB contain veins, suggesting local transport
••••• fracture-related hydrothermal mineralisations in Devonian limestones adjacent to
the basin do not contain quartz (samples 15-16, see appendix)
••••• the solubility of quartz is relatively low and vast quantities of water would be
required to flow through the basin to accomplish the observed extent of quartz
mineralisation in the CMB (Bjørlykke, 1994)
In clastic sedimentary environments, depending on the primary mineralogy and conditions
of pressure and temperature, there are 3 possible internal SiO2 sources derived from the
detrital and authigenic fractions of the rock where vein formation occurs (Worden and
Morad, 2000). These include:
1) intergranular pressure-dissolution of quartz grains
2) clay-mineral transformations (illitization of kaolinite and chloritization of smectite)
3) feldspar alteration reactions
In the study area, the host-lithologies of quartz-bearing veins are invariably sandstones
where quartz grains are a major constituent of the detrital fraction, and XRD analysis of
veins and adjacent clastic rocks denote the absence of feldspar and the presence of
kaolinite, illite/smectite, and minor chlorite. Therefore, source (1) of SiO2, and to a minor
extent source (2); seem to have been dominant.
In clastic sedimentary sequences, quartz cementation from a fluid phase tends to
occur at elevated temperatures because temperature has a major control on the solubility
of quartz and the most important SiO2 liberating reactions (Wood, 1986). As a result quartz
is found as a major cement only in clastic rocks that have been heated above 80°C (Wor-
den and Morad, 2000). However the main control on quartz precipitation in this setting
seems to be governed by kinetics, although it is not clear whether quartz crystallises
continuously over small rates or rapidly over short periods. Complex zonation of qtz1 in
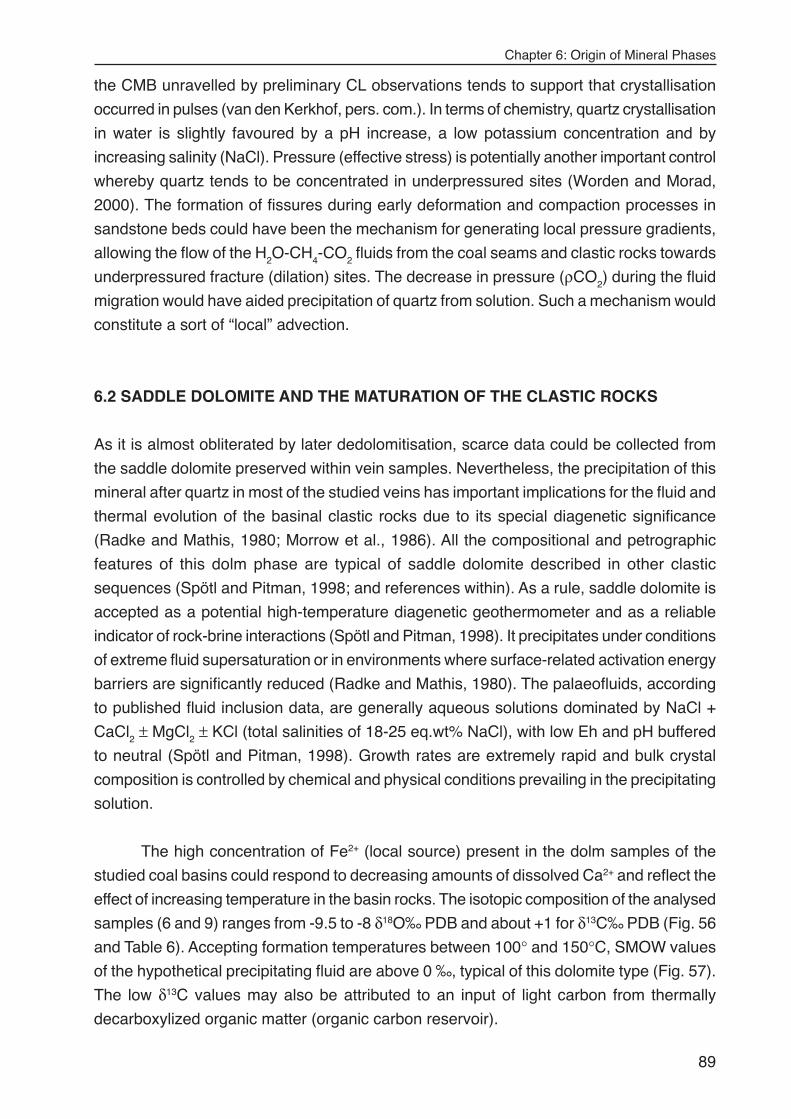
Chapter 6: Origin of Mineral Phases
89
the CMB unravelled by preliminary CL observations tends to support that crystallisation
occurred in pulses (van den Kerkhof, pers. com.). In terms of chemistry, quartz crystallisation
in water is slightly favoured by a pH increase, a low potassium concentration and by
increasing salinity (NaCl). Pressure (effective stress) is potentially another important control
whereby quartz tends to be concentrated in underpressured sites (Worden and Morad,
2000). The formation of fissures during early deformation and compaction processes in
sandstone beds could have been the mechanism for generating local pressure gradients,
allowing the flow of the H2O-CH4-CO2 fluids from the coal seams and clastic rocks towards
underpressured fracture (dilation) sites. The decrease in pressure (ρCO2) during the fluid
migration would have aided precipitation of quartz from solution. Such a mechanism would
constitute a sort of “local” advection.
6.2 SADDLE DOLOMITE AND THE MATURATION OF THE CLASTIC ROCKS
As it is almost obliterated by later dedolomitisation, scarce data could be collected from
the saddle dolomite preserved within vein samples. Nevertheless, the precipitation of this
mineral after quartz in most of the studied veins has important implications for the fluid and
thermal evolution of the basinal clastic rocks due to its special diagenetic significance
(Radke and Mathis, 1980; Morrow et al., 1986). All the compositional and petrographic
features of this dolm phase are typical of saddle dolomite described in other clastic
sequences (Spötl and Pitman, 1998; and references within). As a rule, saddle dolomite is
accepted as a potential high-temperature diagenetic geothermometer and as a reliable
indicator of rock-brine interactions (Spötl and Pitman, 1998). It precipitates under conditions
of extreme fluid supersaturation or in environments where surface-related activation energy
barriers are significantly reduced (Radke and Mathis, 1980). The palaeofluids, according
to published fluid inclusion data, are generally aqueous solutions dominated by NaCl +
CaCl2 ± MgCl2 ± KCl (total salinities of 18-25 eq.wt% NaCl), with low Eh and pH buffered
to neutral (Spötl and Pitman, 1998). Growth rates are extremely rapid and bulk crystal
composition is controlled by chemical and physical conditions prevailing in the precipitating
solution.
The high concentration of Fe2+ (local source) present in the dolm samples of the
studied coal basins could respond to decreasing amounts of dissolved Ca2+ and reflect the
effect of increasing temperature in the basin rocks. The isotopic composition of the analysed
samples (6 and 9) ranges from -9.5 to -8 δ18O‰ PDB and about +1 for δ13C‰ PDB (Fig. 56
and Table 6). Accepting formation temperatures between 100° and 150°C, SMOW values
of the hypothetical precipitating fluid are above 0 ‰, typical of this dolomite type (Fig. 57).
The low δ13C values may also be attributed to an input of light carbon from thermally
decarboxylized organic matter (organic carbon reservoir).
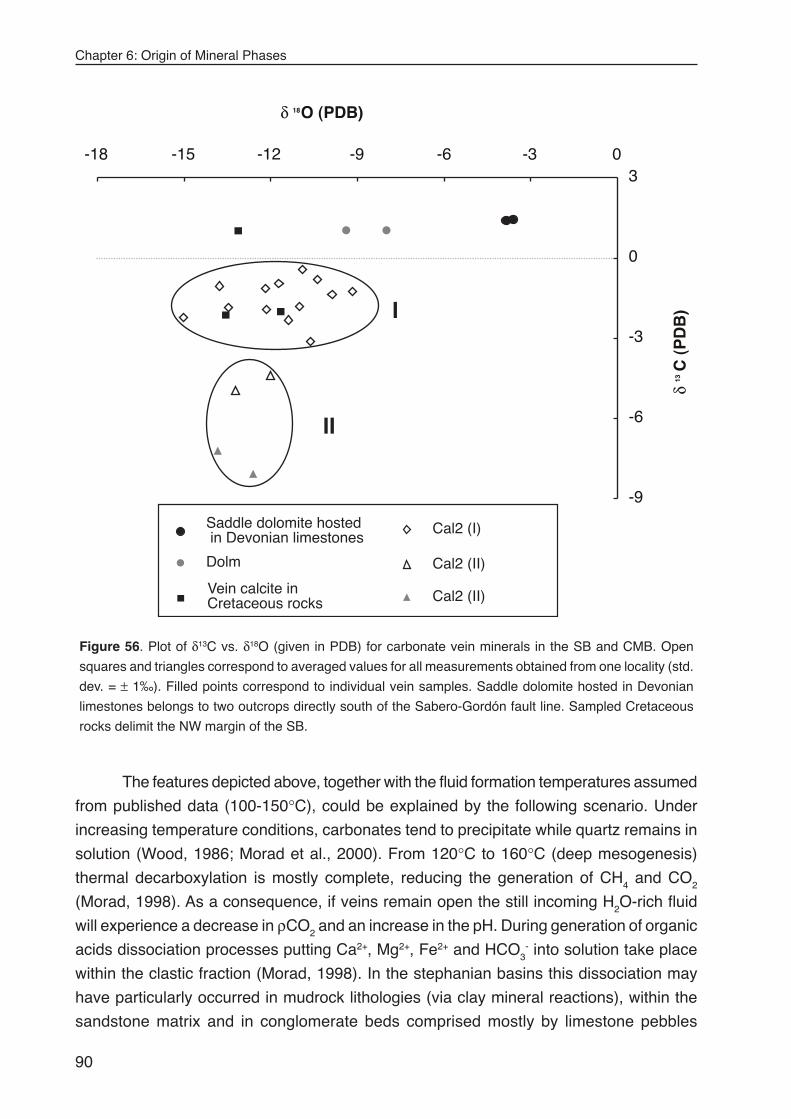
Chapter 6: Origin of Mineral Phases
90
The features depicted above, together with the fluid formation temperatures assumed
from published data (100-150°C), could be explained by the following scenario. Under
increasing temperature conditions, carbonates tend to precipitate while quartz remains in
solution (Wood, 1986; Morad et al., 2000). From 120°C to 160°C (deep mesogenesis)
thermal decarboxylation is mostly complete, reducing the generation of CH4 and CO2
(Morad, 1998). As a consequence, if veins remain open the still incoming H2O-rich fluid
will experience a decrease in ρCO2 and an increase in the pH. During generation of organic
acids dissociation processes putting Ca2+, Mg2+, Fe2+ and HCO3- into solution take place
within the clastic fraction (Morad, 1998). In the stephanian basins this dissociation may
have particularly occurred in mudrock lithologies (via clay mineral reactions), within the
sandstone matrix and in conglomerate beds comprised mostly by limestone pebbles
Vein calcite inCretaceous rocks
-9
-6
-3
0
3-18 -15 -12 -9 -6 -3 0
δ 18O (PDB)
δ13
C (
PD
B)
Saddle dolomite hosted in Devonian limestones
Dolm
Cal2 (I)
Cal2 (II)
Cal2 (II)
I
II
Figure 56. Plot of δ13C vs. δ18O (given in PDB) for carbonate vein minerals in the SB and CMB. Open
squares and triangles correspond to averaged values for all measurements obtained from one locality (std.
dev. = ± 1‰). Filled points correspond to individual vein samples. Saddle dolomite hosted in Devonian
limestones belongs to two outcrops directly south of the Sabero-Gordón fault line. Sampled Cretaceous
rocks delimit the NW margin of the SB.
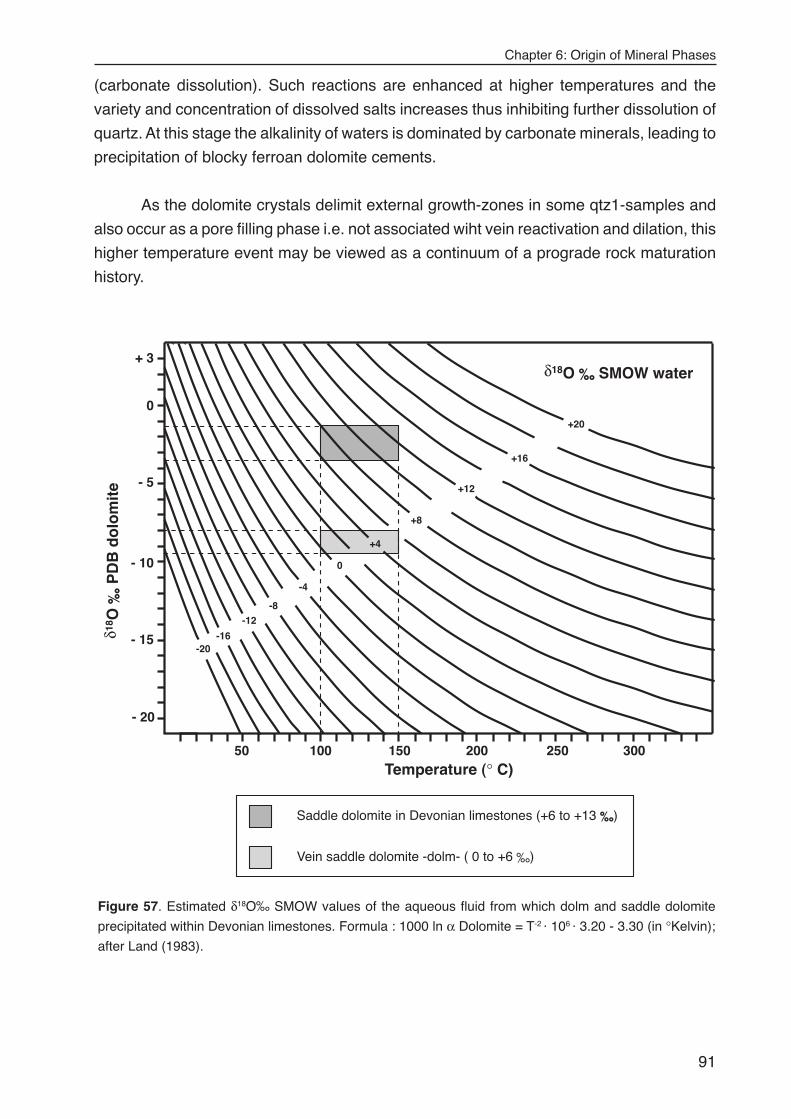
Chapter 6: Origin of Mineral Phases
91
(carbonate dissolution). Such reactions are enhanced at higher temperatures and the
variety and concentration of dissolved salts increases thus inhibiting further dissolution of
quartz. At this stage the alkalinity of waters is dominated by carbonate minerals, leading to
precipitation of blocky ferroan dolomite cements.
As the dolomite crystals delimit external growth-zones in some qtz1-samples and
also occur as a pore filling phase i.e. not associated wiht vein reactivation and dilation, this
higher temperature event may be viewed as a continuum of a prograde rock maturation
history.
+ 3
- 20
- 15
- 10
- 5
0
50 100 150 200 250 300Temperature (° C)
-20-16
-12-8
-4
0
+4
+8
+12
+16
+20
δ18O ‰ SMOW water
δ18 O
‰ P
DB
do
lom
ite
Saddle dolomite in Devonian limestones (+6 to +13 ‰)
Vein saddle dolomite -dolm- ( 0 to +6 ‰)
Figure 57. Estimated δ18O‰ SMOW values of the aqueous fluid from which dolm and saddle dolomite
precipitated within Devonian limestones. Formula : 1000 ln α Dolomite = T-2 · 106 · 3.20 - 3.30 (in °Kelvin);
after Land (1983).
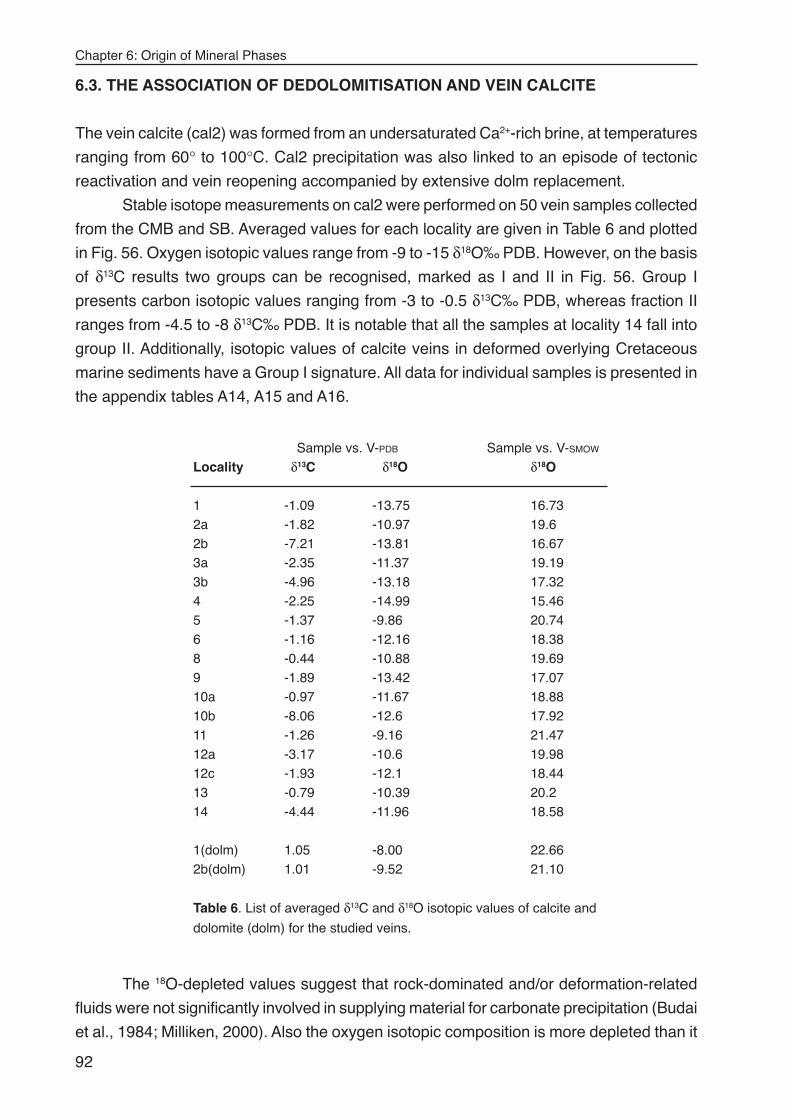
Chapter 6: Origin of Mineral Phases
92
6.3. THE ASSOCIATION OF DEDOLOMITISATION AND VEIN CALCITE
The vein calcite (cal2) was formed from an undersaturated Ca2+-rich brine, at temperatures
ranging from 60° to 100°C. Cal2 precipitation was also linked to an episode of tectonic
reactivation and vein reopening accompanied by extensive dolm replacement.
Stable isotope measurements on cal2 were performed on 50 vein samples collected
from the CMB and SB. Averaged values for each locality are given in Table 6 and plotted
in Fig. 56. Oxygen isotopic values range from -9 to -15 δ18O‰ PDB. However, on the basis
of δ13C results two groups can be recognised, marked as I and II in Fig. 56. Group I
presents carbon isotopic values ranging from -3 to -0.5 δ13C‰ PDB, whereas fraction II
ranges from -4.5 to -8 δ13C‰ PDB. It is notable that all the samples at locality 14 fall into
group II. Additionally, isotopic values of calcite veins in deformed overlying Cretaceous
marine sediments have a Group I signature. All data for individual samples is presented in
the appendix tables A14, A15 and A16.
Sample vs. V-PDB Sample vs. V-SMOW
Locality δ13C δ18O δ18O
1 -1.09 -13.75 16.732a -1.82 -10.97 19.62b -7.21 -13.81 16.673a -2.35 -11.37 19.193b -4.96 -13.18 17.324 -2.25 -14.99 15.465 -1.37 -9.86 20.746 -1.16 -12.16 18.388 -0.44 -10.88 19.699 -1.89 -13.42 17.0710a -0.97 -11.67 18.8810b -8.06 -12.6 17.9211 -1.26 -9.16 21.4712a -3.17 -10.6 19.9812c -1.93 -12.1 18.4413 -0.79 -10.39 20.214 -4.44 -11.96 18.58
1(dolm) 1.05 -8.00 22.662b(dolm) 1.01 -9.52 21.10
Table 6. List of averaged δ13C and δ18O isotopic values of calcite and
dolomite (dolm) for the studied veins.
The 18O-depleted values suggest that rock-dominated and/or deformation-related
fluids were not significantly involved in supplying material for carbonate precipitation (Budai
et al., 1984; Milliken, 2000). Also the oxygen isotopic composition is more depleted than it
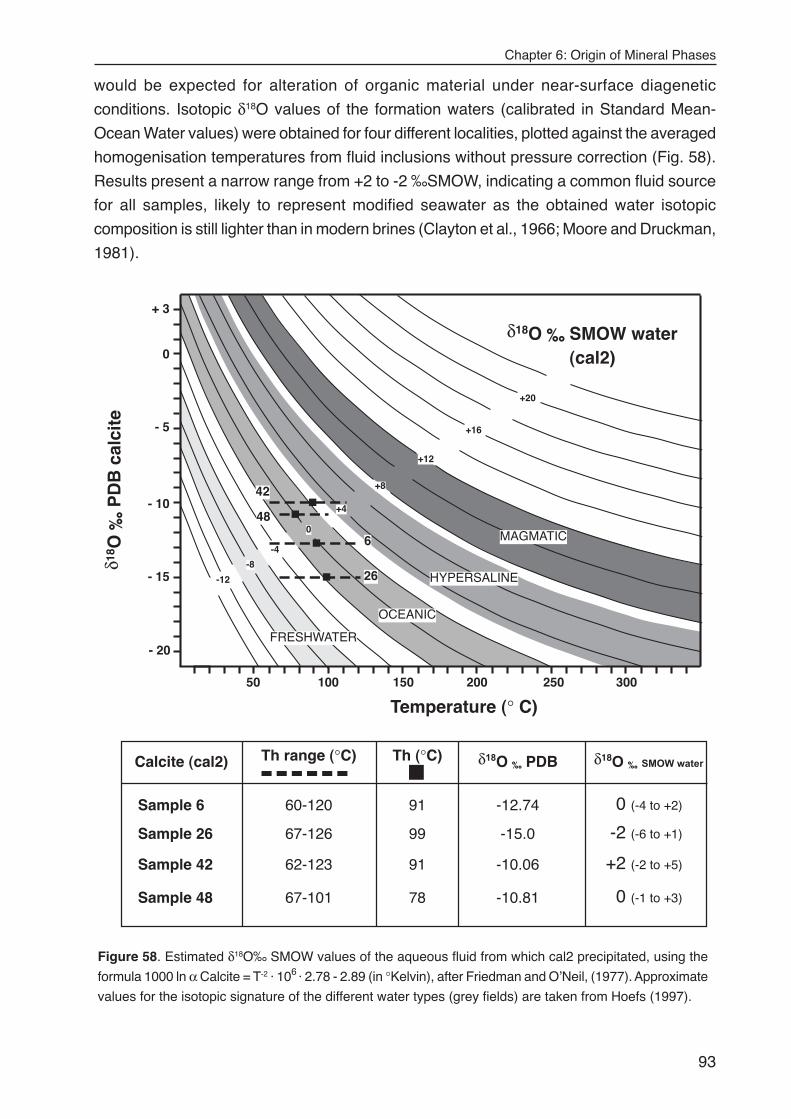
Chapter 6: Origin of Mineral Phases
93
would be expected for alteration of organic material under near-surface diagenetic
conditions. Isotopic δ18O values of the formation waters (calibrated in Standard Mean-
Ocean Water values) were obtained for four different localities, plotted against the averaged
homogenisation temperatures from fluid inclusions without pressure correction (Fig. 58).
Results present a narrow range from +2 to -2 ‰SMOW, indicating a common fluid source
for all samples, likely to represent modified seawater as the obtained water isotopic
composition is still lighter than in modern brines (Clayton et al., 1966; Moore and Druckman,
1981).
(cal2)
Calcite (cal2)
Sample 6
Sample 42
Sample 48
Sample 26
Th range (°C) Th (°C) δ18O ‰ PDB
62-123 91 -10.06
60-120 91 -12.74
67-101 78 -10.81
67-126 -15.099
δ18O ‰ SMOW water
0 (-4 to +2)
-2 (-6 to +1)
+2 (-2 to +5)
0 (-1 to +3)
δ18O ‰ SMOW water
δ18 O
‰ P
DB
cal
cite
+ 3
- 20
- 15
- 10
- 5
0
50 100 150 200 250 300
Temperature (° C)
0
+4
+8
+12
+16
+20
-8
-12
6
26
48
42
FRESHWATER
OCEANIC
HYPERSALINE
MAGMATIC-4
Figure 58. Estimated δ18O‰ SMOW values of the aqueous fluid from which cal2 precipitated, using the
formula 1000 ln α Calcite = T-2 · 106 · 2.78 - 2.89 (in °Kelvin), after Friedman and O’Neil, (1977). Approximate
values for the isotopic signature of the different water types (grey fields) are taken from Hoefs (1997).
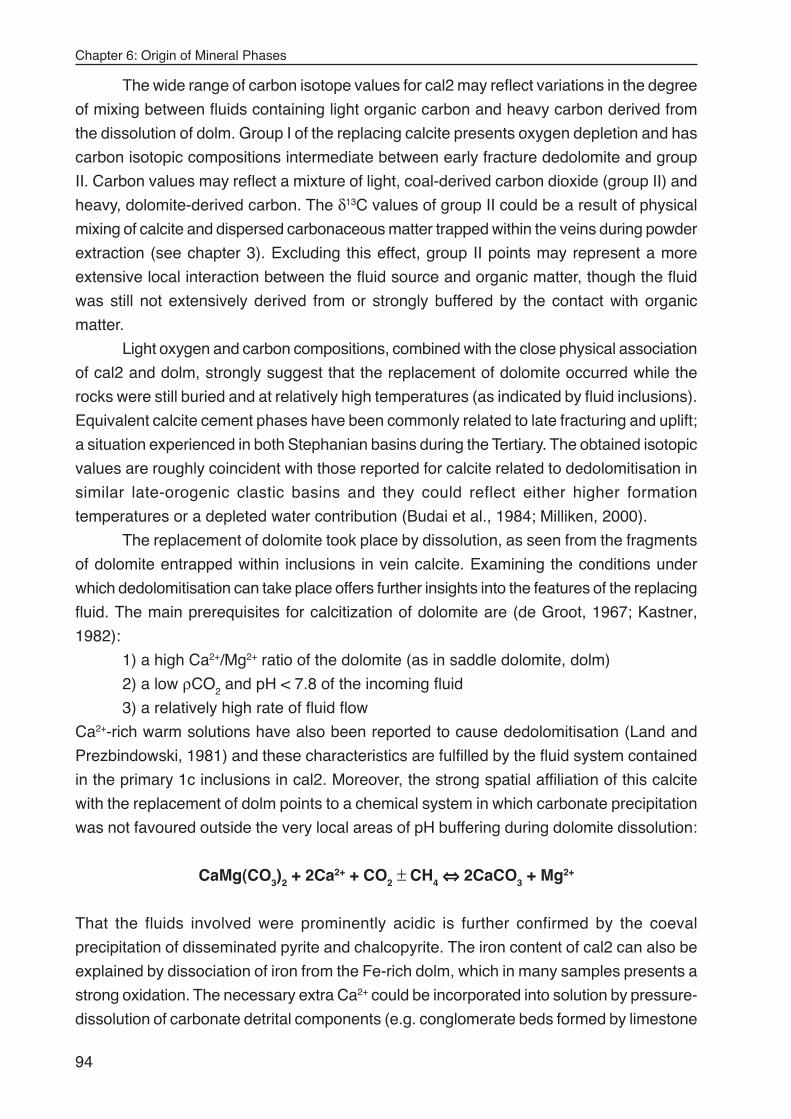
Chapter 6: Origin of Mineral Phases
94
The wide range of carbon isotope values for cal2 may reflect variations in the degree
of mixing between fluids containing light organic carbon and heavy carbon derived from
the dissolution of dolm. Group I of the replacing calcite presents oxygen depletion and has
carbon isotopic compositions intermediate between early fracture dedolomite and group
II. Carbon values may reflect a mixture of light, coal-derived carbon dioxide (group II) and
heavy, dolomite-derived carbon. The δ13C values of group II could be a result of physical
mixing of calcite and dispersed carbonaceous matter trapped within the veins during powder
extraction (see chapter 3). Excluding this effect, group II points may represent a more
extensive local interaction between the fluid source and organic matter, though the fluid
was still not extensively derived from or strongly buffered by the contact with organic
matter.
Light oxygen and carbon compositions, combined with the close physical association
of cal2 and dolm, strongly suggest that the replacement of dolomite occurred while the
rocks were still buried and at relatively high temperatures (as indicated by fluid inclusions).
Equivalent calcite cement phases have been commonly related to late fracturing and uplift;
a situation experienced in both Stephanian basins during the Tertiary. The obtained isotopic
values are roughly coincident with those reported for calcite related to dedolomitisation in
similar late-orogenic clastic basins and they could reflect either higher formation
temperatures or a depleted water contribution (Budai et al., 1984; Milliken, 2000).
The replacement of dolomite took place by dissolution, as seen from the fragments
of dolomite entrapped within inclusions in vein calcite. Examining the conditions under
which dedolomitisation can take place offers further insights into the features of the replacing
fluid. The main prerequisites for calcitization of dolomite are (de Groot, 1967; Kastner,
1982):
1) a high Ca2+/Mg2+ ratio of the dolomite (as in saddle dolomite, dolm)
2) a low ρCO2 and pH < 7.8 of the incoming fluid
3) a relatively high rate of fluid flow
Ca2+-rich warm solutions have also been reported to cause dedolomitisation (Land and
Prezbindowski, 1981) and these characteristics are fulfilled by the fluid system contained
in the primary 1c inclusions in cal2. Moreover, the strong spatial affiliation of this calcite
with the replacement of dolm points to a chemical system in which carbonate precipitation
was not favoured outside the very local areas of pH buffering during dolomite dissolution:
CaMg(CO3)2 + 2Ca2+ + CO2 ± CH4 ⇔⇔⇔⇔⇔ 2CaCO3 + Mg2+
That the fluids involved were prominently acidic is further confirmed by the coeval
precipitation of disseminated pyrite and chalcopyrite. The iron content of cal2 can also be
explained by dissociation of iron from the Fe-rich dolm, which in many samples presents a
strong oxidation. The necessary extra Ca2+ could be incorporated into solution by pressure-
dissolution of carbonate detrital components (e.g. conglomerate beds formed by limestone
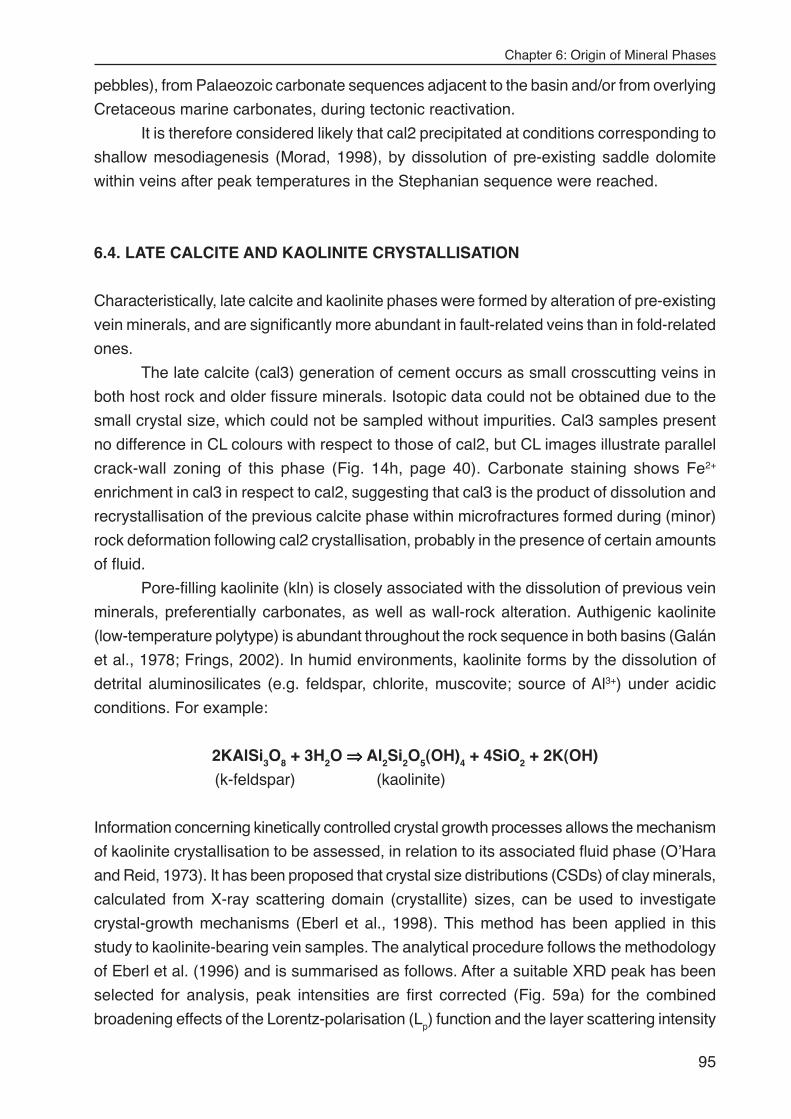
Chapter 6: Origin of Mineral Phases
95
pebbles), from Palaeozoic carbonate sequences adjacent to the basin and/or from overlying
Cretaceous marine carbonates, during tectonic reactivation.
It is therefore considered likely that cal2 precipitated at conditions corresponding to
shallow mesodiagenesis (Morad, 1998), by dissolution of pre-existing saddle dolomite
within veins after peak temperatures in the Stephanian sequence were reached.
6.4. LATE CALCITE AND KAOLINITE CRYSTALLISATION
Characteristically, late calcite and kaolinite phases were formed by alteration of pre-existing
vein minerals, and are significantly more abundant in fault-related veins than in fold-related
ones.
The late calcite (cal3) generation of cement occurs as small crosscutting veins in
both host rock and older fissure minerals. Isotopic data could not be obtained due to the
small crystal size, which could not be sampled without impurities. Cal3 samples present
no difference in CL colours with respect to those of cal2, but CL images illustrate parallel
crack-wall zoning of this phase (Fig. 14h, page 40). Carbonate staining shows Fe2+
enrichment in cal3 in respect to cal2, suggesting that cal3 is the product of dissolution and
recrystallisation of the previous calcite phase within microfractures formed during (minor)
rock deformation following cal2 crystallisation, probably in the presence of certain amounts
of fluid.
Pore-filling kaolinite (kln) is closely associated with the dissolution of previous vein
minerals, preferentially carbonates, as well as wall-rock alteration. Authigenic kaolinite
(low-temperature polytype) is abundant throughout the rock sequence in both basins (Galán
et al., 1978; Frings, 2002). In humid environments, kaolinite forms by the dissolution of
detrital aluminosilicates (e.g. feldspar, chlorite, muscovite; source of Al3+) under acidic
conditions. For example:
2KAlSi3O8 + 3H2O ⇒⇒⇒⇒⇒ Al2Si2O5(OH)4 + 4SiO2 + 2K(OH)
(k-feldspar) (kaolinite)
Information concerning kinetically controlled crystal growth processes allows the mechanism
of kaolinite crystallisation to be assessed, in relation to its associated fluid phase (O’Hara
and Reid, 1973). It has been proposed that crystal size distributions (CSDs) of clay minerals,
calculated from X-ray scattering domain (crystallite) sizes, can be used to investigate
crystal-growth mechanisms (Eberl et al., 1998). This method has been applied in this
study to kaolinite-bearing vein samples. The analytical procedure follows the methodology
of Eberl et al. (1996) and is summarised as follows. After a suitable XRD peak has been
selected for analysis, peak intensities are first corrected (Fig. 59a) for the combined
broadening effects of the Lorentz-polarisation (Lp) function and the layer scattering intensity
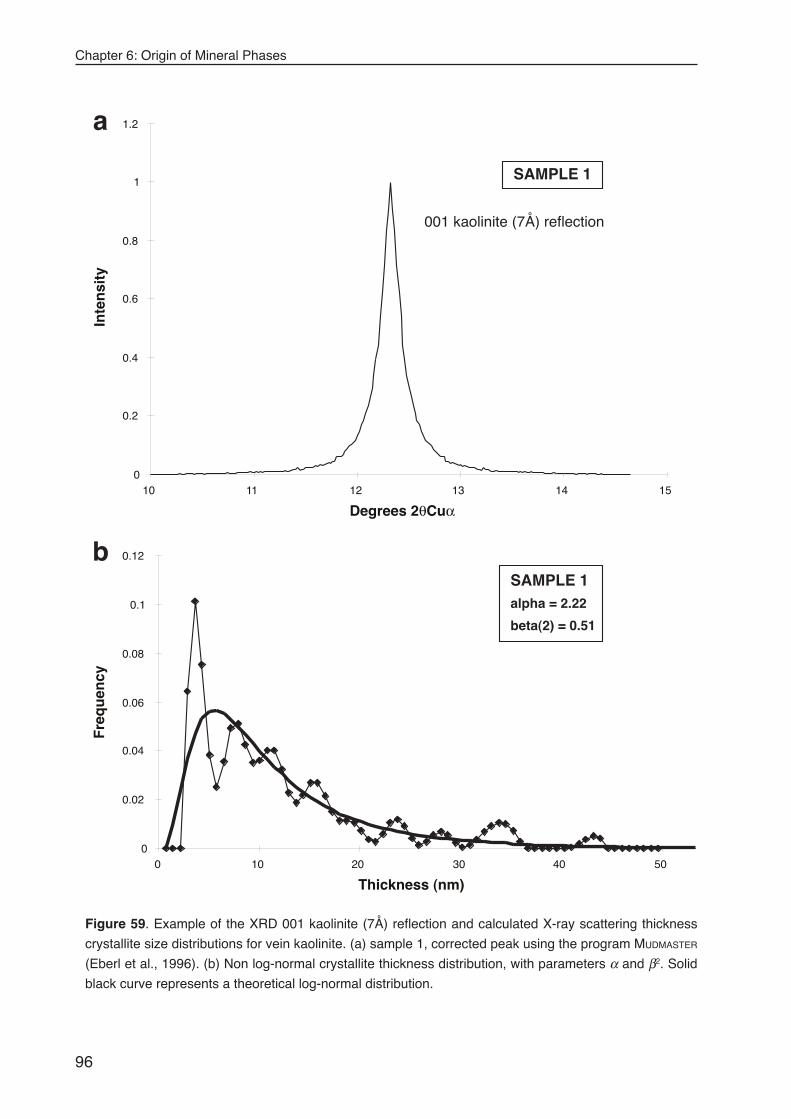
Chapter 6: Origin of Mineral Phases
96
bSAMPLE 1alpha = 2.22
beta(2) = 0.51
0
0.02
0.04
0.06
0.08
0.1
0.12
0 10 20 30 40 50
Thickness (nm)
Fre
qu
ency
SAMPLE 1
a
0
0.2
0.4
0.6
0.8
1
1.2
10 11 12 13 14 15
Degrees 2θCuα
Inte
nsi
ty
001 kaolinite (7Å) reflection
Figure 59. Example of the XRD 001 kaolinite (7Å) reflection and calculated X-ray scattering thickness
crystallite size distributions for vein kaolinite. (a) sample 1, corrected peak using the program MUDMASTER
(Eberl et al., 1996). (b) Non log-normal crystallite thickness distribution, with parameters α and β2. Solid
black curve represents a theoretical log-normal distribution.
Chapter 6: Origin of Mineral Phases
97
G2 (square of the structure factor).
Then, following background subtraction and optional removal of the contribution of
Kα2 radiation, a Fourier analysis of the interference function is undertaken using the Bertaut-
Warren-Averbach method, which calculates the distribution of thicknesses of X-ray
scattering domains. The parameters α (mean of the natural logarithms of the crystal sizes)
and β2 (variance of the natural logarithms of the crystal sizes) describe the shape of the
thickness distributions (Fig. 59b).
In the model of Eberl at al. (1998) crystal growth mechanisms can be interpreted
from α-β2 plots. Theoretical mechanisms are calculated using three simple equations: the
Law of Proportionate Effect (LPE), a mass-balance equation and Ostwald ripening. Fig.
60 represents the simulated trends, corresponding to five growth mechanisms that show
different trends in an α-β2 plot:
(I) continuous nucleation and growth in an open system
(II) surface controlled growth in an open system
(III) supply controlled growth in an open system
(IV) supply- or surface-controlled Ostwald ripening in a closed system
(V) supply-controlled random ripening in a closed system.
According to Warr and Peacor (2002), the use of X-ray scattering domain (crystallite)
sizes for determining crystal growth mechanisms relies on three important requirements:
1) domain-broadening information can be accurately extracted from X-ray diffraction
profiles
2) the X-ray scattering domains correspond only to crystal growth surfaces
3) changes in the shape of size-distributions can be linked with established crystal-
growth mechanism
Recent work has shown that the fulfilment of conditions 1) and 2) is complicated in
polymineralic rocks due to a number of analytical limitations, particularly overlapping mineral
reflections. Moreover, the crystal growth models outlined above represent time dependent
crystal size changes, assuming fixed P-T fluid conditions, which differ by changing crystal
growth parameters such as surface areas, supply of nutrients and interfacial energies.
Nevertheless, in geological environments changes in mineral crystallisation are primarily
driven by changes in P, T and composition in closed systems or by changes in fluid activity
and solutes in open systems. Therefore, Warr and Peacor (2002) suggest using CSDs
with caution when determining crystal growth mechanisms, and these should be
preferentially applied to monomineralic clay samples of relatively simple geological histories.
The following petrographic evidence suggests the kaolinite in these samples is suitable
for analysis:
••••• mineral assemblages are simple, consisting of kaolinite, illite/smectite, calcite,
quartz and minor chlorite
••••• overlapping reflections could be avoided by excluding samples containing chlorite
••••• the structural factor of kaolinite is well known

Chapter 6: Origin of Mineral Phases
98
••••• there is no detrital kaolinite in the samples, as microscopically all kaolinite observed
is authigenic
Results show that X-ray scattering domain size distributions for the selected samples
are not lognormal (Fig. 59b). All the calculated α-β2 values for kln are given in Table 7 and
plotted in Fig. 60, and the change in shape produces an exponential curve, with a correlation
coefficient of 0.7. This trend corresponds best with a crystal growth mechanism of continuous
nucleation and growth in an open system, during which crystals nucleated at constant or
accelerating rate and then grew according to the LPE with an unlimited fluid supply.
bet
a
(I)
(IV)
(II)
(II)
(V)(III)
Ostwaldripening
2
Kaolinite
R2 = 0.6636
Alpha (from nm)
Nuc
leat
ion
+ gr
owth
Supply-controlor random ripening
Surface-control-2
Surface-control-1
0
0.1
0.2
0.3
0.4
0.5
0.6
0.7
0.8
0.9
1
0 1 2 3 4
Figure 60. Predicted crystal size distributions (α-β2) based on hypothetical crystal growth models using
the program GALLOPER (Eberl et al., 1998). Plotted values correspond to samples of vein kaolinite (kln).
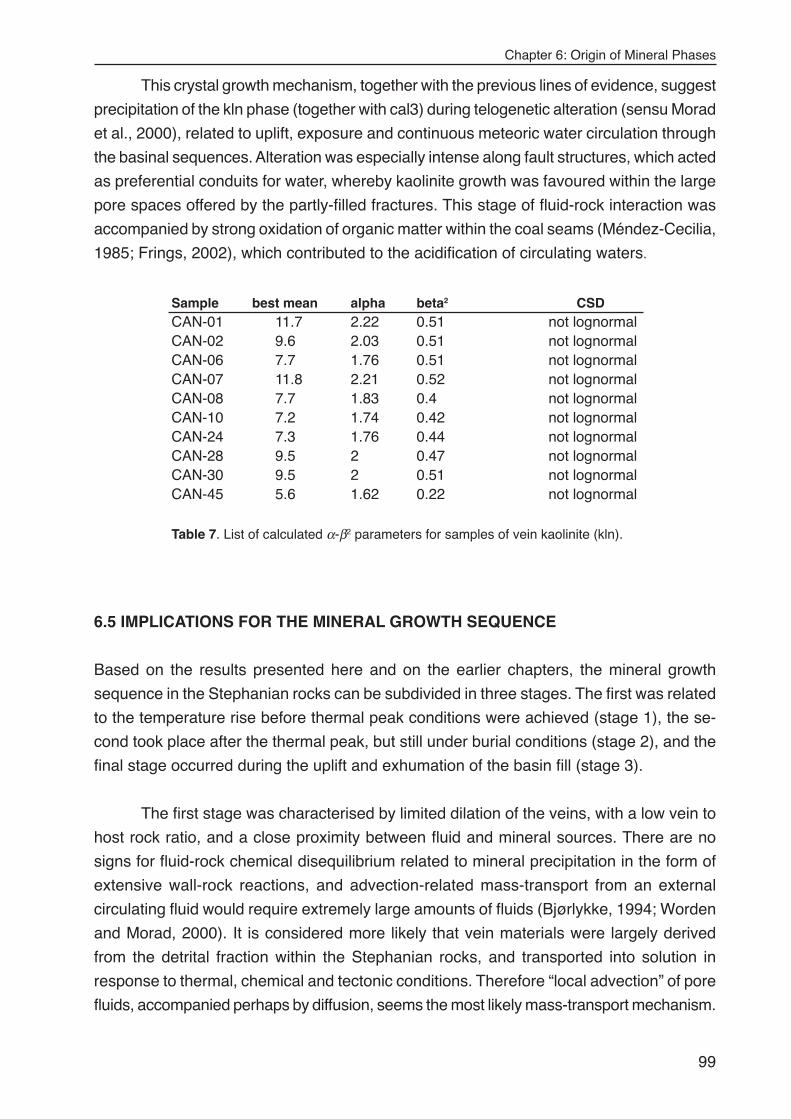
Chapter 6: Origin of Mineral Phases
99
This crystal growth mechanism, together with the previous lines of evidence, suggest
precipitation of the kln phase (together with cal3) during telogenetic alteration (sensu Morad
et al., 2000), related to uplift, exposure and continuous meteoric water circulation through
the basinal sequences. Alteration was especially intense along fault structures, which acted
as preferential conduits for water, whereby kaolinite growth was favoured within the large
pore spaces offered by the partly-filled fractures. This stage of fluid-rock interaction was
accompanied by strong oxidation of organic matter within the coal seams (Méndez-Cecilia,
1985; Frings, 2002), which contributed to the acidification of circulating waters.
Sample best mean alpha beta2 CSDCAN-01 11.7 2.22 0.51 not lognormalCAN-02 9.6 2.03 0.51 not lognormalCAN-06 7.7 1.76 0.51 not lognormalCAN-07 11.8 2.21 0.52 not lognormalCAN-08 7.7 1.83 0.4 not lognormalCAN-10 7.2 1.74 0.42 not lognormalCAN-24 7.3 1.76 0.44 not lognormalCAN-28 9.5 2 0.47 not lognormalCAN-30 9.5 2 0.51 not lognormalCAN-45 5.6 1.62 0.22 not lognormal
Table 7. List of calculated α-β2 parameters for samples of vein kaolinite (kln).
6.5 IMPLICATIONS FOR THE MINERAL GROWTH SEQUENCE
Based on the results presented here and on the earlier chapters, the mineral growth
sequence in the Stephanian rocks can be subdivided in three stages. The first was related
to the temperature rise before thermal peak conditions were achieved (stage 1), the se-
cond took place after the thermal peak, but still under burial conditions (stage 2), and the
final stage occurred during the uplift and exhumation of the basin fill (stage 3).
The first stage was characterised by limited dilation of the veins, with a low vein to
host rock ratio, and a close proximity between fluid and mineral sources. There are no
signs for fluid-rock chemical disequilibrium related to mineral precipitation in the form of
extensive wall-rock reactions, and advection-related mass-transport from an external
circulating fluid would require extremely large amounts of fluids (Bjørlykke, 1994; Worden
and Morad, 2000). It is considered more likely that vein materials were largely derived
from the detrital fraction within the Stephanian rocks, and transported into solution in
response to thermal, chemical and tectonic conditions. Therefore “local advection” of pore
fluids, accompanied perhaps by diffusion, seems the most likely mass-transport mechanism.
Chapter 6: Origin of Mineral Phases
100
Early transport was accompanied by rapid organic maturation during short-lived (hyper-
thermal) temperature increments (Teichmüller et al., 1987; Uysal et al., 2000). The ther-
mal increase was probably related to a combination of rapid burial and a high heat flux.
During this stage a large amount of gas and water would have been liberated in response
to organic-controlled reactions that dissolved silica and controlled quartz precipitation.
Subsequently, still during the thermal rise, volatile generation declined (during prograde
maturation) and mineral transformation reactions became predominant. Burial pore fluids
underwent a progressive enrichment in cations within solution and a consequent rise in
density. The amount of ions in solution inhibited gas solubility, reached fluid saturation and
caused local precipitation of Ca-Mg-Fe (the less soluble ions) rich carbonate phase, namely
the saddle dolomite (dolm).
Following thermal peak conditions, lower temperature diagenetic mineral dissolution-
precipitation reactions controlled composition and mineral growth (stage 2). Mineral growth
was related to vein reopening and dedolomitisation. A relative high fluid/rock ratio, and
therefore an external fluid source, is considered likely but a definite origin for the fluid
phase can not be determined. One possible source could have been the infiltration of
marine water, subsequently modified, during tectonic subsidence of the area in the
Cretaceous (Lobato et al., 1984).
Late alteration phases formed in response to low-T diagenetic and weathering
reactions of the exposed and subjacent Stephanian rocks (stage 3). Alteration and clay
mineral growth was controlled by a constant supply of meteoric water, which circulated
preferentially along fault structures reaching the deeper parts of the stratigraphic section.
Coal degradation and oxidation was associated with the acidification of the circulating
waters, favouring mineral dissolution (Al3+ and Ca2+) and carbonate-kaolinite precipitation,
which may well be active at the present day.
6.6. HYDROTHERMAL ALTERATION AND QUARTZ GROWTH IN DIORITES
The formation of quartz veins within the diorite rocks of the studied basins constitutes a
separate event in respect to the vein growth within the sedimentary sequence, and was
related to the hydrothermal alteration of the magma intruding along coal seams. The
alteration reactions of primary igneous minerals proceeded as irreversible, exothermic
transformations, which generally denote temperatures below 300°C (Alt, 1999). Some of
these reactions are:
HORNBLENDE ⇒ chlorite + carbonate + hematite BIOTITE ⇒ chlorite (± carbonate)
PLAGIOCLASE ⇒ carbonate + epidote CLINOPYROXENE ⇒ actinolite + chlorite
Chapter 6: Origin of Mineral Phases
101
In the case of the CMB and SB intrusions, dolomite was the main carbonate phase
formed instead of calcite (Fig. 23a). The absence of glass and the fine-grained size of
minerals are also indicative of subvolcanic conditions, i.e. pressures below 200 MPa
(Winkler, 1979). The fluid phase necessary to activate most of these transformations was
probably supplied by the abrupt transformation of coal to coke along the contact with the
magma at temperatures between 200° and 300°C. The coke aureoles surrounding the
intrusive bodies are generally several metres wide, and during formation liberated important
amounts of water, CH4 and CO2. The mineral reactions described would have released
minor amounts of silica into the “hot” circulating fluid, leading to precipitation of quartz in
the available fissures during the latter stages of cooling. The related fluid composition and
pressure-temperature conditions are reflected in the fluid system entrapped as primary
inclusions in qtz2 (chapter 5).
Kaolinite is present within qtz2 veins in two different forms. A first type occurs as
fragments trapped within primary fluid inclusions of the hydrothermal quartz and in very
minor amounts in the igneous host rock (Fig. 23a). The high mole fraction of CO2 in the
fluid (> 0.1 in the vapour phase) would have favoured the formation of carbonates, minor
clays, kaolinite and quartz; instead of the diagnostic Ca-Al minerals (Winkler, 1979;
Schiffman and Day, 1999). The second type of kaolinite, clearly the more abundant, was
related to a late low-temperature alteration of the hydrothermal quartz, probably cogenetic
to the kln phase.

Chapter 6: Origin of Mineral Phases
102
Chapter 7: Re-equilibration
103
CHAPTER 7: FLUID INCLUSION RE-EQUILIBRATION
In the two previous chapters the different generations of fluids, their composition, P-T-X
conditions and possible origin in the Sabero and Ciñera-Matallana basins have been
outlined. An important feature not yet considered is the widespread occurrence of fluid
inclusion re-equilibration in fissure quartz of the CMB. The low content of fissure quartz in
the sampled veins of the SB prevented from any analysis of the fluid inclusions, therefore,
the conclusions presented this chapter can not be extended to this basin.Fluid inclusions
should not be considered as simple cavities filled with fluid, but as an integrative system
which also comprises a part of the host mineral. The formation of fluid inclusions related
textures is controlled by three main factors: external geological processes (e.g. changes
in temperature-pressure), crystal dynamics of the host mineral and physico-chemical
processes at the crystal-fluid interface. Textures are then highly useful in order to draw
conclusions about the interaction between a fluid inclusion and its host mineral and of this
mineral with its environment.
The observed re-equilibration textures of type 1 and 2 inclusions in qtz1 mark the
onset of a specific event, which occurred at some stage following qtz1 crystallisation and
before the second generation of blocky calcite (cal2). This chapter examines the fluid
inclusion re-equilibration textures within the fissure quartz (qtz1) and demonstrates how
they provide excellent indication of high heat flow conditions experienced by the clastic
sediments within the high diagenetic to very low-grade metamorphic environment of the
CMB.
7.1. DEFINITION OF RE-EQUILIBRATION
The ideal isochoric model for fluid inclusions assumes that they behave as compositionally
and volumetrically closed systems after formation. When such conditions are fulfilled, the
inclusions preserve the original parent fluid, which in many cases represents that associated
with mineral growth. Re-equilibration is a term that encompasses any type of post-
entrapment modification that takes place in fluid inclusions as a result of a departure from
the P-T path of the original isochore for the inclusion (Fig. 61). This phenomenon has
been a matter of intense investigation by fluid inclusion researchers due to the importance
of evaluating any changes that may invalidate the interpretation of P-T-V-x formation
conditions. Quartz, both natural and synthetic, has received by far the most attention
(Pêcher, 1981; Gratier, 1982; Sterner and Bodnar, 1989; Bakker and Jansen, 1990).
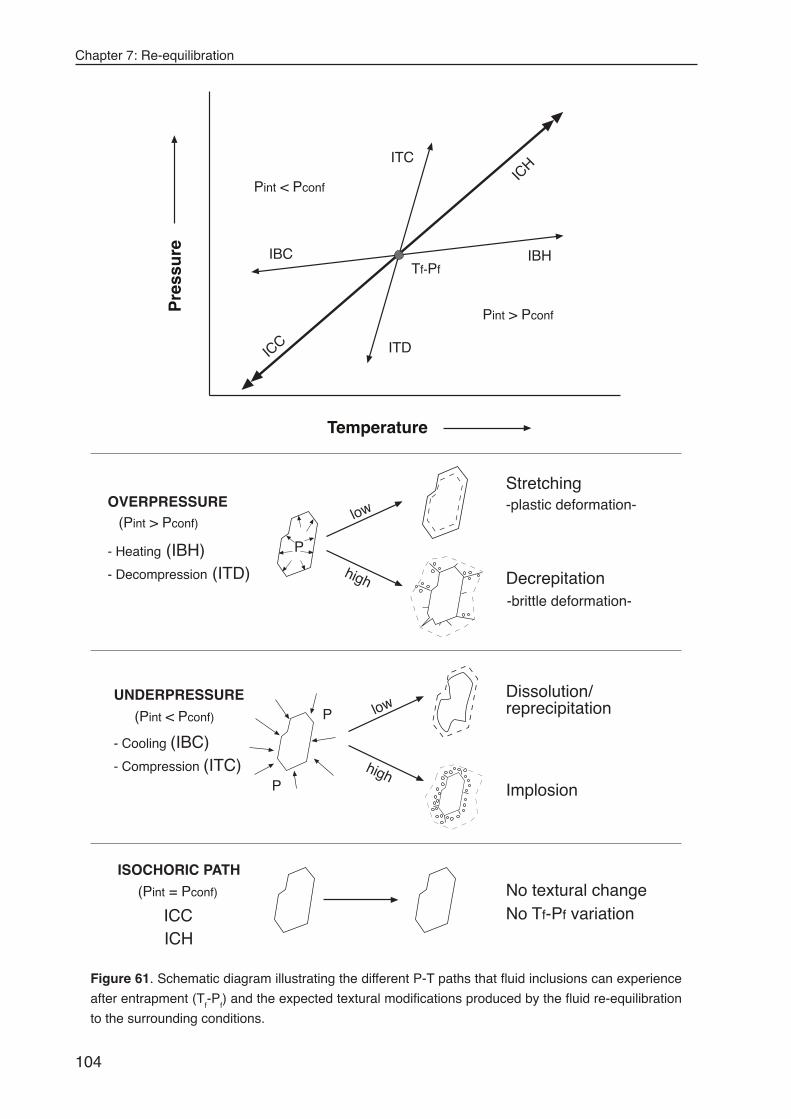
Chapter 7: Re-equilibration
104
Stretching
Decrepitation
Implosion
P
-plastic deformation-
P
P
-brittle deformation-
Temperature
Pre
ssu
reITC
IBH
ITD
IBC
Pint < Pconf
Pint > Pconf
ICC
ICH
Tf-Pf
Dissolution/reprecipitationlow
high
No textural changeNo Tf-Pf variation
low
high
OVERPRESSURE(Pint > Pconf)
- Heating (IBH)- Decompression (ITD)
UNDERPRESSURE
(Pint < Pconf)
- Cooling (IBC)- Compression (ITC)
ISOCHORIC PATH
(Pint = Pconf)
ICCICH
Figure 61. Schematic diagram illustrating the different P-T paths that fluid inclusions can experience
after entrapment (Tf-P
f) and the expected textural modifications produced by the fluid re-equilibration
to the surrounding conditions.
Chapter 7: Re-equilibration
105
Re-equilibration of fluid inclusions follows several intermediate and progressive
steps, namely, stretching, formation of irregular cavity walls, necking down, leakage and
finally, partial and total decrepitation (e.g. Roedder, 1984). Experimental research has
provided an insight into the variety of textural changes of fluid inclusions in natural rock.
Such studies characterise the types of textures related to specific re-equilibration paths,
and evaluate the relative importance of different factors that influence re-equilibration.
Size and shape of the inclusion, its fluid composition and the physical and chemical
properties of the host mineral have been shown to be important.
Textural variations caused by internal overpressure of fluid inclusions are considered
to be limited. Stretching, i.e. inelastic deformation of the inclusion wall is not a feature that
will be texturally preserved in natural rock (e.g. Bodnar and Bethke, 1984). Internal
overpressure may cause a fluid filled cavity to explode (decrepitation), if it exceeds the
lattice strength of the host mineral (Leroy, 1979; Gratier and Jenaton, 1984; Bodnar et al.,
1989; Vityk et al., 1994 and 1995). Such brittle deformation changes the shape of the
inclusion cavity creating cracks, which subsequently can be modified by recrystallisation
to form characteristic textures, such as extremely irregular shapes and planes of satellite
inclusions (i.e. decrepitation clusters). Pêcher (1981) and Bakker and Jansen (1991)
documented the formation of cracks at higher confining pressures, produced both during
internal overpressure and underpressure experiments, although some controversy exists
as to the formation of decrepitation clusters under experimental conditions (Sterner and
Bodnar, 1989).
Re-equilibration textures caused by internal underpressure are well documented
and display a wide variety of morphologies. Progressive stages of modification are
recognised as the parent inclusion is redistributed into the host mineral. Initially, scalloped
textures may develop by intense dissolution of the walls, resulting in highly irregular and
rough inclusion morphologies (Pêcher, 1981; Bakker and Jansen, 1991; Vityk et al., 1995;
Vityk and Bodnar, 1995). Arc, hook, ring and semi-annular textures develop during advanced
re-equilibration (Pêcher, 1981; Vityk and Bodnar, 1995). Audétat and Günther (1999)
observed similar structures in natural samples, where the migration of inclusions was
suggested to cause the formation of tails, giving the inclusions an arc-like appearance.
Three dimensional inclusion clusters or haloes of small secondary inclusions result from
further re-equilibration (e.g. Vityk and Bodnar, 1995). Such clusters are also reported as
implosion haloes (e.g. Sterner and Bodnar, 1989) or sweat haloes (e.g. Audétat and Günther,
1999). During the most advanced stages of re-equilibration, highly irregular dendritic-like
haloes develop with near closing of the parent inclusion (Sterner and Bodnar, 1989; Vityk
and Bodnar, 1995). The original fluid of the parent inclusion is redistributed in an irregular
shaped cloud of numerous small secondary inclusions.
Fluid inclusion studies of decrepitation features in natural samples have focused
on case studies from ore deposits (Foley et al., 1989) and from high to medium grade
metamorphic environments (Swanenberg, 1980, Boullier et al., 1991, Hurai and Horn,
Chapter 7: Re-equilibration
106
1992; Vityk et al., 1996; Küster and Stöckhert, 1997). These studies address the use of
decrepitated inclusions as indicators for thermal cracking of minerals (quartz) and as
geobarometers for tectonic reconstruction in orogens. In contrast, decrepitation in diagenetic
and very-low-grade metamorphic environments (sub-greenschist facies) has received little
attention. Here, studies have focused on the resetting of homogenisation temperatures
within calcite and quartz cements due to stretching of inclusions induced by overheating
and burial (Goldstein, 1986; Burruss, 1987b; Osborne and Haszeldine, 1993 and 1995).
7.2. RE-EQUILIBRATION TEXTURES IN VEIN QUARTZ (QTZ1)
A wide range of re-equilibration textures can be observed in type 1 and 2 inclusions of vein
quartz (qtz1) in the samples from the CMB basin (Fig. 62). Re-equilibration was, however,
not uniform. Both unaffected and highly modified inclusions may occur within the same
assemblage. A clear relationship has been observed between inclusion size and the intensity
of re-equilibration, whereby larger inclusions are typically more affected. A range of
intermediate stages of modification can be recognised in all qtz1 samples, including veins
that do not contain the latter cal2 mineralisation phase (sample 31, Table 1). The only
exception is sample 27, where only one textural variety was observed (Fig. 62c). The re-
equilibration textures identified are summarised as follows.
Scalloped inclusion walls
This first group of inclusions is characterised by numerous irregularities, sharp edges and
re-entrants in the inclusion walls, which suggests dissolution of the adjacent quartz. As a
consequence inclusions become corroded, and adopt chaotic and irregular shapes.
Therefore we use the term scalloped. This texture is predominant in large-sized inclusions
that are both liquid and vapour rich (Fig. 62a).
Annular-ring textures
These exhibit a variety of shapes, which show no relation to whether the inclusion is
aqueous or vapour-rich. A common feature to all is the smoothed, rounded and
crystallographically defined inclusion walls. One type is the arch-hook shape, in which the
ring is not totally closed (Fig. 62b). A second type consists of inclusions with a single,
relatively small patch of enclosed crystallised quartz, pillaring the inclusion walls. A third
type that occasionally occurs is comprised of tubular ring-shaped inclusions.
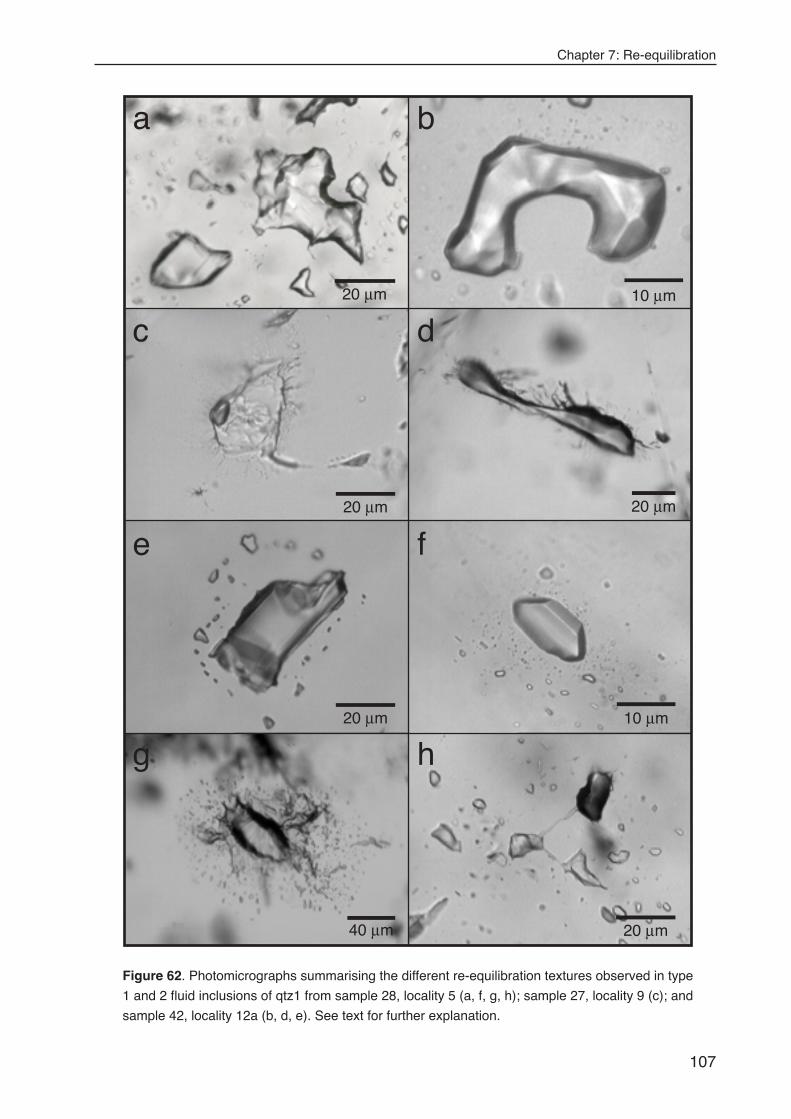
Chapter 7: Re-equilibration
107
a
c d
e f
g h
10 µm
10 µm20 µm
40 µm 20 µm
20 µm
20 µm
b
20 µm
Figure 62. Photomicrographs summarising the different re-equilibration textures observed in type
1 and 2 fluid inclusions of qtz1 from sample 28, locality 5 (a, f, g, h); sample 27, locality 9 (c); and
sample 42, locality 12a (b, d, e). See text for further explanation.
Chapter 7: Re-equilibration
108
Hairy textures
These inclusions have numerous micro-tubes or micro-fractures, which radiate from the
walls to give a hairy appearance. This texture occurs in both liquid-rich (Fig. 62c) and
vapour-rich inclusions (Fig. 62d). In detail these tubes have highly irregular forms and
very small diameters, and are generally filled with H2O (Raman detected). The larger
tubes and fractures typically occur around vapour-rich inclusions (Fig. 62d).
Haloes
Haloes are defined as a group of small daughter inclusions around a regular shaped
parent inclusion (Fig. 62e & f). They consist of either planar or three-dimensional arrays of
minute inclusions. In our examples, they occur preferentially around vapour-rich inclusions.
The daughter inclusions may outline the initial shape of the parent inclusion (Fig. 62e),
whereby both daughter and parent have negative crystal shapes and similar compositions.
But compositional differences were also observed in parent-daughter combinations (Fig.
62f). Inclusions with semi-irregular wall shapes may also develop such haloes.
Decrepitation clusters
True decrepitation clusters consist of single planar fractures branching out from the inclusion
walls in all directions and completely surround the parent inclusion (Fig. 62g). The fractures
did not heal completely, giving a very irregular appearance to the parent inclusion. The
numerous minute inclusions formed in the healed part of the fracture are also highly irregular,
in contrast to the haloes in Fig 62e & f. These clusters show absence of re-crystallised
inclusion-free quartz directly adjacent to the parent inclusion, and the fractured haloes are
more oval in shape. Such textures are observed around both liquid-rich and vapour-rich
inclusions.
Necking down
Typical necking-down textures are observed as small tubes of varying geometry that connect
larger inclusions (Fig. 62h). Total separation of fluid phases may occur when the connecting
tube is sealed, causing formation of all-liquid and all-vapour fluid inclusions. In the example
shown in Fig. 62h, phase separation has nearly reached completion, as the darker vapour-
rich part is connected by a narrow tube to the brighter aqueous-rich part.
Chapter 7: Re-equilibration
109
7.3. CONDITIONS AND MECHANISMS OF RE-EQUILIBRATION
The variety of textures observed in qtz1 indicates that several mechanisms operated
simultaneously during re-equilibration. Some of the previously described experimental re-
equilibration textures (especially scalloped and annular-ring structures) have been formed
at both internal over and underpressurised conditions. Variables other than temperature
and pressure alone play an important role in the development of re-equilibration textures.
Material properties of the host are usually completely ignored. Sterner et al. (1995)
suggested that even chemical potentials of fluid components inside the inclusions might
play an indirect role, at least in experimental studies.
In principle, two independent processes can change the morphology of individual
fluid inclusions: 1. mechanical decrepitation, i.e. sudden change in the total inclusion volume
by newly formed microcracks and/or dislocation arrays; 2. chemical dissolution and
precipitation of quartz on the inclusion walls. In the first mechanism, chemical interaction
between fluid and host mineral is excluded and the host mineral is considered as a
homogeneous solid medium.
A first approach is to consider re-equilibration simply as a brittle mechanical
phenomenon, described by physical variables such as pressure, temperature, inclusion
shape and volume. In the case of fluid overpressure the inclusion acts as an internally
pressurised crack (Lacazette, 1990). Fractures will generate and propagate from the
inclusion walls if the internal pressure is above the host mineral lattice strength. These
fractures tend to be planar and their orientation and intensity is governed by the mineral
properties. Nevertheless, crack growth may occur at stress levels below those necessary
to exceed lattice strength by mechanisms such as stress corrosion (by water), dissolution,
diffusion, ion exchange and microplasticity, all of which may be affected by the chemical
environment (e.g. Kronenberg et al., 1986)
Dissolution and precipitation of the host mineral (in this case quartz) is the main
mechanism by which fluid inclusions form. Inside inclusions, this process does not cease
after a pocket of fluid has been entrapped. Necking-down divides such pockets into many
inclusions, which tend to obtain negative crystal shapes. This process depends on the
solubility of the host mineral in the inclusion fluid, which is enhanced at higher pressures
and temperatures. The cause for the subsequent formation of irregular walls is, however,
unclear. As observed in internal underpressure experiments, fluid inclusions tend to be
redistributed as irregular clouds of many small inclusions. Transport of fluid away from the
parent inclusion may occur along microcracks or crystal defects, such as dislocations
(Bakker and Jansen, 1994). Some components of that fluid, especially water, may be
preferentially lost in response to gradients in pressure and/or water fugacity when re-
equilibration takes place. Consequently, quartz is transported in the opposite direction,
and the parent inclusion will tend to close. In the naturally re-equilibrated inclusions analysed
in this study, it has been observed that water (Raman detected) is the predominant
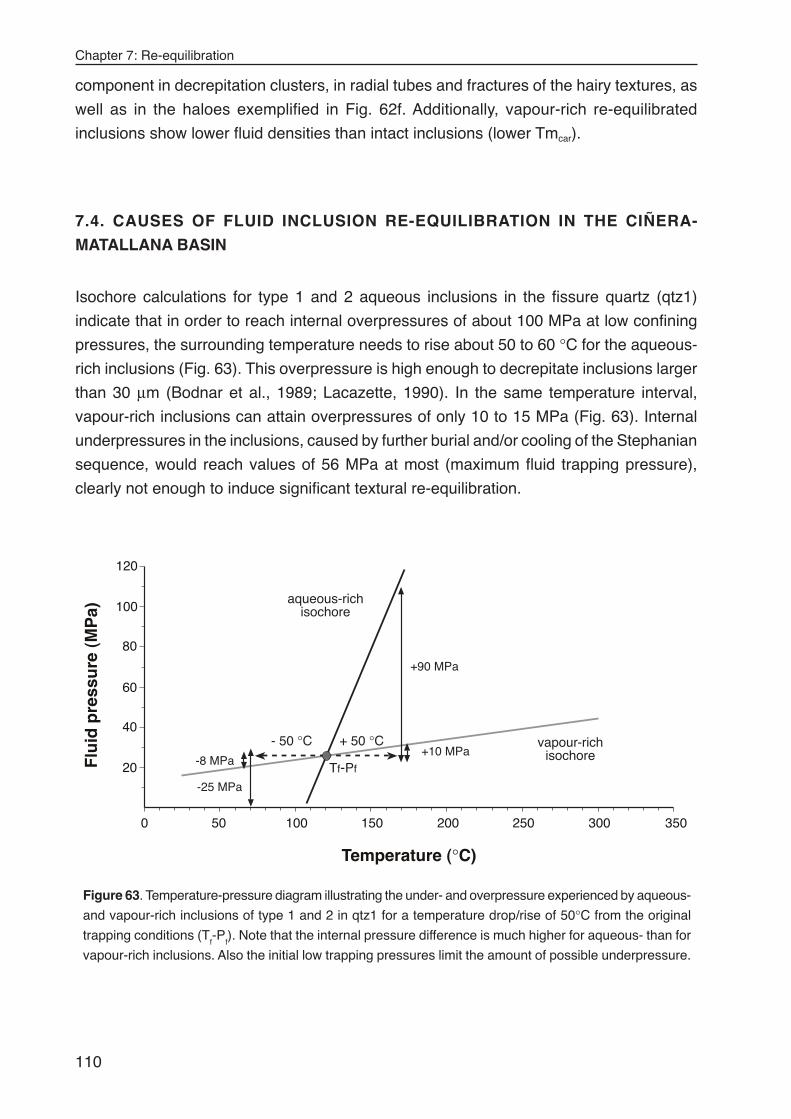
Chapter 7: Re-equilibration
110
component in decrepitation clusters, in radial tubes and fractures of the hairy textures, as
well as in the haloes exemplified in Fig. 62f. Additionally, vapour-rich re-equilibrated
inclusions show lower fluid densities than intact inclusions (lower Tmcar).
7.4. CAUSES OF FLUID INCLUSION RE-EQUILIBRATION IN THE CIÑERA-
MATALLANA BASIN
Isochore calculations for type 1 and 2 aqueous inclusions in the fissure quartz (qtz1)
indicate that in order to reach internal overpressures of about 100 MPa at low confining
pressures, the surrounding temperature needs to rise about 50 to 60 °C for the aqueous-
rich inclusions (Fig. 63). This overpressure is high enough to decrepitate inclusions larger
than 30 µm (Bodnar et al., 1989; Lacazette, 1990). In the same temperature interval,
vapour-rich inclusions can attain overpressures of only 10 to 15 MPa (Fig. 63). Internal
underpressures in the inclusions, caused by further burial and/or cooling of the Stephanian
sequence, would reach values of 56 MPa at most (maximum fluid trapping pressure),
clearly not enough to induce significant textural re-equilibration.
Flu
id p
ress
ure
(M
Pa)
0 50 100 150 200 250 300 350
Temperature (°C)
20
40
60
80
100
120
+ 50 °C
+90 MPa
+10 MPa- 50 °C
-8 MPa
-25 MPa
aqueous-richisochore
vapour-richisochore
Tf-Pf
Figure 63. Temperature-pressure diagram illustrating the under- and overpressure experienced by aqueous-
and vapour-rich inclusions of type 1 and 2 in qtz1 for a temperature drop/rise of 50°C from the original
trapping conditions (Tf-P
f). Note that the internal pressure difference is much higher for aqueous- than for
vapour-rich inclusions. Also the initial low trapping pressures limit the amount of possible underpressure.
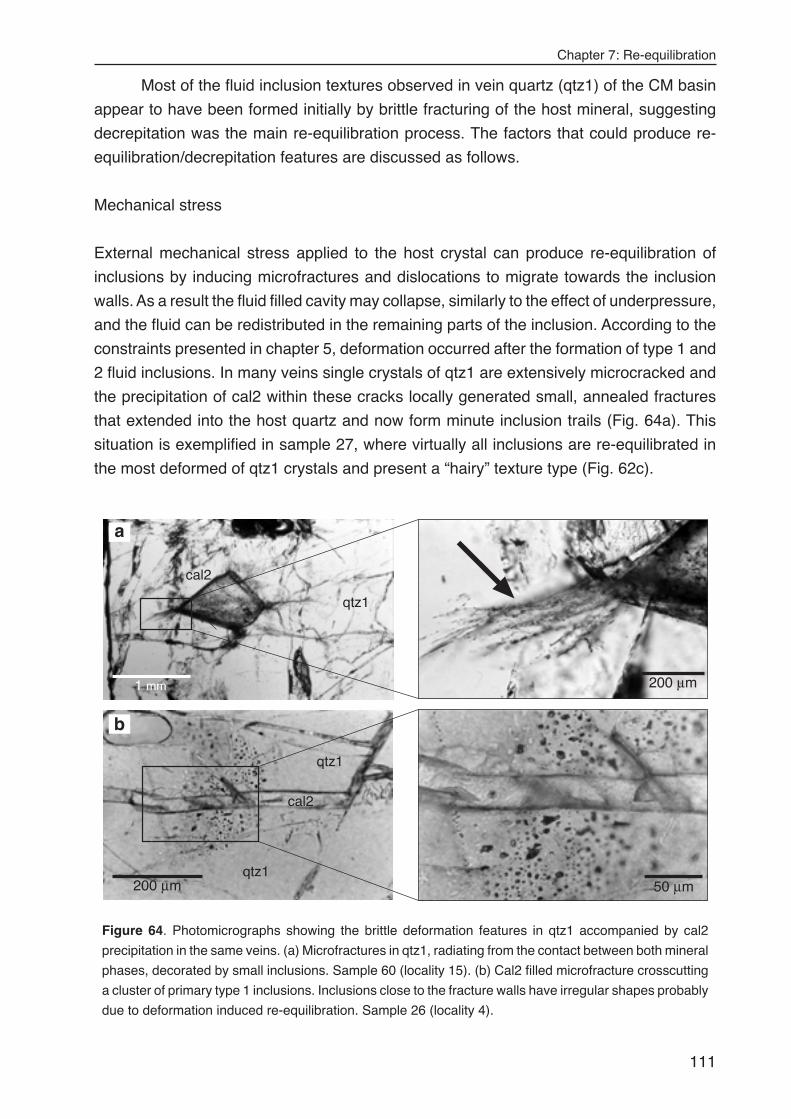
Chapter 7: Re-equilibration
111
Most of the fluid inclusion textures observed in vein quartz (qtz1) of the CM basin
appear to have been formed initially by brittle fracturing of the host mineral, suggesting
decrepitation was the main re-equilibration process. The factors that could produce re-
equilibration/decrepitation features are discussed as follows.
Mechanical stress
External mechanical stress applied to the host crystal can produce re-equilibration of
inclusions by inducing microfractures and dislocations to migrate towards the inclusion
walls. As a result the fluid filled cavity may collapse, similarly to the effect of underpressure,
and the fluid can be redistributed in the remaining parts of the inclusion. According to the
constraints presented in chapter 5, deformation occurred after the formation of type 1 and
2 fluid inclusions. In many veins single crystals of qtz1 are extensively microcracked and
the precipitation of cal2 within these cracks locally generated small, annealed fractures
that extended into the host quartz and now form minute inclusion trails (Fig. 64a). This
situation is exemplified in sample 27, where virtually all inclusions are re-equilibrated in
the most deformed of qtz1 crystals and present a “hairy” texture type (Fig. 62c).
1 mm 200 µm
qtz1
cal2
200 µm
cal2
qtz1
qtz150 µm
b
a
Figure 64. Photomicrographs showing the brittle deformation features in qtz1 accompanied by cal2
precipitation in the same veins. (a) Microfractures in qtz1, radiating from the contact between both mineral
phases, decorated by small inclusions. Sample 60 (locality 15). (b) Cal2 filled microfracture crosscutting
a cluster of primary type 1 inclusions. Inclusions close to the fracture walls have irregular shapes probably
due to deformation induced re-equilibration. Sample 26 (locality 4).
Chapter 7: Re-equilibration
112
Nevertheless, intracrystalline deformation features, such as twinning, pressure shadows,
undulose extinction, and the development of subgrain boundaries, are rare or absent in
most samples. Optical extinction between fracture planes is mostly sharp and uniform. In
addition, re-equilibration textures are observed in both intensively cracked quartz and in
virtually undeformed crystals (e.g. sample 31). Moreover, the main effect of brittle fracturing
at this stage of development would be expected to cause refilling of original inclusions
with the highly saline fluid responsible for cal2 precipitation (compositional re-equilibration).
This feature is locally observed when the microcracks forming type 3 inclusions cut type 1
and 2 assemblages, but the inclusions affected can be clearly differentiated from other re-
equilibrated ones (e.g. sample 31; appendix table). Therefore, it is considered that apart
from cases of direct cross cutting (Fig. 64b), fracturing has not altered the properties of
pre-existing fluid inclusions and external mechanical stress can be excluded as the principle
cause of inclusion re-equilibration.
Decompression
A decrease in the confining pressure of the host quartz is a feature that may result from
fast erosion and/or rapid uplift rates. The original fluid trapping pressures of primary
inclusions (and hence for the mineral crystallisation) were low for qtz1, and ranged between
10 and 56 MPa. A fast uplift of the sequence caused by erosion and/or exhumation would
not generate a pressure gradient high enough to induce extensive decrepitation, since a
minimum pressure difference of 85 MPa is required in quartz to influence a fluid inclusion
as large as 35 µm (e.g. Lacazette, 1990). The required pressure difference becomes
much higher as the inclusion size decreases. The CMB basin is estimated to have reached
a maximum thickness of 2500m (Villegas, pers. comm.; Frings, 2002), and it was overlain
by a thin discordant sequence of Cretaceous cover, with a preserved thickness between
150 and 450 m in areas nearby (Lobato et al., 1984; and Alonso et al., 1990). This represents
an extra burial confining pressure of 40 MPa at most, assuming lithostatic conditions and
maximum thickness of sedimentary cover. Vein samples of qtz1 with decrepitated inclusions
are reported throughout the stratigraphic sequence of the basin (Pastora to Bienvenidas
Formations), and no difference has been observed in the intensity and character of the
textures in relation to burial depth. These features also indicate that P-T paths that generate
fluid underpressure within inclusions (cooling and burial) are not realistic causes of re-
equilibration in this setting.
Heating
Maximum temperatures reached in the sedimentary succession can be estimated to have
not exceeded 170-220 °C, based on the conversion of vitrinite reflectance values with the
formula of Barker and Pawlewicz (1986) presented in Table 8. Such estimates are also in
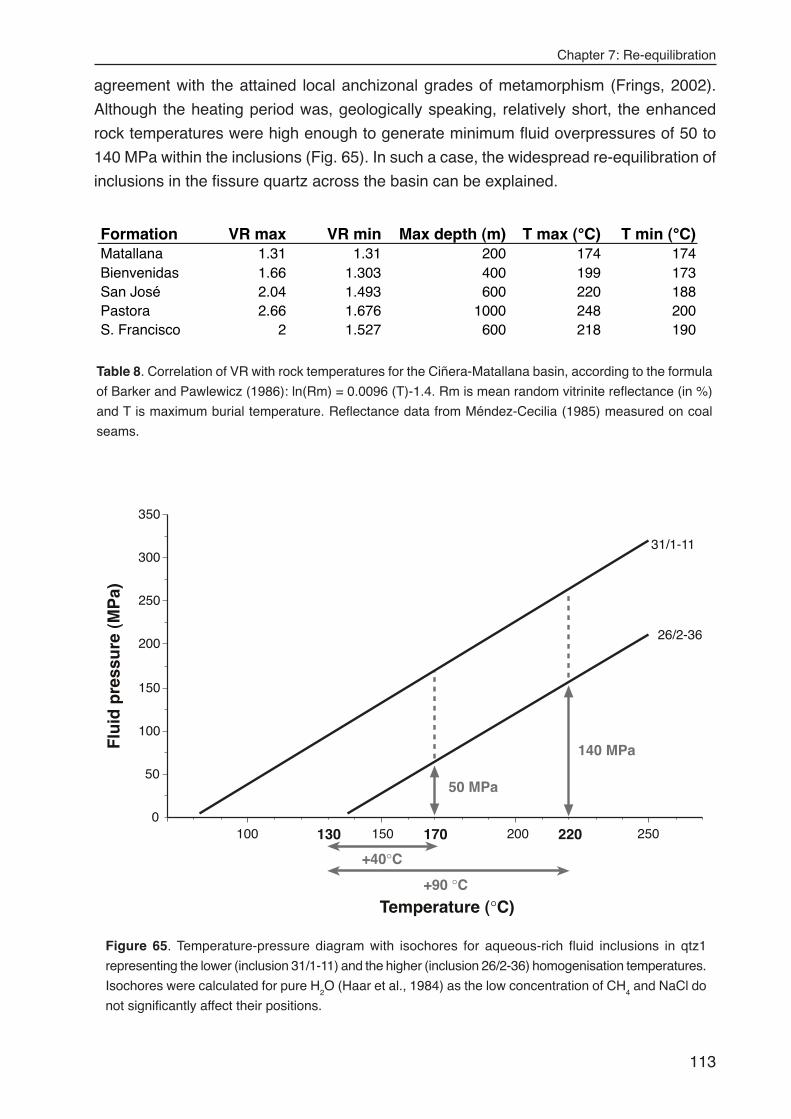
Chapter 7: Re-equilibration
113
Formation VR max VR min Max depth (m) T max (°C) T min (°C)Matallana 1.31 1.31 200 174 174Bienvenidas 1.66 1.303 400 199 173San José 2.04 1.493 600 220 188Pastora 2.66 1.676 1000 248 200S. Francisco 2 1.527 600 218 190
Table 8. Correlation of VR with rock temperatures for the Ciñera-Matallana basin, according to the formula
of Barker and Pawlewicz (1986): ln(Rm) = 0.0096 (T)-1.4. Rm is mean random vitrinite reflectance (in %)
and T is maximum burial temperature. Reflectance data from Méndez-Cecilia (1985) measured on coal
seams.
agreement with the attained local anchizonal grades of metamorphism (Frings, 2002).
Although the heating period was, geologically speaking, relatively short, the enhanced
rock temperatures were high enough to generate minimum fluid overpressures of 50 to
140 MPa within the inclusions (Fig. 65). In such a case, the widespread re-equilibration of
inclusions in the fissure quartz across the basin can be explained.
140 MPa
50 MPa
+90 °C
+40°C
0
50
100
150
200
250
300
350
100 150 200 250
Temperature (°C)
31/1-11
26/2-36
Flu
id p
ress
ure
(M
Pa)
130 170 220
Figure 65. Temperature-pressure diagram with isochores for aqueous-rich fluid inclusions in qtz1
representing the lower (inclusion 31/1-11) and the higher (inclusion 26/2-36) homogenisation temperatures.
Isochores were calculated for pure H2O (Haar et al., 1984) as the low concentration of CH
4 and NaCl do
not significantly affect their positions.
Chapter 7: Re-equilibration
114
There are strong reasons for relating peak palaeotemperatures and therefore inclusion
decrepitation to the high heat flow associated with Permian igneous activity. This line of
evidence is of key importance for the discussion of possible mechanisms of heat
transmission and for the reconstruction of the thermal-fluid history of the Stephanian basins
(particularly of CMB), as analysed in detail in the next chapters.
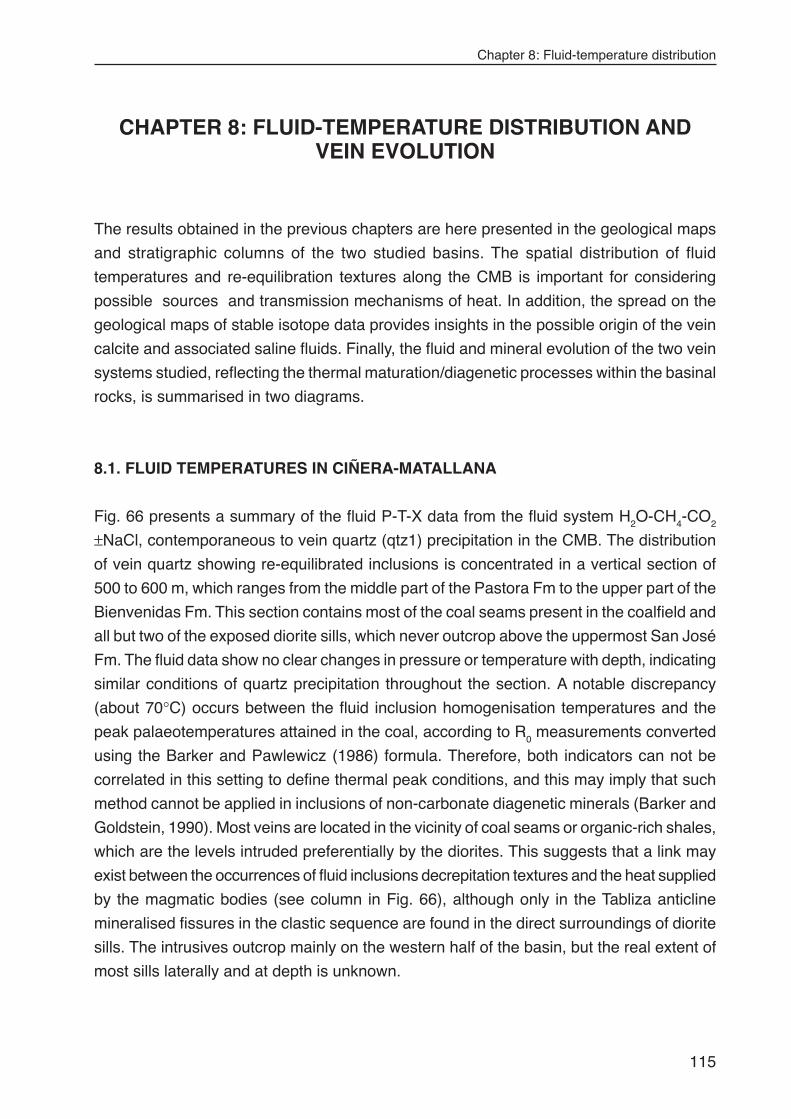
Chapter 8: Fluid-temperature distribution
115
CHAPTER 8: FLUID-TEMPERATURE DISTRIBUTION ANDVEIN EVOLUTION
The results obtained in the previous chapters are here presented in the geological maps
and stratigraphic columns of the two studied basins. The spatial distribution of fluid
temperatures and re-equilibration textures along the CMB is important for considering
possible sources and transmission mechanisms of heat. In addition, the spread on the
geological maps of stable isotope data provides insights in the possible origin of the vein
calcite and associated saline fluids. Finally, the fluid and mineral evolution of the two vein
systems studied, reflecting the thermal maturation/diagenetic processes within the basinal
rocks, is summarised in two diagrams.
8.1. FLUID TEMPERATURES IN CIÑERA-MATALLANA
Fig. 66 presents a summary of the fluid P-T-X data from the fluid system H2O-CH4-CO2
±NaCl, contemporaneous to vein quartz (qtz1) precipitation in the CMB. The distribution
of vein quartz showing re-equilibrated inclusions is concentrated in a vertical section of
500 to 600 m, which ranges from the middle part of the Pastora Fm to the upper part of the
Bienvenidas Fm. This section contains most of the coal seams present in the coalfield and
all but two of the exposed diorite sills, which never outcrop above the uppermost San José
Fm. The fluid data show no clear changes in pressure or temperature with depth, indicating
similar conditions of quartz precipitation throughout the section. A notable discrepancy
(about 70°C) occurs between the fluid inclusion homogenisation temperatures and the
peak palaeotemperatures attained in the coal, according to R0 measurements converted
using the Barker and Pawlewicz (1986) formula. Therefore, both indicators can not be
correlated in this setting to define thermal peak conditions, and this may imply that such
method cannot be applied in inclusions of non-carbonate diagenetic minerals (Barker and
Goldstein, 1990). Most veins are located in the vicinity of coal seams or organic-rich shales,
which are the levels intruded preferentially by the diorites. This suggests that a link may
exist between the occurrences of fluid inclusions decrepitation textures and the heat supplied
by the magmatic bodies (see column in Fig. 66), although only in the Tabliza anticline
mineralised fissures in the clastic sequence are found in the direct surroundings of diorite
sills. The intrusives outcrop mainly on the western half of the basin, but the real extent of
most sills laterally and at depth is unknown.
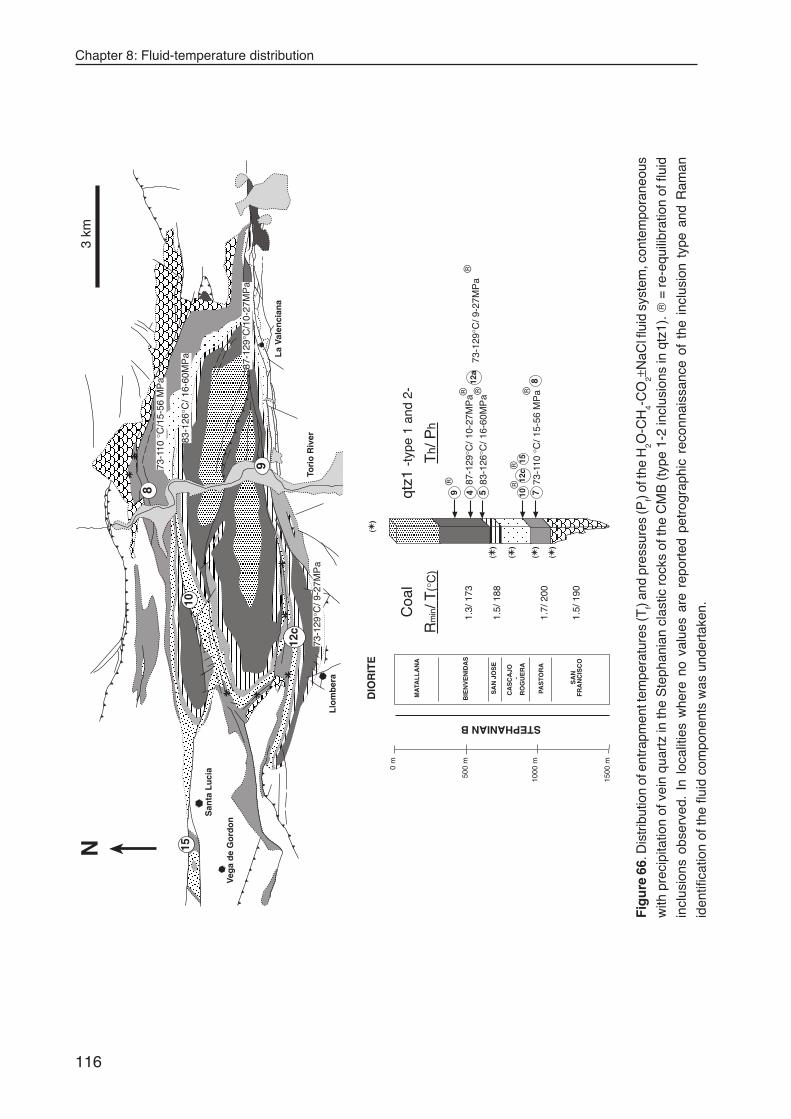
Chapter 8: Fluid-temperature distribution
116
73-1
10 °
C/ 1
5-56
MP
a
87-1
29°C
/ 10-
27M
Pa
12a
12c
qtz1
-typ
e 1
and
2-
Th/
Ph
Tori
o R
iver
Llo
mb
era
San
ta L
uci
a
Veg
a d
e G
ord
on
3 km
N
()
Rm
in/ T
(°C
)
1.3/
173
1.5/
188
1.7/
200
1.5/
190
Coa
l
500
m
0 m
MA
TAL
LA
NA
BIE
NV
EN
IDA
S
SA
N J
OS
E
CA
SC
AJO
-R
OG
UE
RA
PAS
TOR
A
SA
NF
RA
NC
ISC
O
STEPHANIAN B
DIO
RIT
E
1500
m
1000
m
()
()
()
()
83-1
26°C
/ 16-
60M
Pa
83-1
26°C
/ 16-
60M
Pa 73
-129
°C/ 9
-27M
Pa
73-1
29°C
/ 9-2
7MP
a
12c
®®
®
®®
®®
87-1
29°C
/10-
27M
Pa
73-1
10 °
C/1
5-56
MP
a
15
8749 105
15
8
9
10
La
Val
enci
ana
Fig
ure
66.
Dis
trib
utio
n of
ent
rapm
ent t
empe
ratu
res
(Tf)
and
pres
sure
s (P
f) of
the
H2O
-CH
4-C
O2±N
aCl f
luid
sys
tem
, con
tem
pora
neou
s
with
pre
cipi
tatio
n of
vei
n qu
artz
in th
e S
teph
ania
n cl
astic
roc
ks o
f the
CM
B (
type
1-2
incl
usio
ns in
qtz
1).
= r
e-eq
uilib
ratio
n of
flui
d
incl
usio
ns o
bser
ved.
In
loca
litie
s w
here
no
valu
es a
re r
epor
ted
petr
ogra
phic
rec
onna
issa
nce
of t
he i
nclu
sion
typ
e an
d R
aman
iden
tific
atio
n of
the
fluid
com
pone
nts
was
und
erta
ken.
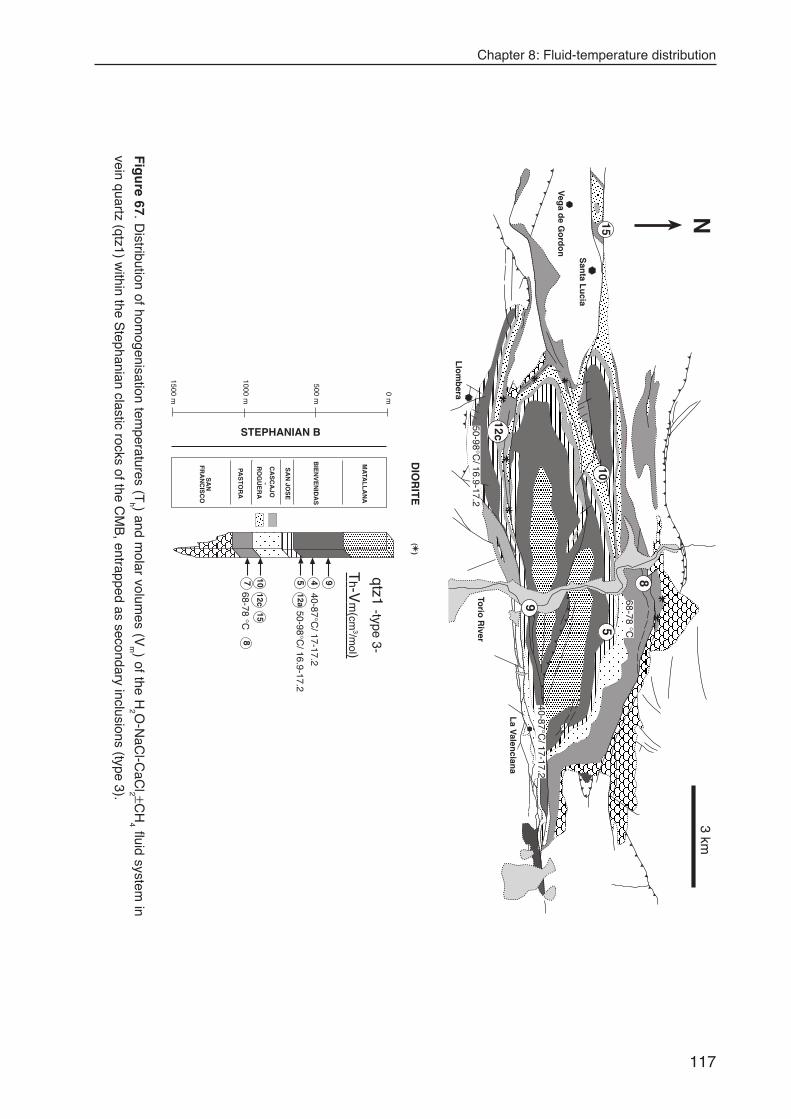
Chapter 8: Fluid-temperature distribution
117
1500 m
1000 m
500 m
0 m
MA
TAL
LA
NA
BIE
NV
EN
IDA
S
SA
N JO
SE
CA
SC
AJO
-R
OG
UE
RA
PAS
TOR
A
SA
NF
RA
NC
ISC
O
STEPHANIAN B
68-78 °C
40-87°C/ 17-17.2
50-98°C/ 16.9-17.2
12a
12c
qtz1 -type 3-
Th-V
m(cm
3/mol)
DIO
RIT
E
Torio
River
Llo
mb
era
San
ta Lu
cia
Veg
a de G
ord
on
3 kmN
12c
()
68-78 °C
40-87°C/ 17-17.2
50-98°C/ 16.9-17.2
8
4 910715
5
15
8
5
9
10
La V
alencian
a
Fig
ure 67. D
istribution of homogenisation tem
peratures (Th ) and m
olar volumes (V
m ) of the H2 O
-NaC
l-CaC
l2 ±CH
4 fluid system in
vein quartz (qtz1) within the S
tephanian clastic rocks of the CM
B, entrapped as secondary inclusions (type 3).
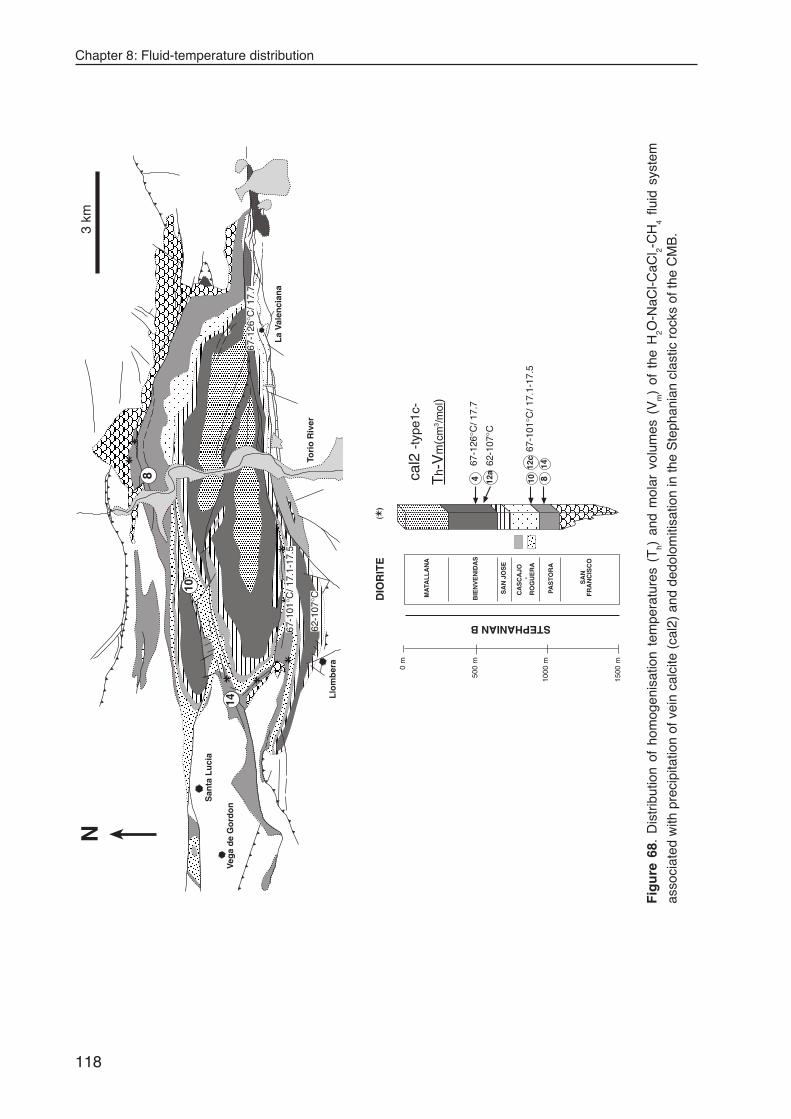
Chapter 8: Fluid-temperature distribution
118
Tori
o R
iver
Llo
mb
era
San
ta L
uci
a
Veg
a d
e G
ord
on
3 km
N
1500
m
1000
m
500
m
0 m
MA
TAL
LA
NA
BIE
NV
EN
IDA
S
SA
N J
OS
E
CA
SC
AJO
-R
OG
UE
RA
PAS
TOR
A
SA
NF
RA
NC
ISC
O
STEPHANIAN B
DIO
RIT
E
67-1
26°C
/ 17.
7
62-1
07°C
12a
12c
67-1
01°C
/ 17.
1-17
.5
cal2
-typ
e1c-
Th-
Vm
(cm
3 /mol
)
67-1
26°C
/ 17.
7
62-1
07°C
67-1
01°C
/ 17.
1-17
.5
()
8
10
14
84 10
14
La
Val
enci
ana
Fig
ure
68.
Dis
trib
utio
n of
hom
ogen
isat
ion
tem
pera
ture
s (T
h) a
nd m
olar
vol
umes
(V
m)
of t
he H
2O-N
aCl-C
aCl 2-
CH
4 flu
id s
yste
m
asso
ciat
ed w
ith p
reci
pita
tion
of v
ein
calc
ite (
cal2
) an
d de
dolo
miti
satio
n in
the
Ste
phan
ian
clas
tic r
ocks
of t
he C
MB
.
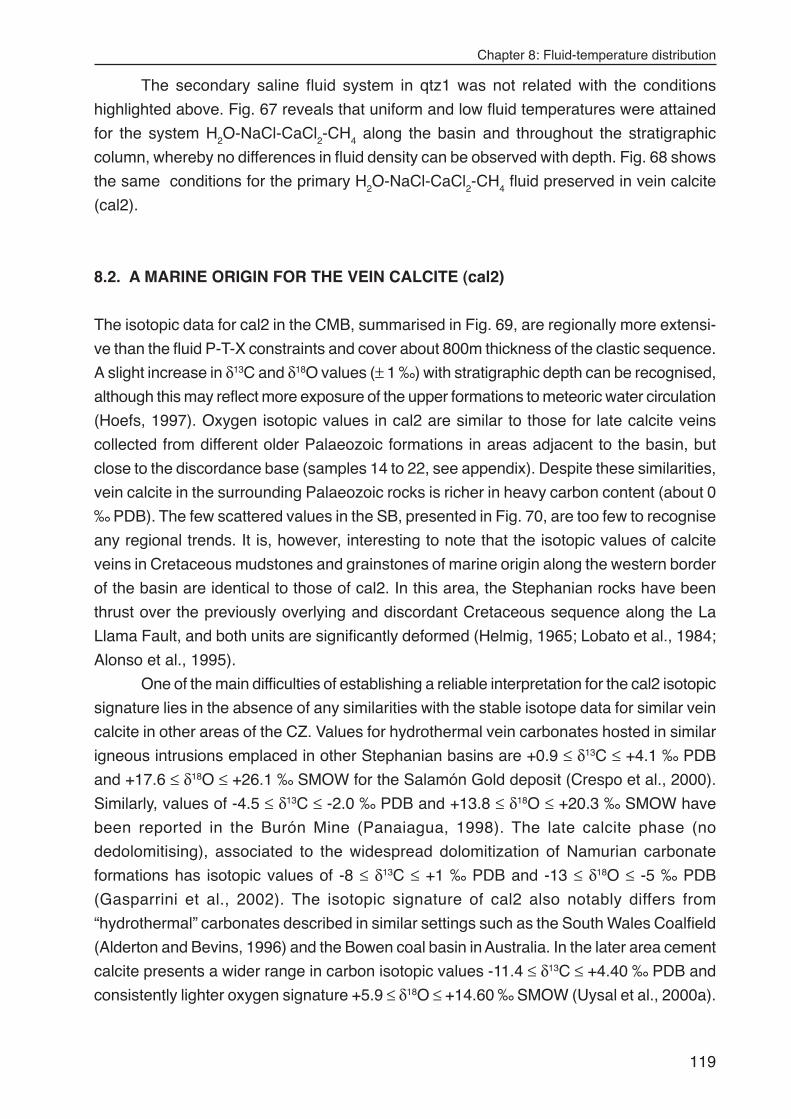
Chapter 8: Fluid-temperature distribution
119
The secondary saline fluid system in qtz1 was not related with the conditions
highlighted above. Fig. 67 reveals that uniform and low fluid temperatures were attained
for the system H2O-NaCl-CaCl2-CH4 along the basin and throughout the stratigraphic
column, whereby no differences in fluid density can be observed with depth. Fig. 68 shows
the same conditions for the primary H2O-NaCl-CaCl2-CH4 fluid preserved in vein calcite
(cal2).
8.2. A MARINE ORIGIN FOR THE VEIN CALCITE (cal2)
The isotopic data for cal2 in the CMB, summarised in Fig. 69, are regionally more extensi-
ve than the fluid P-T-X constraints and cover about 800m thickness of the clastic sequence.
A slight increase in δ13C and δ18O values (± 1 ‰) with stratigraphic depth can be recognised,
although this may reflect more exposure of the upper formations to meteoric water circulation
(Hoefs, 1997). Oxygen isotopic values in cal2 are similar to those for late calcite veins
collected from different older Palaeozoic formations in areas adjacent to the basin, but
close to the discordance base (samples 14 to 22, see appendix). Despite these similarities,
vein calcite in the surrounding Palaeozoic rocks is richer in heavy carbon content (about 0
‰ PDB). The few scattered values in the SB, presented in Fig. 70, are too few to recognise
any regional trends. It is, however, interesting to note that the isotopic values of calcite
veins in Cretaceous mudstones and grainstones of marine origin along the western border
of the basin are identical to those of cal2. In this area, the Stephanian rocks have been
thrust over the previously overlying and discordant Cretaceous sequence along the La
Llama Fault, and both units are significantly deformed (Helmig, 1965; Lobato et al., 1984;
Alonso et al., 1995).
One of the main difficulties of establishing a reliable interpretation for the cal2 isotopic
signature lies in the absence of any similarities with the stable isotope data for similar vein
calcite in other areas of the CZ. Values for hydrothermal vein carbonates hosted in similar
igneous intrusions emplaced in other Stephanian basins are +0.9 ≤ δ13C ≤ +4.1 ‰ PDB
and +17.6 ≤ δ18O ≤ +26.1 ‰ SMOW for the Salamón Gold deposit (Crespo et al., 2000).
Similarly, values of -4.5 ≤ δ13C ≤ -2.0 ‰ PDB and +13.8 ≤ δ18O ≤ +20.3 ‰ SMOW have
been reported in the Burón Mine (Panaiagua, 1998). The late calcite phase (no
dedolomitising), associated to the widespread dolomitization of Namurian carbonate
formations has isotopic values of -8 ≤ δ13C ≤ +1 ‰ PDB and -13 ≤ δ18O ≤ -5 ‰ PDB
(Gasparrini et al., 2002). The isotopic signature of cal2 also notably differs from
“hydrothermal” carbonates described in similar settings such as the South Wales Coalfield
(Alderton and Bevins, 1996) and the Bowen coal basin in Australia. In the later area cement
calcite presents a wider range in carbon isotopic values -11.4 ≤ δ13C ≤ +4.40 ‰ PDB and
consistently lighter oxygen signature +5.9 ≤ δ18O ≤ +14.60 ‰ SMOW (Uysal et al., 2000a).
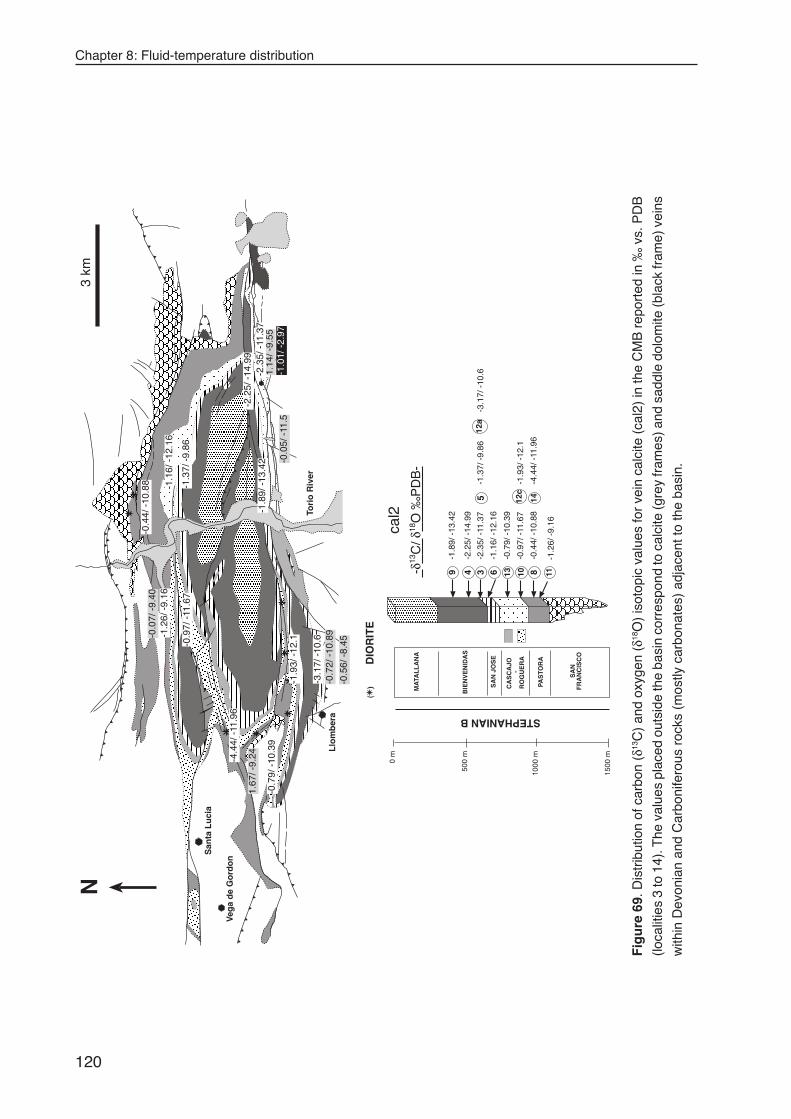
Chapter 8: Fluid-temperature distribution
120
1500
m
1000
m
500
m
0 m
MA
TAL
LA
NA
BIE
NV
EN
IDA
S
SA
N J
OS
E
CA
SC
AJO
-R
OG
UE
RA
PAS
TOR
A
SA
NF
RA
NC
ISC
O
STEPHANIAN B
-1.8
9/ -
13.4
2
-2.2
5/ -
14.9
9
-1.2
6/ -
9.16
-0.4
4/ -
10.8
8-4
.44/
-11
.96
-1.1
6/ -
12.1
6
-0.7
9/ -
10.3
9
-0.9
7/ -
11.6
7-1
.93/
-12
.1
-2.3
5/ -
11.3
7-1
.37/
-9.
86-3
.17/
-10
.612
a
12c
DIO
RIT
E
cal2
-δ13
C/ δ
18O
‰P
DB
-
Tori
o R
iver
Llo
mb
era
San
ta L
uci
a
Veg
a d
e G
ord
on
3 km
N
1.14
/ -9.
55
-0.0
5/ -
11.5
-0.0
7/ -
9.40
-0.5
6/ -
8.45
-0.7
2/ -
10.8
9
1.67
/ -9.
24
-1.0
1/ -
2.97
()
-1.9
3/ -
12.1
-1.8
9/ -
13.4
2
-2.
25/ -
14.9
9
-1.2
6/ -
9.16
-0.4
4/ -
10.8
8
-4.4
4/ -
11.9
6
-1.1
6/ -
12.1
6
-0.7
9/ -
10.3
9
-0.9
7/ -
11.6
7
-2.
35/ -
11.3
7
-1.3
7/ -
9.86
-3.1
7/ -
10.6
11849 3 10
14
13
56
Fig
ure
69.
Dis
trib
utio
n of
car
bon
(δ13
C)
and
oxyg
en (
δ18O
) is
otop
ic v
alue
s fo
r ve
in c
alci
te (
cal2
) in
the
CM
B r
epor
ted
in ‰
vs.
PD
B
(loca
litie
s 3
to 1
4). T
he v
alue
s pl
aced
out
side
the
basi
n co
rres
pond
to c
alci
te (g
rey
fram
es) a
nd s
addl
e do
lom
ite (b
lack
fram
e) v
eins
with
in D
evon
ian
and
Car
boni
fero
us r
ocks
(m
ostly
car
bona
tes)
adj
acen
t to
the
basi
n.
Chapter 8: Fluid-temperature distribution
121
PE
RL
A B
ED
S
UN
ICA
BE
DS
HE
RR
ER
A B
ED
S
QU
EM
AD
AS
FM
SU
CE
SIVA
FM
GO
NZ
AL
O F
M
RA
PO
SA
FM
AL
EJIC
O B
ED
S
0 m
STEPHANIAN BSTEPHANIAN A
400 m
800 m
1200 m
1600 m
2000 m
-1.09/ -13.75
-1.82/ -10.97-7.21/ -13.81
cal2-δ
13C/ δ
18O ‰
PD
B-
cal2T
h-Vm
( cm3/m
ol)
60-120°C/17.8-17.9
Sab
ero
2 km
DIO
RIT
E (
)
-2.14/ -13.55
-2.04/ -11.6
Esla
River
N-1.82/ -10.97-7.21/ -13.81
-1.09/ -13.7560-120°C
/17.8-17.9
1.61/ -3.48
12
Fig
ure 70. D
istribution of carbon (δ13C
) and oxygen (δ18O
) isotopic values for vein calcite (cal2) in the SB
, reported in ‰ vs. P
DB
(localities 1 and 2). The values placed outside the basin correspond to calcite (grey fram
es) and saddle dolomite (black fram
e) veins
within C
retaceous and Devonian carbonates, respectively, adjacent to the basin. A
lso reported are the Th and V
m of the H2 O
-NaC
l-CaC
l2 -
CH
4 system in locality 1.
Chapter 8: Fluid-temperature distribution
122
Given this situation, the following scenario is proposed for the genesis of vein calcite.
The temperate brine precipitating cal2, which has mean values around 0 ‰ SMOW for the
precipitating fluid (Fig. 58, chapter 6), is suggested to have been derived from infiltrated
and modified late Cretaceous marine water hosted in the underlying Stephanian clastic
sequence. The temperature range of the fluid (Th) matches well with expected regional
rock temperatures during Cretacous-Tertiary times by assuming about 1.5 km thickness
for the Mesozoic cover and eroded Stephanian rocks and considering 33°C/km of
geothermal gradient. This gradient has been adopted on the basis of present day borehole
temperatures crossing the discordance between the Stephanian and older Palaeozoic
rocks, and considering also the thermal stability of the crust beneath the southern margin
of the CZ since the Cretaceous (Alonso et al., 1995). In the Matallana syncline (CMB), at
a depth of 1140m, the temperature has been determined to be about 38°C (Villegas, 1996).
The slightly higher fluid temperatures of cal2 in the SB would be expected due to the
larger thickness of the clastic sequence in this basin.
8.3. FLUID AND THERMAL EVOLUTION OF THE STUDIED VEINS
Veins in the clastic Stephanian rocks
The evolution of the different minerals and associated fluid systems, in correspondence
with the opening events in the veins of the clastic rocks of the CMB is illustrated in Fig. 71.
No calcite or quartz cements with measurable inclusions were found in the host sandstones,
even in areas close to the veins. Therefore, any fluid that has circulated through, or is
derived from the clastic rocks is considered to be best represented in the studied mineralised
fissures.Together with the fluid composition and conditions, the process responsible for
the formation of each of the fluid systems is interpreted. At least seven different fluid types
have been recognised, which can be related with at least two main vein-opening events.
P-T-X characteristics of five of these fluids have been described in detail in chapter 5. The
mineral sequence “quartz → dolomite → late calcite” has also been recognised in ore
mineralisations in the south of the Cantabrian zone (Paniagua, 1998 and pers. comm.),
and in coal basins of similar geological settings (South Wales and Appalachians).
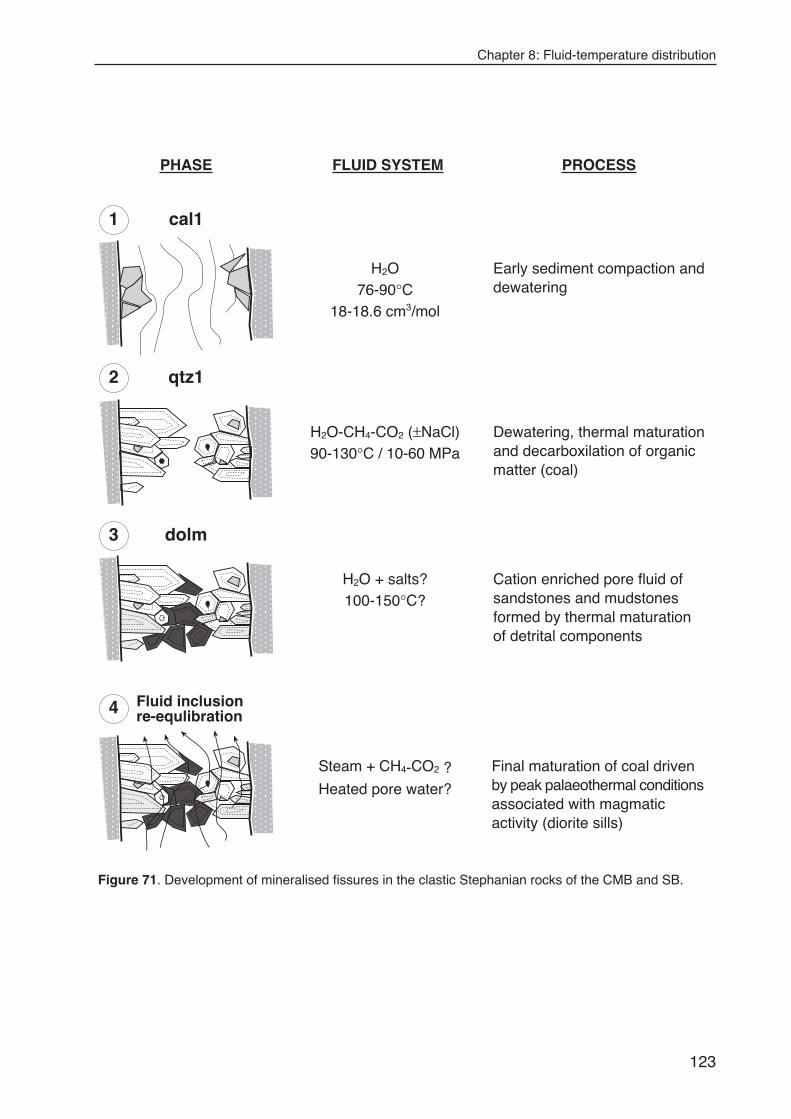
Chapter 8: Fluid-temperature distribution
123
PHASE FLUID SYSTEM
H2O-CH4-CO2 (±NaCl)90-130°C / 10-60 MPa
H2O + salts?100-150°C?
H2O76-90°C
18-18.6 cm3/mol
Dewatering, thermal maturationand decarboxilation of organicmatter (coal)
Early sediment compaction anddewatering
Cation enriched pore fluid ofsandstones and mudstonesformed by thermal maturationof detrital components
Fluid inclusionre-equlibration
Final maturation of coal drivenby peak palaeothermal conditionsassociated with magmaticactivity (diorite sills)
dolm
qtz1
cal1
PROCESS
Steam + CH4-CO2 ?Heated pore water?
2
1
3
4
Figure 71. Development of mineralised fissures in the clastic Stephanian rocks of the CMB and SB.
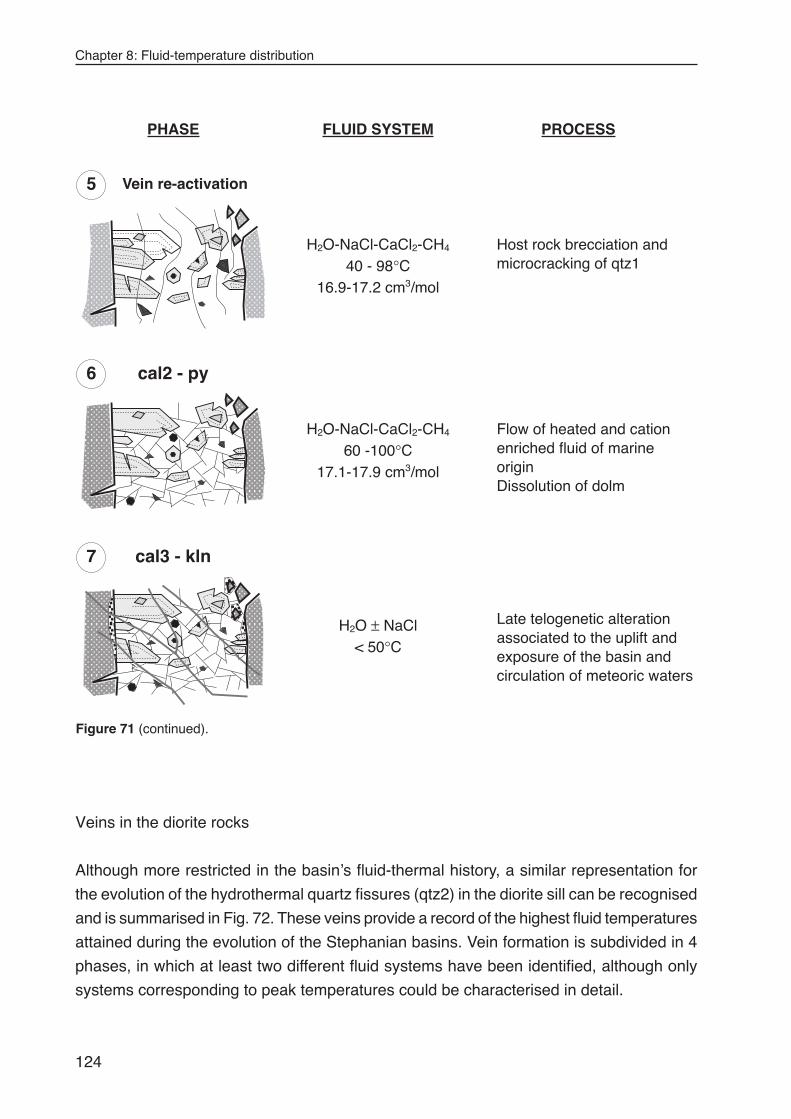
Chapter 8: Fluid-temperature distribution
124
Flow of heated and cationenriched fluid of marineoriginDissolution of dolm
H2O-NaCl-CaCl2-CH4
60 -100°C17.1-17.9 cm3/mol
H2O ± NaCl< 50°C
Late telogenetic alterationassociated to the uplift andexposure of the basin andcirculation of meteoric waters
cal2 - py
cal3 - kln
H2O-NaCl-CaCl2-CH4
40 - 98°C16.9-17.2 cm3/mol
Vein re-activation5
6
7
PHASE FLUID SYSTEM PROCESS
Host rock brecciation andmicrocracking of qtz1
Figure 71 (continued).
Veins in the diorite rocks
Although more restricted in the basin’s fluid-thermal history, a similar representation for
the evolution of the hydrothermal quartz fissures (qtz2) in the diorite sill can be recognised
and is summarised in Fig. 72. These veins provide a record of the highest fluid temperatures
attained during the evolution of the Stephanian basins. Vein formation is subdivided in 4
phases, in which at least two different fluid systems have been identified, although only
systems corresponding to peak temperatures could be characterised in detail.
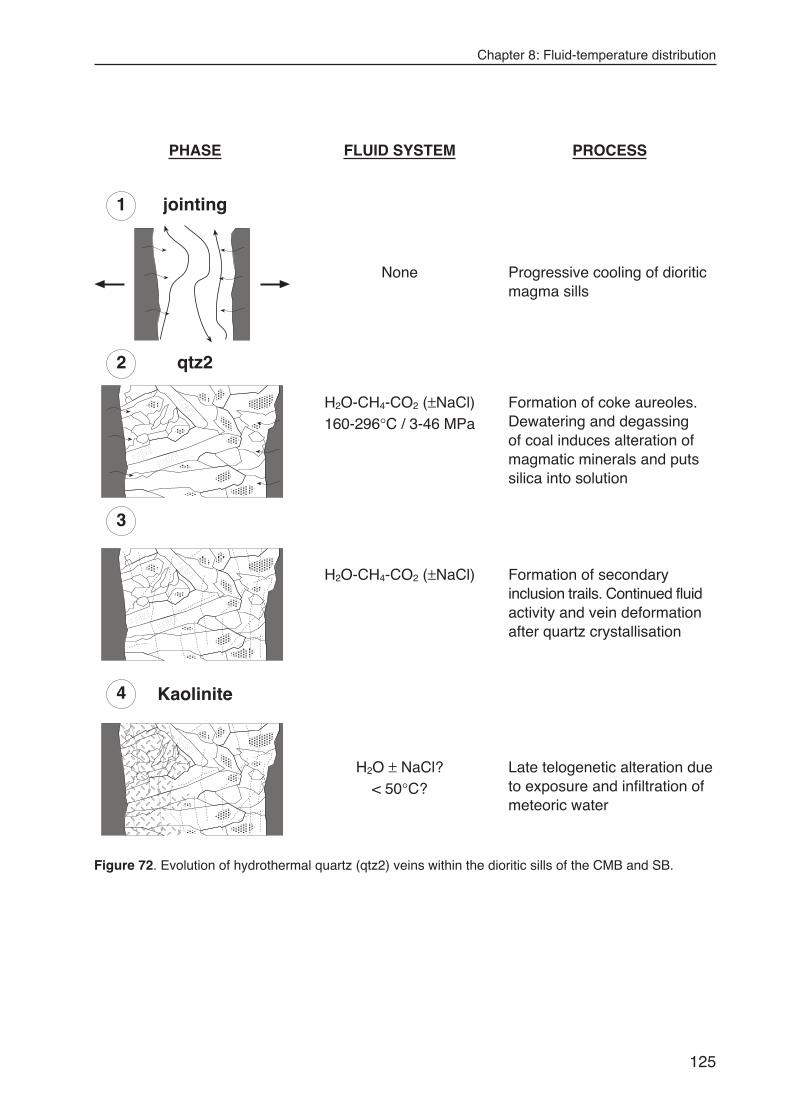
Chapter 8: Fluid-temperature distribution
125
PHASE FLUID SYSTEM PROCESS
H2O-CH4-CO2 (±NaCl)160-296°C / 3-46 MPa
None
H2O-CH4-CO2 (±NaCl)
H2O ± NaCl?< 50°C?
Kaolinite4
jointing1
qtz22
3
Progressive cooling of dioriticmagma sills
Formation of coke aureoles.Dewatering and degassingof coal induces alteration ofmagmatic minerals and putssilica into solution
Formation of secondaryinclusion trails. Continued fluidactivity and vein deformationafter quartz crystallisation
Late telogenetic alteration dueto exposure and infiltration ofmeteoric water
Figure 72. Evolution of hydrothermal quartz (qtz2) veins within the dioritic sills of the CMB and SB.

Chapter 8: Fluid-temperature distribution
126
Chapter 9: Discussion
127
CHAPTER 9: DISCUSSION AND TECTONO-THERMAL
HISTORY
This chapter addresses two remaining questions. How were the fluid inclusions in the
fissure quartz re-equilibrated? and, what are the implications of this event for the thermal
evolution of the CMB and for the investigated fluid and mineral sequence preserved within
the veins? Based on the constraints proposed, a reconstruction of the fluid-thermal events
in relation to the geological history of the Stephanian Ciñera-Matallana basin is presented.
9.1. IMPLICATIONS OF RE-EQUILIBRATION FOR HEAT TRANSMISSION
In this study it has been argued that the re-equilibration of fluid inclusions in vein quartz
(qtz1) is related to a thermal rise. Experimental data confirm that decrepitation is an almost
instantaneous and sensitive phenomenon if the rise in temperature is sharp enough (see
chapter 7). Both fluid inclusion decrepitation and organic matter maturation are irreversi-
ble phenomena and more sensitive to rapid and short-lived temperature rises than clay
mineral reactions, which are often influenced by a number of other variables (Frey, 1987).
If the temperature increased for only a short time span, it is likely that only these two
processes register the full extension of the overheating. As the temperatures recorded by
non-re-equilibrated fluid inclusions are lower than those obtained from the vitrinite
reflectance, the thermal rise responsible for the final coal rank is suggested to have induced
the re-equilibration of the vein quartz inclusions.
9.1.1. Factors affecting heat transmission
In areas where local extensional events take place, for example during the completion of
an orogenic cycle as in the CZ, hyperthermal anomalies may cause maximum palaeo-
temperatures, leading to mineral reactions and organic maturation grades that do not
correspond with maximum burial conditions. These anomalies are commonly associated
with hydrothermal fluid circulation, large igneous intrusions and regional / local high heat
flow related to crustal thinning (Uysal et al., 2000; and references within). Heat can be
transmitted either by conduction through solid rock, or by convection of a hydrothermal
fluid through pore spaces and fractures. In sedimentary basins though, the effect of contact
metamorphic environments, characterised by conductive heat transfer, on maturation level
is often limited compared to that of hydrothermal environments. Large volumes of fluid are
considered to transport heat more efficiently, resulting in more widespread thermal effects
Chapter 9: Discussion
128
(Parnell, 1994; Duddy et al., 1994).
The heat conductivity and the porosity/permeability of the rocks within any basin
have an important control on the heat flow pattern (Duddy et al., 1994). Vertical and local
variations in geothermal gradient commonly reflect changes in the heat conductivity of the
sections where poorly conductive shaly formations, coals and carbonaceous shales are
characterised by high geothermal gradients and high heat flow (Uysal et al., 2000). These
lithologies tend to absorb the heat and act as a barrier for the vertical transfer of deeper
heat flows towards the overlying formations. Their low porosity also makes them impervious
to circulating fluids (Bjørlykke, 1994).
9.1.2. Evidence of fluid activity
The decrepitation of fluid inclusions in the vein quartz may have been caused by circulation
of a hot fluid phase through the fissures and basinal host rocks of the CMB. But this study
has revealed that fluid temperatures in later, deformation related fissure dolomite and
calcite (dolm and cal2) were lower or within the same range (≤ 100°C) as those for vein
quartz (qtz1). So, although these highly saline fluids left traces in the quartz, they can be
excluded as a significant source of heat. Therefore, decrepitation must have occurred at
some stage between the end of quartz formation and the precipitation of vein calcite.
It is nevertheless possible that a hot fluid phase circulated without apparently leaving
associated signs of mineral growth, alteration or dissolution. Neither corrosion nor etching
of the vein quartz (qtz1) is observed, although all these features could have been obliterated
by the later calcite (cal2) mineralisation event. The absence of evidence for associated
widespread host-rock hydrothermal alteration and mineral precipitation in fissures could
be explained by the:
••••• lack of sufficient porosity-permeability in the clastic host-rocks, reduced as a
consequence of ongoing clay mineralisation and diagenetic cementation
••••• local fluid buffering by the host rocks or vein minerals. Concentrated precipitation
of dissolved minerals requires a change in the chemical environment by reactions
with other fluids and minerals
••••• amount of fluid needed to transfer the heat was less than was needed to produce
a mineralogical signature of a hydrothermal event (Yardley, pers. comm.)
That not even secondary inclusion trails containing traces of this hot fluid are
preserved in qtz1 can be explained by the absence of pervasive deformation during this
presumed fluid event. Without deformation, qtz1 crystals would not be able to form
secondary fluid inclusion trails by crack healing. Dissolution and recrystallisation of vein
quartz could have also taken place as a consequence of the circulation of this fluid.
Preliminary optical-cathodoluminescence microscopy of the vein quartz seems to confirm
that such processes may have occurred (van den Kerkhof, pers. comm.). CL-microscopy,
Chapter 9: Discussion
129
either optical or SEM, can reveal such features as internal structures, growth zoning and
lattice defects of quartz (Boiron et al., 1992; Götze et al., 2001; Rusk and Reed, 2002).
9.1.3. The role of the diorites
The most important direct heat source in the geological history of the studied coal basins
were the diorite sills. In this context, it is therefore of interest to consider how the magmatic
bodies interacted with both the coal seams and the clastic rocks, and if there existed
significant temperature gradients and heat transfer away from the sills. Studies on the
influence of magmatic activity in the maturation of organic matter have been conducted in
the Pannonian Basin in Hungary (Horváth et al., 1986), the Late Carboniferous of north
Britain (Raymond and Murchison, 1991), the coalfields of South Africa (Snyman and Barclay,
1989) and the Bowen Basin in Australia (Uysal et al., 2000).
Conductive temperature gradients away from the intrusive bodies
Fig. 73 estimates the extent of conductive temperature gradients in coal seams away from
an intrusive body, based on coal rank distribution. Reflectance values are taken from
Méndez-Cecilia (1985) and Frings (2002). Initial magma temperatures for the intrusive
dioritic material are estimated to be about 800° to 850°C. The mechanism of intrusion was
in many cases a volume by volume replacement of coal within the seams by semi-
concordant igneous bodies; a process that can only be achieved at relatively low confining
pressures. This emplacement mechanism and the position of the sills along the central
part of the seams are favoured by the fact that the coal had already reached the plastic
phase during the degassing period (Méndez Cecilia, 1985). It was also estimated that the
coal had about 0.9% random reflectance (sub-bituminous to high volatile bituminous) before
the intrusion, based on the petrographic study of textures preserved in the coked coal.
Temperatures attributed to these coal ranks are 110-130°C (Barker and Pawlewicz, 1986),
which lyes within the range of those estimated from the primary inclusions in vein quartz.
This suggests that the intrusions post-dated the sedimentation and early lithification, and
post-dated the vein quartz preserved in the formations of the CMB. The regional geothermal
gradient imposed a general rank upon the organic matter, which combined with the low
thermal conductivity of coal, made it more susceptible to further alteration by the rise in
temperature due to the dioritic intrusions. The heat affected non-coke coals in seams up to
San José Fm and induced a rank increase up to about 2% reflectance (Fig. 73).
Where the igneous bodies intrude other lithologies (sandstones and shales) apart
from coal, sills penetrate along stratification surfaces and small oblique fractures under
pressure of the advancing head (Francis, 1982). The thermal effect of these relatively thin
intrusions is very limited. Conductive heat transfer induced clay minerals reactions and
illite growth only in areas immediately adjacent (< 1m) to the sill margins (Méndez-Cecilia,
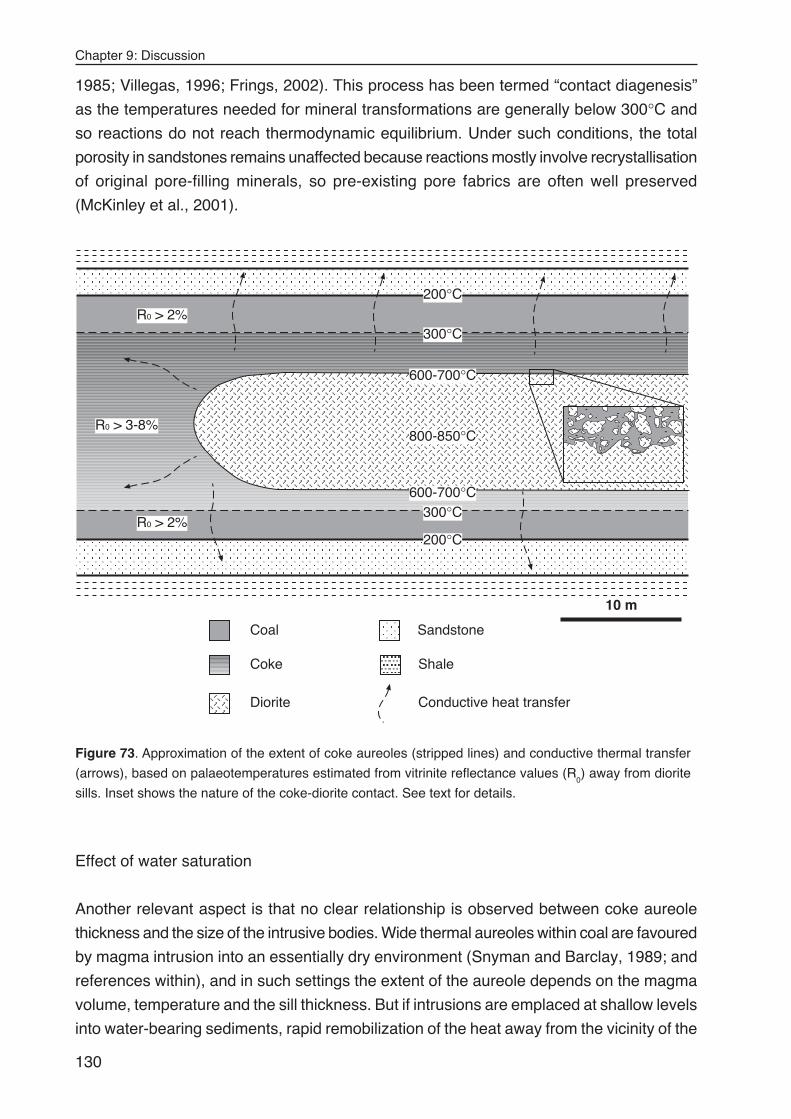
Chapter 9: Discussion
130
1985; Villegas, 1996; Frings, 2002). This process has been termed “contact diagenesis”
as the temperatures needed for mineral transformations are generally below 300°C and
so reactions do not reach thermodynamic equilibrium. Under such conditions, the total
porosity in sandstones remains unaffected because reactions mostly involve recrystallisation
of original pore-filling minerals, so pre-existing pore fabrics are often well preserved
(McKinley et al., 2001).
Effect of water saturation
Another relevant aspect is that no clear relationship is observed between coke aureole
thickness and the size of the intrusive bodies. Wide thermal aureoles within coal are favoured
by magma intrusion into an essentially dry environment (Snyman and Barclay, 1989; and
references within), and in such settings the extent of the aureole depends on the magma
volume, temperature and the sill thickness. But if intrusions are emplaced at shallow levels
into water-bearing sediments, rapid remobilization of the heat away from the vicinity of the
Diorite
Sandstone
ShaleCoke
Coal
300°C
600-700°C
800-850°C
300°C600-700°C
R0 > 2%
R0 > 3-8%
R0 > 2%
Conductive heat transfer
10 m
200°C
200°C
Figure 73. Approximation of the extent of coke aureoles (stripped lines) and conductive thermal transfer
(arrows), based on palaeotemperatures estimated from vitrinite reflectance values (R0) away from diorite
sills. Inset shows the nature of the coke-diorite contact. See text for details.
Chapter 9: Discussion
131
intrusive by fluid circulation can take place. In this case, important limiting factors on the
thickness of the thermal aureoles are (1) the degree of consolidation and water saturation
of the accumulating organic matter and sediments, and (2) the degree of maturation of the
organic matter in the coals and sediments at the time of intrusion (Raymond and Murchison,
1991).
These relationships imply that at the estimated level of maturation reached before
the onset of the magmatic activity in the CMB the coal was still partially saturated with
water. This interpretation is also supported by the abundant contact irregularities (coke
engulfing, magma veining, etc) and the mixing of sediment, organic matter and magma
observed at the margins of some diorites (detail in Fig. 73), similar to that described in
Kisch and Taylor (1966) and Kokelaar (1982). In such a setting, a steam and gas (CH4-
CO2) envelope is generated during intrusion and much of the heat from the diorites was
absorbed during the heating and evaporation of the fluid from the coal and associated
clastic sediments. It is also conceivable that a chemical gradient caused a significant
amount of the vapour and gas phases to migrate from the surrounding coke into the cooling
dioritic magma (Fig. 74). This would further reduce the contact metamorphic effect of the
intrusive on the coal and surrounding rocks, causing extensive mineral alteration and
formation of “white traps” (Kisch and Taylor, 1966).
The fluid system related to the alteration of the igneous rocks, preserved in qtz2
veins, has trapping temperatures and pressures of 160-290°C and 3-48 MPa, respectively.
The components of these fluids were essentially similar to those that caused the early
fissure-quartz mineralisation in the clastic sedimentary rocks, confirming that they were
derived from organic matter maturation. Their high CO2 content conforms with the higher
maturation temperatures reached by the coal in direct contact with the magma. That these
quartz mineralisations only occur within the margins of deeply altered igneous bodies
surrounded by coke aureoles suggests that advective mass transport by these hotter fluids
was only local in extent (Fig. 74). But the excess of fluid produced by the maturation of
coal in the outer margin of the aureoles would maintain P-T conditions similar to those of
the preserved fluid in qtz2, and therefore transports an important amount of heat.
The degree of water saturation in the clastic sediments appears to have been much
lower than that in the coal at the time of the intrusion, as no sediment fluidisation textures
(sensu Kokelaar, 1982) have been observed in the clastic rocks at the contact with the
sills. Although this factor is also influenced by the permeability of the specific host-rock.
The dioritic rocks are also much less altered, with no quartz veins and, what is more
significant, the host sandstones and shales present no signs of hydrothermal alteration.
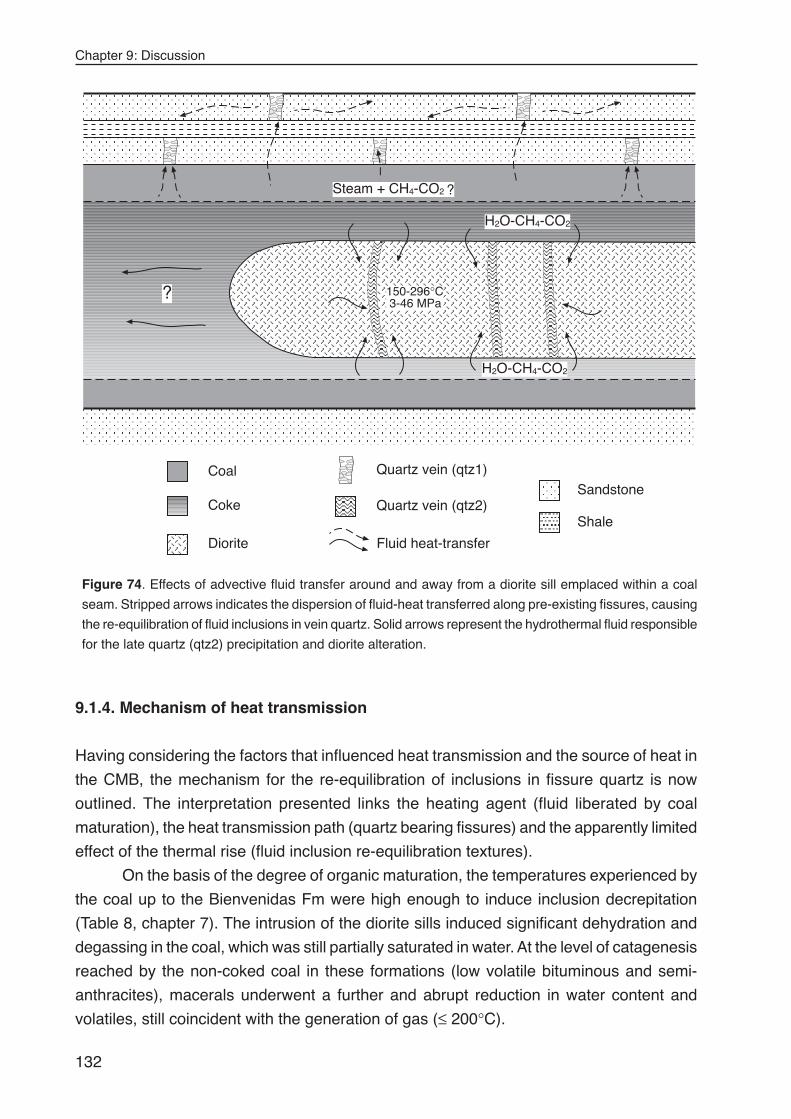
Chapter 9: Discussion
132
9.1.4. Mechanism of heat transmission
Having considering the factors that influenced heat transmission and the source of heat in
the CMB, the mechanism for the re-equilibration of inclusions in fissure quartz is now
outlined. The interpretation presented links the heating agent (fluid liberated by coal
maturation), the heat transmission path (quartz bearing fissures) and the apparently limited
effect of the thermal rise (fluid inclusion re-equilibration textures).
On the basis of the degree of organic maturation, the temperatures experienced by
the coal up to the Bienvenidas Fm were high enough to induce inclusion decrepitation
(Table 8, chapter 7). The intrusion of the diorite sills induced significant dehydration and
degassing in the coal, which was still partially saturated in water. At the level of catagenesis
reached by the non-coked coal in these formations (low volatile bituminous and semi-
anthracites), macerals underwent a further and abrupt reduction in water content and
volatiles, still coincident with the generation of gas (≤ 200°C).
Diorite
150-296°C 3-46 MPa
H2O-CH4-CO2
H2O-CH4-CO2
Sandstone
ShaleCoke
Coal
Fluid heat-transfer
Quartz vein (qtz2)
Quartz vein (qtz1)
Steam + CH4-CO2 ?
?
Figure 74. Effects of advective fluid transfer around and away from a diorite sill emplaced within a coal
seam. Stripped arrows indicates the dispersion of fluid-heat transferred along pre-existing fissures, causing
the re-equilibration of fluid inclusions in vein quartz. Solid arrows represent the hydrothermal fluid responsible
for the late quartz (qtz2) precipitation and diorite alteration.
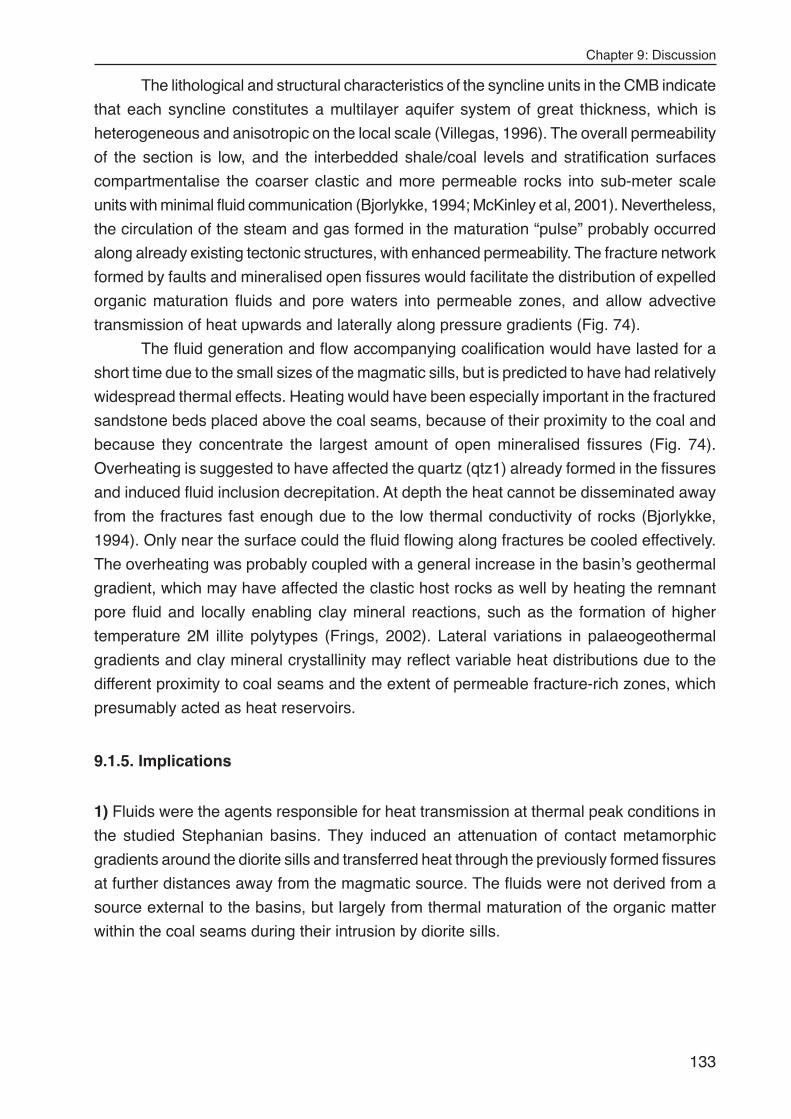
Chapter 9: Discussion
133
The lithological and structural characteristics of the syncline units in the CMB indicate
that each syncline constitutes a multilayer aquifer system of great thickness, which is
heterogeneous and anisotropic on the local scale (Villegas, 1996). The overall permeability
of the section is low, and the interbedded shale/coal levels and stratification surfaces
compartmentalise the coarser clastic and more permeable rocks into sub-meter scale
units with minimal fluid communication (Bjorlykke, 1994; McKinley et al, 2001). Nevertheless,
the circulation of the steam and gas formed in the maturation “pulse” probably occurred
along already existing tectonic structures, with enhanced permeability. The fracture network
formed by faults and mineralised open fissures would facilitate the distribution of expelled
organic maturation fluids and pore waters into permeable zones, and allow advective
transmission of heat upwards and laterally along pressure gradients (Fig. 74).
The fluid generation and flow accompanying coalification would have lasted for a
short time due to the small sizes of the magmatic sills, but is predicted to have had relatively
widespread thermal effects. Heating would have been especially important in the fractured
sandstone beds placed above the coal seams, because of their proximity to the coal and
because they concentrate the largest amount of open mineralised fissures (Fig. 74).
Overheating is suggested to have affected the quartz (qtz1) already formed in the fissures
and induced fluid inclusion decrepitation. At depth the heat cannot be disseminated away
from the fractures fast enough due to the low thermal conductivity of rocks (Bjorlykke,
1994). Only near the surface could the fluid flowing along fractures be cooled effectively.
The overheating was probably coupled with a general increase in the basin’s geothermal
gradient, which may have affected the clastic host rocks as well by heating the remnant
pore fluid and locally enabling clay mineral reactions, such as the formation of higher
temperature 2M illite polytypes (Frings, 2002). Lateral variations in palaeogeothermal
gradients and clay mineral crystallinity may reflect variable heat distributions due to the
different proximity to coal seams and the extent of permeable fracture-rich zones, which
presumably acted as heat reservoirs.
9.1.5. Implications
1) Fluids were the agents responsible for heat transmission at thermal peak conditions in
the studied Stephanian basins. They induced an attenuation of contact metamorphic
gradients around the diorite sills and transferred heat through the previously formed fissures
at further distances away from the magmatic source. The fluids were not derived from a
source external to the basins, but largely from thermal maturation of the organic matter
within the coal seams during their intrusion by diorite sills.
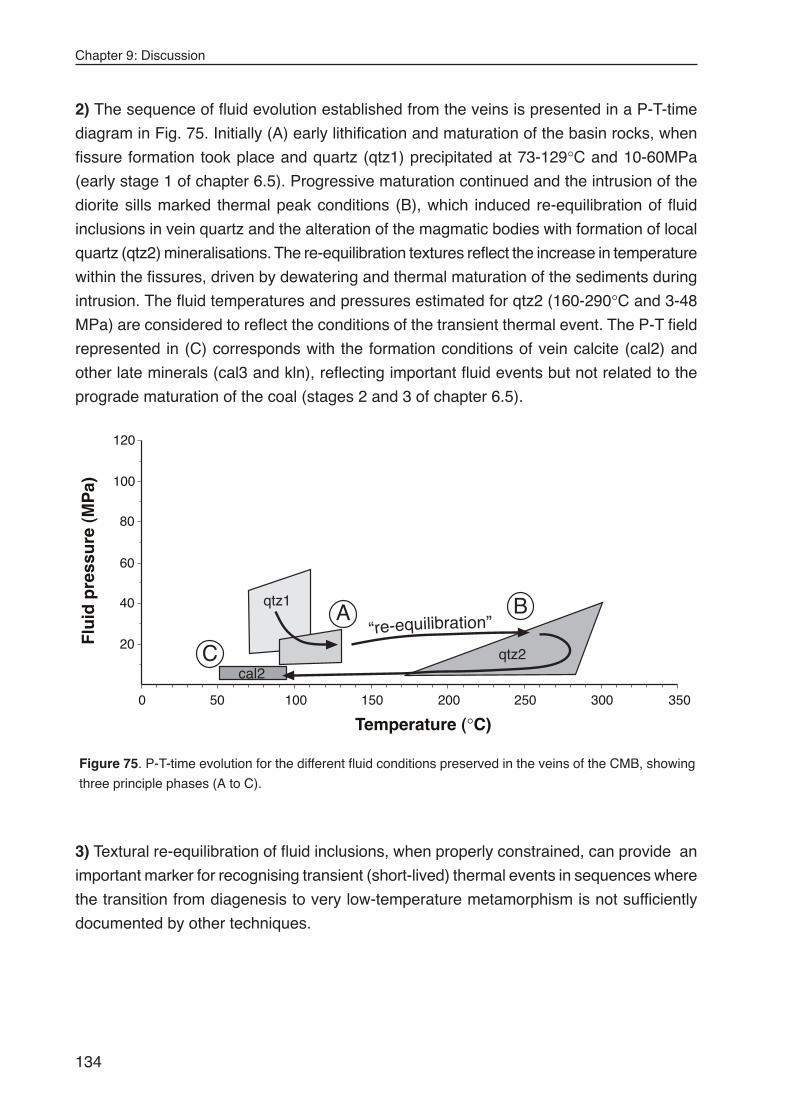
Chapter 9: Discussion
134
Flu
id p
ress
ure
(M
Pa)
0 50 100 150 200 250 300 350
Temperature (°C)
20
40
60
80
100
120
cal2
qtz1
qtz2
A B
C“re-equilibration”
Figure 75. P-T-time evolution for the different fluid conditions preserved in the veins of the CMB, showing
three principle phases (A to C).
2) The sequence of fluid evolution established from the veins is presented in a P-T-time
diagram in Fig. 75. Initially (A) early lithification and maturation of the basin rocks, when
fissure formation took place and quartz (qtz1) precipitated at 73-129°C and 10-60MPa
(early stage 1 of chapter 6.5). Progressive maturation continued and the intrusion of the
diorite sills marked thermal peak conditions (B), which induced re-equilibration of fluid
inclusions in vein quartz and the alteration of the magmatic bodies with formation of local
quartz (qtz2) mineralisations. The re-equilibration textures reflect the increase in temperature
within the fissures, driven by dewatering and thermal maturation of the sediments during
intrusion. The fluid temperatures and pressures estimated for qtz2 (160-290°C and 3-48
MPa) are considered to reflect the conditions of the transient thermal event. The P-T field
represented in (C) corresponds with the formation conditions of vein calcite (cal2) and
other late minerals (cal3 and kln), reflecting important fluid events but not related to the
prograde maturation of the coal (stages 2 and 3 of chapter 6.5).
3) Textural re-equilibration of fluid inclusions, when properly constrained, can provide an
important marker for recognising transient (short-lived) thermal events in sequences where
the transition from diagenesis to very low-temperature metamorphism is not sufficiently
documented by other techniques.
Chapter 9: Discussion
135
9.2. TIMING OF VEIN FORMATION AND BASIN EVOLUTION
The geological evolution of the Ciñera-Matallana basin, in relation to the vein mineral
growth sequence (chapters 6.5 and 8.3), is presented in 8 stages illustrated in Fig. 76.
This evolution is not extended to the SB due to the low abundance of veins and the more
restricted thermal effects of the magmatic intrusions. Figures are not to scale and present
an idealisation of the outlined processes that occurred in the western half of the basin,
along the cross-section I-II of Fig. 5 (page 14). For simplification, the eroded Stephanian
rocks (about 1km) are not represented. The fluid, thermal and mineral evolution of the
CMB is summarised as follows.
Basin development began with the onset of an extensional phase immediately
following the completion of the Variscan Orogeny (Fig. 76a). Thinning of the continental
crust originated transtension along the crustal scale fault of Sabero-Gordón, in the southern
part of the Cantabrian arc. In the area of the Ciñera-Matallana Basin, fast deposition of
more than 1,500 m of clastic material and coal, burial and episodic subsidence took place
at least during Stephanian B times (298-294 Ma).
SN
Maximum thickness(not preserved)
Figure 76a. Stephanian B (298-294 Ma). Sedimentation, subsidence and compaction.
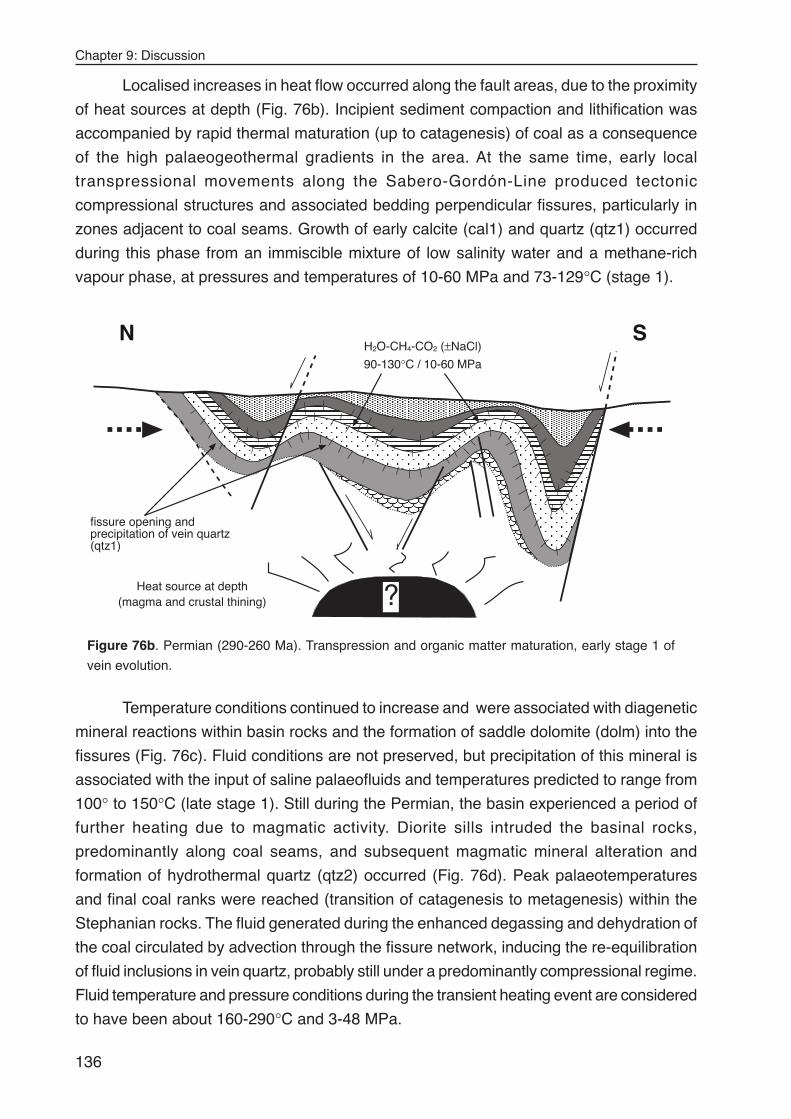
Chapter 9: Discussion
136
Localised increases in heat flow occurred along the fault areas, due to the proximity
of heat sources at depth (Fig. 76b). Incipient sediment compaction and lithification was
accompanied by rapid thermal maturation (up to catagenesis) of coal as a consequence
of the high palaeogeothermal gradients in the area. At the same time, early local
transpressional movements along the Sabero-Gordón-Line produced tectonic
compressional structures and associated bedding perpendicular fissures, particularly in
zones adjacent to coal seams. Growth of early calcite (cal1) and quartz (qtz1) occurred
during this phase from an immiscible mixture of low salinity water and a methane-rich
vapour phase, at pressures and temperatures of 10-60 MPa and 73-129°C (stage 1).
Temperature conditions continued to increase and were associated with diagenetic
mineral reactions within basin rocks and the formation of saddle dolomite (dolm) into the
fissures (Fig. 76c). Fluid conditions are not preserved, but precipitation of this mineral is
associated with the input of saline palaeofluids and temperatures predicted to range from
100° to 150°C (late stage 1). Still during the Permian, the basin experienced a period of
further heating due to magmatic activity. Diorite sills intruded the basinal rocks,
predominantly along coal seams, and subsequent magmatic mineral alteration and
formation of hydrothermal quartz (qtz2) occurred (Fig. 76d). Peak palaeotemperatures
and final coal ranks were reached (transition of catagenesis to metagenesis) within the
Stephanian rocks. The fluid generated during the enhanced degassing and dehydration of
the coal circulated by advection through the fissure network, inducing the re-equilibration
of fluid inclusions in vein quartz, probably still under a predominantly compressional regime.
Fluid temperature and pressure conditions during the transient heating event are considered
to have been about 160-290°C and 3-48 MPa.
H2O-CH4-CO2 (±NaCl)
90-130°C / 10-60 MPa
?
SN
fissure opening andprecipitation of vein quartz(qtz1)
Heat source at depth(magma and crustal thining)
Figure 76b. Permian (290-260 Ma). Transpression and organic matter maturation, early stage 1 of
vein evolution.
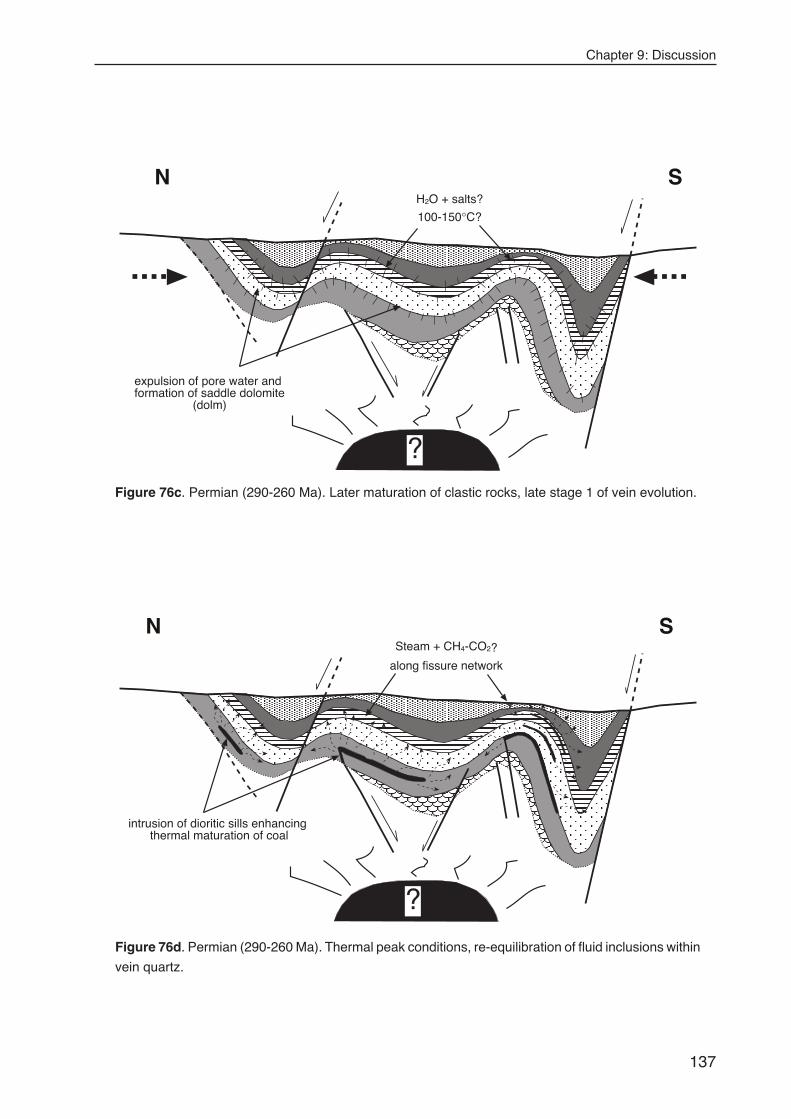
Chapter 9: Discussion
137
H2O + salts?
100-150°C?
SN
expulsion of pore water andformation of saddle dolomite
(dolm)
?Figure 76c. Permian (290-260 Ma). Later maturation of clastic rocks, late stage 1 of vein evolution.
Steam + CH4-CO2?
along fissure network
SN
?
intrusion of dioritic sills enhancing thermal maturation of coal
Figure 76d. Permian (290-260 Ma). Thermal peak conditions, re-equilibration of fluid inclusions within
vein quartz.
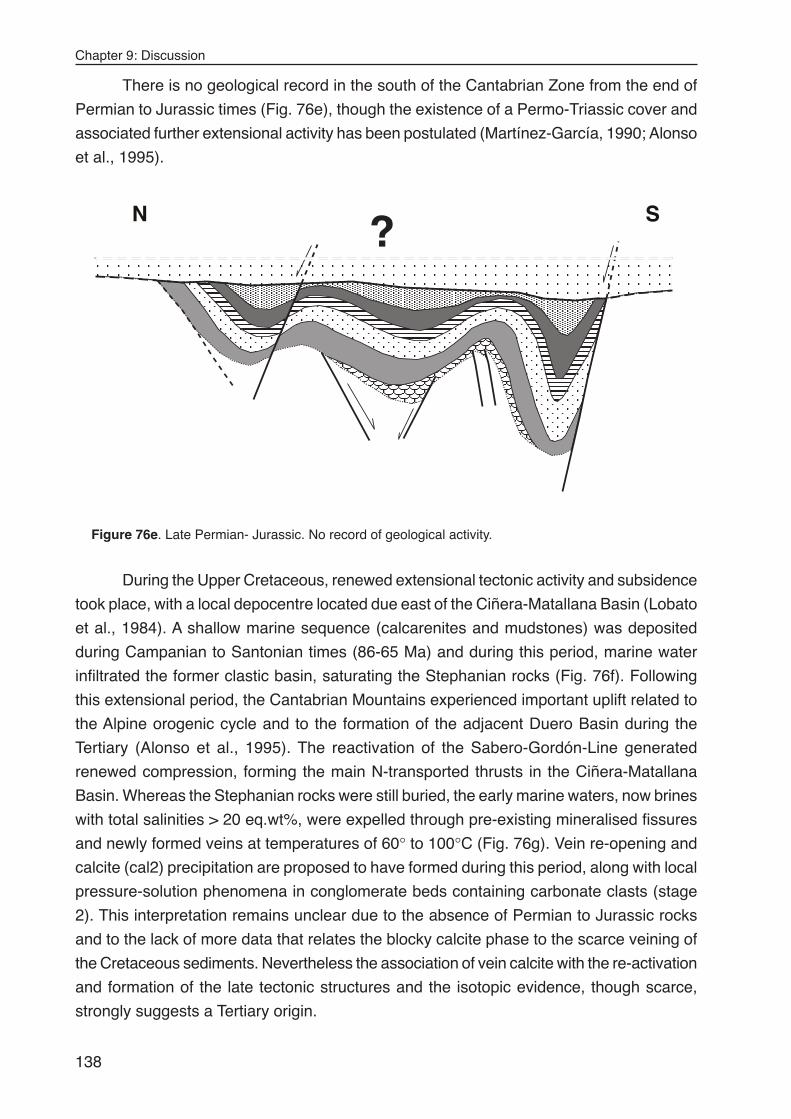
Chapter 9: Discussion
138
There is no geological record in the south of the Cantabrian Zone from the end of
Permian to Jurassic times (Fig. 76e), though the existence of a Permo-Triassic cover and
associated further extensional activity has been postulated (Martínez-García, 1990; Alonso
et al., 1995).
During the Upper Cretaceous, renewed extensional tectonic activity and subsidence
took place, with a local depocentre located due east of the Ciñera-Matallana Basin (Lobato
et al., 1984). A shallow marine sequence (calcarenites and mudstones) was deposited
during Campanian to Santonian times (86-65 Ma) and during this period, marine water
infiltrated the former clastic basin, saturating the Stephanian rocks (Fig. 76f). Following
this extensional period, the Cantabrian Mountains experienced important uplift related to
the Alpine orogenic cycle and to the formation of the adjacent Duero Basin during the
Tertiary (Alonso et al., 1995). The reactivation of the Sabero-Gordón-Line generated
renewed compression, forming the main N-transported thrusts in the Ciñera-Matallana
Basin. Whereas the Stephanian rocks were still buried, the early marine waters, now brines
with total salinities > 20 eq.wt%, were expelled through pre-existing mineralised fissures
and newly formed veins at temperatures of 60° to 100°C (Fig. 76g). Vein re-opening and
calcite (cal2) precipitation are proposed to have formed during this period, along with local
pressure-solution phenomena in conglomerate beds containing carbonate clasts (stage
2). This interpretation remains unclear due to the absence of Permian to Jurassic rocks
and to the lack of more data that relates the blocky calcite phase to the scarce veining of
the Cretaceous sediments. Nevertheless the association of vein calcite with the re-activation
and formation of the late tectonic structures and the isotopic evidence, though scarce,
strongly suggests a Tertiary origin.
SN ?
Figure 76e. Late Permian- Jurassic. No record of geological activity.
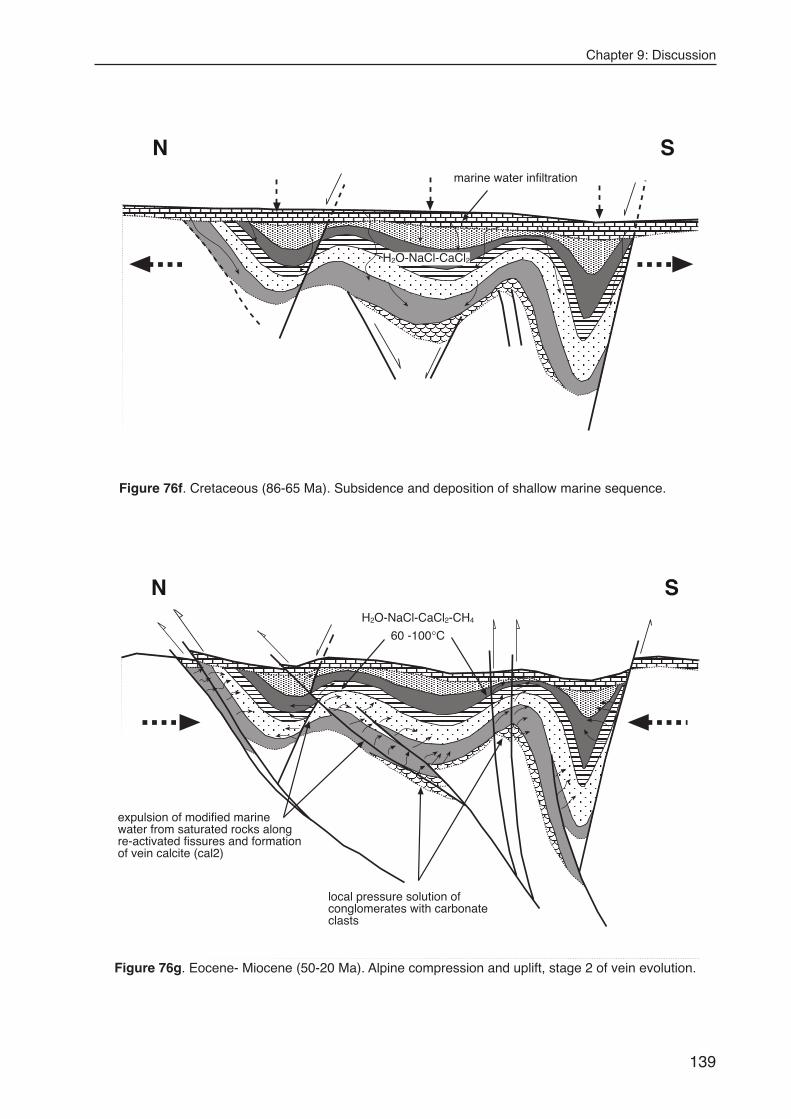
Chapter 9: Discussion
139
SNmarine water infiltration
H2O-NaCl-CaCl2
Figure 76f. Cretaceous (86-65 Ma). Subsidence and deposition of shallow marine sequence.
H2O-NaCl-CaCl2-CH4
60 -100°C
SN
expulsion of modified marinewater from saturated rocks alongre-activated fissures and formationof vein calcite (cal2)
local pressure solution ofconglomerates with carbonateclasts
Figure 76g. Eocene- Miocene (50-20 Ma). Alpine compression and uplift, stage 2 of vein evolution.
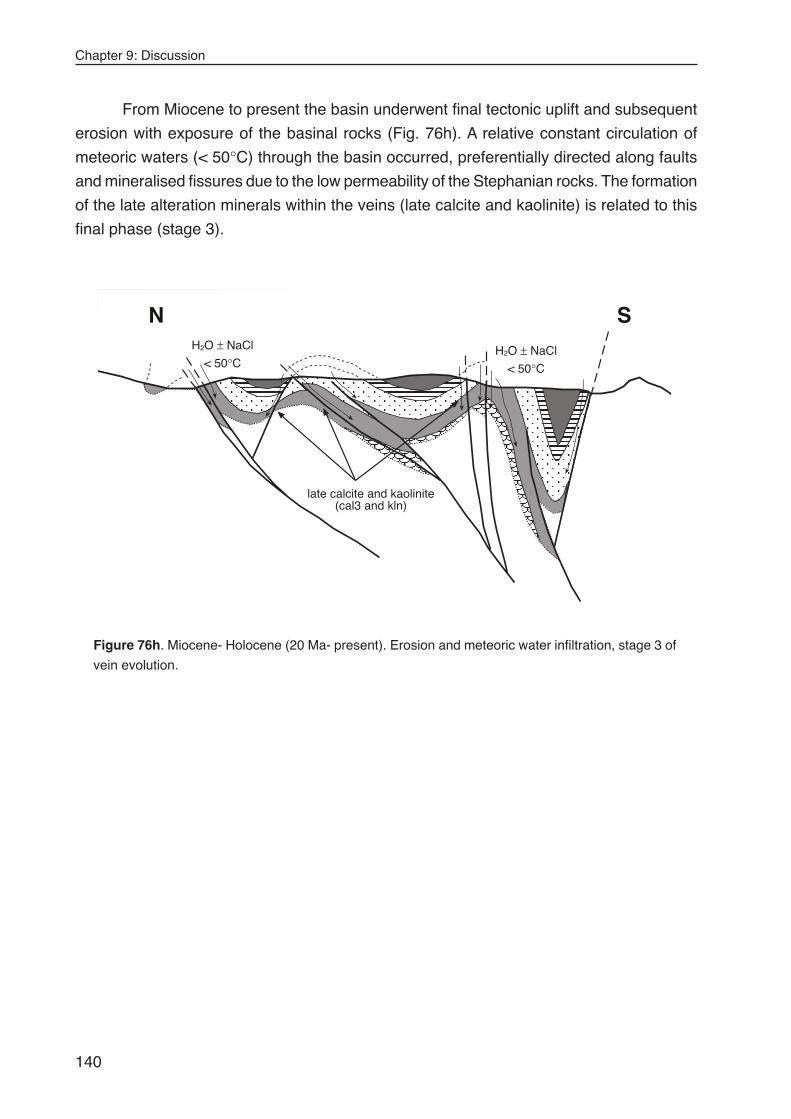
Chapter 9: Discussion
140
SN
H2O ± NaCl
< 50°C
H2O ± NaCl
< 50°C
late calcite and kaolinite(cal3 and kln)
Figure 76h. Miocene- Holocene (20 Ma- present). Erosion and meteoric water infiltration, stage 3 of
vein evolution.
From Miocene to present the basin underwent final tectonic uplift and subsequent
erosion with exposure of the basinal rocks (Fig. 76h). A relative constant circulation of
meteoric waters (< 50°C) through the basin occurred, preferentially directed along faults
and mineralised fissures due to the low permeability of the Stephanian rocks. The formation
of the late alteration minerals within the veins (late calcite and kaolinite) is related to this
final phase (stage 3).
Conclusions
141
CONCLUSIONS
1. Mineral precipitation in syntectonic veins within the Ciñera-Matallana and Sabero pull-
apart coal basins records a complex fluid and thermal history. Fluids derived from the
thermal maturation of the basin‘s rocks were responsible for heat transfer at temperature
peak conditions in the Ciñera-Matallana coalfield.
2. The mineralised fissures (cm-wide) formed synchronous with folding and faulting in
sandstone and conglomerate beds alternating with shales, organic rich pelites and coal-
bearing strata. The mechanism responsible for fracture opening was bedding parallel slip.
3. The following mineral growth sequence is preserved within the veins: early calcite,
euhedral quartz, saddle dolomite, ferroan blocky calcite, minor sulphides and authigenic
kaolinite. Textural relations show that minerals grew within open fractures at various stages
during the basins history.
4. Four mineralising fluid systems are preserved within fluid inclusions of vein minerals:
1) H2O in primary inclusions of early calcite at temperatures < 90°C and molar
volumes of 18-18.6 cm3/mol
2) H2O-CH4-CO2 (±NaCl) heterogeneously trapped in primary and pseudosecondary
inclusions of vein quartz. Fluid P-T conditions were 10-56 MP and 73°-129°C,
and salinity was < 6 wt% NaCl
3) H2O-NaCl-CaCl2-CH4 in secondary inclusions of quartz and primary inclusions of
vein calcite. Fluid temperatures were 60°-100°C, molar volumes ranged from
16.9 to 17.9 cm3/mol and total salinities from 20.5 to 31.9 eq.wt%
4) H2O (±NaCl) at T < 50°C in secondary inclusions of vein calcite, contemporaneous
to the formation of late calcite and authigenic kaolinite
5. On the basis of fluid and mineral characteristics, three stages of vein growth can be
recognised and related to basin evolution:
••••• Stage 1, early calcite, quartz and saddle dolomite formed in relation to burial and
progressive rock (coal) maturation close to thermal peak conditions during Permian
times. Materials for mineral precipitation were derived from the detrital fraction
within the Stephanian rocks, and transported into solution by advection of large
amounts of locally derived water and gas phases (CH4-CO2).
Conclusions
142
••••• Stage 2 reflects brittle reactivation of veins still under burial conditions. Lower
temperature diagenetic dissolution-precipitation reactions (dedolomitisation)
controlled calcite growth in relation to the infiltration of marine water, and was
subsequently modified during tectonic subsidence in the Cretaceous and late
tectonic reactivation in the Alpine Orogeny.
••••• Stage 3 is linked with the uplift and exhumation of the basin fill. Low-T diagenetic
and weathering reactions of the Stephanian rocks result from a constant supply
of meteoric water (T < 50°C), forming late calcite and kaolinite.
6. Small mineralisations of quartz and late kaolinite occur locally in diorite sills emplaced
within the basins. An immiscible H2O-CH4-CO2 (± NaCl) fluid system is defined in primary
inclusions of quartz. P-T conditions were 164°-296°C and 3-48 MPa, with CO2 > 10 mol %
and salinity < 2.5 wt% NaCl. The hydrothermal quartz crystallised due to extensive alteration
of the igneous minerals as the magma intruded the coal seams.
7. Five textural types of re-equilibrated fluid inclusions are recognised and defined in the
fissure quartz within the clastic rocks: scalloped, hairy, annular-ring shaped, haloes and
decrepitation clusters. Each type represents a progressive order of inclusion modification.
These textures resulted from a combination of brittle fracturing and dissolution and re-
precipitation of quartz, with preferential loss of water, induced by a temperature rise within
the veins and surrounding rocks.
8. The distribution of re-equilibrated inclusions in vein quartz throughout the entire basin
reflects the extension of heat flow during thermal peak conditions. Short-lived high
temperatures were related to the intrusion and alteration of the diorite sills into the basin,
which enhanced further maturation of the coal and consequent degassing and dehydration.
Heat was transferred by advective circulation of the released fluid along the already formed
fissure network inducing inclusion re-equilibration.
References
143
LITERATURE LIST
Adams AE, Mackenzie WS, Guilford C (1984) Atlas of sedimentary rocks under themicroscope. Longman Group, 104 pp.
Alderton DHM & Bevins RE (1996) P-T conditions in the South Wales Coalfield: evidencefrom coexisting hydrocarbon and aqueous fluid inclusions. Journal of the Geological Society,London, 153, 265-275.
Aller J, Bastida F, (1987) Cleavage and its relation with metamorphic grade in the CantabrianZone (Hercynian of North-West Spain). Sciences Géologiques Bulletin, 40, 255-272.
Alonso JL, Pulgar JA, García Ramos JC, Barba P (1995) Tertiary basins and alpine tectonicsin the Cantabrian Mountains (NW Spain). In: Tertiary Basins of Spain (PF Friend & DabrioCJ; Eds). Cambridge University Press, 214-227.
Alonso JL, Suárez Rodríguez A, Rodríguez Fernández LR, Farias P, Villegas, FJ (1990)Hoja del Mapa Geológico Nacional E. 1:50:000 n° 103 (LA POLA DE GORDÓN). 2 SerieMAGNA. Instituto Geológico y Minero de España.
Alonso OE & Brime C (1990) Mineralogy, geochemistry, and origin of the underclays of theCentral Coal Basin, Asturias, Spain. Clays and Clay Minerals, 38, 265-276.
Alt JC (1999) Very low-grade hydrothermal metamorphism of basic igneous rocks. In:Low-Grade Metamorphism (Frey M & Robinson D; Eds). Blackwell Science, 169-201.
Andersen T, Frezzoti ML, Burke EAJ -Eds- (2001) Fluid Inclusions: Phase Relationships-Methods-Applications. Special Volume in honour of Jaques Touret. Lithos, 55, 320 pp.
Audetat A & Günther D (1999) Mobility and H2O-loss from fluid inclusions in natural quartzcrystals. Contributions to Mineralogy and Petrology, 137, 1-14.
Bakker RJ (1997) Clathrates: Computer programs to calculate fluid inclusion V-X propertiesusing clathrate melting temperatures. Computers & Geosciences, 23, 1-18.
Bakker RJ (1998) Improvements in clathrate modelling II: The H2O-CO2-CH4-N2-C2H6 fluidsystem. Geological Society Special Publications, 137, 75-105.
Bakker RJ (1999) Adaption of Bowers & Helgeson (1983) equation of state to isochoreand fugacity coefficient calculation in the H2O-CO2-CH4-N2-NaCl fluid system. ChemicalGeology, 154, 225-236.
Bakker RJ (2001a) Combined Raman Spectroscopy and low temperature Micro-thermometry. In: XVI ECROFI, European Current Research on Fluid Inclusions, Porto2001. Abstracts (Noronha F, Dória A, Guedes A; Eds). Faculdade de Ciencias do Porto,Departamiento de Geologia. Memória n° 7, 15-18. University of Porto.
References
144
Bakker RJ (2001b) FLUIDS: new software package to handle microthermometric dataand to calculate isochores. XVI ECROFI, European Current Research on Fluid Inclusions,Porto 2001. Abstracts (Noronha F, Doria A, Guedes A; Eds) Faculdade de Ciencias doPorto, Departamiento de Geologia, Memoria n° 7, 23-25. University of Porto.
Bakker RJ & Jansen JBH (1990) Preferential water leakage from fluid inclusions by meansof mobile dislocations. Nature, 345, 58-60.
Bakker RJ & Jansen JBH (1991) Experimental post-entrapment water loss from syntheticCO2-H2O inclusions in natural quartz. Geochimica et Cosmochimica Acta, 55, 2215-2230.
Bakker RJ & Jansen JBH (1994) A mechanism for preferential H2O leakage from fluidinclusions in quartz, based on TEM observations. Contributions to Mineralogy and Petrology,116, 7-20.
Bakker RJ & Thiery R (1994) Application of clathrates to fluid inclusions studies. In: IMA’94. Short Course on Fluid Inclusions in Minerals (de Vivo B & Frezzotti ML; Eds). VirginiaTech, 191-208.
Barker CE & Goldstein RH (1990) Fluid inclusion technique for determining maximumtemperature in calcite and its comparison to the vitrinite reflectance geothermometer.Geology, 18, 1003-1006.
Barker CE & Kopp OC -Eds- (1991) Luminescence Microscopy and Spectroscopy – Quali-tative and quantitative applications. SEPM Short Course, 25, 195pp.
Barker CE & Pawlewicz MJ (1986) The correlation of vitrinite reflectance with maximumtemperature in humic organic matter. In: Palaeogeothermics (Buntebarth G & Stegena L;Eds). Springer (Heidelberg). Lecture Notes in Earth Sciences, 5, 79-93.
Barnes MA, Barnes WC, Bustin RM (1990) Chemistry and diagenesis of organic matter insediments and fossil fuels. In: Diagenesis (McIlreath IA & Morrow DW; Eds). GeoscienceCanada reprint series, 4, 189-204.
Bastida F, Brime C, Garcia-Lopez S, Sarmiento GN (1999) Tectono-thermal evolution in aregion with thin-skinned tectonics; the western nappes in the Cantabrian Zone (VariscanBelt of NW Spain). International Journal of Earth Sciences, 88, 38-48.
Bennet P & Siegel DI (1987) Increased solubility of quartz in water due to complexing byorganic compounds. Nature, 326, 684-686.
Bevins RE, White SC, Robinson D (1996) The South Wales Coalfield: low-grademetamorphism in a foreland basin setting? Geological Magazine, 133, 739-749.
Bieg G & Burger K (1992) Preliminary study of tonsteins of the Pastora Formation(Stephanian B) of the Ciñera-Matallana Coalfield, north-western Spain. International Journalof Coal Geology, 21, 139-160.
References
145
Bjørlykke K (1994) Fluid-flow processes and diagenesis in sedimentary basins. In: Geofluids:Origin, Migration and Evolution of Fluids in Sedimentary Basins (Parnell J; Ed). GeologicalSociety Special Publication, 78, 127-140.
Bodnar RJ (1993) Revised equation and table for determining the freezing point depressionof H2O-NaCl solutions. Geochimica et Cosmochimica Acta, 57, 683-684.
Bodnar RJ & Bethke PM (1984) Systematics of stretching of fluid inclusions: I. Fluoriteand sphalerite at one atmosphere confining pressure. Economic Geology and the Bulletinof the Society of Economic Geologists, 79, 141-161.
Bodnar RJ, Binns PR, Hall DL (1989) Synthetic fluid inclusions VI. Quantitative evaluationof the decrepitation behaviour of fluid inclusions in quartz at one atmosphere confiningpressure. Journal of Metamorphic Geology, 7, 229-242.
Bohor BF & Tripplehorn DM (1993) Tonsteins: Altered volcanic-ash layers in coal-bearingsequences. Geological Society of America Special Paper, 285, 44pp.
Boiron M, Essarraj S, Sellier E, Cathelineau M, Lespinasse M, Poty B (1992) Identificationof fluid inclusions in relation to their host microstructural domains in quartz bycathodoluminescence. Geochimica et Cosmochimica Acta, 56, 175-185.
Boullier AM, France-Lanord C, Dubessy J, Adamy J, Champenois M (1991) Linked fluidand tectonic evolution in the High Himalayan Mountains (Nepal). Contributions to Mineralogyand Petrology, 107, 358-372.
Brime C (1985) A diagenesis to metamorphism transition in the Hercynian of NW Spain.Mineralogical Magazine, 49, no.352, 481-484.
Brime C & Pérez-Estaún A (1980) A Diagenesis-metamorphism transition in the CaboPeñas region. Cuadernos do Laboratorio Xeoloxico de Laxe, 1, 85-97.
Brime C, García-López S, Bastida F, Valín ML, Sanz-López J, Aller J (2001) Transitionfrom diagenesis to metamorphism near the front of the Variscan regional metamorphism(Cantabrian Zone, north-western Spain). Journal of Geology, 109, 363-379.
Brindley GW & Brown G -Eds- (1980) Crystal Structures of Clay Minerals and Their X-rayIdentification. Mineralogical Society, London, 495pp.
Brown G & Brindley GW (1980) X-ray Diffraction Procedures for Clay Mineral Identification.In: Crystal Structures of Clay Minerals and Their X-ray Identification (Brindley GW &Brown G; Eds-). Mineralogical Society, London, 305-360.
Budai JM, Lohmann KC, Owen RM (1984) Burial dedolomite in the Missisipian MadisonLimestone, Wyoming and Utah thrust belt. Journal of Sedimentary Petrology, 54, 276-288.
Burke EAJ (2001) Raman microspectrometry of fluid inclusions. Lithos, 55, 139-158.
References
146
Burkhard M (1993) Calcite-twins, their geometry, appearance and significance as stress-strain markers and indicators of tectonic regime: a review. Journal of Structural Geology,15, 351-368.
Burley SD, Mullis J, Matter A (1989) Timing diagenesis in the Tartan Reservoir (UK NorthSea): constraints from combined cathodoluminescence microscopy and fluid inclusionstudies. Marine and Petroleum Geology, 6, 98-120.
Burruss RC (1987a) Palaeotemperatures from fluid inclusions: advances in theory andtechnique. In: Thermal History of Sedimentary Basins, Methods and Case Histories (NaeserND & McCulloh TH; Eds). American Association of Petroleum Geologists SpecialPublication, 41, 121-131.
Burruss RC (1987b) Diagenetic palaeotemperatures from aqueous inclusions: re-equilibration of inclusions in carbonate cements by burial heating. Mineralogical Magazi-ne, 51, 477-481.
Carroll JJ, Slupsky JD, Mather AE (1991) The solubility of carbon dioxide in water at lowpressure. Journal of Physical Chemistry Reference Data, 20, 1201-1209.
Clayton RN, Friedman I, Graf DL, Mayeda TK, Meents WF, Shimp NF (1966) The origin ofsaline formation waters. Journal of Geophysical Research, 71, 3869-3882.
Cole JE, Miliorizos M, Frodsham K, Gayer RA, Gillespie PA, Hartley AJ, White SC (1991)Variscan structures in the opencast coal sites of the South Wales Coalfield. Proceedingsof the Ussher Society, 7, 375-379.
Colmenero JR & Prado JG (1993) Coal basins in the Cantabrian Mountains, north-westernSpain. International Journal of Coal Geology, 23, 215-229.
Corretgé LG & Suárez O (1990) Cantabrian and Palentian Zones: Igneous rocks. In: Pre-Mesozoic Geology of Iberia (Dallmeyer RD & Martinez Garcia E, Eds). Springer (Heidel-berg), 72-79.
Crespo JL, Moro MC, Fadón O, Cabrera R, Fernández A (2000) The Salamón gold deposit(León, Spain). Journal of Geochemical exploration, 71, 191-208.
Daniels EJ, Altaner SP, Marshak S, Eggleston JR (1990) Hydrothermal alteration inanthracite from eastern Pennsylvania: implications for mechanisms of anthracite formation.Geology, 18, 247-250.
de Groot K (1967) Experimental dedolomitisation. Journal of Sedimentary Petrology, 37,1216-1220.
Diamond LW (1990) Fluid inclusion evidence for P-V-T-X evolution of hydrothermal solutionsin Late-Alpine gold-quartz veins at Brusson, Val d’Ayas, NW Italian Alps. American Jour-nal of Science, 290, 912-958.
Diamond LW (2001) Review of the systematics of CO2-H2O fluid inclusions. Lithos, 55,69-99.
References
147
Diamond LW & Marshall DD (1994) Fluid inclusions in vein samples from boreholes atWellenberg, Switzerland. Unpublished report, University of Bern.
Dickson JAD (1965) Carbonate identification and genesis as revealed by staining. Journalof Sedimentary Petrology, 36, 491-505.
Duan Z, Møller N, Weare JH (1992a) An equation of state for the CH4-CO2-H2O system: I.Pure systems from 0 to 1000°C and 0 to 8000 bar. Geochimica et Cosmochimica Acta, 56,2605-2617.
Duan Z, Møller N, Weare JH (1992b) An equation of state for the CH4-CO2- H2O system: II.Mixtures from 50 to 1000°C and 0 to 1000 bar. Geochimica et Cosmochimica Acta, 56,2619-2631.
Duan Z, Møller N, Weare JH (1996) A general equation of state for supercritical fluidmixtures and molecular dynamics simulation of mixture P-V-T-X properties. Geochimicaet Cosmochimica Acta, 60, 1209-1216.
Dubessy J, Audeoud D, Wilkins R, Kosztolany C (1982) The use of the Raman MicroprobeMole in the determination of the electrolytes dissolved in the aqueous phase of fluidinclusions. Chemical Geology, 37, 137-150.
Dubessy J, Poty B, Ramboz C (1989) Advances in C-O-H-N-S fluid geochemistry basedon micro-Raman spectrometric analysis of fluid inclusions. European Journal of Mineralogy,1, 517-534.
Dubessy J, Buschaert S, Lamb W, Pironon J, Thiéry R (2001) Methane bearing aqueousfluid inclusions: Raman analysis, thermodynamic modelling and application to petroleumbasins. Chemical Geology, 173, 193-205.
Duddy IR, Green PF, Bray RJ, Hegarty KA (1994) Recognition of the thermal effects offluid flow in sedimentary basins. In: Geofluids: Origin, Migration and Evolution of Fluids inSedimentary Basins (Parnell J, Ed). Geological Society Special Publication, 78, 325-345.
Eberl DD, Srodon J, Nüesch R (1996) MUDMASTER: a program for calculating crystallitesize distributions and strain from the shapes of X-ray diffraction peaks. USGS Open FileReport 96-171, 44 pp.
Eberl D, Drits VA, Srodon J (1998) Deducing growth mechanisms for minerals from theshape of crystal size distributions. American Journal of Science, 298, 499-533.
Ehrenberg SN, Aagaard P, Wilson MJ, Fraser AR, Duthie DML (1993) Depth-dependenttransformation of kaolinite to dickite in sandstones of the Norwegian Continental Shelf.Clays and clay minerals, 28,325-352.
Fein JB (2000) Experimental and field constraints on the role of silica-organic complexationand silica-microbial interactions during sediment diagenesis. Special Publications of theInternational Association of Sedimentologists, 29, 119-127.
References
148
Fisher D & Byrne T (1990) The character and distribution of mineralised fractures in theKodiak Formation, Alaska: implications for fluid flow in an underthrust sequence. Journalof Geophysical Research, 95, 9069-9080.
Fitches WR (1987) Aspects of veining in the Welsh Lower Palaeozoic Basin. In: Deformationof Sediments and Sedimentary Rocks (Jones ME & Preston RMF; Eds). Geological SocietySpecial Publications, 29, 325-342.
Foley NK, Bethke PM, Rye RO (1989) A reinterpretation of the δDH2O of inclusion fluids incontemporaneous quartz and sphalerite, Creede mining district, Colorado. EconomicGeology, 84, 1966-1977.
Francis EH (1982) Emplacement mechanism of late Carboniferous tholeiite sill in northernBritain. Journal of the Geological Society, London, 139, 1-20.
Frey M, Teichmüller M, Teichmüller R, Mullis J, Künzi B, Breitschimd A, Gruner U, SchwizerB (1980) Very low-grade metamorphism in external parts of the Central Alps: Illite crystalinity,coal rank and fluid inclusion data. Eclogae Geologae Helveticae, 73, 173-203.
Frey M (1987) Very low-grade metamorphism of clastic sedimentary rocks. In: LowTemperature Metamorphism (Frey M; Ed). Blackie & Sons, Glasgow, 9-57.
Friedman I & O’Neill JR (1977) Compilation of stable isotope fractionation factors ofgeochemical interest. US Geological Survey Professional Paper, 440 K-K, 12 pp.
Frings KH (2002) Palaeotemperature anomalies in late-Variscan coal basins, Ciñera-Matallana basin, Cantabrian Zone, NW Spain. GAEA heidelbergensis, 11, 128pp.
Frodsham K & Gayer RA (1997) Variscan compressional structures within the mainproductive coal-bearing strata of South Wales. Journal of the Geological Society, London,154, 195-208.
Galán E, Aparicio A, Villegas FJ (1978) El metamorfismo de muy bajo grado(Anquimetamorfismo) de la Cuenca Carbonífera Ciñera-Matallana, León. EstudiosGeológicos, 34, 505-510.
García López S, Brime C, Bastida F, Sarmiento NG (1997) Simultaneous use of thermalindicators to analyse the transition from diagenesis to metamorphism: an example fromthe Variscan Belt of north-west Spain. Geological Magazine, 134, 323-334.
García López S, Bastida F, Brime C, Aller J, Valín ML, Sanz-López J, Méndez CA,Menéndez-Álvarez JR (1999) Metamorphic episodes in the Cantabrian Zone and theirstructural context. Trabajos de Geología, 21, 177-187.
Gardiner DJ & Graves PR -Eds- (1989) Practical Raman Spectroscopy. Springer, Berlin.
Garven G (1995) Continental-scale groundwater flow and geological processes. AnnualReview of Earth and Planetary Sciences, 24, 89-117.
References
149
Gasparrini M, Bechstädt T, Boni M (2001) Large scale hydrothermal dolomitization in theSouthern Cantabrian Zone (NW Spain). In: Water-Rock Interaction 2001 (Cidu R; Ed).Swets & Zeitlinger Publishers, Volume 1, 165-168.
Gasparrini M, Bakker RJ, Bechstädt T, Boni M (2002) Massive hydrothermal dolomitizationin the Cantabrian Zone (NW Spain): a Permian to Triassic event promoted by extensionaltectonics? AAPG-IFP Hedberg Conference, Palermo. Abstracts (Roure F & Swennen R;Eds), s18.
Gayer RA, Cole JE, Frodsham K, , Hartley AJ, Hillier B, Miliorizos M, White SC (1991) Therole of fluids in the evolution of the South Wales Coalfield foreland basin. Proceedings ofthe Ussher Society, 7, 380-384.
Gayer RA, Fowler R and Davies G (1997) Coal rank variations with depth related to majorthrust detachments in the South Wales coalfield: Implications for fluid flow andmineralisation. In: European coal geology and technology (Gayer RA & Pesek J; Eds).Geological Society Special Publication, 125, 161-178.
Gayer RA, Garven G, Rickard D (1998) Fluid migration and coal-rank development inforeland basins. Geology, 26, 679-682.
Goldstein RH (1986) Re-equilibration of fluid inclusions in low-temperature calciumcarbonate cement. Geology, 14, 792-795.
Goldstein RH & Reynolds TJ (1994) Systematics of fluid inclusions in diagenetic minerals.SEPM Short Course, 31, 199 pp.
Gómez-Fernández F, Both RA, Mangas J, Arribas A (2000) Metallogenesis of Zn-PbCarbonate-Hosted mineralisation in the south-eastern region of the Picos de Europa(Central Northern Spain) province: geologic, fluid inclusion, and stable isotope studies.Economic geology, 95, 19-40.
Götze J, Plötze M, Habermann D (2001) Origin, spectral characteristics and practicalapplications of the cathodoluminescence of quartz – A review. Mineralogy and Petrology,71, 225-250.
Gratier JP (1982) Experimental and natural approach to the deformation of rocks bydissolution-crystallisation, with material transfer. Bulletin de Mineralogie, 105, 291-300.
Gratier JP & Jenatton, L (1984) Deformation by solution-deposition, and re-equilibration offluid inclusions in crystals depending on temperature, internal pressure and stress. Jour-nal of Structural Geology, 6, 189-200.
Grimmer JOW (2000) Fluidassoziierte Brekzien als Monitor dolomitisierender unddedolomitisierender Lösungströme in der Kantabrischen Zone (Nordspanien). Naturwis-senschaftlich-Mathematischen Gesamtfakultät. Ruprecht-Karls-Universität Heidelberg,148pp.
References
150
Haar L, Gallagher JS, Kell GS (1984) Steam Tables, thermodynamic and transportproperties and computer programs for vapour and liquid state of water in SI units.Hemisphere Publishing.
Helmig HM (1965) The Geology of the Valderrueda, Tejerina, Ocejo and Sabero coal basins(Cantabrian mountains, Spain). Leidse Geologische Mededelingen, 32, 75-149.
Heward AP (1978) Alluvial fan and lacustrine sediments from the Stephanian A and B (LaMagdalena, Ciñera-Matallana and Sabero coalfields), northern Spain. Sedimentology, 25,451-483.
Hoefs J (1997) Stable Isotope Geochemistry. 4th Edition. Springer-Verlag, 202 pp.
Hollister LS & Crawford ML, Eds (1981) Fluid Inclusions: Applications to Petrology.Mineralogical Association of Canada Short Course Handbook, 6, 304 pp.
Horváth F, Dövény P, Laczó I (1986) Geothermal effect of magmatism and its contributionto the maturation of organic matter in sedimentary basins. Lecture Notes in Earth Sciences,5, 173-183.
Hurai V & Horn E-E (1992) A boundary layer-induced immiscibility in naturally re-equilibratedH2O-CO2-NaCl inclusions from metamorphic quartz (Western Carpathians, Czechoslovakia)Contributions to Mineralogy and Petrology, 112, 414-427.
Johnston CT, Sposito G, Birge RR (1985) Raman spectroscopy of kaolinite in aqueoussuspension. Clays and Clay Minerals, 33, 483-489.
Julivert M (1971) Décollement tectonics in the Hercinian Cordillera of NW Spain. Ameri-can Journal of Science, 270, 1-29.
Julivert M (1978) Hercynian orogeny and Carboniferous palaeogeography in north-westernSpain: a model of deformation-sedimentation relationships. Zeitschrift der DeutschenGeologischen Gesellschaft, 129, 565-592.
Kastner M (1982) When does dedolomitization occur and what controls it. 11th Internatio-nal Congress of Sedimentology (Abstracts). Hamilton, Ontario, Canada, 124.
Keller M & Krumm S (1993) Variscan versus Caledonian and Precambrian metamorphicevents in the Cantabrian Mountains, Northern Spain. Zeitschrift der Deutschen Geologi-schen Gesellschaft, 144, 88-103
Kisch HJ (1987) Correlation between indicators of very low-grade metamorphism. In: LowTemperature Metamorphism (Frey M; Ed). Blackie & Sons, Glasgow, 227-300.
Kisch HJ & Taylor GH (1966) Metamorphism and alteration near an intrusive-coal contact.Economic Geology, 61, 343-361.
Kisch HJ & van den Kerkhof AM (1991) CH4-rich inclusions from quartz veins in the Valley-and-Ridge province and the anthracite fields of the Pennsylvania Appalachians. AmericanMineralogist, 76, 230-240.
References
151
Knight JA (1983) The stratigraphy of the Stephanian rocks of the Sabero Coalfield, León(NW Spain), and an investigation of the fossil flora: part I. The stratigraphy and generalgeology of the Sabero Coalfield. Paleontographica (Stuttgart), Abt. B 187, 1-88.
Knight JA, Burger K, Bieg G (2000) The pyroclastic tonsteins of the Sabero Coalfield,north-western Spain, and their relationship to the stratigraphy and structural geology. In-ternational Journal of Coal Geology, 44, 187-226.
Kokelaar BP (1982) Fluidisation of wet sediments during the emplacement and cooling ofvarious igneous bodies. Journal of the Geological Society, London, 139, 21-33.
Kretz R (1983) Symbols for rock-forming minerals. American Mineralogist, 68, 277-279.
Kronenberg AK, Kirby SH, Aines RD, Rossman GR (1986) Solubility and diffusional uptakeof hydrogen in quartz at high water pressures; implications for hydrolytic weakening. Jour-nal of Geophysical Research, B, Solid Earth and Planets, 91, 12,723-12,741.
Krumgalz BS, Pogorelsky R, Pitzer KS (1996) Volumetric properties of single aqueouselectrolytes from zero to saturation concentrations at 298.15 K represented by Pitzer‘sIon-Interaction Equation. Journal of Physical Chemistry Reference Data, 25, 663-689.
Küster M & Stöckhert B (1997) Density changes of fluid inclusions in high-pressure low-temperature metamorphic rocks from Crete: A thermobarometric approach based on thecreep strength of host minerals. Lithos, 41, 151-167.
Lacazette A (1990) Application of linear elastic fracture mechanics to the quantitativeevaluation of fluid-inclusion decrepitation. Geology, 18, 782-785.
Land LS (1983) The application of stable isotopes to studies of the origin of dolomite andto problems of diagenesis of clastic sediments. SEPM Short Course, 10.
Land LS & Prezbindowski DR (1981) The origin and evolution of saline formation waters,lower Cretaceous carbonates, south-central Texas, USA. Journal of Hydrology, 54, 51-74.
Lee BI & Kesler MG (1975) A generalised thermodynamic correlation based on three-parameter corresponding states. American Institute of Chemical Engineering Journal, 21,510-527.
Leroy J (1979) Gauging the internal pressure of fluid inclusions during decrepitation. Bulletinde Mineralogie, 102, 584-593.
Lobato L, García Alcalde JL, Sánchez de Posada LC, Truyols J, Villegas FJ (1984) Hojadel Mapa Geológico Nacional E. 1:50.000 n° 104 (BOÑAR). 2 Serie MAGNA. InstitutoGeológico y Minero de España.
Luque C, Martínez-García E, Ruiz F (1990) Metallogenesis. In: Pre-Mesozoic geology ofIberia (Dallmeyer RD & Martínez-García E; Eds). Springer-Verlag, 80-87.
References
152
Machel HG & Burton EA (1991) Factors governing cathodoluminescence in calcite anddolomite, and their implications for studies of carbonate diagenesis. In: LuminescenceMicroscopy and Spectroscopy – Qualitative and quantitative applications (Barker CE andKopp OC; Eds). SEPM Short Course, 25, 37-57.
Machel HG, Mason RA, Mariano AN, Mucci A (1991) Causes and emission of luminescencein calcite and dolomite. In: Luminescence Microscopy and Spectroscopy – Qualitative andquantitative applications (Barker CE and Kopp OC; Eds). SEPM Short Course, 25, 9-25.
Marcos A & Pulgar JA (1982) An approach to the tectonostratigraphic evolution in theCantabrian Foreland thrust and fold belt, Hercynian Cordillera of NW Spain. Neues Jahr-buch. Geologie und Paläontologie, 163 (2), 256-260.
Marschik R (1992) Der Übergang von der Diagenese zur sehr niedergradigen Metamor-phose im externen Varistikum (Kantabrische Zone), NW Spanien. Unpublished DiplomaThesis, University Heidelberg, 70 pp.
Martínez-García E (1990) Stephanian and Permian Basins. In: Pre-Mesozoic geology ofIberia (Dallmeyer RD & Martínez-García E; Eds). Springer-Verlag, 80-87.
McCaffrey KJW, Lonergan L, Wilkinson JJ -Eds- (1999) Fractures, Fluid Flow andMineralization. Geological Society Special Publication, 155, 330 pp.
McKinley JM, Worden R, Ruffell AH (2001) Contact diagenesis; the effect of an intrusionon reservoir quality in the Triassic Sherwood Sandstone Group, Northern Ireland. Journalof Sedimentary Research, 71, 484-495.
McMillan PF (1989) Raman spectroscopy in mineralogy and geochemistry. Annual Re-views of Earth and Planetary Sciences, 17, 225-283.
McMillan PF & Hofmeister AM (1988) Infrared and Raman spectroscopy. In: SpectroscopyMethods in Mineralogy and Geology. Reviews in Mineralogy, 18, 99-159.
Méndez-Cecilia AJ (1985) Estudio de la evolución de los carbones de la cuenca Ciñera-Matalana, León. Unpublished PhD Thesis, University of Oviedo, 269 pp.
Milliken KL (1998) Carbonate diagenesis in non-marine sandstones at the western edgeof the Alleghenian overthrust belt, southern Appalachians. Special Publications of the In-ternational Association of Sedimentologists, 26, 87-105.
Moore CH & Druckman Y (1981) Burial diagenesis and porosity evolution, Upper JurassicSmackover, Arkansas and Lousiana. Bulletin of the American Association of PetroleumGeologists, 65, 597-628.
Moore DM & Reynolds RC (1997) X-ray diffraction and the identification and analysis ofclay minerals. 2nd Edition. Oxford University Press, 378 pp.
Morad S. (1998) Carbonate cementation in sandstones: distribution pattern andgeochemical evolution. Special Publications of the International Association ofSedimentologists, 26, 1-26.
References
153
Morad S, Ketzer JM, de Ros LF (2000) Spatial and temporal distribution of diageneticalterations in siliciclastic rocks: implications for mass transfer in sedimentary basins.Sedimentology, 47 (supplement 1), 95-120.
Morrow DW, Cumming GL, Koepnick RB (1986) Manetoe facies – a gas-bearing,megacrystalline, Devonian dolomite, Yukon and Northwest Territories. Canada. Bulletin ofthe American Association of Petroleum Geologists, 70, 702-720.
Muchez P, Slobodnik M, Viaene WA, Keppens E (1995) Geochemical constraints on theorigin and migration of palaeofluids at the northern margin of the Variscan Foreland, southernBelgium. Sedimentary Geology, 96, 191-200.
Muchez P & Sintubin M (1997) Contrasting origin of palaeofluids in a strike-slip fault system.XIV ECROFI, European Current Research on Fluid Inclusions, Nancy 1997. 222-223.
Mullis J (1979) The system methane-water as a geologic thermometer and barometerfrom the external part of the Alps. Bulletin de Minéralogie, 102, 526-536.
Mullis J (1987) Fluid inclusion studies during very low-grade metamorphism. In: LowTemperature Metamorphism (Frey M; Ed). Blackie & Sons, Glasgow, 162-199.
Mullis J, Dubessy J, Poty B, O’Neil J (1994) Fluid regimes during late stages of continentalcollision: Physical, chemical, and stable isotope measurements of fluid inclusions in fissurequartz from a geotraverse through the Central Alps, Switzerland. Geochimica etCosmochimica Acta, 58, 2239-2267.
Naden J (1996) CalcicBrine; a Microsoft Excel 5.0 add-in for calculating salinities frommicrothermometric data in the system NaCl-CaCl2–H2O. Program and Abstracts; BiennialPan-American Conference on Research on Fluid Inclusions, 6, 97-98.
O’Hara M & Reid RC (1973) Modelling Crystal Growth Rates from Solution. EnglewoodCliffs, New Jersey, Prentice-Hall, 272 pp.
Olds RH, Sage BH, Lacey WN (1942) Phase equilibria in hydrocarbon systems:Composition of the dew-point gas in the methane-water system. AIChE Journal, 10, 202.
Oliver J (1986) Fluids expelled tectonically from orogenic belts: Their role in hydrocarbonmigration and other geologic phenomena. Geology, 14, 99-102.
Osborne M & Haszeldine RS (1993) Evidence for resetting of fluid inclusion temperaturesfrom quartz cements in oilfields. Marine and Petroleum Geology, 10, 233-239.
Osborne M & Haszeldine RS (1995) Discussion: Evidence for resetting of fluid inclusiontemperatures from quartz cements in oilfields. Marine and Petroleum Geology, 12, 559-575.
Pagel M, Barbin V, Blanc P, Ohnenstetter D -Eds- (2000) Cathodoluminescence inGeosciences. Springer Verlag, 514 pp.
References
154
Paniagua A (1998) Gold showings and deposits of the Palentian Zone (NW Spain). In:Gold Exploration and Mining in NW Spain (Arias D, Martín-Izard A, Paniagua A; Eds).Facultad de Geología-Departamento de Geología. Universidad de Oviedo.
Paniagua A, Loredo J, Gracía-Iglesias J (1988) Epithermal (Cu-Co-Ni) mineralisation inthe Aramo mine (Cantabrian Mountains, Spain): correlation between paragenetic and fluidinclusion data. Bulletin de Minéralogie, 111, 383-391.
Paniagua A, Rodriguez-Pevida LS, Gutierrez-Villarias JL (1988a) Mineralizaciones As-Sb-Au asociadas a rocas igneas filonianas del NE de León: las minas de Burón. Boletínde la Sociedad Española de Mineralogía, 11, 35-46.
Paniagua A, Fontboté L, Fenoll Hach-Alí P, Fallick AE, Moreiras DB, Corretgé LG (1993)Tectonic setting, mineralogical characteristics, geochemical signatures and age dating ofa new type of epithermal carbonate-hosted, precious metal-five element deposits: theVillamanín area (Cantabrian Zone, Northern Spain). In: Current research in geology appliedto ore deposits (Fenoll Hach-Alí, Torres-Ruiz, Gervilla; Eds). 2nd biennal SGA Meeting,Granada, 531-534.
Paniagua A, Loredo J, García-Iglesias J (1995). Epithermal carbonate-hosted Au-Cu-Ni-Co mineralisation at the Villamanín area (Cantabrian Zone, N Spain): fluid inclusion studyversus paragenetic and sulfur isotopic data. XIII ECROFI, European Current Research onFluid Inclusions, Barcelona 1995. Boletín de la Sociedad Española de Mineralogía, 18,172-173.
Paniagua A, Loredo J, Fenoll P, Rodríguez-Pevida LS (1997) Extrapolation at lowtemperatures of the arsenopyrite geothermometer contrasting with fluid inclusion data:the example of Salamón (Spain). XIV ECROFI, European Current Research on FluidInclusions, Nancy 1997. 255-256.
Parnell J -Ed- (1994) Geofluids: Origin, Migration and Evolution of Fluids in SedimentaryBasins. Geological Society Special Publication, 78, 374 pp.
Paschier CW & Trouw RAJ (1998) Microtectonics. 2ndEdition. Springer-Verlag, 289 pp.
Pêcher A (1981) Experimental decrepitation and re-equilibration of fluid inclusions insynthetic quartz. Tectonophysics, 78, 565-576.
Pérez-Estaun A, Bastida F, Alonso JL, Marquínez J, Aller J, Alvarez-Marrón J, Marcos A,Pulgar JA (1988) A thin-skinned tectonic model for an arcuate fold and thrust belt: theCantabrian Zone (Variscan Ibero-Armorican Arc). Tectonics, 7 (3), 517-537.
Prezbindowsky DR & Larese RE (1987) Experimental stretching of fluid inclusions in calcite:implications for diagenetic studies. Geology, 15, 333-336.
Price LC (1979) Aqueous solubility of methane at elevated pressures and temperatures.Bulletin of the American Association of Petroleum Geologists, 63, 1527-1533.
Pulgar FJ, Alonso JL, Espina RG, Marín JA (1999) The alpine deformation in the Variscanbasement of the Cantabrian Zone. Trabajos de Geología, 21, 283-294.
References
155
Radke BM & Mathis RL (1980) On the formation and occurrence of saddle dolomite. Jour-nal of Sedimentary Petrology, 50, 1149-1168.
Ramboz C, Pichavant M and Weisbrod A (1982) Fluid immiscibility in natural processes.Use and misuse of fluid inclusion data. II. Interpretation of fluid inclusion data on terms ofimmiscibility. Chemical Geology, 37, 29-48.
Raven JGM & Van der Pluijm BA (1986) Metamorphic fluids and transtension in theCantabrian Mountains of northern Spain: an application of the conodont colour alterationindex. Geological Magazine, 123, 673-681.
Raymond AC & Murchison DG (1991) The relationship between organic maturation, thewidths of thermal aureoles and the thicknesses of sills in the Midland Valley of Scotlandand Northern England. Journal of the Geological Society, London, 148, 215-218.
Renard F, Brosse E, Sommer F (2000) The different processes involved in the mechanismof pressure solution in quartz-rich rocks and their interactions. Special Publications of theInternational Association of Sedimentologists, 29, 67-78.
Rettich TR, Handa YP, Battino R, Wilhelm E (1981) Solubility of gases in liquids: 13. Highprecision of Henry’s constants for methane and ethane on liquid water at 275 to 328 K.Journal of Physical Chemistry, 85, 3230-3237.
Roberts S & Beattie I (1995) Micro-Raman spectroscopy in the Earth Sciences. In:Microprobe Techniques in the Earth Sciences (Potts PJ, Bowless JFW, Reed SJB CaveMR; Eds). Chapman and Hall, London, 387-408.
Roedder E (1984) Fluid Inclusions. Reviews in Mineralogy, 12, 646 pp.
Rosenbaum J & Sheppard SM (1986) An isotopic study of siderites, dolomites and ankeritesat high temperatures. Geochimica et Cosmochimica Acta, 50, 1147-1150.
Rusk B & Reed M (2002) Scanning electron microscope-cathodoluminescence analysisof quartz reveals complex growth histories in veins from the Butte porphyry copper deposit,Montana. Geology, 30, 727-730.
Samson IM & Walker RT (2000) Cryogenic Raman Spectroscopic studies in the systemNaCl-CaCl2-H2O and implications for low-temperature phase behaviour in aqueous fluidinclusions. Canadian Mineralogist, 38, 35-43.
Schiffman P & Day HW (1999) Petrological methods for the study of very low-grademetabasites. In: Low-Grade Metamorphism (Frey M & Robinson D; Eds). Blackwell Science,108-142.
Seitz JC, Pasteris JD, Chou IM (1996) Raman spectroscopic characterisation of gasmixtures II: quantitative composition and pressure determination of the CO2-CH4 system.American Journal of Science, 296, 577-600.
References
156
Setzmann U & Wagner W (1991) A new equation of state and tables of thermodynamicproperties for methane covering the range from the melting line to 625°K at pressure up to1000 MPa. Journal of Physical Chemistry Reference Data, 20, 1061-115.
Sharp ZD (1999) Application of stable isotope geochemistry to low-grade metamorphicrocks. In: Low-Grade Metamorphism (Frey M & Robinson D; Eds). Blackwell Science,227-260.
Shepherd T, Rankin AH, Alderton DHM (1985) A Practical Guide to Fluid Inclusion Studies.Blackie & Sons, Glasgow, 239 pp.
Sibson RH (1994) Crustal stress, faulting and fluid flow. In: Geofluids: Origin, Migrationand Evolution of Fluids in Sedimentary Basins (Parnell J; Ed). Geological Society SpecialPublication, 78, 69-84.
Snyman CP & Barclay J (1989) The coalification of South African coal. International Jour-nal of Coal Geology, 13, 375-390.
Soave G (1972) Equilibrium constants from a modified Redlich-Kwong equation of state.Chemical Engineering Science, 27, 1197-1203.
Sorby HC (1858) On the microscopical structure of crystals indicating the origin of rocksand minerals. Quarterly Journal of the Geological Society, London, 14, 453-500.
Spiro B, Tornos F, Shepherd TJ (1995) Stable Isotope characterisation of barren andmineralised tardi-Hercynian hydrothermal carbonates in the Cantabrian Zone (N Spain).In: Mineral Deposits: from their origin to environmental impacts (Pasava J, Kribek B & ZakK; Eds). Rotterdam, Balkema, 75-78.
Spötl C & Pitman JK (1998) Saddle (baroque) dolomite in carbonates and sandstones: arepraisal of a burial diagenetic concept. Special Publications of the International Associationof Sedimentologists, 26, 437-460.
Sterner SM & Bodnar RJ (1989) Synthetic fluid inclusions VII. Re-equilibration of fluidinclusions in quartz during laboratory-simulated metamorphic burial and uplift. Journal ofMetamorphic Geology, 7, 243-260.
Sterner SM, Hall DL, Keppler H (1995) Compositional re-equilibration of fluid inclusions inquartz. Contributions to Mineralogy and Petrology, 119, 1-15.
Svensen H, Jamtveit B, Banks DA, Karlsen D (2001) Fluids and halogens at the diagenetic-metamorphic boundary: evidence from veins in continental basins, western Norway.Geofluids, 1, 53-70.
Swanenberg HEC (1980) Fluid inclusions in high-grade metamorphic rocks from SWNorway. PhD Thesis, Geol. Ultraiectina, Univ. Utrecht, 25, 147 pp.
Swierczeswska A, Tokarski AK, Hurai V (2000) Joints and mineral veins during structuralevolution: case study from the Outer Carpathians (Poland). Geological Quarterly, 44, 333-339.
References
157
Teichmüller M (1987) Organic material and very low-grade metamorphism. In: LowTemperature Metamorphism (Frey M; Ed). Blackie & Sons, Glasgow, 114-161.
Teichmüller M & Teichmüller R (1986) Relations between coalification and palaeo-geothermics in Variscan and Alpidic foredeeps of western Europe. In: Palaeogeothermics(Buntebarth G & Stegena L; Eds). Springer (Heidelberg). Lecture Notes in Earth Sciences,5, 53-78.
Thiery R, Vidal J, Dubessy J (1994) Phase equilibria modelling applied to fluid inclusions;liquid-vapour equilibria and calculation of the molar volume in the CO2-CH4-N2 system.Geochimica et Cosmochimica Acta, 58, 1073-1082.
Tornos F & Spiro BF (2000) The geology and isotope geochemistry of the talc deposit ofPuebla de Lillo (Cantabrian Zone, Northern Spain). Economic Geology, 95, 1277-1296.
Uysal, IT, Glikson M, Golding SD, Audsley F (2000) The thermal history of the BowenBasin, Queensland, Australia; vitrinite reflectance and clay mineralogy of Late Permiancoal measures. Tectonophysics, 323, 105-129.
Uysal, I T; Golding, S D; Glikson, M (2000a) Petrographic and isotope constraints on theorigin of authigenic carbonate minerals and the associated fluid evolution in Late Permiancoal measures, Bowen Basin (Queensland), Australia. Sedimentary Geology, 136, 189-206.
Valley JW, Taylor HP, O’Neill JR -Eds- (1986) Stable Isotopes in High TemperatureGeological Processes. Reviews in Mineralogy, 16, 570 pp.
van den Kerkhof AM (1990) Isochoric phase diagrams in the systems CO2-CH4 and CO2-N2: Application to fluid inclusions. Geochimica et Cosmochimica Acta, 54, 621-629.
van den Kerkhof AM & Hein UF (2001) Fluid inclusion petrography. Lithos, 55, 27-47.
Villegas FJ (1996) Exploración e investigación de un nuevo yacimento de carbón en lacuenca minera Cinera-Matallana (León). Unpublished PhD Thesis, Univ. ComplutenseMadrid, 417p.
Vityk MO & Bodnar RJ (1995) Textural evolution of synthetic fluid inclusions in quartzduring re-equilibration, with application to tectonic reconstruction. Contributions toMineralogy and Petrology, 121, 309-323.
Vityk MO, Bodnar RJ, Schmidt CS (1994) Fluid inclusions as tectonothermobarometers:Relation between pressure-temperature history and re-equilibration morphology duringcrustal thickening. Geology, 22, 731-734.
Vityk MO, Bodnar RJ, Dudok IG (1995) Natural and synthetic re-equilibration textures offluid inclusions in quartz (Marmarosh Diamond): evidence for refilling under conditions ofcompressive loading. European Journal of Mineralogy, 7, 1071-1087.
References
158
Vityk MO, Bodnar RJ, Dudok IG (1996) Fluid inclusions in “Marmarosh Diamonds”: evidencefor tectonic history of the Folded Carpathian mountains, Ukraine. Tectonophysics, 255,163-174.
Wachter E & Hayes JM (1985) Exchange of oxygen isotopes in carbon-dioxide - phosphoricacid systems. Chemical Geology, 52, 365-374.
Wagner RH & Artieda JI (1970): La Cuenca Minera Ciñera-Matallana. S.A. Hullera VascoLeonesa.
Wagner RH (1971) The stratigraphy and structure of the Ciñera-Matallana Coalfield(Province of León, NW Spain). Trabajos de Geología, 4, 385-429.
Wagner W & Pruss A (1993) International equations for the saturation properties of ordinarywater substances. Revised according to the international temperature scale of 1990. Ad-dendum to Journal of Physical Chemistry Reference Data, 16, 783-787.
Walderhaug O (1994) Temperatures of quartz cementation in Jurassic sandstones fromthe Norwegian continental shelf – Evidence from fluid inclusions. Journal of SedimentaryResearch, 64, 311-323.
Warr LN & Peacor DR (2002) Evaluation of X-ray diffraction methods for determining thecrystal growth mechanisms of clay minerals in mudstones, shales and slates. Schweizeri-sche Mineralogische und Petrographische Mitteilungen, 82, 187-202.
Welsch H (1973) Die Systeme Xenon-Wasser und Methan-Wasser bei hohen Drückenund Temperaturen. Dissertation, Universität Karlsruhe.
Welton, Joann E (1984) SEM petrology atlas. AAPG methods in exploration series, 4, 237pp.
White SC (1991) Palaeo-geothermal profiling across the South Wales Coalfield.Proceedings of the Ussher Society, 7, 368-374.
Wilson CJL (1994) Crystal growth during a single-stage opening event and its implicationsfor syntectonic veins. Journal of Structural Geology, 16, 1283-1296.
Winkler HGF (1979) Petrogenesis of metamorphic rocks. Springer-Verlag, 348 pp.
Wood JR (1986) Advective diagenesis: thermal mass transfer in systems containing quartzand calcite. In: Roles of organic matter in sediment diagenesis (Gautier DL; Ed). Societyof economic palaeontologists and mineralogists (SEPM) Special Publications, 38, 170-180.
Worden RH & Morad S (2000) Quartz cementation in oil field sandstones: a review of thekey controversies. Special Publications of the International Association of Sedimentologists,29, 1-20.
Lists
159
LIST OF FIGURES
Fig. 1. Geological sketch map of the Cantabrian Zone (CZ).........................................................3
Fig. 2. Geological sketch map showing the main metamorphic zones of the CZ..........................4
Fig. 3. Geological sketch map showing volatile matter content in the coalfields of the CZ...........6
Fig. 4. Geological map, cross-sections and stratigraphic column of the SB................................11
Fig. 5. Geological map, cross-sections and stratigraphic column of the CMB.............................14
Fig. 6. Diorite intrusion within a coal seam on top of the Pastora Fm................................................16
Fig. 7. Outcrop from locality 12a, fold-related structure...............................................................20
Fig. 8. Type and scale of the fault-related deformation structures...............................................21
Fig. 9. Kinematic model for the formation of the mineralised fissures.........................................22
Fig. 10. Energy Dispersive X-ray spectrum of kaolinite: Al4 [Si4O10](OH)8....................................27
Fig. 11. Calibration curve of the Linkam TH600 Microthermometry Stage..................................29
Fig. 12. Photomicrographs of double polished sections (100-120 µm thick)...............................38
Fig. 13. X-ray diffractograms of two texture preparates (clay fraction < 2µm)..............................39
Fig. 14. Photomicrographs of thin sections (30 to 60 µm) under PPL and CL.............................40
Fig. 15. Stained polished hand specimens from mineralised fissures.........................................41
Fig. 16. Reflected light images of sulphide minerals in veins......................................................42
Fig. 17. SEM back scattered electron images from a thin section...............................................44
Fig. 18. Photomicrographs of authigenic pore filling kaolinite (kln)..............................................44
Fig. 19. X-ray diffractograms showing the authigenic kaolinite main peak (kln)...........................45
Fig. 20. Summarised sequence of mineral growth for the veins..................................................47
Fig. 21. Photomicrograph of a 60-50 µm thin section from a quartz (qtz2) vein..........................48
Fig. 22. SEM back-scattered electron images from kaolinite in a qtz2 thin section......................49
Fig. 23. X-ray diffractograms of two texture preparates (< 2µm) from diorites..............................50
Fig. 24. Fluid inclusion distribution in qtz1...................................................................................52
Fig. 25. Photographs and sketches of inclusions in qtz1..............................................................53
Fig. 26. Raman spectra of vapour phase in types 1 and 2 in qtz1...............................................54
Fig. 27. Histograms vapour phase composition of inclusions in qtz1 and qtz2............................55
Fig. 28. Phase transitions in vapour-rich type 1/2 qtz1................................................................56
Fig. 29. Th-T
m plot of vapour-rich type 1/2 inclusions in qtz1........................................................57
Fig. 30. Phase transitions in aqueous-rich type 1/2 qtz1.............................................................58
Fig. 31. Histogram of Th and T
m ice for qtz1.................................................................................59
Fig. 32. Raman spectra of entrapped solid phases in type 1/2 qtz1 and cal2..............................60
Fig. 33. Raman spectra of methane and hydrohalite in type 3 inclusions....................................61
Fig. 34. Phase transitions in type 3 inclusions of qtz1.................................................................62
Fig. 35. Raman spectra of entrapped kaolinite in type 3 and in qtz2 inclusions...........................63
Fig. 36. Fluid inclusion distribution in cal2....................................................................................64
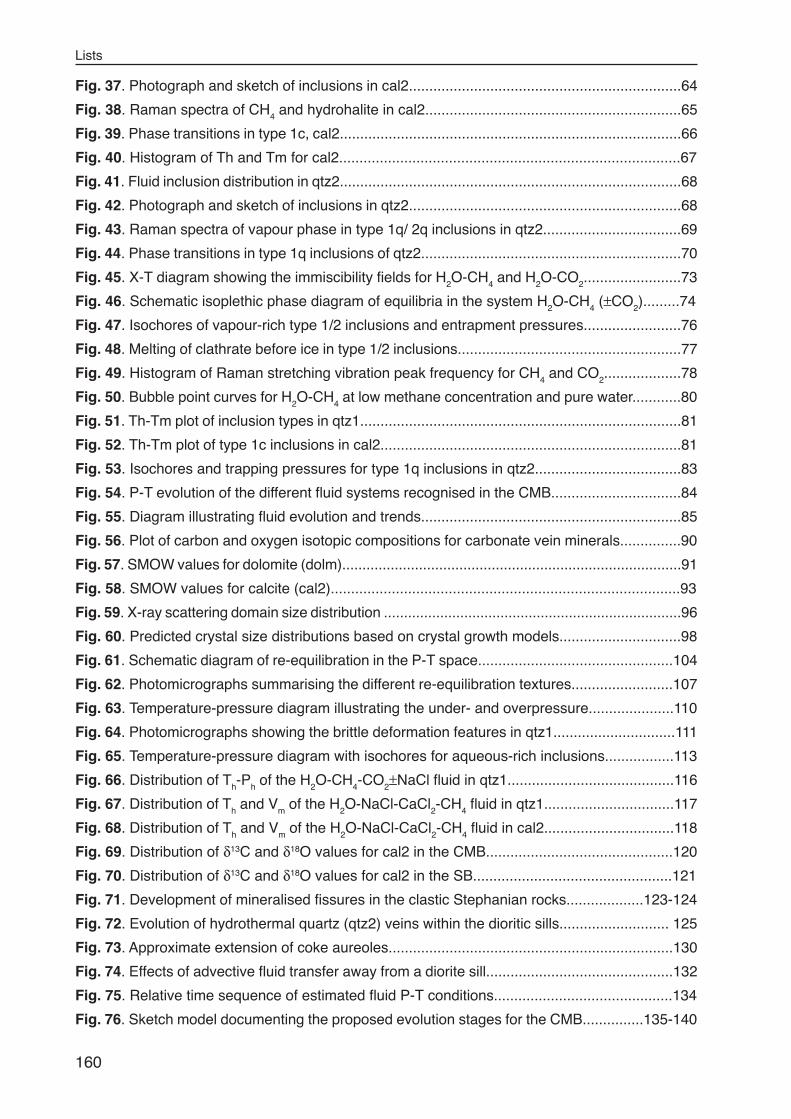
Lists
160
Fig. 37. Photograph and sketch of inclusions in cal2...................................................................64
Fig. 38. Raman spectra of CH4 and hydrohalite in cal2...............................................................65
Fig. 39. Phase transitions in type 1c, cal2....................................................................................66
Fig. 40. Histogram of Th and Tm for cal2....................................................................................67
Fig. 41. Fluid inclusion distribution in qtz2....................................................................................68
Fig. 42. Photograph and sketch of inclusions in qtz2...................................................................68
Fig. 43. Raman spectra of vapour phase in type 1q/ 2q inclusions in qtz2..................................69
Fig. 44. Phase transitions in type 1q inclusions of qtz2................................................................70
Fig. 45. X-T diagram showing the immiscibility fields for H2O-CH4 and H2O-CO2........................73
Fig. 46. Schematic isoplethic phase diagram of equilibria in the system H2O-CH4 (±CO2).........74
Fig. 47. Isochores of vapour-rich type 1/2 inclusions and entrapment pressures........................76
Fig. 48. Melting of clathrate before ice in type 1/2 inclusions.......................................................77
Fig. 49. Histogram of Raman stretching vibration peak frequency for CH4 and CO2...................78
Fig. 50. Bubble point curves for H2O-CH4 at low methane concentration and pure water............80
Fig. 51. Th-Tm plot of inclusion types in qtz1...............................................................................81
Fig. 52. Th-Tm plot of type 1c inclusions in cal2..........................................................................81
Fig. 53. Isochores and trapping pressures for type 1q inclusions in qtz2....................................83
Fig. 54. P-T evolution of the different fluid systems recognised in the CMB................................84
Fig. 55. Diagram illustrating fluid evolution and trends................................................................85
Fig. 56. Plot of carbon and oxygen isotopic compositions for carbonate vein minerals...............90
Fig. 57. SMOW values for dolomite (dolm)....................................................................................91
Fig. 58. SMOW values for calcite (cal2)......................................................................................93
Fig. 59. X-ray scattering domain size distribution ..........................................................................96
Fig. 60. Predicted crystal size distributions based on crystal growth models..............................98
Fig. 61. Schematic diagram of re-equilibration in the P-T space................................................104
Fig. 62. Photomicrographs summarising the different re-equilibration textures.........................107
Fig. 63. Temperature-pressure diagram illustrating the under- and overpressure.....................110
Fig. 64. Photomicrographs showing the brittle deformation features in qtz1..............................111
Fig. 65. Temperature-pressure diagram with isochores for aqueous-rich inclusions.................113
Fig. 66. Distribution of Th-Ph of the H2O-CH4-CO2±NaCl fluid in qtz1.........................................116
Fig. 67. Distribution of Th and Vm of the H2O-NaCl-CaCl2-CH4 fluid in qtz1................................117
Fig. 68. Distribution of Th and Vm of the H2O-NaCl-CaCl2-CH4 fluid in cal2................................118
Fig. 69. Distribution of δ13C and δ18O values for cal2 in the CMB..............................................120
Fig. 70. Distribution of δ13C and δ18O values for cal2 in the SB.................................................121
Fig. 71. Development of mineralised fissures in the clastic Stephanian rocks...................123-124
Fig. 72. Evolution of hydrothermal quartz (qtz2) veins within the dioritic sills........................... 125
Fig. 73. Approximate extension of coke aureoles......................................................................130
Fig. 74. Effects of advective fluid transfer away from a diorite sill..............................................132
Fig. 75. Relative time sequence of estimated fluid P-T conditions............................................134
Fig. 76. Sketch model documenting the proposed evolution stages for the CMB...............135-140
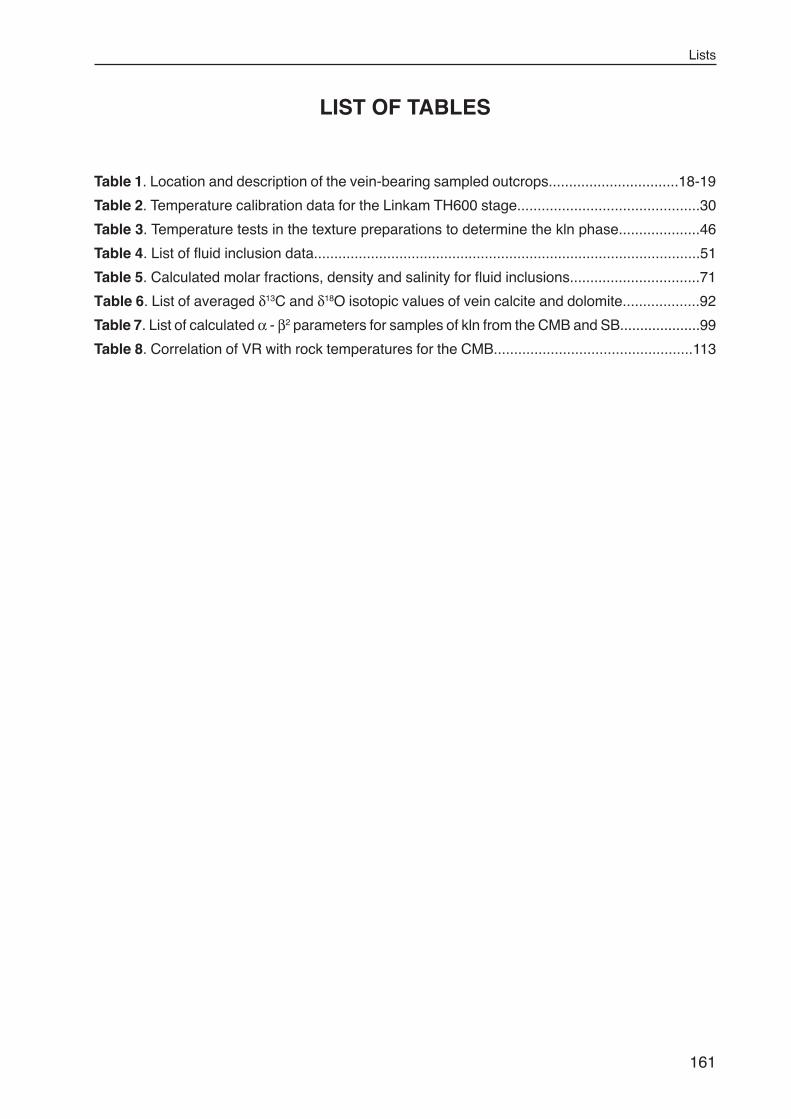
Lists
161
LIST OF TABLES
Table 1. Location and description of the vein-bearing sampled outcrops................................18-19
Table 2. Temperature calibration data for the Linkam TH600 stage.............................................30
Table 3. Temperature tests in the texture preparations to determine the kln phase....................46
Table 4. List of fluid inclusion data...............................................................................................51
Table 5. Calculated molar fractions, density and salinity for fluid inclusions................................71
Table 6. List of averaged δ13C and δ18O isotopic values of vein calcite and dolomite...................92
Table 7. List of calculated α - β2 parameters for samples of kln from the CMB and SB....................99
Table 8. Correlation of VR with rock temperatures for the CMB.................................................113

Lists
162
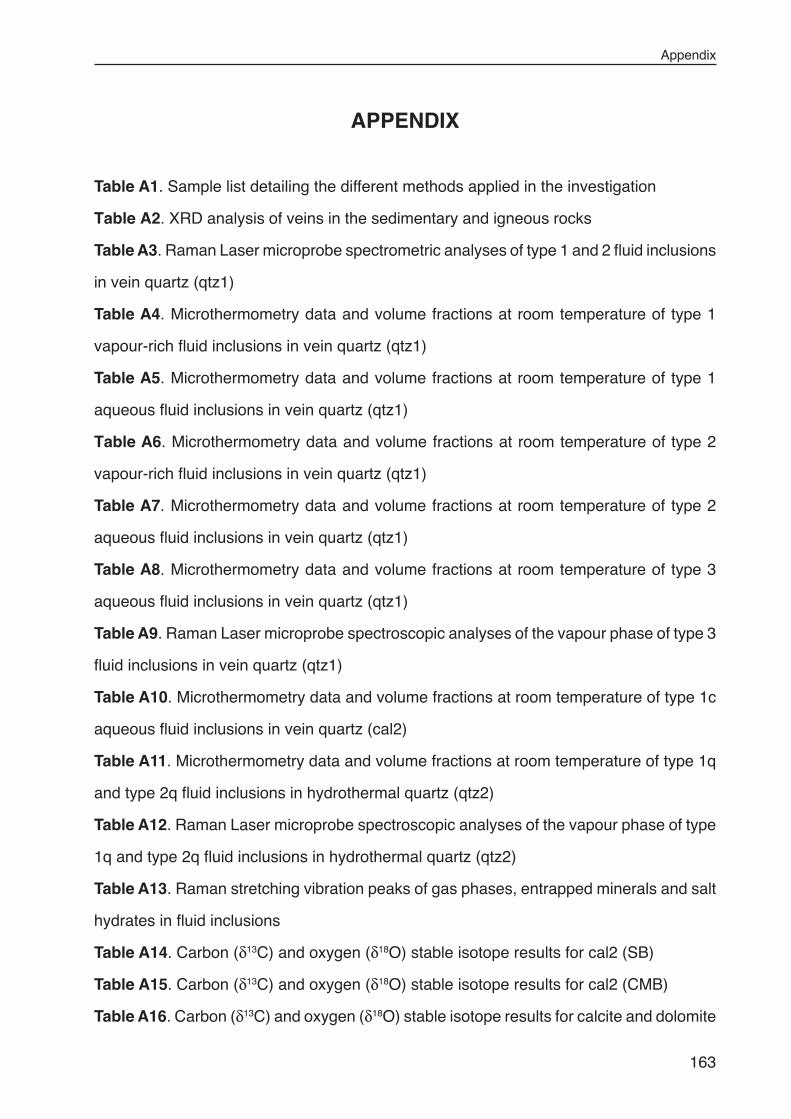
Appendix
163
APPENDIX
Table A1. Sample list detailing the different methods applied in the investigation
Table A2. XRD analysis of veins in the sedimentary and igneous rocks
Table A3. Raman Laser microprobe spectrometric analyses of type 1 and 2 fluid inclusions
in vein quartz (qtz1)
Table A4. Microthermometry data and volume fractions at room temperature of type 1
vapour-rich fluid inclusions in vein quartz (qtz1)
Table A5. Microthermometry data and volume fractions at room temperature of type 1
aqueous fluid inclusions in vein quartz (qtz1)
Table A6. Microthermometry data and volume fractions at room temperature of type 2
vapour-rich fluid inclusions in vein quartz (qtz1)
Table A7. Microthermometry data and volume fractions at room temperature of type 2
aqueous fluid inclusions in vein quartz (qtz1)
Table A8. Microthermometry data and volume fractions at room temperature of type 3
aqueous fluid inclusions in vein quartz (qtz1)
Table A9. Raman Laser microprobe spectroscopic analyses of the vapour phase of type 3
fluid inclusions in vein quartz (qtz1)
Table A10. Microthermometry data and volume fractions at room temperature of type 1c
aqueous fluid inclusions in vein quartz (cal2)
Table A11. Microthermometry data and volume fractions at room temperature of type 1q
and type 2q fluid inclusions in hydrothermal quartz (qtz2)
Table A12. Raman Laser microprobe spectroscopic analyses of the vapour phase of type
1q and type 2q fluid inclusions in hydrothermal quartz (qtz2)
Table A13. Raman stretching vibration peaks of gas phases, entrapped minerals and salt
hydrates in fluid inclusions
Table A14. Carbon (δ13C) and oxygen (δ18O) stable isotope results for cal2 (SB)
Table A15. Carbon (δ13C) and oxygen (δ18O) stable isotope results for cal2 (CMB)
Table A16. Carbon (δ13C) and oxygen (δ18O) stable isotope results for calcite and dolomite
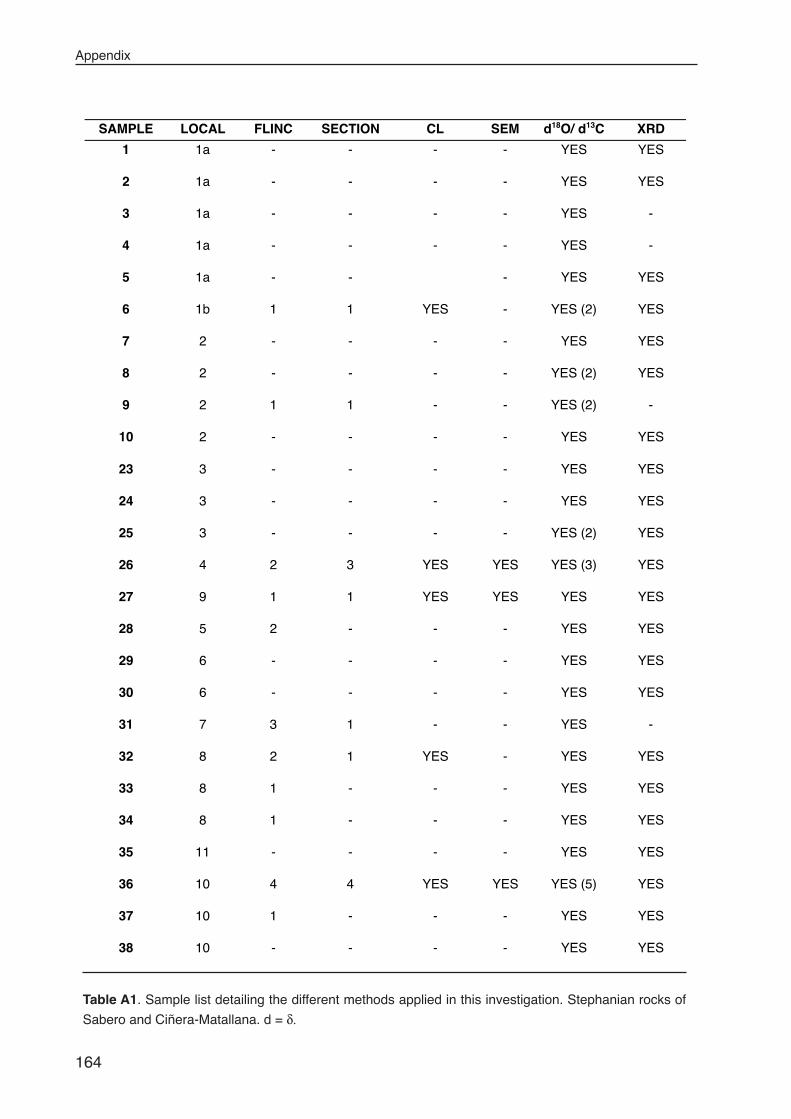
Appendix
164
Table A1. Sample list detailing the different methods applied in this investigation. Stephanian rocks of
Sabero and Ciñera-Matallana. d = δ.
SAMPLE LOCAL FLINC SECTION CL SEM d18O/ d13C XRD
1 1a - - - - YES YES
2 1a - - - - YES YES
3 1a - - - - YES -
4 1a - - - - YES -
5 1a - - - YES YES
6 1b 1 1 YES - YES (2) YES
7 2 - - - - YES YES
8 2 - - - - YES (2) YES
9 2 1 1 - - YES (2) -
10 2 - - - - YES YES
23 3 - - - - YES YES
24 3 - - - - YES YES
25 3 - - - - YES (2) YES
26 4 2 3 YES YES YES (3) YES
27 9 1 1 YES YES YES YES
28 5 2 - - - YES YES
29 6 - - - - YES YES
30 6 - - - - YES YES
31 7 3 1 - - YES -
32 8 2 1 YES - YES YES
33 8 1 - - - YES YES
34 8 1 - - - YES YES
35 11 - - - - YES YES
36 10 4 4 YES YES YES (5) YES
37 10 1 - - - YES YES
38 10 - - - - YES YES
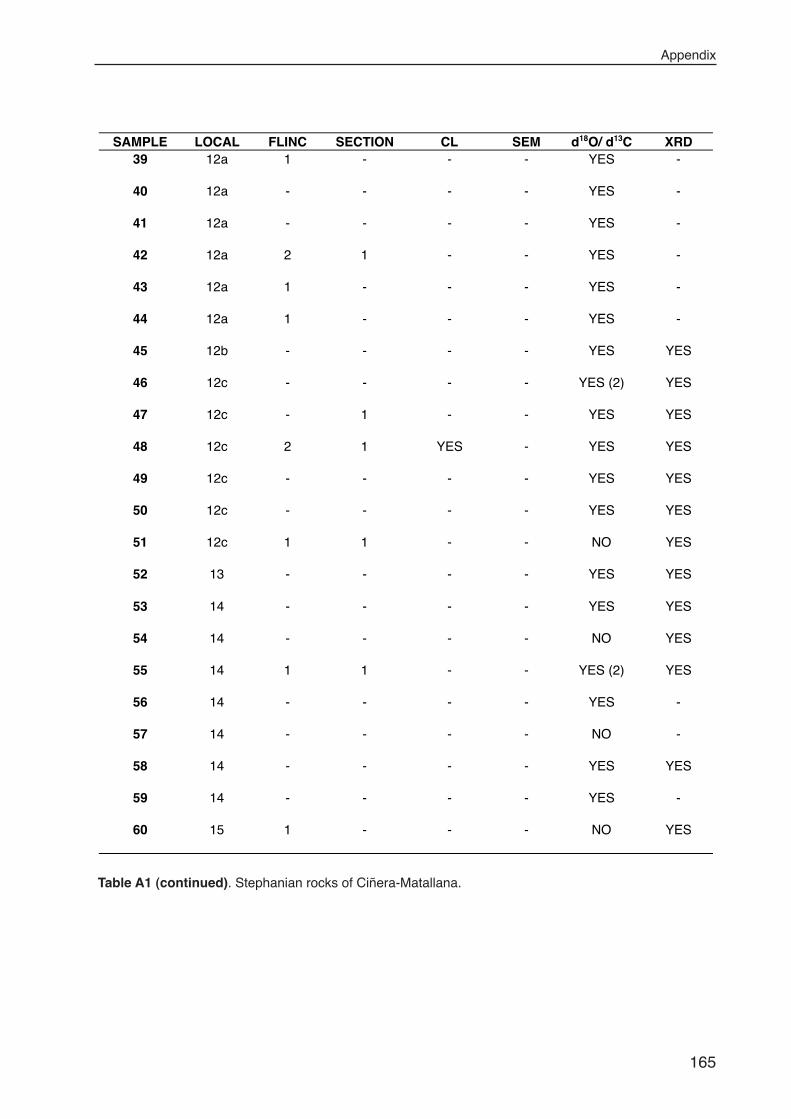
Appendix
165
Table A1 (continued). Stephanian rocks of Ciñera-Matallana.
SAMPLE LOCAL FLINC SECTION CL SEM d18O/ d13C XRD39 12a 1 - - - YES -
40 12a - - - - YES -
41 12a - - - - YES -
42 12a 2 1 - - YES -
43 12a 1 - - - YES -
44 12a 1 - - - YES -
45 12b - - - - YES YES
46 12c - - - - YES (2) YES
47 12c - 1 - - YES YES
48 12c 2 1 YES - YES YES
49 12c - - - - YES YES
50 12c - - - - YES YES
51 12c 1 1 - - NO YES
52 13 - - - - YES YES
53 14 - - - - YES YES
54 14 - - - - NO YES
55 14 1 1 - - YES (2) YES
56 14 - - - - YES -
57 14 - - - - NO -
58 14 - - - - YES YES
59 14 - - - - YES -
60 15 1 - - - NO YES
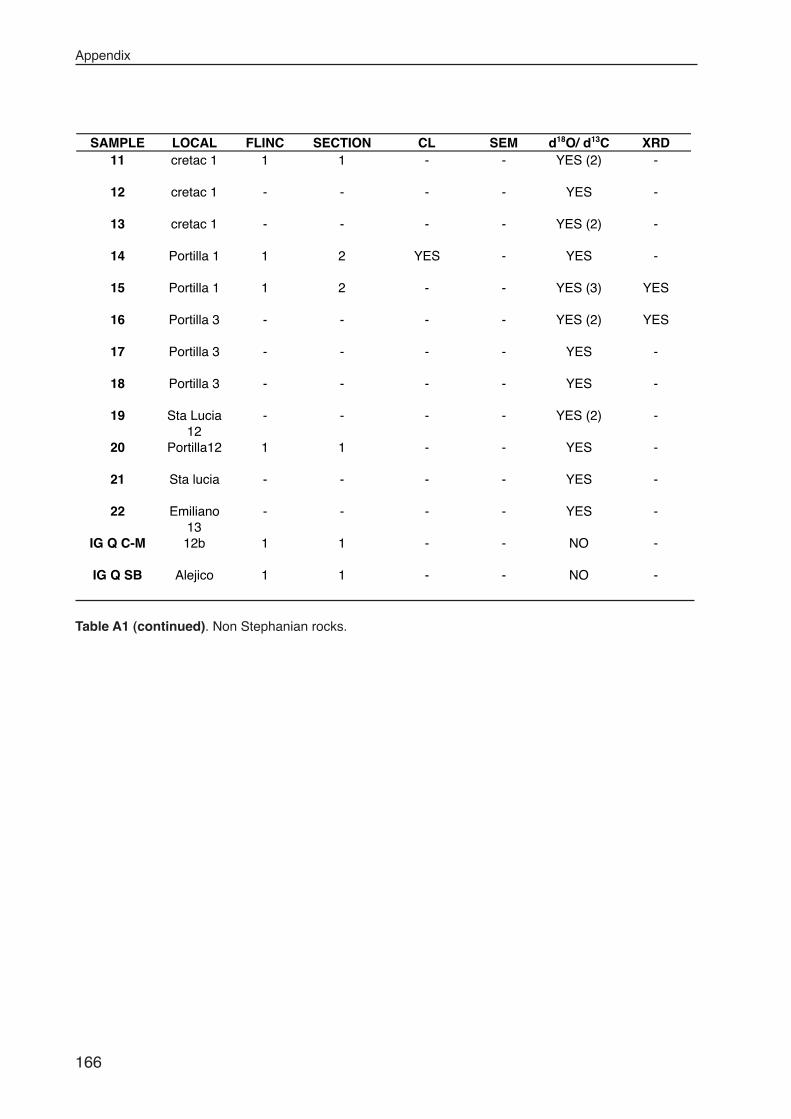
Appendix
166
Table A1 (continued). Non Stephanian rocks.
SAMPLE LOCAL FLINC SECTION CL SEM d18O/ d13C XRD11 cretac 1 1 1 - - YES (2) -
12 cretac 1 - - - - YES -
13 cretac 1 - - - - YES (2) -
14 Portilla 1 1 2 YES - YES -
15 Portilla 1 1 2 - - YES (3) YES
16 Portilla 3 - - - - YES (2) YES
17 Portilla 3 - - - - YES -
18 Portilla 3 - - - - YES -
19 Sta Lucia12
- - - - YES (2) -
20 Portilla12 1 1 - - YES -
21 Sta lucia - - - - YES -
22 Emiliano13
- - - - YES -
IG Q C-M 12b 1 1 - - NO -
IG Q SB Alejico 1 1 - - NO -
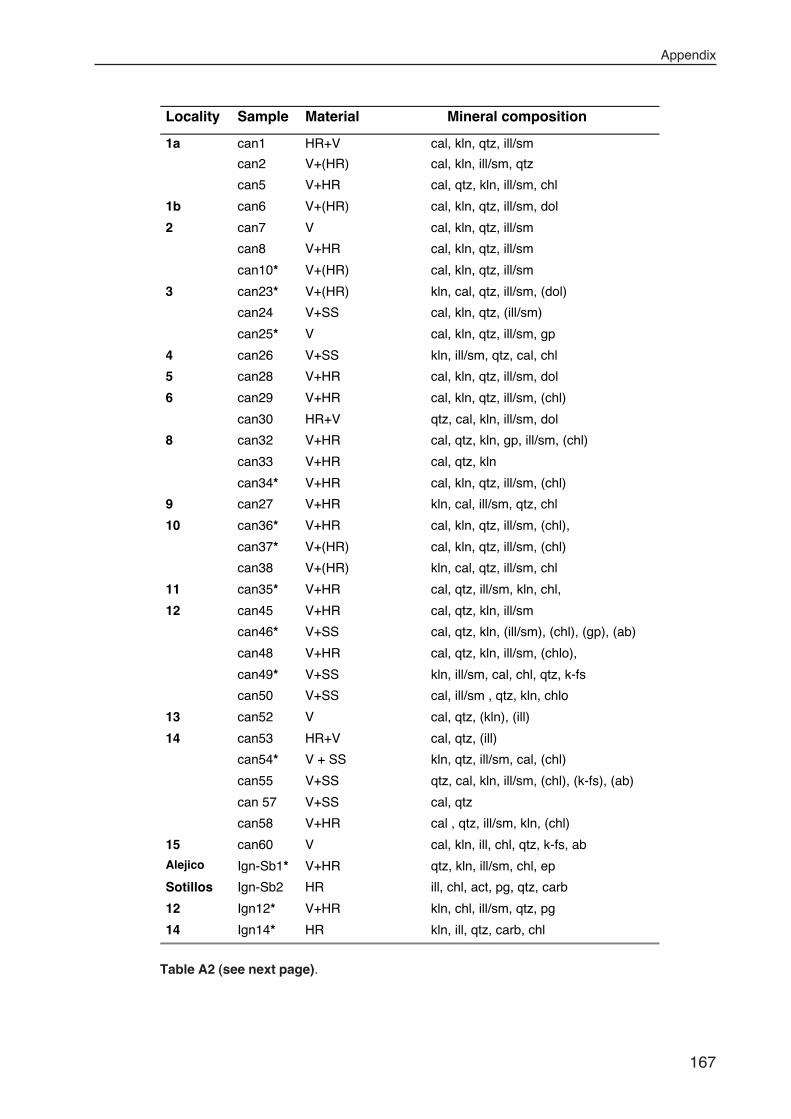
Appendix
167
Locality Sample Material Mineral composition
1a can1 HR+V cal, kln, qtz, ill/sm
can2 V+(HR) cal, kln, ill/sm, qtz
can5 V+HR cal, qtz, kln, ill/sm, chl
1b can6 V+(HR) cal, kln, qtz, ill/sm, dol
2 can7 V cal, kln, qtz, ill/sm
can8 V+HR cal, kln, qtz, ill/sm
can10* V+(HR) cal, kln, qtz, ill/sm
3 can23* V+(HR) kln, cal, qtz, ill/sm, (dol)
can24 V+SS cal, kln, qtz, (ill/sm)
can25* V cal, kln, qtz, ill/sm, gp
4 can26 V+SS kln, ill/sm, qtz, cal, chl
5 can28 V+HR cal, kln, qtz, ill/sm, dol
6 can29 V+HR cal, kln, qtz, ill/sm, (chl)
can30 HR+V qtz, cal, kln, ill/sm, dol
8 can32 V+HR cal, qtz, kln, gp, ill/sm, (chl)
can33 V+HR cal, qtz, kln
can34* V+HR cal, kln, qtz, ill/sm, (chl)
9 can27 V+HR kln, cal, ill/sm, qtz, chl
10 can36* V+HR cal, kln, qtz, ill/sm, (chl),
can37* V+(HR) cal, kln, qtz, ill/sm, (chl)
can38 V+(HR) kln, cal, qtz, ill/sm, chl
11 can35* V+HR cal, qtz, ill/sm, kln, chl,
12 can45 V+HR cal, qtz, kln, ill/sm
can46* V+SS cal, qtz, kln, (ill/sm), (chl), (gp), (ab)
can48 V+HR cal, qtz, kln, ill/sm, (chlo),
can49* V+SS kln, ill/sm, cal, chl, qtz, k-fs
can50 V+SS cal, ill/sm , qtz, kln, chlo
13 can52 V cal, qtz, (kln), (ill)
14 can53 HR+V cal, qtz, (ill)
can54* V + SS kln, qtz, ill/sm, cal, (chl)
can55 V+SS qtz, cal, kln, ill/sm, (chl), (k-fs), (ab)
can 57 V+SS cal, qtz
can58 V+HR cal , qtz, ill/sm, kln, (chl)
15 can60 V cal, kln, ill, chl, qtz, k-fs, ab
Alejico Ign-Sb1* V+HR qtz, kln, ill/sm, chl, ep
Sotillos Ign-Sb2 HR ill, chl, act, pg, qtz, carb
12 Ign12* V+HR kln, chl, ill/sm, qtz, pg
14 Ign14* HR kln, ill, qtz, carb, chl
Table A2 (see next page).
Appendix
168
Table A2. List of X-ray diffraction results for veins in the sedimentary and igneous rocks of Sabero and
Ciñera-Matallana basins. All samples are texture preparates (∆θ < 2µm). Samples marked with (*) have also
been used in temperature tests for determining the kaolin mineral polytype, present in 32 out the 34 samples
studied. V = vein minerals; HR = host rock; SS = slicken sides. Minerals are listed from higher to lower peak
intensities (symbols after Kretz, 1983). Ab = albite; act = actinolite; cal = calcite; carb = carbonate;
chl = chlorite; dol = dolomite; ep = epidote; gp = gypsum; ill/sm = illite/smectite; k-fs = k-feldspar; kln = kaolin;
pg = plagioclase; qtz = quartz. A mineral listed in brackets indicates a very weak peak intensity.
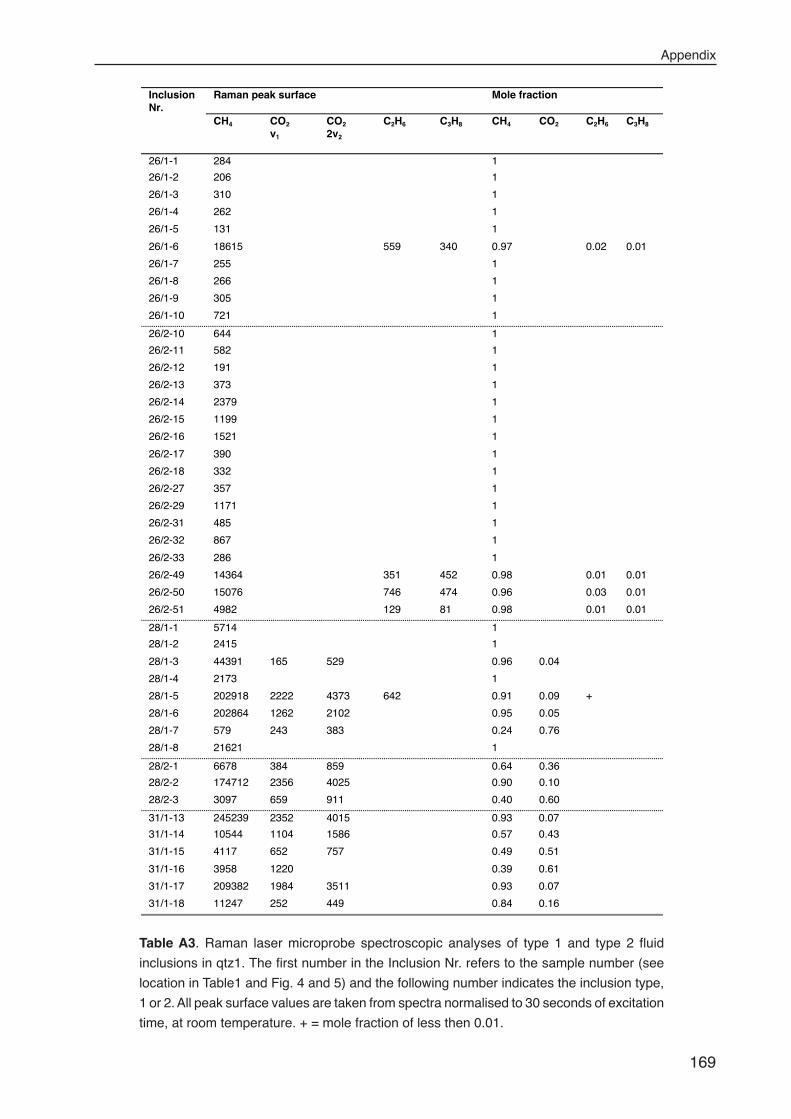
Appendix
169
InclusionNr.
Raman peak surface Mole fraction
CH4 CO2
v1
CO2
2v2
C2H6 C3H8 CH4 CO2 C2H6 C3H8
26/1-1 284 1
26/1-2 206 1
26/1-3 310 1
26/1-4 262 1
26/1-5 131 1
26/1-6 18615 559 340 0.97 0.02 0.01
26/1-7 255 1
26/1-8 266 1
26/1-9 305 1
26/1-10 721 1
26/2-10 644 1
26/2-11 582 1
26/2-12 191 1
26/2-13 373 1
26/2-14 2379 1
26/2-15 1199 1
26/2-16 1521 1
26/2-17 390 1
26/2-18 332 1
26/2-27 357 1
26/2-29 1171 1
26/2-31 485 1
26/2-32 867 1
26/2-33 286 1
26/2-49 14364 351 452 0.98 0.01 0.01
26/2-50 15076 746 474 0.96 0.03 0.01
26/2-51 4982 129 81 0.98 0.01 0.01
28/1-1 5714 1
28/1-2 2415 1
28/1-3 44391 165 529 0.96 0.04
28/1-4 2173 1
28/1-5 202918 2222 4373 642 0.91 0.09 +
28/1-6 202864 1262 2102 0.95 0.05
28/1-7 579 243 383 0.24 0.76
28/1-8 21621 1
28/2-1 6678 384 859 0.64 0.36
28/2-2 174712 2356 4025 0.90 0.10
28/2-3 3097 659 911 0.40 0.60
31/1-13 245239 2352 4015 0.93 0.07
31/1-14 10544 1104 1586 0.57 0.43
31/1-15 4117 652 757 0.49 0.51
31/1-16 3958 1220 0.39 0.61
31/1-17 209382 1984 3511 0.93 0.07
31/1-18 11247 252 449 0.84 0.16
Table A3. Raman laser microprobe spectroscopic analyses of type 1 and type 2 fluid
inclusions in qtz1. The first number in the Inclusion Nr. refers to the sample number (see
location in Table1 and Fig. 4 and 5) and the following number indicates the inclusion type,
1 or 2. All peak surface values are taken from spectra normalised to 30 seconds of excitation
time, at room temperature. + = mole fraction of less then 0.01.
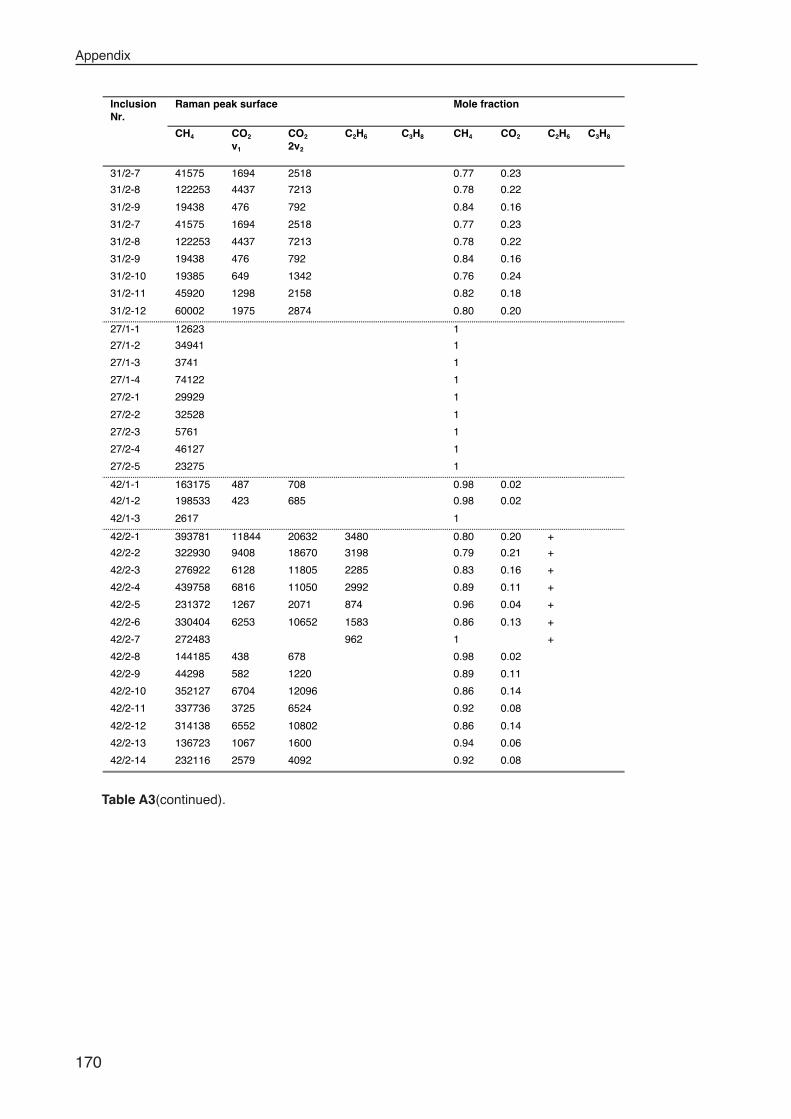
Appendix
170
InclusionNr.
Raman peak surface Mole fraction
CH4 CO2
v1
CO2
2v2
C2H6 C3H8 CH4 CO2 C2H6 C3H8
31/2-7 41575 1694 2518 0.77 0.23
31/2-8 122253 4437 7213 0.78 0.22
31/2-9 19438 476 792 0.84 0.16
31/2-7 41575 1694 2518 0.77 0.23
31/2-8 122253 4437 7213 0.78 0.22
31/2-9 19438 476 792 0.84 0.16
31/2-10 19385 649 1342 0.76 0.24
31/2-11 45920 1298 2158 0.82 0.18
31/2-12 60002 1975 2874 0.80 0.20
27/1-1 12623 1
27/1-2 34941 1
27/1-3 3741 1
27/1-4 74122 1
27/2-1 29929 1
27/2-2 32528 1
27/2-3 5761 1
27/2-4 46127 1
27/2-5 23275 1
42/1-1 163175 487 708 0.98 0.02
42/1-2 198533 423 685 0.98 0.02
42/1-3 2617 1
42/2-1 393781 11844 20632 3480 0.80 0.20 +
42/2-2 322930 9408 18670 3198 0.79 0.21 +
42/2-3 276922 6128 11805 2285 0.83 0.16 +
42/2-4 439758 6816 11050 2992 0.89 0.11 +
42/2-5 231372 1267 2071 874 0.96 0.04 +
42/2-6 330404 6253 10652 1583 0.86 0.13 +
42/2-7 272483 962 1 +
42/2-8 144185 438 678 0.98 0.02
42/2-9 44298 582 1220 0.89 0.11
42/2-10 352127 6704 12096 0.86 0.14
42/2-11 337736 3725 6524 0.92 0.08
42/2-12 314138 6552 10802 0.86 0.14
42/2-13 136723 1067 1600 0.94 0.06
42/2-14 232116 2579 4092 0.92 0.08
Table A3(continued).
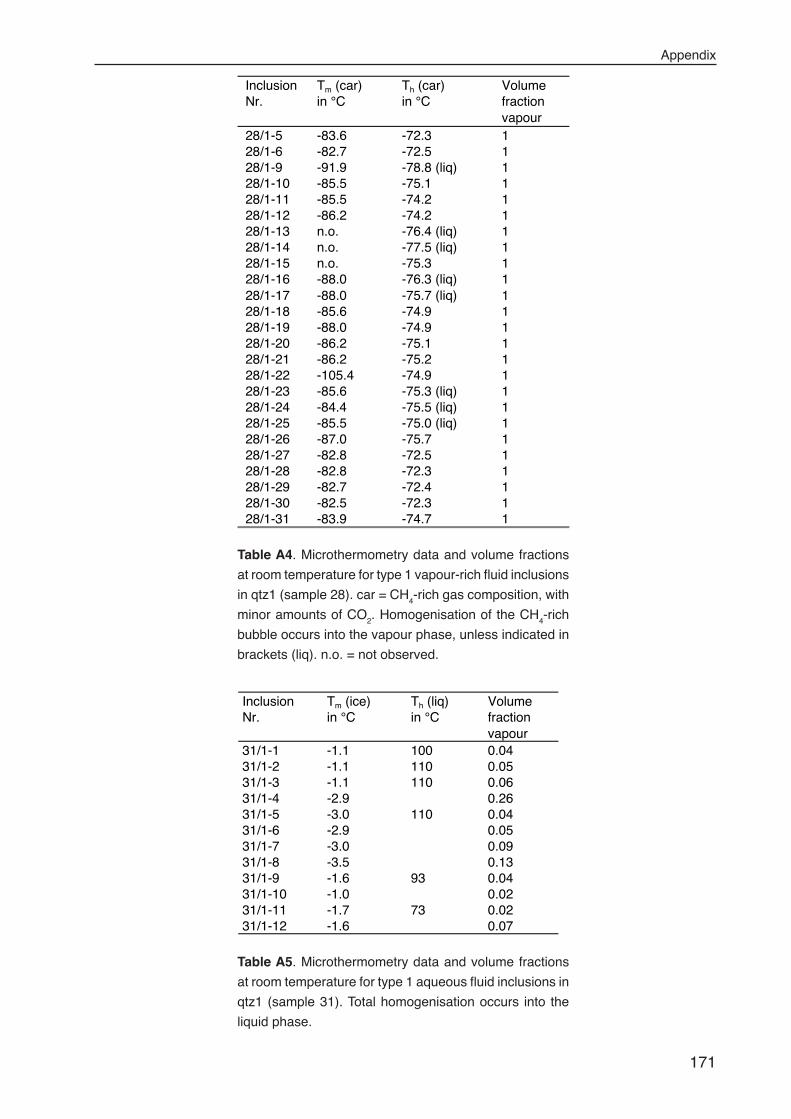
Appendix
171
InclusionNr.
Tm (car)in °C
Th (car)in °C
Volumefractionvapour
28/1-5 -83.6 -72.3 128/1-6 -82.7 -72.5 128/1-9 -91.9 -78.8 (liq) 128/1-10 -85.5 -75.1 128/1-11 -85.5 -74.2 128/1-12 -86.2 -74.2 128/1-13 n.o. -76.4 (liq) 128/1-14 n.o. -77.5 (liq) 128/1-15 n.o. -75.3 128/1-16 -88.0 -76.3 (liq) 128/1-17 -88.0 -75.7 (liq) 128/1-18 -85.6 -74.9 128/1-19 -88.0 -74.9 128/1-20 -86.2 -75.1 128/1-21 -86.2 -75.2 128/1-22 -105.4 -74.9 128/1-23 -85.6 -75.3 (liq) 128/1-24 -84.4 -75.5 (liq) 128/1-25 -85.5 -75.0 (liq) 128/1-26 -87.0 -75.7 128/1-27 -82.8 -72.5 128/1-28 -82.8 -72.3 128/1-29 -82.7 -72.4 128/1-30 -82.5 -72.3 128/1-31 -83.9 -74.7 1
InclusionNr.
Tm (ice)in °C
Th (liq)in °C
Volumefractionvapour
31/1-1 -1.1 100 0.0431/1-2 -1.1 110 0.0531/1-3 -1.1 110 0.0631/1-4 -2.9 0.2631/1-5 -3.0 110 0.0431/1-6 -2.9 0.0531/1-7 -3.0 0.0931/1-8 -3.5 0.1331/1-9 -1.6 93 0.0431/1-10 -1.0 0.0231/1-11 -1.7 73 0.0231/1-12 -1.6 0.07
Table A5. Microthermometry data and volume fractions
at room temperature for type 1 aqueous fluid inclusions in
qtz1 (sample 31). Total homogenisation occurs into the
liquid phase.
Table A4. Microthermometry data and volume fractions
at room temperature for type 1 vapour-rich fluid inclusions
in qtz1 (sample 28). car = CH4-rich gas composition, with
minor amounts of CO2. Homogenisation of the CH
4-rich
bubble occurs into the vapour phase, unless indicated in
brackets (liq). n.o. = not observed.
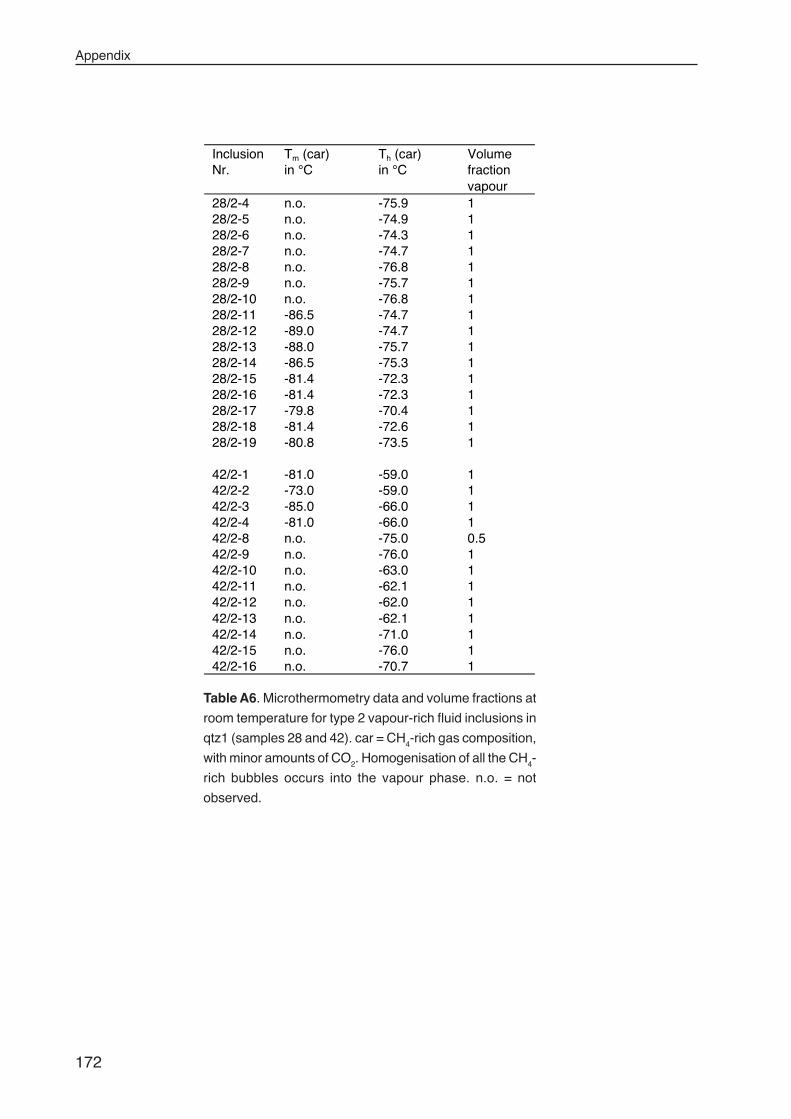
Appendix
172
InclusionNr.
Tm (car)in °C
Th (car)in °C
Volumefractionvapour
28/2-4 n.o. -75.9 128/2-5 n.o. -74.9 128/2-6 n.o. -74.3 128/2-7 n.o. -74.7 128/2-8 n.o. -76.8 128/2-9 n.o. -75.7 128/2-10 n.o. -76.8 128/2-11 -86.5 -74.7 128/2-12 -89.0 -74.7 128/2-13 -88.0 -75.7 128/2-14 -86.5 -75.3 128/2-15 -81.4 -72.3 128/2-16 -81.4 -72.3 128/2-17 -79.8 -70.4 128/2-18 -81.4 -72.6 128/2-19 -80.8 -73.5 1
42/2-1 -81.0 -59.0 142/2-2 -73.0 -59.0 142/2-3 -85.0 -66.0 142/2-4 -81.0 -66.0 142/2-8 n.o. -75.0 0.542/2-9 n.o. -76.0 142/2-10 n.o. -63.0 142/2-11 n.o. -62.1 142/2-12 n.o. -62.0 142/2-13 n.o. -62.1 142/2-14 n.o. -71.0 142/2-15 n.o. -76.0 142/2-16 n.o. -70.7 1
Table A6. Microthermometry data and volume fractions at
room temperature for type 2 vapour-rich fluid inclusions in
qtz1 (samples 28 and 42). car = CH4-rich gas composition,
with minor amounts of CO2. Homogenisation of all the CH4-
rich bubbles occurs into the vapour phase. n.o. = not
observed.
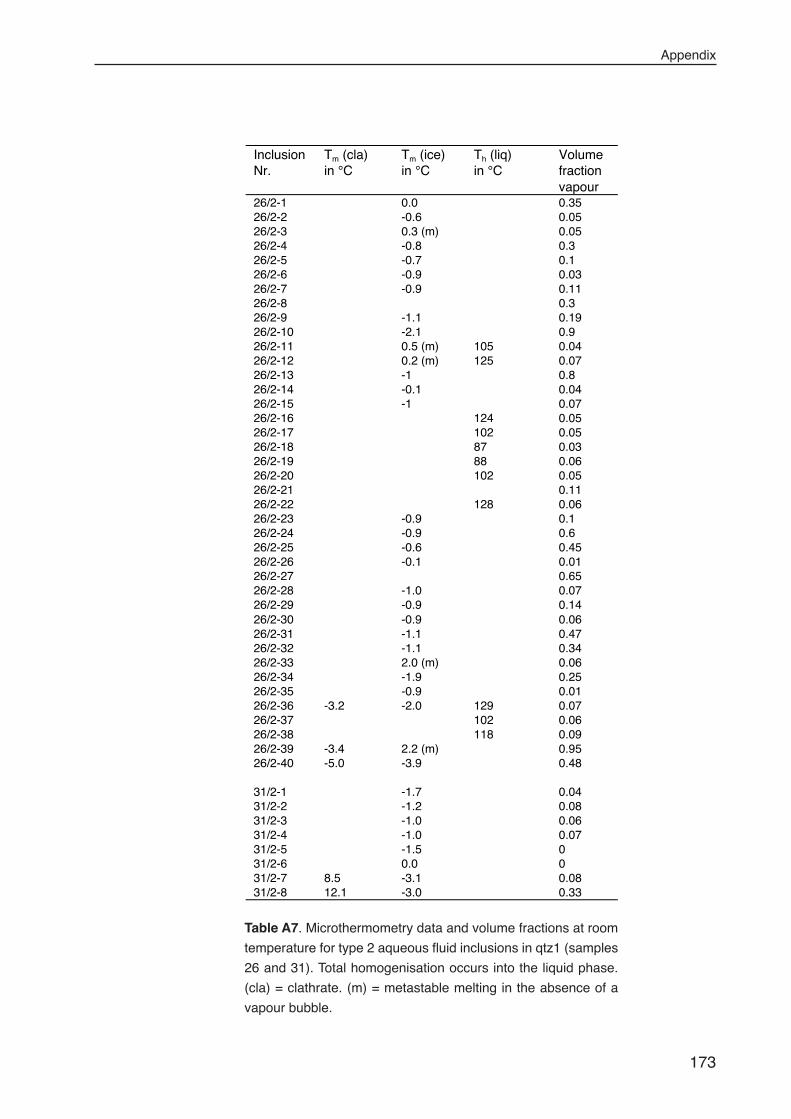
Appendix
173
InclusionNr.
Tm (cla)in °C
Tm (ice)in °C
Th (liq)in °C
Volumefractionvapour
26/2-1 0.0 0.3526/2-2 -0.6 0.0526/2-3 0.3 (m) 0.0526/2-4 -0.8 0.326/2-5 -0.7 0.126/2-6 -0.9 0.0326/2-7 -0.9 0.1126/2-8 0.326/2-9 -1.1 0.1926/2-10 -2.1 0.926/2-11 0.5 (m) 105 0.0426/2-12 0.2 (m) 125 0.0726/2-13 -1 0.826/2-14 -0.1 0.0426/2-15 -1 0.0726/2-16 124 0.0526/2-17 102 0.0526/2-18 87 0.0326/2-19 88 0.0626/2-20 102 0.0526/2-21 0.1126/2-22 128 0.0626/2-23 -0.9 0.126/2-24 -0.9 0.626/2-25 -0.6 0.4526/2-26 -0.1 0.0126/2-27 0.6526/2-28 -1.0 0.0726/2-29 -0.9 0.1426/2-30 -0.9 0.0626/2-31 -1.1 0.4726/2-32 -1.1 0.3426/2-33 2.0 (m) 0.0626/2-34 -1.9 0.2526/2-35 -0.9 0.0126/2-36 -3.2 -2.0 129 0.0726/2-37 102 0.0626/2-38 118 0.0926/2-39 -3.4 2.2 (m) 0.9526/2-40 -5.0 -3.9 0.48
31/2-1 -1.7 0.0431/2-2 -1.2 0.0831/2-3 -1.0 0.0631/2-4 -1.0 0.0731/2-5 -1.5 031/2-6 0.0 031/2-7 8.5 -3.1 0.0831/2-8 12.1 -3.0 0.33
Table A7. Microthermometry data and volume fractions at room
temperature for type 2 aqueous fluid inclusions in qtz1 (samples
26 and 31). Total homogenisation occurs into the liquid phase.
(cla) = clathrate. (m) = metastable melting in the absence of a
vapour bubble.
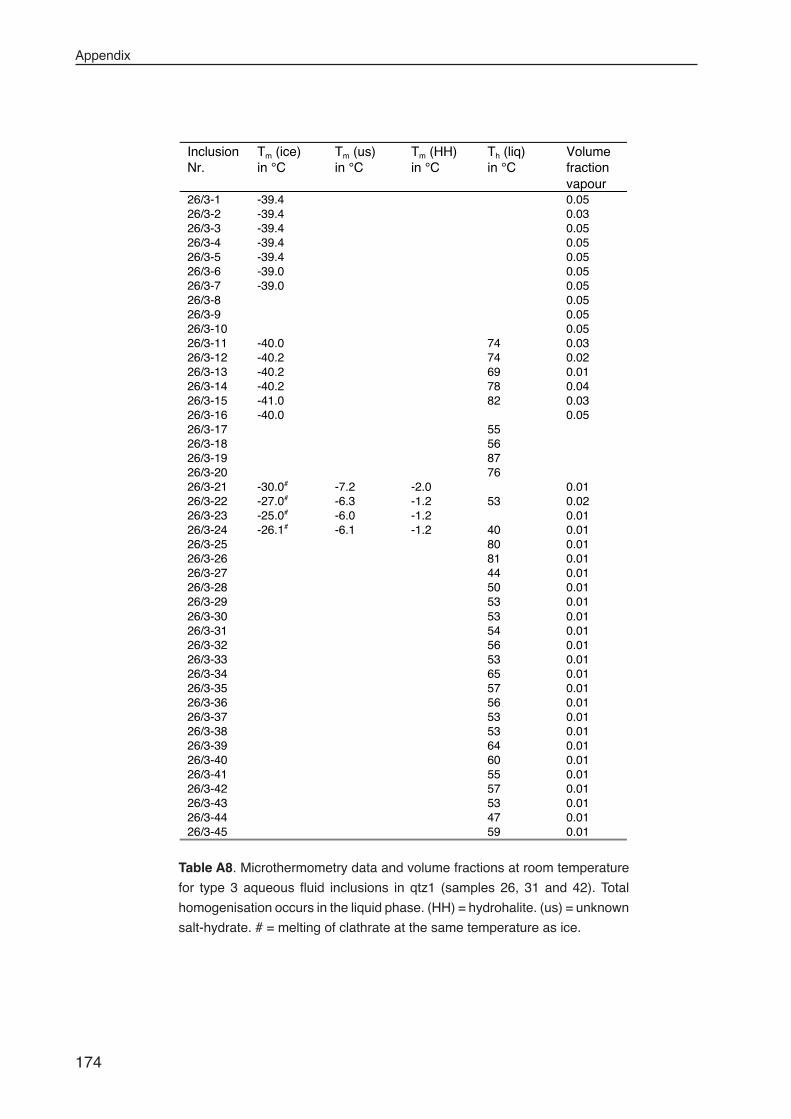
Appendix
174
InclusionNr.
Tm (ice)in °C
Tm (us)in °C
Tm (HH)in °C
Th (liq)in °C
Volumefractionvapour
26/3-1 -39.4 0.0526/3-2 -39.4 0.0326/3-3 -39.4 0.0526/3-4 -39.4 0.0526/3-5 -39.4 0.0526/3-6 -39.0 0.0526/3-7 -39.0 0.0526/3-8 0.0526/3-9 0.0526/3-10 0.0526/3-11 -40.0 74 0.0326/3-12 -40.2 74 0.0226/3-13 -40.2 69 0.0126/3-14 -40.2 78 0.0426/3-15 -41.0 82 0.0326/3-16 -40.0 0.0526/3-17 5526/3-18 5626/3-19 8726/3-20 7626/3-21 -30.0# -7.2 -2.0 0.0126/3-22 -27.0# -6.3 -1.2 53 0.0226/3-23 -25.0# -6.0 -1.2 0.0126/3-24 -26.1# -6.1 -1.2 40 0.0126/3-25 80 0.0126/3-26 81 0.0126/3-27 44 0.0126/3-28 50 0.0126/3-29 53 0.0126/3-30 53 0.0126/3-31 54 0.0126/3-32 56 0.0126/3-33 53 0.0126/3-34 65 0.0126/3-35 57 0.0126/3-36 56 0.0126/3-37 53 0.0126/3-38 53 0.0126/3-39 64 0.0126/3-40 60 0.0126/3-41 55 0.0126/3-42 57 0.0126/3-43 53 0.0126/3-44 47 0.0126/3-45 59 0.01
Table A8. Microthermometry data and volume fractions at room temperature
for type 3 aqueous fluid inclusions in qtz1 (samples 26, 31 and 42). Total
homogenisation occurs in the liquid phase. (HH) = hydrohalite. (us) = unknown
salt-hydrate. # = melting of clathrate at the same temperature as ice.
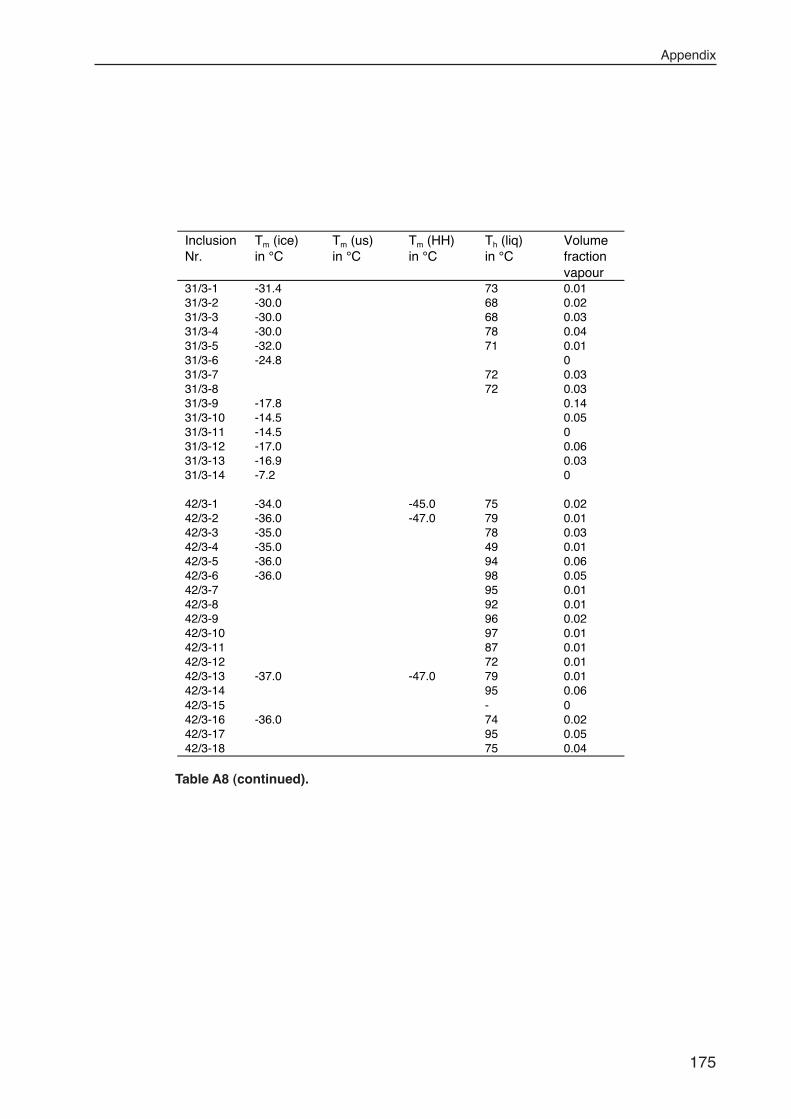
Appendix
175
InclusionNr.
Tm (ice)in °C
Tm (us)in °C
Tm (HH)in °C
Th (liq)in °C
Volumefractionvapour
31/3-1 -31.4 73 0.0131/3-2 -30.0 68 0.0231/3-3 -30.0 68 0.0331/3-4 -30.0 78 0.0431/3-5 -32.0 71 0.0131/3-6 -24.8 031/3-7 72 0.0331/3-8 72 0.0331/3-9 -17.8 0.1431/3-10 -14.5 0.0531/3-11 -14.5 031/3-12 -17.0 0.0631/3-13 -16.9 0.0331/3-14 -7.2 0
42/3-1 -34.0 -45.0 75 0.0242/3-2 -36.0 -47.0 79 0.0142/3-3 -35.0 78 0.0342/3-4 -35.0 49 0.0142/3-5 -36.0 94 0.0642/3-6 -36.0 98 0.0542/3-7 95 0.0142/3-8 92 0.0142/3-9 96 0.0242/3-10 97 0.0142/3-11 87 0.0142/3-12 72 0.0142/3-13 -37.0 -47.0 79 0.0142/3-14 95 0.0642/3-15 - 042/3-16 -36.0 74 0.0242/3-17 95 0.0542/3-18 75 0.04
Table A8 (continued).
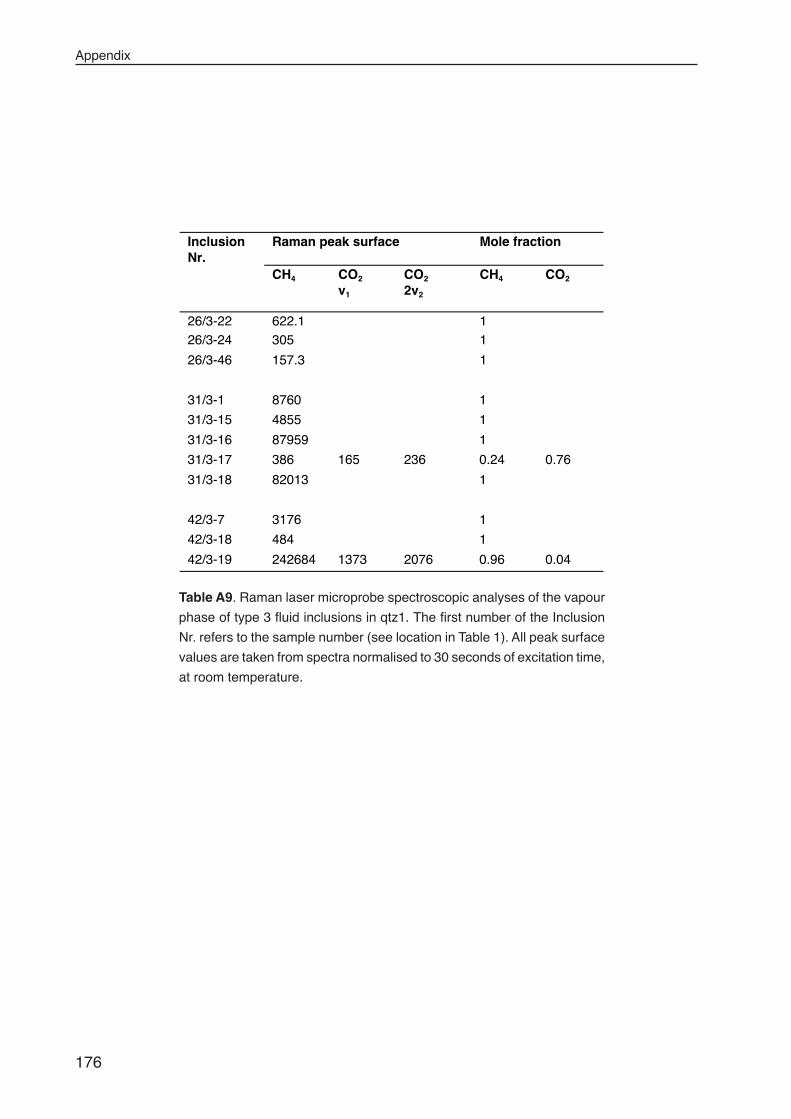
Appendix
176
InclusionNr.
Raman peak surface Mole fraction
CH4 CO2
v1
CO2
2v2
CH4 CO2
26/3-22 622.1 126/3-24 305 1
26/3-46 157.3 1
31/3-1 8760 1
31/3-15 4855 1
31/3-16 87959 1
31/3-17 386 165 236 0.24 0.76
31/3-18 82013 1
42/3-7 3176 1
42/3-18 484 1
42/3-19 242684 1373 2076 0.96 0.04
Table A9. Raman laser microprobe spectroscopic analyses of the vapour
phase of type 3 fluid inclusions in qtz1. The first number of the Inclusion
Nr. refers to the sample number (see location in Table 1). All peak surface
values are taken from spectra normalised to 30 seconds of excitation time,
at room temperature.
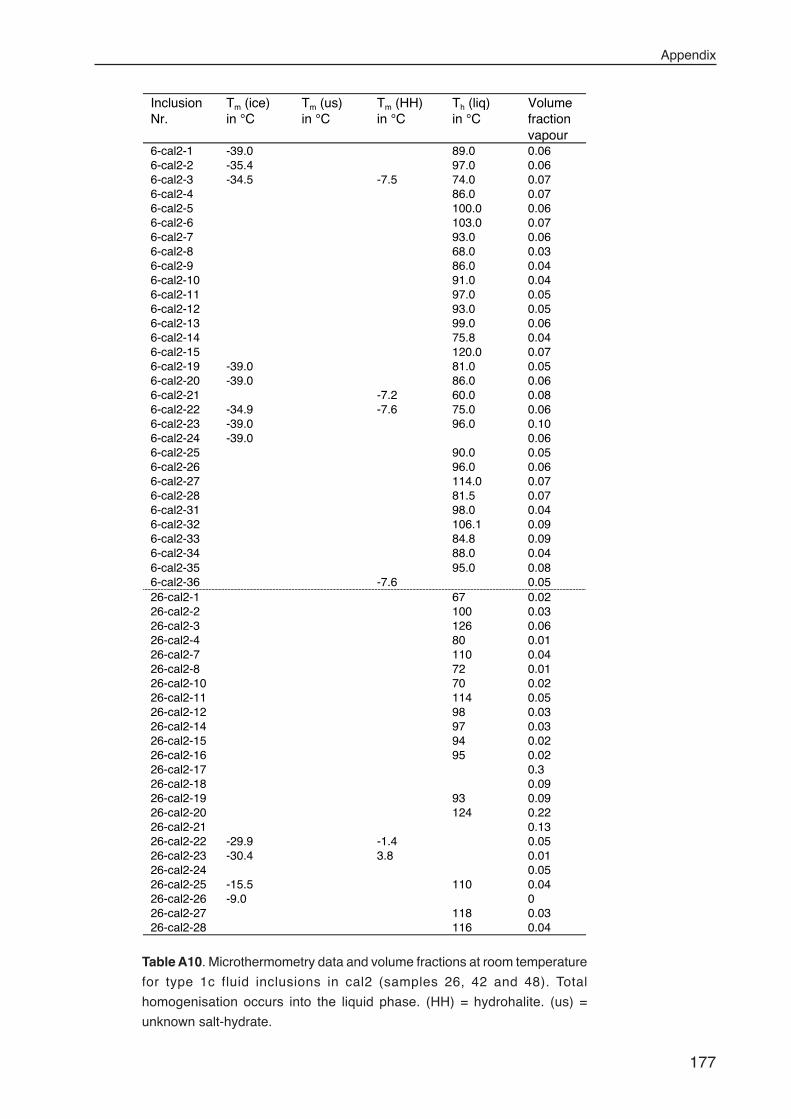
Appendix
177
InclusionNr.
Tm (ice)in °C
Tm (us)in °C
Tm (HH)in °C
Th (liq)in °C
Volumefractionvapour
6-cal2-1 -39.0 89.0 0.066-cal2-2 -35.4 97.0 0.066-cal2-3 -34.5 -7.5 74.0 0.076-cal2-4 86.0 0.076-cal2-5 100.0 0.066-cal2-6 103.0 0.076-cal2-7 93.0 0.066-cal2-8 68.0 0.036-cal2-9 86.0 0.046-cal2-10 91.0 0.046-cal2-11 97.0 0.056-cal2-12 93.0 0.056-cal2-13 99.0 0.066-cal2-14 75.8 0.046-cal2-15 120.0 0.076-cal2-19 -39.0 81.0 0.056-cal2-20 -39.0 86.0 0.066-cal2-21 -7.2 60.0 0.086-cal2-22 -34.9 -7.6 75.0 0.066-cal2-23 -39.0 96.0 0.106-cal2-24 -39.0 0.066-cal2-25 90.0 0.056-cal2-26 96.0 0.066-cal2-27 114.0 0.076-cal2-28 81.5 0.076-cal2-31 98.0 0.046-cal2-32 106.1 0.096-cal2-33 84.8 0.096-cal2-34 88.0 0.046-cal2-35 95.0 0.086-cal2-36 -7.6 0.0526-cal2-1 67 0.0226-cal2-2 100 0.0326-cal2-3 126 0.0626-cal2-4 80 0.0126-cal2-7 110 0.0426-cal2-8 72 0.0126-cal2-10 70 0.0226-cal2-11 114 0.0526-cal2-12 98 0.0326-cal2-14 97 0.0326-cal2-15 94 0.0226-cal2-16 95 0.0226-cal2-17 0.326-cal2-18 0.0926-cal2-19 93 0.0926-cal2-20 124 0.2226-cal2-21 0.1326-cal2-22 -29.9 -1.4 0.0526-cal2-23 -30.4 3.8 0.0126-cal2-24 0.0526-cal2-25 -15.5 110 0.0426-cal2-26 -9.0 026-cal2-27 118 0.0326-cal2-28 116 0.04
Table A10. Microthermometry data and volume fractions at room temperature
for type 1c fluid inclusions in cal2 (samples 26, 42 and 48). Total
homogenisation occurs into the liquid phase. (HH) = hydrohalite. (us) =
unknown salt-hydrate.
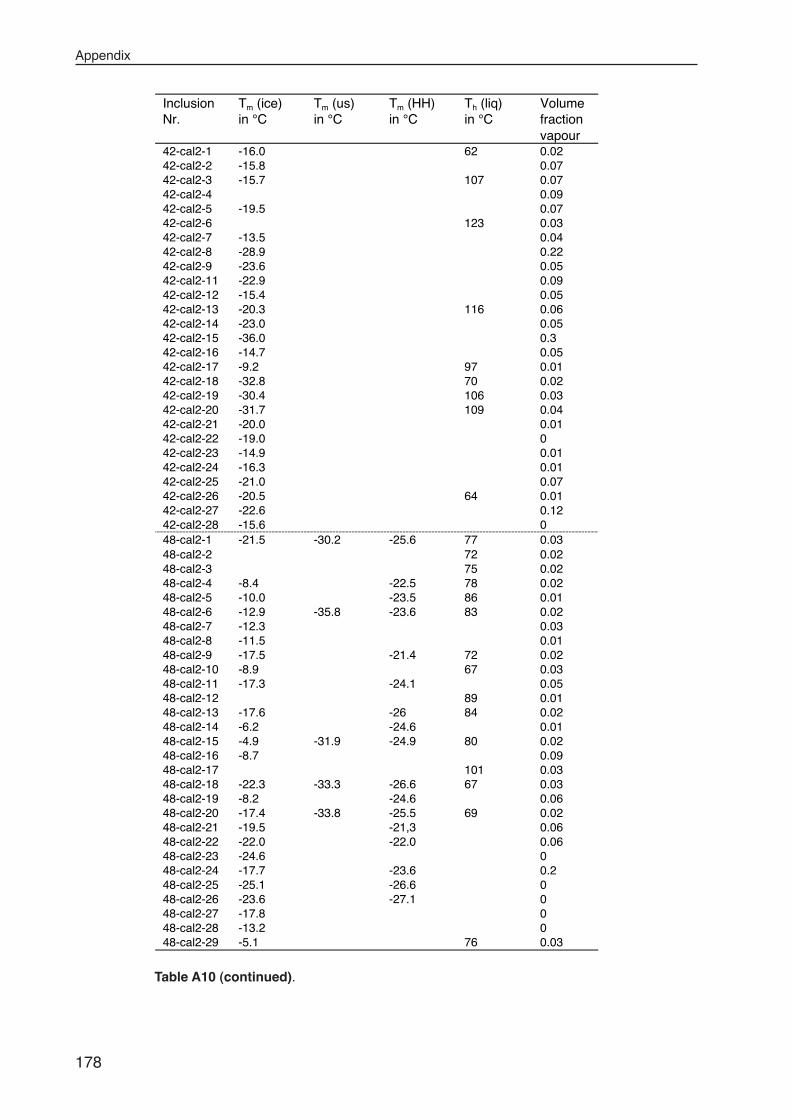
Appendix
178
InclusionNr.
Tm (ice)in °C
Tm (us)in °C
Tm (HH)in °C
Th (liq)in °C
Volumefractionvapour
42-cal2-1 -16.0 62 0.0242-cal2-2 -15.8 0.0742-cal2-3 -15.7 107 0.0742-cal2-4 0.0942-cal2-5 -19.5 0.0742-cal2-6 123 0.0342-cal2-7 -13.5 0.0442-cal2-8 -28.9 0.2242-cal2-9 -23.6 0.0542-cal2-11 -22.9 0.0942-cal2-12 -15.4 0.0542-cal2-13 -20.3 116 0.0642-cal2-14 -23.0 0.0542-cal2-15 -36.0 0.342-cal2-16 -14.7 0.0542-cal2-17 -9.2 97 0.0142-cal2-18 -32.8 70 0.0242-cal2-19 -30.4 106 0.0342-cal2-20 -31.7 109 0.0442-cal2-21 -20.0 0.0142-cal2-22 -19.0 042-cal2-23 -14.9 0.0142-cal2-24 -16.3 0.0142-cal2-25 -21.0 0.0742-cal2-26 -20.5 64 0.0142-cal2-27 -22.6 0.1242-cal2-28 -15.6 048-cal2-1 -21.5 -30.2 -25.6 77 0.0348-cal2-2 72 0.0248-cal2-3 75 0.0248-cal2-4 -8.4 -22.5 78 0.0248-cal2-5 -10.0 -23.5 86 0.0148-cal2-6 -12.9 -35.8 -23.6 83 0.0248-cal2-7 -12.3 0.0348-cal2-8 -11.5 0.0148-cal2-9 -17.5 -21.4 72 0.0248-cal2-10 -8.9 67 0.0348-cal2-11 -17.3 -24.1 0.0548-cal2-12 89 0.0148-cal2-13 -17.6 -26 84 0.0248-cal2-14 -6.2 -24.6 0.0148-cal2-15 -4.9 -31.9 -24.9 80 0.0248-cal2-16 -8.7 0.0948-cal2-17 101 0.0348-cal2-18 -22.3 -33.3 -26.6 67 0.0348-cal2-19 -8.2 -24.6 0.0648-cal2-20 -17.4 -33.8 -25.5 69 0.0248-cal2-21 -19.5 -21,3 0.0648-cal2-22 -22.0 -22.0 0.0648-cal2-23 -24.6 048-cal2-24 -17.7 -23.6 0.248-cal2-25 -25.1 -26.6 048-cal2-26 -23.6 -27.1 048-cal2-27 -17.8 048-cal2-28 -13.2 048-cal2-29 -5.1 76 0.03
Table A10 (continued).
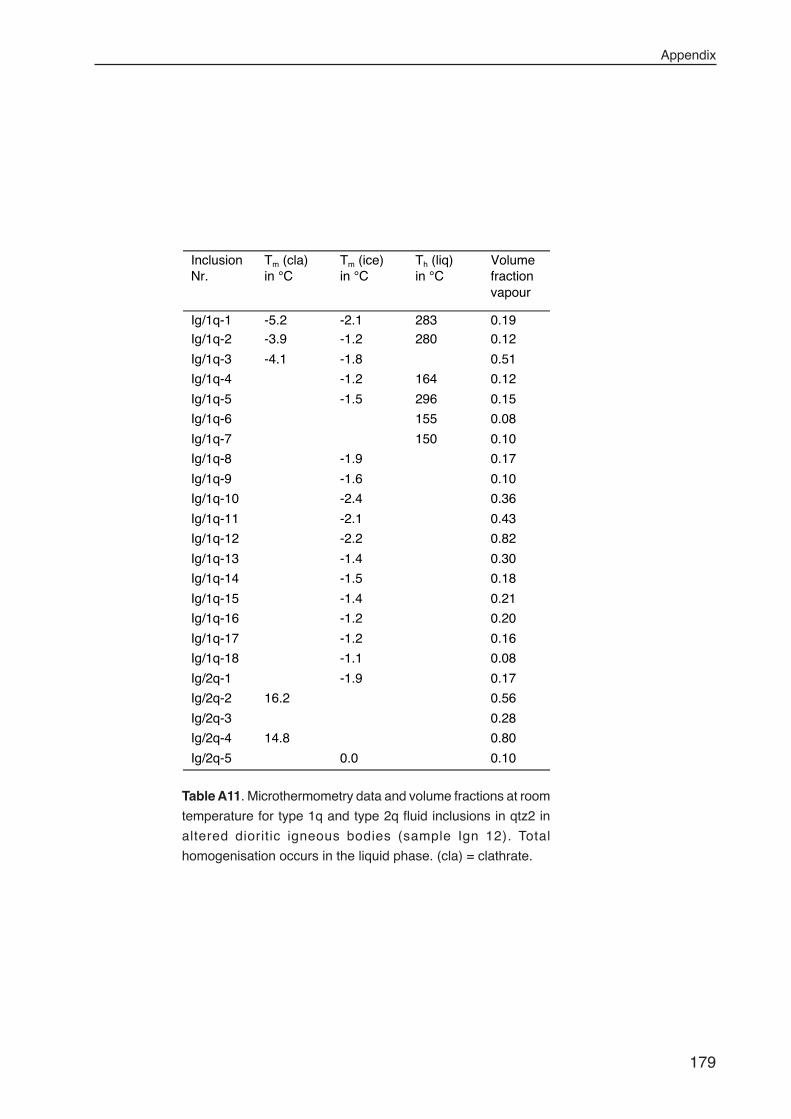
Appendix
179
InclusionNr.
Tm (cla)in °C
Tm (ice)in °C
Th (liq)in °C
Volumefractionvapour
Ig/1q-1 -5.2 -2.1 283 0.19Ig/1q-2 -3.9 -1.2 280 0.12
Ig/1q-3 -4.1 -1.8 0.51
Ig/1q-4 -1.2 164 0.12
Ig/1q-5 -1.5 296 0.15
Ig/1q-6 155 0.08
Ig/1q-7 150 0.10
Ig/1q-8 -1.9 0.17
Ig/1q-9 -1.6 0.10
Ig/1q-10 -2.4 0.36
Ig/1q-11 -2.1 0.43
Ig/1q-12 -2.2 0.82
Ig/1q-13 -1.4 0.30
Ig/1q-14 -1.5 0.18
Ig/1q-15 -1.4 0.21
Ig/1q-16 -1.2 0.20
Ig/1q-17 -1.2 0.16
Ig/1q-18 -1.1 0.08
Ig/2q-1 -1.9 0.17
Ig/2q-2 16.2 0.56
Ig/2q-3 0.28
Ig/2q-4 14.8 0.80
Ig/2q-5 0.0 0.10
Table A11. Microthermometry data and volume fractions at room
temperature for type 1q and type 2q fluid inclusions in qtz2 in
altered dioritic igneous bodies (sample Ign 12). Total
homogenisation occurs in the liquid phase. (cla) = clathrate.
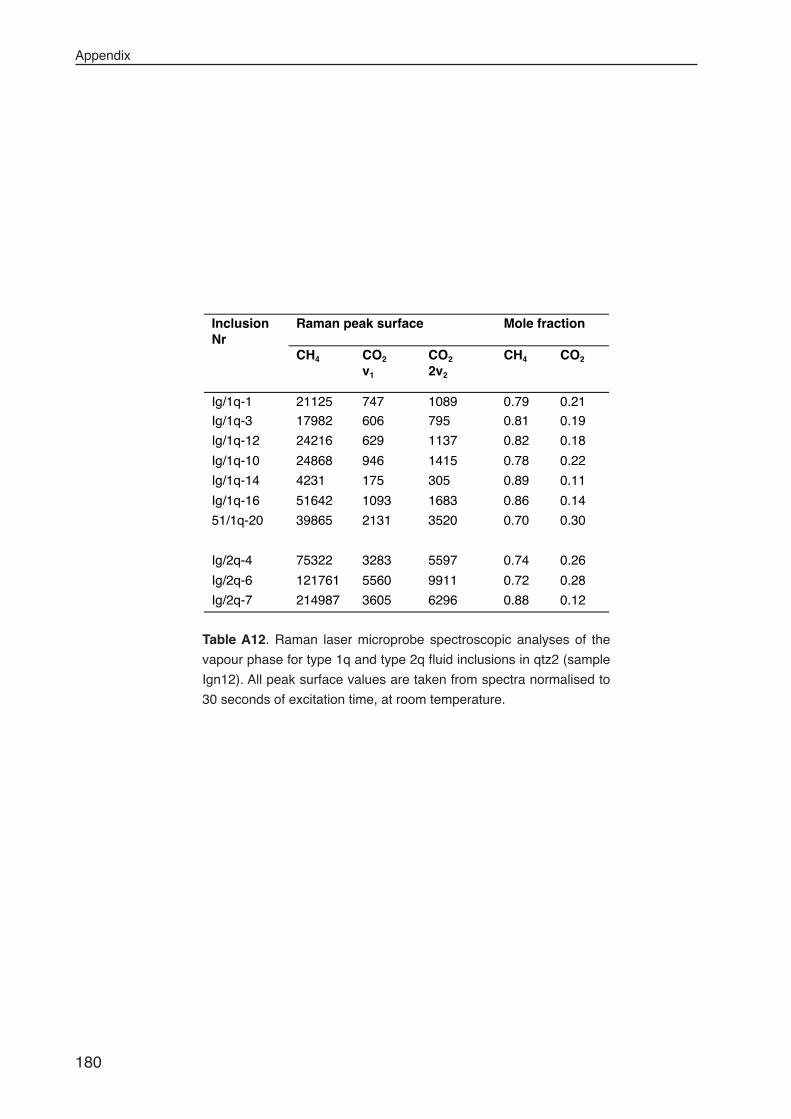
Appendix
180
InclusionNr
Raman peak surface Mole fraction
CH4 CO2
v1
CO2
2v2
CH4 CO2
Ig/1q-1 21125 747 1089 0.79 0.21
Ig/1q-3 17982 606 795 0.81 0.19
Ig/1q-12 24216 629 1137 0.82 0.18
Ig/1q-10 24868 946 1415 0.78 0.22
Ig/1q-14 4231 175 305 0.89 0.11
Ig/1q-16 51642 1093 1683 0.86 0.14
51/1q-20 39865 2131 3520 0.70 0.30
Ig/2q-4 75322 3283 5597 0.74 0.26
Ig/2q-6 121761 5560 9911 0.72 0.28
Ig/2q-7 214987 3605 6296 0.88 0.12
Table A12. Raman laser microprobe spectroscopic analyses of the
vapour phase for type 1q and type 2q fluid inclusions in qtz2 (sample
Ign12). All peak surface values are taken from spectra normalised to
30 seconds of excitation time, at room temperature.
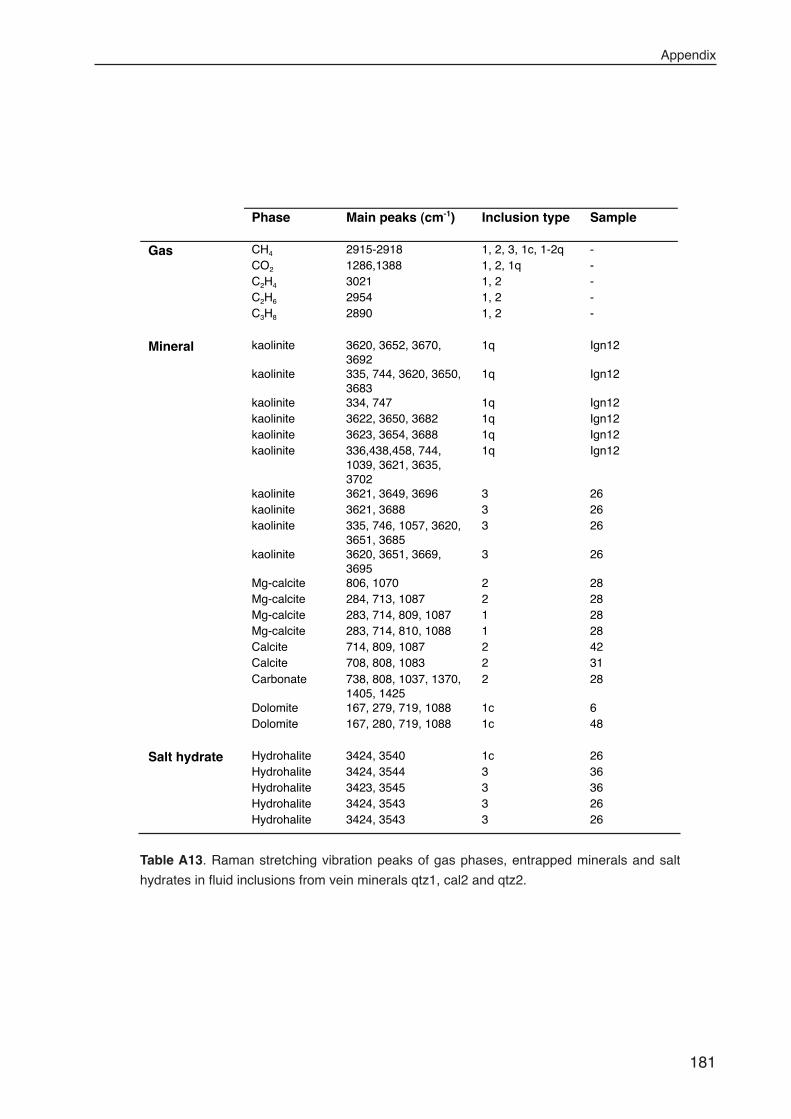
Appendix
181
Phase Main peaks (cm-1) Inclusion type Sample
Gas CH4 2915-2918 1, 2, 3, 1c, 1-2q -CO2 1286,1388 1, 2, 1q -C2H4 3021 1, 2 -C2H6 2954 1, 2 -C3H8 2890 1, 2 -
Mineral kaolinite 3620, 3652, 3670,3692
1q Ign12
kaolinite 335, 744, 3620, 3650,3683
1q Ign12
kaolinite 334, 747 1q Ign12kaolinite 3622, 3650, 3682 1q Ign12kaolinite 3623, 3654, 3688 1q Ign12kaolinite 336,438,458, 744,
1039, 3621, 3635,3702
1q Ign12
kaolinite 3621, 3649, 3696 3 26kaolinite 3621, 3688 3 26kaolinite 335, 746, 1057, 3620,
3651, 36853 26
kaolinite 3620, 3651, 3669,3695
3 26
Mg-calcite 806, 1070 2 28Mg-calcite 284, 713, 1087 2 28Mg-calcite 283, 714, 809, 1087 1 28Mg-calcite 283, 714, 810, 1088 1 28Calcite 714, 809, 1087 2 42Calcite 708, 808, 1083 2 31Carbonate 738, 808, 1037, 1370,
1405, 14252 28
Dolomite 167, 279, 719, 1088 1c 6Dolomite 167, 280, 719, 1088 1c 48
Salt hydrate Hydrohalite 3424, 3540 1c 26Hydrohalite 3424, 3544 3 36Hydrohalite 3423, 3545 3 36Hydrohalite 3424, 3543 3 26Hydrohalite 3424, 3543 3 26
Table A13. Raman stretching vibration peaks of gas phases, entrapped minerals and salt
hydrates in fluid inclusions from vein minerals qtz1, cal2 and qtz2.
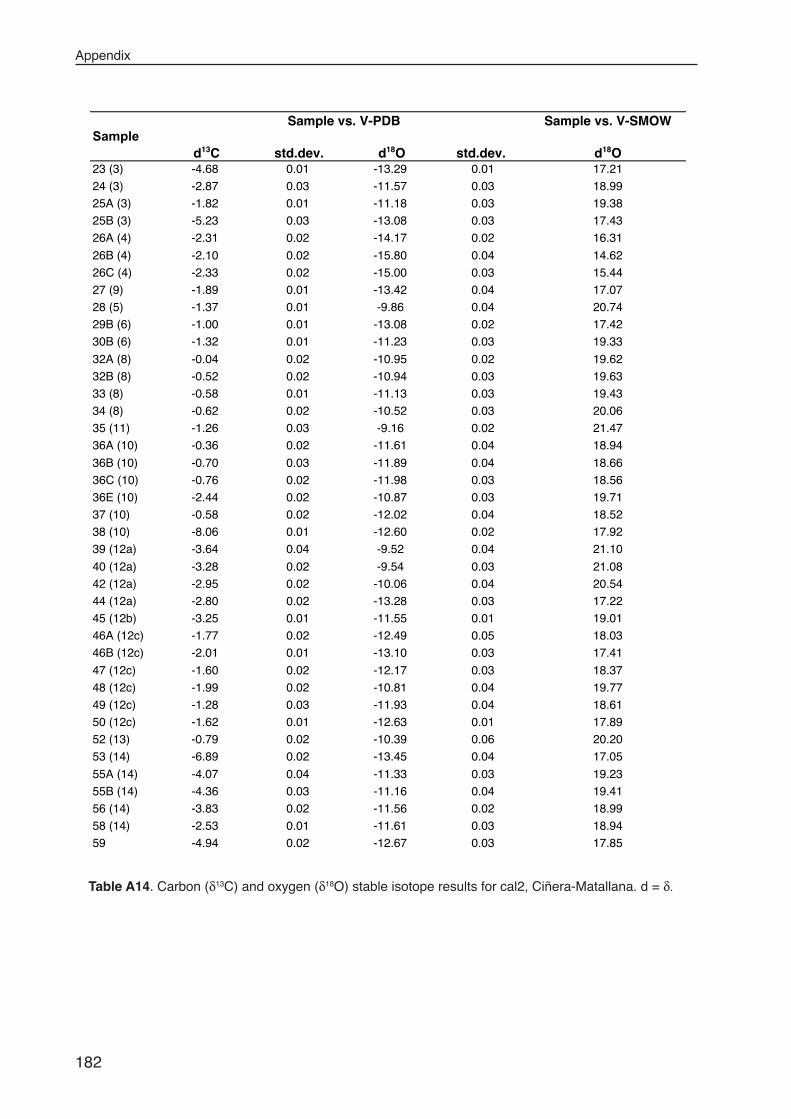
Appendix
182
Table A14. Carbon (δ13C) and oxygen (δ18O) stable isotope results for cal2, Ciñera-Matallana. d = δ.
Sample
Sample vs. V-PDB
d13C std.dev. d18O std.dev.
Sample vs. V-SMOW
d18O23 (3) -4.68 0.01 -13.29 0.01 17.21
24 (3) -2.87 0.03 -11.57 0.03 18.99
25A (3) -1.82 0.01 -11.18 0.03 19.38
25B (3) -5.23 0.03 -13.08 0.03 17.43
26A (4) -2.31 0.02 -14.17 0.02 16.31
26B (4) -2.10 0.02 -15.80 0.04 14.62
26C (4) -2.33 0.02 -15.00 0.03 15.44
27 (9) -1.89 0.01 -13.42 0.04 17.07
28 (5) -1.37 0.01 -9.86 0.04 20.74
29B (6) -1.00 0.01 -13.08 0.02 17.42
30B (6) -1.32 0.01 -11.23 0.03 19.33
32A (8) -0.04 0.02 -10.95 0.02 19.62
32B (8) -0.52 0.02 -10.94 0.03 19.63
33 (8) -0.58 0.01 -11.13 0.03 19.43
34 (8) -0.62 0.02 -10.52 0.03 20.06
35 (11) -1.26 0.03 -9.16 0.02 21.47
36A (10) -0.36 0.02 -11.61 0.04 18.94
36B (10) -0.70 0.03 -11.89 0.04 18.66
36C (10) -0.76 0.02 -11.98 0.03 18.56
36E (10) -2.44 0.02 -10.87 0.03 19.71
37 (10) -0.58 0.02 -12.02 0.04 18.52
38 (10) -8.06 0.01 -12.60 0.02 17.92
39 (12a) -3.64 0.04 -9.52 0.04 21.10
40 (12a) -3.28 0.02 -9.54 0.03 21.08
42 (12a) -2.95 0.02 -10.06 0.04 20.54
44 (12a) -2.80 0.02 -13.28 0.03 17.22
45 (12b) -3.25 0.01 -11.55 0.01 19.01
46A (12c) -1.77 0.02 -12.49 0.05 18.03
46B (12c) -2.01 0.01 -13.10 0.03 17.41
47 (12c) -1.60 0.02 -12.17 0.03 18.37
48 (12c) -1.99 0.02 -10.81 0.04 19.77
49 (12c) -1.28 0.03 -11.93 0.04 18.61
50 (12c) -1.62 0.01 -12.63 0.01 17.89
52 (13) -0.79 0.02 -10.39 0.06 20.20
53 (14) -6.89 0.02 -13.45 0.04 17.05
55A (14) -4.07 0.04 -11.33 0.03 19.23
55B (14) -4.36 0.03 -11.16 0.04 19.41
56 (14) -3.83 0.02 -11.56 0.02 18.99
58 (14) -2.53 0.01 -11.61 0.03 18.94
59 -4.94 0.02 -12.67 0.03 17.85
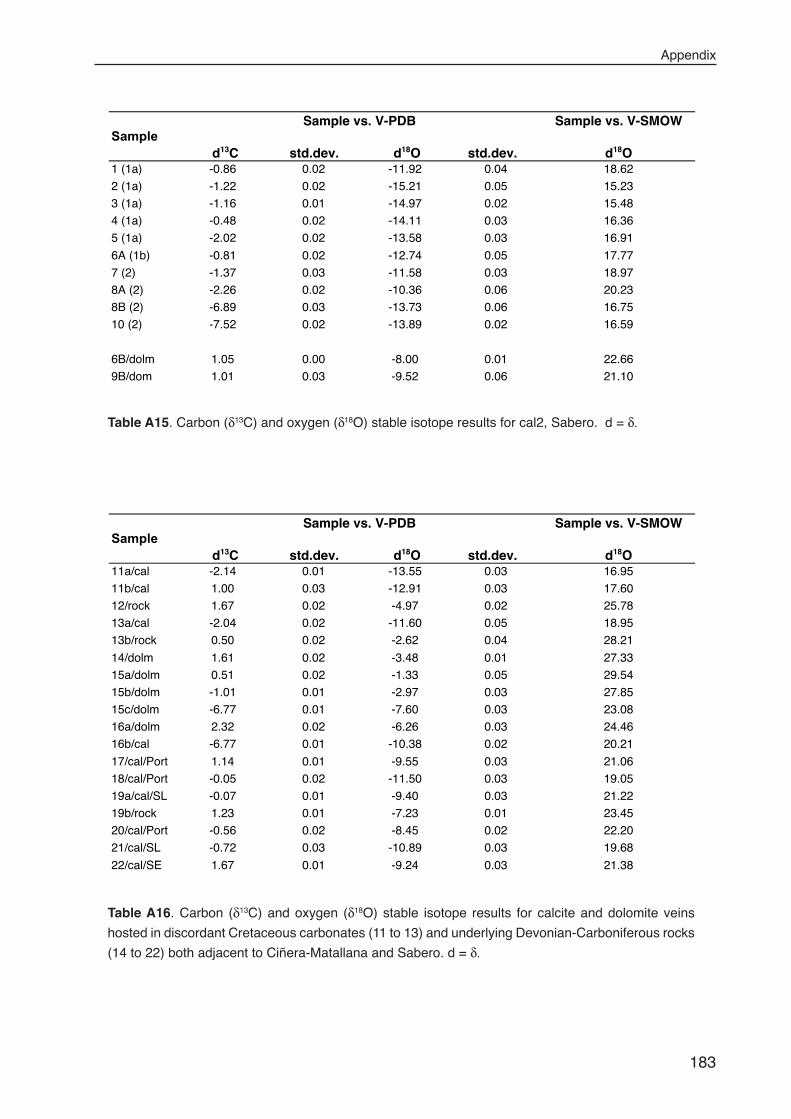
Appendix
183
Table A16. Carbon (δ13C) and oxygen (δ18O) stable isotope results for calcite and dolomite veins
hosted in discordant Cretaceous carbonates (11 to 13) and underlying Devonian-Carboniferous rocks
(14 to 22) both adjacent to Ciñera-Matallana and Sabero. d = δ.
Table A15. Carbon (δ13C) and oxygen (δ18O) stable isotope results for cal2, Sabero. d = δ.
Sample
Sample vs. V-PDB
d13C std.dev. d18O std.dev.
Sample vs. V-SMOW
d18O1 (1a) -0.86 0.02 -11.92 0.04 18.62
2 (1a) -1.22 0.02 -15.21 0.05 15.23
3 (1a) -1.16 0.01 -14.97 0.02 15.48
4 (1a) -0.48 0.02 -14.11 0.03 16.36
5 (1a) -2.02 0.02 -13.58 0.03 16.91
6A (1b) -0.81 0.02 -12.74 0.05 17.77
7 (2) -1.37 0.03 -11.58 0.03 18.97
8A (2) -2.26 0.02 -10.36 0.06 20.23
8B (2) -6.89 0.03 -13.73 0.06 16.75
10 (2) -7.52 0.02 -13.89 0.02 16.59
6B/dolm 1.05 0.00 -8.00 0.01 22.66
9B/dom 1.01 0.03 -9.52 0.06 21.10
Sample
Sample vs. V-PDB
d13C std.dev. d18O std.dev.
Sample vs. V-SMOW
d18O11a/cal -2.14 0.01 -13.55 0.03 16.95
11b/cal 1.00 0.03 -12.91 0.03 17.60
12/rock 1.67 0.02 -4.97 0.02 25.78
13a/cal -2.04 0.02 -11.60 0.05 18.95
13b/rock 0.50 0.02 -2.62 0.04 28.21
14/dolm 1.61 0.02 -3.48 0.01 27.33
15a/dolm 0.51 0.02 -1.33 0.05 29.54
15b/dolm -1.01 0.01 -2.97 0.03 27.85
15c/dolm -6.77 0.01 -7.60 0.03 23.08
16a/dolm 2.32 0.02 -6.26 0.03 24.46
16b/cal -6.77 0.01 -10.38 0.02 20.21
17/cal/Port 1.14 0.01 -9.55 0.03 21.06
18/cal/Port -0.05 0.02 -11.50 0.03 19.05
19a/cal/SL -0.07 0.01 -9.40 0.03 21.22
19b/rock 1.23 0.01 -7.23 0.01 23.45
20/cal/Port -0.56 0.02 -8.45 0.02 22.20
21/cal/SL -0.72 0.03 -10.89 0.03 19.68
22/cal/SE 1.67 0.01 -9.24 0.03 21.38