State of Mineral Finance: - PDAC
40
State of Mineral Finance: 2015 – Déjà Vu Written by: Samad Uddin M.Sc. Director, Capital Markets, PDAC Published on: March 1, 2015 Email: [email protected]
-
Upload
khangminh22 -
Category
Documents
-
view
4 -
download
0
Transcript of State of Mineral Finance: - PDAC
0 State of Mineral Finance 2015
March 1, 2015
State of Mineral Finance: 2015 – Déjà Vu
Written by: Samad Uddin M.Sc.
Director, Capital Markets, PDAC
Published on: March 1, 2015
Email: [email protected]

1 State of Mineral Finance 2015
March 1, 2015
2 State of Mineral Finance 2015
March 1, 2015
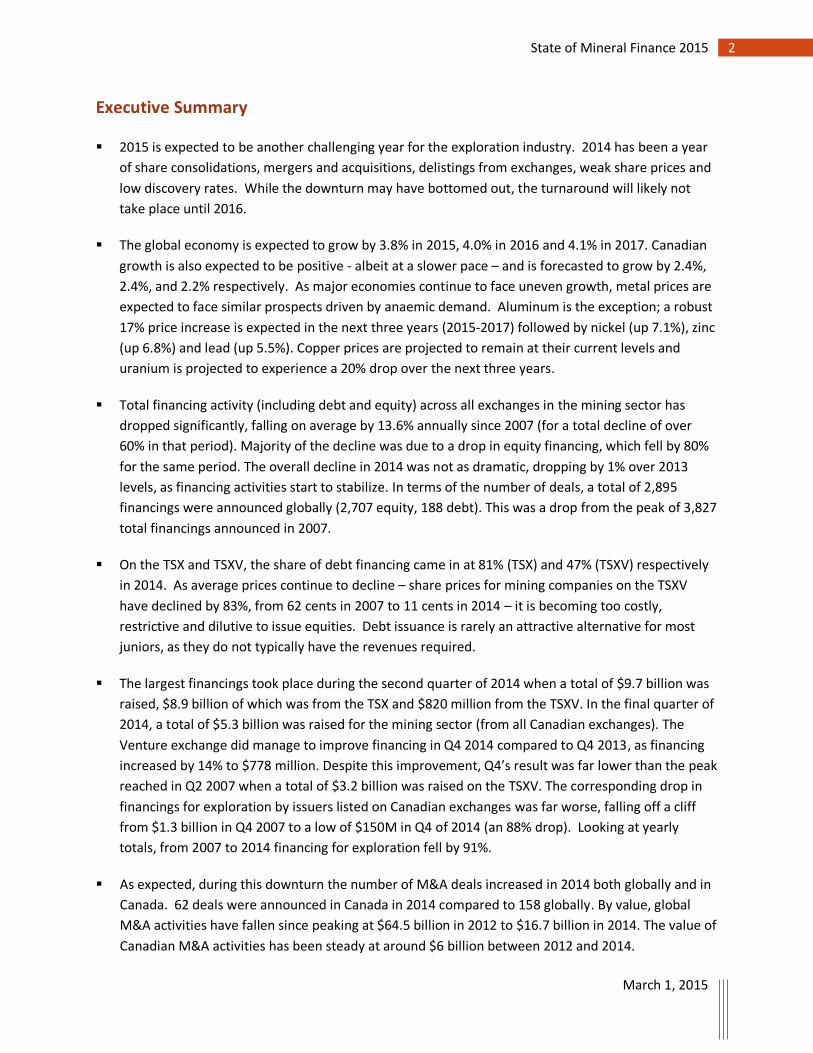
Executive Summary
2015 is expected to be another challenging year for the exploration industry. 2014 has been a year
of share consolidations, mergers and acquisitions, delistings from exchanges, weak share prices and
low discovery rates. While the downturn may have bottomed out, the turnaround will likely not
take place until 2016.
The global economy is expected to grow by 3.8% in 2015, 4.0% in 2016 and 4.1% in 2017. Canadian
growth is also expected to be positive - albeit at a slower pace – and is forecasted to grow by 2.4%,
2.4%, and 2.2% respectively. As major economies continue to face uneven growth, metal prices are
expected to face similar prospects driven by anaemic demand. Aluminum is the exception; a robust
17% price increase is expected in the next three years (2015-2017) followed by nickel (up 7.1%), zinc
(up 6.8%) and lead (up 5.5%). Copper prices are projected to remain at their current levels and
uranium is projected to experience a 20% drop over the next three years.
Total financing activity (including debt and equity) across all exchanges in the mining sector has
dropped significantly, falling on average by 13.6% annually since 2007 (for a total decline of over
60% in that period). Majority of the decline was due to a drop in equity financing, which fell by 80%
for the same period. The overall decline in 2014 was not as dramatic, dropping by 1% over 2013
levels, as financing activities start to stabilize. In terms of the number of deals, a total of 2,895
financings were announced globally (2,707 equity, 188 debt). This was a drop from the peak of 3,827
total financings announced in 2007.
On the TSX and TSXV, the share of debt financing came in at 81% (TSX) and 47% (TSXV) respectively
in 2014. As average prices continue to decline – share prices for mining companies on the TSXV
have declined by 83%, from 62 cents in 2007 to 11 cents in 2014 – it is becoming too costly,
restrictive and dilutive to issue equities. Debt issuance is rarely an attractive alternative for most
juniors, as they do not typically have the revenues required.
The largest financings took place during the second quarter of 2014 when a total of $9.7 billion was
raised, $8.9 billion of which was from the TSX and $820 million from the TSXV. In the final quarter of
2014, a total of $5.3 billion was raised for the mining sector (from all Canadian exchanges). The
Venture exchange did manage to improve financing in Q4 2014 compared to Q4 2013, as financing
increased by 14% to $778 million. Despite this improvement, Q4’s result was far lower than the peak
reached in Q2 2007 when a total of $3.2 billion was raised on the TSXV. The corresponding drop in
financings for exploration by issuers listed on Canadian exchanges was far worse, falling off a cliff
from $1.3 billion in Q4 2007 to a low of $150M in Q4 of 2014 (an 88% drop). Looking at yearly
totals, from 2007 to 2014 financing for exploration fell by 91%.
As expected, during this downturn the number of M&A deals increased in 2014 both globally and in
Canada. 62 deals were announced in Canada in 2014 compared to 158 globally. By value, global
M&A activities have fallen since peaking at $64.5 billion in 2012 to $16.7 billion in 2014. The value of
Canadian M&A activities has been steady at around $6 billion between 2012 and 2014.
3 State of Mineral Finance 2015
March 1, 2015
Globally, exploration budgets dropped by 26% in 2014, reflecting weak commodity prices and the
limited prospects for a robust recovery in demand. Canada and Australia continued to be the two
top destinations for exploration, attracting $1.5 billion (13.9%) and $1.3 billion (11.7%) respectively.
Grassroots exploration in Canada fell by 37% between 2013 and 2014, while spending on existing
minesites increased 13.5% and spending on late stage & feasibility fell by 25.5%.
Exploration companies increasingly relied on flow-through shares to raise risk capital, which will
help many companies to hold onto their claims in Canada. The data in this report clearly reveals the
important counter-cyclical role played by flow through during the recent downturn. As overall
financing levels for exploration fell, the proportion of financings using flow-through shares went up.
Flow-through accounted for 72% of all financing raised for exploration stage activities from 2012-
2014, highlighting its importance as an incentive in attracting capital to the riskiest stage of the
mining cycle.
New exemptions along with a cooperative regulatory regime are major changes to the Canadian
regulatory landscape that could have profound impact on the way junior issuers raise capital,
expanding access to a wider pool of investors and potentially reducing the costs of raising capital.
4 State of Mineral Finance 2015
March 1, 2015
Table of Contents
Executive Summary ___________________________________________________________ 2
Table of Contents _____________________________________________________________ 4
Introduction _________________________________________________________________ 6
Sources of Information______________________________________________________________ 6
Assumptions and Limitations _________________________________________________________ 7
SECTION I: The Macroeconomic Environment _______________________________________ 8
Uneven and Feeble Economic Growth _________________________________________________ 8
Weak Commodity Prices ____________________________________________________________ 9
SECTION II: Financing Trends ___________________________________________________ 12
Downturn in Global Financing Trends _________________________________________________ 12
Canadian Financing Levels Bounce at the Bottom _______________________________________ 15
Debt Issuance Increases while Equity Suffers ___________________________________________ 18
Sharp Drop in Canadian Listings _____________________________________________________ 19
Share Prices Reach Bottom _________________________________________________________ 20
Mergers and Acquisitions Increase ___________________________________________________ 21
SECTION III: Exploration Trends _________________________________________________ 23
Global Exploration Budgets Hit Hard __________________________________________________ 23
Sharp Drop in Canadian Exploration Budgets ___________________________________________ 25
Capital Raised for Exploration Falls off a Cliff ___________________________________________ 26
Working Capital Turns to Survival Capital ______________________________________________ 27
SECTION IV: Fiscal Support and Capital Market Reform ______________________________ 29
Use of Flow-Through Shares Buffers the fall in Financings _________________________________ 29
Regulatory Developments in Canadian Capital Markets __________________________________ 31
New Exemptions Could Help _______________________________________________________________ 31
Cooperative Capital Market Regulator – A Tool to Harmonize Regulations ___________________________ 33
Looking Ahead ______________________________________________________________ 35
ANNEX A: Supplementary Charts and Tables ______________________________________ 36
5 State of Mineral Finance 2015
March 1, 2015
6 State of Mineral Finance 2015
March 1, 2015
Introduction The Prospectors & Developers Association of Canada (PDAC) has always had a strong interest in the
ability of prospectors and mineral exploration companies (juniors1) to raise capital. In 2012, the PDAC
Board of Directors established a ‘capital crisis committee’ to more closely monitor the financing
activities of publicly listed companies in order to better understand the financing difficulties being faced
by the industry, leading to quarterly reports throughout 2013 and 2014. These reports were prepared
by Michael Doggett of Beach Meadows Resources and can be found on the PDAC website.2
This new report builds on these quarterly reports, and is broken down into five sections:
1) The macroeconomic environment
2) Financing trends
3) Exploration trends
4) Fiscal incentives and capital market reforms
5) Annex
The global macroeconomic focus provides a backdrop of the environment under which the mining
sector is operating in as the health of the macro economy dictates the demand for raw materials driven
by industrial output. This section also includes commodity prices broken down by the major metals, as
prices are a key factor that drives investment into companies specializing in those commodities.
The financing trends and exploration trends are the core of the report. The financing trends section
includes sections on capital raising via debt and equities, number of deals, Canada specific financings,
M&As, market capitalization, trading volumes, listings etc. The exploration trends section includes an
analysis of exploration budgets by region, stages of development and company type, as well as
information on exploration financing. The fourth section provides information on fiscal incentive and
regulatory reforms that have an impact on capital raising. Finally the report provides concluding remarks
about the overall financing environment for juniors with an emphasis on future prospects.
Sources of Information
The report extracts data on mining finance from several standard industry recognized sources. The
definitions used in the report are taken directly from the source and have not been altered by the
1 While there are many factors that, taken together, define a junior exploration company, a key defining
feature is that “it is neither a producing company nor the recipient of significant income from
production or from some other business venture”. See Natural Resources Canada definition here:
http://www.nrcan.gc.ca/mining-materials/statistics/8854.
2 The report can be accessed from the link: http://www.pdac.ca/pdf-viewer?doc=/docs/default-
source/default-document-library/capital-crisis-report-update---q2-report.pdf
7 State of Mineral Finance 2015
March 1, 2015
author. In order to make an unbiased assessment about the sector as a whole the data is not dissected
or adjusted other than computing for exchange rates and indexing. Where such modifications are
made, an explanation with appropriate reference is provided. The report is meant to be as consistent as
possible and, where applicable, further improve the quality of the data and how it is presented.
The data collected in the report is primarily sourced from the following:
- TMX Group’s MiG report
- SNL Metals & Mining
- World Bank’s Commodity Markets Outlook
- International Monetary Fund’s World Economic Outlook
- Gamah International’s Monthly Report on Mining and Exploration Company Financings (MECO)
Additional information is collected from various sources for which the reference is made in the
appropriate text, tables and charts.
Assumptions and Limitations
The time period chosen in this report is meant to show recent trends, in particular, since the 2007-08
financial crisis. This report is not meant to provide a longer term view (prior to 2007) of the financing
trends for the mineral sector or relationships to commodity price cycles. The purpose of the report is to
inform PDAC members on the latest financing developments and to provide a backdrop for policy
advocacy by the PDAC, on behalf of its members.
The data used in the report is considered to be accurate as of February 18, 2015. Assumptions and
estimates used to produce the data are from the sources; any modifications to the data are clearly
outlined in the report. For a full description and explanation of the methodology used to produce this
report, please contact the author, Samad Uddin, at [email protected].
8 State of Mineral Finance 2015
March 1, 2015
SECTION I: The Macroeconomic Environment
Uneven and Feeble Economic Growth
Industrial output is a key factor in determining demand for mineral resources and financing activities.
As economic growth picks up, so does industrial output, which has an impact on commodity prices and
investment in the sector. The commodity growth cycles in the past had a positive correlation with
global economic growth and therefore, keeping the pulse of the economic climate is an important
determinant of future potential for mineral resource development and financing. Countries such as
Canada and Australia that are natural resource endowed benefit as global economic growth picks up;
particularly in countries that are major consumers and net importers of mineral resources.
An important source of information on historical and forecasted economic growth is from the
International Monetary Fund’s (IMF) World Economic Outlook. The IMF in their most recent report3
identified four key areas of development that could impact global economic growth. The first is the low
crude oil price environment, which from a junior exploration company’s perspective, is a positive
development as it reduces operating expenses for remote exploration activities that depend on diesel
generators. However, weak demand for raw materials from major economies, particularly from
emerging economies, is another reason for driving both oil and metal prices lower. Additionally,
countries that depend on investment in the oil and gas sectors lose out on capital spending on major
projects as oil prices drop. For example, integrated oil producer Husky Energy Inc., has announced a cut
to its capital spending by $2 billion for 2015, which will have a direct impact on economic growth in
Western Canada. U.S. now being a major producer of oil will also suffer a similar fate when it comes to
investment in the oil sector.
The second factor is the uneven levels of growth in the major economies. U.S. growth has picked up;
however, other major economies such as Japan are experiencing slowdowns in economic activity.
Without a uniform level of growth amongst major industrialized countries, global growth will not be as
robust as it could have been. The third issue is the appreciation of the U.S. dollar relative to other major
currencies, which could help to offset the impact of lower commodity prices for resource countries
(apart from the U.S.) as most commodities are priced in U.S. dollars. As the U.S. dollar appreciates, the
commodity exporting countries can reduce their losses by benefiting from the stronger U.S. dollar to
buffer their exposure to weak prices. The last factor that could impact economic growth is the increase
in interest rates for many of the emerging economies that are also commodity exporters. Higher
interest rates are not favorable for business as lending costs increase resulting in a slower economic
growth environment than if interest rates were lower.
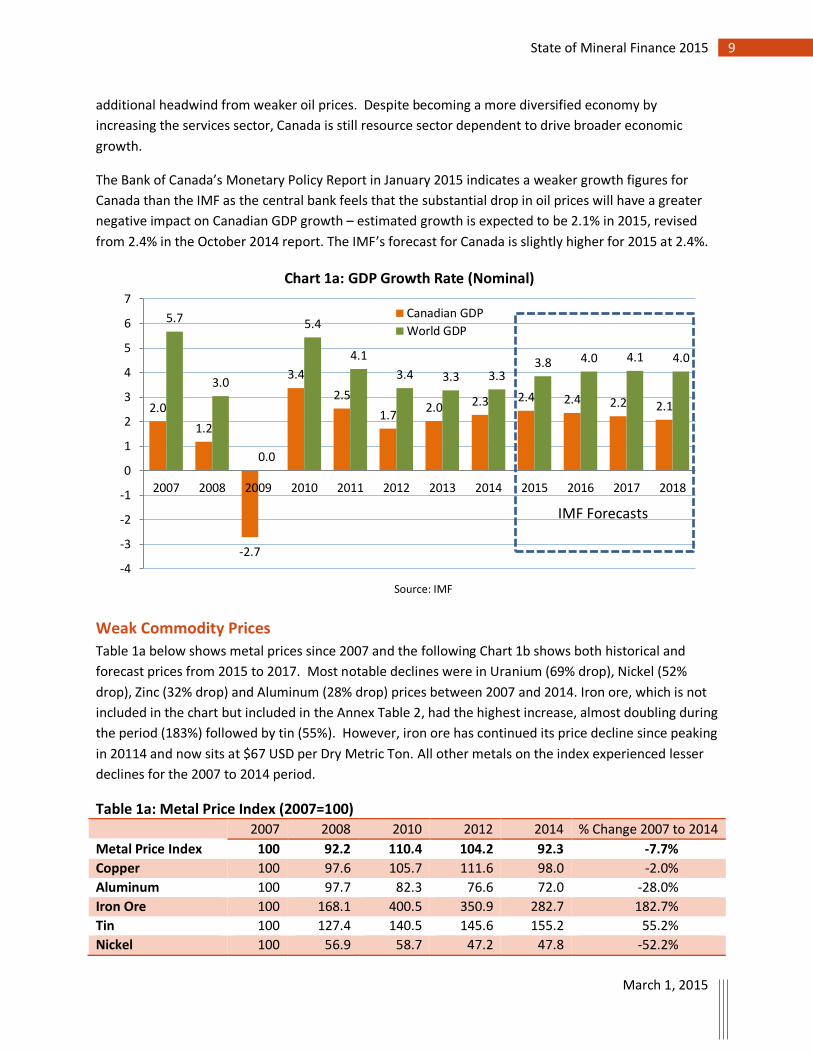
The Chart 1a below provides global GDP forecast and Canada’s growth forecasts. It is not surprising that
Canadian growth is lower than global growth given the weak commodity sector, which is facing
3 IMF World Economic Outlook Update – January 19, 2015
9 State of Mineral Finance 2015
March 1, 2015
additional headwind from weaker oil prices. Despite becoming a more diversified economy by
increasing the services sector, Canada is still resource sector dependent to drive broader economic
growth.
The Bank of Canada’s Monetary Policy Report in January 2015 indicates a weaker growth figures for
Canada than the IMF as the central bank feels that the substantial drop in oil prices will have a greater
negative impact on Canadian GDP growth – estimated growth is expected to be 2.1% in 2015, revised
from 2.4% in the October 2014 report. The IMF’s forecast for Canada is slightly higher for 2015 at 2.4%.
Weak Commodity Prices
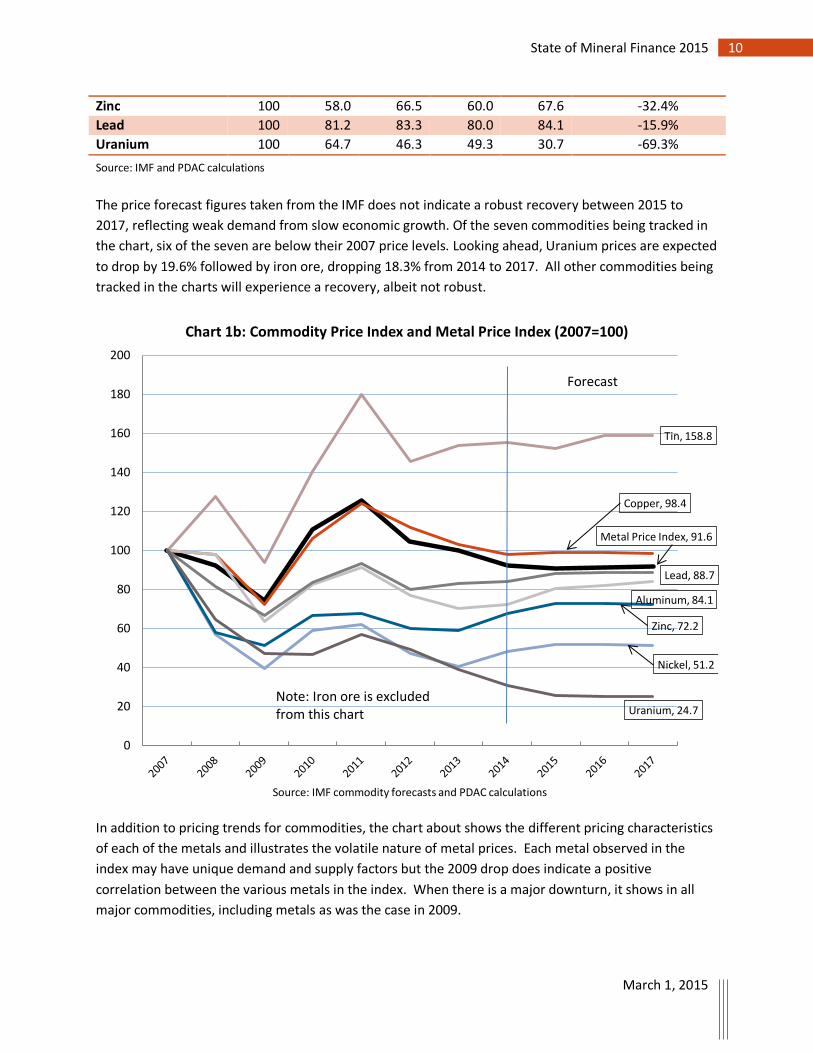
Table 1a below shows metal prices since 2007 and the following Chart 1b shows both historical and
forecast prices from 2015 to 2017. Most notable declines were in Uranium (69% drop), Nickel (52%
drop), Zinc (32% drop) and Aluminum (28% drop) prices between 2007 and 2014. Iron ore, which is not
included in the chart but included in the Annex Table 2, had the highest increase, almost doubling during
the period (183%) followed by tin (55%). However, iron ore has continued its price decline since peaking
in 20114 and now sits at $67 USD per Dry Metric Ton. All other metals on the index experienced lesser
declines for the 2007 to 2014 period.
Table 1a: Metal Price Index (2007=100) 2007 2008 2010 2012 2014 % Change 2007 to 2014
Metal Price Index 100 92.2 110.4 104.2 92.3 -7.7%
Copper 100 97.6 105.7 111.6 98.0 -2.0%
Aluminum 100 97.7 82.3 76.6 72.0 -28.0%
Iron Ore 100 168.1 400.5 350.9 282.7 182.7%
Tin 100 127.4 140.5 145.6 155.2 55.2%
Nickel 100 56.9 58.7 47.2 47.8 -52.2%
2.0
1.2
-2.7
3.4
2.5
1.7 2.0 2.3 2.4 2.4 2.2 2.1
5.7
3.0
0.0
5.4
4.1
3.4 3.3 3.3 3.8 4.0 4.1 4.0
-4
-3
-2
-1
0
1
2
3
4
5
6
7
2007 2008 2009 2010 2011 2012 2013 2014 2015 2016 2017 2018
Source: IMF
Chart 1a: GDP Growth Rate (Nominal)
Canadian GDP
World GDP
IMF Forecasts
10 State of Mineral Finance 2015
March 1, 2015
Zinc 100 58.0 66.5 60.0 67.6 -32.4%
Lead 100 81.2 83.3 80.0 84.1 -15.9%
Uranium 100 64.7 46.3 49.3 30.7 -69.3%
Source: IMF and PDAC calculations
The price forecast figures taken from the IMF does not indicate a robust recovery between 2015 to
2017, reflecting weak demand from slow economic growth. Of the seven commodities being tracked in
the chart, six of the seven are below their 2007 price levels. Looking ahead, Uranium prices are expected
to drop by 19.6% followed by iron ore, dropping 18.3% from 2014 to 2017. All other commodities being
tracked in the charts will experience a recovery, albeit not robust.
In addition to pricing trends for commodities, the chart about shows the different pricing characteristics
of each of the metals and illustrates the volatile nature of metal prices. Each metal observed in the
index may have unique demand and supply factors but the 2009 drop does indicate a positive
correlation between the various metals in the index. When there is a major downturn, it shows in all
major commodities, including metals as was the case in 2009.
Metal Price Index, 91.6
Copper, 98.4
Aluminum, 84.1
Tin, 158.8
Nickel, 51.2
Zinc, 72.2
Lead, 88.7
Uranium, 24.7
0
20
40
60
80
100
120
140
160
180
200
Source: IMF commodity forecasts and PDAC calculations
Chart 1b: Commodity Price Index and Metal Price Index (2007=100)
Forecast
Note: Iron ore is excluded from this chart
11 State of Mineral Finance 2015
March 1, 2015
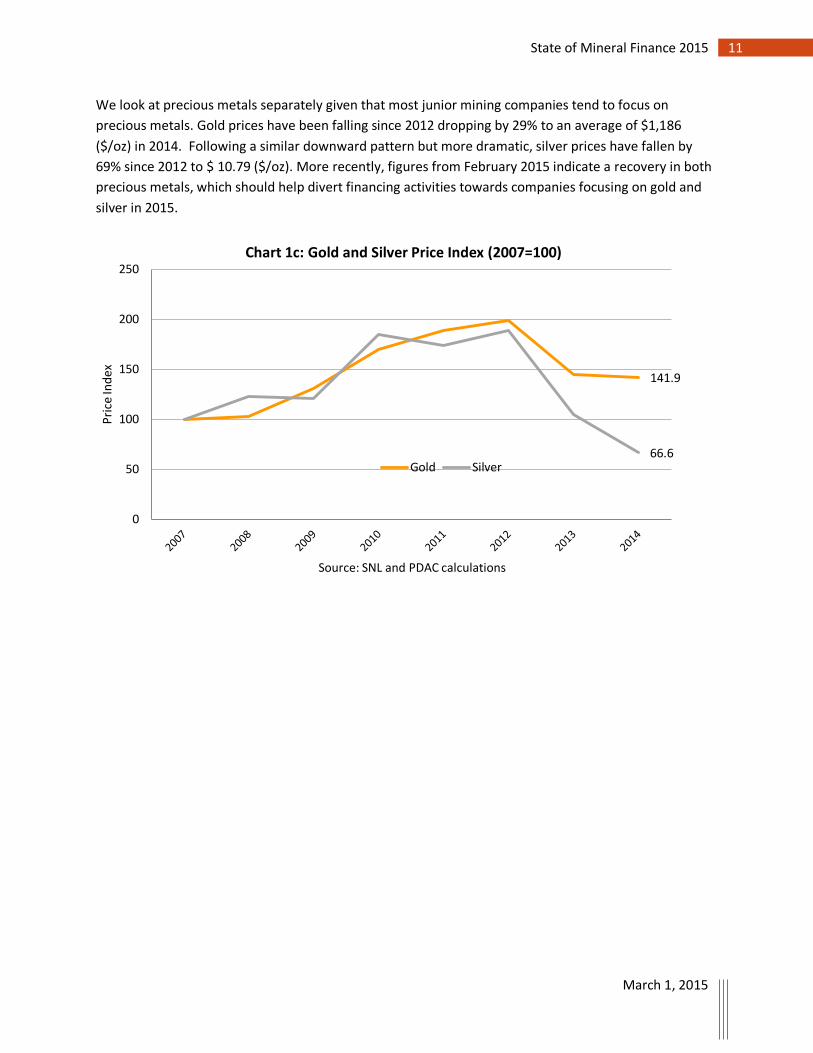
We look at precious metals separately given that most junior mining companies tend to focus on
precious metals. Gold prices have been falling since 2012 dropping by 29% to an average of $1,186
($/oz) in 2014. Following a similar downward pattern but more dramatic, silver prices have fallen by
69% since 2012 to $ 10.79 ($/oz). More recently, figures from February 2015 indicate a recovery in both
precious metals, which should help divert financing activities towards companies focusing on gold and
silver in 2015.
141.9
66.6
0
50
100
150
200
250
Pri
ce In
dex
Source: SNL and PDAC calculations
Chart 1c: Gold and Silver Price Index (2007=100)
Gold Silver
12 State of Mineral Finance 2015
March 1, 2015
SECTION II: Financing Trends
Downturn in Global Financing Trends
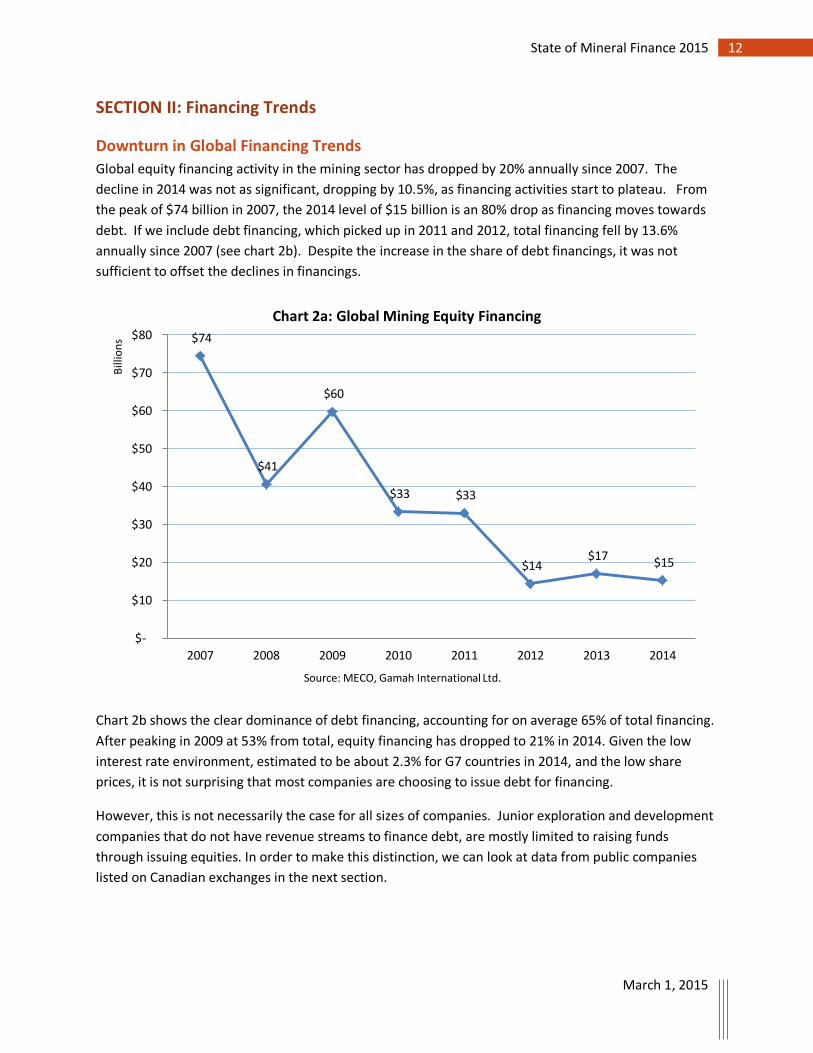
Global equity financing activity in the mining sector has dropped by 20% annually since 2007. The
decline in 2014 was not as significant, dropping by 10.5%, as financing activities start to plateau. From
the peak of $74 billion in 2007, the 2014 level of $15 billion is an 80% drop as financing moves towards
debt. If we include debt financing, which picked up in 2011 and 2012, total financing fell by 13.6%
annually since 2007 (see chart 2b). Despite the increase in the share of debt financings, it was not
sufficient to offset the declines in financings.
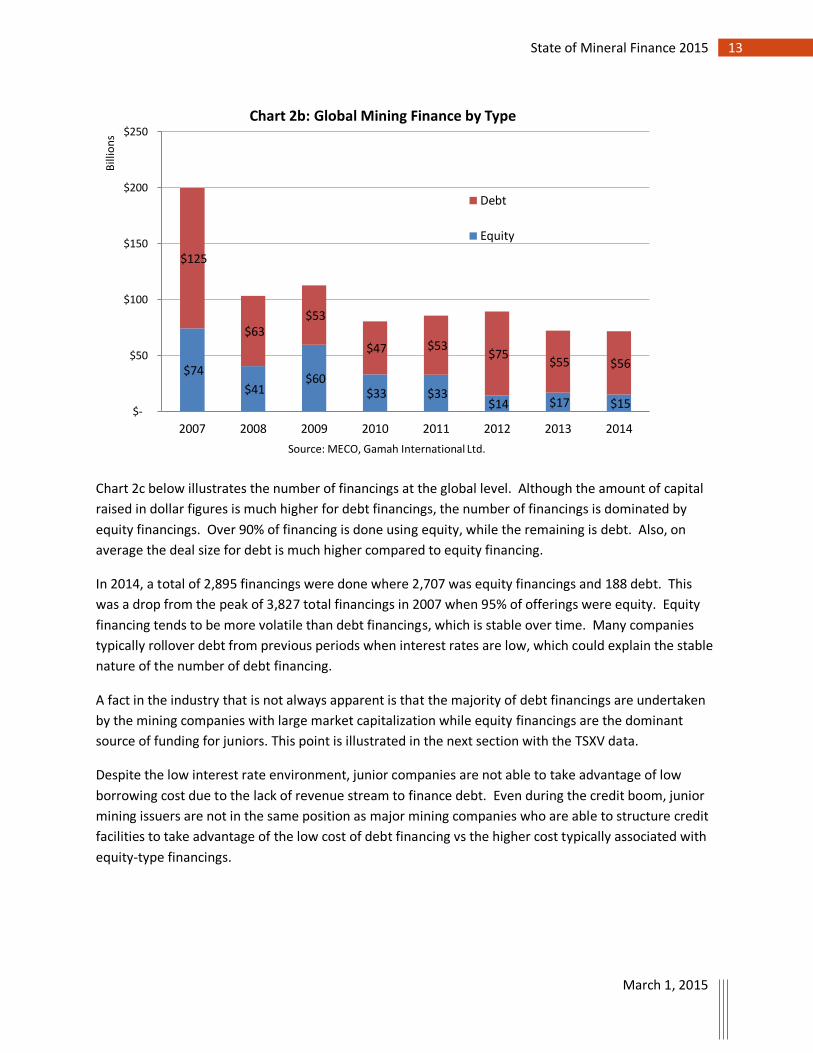
Chart 2b shows the clear dominance of debt financing, accounting for on average 65% of total financing.
After peaking in 2009 at 53% from total, equity financing has dropped to 21% in 2014. Given the low
interest rate environment, estimated to be about 2.3% for G7 countries in 2014, and the low share
prices, it is not surprising that most companies are choosing to issue debt for financing.
However, this is not necessarily the case for all sizes of companies. Junior exploration and development
companies that do not have revenue streams to finance debt, are mostly limited to raising funds
through issuing equities. In order to make this distinction, we can look at data from public companies
listed on Canadian exchanges in the next section.
$74
$41
$60
$33 $33
$14 $17
$15
$-
$10
$20
$30
$40
$50
$60
$70
$80
2007 2008 2009 2010 2011 2012 2013 2014
Bill
ion
s
Source: MECO, Gamah International Ltd.
Chart 2a: Global Mining Equity Financing
13 State of Mineral Finance 2015
March 1, 2015
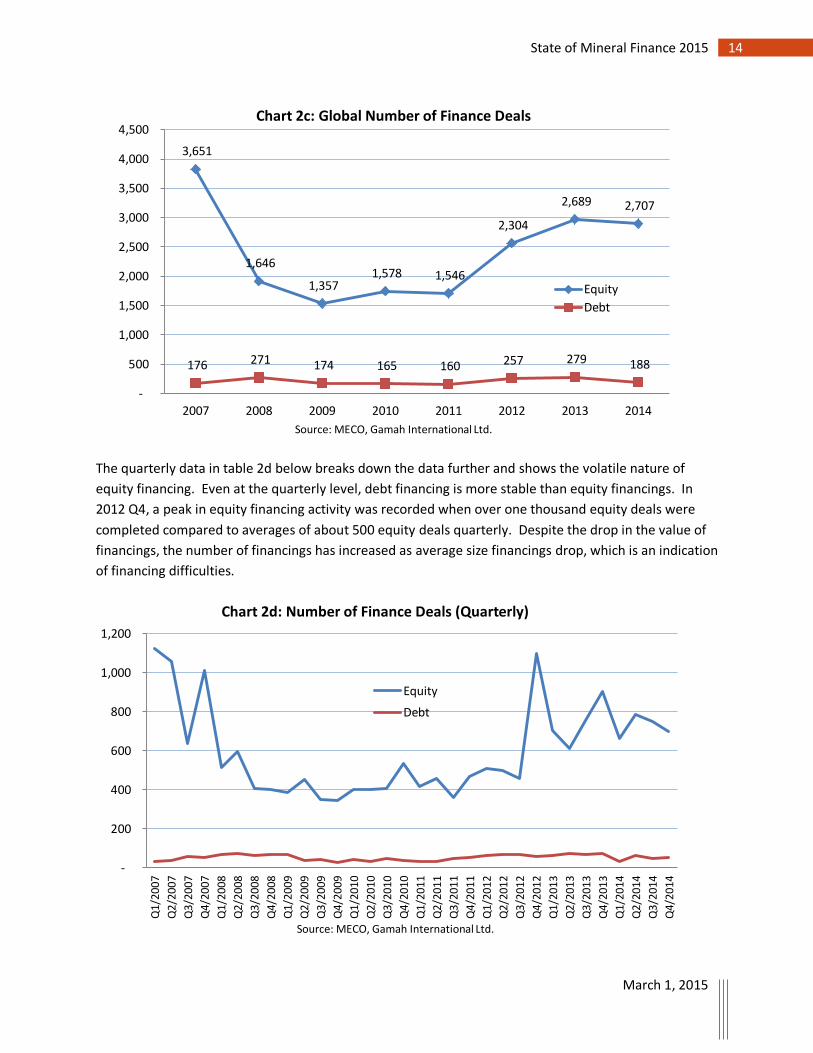
Chart 2c below illustrates the number of financings at the global level. Although the amount of capital
raised in dollar figures is much higher for debt financings, the number of financings is dominated by
equity financings. Over 90% of financing is done using equity, while the remaining is debt. Also, on
average the deal size for debt is much higher compared to equity financing.
In 2014, a total of 2,895 financings were done where 2,707 was equity financings and 188 debt. This
was a drop from the peak of 3,827 total financings in 2007 when 95% of offerings were equity. Equity
financing tends to be more volatile than debt financings, which is stable over time. Many companies
typically rollover debt from previous periods when interest rates are low, which could explain the stable
nature of the number of debt financing.
A fact in the industry that is not always apparent is that the majority of debt financings are undertaken
by the mining companies with large market capitalization while equity financings are the dominant
source of funding for juniors. This point is illustrated in the next section with the TSXV data.
Despite the low interest rate environment, junior companies are not able to take advantage of low
borrowing cost due to the lack of revenue stream to finance debt. Even during the credit boom, junior
mining issuers are not in the same position as major mining companies who are able to structure credit
facilities to take advantage of the low cost of debt financing vs the higher cost typically associated with
equity-type financings.
$74
$41 $60
$33 $33 $14 $17 $15
$125
$63 $53
$47 $53 $75
$55 $56
$-
$50
$100
$150
$200
$250
2007 2008 2009 2010 2011 2012 2013 2014
Bill
ion
s
Source: MECO, Gamah International Ltd.
Chart 2b: Global Mining Finance by Type
Debt
Equity
14 State of Mineral Finance 2015
March 1, 2015
The quarterly data in table 2d below breaks down the data further and shows the volatile nature of
equity financing. Even at the quarterly level, debt financing is more stable than equity financings. In
2012 Q4, a peak in equity financing activity was recorded when over one thousand equity deals were
completed compared to averages of about 500 equity deals quarterly. Despite the drop in the value of
financings, the number of financings has increased as average size financings drop, which is an indication
of financing difficulties.
176 271 174 165 160 257 279 188
3,651
1,646
1,357 1,578 1,546
2,304
2,689 2,707
-
500
1,000
1,500
2,000
2,500
3,000
3,500
4,000
4,500
2007 2008 2009 2010 2011 2012 2013 2014
Source: MECO, Gamah International Ltd.
Chart 2c: Global Number of Finance Deals
Equity
Debt
-
200
400
600
800
1,000
1,200
Q1/
2007
Q2/
2007
Q3/
2007
Q4/
2007
Q1/
2008
Q2/
2008
Q3/
2008
Q4/
2008
Q1/
2009
Q2/
2009
Q3/
2009
Q4/
2009
Q1/
2010
Q2/
2010
Q3/
2010
Q4/
2010
Q1/
2011
Q2/
2011
Q3/
2011
Q4/
2011
Q1/
2012
Q2/
2012
Q3/
2012
Q4/
2012
Q1/
2013
Q2/
2013
Q3/
2013
Q4/
2013
Q1/
2014
Q2/
2014
Q3/
2014
Q4/
2014
Source: MECO, Gamah International Ltd.
Chart 2d: Number of Finance Deals (Quarterly)
Equity
Debt
15 State of Mineral Finance 2015
March 1, 2015
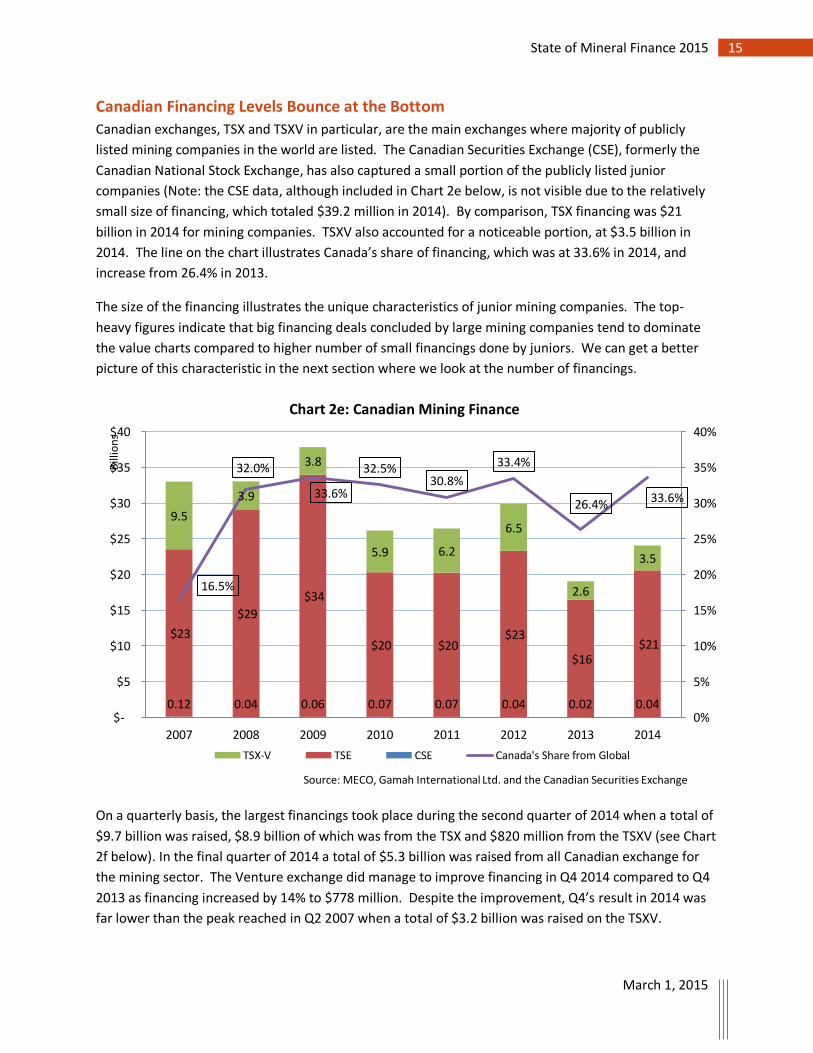
Canadian Financing Levels Bounce at the Bottom
Canadian exchanges, TSX and TSXV in particular, are the main exchanges where majority of publicly
listed mining companies in the world are listed. The Canadian Securities Exchange (CSE), formerly the
Canadian National Stock Exchange, has also captured a small portion of the publicly listed junior
companies (Note: the CSE data, although included in Chart 2e below, is not visible due to the relatively
small size of financing, which totaled $39.2 million in 2014). By comparison, TSX financing was $21
billion in 2014 for mining companies. TSXV also accounted for a noticeable portion, at $3.5 billion in
2014. The line on the chart illustrates Canada’s share of financing, which was at 33.6% in 2014, and
increase from 26.4% in 2013.
The size of the financing illustrates the unique characteristics of junior mining companies. The top-
heavy figures indicate that big financing deals concluded by large mining companies tend to dominate
the value charts compared to higher number of small financings done by juniors. We can get a better
picture of this characteristic in the next section where we look at the number of financings.
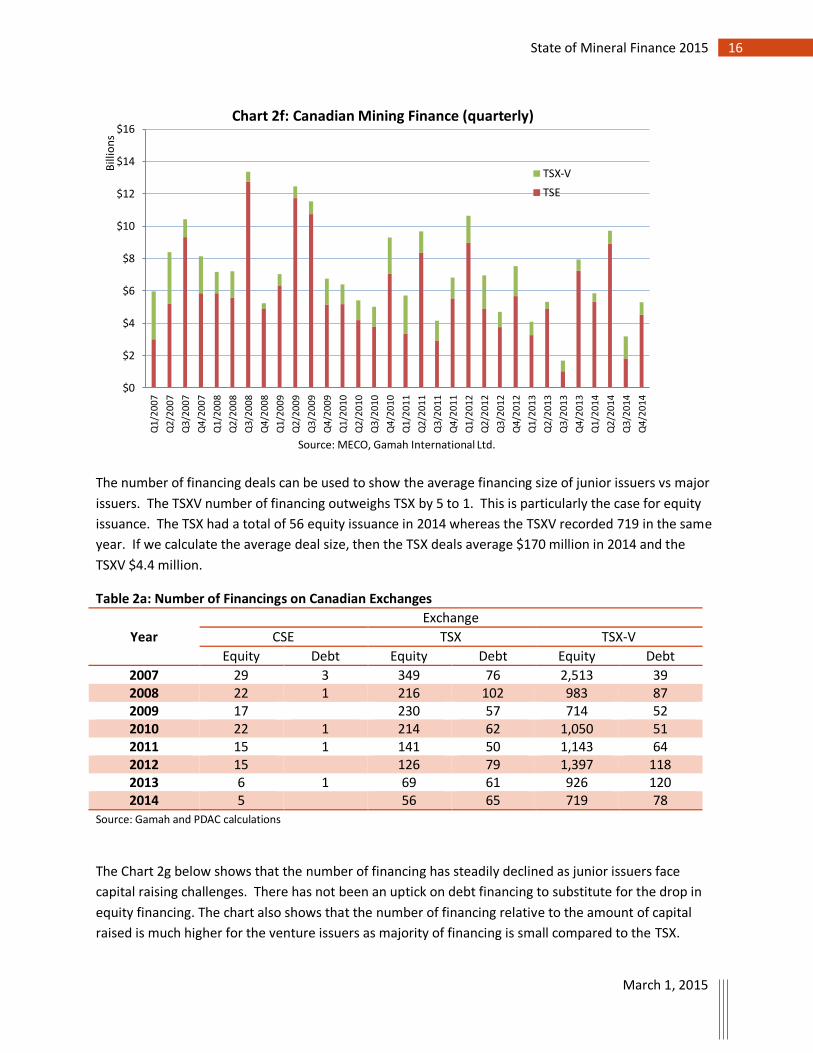
On a quarterly basis, the largest financings took place during the second quarter of 2014 when a total of
$9.7 billion was raised, $8.9 billion of which was from the TSX and $820 million from the TSXV (see Chart
2f below). In the final quarter of 2014 a total of $5.3 billion was raised from all Canadian exchange for
the mining sector. The Venture exchange did manage to improve financing in Q4 2014 compared to Q4
2013 as financing increased by 14% to $778 million. Despite the improvement, Q4’s result in 2014 was
far lower than the peak reached in Q2 2007 when a total of $3.2 billion was raised on the TSXV.
0.12 0.04 0.06 0.07 0.07 0.04 0.02 0.04
$23
$29
$34
$20 $20 $23
$16 $21
9.5
3.9
3.8
5.9 6.2
6.5
2.6
3.5
16.5%
32.0%
33.6%
32.5% 30.8%
33.4%
26.4% 33.6%
0%
5%
10%
15%
20%
25%
30%
35%
40%
$-
$5
$10
$15
$20
$25
$30
$35
$40
2007 2008 2009 2010 2011 2012 2013 2014
Bill
ion
s
Source: MECO, Gamah International Ltd. and the Canadian Securities Exchange
Chart 2e: Canadian Mining Finance
TSX-V TSE CSE Canada's Share from Global
16 State of Mineral Finance 2015
March 1, 2015
The number of financing deals can be used to show the average financing size of junior issuers vs major
issuers. The TSXV number of financing outweighs TSX by 5 to 1. This is particularly the case for equity
issuance. The TSX had a total of 56 equity issuance in 2014 whereas the TSXV recorded 719 in the same
year. If we calculate the average deal size, then the TSX deals average $170 million in 2014 and the
TSXV $4.4 million.
Table 2a: Number of Financings on Canadian Exchanges
Year
Exchange
CSE TSX TSX-V
Equity Debt Equity Debt Equity Debt
2007 29 3 349 76 2,513 39 2008 22 1 216 102 983 87 2009 17
230 57 714 52
2010 22 1 214 62 1,050 51 2011 15 1 141 50 1,143 64 2012 15
126 79 1,397 118
2013 6 1 69 61 926 120 2014 5
56 65 719 78
Source: Gamah and PDAC calculations
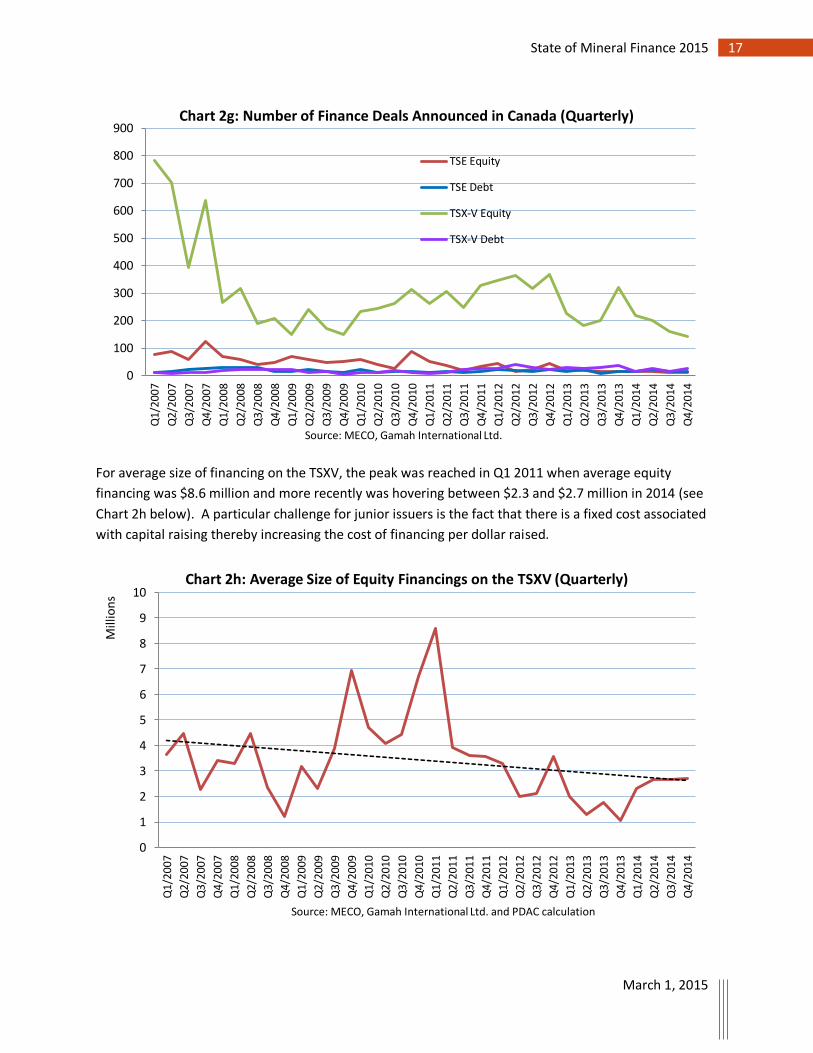
The Chart 2g below shows that the number of financing has steadily declined as junior issuers face
capital raising challenges. There has not been an uptick on debt financing to substitute for the drop in
equity financing. The chart also shows that the number of financing relative to the amount of capital
raised is much higher for the venture issuers as majority of financing is small compared to the TSX.
$0
$2
$4
$6
$8
$10
$12
$14
$16
Q1
/20
07
Q2
/20
07
Q3
/20
07
Q4
/20
07
Q1
/20
08
Q2
/20
08
Q3
/20
08
Q4
/20
08
Q1
/20
09
Q2
/20
09
Q3
/20
09
Q4
/20
09
Q1
/20
10
Q2
/20
10
Q3
/20
10
Q4
/20
10
Q1
/20
11
Q2
/20
11
Q3
/20
11
Q4
/20
11
Q1
/20
12
Q2
/20
12
Q3
/20
12
Q4
/20
12
Q1
/20
13
Q2
/20
13
Q3
/20
13
Q4
/20
13
Q1
/20
14
Q2
/20
14
Q3
/20
14
Q4
/20
14
Bill
ion
s
Source: MECO, Gamah International Ltd.
Chart 2f: Canadian Mining Finance (quarterly)
TSX-V
TSE
17 State of Mineral Finance 2015
March 1, 2015
For average size of financing on the TSXV, the peak was reached in Q1 2011 when average equity
financing was $8.6 million and more recently was hovering between $2.3 and $2.7 million in 2014 (see
Chart 2h below). A particular challenge for junior issuers is the fact that there is a fixed cost associated
with capital raising thereby increasing the cost of financing per dollar raised.
0
100
200
300
400
500
600
700
800
900
Q1/
2007
Q2/
2007
Q3/
2007
Q4/
2007
Q1/
2008
Q2/
2008
Q3/
2008
Q4/
2008
Q1/
2009
Q2/
2009
Q3/
2009
Q4/
2009
Q1/
2010
Q2/
2010
Q3/
2010
Q4/
2010
Q1/
2011
Q2/
2011
Q3/
2011
Q4/
2011
Q1/
2012
Q2/
2012
Q3/
2012
Q4/
2012
Q1/
2013
Q2/
2013
Q3/
2013
Q4/
2013
Q1/
2014
Q2/
2014
Q3/
2014
Q4/
2014
Source: MECO, Gamah International Ltd.
Chart 2g: Number of Finance Deals Announced in Canada (Quarterly)
TSE Equity
TSE Debt
TSX-V Equity
TSX-V Debt
0
1
2
3
4
5
6
7
8
9
10
Q1/
200
7
Q2/
200
7
Q3/
200
7
Q4/
200
7
Q1/
200
8
Q2/
200
8
Q3/
200
8
Q4/
200
8
Q1/
200
9
Q2/
200
9
Q3/
200
9
Q4/
200
9
Q1/
201
0
Q2/
201
0
Q3/
201
0
Q4/
201
0
Q1/
201
1
Q2/
201
1
Q3/
201
1
Q4/
201
1
Q1/
201
2
Q2/
201
2
Q3/
201
2
Q4/
201
2
Q1/
201
3
Q2/
201
3
Q3/
201
3
Q4/
201
3
Q1/
2014
Q2/
2014
Q3/
2014
Q4/
2014
Mill
ion
s
Source: MECO, Gamah International Ltd. and PDAC calculation
Chart 2h: Average Size of Equity Financings on the TSXV (Quarterly)
18 State of Mineral Finance 2015
March 1, 2015
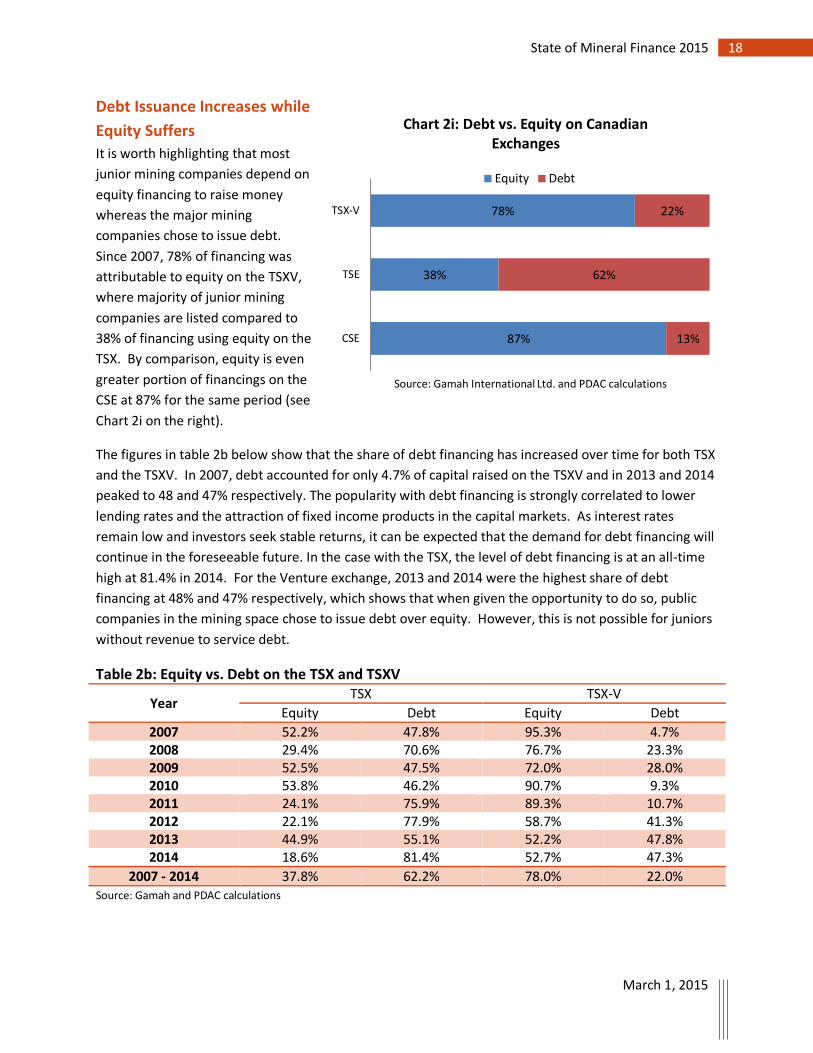
Debt Issuance Increases while
Equity Suffers
It is worth highlighting that most
junior mining companies depend on
equity financing to raise money
whereas the major mining
companies chose to issue debt.
Since 2007, 78% of financing was
attributable to equity on the TSXV,
where majority of junior mining
companies are listed compared to
38% of financing using equity on the
TSX. By comparison, equity is even
greater portion of financings on the
CSE at 87% for the same period (see
Chart 2i on the right).
The figures in table 2b below show that the share of debt financing has increased over time for both TSX
and the TSXV. In 2007, debt accounted for only 4.7% of capital raised on the TSXV and in 2013 and 2014
peaked to 48 and 47% respectively. The popularity with debt financing is strongly correlated to lower
lending rates and the attraction of fixed income products in the capital markets. As interest rates
remain low and investors seek stable returns, it can be expected that the demand for debt financing will
continue in the foreseeable future. In the case with the TSX, the level of debt financing is at an all-time
high at 81.4% in 2014. For the Venture exchange, 2013 and 2014 were the highest share of debt
financing at 48% and 47% respectively, which shows that when given the opportunity to do so, public
companies in the mining space chose to issue debt over equity. However, this is not possible for juniors
without revenue to service debt.
Table 2b: Equity vs. Debt on the TSX and TSXV
Year TSX TSX-V
Equity Debt Equity Debt
2007 52.2% 47.8% 95.3% 4.7% 2008 29.4% 70.6% 76.7% 23.3% 2009 52.5% 47.5% 72.0% 28.0% 2010 53.8% 46.2% 90.7% 9.3% 2011 24.1% 75.9% 89.3% 10.7% 2012 22.1% 77.9% 58.7% 41.3% 2013 44.9% 55.1% 52.2% 47.8% 2014 18.6% 81.4% 52.7% 47.3%
2007 - 2014 37.8% 62.2% 78.0% 22.0% Source: Gamah and PDAC calculations
87%
38%
78%
13%
62%
22%
CSE
TSE
TSX-V
Source: Gamah International Ltd. and PDAC calculations
Chart 2i: Debt vs. Equity on Canadian Exchanges
Equity Debt
19 State of Mineral Finance 2015
March 1, 2015
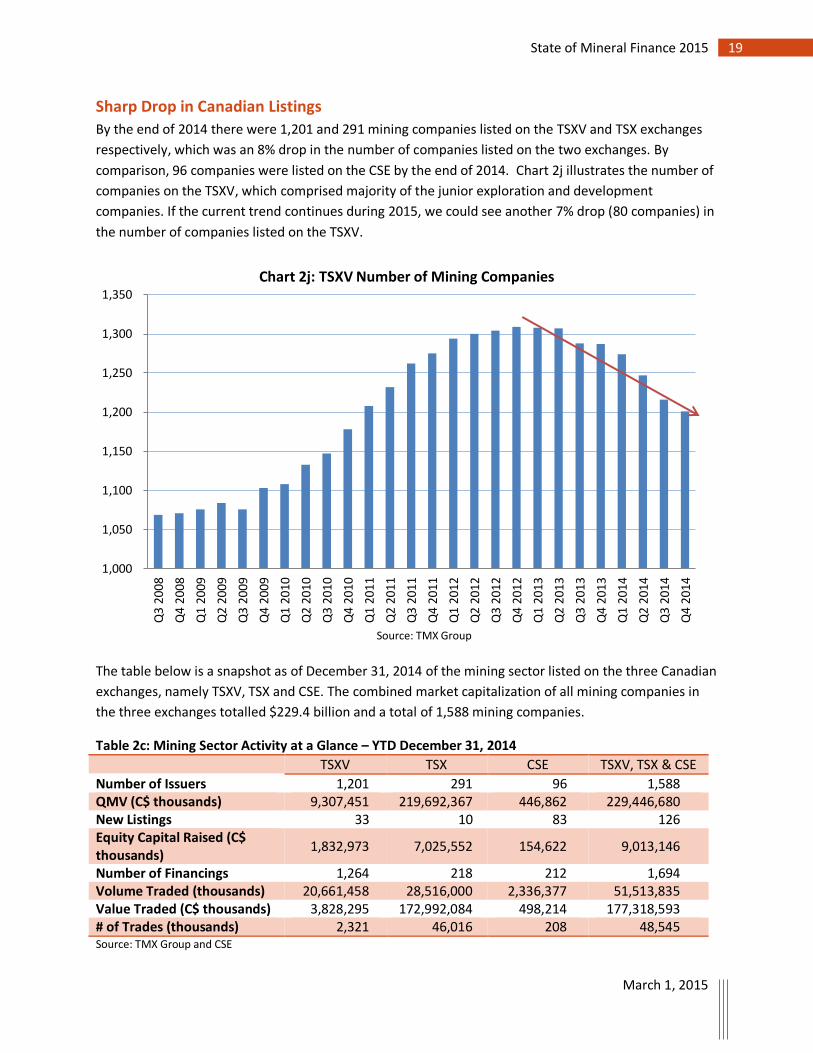
Sharp Drop in Canadian Listings
By the end of 2014 there were 1,201 and 291 mining companies listed on the TSXV and TSX exchanges
respectively, which was an 8% drop in the number of companies listed on the two exchanges. By
comparison, 96 companies were listed on the CSE by the end of 2014. Chart 2j illustrates the number of
companies on the TSXV, which comprised majority of the junior exploration and development
companies. If the current trend continues during 2015, we could see another 7% drop (80 companies) in
the number of companies listed on the TSXV.
The table below is a snapshot as of December 31, 2014 of the mining sector listed on the three Canadian
exchanges, namely TSXV, TSX and CSE. The combined market capitalization of all mining companies in
the three exchanges totalled $229.4 billion and a total of 1,588 mining companies.
Table 2c: Mining Sector Activity at a Glance – YTD December 31, 2014
TSXV TSX CSE TSXV, TSX & CSE
Number of Issuers 1,201 291 96 1,588 QMV (C$ thousands) 9,307,451 219,692,367 446,862 229,446,680 New Listings 33 10 83 126 Equity Capital Raised (C$ thousands)
1,832,973 7,025,552 154,622 9,013,146
Number of Financings 1,264 218 212 1,694 Volume Traded (thousands) 20,661,458 28,516,000 2,336,377 51,513,835 Value Traded (C$ thousands) 3,828,295 172,992,084 498,214 177,318,593 # of Trades (thousands) 2,321 46,016 208 48,545 Source: TMX Group and CSE
1,000
1,050
1,100
1,150
1,200
1,250
1,300
1,350
Q3
2008
Q4
2008
Q1
2009
Q2
2009
Q3
2009
Q4
2009
Q1
2010
Q2
2010
Q3
2010
Q4
2010
Q1
2011
Q2
2011
Q3
2011
Q4
2011
Q1
2012
Q2
2012
Q3
2012
Q4
2012
Q1
2013
Q2
2013
Q3
2013
Q4
2013
Q1
2014
Q2
2014
Q3
2014
Q4
2014
Source: TMX Group
Chart 2j: TSXV Number of Mining Companies
20 State of Mineral Finance 2015
March 1, 2015
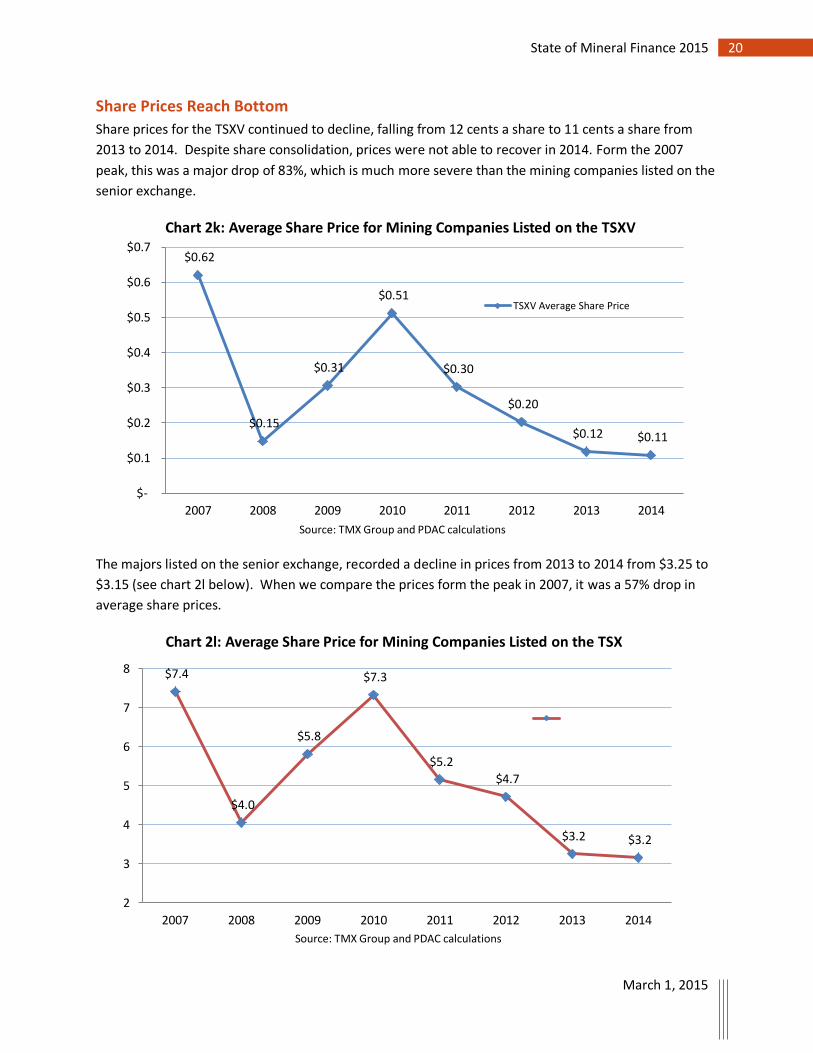
Share Prices Reach Bottom
Share prices for the TSXV continued to decline, falling from 12 cents a share to 11 cents a share from
2013 to 2014. Despite share consolidation, prices were not able to recover in 2014. Form the 2007
peak, this was a major drop of 83%, which is much more severe than the mining companies listed on the
senior exchange.
The majors listed on the senior exchange, recorded a decline in prices from 2013 to 2014 from $3.25 to
$3.15 (see chart 2l below). When we compare the prices form the peak in 2007, it was a 57% drop in
average share prices.
$0.62
$0.15
$0.31
$0.51
$0.30
$0.20
$0.12 $0.11
$-
$0.1
$0.2
$0.3
$0.4
$0.5
$0.6
$0.7
2007 2008 2009 2010 2011 2012 2013 2014
Source: TMX Group and PDAC calculations
Chart 2k: Average Share Price for Mining Companies Listed on the TSXV
TSXV Average Share Price
$7.4
$4.0
$5.8
$7.3
$5.2
$4.7
$3.2 $3.2
2
3
4
5
6
7
8
2007 2008 2009 2010 2011 2012 2013 2014
Source: TMX Group and PDAC calculations
Chart 2l: Average Share Price for Mining Companies Listed on the TSX
21 State of Mineral Finance 2015
March 1, 2015
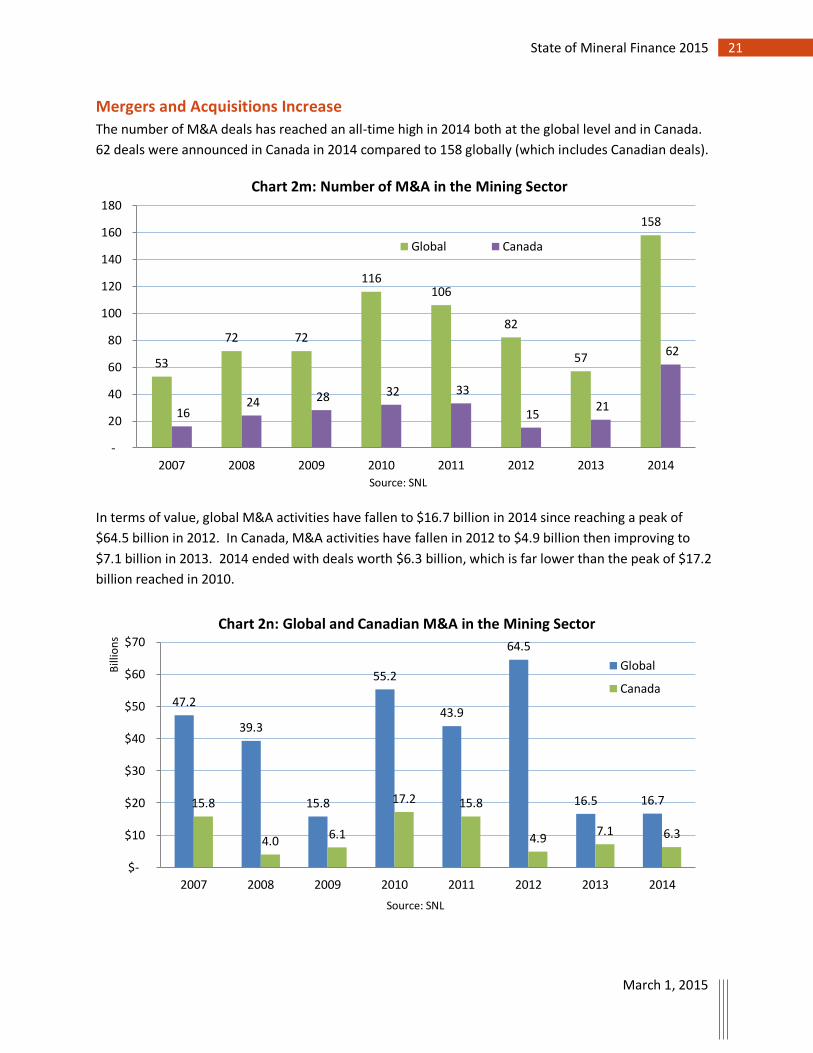
Mergers and Acquisitions Increase
The number of M&A deals has reached an all-time high in 2014 both at the global level and in Canada.
62 deals were announced in Canada in 2014 compared to 158 globally (which includes Canadian deals).
In terms of value, global M&A activities have fallen to $16.7 billion in 2014 since reaching a peak of
$64.5 billion in 2012. In Canada, M&A activities have fallen in 2012 to $4.9 billion then improving to
$7.1 billion in 2013. 2014 ended with deals worth $6.3 billion, which is far lower than the peak of $17.2
billion reached in 2010.
53
72 72
116 106
82
57
158
16 24 28 32 33
15 21
62
-
20
40
60
80
100
120
140
160
180
2007 2008 2009 2010 2011 2012 2013 2014
Source: SNL
Chart 2m: Number of M&A in the Mining Sector
Global Canada
47.2
39.3
15.8
55.2
43.9
64.5
16.5 16.7 15.8
4.0 6.1
17.2 15.8
4.9 7.1 6.3
$-
$10
$20
$30
$40
$50
$60
$70
2007 2008 2009 2010 2011 2012 2013 2014
Bill
ion
s
Source: SNL
Chart 2n: Global and Canadian M&A in the Mining Sector
Global
Canada
22 State of Mineral Finance 2015
March 1, 2015
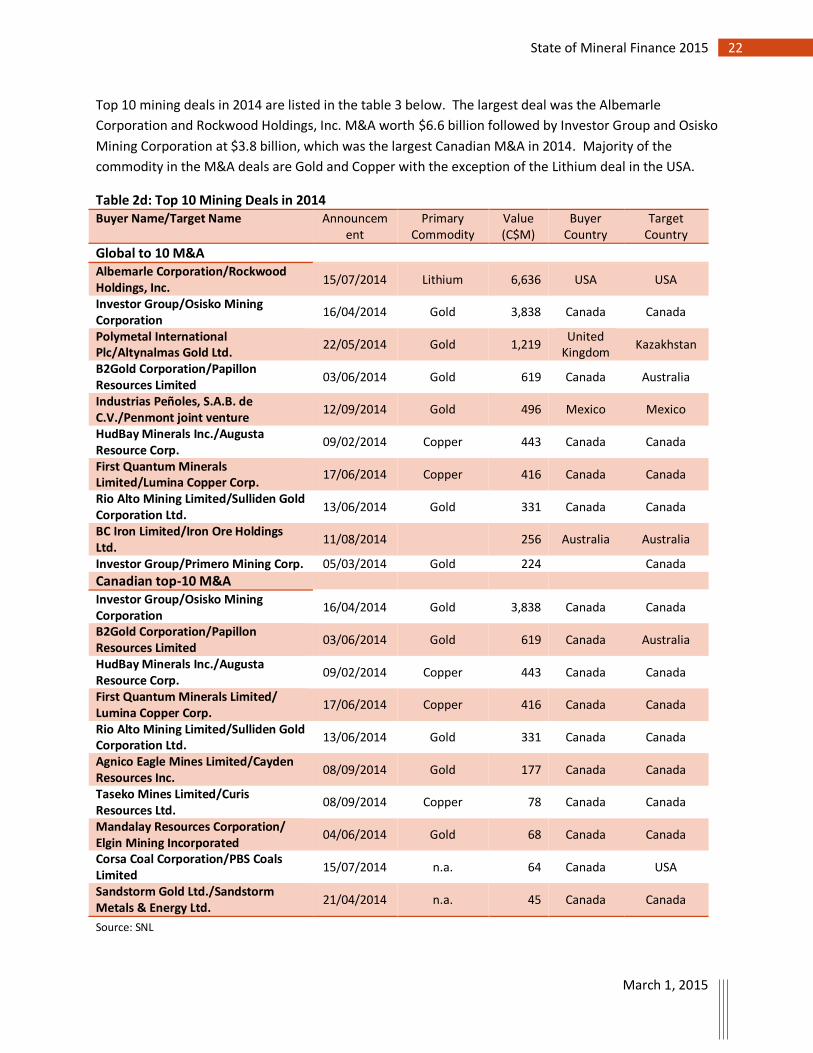
Top 10 mining deals in 2014 are listed in the table 3 below. The largest deal was the Albemarle
Corporation and Rockwood Holdings, Inc. M&A worth $6.6 billion followed by Investor Group and Osisko
Mining Corporation at $3.8 billion, which was the largest Canadian M&A in 2014. Majority of the
commodity in the M&A deals are Gold and Copper with the exception of the Lithium deal in the USA.
Table 2d: Top 10 Mining Deals in 2014
Buyer Name/Target Name Announcement
Primary Commodity
Value (C$M)
Buyer Country
Target Country
Global to 10 M&A
Albemarle Corporation/Rockwood Holdings, Inc.
15/07/2014 Lithium 6,636 USA USA
Investor Group/Osisko Mining Corporation
16/04/2014 Gold 3,838 Canada Canada
Polymetal International Plc/Altynalmas Gold Ltd.
22/05/2014 Gold 1,219 United
Kingdom Kazakhstan
B2Gold Corporation/Papillon Resources Limited
03/06/2014 Gold 619 Canada Australia
Industrias Peñoles, S.A.B. de C.V./Penmont joint venture
12/09/2014 Gold 496 Mexico Mexico
HudBay Minerals Inc./Augusta Resource Corp.
09/02/2014 Copper 443 Canada Canada
First Quantum Minerals Limited/Lumina Copper Corp.
17/06/2014 Copper 416 Canada Canada
Rio Alto Mining Limited/Sulliden Gold Corporation Ltd.
13/06/2014 Gold 331 Canada Canada
BC Iron Limited/Iron Ore Holdings Ltd.
11/08/2014
256 Australia Australia
Investor Group/Primero Mining Corp. 05/03/2014 Gold 224
Canada
Canadian top-10 M&A
Investor Group/Osisko Mining Corporation
16/04/2014 Gold 3,838 Canada Canada
B2Gold Corporation/Papillon Resources Limited
03/06/2014 Gold 619 Canada Australia
HudBay Minerals Inc./Augusta Resource Corp.
09/02/2014 Copper 443 Canada Canada
First Quantum Minerals Limited/ Lumina Copper Corp.
17/06/2014 Copper 416 Canada Canada
Rio Alto Mining Limited/Sulliden Gold Corporation Ltd.
13/06/2014 Gold 331 Canada Canada
Agnico Eagle Mines Limited/Cayden Resources Inc.
08/09/2014 Gold 177 Canada Canada
Taseko Mines Limited/Curis Resources Ltd.
08/09/2014 Copper 78 Canada Canada
Mandalay Resources Corporation/ Elgin Mining Incorporated
04/06/2014 Gold 68 Canada Canada
Corsa Coal Corporation/PBS Coals Limited
15/07/2014 n.a. 64 Canada USA
Sandstorm Gold Ltd./Sandstorm Metals & Energy Ltd.
21/04/2014 n.a. 45 Canada Canada
Source: SNL
23 State of Mineral Finance 2015
March 1, 2015
SECTION III: Exploration Trends
Global Exploration Budgets Hit Hard
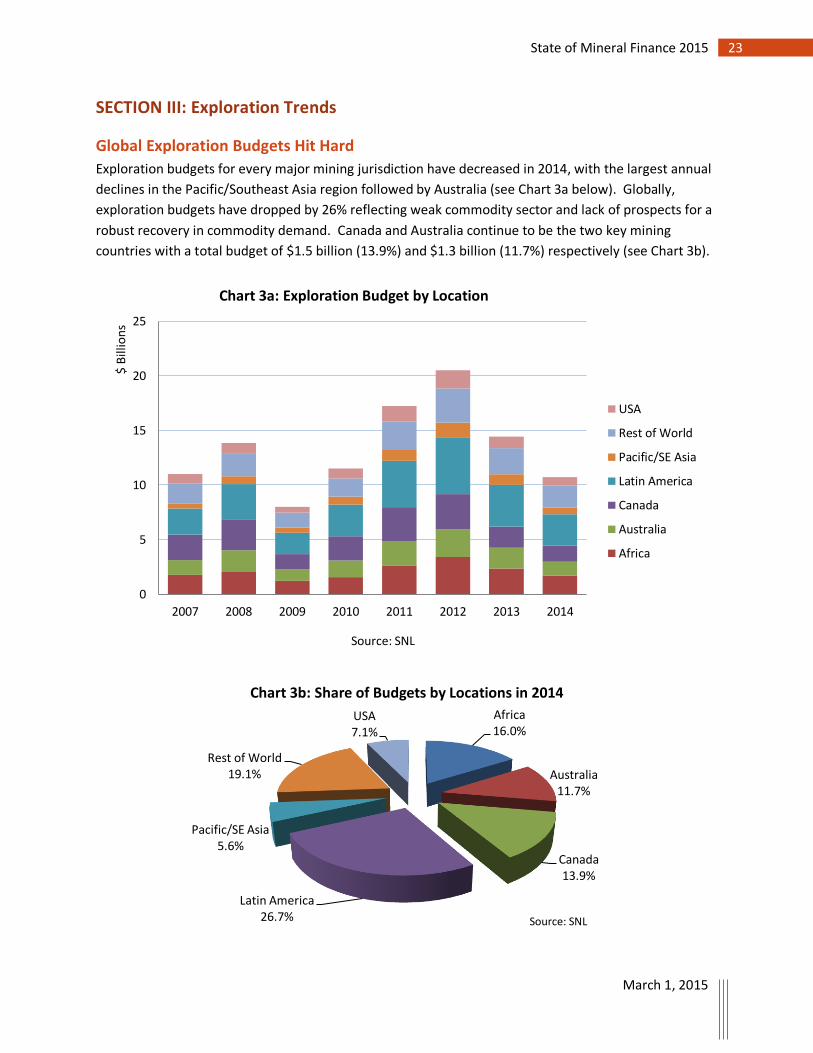
Exploration budgets for every major mining jurisdiction have decreased in 2014, with the largest annual
declines in the Pacific/Southeast Asia region followed by Australia (see Chart 3a below). Globally,
exploration budgets have dropped by 26% reflecting weak commodity sector and lack of prospects for a
robust recovery in commodity demand. Canada and Australia continue to be the two key mining
countries with a total budget of $1.5 billion (13.9%) and $1.3 billion (11.7%) respectively (see Chart 3b).
0
5
10
15
20
25
2007 2008 2009 2010 2011 2012 2013 2014
$ B
illio
ns
Source: SNL
Chart 3a: Exploration Budget by Location
USA
Rest of World
Pacific/SE Asia
Latin America
Canada
Australia
Africa
Africa 16.0%
Australia 11.7%
Canada 13.9%
Latin America 26.7%
Pacific/SE Asia 5.6%
Rest of World 19.1%
USA 7.1%
Chart 3b: Share of Budgets by Locations in 2014
Source: SNL
24 State of Mineral Finance 2015
March 1, 2015
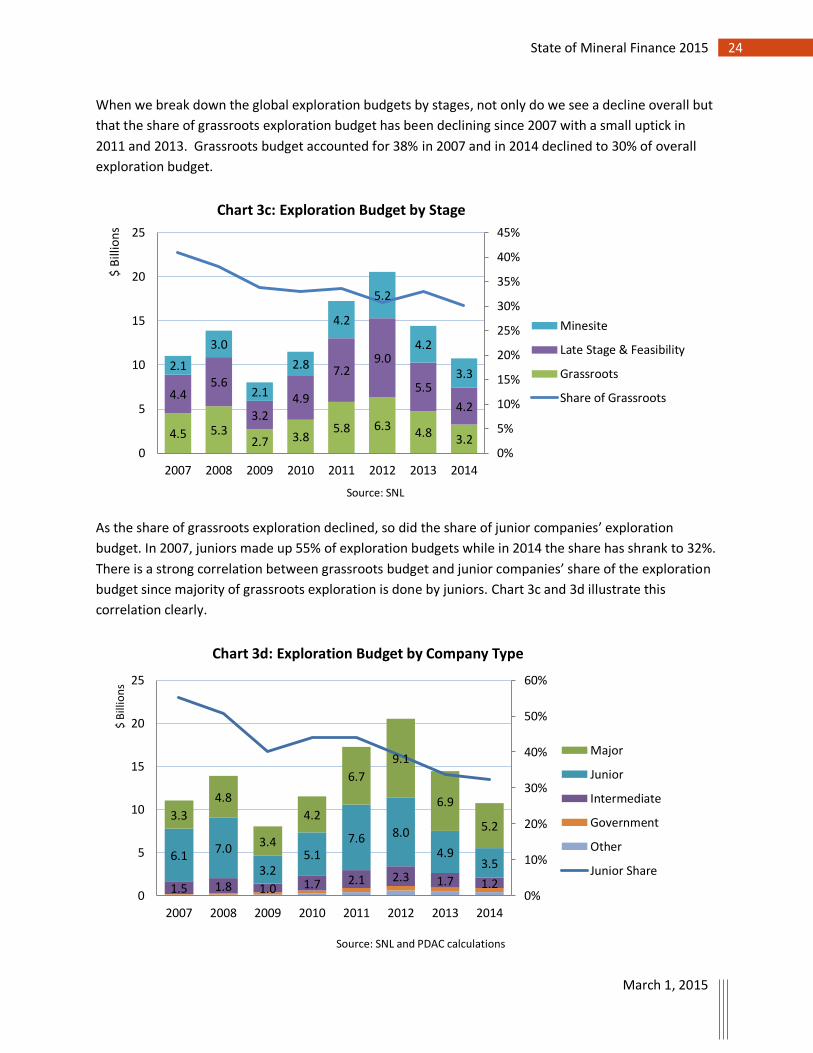
When we break down the global exploration budgets by stages, not only do we see a decline overall but
that the share of grassroots exploration budget has been declining since 2007 with a small uptick in
2011 and 2013. Grassroots budget accounted for 38% in 2007 and in 2014 declined to 30% of overall
exploration budget.
As the share of grassroots exploration declined, so did the share of junior companies’ exploration
budget. In 2007, juniors made up 55% of exploration budgets while in 2014 the share has shrank to 32%.
There is a strong correlation between grassroots budget and junior companies’ share of the exploration
budget since majority of grassroots exploration is done by juniors. Chart 3c and 3d illustrate this
correlation clearly.
4.5 5.3 2.7 3.8
5.8 6.3 4.8
3.2
4.4 5.6
3.2
4.9
7.2 9.0
5.5
4.2
2.1
3.0
2.1
2.8
4.2
5.2
4.2
3.3
0%
5%
10%
15%
20%
25%
30%
35%
40%
45%
0
5
10
15
20
25
2007 2008 2009 2010 2011 2012 2013 2014
$ B
illio
ns
Source: SNL
Chart 3c: Exploration Budget by Stage
Minesite
Late Stage & Feasibility
Grassroots
Share of Grassroots
1.5 1.8 1.0 1.7 2.1 2.3 1.7 1.2
6.1 7.0
3.2 5.1
7.6 8.0
4.9 3.5
3.3
4.8
3.4
4.2
6.7
9.1
6.9
5.2
0%
10%
20%
30%
40%
50%
60%
0
5
10
15
20
25
2007 2008 2009 2010 2011 2012 2013 2014
$ B
illio
ns
Source: SNL and PDAC calculations
Chart 3d: Exploration Budget by Company Type
Major
Junior
Intermediate
Government
Other
Junior Share
25 State of Mineral Finance 2015
March 1, 2015
Average corporate exploration budget has declined in 2014 to $138 million from $190 million in the
previous year, which is a 27% drop. As reported by SNL, the number of junior and intermediate
companies with current exploration budgets and revenue fell to 252 in 2014 from 273 in 2013.
Sharp Drop in Canadian Exploration Budgets
Canada remained the top destination for non-ferrous exploration despite exploration expenditures in
Canada dropping 22% over 2013 levels. Australia was the second most popular destination, despite non-
ferrous exploration expenditures in that country dropping 34% over 2013 levels. If iron ore and coal
exploration budgets are included, however, SNL Metals and Mining data suggests that Australia has
actually been the top destination for exploration since at least 2011.
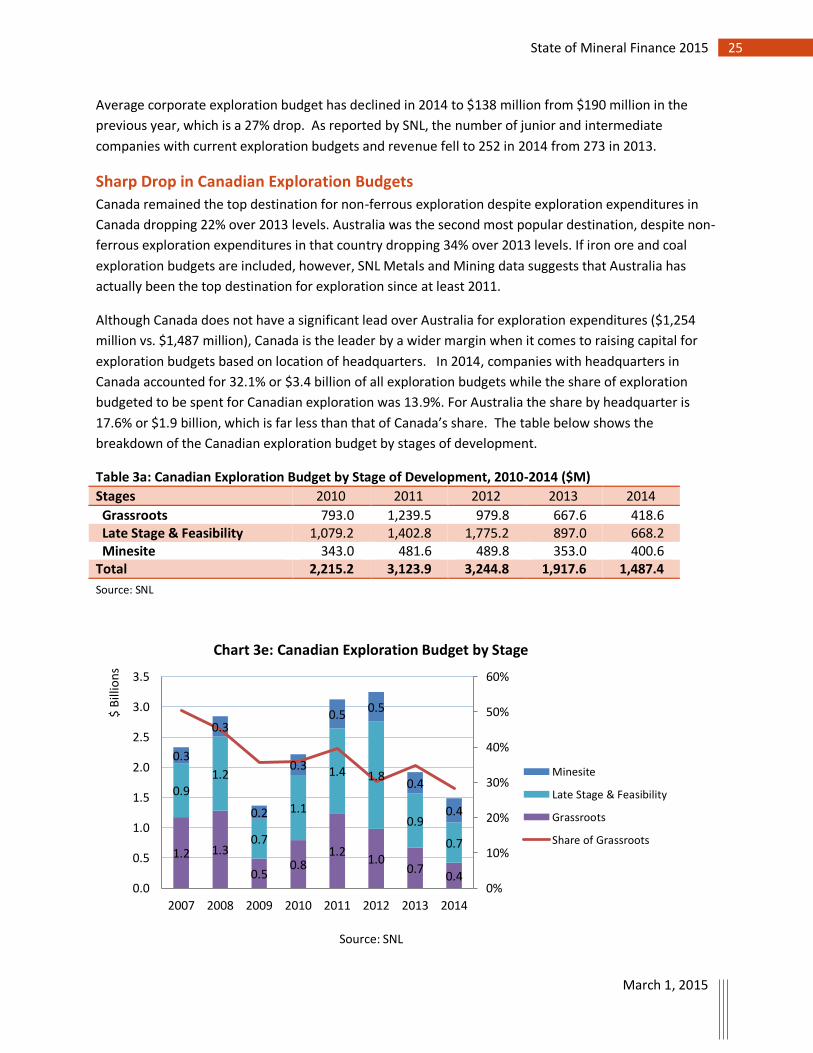
Although Canada does not have a significant lead over Australia for exploration expenditures ($1,254
million vs. $1,487 million), Canada is the leader by a wider margin when it comes to raising capital for
exploration budgets based on location of headquarters. In 2014, companies with headquarters in
Canada accounted for 32.1% or $3.4 billion of all exploration budgets while the share of exploration
budgeted to be spent for Canadian exploration was 13.9%. For Australia the share by headquarter is
17.6% or $1.9 billion, which is far less than that of Canada’s share. The table below shows the
breakdown of the Canadian exploration budget by stages of development.
Table 3a: Canadian Exploration Budget by Stage of Development, 2010-2014 ($M)
Stages 2010 2011 2012 2013 2014
Grassroots 793.0 1,239.5 979.8 667.6 418.6 Late Stage & Feasibility 1,079.2 1,402.8 1,775.2 897.0 668.2 Minesite 343.0 481.6 489.8 353.0 400.6 Total 2,215.2 3,123.9 3,244.8 1,917.6 1,487.4
Source: SNL
1.2 1.3
0.5 0.8
1.2 1.0
0.7 0.4
0.9 1.2
0.7
1.1
1.4 1.8
0.9
0.7
0.3
0.3
0.2
0.3
0.5 0.5
0.4
0.4
0%
10%
20%
30%
40%
50%
60%
0.0
0.5
1.0
1.5
2.0
2.5
3.0
3.5
2007 2008 2009 2010 2011 2012 2013 2014
$ B
illio
ns
Source: SNL
Chart 3e: Canadian Exploration Budget by Stage
Minesite
Late Stage & Feasibility
Grassroots
Share of Grassroots
26 State of Mineral Finance 2015
March 1, 2015
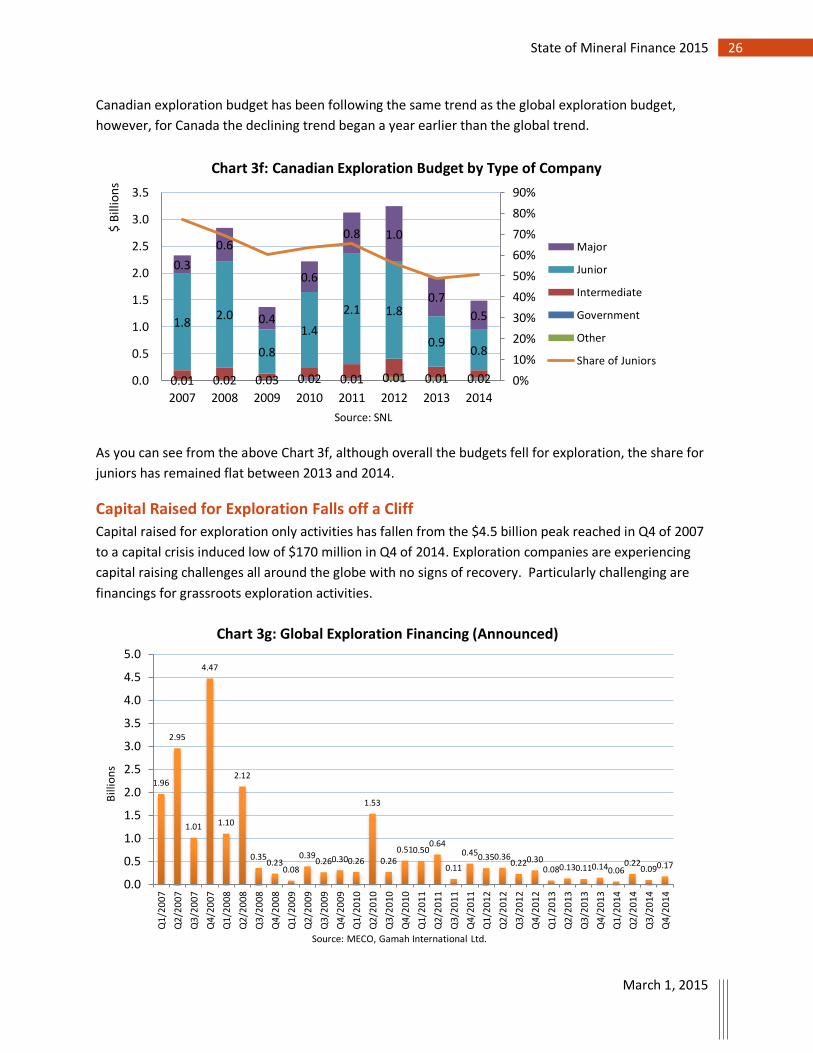
Canadian exploration budget has been following the same trend as the global exploration budget,
however, for Canada the declining trend began a year earlier than the global trend.
As you can see from the above Chart 3f, although overall the budgets fell for exploration, the share for
juniors has remained flat between 2013 and 2014.
Capital Raised for Exploration Falls off a Cliff
Capital raised for exploration only activities has fallen from the $4.5 billion peak reached in Q4 of 2007
to a capital crisis induced low of $170 million in Q4 of 2014. Exploration companies are experiencing
capital raising challenges all around the globe with no signs of recovery. Particularly challenging are
financings for grassroots exploration activities.
0.01 0.02 0.03 0.02 0.01 0.01 0.01 0.02
1.8 2.0
0.8
1.4
2.1 1.8
0.9 0.8
0.3
0.6
0.4
0.6
0.8 1.0
0.7
0.5
0%
10%
20%
30%
40%
50%
60%
70%
80%
90%
0.0
0.5
1.0
1.5
2.0
2.5
3.0
3.5
2007 2008 2009 2010 2011 2012 2013 2014
$ B
illio
ns
Source: SNL
Chart 3f: Canadian Exploration Budget by Type of Company
Major
Junior
Intermediate
Government
Other
Share of Juniors
1.96
2.95
1.01
4.47
1.10
2.12
0.35 0.23
0.08
0.39 0.26 0.30 0.26
1.53
0.26 0.51 0.50
0.64
0.11
0.45 0.35 0.36 0.22 0.30
0.08 0.13 0.11 0.14 0.06 0.22
0.09 0.17
0.0
0.5
1.0
1.5
2.0
2.5
3.0
3.5
4.0
4.5
5.0
Q1
/20
07
Q2
/20
07
Q3
/20
07
Q4
/20
07
Q1
/20
08
Q2
/20
08
Q3
/20
08
Q4
/20
08
Q1
/20
09
Q2
/20
09
Q3
/20
09
Q4
/20
09
Q1
/20
10
Q2
/20
10
Q3
/20
10
Q4
/20
10
Q1
/20
11
Q2
/20
11
Q3
/20
11
Q4
/20
11
Q1
/20
12
Q2
/20
12
Q3
/20
12
Q4
/20
12
Q1
/20
13
Q2
/20
13
Q3
/20
13
Q4
/20
13
Q1
/20
14
Q2
/20
14
Q3
/20
14
Q4
/20
14
Bill
ion
s
Source: MECO, Gamah International Ltd.
Chart 3g: Global Exploration Financing (Announced)
27 State of Mineral Finance 2015
March 1, 2015
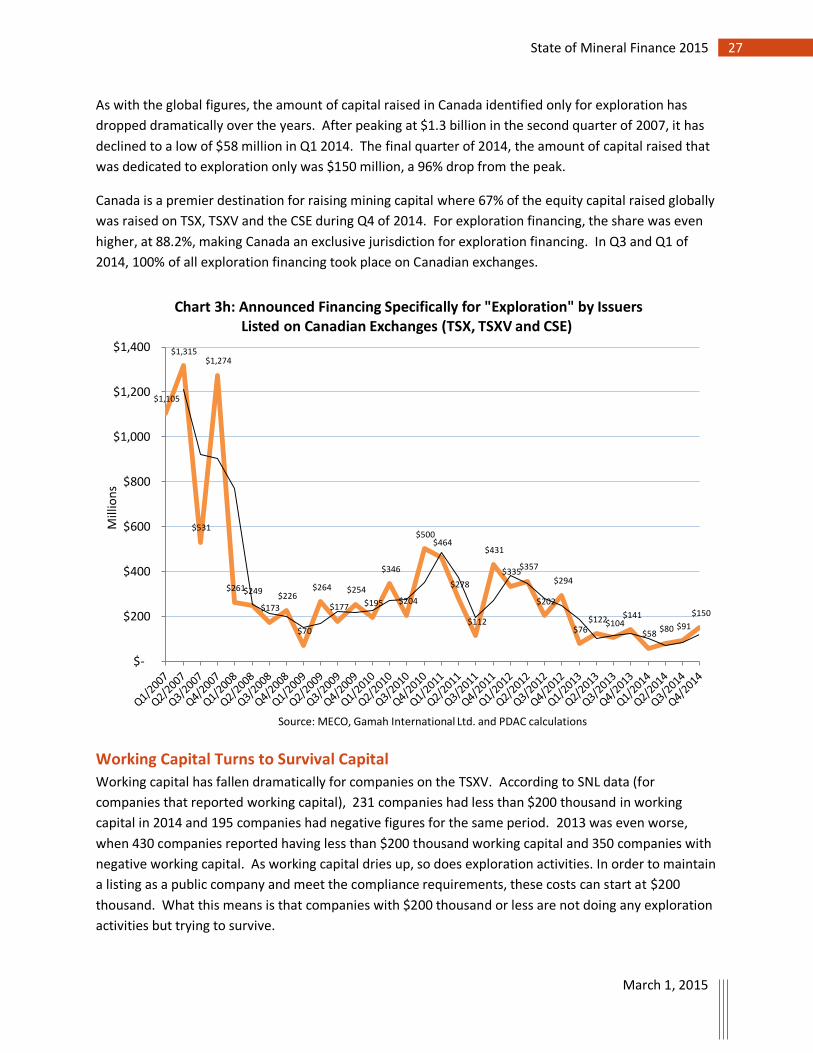
As with the global figures, the amount of capital raised in Canada identified only for exploration has
dropped dramatically over the years. After peaking at $1.3 billion in the second quarter of 2007, it has
declined to a low of $58 million in Q1 2014. The final quarter of 2014, the amount of capital raised that
was dedicated to exploration only was $150 million, a 96% drop from the peak.
Canada is a premier destination for raising mining capital where 67% of the equity capital raised globally
was raised on TSX, TSXV and the CSE during Q4 of 2014. For exploration financing, the share was even
higher, at 88.2%, making Canada an exclusive jurisdiction for exploration financing. In Q3 and Q1 of
2014, 100% of all exploration financing took place on Canadian exchanges.
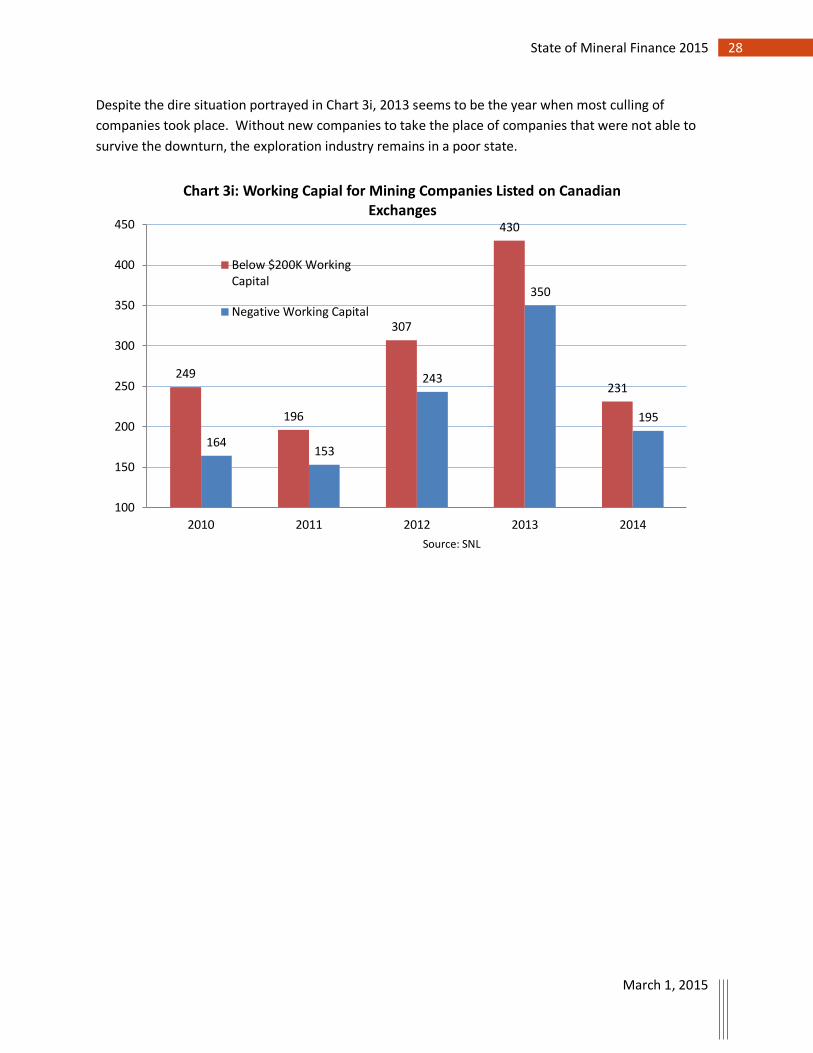
Working Capital Turns to Survival Capital
Working capital has fallen dramatically for companies on the TSXV. According to SNL data (for
companies that reported working capital), 231 companies had less than $200 thousand in working
capital in 2014 and 195 companies had negative figures for the same period. 2013 was even worse,
when 430 companies reported having less than $200 thousand working capital and 350 companies with
negative working capital. As working capital dries up, so does exploration activities. In order to maintain
a listing as a public company and meet the compliance requirements, these costs can start at $200
thousand. What this means is that companies with $200 thousand or less are not doing any exploration
activities but trying to survive.
$1,105
$1,315
$531
$1,274
$261 $249
$173
$226
$70
$264
$177
$254
$195
$346
$204
$500 $464
$278
$112
$431
$335 $357
$202
$294
$76 $122 $104
$141
$58 $80 $91
$150
$-
$200
$400
$600
$800
$1,000
$1,200
$1,400
Mill
ion
s
Source: MECO, Gamah International Ltd. and PDAC calculations
Chart 3h: Announced Financing Specifically for "Exploration" by Issuers Listed on Canadian Exchanges (TSX, TSXV and CSE)
28 State of Mineral Finance 2015
March 1, 2015
Despite the dire situation portrayed in Chart 3i, 2013 seems to be the year when most culling of
companies took place. Without new companies to take the place of companies that were not able to
survive the downturn, the exploration industry remains in a poor state.
249
196
307
430
231
164 153
243
350
195
100
150
200
250
300
350
400
450
2010 2011 2012 2013 2014
Source: SNL
Chart 3i: Working Capial for Mining Companies Listed on Canadian Exchanges
Below $200K WorkingCapital
Negative Working Capital
29 State of Mineral Finance 2015
March 1, 2015
SECTION IV: Fiscal Support and Capital Market Reform Canada is a leader for exploration and mineral financing. In order to maintain its leadership, there is a
need to provide an enabling environment for the industry to flourish. In a downturn, such as the one
the industry has been experiencing over the last few years, it is of greater importance to provide the
right fiscal landscape for the industry. Without the right incentives in place, risk capital becomes harder
to access during a downturn and an increasing competitive environment. A good example is the
innovative flow-through system in Canada, which has been l tremendous help to the industry.
Additionally, capital markets play a crucial role in helping the exploration and development companies
to raise risk capital from retail investors. New reform to the capital markets are needed to adapt to the
new structure of capital markets that employ new technology and develop new products. The
traditional model of how exploration companies were financed in the past has changed and capital
market reform is needed to adapt to new ways of raising capital – from both private and public markets.
The Cooperative Capital Market Regulator and new exemptions, if done right, are a step in the right
direction.
Use of Flow-Through Shares Buffers the fall in Financings
Flow-through shares4 are a major source of financing that is targeted specifically to exploration activities
in Canada for companies listed on Canadian exchanges. Flow-through can help attract capital back to
juniors, and back to grassroots exploration because of the ability for investors to benefit from the
Mineral Exploration Tax Credit (METC).5
PDAC was the first organization to recommend the government implement a flow-through program for
the exploration sector and has consistently supported the federal government to keep the METC in
place. The credit was initially implemented in October, 2000 for three years as an interim measure,
extended annually. In the federal government’s Budget 2013 the METC was extended with expiry date
to March 31, 2015.
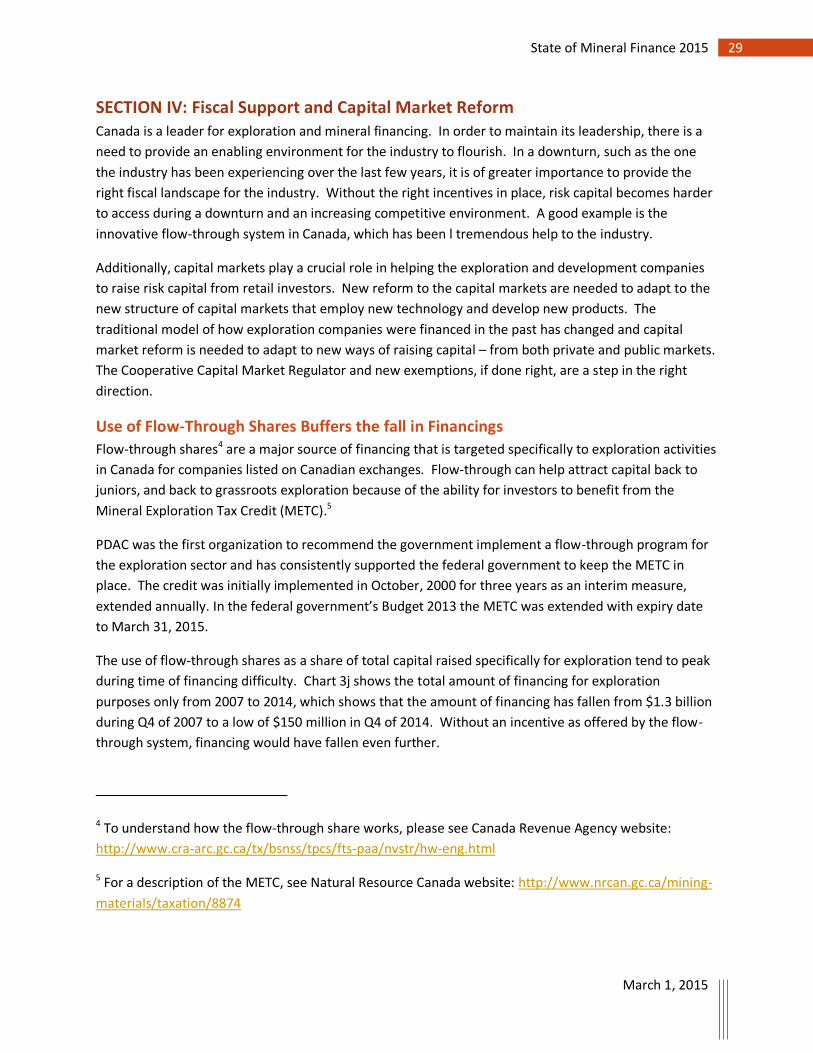
The use of flow-through shares as a share of total capital raised specifically for exploration tend to peak
during time of financing difficulty. Chart 3j shows the total amount of financing for exploration
purposes only from 2007 to 2014, which shows that the amount of financing has fallen from $1.3 billion
during Q4 of 2007 to a low of $150 million in Q4 of 2014. Without an incentive as offered by the flow-
through system, financing would have fallen even further.
4 To understand how the flow-through share works, please see Canada Revenue Agency website:
http://www.cra-arc.gc.ca/tx/bsnss/tpcs/fts-paa/nvstr/hw-eng.html
5 For a description of the METC, see Natural Resource Canada website: http://www.nrcan.gc.ca/mining-
materials/taxation/8874
30 State of Mineral Finance 2015
March 1, 2015
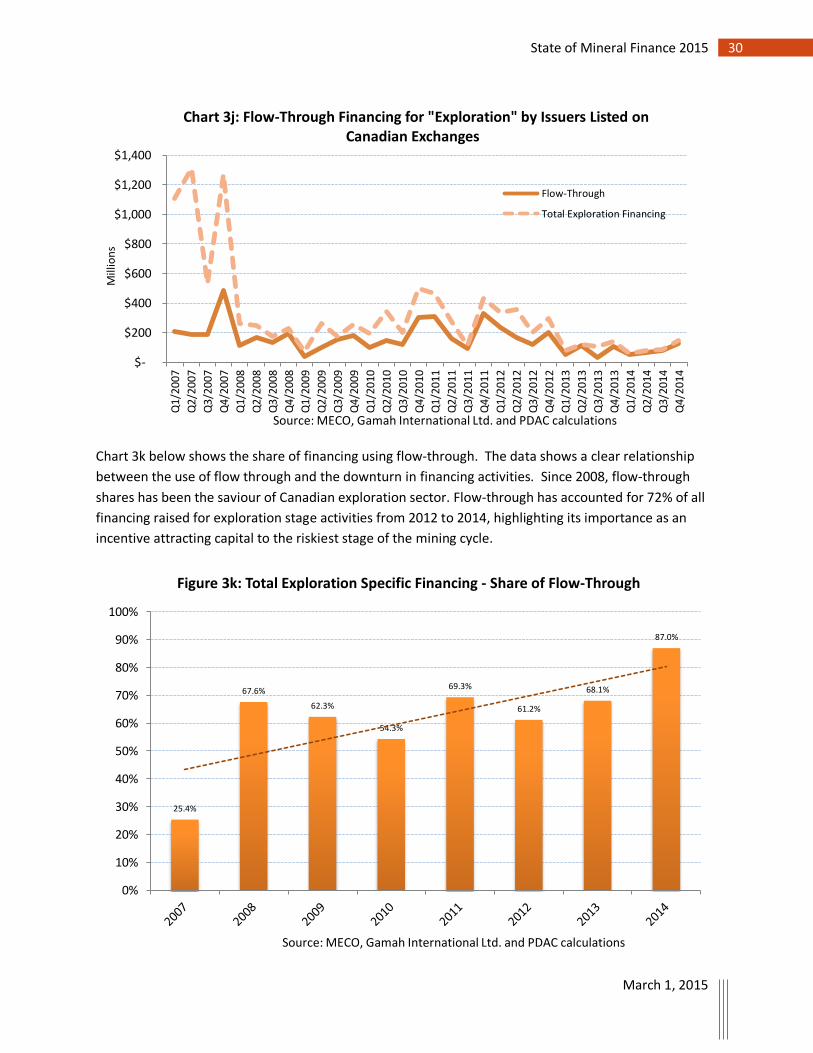
Chart 3k below shows the share of financing using flow-through. The data shows a clear relationship
between the use of flow through and the downturn in financing activities. Since 2008, flow-through
shares has been the saviour of Canadian exploration sector. Flow-through has accounted for 72% of all
financing raised for exploration stage activities from 2012 to 2014, highlighting its importance as an
incentive attracting capital to the riskiest stage of the mining cycle.
$-
$200
$400
$600
$800
$1,000
$1,200
$1,400
Q1/
2007
Q2/
2007
Q3/
2007
Q4/
2007
Q1/
2008
Q2/
2008
Q3/
2008
Q4/
2008
Q1/
2009
Q2/
2009
Q3/
2009
Q4/
2009
Q1/
2010
Q2/
2010
Q3/
2010
Q4/
2010
Q1/
2011
Q2/
2011
Q3/
2011
Q4/
2011
Q1/
2012
Q2/
2012
Q3/
2012
Q4/
2012
Q1/
2013
Q2/
2013
Q3/
2013
Q4/
2013
Q1/
2014
Q2/
2014
Q3/
2014
Q4/
2014
Mill
ion
s
Source: MECO, Gamah International Ltd. and PDAC calculations
Chart 3j: Flow-Through Financing for "Exploration" by Issuers Listed on Canadian Exchanges
Flow-Through
Total Exploration Financing
25.4%
67.6%
62.3%
54.3%
69.3%
61.2%
68.1%
87.0%
0%
10%
20%
30%
40%
50%
60%
70%
80%
90%
100%
Source: MECO, Gamah International Ltd. and PDAC calculations
Figure 3k: Total Exploration Specific Financing - Share of Flow-Through
31 State of Mineral Finance 2015
March 1, 2015
Regulatory Developments in Canadian Capital Markets
The Canadian capital markets have been going through changes both at the provincial level as well as
structural shift in the way regulations are implemented in Canada. New exemptions along with a
cooperative regulatory regime are major changes to the Canadian regulatory landscape in Canada that
could have a profound impact on the way junior issuers raise capital in Canada.
New Exemptions Could Help
Jurisdictions across Canada are responding to the capital crisis by putting forth a range of ‘exempt
market’ proposals (some of which are new; being adopted by a wider range of jurisdictions; and others
being modified).
On June 18, 2014, PDAC made 8 submissions6 related to four types of exemptions: Offering
memorandum exemption (OM); Family, friends and business associates exemption (FFBA); Existing
security holders exemption; and Crowdfunding (and start-up crowd-funding) exemption.
1. OSC - Existing Security Holder (proposed s. 2.9 of OSC Rule 45-501 Ontario Prospectus and
Registration Exemptions) Proposal to introduce a new prospectus exemption that would allow non-
investment fund issuers listed on certain Canadian stock exchanges to distribute securities to
existing security holders in prescribed circumstances. This exemption is in effect starting February
11, 2015 throughout Canada; however it will be subject to different treatment in Ontario.7
2. OSC - Family, Friends and Business Associates (s. 2.5 and proposed s. 2.6.1 of NI 45-106) - Proposal
to introduce a family, friends and business associates prospectus exemption similar to those in
other CSA jurisdictions for non-investment fund issuers. Ontario will be adopting a Family, Friends
and Business Associates Prospectus Exemption effective May 5, 2015, which will be largely
harmonized with the FFBA exemption in the rest of Canada.
6 To see the full submissions by PDAC on the above regulatory proposal, please click on link:
http://www.pdac.ca/policy/securities/policy/2014/06/23/pdac-comments-on-all-of-the-exempt-
market-proposals-from-provincial-securities-regulators
7 In Ontario, it is not available to investment funds; the issuance must not result in an increase of more
than 100% of the outstanding listed securities of the issuer; and the OSC rule provides for Secondary
Market Disclosure Liability, which includes an right of action for damages as compared to the CSA rule
that provides for Contractual Liability, which includes recession rights.
One area of difference that will be harmonized with the CSA rule is that the OSC rule does not require a
pro-rata distribution requirement. Instead the OSC has provided guidance in the companion policy to
OSC Rule 45-501 – i.e. the OSC expects issuers to “fairly allocate investment opportunities among all of
the issuer’s security holders”.
32 State of Mineral Finance 2015
March 1, 2015
3. OM (s. 2.9 of NI 45-106): AB, SK, QC - Proposal to impose new annual caps on the amount that can
be raised from an individual, to address marketing materials and to require annual financial
statements
4. OM: ON - Proposal to introduce an offering memorandum prospectus exemption similar to the
exemption available in certain other CSA jurisdictions (as proposed to be amended) for non-
investment fund issuers.
5. OM: NB - Proposal to adopt an offering memorandum prospectus exemption on the same terms as
in Ontario
6. Crowdfunding and start-up crowdfunding
a. Crowdfunding - (proposed MI 45-108 Crowdfunding) - SK, MB, QC, NB, NS - Proposal to
introduce a new crowdfunding prospectus exemption for non-investment fund issuers and an
associated registration regime for online funding portals.
b. Start-Up Crowdfunding general and blanket orders - MB, QC, NB, NS - Proposal to introduce
new crowdfunding prospectus and registration exemptions for non-reporting issuers similar to
Saskatchewan’s existing regime
7. Crowdfunding – ON – Crowdfunding Prospectus Exemption and Crowdfunding Portal Requirements
8. Start-Up Crowdfunding (BC Notice 2014/03) - BC - introducing new crowdfunding prospectus and
registration exemptions for non-reporting issuers similar to Saskatchewan’s existing regime for
start-ups
For both the OM and the Crowdfunding exemptions, the regulators are going to decide on a final rule or
a second round of comments by summer of 2015. Additionally, two sets of changes to the prospectus
exemptions under National Instrument 45-106 were recently proposed.
With respect to the Accredited Investor and Minimum Investment Amount:
a new risk acknowledgement form for individual accredited investors that describes, in plain
language, the categories of individual accredited investor and identifies the key risks associated
with purchasing securities in the exempt market;
provide expanded guidance on the steps a seller should take to verify the status of purchasers
acquiring securities under prospectus exemptions, including the AI exemption; and
restrict the MA exemption to distributions to non-individual investors.
33 State of Mineral Finance 2015
March 1, 2015
The Minimum Investment Amount will have limited impact on the mining industry. The addition of an
additional risk acknowledgement form is duplicative considering most private placements subscription
agreements usually have an Investor Certificate of some form attached to them.8
Cooperative Capital Market Regulator – A Tool to Harmonize Regulations
The CCMR is a proposed capital markets regulator that has the potential (if all jurisdictions ‘opt-in’) to
harmonize securities regulations across Canada. The new regulator would be a single, operationally
independent, cooperative capital markets regulator that would administer provincial and federal
legislation, and a single set of regulations. It would create uniform provincial and territorial legislation
for each participating jurisdiction. Complementary federal legislation would be in place to address
criminal matters and matters relating to systemic risk in national capital markets and national data
collection.
Ontario, British Columbia and the federal government initiated the discussion and then Saskatchewan
and New Brunswick joined on July 9, 2014. Prince Edward Island was the last province to join on
September 30, 2014.
PDAC recommends that the participating jurisdictions design the CCMR’s regulations to:
1. Facilitate capital-raising from a broader base of investors to increase global competitiveness. In
order to achieve this recommendation, the PDAC strongly supports modernizing accredited
investor (AI) thresholds and standardizing key prospectus exemptions within the new regulatory
system.
2. Reduce regulatory burden and compliance costs in order to improve efficiency and
competitiveness. PDAC is calling for a simplified, proportional regime for smaller issuers that
eliminate onerous and unnecessary rules for junior exploration companies and other speculative
industries that depend on risk-tolerant capital.
3. Pursue a more effective enforcement regime to increase protection for investors. PDAC strongly
supports effective enforcement as a means to enhance investor confidence in capital markets,
as opposed to just adding more layers of regulation. PDAC is calling for a risk-based approach to
enforcement, with sufficient resources allocated to prosecuting criminals
PDAC has provided detailed comments on the consultation draft of Provincial Capital Markets Act
(PCMA) and the federal Capital Markets Stability Act (CMSA). You can find the submission published on
8 For a revised list of Exempt Market Review, see link
http://www.osc.gov.on.ca/documents/en/News/nr_20150219_family-friends-business-
backgrounder.pdf
Full text of the amendments can be found on link http://www.osc.gov.on.ca/documents/en/Securities-
Category4/ni_20150219_45-106_amendments.pdf
34 State of Mineral Finance 2015
March 1, 2015
the CCMR website: http://ccmr-ocrmc.ca/wp-content/uploads/com_20141208_draft-
legislation_prospectors-developers-association-of-canada.pdf
“The implementation of the Cooperative System will occur in several phases and the parties are working
collaboratively to achieve the agreed upon implementation milestones. These milestones include:
publishing draft initial regulations under the Provincial Capital Markets Act for public comment
by early spring 2015; and
enacting the Provincial Capital Markets Act and the federal Capital Markets Stability Act by June
30, 2015.
The governments are continuing this implementation work with a view to operationalizing the
Cooperative System by the fall of 2015.” Source: CCMR website http://ccmr-ocrmc.ca/
35 State of Mineral Finance 2015
March 1, 2015
Looking Ahead 2014 has come to a close and a new year has already begun. The mining industry, however, continues
to face the same financing challenges that it has faced for the last three years, rooted in macroeconomic
factors such as weak global demand and low commodity prices. Notwithstanding these challenges,
there are signs that the bottom may be near. 2015 may be a pivotal year for the juniors as companies
with low working capital are purchased by, or merge with, companies with high quality assets and
access to capital. In the most optimistic scenario, the industry will see an upward swing in 2016, if
current predictions for global economic growth hold.
As the industry goes through another cyclical downturn, there is also concern that a ‘structural shift’
may be unfolding at the same time that will have significant impacts on the mineral exploration
ecosystem that exists in Canada. This structural shift is a function of an aging retail investor community,
shifts in the broker/dealer landscape that will impact how risk capital flows into juniors, and reforms to
securities regulations that may allow more Canadians to invest in exploration. Industry associations like
the PDAC, along with its provincial and territorial counterparts, will continue work with their members
and stakeholders to navigate these structural and regulatory changes. Survival will require innovation
by both industry and government, from new financing models to securities reforms that facilitate access
to capital and reduce the costs of regulatory compliance.
Fiscal incentives and tax policy will continue to play a key role in attracting risk capital to the exploration
industry. In this regard, the data shows that the flow-through system has been crucial to sustaining
what little financing has taken place in this downturn. This type of innovation in financing has allowed
Canada to become a global mining finance hub, creating economic opportunities in urban centres as
well as the most remote parts of the country. If Canadian jurisdictions continue to support the industry
through sound fiscal policies and reforms to capital markets that have the interests of both investors
and issuers in mind, then the industry will likely be able to survive the current downturn, and witness
better days ahead.
36 State of Mineral Finance 2015
March 1, 2015
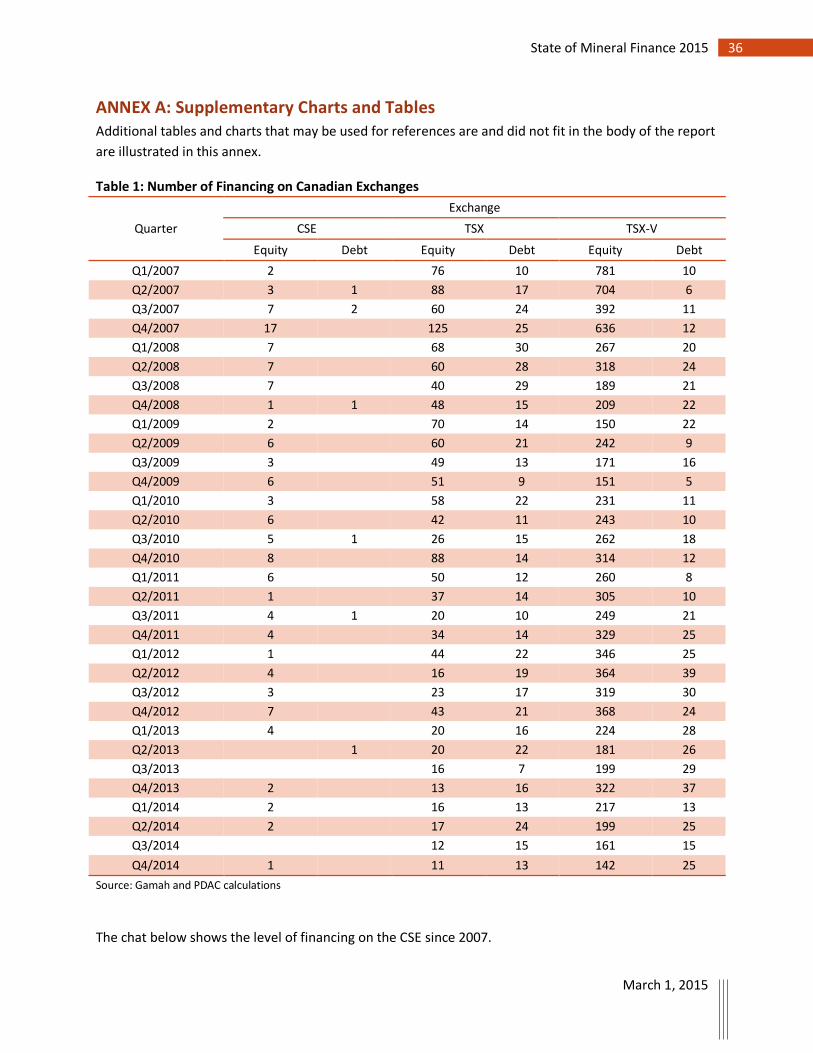
ANNEX A: Supplementary Charts and Tables Additional tables and charts that may be used for references are and did not fit in the body of the report
are illustrated in this annex.
Table 1: Number of Financing on Canadian Exchanges
Quarter
Exchange
CSE TSX TSX-V
Equity Debt Equity Debt Equity Debt
Q1/2007 2
76 10 781 10
Q2/2007 3 1 88 17 704 6
Q3/2007 7 2 60 24 392 11
Q4/2007 17 125 25 636 12
Q1/2008 7
68 30 267 20
Q2/2008 7 60 28 318 24
Q3/2008 7
40 29 189 21
Q4/2008 1 1 48 15 209 22
Q1/2009 2
70 14 150 22
Q2/2009 6 60 21 242 9
Q3/2009 3
49 13 171 16
Q4/2009 6 51 9 151 5
Q1/2010 3
58 22 231 11
Q2/2010 6 42 11 243 10
Q3/2010 5 1 26 15 262 18
Q4/2010 8 88 14 314 12
Q1/2011 6
50 12 260 8
Q2/2011 1 37 14 305 10
Q3/2011 4 1 20 10 249 21
Q4/2011 4 34 14 329 25
Q1/2012 1
44 22 346 25
Q2/2012 4 16 19 364 39
Q3/2012 3
23 17 319 30
Q4/2012 7 43 21 368 24
Q1/2013 4
20 16 224 28
Q2/2013 1 20 22 181 26
Q3/2013
16 7 199 29
Q4/2013 2 13 16 322 37
Q1/2014 2
16 13 217 13
Q2/2014 2 17 24 199 25
Q3/2014
12 15 161 15
Q4/2014 1 11 13 142 25
Source: Gamah and PDAC calculations
The chat below shows the level of financing on the CSE since 2007.
37 State of Mineral Finance 2015
March 1, 2015
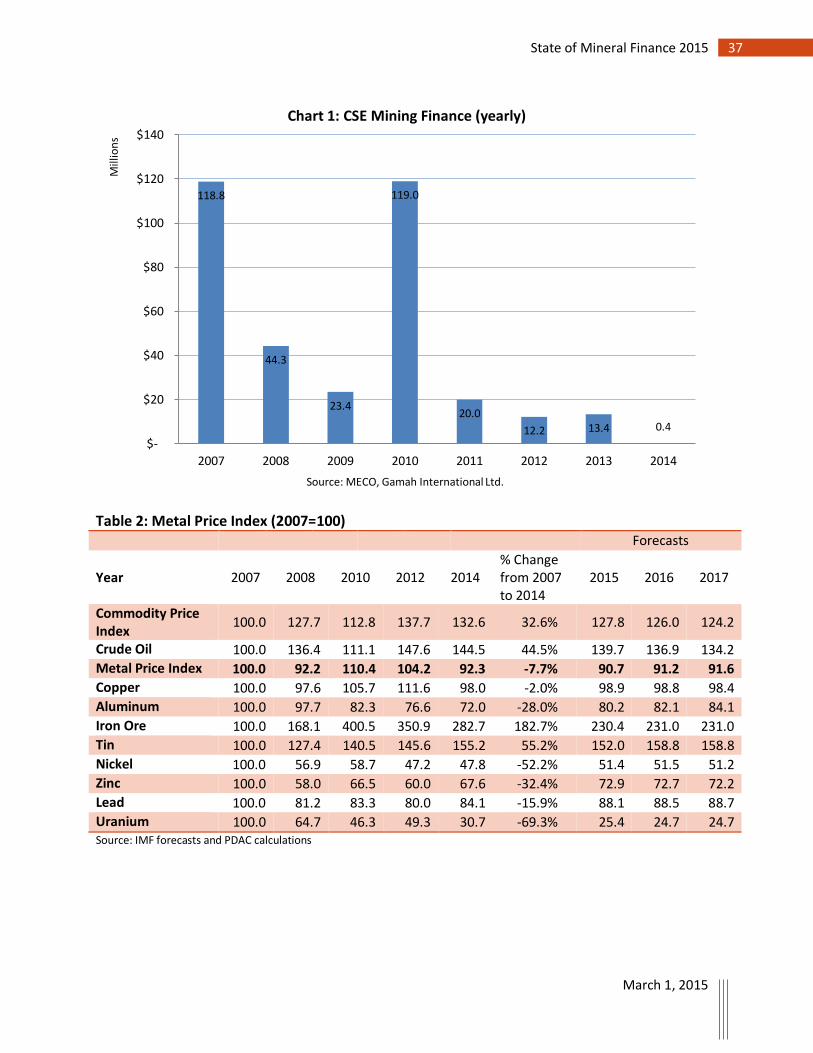
Table 2: Metal Price Index (2007=100) Forecasts
Year 2007 2008 2010 2012 2014 % Change from 2007 to 2014
2015 2016 2017
Commodity Price Index
100.0 127.7 112.8 137.7 132.6 32.6% 127.8 126.0 124.2
Crude Oil 100.0 136.4 111.1 147.6 144.5 44.5% 139.7 136.9 134.2
Metal Price Index 100.0 92.2 110.4 104.2 92.3 -7.7% 90.7 91.2 91.6
Copper 100.0 97.6 105.7 111.6 98.0 -2.0% 98.9 98.8 98.4
Aluminum 100.0 97.7 82.3 76.6 72.0 -28.0% 80.2 82.1 84.1
Iron Ore 100.0 168.1 400.5 350.9 282.7 182.7% 230.4 231.0 231.0
Tin 100.0 127.4 140.5 145.6 155.2 55.2% 152.0 158.8 158.8
Nickel 100.0 56.9 58.7 47.2 47.8 -52.2% 51.4 51.5 51.2
Zinc 100.0 58.0 66.5 60.0 67.6 -32.4% 72.9 72.7 72.2
Lead 100.0 81.2 83.3 80.0 84.1 -15.9% 88.1 88.5 88.7
Uranium 100.0 64.7 46.3 49.3 30.7 -69.3% 25.4 24.7 24.7 Source: IMF forecasts and PDAC calculations
118.8
44.3
23.4
119.0
20.0
12.2 13.4 0.4
$-
$20
$40
$60
$80
$100
$120
$140
2007 2008 2009 2010 2011 2012 2013 2014
Mill
ion
s
Source: MECO, Gamah International Ltd.
Chart 1: CSE Mining Finance (yearly)
38 State of Mineral Finance 2015
March 1, 2015
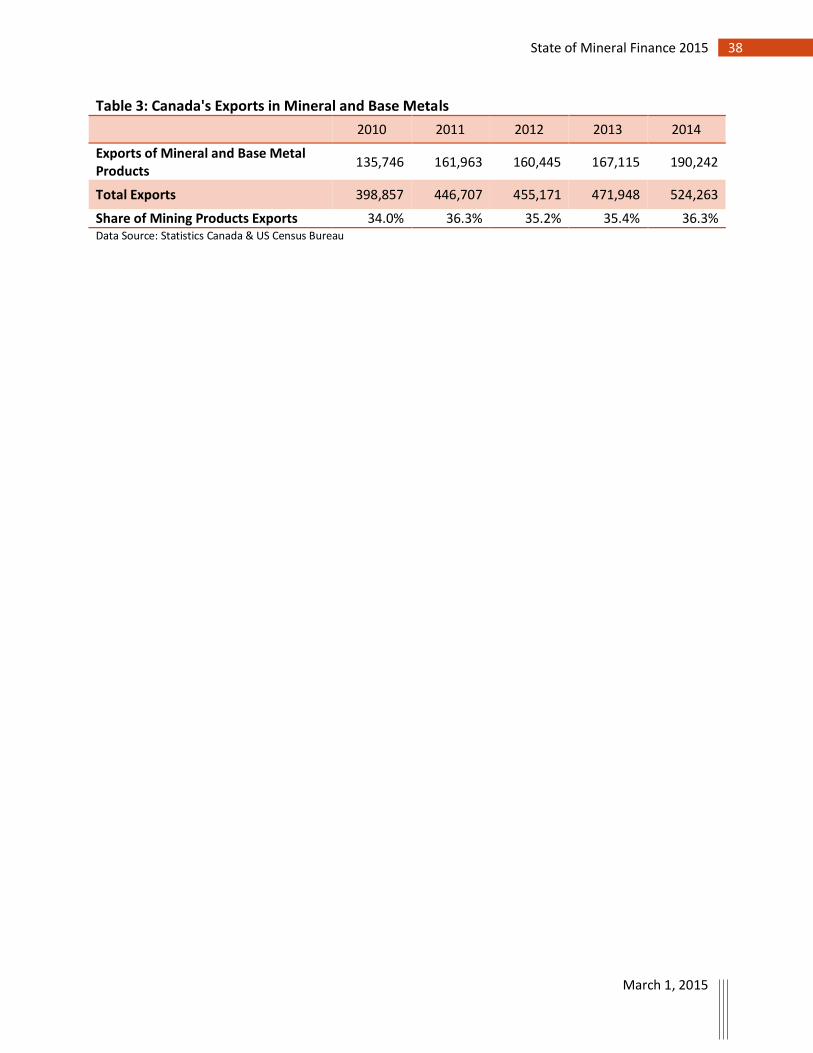
Table 3: Canada's Exports in Mineral and Base Metals
2010 2011 2012 2013 2014
Exports of Mineral and Base Metal Products
135,746 161,963 160,445 167,115 190,242
Total Exports 398,857 446,707 455,171 471,948 524,263
Share of Mining Products Exports 34.0% 36.3% 35.2% 35.4% 36.3% Data Source: Statistics Canada & US Census Bureau

39 State of Mineral Finance 2015
March 1, 2015