State Finance Audit Report, Government of Telangana - CAG
128
-
Upload
khangminh22 -
Category
Documents
-
view
0 -
download
0
Transcript of State Finance Audit Report, Government of Telangana - CAG


Report of the Comptroller and Auditor General of India
State Finances Audit Report for the year ended March 2019
Government of Telangana Report No. 4 of 2020


Particulars Reference to
Paragraph Page
Preface v
Executive Summary vii
Chapter – 1 Finances of the State Government
Gross State Domestic Product (GSDP) 1.1 1
Summary of Fiscal Transactions 1.2 1
Review of Fiscal Situation 1.3 4
Financial Resources of the State 1.4 10
Application of Resources 1.5 18
Government Assets 1.6 27
Government Liabilities 1.7 33
Fiscal Reform Path 1.8 42
Apportionment of Assets and Liabilities between Andhra
Pradesh and Telangana
1.9 43
Chapter – 2 Financial Management and Budgetary Control
Financial Accountability and Budget Management 2.1 45
Summary of Appropriation Accounts 2.2 46
Analysis of Expenditure 2.3 46
Supplementary Provisions 2.4 52
Re-appropriations 2.5 53
Rush of Expenditure 2.6 55
Advances from Contingency Fund 2.7 55
Review of selected Grants 2.8 56
Special Development Fund 2.9 58
Deficiencies in Budgeting 2.10 58
Chapter – 3 Financial Reporting
Personal Deposit Accounts 3.1 61
Opaqueness in Accounts 3.2 67
Compliance to Indian Government Accounting Standards 3.3 69
Submission of Annual Accounts by Autonomous Bodies 3.4 70
Submission of Utilisation Certificates 3.5 71
Table of Contents

Page | ii
Particulars Reference to
Paragraph Page
Submission of Detailed Contingent bills 3.6 72
Un-reconciled Receipts and Expenditure 3.7 73
Follow up action on Audit Reports 3.8 74

Page | iii
Appendices
Appendix
No.
Name of the Appendix Reference to
Paragraph Page
1.1 Profile of Telangana 77
1.2 Structure of Government Accounts and layout of
Finance Accounts
78
1.3 Abstract of Receipts and Disbursements in 2018-19 1.2 79
1.4 Time Series Data on State Government Finances 1.2 81
1.5 Composition and application of resources in the
Consolidated Fund of the State
1.2 84
1.6 Summarised financial position of the Government of
Telangana as on 31 March 2019
1.6 85
1.7 Summarised position of Apportionment of balances
between Andhra Pradesh and Telangana as on
31 March 2019
1.9 86
2.1 Top five Grants with high Savings and Excess
expenditure
2.3.2 87
2.2 Excess expenditure against amounts authorised by the
Legislature during the year
2.3.2.1 87
2.3 Cases of Expenditure incurred without approval of the
Legislature
2.3.2.1 88
2.4 Grants/Appropriations where saving was more than
₹100 crore each and more than 20 per cent of the total
provision
2.3.2.3 90
3.1 Cases where entire Receipts were booked under
omnibus Minor Head – 800 in 2018-19
3.2 92
3.2 Cases where almost entire expenditure booked under
omnibus Minor Head - 800 in 2018-19
3.2 92
3.3 Cases where more than 50 per cent of Receipts were
booked under omnibus Minor Head - 800 for the year
2018-19
3.2 93
3.4 Cases where more than 50 per cent of Expenditure was
booked under omnibus Minor Head - 800 for the year
2018-19
3.2 93
3.5 Statement of Un-reconciled Receipts of Telangana for
the year 2018-19
3.7 94
3.6 Statement of Un-reconciled Revenue Expenditure of
₹100 crore above for the year 2018-19
3.7 96
Glossary of Terms 97
Abbreviations 99


This Report has been prepared for submission to the Governor of Telangana under
Article 151 of the Constitution.
The State Finances Audit Report of Government of Telangana intends to assess
financial performance of the State during 2018-19 and to provide the State
Legislature with inputs based on audit analysis of financial data. The Report
attempts to analyse the financial performance against the targets envisaged by the
Telangana Fiscal Responsibility and Budget Management (Amendment) Act, 2016,
the Fourteenth Finance Commission Report and Budget Documents. This Report
contains three Chapters.
Chapter 1 is based on the Finance Accounts and makes an assessment of Telangana
Government’s fiscal position as on 31 March 2019. It provides an insight into the
trends in revenue, expenditure, repayment of debt and borrowing patterns.
Chapter 2 is based on Appropriation Accounts of Government of Telangana and
the manner in which the allocated resources were managed by the service delivery
Departments.
Chapter 3 is an inventory of Government of Telangana’s compliance to various
reporting requirements and financial rules.
An Entry Conference was held in January 2020 with Principal Secretary, Finance
Department, Government of Telangana wherein the issues taken up for review in the
State Finances Audit Report were discussed.
The audit has been conducted in conformity with the Auditing Standards issued by
the Comptroller and Auditor General of India.
Preface


Executive Summary Fiscal situation of the State
There has been an increase in growth of Revenue Receipts (RR) and Revenue
Expenditure(RE) during the years 2015-16 to 2018-19. As a percentage of Gross State
Domestic Product (GSDP), however, both RR and RE have decreased marginally in
2018-19. The growth rates of RR and RE have risen in 2018-19 and came close to the
growth rate of GSDP. Capital Expenditure (CE) has decreased in 2018-19 in comparison
to preceding year as well as in comparison to GSDP.
(Paragraph 1.2)
The State registered a Revenue Surplus of ₹4,337 crore. The Fiscal Deficit was
₹26,949 crore. Revenue Surplus, however, was overstated by ₹9,481.97 crore and Fiscal
Deficit was understated by ₹217.86 crore on account of misclassifications and
non-contribution to Statutory Funds. Effectively, there was a Revenue Deficit of
₹5,144.97 crore and a Fiscal Deficit of ₹27,166.86 crore.
The two important fiscal parameters were within the limits, viz., (i) Fiscal Deficit was
3.11 per cent of GSDP (₹8,65,688 crore) and within the limit of 3.25 per cent prescribed
by 14th Finance Commission (XIV FC) and 3.5 per cent target set out in Medium Term
Fiscal Policy Statement of the State Government as per FRBM Act; (ii) the total
outstanding liabilities (₹1,96,963 crore) were 22.75 per cent of the GSDP, which is within
the limit of 23.33 per cent prescribed by XIV FC and also within 25 per cent as targeted by
Medium Term Fiscal Policy Statement (MTFP) of the State Government.
Primary Deficit (₹14,363 crore), in 2018-19, has decreased by nine per cent in comparison
to preceding year (₹15,864 crore). Primary Deficit, though decreased, indicates that the
non-debt receipts were not sufficient to meet Primary Expenditure.
(Paragraph 1.3.1)
Mobilisation and application of Resources
Revenue Receipts (₹1,01,420 crore) in 2018-19 increased by ₹12,596 crore (14 per cent)
over 2017-18. They were, however, lower than the budget estimates by ₹29,555 crore
(23 per cent).
Revenue Expenditure (₹97,083 crore) in 2018-19 increased by ₹11,718 crore (14 per cent)
over 2017-18. It was, however, lower than the budget estimates by ₹28,372 crore
(23 per cent).
Capital Expenditure (₹22,641 crore) in 2018-19 decreased by ₹1,261 crore (five per cent)
in comparison to 2017-18, which was, however, lower than the budget estimates by
₹10,728 crore (32 per cent).
Recommendation: The Finance Department should rationalise the budget preparation
exercise, so that the gap between the budget estimates and actuals is minimised.
(Paragraphs 1.2 and 1.3.2)

State Finances Audit Report for the year ended March 2019
Page | viii
Summary of important audit findings and recommendations
Efficiency in Tax Collection
The efficiency in collection (measured in terms of cost of collection as a percentage of the
Gross Revenue collection) of major taxes of the State remained almost constant compared
to previous year in respect of Taxes on Vehicles, Stamps and Registration Fees, while there
was improvement in efficiency in respect of Taxes on Sales, Trade etc., State Goods and
Services Tax and State Excise.
(Paragraph 1.4.2.2)
Committed Expenditure
The burden of committed expenditure measured as a percentage of Revenue Expenditure
of the State, which was steadily rising during the previous years has declined by
six per cent from 61 per cent of Revenue Expenditure in 2017-18 to 55 per cent in
2018-19.
There was increase in interest payments (16 per cent), subsidies (two per cent) and salaries
(1.5 per cent). Pension payments, on the other hand, decreased by four per cent. Greater
reliance on market borrowings by the Government in the recent years has led to increase in
liabilities on account of interest payments.
(Paragraph 1.5.2.1)
Adequacy of public expenditure
Telangana focussed more on Development Expenditure (₹93,483 crore) and Capital
Expenditure (₹22,641 crore). The focus of Government on Education was comparatively
lesser across the years.
(Paragraph 1.5.4.1)
Per Capita expenditure in some major socio economic sectors
The Agriculture got the top priority with 97.82 per cent increase in Per Capita expenditure
over previous year due to a new Investment Support Scheme (Rythu Bandhu). There was a
considerable increase (12.41 per cent) on Health and Family Welfare over previous year.
There was a considerable dip in the Per Capita expenditure in respect of Transport
(14.32 per cent) and Education, Sports, Arts and Culture (6.19 per cent).
(Paragraph 1.5.4.2)
National Pension System
There was an overall shortfall in contribution by Government to a tune of ₹57.50 crore as
compared to contribution by the employees during the last five years. As a result, the
current liability of the Government stands deferred to future years.
An amount of ₹1,445.14 crore (inclusive of all receipts, apportionment amount and opening
balance) was received into NPS deposit account, out of which the Government transferred
an amount of ₹1,171.58 crore to National Securities Depository Limited (NSDL), leaving
a closing balance of ₹273.57 crore in the NPS Deposit Account.

Executive Summary
Page | ix
An amount of ₹730.64 crore available under National Pension System (NPS) deposit
account i.e., Defined Contributory Pension Fund as of 01 April 2018 was to be apportioned
between Andhra Pradesh and Telangana. Out of this, an amount of ₹365.21 crore was
apportioned in 2018-19 between the two States and Telangana received ₹134.60 crore. An
amount of ₹365.43 crore was yet to be apportioned.
Thus, the State Government has created an interest liability on the amount of ₹331.07 crore
(which is the total of ₹273.57 crore, the amount not transferred to NSDL and ₹57.50 crore,
the overall short contribution by the Government over five years), incorrectly used the
funds that belong to its employees and created uncertainty in respect of benefits due to the
employees affected / avoidable financial liability to Government in future, and, thus leading
to possible failure of the scheme itself.
(Paragraph 1.5.2.4)
Capital Outlays: Incomplete Projects
The State Government has spent ₹1,01,877 crore on capital projects during the years
2014-19. Within the capital projects, the major share of the Capital Expenditure was on
Irrigation and Flood Control. Delays in completion of projects, however, not only adversely
affected the quality of the expenditure but also deprived the State of the intended benefits
and economic growth. Out of 26 ongoing projects, 20 projects were delayed with delays
ranging from three months to 11 years and led to escalation of projected cost to ₹1,87,848
crore. An amount of ₹1,00,494 crore was already spent on these incomplete projects so far.
The State Government did not disclose the financial results of any of the Irrigation projects.
Recommendation: State Government may compile working results of Major Irrigation
Projects to assess benefits from persistent heavy investments in Irrigation sector. These
working results would guide future investments in the sector.
(Paragraph 1.6.1)
Investments
As of 31 March 2019, the State Government’s investment in Statutory Corporations,
Government Companies, Joint Stock Companies and Co-operatives stood at
₹19,754 crore. The Return on Investment (RoI) from Corporations / Companies was low at
0.48 per cent while the average rate of interest on Government borrowings was
6.93 per cent.
(Paragraph 1.6.2)
Loans and Advances given by the State Government
As of 31 March 2019, Loans and Advances given by the Government to Autonomous
Bodies, Corporations etc., were ₹24,509 crore. While the average rate of interest payments
as a percentage of outstanding liabilities is 6.39 per cent, the interest receipts as a
percentage of outstanding Loans and Advances was only 0.03 per cent.
Out of ₹24,509 crore loans provided, 28 per cent i.e., ₹6,920 crore were provided
to Autonomous Bodies without definite stream of revenues of their own for debt servicing.
Thus, such Loans do not indicate real worth of Government assets.

State Finances Audit Report for the year ended March 2019
Page | x
Government provided loans (₹5,932.30 crore) to Hyderabad Metropolitan Water Supply
and Sewerage Board, whose annual accounts were in arrears from 2010-11. Government
also gave fresh loans of ₹1,083.32 crore to three autonomous bodies for servicing their past
loans.
The current level of recovery of loans was very low. In the Budget estimates, an amount of
₹7,807 crore was estimated to be recovered in 2018-19. The actual recovery (₹66 crore),
however, was only 0.85 per cent of the estimated recovery.
Recommendation: The State Government may place on record debt servicing capacity of
the institutions before providing loans.
(Paragraph 1.6.3)
Ways and Means Advances
State Government maintained the mandatory minimum daily cash balance of ₹1.38 crore
with RBI for only 197 days during the year. The State Government depended on Special
Drawing Facility (for 168 days: ₹5,606.47 crore), Ways And Means Advances
(for 135 days: ₹13,616.88 crore) and Over Draft (for 32 days: ₹2,599.92 crore) for
maintaining the minimum balance with RBI. In monetary terms, however, SDF / WMA /
OD decreased by ₹1,099 crore (five per cent decrease) in 2018-19 over 2017-18. However,
it still indicates increasing dependency of Government on WMA. The interest payment on
WMA (including SDF and OD) during 2018-19 was ₹15.44 crore as against ₹13.82 crore
in 2017-18, i.e., 12 per cent increase.
(Paragraph 1.6.4)
Contribution to Reserve Funds
State Government was to contribute ₹829.25 crore to the Consolidated Sinking Fund (CSF)
in 2018-19. The contribution of State Government in 2018-19 was ₹500 crore. Further the
interest earned on the investment from CSF was ₹352.31 crore. Thus, the total addition to
CSF during the year was ₹852.31 crore.
The shortfall in contribution to Guarantee Redemption Fund (GRF) in the year 2018-19
was ₹188.56 crore. The State Government did not contribute in 2016-17 and 2017-18,
though, it contributed ₹83.94 crore in 2015-16. The total available balance (₹837.69 crore)
in GRF as of March 2019 was only 1.08 per cent of the outstanding amount of guarantees
(₹77,713 crore) as against the target of three per cent.
(Paragraph 1.7.1)
Guarantees
Guarantees (₹77,713 crore) given by the Government to the end of 2018-19 stood at
87 per cent of total Revenue Receipts of the preceding year (₹88,824 crore) and was within
the ceiling of 90 per cent. It was noted that the State Government was extending Guarantees
to bodies that had not finalised their accounts.

Executive Summary
Page | xi
Out of the total loans guaranteed by the Government, 65 per cent pertained to two Special
Purpose Vehicles viz., (i) Telangana Drinking Water Supply Corporation for
implementation of a flagship project: Mission Bhagiratha and (ii) Kaleshwaram Irrigation
Project Corporation Limited for implementation of Kaleshwaram Project.
Guarantee Commission of ₹388.56 crore was to be received by the Government to the end
of March 2019 from 26 institutions to which Guarantees of ₹77,713 crore were provided.
Guarantee commission of ₹340 crore was, however, received from only one institution viz.,
Telangana State Water Resources Infrastructure Development Corporation Limited
(TSWRIDCL). This was much higher than the Guarantee Commission actually receivable
from TSWRIDCL on the outstanding guarantees of ₹4,141 crore.
(Paragraph 1.7.2)
Debt Management
Outstanding Public Debt (₹1,65,164 crore) increased by 16 per cent in 2018-19 over the
preceding year, at a slightly higher pace than growth of GSDP. Interest payments are
increasingly consuming Revenue Receipts. Interest payments relative to Revenue Receipts
were much higher at 12.41 per cent against the target of 8.37 per cent fixed by XIV Finance
Commission.
Net Availability of Borrowed Funds (NABF) indicate the amount that can be utilised by
Government for its activities after payment of interests and repayment of borrowings.
There was a decrease (₹3,553 crore) in NABF despite higher market borrowings
(₹2,908 crore) in comparison to 2017-18 (₹26,231 crore) on account of higher interest
payments (₹1,750 crore) and higher principal repayments (₹12,877 crore).
The difference between real growth rate and real interest rate i.e., Domar gap is positive
during the period from 2015-16 to 2018-19. Therefore, as per Domar model, the Public
Debt is stated to be stable. It is, however noteworthy that the Domar gap has been
registering a decreasing trend. Moreover, other factors such as public liabilities and force
majeure events have to be reckoned in assessing debt sustainability / stability of the State.
The maturity profile of outstanding public debt as of March 2019 showed that 46 per cent
(₹76,262 crore) of total outstanding public debt is to be repaid over the next seven years.
(Paragraph 1.7.3)
Fiscal Reform Path
State Government (combined State), in compliance with the recommendations of the
XII Finance Commission (XII FC), enacted the Fiscal Responsibility and Budget
Management (FRBM) Act, 2005 (amended in 2016).
FRBM Act, 2005 also requires the State Government to make disclosures and statements
under Section 10 of FRBM Act, 2005 together with Rule 6 of Fiscal Responsibility and
Budget Management Rules, 2006. The State Government, however, did not make four out
of ten disclosures required to be made.
(Paragraph 1.8)

State Finances Audit Report for the year ended March 2019
Page | xii
Apportionment of Assets and Liabilities between Andhra Pradesh and Telangana
An amount of ₹1,51,349.67 crore under Capital Heads, ₹28,099.69 crore under Loans and
Advances, ₹4,474.04 crore under Deposits and Advances, ₹238 crore under Suspense and
Miscellaneous and ₹310.24 crore under Remittances was yet to be apportioned between
Andhra Pradesh and Telangana even after more than five years of State Re-organisation.
(Paragraph 1.9)
Excess expenditure
Excess expenditure of ₹29,133.69 crore was incurred in seven Grants and two
Appropriations. A total expenditure of ₹3,507.17 crore was incurred at sub-head level
without any budget provision in 34 cases. Persistent Excess expenditure occurred in Fiscal
Administration, Planning, Surveys and Statistics and Home Administration Grants.
This is in violation of Article 204 of the Constitution which provides that no money shall
be withdrawn from the Consolidated Fund except under appropriation by Law by the State
Legislature. This vitiates the system of budgetary and financial control and encourages
financial indiscipline in management of public resources.
Recommendation: Finance Department should ensure that no expenditure is incurred
without budget provision or in excess to what has been passed by the Legislature.
Government may analyse the reasons for persistent Excess expenditure, placing Grant IX
– Fiscal Administration on priority.
(Paragraph 2.3.2.1)
Excess expenditure requiring regularisation
As per Article 205 of the Constitution of India, it is mandatory for a State Government to
get Excess expenditure over a Grant / Appropriation regularised by the State Legislature.
State Government did not get the Excess expenditure of ₹55,517.30 crore, over and above
the allocation pertaining to the years 2014-15 to 2017-18, regularised.
Recommendation: All the existing cases of Excess expenditure need to be regularised on
priority. State Government may place a mechanism to check Excess expenditures which did
not have the vote of State Legislature.
(Paragraph 2.3.2.2)
Savings
In the year 2018-19, the total savings were ₹66,614 crore, of which, ₹61,856 crore
(93 per cent) pertain to 39 Grants with savings of more than ₹100 crore each and by more
than 20 per cent of the total provision. In addition, during the years 2014-19, there were
six Grants with persistent savings of more than ₹1,000 crore in each year.
Persistent Savings indicate that the schemes under these Grants did not receive the required
priority by the Government or there was inefficiency in implementation by the Departments
concerned / implementing agencies or both.
(Paragraph 2.3.2.3)

Executive Summary
Page | xiii
Re-appropriations
Re-appropriations are meant for transfer of saving in one scheme / unit to another within
the same Grant and under same section (i.e., Capital, Revenue or Loans). Finance
Department, however, issued re-appropriation orders to mainly withdraw the budget
provisions, on the last day of the financial year. There were several deficiencies in
Re-appropriations like decrease of provisions in cases of Excess expenditures,
augmentation of provision in cases of savings, issuing orders for withdrawing of entire
provision whilst incurring full expenditure, issue of Re-appropriation orders without budget
provisions, orders of withdrawing the provision of charged expenditure, unnecessary
re-appropriation etc.
Recommendation: By leveraging advancements in Information Technology, the State
Government may issue Re-appropriation orders on the basis of real-time data so that the
funds are utilised in an optimum manner.
(Paragraph 2.5)
Rush of Expenditure
During 2018-19, out of the total expenditure of ₹1,61,570.20 crore, an amount of
₹55,077.98 crore (34.09 per cent) was spent in the last quarter of the financial year.
However, it was observed that an amount of ₹50,179.11 crore (32.92 per cent of the total
receipts of ₹1,52,447.94 crore) was received during the last quarter only. The expenditure
during the last quarter this year was higher by 6.03 percentage points in comparison to
2017-18 when the expenditure during the last quarter was ₹41,848.98 crore (28.06 per cent
of the total expenditure of ₹1,49,127.91 crore).
A Budget Provision of ₹2,400 crore was allocated under 4801 - Capital Outlay on Power
Projects. Out of this, expenditure of ₹1,800 crore (75 per cent) was incurred in the month
of March 2019.
(Paragraph 2.6)
Advances from Contingency Fund
An amount of ₹17.18 crore was sanctioned as advance from Contingency Fund, out of
which an expenditure of ₹15.96 crore was incurred towards decretal charges and to deposit
amounts in different courts in connection with acquisition of lands for various
developmental activities of the Government. No expenditure was incurred in respect of
₹1.21 crore. In respect of ₹0.01 crore, neither expenditure was incurred, nor recoupment
took place. On the whole, an amount of ₹15.07 crore only was recouped back to
Contingency Fund. This indicates that the advances from Contingency Fund were not
drawn with due diligence; were not spent after drawal; and were not fully recouped within
the financial year.
(Paragraph 2.7)
Personal Deposit (PD) Accounts
The State Government reported that 182 accounts fall under the definition of Personal
Deposit (PD) Accounts. This was at variance with the number of PD accounts reported in
earlier years (28,674 in 2017-18 and 28,087 in 2016-17). The proliferation of number of

State Finances Audit Report for the year ended March 2019
Page | xiv
PD accounts in earlier years was owing to absence of unique ID to PD Administrators,
considering all the Deposit Accounts operated by each Designated Drawing Officers as a
separate PD account. Out of the 13,396 Category ‘C’ Deposit Accounts, all the test checked
accounts (52) were operated as PD accounts at field level. Hence, the number of PD
accounts reported as 182 was at variance with the situation at field level.
Amounts of ₹3,576 crore and ₹4,946 crore were transferred to Category ‘C’ Deposit
Accounts in the months of March 2018 and March 2019 respectively, indicating that the
PD accounts were being utilised for transfer of funds at the fag end of financial year to
avoid lapse of budget.
PD Administrators in respect of seven test checked cases deposited an amount of ₹721.36
crore in Current Account / Savings Bank Account / Fixed Deposit Receipt account.
Unspent balances in respect of seven cases amounting to ₹467.38 crore in Category ‘C’
Deposit accounts pertaining to 2018-19, which should have been lapsed in view of the spirit
of Budget Manual, Financial Code were not lapsed. Unspent balances in respect of five
test checked cases amounting ₹309.64 crore pertaining to earlier financial years (i.e., 2016-17 and 2017-18), which were to be lapsed as per Government Orders (April 2000) were not lapsed to the Government account at the end of 2018-19.
As per the information furnished by Directorate of Treasuries and Accounts, amounts of
₹321 crore and ₹2,606 crore were lapsed and credited to Government account as Revenue
Receipts in March 2018 and March 2019 respectively, instead of as minus debit to the
corresponding service Head of Account, resulting in overstatement of both Receipts and
Expenditure.
Out of the 125 PD accounts reported to be in operation, there was no expenditure in respect
of 76 accounts; no receipts in 40 accounts; and no balance in respect of 12 accounts.
Recommendation: Government may consider assigning a Unique ID to each PD
Administrator. Government may review its orders of April 2000 to align them with Budget
Manual and Financial Code. State Government may review Category ‘C’ Deposit Accounts
being operated as PD accounts and bring them under the relevant Head of Account. State
Government may also initiate action to close the inoperative PD accounts.
(Paragraph 3.1)
Submission of Annual Accounts by Autonomous Bodies
None of the 24 Autonomous Bodies, which were to submit their Annual Accounts for
certification to Comptroller and Auditor General of India submitted their Annual Accounts
in time. There were delays ranging from one to nine years in submission of accounts.
Hyderabad Metropolitan Water Supply and Sewerage Board (HMWSSB) did not submit
annual accounts from 2010-11 onwards. Despite non-rendering of accounts for nine years,
the Government has been providing Loans and Guarantees to HMWSSB. The State
Government has provided ₹874.80 crore as Loans to HMWSSB in 2018-19 alone. The total
Loans outstanding as of March 2019 stood at ₹5,932.30 crore. Further, the value of
Guarantees given by State Government to HMWSSB also increased from ₹3,399 crore
(March 2018) to ₹3,487 crore (March 2019).

Executive Summary
Page | xv
Metropolitan Legal Services Authority and Telangana State Group Life Insurance did not
submit even their first Annual Accounts since 2010-11 and 2014-15 respectively, as of
December 2019.
(Paragraph 3.4)
Submission of Detailed Contingent bills
Detailed Contingent bills (2,969) of funds drawn for items of contingent nature were not
submitted for ₹340.39 crore, in the absence of which there was no assurance that the money
was spent for purpose for which they were drawn. Out of the above, 1,651 bills worth
₹193.54 crore pertain to only three Departments. Further, there were 365 AC bills
amounting to ₹30.12 crore pertaining to the period prior to bifurcation of the State.
Advances drawn and not accounted for increases the possibility of wastage /
mis-appropriation / malfeasance etc.
(Paragraph 3.6)


Chapter 1 Finances of the State Government
This Chapter provides an audit perspective on the finances of the State Government during
2018-19 and analyses changes in major fiscal aggregates relative to 2017-18 keeping in
view overall trends during the preceding four years.
The analysis is based on the details contained in the Finance Accounts of Government of
Telangana. A profile of the State with demographic and other details is in
Appendix 1.1. The structure of the Government Accounts is explained in Part A and the
layout of the Finance Accounts in Part B of Appendix 1.2.
1.1 Gross State Domestic Product (GSDP)
The Gross State Domestic Product (GSDP)1 of Telangana in 2018-19 at current prices was
₹8,65,688 crore. The trends in annual growth of Gross Domestic Product (GDP) of India
and GSDP of the State at current prices and constant prices (Base year: 2011-12) are given
in Table 1.1. Growth of GSDP in Telangana was higher than the all-India average at both
current and constant prices.
Table 1.1: GDP of India and GSDP of the State
Year 2015-16
(TRE)
2016-17
(SRE)
2017-18
(FRE)
2018-19
(AE)
Current Prices
India’s GDP (₹ in crore) 1,37,71,874 1,53,62,386 1,70,95,005 1,90,10,164
Growth rate of GDP (per cent) 10.5 11.5 11.3 11.2
State’s GSDP (₹ in crore) 5,77,902 6,59,033 7,53,811 8,65,688
Growth rate of GSDP (per cent) 14.24 14.04 14.38 14.84
Constant Prices (Base year – 2011-12)
India’s GDP (₹ in crore) 1,13,69,493 1,22,98,327 1,31,79,857 1,40,77,586
Growth rate of GDP (per cent) 8.0 8.2 7.2 6.8
State’s GSDP (₹ in crore) 4,64,542 5,08,156 5,59,750 6,18,544
Growth rate of GSDP (per cent) 11.58 9.39 10.15 10.50
Source: Ministry of Statistics and Programme Implementation (figures as on 01 August 2019 and
02 September 2019 for GDP); TRE: Third Revised Estimates; SRE: Second Revised Estimates; FRE: First
Revised Estimates; AE: Advance Estimates
1.2 Summary of Fiscal Transactions
Table 1.2 presents the summary of fiscal transactions of State Government during
2018-19 vis-à-vis 2017-18 and 2016-17. Further details of receipts and disbursements as
well as overall fiscal position during 2018-19 are given in Appendix 1.3. Time series data
of Government Finances for the years 2014-19 are given in Appendix 1.4.
1 Gross Domestic Product (GDP) and Gross State Domestic Product (GSDP) refers to the market value of
all officially recognised final goods and services produced within the Country and the State respectively
in a given period of time, accounted without duplication and are an important indicator of the Country
and State’s economy.

State Finances Audit Report for the year ended March 2019
Page | 2
Table 1.2: Summary of Fiscal Transactions in 2016-19
(₹ in crore)
Receipts Disbursements
2016-17 2017-18 2018-19 2016-17 2017-18 2018-19
Section A – Revenue Account2
Tax Revenue 48,408 56,520 64,674 General Services 25,125 30,872 34,199
Non-Tax Revenue 9,782 7,825 10,007 Social Services 35,286 37,260 39,721
Share of Union
Taxes/Duties
14,876 16,420 18,561 Economic
Services
20,949 17,200 23,158
Grants from
Government of
India
9,752 8,059 8,178 Grants-in-Aid
and
Contributions
72 33 5
Total Revenue
Receipts
82,818 88,824 1,01,420 Total Revenue
Expenditure
81,432 85,365 97,083
Section B – Capital Account3 and Others
Miscellaneous
Capital Receipts
-- -- --- Capital
Expenditure
33,371 23,902 22,641
Recoveries of
Loans and
Advances
156 138 66 Loans and
Advances
disbursed
3,402 6,209 8,706
Public Debt4
Receipts*
44,819 49,153 50,962 Repayment of
Public Debt*
15,568 27,471 28,716
Net of inter-state
Settlement5
-- -- --- Net of inter-state
Settlement
50 186 5
Contingency Fund -- -- 0.09 Contingency
Fund
0.09 -- 2.10
Public Account
Receipts
1,09,094 1,06,511 1,14,152 Public Account
Disbursements
1,05,368 98,664 1,09,222
Opening Cash
Balance
6,468 4,164 6,993 Closing Cash
Balance
4,164 6,993 7,218
Grand Total 2,43,355 2,48,790 2,73,593 Grand Total 2,43,355 2,48,790 2,73,593
Source: Finance Accounts
* excluding Ways and Means Advances6, Public Debt receipts are ₹32,731 crore in 2016-17,
₹26,231 crore in 2017-18 and ₹29,139 crore in 2018-19; Repayment of Public Debt was ₹3,480 crore in
2016-17, ₹4,549 crore in 2017-18 and ₹6,893 crore in 2018-19
2 Revenue Account is the account of the current income and expenditure of the State. The income is
derived mainly from taxes and duties, fees for services rendered, fines and penalties, revenue from
Government estates such as forests and other miscellaneous items 3 Capital Account is the account of expenditure of a capital nature such as construction of buildings, laying
of roads, irrigation and electricity projects. Such expenditure is met from sources other than current
revenues, e.g. loans, surplus revenue of previous years, if any, and capital receipts. Capital Receipts
include Miscellaneous Capital Receipts, Recoveries of Loans and Advances etc. 4 Public Debt comprises loans raised by Government such as market loans, loans from the Life Insurance
Corporation of India, etc., and loans and advances from the Central Government 5 Inter-State Settlement is intended to provide for the accounting of sums due by one State Government to
another under the financial settlement, on the setting up of new States or under the States’ Reorganisation
Acts as well as the financial settlement between the centre and foreign countries 6 Ways and Means Advances are temporary advances extended by RBI to the Government. These are
meant to bridge the gap between expenditure and receipts. They are not a source of finance but are meant
to provide support, for purely temporary difficulties that arise on account of mismatch/shortfall
in revenue or other receipts for meeting Government liabilities

Chapter I – Finances of the State Government
Page | 3
Composition and application of resources of the Consolidated Fund of the State in the year
2018-19 is given in Appendix 1.5.
The trends of Revenue Receipts (RR) / Revenue Expenditure (RE) / Capital
Expenditure(CE) relative to GSDP at current as well as constant prices7 are given in
Table 1.3.
Table 1.3: Trends in RR / RE / CE relative to GSDP
Particulars 2015-16 2016-17 2017-18 2018-19
Gross State Domestic Product at current prices 5,77,902 6,59,033 7,53,811 8,65,688
Revenue Receipts (RR) relative to GSDP
RR at current prices (₹ in crore) 76,134 82,818 88,824 1,01,420
Rate of growth of RR at current prices (per cent) * 8.78 7.25 14.18
RR at constant prices (₹ in crore) 61,200 63,858 65,957 72,466
Rate of growth of RR at constant prices (per cent) * 4.34 3.29 9.87
RR/GSDP 13.17 12.57 11.78 11.72
Revenue Expenditure (RE) relative to GSDP
RE at current prices (₹ in crore) 75,896 81,432 85,365 97,083
Rate of growth of RE at current prices (per cent) * 7.29 4.83 13.73
RE at constant prices (₹ in crore) 61,008 62,789 63,389 69,367
Rate of growth of RE at constant prices (per cent) * 2.92 0.95 9.43
RE/GSDP 13.13 12.36 11.32 11.21
Capital Expenditure (CE) relative to GSDP
CE at current prices (₹ in crore) 13,590 33,371 23,902 22,641
Rate of growth of CE at current prices (per cent) * 145.56 (-) 28.37 (-)5.28
CE at constant prices (₹ in crore) 10,924 25,731 17,749 16,177
Rate of growth of CE at constant prices (per cent) * 135.54 -31.02 -8.85
CE/GSDP 2.35 5.06 3.17 2.62
Source: Finance Accounts and GSDP data from MoSPI (figures as on 01 August 2019) of respective years
* Not compared with 2014-2015, as figures for 2014-15 are for only 10 months (due to bifurcation of
Andhra Pradesh State (combined) after 2 June 2014)
From the above table the following can be observed:
• While the GSDP at current prices was growing at a rate of more than 14 per cent from
2015-16 to 2018-19, the growth rates of Revenue Receipts and Revenue Expenditure
was much lower in comparison to growth rate of GSDP in earlier years. However,
the growth rates of both Revenue Receipts and Revenue Expenditure have risen in
2018-19 and came closer to the growth rate of GSDP.
• In comparison to 2015-16, the GSDP in 2018-19 has increased by
49.80 per cent, whereas the Revenue Receipts and Revenue Expenditure increased
by 33.21 per cent and 27.91 per cent respectively.
• Both Revenue Receipts and Revenue Expenditure decreased marginally in 2018-19
as a percentage of GSDP.
• Capital Expenditure in 2018-19 has decreased in comparison to preceding year
2017-18 as well in comparison to GSDP.
7 Constant prices figures for Revenue Receipts, Revenue Expenditure and Capital Expenditure are arrived
by using a deflator i.e., ratio of GSDP at constant prices to GSDP at current prices for each year

State Finances Audit Report for the year ended March 2019
Page | 4
1.3 Review of Fiscal Situation
1.3.1 Fiscal parameters
Three key fiscal parameters viz., (i) Revenue Surplus8 / Deficit, (ii) Fiscal Deficit9 and
(iii) Primary Deficit10 help in assessing the fiscal situation of the Government. The way
these deficits are financed assists in assessing the fiscal health of the Government. Trends
in fiscal parameters (Chart 1.1 and Chart 1.2) as per Finance Accounts indicate that the
State’s performance in 2018-19 had marginally improved over the preceding year. On the
other hand, trends in Debt Sustainability i.e., Debt as a percentage in GSDP has increased
(Chart 1.3) as compared to preceding year.
Chart 1.1: Trends of fiscal parameters Chart 1.2: Fiscal parameters vis a vis GSDP
Chart 1.3: Debt Sustainability (i.e., debt to GSDP ratio)
• Revenue Surplus (₹4,337 crore) of the
State in 2018-19 increased over
previous year by ₹878 crore as per
Finance Accounts. Further, there was
an increase in the ratio of Revenue
Surplus as a percentage of Revenue
Receipts from 3.89 per cent in 2017-18
to 4.28 per cent in 2018-19.
Source: Finance Accounts
• Fiscal Deficit (₹26,949 crore), in 2018-19, has increased by ₹249 crore in comparison
to preceding year (₹26,700 crore). Fiscal Deficit as a percentage of GSDP was
3.11 per cent, which is within the ceiling of 3.25 per cent11 fixed by XIV Finance
Commission and 3.5 per cent target set out in Medium Term Fiscal Policy Statement
of the State Government as per FRBM Act.
8 Revenue Surplus = Revenue Receipts (-) Revenue Expenditure 9 Fiscal Deficit = Revenue Expenditure + Capital Expenditure + Net Loans and Advances (-) Revenue
Receipts (-) Miscellaneous Capital Receipts 10 Primary Deficit = Fiscal Deficit (-) interest payments 11 Ministry of Finance, Department of Expenditure letter No.F.No.40(6)/PF-S/2017-18,
dated 11 September 2018
369 238 1,386 3,459 4,337
-9,410
-18,856
-35,281
-26,700
-26,949
-4,183
-11,298
-26,672
-15,864
-14,363
-40,000
-35,000
-30,000
-25,000
-20,000
-15,000
-10,000
-5,000
-
5,000
10,000
2014-15 2015-16 2016-17 2017-18 2018-19
₹ i
n c
rore
Revenue Surplus Fiscal Deficit
Primary Deficit
0.07 0.040.21 0.46
0.5
-1.86
-3.26
-5.35
-3.54 -3.11
-0.83
-1.96
-4.05
-2.1 -1.66
-6
-5
-4
-3
-2
-1
0
1
2014-15 2015-16 2016-17 2017-18 2018-19
in p
er c
ent
Revenue Surplus Fiscal Deficit
Primary Deficit
15.7916.96
20.44
22.0022.75
14
16
18
20
22
24
2014-15 2015-16 2016-17 2017-18 2018-19
in p
er c
ent

Chapter I – Finances of the State Government
Page | 5
Fiscal Deficit position improved over previous year mainly due to decrease in Capital
Expenditure by ₹1,261 crore.
• Primary Deficit (₹14,363 crore) in 2018-19 decreased by nine per cent in comparison
to preceding year (₹15,864 crore). Though Primary Deficit, decreased, the non-debt
receipts12 (₹1,01,486 crore) were, however, not sufficient to meet Primary
Expenditure13 (₹1,15,849 crore).
• As per XIV Finance Commission recommendations, the total outstanding Debt14 to
GSDP ratio (in per cent) was to be less than 23.33 per cent for the year 2018-19. As
per Medium Term Fiscal Policy Statement (MTFP) of the State Government, the total
outstanding liabilities were to be less than 25 per cent of the GSDP. In 2018-19, the
total outstanding liabilities (₹1,96,963 crore) of Telangana were 22.75 per cent of the
GSDP, which is within the ceilings of both XIV Finance Commission and MTFP
Statement. The outstanding liabilities, however, grew by 19 per cent over the previous
year, indicating that the growth rate of liabilities was higher than growth rate of GSDP.
Impact on Revenue Surplus of State Government consequent to the incorrect / inadequate
bookings is given in Table 1.4:
Table 1.4: Impact on Revenue Surplus and Fiscal Deficit (₹ in crore)
Particulars
Impact on
Revenue
Surplus
Impact on
Fiscal
Deficit
(i) Overstatement of Revenue Receipts
Lapsing of loan amounts in PD accounts as Non-Tax Revenue to
Government without corresponding reduction in outstanding loans
given15
(refer Box 1.1, paragraph 1.3.1)
2,300.00 --
(ii) Understatement of Revenue Expenditure
Providing loans instead of Grants in Aid to Autonomous Bodies,
which do not have own resources of serving debt, for
implementation of Government schemes16
(refer paragraph 1.6.3)
3,908.80 --
Short contribution to Guarantee Redemption Fund 188.56 188.56
Non provision of interest on Interest bearing Reserve Funds and
Deposits17
29.30 29.30
12 Non-debt receipts = Revenue Receipts + Miscellaneous Capital receipts + Recoveries of Loans and
Advances 13 Primary Expenditure = (Revenue Expenditure – Interest payments) + Capital Expenditure + Loans and
Advances + Inter State Settlements 14 Total outstanding debt includes Public Debt and Public Account Liabilities 15 (i) Telangana State Scheduled Castes Cooperative Development Corporation Limited: ₹1,500 crore and
(ii) Telangana State Scheduled Tribes Cooperative Finance Corporation Limited: ₹800 crore 16 (i) Telangana State Scheduled Castes Cooperative Development Corporation Limited: ₹1,500 crore,
(ii) Telangana State Scheduled Tribes Cooperative Finance Corporation Limited: ₹900 crore,
(iii) Arogyasri Health Care Trust: ₹621.70 crore, (iv) Telangana State Sheep and Goat Development
Cooperative Federation Limited: ₹493.32 crore and (v) Telangana State Civil Supplies Corporation
Limited: ₹393.78 crore 17 Interest liability not provided: (i) ₹23.96 crore on Deposits (₹299.50 crore) bearing interest in Defined
Contribution Pension Scheme calculated at eight per cent (General Provident Fund Interest Rate) and
(ii) ₹5.34 crore on Reserve Funds bearing interest(State Disaster Response Fund: ₹66.71 crore)
calculated at eight per cent (average Ways and Means Advance Rate)

State Finances Audit Report for the year ended March 2019
Page | 6
Particulars
Impact on
Revenue
Surplus
Impact on
Fiscal
Deficit
(iii) Understatement of Revenue Expenditure due to misclassification
Assistance to Local Bodies and other institutions for creation of
assets under Capital in the Government accounts instead of under
Revenue18
2,622.00 --
Classification of Minor works under Capital 351.20 --
Classification of incidental charges of Rythu Bandhu programme
under Capital
60.00 --
Classification of Grants-in-Aid under Capital 48.60 --
(iv) Overstatement of Revenue Expenditure
Decretal charges on Land Acquisition for irrigation projects
classified under Revenue section instead of under Capital
(-)26.49 --
Total 9,481.97 217.86
Source: Finance Accounts
As a result, the Revenue Surplus was overstated by ₹9,481.97 crore and Fiscal Deficit
was understated by ₹217.86 crore. Effectively, there was a Revenue Deficit of
₹5,144.97 crore instead of Revenue Surplus and the actual Fiscal Deficit was to be
₹27,166.86 crore (3.14 per cent of GSDP).
It is to be noted that while short contribution to Statutory Funds was persistent during the
past few years, the provision of loans to institutions without definite streams to service their
debt is relatively a recent phenomenon.
Box 1.1: Providing loans to Autonomous Bodies, not having revenue streams
for debt servicing, for implementing Government Schemes
Report of the Comptroller and Auditor General of India on Telangana State Finances for
the year 2017-18 mentioned that the State Government advanced loans amounting to
₹2,300 crore to two Autonomous Bodies (ABs)19, which were implementing various
programmes taken up by the State Government for the benefit of Schedule Castes and
Schedule Tribes. No terms and conditions like repayment period, rate of interest, etc.,
were stipulated while sanctioning the loans indicating that they were indirect subsidies.
Moreover, these ABs did not have any definite revenue stream to service the loan. As a
result, Revenue Expenditure was understated to that extent apart from overstatement of
Revenue Surplus and Outstanding Loans in that year. These amounts were in the
Personal Deposit (PD) Accounts of the ABs as of 31 March 2018.
In the year 2018-19, it was observed in audit, that these amounts of (₹1,500 crore and
₹800 crore) lying in PD accounts of these two ABs lapsed and were credited to
18 (i) Mahatma Gandhi National Rural Employment Guarantee Scheme (₹1,401.38 crore), (ii) Swachh
Bharat Mission – Gramin (₹1,078.33 crore), (iii) Constituency Development Fund (₹74.16 crore),
(iv) Purchase of surgical consumables (₹60.50 crore) and (v) Rashtriya Madhyamika Shiksha Abhiyan
(₹7.63 crore) 19 (i) Telangana State Scheduled Castes Cooperative Development Corporation Limited:₹1,500 crore and
(ii) Telangana State Scheduled Tribes Cooperative Finance Corporation Limited: ₹800 crore

Chapter I – Finances of the State Government
Page | 7
Government account as Revenue Receipts without corresponding reduction in the
outstanding loan amounts.
Lapsing of amounts, which had been transferred to PD accounts as loans in the
preceding year, as Revenue Receipts without corresponding change in the
outstanding loan amounts resulted in overstatement of both Revenue Receipts and
Assets of the Government in the form of outstanding Loans to a tune of ₹2,300 crore.
On the other hand, the State Government continued with provision of loans to these two
ABs in 2018-19 also by providing ₹2,400 crore20, thus taking total of outstanding loans
to ₹4,700 crore. The Government stated (January 2020) that it was consciously providing
loans to these institutions.
It was further observed in audit that the State Government has provided such similar
loans amounting to ₹1,508.80 crore in 2018-19 to three other ABs21, which were also
implementing Government schemes.
Providing funds in the form of loans to ABs, which do not have their own revenue
resources for debt servicing and were implementing Government schemes, instead
of in the form of either Grants-in-Aid or Subsidies resulted in understatement of
Revenue Expenditure and overstatement of Revenue Surplus.
1.3.1.1 Composition and Financing of Fiscal Deficit
Fiscal Deficit represents the total financing the State requires (predominantly by drawing
on its cash and investment balances with the RBI and by borrowing) to meet the excess of
Revenue and Capital Expenditure (including Loans and Advances) over Revenue and
non-debt receipts. The composition and financing of fiscal deficit are given in Table 1.5:
Table 1.5: Components of Fiscal Deficit and their financing pattern
(₹in crore)
Sl.
No. Particulars
2015-16 2016-17 2017-18 2018-19
Net Net Net Receipts Disburse
-ments Net
A Decomposition of Fiscal
Deficit (1 to 4)
(-)18,856 (-)35,281 (-)26,700 1,01,486 1,28,435 (-)26,949
1 Revenue Surplus 238 1,386 3,459 1,01,420 97,083 4,337
2 Capital Expenditure (-)13,590 (-)33,371 (-)23,902 -- 22,641 (-)22,641
3 Net Loans and Advances (-)5,145 (-)3,246 (-)6,071 66 8,706 (-)8,640
4 Interstate Settlements (-)359 (-)50 (-)186 -- 5 (-)5
20 (i) Telangana State Scheduled Castes Cooperative Development Corporation Limited: ₹1,500 crore; (ii)
Telangana State Scheduled Tribes Cooperative Finance Corporation Limited : ₹900 crore 21 (i) Arogyasri Health Care Trust:₹621.70 crore, (ii) Telangana State Sheep and Goat Development
Cooperation Federation Limited: ₹493.32 crore and (iii) Telangana State Civil Supplies Corporation
Limited: ₹393.78 crore

State Finances Audit Report for the year ended March 2019
Page | 8
Sl.
No. Particulars
2015-16 2016-17 2017-18 2018-19
Net Net Net Receipts Disburse
-ments Net
B Financing Pattern of Fiscal Deficit
1 Net Borrowings 14,653 29,251 21,682 50,962 28,716 22,246
a Market Borrowings* 13,883 29,058 21,458 50,528 27,882 22,646
b Loans from GoI 770 193 224 434 834 (-)400
2 Net of Public Account 5,476 3,726 7,847 1,14,152 1,09,222 4,930
a Small Savings, PF, etc. 862 1,069 976 2,427 1,582 845
b Reserve Funds 1,126 440 278 1,598 68 1,530
c Deposits and Advances 2,222 1,918 5,860 62,595 59,494 3,100
d Suspense and Miscellaneous 1,405 454 (-)573 29,672 30,332 (-)660
e Remittances (-)139 (-)155 1,306 17,860 17,746 115
3 Contingency Fund --- (-)0.09 --- 0.09 2.10 (-)2.01
4 Total (1 to 3) 20,129 32,977 29,529 1,65,114 1,37,940 27,174
5 Increase (-) / Decrease (+) in
Cash Balance
(-)1,273 2,304 (-)2,829 --- --- (-)225
6 Overall Surplus/ Deficit
(4+5)
18,856 35,281 26,700 --- --- 26,949
Source: Finance Accounts
* Includes borrowings from other institutions
It can be seen from the above that Capital Expenditure accounted for 84 per cent of the
Fiscal Deficit, which was mainly financed by Market borrowings. This, however, needs
to be viewed in the background that the State Government misclassified ₹9,508.46 crore of
Revenue Expenditure as Capital Expenditure as discussed in paragraph 1.3.1 above.
1.3.1.2 Quality of Deficit / Surplus
The bifurcation of Primary Deficit (Table 1.6) indicates the extent to which deficit has been
on account of enhancement of Capital Expenditure, which is desirable to improve
productive capacity of the Government.
Table 1.6: Primary Deficit/ Surplus – bifurcation of factors
(₹ in crore)
Year
Non-
debt
receipts
Primary
Revenue
Expenditure22
Capital
Expenditure
Loans and
Advances
and Inter-
State
settlements
Primary
Expenditure
Primary
Revenue
Surplus23
Primary
Revenue
Surplus /
Capital
Expenditure
(per cent)
1 2 3 4 5 6 (3+4+5) 7 (2-3) 8
2015-16 76,222 68,338 13,590 5,592 87,520 7,884 58.01
2016-17 82,974 72,823 33,371 3,452 1,09,646 10,151 30.42
2017-18 88,962 74,529 23,902 6,395 1,04,826 14,433 60.38
2018-19 1,01,486 84,497 22,641 8,711 1,15,849 16,989 75.04
Source: Finance Accounts
22 Primary Revenue Expenditure = Revenue Expenditure – Interest payments 23 Primary Revenue Surplus = Non-Debt Receipts (i.e., Revenue Receipts + Miscellaneous Capital Receipts
+ Recovery of Loans and Advances) – Primary Revenue Expenditure

Chapter I – Finances of the State Government
Page | 9
• As can be seen from above, the non-debt receipts have not been sufficient to meet the
Primary Expenditure.
• The Primary Revenue Surplus (₹16,989 crore) is equivalent to 75 per cent of the
Capital Expenditure (₹22,641 crore) in 2018-19, an improvement over previous year.
1.3.2 Budget Estimates and Actuals
Changes of actual receipts and expenditure against budget estimates, either due to
unanticipated and unforeseen events or under/over estimation of expenditure or revenue at
the stage of budget preparation, adversely impacts the desired fiscal objectives. Significant
variations were noticed between Budget Estimates and Actuals as shown in Chart 1.4:
Chart 1.4: Budget Estimates and Actuals for the year 2018-19
Source: Budget Estimates and Finance Accounts
It can be seen from above that the Revenue Receipts fell short of Budget Estimates (BE)
by 23 per cent. Tax Revenue fell short of BE by 10 per cent mainly due to shortfall in GST
(12 per cent) and Taxes on Sales, Trade, etc., (22 per cent). Shortfall in Grants-in-Aid was
72 per cent, which was mainly due to “Nil” receipts under, Grants for Special Package and
additional Central Assistance (BE: ₹16,350 crore), Grants for Local Bodies (BE:
₹1,982 crore), National Employee Guarantee Fund (BE: ₹1,000 crore), Urban Rejuvenation
Mission and Mission for Development of Smart Cities (₹365 crore). It is thus, necessary
that a more reliable method of forecasting revenues is adopted to achieve better planning
of expenditure.
• Non-Tax Revenue was higher than the BE by 11.50 per cent. The increase in Non-Tax
Revenue was mainly due to increase in receipts in Mineral concession Fees, Rents and
Royalties under Non-ferrous Mining and Metallurgical Industries (increase of
₹593 crore in comparison to BE of ₹3,254.06 crore), receipts from Guarantee Fees
under Miscellaneous General Services (₹340 crore in comparison to BE of ‘nil’) and
from lapsing of outstanding loans (₹2,300 crore in comparison to BE of ‘nil’) as
discussed in Box 1.1 (refer Paragraph 1.3.1).
• Revenue Expenditure was less than the BE by 22.60 per cent. The maximum shortfall
in Revenue Expenditure was due to shortfall mainly under Irrigation and Flood Control
-40,000
-20,000
0
20,000
40,000
60,000
80,000
1,00,000
1,20,000
1,40,000
Revenue
Receipts
Tax
Revenue
Non Tax
Revenue
Revenue
Expenditure
Grants-in-
Aid
Capital
Expenditure
Revenue
Surplus
Fiscal
Deficit
Primary
Deficit
1,30,975
72,252
8,974
1,25,455
29,042 33,369
5,520
-29,078
-17,387
1,01,420
64,674
10,007
97,083
8,178
22,641
4,337
-26,949
-14,363
₹ i
n c
rore
Budget Estimates Actuals
State Finances Audit Report for the year ended March 2019
Page | 10
(₹7,860 crore i.e., 95 per cent) and Water Supply, Sanitation, Housing and Urban
Development (₹5,858 crore i.e., 65 per cent).
• Capital Expenditure fell short of BE by 32 per cent mainly due to shortfall in General
Economic Services (₹2,637 crore i.e., 79 per cent), Transport (₹1,593 crore i.e.,
61 per cent), Welfare of SCs/STs/OBCs and Minorities (₹1,487 crore i.e., 71 per cent),
Health and Family Welfare (₹629 crore i.e., 58 per cent) and Social Welfare and
Nutrition (₹35 crore i.e., 85 per cent).
• Revenue Surplus was lower than BE by 21 per cent. Fiscal Deficit and Primary Deficit
were higher than BE by seven per cent and 17 per cent respectively.
Recommendation 1: The Finance Department should rationalise the budget preparation
exercise, so that the gap between the budget estimates and actuals is minimised.
1.4 Financial Resources of the State
1.4.1 Resources of the State as per Annual Finance Accounts
Revenue Receipts consists of Tax Revenues, Non-Tax Revenues, State’s share of Union
taxes and duties, and Grants-in-Aid from Government of India (GoI). Receipts under
Capital comprise of non-debt Capital Receipts and Debt Capital Receipts. Non-debt
Capital Receipts include miscellaneous Capital Receipts such as proceeds from
disinvestments, recoveries of Loans and Advances, while Debt Capital Receipts include
debt receipts from internal sources (market loans, borrowings from financial institutions /
commercial banks) and Loans and Advances from GoI. Public Accounts Receipts include
funds available with Government for use i.e., Small Savings, Provident Fund, Reserve
Funds, Deposits and Advances etc.
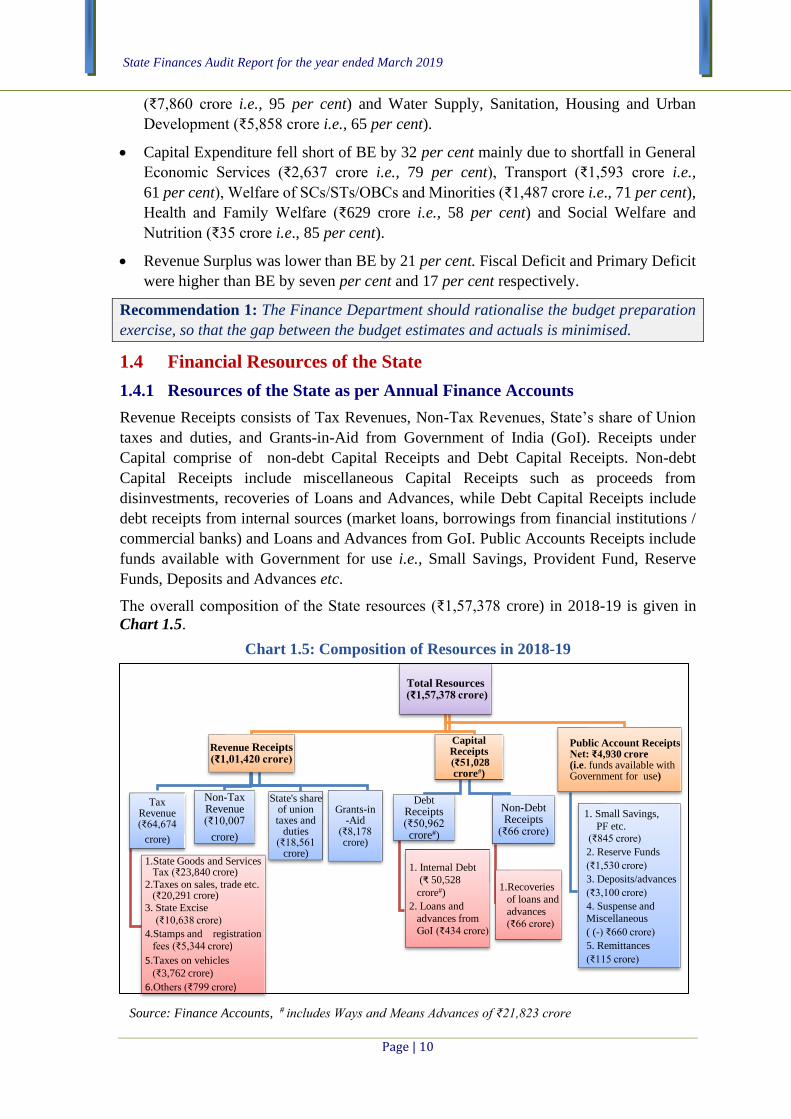
The overall composition of the State resources (₹1,57,378 crore) in 2018-19 is given in
Chart 1.5.
Chart 1.5: Composition of Resources in 2018-19
Source: Finance Accounts, # includes Ways and Means Advances of ₹21,823 crore
Total Resources(₹1,57,378 crore)
Revenue Receipts (₹1,01,420 crore)
Tax Revenue(₹64,674
crore)
1.State Goods and Services Tax (₹23,840 crore)
2.Taxes on sales, trade etc. (₹20,291 crore)
3. State Excise
(₹10,638 crore)
4.Stamps and registration
fees (₹5,344 crore)
5.Taxes on vehicles
(₹3,762 crore)
6.Others (₹799 crore)
Non-Tax Revenue (₹10,007
crore)
State's share of union taxes and
duties (₹18,561
crore)
Grants-in-Aid
(₹8,178 crore)
Capital Receipts(₹51,028 crore#)
DebtReceipts (₹50,962 crore#)
1. Internal Debt
(₹ 50,528
crore#)
2. Loans and
advances from
GoI (₹434 crore)
Non-Debt Receipts
(₹66 crore)
1.Recoveries
of loans and
advances(₹66 crore)
Public Account Receipts Net: ₹4,930 crore(i.e. funds available with Government for use)
1. Small Savings,
PF etc. (₹845 crore)
2. Reserve Funds
(₹1,530 crore)
3. Deposits/advances
(₹3,100 crore)
4. Suspense and
Miscellaneous
( (-) ₹660 crore)
5. Remittances
(₹115 crore)

Chapter I – Finances of the State Government
Page | 11
1.4.2 Revenue Receipts
Statement 14 of the Finance Accounts gives details of Revenue Receipts of the
Government. The trends and composition of the Revenue Receipts during the years
2015-16 to 2018-19 are in Chart 1.6.
Chart 1.6: Composition of Revenue Receipts during the years 2015-16 to 2018-19
Source: Finance Accounts
It can be seen from the above chart that the Own Tax revenue and Central tax transfers have
been increasing; whereas Non-Tax Revenue and Grants-in-Aid which saw a dip in
2017-18 were higher in 2018-19. The trends in Revenue Receipts relative to GSDP are
presented in Table 1.7:
Table 1.7: Trends in Revenue Receipts relative to GSDP during 2014-19
Description of parameter 2014-15 2015-16
2016-17
2017-18
2018-19
Gross State Domestic Product (GSDP)
(₹ in crore)
5,05,849
5,77,902
6,59,033
7,53,811
8,65,688
Rate of Growth of GSDP (in per cent) --- 14.24 14.04 14.38 14.84
Revenue Receipts (RR) (₹ in crore) 51,042 76,134 82,818 88,824 1,01,420
Rate of Growth of RR (in per cent) --- 49.16 8.78 7.25 14.18
RR/GSDP (in per cent) 10.09 13.17 12.57 11.78 11.72
State’s Own Tax Revenue (OTR) (₹ in crore) 29,288 39,975 48,408 56,520 64,674
Rate of Growth of State's Own Tax Revenue
(in per cent) --- 36.49 21.10 16.76 14.43
Buoyancy Ratios
Revenue Buoyancy with respect to GSDP --- 3.45 0.63 0.50 0.96
State’s Own Tax Revenue Buoyancy with
respect to GSDP --- 2.56 1.50 1.17 0.97
Source: Finance Accounts and Ministry of Statistics and Programme Implementation for GSDP figures
of respective years
-
10,000
20,000
30,000
40,000
50,000
60,000
70,000
2015-16 2016-17 2017-18 2018-19
39,975
48,408
56,520
64,674
14,414 9,782 7,825
10,007 12,351 14,876 16,420
18,561
9,394 9,752 8,059 8,178
₹ i
n c
rore
Own Taxes Non-Tax Revenue Central Tax Transfers Grants-in-aid

State Finances Audit Report for the year ended March 2019
Page | 12
From the table, it can be inferred that:
• Revenue buoyancy with reference to GSDP was higher in 2018-19 when compared to
previous two years. However, it is still marginally less than ‘one’.
• The State’s Own Tax buoyancy with respect to GSDP was more than ‘one’ during
the years 2015-16 to 2017-18. However, during 2018-19, it came down to below ‘one’,
indicating less than optimum growth in Own Tax Revenue compared to the growth in
GSDP.
1.4.2.1 State’s Own Resources
The State’s performance in mobilisation of resources is assessed in terms of Tax Revenue
and Non-Tax Revenue, not including the State’s share in Central Taxes and Grants-in-Aid
which is based on the recommendations of the Finance Commission.
State’s Own Tax Revenue
Components of State’s Own Tax Revenue are in Table 1.8:
Table 1.8: Components of State’s Own Tax Revenue (₹ in crore)
2015-16 2016-17 2017-18 2018-19
Actuals Actuals Actuals Budget
Projections
Actuals
State Goods and Services Tax --- --- 13,073 26,040 23,840
Taxes on Sales, Trade, etc. 29,847 34,235 25,107 25,942 20,291
State Excise 3,809 5,581 9,421 10,600 10,638
Taxes on Vehicles 2,309 3,394 3,590 3,950 3,762
Stamp Duty and Registration Fees 3,102 3,822 4,202 4,700 5,344
Land Revenue 104 7 4 5 0.42
Taxes on Goods and Passengers 33 11 88 --- 189
Other Taxes 771 1,358 1,035 1,016 610
Total 39,975 48,408 56,520 72,253 64,674
Source: Finance Accounts
As seen from the above table, State’s Own Tax Revenue (SOTR) in 2018-19 was
₹64,674 crore and constituted 64 per cent of total Revenue Receipts. Tax Revenue grew by
14.43 per cent, at a rate marginally lower than the increase (14.84 per cent) in GSDP. The
increase in State Goods and Services Tax (₹10,767 crore) was mainly due to higher receipts
under ‘Input Tax Credit cross utilization of SGST and IGST’, ‘Advance apportionment
from IGST’ and ‘Apportionment of IGST –Transfer-in of Tax component of SGST’.
Further, State’s Own Tax Revenue as a percentage of GSDP, which increased from
6.91 per cent in 2015-16 to 7.49 per cent in 2017-18, remained at the same level
(7.47 per cent) in 2018-19 also.

Chapter I – Finances of the State Government
Page | 13
Non-Tax Revenue
Non-Tax Revenue (NTR)
accounts for receipts from
services rendered and supplies
made by various Departments of
Government and interest
receipts. NTR in 2018-19 was
₹10,007 crore and constituted
10 per cent of total Revenue
Receipts. The increase
(28 per cent) in NTR was due to
increase in Other Receipts,
receipts from Guarantee Fees,
and receipts towards Mineral
concession Fees, Rents and
Royalties.
Chart 1.7: Non-Tax Revenue: 2015-16 to 2018-19
Source: Finance Accounts of years concerned
The following was observed in audit:
• There was a huge increase of 1,864 per cent under Other Receipts (₹2,660.71 crore) in
2018-19 as against ₹135.45 crore in 2017-18. This was mainly due to lapsing of
amounts lying unutilised in PD accounts for more than one year, and includes
₹1,500 crore and ₹800 crore provided as loans in 2017-18 to Telangana State Scheduled
Castes Development Corporation Limited and Telangana State Scheduled Tribes
Cooperative Finance Corporation Limited (refer Paragraph 1.3.1).
• Revenue (₹4,646.94 crore) under the Non-ferrous Mining and Metallurgical Industries
increased by 29 per cent during 2018-19 over the previous year (₹3,592.51 crore).
Royalty from both, Major and Minor minerals increased considerably from
₹2,047 crore in 2017-18 to ₹2,483 crore in 2018-19 (21 per cent increase) and from
₹801 crore in 2017-18 to ₹1,339 crore in 2018-19 (67 per cent increase) respectively
for Major and Minor minerals.
• Guarantee commission of ₹340 crore was received under Miscellaneous General
Services from Telangana State Water Resources Infrastructure Development
Corporation Limited for Guarantee given by the Government.
1.4.2.2 Efficiency in Tax collection
The efficiency in collection (measured in terms of cost of collection as a percentage of the
Gross Revenue collection) of major taxes of the State remained almost constant compared
to previous year (Table 1.9) in respect of Taxes on Vehicles, Stamps and Registration Fees,
while there was improvement in the efficiency in respect of Taxes on Sales, Trade etc, State
Goods and Services Tax and State Excise.
14,414
9,782
7,825
10,007
1,572 412 135
2,6612,2133,148
3,5934,647
0
2,000
4,000
6,000
8,000
10,000
12,000
14,000
16,000
2015-16 2016-17 2017-18 2018-19
₹ i
n c
rore
Total Non-Tax Revenue
Miscellaneous General Services (other receipts)
Non-ferrous mining and Metallurgical Industries

State Finances Audit Report for the year ended March 2019
Page | 14
Table 1.9: Tax collected and cost of collection
2015-16 2016-17 2017-18 2018-19
Taxes on
Sales, Trade,
etc., and
SGST
Gross Revenue collection (₹ in crore) 29,847 34,235 40,068 44,130
Cost of Collection (₹ in crore) 210 228 217 196
Percentage to Gross collection 0.70 0.67 0.54 0.44
State Excise
Gross Revenue collection (₹ in crore) 3,809 5,581 9,421 10,638
Cost of Collection (₹ in crore) 206 216 226 233
Percentage to Gross collection 5.41 3.87 2.40 2.19
Taxes on
Vehicles
Gross Revenue collection (₹ in crore) 2,309 3,394 3,589 3,762
Cost of Collection(₹ in crore) 80 74 76 79
Percentage to Gross collection 3.46 2.18 2.12 2.10
Stamps and
Registration
Fees
Gross Revenue collection (₹ in crore) 3,102 3,822 4,202 5,344
Cost of Collection (₹ in crore) 62 68 69 89
Percentage to Gross collection 2.00 1.78 1.64 1.67
Source: Finance Accounts
1.4.2.3 Goods and Services Tax (GST)
The State Government implemented Telangana Goods and Services Tax (TGST) Act with
effect from 01 July 2017. The GST has four components viz., (i) GST receipts by the Centre
(i.e., Central GST or CGST); (ii) GST receipts by the State (i.e., State GST or SGST);
(iii) Integrated GST (IGST)24, a tax on inter-State supply of Goods or Services or both by
the Central Government and (iv) GST Compensation Cess25. SGST is levied on intra-State
supply of goods or services (except alcohol for human consumption and five specified
petroleum products26).
(i) CGST: The State received ₹4,580.66 crore as share of net proceeds assigned to States
under CGST during the year 2018-19.
(ii) SGST: The receipts of the State through SGST was ₹23,840.18 crore27.
(iii) IGST: Telangana State received ₹36.56 crore per month as IGST for 10 months in
2018-19 up to January 2019 totalling to ₹365.50 crore. IGST for the months of February
2019 and March 2019 was not received.
(iv) GST Compensation: According to GST (Compensation to the States) Act, 2017, the
Central Government will compensate the States for loss of revenue arising on account
of implementation of GST for a period of five years. The Compensation payable to the
State shall be calculated for every financial year after the receipt of final revenue
figures, as audited by the Comptroller and Auditor General of India. The projected
revenue for any year of a State shall be calculated by applying the projected growth rate
of (14 per cent per annum) over the base year (2015-16) revenue of the State.
24 in respect of inter-State supply of Goods and Services, Integrated GST (IGST) is levied and collected by
Government of India (GoI). The IGST so collected is apportioned between the Centre and the State where
Goods and Services are consumed 25 as per GST Compensation Cess Act, GST Compensation Cess is paid by GoI for a period of five years
to the State in case the share of a State falls short of the revenue earned in the pre-GST regime 26 Petroleum crude, High speed diesel, Motor spirit (Petrol), Natural gas and Aviation turbine fuel 27 Includes (i) ₹20,912.60 crore as SGST, (ii) ₹1,873.47 crore as advance apportionment of IGST and
(iii) ₹1,054. 05 crore as apportionment of IGST-Transfer-in of Tax Component to SGST

Chapter I – Finances of the State Government
Page | 15
The compensation was to be paid by GoI and to be received by the State considering
the base figure of revenue of a State for the year 2015-16, escalated by 14 per cent per
annum for the five years commencing from 01 July 2017. In case of Telangana, the
revenue in the base year (2015-16) was ₹16,109 crore. Accordingly, Protected Revenue
for the year 2018-19 was ₹23,866.19 crore28.
The State received ₹23,840.18 crore as SGST and ₹1,073.30 crore as pre-GST tax
collected during the year. Thus, the total amount received was ₹24,913.48 crore. As the
collection of the State under SGST and taxes subsumed under SGST were more than
the protected revenues for the year 2018-19, no GST Compensation was to be received.
With automation of collection of GST having taken place, it is essential for Audit to
transition from sample checks to a comprehensive check of all transactions, to fulfil the
CAG’s constitutional mandate of certifying the Accounts. The required access to data
is yet to be provided. Not having access to the data pertaining to all GST transactions
has come in the way of comprehensively auditing the GST receipts. The accounts for
the year 2018-19 are, therefore, certified on the basis of test audit, as was done when
records were manually maintained, as a one-time exception.
1.4.2.4 State’s share of Union Taxes
The different components of States share of Union Taxes during years 2015-16 to
2018-19 is given in Table 1.10, along with XIV Finance Commission projections for
2018-19 at a rate of 2.44 per cent of net proceeds of shareable Union Taxes and Duties.
Table 1.10: Different components of State’s share of Union Taxes
(₹ in crore)
Source: Finance Accounts
NA: Not applicable due to implementation of GST Act with effect from 1 July 2017
28 Calculated at compounding increase of 14 per cent per annum for three years viz., 2016-17, 2017-18 and
2018-19 from the base year revenue of ₹16,109 crore (i.e., ₹16,109 x 1.14 x 1.14 x 1.14 = ₹23,866.19
crore)
Component of State’s share of Union taxes 2015-16 2016-17 2017-18
14 FC
Projections
for
2018-19
2018-19
Corporation Tax 3,870 4,763 5,027 5,393 6,454
Customs 1,979 2,049 1,657 946 1,315
Income Tax 2,675 3,310 4,245 4,772 4,753
Other Taxes and Duties on commodities and
services 11 0 0 0 10
Service Tax 2,153 2,404 1,872 0 172
Wealth Tax 1 10 0 (-) 0.17 2
Union Excise Duties 1,662 2,340 1,731 922 874
CGST NA NA 231 6,181 4,581
IGST NA NA 1,657 512 366
Other Taxes on Income and Expenditure 0 0 0 0 34
Grand total 12,351 14,876 16,420 18,726 18,561
Devolution as percentage of Revenue
Receipts of the State 16.22 17.96 18.49 -- 18.30

State Finances Audit Report for the year ended March 2019
Page | 16
As seen from the above table, the devolution as a percentage of Revenue Receipts of the
State has marginally decreased compared to preceding year. The devolution including
Service Tax for 2018-19 is marginally less than the XIV Finance Commission projections
of ₹18,726 crore. The higher devolutions in respect of Corporation Tax and Customs than
the projections of XIV Finance Commission were undermined by lower receipts on account
of devolution of CGST.
1.4.2.5 Grants-in-Aid from Government of India
The details of Grants-in-Aid and its composition during the years 2015-16 to 2018-19 are
in Table 1.11.
Table 1.11: Grants-in-Aid from Government of India
(₹ in crore)
Particulars 2015-16 2016-17 2017-18 2018-19
Actuals Actuals Actuals BE Actuals
Non-Plan Grants 2,978 3,057 --- 18,770 ---
Grants for Centrally Assisted State Plan
Schemes 6,416 6,695 --- 10,272 ---
Grants for Central and
Centrally sponsored Plan Schemes --- --- 6,108 --- 5,508
Finance Commission Grants --- --- 1,168 --- 1,806
Other Transfers/Grants to States --- --- 783 --- 864
Total 9,394 9,752 8,059 29,042 8,178
Total Grants as a percentage of Revenue
Receipts 12.34 11.78 9.07 22.17 8.06
Source: Finance Accounts; BE: Budget Estimates
It can be seen from above that the Government of Telangana State (GoTS) was receiving
less than ₹10,000 crore from GoI as Grants-in-Aid (GIA) during past few years. The GoTS,
however, had estimated ₹29,042 crore as GIA receipts for 2018-19. The GIA actually
received (₹8,178 crore), though marginally higher than the preceding year (₹8,059 crore)
by 1.5 per cent, proved that the Budget Estimates were much higher than the trend of GIA
receipts in recent years.
Recommendation 2: Receipts from Government of India as Grants-in-Aid may be
estimated on a realistic basis keeping in view the actual receipts in the recent past.
1.4.2.6 Transfers of funds directly to implementing agencies without routing through
Consolidated Fund of the State
With effect from 01 April 2014, it has been decided by Government of India (GoI) to
release all assistance related to the Centrally Sponsored Schemes/Additional Central
Assistances to the State Government and not directly to implementing agencies. During
2018-19, however, the GoI released ₹9,795 crore directly to the implementing agencies for
National Rural Employment Guarantee Scheme (₹6,376 crore), Food Subsidy
(₹2,559 crore), etc., as shown in Appendix-VI of Finance Accounts 2018-19. Similar direct
releases to implementing agencies had happened in 2017-18 (₹9,740.78 crore), 2016-17
(₹887.96 crore) and 2015-16 (₹858.38 crore) also.

Chapter I – Finances of the State Government
Page | 17
1.4.3 Receipts under the Capital Section
The details of Capital Receipts and their composition for the years 2015-16 to 2018-19 are
in Table 1.12:
Table 1.12: Composition of Capital Receipts (₹in crore)
Sources of State’s Receipts 2015-16 2016-17 2017-18 2018-19
Actuals Actuals Actuals BE Actuals
Capital Receipts (CR) 17,586 44,975 49,291 41,007 51,028
Recovery of Loans and Advances 88 156 138 7,807 66
Public Debt Receipts# 17,498 44,819 49,153 33,200 50,962
Source: Finance Accounts #includes Ways and Means Advances of ₹12,088 crore, ₹22,922 crore and ₹21,823 crore for 2016-17,
2017-18 and 2018-19 respectively.
As seen from above, Public debt receipts constituted major component of Capital Receipts
(99.87 per cent).
1.4.3.1 Public Account Receipts and Disbursements
As per para 1.7 of Budget Manual, Receipts and disbursements in respect of transactions
such as Small Savings, Provident Fund, Reserve Funds, Deposits, Suspense, Remittances
etc., which do not form part of the Consolidated Fund, are kept in the Public Account set
up as per Article 266 (2) of the Constitution. These are not subject to vote by State
Legislature. Government acts as banker or trustee. The balance after disbursements is the
fund available with the Government for its use. Composition of Public Account receipts
and disbursements is detailed in Table 1.13:
Table.1.13: Composition of Public Account Receipts and Disbursements
(₹ in crore)
Particulars 2015-16
Actuals
2016-17
Actuals
2017-18
Actuals
2018-19
Budget
Estimates Actuals
A. Public Account Receipts
Small Savings, Provident Fund, etc. 2,101 2,417 2,495 2,500 2,427
Reserve Fund 1,788 1,292 831 15,874 1,598
Deposits and Advances 39,840 43,378 54,048 51,392 62,595
Suspense and Miscellaneous 26,458 39,369 28,582 --- 29,672
Remittances 16,198 22,638 20,555 --- 17,860
Total (A) 86,385 1,09,094 1,06,511 69,766 1,14,152
B. Public Account Disbursements
Small Savings, Provident Fund etc. 1,239 1,348 1,519 1,400 1,582
Reserve Fund 662 852 553 15,653 68
Deposits and Advances 37,619 41,460 48,188 50,213 59,494
Suspense and Miscellaneous 25,053 38,915 29,155 --- 30,332
Remittances 16,336 22,793 19,249 --- 17,746
Total (B) 80,909 1,05,368 98,664 67,266 1,09,222
Public Account Net (A) - (B) 5,476 3,726 7,847 2,500 4,930
Source: Finance Accounts

State Finances Audit Report for the year ended March 2019
Page | 18
1.5 Application of Resources
1.5.1 Growth and Composition of expenditure
The total expenditure in 2018-19 was ₹1,28,435 crore. Chart 1.8 presents the trends and
composition of total expenditure during 2015-16 to 2018-19.
Chart 1.8: Composition and Growth of expenditure during last four years
Source: Finance Accounts
Capital Expenditure, which was 21 per cent of total expenditure in 2017-18, has decreased
to 18 per cent in 2018-19. On the other hand, the Revenue Expenditure increased from
74 per cent in 2017-18 to 76 per cent in 2018-19. The increase in Revenue Expenditure
was mainly due to commencement of Investment Support Scheme (Rythu Bandhu) in
2018-19 on which ₹9,969.07 crore was spent.
From the sector wise perspective, Social Services29 got preference with 40.45 per cent of
the total expenditure over Economic Services30 (32.33 per cent) and General Services
(27.17 per cent) indicating prioritisation of Welfare. Component-wise major expenditures
under different sectors in Revenue and Capital sections incurred in 2018-19 is given in
Table 1.14:
Table 1.14: Major expenditure components under Revenue and Capital
Revenue Capital
Component Sector
2017-18
(₹ in
crore)
2018-19
(₹ in
crore)
Component Sector
2017-18
(₹ in
crore)
2018-19
(₹ in
crore)
Agriculture and
Allied Activities Economic 6,560 12,601
Irrigation and Flood
Control Economic 12,596 9,118
Education31,
Sports, Art and
Culture
Social 12,246 11,503
Water Supply,
Sanitation, Housing
and Urban
Development
Social 1,873 4,253
29 refers to welfare activities of the Government and includes (i) Education, Sports, Art and Culture,
(ii) Health and Family Welfare, (iii) Water Supply, Sanitation, Housing and Urban Development,
(iv) Information and Broadcasting, (v) Welfare of Scheduled Castes, Scheduled Tribes and Backward
Classes, (vi) Labour and Labour Welfare, (vii) Social Welfare and Nutrition and (viii) Others 30 refers to economic development activity sectors of the Government and includes (i) Agriculture and
allied services, (ii) Irrigation and Flood Control, (iii) Energy, (iv) Industry and Minerals, (v) Transport,
(vi) Science Technology and Environment, (vii)Rural Development and (viii) General Economic
Services 31 includes General Education:₹10,939 crore and Technical Education:₹329 crore for 2018-19
-
40,000
80,000
1,20,000
1,60,000
2015-16 2016-17 2017-18 2018-19
95,078 1,18,255 1,15,662
1,28,435
75,896 81,432 85,365 97,083
13,590 33,371 23,902 22,641
5,592 3,452 6,395 8,711
₹ i
n c
rore
Total Expenditure Revenue Expenditure Capital Expenditure Loans and Advances

Chapter I – Finances of the State Government
Page | 19
Revenue Capital
Component Sector
2017-18
(₹ in
crore)
2018-19
(₹ in
crore)
Component Sector
2017-18
(₹ in
crore)
2018-19
(₹ in
crore)
Social Welfare
and Nutrition Social 8,864 10,709 Energy Economic 2,721 2,400
Welfare of SCs,
STs, OBCs and
Minorities
Social 7,862 8,822 Rural Development Economic 858 1,996
Energy Economic 4,391 4,983 Transport Economic 2,169 1,024
Health and Family
Welfare Social 4,768 4,912
Agriculture and
Allied Activities Economic 514 1,012
Water Supply,
Sanitation,
Housing and
Urban
Development
Social 2,964 3,220
Rural
Development Economic 3,790 2,857
Source: Finance Accounts
• Revenue Expenditure (₹97,083 crore) was higher than the preceding year’s figures
(₹85,365 crore) by 14 per cent. The increase over previous year was mainly due to
higher outgo on Agriculture and Allied Activities (increase of ₹6,041 crore) including
Investment Support Scheme Rythu Bandhu, Social Welfare and Nutrition (increase
of ₹1,845 crore) and Welfare of SCs, STs, OBCs and Minorities (increase of
₹960 crore). Expenditure on Rural Development decreased as compared to previous
year owing to less expenditure on schemes under Special Component Plan for
Scheduled Castes (decrease of ₹158 crore), Tribal Area Sub-Plan (decrease of
₹131 crore) and Other Expenditure (decrease of ₹592 crore).
• Capital Expenditure during current year (₹22,641 crore) marginally decreased over
preceding year (₹23,902 crore) by five per cent. This was mainly due to decrease
under Irrigation and Flood Control (₹3,478 crore), Transport (₹1,145 crore) and
Energy (₹321 crore).
Decrease under Irrigation and Flood Control was mainly due to less expenditure on
Kaleshwaram Project (₹3,037 crore), Flood Flow Canal Project (₹600 crore),
J. Chokka Rao Devadula Lift Irrigation Scheme (₹419 crore).
The Capital Expenditure, however, was much higher in Water Supply, Sanitation,
Housing and Urban Development on account of increase in expenditure on Mission
Bhagiratha (₹1,917 crore), Swachh Bharath Mission–Gramin (₹1,078 crore), and in
Rural Development on account of Mahatma Gandhi National Rural Employment
Guarantee Scheme (₹1,401 crore).
• Out of the total Development Expenditure32 (₹93,483 crore), 67 per cent was under
Revenue section.
32 Development Expenditure is the expenditure incurred on Social and Economic Services. It includes
Developmental Capital Expenditure (₹21,938 crore), Developmental Revenue Expenditure
(₹62,879 crore) and Development Loans and Advances (₹8,666 crore)

State Finances Audit Report for the year ended March 2019
Page | 20
1.5.2 Revenue Expenditure
1.5.2.1 Committed Expenditure
Committed expenditure of Government consists of interest payments (₹12,586 crore),
salaries and wages (₹23,351 crore), pensions (₹11,477 crore) and subsidies
(₹6,304 crore). The committed expenditure in 2018-19 was ₹53,718 crore and constituted
55 per cent of Revenue Expenditure (Chart 1.9).
Chart 1.9: Committed Expenditure as percentage of Revenue Expenditure
Source: Finance Accounts of years concerned
The following observations were made in audit:
• The burden of committed expenditure measured as a percentage of Revenue
Expenditure of the State, which was steadily rising during the previous years has
declined in 2018-19 (Chart 1.9).
• In comparison to preceding year, there was increase in interest payments
(₹12,586 crore: increase by 16 per cent over 2017-18), Subsidies (₹6,304 crore:
increase by two per cent over 2017-18) and Salaries and Wages (₹23,351 crore:
increase by 1.5 per cent). Pension Payments (₹11,477 crore), on the other hand,
decreased by four per cent.
• Greater reliance on market borrowings by Government in recent years has led
to increase in liabilities on account of interest payments. As a result, the interest
payments relative to Revenue Receipts were much higher at 12.41 per cent as
against target of 8.37 per cent fixed by XIV Finance Commission.
55
10 11
27
7
56
11 11
27
7
61
13 14
27
7
55
13 12
24
6
0
10
20
30
40
50
60
Total Committed
Expenditure
Interest Payments Pension Payments Salaries and Wages Subsidies
in p
er c
ent
2015-16 2016-17 2017-18 2018-19

Chapter I – Finances of the State Government
Page | 21
1.5.2.2 Committed Expenditure – Subsidies
Details of Subsidies for various Departments are shown in Table 1.15:
Table 1.15: Department-wise Subsidies (₹ in crore)
Sl. No. Department 2017-18 2018-19
1 Power 3,262 3,705
2 Civil Supplies 1,181 1,432
3 Social Welfare 828 680
4 Agricultural and other allied activities 304 108
5 Tribal Welfare 267 215
6 Roads, Buildings and Ports 260 130
7 Others 57 34
Total 6,159 6,304
Revenue Expenditure 85,365 97,083
Source: Finance Accounts
It can be seen from above that Subsidies for Power and Civil Supplies increased in
2018-19 over preceding year by ₹443 crore and ₹251 crore respectively. Together Power
(59 per cent) and Civil Supplies (22 per cent) constitute 81 per cent of the Subsidies. On
the other hand, Subsidies of Social Welfare, Tribal Welfare, Transport, Agriculture and
allied activities saw a decline in 2018-19. The decrease of Subsidies on Agriculture and
allied activities is substantial (64 per cent) on account of decreased Subsidies in respect of
Farm Mechanisation and Supply of Seeds.
Further, the Government incurred expenditure as ‘Grants-in-Aid’ and ‘Other expenditure’
which are in the nature of Subsidies like (i) interest free loans to DWCRA Women
(Vaddileni Runalu) (₹1,402 crore), (ii) assistance to Transmission Corporation of
Telangana Limited, for Agricultural and allied subsidy (₹1,256 crore), (iii) assistance to
Municipalities / Corporations for interest free loans (Vaddileni Runalu) (₹166 crore),
(iv) marginal subsidy to Telangana State Scheduled Castes Co-operative Development
Corporation (₹46 crore), (v) power subsidy for industries (₹19 crore), etc. Though, these
are in the nature of subsidies, they are however, not reflected as subsidies and the
committed expenditure is understated to that extent.
Box 1.2: Implementation of a subsidy scheme through funds mobilised in the
nature of Off-Budget Borrowings
Government of Telangana State (GoTS) has taken up a scheme for distribution of four
lakh Sheep units at an estimated cost of ₹5,000 crore in three years from 2016-17 to
2018-19 to four lakh beneficiaries. The objectives were to (i) increase the Rural Economy
in the State through Sheep rearing; (ii) make the State self-sufficient in Meat Production
and export of meat to other states and countries and (iii) to strengthen the Primary Sheep
Cooperative Societies.
An Autonomous Body viz., Telangana State Sheep and Goat Development Cooperative
Federation Limited (TSSGDCFL) was the Nodal agency for implementing the Scheme.
National Cooperative Development Corporation (NCDC) was to finance the scheme with
60 per cent (₹3,000 crore) as loan to TSSGDCFL, 20 per cent (₹1,000 crore) as subsidy

State Finances Audit Report for the year ended March 2019
Page | 22
subject to availability. The remaining 20 per cent (₹1,000 crore) was to be the
contribution from beneficiaries. As of March 2019, a total loan of ₹3,380 crore33 was
drawn by TSSGDCFL from NCDC. The scheme’s funding pattern for the beneficiary
through TSSGDCFL was modified by the GoTS as 75 per cent subsidy (₹3,750 crore)
by the State Government and 25 per cent by the beneficiary contribution (₹1,250 crore).
The loans from NCDC to TSSGDCFL were guaranteed by Government of Telangana
State (GoTS) i.e., in case of default by TSSGDCFL, the Government would repay any
amounts due to NCDC. The total amount of guarantees provided by GoTS to
TSSGDCFL to the end of 2018-19 was ₹3,160 crore.
It was, however, observed in audit that the TSSGDCFL did not have any definite stream
of revenue resources of its own for repayment of loan. It was, in fact, implementing the
scheme for which Government decided to provide subsidies. In the year 2018-19, the
Government provided an amount of ₹493.32 crore, albeit¸ as Loans to TSSGDCFL for
payment of interest (₹267.61 crore) and repayment of principal (₹225.71 crore) to
NCDC.
Thus, it is evident that the State Government was implementing the subsidy scheme
through Off – Budget Borrowings i.e., loans procured by an Autonomous body. The fact
of implementing the scheme through Off-Budget Borrowing was also mentioned in the
Budget speech.
Implementation of a subsidy scheme in the nature of Off-Budget Borrowings
resulted in understatement of Revenue Expenditure.
1.5.2.3 Financial assistance to Local Bodies
Financial assistance to the tune of ₹37,908 crore was provided by the State Government to
local bodies and other institutions by way of Grants and Loans in 2018-19 (Table 1.16).
There was an increase in the overall quantum of assistance in comparison to previous year
(₹30,416 crore) mainly due to increase in assistance to Agriculture and allied activities
(141 per cent), Urban Local Bodies (93 per cent) and Social Welfare (30 per cent).
Under Agriculture and allied activities, increase is mainly due to provision of Grants under
two new schemes viz., Investment Support Scheme (₹9,969 crore) and Insurance to
Farmers (₹659 crore). In Urban Local Bodies increase is mainly under Pradhan Mantri
Awas Yojana (Urban) (₹183 crore) and Hyderabad Road Development Scheme
(₹277 crore). Increase in Social Welfare is mainly under Interest free loans to DWCRA
Women (₹1,377 crore).
33 ₹2,500 crore in 2017-18 and ₹880 crore in 2018-19

Chapter I – Finances of the State Government
Page | 23
Table 1.16: Financial Assistance to Local Bodies and other institutions
(₹ in crore)
Sl. No. Grants given to 2017-18 2018-19
1 Educational Institutions (Aided Schools, Aided Colleges,
Universities, etc.)
1,000 1,037
2 Urban Local Bodies 798 1,542
3 Panchayat Raj Institutions 6,376 5,996
4 Development Agencies 291 236
5 Other Autonomous Bodies 1,093 1,220
6 Co-operative Institutions 56 229
7 Agriculture and allied activities 4,614 11,165
8 Social Welfare 5,177 6,738
9 Rural Development 1,514 1,751
10 Other Institutions 9,497 7,994
Total 30,416 37,908
Assistance as percentage of Revenue Expenditure 36 39
Source: Finance Accounts
Box 1.3: Formation of State Finance Commission
As stipulated in Article 243-I (1) read with 243Y (1) of the Constitution, the Governor
of the State shall constitute a State Finance Commission within the period of one year
from 73rd amendment of the Indian Constitution (1992) and at the end of every five years
thereafter to review financial position of Panchayat Raj Institutions (PRI) and Urban
Local Bodies (ULB) of the State and to recommend principles for distribution of divisible
pool of levies of the State between State and PRI / ULB.
Though constitution of the State Finance Commission was notified in March 2015,
within one year of formation of the Telangana State, the Chairman and member were
appointed only in January 2018.
There after no progress was on records regarding recommendations of the State Finance
Commission.
1.5.2.4 National Pension System
State Government employees recruited on or after 01 September 2004 are covered under
the National Pension System (NPS), which is a defined contributory pension scheme. It is
mandatory for employees to contribute 10 per cent of basic pay and dearness allowance
every month. The State Government has to make equal contribution. The Government has
to transfer these contribution amounts along with details to the National Securities
Depository Limited (NSDL) and to the fund managers appointed by the NPS Trust,
respectively.
On the bifurcation of the erstwhile combined State of Andhra Pradesh in 2014, a balance
of ₹730.64 crore was available in the NPS Deposit Account of the combined Andhra
Pradesh State, pending transfer to NSDL. This amount was to be apportioned between the
States of Andhra Pradesh and Telangana. Of this amount, ₹365.21 crore was apportioned

State Finances Audit Report for the year ended March 2019
Page | 24
in 2018-19, with Telangana State being allocated ₹134.60 crore, leaving an amount of
₹365.43 crore pending apportionment.
Details of contributions by employees and Government and transfers to NSDL are shown
below in Table 1.17:
Table 1.17: Details of Contribution to NPS Deposit Account and transfer to NSDL
(₹ in crore)
Year
Employee
contribution
Government
contribution
Excess (+) /
Shortfall (-)
in
Government
contribution
Total
contributions
in the NPS
Deposit
Account *
Transferred
to NSDL
during the
year
Closing
Balance as on
31st March in
Pension Deposit
Account
1 2 3 4 (=3-2) 5 (=3+2) 6 7
2014-15 197.66 177.65 (-)20.01 375.31 373.66 10.03
2015-16 359.16 371.23 12.07 730.39 769.56 (-)20.83
2016-17 420.14 348.23 (-)71.91 768.37 574.79 177.12
2017-18 481.61 431.74 (-)49.87 913.35 926.89 164.90
2018-19 532.62 604.84 72.22 1,137.46 1,171.58 273.57
Total 1,991.19 1,933.69 (-)57.50
Source: Finance Accounts
*This amount does not include interest on legacy period and Foreign employers’ contribution
As on 01 April 2018, the NPS Deposit Account under Defined Contribution Pension
Scheme for Government Employees (Major Head of Account- 8342, Minor Head of
Account - 117) had an opening balance of ₹164.90 crore. Receipts to the NPS Deposit
Account during the year were Employee contribution (₹532.62 crore), the Government
contribution (₹604.84 crore), Interest contribution for legacy period34 (₹6.95 crore) and
Foreign employers’ contribution (₹1.23 crore). The apportionment amount of
₹134.60 crore was also received in the NPS Deposit Account. Of the total receipts of
₹1,445.14 crore (inclusive of all receipts, apportionment amount and opening balance) the
Government transferred an amount of ₹1,171.58 crore to NSDL, leaving a closing balance
of ₹273.57 crore in the NPS Deposit Account.
The interest liability on the opening balance of ₹164.90 crore was ₹13.19 crore (calculated
at a rate of eight per cent35), for which the Government did not make any provision. Further,
interest will also be due on the amount to be apportioned to Telangana out of the
₹365.43 crore which is pending apportionment.
As Accountant General (Accounts and Entitlements) does not maintain the accounts of
individual employee’s contribution, the correctness of recovery from the employee’s salary
bills cannot be verified. No reconciliation of the amounts transferred has been carried out
with NSDL/ Trustee Bank.
As per provisions of the NPS, the Government has to match the contribution of the
Employees. As seen from the table above, over a period of five years, Employees
34 Pertains to the period from September 2004 to March 2011 35 Interest rate on General Provident Fund (State Government)

Chapter I – Finances of the State Government
Page | 25
contributed an amount of ₹1,991.19 crore to the NPS Deposit Account, while the
Government contributed an amount of ₹1,933.69 crore to the NPS Deposit Account,
resulting in an overall short contribution of ₹57.50 crore by the Government. Thus, the
current liability stands deferred to future years.
Further, the State Government has created an interest liability on the amount of
₹331.07 crore (which is the total of ₹273.57 crore, the amount not transferred to NSDL and
₹57.50 crore, the overall short contribution by the Government over five years), incorrectly
used the funds that belong to its employees and created uncertainty in respect of benefits
due to the employees affected / avoidable financial liability to Government in future, and,
thus leading to possible failure of the scheme itself.
1.5.3 Capital Expenditure
Capital Expenditure (₹22,641 crore) saw a dip in 2018-19 i.e., a decrease of ₹1,261 crore
(5.27 per cent) from the preceding year (₹23,902 crore). The decrease was mainly under
Major Irrigation (₹3,166 crore), Roads and Bridges (₹1,145 crore) and Special
Development for Welfare and Development activities (₹828 crore). On the other hand, the
Capital Expenditure booked under Mission Bhagiratha during 2018-19 increased by
₹1,918 crore which is 375 per cent higher than previous year.
• Out of Capital Expenditure of ₹22,641 crore during the year 2018-19, an
expenditure of ₹4,756 crore was incurred on 20 delayed incomplete projects (please
refer Paragraph 1.6.1 for further details).
• The entire investment of ₹3,389 crore made by the Government during the year was
in 11 companies, none of which has paid any dividend during the year indicating
that the Government investments were in the loss making units in 2018-19 (please
refer Paragraph 1.6.2 for further details).
1.5.4 Quality of Expenditure
Quality of expenditure basically involves two aspects, viz., adequacy of the expenditure
(i.e., adequate provisions for providing public services) and efficiency of expenditure use.
1.5.4.1 Adequacy of public expenditure
A comparison of fiscal priority of Telangana Government with other General Category
States36 (Chart 1.10) revealed that Telangana focussed more on Development Expenditure
(₹93,483 crore) and Capital Expenditure (₹22,641 crore). The focus of Government on
Education was comparatively lesser across the years.
36 Undivided Andhra Pradesh, Bihar, Chhattisgarh, Gujarat, Haryana, Jharkhand, Karnataka, Kerala,
Madhya Pradesh, Maharashtra, Odisha, Punjab, Rajasthan, Tamil Nadu, Uttar Pradesh and West Bengal

State Finances Audit Report for the year ended March 2019
Page | 26
Chart 1.10: Prioritisation in public expenditure in percentage
Source: Finance Accounts
1.5.4.2 Per Capita expenditure in some major socio economic sectors
Per Capita expenditure for 2018-19 of Telangana in some major socio economic sectors
and its comparison with the previous year 2017-18 is given in the Table 1.18 below:
Table 1.18: Per Capita expenditure on some major socio economic sectors
Sector
2017-18 2018-19 Percentage
increase
(+) /
decrease
(-)
Expenditure
(₹ in crore)
Population
of the State
(in crore)
Per capita
expenditure
(in ₹)
Expenditure
(₹ in crore)
Population
of the State
(in crore)
Per capita
expenditure
(in ₹)
Health and
Family
Welfare
5,306 3.70 1,434 5,997 3.72 1,612 12.41
Education,
Sports, Arts
& Culture
12,492 3.70 3,377 11,782 3.72 3,167 (-)6.19
Agriculture 7,135 3.70 1,928 14,187 3.72 3,814 97.82
Rural
Development
4,648 3.70 1,256 4,853 3.72 1,305 3.90
Transport 3,075 3.70 831 2,649 3.72 712 (-)14.32
Source: Expenditure figures from Finance Accounts of respective years and population figures from National
Commission on Population 2019
From the above table the following can be observed:
• Agriculture got the top priority with 97.82 per cent increase in Per Capita
expenditure over previous year due to a new Investment Support Scheme (Rythu
Bandhu). There was a considerable increase (12.41 per cent) on Health and Family
Welfare over previous year.
• There was a considerable dip in the Per Capita expenditure in respect of Transport
(14.32 per cent) and Education, Sports, Arts and Culture (6.19 per cent).
0.00
10.00
20.00
30.00
40.00
50.00
60.00
70.00
80.00
Aggregated
Expenditure
(AE) to
GSDP
Development
Expenditure
in AE
Social Sector
Expenditure
in AE
Economic
Sector
Expenditure
in AE
Capital
Expenditure
in AE
Education in
AE
Health in AE
16.05
67.04
36.5930.45
14.28 14.99
5.07
14.84
72.78
40.45
32.33
17.63
9.174.74
in p
er c
ent
General Category States Telangana

Chapter I – Finances of the State Government
Page | 27
1.5.4.3 Efficiency of expenditure use
Details of Capital and Revenue Expenditure on maintenance of social and economic
services are in Table 1.19 below:
Table 1.19: Efficiency of expenditure on selected social and economic services
(in per cent)
Social/Economic Infrastructure 2017-18 2018-19
Ratio of
CE to TE
In RE, the share
of
Ratio of
CE to
TE
In RE, the share
of
S&W O&M S&W O&M
Social Services (SS)
General Education 1.98 69.63 0.08 2.37 85.27 0.00
Health and Family welfare 5.21 29.15 0.34 8.61 45.77 0.00
Water Supply, Sanitation,
Housing &Urban Development
38.73 10.16 1.77 56.91 14.53 0.35
Total (SS) 7.11 31.17 0.31 12.39 35.61 0.03
Economic Services (ES)
Agriculture & Allied Activities 7.27 12.37 3.34 7.43 9.30 0.00
Irrigation & Flood Control 96.94 63.07 19.10 95.91 67.35 15.12
Power & Energy 38.26 0.00 0.00 32.51 0.30 0.00
Transport 78.47 3.19 50.25 54.01 2.18 4.60
Total (ES) 54.36 11.45 3.59 41.34 10.46 0.51
Total (SS + ES) 30.00 24.94 1.35 25.87 26.34 0.21
Source: Finance Accounts; CE: Capital Expenditure; RE: Revenue Expenditure; TE: Total Expenditure;
S&W: Salaries & Wages; O&M: Operation & Maintenance
It can be seen from above that, the ratio of Capital Expenditure to Total Expenditure in
Water Supply, Sanitation, Housing and Urban Development has increased significantly,
indicating the focus of the Government on asset creation under this sector.
In respect of Revenue Expenditure, the share of Salaries and Wages considerably increased
over the preceding year in Health and Family Welfare followed by General Education under
Social Sector. There was a dip in share of Operation and Maintenance (O&M) over the
previous year in both Social Sector and Economic Sector.
1.6 Government Assets
While the Government accounting system does not provide for comprehensive accounting
of fixed assets like land and buildings owned by the Government, these can be derived from
the accounting of financial liabilities and assets created out of expenditure incurred.
Appendix 1.6 gives an abstract of liabilities and assets, as on 31 March 2019, compared
with the corresponding position on 31 March 2018.
Government assets mainly comprise of Capital outlay, Investments, Loans and Advances
given by the State Government and cash balances.
1.6.1 Capital outlays: Incomplete projects
Capital Expenditure has accounted for 13.83 per cent to 28.22 per cent of the Total
Expenditure in the last five years. During the years 2014-19, an amount of ₹1,01,877 crore
was spent on capital projects.

State Finances Audit Report for the year ended March 2019
Page | 28
Within the capital projects, the major share of the Capital Expenditure was on
Irrigation and Flood Control. An amount of ₹48,349 crore was spent on Irrigation and
Flood control during the last five years. The capital outlay on Irrigation and Flood Control
and its share in total Capital Expenditure of the Government are in Chart 1.11 and
Chart 1.12.
Chart 1.11: Expenditure on Irrigation and Flood Control across years
Chart 1.12: Portion of Irrigation and Flood control in Capital Expenditure
Source: Finance Accounts
Chart 1.13: Status of Major and Medium
Irrigation Projects
Out of the 26 ongoing projects, as
shown in Chart 1.13, there were 20
projects with delays ranging from
three months to 11 years37 beyond
the scheduled date of completion
these projects. The original
estimated cost of these 20 delayed
projects was ₹76,287 crore. The
delays have led to revision of cost
to ₹1,87,848 crore i.e., an
escalation of ₹1,11,561 crore
(146 per cent). An amount of
₹1,00,494 crore has already been
spent so far on these incomplete
projects. Delays in completion of
projects not only adversely
affected the quality of the
expenditure but also deprived the
State of intended benefits of
economic growth.
Source: Based on information furnished by Irrigation and
Command Area Development Department
37 11 years: 6 projects (SRSP Stage II, Peddavagu at Jagannathpur, Sri KomaramBheem, Neelwai,
Palemvagu, Modikuntavagu); 10 years: 1 project (M Baga Reddy Singur Canals); 9 years : 4 projects
(Mahatma Gandhi Kalwakurthi Lift Irrigation Scheme, Rajiv Bheema Lift Irrigation Scheme, Jawahar
Nettempadu Lift Irrigation Scheme, Lendi Project); 8 years: 1 Project (Koilsagar), 7 years: 1 Project
(Sripadasagar Yellampally); 6 years: 3 Projects (AMR SLBC Project, Indiramma Flood flow Canal of
SRSP, Kaleshwaram Lift Irrigation Scheme) and others with a delay of five years or less
-
2,000
4,000
6,000
8,000
10,000
12,000
14,000
2014-15 2015-16 2016-17 2017-18 2018-19
5,194
7,776
13,665 12,596
9,118
₹ i
n c
rore
62.03
57.22
40.95
52.70
40.27
0
10
20
30
40
50
60
70
2014-15 2015-16 2016-17 2017-18 2018-19in
per
cen
t
Total Projects : 71Major -31, Medium - 40
Ongoing : 26
On going projects without delay: 6
Ongoing delayed
projects : 20
Completed: 45

Chapter I – Finances of the State Government
Page | 29
Irrigation projects are taken up and approved on the basis of data that supports an implicit
assumption that the benefits of the project will outweigh the costs. With time overruns,
cost escalations and changes in design, the above averment made at planning stage, would
come to naught.
Further, the State Government did not disclose financial results of any of the
Irrigation projects. As a result, there was no proper assurance of returns from the
heavy public investments in Irrigation and Flood control.
Recommendation 3: State Government may compile working results of Major Irrigation
Projects to assess benefits from persistent heavy investments in Irrigation sector. These
working results would guide future investments in the sector.
1.6.2 Investments
As of 31 March 2019, the State Government’s investments stood at ₹19,754 crore in
Statutory Corporations, Government Companies, Joint Stock Companies and
Co-operatives. During the year 2018-19, Government of Telangana invested
₹3,388.55 crore in 11 entities. These investments were mainly in (i) Power Distribution
Companies of Telangana (DISCOMs) (₹2,400 crore), (ii) Telangana State Seeds
Development Corporation Limited (₹677 crore) and (iii) Telangana Backward Castes
Cooperative Finance Corporation Limited (₹177 crore). However, neither the State
Government nor the individual entities reconciled or confirmed these investments. Further,
the Finance Department did not furnish the files pertaining to fresh investments made
during the year. Hence, audit could not ensure that the investments were made with due
diligence by the State Government and for the purpose for which the entities were created.
Details of Investments made by the Government are shown in Table 1.20 below:
Table 1.20: Return on Investment
Sl.
No.
Investment / Return / Cost of
borrowings
2015-16 2016-17 2017-18 2018-19
1 Investment at the end of the year
(₹ in crore)
1,329 13,075 16,365 19,754
2 Return in the form of Dividend
(₹ in crore)
69 70 101 94
3 Rate of Return (RoR) (per cent) 5.19 0.54 0.62 0.48
4 Average rate of interest on Government
borrowing (per cent)
8.50 7.40 7.21 6.93
5 Difference between RoR
(per cent) and interest rate (3-4)
(-) 3.31 (-) 6.86 (-) 6.59 (-) 6.45
Source: Finance Accounts
As can be seen from the above, Return on Investment (RoI) in these Companies /
Corporations has been very low. Further, even though the investments made by the
Government has increased from ₹1,329 crore in 2015-16 to ₹19,754 crore in 2018-19, there
is no marked increase in RoR from the Companies / Corporations.

State Finances Audit Report for the year ended March 2019
Page | 30
1.6.3 Loans and Advances given by the State Government
Government provides Loans and Advances to Public Sector Undertakings, Local Bodies
and Autonomous Bodies. Table 1.21 presents the details of outstanding Loans and
Advances during the years 2015-19:
Table 1.21: Details of Loans and Advances by State Government
Sl.
No.
Quantum of Loans/Interest Receipts/
Cost of Borrowings
2015-16 2016-17 2017-18 2018-19
1 Opening Balance (₹ in crore) 1,406 6,552 9,798 15,869
2 Amount advanced during the year (₹ in crore) 5,233 3,402 6,209 8,706
3 Amount recovered during the year (₹ in crore) 88 156 138 66
4 Closing Balance (₹ in crore) 6,552 9,798 15,869 24,509
5 Net addition (₹ in crore) 5,145 3,246 6,071 8,640
6 Interest Receipts (₹ in crore) 53 105 84 7
7 Interest receipts as percentage of outstanding
Loans and Advances (in per cent)
0.80 1.07 0.53 0.03
8 Interest payments as percentage to outstanding
liabilities of the State Government (in per cent)
8.50 7.4 7.21 6.39
9 Difference between interest receipts and interest
payments (in per cent)
(-)7.70 (-)6.33 (-)6.68 (-)6.36
Source: Finance Accounts;
Following observations are made in Audit:
• Loans and Advances to Autonomous Bodies and Corporations (₹8,706 crore) in
2018-19 increased significantly by 40 per cent (₹2,497 crore) over preceding year.
This was, however, lower than Budget Estimates of ₹9,036 crore. Major portion of
loans were disbursed for projects relating to Water Supply, Sanitation, Housing and
Urban Development (₹3,596 crore) as well as for Social Welfare and Nutrition
(₹2,400 crore), Road Transport (₹753 crore), Health & Family Welfare
(₹621 crore), Agriculture and allied services (₹575 crore). Total balance of Loans and
Advances given to the end of 31 March 2019 was ₹24,509 crore.
• The State Government has not confirmed the overdue Principal amount and interest
under Loans and Advances. Further, acceptance of loan amounts, loan agreements
and statement of reconciliation of outstanding loans were not made available to audit.
As a result, it cannot be assured that the outstanding loans in the Government
Accounts are properly reflected as borrowings from the Government in the records of
the Loanee institutions.
Government advanced a loan of ₹276.28 crore and Grants-in-Aid of ₹222.60 crore in
2017-18 to Arogyasri Health Care Trust (AHCT). On cross verification of annual
Receipts and Payment accounts of AHCT with that of Government Accounts, it was
noticed that the annual Receipts and Payment accounts of AHCT depicted
₹182.05 crore as Advances and ₹461.38 crore as Grants-in-Aid. This indicates that
the depiction of Loans and Grants by the institutions was not in conformity with the
accounts of the Government.
Chapter I – Finances of the State Government
Page | 31
• The Government has also been providing loans to Autonomous Bodies which are
implementing Government subsidy schemes and which do not have a definite stream
of revenue resources for servicing debt. Out of ₹24,509 crore loans provided by the
Telangana Government after formation of the State, 28 per cent i.e., ₹6,920 crore38
were provided to such institutes without definite stream of revenues of their own for
debt servicing.
• As discussed earlier in paragraph 1.3.1, funds amounting to ₹2,300 crore kept in
Personal Deposit Account of two institutions39 originally debited under loan heads
of account in 2017-18 and lapsed at the end of the year were resumed and credited
back to the receipt head of account in 2018-19 instead of minus debit of the loan head.
These amounts were, however, continued to be shown as outstanding under Loans in
Government assets, and hence do not indicate the real worth of Government assets.
• Further, the Government gave fresh loans of ₹671 crore to Hyderabad Metropolitan
Water Supply and Sewerage Board (HMWSSB), and ₹19 crore to Telangana State
Industrial Infrastructure Corporation (TSIIC) for repayment of their past loans.
Government also gave loans (₹493.32 crore) for repayment of loan (₹225.71 crore)
and payment of interest (₹267.61 crore) by Telangana State Sheep and Goat
Development Cooperative Federation Limited (TSSGDCFL) to National Cooperative
Development Corporation (NCDC) (please refer to paragraph 1.5.2.2 for further
details).
• The accounts of bodies like Hyderabad Metropolitan Water Supply and Sewerage
Board (HMWSSB) were in arrears since 2010-11. The Government, however,
provided loans amounting to ₹5,932.30 crore to the Board to end of 31 March 2019
to this institution.
Providing unconditional loans and further loans to repay past loans without insisting
on the financial discipline of rendering timely accounts etc. are detrimental to public
accountability and indicative of poor financial management.
• The current level of recovery of loans was very low. An amount of ₹7,807 crore was
estimated, in the budget, to be recovered in 2018-19. The actual recovery (₹66 crore)
in 2018-19 was only 0.85 per cent. The Budget Estimates in this regard were
consistently inflated in comparison to previous years’ recovery trends40.
38 Telangana State Scheduled Castes Cooperative Development Corporation Limited (₹3,142 crore),
Telangana State Scheduled Tribes Cooperative Finance Corporation Limited (₹1,776 crore), Arogyasri
Health Care Trust (₹924 crore), Telangana State Sheep and Goat Development Cooperative Federation
Limited (₹684 crore), Telangana State Civil Supplies Corporation Limited (₹393.78 crore) 39 Telangana State Scheduled Castes Cooperative Development Corporation Limited (₹1,500 crore) and
Telangana State Scheduled Tribes Cooperative Finance Corporation Limited (₹800 crore). 40 In 2015-16, the recovery of loans and advances was ₹88 crore (10.06 per cent) as against budget
provision of ₹875 crore. The Budget Estimates in the 2016-17 was ₹2,874 crore, the recovery of loans
was ₹156 crore (5.43 per cent). The Budget Estimates in the 2017-18 was ₹5,807 crore, the recovery of
loans was ₹138 crore (2.38per cent). The Budget Estimates in the next year was ₹7,807 crore.

State Finances Audit Report for the year ended March 2019
Page | 32
Low recovery and increase in amounts advanced have together led to increase in the
amount of outstanding loans there by having an impact of ₹8,640 crore in the Fiscal
Deficit.
• Interest receipts from outstanding Loans and Advances have been decreasing for the
last two years and are a meagre 0.03 per cent in 2018-19.
Recommendation 4: The State Government may place on record debt servicing capacity
of the institutions before providing loans.
1.6.4 Cash balance
The State Government’s cash balances at the end of March 2019 amounted to ₹7,218 crore
(Appendix 1.3). Out of this, an amount of ₹7,309 crore41 was cash balance investments
(₹1,588.95 crore) and investments in earmarked funds (₹5,719.69 crore) including Sinking
Funds (₹4,877.14 crore) and Guarantee Redemption Fund – Investment Account
(₹837.70 crore). Table 1.22 depicts the cash balances and investments made by the State
Government out of cash balances during the year:
Table 1.22: Cash Balances and Investment of Cash Balances
(₹ in crore)
Opening
balance as on
01-04-2018
Closing
balance as on
31-03-2019
Increase(+)/
Decrease(-)
(a) General Cash Balance
Cash in Treasuries --- --- ---
Deposits with Reserve Bank 76.03 (-)93.29 (-)169.32
Deposits with other Banks --- --- ---
Remittances in transit - Local 2.07 2.07 0
Total 78.10 (-)91.22 (-)169.32
Investments held in Cash Balance investment
account
2,277.42 1,588.95 (-)688.47
Total (a) 2,355.52 1,497.73 (-)857.79
(b) Other Cash Balances and Investments
Cash with Departmental officers viz., Public
Works Department Officers, Forest
Department Officers, District Collectors
--- --- ---
Permanent advances for contingent
expenditure with Departmental officers
0.30 0.30 0
Investment of earmarked funds 4,637.09 5,719.69 1,082.60
Total (b) 4,637.39 5,719.99 1,082.60
Grand total (a)+ (b) 6,992.91 7,217.72 224.81
The Cash Balances at the end of March 2019 increased by ₹224.81 crore i.e., increase by
three per cent compared to previous year.
The State Government has to maintain a mandatory minimum daily cash balance of
₹1.38 crore with the Reserve Bank of India (RBI). The Governments can avail Special
Drawing Facility (SDF42) against the collateral of Consolidated Sinking Fund (CSF),
41 This includes minus balance of ₹93.29 crore under Deposits with Reserve Bank. 42 previously known as Special Ways and Means Advances

Chapter I – Finances of the State Government
Page | 33
Guarantee Redemption Fund (GRF) and Auction Treasury Bills (ATBs) balances and other
investments in Government securities. The State Governments would be facilitated by RBI
with Ways and Means Advances (WMA) for meeting temporary cash mismatches.
Overdraft (OD) is advanced to the State Governments beyond their WMA limits.
State Government maintained mandatory minimum daily cash balance of ₹1.38 crore with
RBI for 197 days during the year. State Government depended on SDF (for 168 days:
₹5,606.47 crore), WMA (for 135 days: ₹13,616.88 crore) and OD (for 32 days:
₹2,599.92 crore) for maintaining the minimum balance with RBI.
In monetary terms, however, SDF / WMA / OD marginally decreased by ₹1,099 crore
(five per cent decrease) to ₹21,823.27 crore in 2018-19 from ₹22, 921.77 crore in 2017-18,
however it still indicates increasing dependency of Government on WMA. The interest
payment on WMA (including SDF and OD) during 2018-19 was ₹15.44 crore as against
₹13.82 crore in 2017-18, i.e., 12 per cent increase.
1.7 Government Liabilities
Total Liabilities of the Government consist mainly of internal borrowings, Loans and
Advances from GoI and balances in the Public Account. The total liabilities of the State as
of 31 March 2019 was ₹1,96,963 crore; its composition is at Chart 1.14.
Chart 1.14: Components of total liabilities of the State Government
Total Liabilities (₹1,96,963 crore)
Internal Debt from Market, financial institutions, etc.
(₹1,56, 933 crore)
Loans and Advances from Government of
India (₹8,231 crore)
Public Account Liabilities where
Government acts as a banker (₹31,799crore)
Market Loans
(₹1,33,719 crore)
Loans for Central Plan Schemes and other Loans
(₹8,214 crore)
Small Savings, Provident Fund, etc.(₹10,117 crore)
Bonds(₹8,923 crore) Non Plan Loans
(₹17 crore) Reserve Fund bearing interest (₹377 crore)
Loans from Financial Institutions (₹4,721 crore)
Reserve Fund not bearing interest (₹1,591 crore)
Special Securities issued to NSSF(₹8,860 crore)
Deposits bearing interest (₹2,440 crore)
Other Loans(₹710 crore) Deposits not bearing
interest (₹17,274 crore)
Source: Finance Accounts
Audit analysis showed that the liabilities are on an ascending trend (Chart 1.15) over the
last four years. The total liabilities of the Government are 1.94 times of its Revenue
Receipts. The liabilities constitute 22.75 per cent of the Gross State Domestic Product
(GSDP), which, however, is within the limit of 25 per cent prescribed by Medium Term
Fiscal Policy Statement (MTFP). The liabilities grew by 18.76 per cent over preceding
year.

State Finances Audit Report for the year ended March 2019
Page | 34
Chart 1.15: Trend of liabilities (₹ in crore)
Source: Finance Accounts
1.7.1 Reserve Funds
Reserve Funds are created for specific and defined purposes. These are funded by
contributions/Grants from the Consolidated Fund of the State. Out of the gross accumulated
balance of ₹7,687.68 crore lying in these Funds as on 31 March 2019, ₹5,719.69 crore was
invested in the GoI Securities, leaving the total net accumulated balance of ₹1,967.99 crore
(Reserve Funds bearing Interest: ₹377.07 crore and Reserve Funds not bearing Interest:
₹1,590.92 crore).
1.7.1.1 Consolidated Sinking Fund
Sinking Fund was created in the year 1999-2000 for amortisation of State’s liabilities. As
per guidelines43, the State Government may contribute annual contributions to the Sinking
Fund at 0.5 per cent of the outstanding liabilities at the end of the previous financial year.
Accordingly, ₹829.25 crore was to be contributed in 2018-19 on the outstanding liabilities
of ₹1,65,849 crore at the end of 2017-18. The contribution of State Government in
2018-19 was ₹500 crore. Further the interest earned on the investment from CSF was
₹352.31 crore. Thus, the total addition to CSF during the year was ₹852.31 crore.
1.7.1.2 Guarantee Redemption Fund
As per guidelines of Reserve Bank of India, Government of Telangana created44
(June 2014) the Guarantee Redemption Fund (GRF) to meet its obligation pertaining to the
Guarantees given by the Government on loans raised by bodies such as Public Sector
Undertakings, Special Purpose Vehicles, etc., outside of the State budget. In case of default
by the borrower, these guarantees become liabilities of the State Government. As such,
guarantees, generally, are contingent liabilities.
A minimum of 0.5 per cent of outstanding guarantees was envisaged as annual contribution
to raise the Fund to a minimum level of three per cent in next five years and eventually to
a level of five per cent. Accordingly, ₹388.56 crore was to be contributed in 2018-19 on
43 G.O.Ms.No. 3, Finance (DCM), dated 11 June 2014 on Revised Scheme of Consolidated Sinking Fund 44 G.O.Ms.No. 4, Finance (DCM), dated 11.06.2014
97,992
1,34,738
1,65,8491,96,963
83,772
1,12,830
1,34,287
1,56,933
8,2138,406
8,631 8,2316,007
13,502 22,93131,799
0
50,000
1,00,000
1,50,000
2,00,000
2015-16 2016-17 2017-18 2018-19
₹ i
n c
ro
re
Total liabilities Internal Debt Loans and Advances Public Account Liabilities

Chapter I – Finances of the State Government
Page | 35
the outstanding value (₹77,713 crore) of guarantees. State Government, however, has
contributed only ₹200 crore leaving a shortfall of ₹188.56 crore.
• The total available balance in GRF as of March 2019 was ₹837.69 crore45. This
was only 1.08 per cent of the outstanding amount of guarantees (₹77,713 crore) as
against the targeted three per cent i.e., ₹2,331.39 crore. Thus, there was a short
contribution of ₹1,493.70 crore in the Guarantee Redemption Fund.
• The State Government did not contribute in 2016-17 and 2017-18, though, it
contributed ₹83.94 crore in 2015-16.
1.7.1.3 State Disaster Response Fund
The State Government constituted State Disaster Response Fund (SDRF) in 2010-11. As
per the guidelines of the Fund, Government of India (GoI) and State Governments are
required to contribute to the Fund in proportion of 75:25 respectively.
The amount available in the SDRF at the beginning of the year was ₹66.71 crore. During
2018-19, GoI contributed ₹226.50 crore and State Government had contributed its share of
₹75.50 crore to the fund. Out of ₹368.71 crore available in the fund, an amount of
₹15.23 crore was utilised, leaving a balance of ₹353.47 crore.
1.7.1.4 Non-discharge of interest obligation towards interest bearing deposits – Zilla
Parishad Provident Fund
Deposit account “MH 8338 - Deposits of Local Funds” includes contributions of employees
of Zilla Parishads towards Provident Fund and payments made therefrom. The individual
Provident Fund Accounts (ZPPF) are maintained by the Chief Executive Officer (CEO),
Zilla Parishad of the district concerned. Since this is under the category of ‘deposits bearing
interest’, the State Government has a liability to pay interest on balances in this account.
Director of State Audit is responsible to consolidate the total interest payable on the
balances and send proposals to Finance Department for necessary budget provision towards
interest on ZPPF.
The Director of State Audit intimated that an amount of ₹934.55 crore was due towards interest
on Zilla Parishad Provident Fund in respect of Panchayati Raj employees from 2000-01 to
2018-19.
Thus, undischarged liability being postponed increases the burden on the Governments’ Revenue
Expenditure at later date.
1.7.2 Guarantees
The State Government, at times, stands as a Guarantor for the loans obtained by
Government Companies, Corporations or Autonomous Bodies. The Guarantees given by
the Government might become the liabilities of the State Government in case of default by
the borrower.
45 including interest earned of ₹54.06 crore during the year

State Finances Audit Report for the year ended March 2019
Page | 36
Fiscal Responsibility and Budget
Management (FRBM) Act, 2005 stipulated
that the annual risk weighted guarantees are
to be limited to 90 per cent of the total
Revenue Receipts in the preceding year.
The outstanding guarantees (₹77,713 crore)
(Chart 1.16) at end of 2018-19 stood at
87 per cent of total Revenue Receipts of the
preceding year (₹88,824 crore). The
outstanding Guarantees were within the
FRBM ceiling (90 per cent).
Chart 1.16: Status of Outstanding Guarantees
Source: Finance Accounts
Out of the total loans guaranteed by the Government, 65 per cent pertained to two Special
Purpose Vehicles viz., (i) Telangana Drinking Water Supply Corporation for implementation of a flagship project: Mission Bhagiratha and (ii) Kaleshwaram Irrigation
Project Corporation Limited for implementation of Kaleshwaram Project (Chart 1.17).
Chart 1.17: Entities in receipt of guarantees at the end of 31 March 2019
Source: Finance Accounts
The erstwhile Government of Andhra Pradesh (Combined) issued (September 2003)
instructions46 to be followed while providing guarantees. Audit analysed the compliance of
the instructions contained in the Government Order by the State Government while
extending the guarantees during 2018-19. The following are the findings in Audit:
46 G.O.Ms.No.446, dated 29 September 2003
26,619
29,965
41,892
77,713
25,000
40,000
55,000
70,000
85,000
2015-16 2016-17 2017-18 2018-19
₹ i
n c
rore
23,014
27,990
3,487 3,361 4,270 3,1601,920
4,1416,370
0
10,000
20,000
30,000
Guarantees given by Government
(₹ in crore)
Telangana Drinking Water Supply Corporation
Kaleshwaram Irrigation Project Corporation Limited
Hyderabad Metropolitan Water Supply and Sewerage Board
Telangana State Power Finance Corporation
Telangana State Housing Corporation Limited
Telangana Sheep and Goat Cooperative Federation Limited
Telangana State Road Development Corporation
Telangana State Water Resources Infrastructure Development Corporation Ltd.
Others

Chapter I – Finances of the State Government
Page | 37
• The Government Order required that the financial performance of the borrowing
entity shall be analysed in terms of its profitability, operational strength, and financial
ratios. However, audit observed that :
o The Government extended Guarantees (₹3,487 crore) to loans taken by
Hyderabad Metropolitan Water Supply and Sewerage Board (HMWSSB) whose
annual accounts were in arrears from 2010-11 onwards.
Box 1.4: Guarantees to Kaleshwaram Irrigation Project Corporation Limited
The Kaleshwaram Irrigation Project was implemented by Irrigation and Command Area
Development (I&CAD) Department through a SPV, viz., Kaleshwaram Irrigation
Project Corporation Limited (KIPCL). The Detailed Project Report (DPR) of
Kaleshwaram Project mentioned that the project would hardly generate any revenues as
irrigation water was being provided at a very nominal water charges since the command
area lies in the drought prone districts of Telangana. Hence, no analysis of the revenues
was made in the DPR since there were no proposals for imposing water charges.
It was observed in audit that while providing guarantees of ₹27,990 crore to KIPCL for
obtaining loans from various Banks, the I&CAD Department stipulated a condition that
KIPCL shall undertake to repay the loans through revenue accruals from the project or
project revenues.
In view of the mention in the DPR that there might be hardly any revenues from
the Project, there is a risk that the Guarantee given by the State Government to
KIPCL turns out to be an off budget borrowing.
The above indicates that the State Government provided Guarantees to the
organisations without ensuring financial accountability through which financial
performance could be assessed. Providing Guarantees without proper risk evaluation
assumes importance in the back ground that all the Guarantees given by the
Government were categorised as 100 per cent risk weighted as per the Statement of
Fiscal Policy presented to the Legislatures.
• The Government Order of 2003 stipulated that the guarantee shall cover only the
principal portion of the loan and not the interest thereon. In case, interest was also to
be guaranteed, the reason for the same shall be detailed by the borrowing entity, and
the same shall be examined by the Government. Guarantees worth ₹3,230 crore were,
however, extended by the Government for three institutions47 covering interest
portion also. No reasons were found on record or furnished to audit for extending
guarantees for the interest portion.
• Further, the GO also stipulated a Guarantee Commission of 0.5 per cent per annum
or two per cent consolidated for the entire guarantee period from the borrowing entity.
As such, Guarantee Commission of ₹388.56 crore48 was to be received by the
Government to the end of March 2019 from 26 institutions to which Guarantees of
47 Telangana State Sheep and Goat Development Cooperative Federation Limited (₹3,160 crore), Singareni
Collieries Company Limited (₹66.33 crore) and Co-operative Sugar Factories (₹4.02 crore) 48 calculated at a rate of 0.5 per cent on the total guaranteed amount of ₹77,713 crore

State Finances Audit Report for the year ended March 2019
Page | 38
₹77,713 crore were provided. Guarantee Commission of, however, ₹340 crore was
received under Miscellaneous General Services from only one institution viz.,
Telangana State Water Resources Infrastructure Development Corporation Limited
(TSWRIDCL). This was much higher (₹319.29 crore) than the Guarantee
Commission of ₹20.71 crore actually receivable from TSWRIDCL on outstanding
guarantees of ₹4,141 crore.
As the accretions by way of Guarantee Commission realised during the year would
have to be transferred to Guarantee Redemption Fund in the succeeding year, short
collection would make the GRF underfunded.
1.7.3 Debt Management
Outstanding Public Debt (internal debt and Loans and Advances from Government of
India) of the State Government as of 31 March 2019 is ₹1,65,164 crore. The Outstanding
Public Debt increased by 16 per cent over the preceding year, at a slightly higher rate than
the growth of GSDP.
1.7.3.1 Debt analysis – Debt Sustainability and trends of debt repayment
Debt sustainability is defined as the ability of the State to service its debt liability in the
future. Sustainability of debt therefore also refers to sufficiency of liquid assets to meet
current or committed obligations and the capacity to keep balance between costs of
additional borrowings, with returns from such borrowings. It means that increase in Fiscal
Deficit should match with the increase in capacity to service the debt. Table 1.23 analyses
the Debt sustainability of the State according to these indicators.
Table 1.23: Debt Sustainability: Indicators and Trends
Particulars 2015-16 2016-17 2017-18 2018-19
Rate of growth of outstanding debt (public debt and other
liabilities) (in per cent)
22.67 37.50 23.09 18.76
Rate of growth of GSDP (in per cent) 14.24 14.04 14.38 14.84
Average interest rate of outstanding debt 8.50 7.40 7.20 6.90
Interest Payments/Revenue Receipt (in per cent) 9.93 10.40 12.20 12.41
Receipts under Public Debt and other liabilities (₹ in crore) 61,136 91,902 1,06,641 1,17,715
Repayment (principal and interest) under public debt and
other liabilities (₹ in crore)
50,581 68,160 89,039 1,03,666
Debt Redemption ((Principal + Interest Payments) / Debt
Receipts)) (in per cent)
82.74 74.17 83.49 88.07
Net Availability of Borrowed Fund (₹ in crore)
(per cent)
10,555
(17.26)
23,742
(25.83)
17,602
(16.51)
14,049
(11.93)
Source: Finance Accounts
Notes: Receipts and Repayments under Public Debt include Ways and Means Advances
The following are observed:
• Interest Payments: Interest payments are increasingly consuming Revenue Receipts.
Interest payments as percentage of Revenue Receipts increased from
9.93 per cent in 2015-16 to 12.41 per cent in 2018-19. The interest payments relative
to Revenue Receipts were much higher at 12.41 per cent in comparison to the target
of 8.37 per cent fixed by XIV Finance Commission.

Chapter I – Finances of the State Government
Page | 39
• Net Availability of Borrowed Funds: The Net Availability of Borrowed Funds
(NABF) indicates the amount that can be utilised by Government for its activities
after payment of interests and repayment of borrowings. The NABF for purpose
other than Debt repayment was ₹14,049 crore. The net availability of borrowed
funds was lower in 2018-19 in comparison to 2017-18, when it was ₹17,602 crore.
It can be noted that there was a decrease (₹3,553 crore) in NABF despite higher
(₹2,908 crore) market borrowings in comparison to 2017-18 (₹26,231 crore) on
account of higher interest payments (₹1,750 crore) and higher principal repayments
(₹12,877 crore). As a result, only 11.93 per cent of borrowed funds were available
as compared to 16.51 per cent in 2017-18 .
• Domar Model of Debt sustainability : Fiscal Deficit of the State as a proportion of
GSDP has fluctuated during the last four years between 2015-16 (3.23 per cent) and
2018-19 (3.11 per cent) with higher fiscal deficits in 2016-17 (4.3 per cent) and
2017-18 (3.55 per cent). The State registered Revenue Surplus and Primary Deficit
during 2015-16 to 2018-19.
There are various approaches at assessing the debt sustainability, one such approach
is Domar model49.
An analysis on debt sustainability was carried out using this approach. The details are as
follows:
g-r (g: real economic growth
rate; r : real interest rate
without taking inflation in to
account)
s<0 (primary deficit)
(s: Primary Balance)
s>0 (primary surplus)
(s: Primary Balance)
g-r > 0
(strong economic growth)
public debt will converge to a
stable level greater than zero
public debt will converge to a
stable level less than zero
leading to public savings
g-r < 0
(slow economic growth)
public debt will increase
indefinitely, without converging
to a stable level
undefined situation
The results of applying the analysis to Telangana are shown in Table 1.24 below:
Table 1.24: Debt Sustainability as per Domar model
Year Real Growth rate
(g)
Real Interest
rate ( r )
Domar
gap (g-r)
Primary Deficit (-) /
Surplus ((+) s) (₹ in crore)
2015-16 11.58 2.98 8.60 (-) 11,298
2016-17 9.39 1.25 8.14 (-) 26,672
2017-18 10.15 3.35 6.80 (-) 15,864
2018-19 10.50 4.31 6.19 (-) 14,363
Source: Finance Accounts
Further, Debt to GSDP ratio stood at 22.75 per cent and the Fiscal Deficit to GSDP
ratio at 3.11 per cent in 2018-19. The corresponding Fiscal target of Debt limit as per
Fiscal Responsibility and Budget Management (FRBM) Act, 2005 (amended in 2016)
was 25 per cent, and Fiscal Deficit ceiling was 3.5 per cent of GSDP. Fiscal target of
Debt limit as per XIV FC was 23.33 per cent and Fiscal Deficit ceiling was
49 E.D. Domar, 1914-1997

State Finances Audit Report for the year ended March 2019
Page | 40
3.25 per cent of GSDP. The Capital Expenditure of the State has hovered between
2015-16 (14.3 per cent) and 2018-19 (14.4 per cent) with higher Capital Expenditure
in 2016-17 (28.2 per cent) and 2017-18 (16.7 per cent).
During 2014-15 to 2018-19, the State has registered primary deficit. However, it is seen
that the Domar gap (g-r) is positive during the entire period from 2015-16 to 2018-19.
Therefore, as per the Domar model, the public debt is stated to be stable. It is, however,
noteworthy that the Domar gap (g-r) has been registering a decreasing trend. Moreover,
other factors such as public account liabilities and force majeure events50 and/or any
other un-inventoried losses of revenue also have to be reckoned in assessing the debt
sustainability/stability of the State51.
• Market borrowings : Market borrowings (₹1,33,719 crore) form a major portion
(85 per cent) of the internal debt (₹1,56,933 crore) of the State Government, with
interest rates ranging from 5 to 13.99 per cent. In 2018-19, the State Government
borrowed fresh market loans of ₹26,742 crore (Chart 1.18) and repaid ₹4,558 crore
(Chart 1.19). The outstanding market borrowings as of 31 March 2019 were
₹1,33,719 crore. The net increase of market borrowings during the year was 20 per cent
(₹22,184 crore).
Chart 1.18: Internal Debt Taken
(₹ in crore)
Chart 1.19: Internal Debt Repaid
(₹ in crore)
Source: Finance Accounts
1.7.3.2 Debt repayment schedule
Public Debt maturity profile (Chart 1.20) indicates commitment on the part of the
Government for debt repayment or debt servicing in the coming years.
50 Like current Coronavirus crisis & its effect on GSDP. 51 As these cannot be anticipated or determined statistically, these have not been factored in the analysis
-
10,000
20,000
30,000
40,000
8,201 13,848
21,861 24,600 26,742
1,293
2,616
9,914
995 1,963
Loans taken from Bonds, financial institutions,
special securities etc
Market loans taken
0
1000
2000
3000
4000
5000
6000
7000
588 1,118 1,283
2,772
4,5581,139
1,464 1,434
1,366
1,500
Loans Repaid - Bonds, financial institutions,
special securities etc
Market loans Repaid

Chapter I – Finances of the State Government
Page | 41
Chart 1.20: Debt Maturity profile
Source: Finance Accounts
Note: The total of ₹1,58,028 crore above varies with total outstanding debt of ₹1,65,164 crore due to
non-availability of maturity details for debt servicing for ₹7,136 crore in the Finance Accounts.
The maturity profile of outstanding stock of public debt as on 31 March 2019 showed that
46 per cent (₹76,262 crore) of the total outstanding debt was to be repaid in next seven
years and the balance thereafter. The State needs to augment its resources or it would
be forced to curtail its expenditure to meet the increasing debt repayment burden over
the next seven years.
Out of ₹26,742 crore market borrowings made in 2018-19, repayment of 51 per cent is due
in the year 2043 (₹13,718 crore) and 23 per cent in 2038 (₹6,250 crore). This indicates
that in 2018-19, the Government has been, borrowing loans with longer maturity of 20 and
25 years with interest rates ranging from 7.75 per cent to 8.75 per cent.
Box 1.5: Long term Projections
The internal debt from market, financial institutions etc was ₹1,56,933 crore and Loans
and Advances from Government of India was ₹8,231 crore totalling to ₹1,65,164 crore
(paragraph 1.7.1). Apart from servicing the debt, the State Government is also
committed to fund 20 capital intensive irrigation projects that are in various stages of
construction. The revised cost of these projects is ₹1,87,848 crore, out of which
₹1,00,494 crore was spent, leaving a further financial requirement of ₹87,354 crore on
these delayed projects. There are another six ongoing projects, whose cost is estimated
at ₹19,360 crore. Thus, Government will need to gather more than ₹1.78 lakh crore52 over the next seven years to meet its commitments.
Government also carries a direct contingent liability for another ₹77,713 crore by way of
Guarantees mainly on account of Telangana Drinking Water Supply Corporation for
Mission Bhagiratha (₹23,014 crore) and Kaleshwaram Irrigation Project Corporation
Limited (₹27,990 crore) for Kaleshwaram Project. In view of the mention in the DPR of
Kaleshwaram project that the Project would hardly generate any revenues, the
Government would have to shoulder the responsibility of repaying the Loans taken by
KIPCL in case it is unable to generate enough resources for servicing the debts.
52 ₹76,262 crore towards debt repayment, ₹87,354 crore for commitment towards delayed incomplete
irrigation projects and ₹14,326 crore for ongoing irrigation projects
8,353
15,536 23,197 29,176 33,465 48,301
0% 10% 20% 30% 40% 50% 60% 70% 80% 90% 100%
Am
ou
nt
to b
e re
pai
d
(₹ i
n c
rore
)
0-1 years 1-3 years 3-5 years 5-7 years 7-15 years 15-30 years

State Finances Audit Report for the year ended March 2019
Page | 42
In the year 2018-19, the State Government has provided, albeit as a Loan, amounts for
payment of interest and repayment of principal in respect of Telangana State Sheep and
Goat Development Federation Corporation Limited (₹3,160 crore) for which it stood as
a Guarantor.
The above indicates that there is a need for the State Government to undertake a study,
supported by future projections, to measure its total fiscal commitments and the ability
to meet them. Such study would help in risk assessment on its future borrowings or plan
its receipts. It would also help in planning for Government’s long-term debt servicing
needs in view of longer-term borrowings.
1.8 Fiscal Reform Path
The State Government (combined State), in compliance with the recommendations of the
Twelfth Finance Commission (TFC), enacted the Fiscal Responsibility and Budget
Management (FRBM) Act, 2005 (amended in 2016).
1.8.1 Disclosures not made
Fiscal Responsibility and Budget Management (FRBM) Act, 2005 places an onus on the
State Government to monitor and control the Fiscal Deficit. It also requires the State
Government to make disclosures and statements under Section 10 of FRBM Act, 2005
together with Rule 6 of Fiscal Responsibility and Budget Management Rules, 2006.
The State Government, however, did not make the following four out of ten disclosures
required to be made:
• Statement of Assets;
• Claims and commitments made by the Government on revenue demands raised but
not realised;
• Liability in respect of major works and contracts, committed liabilities in respect of
land acquisition charges and claims on State Government in respect of unpaid bills
on works and supplies;
• Details of number of employees in Government, public sector and aided institutions
and related salaries and pensions in the forms prescribed under FRBM Legislation.
1.8.2 Fourteenth Finance Commission Ceiling and achievements
Achievement of Government on key indicators in terms of targets prescribed by the
XIV Finance Commission with regards to fiscal reform path is as below:
• As per XIV Finance Commission recommendations, the outstanding debt53 to
GSDP ratio (in per cent) was to be less than 23.33 per cent for the year 2018-19.
The achievement of the Government was 22.75 per cent, which is well within the
permissible limit.
53 Total outstanding debt includes Public Debt and Public Account Liabilities

Chapter I – Finances of the State Government
Page | 43
• The ceiling limit prescribed as per the XIV Finance Commission recommendations
for Fiscal Deficit was 3.25 per cent of the GSDP (₹8,65,688 crore). The
achievement in 2018-19 (₹26,949 crore) was 3.11 per cent, which is within the
limit.
1.9 Apportionment of Assets and Liabilities between Andhra Pradesh
and Telangana
As per the Andhra Pradesh State Reorganisation Act, 2014, the balances under
Cumulative Capital Expenditure, Loans and Advances, Public Debt and the balances
under Public Accounts are to be apportioned between Andhra Pradesh and Telangana
States. The status of apportionment as on 31 March 2019 is as under (details are at
Appendix 1.7):
• Out of the outstanding un-apportioned balance of ₹17,082.77 crore available
under Deposits and Advances, an amount of ₹4,478.89 crore was apportioned
to Telangana and ₹8,129.83 crore was apportioned to Andhra Pradesh in
2018-19 leaving un-apportioned balance of ₹4,474.04 crore.
• An amount of ₹1,51,349.67 crore under Capital Heads, ₹28,099.69 crore under
Loans and Advances, ₹4,474.04 crore under Deposits and Advances,
₹238 crore under Suspense and Miscellaneous and ₹310.24 crore under
Remittances was yet to be apportioned even after more than five years of State
Re-organisation. Major amounts under Capital Head pertain to Major Irrigation
(₹87,707.44 crore) and Roads and Bridges (₹17,182.87 crore). Major amount
under Loans and Advances pertain to Loans for Housing (₹13,182.17 crore).
As such the depicted assets and liabilities of the State Government in the Finance
Accounts are affected to that extent.


Chapter 2 Financial Management and Budgetary Control
The Comptroller and Auditor General of India performs the audit of Appropriations to
ascertain whether the expenditure actually incurred under various Grants underlying the
budget is within authorisations given under the Appropriation Act for the year, whether the
expenditure required to be charged under provisions of the Constitution is so charged, and
whether expenditure is incurred in conformity with the law, relevant rules, regulations and
instructions. This Chapter analyses the Appropriation Accounts of the Government for the
year 2018-19.
2.1 Financial Accountability and Budget Management
Government of Telangana adopted1 Codes/Rules/Manuals of Government of Andhra
Pradesh with effect from 02 June 2014. The State Legislature initially passes the annual
budget proposals of the Government. When the initial allocation is found to be inadequate
or expenditure has to be incurred on a new item, the State Government presents
Supplementary demands (Para 15.24 of the Budget Manual) before the Legislature for
approval. Re-appropriation is a mechanism which allows the State Government to transfer
savings from one sub-head (usually a scheme) to another, provided such transfers occur
within the same Grant2 and under the same section3. Appropriation Accounts captures the
data along the entire process of budget formulation and implementation (Chart 2.1).
Chart 2.1: Flow chart of budget implementation
Approval by the Legislature Implementation by the Governmennt
Source: Based on the procedure prescribed in Budget Manual and Appropriation Accounts
1 G.O.Ms.No.69, Finance (TFR) Department, dated 30 May 2016 and in accordance with Section 101 of
the Andhra Pradesh Reorganisation Act-2014 2 Grant means the amount voted by the Legislative Assembly in respect of a demand for Grant 3 Capital, Revenue and Loans sections
OriginalBudget
(Charged and
Voted)
Supple-mentaryProvision (Charged
and Voted)
Total Budget
approved by Legislature (Charged
and Voted)
Re-appropriatioins
•for transfer from one scheme to another
Expenditure
•Savings
(or)
•Excess expenditure

State Finances Audit Report for the year ended March 2019
Page | 46
2.2 Summary of Appropriation Accounts
The summarised position of actual expenditure in 2018-19 against 40 Grants /
Appropriations is in Table 2.1.
Table 2.1: Position of actual expenditure vis-à-vis allocations in 2018-19 (₹ in crore)
Nature of
expenditure Original
Supple-
mentary Total
Actual
Expenditure
Savings (-) /
Excess (+)
with
reference to
total budget
Savings (-)
/ Excess
(+) in
percentage
Voted
Revenue 1,13,443.99 7,314.35 1,20,758.34 88,414.06 (-)32,344.28 (-)27
Capital 33,188.31 14,271.83 47,460.14 22,826.82 (-)24,633.32 (-)52
Loans and
Advances 9,035.55 1,648.46 10,684.01 8,711.54 (-)1,972.47 (-)18
Total Voted 1,55,667.85 23,234.64 1,78,902.49 1,19,952.42 (-)58,950.07 (-)33
Charged
Revenue 12,065.72 166.37 12,232.09 12,809.35 577.26 5
Capital 180.79 96.35 277.14 92.79 (-)184.35 (-)67
Public
Debt-Re-
payment
6,594.48 1,044.72 7,639.20 28,715.64* 21,076.44 276
Total Charged 18,840.99 1,307.44 20,148.43 41,617.78 21,469.35 107
Grand Total 1,74,508.84 24,542.08 1,99,050.92 1,61,570.20 (-)37,480.72 (-)19
Source: Appropriation Accounts
* includes repayment of Ways and Means Advances (WMA) of ₹21,823 crore
As seen from above table, the total provision in 2018-19 was ₹1,99,050.92 crore. The actual
gross expenditure during the year was ₹1,61,570.20 crore (81 per cent). There was an
overall savings of ₹66,614.41 crore and excess of ₹29,133.69 crore which resulted in net
savings of ₹37,480.72 crore in 2018-19.
2.3 Analysis of Expenditure
2.3.1. Revenue, Capital, Loans and Advances
As per para 15.10 of the Budget Manual, the Government expenditure is categorised into
three sections (i) Revenue Expenditure4, (ii) Capital Expenditure5 and (iii) Loans and
Advances6. The Budget provision vis a vis expenditure under Revenue, Capital and Loans
and Advances sections is shown below in Chart 2.2:
4 Revenue Expenditure is the account of current expenditure of the State. For example, wages, salaries,
maintenance works and repairs etc. 5 Capital Expenditure means expenditure of a Capital nature such as construction of irrigation projects,
bridges, buildings, laying of roads and electricity projects etc. 6 Loan account is the account of public debt discharged and loans and advances made by the State
Government to local bodies, employees and others including recoveries

Chapter II – Financial Management and Budgetary Control
Page | 47
Chart 2.2: Budget provision and expenditure under Revenue, Capital and
Loans and Advances sections (₹ in crore)
Source: Appropriation Accounts
It can be seen from above chart that savings occurred in both Revenue and Capital Account,
while Excess expenditure occurred in Loans and Advances.
• The savings are substantial under Capital Account, as the actual expenditure
was less than even half of the Budget provision. The projects / activities in which
budget provisions could not be spent in full, resulting in huge savings were:
▪ Kaleshwaram Project (₹4,774.23 crore, 78 per cent);
▪ Special Development Fund for welfare and development activities
(₹1,931.36 crore, 85 per cent);
▪ J. Chokka Rao Devadula Lift Irrigation Scheme (₹1,831.86 crore,
93 per cent);
▪ Sitarama Lift Irrigation Project (₹1,038.32 crore, 85 per cent); and
▪ Mission Kakatiya (₹952.59 crore, 59 per cent).
• Revenue Expenditure (₹1,01,223 crore) was lower than the Budget Estimates
(₹1,32,990 crore) by 24 per cent. The projects / activities in which budget
provisions could not be spent in full resulting in huge savings were:
▪ Investment Support Scheme viz., Rythu Bandhu (₹1,403.54 crore) under
Agriculture,
▪ State Finance Commission Grants to Gram Panchayats (₹1,132.05 crore)
under Panchayat Raj,
▪ Economic Support Schemes and Land Purchase Scheme (₹1,101.28 crore)
under Social Welfare and
▪ Construction of Two Bed Rooms House to the Rural Poor (₹968 crore)
under Housing Grants.
• Expenditure on Loans and Advances section was in excess (₹19,104 crore) of
Budget Estimates, mainly on account of repayment of Ways and Means Advances
(₹21,823 crore). Thus, Budget Estimates were made without proper analysis of
actual needs.
-
20,000
40,000
60,000
80,000
1,00,000
1,20,000
1,40,000
Revenue Capital Loans and Advances
1,32,990
47,737
18,323
1,01, 223
22,920
37,427
Budget Provision Expenditure

State Finances Audit Report for the year ended March 2019
Page | 48
2.3.2. Grant-wise analysis
As per the Budget Manual, the authority administering a Grant is responsible for watching
the progress of expenditure under its control and for keeping it within the sanctioned Grant
or Appropriation. The Budget Provisions and expenditure by Telangana Government is
done through 40 different Grants. For the purpose of determining savings or Excess
expenditure under each Grant, (i) Revenue (voted), (ii) Revenue (charged), (iii) Capital
(voted), (iv) Capital (charged), (v) Loans (voted) and (vi) Loans (charged) sections are
treated as independent Grants. Out of the total such possible 240 Grants, the State
Government made allocations or incurred expenditure under 106 Grants during the year
2018-19. Out of these 106 Grants / Appropriations for which Budget provisions made or
expenditure was incurred during 2018-19, there was neither Excess expenditure nor savings
in respect of one Grant and one Appropriation. In respect of remaining 104 Grants /
Appropriations, Excess expenditures and savings for Grants / Appropriations under
Revenue, Capital and Loans and Advances sections are in Table 2.2. The Grants in which
high savings and high Excess expenditure occurred are listed in Appendix 2.1.
Table 2.2: Total excess or savings under different Grants
Description Revenue Capital Loans and
Advances
Amount
(₹ in
crore) Number
of
Grants7
Number
of Appro-
priations8
Number
of
Grants
Number
of
Appro-
priations
Number
of
Grants
Number
of
Appro-
priations
Excess expenditure
occurred in 39 110 211 --- 212 113 29,133.69
Savings occurred in 37 8 31 5 14 --- 66,614.41
Source: Appropriation Accounts
The Excess expenditure of ₹29,133.69 crore in nine Grants / Appropriations mentioned
above includes two instances wherein an expenditure of ₹2,400 crore was incurred without
even budget provisions, Original or Supplementary (Refer Box 2.1).
2.3.2.1 Excess expenditure
As per Article 204 (3) of the Constitution of India, no money shall be withdrawn from
Consolidated Fund of the State except under appropriations made by law passed in
accordance with the provisions of this Article.
7 Grants are the provisions voted by the Legislature for incurring voted expenditure 8 Appropriation is the provision made in the budget for incurring expenditure which is directly charged
and not subject to the voting of the Legislature 9 IX-Fiscal Administration, Planning, Surveys and Statistics (₹3,990.45 crore), X-Home Administration
(₹773.25 crore) and VI-Excise Administration (₹27.35 crore) 10 IX-Fiscal Administration, Planning, Surveys and Statistics (₹794.72 crore) 11 XXIX-Forest, Science, Technology and Environment (₹68.42 crore) and V-Revenue, Registration and
Relief (₹3.06 crore) 12 XXI-Social Welfare (₹1,500.00 crore) and XXII-Tribal Welfare (₹900.00 crore) 13 IX-Fiscal Administration, Planning, Surveys and Statistics (₹21,076.44 crore)

Chapter II – Financial Management and Budgetary Control
Page | 49
(i) Excess expenditure in current year: It was observed that Excess expenditure of
₹29,133.69 crore was incurred in seven Grants and two Appropriations (including public
debt) (details in Appendix 2.2).
• The Excess expenditure of ₹21,076.44 crore under Grant IX – Fiscal Administration,
Planning, Surveys and Statistics (Loans Charged) was mainly due to Excess
expenditure in repayment of Ways and Means Advances14 (₹20,723.27 crore) to the
Reserve Bank of India under Loans charged section.
• Excess expenditure of ₹773.25 crore in Grant X – Home Administration (Revenue
Voted) was mainly under Minor Head “District Police” 15 (₹574.83 crore).
Box 2.1: Expenditure without authorisation of the Legislature
Reports of the Comptroller and Auditor General of India on State Finances had highlighted
the issue of incurring expenditure without budget provisions authorised by Legislature in
earlier years. This trend, however, continued in 2018-19 also.
An expenditure of ₹3,507.17 crore was incurred (at sub-head level) on various schemes
without any budget provision, i.e., either in Original or in Supplementary provisions in
34 cases in 2018-19 (details in Appendix 2.3). Out of this, in 10 cases, an expenditure of
₹442.11 crore was incurred through issue of Re-appropriation orders (refer to paragraph 2.5
for further details on Re-appropriations).
These amounts were mainly spent on:
• Loans to Telangana State Scheduled Castes Cooperative Development Corporation
Limited (₹1,500.00 crore);
• Loans to Telangana State Scheduled Tribes Cooperative Finance Corporation
Limited (₹900.00 crore);
• Subvention from Central Road Fund (₹279.08 crore);
• Transfer to Rural Development Fund (₹ 144.85 crore);
• Nationwide Emergency Response System (₹25.00 crore) and
• Loans to TRANSCO for Modernisation and Strengthening of Transmission System
in Hyderabad Metropolitan Area (₹16.10 crore).
Incurring huge expenditure persistently without approval of the budget provision by the
Legislature not only undermines the authority of the Legislature but also is in violation
of the will of the Legislature.
This is in violation of Article 204 of the Constitution which provides that no money shall be
withdrawn from the Consolidated Fund except under appropriation by Law by the State
Legislature. This vitiates the system of budgetary and financial control and encourages
financial indiscipline in management of public resources.
14 Total provision ₹1,100 crore; actual expenditure ₹21,823.27 crore 15 Total provision ₹2,284.31 crore; actual expenditure ₹2,859.14 crore

State Finances Audit Report for the year ended March 2019
Page | 50
(ii) Persistent Excess expenditures: Cases of Excess expenditure are being reported every
year through Audit Reports on State Finances. There were, however, Grants in which
Excess expenditure has occurred persistently during last four years. The details are in
Table 2.3:
Table 2.3: Grants in which persistent Excess expenditure occurred in last four years
(₹ in crore)
Sl.
No. Number and Name of the Grant
Amount of Excess expenditure
2015-16 2016-17 2017-18 2018-19
1. IX-Fiscal Administration, Planning, Surveys and
Statistics (Revenue Voted) 4,934.94 4,334.47 2,592.63 3,990.45
2. X-Home Administration (Revenue Voted) 328.30 1,040.21 958.49 773.25
Source: Appropriation Accounts
It is important to note that the persistent Excess expenditures have mainly occurred in the
Finance Department. Such repeated Excess expenditures over Grants approved by the
Legislature indicate lack of control mechanism and financial discipline.
Recommendation 5: Finance Department should ensure that no expenditure is incurred
without budget provision or in excess to what has been passed by the Legislature.
Government may analyse the reasons for persistent Excess expenditure, placing Grant IX
– Fiscal Administration on priority.
2.3.2.2 Excess expenditure requiring regularisation
As per Article 205 of the Constitution of India, it is mandatory for a State Government to get
Excess expenditure over a Grant / Appropriation regularised by the State Legislature. The
Excess expenditure was to be regularised after discussion of the Appropriation Accounts by
the Public Accounts Committee (PAC). For this purpose, the Departments concerned are
required to submit Explanatory Notes (EN) for Excess expenditure to PAC through Finance
Department.
The State Government, however, did not get the Excess expenditure amounting to
₹55,517.30 crore over and above the allocation, pertaining to the years 2014-15 to 2017-18,
regularised as of February 2020 as shown in Table 2.4.
Table 2.4: Details of Excess expenditure to be regularised
(₹ in crore)
Grant
Description
2014-15 2015-16 2016-17 2017-18
No. of
Grants/
Appro-
priations
Amount
No .of
Grants/
Appro-
priations
Amount
No. of
Grants/
Appro-
priations
Amount
No. of
Grants/
Appro-
priations
Amount
Revenue Voted
-- -- 4 5,361.08 10 6,261.27 7 4,578.26
Revenue Charged
1 1.42 1 9.37 3 13,127.30 1 342.74
Capital Voted
3 294.98 2 2.78 4 1,762.83 2 341.10
Loans Voted 2 7.25 2 507.56 2 10.19 1 122.06
Public Debt -- -- -- -- -- -- 1 22,787.11
Total 303.65 5,880.79 21,161.59 28,171.27
Source: Appropriation Accounts

Chapter II – Financial Management and Budgetary Control
Page | 51
Recommendation 6: All the existing cases of Excess expenditure need to be regularised
on priority. State Government may place a mechanism to check Excess expenditures which
did not have the vote of State Legislature.
2.3.2.3 Savings
In the year 2018-19, the total savings were ₹66,614.41 crore. Of this, ₹61,856.44 crore
(93 per cent) pertain to 39 Grants with savings of more than ₹100 crore each and by more than
20 per cent of the total provision (Appendix 2.4).
In addition, during the years 2014-19, there were cases of persistent savings of more than
₹1,000 crore each in the following six Grants as shown in Table 2.5:
Table 2.5: Grants / Appropriations with persistent savings during the years 2014-19
Sl.
No.
Grant
No.
Name of the
Grant/
Appropriation
Savings rupees in crore (per cent)
2014-15 2015-16 2016-17 2017-18 2018-19
Revenue Voted
1. XVI Medical and
Health
1,299.38(36) 1,396.21(30) 2,724.28(41) 1,497.61(27) 2,010.86(33)
2. XVII Municipal
Administration
and Urban
Development
2,646.79(70) 1,286.68(40) 4,121.44(75) 3,085.72(67) 4,034.91(67)
3. XXI Social Welfare 2,196.51(69) 3,550.73(57) 3,309.19(53) 3,812.20(40) 4,539.33(38)
4. XXVII Agriculture 1,863.17(26) 1,366.57(20) 1,598.21(24) 1,344.18(24) 4,178.21(31)
Capital Voted
5. XI Roads,
Buildings and
Ports
1,377.91(52) 3,121.91(61) 1,929.95(36) 2,041.38(46) 2,568.17(63)
6. XXXI Panchayat Raj 2,003.68(90) 1,121.21(38) 1,199.80(35) 3,881.15(59) 1,142.00(19)
Source: Appropriation Accounts
It can be seen from the above that there is a marked increase in savings in Agriculture and
Municipal Administration and Urban Development Grants in 2018-19.
Persistent savings indicate that the schemes under these Grants did not receive the required
priority by the Government or that there was inefficiency in implementation by the
Departments concerned / implementing agencies, or both.
Further analysis of data at the subhead level revealed that entire original provision made
(₹15,482.99 crore) was withdrawn through Re-appropriation orders in respect of 25 cases,
wherein the budget allocation was more than ₹100 crore in each case. No expenditure was
incurred in 24 out of these 25 cases. Such cases indicate that the State Government did not
take up the budgetary plans at all. The following are a few major cases:
• Resettlement and Rehabilitation under Kaleshwaram Project (₹600 crore);
• Hyderabad Metro Airport Express under Urban Development (₹400 crore);
• Musi Riverfront Development under Urban Development (₹377.35 crore); and
• Vaddileni Runalu under Crop Husbandry (₹377.35 crore).

State Finances Audit Report for the year ended March 2019
Page | 52
2.4 Supplementary Provisions
A Supplementary Provision is made, as per Article 205 of the Constitution, if the amount
authorised by the Appropriation Act is found to be insufficient or when a need has arisen
for supplementary or additional expenditure upon some New Service.
Out of total 106 Grants / Appropriations used during the year, there were Supplementary
Provisions in respect of 86 Grants/Appropriations amounting to ₹24,542 crore. Audit
analysis showed that Supplementary Grant (Rupees one crore and above) of
₹17,974 crore16 i.e., 80 per cent of total Supplementary Grant was either unnecessary or
excessive in 65 cases. On the other hand, in 7 cases the Supplementary Grant of
₹1,622 crore was not adequate to meet the requirement and fell short by 94 per cent
(Chart 2.3).
Chart 2.3: Unnecessary, Excessive and Insufficient Supplementary Provisions
Source: Appropriation Accounts
The cases where Supplementary Provision of more than ₹500 crore was made and was
proved unnecessary are detailed in Table 2.6:
16 ₹14,631crore+₹3,343 crore
Unnecessary Supplemen-tary Grants
49 Cases: Original
Provision: ₹1,15,341Cr; Expenditure: ₹72,480 Cr
Supplementary Provision in these cases: ₹14,631 Cr
Hence, entire Supplementary
Provision proved unnecessary
Excessive Supplemen-
tary Grants
16 Cases: Original
Provision: ₹12,695 Cr; Expenditure: ₹17,072 Cr
Supplementary Provision in these cases: ₹7,720 Cr
Excessive Supplementary
Provision: ₹3,343 Cr
Insufficient Supplemen-tary Grants
7 Cases: Original
Provision: ₹36,181 Cr; Expenditure: ₹64,537 Cr
Supplementary Provision in these cases: ₹1,622 Cr
Insufficient Supplementary
Provision: ₹26,734 Cr

Chapter II – Financial Management and Budgetary Control
Page | 53
Table 2.6: Cases where Supplementary Provision of more than ₹500 crore proved
unnecessary
(₹ in crore)
Sl.N
o. Grant No. Grant Name Original
Supple-
mentary Total
Expen-
diture
Savings(-)
/Excess(+)
1 XXXIII
(Capital
Voted)
Major and Medium
Irrigation 11,707.68 7,493.25 19,200.93 7,957.48 (-)11,243.45
2 XXVII
(Revenue
Voted)
Agriculture 12,368.08 1,039.74 13,407.82 9,229.61 (-)4,178.21
3
XVII
(Revenue
Voted)
Municipal
Administration and
Urban
Development
5,145.06 851.50 5,996.56 1,961.65 (-)4,034.91
4
XXXVI
(Revenue
Voted)
Industries an
Commerce 1,107.32 578.10 1,685.42 481.57 (-)1,203.85
5 XI (Capital
Voted)
Roads, Buildings
and Ports 3,474.55 577.83 4,052.38 1,484.21 (-)2,568.17
Source: Appropriation Accounts
As seen from the above table, unnecessary Supplementary Provision was observed highest
under Major and Medium Irrigation (Capital Voted: ₹7,493.25 crore) and Agriculture
(Revenue Voted: ₹1,039.74 crore) Grants.
Further analysis of data at the subhead level revealed that entire Supplementary Provision
made (₹619.36 crore) was withdrawn through Re-appropriation orders and no expenditure
was incurred in respect of 27 cases. Such cases indicate that either the necessity for
obtaining a Supplementary Provision was not assessed properly before obtaining approval
or the scheme /activity was not taken up despite getting approval through Supplementary
Provisions. The following are few major items:
• Assistance to Telangana State Industrial Infrastructure Corporation for
development of e-City Project at Raviryal (₹207.60 crore);
• Assistance to TSIIC for Electronic Manufacture Cluster project at Maheswaram
(₹138.60 crore); and
• Safe City Project for safety of Women in Hyderabad City (Nirbhaya Fund)
(₹138.57 crore).
2.5 Re-appropriations
By definition, Re-appropriations are meant for transfer of saving from one scheme / unit to
another (generally at sub-head level and below) within the same Grant and under same
section (i.e., Capital, Revenue or Loans). Finance Department, however, issued
re-appropriation orders to mainly withdraw the budget provisions, generally on the last day
of the financial year.
The utilisation of Re-appropriations in 2018-19 is depicted in Chart 2.4.

State Finances Audit Report for the year ended March 2019
Page | 54
Chart 2.4: Re-appropriation in the overall budget
Source: Appropriation Accounts
* except Grant I – State Legislature, where there were no Re-appropriations
It can be noted from the above chart that 31 per cent of the provisions approved by the
Legislature were withdrawn by Government through Re-appropriation orders. There were
deficient / irregular / unnecessary Re-appropriations as detailed in Table 2.7 below:
Table 2.7: Deficient / irregular / unnecessary Re-appropriations in 2018-19
(₹ in crore)
Sl.
No. Description
No. of
Cases Original
Supple-
mentary
Original
plus
Supple-
mentary
Re-
appropriatio
n
Actual
Expenditure
Excess (+)
/
Savings (-)
at Sub Head Level
1 Re-appropriation
orders issued for
withdrawal of entire
provision despite
actual expenditure
1 362.26 0 362.26 (-)362.26 362.26 362.26
2 Re-appropriation
orders for decrease
though there was
excess expenditure
37 3,612.57 563.31 4,175.88 (-)814.23 5,612.89 1,437.01
3 Re-appropriation
orders for
augmentation
though there were
savings
6 97.82 0.04 97.86 55.66 0.20 (-)97.66
at Detailed Head Level
4 Re-appropriation
without Budget
Provision 154 0 0 0 1,264.82 1,235.16 1,235.16
5 Re-appropriation
orders for higher
amounts than the
budget provisions
301 5,846.39 1,971.41 7,817.80 (-)10,674.77 668.60 (-)7,149.20
6 Re-appropriation
orders issued for
withdrawal of entire
provision despite
actual expenditure
(Charged section)
1 155.29 0 155.29 (-)155.29 108.33 108.33
7 Re-appropriation
orders for
augmentation
without any
expenditure
32 99.88 1.00 100.88 270.36 0 (-)100.88
Source: Appropriation Accounts
Total Grants and Provisions
Re-appropriations occured in
•40 Grants•₹1,99,050 crore
•39 Grants*•Net amount
(-) ₹61,884 crore

Chapter II – Financial Management and Budgetary Control
Page | 55
The above table indicates that the mechanism of issue of Re-appropriation orders was not
mapped properly with the budget provisions and expenditure data. The Finance
Department stated that the Re-appropriation / Resumption orders were not linked to
IMPACT / IFMS software.
Recommendation 7: By leveraging advancements in Information Technology, the State
Government may issue Re-appropriation orders on the basis of real-time data so that the
funds are utilised in an optimum manner.
2.6 Rush of Expenditure
Maintaining uniform pace of expenditure is a crucial component of sound public financial
management. Any rush of expenditure in the closing month of the financial year should be
avoided.
• During 2018-19, out of the total expenditure of ₹1,61,570.20 crore, an amount of
₹55,077.98 crore (34.09 per cent) was spent in the last quarter of the financial year.
However, it was observed that an amount of ₹50,179.11 crore (32.92 per cent of
the total receipts of ₹1,52,447.94 crore) was received during the last quarter only.
The expenditure during the last quarter this year was higher by 6.03 percentage
points in comparison to 2017-18 when the expenditure during the last quarter was
₹41,848.98 crore (28.06 per cent of the total expenditure of ₹1,49,127.91 crore).
• A Budget Provision of ₹2,400 crore was allocated under 4801 - Capital Outlay on
Power Projects. Out of this, expenditure of ₹1,800 crore (75 per cent) was incurred
in the month of March 2019.
2.7 Advances from Contingency Fund
The Contingency Fund of the State established under Article 267 (2) of the Constitution is
in the nature of an imprest placed at the disposal of the Governor to enable him to make
advances to meet urgent unforeseen expenditure, pending authorisation by Legislature.
Approval of the Legislature for such expenditure and for withdrawal of an equivalent
amount from the Consolidated Fund is subsequently obtained, where upon the advances
from the Contingency Fund are recouped to the Fund.
In 2018-19, an amount of ₹17.18 crore was sanctioned as advance from Contingency Fund
under six Major Heads17. Out of this, an expenditure of ₹15.96 crore was incurred towards
decretal charges and to deposit amounts in different courts in connection with acquisition
of lands for various developmental activities of the Government. An amount of
₹15.07 crore was recouped back to the Contingency Fund. Audit observed the following:
17 (i) District Administration (MH:2053) - ₹1.11 crore; (ii) Police (MH: 2055) - ₹0.26 crore; (iii) Urban
Development (MH:2217) - ₹0.32 crore, (iv) Capital outlay on Medical and Health (MH:4210) -
₹0.75 crore, (v) Capital outlay on Forestry and Wild Life (MH:4406) - ₹0.49 crore and (vi) Capital outlay
on Roads and Bridges (MH:5054) - ₹14.25 crore
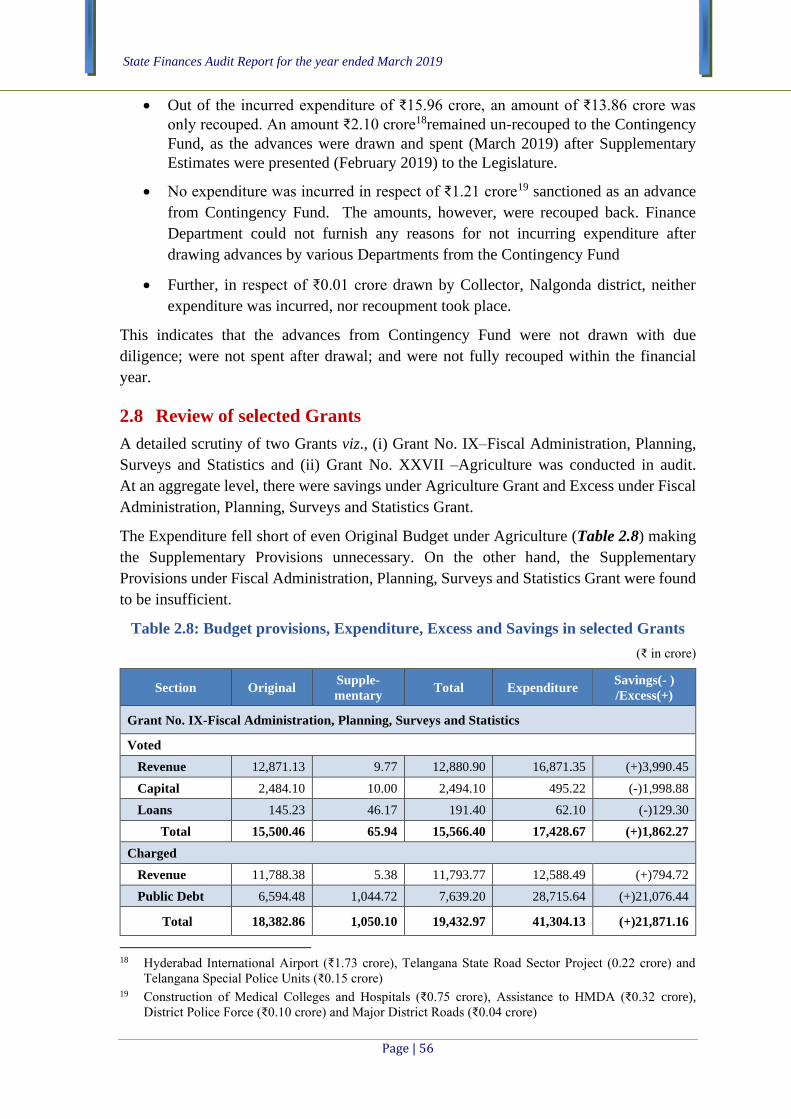
State Finances Audit Report for the year ended March 2019
Page | 56
• Out of the incurred expenditure of ₹15.96 crore, an amount of ₹13.86 crore was
only recouped. An amount ₹2.10 crore18remained un-recouped to the Contingency
Fund, as the advances were drawn and spent (March 2019) after Supplementary
Estimates were presented (February 2019) to the Legislature.
• No expenditure was incurred in respect of ₹1.21 crore19 sanctioned as an advance
from Contingency Fund. The amounts, however, were recouped back. Finance
Department could not furnish any reasons for not incurring expenditure after
drawing advances by various Departments from the Contingency Fund
• Further, in respect of ₹0.01 crore drawn by Collector, Nalgonda district, neither
expenditure was incurred, nor recoupment took place.
This indicates that the advances from Contingency Fund were not drawn with due
diligence; were not spent after drawal; and were not fully recouped within the financial
year.
2.8 Review of selected Grants
A detailed scrutiny of two Grants viz., (i) Grant No. IX–Fiscal Administration, Planning,
Surveys and Statistics and (ii) Grant No. XXVII –Agriculture was conducted in audit.
At an aggregate level, there were savings under Agriculture Grant and Excess under Fiscal
Administration, Planning, Surveys and Statistics Grant.
The Expenditure fell short of even Original Budget under Agriculture (Table 2.8) making
the Supplementary Provisions unnecessary. On the other hand, the Supplementary
Provisions under Fiscal Administration, Planning, Surveys and Statistics Grant were found
to be insufficient.
Table 2.8: Budget provisions, Expenditure, Excess and Savings in selected Grants
(₹ in crore)
Section Original Supple-
mentary Total Expenditure
Savings(- )
/Excess(+)
Grant No. IX-Fiscal Administration, Planning, Surveys and Statistics
Voted
Revenue 12,871.13 9.77 12,880.90 16,871.35 (+)3,990.45
Capital 2,484.10 10.00 2,494.10 495.22 (-)1,998.88
Loans 145.23 46.17 191.40 62.10 (-)129.30
Total 15,500.46 65.94 15,566.40 17,428.67 (+)1,862.27
Charged
Revenue 11,788.38 5.38 11,793.77 12,588.49 (+)794.72
Public Debt 6,594.48 1,044.72 7,639.20 28,715.64 (+)21,076.44
Total 18,382.86 1,050.10 19,432.97 41,304.13 (+)21,871.16
18 Hyderabad International Airport (₹1.73 crore), Telangana State Road Sector Project (0.22 crore) and
Telangana Special Police Units (₹0.15 crore) 19 Construction of Medical Colleges and Hospitals (₹0.75 crore), Assistance to HMDA (₹0.32 crore),
District Police Force (₹0.10 crore) and Major District Roads (₹0.04 crore)

Chapter II – Financial Management and Budgetary Control
Page | 57
Section Original Supple-
mentary Total Expenditure
Savings(- )
/Excess(+)
Grant No. XXVII-Agriculture
Voted
Revenue 12,368.08 1,039.74 13,407.82 9,229.61 (-) 4,178.21
Capital 279.51 828.84 1,108.35 769.35 (-) 339.00
Loans 86.48 0.00 86.48 45.44 (-)41.04
Total 12,734.07 1,868.58 14,602.65 10,044.40 (-)4,558.25
Source: Appropriation Accounts
Audit Findings on the above Grants are detailed in the subsequent paragraphs:
(i) Fiscal Administration, Planning, Survey and Statistics (Grant IX)
• The main reason for Excess expenditure under this Grant was due to Ways and Means
Advances (WMA) from Reserve Bank of India (RBI). The WMA are provided by
RBI to States to temporarily tide over for maintaining minimum cash balance with it.
An amount of ₹100 crore was provided originally, which was later supplemented by
another ₹1,000 crore. The actual repayment of WMA during 2018-19 was
₹21,823 crore (refer to paragraph 1.6.4 for further details on WMA).
• An amount of ₹2,974.58 crore was spent on ‘Service Pension allocable to Successor
State of Telangana’ in 2017-18. However, the budget provision in 2018-19 was only
₹23.40 crore. The final expenditure in the current year was ₹1,963.53 crore for this
item indicating that the budget provision was very meagre, unrealistic and not based
on the previous year’s expenditure pattern.
• The expenditure on interest on State Development Loans was ₹9,609.83 crore against
the budget provision of ₹8,315.55 crore leading to Excess expenditure of
₹1,294.28 crore on this account. This proves that the interest liability of State
Government was not assessed properly in the Budget Estimates. No amounts were
provided through Supplementary Estimates either. Though an amount of
₹403.79 crore was augmented through Re-appropriation orders there was still an
Excess expenditure of ₹890.48 crore. This indicates that the Supplementary
Provisions and Re-appropriations was not done on a realistic basis.
(ii) Agriculture (Grant XXVII)
• A saving of ₹1,403.54 crore occurred against a provision of ₹9,056.40 crore in respect
of Investment Support Scheme (Rythu Bandhu), which is a new scheme commenced
from 2018-19;
• A saving of ₹410.16 crore occurred under Crop Insurance where in an allocation of
₹443.69 crore was made and an expenditure of ₹33.53 crore only was incurred up to
the end of the current year.
• Though a budget allocation of ₹377.35 crore, was made for Vaddileni Runalu
(Pavalavaddi) scheme, no expenditure was incurred as entire amount was withdrawn
through Re-appropriation orders.

State Finances Audit Report for the year ended March 2019
Page | 58
• Similarly, in respect of Rashtriya Krishi Vikas Yojana, a budget allocation of
₹203.54 crore made originally was supplemented with an amount of ₹167.73 crore.
The entire amount of ₹371.27 crore was withdrawn through Re-appropriation orders.
• Savings of more than ₹100 crore occurred in other key schemes as well: Farm
Mechanisation (₹336.32 crore), Integrated scheme on Agriculture Marketing
(₹218.74 crore), Pradhan Mantri Krishi Sinchayi Yojana (₹249.71 crore), Buildings
(₹150.76 crore), Scheme for Debt relief to farmers (₹140.57 crore), Supply of seeds
to farmers (₹114.74 crore).
• Rush of expenditure: As per Article 39 of the Telangana Financial Code, no attempt
should be made to prevent the lapse of an appropriation by any undue rush of
expenditure during March. However, in Telangana State Micro Irrigation Project
(TSMIP) and promotion of Horticulture Activities, the entire expenditure of
₹72.32 crore and ₹7.89 crore respectively was incurred in the month of March 2019.
2.9 Special Development Fund
Telangana State Scheduled Castes and Scheduled Tribes Special Development Fund
(Planning, Allocation and Utilisation of Financial Resources) Act, 2017 requires that all
Departments should earmark at least 15.45 per cent and 9.08 per cent of the total outlay in
the Budget exclusively under the Scheduled Castes and Scheduled Tribes Special
Development Funds (SCSDF and STSDF) respectively. Programmes under SCSDF and
STSDF include subsidies for scholarships, construction of roads in SC/ST hamlets, etc.
Government allocated ₹16,452.79 crore20 and ₹9,693.12 crore21 to SCSDF and STSDF
respectively in 2018-19. However, 62 per cent and 43 per cent22 of the allocated funds
were not utilised under SCSDF and STSDF respectively. This issue was reported earlier
also as the utilisation was only 54 per cent each under SCSDF and STSDF in 2017-18 and
60 and 57 per cent respectively in 2016-17.
2.10 Deficiencies in Budgeting
2.10.1. Improper Categorisation between Capital and Revenue
2.10.1.1. Allocation of Budget in Revenue Section for irrigation projects under
construction instead of under Capital Section.
Kaleshwaram Project and Palamuru Ranga Reddy Lift Irrigation Schemes are under
execution, and hence the requirement of funds was under ‘Capital’. Funds were, however,
allocated under ‘Revenue’ as shown below in Table 2.9.
20 ₹14,706.55 crore towards all Departments and ₹1,746.24 crore towards non-divisible infrastructure
works 21 ₹8,944.73 crore towards all Departments and ₹748.39 crore towards non-divisible infrastructure works 22 SCSDF: Budget (O+S):₹15,694.59 crore, Expenditure: ₹5,897.89 crore (38 per cent) and Savings:
₹9,796.70 crore (62 per cent); STSDF: Budget (O+S): ₹9,231.51 crore, Expenditure: ₹5,280.85 crore
(57 per cent) and Savings: ₹3,950.66 crore (43 per cent)

Chapter II – Financial Management and Budgetary Control
Page | 59
Table 2.9: Budget provision for Projects under Construction in Revenue Section
(₹ in crore)
Project Dam and Appurtenant Works Canals and Distributaries
Provision Expenditure Provision Expenditure
Kaleshwaram Project 2,689.00 0.00 2,697.41 0.00
Palamuru Ranga Reddy Lift
Irrigation Scheme
2,021.50 0.00 0.01 0.00
Source: Appropriation Accounts
The provisions under Revenue were withdrawn and no expenditure was actually incurred
under ‘Revenue’ leading to savings under this section. The same amounts were later
allocated under ‘Capital’ as Supplementary Provision.
2.10.1.2. Allocation of Budget under Capital Section for Afforestation Fund instead
of Revenue
An amount of ₹100 crore was provided under Capital section in respect of ‘Afforestation
Fund’ for minor works, which fall under Revenue Section. The expenditure of
₹209.06 crore was also booked under Capital section. Thus, making incorrect provision
under Capital instead of under Revenue in Budget Estimates and incurring expenditure
under Capital resulted in inflation of Capital Expenditure and understatement of Revenue
Expenditure.
2.10.2. Opening new sub-heads without concurrence of Accountant General
(Accounts and Entitlements)
Article 150 of the Constitution mandates the prescription of the form of accounts by the
President on the advice of the Comptroller and Auditor General of India (CAG).
Accordingly, the State Government has to take prior concurrence of the Accountant
General, Accounts and Entitlements (AG (A&E)), Telangana before opening any new
sub-head.
The Government, however, opened 18 new sub-heads in 2018-19 without prior concurrence
of the AG (A&E). Total provision made under these sub-heads was
₹13,891 crore. Against this provision, an expenditure of ₹10,809 crore was incurred
disregarding the statutory provision.
Such opening of new sub-heads without concurrence was persistent as ₹12,910 crore
was provided under 223 new sub-heads in 2017-18, ₹24,165 crore was provided under
137 new sub-heads in 2016-17 and ₹6,121 crore was provided under 39 new sub-heads
in 2015-16. This indicates that the trend of opening new sub-heads without
concurrence of AG (A&E) had continued.
On this issue, the State Government assured (November 2014) that concurrence of
AG (A&E) would be ensured for opening of new sub-heads. This, however, was not
followed during the last five years.


Chapter 3 Financial Reporting
A reliable financial reporting mechanism aids in exercise of controls on utilisation of funds.
This Chapter provides an overview and status of compliance to various financial rules,
procedures and directives during the year.
3.1 Personal Deposit Accounts
3.1.1 Personal Deposit Account framework
Personal Deposits (PD) are maintained in the treasuries in the nature of banking accounts.
These are commonly known as Personal Ledger (PL) Accounts or Personal Deposit
Accounts. PD Accounts are established in the following manner:
• Under statutory provisions of the Government or created under any law or rule
having force of law by transferring funds from Consolidated Fund of the State for
discharging liabilities of the Government arising of special enactments.
• PD Accounts may also be opened, in favour of specified Government Officers, by
transferring fund from the Consolidated Fund of the State for discharging the
liabilities of the State Government in respect of execution of various projects,
schemes etc.
As per the Telangana Financial Code, the purpose of PD Accounts is to enable the Drawing
Officers to incur expenditure pertaining to a scheme, for which funds are placed at their
disposal, by transfer from the Consolidated Fund of the State.
Ordinarily, Government accords permission for opening of a PD Account under intimation
to the Accountant General (A&E), Telangana. Except where the PD Accounts are created
by law or rules having the force of law for discharging liabilities arising out of special
enactments, other PD Accounts shall be closed at the end of the financial year.
Analysis of Audit revealed the following:
3.1.2 Opening of PD Accounts
Government orders (June 2005) stipulate that a requisition for opening a PD account should
be forwarded through the Administrative Department of the Secretariat concerned,
indicating the sources of the funds to the PD account and the nature of transactions to
exclude the possibility of budgetary resources getting diverted to PD account. When the
Government orders a PD account to be opened, the Directorate of Treasuries and Accounts
(DTA) shall authorise the District Treasury Officer to assign a PD account number to the
PD Administrator (PDA) and notify the Accountant General (Accounts and Entitlements).
The Finance Department, however, did not furnish information on the PD accounts
authorised to be opened during the period 2016-19.

State Finances Audit Report for the year ended March 2019
Page | 62
Consequently, the extent of adherence to the procedural norms, could not be vouchsafed in
Audit.
3.1.3 Status of PD Accounts in Telangana
In order to bring about a uniform treatment of PD accounts across States, a review was
conducted by Comptroller and Auditor General of India in 2018. As per the review, the
PD accounts have been aligned with the prescribed format of accounts as those operated
under Major Head (MH) 8443 – Civil Deposits and Minor Head (MiH) 106 – Personal
Deposits. As an outcome of the review, the State Government reported that 182 accounts
(125 Operational and 57 in-operative accounts) classified under MH 8443–Civil Deposits
– MiH 106 – Personal Deposits as indicated below shall come under the definition of
PD Accounts.
Table 3.1: Details of PD accounts
Sl.
No.
Description No. of
Accounts
Amount
(₹ in crore)
1 Number of PD Accounts existing at the beginning of the year* 182 51.20
2 New PD Accounts opened during the year -- 702.07
3 PD Accounts closed during the year -- 717.74
4 PD Accounts existing at the end of the year 182 35.53
Source: Information furnished by Director of Treasuries and Accounts (DTA)
*No of PD accounts existing at the beginning of the year 2018-19 differs from the PD Accounts existing at
the end of previous year 2017-18 due to clarification from the State Government that only the accounts
opened under Head of Account 8443-106 shall be constituted as PD Accounts; as such all other Deposit
Accounts have been omitted in the above table
The following were further observed in this regard:
• No Unique ID was assigned to the PD Administrators. All Deposit Accounts
operated by each Designated Drawing Officers were being considered as separate
PD accounts. This had resulted in proliferation of number of PD Accounts reported
in earlier years (28,674 in 2017-18 and 28,087 in 2016-17).
• As per List of Major and Minor Heads, PD accounts are to be operated under Major
Head of Account 8443 and Minor Head of Account 106-Personal Deposits. In
respect of 2018-19, the DTA informed that there were 182 PD accounts in existence
as per the above classification. However, there were 13,396 Category ‘C’1 Deposit
Accounts operated under 10 Heads of Account2 in 2018-19, out of which
1 The State Government classified Deposit Accounts in to three Categories. Category A – Contains own
sources; Receipts through devolution and transfers from other Governments; Category B – Receipts
through securities collected for specific purposes; and Category C – Receipts through transfers from
Consolidated Fund of the State. 2 Major Head (MH) 8342 – Minor Head (MiH) 103, MH 8443- MiH 109, MH 8443 – MiH 111, MH 8443
– MiH 800, MH 8448 – MiH 102, MH 8448 – MiH 109, MH 8448 - MiH 110, MH 8448 – MiH 120,
MH 8449 – MiH 120 and MH 8782 - MiH 103

Chapter III – Financial Reporting
Page | 63
52 Category ‘C’ accounts were test checked in audit. It was observed that all these
test checked accounts were not under 8443-106, but were, however, operated as
PD accounts. Hence, the number of PD accounts reported by DTA as 182 (mostly
pertaining to Principals of schools, colleges, Ground Water Department etc.) for
2018-19 was at variance with the situation at field level. The number of PD accounts
specified under Head of Account 8443-106 are very meagre and did not cover major
activities like implementation of Government schemes, which are being operated
through other Deposit Heads of Account through which huge amounts of funds are
being spent.
As unspent amounts in the PD accounts are lapsable, operation of different Heads of
Account makes it difficult to identify the balances and lapse the balances as per the norms
prescribed, since other Deposit Accounts are also available under these Heads.
3.1.4 Operation of PD Accounts
The following were observed in operation of PD Accounts:
• Audit observed that amounts of ₹3,655 crore and ₹4,999 crore were transferred in
the months of March 2018 and 2019 respectively from Consolidated Fund to Deposit
accounts. Out of the above, ₹3,576 crore and ₹4,946 crore were transferred to
Category “C” Deposit Accounts. This indicates that these PD accounts were being
utilised to transfer funds at the fag end of financial year to avoid lapse of budget.
• Article 3 (1) of the Financial Code stipulates that expenditure should not be prima
facie more than what the occasion demands. Transfers from Consolidated Fund to
PD account is treated as expenditure from the Consolidated Fund, and hence any
such transfer far in advance of requirement is in contravention of Article 3(1) of
Financial Code. Further, Government instructions3 (September 2012) stipulated that
there shall not be any transfer of funds from PD accounts to Fixed Deposit Receipt
account.
PD Administrators of seven test checked accounts deposited an amount of
₹721.36 crore in Current Accounts (CA) / Savings Bank Accounts (SBA)/ Fixed
Deposit Receipt (FDR) accounts in Banks during 2016-17 to 2018-19. These
accounts earned interests amounting to ₹20.39 crore, which were utilised for
purposes such as meeting employee costs like pay and allowances, administrative
expenditure etc.
• As per Subsidiary Rule 2 of Treasury Code, Fully Vouched Contingent Bill (FVCB)
Form ‘58’ is used for payment of services already availed or goods received.
Scrutiny of vouchers pertaining to District Treasury Officer, Hyderabad (Urban) for
the year 2018-19 revealed that the DDOs of 10 Departments drew ₹1,745.45 crore
in 76 cases for transferring money from Consolidated Fund to PD accounts by using
3 Memo No.351/B1/DCM.II/2012, dated 04 September 2012

State Finances Audit Report for the year ended March 2019
Page | 64
FVCB Form ‘58’ without enclosing required details of services already availed or
goods received. As amounts transferred from Consolidated Fund to PD account are
lapsable, use of FVCB Form ‘58’, meant for expenditure already incurred through
services availed or goods received, impacts transparency in accounting.
Box 3.1: Diversion of Funds
Funds transferred to PD accounts were diverted in respect of two test checked cases for
other purposes.
• An amount of ₹27.04 crore for purchase of Medical equipment was diverted for
pay and allowances of staff by Nizam’s Institute of Medical Sciences.
• In another test checked case, Hyderabad Metropolitan Development Authority
(HMDA) utilised an amount of ₹29.15 crore (sanctioned in June 2017) for works
undertaken by Roads and Building Department towards creation of additional
facilities in Pragathi Bhavan from out of the Loans given to HMDA for taking up
development activities. However, HMDA did not offer its remarks as to how the
works relating to additional facilities in Pragathi Bhavan came under the purview
of developmental activities for which loan amounts were approved by the
Legislature.
3.1.5 Lapsing of amounts in PD accounts and closing of PD Accounts
Article 202 of the Constitution of India provides for Legislative financial control over
public expenditure through the Annual Financial Statement / Budget. Not transferring the
unspent balances lying in PD Accounts to the Consolidated Fund before the closure of the
financial year violates Legislative intent, which is to ensure that funds approved by it for
the financial year are spent during the financial year itself. According to para 17.1 of Budget
Manual, an appropriation authorised by the Legislature is operative only until the close of
the financial year; any unspent balance lapses and is not available for utilisation in the
following year. As per Article 271 (iii) (4) 4 Financial Code, PD accounts are to be closed
at the end of the financial year by minus debit of the balance to the relevant service heads
in the Consolidated Fund of the State5. The account may be opened again in the following
year, if necessary, in the usual manner6.
The following was observed with regard to lapsing of amounts in the PD accounts and
closing of PD accounts:
4 Memo. No. 1596/Accts./5y-4, Dt. 31-12-1959 5 except, where personal deposits are created by Law or rules having the force of law for discharging the
liabilities arising out of special enactments 6 Personal Deposit Accounts in connection with the working of schemes of commercial and quasi-commercial
nature and schemes whose transactions spread over more than one financial year, need not be closed at the
end of the financial year. Such Deposit Accounts should be closed when the need for them ceases

Chapter III – Financial Reporting
Page | 65
• Lapsing of amounts under PD Accounts in the next financial year: Government
orders of April 2000 provided that amounts released to Category ‘C’ Deposit
Accounts for execution of specific schemes sanctioned by Government are lapsable.
These Orders, however, stipulated that the funds released during a particular
financial year shall lapse by 31 March of the next financial year. Thus, the
Government Orders were at variance with the provisions of Article 202 of the
Constitution, Budget Manual, Telangana Financial Code and Legislative intent.
▪ Audit observed that unspent balances in seven cases amounting to
₹467.38 crore7 in Category ‘C’ Deposit accounts pertaining to 2018-19, which
should have been lapsed in view of the spirit of Article 202 of the Constitution,
Budget Manual and Financial Code were not lapsed at the end of 2018-19.
▪ Audit also observed that even Government orders of April 2000 that unspent
balances would be lapsed at the end of next financial year were also not
complied with and unutilised funds in five cases amounting to ₹309.64 crore8
pertaining to previous financial years (2016-17 and 2017-18) were not lapsed
even at the end of 2018-19.
Since transfers by the Government to PD accounts i.e., transfers to Public Account
is considered as expenditure from the Consolidated Fund, any unutilised amount in
the PD accounts after the close of the financial year would only distort the magnitude
of expenditure figures in the Government accounts. Further, non-transfer of unspent
balances lying in PD Accounts to Consolidated Fund is fraught with the risk of
misuse of public fund, fraud, and mis-appropriation.
• Lapsing of amounts under PD Accounts as Revenue Receipts : The Government
Orders (April 2000), stipulated that the funds remaining unspent till the end of the
subsequent financial year are to be credited to Minor Head – Other Receipts (800)
under Departmental Receipt Major Head. Government orders (March 2016)
regarding lapsing of funds for the year 2015-16 further stipulated that if the Treasury
Officer was unable to find out the Departmental Receipt Major Head, then the
unspent balances shall be remitted under Major Head 0075 – Miscellaneous General
Services.
7 (i) Telangana State Housing Corporation limited (₹209.26 crore), (ii) Telangana State Backward Classes
Cooperative Finance Corporation Limited (₹5.92 crore), (iii) Telangana State Seeds Development
Corporation (₹228.00 crore), (iv) Hyderabad Road Development Corporation Limited (₹2.73 crore),
(v) Telangana Most Backward Classes Cooperative Finance Corporation limited (₹1.21 crore),
(vi) Chief Planning Officer, Nalgonda (₹0.26 crore), and (vii) District Collector, Sircilla (₹20.00 crore) 8 (i) Telangana State Housing Corporation limited (2016-17:₹0.30 crore, 2017-18: ₹287.50 crore),
(ii) Telangana State Backward Classes Cooperative Finance Corporation Limited (2016-17:₹4.04 crore,
2017-18: ₹3.25 crore), (iii) Hyderabad Road Development Corporation Limited (2017-18: ₹12.64 crore),
(iv) Telangana Most Backward Classes Cooperative Finance Corporation limited (2017-18:
₹1.85 crore,), and (v) Chief Planning Officer, Nalgonda (2017-18: ₹0.06 crore)

State Finances Audit Report for the year ended March 2019
Page | 66
As per the information furnished (November 2019) by DTA, amounts of ₹321 crore
and ₹2,606 crore9 were lapsed and credited to Government account as Revenue
Receipts in March 2018 and March 2019 respectively instead of as minus debit to
the corresponding service Head of Account.
As transfer from Consolidated Fund to PD accounts i.e., Public Account has already
been treated as expenditure, crediting the unspent balance to Receipts Heads not only
contradicts instructions of Financial Code, but also results in overstatement of both
Receipts and Expenditure.
Box 3.2: Incorrect lapsing of funds pertaining to Badangpet Municipality
As per Government Orders (April 2000), the Deposit accounts of the Local Bodies
wherein own receipts such as taxes, other fees and user charges are collected directly
from the public under the provisions of their statutes and by-laws, are to be classified as
Category ‘A’ Deposit Accounts. These Local Bodies may also receive statutory
devolutions and statutory Grants. The Deposit Accounts under Category ‘A’ are non-
lapsable.
As per Government Orders of April 2000, Badangpet Municipality, which is a Local
Body, was assigned a PD account under Category ‘C’ instead of Category ‘A’, for
reasons not on record.
It was observed in audit that the Government has lapsed balance of ₹1.72 crore available
in the PD account of Commissioner, Badangpet Municipality (Commissioner) at the end
of March 2019. Commissioner stated (February 2020) that lapsing of this amount,
collected from public to be spent on developmental works, was not correct. The
Commissioner also stated that the grounds on which the amounts were lapsed were not
known.
Such lapsing of funds belonging to the third tier of Governance i.e., Municipality would
adversely affect their performance.
3.1.6 Inoperative PD Accounts
As per Article 271 (iii) (4) of Financial Code, if a PD account is not operated for a
considerable period and there is a reason to believe that the need for the deposit account
has ceased, the same should be closed in consultation with the officer in whose favour the
deposit account has been opened. These orders were, however, not complied with and the
following were observed:
9 from 493 accounts in March 2018; from 527 accounts in March 2019
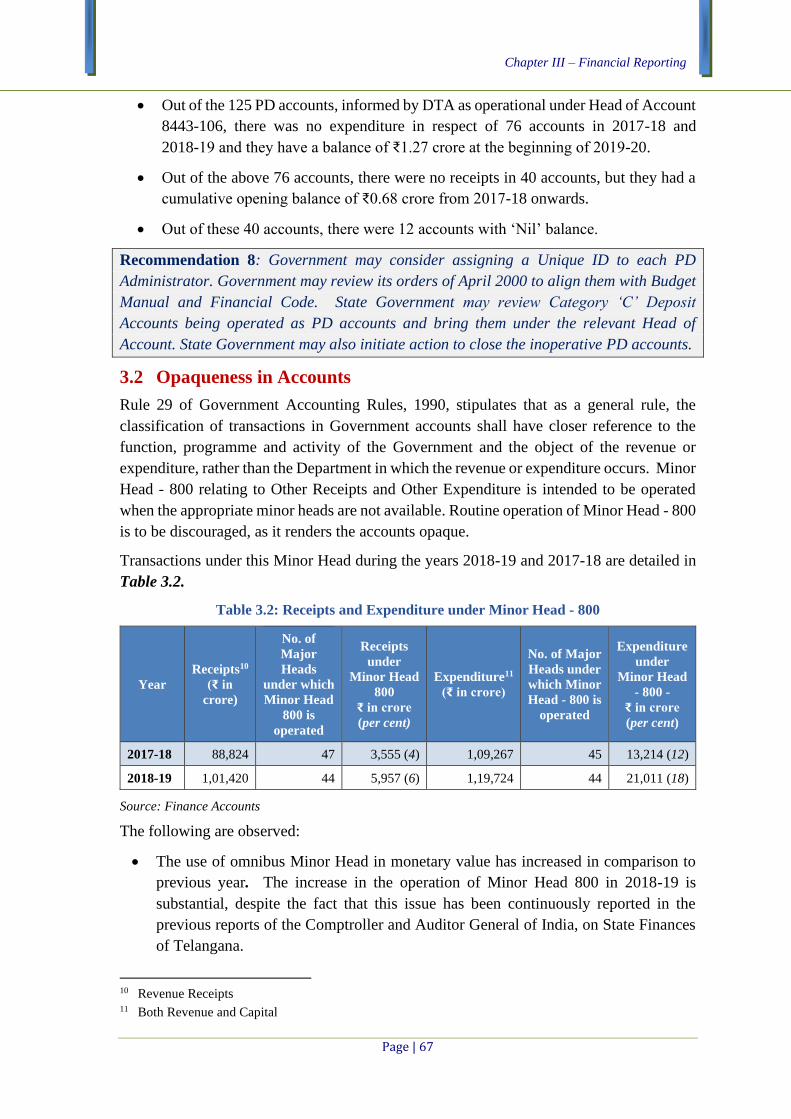
Chapter III – Financial Reporting
Page | 67
• Out of the 125 PD accounts, informed by DTA as operational under Head of Account
8443-106, there was no expenditure in respect of 76 accounts in 2017-18 and
2018-19 and they have a balance of ₹1.27 crore at the beginning of 2019-20.
• Out of the above 76 accounts, there were no receipts in 40 accounts, but they had a
cumulative opening balance of ₹0.68 crore from 2017-18 onwards.
• Out of these 40 accounts, there were 12 accounts with ‘Nil’ balance.
Recommendation 8: Government may consider assigning a Unique ID to each PD
Administrator. Government may review its orders of April 2000 to align them with Budget
Manual and Financial Code. State Government may review Category ‘C’ Deposit
Accounts being operated as PD accounts and bring them under the relevant Head of
Account. State Government may also initiate action to close the inoperative PD accounts.
3.2 Opaqueness in Accounts
Rule 29 of Government Accounting Rules, 1990, stipulates that as a general rule, the
classification of transactions in Government accounts shall have closer reference to the
function, programme and activity of the Government and the object of the revenue or
expenditure, rather than the Department in which the revenue or expenditure occurs. Minor
Head - 800 relating to Other Receipts and Other Expenditure is intended to be operated
when the appropriate minor heads are not available. Routine operation of Minor Head - 800
is to be discouraged, as it renders the accounts opaque.
Transactions under this Minor Head during the years 2018-19 and 2017-18 are detailed in
Table 3.2.
Table 3.2: Receipts and Expenditure under Minor Head - 800
Year
Receipts10
(₹ in
crore)
No. of
Major
Heads
under which
Minor Head
800 is
operated
Receipts
under
Minor Head
800
₹ in crore
(per cent)
Expenditure11
(₹ in crore)
No. of Major
Heads under
which Minor
Head - 800 is
operated
Expenditure
under
Minor Head
- 800 -
₹ in crore
(per cent)
2017-18 88,824 47 3,555 (4) 1,09,267 45 13,214 (12)
2018-19 1,01,420 44 5,957 (6) 1,19,724 44 21,011 (18)
Source: Finance Accounts
The following are observed:
• The use of omnibus Minor Head in monetary value has increased in comparison to
previous year. The increase in the operation of Minor Head 800 in 2018-19 is
substantial, despite the fact that this issue has been continuously reported in the
previous reports of the Comptroller and Auditor General of India, on State Finances
of Telangana.
10 Revenue Receipts 11 Both Revenue and Capital

State Finances Audit Report for the year ended March 2019
Page | 68
The fact that such substantial proportion of the receipts / expenditure is classified
under Minor Head - 800 is a cause for concern, as it impacts transparency.
• In respect of 12 Receipt Major Heads like Tourism, Urban Development and Minor
Irrigation, entire Receipts totalling to ₹62 crore were classified under Minor Head -
800 – Other Receipts (details in Appendix 3.1).
• In respect of six Expenditure Heads, expenditure totalling to ₹1,468 crore was
classified under Minor Head 800 – Other expenditure (details in Appendix 3.2).
Capital Outlay on Roads and Bridges alone was ₹1,300.59 crore under Minor Head -
800.
• In respect of 11 Major Heads, receipts amounting to ₹2,836.73 crore, (details in
Appendix 3.3) and in respect of 6 Major Heads, expenditure amounting to
₹13,192.14 crore, (details in Appendix 3.4), substantial proportion i.e., 50 per cent or
more were classified under Minor Head 800 – Other Receipts / Expenditure.
• In respect of two receipt Major Heads viz., Miscellaneous General Services
(₹2,660.71 crore) and State Goods and Services Tax (₹1,913.43 crore), the Receipts
classified under Minor Head 800 was more than ₹1,000 crore in each case.
Accounting huge receipts under Other Receipts adversely impacts the quality of
reporting of the Receipts.
• In respect of five12 Revenue Expenditure Major Heads, the expenditure classified
under Minor Head - 800 was more than ₹1,000 crore in each case.
3.2.1 Use of omnibus Minor Head - 800 despite availability of specific Minor
Heads
It was observed in audit that Omnibus Minor Head - 800 (with the relatable sub-head) was
operated despite availability of specific Minor Head in the following cases (Table 3.3):
12 (i) Crop Husbandry (₹8,151.02 crore), (ii) Power (₹3,710.96 crore), (iii) Welfare of SC and ST
(₹2,424.45 crore), (iv) Nutrition (₹1,432.40 crore) and (v) Capital outlay on Roads and Bridges
(₹1,300.59 crore)

Chapter III – Financial Reporting
Page | 69
Table 3.3: Use of Minor Head 800 with relatable sub-head despite availability of relatable
specific Minor Head
(₹ in lakh)
Sl.
No.
Classification
under Minor
Head - 800
Description of
sub-head used
Related
specific
Minor Head
to be used
Related specific
Minor Head
Description
No. of
cases Amount
Receipts
1 0070-60-800-25 Receipts under
Right to
Information Act,
2005
0070-60-118 Receipts under
Right to
Information Act,
2005
135 1.39
2 0202-04-800-01 Receipts of the
Department of
Archaeology
0202-04-101 Archives and
Museums
98 64.34
Expenditure
1 2403-00-800-08 Veterinary
services and
Animal Health
2403-00-101 Veterinary
services and
Animal Health
65 466.93
2 2405-00-800-05 National scheme
for welfare of
Fishermen
2405-00-121 Welfare schemes
for Fishermen
1 247.50
Source: Finance Accounts
Classifying the receipts and expenditure under omnibus Minor Head - 800, despite
availability of specific Minor Head indicates wrong depiction of Government Accounts.
Also, it may be noted, as discussed in paragraph 2.10.2, that the Government has been
opening new sub-heads every year without the concurrence of Accountant General (A&E).
The Government opened 18 new sub-heads in 2018-19 without prior concurrence of the
AG (A&E). Total provision made under these sub-heads was ₹13,891 crore. Obtaining
concurrence of Accountant General (A&E) before opening new sub-heads helps in
avoiding such duplications and incorrect classifications.
Recommendation 9: The Finance Department may, in consultation with the Accountant
General (A&E), conduct a comprehensive review of all the items presently appearing under
Minor Head – 800 -‘Other Expenditure’ and ensure that, in future, all such receipts and
expenditure are booked under appropriate Heads of Account to avoid opaqueness in the
accounts.
3.3 Compliance to Indian Government Accounting Standards
As per Article 150 of the Constitution of India, the President of India may, on the advice
of the Comptroller and Auditor General of India, prescribe the form of accounts of the
Union and of the States. In accordance with this provision, the President of India has so far
notified three Indian Government Accounting Standards (IGAS). Compliance to these
Accounting Standards by Government of Telangana in 2018-19 and deficiencies therein
are detailed in Table 3.4:

State Finances Audit Report for the year ended March 2019
Page | 70
Table 3.4: Compliance to Accounting Standards
Sl.
No. Accounting Standard
Compliance by
State
Government
Deficiencies noticed in compliance
1 IGAS 1: Guarantees
Given by the
Government –
Disclosure requirements
Not complied
(Statements 9
and 20 of
Finance
Accounts)
Detailed information like number of Guarantees for
each institution was not furnished. The Statements
are incomplete to that extent. (please refer to
paragraph 1.7.2 - for further audit findings on
Guarantees)
2 IGAS 2:Accounting and
Classification of Grants-
in-Aid
Not complied
(Statement 10 of
Finance
Accounts)
Certain Grants-in-Aid were classified under Capital
section in contrast to the Accounting Standards
(please refer to paragraph 1.3.1, Table 1.4)
3 IGAS 3: Loans and
Advances made by
Governments
Not complied
(Statement 18 of
Finance
Accounts)
Details not confirmed by the State Government.
Detailed information of overdue Principal and
interest was not furnished. Confirmation of balances
of individual Loanee was not furnished.
(please refer to paragraph 1.6.3 for further audit
findings on Loans and Advances)
Source: Indian Government Accounting Standards and Finance Accounts
Non-compliance to Accounting Standards would impact the objective of financial
statements to present a true and fair view of the financial position, financial performance
and cash flows apart from hindering fiscal transparency.
3.4 Submission of Annual Accounts by Autonomous Bodies
Sections 19 and 20 of “Comptroller and Auditor General of India (Duties, Powers and
Conditions of Service Act) 1971” (CAG’s DPC Act) facilitate certification of Accounts of
Autonomous Bodies (ABs) set up by the State Governments.
There were 24 ABs which were to
submit their Annual Accounts to
CAG for certification of Accounts
under Section 19 and 20 of the
CAG’s DPC Act, before 30 June
every year. None of the 24 ABs have
submitted their Annual Accounts in
time. There were delays ranging from
one to nine years in submission of
Accounts (Table 3.5).
Table 3.5: Age-wise details of delay in submission
of Annual Accounts of Autonomous Bodies
Sl.
No
Delay in Number of
Years
No. of Bodies/
Authorities
1 1 6
2 2-3 9
3 4-5 5
4 6-7 2
5 8-9 2
Total 24
The following are observed:
• Metropolitan Legal Services Authority and Telangana State Group Life Insurance did
not submit even their first Annual Accounts since 2010-11 and 2014-15 respectively, as
of December 2019.

Chapter III – Financial Reporting
Page | 71
• Hyderabad Metropolitan Water Supply and Sewerage Board (HMWSSB) did not submit
annual accounts from 2010-11 onwards. Despite non-rendering of accounts for nine
years, the Government has been providing loans and guarantees to HMWSSB. The State
Government has provided ₹874.80 crore as Loans to HMWSSB in 2018-19 alone. The
total loans outstanding as of March 2019 stood at ₹5,932.30 crore. Further, the value of
guarantees given by State Government to HMWSSB also increased from ₹3,399 crore
(March 2018) to ₹3,487 crore (March 2019).
In the absence of rendering of annual accounts, there is likelihood of cases of
misclassification and wrong accounting procedures going un-noticed. A case in point is
comparison of accounts of State Government and Arogyasri Health Care Trust (AHCT).
While the accounts of State Government depict a loan of ₹276.28 crore and Grants-in-Aid
of ₹222.60 crore to Arogyasri Health Care Trust (AHCT) in 2017-18, the annual accounts
of AHCT for 2017-18 depict that it has received ₹182.05 crore in the form of Advances
and ₹461.38 crore in the form of Grants-in-Aid. Such aberrations/misrepresentations might
go undetected if the annual accounts are not submitted in time.
Delay in submission of annual accounts dilutes accountability and impacts the purpose of
preparation of accounts. There is a need for the State Government to ensure that the
Autonomous Bodies receiving Loans, Guarantees or Grants prepare and submit their annual
accounts timely, so as to ensure that financial misrepresentations or irregularities, if any,
do not go undetected.
3.5 Submission of Utilisation Certificates
Effective Budget controls aid in transparency of accounts and help in watching the proper
utilization of Grants provided for various schemes/programs. As per Article 211-A.2 of TS
Financial Code, the Departmental Officers are responsible for certifying to the Accountant
General (A&E) about the fulfilment of conditions attached to the utilisation of the Grant.
The Utilisation Certificates (UCs) should be furnished in such form and at such intervals
as may be agreed between AG (A&E) and the Head of Department concerned.
Utilisation Certificates for Grants in respect of seven sanctions (amounting to
₹421.84 crore) in respect of three schemes out of 11 sanctions (amounting to
₹1,015.33 crore) pertaining to Municipal Administration and Urban Development
Department, for which sanctions were accorded with a stipulation that the Grant receiving
authority shall submit UCs to AG (A&E), have become due and have not yet been received
as of December 2019. Details shown in Table 3.6 below:

State Finances Audit Report for the year ended March 2019
Page | 72
Table 3.6: Schemes for which UCs not received (₹ in crore)
S.
No Name of the Scheme Year of Grant
Total GIA
released
UCs
submitted Balance
1 AMRUT& Smart Cities 2016-17 374.97 -- 374.97
2 JNNURM 2016-17 18.12 -- 18.12
3 Swachh Bharat 2016-17 28.75 -- 28.75
Total 421.84 421.84
Source: Information furnished by AG (A&E)
• Audit observed that Grants-in-Aid of ₹500.00 crore was released to the Telangana
State Housing Corporation Limited (TSHCL) (September 2018) towards the scheme
‘Construction of Two Bed Room Houses to the Rural poor’. As per the Appropriation
Accounts, in the month of March 2019, ₹468.00 crore was withdrawn by the
Government and expenditure of ₹32.00 crore only was incurred towards the scheme.
However, UC for ₹500.00 crore was submitted by TSHCL (May 2019), stating that
the amount has been utilised fully. The UC furnished was faulty.
Pendency in submission of UCs is fraught with risk of fraud and mis-appropriation of funds.
Further, it was observed that the Grant receiving authorities in respect of MA & UD
Department only were instructed to furnish Utilisation Certificates to Accountant General
(A&E). Similar instructions in respect of sanctions pertaining to other Departments for
monitoring by AG (A&E) were not forthcoming.
Recommendation 10: State Government may ensure that sanctions in respect of specific
purpose Grants pertaining to other Departments may also include a stipulation regarding
furnishing of UCs to AG (A&E).
3.6 Submission of Detailed Contingent bills
Financial Rules13 permit drawal of advances on Abstract Contingent bills (AC bills) for the
purpose of meeting contingent expenditure for specified purposes. Treasury rules14 and
Government orders15 stipulate that all advances drawn on AC bills should be adjusted by
submitting the Detailed Contingent bills (DC bills) with supporting vouchers within one
month. As of March 2019, there were 2,969 AC bills amounting to ₹340.39 crore, which
remained un-adjusted due to non-submission of DC bills as shown in Table 3.7 below:
13 Article 99 of Telangana Financial code 14 SR18 below TR 16 15 GO No.391, dt.22-03-2002 and 507, dt.10-04-2002

Chapter III – Financial Reporting
Page | 73
Table 3.7: Year-wise details of AC bills pending adjustment
Year As of March 2018 As of March 2019
No. of
AC Bills
Amount
(₹ in crore)
No. of AC Bills Amount
(₹ in crore)
Up to 2014 641 81.64 548 75.21
2014-15 349 99.00 273 49.06
2015-16 393 39.38 256 24.47
2016-17 447 42.40 255 35.28
2017-18 334* 18.03* 589 21.37
2018-19 -- -- 1,048* 135.00*
Total 2,164 280.45 2,969 340.39
Source: Accountant General (A&E), Telangana
* Information reflects data upto December of the respective years
The number of AC bills awaiting adjustment as of March 2019 (2,969 bills amounting to
₹340.39 crore) has increased in comparison to previous year (2,164 bills amounting to
₹280.45 crore). Further, the drawal of AC bills has increased substantially in 2018-19.
Out of 2,969 AC bills pending adjustment, 1,651 AC bills amounting to ₹193.54 crore
(57 per cent) were pending adjustment by three Departments16 in which DC bills for more
than ₹10 crore in each case were awaited as of March 2019.
365 AC bills amounting to ₹30.12 crore pertaining to the period prior to bifurcation of the
State were still pending.
Advances drawn and not accounted for increase the possibility of wastage /
mis-appropriation / malfeasance etc.
3.7 Un-reconciled Receipts and Expenditure
Government Orders17 and Financial Rules18 stipulate that expenditure recorded in the books
of Chief Controlling Officers (CCOs) of Departments is to be reconciled with the books of
the Accountant General (Accounts and Entitlements) every month. Reconciliation enables
the CCOs to exercise effective control over budget and expenditure. It also ensures
accuracy of the accounts.
A sum of ₹18,943.16 crore of receipts, i.e., 19 per cent of total Revenue Receipts
(₹1,01,420.16 crore) remained un-reconciled in 2018-19 (Appendix 3.5). Similarly,
expenditure of ₹21,435.71 crore, i.e., 18 per cent of total expenditure (₹1,19,723.61 crore)19
remained un-reconciled. Non-reconciliation impacts the assurance that all the
receipts/expenditures have properly been taken to the final Head of Account.
16 Revenue – 1,473 AC Bills (₹161.71 crore); Panchayat Raj & Rural Department – 134 AC Bills
(₹15.08 crore); Planning Department – 44 AC Bills (₹16.75 crore) 17 GO Ms .No. 507 of Finance(TFR)Department dated 10 April 2002 18 Article 9 of State Financial Code 19 Total Expenditure for 2018-19 as per Finance Accounts

State Finances Audit Report for the year ended March 2019
Page | 74
• There were five CCOs who did not reconcile receipts of ₹100 crore and above as
shown in (Table 3.8) below. The total of such un-reconciled receipts in 2018-19 was
₹18,667.06 crore.
Table 3.8: CCOs with highest un-reconciled receipts
S. No. Name of the CCO Amount
(₹ in crore)
1 Commissioner of Commercial Taxes 10,512.41
2 Commissioner, Prohibition and& Excise 4,757.92
3 Commissioner of Industries 2,721.82
4 Director, Mines and Geology (Non-Ferrous Mining and Metallurgical
Industries)
390.78
5 Commissioner and Inspector General of Stamps and Registration 284.13
Total 18,667.06
Source: Information obtained from Accountant General (A&E), Telangana
• Similarly, there were 25 CCOs who did not reconcile expenditure of ₹100 crore and
above (Appendix 3.6). The total of such un-reconciled expenditure was ₹19,235.53
crore. Out of these, six CCOs did not reconcile expenditure of more than
₹1,000 crore as shown in Table 3.9 below. The total of such un-reconciled
expenditure was ₹11,782.70 crore, which amounted to 55 per cent of the total un-
reconciled expenditure.
Table 3.9: CCOs with highest un-reconciled expenditure
Sl. No. Name of the CCO Amount (₹ in crore)
1 Commissioner, Social Welfare, D.S. Samkshema Bhavan 3,974.21
2 Director of School Education 2,379.70
3 Commissioner, Tribal Welfare, D.S. Samkshema Bhavan 2,180.28
4 Secretary, Energy Department 1,203.66
5 Commissioner, BC Welfare, D.S. Samkshema Bhavan 1,039.89
6 Commissioner, Panchayat Raj 1,004.96
Total 11,782.70
Source: Information obtained from Accountant General (A&E), Telangana
Periodical and regular reconciliation of accounts is necessary to provide accuracy and
consistency in financial accounts.
3.8 Follow up action on Audit Reports
As per the instructions issued by Finance and Planning Department in November 1993,
Administrative Departments are required to submit Explanatory Notes within three months
of presentation of Audit Reports to Legislature, without waiting for any notice or call from
Public Accounts Committee, duly indicating action taken or proposed to be taken.

Chapter III – Financial Reporting
Finance Department furnished (July 2018) Explanatory Notes for Audit Report on State Finances for the year 2016-17. Finance Department, however, did not furnish Explanatory Notes for Audit Reports on State Finances for the years 2017-18, 2015-16 and 2014-15 as of January 2020.
Hyderabad The
(SUDHA RAJAN) Accountant General (Audit), Telangana
Countersigned
New Delhi The
(RAJIV MEHRISHI) Comptroller and Auditor General of India
29 July 2020
31 July 2020


Appendices


Appendix 1.1
Profile of Telangana
(Refer paragraph on State Profile, page 1)
A General Data
Sl.
No
Particulars Figures
1 Area 1,11,851 sq. km
2 Population -
a. As per 2001 Census 3.10 crore
b. As per 2011 Census 3.50 crore
3 a. Density of Population (as per 2001 Census)
(All India Density = 325 persons per Sq. km.)
270 persons per Sq.km
b. Density of Population (as per 2011 Census)
(All India Density = 382 persons per Sq.km.)
312 persons per Sq.km.
4 Population Below Poverty Line (BPL) 2011-12 (All India
Average=21.9 per cent)
9.2
5 a. Literacy (as per 2001 Census) (All India Average=64.86 per
cent)
58 per cent
b. Literacy (as per 2011 Census) (All India Average=73.00 per
cent)
66.5 per cent
6 Infant mortality (per 1000 live births)
(All India Average = 33 per 1,000 live births) (2012-16)
28
7 Life Expectancy at birth ( (All India Average = 68.7 years) 71.3
8 Gini Coefficient
a. Rural (All India = 0.29) 0.28
b. Urban (All India = 0.38) 0.38
9 Gross State Domestic Product (GSDP) 2018-19 at current price ₹ 8,65,688 crore 10 Per capita GSDP CAGR (2011-12 to 2018-
19)
Telangana 12.26
General Category
States
10.99
11 GSDP CAGR (2011-12 to 2018-19) Telangana 13.38
General Category
States
12.23
12 Population Growth (2009 to 2019) Telangana 8.43
General Category
States
12.46
B Financial Data
Compounded Annual Growth Rate Particulars
General
Category States
(2013-14 to
2017-18)
Telangana
(2014-15 to
2017-18)
General Category
States (2017-18 to
2018-19)
Telangana
(2017-18 to 2018-
19)
(in per cent)
a. of Revenue Receipts 13.54 20.28 12.77 14.18
b. of Tax Revenue 11.17 24.85 12.72 14.11
c. of Non -Tax Revenue 7.48 6.67 19.78 27.88
d. of Total Expenditure 13.86 31.95 12.73 11.04
e. of Capital Expenditure 15.35 41.86 11.93 (-)5.28
f. of Revenue Expenditure on
Education 10.69 21.63 9.38 (-)6.07
g. of Revenue Expenditure on
Health 17.59 24.38 11.09 3.02
h. of Salary and Wages 10.47 23.54 11.03 1.51
i. of Pension 13.83 41.52 14.31 (-)3.81

State Finances Audit Report for the year ended March 2019
Page | 78
Appendix 1.2
Structure of Government Accounts and layout of Finance Accounts
(Refer introductory paragraph to Chapter 1, page 1)
Part A: Structure of Government Accounts
The accounts of the State Government are kept in three parts (i) Consolidated Fund, (ii) Contingency Fund and (iii) Public
Account.
Part I: Consolidated Fund: All revenues received by the State Government, all loans raised by issue of treasury bills,
internal and external loans and all moneys received by the Government in repayment of loans shall form one consolidated
fund entitled ‘The Consolidated Fund of State’ established under Article 266(1) of the Constitution of India.
Part II: Contingency Fund: The Contingency Fund of the State established under Article 267 (2) of the Constitution is
in the nature of an imprest placed at the disposal of the Governor to enable him to make advances to meet urgent
unforeseen expenditure, pending authorization by Legislature. Approval of the Legislature for such expenditure and for
withdrawal of an equivalent amount from the Consolidated Fund is subsequently obtained, whereupon the advances from
the Contingency Fund are recouped to the Fund.
Part III: Public Account: Receipts and disbursements in respect of certain transactions such as small Savings, provident
funds, reserve funds, deposits, suspense, remittances etc., which do not form part of the Consolidated Fund, are kept in
the Public Account set up under Article 266 (2) of the Constitution and are not subject to vote by the State Legislature.
Part B: Layout of Finance Accounts
Statement
No.
Layout
01 Statement of Financial Position
02 Statement of Receipts & Disbursements
Annexure - Cash Balances and Investments of Cash Balances
03 Statement of Receipts(Consolidated Fund)
04 Statement of Expenditure(Consolidated Fund)
05 Statement of Progressive Capital Expenditure
06 Statement of Borrowings and Other Liabilities
07 Statement of Loans and Advances given by the Government
08 Statement of Investments of the Government
09 Statement of Guarantees given by the Government
10 Statement of Grants-in-Aid given by the Government
11 Statement of Voted and Charged Expenditure
12 Statement on Sources and Application of funds for expenditure other than on Revenue Account
13 Summary of Balances under Consolidated Fund, Contingency Fund and Public Account
Notes to Accounts
14 Detailed Statement of Revenue and Capital Receipts by Minor Heads
15 Detailed Statement of Revenue Expenditure by Minor Heads
16 Detailed Statement of Capital Expenditure by Minor Heads and Sub Heads
17 Detailed Statement of Borrowings and Other Liabilities
18 Detailed Statement of Loans and Advances given by the State Government
19 Detailed Statement of Investments of the Government
20 Detailed Statement of Guarantees given by the Government
21 Detailed Statement of Contingency Fund and other Public Account transactions
22 Detailed Statement of Investments of Earmarked Funds
Appendices In addition to the above 22 statements Finance Accounts also contain 13 appendices giving the
details on salaries, subsidies, Grants-in-Aid – scheme-wise and institution –wise, details of
externally aided projects, scheme-wise expenditure in respect of major Central Schemes and State
Plan Schemes etc.

Appendices
Page | 79
Appendix 1.3
Abstract of Receipts and Disbursements in 2018-19
(Refer paragraph 1.2 and 1.6.4; pages 1 and 32)
(₹ in crore)
Receipts Disbursements
BE Actuals BE Actuals
Section-A: Revenue
I. Revenue Receipts 1,30,975 1,01,420 I. Revenue Expenditure 1,25,455 97,083
Tax revenue 72,252 64,674 General Services 32,479 34,199
Social Services 55,366 39,721
Non-tax revenue 8,974 10,007 Education, Sports, Art and
Culture 12,530 11,503
Health and Family Welfare 6,423 4,912
State's share of Union
Taxes 20,707 18,561 Water Supply, Sanitation,
Housing and Urban
Development
9,078 3,220
Non-Plan Grants 18,770 --- Information and
Broadcasting 447 270
Grants for State Plan
Schemes
10,272 --- Welfare of SCs, STs, OBCs
and Minorities
14,503 8,822
Grants for Central and
Centrally sponsored Plan
Schemes
--- 5,508 Labour and Labour Welfare 388 166
Finance Commission
Grants
--- 1,806 Social Welfare and Nutrition 11,835 10,709
Other Transfers/Grants to
States --- 864 Others 162 119
Economic Services 37,577 23,158
Agriculture and allied
Activities
16,896 12,601
Rural Development 3,658 2,857
Irrigation and Flood Control 8,249 389
Energy 5,052 4,983
Industry and Minerals 1,547 751
Transport 1,154 872
Science, Technology and
Environment 20 7
General Economic Services 1,001 698
Grants-in-Aid and
Contributions
33 5
II. Revenue deficit
carried over to Section B
--- --- II. Revenue Surplus
carried over to Section B
5,520 4,337
Section-B: Others
III. Opening Cash
balance including
Permanent Advances and
Cash Balance Investment
312 6,993 III. Opening Overdraft
from RBI
--- ---
IV. Miscellaneous
Capital receipts
--- --- IV. Capital Outlay 33,369 22,641
General Services 2,182 703
Social Services 6,655 5,620
Education, Sports, Art and
Culture
545 279
Health and Family Welfare 1,092 463
Water Supply, Sanitation, Housing and Urban
Development
2,864 4,253
Welfare of Scheduled
Castes, Scheduled Tribes,
2,105 618

State Finances Audit Report for the year ended March 2019
Page | 80
Other Backward Classes and
Minorities
Social Welfare and Nutrition 41 6
Others 8 1
Economic Services 24,532 16,318
Agriculture and allied
Activities
356 1,012
Rural Development
Programme
3,699 1,996
Irrigation and Flood Control 14,419 9,118
Energy --- 2,400
Industry and Minerals 103 67
Transport 2,617 1,024
General Economic Services 3,338 701
V. Recoveries of Loans
and Advances
7,807 66 V. Loans and Advances
disbursed
9,036 8,706
From Power Projects 401 --- For Power Projects 598 250
From Government
Servants
36 65 To Government Servants 145 57
From others 7,370 1 To Others 8,293 8,399
VI. Revenue Surplus
brought down
5,520 4,337 VI. Revenue deficit
brought down
--- ---
VII. Public Debt receipts 33,200 50,962 VII. Repayment of Public
Debt
6,594 28,716
Internal Debt other than Ways and Means
Advances and Overdraft
32,400 28,705 Internal debt other than Ways and Means Advances
and Overdraft
6,191 6,059
Net transactions of Ways and Means Advances
including Overdraft
--- 21,823 Net transactions of Ways and Means Advances including
Overdraft
--- 21,823
Loans and Advances from
Central Government
800 434 Repayment of Loans and
Advances to Central
Government
403 834
VIII. Net of Inter-State
Settlement
--- --- VIII. Net of Inter-State
Settlement
--- 5
IX. Appropriation to
Contingency Fund
--- --- IX. Appropriation to
Contingency Fund
--- ---
X. Amount recouped to
Contingency Fund
--- 0.09 X. Expenditure from
Contingency Fund
(remained un-recouped)
--- 2.10
XI. Public Account
Receipts
69,766 1,14,152 XI. Public Account
disbursements
67,266 1,09,222
Small Savings and
Provident Funds
2,500 2,427 Small Savings and Provident
Funds
1,400 1,582
Net Reserve Funds 15,874 1,598 Net Reserve Funds 15,653 68
Net Suspense and
Miscellaneous
--- 29,672 Net Suspense and
Miscellaneous
--- 30,332
Remittances --- 17,860 Remittances --- 17,746
Deposits and Advances 51,392 62,595 Deposits and Advances 50,213 59,494
XII. Closing Overdraft
from Reserve Bank of
India
--- --- XII. Closing Cash Balance 340 7,218
Cash in Treasuries and Local
Remittances
--- 2.07
Deposits with Reserve Bank
and other Banks
--- (-) 93
Departmental cash balance
including permanent
advances
--- 0.30
Cash balance investment and
investment of earmarked
funds
--- 7,309
Total 2,47,580 2,77,930 Total 2,47,580 2,77,930

Appendices
Page | 81
Appendix 1.4
Time Series Data on State Government Finances
(Refer paragraph 1.2; page 1)
(₹in crore)
2014-15 2015-16 2016-17 2017-18 2018-19
Part A Receipts
1 Revenue Receipts 51,042(99.85) 76,134(99.88) 82,818(99.81) 88,824(99.84) 1,01,420(99.93)
(i) Tax Revenue 29,288(57.38) 39,975(52.51) 48,408(58.44) 56,520(63.63) 64,674(63.77)
State Goods and Services Tax --- --- --- 13,073(23.13) 23,840(36.86)
Taxes on Sales, Trade, etc. 22,121(75.53) 29,847(74.66) 34,235(41.33) 25,107(44.42) 20,291(31.37)
State Excise 2,808(9.59) 3,809(9.53) 5,581(6.74) 9,421(16.67) 10,638(16.45)
Taxes on Vehicles 1,618(5.52) 2,309(5.78) 3,394(4.09) 3,590(6.35) 3,762(5.82)
Stamps and Registration fees 2,177(7.43) 3,102(7.76) 3,822(4.61) 4,202(7.43) 5,344(8.26)
Land Revenue 9(0.03) 104(0.26) 7(0.01) 4(0.01) 0.42(0)
Other Taxes 555(1.89) 804(2.01) 1,369(1.65) 1,123(1.99) 799(1.24)
(ii) Non-Tax Revenue 6,447(12.63) 14,414(18.93) 9,782(11.79) 7,825(8.81) 10,007(9.87)
(iii) State’s share in Union taxes
and duties
8,189(16.04) 12,351(16.22) 14,876(17.93) 16,420(18.49) 18,561(18.30)
(iv) Grants-in-Aid from GOI 7,118(13.95) 9,394(12.34) 9,752(11.81) 8,059(9.07) 8,178(8.06)
2 Misc. Capital Receipts 0(0) 0(0) 0(0) 0(0) 0(0)
3 Recovery of Loans and
Advances
77(0.15) 88(0.12) 156(0.19) 138(0.16) 66(0.07)
4 Total revenue and Non-debt
capital receipts (1+2+3)
51,119(84.22) 76,222(81.33) 82,974(64.93) 88,962(64.41) 1,01,486(66.57)
5 Public Debt Receipts 9,580(15.78) 17,498(18.67) 44,819(35.07) 49,153(35.59) 50,962(33.43)
Internal Debt (excluding Ways
and Means Advances and
Overdraft)
9,494(99.10) 16,465(94.10) 31,775(70.89) 25,595(52.07) 28,705(56.33)
Net transactions under Ways and
Means Advances and Overdraft
0(0) 112(0.64) 12,088(26.97) 22,922(46.63) 21,823(42.82)
Loans and Advances from
Government of India
86(0.90) 921(5.26) 956(2.13) 636(1.30) 434(0.85)
6 Total Receipts in the
Consolidated Fund (4+5)
60,699(21.41) 93,720(52.04) 1,27,793(53.95) 1,38,115(56.46) 1,52,448(57.19)
7 Contingency Fund receipts 50(0.02) 0(0) 0(0) 0(0) 0.09(0)
8 Public Account receipts 2,22,579(78.5
6)
86,385(47.96) 1,09,094(46.05) 1,06,511(43.54) 1,14,152(42.81)
9 Total Receipts of Government
(6+7+8)
2,83,328 1,80,105 2,36,887 2,44,626 2,66,600
Part B Expenditure/Disbursement
10 Revenue Expenditure 50,673(83.72) 75,896(79.82) 81,432(68.87) 85,365(73.81) 97,083(75.59)
Plan 14,063(27.75) 21,240(27.99) 24,580(30.18) 0(0) 0(0)
Non-plan 36,610(72.25) 54,656(72.01) 56,852(69.82) 85,365(100) 97,083(100)
General Services (including
interest payments)
14,164(27.95) 23,247(30.63) 25,125(30.85) 30,872(36.16) 34,199(35.23)
Social Services 18,753(37.01) 30,466(40.14) 35,286(43.33) 37,260(43.65) 39,721(40.91)
Economic Services 17,644(34.82) 22,043(29.04) 20,949(25.73) 17,200(20.15) 23,158(23.85)
Grant-in-Aid and contributions 112(0.22) 140(0.18) 72(0.09) 33(0.04) 5(0.01)
11 Capital Expenditure 8,373(13.83) 13,590(14.29) 33,371(28.22) 23,902(20.66) 22,641(17.63)
Plan 8,373(100.00) 13,590(100) 33,366(99.99) 0(0) 0(0)
Non-plan 0(0) 0(0) 5(0.01) 23,902(100) 22,641(100)
General Services 406(4.85) 274(2.02) 567(1.70) 565(2.36) 703(3.11)
Social Services 905(10.81) 2,152(15.84) 3,162(9.47) 2,851(11.93) 5,620(24.82)
Economic Services 7,062(84.34) 11,164(82.14) 29,642(88.83) 20,486(85.71) 16,318(72.07)

State Finances Audit Report for the year ended March 2019
Page | 82
12 Disbursement of Loans and
Advances
1,483(2.45) 5,233(5.50) 3,402(2.88) 6,209(5.37) 8,706(6.78)
13 Net of Inter-State Settlement 0 359 50(0.03) 186(0.16) 5(0)
14 Total (10+11+12+13) 60,529 (97.15) 95,078 (97.09) 1,18,255(88.37) 1,15,662(80.81) 1,28,435(81.73)
15 Repayment of Public Debt 1,727(2.77) 2,845(2.91) 15,568(11.63) 27,471(19.19) 28,716(18.27)
Internal Debt (excluding Ways
and Means Advances and
Overdraft)
1,727(100.00) 2,582(90.76) 2,717(17.45) 4,137(15.06) 6,059(21.10)
Net transactions under ways and
Means Advances and Overdraft
0(0) 112(3.93) 12,088(77.65) 22,922(83.44) 21,823(76)
Loans and Advances from
Government of India
0(0) 151(5.31) 763(4.90) 412(1.50) 834(2.90)
16 Appropriation to Contingency
Fund
50(0.08) 0(0) 0(0) 0(0) 0(0)
17 Total disbursement out of
Consolidated Fund (14+15+16)
62,306(78.54) 97,923(54.76) 1,33,823(55.95) 1,43,133(59.20) 1,57,151(58.99)
18 Contingency Fund
Disbursements
0(0) 0(0) 0.09(0) 0(0) 2.10(0.01)
19 Public account disbursement 2,20,971(78) 80,909(45.24) 1,05,368(44.05) 98,664(40.80) 1,09,222(41)
20 Total disbursement by the
state (17+18+19)
2,83,277 1,78,832 2,39,191 2,41,797 2,66,375
Part C Deficits
21 Revenue Deficit(-)/Surplus(+)
(1-10)
369 238 1,386 3,459 4,337
22 Fiscal Deficit(-)/Surplus (+) (4-
14)
(-)9,410 (-)18,856 (-)35,281 (-)26,700 (-)26,949
23 Primary Deficit (-)/Surplus (+)
(22-24)
(-)4,183 (-)11,298 (-)26,672 (-)15,864 (-)14,363
Part D Other Data
24 Interest Payments (included in
Revenue Expenditure)
5,227 7,558 8,609 10,836 12,586
25 Financial Assistance to local
bodies etc.
20963 29,058 30,648 30,416 37,908
26 Ways and Means
Advances/Overdraft availed
(days)
0 4 99 7 32
27 Interest on Ways and Means
Advances/Overdraft
0 0.04 7 14 15
28 Gross State Domestic Product
(GSDP)#
5,05,849 5,77,902 6,59,033 7,53,811 8,65,688
29 Outstanding fiscal liabilities
(year-end)@$
79,880 97,992 1,34,738 1,65,849 1,96,963
30 Outstanding guarantees (year-
end)%
18,265 26,619 29,965 41,892 77,713
31 Maximum amount guaranteed
(yearend)
21,240 28,094 31,871 41,892 77,713
32 Number of incomplete projects^ 109 23 92 19 20
33 Capital blocked in incomplete
projects^
33,001 24,224 50,216 70,758 1,00,494
Part E Fiscal Health Indicators
I Resource Mobilization
Own Tax revenue/GSDP 0.058 0.069 0.073 0.075 0.075
Own Non-Tax revenue/GSDP 0.013 0.025 0.015 0.010 0.012
Central transfers/GSDP 0.030 0.038 0.037 0.033 0.031
II Expenditure Management
Total expenditure/GSDP 0.123 0.169 0.203 0.190 0.182
Total Expenditure/Revenue
Receipts
1.186 1.249 1.428 1.611 1.550
Revenue Expenditure/ Total
Expenditure
0.837 0.739 0.689 0.596 0.618
Expenditure on Social
Services/Total Expenditure
0.344 0.395 0.349 0.280 0.289

Appendices
Page | 83
Expenditure on Economic
Services/Total Expenditure
0.413 0.354 0.432 0.263 0.251
Capital Expenditure/Total
Expenditure
0.138 0.143 0.282 0.167 0.144
Capital Expenditure on Social
and Economic Services/ Total
Expenditure
0.132 0.141 0.277 0.163 0.140
III Management of Fiscal
Imbalances
Revenue Deficit (surplus)/GSDP 0.0007 0.0004 0.0021 0.005 0.005
Fiscal Deficit/ GSDP (-)0.0186 (-)0.0326 (-)0.0535 (-)0.035 (-)0.031
Primary Deficit/ GSDP (-)0.0083 (-)0.0195 (-)0.0405 (-)0.021 (-)0.017
Revenue Surplus/Fiscal Deficit (-)0.039 (-)0.013 (-)0.039 (-)0.130 (-)0.161
Primary Revenue Balance/
GSDP
0.0112 0.0136 0.0154 0.019 0.020
IV Management of Fiscal
Liabilities
Fiscal liabilities/ GSDP 0.158 0.170 0.204 0.221 0.228
Fiscal liabilities/RR 1.564 1.287 1.627 1.867 1.942
Primary deficit vis-à-vis
quantum spread
NA NA NA NA NA
Debt Redemption:
(Principal + Interest)/Total Debt
Receipts
0.734 0.594 0.540 0.77 0.80
V Other Fiscal Health Indicators
Return on Investment 35.08 5.19 0.54 0.62 0.48
Balance from Current Revenue -
Financial Assets/Liabilities 0.198 0.351 0.502 0.595 0.658
Note: Figures in brackets represent percentages (rounded) to total of each sub-heading
NA – Not Available
# GSDP data from Directorate of Economics and Statistics, Government of Telangana @Nomenclature and its components were changed so as to show total liabilities of Government (i.e. Public
debt and other obligations) as per revised format of Chapter-I.
^ The information is not exhaustive but is as furnished by the Departmental authorities.
$ Excluding un-apportioned balances retained with successor state of Andhra Pradesh as per AP
Reorganisation Act 2014.
% As disclosed Budget documents

State Finances Audit Report for the year ended March 2019
Page | 84
Appendix 1.5
Composition and application of resources in the Consolidated Fund of the State
(Refer paragraph 1.2; page 3)
Composition of Resources
Application of resources
42.42
6.5612.18
5.360.04
33.43
₹ comes from
(in per cent)
Tax RevenueNon-Tax RevenueCentral Tax TransfersGrants-in-aidRecoveries of loans & AdvancesPublic Debt Receipts
21.76
25.28
14.74
0.00
14.41
5.54
0.00
18.27
₹ Goes to
(in per cent)
General ServicesSocial ServicesEconomic ServicesGrants-in-aid (5 crore)Capital ExpenditureLoans and AdvancesInter-State Settlement (5 crore)Repayment of Public Debt

Appendices
Page | 85
Appendix 1.6
Summarised financial position of the Government of Telangana as on 31 March 2019
(Refer paragraph 1.6; page 27)
(₹in crore)
As on 31 March
2018 Liabilities As on 31 March 2019
1,34,287 Internal Debt 1,56,934
1,11,536 Market Loans bearing interest 1,33,719
0.20 Market Loans not bearing interest 0.12
0 Market Loans Suspense 0
85 Loans from LIC 72
19 Loans from GIC 16
3,746 Loans from NABARD 4,546
9,227 Loans from other Institutions 9,721
9,674 Special securities issued to NSSF 8,860
- Ways and Means Advances -
- Overdraft from Reserve Bank of India -
8,631 Loans and Advances from Central Government 8,230
- Pre 1984-85 Loans -
19 Non-Plan Loans 16
8,612 Loans for State Plan Schemes 7,144
- Loans for Central Plan Schemes -
- Loans for Centrally Sponsored Plan Schemes -
- Other loans for States/Union Territories with Legislature schemes 1,070
- Other Ways and Means Advances -
50 Contingency Fund 50
9,272 Small Savings, Provident Funds, etc. 10,117
12,138 Deposits 19,714
6,158 Reserve Funds 7,688
871 Suspense and Miscellaneous Balances 201
16 Remittance Balances 131
1,71,423 Total 2,03,065
Assets
79,236 Gross Capital Outlay on Fixed Assets 1,01,876
16,365 Investments in shares of Companies, Corporations, Cooperatives,
etc. 19,754
62,871 Other Capital Outlay 82,122
0.09 Contingency Fund (un-recouped) 2.10
15,869 Loans and Advances 24,509
538 Loans for Power Projects 788
15,234 Other Development Loans 23,633
97 Loans to Government servants and Miscellaneous loans 88

State Finances Audit Report for the year ended March 2019
Page | 86
(-) 20 Advances (-) 23
0 Remittance Balances 0
0 Suspense and Miscellaneous Balances 0
6,993 Cash 7,218
2.07 Cash in Treasuries and Local Remittances 2.07
76.03 Deposits with Reserve Bank and other Banks (-) 93.29
0.30 Departmental Cash Balance 0.30
2,277.42 Cash Balance Investments 1,589
4,637.09 Investment of Earmarked funds 5,720
69,345 Deficit on Government Account 69,483
1,71,423 Total 2,03,065
Appendix 1.7
Summarised position of Apportionment of balances between Andhra Pradesh and
Telangana as on 31 March 2019
(Refer paragraph 1.9; page 43)
(₹ in crore)
Sl.
No. Head of Account
Balance
as on
01 June
2014
Balance
allocated to
Telangana
Balance
allocated to
Andhra Pradesh
Balance yet to
be apportioned
as on 31 March
2019
1 Capital Heads 1,51,349.67 0 0 1,51,349.67
2 Public Debt 1,66,522.32 69,479.48 97,123.93 (-) 81.09
3 Loans and Advances 28,099.69 0 0 28,099.69
4 Small Savings,
Provident Funds
14,077.84 6,097.54 7,980.30 0
5 Reserve Funds 2,459.06 1,008.81 1,450.25 0
6 Deposits and Advances 17,082.77 4,478.89 8,129.84 4,474.04
7 Suspense And
Miscellaneous
6,234.24 2,495.81 3,500.43 238
8 Remittances 339.47 2.32 26.92 310.23

Appendices
Page | 87
Appendix 2.1
Top five Grants with high Savings and Excess expenditure
(Refer paragraph 2.3.2; page 48)
(₹ in crore)
Grants with High Savings Grants with Excess expenditure
Grant No. Grant Name Savings Grant
No. Grant Name Excess
XXXIII
CV
Major and Medium
Irrigation
(-) 11,243.45 IX
LC
Fiscal Administration,
Planning, Surveys and
Statistics
21,076.44
XXXIII
RV
Major and Medium
Irrigation
(-) 7,830.68 IX
RV
Fiscal Administration,
Planning, Surveys and
Statistics
3,990.45
XXI
RV
Social Welfare (-) 4,539.33 XXI
LV
Social Welfare 1,500.00
XXVII
RV
Agriculture (-) 4,178.21 XXII
LV
Tribal Welfare 900.00
XVII
RV
Municipal
Administration and
Urban Development
(-) 4,034.91 IX
RC
Fiscal Administration,
Planning, Surveys and
Statistics
794.72
TOTAL (-) 31,826.58 28,261.61
CV: Capital Voted; LC: Loans charged; RV: Revenue Voted; LV: Loans voted; RC: Revenue Charged
Appendix 2.2
Excess expenditure against amounts authorised by the Legislature during the year
(Refer paragraph 2.3.2.1; page 49)
(₹ in crore)
Sl.No. Grant
No.
Name of the Grant or
appropriation
Total
Grant Expenditure
Excess
expenditure
1 V
CV
Revenue, Registration and Relief 16.32 19.38 3.06
2 VI
RV
Excise Administration 227.20 254.55 27.35
3 IX
LC
Fiscal Administration, Planning,
Surveys and Statistics
7,639.20 28,715.64 21,076.44
4 IX
RC
Fiscal Administration, Planning,
Surveys and Statistics
11,793.77 12,588.49 794.72
5 IX
RV
Fiscal Administration, Planning,
Surveys and Statistics
12,880.90 16,871.35 3,990.45
6 X
RV
Home Administration 5,097.69 5,870.94 773.25
7 XXI
LV
Social Welfare 0.00 1,500.00 1,500.00
8 XXII
LV
Tribal Welfare 0.00 900.00 900.00
9 XXIX
CV
Forest, Science, Technology and
Environment
148.29 216.71 68.42
Total 37,803.37 66,937.06 29,133.69
CV: Capital Voted; RV: Revenue Voted; LC: Loans charged; RC: Revenue Charged; LV: Loans voted;

State Finances Audit Report for the year ended March 2019
Page | 88
Appendix 2.3
Cases of Expenditure incurred without approval of the Legislature
(Refer paragraph 2.3.2.1; page 49)
(`₹ in crore)
Sl.No. Grant
No.
Head Of
Account Sub Head Description
Total
Grant-
O+S
Re-
Appropriation Expenditure
1 I 2071-01-111-34 Pension allocable to
successor State of
Telangana
0.00 0.00 7.70
2 IV 4070-00-800-42 Purchase of Vehicles to
Chief Electoral Officer
0.00 1.35 3.13
3 VII 3604-00-103-04 Assignments to Local
Authorities
0.00 4.93 4.93
4 IX 7810-00-125-00 Andhra Pradesh and
Telangana
0.00 0.00 5.30
5 IX 2052-00-090-15 Assistance to Telangana
State IAS Officers
Institute
0.00 5.00 5.00
6 IX 2071-01-103-34 Pension allocable to
successor State of
Telangana
0.00 0.00 4.82
7 IX 2071-01-104-15 Retirement Gratuity and
Death Gratuity to
employees covered
under NPS
0.00 0.00 0.08
8 IX 2071-01-105-14 Post-bifurcation Family
Pensions allocable
between the Successor
States of Andhra
Pradesh and Telangana
in the ratio of
58.32:41.68
0.00 0.00 159.40
9 IX 2071-01-115-34 Amount Allocable to
successor State of TS
0.00 0.00 203.95
10 IX 2071-01-800-06 Medical
Reimbursement of all
types of Pensioners
0.00 0.00 133.97
11 IX 2071-01-800-07 Pensioners PRC arrears 0.00 0.00 103.22
12 X 4055-00-207-31 Nationwide Emergency
Response System
0.00 0.00 25.00
13 X 4055-00-207-38 Police Stations as
Citizen Friendly
Service Delivery Units
(Rachakonda)
0.00 0.00 0.57
14 X 4055-00-207-40 Backbone for Citizen
Centric Traffic
Management
0.00 0.00 0.19
15 XI 3054-04-797-04 Subvention From
Central Road Fund
0.00 279.08 279.08
16 XV 2204-00-104-05 Assistance to Telangana
State Sports School
0.00 2.27 2.27

Appendices
Page | 89
17 XVI 2210-01-110-96 Add-Charges
transferred from 06
P.H. towards repairs of
Motor Vehicles of
Primary Health Centers
on Pro-rata basis
0.00 0.00 0.49
18 XVI 2210-06-101-97 Add Charges 0.00 0.00 0.26
19 XVI 2211-00-104-97 Add Charges
Transferred from SMH
06 towards repairs of
Motor Vehicles under
Family Welfare
0.00 0.00 1.74
20 XXI 6225-01-800-07 Loans to SC
Development
Corporation
0.00 0.00 1500.00
21 XXII 4225-02-277-75 Buildings for School
Complexes
0.00 2.37 0.96
22 XXII 6225-02-800-14 Loans to TRICOR 0.00 0.00 900.00
23 XXVII 4401-00-119-05 Development of
Horticulture Colleges
0.00 0.00 0.15
24 XXVII 2851-00-797-04 Transfer to Sericulture
Development Fund
0.00 0.00 0.20
25 XXIX 2406-01-101-06 Conservation of Natural
Resources and Eco
System
0.00 0.08 0.08
26 XXXI 2235-60-104-04 Deposit Linked
Insurance Scheme
0.00 0.00 1.29
27 XXXII 2515-00-797-04 Transfer to Rural
Development Fund
0.00 145.00 144.85
28 XXXIII 4700-80-800-06 Project Establishment
under TILIP
0.00 0.00 0.02
29 XXXIII 4711-01-103-27 Canals and
Distributaries
0.00 0.41 0.41
30 XXXIII 2700-01-110-26 Dam and Appurtenant
Works
0.00 1.62 1.62
31 XXXIII 2700-01-800-04 Project Establishment
under Chief Engineer,
Major Irrigation
0.00 0.00 0.00*
32 XXXIV 2702-03-101-10 Construction of New
Minor Irrigation Tanks
under ILIP
0.00 0.00 0.01#
33 XXXV 6801-00-205-10 Loans to Transco for
Modernisation and
Strengthening of
Transmission system in
Hyderabad
Metropolitan Area
0.00 0.00 16.10
34 XXXVIII 3456-00-103-08 Strengthening of Price
Monitoring Cell (PMC)
0.00 0.00 0.38
TOTAL 0.00 442.11 3,507.17
* Actual Expenditure is ₹6,156 rounded off to crore
# Actual Expenditure is ₹50,000 rounded off to crore

State Finances Audit Report for the year ended March 2019
Page | 90
Appendix 2.4
Grants/Appropriations where saving was more than ₹100 crore each and
more than 20 per cent of the total provision
(Refer paragraph 2.3.2.3; page 51)
(₹ in crore)
Sl.
No Grant No.
Name of the Grant or
appropriation Total Grant Expenditure Saving
In Per
cent
Revenue Voted
1 III Administration of
Justice
672.45 435.04 (-)237.41 (-)35.30
2 IV General Administration
and Elections
810.72 615.46 (-)195.26 (-)24.08
3 V Revenue, Registration
and Relief
2,196.23 1,637.59 (-)558.65 (-)25.44
4 XI Roads, Buildings and
Ports
1,380.53 1,047.67 (-)332.85 (-)24.11
5 XIII Higher Education 1,972.35 1,321.08 (-)651.28 (-)33.02
6 XVI Medical and Health 6,085.90 4,075.03 (-)2,010.86 (-)33.04
7 XVII Municipal
Administration and
Urban Development
5,996.57 1,961.65 (-)4,034.91 (-)67.29
8 XVIII Housing 2,220.72 623.47 (-)1,597.25 (-)71.92
9 XIX Information and Public
Relations
458.07 269.74 (-)188.33 (-)41.11
10 XX Labour and
Employment
828.76 607.19 (-)221.57 (-)26.73
11 XXI Social Welfare 11,814.28 7,274.95 (-)4,539.33 (-)38.42
12 XXII Tribal Welfare 6,814.27 4,655.22 (-)2,159.04 (-)31.68
13 XXIII Backward Classes
Welfare
5,764.78 3,544.07 (-)2,220.70 (-)38.52
14 XXIV Minority Welfare 2,096.55 1,265.62 (-)830.93 (-)39.63
15 XXV Women, Child and
Disabled Welfare
1,838.19 1,202.14 (-)636.06 (-)34.60
16 XXVII Agriculture 13,407.82 9,229.61 (-)4,178.21 (-)31.16
17 XXVIII Animal Husbandry and
Fisheries
743.92 517.29 (-)226.63 (-)30.46
18 XXXI Panchayat Raj 3,153.15 2,301.31 (-)851.84 (-)27.02
19 XXXIII Major and Medium
Irrigation
8,204.25 373.57 (-)7,830.68 (-)95.45
20 XXXVI Industries and
Commerce
1,685.42 481.57 (-)1,203.85 (-)71.43
21 XXXVIII Civil Supplies
Administration
1,929.25 1,509.43 (-)419.82 (-)21.76
Capital Voted
22 IX Fiscal Administration,
Planning, Surveys and
Statistics
2,494.10 495.22 (-)1,998.88 (-)80.14
23 X Home Administration 1,351.35 301.43 (-)1,049.92 (-)77.69

Appendices
Page | 91
24 XI Roads, Buildings and
Ports
4,052.38 1,484.21 (-)2,568.17 (-)63.37
25 XII School Education 490.26 194.31 (-)295.96 (-)60.37
26 XVI Medical and Health 1,147.71 462.82 (-)684.89 (-)59.67
27 XXI Social Welfare 1,371.64 248.70 (-)1,122.94 (-)81.87
28 XXII Tribal Welfare 1,417.91 307.94 (-)1,109.97 (-)78.28
29 XXIII Backward Classes
Welfare
642.50 331.18 (-)311.32 (-)48.45
30 XXVII Agriculture 1,108.35 769.35 (-)339.00 (-)30.59
31 XXXIII Major and Medium
Irrigation
19,200.93 7,957.48 (-)11,243.45 (-)58.56
32 XXXIV Minor Irrigation 2,782.96 1,080.34 (-)1,702.62 (-)61.18
33 XXXVI Industries and
Commerce
237.49 65.66 (-)171.83 (-)72.35
Loans Voted
34 IX Fiscal Administration,
Planning, Surveys and
Statistics
191.40 62.10 (-)129.30 (-)67.55
35 XVII Municipal
Administration and
Urban Development
2,105.50 1,051.30 (-)1,054.2 (-)50.07
36 XXXIII Major and Medium
Irrigation
2,316.78 - (-)2,316.78 (-)100.00
37 XXXV Energy 598.24 249.67 (-)348.57 (-)58.27
Revenue Charged
38 V Revenue, Registration
and Relief
153.70 27.54 (-)126.16 (-)82.08
Capital Charged
39 XI Roads, Buildings and
Ports
169.37 12.35 (-)157.02 (-)92.71
Total 1,21,906.76 60,050.32 (-)6,1856.44

State Finances Audit Report for the year ended March 2019
Page | 92
Appendix 3.1
Cases where entire Receipts were booked under omnibus Minor Head - 800 in
2018-19
(Refer paragraph 3.2; page 68)
(₹ in crore)
Sl.
No.
Major
Head Major Head Description
Total
Revenue
Receipts
Revenue Receipts
under Min Head
800
Per cent
1 1452 Tourism 18.51 18.51 100
2 0217 Urban Development 8.60 8.60 100
3 0801 Power 7.75 7.75 100
4 0702 Minor Irrigation 5.72 5.72 100
5 1456 Civil Supplies 4.68 4.70 100
6 1053 Civil Aviation 4.03 4.03 100
7 0701 Medium Irrigation 3.90 3.90 100
8 0235 Social Security and Welfare 3.83 3.83 100
9 0506 Land Reforms 3.02 3.02 100
10 0515 Other Rural Development Programmes 1.45 1.45 100
11 0056 Jails 0.27 0.27 100
12 0211 Family Welfare 0.23 0.23 100
TOTAL 62.02 62.02
Appendix 3.2
Cases where almost entire expenditure booked under omnibus Minor Head - 800
in 2018-19
(Refer paragraph 3.2; page 68)
(₹ in crore)
Sl.
No.
Major
Head Major Head Description
Total
Expenditure
Expenditure
in Minor
Head
Per cent
1 5054 Capital Outlay on Roads and Bridges 1,024.23 1,300.59 127*
2 4070 Capital Outlay on Other Administrative Services 144.25 144.25 100
3 2810 New and Renewable Energy 15.64 15.64 100
4 2875 Other Industries 6.00 6.00 100
5 4405 Capital Outlay on Fisheries 1.02 1.02 100
6 2701 Medium Irrigation 0.09 0.09 100
TOTAL 1,191.00 1,468.00
* Percentage figure is more than 100 as total expenditure under the Major Head is reduced mainly due to
recoveries in other Minor Heads (Expenditure under Minor Head 800 Other Expenditure: ₹1,300.59
crore; Minor Head 902: (-)₹279.08 crore, Minor Head 337 Road works:₹3.48 crore, Minor Head 796
Tribal Sub Plan: ₹3.46 crore)

Appendices
Page | 93
Appendix 3.3
Cases where more than 50 per cent of Receipts were booked under
omnibus Minor Head - 800 for the year 2018-19
(Refer paragraph 3.2; page 68)
(₹ in crore)
Sl.
No.
Major
Head Major Head Description
Receipts under
Major Head
Receipts under
Minor Head-800 Percentage
1 0425 Co-operation 10.09 9.97 98.81
2 1054 Roads and Bridges 34.08 33.53 98.39
3 0700 Major Irrigation 31.59 30.88 97.75
4 0058 Stationery and Printing 1.58 1.49 94.30
5 0401 Crop Husbandry 14.01 12.94 92.36
6 0220 Information and Publicity 0.24 0.22 91.67
7 0059 Public Works 11.58 8.72 75.30
8 0406 Forestry and Wild Life 60.62 41.70 68.79
9 0075 Miscellaneous General Services 3,885.33 2,660.72 68.48
10 0029 Land Revenue 0.42 0.28 66.67
11 0049 Interest Receipts 59.51 36.28 60.96
Total 4,109.05 2,836.73
Appendix 3.4
Cases where more than 50 per cent of Expenditure was booked under
omnibus Minor Head - 800 for the year 2018-19
(Refer paragraph 3.2; page 68)
(₹ in crore)
Sl
No.
Major
Head Major Head Description
Expenditure
under
Major Head
Expenditure
under Minor
Head-800
Percentage
1 2801 Power 4,967.00 3,710.96 74.71
2 2401 Crop Husbandry 11,297.66 8,151.02 72.15
3 5475 Capital Outlay on other
General Economic Services
701.03 485.22 69.22
4 2501 Special Programmes for Rural
Development
602.73 382.66 63.49
5 2851 Village and Small Industries 133.46 74.74 56
6 3054 Roads and Bridges 702.45 387.54 55.17
Total 18,404.33 13,192.14

State Finances Audit Report for the year ended March 2019
Page | 94
Appendix 3.5
Statement of Un-reconciled Receipts of Telangana for the year 2018-19
(Refer paragraph 3.7; page 73)
Sl. No. Chief Controlling Officer Major Head Amount (₹ in crore)
1 Commissioner of Commercial taxes 0040 10,512.41
2 Commissioner, Prohibition & Excise 0039 4,757.92
3 Commissioner of Industries 0853 2,721.82
4 Non-Ferrous Mining &Metallurgical industries 0853 390.78
5 Commissioner and Inspector General of Stamps &
Registration 0030 284.13
6 Commissioner of Commercial Taxes 0040 68.33
7 Forestry and Wild Life 0406 60.44
8 Major Irrigation 0070 47.83
9 Major and Medium Irrigation 0700 31.44
10 Commissioner of Tourism and Culture 1452 15.83
11 Public Works 0059 9.67
12 Education, Sports, Art and Culture 0202 7.37
13 Taxes on Goods and Passengers 0042 6.80
14 Minor Irrigation 0702 5.66
15 Other Economic Services 1475 5.00
16 Major and Medium Irrigation 0701 3.90
17 Other Taxes on Income & Expenditure 0028 2.71
18 Roads and Bridges 1054 2.01
19 Social Security and Welfare 0235 1.51
20 Water Supply and Sanitation 0215 1.38
21 Social Security 0235 1.23
22 Public Works 0059 1.02
23 Commissioner And Ex-Officio Secretary, CAF&CS 1456 0.75
24 Other Rural Development Programmes 0515 0.68
25 Other Social Services 0250 0.60
26 Commissioner of Commercial Taxes 0045 0.59
27 Assistant Secretary, Energy Department 0801 0.46
28 Education, Sports, Art And Culture 0202 0.28
29 Housing 0216 0.22
30
Commissioner of Rural Development &
Commissioner of Panchayat Raj and Rural
Development
0515 0.14
31 Other Administrative Services 0700 0.12
32 Police 0055 0.10
33 Forestry and Wild Life 0406 0.06
34 Commissioner of Industries 0851 0.03

Appendices
Page | 95
35 Non-Ferrous Mining & Metallurgical Industries 0853 0.03
36 Housing 0216 0.02
37 Chief Engineer of I & CAD 0702 0.02
38 Other Administrative Services 0070 0.01
39 Engineer-In-Chief, R&B 1054 0.00
40 Commissioner of Industries 0875 0.00
41 Chief Commissioner of Land Administration 0029 (-) 0.14
TOTAL 18,943.16

State Finances Audit Report for the year ended March 2019
Page | 96
Appendix 3.6
Statement of Un-reconciled Revenue Expenditure of ₹ 100 crore above
for the year 2018-19
(Refer paragraph 3.7; page 74)
Sl.
No. Chief Controlling Officer
Major
Head
Un-reconciled
amount (₹ in crore)
1 School Education –HoD, Director Of School Education, Saifabad 2202 2,238.70
2 Commissioner Social welfare, DS Samkshema Bhavan 2401 1,461.19
3 Secretary, Energy Department, Telangana State Secretariat 2801 1,203.66
4 Commissioner Social welfare, DS Samkshema Bhavan 2235 1,069.58
5 Commissioner, Backward Classes Welfare, DS Samkshema Bhavan 2225 1,039.89
6 Commissioner, Panchayat Raj Urdu Hall Lane, Himayat Nagar 2515 1,004.96
7 Land Administration – HoD, Chief Commissioner 2053 897.22
8 Chief Engineer Rural Water Supply, Errum Manzil 4215 734.96
9 Commissioner of Rural Development 2235 680.26
10 DG&IG of Police, Saifabad 2055 672.60
11 Commissioner of Tribal Welfare, DS Samkshema Bhavan 2235 658.57
12 Commissioner Social Welfare, DS Samkshema Bhavan 2225 652.62
13 Commissioner of Tribal Welfare, DS Samkshema Bhavan 2225 626.77
14 Secretary, M A & U D Department, Telangana Secretariat 2217 519.36
15 Commissioner of Tribal Welfare, DS Samkshema Bhavan 2401 515.16
16 Deputy Secretary to Government, Health, Medical and Welfare
Department 2210 462.67
17 Civil Supplies –HoD, Commissioner of Civil Supplies, Civil Supplies
Bhavan 2236 429.72
18 Commissioner Social Welfare, DS Samkshema Bhavan 2236 407.03
19 Commissioner Social Welfare, DS Samkshema Bhavan 2801 383.79
20 Intermediate Education - HoD Director, Intermediate Education 2202 337.30
21 Registrar, High Court, Nayapul 2014 289.91
22 Secretary, Youth Advancement, Tourism and Cultural Department
Telangana State Secretariat 2251 288.75
23 Director, Medical Education, DMS Compound, Koti 4210 264.44
24 Commissioner of Rural Development, 2nd Floor, Huda Hermitage
Complex 2501 246.79
25 Commissioner of Rural Development, 2nd Floor, Huda Hermitage
Complex, Saifabad 4515 244.00
26 Commissioner of Tribal Welfare, DS Samkshema Bhavan 2801 244.23
27 Elections: Chief Electoral Officer & Ex-Officio Special Secretary to
Govt, General Administration Elections Department 2015 240.64
28 Agriculture –HOD, Commissioner & Director of Agriculture, Fateh
Maidan 2401 231.83
29 Higher Education, Secretariat Dept. - HOD Secretary 2202 224.42
30 Principal Chief Conservator of Forests, Aranya Bhavan, Opposite
Reserve bank of India, Saifabad, 2406 194.48
31 School Education - HOD Director of School Education Saifabad 2236 141.00
32 Commissioner Tribal Welfare, DS Samkshema Bhavan 2236 135.55
33 Director of Health, Government of Telangana State, Sultan Bazar 2210 133.02
34 Technical Education - Director, Technical Education 2203 130.45
35 Commissioner of State Excise 2039 124.95
36 Collegiate Education - HOD Director of Collegiate Education 2202 105.06 TOTAL 19,235.53

Appendices
Page | 97
Glossary of Terms
Term Basis of Calculation
Buoyancy of a Parameter Rate of Growth of a Parameter / GSDP Growth Rate
Development Expenditure Social Services Expenditure + Economic Services
Expenditure
Fiscal Deficit
Revenue Expenditure + Capital Expenditure + Net Loans and
Advances – Revenue Receipts – Miscellaneous Capital
Receipts
Non Debt Receipts Revenue Receipts + Miscellaneous Capital receipts +
Recoveries of Loans and Advances
Primary Deficit Fiscal Deficit – Interest payments
Primary Expenditure Revenue Expenditure – Interest payments + Capital
Expenditure + Loans and Advances + Inter State Settlements
Primary Revenue
Expenditure Revenue Expenditure – Interest payments
Primary Revenue Surplus Non Debt Receipts - Primary Revenue Expenditure
Revenue Surplus Revenue Receipts – Revenue Expenditure
Term Description
Appropriation
Appropriation is the provision made in the budget for incurring
expenditure which is directly charged and not subject to the
voting of the Legislature
Capital Expenditure
Expenditure of a capital nature such as construction of irrigation
projects, bridges, buildings, laying of roads, irrigation and
electricity projects, etc.
Debt sustainability
Debt sustainability is defined as the ability of the State to
maintain a constant Debt - GSDP ratio over a period of time. It
means that rise in fiscal deficit should match with the increase
in the State’s capacity to service the incremental debt from
additional revenues generated from the use of such debt in
creating income generating capital assets.
GDP/GSDP
Gross Domestic Product (GDP) and Gross State Domestic
Product (GSDP) refers to the market value of all officially
recognised final goods and services produced within the
Country and the State respectively in a given period of time,
accounted without duplication and are an important indicator of
the Country and State’s economy.

State Finances Audit Report for the year ended March 2019
Page | 98
Term Description
Grant Grant means the amount voted by the Legislative Assembly in
respect of a demand for Grant
Loan account
Loan account is the account of public debt incurred and
discharged and loans and advances made by the State
Government to local bodies, employees and others and
recovered from them.
Public Debt
Public Debt comprises of loans raised by Government such as
market loans, loans from the Life Insurance Corporation of
India etc., and the borrowings from the Central Government.
Revenue Expenditure
Revenue Expenditure is the account of current expenditure of
the State. For example, wages, salaries, maintenance works,
repairs, etc.
Ways and Means Advances
Ways and Means Advances are temporary advances extended
by RBI to the Government. These are meant to bridge the gap
between expenditure and receipts. They are not a source
of finance but are meant to provide support, for purely
temporary difficulties that arise on account of
mismatch/shortfall in revenue or other receipts for meeting
Government liabilities

Appendices
Page | 99
Abbreviations
Acronym Full form
AC Bills Abstract Contingent Bills
AHCT Arogyasri Health Care Trust
ATB Auction Treasury Bill
BE Budget Estimates
BPL Below Poverty Line
CAG Comptroller and Auditor General of India
CCO Chief Controlling Officer
CDP Constituency Development Programme
CEO Chief Executive Officer
CGST Central Goods and Services Tax
CPO Chief Planning Officer
CSF Consolidated Sinking Fund
DC Bills Detailed Contingent Bills
DDO Designated Disbursing Officer
DISCOM Distribution Company
DPC Duties, Powers and Conditions of Service Act, 1971
DPR Detailed Project Report
DTA Director of Treasuries and Accounts
DTO District Treasury Office
FC Finance Commission
FRBM Fiscal Responsibility and Budget Management
GCS General Category States
GDP Gross Domestic Product
GIA Grants-in-Aid
GO Government Order
GoI Government of India
GRF Guarantee Redemption Fund
GSDP Gross State Domestic Product
GST Goods and Services Tax
HMDA Hyderabad Metropolitan Development Authority
HMWSSB Hyderabad Metropolitan Water Supply and Sewerage Board
HoD Head of Department
I&CAD Irrigation and Command Area Development
IGAS Indian Government Accounting Standards
IGST Integrated Goods and Services Tax
IMR Infant Mortality Rate
KIPCL Kaleshwaram Irrigation Project Corporation Limited

State Finances Audit Report for the year ended March 2019
Page | 100
MA & UD Municipal Administration and Urban Development
MTFP Medium Term Fiscal Policy Statement
NABF Net Availability of Borrowed Funds
NCDC National Cooperative Development Corporation
NPS National Pension System
NSDL National Securities Depository Limited
NTR Non-Tax Revenue
OD Overdraft
PAC Public Accounts Committee
PAO Pay and Accounts Office
PCI Per Capita Income
PD account Personal Deposit account
PDA Personal Deposit Administrator
PRI Panchayat Raj Institutions
RBI Reserve Bank of India
RoI Return on Investment
SBM-G Swachh Bharat Mission-Gramin
SCCDCL Scheduled Castes Co-operative Development Corporation Limited
SCSDF Scheduled Castes Special Development Fund
SDF Special Drawing Facility
SGST State Goods and Services Tax
SOTR State’s Own Tax Revenue
SPV Special Purpose Vehicle
STSDF Scheduled Tribes Special Development Fund
TDWSCL Telangana Drinking Water Supply Corporation Limited
TE Total Expenditure
TGST Telangana Goods and Services Tax
TRANSCO Transmission Corporation
TRICOR Telangana State Scheduled Tribes Cooperative Finance Corporation Limited
TSIIC Telangana State Industrial Infrastructure Corporation
TSSGDCFL Telangana State Sheep and Goat Development Cooperative Federation
Limited
TSWRIDCL Telangana State Water Resources Infrastructure Development Corporation
Limited
ULB Urban Local Bodies
WMA Ways and Means Advances
ZPPF Zilla Parishad Provident Fund


www.agap.cag.gov.in
©
COMPTROLLER AND AUDITOR GENERAL OF INDIA
www.cag.gov.in

FBXGG

FBXGG