ISA 402, Audit Considerations Relating to an Entity ... - ICJCE
Upload
khangminh22Category
view
0download
0
CHAPTER II
PERFORMANCE AUDIT RELATING TO GOVERNMENT COMPANIES
2.1 Underground Mining Activities in The
Singareni Collieries Company Limited 2.2 Activities of Andhra Pradesh State Agro
Industries Development Corporation Limited

Chapter II
2. Performance Audit relating to Government Companies 2.1 Underground Mining Activities in The Singareni Collieries
Company Limited
Executive Summary
Introduction The Singareni Collieries Company Limited (SCCL/ Company) was incorporated in December 1920 with main objective of development of mines for extraction of coal in the state of Andhra Pradesh. As most of the mines up to a depth of 350 metres have already been opened up by the Company either by underground or opencast method, all future mines will have to be operated in a depth range of 350 metres to 600 metres. Hence incremental production has to come mainly from underground (UG) mining.
Production and Profitability The production from UG mines was continuously decreasing during 2009-14, except for an increase in 2012-13. In UG mining, cost of production increased by 54.79 per cent whereas sales realisation increased only by 28.46 per cent during the period. The losses increased by 135.63 per cent.
Under utilization of Machinery Overall percentage of machine utilization during the five year period was only 35.85 per cent. There was overall shortfall in targeted production from UG mines and 54.41 per cent of that shortfall was attributable to under-performance of Side Dump Loaders (SDLs). The Company was using a large number of SDLs past their useful lives which were yet to be surveyed off.
Planning and execution of projects for introduction of Longwall method (LW) The Company had planned to introduce the state of the art Longwall technologies for bulk production from UG mines in four new projects with a total estimated capital outlay of ` 1,608.68 crore and production capacity of 9.01 MT.
The four longwall projects (KTK, Shanthikhani, Adriyala and Jallaram) though planned to achieve total additional production of 9.01 MT by 2012-13, could not commence production till June 2014, for which expenditure of ` 1,405.80 crore was incurred till March 2014.
Contrary to the Board’s approval for preparation of Notice Inviting Tender (NIT) for global tenders on risk and gain sharing basis, the Company engaged a private consultancy firm for preparation of NIT and identification of a technology provider-cum-operator (TPO). As the TPO failed to obtain the necessary approvals and clearances, Company terminated the agreement in March 2014. The Company had spent ` 125.16 crore till March 2014.
Report No. 4 of 2015 (Public Sector Undertakings)
18
Expenditure of ` 61.67 crore incurred on Shanthikhani longwall project became unfruitful due to unreasonable delays in decision making at every stage.
Combining two high cost projects, i.e. Jallaram and Adriyala, without assessing the feasibility of implementation and subsequent deferment of Jallaram project has adversely impacted the productivity and viability of Adriyala mine. Failure to take into account the planned overburden (OB) dump before planning the project led to loss of safety in the UG mine.
Irregularities in award of contracts for processing sand from Overburden The Company decided to process sand from the OB for which four contracts were awarded during the last five years. Amendments to NIT were issued for supply of water and power free of cost to the Contractor instead of chargeable basis without the approval of competent authority. Financial impact of these was ` 101.38 crore.
Sales Realization Loss incurred due to selling coal as Run of Mine (ROM) coal instead of crushed coal worked out to ` 28.40 crore during the period from 2009-10 to 2013-14. Sale of coal without separating into B-grade and D-grade in Vakilpalli mine resulted in loss of revenue of ` 29.56 crore in 2012-13.
Manpower Special Incentive scheme was designed without considering the additional financial burden compared to additional production over the target in case of UG mines.
Environment Failure to complete the projects on schedule necessitated the company to resort to mining in excess of EC capacity in violation of Environment Laws.

Chapter II-Performance Audit relating to Government Companies
19
2.1.1 Introduction
The Singareni Collieries Company Limited (SCCL/ Company) was incorporated in December 1920 with the main objective of development of mines for extraction of coal in the State of Andhra Pradesh. Since 1960, the Company is jointly owned by Government of Andhra Pradesh (GoAP) and Government of India (GoI) in the ratio of 51 per cent (` 885.60 crore) and 49 per cent (` 847.56 crore) respectively. The paid-up capital as on 31 March 2014 was ` 1,733.20 crore.
The demand for coal estimated by the Company for the terminal year of Twelfth Five Year Plan i.e. 2016-17 was around 73.50 million tonnes (MT) and projected production for the same year was 57 MT. Given the demand-supply gap, it was imperative for the Company to complete the new projects as per schedule. Coal can be extracted through either underground (UG) mining or opencast (OC) mining. The Company extracted 257.63 MT of coal during the last five years ending 2013-14 out of which 56.38 MT (21.88 per cent) was from UG mining and 201.25 MT (78.12 per cent) from OC mining. The Company has proven coal reserves of 9,923.31 MT (8.06 per cent of Country’s total coal reserves) spread over 17,500 sq kms in Khammam, Karimnagar, Adilabad and Warangal districts of Andhra Pradesh.
OC mining is done by removing the soil layers over coal seams i.e. overburden whereas in UG mining, coal is extracted by means of vertical and inclined shafts. The Company in its Board meeting concluded that coal seams were deep below the surface and it was not practical or economical to strip off the overlaying soil/ rock to extract coal. As most of the mines up to a depth of 350 metres have already been opened up by the Company either by underground or opencast method, all future mines will have to be operated in a depth range of 350 metres to 600 metres. Hence incremental production has to come mainly from underground mining. The Company has 48 operating mines (16- OC and 32- UG mines) as on 31 March 2014.
The Financial Performance of UG mines, OC mines during the period from 2009-10 to 2013-14 is detailed in Table 2.1:
Table 2.1: Financial Performance of SCCL (` in Crore)
Year UG OC Others13 SCCL Sales
Realisation 2009-10 1945.08 5005.20 126.18 7367.54 2010-11 2183.05 5873.26 76.04 8132.34 2011-12 2343.04 6646.23 411.96 9401.22 2012-13 2617.41 7173.31 506.64 10297.36 2013-14 2498.71 7291.18 453.01 10242.90
Cost of Production
2009-10 2578.52 3891.03 230.86 6970.82 2010-11 2877.72 4536.27 181.68 7595.67 2011-12 3477.43 5108.03 246.80 8832.27 2012-13 3827.78 5637.87 273.17 9738.82
13Others represents Investment income and expenditure related to Corporate Office.

Report No. 4 of 2015 (Public Sector Undertakings)
20
Year UG OC Others13 SCCL 2013-14 3991.26 5745.78 46.40 9783.44
Profit / Loss
2009-10 -633.44 1114.17 -104.68 396.72 2010-11 -694.67 1336.98 -105.64 536.68 2011-12 -1134.40 1538.20 165.15 568.96 2012-13 -1210.37 1535.44 233.47 558.54 2013-14 -1492.55 1545.40 406.61 459.46
Source: Mine Working Results
It can be seen from the above table that sales realization from OC mining increased by 45.67 per cent during the last five years while the cost of production increased by 47.67 per cent during the same period resulting in reduction in profit by 38.70 per cent. In case of UG mining, cost of production increased by 54.79 per cent whereas sales realization increased only by 28.46 per cent during the period. The losses increased by 135.63 per cent.
Performance Audit of the UG mining activities of the Company was taken up during 2014-15.
2.1.2 Organizational Structure
The management of the Company is vested in Board of Directors (Board). The Chairman and Managing Director (C&MD) is the Chief Executive who is assisted by five Functional Directors looking after Finance, Operations, Personnel, Administration and Welfare (PA&W), Electrical and Mechanical (E&M) and Projects and Planning (P&P), respectively. The Company is operating through 10 administrative areas, each headed by a General Manager responsible for the functioning of mines in the area.
2.1.3 Audit Objectives
The performance audit was conducted with a view to assess whether:
Effective planning was done for individual projects and proper execution carried out to increase productivity and production of the mines;
Marketing/ Sales activities ensured revenue optimization with specific focus on optimum product mix; and
Adequate attention was paid to safety and environmental factors in the operation and closure of the mines.
2.1.4 Scope of Audit and Methodology
The Performance audit was conducted from March to June 2014 and covers Performance of Underground (UG) Mining activities in the Company during the 5 year period from 2009-10. The 32 UG mines in operation as well as six UG projects14 under implementation during this period were reviewed in audit.
14 Project is a mine under construction.
Chapter II-Performance Audit relating to Government Companies
21
Records and related data kept at Corporate Office and the 10 Area offices were test checked with reference to audit criteria.
2.1.5 Audit Criteria
The audit criteria adopted were:
Agenda and minutes of Board Meetings,
Guidelines of Ministry of Coal,
Feasibility Reports and Revised Cost Estimates of mining projects and
Purchase and works manuals and procedures of the Company.
Audit objectives and audit criteria adopted were explained to the management in an Entry Conference held on 06 March 2014. An Exit Conference was held on 15 December 2014 wherein audit findings were discussed at the Government level.
2.1.6 Audit Findings
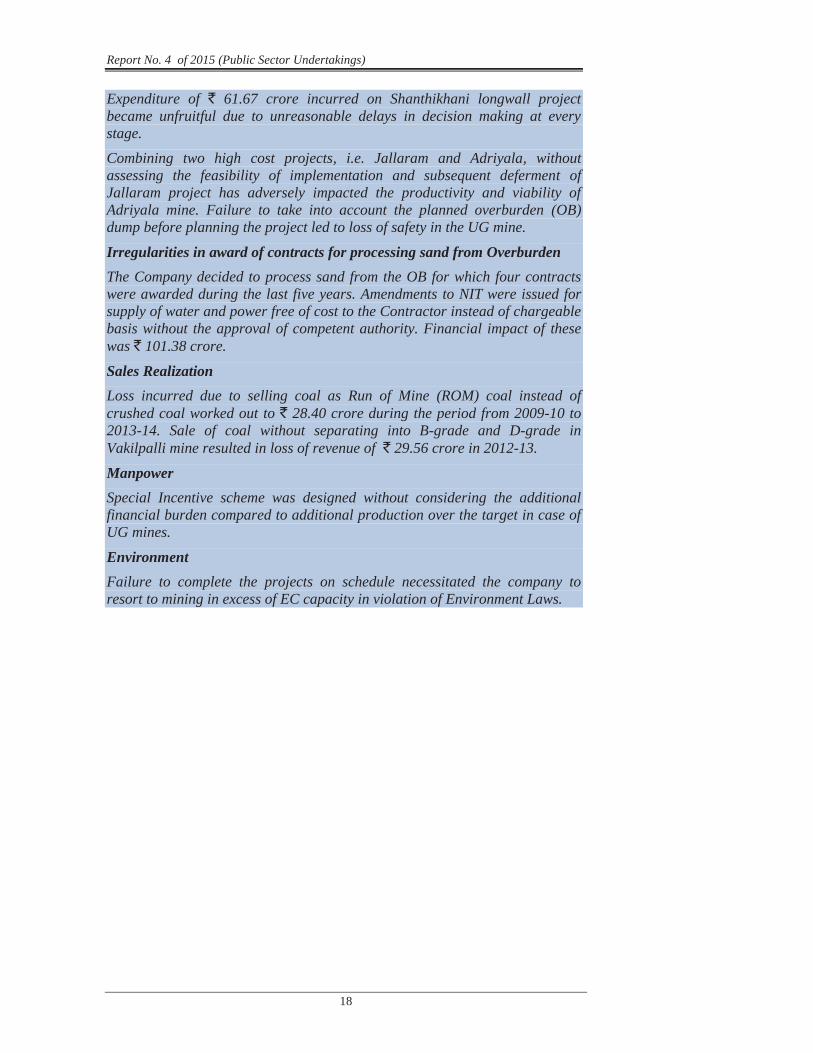
Production and Profitability The Company fixes mine-wise production targets for the ensuing year in advance. The Production performance and profitability was analyzed in audit. The production performance of UG mines and OC mines during the period from 2009-10 to 2013-14 are given in Table 2.2.
Table 2.2: Production Performance of UG mines and OC mines (Qty in MTs)
Year
Company Total
UG
OC
% of UG production to total production
Target Actual % of Target
Target Actual % of Target
2009-10 50.42 12.80 11.97 93.51 31.70 38.46 121.31 23.74 2010-11 51.33 12.25 11.63 94.92 33.75 39.71 117.65 22.65 2011-12 52.21 12.50 10.64 85.11 38.50 41.57 107.98 20.38 2012-13 53.19 13.00 11.60 89.21 40.10 41.59 103.72 21.80 2013-14 50.47 12.00 10.55 87.90 38.30 39.92 104.23 20.90
Source: Monthly Performance Reports (MPRs)
From the above, it can be observed that there was a fall in production in 2013-14 in both the UG as well as OC mines. The production from UG mines was continuously falling since 2009-10, except for an increase in 2012-13, while the production from OC mines increased till 2012-13 before registering a fall in the next year.
Audit observed that the production from OC mines was in excess of the sanctioned capacity in existing mines as discussed in paragraph 2.1.6.23. Further, production from UG mines was decreasing due to delay in execution of new UG mines and due to failure in processing the envisaged

Report No. 4 of 2015 (Public Sector Undertakings)
22
quantity of sand from overburden (OB)15 as discussed in paragraphs 2.1.6.8 to 2.1.6.12 and 2.1.6.13 to 2.1.6.19 respectively.
Management stated that the fall in production from OC mines in 2013-14 was due to delay in obtaining clearances for forest land diversion, land acquisition and rehabilitation & resettlement issues, while the reduction in UG mines output was due to exploration into increasingly deeper seams of the mines, reducing the efficiency of machines and also due to non-availability of sand for Stowing16.
However, all these issues are common to any mining activity and not unanticipated. The Company could have addressed these issues effectively by proper planning, coordination and managing activities more efficiently as discussed in the subsequent paragraphs.
2.1.6.1 Non-finalization of the Memorandums of Understanding (MoUs)
GoAP directed the Company to prepare a five year corporate plan and get it approved by the concerned administrative department. Thereafter an MoU was to be entered every year with the administrative department in consultation with Public Enterprises department, which inter-alia, was to stipulate the performance targets at the beginning of the year to help evaluate the managerial performance through objective criteria. It was noticed in audit that Government had not finalized the MoUs for the years 2009-14 for reasons not on record. Due to non-finalization of the MoUs for so many years, Company lost the advantage of Government’s evaluation of managerial performance.
Management stated that the Company had submitted MoU proposals to GoAP for the years 2012-13 and 2013-14.
No reply has been received from GoAP even after repeated reminders by Audit.
2.1.6.2 Losses due to increased cost of production
Working results of UG Mines during the last five years are shown in Table 2.3. Cost analysis has been shown in Table 2.4.
Table 2.3: Working results of UG Mines (` in crore)
Particulars 2009-10 2010-11 2011-12 2012-13 2013-14 Sales Realisation 1945.08 2183.05 2343.04 2617.41 2498.71 Cost of Production 2578.52 2877.71 3477.43 3827.78 3991.26 Salaries & Wages (per cent)
1900.76 (73.72)
2060.35 (71.60)
2503.28 (71.99)
2920.38 (76.29)
3026.95 (75.84)
15Overburden is the soil above the coal bands which has to be removed and dumped in the
earmarked place for extraction of coal. 16To avoid damage to surface areas, the void formed due to extraction of coal is immediately
filled with stowing material (generally sand which is best suited for hydraulic stowing).

Chapter II-Performance Audit relating to Government Companies
23
Power 94.56 115.58 117.38 196.07 170.13 Explosives 28.65 30.01 29.90 36.04 32.56 Stores 249.94 246.88 243.89 272.72 259.31 Other Expenses 171.49 273.48 199.73 226.87 290.76 Sand Transport 26.36 26.70 46.26 45.21 68.28 Interest 1.66 1.22 0 5.17 12.01 Depreciation 105.07 123.48 114.00 125.32 131.26
Source: Performance Analysis reports on cost of production and profitability
Table 2.4: Cost Analysis
(` per tonne)
Particulars 2009-10 2010-11 2011-12 2012-13 2013-14 Per cent increase over the period
Average Cost per Tonne
2169.48 2537.94 3316.00 3355.00 3840.00 77.00
Average Sales Realization per Tonne
1636.53 1925.29 2234.00 2294.00 2404.00 46.90
Average Loss per Tonne
532.95 612.65 1082.00 1061.00 1436.00 169.44
Source: Performance Analysis reports on cost of production and profitability
Despite increase in average sales realization per tonne by 46.90 per cent over a period of five years, UG mines had been incurring increasing losses every year due to increases in cost of production. Cost of production per tonne increased by 77 per cent over the period, while the average loss per tonne increased by 169.44 per cent during the same period. Audit observed that the reasons for non-achievement of production targets and increasing cost of production were low machine utilization as well as delay in implementation of new projects which have been discussed in paragraphs 2.1.6.4 and 2.1.6.8 to 2.1.6.12.
Management stated that main factors for increase in cost of production were increase in wages, poor machine utilization, low productivity due to short supply of sand in the mines where sand stowing is practiced.
However, audit observed that while periodical price revisions took into account the increases in costs due to wages and other factors, the Company could not effectively address the issues of poor machine utilization and non-availability of sand as discussed in subsequent paragraphs 2.1.6.4 and 2.1.6.13 to 2.1.6.19
2.1.6.3 Avoidable expenditure due to surrender of coal bearing land and reclaiming the same
The Company acquires land required for coal mining from State Government, Forest Department and Private Parties by making payments of value/ compensation. As per the rules of forest department, for diversion of forest

Report No. 4 of 2015 (Public Sector Undertakings)
24
land for coal mining, the Company has to surrender non-forest land and also pay the charges for Compensatory Afforestation (CA).
In 1988, Company had handed over its acquired land measuring 412.40 Hectare (Ha) for CA in lieu of diverted reserve forest land at Manuguru for an OC mine i.e. OC-II. The land was partly covered by underground mines (GDK 9, Vakilpalli Block, GDK 10 and GDK 10A).
In February 2005, the Company reclaimed that land for underground mining (165.40 Ha) and for surface use17 (247.00 Ha) for which it paid Net Present Value (NPV)18 amounting to ` 23.07 crore. It also surrendered 247 Ha of land in Srikakulam and Bhadrachalam Forest Division towards land for CA and also paid ` 1.46 crore towards CA charges.
In August 2009, out of reclaimed 165.40 Ha earmarked for underground mining, Company proposed Ramagundam OC-II Project requiring 147.42 Ha of land for which it had already paid NPV of ` 4.61 crore. In lieu of diversion of 147.42 Ha of land for OC mining Company paid CA charges of ` 4.57 crore in addition to the NPV.
Audit observed that the Company incurred an avoidable expenditure of ` 32.25 crore (` 23.07 crore + ` 4.57 crore + ` 4.61 crore) due to first handing over of coal bearing land to Forest Department for CA and subsequently reclaiming the same land for mining purpose.
Government replied (December 2014) that coal bearing non-forest land was handed over for CA as at that time only conventional underground mining was going on and the Company had to hand over the said land to get the equivalent land for Manuguru OC Project. The reply is not tenable as the Company could have acquired waste land for surrendering towards CA, instead of handing over coal bearing land which required to be reclaimed.
Mining methods in UG Mines
There are three categories of mining methods19: manual/ Hand Section (HS) mining, semi-mechanised mining and fully mechanised mining.
HS mining (Bord and Pillar method) was earlier the predominant method of coal extraction from UG mines, under which coal is fragmented by drilling and blasting and is manually loaded into tubs and hauled to surface. With a view to minimise human exposure to hazardous working conditions, improve safety conditions and increase production, the Company introduced mechanisation from 1990 onwards.
17Surface use means blanketing the land with overburden material etc., to prevent water
seepage in the underground mine beneath that land. 18NPV is payable, 100 per cent in case of mining activity (opencast mining/ surface use) that
causes deforestation and 50 per cent in case of underground mining, which doesn’t affect the surface environment.
19 Source: Presentations given by Company

Chapter II-Performance Audit relating to Government Companies
25
SDL LHD
Semi-mechanised method: Under Semi-mechanised methods like SDL20s, LHD21s and Blasting Gallery (BG), the blasted coal is loaded into tubs by machines i.e. by SDLs, LHDs and remote-controlled LHDs respectively.
Fully mechanised mining methods like Continuous Miner (CM) and Longwall (LW) eliminate the need for blasting. Under these methods, coal is cut by the machines and loaded onto coal conveyors either through shuttle cars or belt conveyors. Longwall mining is used for extracting coal seams beyond 300 metres depth which are devoid of faults. Its initial capital requirement is high and is suitable for bulk production.
Continuous Miner
20Side Discharge (Dump) Loader; 21 Load Haul Dumper;

Report No. 4 of 2015 (Public Sector Undertakings)
26
Longwall Longwall in operation
As on 31 March 2014, in different sections of the 32 operating mines, the Company had deployed different methods as follows: HS (18 mines), SDLs (22 mines), LHDs (9 mines), BG (5 mines), CM (2 mines), Shortwall (1 mine) and LW (2 mines). Further, 2 projects22 with SDL and 4 projects23 with LW technology were under implementation.
Audit observations relating to manual mining, semi-mechanised mining and the mechanised mining methods are discussed in the succeeding paragraphs.
2.1.6.4 Under-utilization of Machinery
An analysis of the utilization of underground machinery available/ deployed during the period from 2009-10 to 2013-14 revealed that the machines were utilized for 24.83 lakh work hours against the available24 69.27 lakh work hours as detailed in Table 2.5:
Table 2.5: Machine Utilization Hours vis-à-vis available hours during the last five years
(Hours in ‘000s)
22 Kondapuram, Kasipet-2 23 KTK-Longwall, Adriyala LW, ShanthiKhani LW and Jallaram LW 24 Available work hours = Standard Schedule Hours – Maintenance hours
Type of Machinery
2009-10 2010-11 2011-12 2012-13 2013-14
Perc
enta
ge
utili
zatio
n
Ava
ilabl
e
Use
d
Ava
ilabl
e
Use
d
Ava
ilabl
e
Use
d
Ava
ilabl
e
Use
d
Ava
ilabl
e
Use
d
LW 10.38 4.98 10.03 3.49 5.74 1.60 5.56 1.58 5.93 0.73 32.93
CM 10.26 2.31 10.78 3.89 10.23 2.39 7.69 2.19 9.64 3.99 30.41
RH 39.57 5.69 40.81 9.99 52.00 10.95 58.62 9.94 61.20 5.12 16.53
BG 114.85 45.60 139.61 50.68 149.56 54.74 155.92 57.00 113.76 39.57 36.75
LHDs 262.26 100.59 248.20 88.04 238.24 81.92 225.18 83.81 210.91 76.15 36.34
SDLs 709.04 273.12 928.50 332.16 976.37 321.96 1040.59 397.52 1075.69 411.55 36.71
Roof supports
shearer
Shearer

Chapter II-Performance Audit relating to Government Companies
27
Source: Machine Utilization Statements
The Company set machine utilization norms for different machines which ranged from 46 per cent for RH machines to 100 per cent for LW machines up to 2010-11. From 2011-12 onwards, the Company revised these norms and revised norms for different machines ranged between 56 per cent and 89 per cent. As against these norms, overall percentage of machine utilization during the five year period was only 35.85 per cent. The reasons attributed by the Company for low utilization of machines were shifting of machinery, shift change, preparation for roof supports etc.
While confirming the above figures, Management contested that there was any abnormal variation and stated that the machine performance was ‘stabilised at practicable levels’.
Management’s reply is self-contradictory as the Company could not adhere to the norms fixed by itself in respect of any of the machines in any of years covered in audit.
2.1.6.5 Non-achievement of targets fixed for SDLs An analysis of Management Control Statements revealed that out of total production of 56.38 MT achieved by the Company from UG mines during the period 2009-14, 24.72 MT was produced by SDLs. It was further observed that there was overall shortfall in targeted production from UG mines and 54.41 per cent of that shortfall was attributable to under-performance of SDLs as detailed in Table 2.6.
Table 2.6: Under performance of SDLs (Qty in MTs)
Machine 2009-10 2010-11 2011-12 2012-13 2013-14 Total
SDLs Target 4.44 5.85 5.95 6.36 5.45 28.05
Actual 4.41 5.06 4.81 5.28 5.16 24.72
Shortfall 0.02 0.79 1.14 1.08 0.29 3.33
Percentage Shortfall
0.52 13.50 19.16 16.98 5.32 11.87
Overall for all machines
Target 12.75 12.25 12.50 13.00 12.00 62.50
Actual 11.97 11.63 10.64 11.60 10.55 56.38
Shortfall 0.78 0.62 1.86 1.40 1.45 6.12
Percentage Shortfall
6.12 5.06 14.88 10.77 12.08 9.79
Total 1146.35 432.29 1377.91 488.25 1432.14 473.57 1493.56 552.05 1477.11 537.10 35.85
Percentage utilization of all machinery
37.71 35.43 33.07 36.96 36.36
Total Available hours (in lakhs) 69.27
Total hours utilized (in lakhs) 24.83

Report No. 4 of 2015 (Public Sector Undertakings)
28
Machine 2009-10 2010-11 2011-12 2012-13 2013-14 Total
Share of SDL shortfall in total shortfall (per cent)
2.95 127.42 61.29 77.14 20.00 54.41
Source: MPRs
As against the production norm of 54000 tonnes per annum fixed per SDL, production achieved per SDL reduced from 35902 tonnes in 2009-10 to 33416 tonnes in 2011-12. Keeping in view the shortfall in performance of SDLs in these years, Company had reduced production norm for SDL from 54000 tonnes per SDL per annum to 45000 tonnes per SDL in 2012-13. Even after such relaxation the production achieved per SDL was only 33497 tonnes in 2013-14.
Management stated that SDL production varied from 32,600 tonnes per annum to 36,000 tonnes/ per annum due to shortage of working places, seam thickness, floor conditions etc. Management further stated that targets were stretched to motivate the mines to achieve higher performance.
However, the reply of the management is not correct as the targets are fixed for each mine after considering the mine-specific issues. Targets thus fixed are linked to annual dispatch capacity, coal linkage plan and are also committed to GoI. Fixing stretched targets undermines the validity of target fixation process.
2.1.6.6 Use of surveyed-off25 SDLs
For replacement of old machinery, the Company devised a survey-off policy, according to which SDLs were to be assessed for survey-off after completion of 4 years or 12,000 hours or 1,20,000 tonnes of production whichever was earlier. Audit observed that the Company was using a large number of SDLs past their useful lives which were yet to be surveyed off. The number of such SDLs in use increased from 21 out of total 123 in 2009-10 (17 per cent) to 69 out of total 154 in 2013-14 (45 per cent). The production targets were fixed by taking into consideration all SDLs including the SDLs which were to have been surveyed off, which led to frequent break-downs and heavy repair costs as shown in Table 2.7, resulting in loss of production due to under-utilization of machine hours.
Table 2.7: Repair cost during the last three years
(` in crore) Particulars 2011-12 2012-13 2013-14
Repairs cost 53.11 69.31 59.45
Percentage Growth over previous year 0 30.50 -14.22
Source: Balance Sheet
25 To remove a machine from rolls after inspection, following a defined procedure.

Chapter II-Performance Audit relating to Government Companies
29
Audit could collect data in respect of 78 out of 85 machines identified for surveying off, and found that in respect of 54 machines, the cost of repairs undertaken during the three years 2011-14 exceeded the original cost of the machines. The total cost of spares in respect of these 78 machines amounted to ` 21.91 crore, as compared to the total cost of ` 16.83 crore for these machines.
Management stated that increase of 12 per cent in overall repair costs over three years 2011-14 from ` 53.11 crore to `̀ 59.45 crore was in line with inflation and was within ‘acceptable range’ and that the survey-off equipment were used after ensuring their ‘fitness and safety features’ to meet production targets till new machines were acquired. However, Management agreed to re-examine the norms for survey-off of UG machines.
Reply is again self-contradictory as the machines were to be surveyed off because of their unsuitability for the purpose.
2.1.6.7 Discontinuation of Kondapuram Mine The Kondapuram project was approved (December 2008) with a capital outlay of ` 70.68 crore. The production was scheduled to start in 2009-10 and reach the rated capacity26 of 0.51 MT by 2012-13. The total forest land required was 477.03 Ha which was envisaged to be acquired within a period of two years. Till the forest land acquisition was completed and shaft was constructed, it was proposed to approach the coal seams through punch entries27 from the adjacent OC mine MNG OC-II project after which the punch entry was to be closed, as 2.257 MT of coal of that mine will remain blocked due to punch entry. The Company started production from Kondapuram project in May 2009 which was stopped in December 2011 as the punch entry had reached the forest land boundary and the Company had not acquired the forest land. From December 2011 to March 2014, no production activity was conducted in Kondapuram project and because of the punch entry, coal reserves of 2.257 MT could not be extracted from MNG OC-II project. Owing to that, the Company finally discontinued the Kondapuram project from April 2014. It was further noticed that the Company continued deployment of manpower in the project till March 2014, despite stoppage of production from December 2011 which resulted in unfruitful expenditure of ` 10.22 crore on wages and others. Phased withdrawal of manpower was started only from April 2014.
Management stated that manpower required for statutory inspection, maintenance of ventilation, safety, pumping were continued to be deployed and that the expenditure incurred was not unfruitful as the mine is planned for reopening during 2015-16.
The withdrawal and subsequent re-deployment of labour to nearby coal mines by the Company in April 2014 indicates that reopening of the mine in near future was doubtful. The Company could have undertaken the redeployment in
26Planned production per annum. 27Punch entry is an entry into UG mine from the boundary wall of an existing OC mine to
reach the UG coal deposits.
Report No. 4 of 2015 (Public Sector Undertakings)
30
2011 itself instead of keeping the manpower idle from November 2011 till March 2014, though there was shortage of manpower in several other areas (4, 6 and 8 out of total 10 areas during 2011-12, 2012-13 and 2013-14 respectively). Apart from deficient planning, this also indicated inefficient labour deployment.
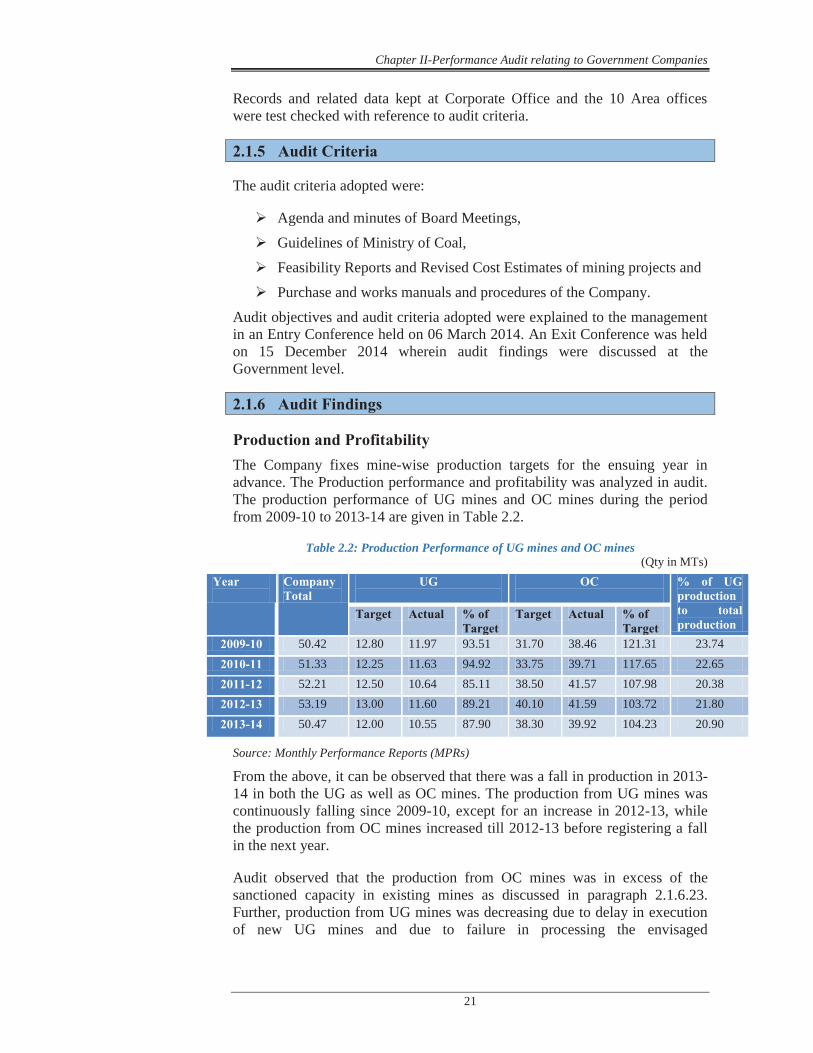
Planning and execution of projects for introduction of Longwall method Realizing the urgent need for underground bulk production, the Company had planned to introduce the state of the art Longwall technologies for bulk production from UG mines in the following four new projects with a total estimated capital outlay of ` 1,608.68 crore and production capacity of 9.01 MTs as detailed in Table 2.8:
Table: 2.8 – Longwall projects under implementation
Sl No.
Name Date of Approval
Cost (`̀ Crore)
Capacity (MT)
Method of working
Scheduled completion
Expenditure incurred (`̀ in crore)
Present status
1 KTK Longwall
15/12/2008 453.63 2.75 TPO28 2012-13 125.16 Contract with TPO terminated.
2 Adriyala LW
29/09/2006 438.24 2.81 Risk - Gain
sharing
2012-13 1206.66 Planned to be commissioned in 2014-15.
3 ShanthiKhani 09/10/2006 249.03 1.17 NA 2011-12 61.67 RFR29under preparation. 4 Jallaram 14/09/2007 467.78 2.29 NA 2012-13 12.31
Total 1608.68 9.01 1405.80 Source: Board Minutes
None of the four longwall projects which were planned to achieve total additional production of 9.01 MT by 2012-13 could commence production till June 2014, for which expenditure of ` 1,405.80 crore was incurred till March 2014. There was deficient planning leading to deviations from approved project plans, mid-term deviations, loss of extractable reserves affecting project viability and delays in implementation and consequent cost escalations, as discussed in the following paragraphs:
2.1.6.8 KTK longwall project - Induction of TPO in violation of GoI approval
As per coal linkage plan, the Company was to supply about 2.5 MT per annum to Andhra Pradesh Power Generation Corporation Limited (APGENCO) for their Kakatiya Thermal Power Plant (KTPP) at Bhupalpalli. In order to minimize the cost of transportation to APGENCO, the Company formulated Kakatiya (KTK) longwall project in Bhupalpalli Area exclusively for meeting the requirement of KTPP which was approved by the GoI in December 2008
28 Technology Provider cum Operator. 29 Revised Feasibility Report.

Chapter II-Performance Audit relating to Government Companies
31
at a capital outlay of ` 453.63 crore with scheduled date of completion in December 2011.
As per the approved feasibility report (FR), the project was to be executed on Risk-gain sharing basis30 and a tie up was to be entered into with global suppliers for operation and maintenance (O&M) of longwall equipment over a period of five to seven years, with penalty and bonus clauses for guaranteed performance.
Audit noticed that contrary to the Board’s approval for preparation of Notice Inviting Tender (NIT) for global tenders on risk and gain sharing basis, the Company engaged a private consultancy firm for preparation of NIT for identification of a suitable technology provider-cum-operator (TPO) who was to provide longwall mining machinery, design longwall panels and operate the mine on cost per tonne basis (Unified Mining Fee (UMF)). As a result, the cost of coal extraction escalated from the earlier estimated ` 554.22 per tonne to ` 1234.42 per tonne (increase of 123.34 per cent). Approval of competent authority for this deviation was not obtained.
Management stated that TPO was inducted as the Company was not having any experience to work longwall in such typical geo-mining conditions.
This contention is not tenable as induction of TPO was in deviation to the FR wherein it was already mentioned that the project was to be executed on risk-gain sharing basis to mitigate the risks associated with lack of experience.
A Global enquiry was floated in May 2009 inviting offers for selection of TPO. On the basis of a global enquiry, a TPO was selected out of two bidders and an agreement was entered with the TPO in April 2012. Coal production was to have commenced within 16 months from date of agreement i.e. from April 2013. However, as the TPO failed to obtain the necessary approvals and clearances, the Company terminated the agreement in March 2014. The Company had spent ` 125.16 crore till March 2014 towards land, buildings, plant and machinery (P&M) and other costs. While it encashed the bank guarantees of ` 58 crore towards recovery of mobilization advance, the balance amount recoverable from TPO towards penalty of ` 50 crore and liquidated damages up to 10 per cent of annual contract price for initial roadway development could not be recovered. The assets acquired also were lying idle.
Management stated that coal was being extracted by the Company through SDLs and the assets like buildings, P&M, land will be utilized departmentally. However, since production by SDLs is insignificant as compared to the bulk production envisaged from longwall, the objective remained unachieved.
30A method in which the Contractor is eligible for incentive for production above the
guaranteed level of production and will be penalized for production below the guaranteed production, thus ensuring a financially viable process and guaranteed production to the Company.

Report No. 4 of 2015 (Public Sector Undertakings)
32
2.1.6.9 Shanthikhani longwall Project- delay in implementation due to delay in placement of orders
Shantikhani longwall project is located on the dip side of the existing Shanthikhani mine in Mandamarri area. The geological reserves of the project were 48.872 MT and the extractable reserves were assessed as 17.77 MT. The rated capacity of the mine was 1.17 MT per annum. Audit noticed however that extensive delays have occurred in placing NITs which led to cost escalations and deferment of mining project. The details are as follows:
One set of continuous miner, three road headers and one set of longwall equipment were proposed in the FR (February 2006) to be introduced within 22 months, 14 months and 46 months respectively. All equipment were to be commissioned and operated at full capacity by fifth year i.e. by 2011. The GoI approved the project in October 2006. Audit found unreasonable delays in decision making at every stage of the project. Though the project was approved in October 2006, NIT for procurement of longwall was floated in March 2008. No reasons have been found on record to justify the delays in placing the NIT. The NIT was dropped in February 2010 as the project was not getting the required Internal Rate of Return (IRR) with the cost quoted by the bidders. Company decided to prepare revised feasibility report (RFR) only in November 2010. However, it was found in Audit that the RFR had not yet been prepared. The expenditure of ` 61.67 crore incurred on land, prospecting, boring, plant and machinery and development up to June 2014 became unfruitful.
Management stated that to get the required IRR, additional property was being annexed to the project and the project was expected to start production in Thirteenth Plan period i.e. 2017-22. Therefore the infrastructure will be gainfully utilized in future.
The reply confirms that lack of any serious planning and execution by the Company and the premature nature of investment made by the Company.
Shantikhani was selected for longwall mining because it could yield bulk quantities. However delays in finalizing tenders for mining contracts and RFR have derailed the project which is yet to start even after eight years of approval.
Adriyala and Jallaram Longwall projects
2.1.6.10 Ineffective project planning leading to failure of Adriyala longwall project
Adriyala and Jallaram projects are contiguous mines. Adriyala Project was proposed as a model new generation UG mine with high technology longwall with bulk production of about 2 MT per annum. Government of India had approved the project with capital outlay of ` 438.24 crore in September 2006. The project was scheduled to be completed by 2012-13.

Chapter II-Performance Audit relating to Government Companies
33
Government of India approved Jallaram project with capital outlay of ` 512.87 crore in September 2007. The project was scheduled to be completed by 2012-13. Though the Company decided (September 2010) to prepare RFR for the project in view of geological disturbances, it was not yet ready even after a lapse of four years (June 2014).
As per the FRs of the above two projects, four longwalls, i.e. two longwall machines in each project were envisaged. One longwall machine was to extract coal seam with specific thickness of 2.5 metre and the second machine was to extract coal seam with a thickness of 3.5 metre. However, it was decided later (December 2009) to procure only two high capacity longwalls i.e. one each for Adriyala and Jallaram with different specifications31 and swap the equipment in the two projects as per the need. The two mines were scheduled to be commissioned by September 2012.
However, audit noted that the Jallaram project was not implemented, nor were any RFR prepared to initiate purchase of the planned second longwall machine to extract seams of 2.5 metre thickness. The Company procured one longwall equipment to extract coal from seams of 3.5 metre thickness for the Adriyala project in October 2012 at a cost of ` 571.41 crore. Audit noted that the minimum thickness of three out of the four seams planned for extraction in Adriyala Project were having thickness in the range of 1.14 metre to 2.19 metre as per FR which was prepared after geo-mining studies. Despite being aware of the seam thickness and the requirement of a second longwall machine, the Company has not procured the second longwall equipment. Thus combining two high cost projects without assessing the feasibility of implementation and subsequent deferment of Jallaram project has adversely impacted the operation of Adriyala project since it would not be able to mine the 2.5 metre thickness seam with a 3.5 metre longwall machine, thereby affecting the productivity and viability of Adriyala mine.
Management stated that it was now planning to extract all seams with only one high capacity longwall machine and that the viability of Adriyala project was not only independent of the Jallaram project but was improved without it.
The reply indicates that the original plan to swap the equipment was flawed. Further, with one high-capacity machine, the Company would not be able to mine seams upto 2.5 metre thickness. Given that three out of the four seams in Adriyala Project were having thickness outside the range of the longwall equipment procured by the Company, from which 57.19 per cent (24.81 MT) of total production (43.38 MT) was estimated to be achieved from the Adriyala mine, it is not clear as to how the project viability had improved as claimed by Management.
Audit noticed that the Company had submitted to GoI (September 2012), for approval, a revised cost estimate as the estimated capital requirement of ` 1,237.68 crore exceeded the sanctioned cost. The same was yet to be approved by GoI (June 2014). The project was yet to be commissioned (June
31 3.5 metre extracting machine for Adriyala and 2.5 metre extracting machine for Jallaram.

Report No. 4 of 2015 (Public Sector Undertakings)
34
2014). The expenditure incurred by the Company was ` 1,387.51 crore so far (May 2014).
2.1.6.11 Ignoring the OB dump over longwall panels led to loss of extractable reserves and safety
In longwall technology, coal seams are divided into number of mining panels. The coal barrier left unextracted between adjacent longwall panels to support roof is called barrier pillar. The width of the barrier pillar is based on estimated vertical stress on the pillar and the required safety factor. In Adriyala project, the width of barrier pillar was estimated as 45 metre. Overall, 21 Barrier pillars for 26 panels were planned in the project.
Adriyala Project Mine layout
Source: Project Planning dept. SCCL
However, it was later realized by the Company that a 120 metre high overburden (OB) dump was planned for Ramagundam OC-II project directly above the proposed longwall panels. A study was conducted (October 2013) by Central Institute of Mining and Fuel Research (CIMFR) to assess the impact of existence of OB dump and its additional stress on barrier pillars. The study confirmed the reduction in safety factor due to the presence of OB dump and suggested to increase the size of the pillars from 45 metre originally planned to 60 metre. However, audit observed that the pillar size between panel-1 and 2 in Seam-1 was already made 50 metre, thereby affecting the safety of the mine. For remaining 20 barrier pillars, as the Company was required to increase the size by 15 metre, the extractable coal quantity was reduced affecting the financial viability of the mine32.
32 The quantity of Coal blocked in 3 pillars of Seam-1 alone worked out to 6.63 lakh tonnes.
BarrierPillar
Longwall panel

Chapter II-Performance Audit relating to Government Companies
35
Audit noted that failure to take into account the planned OB dump before planning the project led to loss of safety in the UG mine. The increase in pillar size implied that lesser quantity of coal could be mined than was justified by the expensive longwall machines, thus affecting the financial viability of the project, besides loss of extractable reserves.
Management stated that while designing the barrier pillars between two adjacent panels, the OB dump was considered and thus there had been an increase in the size of pillars from 45 metre to 60 metre and the loss of reserves or issue of safety did not affect the project.
However, the pillar width between panel-1 and 2 in seam-1 was only 50 metres affecting the safety of the mine. Further, the production estimates were based on lower pillar sizes which had not yet been revised for the increased pillar size.
2.1.6.12 Violation of MoEF approval
Further, audit noted that though the Ministry of Environment and Forests (MoEF) sanctioned the project with a rated capacity of 2.144 MT per annum, the revised proposal was sanctioned with a capacity of 2.81 MT per annum with a peak production of 3.035 MT per annum. No Environmental Clearance Certificate (EC) was obtained for the revised proposals.
Management stated that the proposal for EC enhancement for 3.14 MT per annum was under consideration by MoEF. However, MoEF had not yet sanctioned the EC for enhanced capacity.
Irregularities in award of contracts for processing sand from Overburden
Stowing in underground coal mines is a mandatory activity under the Coal Mines Regulations, 1957. The Company had obtained sand mining leases from State Government to mine the sand for stowing. During the last five years ` 212.81 crore were spent on sand transportation for UG mines apart from incidental costs like royalty on sand, power etc.
In view of the problems in sand mining (transportation, availability only during non-rainy season, reduction of sand in riverbeds, ban on sand mining by Courts etc.,), the Company decided to process sand from the overburden (OB). Accordingly, four contracts were awarded to private firms selected on open tender basis during the last five years.
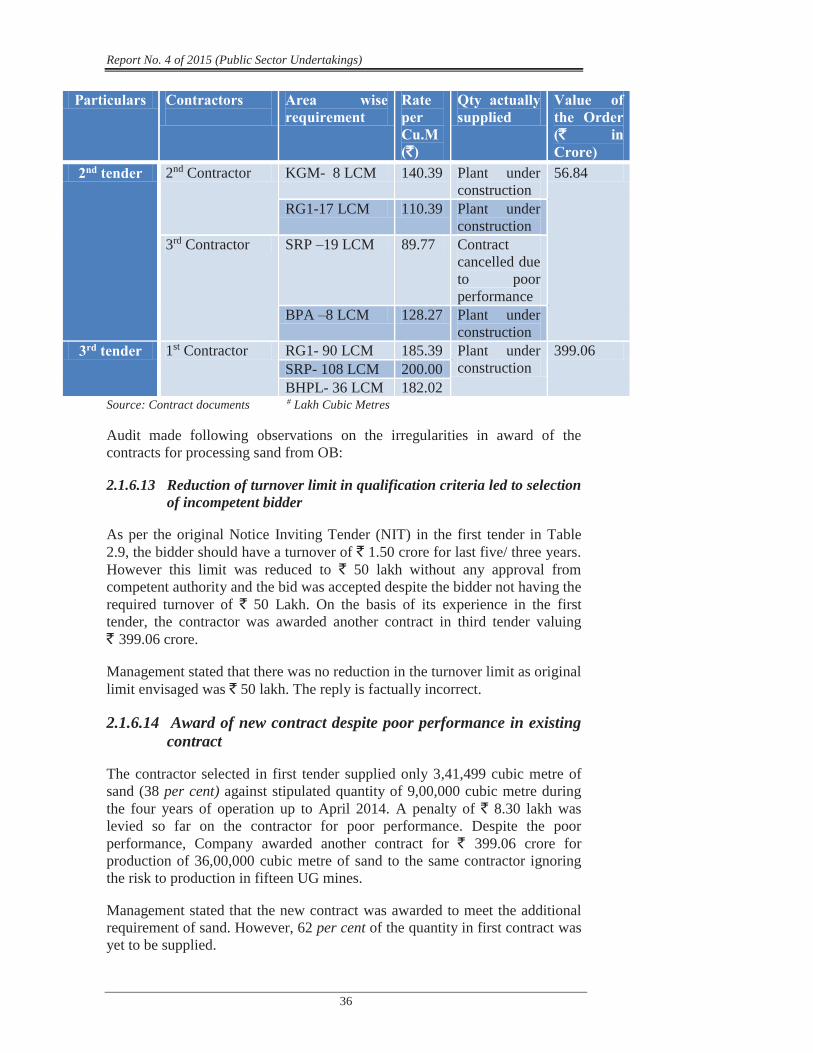
The details of the contracts awarded were as follows: Table 2.9 – OB processing contracts
Particulars Contractors
Area wise requirement
Rate per Cu.M (`̀)
Qty actually supplied
Value of the Order (`̀ in Crore)
1st tender 1st Contractor BHPL- 17 LCM#
168.75 3.41 LCM up to April 2014
27.86
Report No. 4 of 2015 (Public Sector Undertakings)
36
Particulars Contractors
Area wise requirement
Rate per Cu.M (`̀)
Qty actually supplied
Value of the Order (`̀ in Crore)
2nd tender 2nd Contractor KGM- 8 LCM 140.39 Plant under construction
56.84
RG1-17 LCM 110.39 Plant under construction
3rd Contractor SRP –19 LCM 89.77 Contract cancelled due to poor performance
BPA –8 LCM 128.27 Plant under construction
3rd tender 1st Contractor RG1- 90 LCM 185.39 Plant under construction
399.06 SRP- 108 LCM 200.00 BHPL- 36 LCM 182.02
Source: Contract documents # Lakh Cubic Metres
Audit made following observations on the irregularities in award of the contracts for processing sand from OB:
2.1.6.13 Reduction of turnover limit in qualification criteria led to selection of incompetent bidder
As per the original Notice Inviting Tender (NIT) in the first tender in Table 2.9, the bidder should have a turnover of ` 1.50 crore for last five/ three years. However this limit was reduced to ` 50 lakh without any approval from competent authority and the bid was accepted despite the bidder not having the required turnover of ` 50 Lakh. On the basis of its experience in the first tender, the contractor was awarded another contract in third tender valuing ` 399.06 crore.
Management stated that there was no reduction in the turnover limit as original limit envisaged was ` 50 lakh. The reply is factually incorrect.
2.1.6.14 Award of new contract despite poor performance in existing contract
The contractor selected in first tender supplied only 3,41,499 cubic metre of sand (38 per cent) against stipulated quantity of 9,00,000 cubic metre during the four years of operation up to April 2014. A penalty of ` 8.30 lakh was levied so far on the contractor for poor performance. Despite the poor performance, Company awarded another contract for ` 399.06 crore for production of 36,00,000 cubic metre of sand to the same contractor ignoring the risk to production in fifteen UG mines.
Management stated that the new contract was awarded to meet the additional requirement of sand. However, 62 per cent of the quantity in first contract was yet to be supplied.

Chapter II-Performance Audit relating to Government Companies
37
2.1.6.15 Unauthorized amendment
As per the Original NIT, raw water and power were to be provided by the Company on chargeable basis. However, amendments were issued by Chief General Manager (CGM (Purchase)) to these clauses providing for supply of water and power free of cost without the approval of competent authority. The same clause was continued in 2nd and 3rd tenders as per the table above, without assessing the cost impact on the Company. Audit worked out the financial impact of the amendments in all four contracts to the tune of ` 101.38 crore. Board approval was not obtained for any of the changes made.
Management stated that the corrigendum was issued with the approval of head of purchase department i.e. CGM (Purchase) before the closure of the first tender enquiry. As such the supply of water and power free of cost was expected to be factored in the price quoted.
The reply is untenable as the financial powers of CGM (Purchase) are limited to ` 0.25 crore only.
2.1.6.16 Allotment of land in violation of delegation of powers (DoPs)
As per NIT of first tender, the Company would provide 4 Ha (i.e. 40,000 Sq. Metre) of land for setting up the plant. However, as per the Delegation of Powers, only the Board can allot Company’s land exceeding 1,000 sq. metre per allottee on lease/ license basis to contractors for the contract period. However, no approval of the Board was obtained for allotting the land. Thus, the allotment of land free of cost in the first tender was in violation of the DoPs.
Management stated that the allotting of land to the Contractor did not involve any transfer of land and hence Board approval was not required. Reply is factually incorrect as allotment of land even on lease/ license basis to contractors in excess of the limit required Board approval.
2.1.6.17 Misrepresentation of cost of contracts
As per the DoPs, contracts valuing more than ` 30 crore and up to ` 500 crore require Board approval. In respect of the first tender the value of proposal was arrived as ` 27.86 crore in which the cost of raw water and power provided free of cost by the Company were not included and contract was finalized without the Board approval, although the total cost exceeded ` 30 crore. Similarly, the value of the work under third tender was reduced to ` 399.06 crore from ` 530.73 crore by providing free power and water and excluding the service tax element from the cost estimates. Hence in both the cases cost of tenders was misrepresented and resultantly tenders came within the delegated powers.
Management stated that as per the purchase practice in vogue, the basic value of the proposal was only considered for deciding approving authority as per DoP. Further it was stated that the Company had started (January 2015)

Report No. 4 of 2015 (Public Sector Undertakings)
38
inclusion of value of consumables issued free of cost for the purpose of deciding the approving authority.
2.1.6.18 Non-valuation of by-products
While considering the proposal for processing of sand from OB, it was envisaged that by-products like clay etc. were likely to be obtained during the process of preparation of sand which would yield some revenue to the Company and help reduce the cost of sand preparation from OB. However, there was no mention in the agreement regarding the quantity, value adjustment of by-products that would be generated. In the absence of details audit could not estimate the loss to the Company on this account.
Management accepted and stated that use of by-products was in the agenda of the Company and would be taken up in future.
2.1.6.19 Incorrect claim for stowing cost from CCDAC
Coal Conservation and Development Advisory Committee (CCDAC) constituted under the provisions of the Coal Mines (Conservation and Development) Act, 1974 reimburses expenses incurred by the Coal Companies for stowing and environmental protection activities from the proceeds of Stowing Excise Duty (SED) collected by the Government.
The mine-wise normative stowing cost per cubic metre of Sand approved by CCDAC ranged from ` 225.25 to ` 477.93. According to the approved normative cost, the Company had claimed an amount of ` 530.69 crore for stowing 137.22 LCM of sand and received ` 228.11 crore during the period from April 2009 to September 2013.
Company had started using Processed OB (POB) for stowing purposes from 2011-12 onwards in Bhupalpalli area. Though the cost of sand processed from OB was not considered while arriving at the normative cost, the Company claimed the cost of POB also from CCDAC at the rates applicable to sand, resulting in incorrect claim of ` 10.75 crore during the three year period from 2011-12 to 2013-14.
Management replied that transportation cost, wage cost, power cost of pumping and lighting were not considered while claiming the cost of POB stowed and if the same were included the claim would be much higher.
However, the Company should have followed the procedure prescribed by CCDAC for claiming the reimbursement and should have claimed the correct amount.

Chapter II-Performance Audit relating to Government Companies
39
Sales Realization
2.1.6.20 Selling run-of-mine coal in deviation of approved FR resulted in loss of revenue of `̀ 28.40 crore
As per price notification of the Company, crushed coal is sold at higher rate than run-of-mine (ROM) coal. As per the approved FRs of KTK-2 and KTK-5 mines of Bhupalpalli Area, the coal produced was envisaged to be dispatched in crushed form to fetch additional revenue. However, in deviation to the FR the Company has been selling the coal from both the mines as ROM coal. The loss incurred due to selling coal as ROM coal instead of crushed coal works out to ` 28.40 crore during the period from 2009-10 to 2013-14.
Management stated the separation of ROM and crushed coal was not taken-up as the required demand was not there.
The reply indicates that projections made in the FR based on which the projects were taken up were not correct.
2.1.6.21 Deviation from approved FR in selling coal resulted in loss of revenue of ` 29.56 crore
Vakilpalli mine has two seams with two different grades of coal, B and D. As per FR, it was envisaged to dispatch B-grade coal and D-grade coal separately to realize optimum revenue. It is to be noted that B-grade coal is higher grade coal which fetches very high price33.
Audit observed that, contrary to the approved FR, the Company during the year 2012-13, dispatched the entire quantity of coal produced from Vakilpalli mine as single grade of C-grade coal. Selling coal without separating into B-grade and D-grade had resulted in loss of revenue of ` 29.56 crore.
Management stated that with the admittance of coal from Vakilpalli mine at common dispatch point (Coal Handling Plant- CHP), lower grade coal from other mines got upgraded from D-grade to C-grade.
The reply is not correct as the Audit scrutinized mine-wise quantities admitted to the CHP and found that the grade in CHP would have remained C-grade even without admittance of B-grade coal of Vakilpalli mine.
2.1.6.22 Manpower
Manpower is an important input for production of coal from UG mines and more than 60 per cent of the total manpower was deployed in UG mines. Total manpower deployed by the Company decreased from 70,586 in January 2009
33 Price of B-grade coal : ` 3319 per tonne.
Price of C-grade coal : ` 1840 per tonne. Price of D-grade coal : ` 1500 per tonne.

Report No. 4 of 2015 (Public Sector Undertakings)
40
to 61,778 in March 2014 due to retirements, control on fresh recruitment and mechanisation of operations in UG mines. The manpower deployed in UG mines reduced from 44,849 to 37,419. Audit analysis of wages and incentive costs revealed the following:
Avoidable expenditure of `̀ 7.98 crore on ineffective Special Incentive Schemes
In order to motivate the employees to achieve the targeted production for the year, a special incentive scheme was operated from 2010-11 to 2013-14, under which, in addition to existing wage incentives, special incentive was proposed for employees who attended duty on all working days in a month during the last four months (i.e. December to March) of the financial year when the Company achieved the monthly and annual targets.
Audit observed that individual/ mine-wise targets were not fixed during 2010-11 to 2012-13. The schemes did not take into account the peculiar/ different working conditions in OC and UG mines and was not linked to mine-wise production.
During the first three years, UG mines had not achieved the targets except in March 2011, but earned major portion of the incentives as the Company had achieved the overall target. Employees were paid incentive irrespective of their individual performance, subject only to attendance. The Company did not achieve the targets in 2012-13 despite operation of the above schemes.
The special incentive scheme was modified from the previous scheme and individual mine-wise targets were fixed in the new scheme from 2013-14. The Company did not achieve the overall annual target in 2013-14. The total additional production achieved by UG mines during the four months was only 0.2 MT with an incentive cost of ` 1.62 crore, i.e. special incentive cost of ` 80 per tonne. Audit observed that the scheme was designed without considering the additional financial burden compared to additional production over the target in case of UG mines.
Management stated that there was an improvement in average monthly production from UG mines. Further it was stated that the objective of monthly incentive scheme was to ensure achievement of annual production targets by reducing the production shortfall from UG mines. Audit noted that UG mines had not achieved the targeted additional production in 11 out of 16 months despite the additional cost incurred.
Environment
2.1.6.23 Mining in excess of EC capacity- Violation of MoEF guidelines
As per the provisions of the Environment (Protection) Act, 1986 mining companies have to obtain Environmental Clearance (EC) for all their mining projects from MoEF which stipulates conditions including the capacity of the

Chapter II-Performance Audit relating to Government Companies
41
project and activities/ protection measures to be taken by the mining Company while executing/ operating the project.
Audit noted that the Company was operating mines in excess of the sanctioned EC capacity in violation of the Guidelines of MoEF, GoI (Annexure-2.I). The Company had exceeded the EC capacity by 9.56 MT (0.46 MT from UG mines and 9.10 MT from OC mines) in 2012-13 and 8.18 MT (0.34 MT from UG mines and 7.84 MT from OC mines) in 2013-14. Further, it was observed that even the production targets were fixed above the EC capacity in 20 out of 48 mines in 2014-15.
MoEF directed in June 2013 that production needed to be restricted to the EC capacity till EC was obtained for enhanced capacity and in case of any violation, legal action as per the provisions of Environment (Protection) Act, 1986 would be taken against the project proponent34 and the case of EC clearance would be summarily rejected.
However, the Management continued mining activities in excess of EC capacity. MoEF then again directed the State Environment Dept. (December 2013) to initiate legal action for violation of Environment Protection (Amendment) Act, 2006 by the Company and to furnish Action Taken Report. Despite this, the Company had continued mining in excess of sanctioned capacity.
State Government requested GoI in January 2014 to exempt the Company from the provisions of Environment (Protection) Act and not to resort to legal action.
The main reason for mining in excess of EC capacity was the failure to complete the new projects as per schedule. Had the Company done so, it would have added an additional production of 26.85 MT coal by 2013-14. Failure to complete the projects on schedule necessitated the Company to resort to mining in excess of EC capacity in violation of Environment Laws.
Though Management stated that the pollution levels were within the EC prescribed limits and the Company was following up with MoEF for upward revision of EC capacities, revised ECs were not issued so far by MoEF (June 2014).
2.1.6.24 Safety
The Company has got Risk Management Plan prepared by a third party in 2008-09 and based on the risk assessment and guidelines given in the plan, safety management plans were prepared and monitored. The number of accidents recorded during the last 6 years is indicated in Table 2.10:
34 A person who desires to undertake any new project in any part of India or the expansion or
modernization of any existing industry or project and applies to MoEF for environmental clearance.

Report No. 4 of 2015 (Public Sector Undertakings)
42
Table: 2.10 – Accidents
Description 2008-09 2009-10 2010-11 2011-12 2012-13 2013-14
No. of Accidents 9 9 7 6 4 4 Fatalities 11 12 8 7 5 5 Serious injuries 342 369 244 290 324 267 Source: MIS
Conclusion
Lack of proper planning affected the productivity of the Company. Targeted production was not achieved during 2009-14 in UG mining. Under-utilization of machinery and delays in implementation of new projects led to increased cost of production. The Company could not commence production from any of the four new-generation longwall projects due to delays in procurement and improper planning, leading to mid-term changes rendering the projects unviable. Undue advantages were allowed in awarding contracts for processing of sand from overburden.
Recommendations
The Company should consider the following
obtain approval from competent authority as per DoPs in approving projects, amendment to contract clauses and allotment of land for setting up of plants to improve accountability;
should consider all the related issues at initial planning stage to avoid deviations and delays in project execution specifically in longwall projects;
fix production targets within the available EC limits to avoid violation of MoEF norms.

2.2 Activities of Andhra Pradesh State Agro Industries Development Corporation Limited
Executive Summary
Introduction Andhra Pradesh State Agro Industries Development Corporation (APS Agros) Limited was established on 5 March 1968 to help in growth and modernisation of agriculture, horticulture, sericulture and other allied sectors of the State. The Company is engaged primarily in Land Development Activity (LDA) and is the nodal agency for supply of farm machinery and agriculture inputs to beneficiary farmers. Other activities of the Company include trading of fertilizers and pesticides through Agro Rythu Seva Kendras (ARSK) and maintenance of Agro Service Centres (ASC) for distribution of agricultural implements and sale of tyres, tubes and batteries for government departments. It has two mango processing units at Nuzivedu and Tirupati for exporting mangoes to Japan.
Financial Position
The Company earned profit of ` 8.51 crore in 2011-12 and incurred loss of ` 2.91 crore in 2012-13 and loss further increased to ` 9.14 crore in 2013-14 due to decrease in allocation of business by the Agriculture and Horticulture departments.
Implementation of schemes:
A) Construction of display centres:
Government released (September 2011 & November 2012) ` 10.80 crore for construction of farm machinery display centres in Phase-I and Phase-II. Without utilising the sheds constructed under phase-I at a cost of ` 3.13 crore, Company further initiated action for construction of display centres under phase-II.
B) Machinery repair centres:
The government released (September 2011 to September 2013) ` 1.11 crore for imparting training to unemployed youth to open ‘machinery repair centres’. Company identified and trained only 119 candidates against 1,100 candidates proposed under scheme, by spending ` 12.73 lakh and only one trainee opened the repair centre.
C) Construction of Godowns:
Government released (November, 2012) an amount of ` 4.01 crore for construction of godowns, at Chintal, Hyderabad. The Company did not commence the works and kept the funds in fixed deposits. Government further released (September, 2013) an amount of ` three crore during 2013-14,but the Company dropped the proposal of construction of godown citing paucity of

Report No.4 of 2015 (Public Sector Undertakings)
44
time and surrendered ` one crore. Remaining amount of ` two crore was proposed to be utilised for procurement of machinery (` 1.87 crore) for display centres and machinery repair centre (` 0.13 crore). The Company failed to utilise these funds till date (July 2014).
D) Fruit processing plants for export of mangoes:
The Company constructed (2008-09) two fruit processing plants at Nuziveedu (Krishna district) and Tirupati (Chittoor district), at a cost of ` 26.40 crore, with an objective of exporting mangoes. But the plants were kept idle without utilisation/exporting mangoes, rendering the entire expenditure futile.
Agro Service Centres (ASCs)
Unauthorised reduction of service charges from four per cent to two per cent, by Commissioner and Director of Agriculture, resulted in loss of business. Lack of proper monitoring of Agro Rythu Seva Kendras (ARSKs) resulted in non-renewal of agreements with them resulting in loss of ` 82.92 lakh.
Ineffective Land Development Activity (LDA)
Company did not achieve the targeted hours of operation of land development machinery, as well as financial targets in any of the years during the period of review.
The Company revised the rate per hour for land machinery factoring oil cost only and ignoring changes in the other fixed and variable costs which resulted in loss in LDA activity of ` 1.39 crore during the five year review period.
Inefficient management of lands and other properties The Company, on orders of Government, retransferred (1994-96) two lands to other State Government departments and did not receive compensation of ` 20.39 lakh, even after 20 years of their transfer due to non pursuance with the departments.
Company took possession (2005) of lands at Hyderabad (23.28 acres) and Bellampally (543.15 acres) from its subsidiary Company i.e. Hyderabad Chemicals and Fertilisers (HCF). Even 10 years after taking possession of the lands, Company had not planned utilisation of the lands which were lying idle.
Internal control mechanism
Monthly review meetings with regional managers to analyse the working of various activities in the regions were not being conducted, which resulted in lack of proper internal control and supervision. Idling of surplus funds in current accounts resulted in loss of interest of ` 6.70 crore.

Chapter II-Performance Audit relating to Government Companies
45
2.2.1 Introduction
Andhra Pradesh State Agro Industries Development Corporation (APS Agros) Limited was established on 5 March 1968 to help in growth and modernisation of agriculture, horticulture, sericulture and other allied sectors of the State. The paid up capital of the Company is ` 21.50 crore, out of which Government of India contributed ` 2.69 crore and Government of Andhra Pradesh contributed ` 18.81 crore.
The Company is engaged primarily in Land Development Activity (LDA) and is the nodal agency for supply of farm machinery and agriculture inputs. Other activities of the Company include trading of fertilizers and pesticides through Agro Rythu Seva Kendras (ARSK), maintenance of 22 Agro Service Centres (ASC) for distribution of agricultural implements and sale of tyres, tubes and batteries for government departments. It has two mango processing units at Nuzivedu and Tirupati for exporting mangoes to Japan.
2.2.2 Organisational structure
The Company is headed by Vice Chairman & Managing Director and is assisted by five functional heads looking after: (i) Projects & Estates, (ii) ARSKs, (iii) Personnel and Administration, (iv) Land Development, (v) Farm Mechanisation, Finance and Accounts at the corporate office. It has 10 Regional Managers at 10 Regional Offices35 covering 23 districts at the field level.
2.2.3 Scope and Methodology
Performance Audit on the activities of the Company was conducted during the period 2009-14 from November 2013 to May 2014. Five Regional offices in three regions viz. Telangana (two), Andhra (two) and Rayalaseema (one) of the composite State of Andhra Pradesh were selected for detailed study. Entry conference was held on 26 February 2014. Audit findings were reported to the Company and Government during August 2014. Management’s replies were received (October 2014) and incorporated. An Exit conference was held on 31 October 2014 where audit findings were discussed at Government level along with VC & MD and functional heads of the Company.
2.2.4 Audit objectives
Audit was conducted with the objectives of ascertaining whether:
the Company successfully planned and implemented various government schemes;
35 Ananthapur, Chittoor, Eluru, Guntur, Hyderabad, Jagitial, Khammam, Nizamabad, SPSR
Nellore and Vizianagaram.

Report No. 4 of 2015 (Public Sector Undertakings)
46
land development activity was carried out economically, efficiently and effectively;
financial management, internal control and property management were effective.
2.2.5 Audit criteria
The following audit criteria were adopted:
Government Orders (GOs) relating to various schemes and operations of the Company.
Board minutes and Agenda of the Company. Guidelines of various Government schemes like Rashtriya Krishi Vikas Yojana (RKVY), Farm Mechanisation (FM), Horticulture etc.
Management Information Systems statements in respect of scheme implementation, target vis-à-vis achievement, internal controls etc.
Memorandum of Understanding (MoU), which is an Annual Plan containing yearly targets and projections submitted to the State Government.
2.2.6 Audit Findings
Financial Position and working results of the Company for the period 2009-14
The sources of income of the Company are (i) hiring charges for its bulldozers for its land development activities, (ii) service charges collected from the departments of Agriculture and Horticulture for implementation of Government schemes and (iii) commission received from other departments for execution of Department-specific schemes. The Company also receives grants from State and Government of India for execution of various schemes/projects like display centres, machinery servicing centres etc. The summarised financial position of the Company for the period from 2009-14 are given in Table 2.11.
Table 2.11: Financial Position and working results for the period 2009-2014
(` in crore) 2009-10 2010-11 2011-12 2012-13 2013-14*
I. Equity and Liabilities 1. Shareholder's funds (a) Share Capital 21.50 21.50 21.50 21.50 21.50 (b) Reserves and Surplus 8.38 12.32 28.60 46.83 35.79 2. Non-Current Liabilities (a) Long Term borrowings 42.01 43.43 44.85 46.27 47.70 (b) Deferred Tax Liability - 0.02 0.66 0.86 0.86

Chapter II-Performance Audit relating to Government Companies
47
3. Current Liabilities (a) Trade Payables 109.32 147.48 111.79 37.22 33.91 (b) �ther Current Liabilities 117.50 137.19 110.21 121.22 95.99 (c) Short Term Provisions - 0.51 0.66 0.54 0.24 Total 29�.�1 362.45 31�.2� 2�4.44 235.99 II. Assets 1. Non-current assets (a) Fixed Assets (i) Tangible assets 25.31 24.23 25.83 29.64 28.15 (b) Non-current investments 1.44 1.44 1.44 1.44 1.44 (c) Long term loans and advances
0 33.83 36.98 37.78 37.91
2. Current assets (a) Inventories 4.81 9.78 4.59 1.93 1.63 (b) Trade receivables 92.45 126.33 119.97 53.95 54.25 (c) Cash and Cash equivalents 137.87 154.33 114.98 137.88 104.56 (d) Short term loans and advances
36.83 12.51 14.48 11.82 8.05
Total 29�.�1 362.45 31�.2� 2�4.44 235.99 Source: Annual Accounts *provisional
2.2.6.1 Irregular use of interest earned on scheme funds
Cash balance of ` 104.56 crore includes funds received for execution of various schemes (including unutilised capital grants pertaining to incomplete schemes as discussed in paras 2.2.6.3 to 2.2.6.6). Out of this amount, ` 54.25 crore were kept in Fixed Deposits (FDs). The interest of ` 21.58 crore earned was utilised for its administrative expenditure during the last five years ending March 2014 which was irregular as the interest should have been credited to the capital grants the funds pertained to.
2.2.6.2 Reduction in activity of the Company resulted in losses
Working results of the Company are shown in Table 2.12. Table 2.12: Profit and loss account for the years 2009-10 to 2013-14
(` in crore) PARTIC�LARS 2009-10 2010-11 2011-12 2012-13 2013-14*
INC�� E I. Revenue from operations 260.88 449.68 436.16 51.67 26.36 II. �ther Income 3.81 5.99 8.86 7.98 3.42 III. Total 264.69 455.6� 445.02 59.65 29.�� I�. Expenses a. Cost of material consumed 2.05 2.62 2.06 2.11 3.45 b. Purchase of stock in trade 246.08 434.64 412.49 42.35 20.54 c. Changes in inventories -0.77 -5.04 5.18 2.65 0.46
d. Employee benefits expenses 8.25 12.94 11.28 11.11 10.93

Report No. 4 of 2015 (Public Sector Undertakings)
48
e. Finance Costs 1.43 1.50 1.44 1.43 1.42 f. Depreciation and Amortisation expense
0.13 0.13 0.13 0.15 0.15
g. �ther expenses 5.28 3.79 3.93 2.76 1.97 Total 262.45 450.58 436.51 62.56 38.92 �. Profit before tax 2.24 5.09 8.51 -2.91 -9.14 Profit c�f to �S -7.6 5.08 6.49 -4.48 -9.15
Source: Annual Accounts *provisional
The major chunk of income of the Company comes from the Agro Service Centres and ARSKs from which it collects service charges; schemes of the departments of Agriculture and Horticulture are implemented through these Centres. As seen from the P&L account, the Company was making profits till 2011-12, but there was reduction in the activities of the Company from the next year onwards as reflected by abrupt decreases in both income and expenditure of the Company in 2012-13; the income and expenditure were only 13.41 per cent and 14.33 per cent respectively of their 2011-12 levels. In 2013-14, they shrunk further by 51 per cent and 38 per cent. The Company which had earned profit of ` 8.51 crore in 2011-12 incurred loss of ` 2.91 crore in 2012-13, which further increased to ` 9.14 crore loss in 2013-14. The reduction in its activities was due to decrease in allocation of business by the Agriculture and Horticulture departments as discussed in para 2.2.6.7. As a result, revenue from operations declined from ` 436.16 crore in 2011-12 to only ` 26.36 crore in 2013-14, thus seriously affecting the financial position of the Company.
Implementation of schemes
The Company implemented various government schemes through grants received by it as shown in Table 2.13:
Table 2.13 - Grants received from Government of India
(` in lakh) �ear Construction
of display centres
Purchase of bulldo�ers
(LDA)
Servicing centres
� are-houses
Procurement of machinery for display centres
2011-12 420.80 655.33 23.87 0 0
2012-13 586.60 1411.00 62.40 401.00 0
2013-14 0 0 13.00 300.00 187.00
Total 100�.40 2066.33 99.2� �01.00 1��.00
Source: information submitted by the Management
Utilization of these grants are discussed in the subsequent paragraphs.
2.2.6.3 Non-utilisation of display centres The Company proposed (28 July 2011) setting up of two ‘permanent farm equipment36 display centres’ (one open shed of 3,000 sq.ft. and one closed 36 Harvesters, Planters, Tractors and Weeders etc.

Chapter II-Performance Audit relating to Government Companies
49
shed of 2,000 sq. ft.) in each district of the State. Implementation of the scheme was to have been carried out in 2 phases, with 22 sheds to be constructed in 11 districts in phase-I and 22 sheds in 11 more districts in phase-II. The main objective of construction of these display centres was to demonstrate/display agricultural equipment and create awareness among farmers about farm mechanisation. Manufacturing companies of the farm machinery were to be encouraged to display their latest machinery and equipment in these centres. The sheds were to be constructed on the assumption that nearly 5000 farmers would visit these centres in each district in a year and to motivate farmers for use of modern techniques. It was also expected to overcome the labour problems faced by farmers.
Government released (September 2011 & November 2012) ` 10.80 crore covering both Phase-I and Phase-II under RKVY scheme to the end of March 2014. Under Phase-I, the Company completed seven open sheds and eight closed sheds in nine districts37 at total expense of ` 3.13 crore, the remaining seven sheds could not be taken up due to non-identification of land (May 2014). It was observed in audit that none of the display centres constructed so far had any equipment to display and were non-functional till the date of Audit (May 2014).
Audit observed that the Company neither carried out any survey nor interacted with the farm equipment manufacturers before proposing the scheme/ centres, nor took any action after the completion of these centres under phase-I for displaying farm equipment. It further initiated action for construction of the remaining display centres under phase-II by calling for tenders.
Management reply was silent on non-utilisation of display centres for the purpose for which they were constructed.
2.2.6.4 Failure in setting up of rural agricultural implements and machinery servicing centres
To facilitate timely repairs and replacements of agricultural machinery38 at the doorsteps of farmers, Company proposed (July 2011) a 3-months training (including food and shelter of trainees for the period) to the unemployed youth at mandal level. It was proposed to train 1100 youth within a span of 3 years (200, 400 and 500 in first, second and third year respectively). After completion of the training, the trained youths were to be provided special tool kits worth ` 25,000 each for establishment of farm equipment repairing centres at mandal headquarters with financial assistance of ` 2,000 per month for a period of 6 months. Later, they were expected to run repair centre at their own cost.
The government approved the proposal and released (September 2011 to September 2013) ` 1.11 crore (100 per cent grant under RKVY scheme) for
37Anathapur, Chittoor, Eluru, Guntur, Hyderabad, Jagitial, Kurnool, SPSR Nellore, &
Vizianagaram, (Khammam, Nalgonda were not taken up due to non-finalisation of lands for the construction purpose).
38Harvesters, multicrop threshers, power tillers, paddy and sugar cane planters, tractors etc.

Report No. 4 of 2015 (Public Sector Undertakings)
50
the period 2011-14. The Company identified 119 candidates for training through a Government agency viz. Society for Elimination of Rural Poverty (SERP). It was decided to train the youth in the ‘Swamy Ramananda Tirtha Rural Institute’ a Government institution by paying for board and lodging for training. Subsequently, tool kits were to be provided by the Company.
Audit noticed that the Company identified and trained only 119 candidates (30 in 1st year, 54 in 2nd year and 35 in 3rd year) against 1,100 targeted and spent only ` 12.73 lakh out of ` 1.11 crore allocated for the purpose from 2011-12 to 2013-14. Only 22 out of the 119 trained candidates came forward to open repair centres and were provided with toolkits but only one trainee opened the repair centre.
Audit observed that the scheme was not backed by any awareness program among the targeted unemployed youth for the training/ opening of repair centre. There was no direct link between the training, distributions of toolkits and running of repair centre which was voluntary on the part of the trainees. The Company could not motivate the trainees for setting up of repair centre and there was no follow up after the training.
Management in its reply stated that the Company has taken utmost care through paper advertisement and contacting government departments to identify the candidates who were supposed to set up the service centres. It was also stated that the trained candidates were expecting permanent job guarantee for setting up of service centres. Therefore the purpose could not be achieved.
The reply is not tenable as the scheme was designed and implemented without proper planning. There was no component of creating awareness, assessing demand in the estimates prepared to implement the scheme.
2.2.6.5 Non construction of Warehouses
The State Level Sanction Committee (SLSC) of RKVY desired (June 2012) that godowns/ warehouses be constructed in areas where they were required, for storage of fertilisers or produce of farmers where the Company land was readily available for which 100 per cent grants would be provided under the scheme. The Company submitted proposal (June 2012) to SLSC (RKVY) for construction of four godowns at Khammam, Medak, Anantharajupet and Chintal, Hyderabad at an estimated cost of ` 15 crore. Government released (November 2012) an amount of ` 4.01 crore for construction of godown, at Chintal, Hyderabad. Even after one year from the receipt of funds, the Company has not commenced the preliminary work of identification of land, design/ plan etc. till date (May 2014)
For construction of godown at Ananthrajupet (Kadapa district) government released (September 2013) an amount of ` three crore for 2013-14 and deposited the amount in PD account of the Company. Company did not initiate any action for construction and rather decided (January 2014) to drop the proposal of construction of godown citing paucity of time and surrendered ` one crore and remaining ` two crore was proposed to be utilised for procurement of machinery (` 1.87 crore) for display centres and machinery

Chapter II-Performance Audit relating to Government Companies
51
repair centre (` 0.13 crore). Though the proposal was approved, the Company failed to even utilise these funds till date (May 2014).
Audit further observed that though the Company in its proposal had indicated availability of 15 acres of land at four locations with a proposed built up area of 3,00,000 sq.ft for construction of godowns and accordingly received funds from RKVY, it failed to identify specific locations for construction work and could not utilise the grants received for the purpose.
Management replied that construction of godown at Central workshop, Chintal was being reviewed and comprehensive revised proposal would be submitted. The reply confirms the ad-hoc nature of planning and preparedness.
2.2.6.6 Ineffective planning in construction of mango processing units at two locations for export of mangoes resulted in idling of plants
Andhra Pradesh is one of the leading mango producing States in India. The Government decided to export mangoes to Japan through the Company, by following quality control regulations of Agricultural Processed Food Products Export Development Authority (APEDA), Government of India. As per these regulations, all export consignments to Japan should undergo Vapour Heat Treatment (VHT) against fruit flies in the presence of a Japanese quarantine inspector before their export. For this purpose, the Company constructed (2008-09) two fruit processing plants, with post- harvest processing facilities, i.e., Integrated Pack House and Vapour Heat Treatment Plants (IPH & VHT), at Nuziveedu (Krishna district) and Tirupati (Chittoor district), at a cost of ` 26.40 crore (funded by Government). The plants were run by the Company for some time and also leased out to private parties.
It was noticed that the stringent safety regulations for export could not be fulfilled either by the Company or by lessees selected by the Company for running these plants, as a result of which no mangoes could be exported to Japan ever since the two plants were constructed in 2008-09 till the date of audit. Thus, the expenditure of ` 26.40 crore incurred for the construction of these plants turned infructuous. The Company incurred expenditure of ` 65.54 lakh towards maintenance of these two plants till March 2014 and it was still paying for its maintenance. In addition, there were accumulated liabilities to the extent of ` 2.32 crore on account of lease rentals and cost of land (` 2.02 crore for Tirupati plant and ` 0.30 crore for Nuziveedu plant), which were yet to be discharged by the Company.
Audit observed that lack of planning by the Company to take appropriate measures for meeting the stringent safety standards resulted in non-export of mangoes even for a single year out of seven years since the establishment of these units. The objective of construction of the plants was thus defeated. The Company had neither taken any steps to overcome the quality issues nor explored alternative use of the facilities created in the plants so far. Management in its reply was silent on the utilisation of these plants.
Report No. 4 of 2015 (Public Sector Undertakings)
52
���� ������� ������� ������
The Government nominated (May 2005) the Company as a nodal agency for distribution of agricultural implements to beneficiary farmers under government schemes of Agriculture and Horticulture departments and sale of tyres, tubes and batteries to government departments. To carry out these functions, Company gets service charges between 4 per cent and 11 per cent.
2.2.6.7 Unauthorised reduction of service charges by C&DA resulting in loss of business
Departments of Agriculture and Horticulture assign implementation of subsidy schemes to the Company such as supply of farm equipment, fertilizers and seeds to farmers at 50 per cent price discounts. The departments identify the beneficiary farmers and collect the remaining 50 per cent from them. The Company, after retaining 4 per cent of beneficiary contribution as service charge, would pay the remaining amount as advance to the supplier. After supplies are made, Utilisation Certificates (UCs) are submitted by Company to Agriculture Department and then subsidies are claimed from the departments. On receipt of the subsidy from the department, payments are made to the suppliers and the Company earns another 4 per cent on the subsidy amounts. This was the major source of income for the Company, but Commissioner & Director of Agriculture (C&DA), reduced (since 2011-12) the service charges from 4 per cent to 2 per cent and started paying at the reduced rate. The Company has not pursued with Government for restoration of service charge at 4 per cent which was its major source of business and income.
Management in its reply stated that C&DA has unilaterally reduced the margin from 4 per cent to 2 per cent.
2.2.6.8 Lack of proper monitoring of Agro Rythu Seva Kendras (ARSKs)
To supply quality agriculture inputs like seeds, fertilisers and pesticides under one roof, Government directed (May 2005) the Company to set up 30 to 40 ARSK (single window) outlets in each district in a phased manner. ARSK were allotted to private entrepreneurs by the Company specifically to unemployed youth who are allowed to sell the products exclusively supplied/ authorised by the Company or other nodal agencies (AP Seeds, HACA, AP Oil Fed, APMARKFED) at notified prices from time to time. On selling of these products, ARSKs and Company get commission at the rate of 1.5 per cent and 0.5 per cent respectively. The Company had 450 ARSKs as on 31 March 2014. The performance of the ARSKs was reviewed for the period 2009-14.
It was seen that as per the guidelines, an entrepreneur has to enter into an agreement with the Company for allotment of ARSK dealership renewable on yearly basis. The selected entrepreneur should deposit ` three lakh as trade advance and ` 10,000 as security deposit. The same is refunded after expiry/ termination of the agreement, after adjusting the dues outstanding, if any. Regional Managers should ensure that stocks are supplied to the entrepreneur

Chapter II-Performance Audit relating to Government Companies
53
only to the extent of amount remitted by them or credit balance available in their account. In case an entrepreneur failed to remit the sale proceeds of the stock supplied, he was liable to pay the entire value of stock with interest at 18 per cent p.a.
Audit observed that the Company had not collected trade advance (` 3 lakh per entrepreneur) amounting to ` 13.50 crore from 450 ARSKs to the end of March 2014. Further, ARSK agreements were not renewed from time to time. Though, the agreement insists on maintenance of stock records, account books etc. and furnishing of monthly reports and returns regarding receipt of stocks, sales etc., the same were not furnished to the Company. Thus, Company failed in monitoring the ARSKs which resulted in non-collection of ` 82.92 lakh as discussed below.
Department of Agriculture assigned the task of providing quality seeds to the farming community at 50 per cent subsidy. Accordingly, Company had taken up distribution of subsidised seeds from 2005-06 through ARSKs, under the Agriculture departmental subsidy programme.
During 2010, the Company noticed that remitting of non-subsidy amounts to the Company was being delayed by ARSKs resulting in delayed payments to seed nodal agencies (AP Seeds). Therefore, the Company decided (May 2010) that the collection of non-subsidy amounts from ARSKs should be the responsibility of seed nodal agencies. As the ARSKs started remitting the non-subsidy amounts directly to the seeds nodal agencies, the Company had to forego the 0.5 per cent commission it used to receive from the seed nodal agencies from 2010-11 onwards. The Company requested (September 2013) AP Seeds to clear the outstanding commission of ` 82.92 lakh for the period 2009-13. AP Seeds in turn asked the Company to arrange for remittance of the outstanding dues i.e. sale proceeds amounting to ` 4.38 crore from ARSKs so as to settle the commission to the Company. As the Company failed to collect the amounts from ARSKs an amount of ` 82.92 lakh remained uncollected from seed nodal agencies.
Management in its reply stated that the commission receivable from the seed agencies is being pursued.
2.2.6.9 Ineffective Land Development Activity (LDA) The Company was engaged in land development activity (LDA) i.e. tank de-silting, levelling, bunding and ripping works in six out of ten regions. For this purpose, Company was maintaining 54 bulldozers and heavy earth moving equipment. In addition, the Company proposed to take up development of ponds for fish culture and prawn culture extensively in coastal areas, besides taking up soil moisture conservation works etc.

Report No. 4 of 2015 (Public Sector Undertakings)
54
��� ����������� �� �������
The State has 16.28 lakh acres39 of cultivable waste land which can be brought under cultivation. No data bank of land to be brought under cultivation had been developed by the Company so far, the absence of which will affect planning for its land development activities.
Targets for land development activities in terms of number of machine hours with financial targets are fixed by the Company from year to year. Company however did not achieve the targeted hours of operation as well as financial targets in any of the years during the period of review which were 166,500 hours and ` 20.77 crore respectively during the period covered by audit, against which there were shortfalls of 46,184 hours and ` 6.12 crore respectively. Due to this the Company could develop only 20,053 acres (72 per cent) out of the targeted 27,749 acres of land (�������� ���). The reasons cited by the Company included old machines which are prone to frequent break down and repair, state bifurcation and stiff competition from private owners of bull dozers/excavators/JCBs and wheeled tractors with blade attachment.
It had received (November 2012) a grant of ` 14.11 crore for purchase of new machinery, but even after 15 months (March 2014) it did not procure the machinery. Thus Company’s own slackness was also responsible for non-achievement of targets and non-utilisation of available funds.
2.2.6.10 Loss due to wrong fixation of machine hour rate for bulldozers
Machine hour rate of bulldozers is fixed by the Company on the basis of life of the machine and its working condition. However, while fixing machine hour rate, the fixed and variable costs needed for its operation are required to be taken into consideration. Company prepares a cost sheet for arriving at the rate per hour of operation of the bulldozers. For bringing land under cultivation, farmers are charged on the basis of actual working hours rendered and rent is collected at hourly rate.
The Company had fixed (July 2008) the rate per hour at ` 1,100 considering fixed cost and variable cost40 (July 2008). It revised the rate three times in September 2010, September 2011 and May 2013 respectively. Audit observed that the revisions were made by factoring oil cost only and ignoring changes in the other fixed and variable costs due to which the rate that was fixed was less than the actual cost incurred. This led to a loss of ` 1.39 crore during the last five years.
Management while accepting the observations stated that care would be taken in future to revise the process by taking into account all cost-variants. 39Source: Web site data from Ministry of Agriculture, GoI as on May 2014. 40Fixed cost (operator& administrative salaries and overheads expenses) and variable cost
(HSD oil, lubricants @10 per cent of HSD, R&M cost, TA&DA to operators).

Chapter II-Performance Audit relating to Government Companies
55
2.2.6.11 Inefficient management of lands and other properties The Company holds 617.48 acres of land. Out of this 23.39 acres of lands were transferred (1979) from the Agricultural Department to the Company for its utilisation. It was noticed in audit that land at Suryapet (2.02 acres) and Miryalaguda (1.48 acres) was kept idle for 15 years till 1994. Thereafter the Company on orders of Government re-transferred (1994-96) these lands to other State Government departments for which the Company was to receive compensation of ` 20.39 lakh. Even after 20 years of the transfer of the lands, the Company did not get any compensation nor was it pursuing with the departments for claiming the due amounts (May 2014).
Audit further noticed that Company took possession (2005) of lands at Hyderabad (23.28 acres) and Bellampally (543.15 acres) from its subsidiary Company i.e. Hyderabad Chemicals and Fertilisers (HCF). Even after 10 years after taking the possession of the lands, Company had not planned utilising of the land which was lying idle.
Management replied that HCF land was being surveyed after which the land would be protected by fencing (October 2014). However, it was noticed by audit that there were “encroachments on the road side” in the land the extent of which could not be ascertained from the records. Management themselves were unaware of the extent of such encroachments.
2.2.6.12 Internal control mechanism
Internal control is designed for providing reasonable assurance for efficiency of operations, reliability of financial reporting and compliance with applicable laws and statutes essential for proper functioning as well as effectiveness of the organisation. It was seen by audit that Company had outsourced its internal audit function to private Chartered Accountants (2009-10). Internal audit reports revealed that the comments focussed more on the establishment matters rather than the core activities of the Company. Though the statutory auditors in their audit report were stating every year that there were several cases of advances, funds in transit and stock in transit remaining unadjusted for long period due to non-reconciliation of advances, debtors and creditors, neither the Company nor the Internal Audit suggested any measures to improve the state of affairs.
Audit further noticed, that as a part of internal control, the VC&MD has to conduct monthly review meetings with regional managers to analyse the working of various activities in the regions viz., ASCs, LDA, FMD etc. Audit however observed that such meetings were not held after December 2011, resulting in lack of proper internal controls and supervision at the top level. On review of the internal control mechanism, the following observations are made by audit.
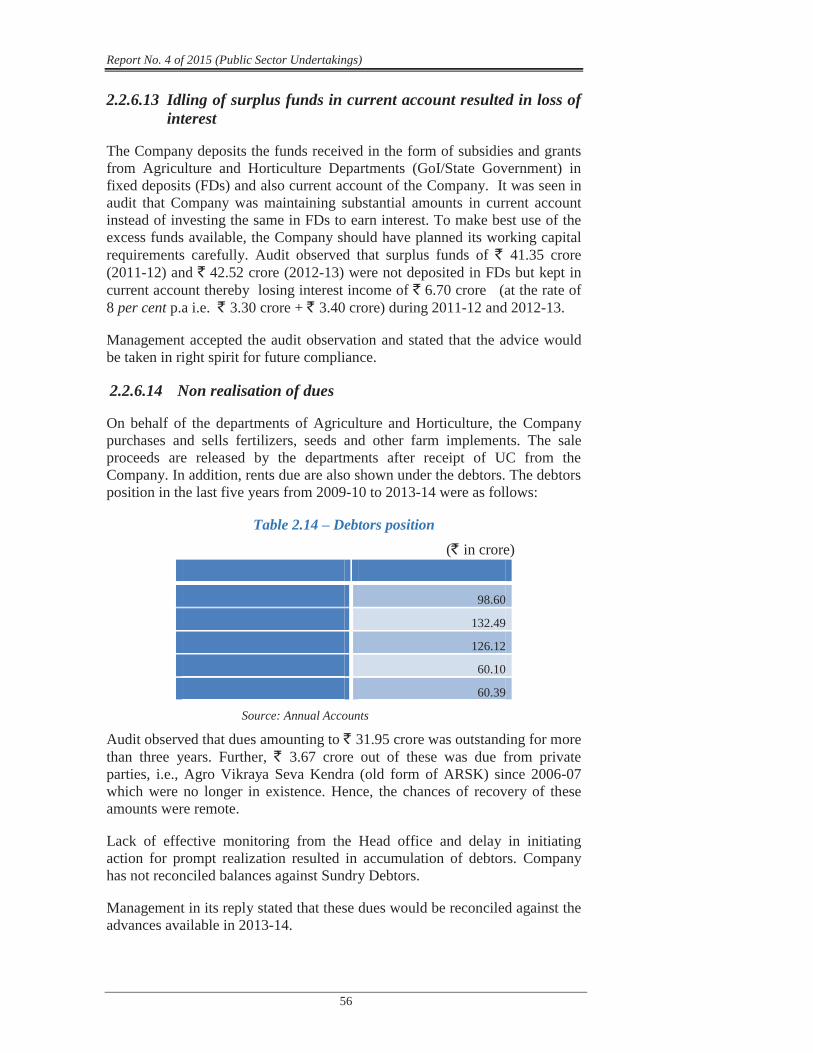
Report No. 4 of 2015 (Public Sector Undertakings)
56
2.2.6.13 Idling of surplus funds in current account resulted in loss of interest
The Company deposits the funds received in the form of subsidies and grants from Agriculture and Horticulture Departments (GoI/State Government) in fixed deposits (FDs) and also current account of the Company. It was seen in audit that Company was maintaining substantial amounts in current account instead of investing the same in FDs to earn interest. To make best use of the excess funds available, the Company should have planned its working capital requirements carefully. Audit observed that surplus funds of ` 41.35 crore (2011-12) and ` 42.52 crore (2012-13) were not deposited in FDs but kept in current account thereby losing interest income of ` 6.70 crore (at the rate of 8 per cent p.a i.e. ` 3.30 crore + ` 3.40 crore) during 2011-12 and 2012-13.
Management accepted the audit observation and stated that the advice would be taken in right spirit for future compliance.
2.2.6.14 Non realisation of dues
On behalf of the departments of Agriculture and Horticulture, the Company purchases and sells fertilizers, seeds and other farm implements. The sale proceeds are released by the departments after receipt of UC from the Company. In addition, rents due are also shown under the debtors. The debtors position in the last five years from 2009-10 to 2013-14 were as follows:
Table 2.14 – Debtors position
(` in crore) ���� �������
������� 98.60 ������� 132.49 ������� 126.12 ������� 60.10 ������� ������������� 60.39
Source: Annual Accounts
Audit observed that dues amounting to ` 31.95 crore was outstanding for more than three years. Further, ` 3.67 crore out of these was due from private parties, i.e., Agro Vikraya Seva Kendra (old form of ARSK) since 2006-07 which were no longer in existence. Hence, the chances of recovery of these amounts were remote.
Lack of effective monitoring from the Head office and delay in initiating action for prompt realization resulted in accumulation of debtors. Company has not reconciled balances against Sundry Debtors.
Management in its reply stated that these dues would be reconciled against the advances available in 2013-14.
Chapter II-Performance Audit relating to Government Companies
57
����������
There was deficient planning and delay in implementation of various schemes. Infrastructure created for processing and exporting of mangoes and display centres for farm machinery was kept idle for years. The Company did not focus on bringing waste land to cultivation in the State. Funds were kept idle in current accounts of various Regional offices. Review meetings with regional managers to analyse the working of various activities were not being conducted. Internal control was weak and monitoring was poor.
���������������
The following are for consideration
Company plan and complete the schemes undertaken;
Avenues be explored to use the idle infrastructure created in respect of Display centres and mango processing units;
Company increase its land development activity and strengthen its internal control mechanism.
Copyright © 2022 FDOKUMEN