PERFORMANCE AUDIT on EMPOWERMENT of WOMEN - CAG
184
Report of the Comptroller and Auditor General of India For the year ended 31 March 2015 PERFORMANCE AUDIT on EMPOWERMENT of WOMEN Government of Uttar Pradesh Report No. 3 of 2016
-
Upload
khangminh22 -
Category
Documents
-
view
4 -
download
0
Transcript of PERFORMANCE AUDIT on EMPOWERMENT of WOMEN - CAG
Report of the
Comptroller and Auditor General of India
For the year ended 31 March 2015
PERFORMANCE AUDIT on
EMPOWERMENT of WOMEN
Government of Uttar Pradesh
Report No. 3 of 2016

i
TABLE OF CONTENTS
Subject Paragraph Page Preface v Executive Summary vii CHAPTER 1: INTRODUCTION Introduction 1.1 1 Audit objectives 1.2 4 Audit Criteria 1.3 4 Institutional mechanism 1.4 5 Scope of audit and methodology 1.5 5 Acknowledgement 1.6 6 CHAPTER 2: PLANNING AND FINANCIAL MANAGEMENT Planning 2.1 7 Financial Management 2.2 9 CHAPTER 3: MISSING DAUGHTERS Pre- conception and Pre-natal Diagnostic Techniques (Prohibition of Sex Selection) Act, 1994
3.1 12
The Medical Termination of Pregnancy Act, 1971 3.2 24 CHAPTER 4: CONTROLLING MATERNAL MORTALITY Janani Suraksha Yojana 4.1 31 Maternal Death Review 4.2 35 Family Planning Programme 4.3 36 CHAPTER 5: IMPROVING HEALTH AND NUTRITIONAL SUPPORT Financial Management 5.1 40 Planning 5.2 41 Infrastructure facilities 5.3 42 Services under ICDS 5.4 44 Training and Capacity Development of the functionaries 5.5 54 Monitoring 5.6 55 Conclusion 5.7 56 CHAPTER 6: ADOLESCENT GIRLS Kishori Shakti Yojana 6.1 57 Rajiv Gandhi Scheme for Empowerment of Adolescent Girls/ SABLA
6.2 61
Conclusions 6.3 65
ii
CHAPTER 7: CRIME AGAINST WOMEN Incidence of crimes against women 7.1 68 Major crimes against women 7.2 69 Human trafficking and missing persons 7.3 71 Police Manpower 7.4 72 Delay in filing FIRs 7.5 73 Crime and Criminals Tracking Network and Systems 7.6 73 Compensation Schemes for victims of crimes 7.7 74 Trafficking 7.8 75 UJJAWALA - Rescue and Rehabilitation of trafficked women 7.9 77 Conclusion 7.10 79 CHAPTER 8: DESTITUTE WOMEN Allocation and Expenditure 8.1 81 Implementation 8.2 82 Improper functioning of Swadhar Greh 8.3 83 Monitoring 8.4 84 Conclusions 8.5 84 CHAPTER 9 : CONCLUSIONS AND RECOMMENDATIONS Planning and Financial Management 9.1 85 Missing Daughters 9.2 85 Controlling Maternal Mortality 9.3 88 Improving Health and Nutritional Support 9.4 89 Adolescent Girls 9.5 91 Crime Against Women 9.6 92 Destitute Women 9.7 94
APPENDICES Number Particulars Page
No. 1.1 Important Government schemes dealing with Empowerment of
Women and gender equality as on 31 March 2015 97
3.1 Roles and functions of various authorities under the PC-PNDT Act
98
3.2 Allotment of fund to the State from GoI under NHM for implementation of PC-PNDT Act
99
3.3 Details of expenditure incurred on various PC-PNDT activities under NHM during 2010-15
99
3.4 Amount received and utilised at district level 100 3.5 Registration/renewals of ultrasound centres (2010-15) 100 3.6 Joint Physical Inspection of 100 USG centres 101
iii
3.7 Maintenance of records in the test checked districts (2010-15) 102 3.8 Number of Ultrasound centres register and inspection conducted
by DAA 103
3.9 Statement of inspections of registered centres during 2010-15 103 3.10 Decisions/discussions in meetings at various levels not followed 104 3.11 District Advisory Committee (DAC) meetings in test-checked
districts during 2010-15 105
3.12 Allotment of fund under NHM for implementation and monitoring of MTP Act
106
3.13 Total number of registered Hospitals/ Nursing Homes under MTP Act, 1971
107
3.14 Total MTPs done in State and in test-checked districts 108 3.15 Position of District Level Committee (DLC) and status of
meetings 109
4.1 Year-wise Allotment and Expenditure under JSY during 2010-15 110 4.2 The target and achievement in institutional deliveries in
test-checked districts 110
4.3 Year-wise Allotment and expenditure under MDR during 2010-15
113
4.4 Allotment and Expenditure under Family Planning during 2010-15
113
4.5 Year wise target and achievement of limiting methods in test-checked districts
114
4.6 Target and Achievement of IUD, OPU and CC users in test-checked districts
117
5.1 Details of services provided at Angan Wadi Centres 120 5.2 Details and nutritional value of supplementary nutrition provided
to beneficiaries 121
5.3 Details of health services provided at AWCs 122 5.4 Budget allocation, releases and expenditure under ICDS-General 122 5.5 Details of non-availability of basic amenities at AWCs 123 5.6 Budget allocation and expenditure under Supplementary
Nutrition Programme 123
5.7 Details of population and number of beneficiaries under SNP in the State
124
5.8 Number of SNP beneficiaries in test checked districts 124 5.9 Details of calculation of total number of nutrition days in a
month and year during 2010-15 125
5.10 Details of AWCs functioning without new growth charts, maternal and child protection cards, weighing machines
126
5.11 Details of training slots organized for ICDS functionaries 126
iv
5.12 Status of monitoring and evaluation of ICDS Scheme 127 6.1 Funds released and expenditure (State level) 128 6.2 Details of identified and targeted Adolescent Girls in
test-checked districts and State 128
6.3 Status of Identified and Benefited AGs for SNP 129 6.4 Components under KSY scheme 129 6.5 Status of training imparted (test-checked districts level) 130 6.6 Release & Expenditure of Central and GoUP Share 130 6.7 Funds released and expenditure (State level) 130 6.8 Number of AGs identified and covered for THR (District level) 131 6.9 Status of supply of SABLA Training Kits 131 7.1 Cases related to rape 132 7.2 Cases related to assault on women with intent to outrage her
modesty 132
7.3 Cases related to kidnapping/abduction 133 7.4 Cases related to missing girls/women 133 7.5 Cases related to late FIR 134 7.6 Summary Statement of Grant under all components of the
Ujjawala scheme for a year 135
7.7 Status of Ujjawala projects in the State during 2010-15 136 8.1 Component wise assistance for a 30 residents Swadhar Greh 137 8.2 Grant release and expenditure under Swadhar Greh scheme
during 2010-15 137
8.3 List of Districts where Swadhar Grehs were not established 138 8.4 Improper functioning of Swadhar Greh (Results of JPI) at test-
checked districts 139
LIST OF ABBREVIATIONS 140
v
PREFACE
This Report containing the observations arising out of Performance Audit
on “EMPOWERMENT OF WOMEN” has been prepared for submission
to the Governor of Uttar Pradesh under Article 151(2) of the Constitution.
The cases mentioned in the Report are among those which came to notice
in the course of test audit of records of Women and Child Development
Department, Women Welfare Department, Medical Health and Family
Welfare Department and Home (Police) Department relating to selected
schemes/Acts implemented by these departments for Empowerment of
Women. Performance Audit covered the period 2010-11 to 2014-15.
The Audit has been conducted in conformity with the Auditing Standards
issued by the Comptroller and Auditor General of India.


vii
Executive Summary
Women Empowerment is a burning issue all across the world especially in developing countries like India where gender inequality and discrimination against women persists for centuries. Indian Constitution guarantees equality and equal protection of law for both men and women, prohibits gender discrimination and empowers the States for adopting special measures for women and children. India has also ratified the Convention on Elimination of All Forms of Discrimination Against Women in 1993. Despite these constitutional provisions and ratifying international conventions, Indian women continue to face discrimination in social, economic, religious and other spheres adversely affecting their advancement, development, confidence and security.
In Gender Gap Index rankings, India ranked 108 out of 145 countries in World Economic Forum 2015 much below some of our neighboring countries such as Sri Lanka at 84 and China at 91. The State of Uttar Pradesh has also been performing poorly in removing gender inequalities/disparities and ranked 26 amongst all Indian States with sex ratio of only 908 females per 1000 males as per 2011 Census. The maternal mortality rate (292 per one lakh live births) of the State was much above the all India average (178) and at approximately three times higher than the UN Millennium Development Goals, 2015 (109). Every second child in the State is undernourished and 52 per cent of pregnant women were anaemic as per data maintained by State Nutrition Mission. There were wide wage disparities between men and women. The incidence of crime against women in the State were highest in the country.
We have, therefore, taken up this performance audit to evaluate important government schemes relating to Empowerment of Women in the State to ascertain efficiency and effectiveness of their implementations, identify slippages and make suitable recommendations for taking appropriate corrective measures by the State Government.
As women empowerment is a multidimensional issue and it is not possible to examine all the schemes in one performance audit, we have selected 11 government schemes/Acts for examination during the course of this performance audit. These schemes relate to controlling abuse of modern technology for sex selection, reducing maternal mortality rates through institutional/safe deliveries, family planning, improving health and nutritional support of mother and girl child, addressing problems of adolescent girls, providing financial and other supports to victims of crime and women in distress, etc. The focus of this performance audit has been on women empowerment issues related to health, nutrition, safety and wellbeing of women so that they can live their life freely with a sense of self-worth, respect and dignity.
The performance audit covers the period from 2010-11 to 2014-15. Out of 75 districts of the State, 20 districts were selected for detailed test-check of implementation of the schemes.
viii
Chapter-1 of the report provides the introduction and major audit findings of the performance audit are contained in Chapter 2 to Chapter-8 of the report. The conclusions and recommendations are listed in the Chapter-9.
Our major audit findings are as follows:
Chapter 2 - Planning and Financial Management
● To promote gender equality and women empowerment, the Government of India (GoI) has already implemented gender based budgeting in the Ministries. The Government of Uttar Pradesh (GoUP) had declared State Women Policy in 2006 accepting the principle of gender based budgeting for introduction from the year 2005-06. GoUP, however, failed to adopt the gender based budgeting even after 10 years of its declaration of State Women Policy in 2006.
(Paragraph 2.1.1)
● Gender segregated data was not maintained by programme implementing agencies and, therefore, proper identification of beneficiaries, accurate need assessment of financial and other resources required, and setting realistic performance targets and goals were not feasible.
(Paragraph 2.1.2)
● In various schemes related to empowerment of women such as Pre-Conception and Pre-natal Diagnostic Techniques (Prohibition of Sex Selection), Medical Termination of Pregnancy, Maternal Death Review, Family Planning, Kishori
Shakti Yojna and Uttar Pradesh Victim Compensation Scheme, there were significant savings ranging from 46 to 100 per cent indicating non-achievement of targets/goals in respect of these schemes due to lack of proper planning and inefficient implementation by implementing agencies and ineffective monitoring by the governance structure.
(Paragraph 2.2)
Chapter 3 - Missing Daughters
Steep decline in the child sex ratio in the State is becoming an area of serious concern which needs to be addressed by the Government on priority. The practice of sex selective abortions had been a critical influencer of skewed sex ratio after advent of modern technologies. The use of ultrasound technology has become the most common mode of sex determination. In view of growing misuse of technology, the Pre-Conception and Pre-natal Diagnostic Techniques (Prohibition of Sex Selection) Act (PC-PNDT), 1994 was enacted to check female foeticide and address gender-biased sex selection and hence, improve sex ratio at birth.
The Act provides for mandatory maintenance and preservation of certain records and information by all Ultrasonography Centres (USG), frequent inspection and close monitoring of the activities of these centres by the district authorities and complete mapping of USG centres by the Government to ensure that the ultrasonography and other diagnostic testing is carried out by the registered centres/clinics only for bona-fide medical purposes on the recommendation of a qualified doctor and were not used illegally for sex determination and termination.

ix
We conducted scrutiny of records of USG centres and also carried out joint physical inspections of selected centres/clinics along with the departmental officials, and our findings are as follows:
Pre-Conception and Pre-natal Diagnostic Techniques (Prohibition of Sex Selection) Act, 1994
● GoI allotted only 35 per cent funds against the requirement of ` 20.26 crore projected by the State during 2010-14, against which the State Government could utilise only 54 per cent (` 3.86 crore) of the meagre allocation of ` 7.09 crore made during 2010-14 indicating inadequate implementation of the Act and leaving USG centres largely un-monitored and un-regulated.
(Paragraph 3.1.3)
● Ultrasonography (USG) centres did not maintain/preserve mandatory basic records/information as such 68 per cent of the ultrasonography cases test-checked did not have referral slips of doctors who recommended such tests and 57 per cent did not mention the purpose of carrying out USG/diagnostic procedures. In absence of which it was difficult for the inspecting authorities to establish the purpose of carrying out diagnostic procedures and large scale misuse of technology for illegal sex determination could not be ruled out.
(Paragraph 3.1.4.2)
● None of the test checked centres kept backups/records of images taken during ultrasonography of pregnant women which is mandatory to be kept for two years and 16 per cent USG centres did not submit prescribed monthly returns. In absence of proper maintenance of mandatory records and non-receipt of prescribed returns, effective monitoring and inspection of the USG centres in the districts was not possible.
(Paragraph 3.1.4.2 and 3.1.4.3)
● District Appropriate Authorities (DAAs) did not conduct prescribed number of inspections of USG centres and there was a shortfall of 76 per cent against the norm prescribed under the Act.
(Paragraph 3.1.4.4)
● In 96 per cent cases, DAAs did not issue inspection reports to USG centres after their inspections. 13 out of 20 test-checked DAAs did not maintain even information of USG centres functioning under their jurisdiction. This indicated extremely lackadaisical approach adopted by the District Appropriate Authorities towards strict enforcement of the provisions of the Act.
(Paragraph 3.1.4.5)
● Mapping of sale of USG machines was not carried out by the State/District Appropriate Authorities in any of the districts test checked. In the absence of mapping of USG machines and exact location of their operation, State Appropriate Authority (SAA) and DAAs were not able to effectively monitor and regulate the activities of such centres/clinics.
(Paragraph 3.1.4.6)
x
● It was found in joint physical inspection that USG machines did not have memory to save data for more than 24 hours making it difficult to verify their actual usage in inspection/surprise checks. GoUP also failed to introduce online tracking system for tracking of all the scanning done on USG machines to facilitate centralized monitoring, and control misuse of these machines for illegal purposes.
(Paragraph 3.1.4.7)
● Breach of important provisions of the Act was noticed in 936 (58 per cent) out of 1,652 USG centres in 20 test checked districts. Despite, rampant breaches of the mandatory provisions, neither any action was taken nor any penalty imposed on the defaulting USG centres by District Magistrates.
(Paragraph 3.1.4.11)
● State Supervisory Board (SSB) headed by Hon’ble Minister-in-charge of Health and Family Welfare, State Advisory Committee (SAC) and District Advisory Committee (DACs) neither met regularly nor ensured proper follow up action on their directions regarding maintenance of basic records/information by USG centres, conduct of regular inspections, tracking of pregnancies, providing toll free lines for registration of complaints, ensuring receipt of monthly reports from USG centres, sealing USG centres breaching provisions of the PC-PNDT Act and initiating legal action against them.
(Paragraph 3.1.5.1 and 3.1.5.2)
● State Inspection and Monitoring Committee (SIMC) also did not carry out adequate number of random inspections. The number of decoy operations carried out by DAAs was also negligible.
(Paragraph 3.1.5.3)
Medical Termination of Pregnancy Act, 1971
The Medical Termination of Pregnancy Act, 1971 (MTP, Act), provides for the termination of pregnancies by registered medical practitioners in cases where length of pregnancy ranged between 12 and 20 weeks and continuance of pregnancy would involve a risk to life of the pregnant woman or of grave injury physical or mental health; or there is a substantial risk that if the child were born, it would suffer from such physical or mental abnormalities so as to be seriously handicapped.
● Only 11 per cent of the total funds allocated (` 4,058.12 lakh) for MTP purposes during 2010-15 could be utilised by the department due to non-procurement of kits and equipment required for MTP.
(Paragraph 3.2.2)
● Only six per cent of 773 Community Health Centres (CHCs) in the State were having MTP facilities. As a result, majority of women in rural areas had no access to safe abortion services at affordable cost and at reasonable distance from their habitations.
(Paragraph 3.2.3)

xi
● Only 548 of 2,083 nursing homes/hospitals having MTP facilities and operating in test-checked districts, were registered under MTP Act.
(Paragraph 3.2.4.1)
● Inspection to ensure safe and hygienic conditions for MTPs had not been carried out by Chief Medical Officers/District Level Committees (DLCs) during 2010-15 in any of test-checked districts. CMOs of 10 out of 20 test-checked districts did not receive monthly report on MTP while out of remaining 10, CMOs of 7 districts had received MTP reports sporadically and in incomplete format.
(Paragraph 3.2.5.3)
● Only 25 per cent of MTPs, which were conducted at Government hospitals, were reported and remaining 75 per cent MTPs were conducted at private clinics, most of which were unregistered. The department did not have any information on the total number of MTPs in the State including those conducted in unauthorised clinics.
(Paragraph 3.2.5.4)
Chapter 4 – Controlling Maternal Mortality Janani Surakhsha Yojana
The main objective of Janani Suraksha Yojana (JSY) is to reduce Maternal Mortality Rate (MMR) and Infant Mortality Rate (IMR) and to provide safe motherhood by encouraging institutional deliveries.
We in audit observed that:
● Target for institutional deliveries was only 1.24 crore (46 per cent of registered pregnant women) during 2010-15 indicating that majority of rural women had to depend on home deliveries by unskilled birth attendants due to non-affordability of private nursing homes and lack of access to Government institutions.
(Paragraph 4.1.2)
● There was shortage of government health centres in the State as only 773 CHCs, 3,538 PHCs and 20,521 Sub centres were functional as on March 2015 against the required number of 1,555 CHCs, 5,183 PHCs and 31,100 Sub-centres respectively indicating lack of government health facilities in rural areas.
(Paragraph 4.1.2)
● There were huge shortfalls in achievement of targets for home deliveries by Skilled Birth Attendants which increased from 55 per cent in 2010-11 to 92 per cent in 2014-15. A large number of rural poor approximately 111.76 lakh (42 per cent) had to depend on home deliveries by unskilled attendants during last five years.
(Paragraph 4.1.3 (i) and (ii))
● No private nursing homes and hospitals were accredited in the State for JSY purposes. Only 7,226 sub centres (42 per cent) under CHCs/PHCs were accredited to the scheme as of March 2015 against 17,219 sub centres running in government buildings in the State.
(Paragraph 4.1.5 and 4.1.6)
xii
Maternal Death Review
MDR programme was started with the objective to effectively reduce Maternal Mortality Rate through qualitative improvements in delivery of Services. However, we in audit observed that:
● Expenditure of only ` 1.70 crore was incurred against the allotment of ` 7.22 crore indicating that very few cases of maternal death were reviewed by the Department.
(Paragraph 4.2.1)
● 85 per cent of the estimated Maternal Deaths (55,242 Deaths) were unreported and 86 per cent were un-reviewed during 2010-15 in the state, defeating the objective of the scheme.
(Paragraph 4.2.2)
Family Planning Programme
There is a close relationship between birth spacing and maternal health. The objective of Family Planning Programme was to control the population growth and have a positive impact on state of maternal health by encouraging adoption of appropriate family planning methods.
We in audit observed that:
● 49 per cent of allotted funds (` 380.57 crore) under the scheme remained unutilized during 2010-15.
(Paragraph 4.3.1)
● Target fixed for females (tubectomy) was 20 times higher than the target fixed for males (vasectomy); while achievement for tubectomy was 41 times of the achievement for vasectomy in terms of absolute numbers.
(Paragraph 4.3.2)
● There was short-fall in achievement of Intra-Uterine Device (IUD) targets ranging from 41 to 47 per cent, while no targets were fixed for most common and non-invasive methods viz. oral-pills and condoms etc.
(Paragraph 4.3.3)
Chapter 5 –Improving Health and Nutritional Support
Women are severely disadvantaged in having poor diet and access to health care services. Women face high risk of malnutrition and disease at all the three critical stages viz., infancy and childhood, adolescence and reproductive phase. As maternal and child nutritional levels in the State remain to be persistently low and access to medical care was limited, there is a wide prevalence of deficiency diseases, low body mass index and other related health issues. This is also one of the main cause of high rate of maternal and infant mortality. Hence, addressing nutrition and health care issues has been one of the prime focus of the Government policy on the women empowerment.
xiii
Integrated Child Development Services (ICDS) Scheme
The Scheme aims at holistic development of children up to six years of age, pregnant women and lactating mothers. The scheme is implemented through Angan Wadi Centre (AWC), located within the village or a slum, and run by an Angan Wadi Worker (AWW) with the support of Angan Wadi Helper (AWH) in service delivery. However, we in audit observed that:
● Adequate number of AWCs, as required under the scheme guidelines, were not established. Against the requirement of 2,85,429 AWCs, 1,90,145 (67 per cent) were sanctioned and 1,87,997 (66 per cent) were functional in the State.
(Paragraph 5.3.1)
● Basic amenities like toilet facilities were not available in 43,600 AWCs (68 per cent), safe drinking water facilities were not found in 53,757 AWCs (84 per cent), and kitchens were not provided in 18,467 AWCs (29 per cent) test checked.
(Paragraph 5.3.2)
● Initially, 9400 AWCs in the State were to be equipped with the facility of crèche. The Government of Uttar Pradesh decided to establish 3000 crèches during 2014-15. However, none of the crèches were established in the State, depriving the targeted children and their mothers of the intended benefits of the scheme.
(Paragraph 5.3.3)
● GoUP failed to obtain central grant of ` 650.83 crore under Supplementary Nutrition Programme (SNP) component as GoI released only ` 6,502.77 crore against total expenditure of ` 7,153.60 crore incurred by the State during 2010-15.
(Paragraph 5.4.1.1 (i))
● The State had total 3.21 crore to 3.44 crore pregnant women, lactating mothers and children between six months and six years of age, however, supplementary nutrition was provided to only 2.33 crore to 2.52 crore beneficiaries during 2010-15. Hence, 22 to 32 per cent pregnant women, lactating mothers and children were deprived of the benefits of supplementary nutrition programme during 2010-15.
(Paragraph 5.4.1.1 (ii))
● Nutritional support was provided to the beneficiaries ranging between 20 and 22 days in a month and 240 to 269 days in a year during 2010-15 against the prescribed norms of 25 days per month and 300 days per year.
(Paragraph 5.4.1.1 (iii))
● Required funds were not released to 17, out of the 20 test-checked districts, during 2010-15, which resulted in supply of hot cooked food to the children for only two to nine months in a year.
(Paragraph 5.4.1.1 (iv))
xiv
● 42 per cent of the children in the State were underweight and 15 per cent were suffering from wasting. The number of severely malnourished children increased more than five times from 0.28 lakh in 2010-11 to 1.46 lakh in 2014-15.
(Paragraph 5.4.1.1 (v) and 5.7)
● Nutrition and Health Education was neglected in AWCs as documentation regarding house visits by AWWs to counsel the mothers and their families during critical contact periods of pregnancy, infancy and sickness was not maintained in 157 (52 per cent) out of 300 test checked AWCs.
(Paragraph 5.4.1.2)
● Number of girls not attending Pre School Education activities has exponentially increased from three per cent in 2010-11 to 33 per cent in 2014-15.
(Paragraph 5.4.1.3 (i))
● Pre-natal and post-natal health check-up services were inadequate as pre-natal and post-natal cards were not issued to expectant/lactating mothers in 217 (72 per
cent) out of 300 test checked AWCs.
(Paragraph 5.4.2.1)
● Only ` 19.75 crore (34 per cent) of released amount of ` 58 crore was utilized for purchase of medicine kits during 2010-15 within the respective financial year. Medicine kits for common ailments like fever, cold, worm infection etc., were not supplied to 1,87,997 AWCs (100 per cent) in the State in 2012-13 and about 50 per
cent AWCs were not issued medicine kits in 2011-12 and 2014-15.
(Paragraph 5.4.2.1 (i))
● Health care services provided at AWCs were deficient as new growth charts were not available in 60 to 95 per cent AWCs; Maternal and Child Protection cards, baby weighing machines and adult weighing machines were also not available in 91 to 100 per cent, 22 to 84 per cent and 22 to 84 per cent AWCs respectively.
(Paragraph 5.4.2.1 (ii))
● Monitoring and Evaluation Committees at district, block and AWC level neither met regularly nor the functionaries of ICDS conducted regular inspections of AWCs. The revised web-based MIS was also not implemented in AWCs in the State.
(Paragraph 5.6)
Chapter 6 - Adolescent Girls
To address the problems of adolescence, a significant phase of transition from childhood to adulthood and marked by physical changes accompanied by psychological changes, Kishori Shakti Yojana (KSY) and Rajiv Gandhi Scheme for Empowerment of Adolescent Girls or Sabla (SABLA) were launched through ICDS platform. The objectives of these schemes were to make adolescent girls (AGs)
xv
aware of health, nutrition, and lifestyle related behaviour and adolescent reproductive and sexual health needs to be positioned in this phase of life in order to improve the health of adolescent girls and facilitate an easier transition to womanhood. KSY has been implemented in 53 districts and SABLA in remaining 22 districts of the State. An expenditure of ` 11.69 crore was incurred on implementation of KSY and ` 1,186.41 crore on SABLA during 2010-15. We in audit observed that:
Kishori Shakti Yojana
● Only ` 11.69 crore (62 per cent) of released amount of ` 18.88 crore was spent during 2010-15 for implementation of the scheme in the State.
(Paragraph 6.1.1.1)
● Due to ceiling of covering just 60 adolescent girls per block, only 35100 adolescent girls (less than one per cent) out of the total population of 70,74,240 adolescent girls were provided supplementary nutrition in the test-checked districts, leaving balance 99 per cent adolescent girls uncovered. Thus, KSY had little impact on nutritional status and vocational skills of adolescent girls in 53 districts of the State.
(Paragraph 6.1.2)
● Shortfall of 87 per cent in achieving targets fixed for imparting vocational training to adolescent girls was noticed in the test checked districts.
(Paragraph 6.1.4)
Rajiv Gandhi Scheme for Empowerment of Adolescent Girls/SABLA
● An expenditure of ` 1,186.41 crore was incurred on the scheme during 2010-15 including Central share of ` 564.34 crore and 97.77 lakh Adolescent Girls (AG), were covered under the scheme.
(Paragraph 6.2.1.1)
● Take Home Ration (THR) was not provided to 13.45 lakh adolescent girls (AGs) in the test checked districts during 2011-15. This implied that 28.21 per cent of the eligible AGs did not get nutritional support under the scheme in these districts.
(Paragraph 6.2.3.1)
● Vocational training was not imparted to adolescent girls in any of the six test-checked districts during 2011-15.
(Paragraph 6.2.3.2 (i))
● Only 26,084 training kits (10 per cent) against requirement of 2,60,865 kits in 52,173 AWC’s of 22 districts covered under the scheme were provided in the year 2014-15.
(Paragraph 6.2.3.2. (ii))

xvi
Chapter 7 - Crime Against Women
Crime against women includes any act of gender-based violence that results in, or is likely to result in, physical, sexual or psychological harm or suffering to women, including threats of such acts, coercion or arbitrary deprivation of liberty, whether occurring in public or private life. The incidence of crime against women in India have been increasing continuously with 2.13 lakh cases reported in 2010 which rose to 3.37 lakh cases in 2014 registering a growth of 58 per cent in last four years. According to the report of National Crime Records Bureau (NCRB) for the year 2014 (latest), Uttar Pradesh earned the dubious distinction of leading the list of States where crime against women in 2014 was highest, accounting for 11.4 per
cent of the total number of incidence of crime against women in the country.
We in audit observed that:
● The incidence of crime against women in the State have been rising consistently during last five years. There has been 61 per cent increase in incidence of crime against women between 2010-11 and 2014-15. The increase in crime has been very steep during 2013-14 when the number of such incidence shot up from 24,652 in 2012-13 to 31,810 in 2013-14. The incidence of crime against women have not declined in 2014-15.
(Paragraph 7.1)
● There was substantial increase in cases of rape (43 per cent) and kidnapping and abduction of girls/women (21 per cent) during 2013-14 as compared to previous year. 59 per cent of the victims of rape and 71 per cent of victims of kidnapping and abduction were minor girls.
(Paragraph 7.2)
● The cases of Torture-both mental and physical increased from 7302 in 2010-11 to 9476 in 2014-15. There has been significant increase of 24 per cent in 2013-14 over the previous year.
(Paragraph 7.2)
● The cases of assault on women with intent to outrage her modesty have increased from 2989 in 2010-11 to 7972 in 2014-15. Maximum number (55 per
cent) of victims for the said crime were minor girls. In the year 2013-14 there was an increase of 73 per cent in the cases of assault on women with intent to outrage her modesty over the previous year.
(Paragraph 7.2)
Police manpower
● To protect 19.98 crore population of the State and to enforce law and order and deal with all types of crime including crime against women only 81 police personnel per one lakh population were available against the sanctioned strength of 178.48 police personnel per one lakh population in the State. Since Uttar Pradesh tops the list of the States having highest number of violent crimes against women accounting
xvii
for 12.7 per cent of the total number of violent crimes in the country and also has maximum incidence of crime against women, shortage of about 55 per cent of the police manpower if not immediately bridged may further worsen the crime scenario in the State.
(Paragraph 7.4)
● Women police personnel constitute only 4.55 per cent of the total police force in the State against the Ministry of Home Affairs advisory (September 2009) of 33 per
cent. (Paragraph 7.4.1)
Crime and Criminal Tracking Network and Systems
● Implementation of Crime and Criminal Tracking Network and Systems (CCTNS) has been considerably delayed in the State. Except for registration of FIRs, other functionalities/ modules of Core Application Software (CAS) are rarely being used by the police stations and higher offices though made functional. Further, citizen centric services envisaged to be made available through police portal and via SMS have not yet been made fully functional.
(Paragraph 7.6)
Compensation schemes
● Under the direction of the Hon’ble Supreme Court, a scheme for restorative justice was formulated by GoI as ‘Financial Assistance and Support Services to Victims of Rape: A Scheme for Restorative Justice’. The allocation of ` 15.03 crore by GoI during 2010-12 under this scheme, was not utilised by the State though 3544 cases of rape were reported in the State during the same period.
(Paragraph 7.7.1)
● Out of the total 18 cases for sanction of compensation under The Uttar Pradesh Victim Compensation Scheme, only two cases have been awarded compensation and remaining 16 cases are pending for four to 20 months as of December 2015.
(Paragraph 7.7.2)
Ujjawala – Support Services for Trafficked Women
Ujjawala scheme is implemented for prevention, rescue and rehabilitation of trafficked women and their children. Under the scheme Ujjawala homes are set up for providing immediate relief such as food, shelter, trauma care and counselling to the rescued victims. The victims are also to be provided skill training, capacity building and guidance in income generating activities to empower and help them to live independently.
● Only 13 Ujjawala projects were implemented in the State during 2010-11 to 2014-15 covering 11 districts. No second and subsequent installments were released to 12 out of 13 projects. All the three projects located in the test checked districts (Allahabad, Pratapgarh and Unnao) were found closed. Hence, Ujjawala scheme had become largely non-functional in the State.
xviii
(Paragraph 7.9.1)
● No Ujjawala homes were established in districts bordering Nepal which are major transit areas vulnerable to trafficking as per UN report.
(Paragraph 7.9.2)
● The State Level Monitoring Committee was not formed and periodic evaluation of the projects through reputed institutions was not done.
(Paragraph 7.9.3)
Chapter 8 - Destitute Women
The Swadhar Greh scheme is meant to provide temporary accommodation, maintenance and rehabilitation service to women and girls rendered homeless due to family discord, crime, violence, mental stress, social ostracism etc. We in audit observed that:
● District Women Welfare Committees for planning and implementation of the Swadhar Greh scheme in the districts were not constituted, as a result, the magnitude of prevalence of destitution in women in the districts remained un-assessed.
(Paragraph 8.2.1)
● Swadhar Grehs were established in only 42 out of 75 districts in the State as of March 2015.
(Paragraph 8.2.2)
● The State Department as well as implementing agencies had not established necessary linkages with other programmes such as non-formal education, skill development, etc., which resulted in non-achievement of the objective of upliftment and economic rehabilitation of inmates of Swadhar Greh through linkage with other programmes.
(Paragraph 8.2.3)
● Inadequate infrastructure, excess reporting of beneficiaries, lack of support services, non-rehabilitation of inmates and improper maintenance of records were found in Swadhar Grehs, functioning in test checked districts.
(Paragraph 8.3)

Chapter 1 - Introduction
1.1 Introduction
Empowerment of Women is a burning issue all across the world especially in developing countries including India. Article 14 and 15 of Constitution of India guarantees equality and equal protection of law for both men and women and prohibits gender discrimination. The directive principles of State policy contained in Article 39 of the Constitution also require the State to direct its policies towards providing adequate means of livelihood equally for men and women and ensure equal pay for equal work. India has also ratified the Convention on Elimination of All Forms of Discrimination Against Women (CEDAW) in 1993.
Despite the above Constitutional provisions and ratifying the International Convention, Indian women continue to face discrimination in social, economic and other spheres adversely affecting their advancement, development, confidence and security. Discrimination against women ultimately results in adverse sex ratio, malnutrition, high female mortality rates, illiteracy, serious wage disparities, crime against women, and various other forms of social, cultural and economic malpractices leading to exploitation and marginalisation of women. In Gender Gap Index1 rankings, India ranked 108 out of 145 countries in World Economic Forum 2015, even much below our neighbours such as Sri Lanka at 84 and China at 91.
The State of Uttar Pradesh has also been performing poorly in removing gender disparities. With sex ratio of 908 females per 1,000 males, it ranked 26 amongst all Indian States as per Census 2011. The rates of maternal and infant mortality continue to be much higher in the State in comparison to the national average. Further, Parliament enacted Equal Remuneration Act, 1976 fixing responsibility on the employer to pay equal remuneration to men and women workers for same work or work of similar nature. However, discriminatory practices are prevalent in labour markets which get reflected in the wages paid to women workers. The disparity in male and female wages in Uttar Pradesh was as high as 73 per cent in rural areas and 31 per cent in urban areas as per National Sample Survey 2011-12. Women also continue to face discrimination in government wage employment and self-employment programmes including skill development in the State.
1 Gender Gap Index examines the gap between men and women in four fundamental categories: Economic
Participation and Opportunity, Educational Attainment, Health and Survival and Political Empowerment.

Report on Performance Audit of Empowerment of Women for the year ended 31 March 2015
2
Economic and educational empowerment hold the key to women empowerment as lack of literacy and financial independence impedes growth and limits access to opportunities and has a host of other negative impacts including poor health, sanitation, hygiene, nutrition and more instances of violence and crimes against women. In terms of education, there is a wide disparity in men and women which is reflected in high female illiteracy rates in the State. The female literacy rate (57.18 per cent) in Uttar Pradesh is much below the male literacy rate of 77.28 per cent. The State of Uttar Pradesh ranks 31 amongst all Indian States and Union Territories in terms of female literacy. Crime against women in the State as per cases reported and registered with the police department has also been rising with no indication of any reversal in trend in any of the categories of violence/crime during 2010-15.
By its very nature, the issue of women empowerment is multi-dimensional and, therefore, both Central and State Governments have implemented number of schemes intended to reduce gender inequality in the areas of education, employment, health, nutrition, safety and security. The goal and objective of the Government policies on Women Empowerment is to bring about advancement and overall development of women by ensuring gender equality and eliminating discrimination and violence against women. Some important Government schemes dealing with the issues of women empowerment and gender equality are given in Appendix 1.1.
As it was not possible to examine all the schemes in this Performance Audit due to limitation of resources, time and space, we had selected 11 government schemes/Acts for examination during this Performance Audit covering areas such as adverse sex ratio, abuse of modern technology in sex selection, controlling high maternal and infant mortality through institutional/safe deliveries, providing proper health and nutritional support to mother, child and adolescent girls, violence and crime against women and providing support to women in distress. The focus of this review has been on women empowerment issues related to health, safety and wellbeing of women so that they can freely live their life with a sense of self-worth, respect and dignity.
While law and order is a State subject, other schemes selected in the performance audit are centrally sponsored schemes implemented through the State Government Departments, Urban Local Bodies, Panchayati Raj Institutions, etc. The specific schemes selected for review under the performance audit and their primary objectives are given in the table below:
Chapter 1 - Introduction
3
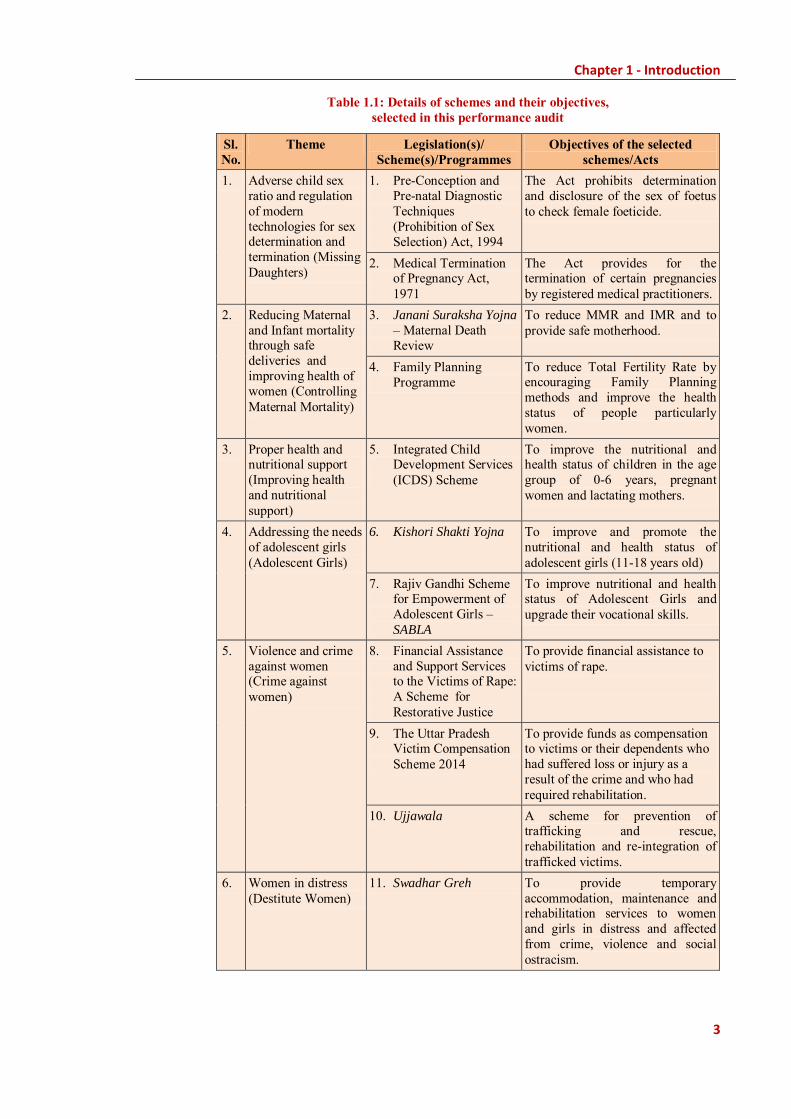
Table 1.1: Details of schemes and their objectives, selected in this performance audit
Sl. No.
Theme Legislation(s)/ Scheme(s)/Programmes
Objectives of the selected schemes/Acts
1. Adverse child sex ratio and regulation of modern technologies for sex determination and termination (Missing Daughters)
1. Pre-Conception and Pre-natal Diagnostic Techniques (Prohibition of Sex Selection) Act, 1994
The Act prohibits determination and disclosure of the sex of foetus to check female foeticide.
2. Medical Termination of Pregnancy Act, 1971
The Act provides for the termination of certain pregnancies by registered medical practitioners.
2. Reducing Maternal and Infant mortality through safe deliveries and improving health of women (Controlling Maternal Mortality)
3. Janani Suraksha Yojna – Maternal Death Review
To reduce MMR and IMR and to provide safe motherhood.
4. Family Planning Programme
To reduce Total Fertility Rate by encouraging Family Planning methods and improve the health status of people particularly women.
3. Proper health and nutritional support (Improving health and nutritional support)
5. Integrated Child Development Services (ICDS) Scheme
To improve the nutritional and health status of children in the age group of 0-6 years, pregnant women and lactating mothers.
4. Addressing the needs of adolescent girls (Adolescent Girls)
6. Kishori Shakti Yojna To improve and promote the nutritional and health status of adolescent girls (11-18 years old)
7. Rajiv Gandhi Scheme for Empowerment of Adolescent Girls – SABLA
To improve nutritional and health status of Adolescent Girls and upgrade their vocational skills.
5. Violence and crime against women (Crime against women)
8. Financial Assistance and Support Services to the Victims of Rape: A Scheme for Restorative Justice
To provide financial assistance to victims of rape.
9. The Uttar Pradesh Victim Compensation Scheme 2014
To provide funds as compensation to victims or their dependents who had suffered loss or injury as a result of the crime and who had required rehabilitation.
10. Ujjawala A scheme for prevention of trafficking and rescue, rehabilitation and re-integration of trafficked victims.
6. Women in distress (Destitute Women)
11. Swadhar Greh To provide temporary accommodation, maintenance and rehabilitation services to women and girls in distress and affected from crime, violence and social ostracism.
Report on Performance Audit of Empowerment of Women for the year ended 31 March 2015
4
1.2 Audit objectives
The objectives of the performance audit were to ascertain:
● whether gender responsive budgeting has been adopted and effectively implemented to translate gender commitments into firm budgetary resource allocations to promote women’s equality and empowerment;
● whether adequate budgetary resources were provided for women empowerment related programmes/ schemes and their utilisation was efficient and effective;
● whether laws and regulations relating to prohibition of sex selection and safe medical termination of pregnancies were effectively enforced to prevent misuse of modern diagnostic techniques for sex selection and irregular/unsafe termination of pregnancies;
● whether high rates of maternal and infant mortality were effectively controlled by ensuring institutional deliveries, supervised home deliveries and providing adequate health and nutritional support to pregnant women, lactating mothers and children below six years of age;
● whether limiting and spacing methods of family planning were implemented effectively, with adequate gender neutrality, to arrest the high rate of population growth and promote maternal health;
● whether adequate health care, nutrition and vocational training was provided to adolescent girls to ensure their proper development, confidence building and provide vocational skills;
● whether crime against women was effectively controlled and adequate financial assistance/compensation under Government schemes was provided to the victims promptly; and
● whether Swadhar Grehs were setup in each district and managed efficiently to provide shelter, food, clothing and medical treatment care to the women in distress.
1.3 Audit Criteria
Sources of audit criteria were as follows:
● Acts, rules, regulations and orders of the Government of India and Government of Uttar Pradesh;
● Provisions of Constitution, PCPNDT Act, 1994 and MTP Act, 1971 etc.
● Budget manual, Financial rules/regulations, annual strategic and action plans; and
Chapter 1 - Introduction
5
● Guidelines of the schemes JSY, ICDS, KSY, SABLA, Ujjawala, Swadhar
Greh etc.
1.4 Institutional mechanism
The Department of Women and Child Development is the nodal department for empowerment of women and is headed by Principal Secretary. Schemes covered under the Performance Audit are under the jurisdiction of Principal Secretary, Medical Health and Family Welfare Department (PC-PNDT Act, 1994, MTP Act, 1971, JSY and Family Planning); Principal Secretary, Women and Child Development Department (ICDS, KSY/SABLA); Principal Secretary, Women Welfare Department (Ujjawala, Swadhar Greh); and Principal Secretary, Home Department (Law and Order).
1.5 Scope of audit and methodology
Twenty districts2 were selected for test-check of the schemes covered under the Performance Audit. The selection of districts was made using statistical sampling (probability proportionate to size without replacement). Offices of the Principal Secretaries of Medical Health and Family Welfare Department, Women and Child Development Department, Women Welfare Department, Home Department and Planning Department with their State headquarters/ Directorates viz., Directorate of Family Welfare, ICDS, Women Welfare and Director General of Police offices along with district level units of these departments viz., Chief Medical Officer, District Programme Officer and District Probation Officer were visited by Audit teams for scrutiny of records and collection of information. Joint Physical Inspections of AWCs (five AWCs in each project from three projects in each selected district), Ultrasonography Centres (five in each selected district) and Shelter Homes were also carried out, with the officials of the Department concerned, in the test-checked districts.
The Audit methodology involved scrutiny of records of implementing agencies, collection and analysis of data, issuing audit queries, obtaining response to audit queries, joint physical inspection and photographic evidencing.
Audit objectives, criteria, scope, methodology etc., were discussed (9 January 2015) with Principal Secretaries, Women and Child Development Department and Women Welfare Department during Entry Conference. An exit conference was also held (December 2015) in which the State Government accepted the facts and figures and the recommendations made by Audit. The results of exit conference have been incorporated at appropriate places in the report.
2 Agra, Allahabad, Ambedkar Nagar, Azamgarh, Banda, Bareilly, Bulandshahr, Deoria, Firozabad, Gorakhpur,
Hardoi, Jhansi, Meerut, Pratapgarh, Saharanpur, Sant Kabir Nagar, Sitapur, Sultanpur, Unnao, Varanasi.

Report on Performance Audit of Empowerment of Women for the year ended 31 March 2015
6
1.6 Acknowledgement
The co-operation extended by the Principal Secretaries of implementing Departments i.e., Women and Child Development Department, Medical Health and Family Welfare Department, Women Welfare Department, Home Department and Planning Department is acknowledged.

7
Chapter 2: Planning and Financial Management
Introduction
Planning involves defining annual/multi-year strategies, resources and actions that are required to be taken to achieve government’s priorities within a given time frame by making optimum use of available resources and minimizing risks. It helps in giving right direction to the implementing agencies by providing performance measures to gauge progress and maintain control over execution of the programme in a time bound and cost effective manner. This becomes even more critical in multi-dimensional programmes/issues such as women empowerment, the implementation of which requires involvement of large number of departments and agencies.
Deficiencies noticed in the planning and financial management of the schemes covered under the performance audit are discussed below.
2.1 Planning
Assessment of requirement and providing adequate funding commitment through budgetary approvals is a key element of planning in any development programme. It also presupposes availability of adequate and reliable data for identification of beneficiaries and putting in place a proper institutional framework to coordinate and implement strategies for achievement of programme objectives in an efficient and optimal manner.
2.1.1 Absence of gender budgeting
As women face disparity in access to and control over services/resources and bulk of public expenditure has been in gender neutral sectors, a need was felt to promote women’s equality and empowerment by introducing gender responsive budgeting in India.
Gender Budgeting (GB) is defined as the application of gender mainstreaming in the budgetary process. It encompasses a gender perspective at all levels and stages of the budgetary process and paves the way for translating the gender commitments to budgetary commitments. The gender budgeting is a means of ensuring that public resources are allocated in an equitable way so that most pressing needs of a specific gender groups are satisfied. It seeks to view the government budget from a gender perspective in an order to assess as to how it will address the different needs of women.
In 2004-05, the Ministry of Finance, GoI created an institutional mechanism for mainstreaming gender by mandating setting up of Gender Budgeting cells in all ministries/departments and prepare gender responsive budget. Ministry
8
of Finance, GoI issued a GB charter in March 2007 defining the roles and functions of Gender Budgeting cells which included identification of three to six largest programmes implemented by the ministry to conduct an analysis of gender issues addressed by them, suggesting policy interventions, organising training/capacity building, conducting performance audits, designating best practices etc.
The Ministry of Finance made it mandatory that gender outcomes form part of the outcome budget of the respective Departments/Ministries. The gender budgeting scheme of the Government encourages State Government and PRIs to evolve plans and strategies for undertaking gender budgeting by providing financial support, training etc.
The Government of Uttar Pradesh (GoUP) declared State Women Policy in 2006 for empowerment of women in which the principle of gender based budgeting was accepted for introduction from the year 2005-06. The main objective of gender budgeting was to make Government budget an effective medium for empowerment of Women in the State.
We in Audit observed (July 2015) that:
● Government of UP has not adopted the Gender Budgeting even after 10 years of declaration of the above policy in 2006 and was not maintaining gender based budget data/information about allocation and expenditure as of March 2015.
● GoUP has still not setup the necessary institutional mechanism viz., GB cells in various departments for formulation of gender based budget.
● Department of Finance has not prepared any time bound programme for implementation of gender budgeting in the State.
Due to non-implementation of gender based budgeting, gender perspective of budget allocation and expenditure in various Schemes covered under this performance audit could not be ascertained.
Failure of the State Government to implement such an important decision for women empowerment, even after 10 years of declaration of its commitments, is indicative of inadequate priority being accorded by the Government to issues related to women empowerment. In absence of GB, gender mainstreaming was not ensured in the State and gender differential impact of the budget could not be assessed.
Recommendation: The Government should take immediate steps to setup GB cells in all departments and implement gender based budgeting.
2.1.2 Gender segregated data for planning
For efficient planning of programmes related to women empowerment in sectors like health, nutrition, education, employment, skill development,
9
training, sanitation, social security, housing, law and order etc., gender segregated data must be systematically collected for proper need assessment and subsequent evaluation of government interventions through various schemes and programmes.
It was, however, noticed in the performance audit that gender segregated data was not maintained by implementing agencies and, therefore, proper identification of beneficiaries, accurate need assessment of financial and other support required, and setting realistic performance targets and goals was not feasible. For instance, in ICDS, GoI had directed maintenance of gender segregated data at Agan Wadi Centres’ level. However, no such data was maintained at Directorate level and, therefore, it was difficult to plan women centric activities to cater to the specific needs of women and adolescent girls. The Directorate did not have authentic data on nutritional and anaemic status of girls and women, which deprived the department from preparing comprehensive plans to cater to their specific needs and reduce prevalence of anaemia and other deficiencies as discussed in Paragraph 5.2.
Recommendation: Gender segregated data should be maintained by the implementing agencies at all levels for proper planning and efficient implementation of the schemes and ensuring that the specific needs of women and girl child are taken care of adequately to minimise gender gap/disparities.
2.1.3 Identification of beneficiaries and other issues related to planning
Non-conduct of base line surveys, lack of proper identification of beneficiaries, and non-fixation of targets/goals result in deficient planning in terms of inadequate coverage, improper focus and unrealistic/inaccurate commitment of resources. Improper identification of beneficiaries leads to coverage of ineligible beneficiaries and exclusion of genuine beneficiaries. We during performance audit of Kishori Shakti Yojna noticed that over aged girls were granted benefits in violation of scheme guidelines. Further, targets were also not fixed in Family Planning Programme for use of spacing methods.
Lack of proper assessment/survey may result in non-coverage of areas with high concentration of target groups, as was reported in Ujjawala scheme in which districts bordering Nepal had not been covered for setting-up of Ujjawala homes for trafficked women despite these districts being transit points for trafficking of women as per the report of United Nations Office on Drugs and Crime (UNODC). Specific issues relating to deficient planning have been discussed in the respective Chapters under the relevant schemes.
2.2 Financial Management
During the year 2010-15 an amount of ` 25,408.86 crore was allocated/ released by GoI/GoUP for the programmes/schemes/Acts1 covered under the 1PCPNDT, MTP, JSY, Family Planning, ICDS, KSY, Sabla, Ujjawala, Swadhar, ITP, IPC etc.

10
Performance Audit, against which an expenditure of ` 23,538.34 crore was incurred as detailed in table below:
Table 2.1: Details of Allotment/Expenditure under each Scheme (` in crore)
Sl. No.
Name of Scheme Allotment Expenditure Savings Percentage savings
1. PC-PNDT 7.09 3.86 3.23 46 2. MTP 40.58 4.50 36.08 89 3. JSY 2,380.11 2,196.56 183.55 08 4. MDR 7.22 1.70 5.52 76 5. Family Planning 380.57 194.67 185.90 49 6. a. SNP 14,677.88 14,307.20 370.68 03
b. ICDS-General 6,681.92 5,613.92 1,068.00 16 7. KSY 32.42 11.69 20.73 64 8. SABLA 1,190.34 1,196.50 0 0 9. Uttar Pradesh Victim
Compensation Scheme 2.00 0 2.00 100
10. Ujjawala 0.66 0.56 0.10 15 11. Swadhar Greh 8.07 7.18 0.89 11
Total 25,408.86 23,538.34 1,876.68 07 (Source: Data provided by concerned Departments)
It would be seen from the above table that in most of the schemes related to empowerment of women such as PC-PNDT, MTP, MDR, Family Planning, KSY and UPVCS, there were significant savings ranging from 46 to 100 per cent. The savings were mainly on account of poor implementation of the schemes resulting in non-achievement of targets. This indicated that despite allocation of funds, majority of the schemes related to health, nutrition, rehabilitation, training and providing financial support to women could not achieve their goal of reducing gender disparity due to lack of planning and inefficient execution by implementing agencies and ineffective monitoring by the governance structure. Specific audit findings relating to financial management and the implementation of the schemes are discussed in the relevant chapters.
Thus, GoUP has not adopted the Gender Budgeting after ten years of declaration of the above policy in 2006; Gender Budgeting cells were not setup in government departments for formulation of gender based budgeting; gender segregated data was not maintained by implementing agencies; proper identification of beneficiaries was not ensured in KSY which led to coverage of ineligible beneficiaries; appropriate assessment/survey was not conducted in Ujjawala Scheme which led to non-coverage of bordering areas with Nepal with high concentration of target groups. There were significant savings in most of the Schemes. As such, goal of reducing gender disparity envisaged under these Schemes could not be achieved.


11
Chapter 3: Missing Daughters
Introduction
Society‟s continued preference for boys and apathy for girl child has led to child sex ratio in the country dropping to 919 females per 1,000 males, one of the lowest since independence according to Census 2011. In Uttar Pradesh, the sex ratio1 in the State increased from 898 in 2001 to 908 in 2011 while child sex ratio (CSR) is far below the national average and has consistently declined from 927 females per 1,000 males in 1991 to 916 in 2001, 902 females per 1,000 males in 2011 and further deteriorated to 883 in 20152. CSR in the State had not improved even in three decades as depicted in chart 3.1 below.
Chart 3.1: Sex Ratio and Child Sex Ratio in India and Uttar Pradesh
(Source: Census Reports, Government of India)
3 Child Sex Ratio: Trend across the States
As per Programme Implementation Plan of National Health Mission, the child sex ratio was decreasing in the State as depicted in the chart 3.2 below:
Chart 3.2: Trend of Child Sex Ratio in UP vis-à-vis India and other States
(Source: Census and Health management Information System maintained by NHM)
1As per census 2001 and 2011. 2 As per Health Management Information System 2014-15.
927 933 943
879 898 908
800
850
900
950
1000
1991 2001 2011
In n
umbe
rs
Census years
Sex Ratio
India Uttar Pradesh
945 927 919
927 916 902
800
850
900
950
1000
1991 2001 2011
In n
umbe
rs
Census years
Child Sex Ratio
India Uttar Pradesh
927
916
960 973
919
902
959
970
915
883
958
931
860880900920940960980
1000
India Uttar Pradesh Kerala Meghalaya
Cen
sus
Inde
x
Census 2001 Census 2011 HMIS 2014-15
12
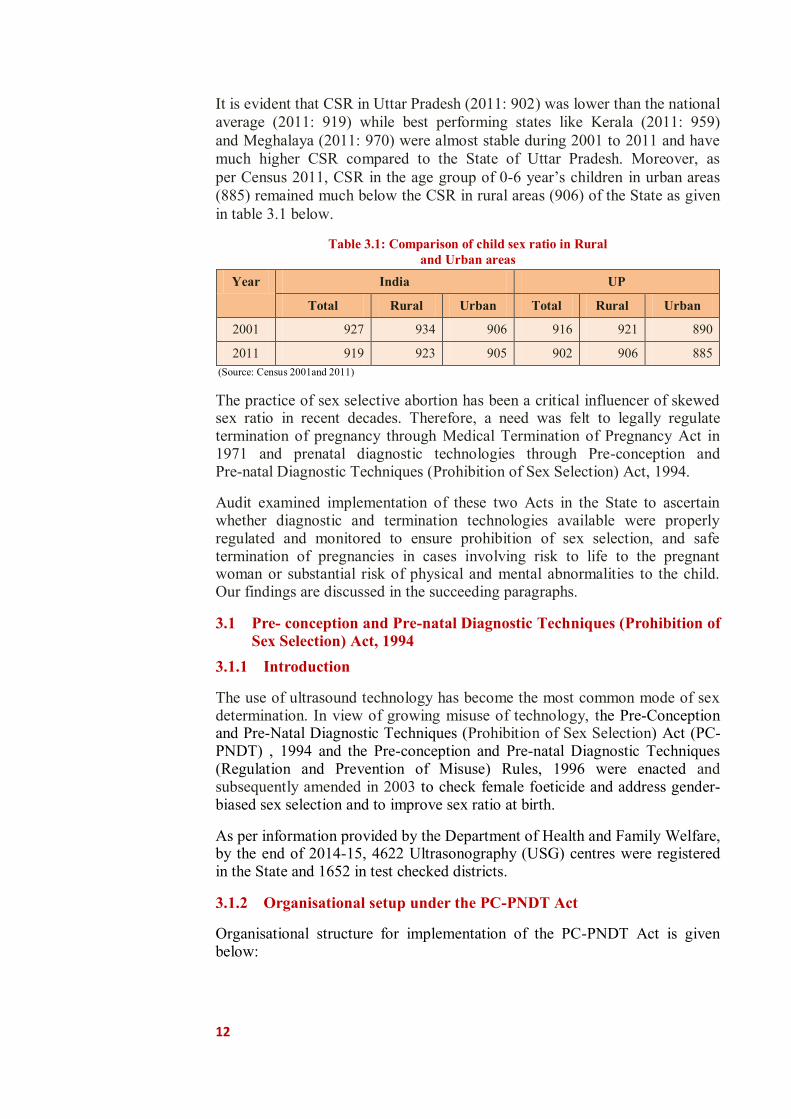
It is evident that CSR in Uttar Pradesh (2011: 902) was lower than the national average (2011: 919) while best performing states like Kerala (2011: 959) and Meghalaya (2011: 970) were almost stable during 2001 to 2011 and have much higher CSR compared to the State of Uttar Pradesh. Moreover, as per Census 2011, CSR in the age group of 0-6 year‟s children in urban areas (885) remained much below the CSR in rural areas (906) of the State as given in table 3.1 below.
Table 3.1: Comparison of child sex ratio in Rural and Urban areas
Year India UP
Total Rural Urban Total Rural Urban
2001 927 934 906 916 921 890
2011 919 923 905 902 906 885 (Source: Census 2001and 2011)
The practice of sex selective abortion has been a critical influencer of skewed sex ratio in recent decades. Therefore, a need was felt to legally regulate termination of pregnancy through Medical Termination of Pregnancy Act in 1971 and prenatal diagnostic technologies through Pre-conception and Pre-natal Diagnostic Techniques (Prohibition of Sex Selection) Act, 1994.
Audit examined implementation of these two Acts in the State to ascertain whether diagnostic and termination technologies available were properly regulated and monitored to ensure prohibition of sex selection, and safe termination of pregnancies in cases involving risk to life to the pregnant woman or substantial risk of physical and mental abnormalities to the child. Our findings are discussed in the succeeding paragraphs.
3.1 Pre- conception and Pre-natal Diagnostic Techniques (Prohibition of Sex Selection) Act, 1994
3.1.1 Introduction
The use of ultrasound technology has become the most common mode of sex determination. In view of growing misuse of technology, the Pre-Conception and Pre-Natal Diagnostic Techniques (Prohibition of Sex Selection) Act (PC-PNDT) , 1994 and the Pre-conception and Pre-natal Diagnostic Techniques (Regulation and Prevention of Misuse) Rules, 1996 were enacted and subsequently amended in 2003 to check female foeticide and address gender-biased sex selection and to improve sex ratio at birth.
As per information provided by the Department of Health and Family Welfare, by the end of 2014-15, 4622 Ultrasonography (USG) centres were registered in the State and 1652 in test checked districts.
3.1.2 Organisational setup under the PC-PNDT Act
Organisational structure for implementation of the PC-PNDT Act is given below:
13
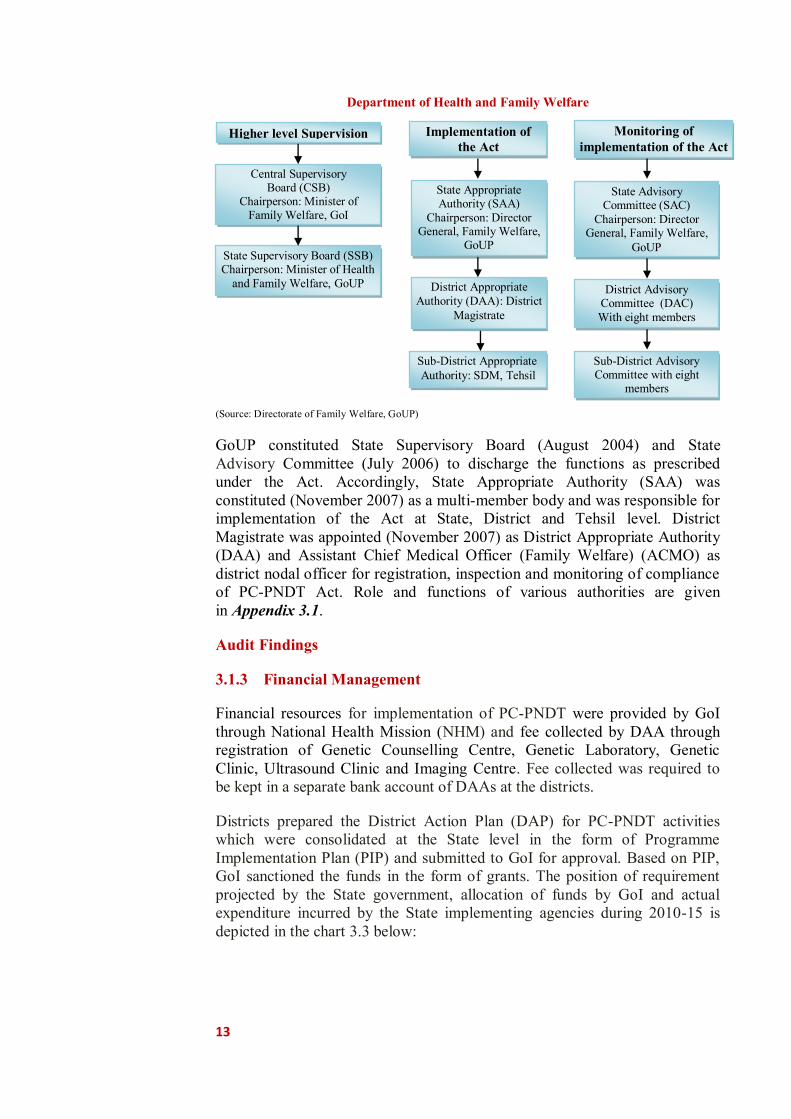
Department of Health and Family Welfare
(Source: Directorate of Family Welfare, GoUP)
GoUP constituted State Supervisory Board (August 2004) and State Advisory Committee (July 2006) to discharge the functions as prescribed under the Act. Accordingly, State Appropriate Authority (SAA) was constituted (November 2007) as a multi-member body and was responsible for implementation of the Act at State, District and Tehsil level. District Magistrate was appointed (November 2007) as District Appropriate Authority (DAA) and Assistant Chief Medical Officer (Family Welfare) (ACMO) as district nodal officer for registration, inspection and monitoring of compliance of PC-PNDT Act. Role and functions of various authorities are given in Appendix 3.1.
Audit Findings
3.1.3 Financial Management
Financial resources for implementation of PC-PNDT were provided by GoI through National Health Mission (NHM) and fee collected by DAA through registration of Genetic Counselling Centre, Genetic Laboratory, Genetic Clinic, Ultrasound Clinic and Imaging Centre. Fee collected was required to be kept in a separate bank account of DAAs at the districts.
Districts prepared the District Action Plan (DAP) for PC-PNDT activities which were consolidated at the State level in the form of Programme Implementation Plan (PIP) and submitted to GoI for approval. Based on PIP, GoI sanctioned the funds in the form of grants. The position of requirement projected by the State government, allocation of funds by GoI and actual expenditure incurred by the State implementing agencies during 2010-15 is depicted in the chart 3.3 below:
Higher level Supervision Implementation of the Act
Monitoring of implementation of the Act
Central Supervisory Board (CSB)
Chairperson: Minister of Family Welfare, GoI
State Supervisory Board (SSB) Chairperson: Minister of Health
and Family Welfare, GoUP
State Appropriate Authority (SAA)
Chairperson: Director General, Family Welfare,
GoUP
District Appropriate Authority (DAA): District
Magistrate
Sub-District Appropriate Authority: SDM, Tehsil
State Advisory Committee (SAC)
Chairperson: Director General, Family Welfare,
GoUP
District Advisory Committee (DAC) With eight members
Sub-District Advisory Committee with eight
members

14
Chart 3.3: Funding of PC-PNDT under NHM
(Source: Census and HMIS: Health management Information System maintained by NHM)
We in audit observed that:
● Only 54 per cent (` 3.86 crore) of the total allocation of ` 7.09 crore during 2010-14 was utilized by the State government for the implementation of PC-PNDT Act (Appendix 3.2). Details of expenditure incurred on various PC-PNDT activities are given in Appendix 3.3.
● Failure to utilize funds led to allocation of ` 7.09 crore only (35 per cent) of the funds by GoI as against the projected requirement of ` 20.26 crore during 2010-143.
As regards utilisation of revenue generated from fee etc., scrutiny of records of the 20 test-checked districts revealed that utilization of funds collected through registration/renewal fee, penalties charged by DAA from diagnostic centres was negligible as indicated in Appendix 3.4.
Audit observed that ` 1.93 crore, received by DAAs in form of fee, penalties etc., which was to be spent on monitoring, IEC, etc. activities was kept in the savings bank accounts resulting in accumulation of funds in DAAs accounts from` 18.09 lakh in 2010-11 to ` 207.64 lakh at the end of 2014-15.
Thus, meagre allocation of funds, failure of the State and district implementing agencies to utilise grants received from GoI and fee collected from diagnostic centres indicated poor implementation of the Act in the State thereby leaving diagnostic centres largely unregulated and unmonitored, defeating the very purpose of the PC-PNDT Act viz., enforcing prohibition of sex determination etc. as discussed below:
3 Separate figures for this component for 2014-15 was not made available to audit.
202.
13
205.
55
244.
1
1373
.92
180.
16
47.3
5 222.
65
258.
58
84.9
6
51.8
3
125.
83
123.
49
0
200
400
600
800
1000
1200
1400
1600
2010-11 2011-12 2012-13 2013-14
` in
lakh
Proposed Allotment Expenditure

15
3.1.4 Implementation
Chapter III section 18(1) of PC-PNDT Act envisaged that no Genetic Counselling Centre, Genetic Laboratory or Genetic Clinic would function without being registered under the Act. As of March 2015, 4,622 Ultrasound/ Genetic Clinics were registered with District Appropriate Authorities (District Magistrates) in the State including 1,652 in the test-checked districts. The number of unregistered USG centres operating unauthorisedly or due to delay in approval of registration by the competent authority was not known. Audit noticed cases of serious violation of PC-PNDT Act including non-renewal of registration, non-maintenance of patients‟ details and diagnostic records, absence of regular inspection of USG centres by DAA, lack of mapping and regulation of USG equipment, absence of tracking system in USG machines, non-imposition of penalties, etc., as discussed in succeeding paragraphs:
3.1.4.1 Operation of Ultrasound Clinics without renewal of registration
Every certificate of registration shall be valid for a period of five years since its issue and application for renewal of registration should be made 30 days before the expiry of the certificate of registration along with the prescribed fee.
If the Appropriate Authority fails to renew the certificate of registration within 90 days of its receiving the application for renewal, it will amount to automatic renewal or deemed renewal. Further, SSB in its meetings (2008 and 2014) directed all the DAAs to ensure registration of all the USG centres functional in the State and take appropriate action against the centres operating without proper registration.
Audit, however, noticed in test-checked districts that pendency in renewal of registration of 138 centres ranged between 26 and 1490 days while registration of 32 centres had not been done in due time (Appendix 3.5). The department was also not ensuring timely submission of application for renewal of registration by USG centres and taking action against the defaulters as Format H containing the details about USG centre such as date of receipt of application, Name, address of applicant, details of machine installed, recommendation of DAC, registration number allotted, date of renewal and renewed upto etc. are mentioned was not being maintained by DAAs. Thus, these centres functioned as deemed to have been registered during the intervening period.
In reply the district authorities accepted the fact and ensured compliances in future.
Recommendation: The Department should ensure timely renewal of registration to avoid functioning of centres as „deemed registered‟.
16
3.1.4.2 Violation of provisions of PC-PNDT Act by Ultra-sound centres
PC-PNDT Act and Rule made thereunder makes it mandatory for every genetic counselling centre, genetic laboratory, clinic, ultrasound clinic and imaging centre to maintain and preserve complete records of each case including details of the patient, details of doctor referring the pregnant women for ultrasonography, laboratory test results/pictures/plates/slides and recommendations. Further USG centres were to intimate any change in its employees, place, address and installed equipment to DAA within thirty days. The main aim of maintenance and preservation of these details and records is to facilitate proper inspection and monitoring by the authorities to ensure that pre-natal diagnostic investigation had been carried out only on the recommendation of a qualified doctor on valid grounds and was not intended to be used for irregular sex determination and termination of pregnancy.
In order to ascertain whether USG centres were adhering the provisions of PC-PNDT Act/ Rules, joint physical inspections (JPIs) of 100 USG centres in test-checked districts were conducted by audit teams along with the representative of DAAs and nodal officer PC-PNDT from the department in which 1,937 cases (Form „F‟) were test checked. Violations and shortcomings noticed during JPI of the ultrasound centres (Appendix 3.6) are discussed below:
● 1,326 cases (68 per cent) did not have referral slips of registered medical practitioner attached to them while details of procedure conducted and the purpose of such procedure were also not mentioned in 1,110 cases (57 per cent).
● Basic details of patient, such as number of living children, phone number, address etc., to track records of pregnancy, were not filled in 961 cases (50 per cent).
● According to section 29 of PC-PNDT Act, USG centres were to preserve Form F, referral slips of doctors, forms of consent and sonographic plates or slides for not less than two years. However, it was observed in all the test-checked USG centres (100 per cent) that they did not keep backups/ records of images taken during ultrasonography for the prescribed period.
● As per rule 13 of PC-PNDT Rules, USG centres were to intimate any change in its employees, place, address and installed equipment to DAA within thirty days. It was observed that two USG centres in Agra were having two machines against only one registered without any intimation to DAA. Further, change of staff was not intimated to DAA by one centre while two centres did not intimate shifting of USG machine to other place.
● Two USG centres in Agra were not maintaining any records, registers etc. on this being pointed out by Audit, the management stated that the centre was closed and the registration was surrendered but this was neither confirmed by CMO nor any documentary proof was produced by the management though called for (May,2015) from the centre visited.
17
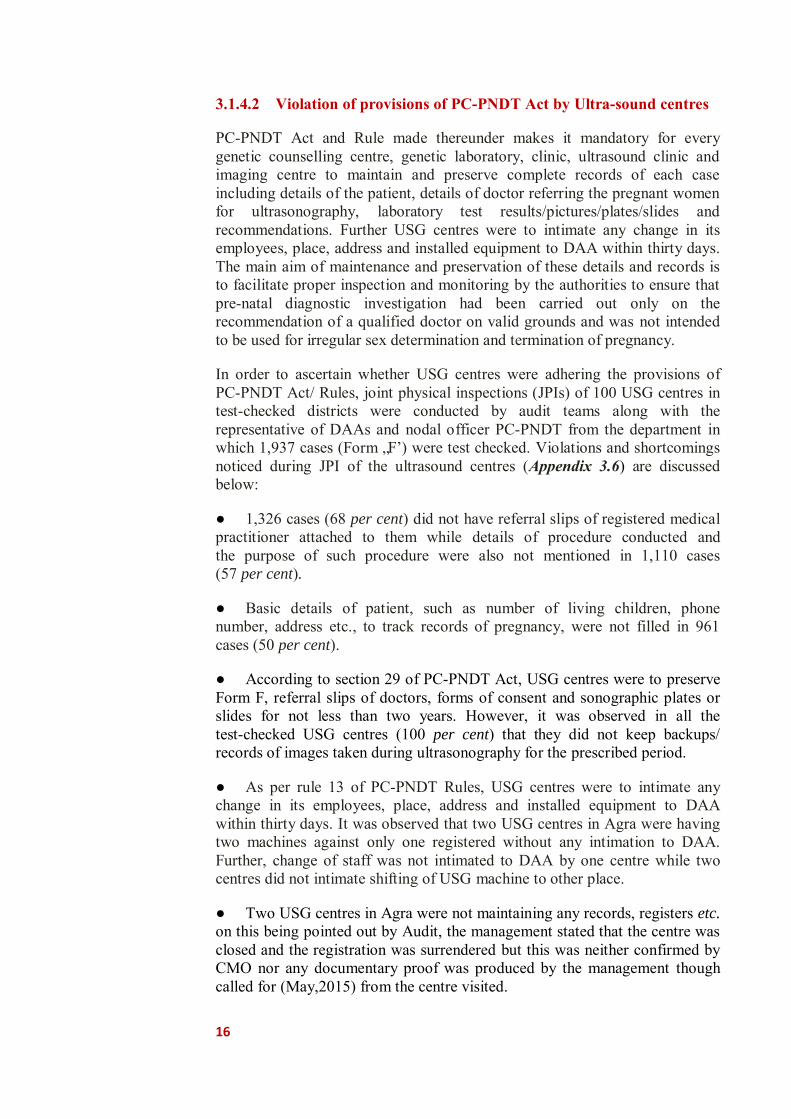
Thus, JPI noticed large scale blatant violations of the provisions of the Act by USG centres. Non-maintenance of patient details, performing ultrasonography on pregnant women without recommendation of a doctor, not indicating the purpose of carrying out such diagnostic test and not preserving results of diagnostic test/ ultrasonography by large number of USG centres not
only indicated possible misuse of facilities by these centres for illegal sex determination but also highlighted complete failure of the concerned authorities to effectively monitor and regulate their activities.
3.1.4.3 Non-maintenance of records at DAA
(i) Information of USG centres: As per rule 9 of the PC-PNDT Rules,1996, the District Appropriate Authority was to maintain a permanent record in Form H in which details about USG centre such as date of receipt of application, name, address of applicant, details of machine installed, recommendation of District Advisory Committee, registration number allotted, date of renewal and renewed upto etc., are mentioned about applicants for grant or renewal of certificate of registration along with basic details of centres. Maintenance of this information by DAA is essential to facilitate inspection and monitoring of the centres to verify and ensure that no unauthorised practices are being carried out by USG centres.
Scrutiny revealed that in 13 out of 20 test-checked districts, details of USG centres have not been maintained by DAA. In the absence of such information, DAA were not able to effectively monitor USG centres and ensure that no unauthorised activities were undertaken by USG centres.
In reply department assured that it had taken the matter in consideration for appropriate action.
(ii) Non-receipt of monthly reports from USG centres: Section 29 of the PC-PNDT Act and Rule 9 of PC-PNDT Rules, 1996 envisaged that every USG Centres was to maintain a register showing details of patients, procedures and tests conducted etc., along with details about patient‟s case history in prescribed formats (Form D, Form E and Form F) and should send monthly report about the above details in respect of all diagnosis conducted by them by 5th of the following month to the concerned DAA.
We noticed during scrutiny of records of test-checked districts that:
Ultrasound machine sealed during JPI at Agra
18
● No monitoring register was maintained by DAA except in three districts4, to confirm that monthly reports had been received from USG centres; and
● 262 USG centres (16 per cent) in test-checked districts had not submitted their monthly reports regarding the above details of patient in due time (Appendix 3.7)
Thus, in the absence of proper maintenance of mandatory records and non-receipt of prescribed returns, no effective monitoring and inspection of all the USG centres in the district was possible. Hence, possibility of irregularities such as illegal operations of ultrasound machines could not be ruled out.
In reply, district authorities had assured for appropriate action.
Recommendation: The Department should ensure the proper maintenance/up keep of mandatory records at USG centres as well as at DAA level.
3.1.4.4 Absence of regular inspection of Ultrasonography centres by DAA
GoUP instructed (July 2013) DAA to inspect two USG centre per week. Further, as per Rule 18-A (8) (i) of PC-PNDT Amendment Rules, 2014, all the DAAs (District Magistrates) were to inspect and monitor all registered centres once in every 90 days and preserve inspection report as documentary evidence to ensure enforcement of the provisions of the Act by the USG centres.
Scrutiny of the records of the directorate revealed that no inspection schedule was prescribed by GoUP for the period between April 2010 and June 2013. Only 4681 inspections (25 per cent) were conducted by DAAs during 2014-15 against 18488 targeted in the State (Appendix 3.8) while only 1561 against required 6608 inspections5 were carried out by DAAs of test-checked districts during 2014-15 (Appendix 3.9). Thus, there was a shortfall of 76 per cent in inspections in the test checked districts.
Recommendation: The Government should ensure regular inspection of USG centres by District Appropriate Authorities.
3.1.4.5 Documentation of inspection report
As per rule 18-A (8) (ii), the District Appropriate Authorities had to conduct regular inspections of USG centres and place all inspection reports once in three months before District Advisory Committees for follow up action.
Scrutiny of records of test-checked districts revealed that as per information furnished by district authorities, 3532 inspections of 1652 USG centres were carried out by DAAs in the test-checked districts during 2010-15, but only 130 inspection reports (four per cent) were issued to USG centres. The district authorities did not furnish information about placement of inspection reports before DACs.
4 Agra, Bareilly and Saharanpur. 5 4x1652 centres.

19
Non-issue of inspection reports to USG centres for compliance after inspection and non-placement before DACs defeats the purpose of carrying out the inspection and indicates the lackadaisical attitude of the authorities towards implementation of PC-PNDT Act.
In reply department had taken the matter in consideration for appropriate action.
3.1.4.6 Mapping and regulation of Ultrasound equipment
As per Rule 18-A (7) of PC-PNDT Amendment Rules, 2014, all the Appropriate Authorities were required to regulate the use of ultrasound equipment; monitor the sales and import of USG machines; ensue regular quarterly reports from ultrasound manufacturers and dealers; conduct periodical survey and audit of all USG machines sold and operating in the State; and file complaint against any unregistered owner or seller of the USG machine.
Scrutiny of records of test checked districts revealed that the department did not take any action for mapping of sale of USG equipment and also did not call for any information regarding sale, installation and possession of USG equipment from the manufacturers, suppliers, dealers, etc., due to which number of USG equipment installed and the location of their placement were not known to the authorities to regulate the use of all the ultrasound machines.
In reply department stated that information is not available in this regard.
Thus, in absence of information on placement and possession of USG machines the possibility of misuse of ultrasound machines could not be ruled out.
Recommendation: The Government should effectively monitor the sale, supply and installation of USG machines to regulate and ensure their proper use as per PC-PNDT Act..
3.1.4.7 Absence of tracking system in USG machines installed at USG centres
The State Supervisory Board in its meeting (October 2012) discussed some aspect relating to implementation of PC-PNDT Act in the other States6 and concluded that Active tracker be installed at USG equipment to report every diagnostic procedure conducted at USG centres. It was expected to help in reporting online and tracking suspicious scans.
JPI revealed that USG centres‟ machines did not have memory to save data for more than 24 hours. In absence of online tracking of USGs and lack of memory of the existing USG equipment beyond 24 hours, no effective tracking of USGs centres was being conducted in the State.
Thus, in absence of tracking system and online reporting, the misuse of USG equipment during check-up of pregnancies could not be ruled out.
6 Maharashtra and Rajasthan.
20
Recommendation: The Department should ensure inbuilt system of active tracking of data in USG machines to prevent misuse during checkup of pregnancies.
3.1.4.8 Training of medical practitioners conducting Ultrasonography
According to PC-PNDT (Prohibition of Sex Selection) (Six Months Training) Rules, 2014, the existing registered medical practitioners who were conducting ultrasound procedure on the basis of one year experience or six months training under any radiologist were required to qualify competency based examination or to complete six months training from the accredited institutions for the purpose of renewal of registrations.
Scrutiny revealed that GoUP neither notified any institute as accredited for imparting training nor conducted any examination in this regard. As such, 28 registered medical practitioners in the two out of 20 test-checked districts were conducting ultrasound on the basis of one year experience or six month training without undergoing the said competency examination or six months training under the rules.
No specific reply was furnished by department to address the issue raised by audit.
3.1.4.9 Seized USG machines found missing
As per Rule 11(2) of PC-PNDT Rules, the seized objects, if it is not possible to remove, may be retained where they are found after taking a bond from the owner that the same would be produced before the court as and when required.
Scrutiny revealed that 120 USG machines had been sealed for breach of the provisions of PC-PNDT Act, 1994 in the State by the end of March, 2015 but the whereabouts of these machines were not known to the department. During Joint Physical Inspection(JPI) conducted by Audit, one sealed machine was found to have been sold in Bulandshahr district and in two other machines at Agra were found to have been removed from the centres, without any intimation to the department. Thus, failure of the department in monitoring and tracking the sealed ultrasound machines may result in misuse of such machines for illegal and unauthorised purposes.
In reply, district authorities had assured for appropriate action.
Recommendation: The Department should ensure effective tracking of seized machines to avoid unauthorised use of these machines.
3.1.4.10 Decoy Customer or Sting operation
State Supervisory Board recommended (June 2008) to send decoy cases to USG centres and to conduct sting operations at large scale in order to identify USG centres involved in sex determination for petty payments. Audit noticed that only 52 decoy operations7 were undertaken in 52 USG centres (one per cent) of 4,622 registered centres during 2010-15 in the State while
7 Decoy used - 2010-11: 0 ; 2011-12: 0; 2012-13: 0 ; 2013-14: 29 and 2014-15: 23.

21
19 decoy operations had been done in the test checked districts during 2013-15. Thus, a negligible number of decoy operations were carried out to monitor that the centres were not engaged in illegal activities of sex determination.
Thus, the department was failed in conducting the decoy operation on large scale so that centres engaged in illegal activities of sex determination may be detected. In absence of sting operations actions were not taken against defaulters conducting sex determination.
3.1.4.11 Non-imposition of penalty
Section 20 of PC-PNDT Act envisages that in case of a breach of the provisions of this Act or the Rules by USG centres, DAA may suspend their registration for such period as it may think fit or cancel their registration. Further, as per Section 23 of the Act, whoever contravenes any of the provisions of this Act or any Rules made thereunder, shall be punishable with imprisonment upto three years or fine upto ten thousand rupees and as per Section 25 whoever contravenes any of the provisions of this Act or any rules made thereunder, for which no penalty has been provided in this Act, shall be punishable with imprisonment upto three months or fine upto one thousand rupees.
Further, as per the provisions of Rule 9, every USG centre should maintain a register showing the names and addresses of the women subject to pre-natal diagnostic procedure/ technique/ test along with the names of their spouse or father, the date on which they first reported etc. in seriatim. The details in Form „F‟ with respect to each woman subject to pre-natal diagnostic procedure/ technique/test, history of genetic/ medical disease and indication of pre-natal diagnosis etc., was also required to be maintained by USG Centres.
Scrutiny of records of test checked districts revealed that the above said records were not maintained by USG centres in 936 (58 per cent) out of 1,652 USG centres (Appendix 3.7) registered in test-checked districts. However, neither any action was taken nor any penalty imposed (under sections 20, 23 and 25 of the Act) on the defaulting USG centres during 2010-15 except issuing show cause notices (under section 20 of the Act) to 221 centres out of 936 centres at default. The notices issued were however, not being followed to ensure compliance.
Failure to take action against any defaulting USG centre and impose penalties despite serious violation of provisions of PC-PNDT Act by such a large number of centres, indicates lax attitude adopted by the district administration with regard to the implementation of PC-PNDT Act. Lack of any deterrent action will encourage defaulting USG centres to commit more violations thereby defeating the very purpose for which the PC-PNDT Act was enacted.
Recommendation: The Department should ensure adherence to the provision of the Act by USG centres and penal action should be taken against the defaulting centres.
22
3.1.5 Monitoring and Inspections
A State Supervisory Board (SSB) was to be constituted under the Chairmanship of the Hon‟ble Minister-in-charge of Health and Family Welfare to review the activities of Appropriate Authorities; to monitor the implementation of provisions of the Act and Rules; and to make suitable recommendations. Likewise State Advisory Committee (SAC) headed by Director General Family Welfare, Uttar Pradesh and District Advisory Committee (DAC) under District Magistrate were to be constituted to aid and advise the Appropriate Authority in granting, renewing, suspending or cancelling registration of USG centres in the district.
3.1.5.1 State Level Monitoring
A State Supervisory Board (SSB) was constituted in August 2004. SSB was to meet at least once in four months to create public awareness; to review the activities of the Appropriate Authorities functioning in the State and recommend appropriate action against them; to monitor the implementation of provisions of the Act and the Rules and any other functions as may be prescribed under the Act.
Scrutiny revealed that only five meetings (33 per cent) had been held against required 15 meetings during 2010-15. It was also noticed that most of the recommendations that analysis of Form F (patient details, purpose of investigation etc.), regular inspections, tracking of pregnancies, providing toll free lines for registration of complaints, online filing of Form F, analysis of monthly reports received from USG centres, centres breaching provisions of Act to be sealed and legal action initiated etc., made by SSB were not implemented (Appendix 3.10).
In reply, department had taken the matter in consideration for appropriate action.
3.1.5.2 Advisory Committees
State Advisory Committee (SAC) headed by Director General Family Welfare, Uttar Pradesh and District Advisory Committee (DAC) under District Magistrate were constituted in July 2006. SAC and DAC were to meet once in 60 days.
Scrutiny revealed that SAC met only five times against the required 30 meetings during 2010-15. Scrutiny further revealed that only 943 DAC level meetings (42 per cent) were conducted in the State, during 2010-15, against the required 2250 meetings. Thus, on an average only two to three meetings of DAC were held in each district every year against the requirement of six meetings. DACs in Ambedkar Nagar, Firozabad, Gorakhpur, Hardoi, Jhansi, Sant Kabir Nagar and Sitapur were not meeting regularly and very few meetings (five to seven meetings) were held during 2010-15.
Scrutiny of records of test-checked districts revealed that five to 23 meetings against required 30 meeting were held during 2010-15 (Appendix 3.11). It was also observed that most of the decisions/recommendations of DACs such as collecting reports from the centres on total number of ultrasound performed
23
during the month, noting patient‟s name and phone numbers on Form F and D and compiling the information at district level, enquiring about the delivery (boy/girl) six months after the scan, conducting more inspections in rural areas, clearing pending renewals within one month etc., were either not followed or discontinued.
Thus, on one hand SSB, SAC and DACs did not meet regularly and on the other, they did not ensure proper follow up action on the decisions taken and directions given by them. This rendered the entire system of monitoring, created under the provisions of the PC-PNDT Act, ineffective and largely dysfunctional.
Recommendation: The Government should ensure regular meetings of SAC and DAC for monitoring the proper implementation of the provisions of Act.
3.1.5.3 Insufficient inspections
GoUP in February 2009 constituted a State Inspection and Monitoring Committee (SIMC) headed by Joint Director Family Welfare under the provisions of PC-PNDT Act, 1994 to undertake field visits and conduct monitoring and inspections of USG centres for effective implementation of PC-PNDT Act.
Scrutiny revealed that budgetary provisions of ` 7.30 lakh8 were made during 2010-15 through NHM to conduct 53 random inspections9 in worst districts of the State in term of sex ratio, against which only 17 inspections10 were carried out. Thus, on an average only zero to nine inspections were carried out every year by SIMC in the State having 75 districts and 4,622 registered USG centres.
Thus, State Inspection and Monitoring Committee did not conduct adequate inspections of USG centres and failed to discharge their responsibility to monitor and ensure the proper implementation of PC-PNDT Act.
Recommendation: The Government should ensure regular inspection by SIMC for enforcement of the provisions of the Act.
3.1.6 Complaint redressal system
As per Section 17 of the Act, SAA was to investigate complaint for breach of provisions of the Act or Rules and take immediate action based on the recommendation of SAC. Further, SSB in its meeting of October 2012 had directed the department to establish a website and provide a dedicated toll free phone number for registering complaints. The toll free phone number was to be displayed at prominent places and printed on pamphlets/forms for distribution under IEC activities.
It was observed in audit that the department had not established dedicated toll free phone line as of October 2015 for registration of complaints nor department had any database of complaints received for their proper disposal. 8 2010-11: ` one lakh; 2011-12: ` two lakh; 2012-13: ` 1.3 lakh; 2013-14: ` one lakh; and 2014-15: ` two lakh. 9 No. of inspections during the year 2010-11: 20; 2011-12:10; 2012-13: 13; 2013-14: 10; and 2014-15: not mentioned. 10 No. of inspections during the year: 2010-11: 02; 2011-12: Nil; 2012-13: 02; 2013-14: 09; and 2014-15:02.
24
On this being pointed out in audit, the department stated (June 2015) that no phone line was established for complaint registration but complaints can be registered through their website which was established in November, 2014. Further, complaints were received on different subjects at different levels in different offices so it had not maintained any database of year wise complaints received in respect of PC-PNDT Act. The reply was not acceptable as the registration of complaints through website only may not be sufficient to provide easy access to common public to register their grievances. As internet access to common public especially in rural areas is limited and tele-density is relatively much higher, a toll free phone number for registration of complaints, as directed by SSB, in addition to website should have been provided.
Recommendation: The Government should establish a dedicated toll free phone line for registration of complaints and should also effectively monitor redressal of grievances by maintaining a separate database of complaints received relating to violations of PC-PNDT Act.
3.2 The Medical Termination of Pregnancy Act, 1971
3.2.1 Introduction
The Medical Termination of Pregnancy Act, 1971 (MTP, Act), provides for the termination of pregnancies by registered medical practitioners in cases where length of pregnancy is between 12 to 20 weeks and continuance of pregnancy would involve a risk to life of the pregnant woman or of grave injury physical or mental health; or there is a substantial risk that if the child were born, it would suffer from such physical or mental abnormalities so as to be seriously handicapped. The Medical Termination of Pregnancy Rules, 2003 (MTP, Rules) have been framed for implementation of MTP Act. MTP Rules require constitution of District Level Committee (DLC) for two years to approve the place for MTPs in the district. Further, the Chief Medical Officer (CMO) of concerned District, as often as may be necessary, is to verify whether termination of pregnancies are being done under safe and hygienic conditions.
We have taken up this topic for examination during this performance audit as per Director General, Family Welfare, the number of maternal deaths in the State due to unsafe abortions was quite significant (8.9 per cent of the maternal deaths). Further, there is also a likelihood of misuse of MTP for termination of female fetus unless, such terminations are effectively monitored and regulated.
Audit Findings 3.2.2 Financial Management
Resources were provided by GoI for services to be covered under MTP Act through NHM under the head „safe abortion services‟ covering expenditure on procurement of equipment for MTP, strengthening of DLC and review of implementation of the Act, etc.
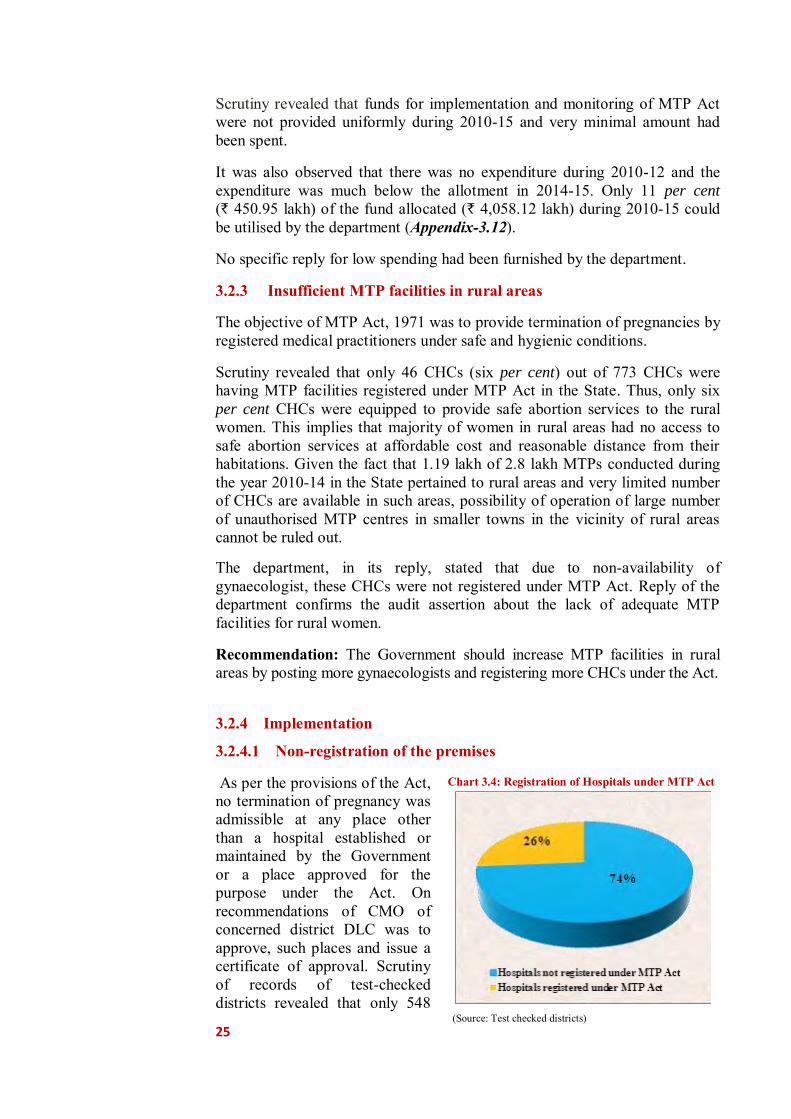
25
Scrutiny revealed that funds for implementation and monitoring of MTP Act were not provided uniformly during 2010-15 and very minimal amount had been spent.
It was also observed that there was no expenditure during 2010-12 and the expenditure was much below the allotment in 2014-15. Only 11 per cent (` 450.95 lakh) of the fund allocated (` 4,058.12 lakh) during 2010-15 could be utilised by the department (Appendix-3.12).
No specific reply for low spending had been furnished by the department.
3.2.3 Insufficient MTP facilities in rural areas
The objective of MTP Act, 1971 was to provide termination of pregnancies by registered medical practitioners under safe and hygienic conditions.
Scrutiny revealed that only 46 CHCs (six per cent) out of 773 CHCs were having MTP facilities registered under MTP Act in the State. Thus, only six per cent CHCs were equipped to provide safe abortion services to the rural women. This implies that majority of women in rural areas had no access to safe abortion services at affordable cost and reasonable distance from their habitations. Given the fact that 1.19 lakh of 2.8 lakh MTPs conducted during the year 2010-14 in the State pertained to rural areas and very limited number of CHCs are available in such areas, possibility of operation of large number of unauthorised MTP centres in smaller towns in the vicinity of rural areas cannot be ruled out.
The department, in its reply, stated that due to non-availability of gynaecologist, these CHCs were not registered under MTP Act. Reply of the department confirms the audit assertion about the lack of adequate MTP facilities for rural women.
Recommendation: The Government should increase MTP facilities in rural areas by posting more gynaecologists and registering more CHCs under the Act.
3.2.4 Implementation
3.2.4.1 Non-registration of the premises
As per the provisions of the Act, no termination of pregnancy was admissible at any place other than a hospital established or maintained by the Government or a place approved for the purpose under the Act. On recommendations of CMO of concerned district DLC was to approve, such places and issue a certificate of approval. Scrutiny of records of test-checked districts revealed that only 548
Chart 3.4: Registration of Hospitals under MTP Act
(Source: Test checked districts)
26
(26.3 per cent) of 2083 nursing homes/ hospitals, having MTP facilities and operating in test-checked districts, were registered under MTP Act as detailed in Appendix-3.13 and depicted in chart 3.4.
Further, Community Health Centres (CHCs)/Primary Health Centres (PHCs) particularly for rural services were not registered under MTP Act though 9493311 MTPs/abortions were conducted in the Government institutions (District Women Hospital, CHCs and PHCs) in the State during 2013-15 and 4015212 abortions in the Government institutions of test-checked district (Appendix-3.14). As such only 14 CHCs were registered under the MTP Act against 240 CHCs in the test checked districts. Moreover, safe and hygienic conditions were not ensured in 226 un-registered CHCs in test checked districts while it was observed that (1595) terminations had been carried out in seven out of 226 un-registered CHCs/PHCs during 2010-15. Therefore, the illegal, unsafe and unhygienic abortions could not be denied.
The department had taken the matter in cognizance and assured to take appropriate action.
3.2.4.2 Illegal termination of pregnancies
Accordingly to Section 3 of MTP Act, a pregnancy may be terminated by a registered medical practitioner where length of pregnancy does not exceed twelve weeks. It also prescribes that pregnancy of 12 to 20 weeks may be terminated, if not less than two registered medical practitioners were of the opinion that continuance of the pregnancy would involve a risk to life of the pregnant woman; or would result in fetus abnormality; or pregnancy was due to rape or contraceptive failure.
Audit scrutiny of records of test checked districts revealed that four pregnancies from 13 weeks to six months had been terminated in a hospital at Hardoi by medical practitioner who was granted permission for termination of pregnancy up to 12 weeks only, but the department even did not scrutinise the case reported through Form-I.
The district authority while acknowledging the fact, assured to take appropriate action.
3.2.5 Monitoring
The MTP Rules, 2003 had provided rules for composition and tenure of District Level Committee, Conditions for approval of the place for MTP, Inspection of place, cancellation or suspension of certificate etc. We in audit observed that:
3.2.5.1 District Level Committee (DLC)
A multi member committee was to be constituted at district level, consisting of one member as Gynaecologist/ Surgeon/ Anaesthetist and other members from local medical profession, non-government organisation and Panchayati Raj
11 As per HIMS Report during 2013-14: 49130 and 2014-15: 45803. 12 2013-14: 20651; 2014-15: 19501.
27
Institutions of the district. Provided that one of the members of the committee shall be a woman. Tenure of the Committee shall be for two calendar years. The Committee was to approve place for termination of pregnancy and issue a certificate of approval on the recommendations of Chief Medical Officer.
Scrutiny revealed that DLCs in 14 out 20 test-checked districts had become invalid as tenure of the committee had expired and not renewed during 2010-15. It was also observed that DLCs meetings were not held regularly (only 41 against the required 1200 meetings) in 20 test-checked districts, defeating the objective of constitution of the committee (Appendix 3.15).
The district authorities while acknowledging the fact, assured for constitution of DLC in timely manner and its regular meetings.
3.2.5.2 Inspections for death/injury and hygiene/safety
DLC on recommendation of CMO13 could cancel registration of place of MTP.CMOs have power of inspection and seizure14 of the place of MTP in case of death/injury to pregnant women and lack of hygiene/safety.
Scrutiny revealed that no inspections were carried out by CMOs of test-checked districts to ensure that no death/injury to a pregnant woman had happened. Similarly, no inspection to ensure safe and hygienic conditions for MTPs had been carried out during 2010-15 in any of test-checked districts by the authorities.
Audit examination disclosed that as per records of directorate, the instances of death/injury to pregnant women were nil during 2013-15, however, HMIS reported two cases of death in the State due to unsafe abortions during 2013-14 and nil instances of death / injury to pregnant women during 2014-15.
This indicated that CMOs and DLCs completely failed in discharging their responsibility under the Act to inspect hospitals and nursing homes to verify safe and hygienic conditions and ensure that there was no death/injury to any pregnant woman due to negligence in termination of pregnancy.
The district authorities had noted audit observation for compliance in future.
3.2.5.3 Submission of irregular monthly reports
As per, Para 4(5) of MTP Regulations, head of the hospital or owner of the approved place was to submit a monthly statement of cases to CMOs of concerned district where medical termination of pregnancy had been carried out. However, audit observed that CMOs of 10 out of 20 test-checked districts did not receive monthly report on MTP while out of remaining 10 districts, CMOs of seven districts had received MTP reports irregularly and in incomplete format (Appendix 3.13). Other three districts did not furnish any information.
Further, as per paragraph 4 (7) of MTP Regulations, where pregnancy was not terminated in an approved place or hospital, intimation by the registered 13 Rule 6 of MTP Rules. 14 Rule 6 (2) of MTP Rules.

28
medical practitioner or practitioners by whom such termination of pregnancy was performed was required to be sent to the CMO of the district on the same day or on the next working day following the day on which the pregnancy was terminated.
Audit scrutiny revealed that no enforcement mechanism was developed by district authorities to ensure reporting under this provision.
Thus, due to lack of inspections and monitoring, the department failed to recognize unregistered centres conducting MTPs and number of MTPs cases shown by the department was un-realistic as the department did not ensure reporting from unregistered hospitals.
The district authorities had noted audit observation for compliance in future.
Recommendation: The Government should ensure regular meetings of DLC and required inspection by CMOs, for effective monitoring of the provisions of the Act.
3.2.5.4 Operation of unauthorised MTP in private clinics
As per Directorate, Family Welfare only 25 per cent of MTPs, which were conducted at Government hospitals, were reported and remaining 75 per cent MTPs were conducted at private clinics, most of which were unregistered. Information on MTP conducted in private clinics was not received in view of most of these clinics being unregistered and, therefore, it was not known as to whether these private clinics were complying with the prescribed safety and hygiene norms and standards or otherwise.
Audit observed that as per Health Management Information System (HMIS)15 2013-15 database, the total MTPs reported were 94,93316 in the State, out of which 88 per cent (83,541 cases) were in government institutions and 12 per cent (11,392 cases) MTPs were in private institutions. Since HMIS captured data only in respect of registered MTP centres as explained above, the department did not have any information on the total number of MTPs in the State including those conducted in unauthorised clinics. Despite operation of large number of unauthorised MTP clinics (as informed by the Directorate, Family Welfare), the CMOs did not conduct inspections and enforce provisions of MTP Act with regard to taking action against the unregistered/unauthorised private clinics carrying out MTPs in unsafe and unhygienic conditions so as to compel them either to register under MTP Act or to discontinue their unauthorised activities.
Thus, due to poor implementation of MTP Act, 1971 the objectives of the Act “to provide for the termination of certain pregnancies by registered medical practitioner and for matters connected therewith or incidental thereto” could not be fulfilled and prescribed safety and hygiene norms and standards for safe abortion services had not been ensured.
15 HMIS is a digital initiative under National Health Mission by Ministry of Health and Family Welfare, GoI for
compilation of information regarding the health indicators of India. The information sources are National Family Health Survey, Census, Sample Registrations System (SRS) and performance statistics at various levels.
16 2013-14: 49130; 2014-15: 45803.

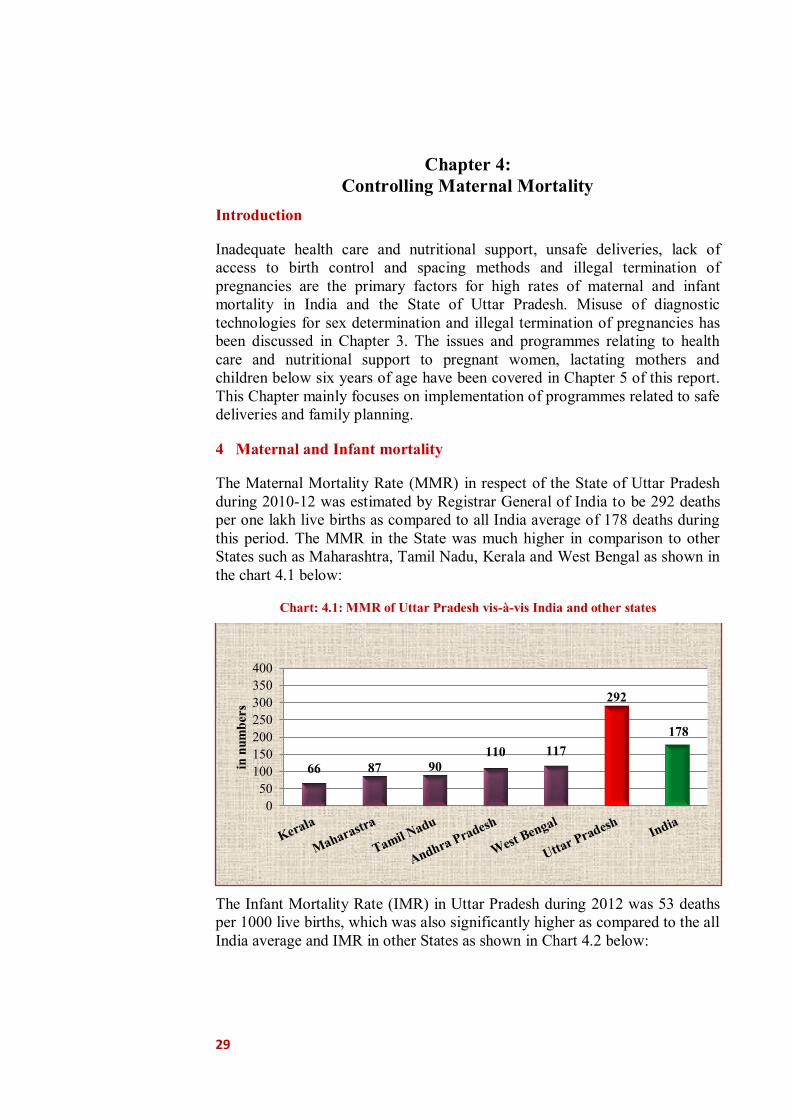
29
Chapter 4: Controlling Maternal Mortality
Introduction
Inadequate health care and nutritional support, unsafe deliveries, lack of access to birth control and spacing methods and illegal termination of pregnancies are the primary factors for high rates of maternal and infant mortality in India and the State of Uttar Pradesh. Misuse of diagnostic technologies for sex determination and illegal termination of pregnancies has been discussed in Chapter 3. The issues and programmes relating to health care and nutritional support to pregnant women, lactating mothers and children below six years of age have been covered in Chapter 5 of this report. This Chapter mainly focuses on implementation of programmes related to safe deliveries and family planning.
4 Maternal and Infant mortality
The Maternal Mortality Rate (MMR) in respect of the State of Uttar Pradesh during 2010-12 was estimated by Registrar General of India to be 292 deaths per one lakh live births as compared to all India average of 178 deaths during this period. The MMR in the State was much higher in comparison to other States such as Maharashtra, Tamil Nadu, Kerala and West Bengal as shown in the chart 4.1 below:
Chart: 4.1: MMR of Uttar Pradesh vis-à-vis India and other states
The Infant Mortality Rate (IMR) in Uttar Pradesh during 2012 was 53 deaths per 1000 live births, which was also significantly higher as compared to the all India average and IMR in other States as shown in Chart 4.2 below:
66 87 90 110 117
292
178
050
100150200250300350400
in n
umbe
rs

30
Chart: 4.2: IMR of Uttar Pradesh vis-à-vis India and other states
The female IMR in 2012 in the State was 55 deaths per thousand live births as compared to all India average of only 44 deaths. Uttar Pradesh was among the States having the highest female IMR in the country (57 deaths in Assam, 59 in Madhya Pradesh, 54 in Orissa and 51 in Rajasthan). Many other states have much lower female IMR such as 13 deaths per 1000 live births in Kerala, 26 in Maharashtra, 22 in Tamil Nadu, 26 in Delhi and 29 in Punjab.
As per the UN Millennium Development Goals (MDG) for improvement in maternal health, the MMR has to be brought down to 109 deaths per one lakh live births by 2015. Hence, MMR in the State is more than double the target of MDG 2015. National Health Mission (NHM) aims to bring down the MMR to 200 deaths per lakh live births upto 2017. Given the high rate of MMR in India and in the State of Uttar Pradesh, the NHM target appears to be quite inadequate to achieve the targets of MDG 2015.
The MDG target for IMR was 28 deaths per 1000 live births by 2015. Both IMR and female IMR in the State are almost two times higher than the MDG 2015 targets.
Therefore, high incidence of maternal under nourishment, low incidence of institutional deliveries and high prevalence of unsupervised home deliveries, high maternal mortality rate, non-adoption of appropriate family planning methods and prevalence of low weight children and under-nourishment of girls over boys are some of the most important issues that need to be given due attention by the Government. For this purpose, we have reviewed implementation of Janani Suraksha Yojana (JSY), Maternal Death Review
(MDR) and Family Planning Programme of the government, as discussed in this chapter. Our findings are as follows:
12 21
25 32
41
53
42
0
10
20
30
40
50
60
70
in n
um
be
rs
31
Audit Findings 4.1 Janani Suraksha Yojana
Janani Suraksha Yojana (JSY) is being implemented with an objective to reduce Maternal Mortality Rate (MMR) & Infant Mortality Rate (IMR) and to provide safe motherhood by encouraging institutional deliveries. To promote institutional deliveries at Government health centres, an incentive of ` 1,400 in rural area and ` 1,000 in urban area is provided to the beneficiaries.
4.1.1 Budget allotment and expenditure
A total expenditure of ` 2,196.56 crore was incurred on JSY against allotment of ` 2,380.11 crore during 2010-15 (Appendix 4.1). Audit observed that the annual expenditure under the scheme remained almost static during last five years despite prevalence of high maternal and infant mortality rate in the State much above the national average and also of UN development goals. The funds allotted under the scheme were also not fully utilised with significant shortfalls in 2012-13 and 2014-15.
4.1.2 Institutional Deliveries
As per JSY guidelines, institutional deliveries refer to deliveries in government health centres, viz., districts hospitals, community health centres, primary health centres, sub-centres etc.
The targets and achievements of institutional deliveries in the State during 2010-15 were as detailed in the table below:
JSY beneficiaries at Community Health Centre,
Allahabad
JSY ward at Community Health Centre, Allahabad.
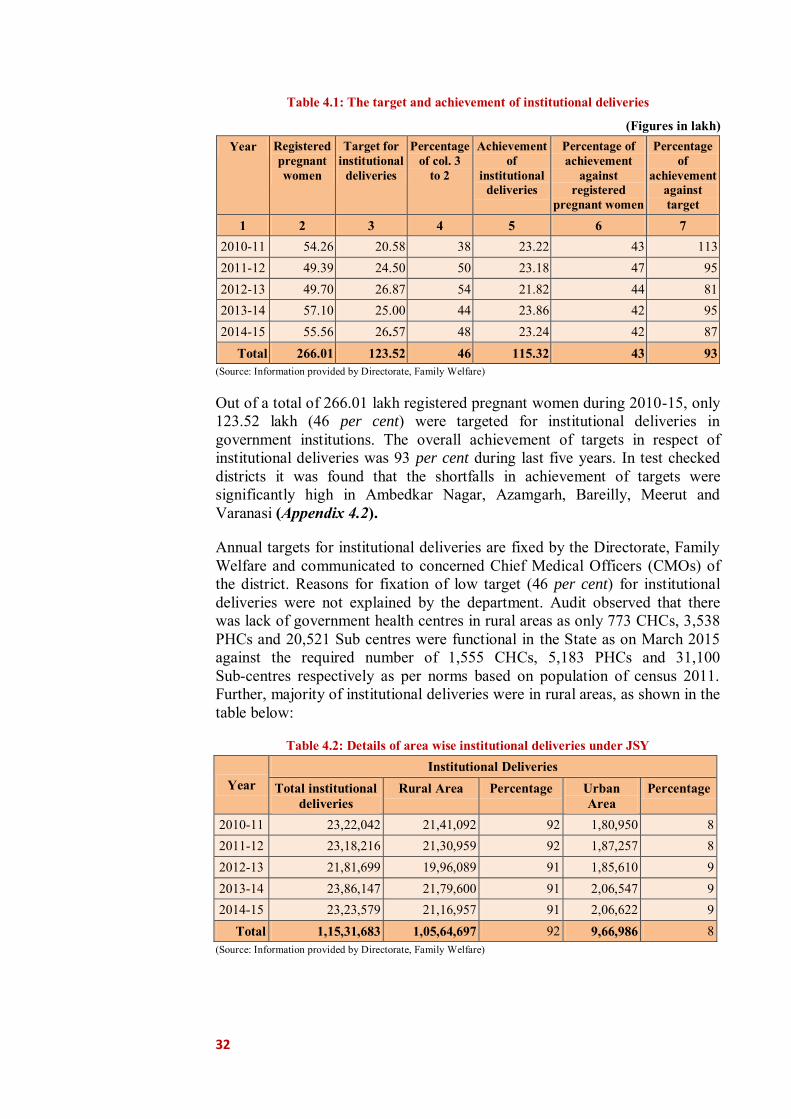
32
Table 4.1: The target and achievement of institutional deliveries
(Figures in lakh) Year Registered
pregnant women
Target for institutional
deliveries
Percentage of col. 3
to 2
Achievement of
institutional deliveries
Percentage of achievement
against registered
pregnant women
Percentage of
achievement against target
1 2 3 4 5 6 7 2010-11 54.26 20.58 38 23.22 43 113 2011-12 49.39 24.50 50 23.18 47 95 2012-13 49.70 26.87 54 21.82 44 81 2013-14 57.10 25.00 44 23.86 42 95 2014-15 55.56 26.57 48 23.24 42 87
Total 266.01 123.52 46 115.32 43 93 (Source: Information provided by Directorate, Family Welfare)
Out of a total of 266.01 lakh registered pregnant women during 2010-15, only 123.52 lakh (46 per cent) were targeted for institutional deliveries in government institutions. The overall achievement of targets in respect of institutional deliveries was 93 per cent during last five years. In test checked districts it was found that the shortfalls in achievement of targets were significantly high in Ambedkar Nagar, Azamgarh, Bareilly, Meerut and Varanasi (Appendix 4.2).
Annual targets for institutional deliveries are fixed by the Directorate, Family Welfare and communicated to concerned Chief Medical Officers (CMOs) of the district. Reasons for fixation of low target (46 per cent) for institutional deliveries were not explained by the department. Audit observed that there was lack of government health centres in rural areas as only 773 CHCs, 3,538 PHCs and 20,521 Sub centres were functional in the State as on March 2015 against the required number of 1,555 CHCs, 5,183 PHCs and 31,100 Sub-centres respectively as per norms based on population of census 2011. Further, majority of institutional deliveries were in rural areas, as shown in the table below:
Table 4.2: Details of area wise institutional deliveries under JSY
Year Institutional Deliveries
Total institutional deliveries
Rural Area Percentage Urban Area
Percentage
2010-11 23,22,042 21,41,092 92 1,80,950 8 2011-12 23,18,216 21,30,959 92 1,87,257 8 2012-13 21,81,699 19,96,089 91 1,85,610 9 2013-14 23,86,147 21,79,600 91 2,06,547 9 2014-15 23,23,579 21,16,957 91 2,06,622 9
Total 1,15,31,683 1,05,64,697 92 9,66,986 8 (Source: Information provided by Directorate, Family Welfare)

33
It is evident from the above table that more than 90 per cent of the institutional deliveries were in rural areas. Inadequate government health facilities, lack of access to government health centres and non-affordability of private nursing homes/hospitals may have forced rural poor to depend more on home deliveries to be done by unskilled birth attendant. On being pointed out in audit, department accepted (August 2015) the fact and replied that efforts are being made to provide health facilities to general public by construction of CHCs/PHCs as per norms.
Recommendations:
● Achievement of targets for institutional deliveries should be ensured in all the districts of the State especially with higher population of rural poor.
● Adequate health infrastructure may be created in rural areas by establishing more CHCs/PHCs/Sub-Centres as per norms to ensure safe and hygienic institutional deliveries.
● Transparent system should be adopted by the Department for fixing the targets of institutional deliveries.
4.1.3 Home Deliveries (i) Home deliveries by Skilled Birth Attendant
Under JSY, an incentive of ` 500 per case was to be paid to BPL women for home deliveries attended by Skilled Birth Attendant (SBA), for her care during delivery and to meet incidental expenses of delivery. Targets and achievements under home delivery are detailed in the following table:
Table 4.3: Targets and achievements under Home delivery by SBA
(Numbers in lakh) Year Home deliveries under JSY (deliveries for which
incentive was paid) Achieveme
nt in per cent Target of home deliveries
by Skilled Birth Attendants (SBA)
Achievement against Target of home deliveries by Skilled Birth
Attendants (SBA) 2010-11 0.42 0.19 45 2011-12 0.50 0.10 20 2012-13 0.14 0.05 36 2013-14 0.15 0.02 13 2014-15 0.12 0.01 08
Total 1.33 0.37 28 (Source: Information provided by Directorate, Family Welfare)
It is evident from above table that there were huge shortfalls in achievement of targets for home deliveries by Skilled Birth Attendants. The shortfalls have increased from 55 per cent in 2010-11 to 92 per cent in 2014-15 due to lackadaisical approach of the department.
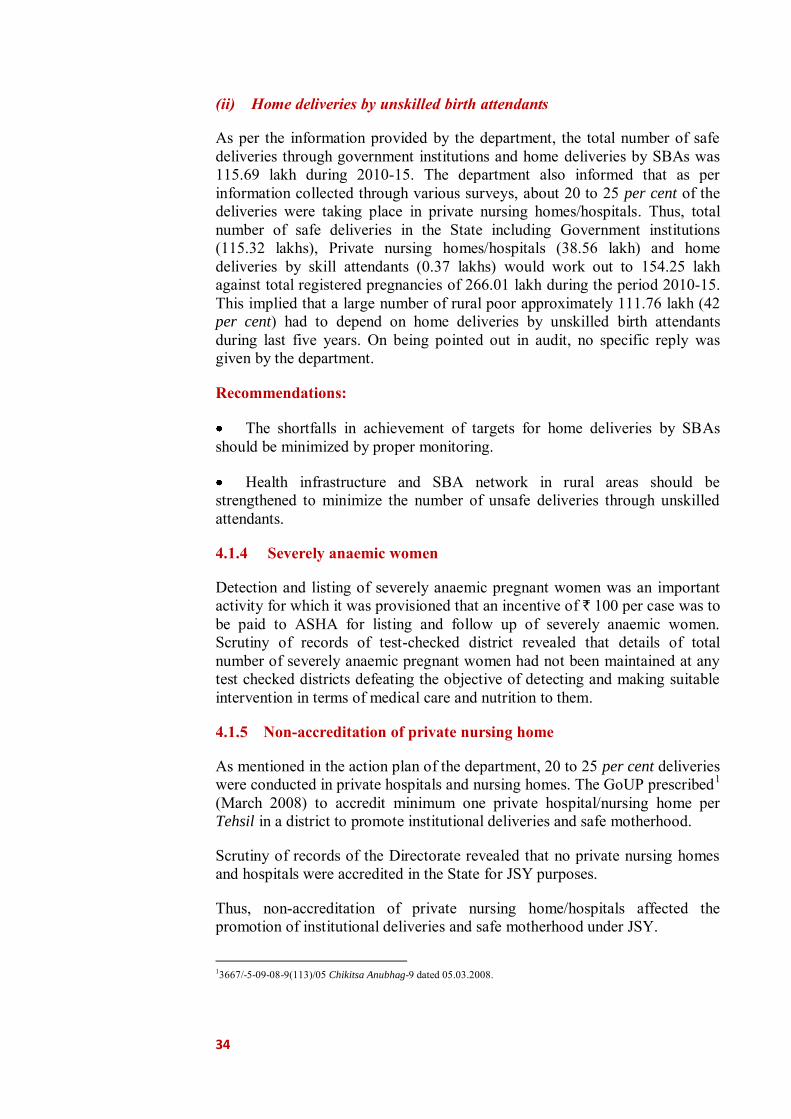
34
(ii) Home deliveries by unskilled birth attendants
As per the information provided by the department, the total number of safe deliveries through government institutions and home deliveries by SBAs was 115.69 lakh during 2010-15. The department also informed that as per information collected through various surveys, about 20 to 25 per cent of the deliveries were taking place in private nursing homes/hospitals. Thus, total number of safe deliveries in the State including Government institutions (115.32 lakhs), Private nursing homes/hospitals (38.56 lakh) and home deliveries by skill attendants (0.37 lakhs) would work out to 154.25 lakh against total registered pregnancies of 266.01 lakh during the period 2010-15. This implied that a large number of rural poor approximately 111.76 lakh (42 per cent) had to depend on home deliveries by unskilled birth attendants during last five years. On being pointed out in audit, no specific reply was given by the department.
Recommendations:
The shortfalls in achievement of targets for home deliveries by SBAs should be minimized by proper monitoring.
Health infrastructure and SBA network in rural areas should be strengthened to minimize the number of unsafe deliveries through unskilled attendants.
4.1.4 Severely anaemic women
Detection and listing of severely anaemic pregnant women was an important activity for which it was provisioned that an incentive of ` 100 per case was to be paid to ASHA for listing and follow up of severely anaemic women. Scrutiny of records of test-checked district revealed that details of total number of severely anaemic pregnant women had not been maintained at any test checked districts defeating the objective of detecting and making suitable intervention in terms of medical care and nutrition to them.
4.1.5 Non-accreditation of private nursing home
As mentioned in the action plan of the department, 20 to 25 per cent deliveries were conducted in private hospitals and nursing homes. The GoUP prescribed1 (March 2008) to accredit minimum one private hospital/nursing home per Tehsil in a district to promote institutional deliveries and safe motherhood.
Scrutiny of records of the Directorate revealed that no private nursing homes and hospitals were accredited in the State for JSY purposes.
Thus, non-accreditation of private nursing home/hospitals affected the promotion of institutional deliveries and safe motherhood under JSY.
13667/-5-09-08-9(113)/05 Chikitsa Anubhag-9 dated 05.03.2008.
35
Recommendation: The Government should ensure registration of private hospitals and nursing homes under JSY to promote institutional delivery and safe motherhood.
4.1.6 Accreditation of sub-centres of CHC/PHC
At least 50 per cent sub centres running in government buildings were to be accredited under JSY with a view to increase institutional deliveries2. These sub centres were to be accredited as early as possible for maximization of institutional deliveries by Auxiliary Nursing Midwife (ANM) and to ensure availability of benefit of JSY to beneficiaries in these sub centres. The responsibility of accreditation and activation of maximum such sub centres in districts was given to CMOs.
Audit observed that only 7,226 sub centres (42 per cent) were accredited to the scheme as of March 2015 against 17,219 sub centres running in government buildings in the State. Whereas scrutiny of records of test-checked districts revealed that only 2,255 sub centres (39 per cent) were accredited to the scheme against 5,786 sub centres running in government buildings. Thus, non-accreditation of sub-centres affected the fulfilment of objectives. On being pointed out in audit reason for non-accreditation of sub centres was not furnished by the Department.
4.2 Maternal Death Review
MDR programme was started by GoI under the mission for effective reduction in MMR through qualitative improvements in delivery services to reduce maternal mortality. Under this programme it was provisioned to review every maternal death to find the gaps in the service delivery and to ensure corrective measure.
4.2.1 Budget allotment and expenditure
Audit observed that the expenditure incurred was only ` 1.70 crore against the allotment of ` 7.22 crore (Appendix 4.3) indicating that very few cases of maternal death were reviewed by the department.
4.2.2 Review and reporting of maternal deaths
Under the MDR, all maternal deaths (may be at home, on the way or at health units) were to be reviewed by block level MDR team, and facility based MDR committee under the leader ship of block medical officer/ Superintendent and facility nodal officer respectively. District level maternal death review committee under the chairmanship of CMO was to monitor the review reports of all types of maternal deaths in the districts. It was also provisioned that ASHAs at village level will inform all maternal deaths of her area to the concerned block medical officer so that all maternal deaths may be reported for the review. 23667/-5-09-08-9(113)/05 Chikitsa Anubhag-9 dated 05.03.2008

36
The numbers of estimated, reported and reviewed maternal deaths in the State during 2012-15 are as depicted in Chart 4.3. Scrutiny revealed that reported figures of maternal deaths (8,477) were only 15 per cent of the estimated number of maternal deaths (55,242) in the State during 2012-15 as reported by the department. Hence, large number of maternal deaths (85 per cent) remained unreported and 86 per cent of
maternal deaths remained un-reviewed. As a result, in majority of the cases of maternal deaths the reasons for death could not be ascertained and verified to establish deficiency or lapse in medical care/treatment, if any, and ensure corrective measures.
Recommendation: The Government should put in place a more effective system to ensure that every case of maternal death is reported and reviewed to ascertain service delivery gaps for taking corrective measures.
4.3 Family Planning Programme
The population of the State increased from 16.61 crore in 2001 to 19.98 crore in 2011 (10.45 crore males and 9.53 crore females) registering a decadal growth rate of 20.23 per cent as per Census-2011. The average annual exponential growth rate (1.85 per cent) of the population in the State was above the national average of 1.64 per cent.
There is a close relationship between birth spacing and maternal health. Adequate birth spacing leads to improvement in the health of mother and the child. While motherhood is often a positive and fulfilling experience, for many women particularly living under poverty-sticken conditions (who are not literate and do not have access to birth control/spacing methods) it could be associated with suffering, ill health and even death. Lack of access to and awareness about birth control and birth spacing methods results in unwanted pregnancies and large family size putting tremendous stress on the health and wellbeing of the mother and children. Hence, it was important for the government to adopt suitable measures for popularising family planning methods in the State not only to stabilise the population but also to have a positive impact on the state of maternal health.
Objective of the Family Planning programme was to reduce Total Fertility Rate and improve the health status of people particularly women by encouraging adoption of appropriate family planning methods. Limiting methods of family planning consisted of vasectomy for male and tubectomy
(Source: Information provided by Directorate, Family Welfare)
55242
8477 7644
0
10000
20000
30000
40000
50000
60000
Estimateddeaths
Reporteddeaths
Revieweddeaths
in n
umbe
rs
Chart 4.3: Maternal Deaths 2012-15
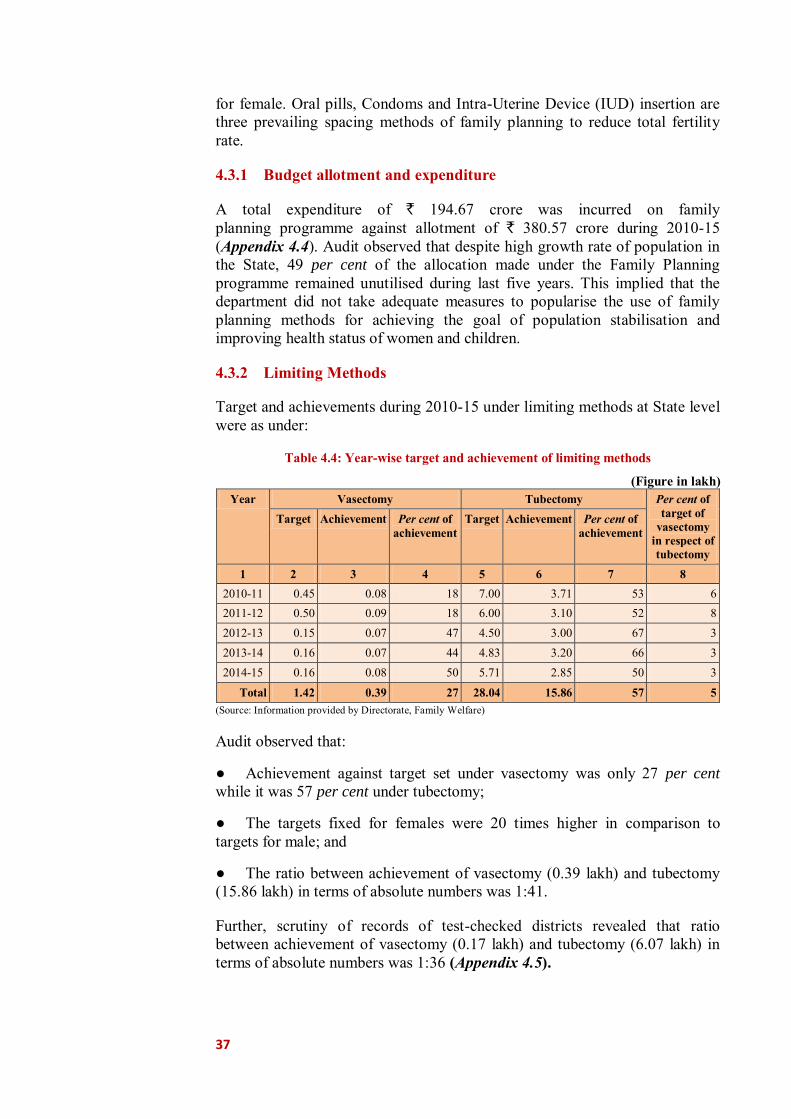
37
for female. Oral pills, Condoms and Intra-Uterine Device (IUD) insertion are three prevailing spacing methods of family planning to reduce total fertility rate.
4.3.1 Budget allotment and expenditure
A total expenditure of ` 194.67 crore was incurred on family planning programme against allotment of ` 380.57 crore during 2010-15 (Appendix 4.4). Audit observed that despite high growth rate of population in the State, 49 per cent of the allocation made under the Family Planning programme remained unutilised during last five years. This implied that the department did not take adequate measures to popularise the use of family planning methods for achieving the goal of population stabilisation and improving health status of women and children.
4.3.2 Limiting Methods
Target and achievements during 2010-15 under limiting methods at State level were as under:
Table 4.4: Year-wise target and achievement of limiting methods
(Figure in lakh) Year Vasectomy Tubectomy Per cent of
target of vasectomy
in respect of tubectomy
Target Achievement Per cent of achievement
Target Achievement Per cent of achievement
1 2 3 4 5 6 7 8 2010-11 0.45 0.08 18 7.00 3.71 53 6 2011-12 0.50 0.09 18 6.00 3.10 52 8 2012-13 0.15 0.07 47 4.50 3.00 67 3 2013-14 0.16 0.07 44 4.83 3.20 66 3 2014-15 0.16 0.08 50 5.71 2.85 50 3
Total 1.42 0.39 27 28.04 15.86 57 5 (Source: Information provided by Directorate, Family Welfare)
Audit observed that:
● Achievement against target set under vasectomy was only 27 per cent while it was 57 per cent under tubectomy;
● The targets fixed for females were 20 times higher in comparison to targets for male; and
● The ratio between achievement of vasectomy (0.39 lakh) and tubectomy (15.86 lakh) in terms of absolute numbers was 1:41.
Further, scrutiny of records of test-checked districts revealed that ratio between achievement of vasectomy (0.17 lakh) and tubectomy (6.07 lakh) in terms of absolute numbers was 1:36 (Appendix 4.5).
38
On being pointed out by audit, it was stated by test-checked districts that targets were fixed by the directorate level confirming the fact that even the directorate failed to take gender neutral view while setting targets.
4.3.3 Spacing Methods
Scrutiny revealed that shortfall in Intra-Uterine Device (IUD) insertion at State level was ranged between 41 and 47 per cent while it ranged between 14 to 78 per cent in 18 out of 20 test-checked districts whereas in two districts3 achievement was more than 80 per cent (Appendix 4.6). Moreover, for most common and non-invasive methods viz., oral pills and condoms, no targets were set.
Recommendations:
● The Government should enhance awareness in the society through IEC activities to increase inclination towards vasectomy and set prudent targets for both vasectomy and tubectomy.
● The Government should enhance awareness in the society through IEC activities to adopt spacing methods for family planning.
4.3.4 Monitoring and Supervision
● As per JSY guidelines, districts were directed to make available detailed information of names, address, contract number and details of payments to beneficiaries with name of ASHA and ANM at active JSY web site at state level which was to be monitored regularly at state level. As per provision, detailed supervision and monitoring of implementation of the programme was to be ensured by JSY cell at State level. No documentary evidences were found in any of the test-checked districts in support of supervision and monitoring carried out by JSY Cell;
● As per JSY guidelines, 10 per cent JSY beneficiaries were to be physically verified by Chief Medical Officer (CMO) and their subordinate officers. It was found in audit that required 10 per cent physical verification was not done in any of the test checked districts as any evidence regarding physical verification, corrective and penal actions/directions was not found. In the absence of physical verification, it was not known as to whether JSY beneficiaries were fully satisfied with the services provided by government institutions for institutional deliveries or otherwise and financial benefits were extended only to genuine beneficiaries; and
● As per Programme Implementation Plan, to reduce MMR, listing and follow up of severe anemic pregnant women and details of high risk pregnancy cases were to be reported to CMO by sub-centres, PHCs/CHCs and health units of districts level for treatment of severe anaemia. No such reports and follow-up actions on these reports were found in any of the test-checked districts. 3Bulandshahr and Sultanpur.

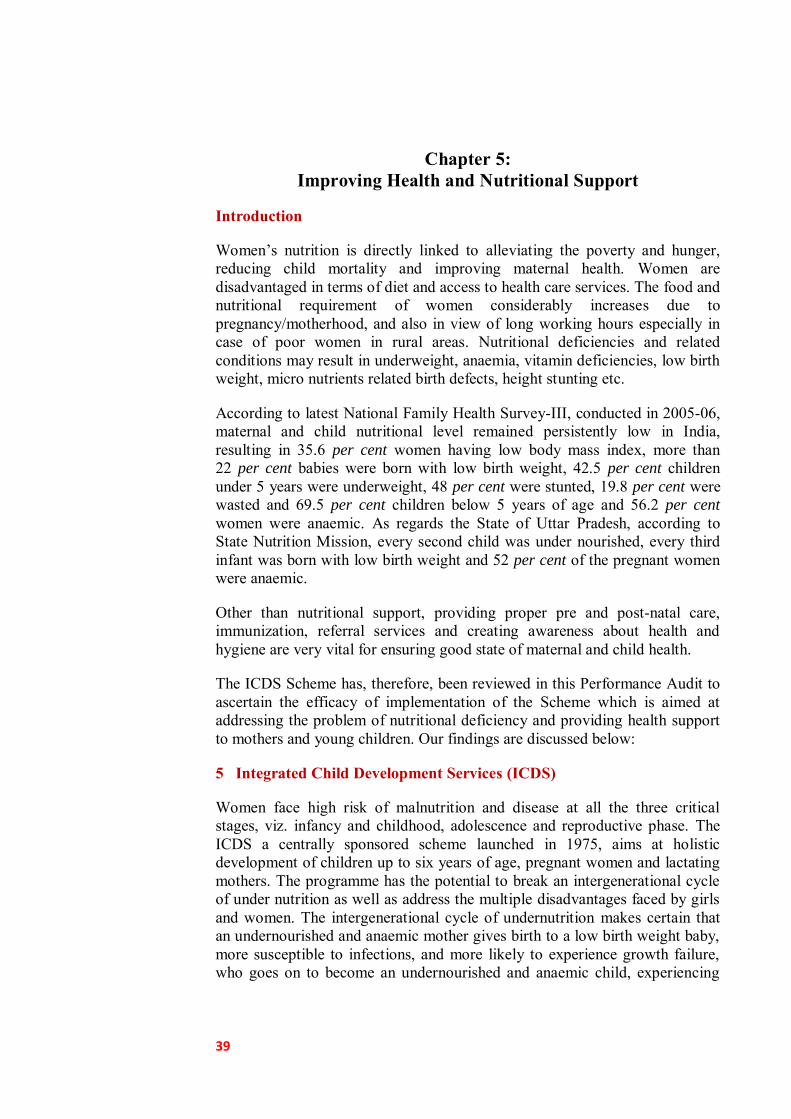
39
Chapter 5: Improving Health and Nutritional Support
Introduction
Women’s nutrition is directly linked to alleviating the poverty and hunger, reducing child mortality and improving maternal health. Women are disadvantaged in terms of diet and access to health care services. The food and nutritional requirement of women considerably increases due to pregnancy/motherhood, and also in view of long working hours especially in case of poor women in rural areas. Nutritional deficiencies and related conditions may result in underweight, anaemia, vitamin deficiencies, low birth weight, micro nutrients related birth defects, height stunting etc.
According to latest National Family Health Survey-III, conducted in 2005-06, maternal and child nutritional level remained persistently low in India, resulting in 35.6 per cent women having low body mass index, more than 22 per cent babies were born with low birth weight, 42.5 per cent children under 5 years were underweight, 48 per cent were stunted, 19.8 per cent were wasted and 69.5 per cent children below 5 years of age and 56.2 per cent women were anaemic. As regards the State of Uttar Pradesh, according to State Nutrition Mission, every second child was under nourished, every third infant was born with low birth weight and 52 per cent of the pregnant women were anaemic.
Other than nutritional support, providing proper pre and post-natal care, immunization, referral services and creating awareness about health and hygiene are very vital for ensuring good state of maternal and child health.
The ICDS Scheme has, therefore, been reviewed in this Performance Audit to ascertain the efficacy of implementation of the Scheme which is aimed at addressing the problem of nutritional deficiency and providing health support to mothers and young children. Our findings are discussed below:
5 Integrated Child Development Services (ICDS)
Women face high risk of malnutrition and disease at all the three critical stages, viz. infancy and childhood, adolescence and reproductive phase. The ICDS a centrally sponsored scheme launched in 1975, aims at holistic development of children up to six years of age, pregnant women and lactating mothers. The programme has the potential to break an intergenerational cycle of under nutrition as well as address the multiple disadvantages faced by girls and women. The intergenerational cycle of undernutrition makes certain that an undernourished and anaemic mother gives birth to a low birth weight baby, more susceptible to infections, and more likely to experience growth failure, who goes on to become an undernourished and anaemic child, experiencing
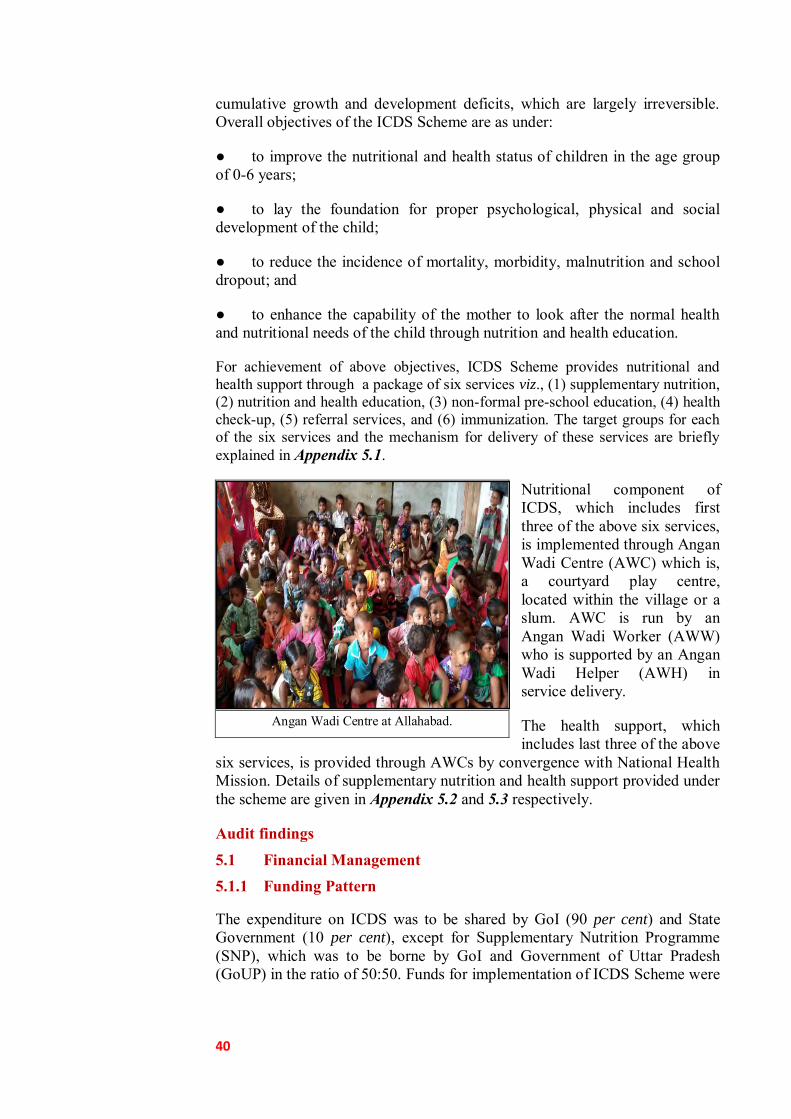
40
cumulative growth and development deficits, which are largely irreversible. Overall objectives of the ICDS Scheme are as under:
● to improve the nutritional and health status of children in the age group of 0-6 years;
● to lay the foundation for proper psychological, physical and social development of the child;
● to reduce the incidence of mortality, morbidity, malnutrition and school dropout; and
● to enhance the capability of the mother to look after the normal health and nutritional needs of the child through nutrition and health education.
For achievement of above objectives, ICDS Scheme provides nutritional and health support through a package of six services viz., (1) supplementary nutrition, (2) nutrition and health education, (3) non-formal pre-school education, (4) health check-up, (5) referral services, and (6) immunization. The target groups for each of the six services and the mechanism for delivery of these services are briefly explained in Appendix 5.1.
Nutritional component of ICDS, which includes first three of the above six services, is implemented through Angan Wadi Centre (AWC) which is, a courtyard play centre, located within the village or a slum. AWC is run by an Angan Wadi Worker (AWW) who is supported by an Angan Wadi Helper (AWH) in service delivery.
The health support, which includes last three of the above
six services, is provided through AWCs by convergence with National Health Mission. Details of supplementary nutrition and health support provided under the scheme are given in Appendix 5.2 and 5.3 respectively.
Audit findings
5.1 Financial Management 5.1.1 Funding Pattern
The expenditure on ICDS was to be shared by GoI (90 per cent) and State Government (10 per cent), except for Supplementary Nutrition Programme (SNP), which was to be borne by GoI and Government of Uttar Pradesh (GoUP) in the ratio of 50:50. Funds for implementation of ICDS Scheme were
Angan Wadi Centre at Allahabad.
41
73
8.4
9
77
7.1
8
17
19
.04
13
85
.45
15
11
.11
68
9.2
73
8.9
5
15
64
.63
12
71
.83
13
49
.31
0
400
800
1200
1600
2000
2010-11 2011-12 2012-13 2013-14 2014-15
` in
cror
e
Releases Expenditure
obtained through Demands for Grants and allotted by the Director, ICDS to District Programme officers (DPOs) of respective districts through treasury. The DPOs were to distribute certain portion of funds meant for distribution of hot cooked food; distribution of uniform to AWWs and AWHs; flexi fund for purchase of items like utensils, towel, comb, broom etc.; and for purchase of stationery, to AWCs who were to deposit it in a Bank. After utilizing funds, AWCs were to submit adjustment vouchers to Child Development Project Officers (CDPOs). Based on Statement of Expenditure of CDPOs, DPOs were to furnish detailed expenditure to the Director, ICDS and Utilization Certificates were to be furnished to GoI accordingly.
5.1.2 Allotment and expenditure under ICDS-General
ICDS-General covers all the package services of ICDS except supplementary nutrition programme. In other words, five services viz. (i) nutrition and health education, (ii) non-formal preschool education, (iii) health check-up, (iv) referral services, and (v) immunization are covered under ICDS General. Allocation, releases and expenditure under ICDS-General component during 2010-15 were as given in Appendix 5.4 and also depicted in chart 5.1 given below:
There were persistent savings ranging from `
38.23 crore to `
161.80 crore during 2010-15 due to non-utilisation of budget allocation and releases. Against the release of ` 6131.27 crore, only ` 5613.92 crore could be utilised during last five years resulting in an aggregate saving of ` 517.35 crore.
(Source: Directorate, ICDS)
5.2 Planning
5.2.1 Non-maintenance of gender segregated data
Basic data for the Scheme was to be maintained at AWC level in the registers like AWC survey register, pregnancy and delivery register, immunization and village health and nutrition day (VHND) register, referral register, weighing register, AWWs home visit register etc.
Scrutiny revealed that GoI directed (March 2012) to keep gender segregated data at AWC level latest by June 2013. However, gender segregated data from AWCs was not obtained and compiled at Directorate level making it
Chart 5.1: Releases and expenditure under ICDS-General
42
impossible to plan women centric activities to cater to the specific needs of women and adolescent girls.
5.2.2 No plans to cater for specific needs of girls and women
As per the directives issued (October 2012) by GoI, one of the main goals of the ICDS mission was to improve health care and nutrition of girls and women and reduce anaemia prevalence in young children, girls and women by one fifth. It was noticed that the Department did not include reporting on these indicators in its Monthly Progress Reports (MPRs) though 52 per cent of pregnant women and 49 per cent adolescent girls were suffering from anaemia in the State. Thus, the Department did not have authentic data relating to nutritional and anaemic status of girls and women, which deprived the Department from preparing plans to cater to the specific needs of girls and women to reduce the prevalence of anaemia among them.
Government in reply stated (December 2015) that information regarding anaemic status of girls and women was not being obtained due to non-availability of column regarding anaemia in MPR.
Recommendation: The Government should evolve a mechanism to obtain gender segregated data at State level especially in respect of important nutritional deficiencies for formulation of specific plan of action and taking corrective measures.
Implementation of the Scheme 5.3 Infrastructure facilities 5.3.1 Inadequate network of AWCs
Establishment of adequate number of AWCs was very vital for providing health and nutritional support to pregnant women, lactating mothers and children. The Scheme envisaged establishment of one AWC for 500-700 population in an ICDS project. Based on 2011 census, total population of the State was 19.98 crore. Accordingly, 2,85,429 AWCs were required in the State, against which only 1,90,145 AWCs (67 per cent) were sanctioned and 1,87,997 AWCs (66 per cent) were actually functional (March 2015). Thus, the shortage of AWCs against the prescribed norms was as high as 34 per cent in the State. In the test checked districts, the shortage of AWCs was 36,468 (36 per cent) as only 63,766 AWCs were functional against the requirement of 1,00,234 AWCs. Such huge shortage of AWCs in the State is bound to affect the quality of health and nutritional support provided to women and children through such centres under the scheme.
Government in reply accepted (December 2015) the audit observation but did not mention the corrective measures intended to be taken to expand the network of AWCs.
Recommendation: The Government should ensure opening of AWCs as per population norms for effective implementation of the Scheme.

43
5.3.2 Absence of basic infrastructure at AWCs
AWCs were focal point for delivery of nutritional and health support under ICDS. In order to discharge functions effectively, AWCs should be child friendly with all relevant infrastructures such as building, kitchen, child friendly toilets, drinking water, utensils etc., having at least 600 square feet space.
Audit scrutiny in test checked districts revealed that basic amenities like toilet facilities were not available in 43,600 AWCs (68 per cent), safe drinking water facilities were not found in 53,757 AWCs (84 per cent), and kitchens were not provided in 18,467 AWCs (29 per cent). District wise position of lack of amenities in AWCs is given in Appendix 5.5. More than 80 per cent of the AWCs in test checked Bareilly, Hardoi, Meerut, Bulandshahr, Sitapur, Sultanpur, Unnao and Saharanpur districts did not have toilet facilities.
It was also observed that out of total 1,87,997 AWCs in the State, 23,191 (12 per cent) were running in rented premises and 100 AWCs were running in the homes of AWWs/in open areas. During joint physical inspections (JPI) of 300 test-checked AWCs, it was observed that none of the 67 AWCs functioning in rented buildings had the prescribed area of 600 square feet.
AWC functioning in open space
in Azamgarh AWC in Bulandshahr having toilet in
dilapidated condition
As such, adequate infrastructure/basic amenities were not available in most of the AWCs thereby putting children, pregnant women and lactating mothers to lots of inconvenience and discomfort.
Government in reply stated (December 2015) that directions were issued in June 2014 to provide drinking water, toilet and kitchen facilities at AWCs running in rented buildings. Reply was not acceptable as large number of AWCs were still lacking in these basic facilities and no remedial measures have been taken so far.
Recommendation: The Government should ensure required infrastructure and basic amenities at all AWCs for providing hygienic and safe environment to children and pregnant women/lactating mothers visiting AWCs.
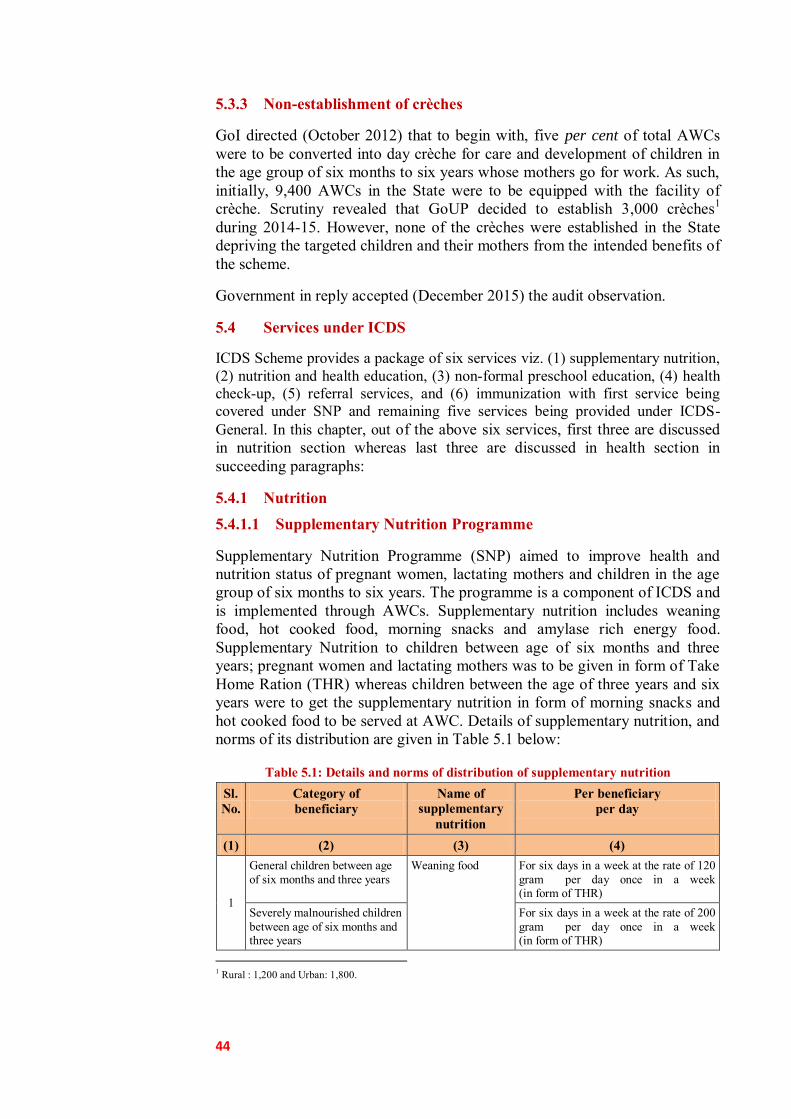
44
5.3.3 Non-establishment of crèches
GoI directed (October 2012) that to begin with, five per cent of total AWCs were to be converted into day crèche for care and development of children in the age group of six months to six years whose mothers go for work. As such, initially, 9,400 AWCs in the State were to be equipped with the facility of crèche. Scrutiny revealed that GoUP decided to establish 3,000 crèches1 during 2014-15. However, none of the crèches were established in the State depriving the targeted children and their mothers from the intended benefits of the scheme.
Government in reply accepted (December 2015) the audit observation.
5.4 Services under ICDS
ICDS Scheme provides a package of six services viz. (1) supplementary nutrition, (2) nutrition and health education, (3) non-formal preschool education, (4) health check-up, (5) referral services, and (6) immunization with first service being covered under SNP and remaining five services being provided under ICDS-General. In this chapter, out of the above six services, first three are discussed in nutrition section whereas last three are discussed in health section in succeeding paragraphs:
5.4.1 Nutrition 5.4.1.1 Supplementary Nutrition Programme
Supplementary Nutrition Programme (SNP) aimed to improve health and nutrition status of pregnant women, lactating mothers and children in the age group of six months to six years. The programme is a component of ICDS and is implemented through AWCs. Supplementary nutrition includes weaning food, hot cooked food, morning snacks and amylase rich energy food. Supplementary Nutrition to children between age of six months and three years; pregnant women and lactating mothers was to be given in form of Take Home Ration (THR) whereas children between the age of three years and six years were to get the supplementary nutrition in form of morning snacks and hot cooked food to be served at AWC. Details of supplementary nutrition, and norms of its distribution are given in Table 5.1 below:
Table 5.1: Details and norms of distribution of supplementary nutrition Sl. No.
Category of beneficiary
Name of supplementary
nutrition
Per beneficiary per day
(1) (2) (3) (4)
1
General children between age of six months and three years
Weaning food For six days in a week at the rate of 120 gram per day once in a week (in form of THR)
Severely malnourished children between age of six months and three years
For six days in a week at the rate of 200 gram per day once in a week (in form of THR)
1 Rural : 1,200 and Urban: 1,800.

45
27
20
.02
26
80
.61
26
64
.50
29
62
.90
36
43
.61
27
19
.60
26
80
.28
23
96
.30
29
61
.78
35
49
.24
0500
1000150020002500300035004000
2010-11 2011-12 2012-13 2013-14 2014-15
` in
cro
re
Releases Expenditure
2
General children between age of three years and six years
Hot cooked food in form of Khichdi/Dalia
Approximately 100 to 125 gram per beneficiary per day
Morning snack 50 gram amylase rich energy food for four days in a week (except Wednesday and Friday) Local fruit/Gur-chana/lai-chana two days in a week (on Wednesday and Friday)
3
Severely malnourished children between age of three years and six years
Amylase rich energy food
In addition to above at Sl. No. 2, amylase rich energy food at the rate of 75 gram per day for six days in a week at once (in form of THR)
4 Pregnant women and lactating mothers
Amylase rich energy food
For six days in a week at the rate of 140 gram per day once in a week (in form of THR
(Source: Directorate, ICDS)
The expenditure on SNP is funded on 50:50 per cent basis by GoI and GoUP.
(i) Financial Management of SNP
A sum of ` 14,307.20 crore was spent against the budget allocation of ` 14,677.88 crore under SNP during 2010-15. The year-wise details of GoI share and GoUP share are given in Appendix 5.6. Releases and expenditure under SNP is depicted in chart 5.2 given below:
GoI released only ` 6,502.77 crore against total expenditure of ` 7,153.60 crore incurred by the State during 2010-15. As such, GoUP failed to obtain central grant of ` 650.83 crore under SNP component.
Moreover, short receipt of Central grant increased from ` 4.59 crore in 2010-11 to ` 678.29 crore in 2014-15 including outstanding amounts of previous years.
(Source: Directorate, ICDS)
(ii) Less coverage of beneficiaries
The Supreme Court ordered (October 2004) to provide supplementary nutrition as per norms to all eligible children in the age group of six months to six years, pregnant women and lactating mothers. Details of population and number of SNP beneficiaries in the State are as given in Appendix 5.7 which indicated that the State had total 3.21 crore to 3.44 crore pregnant women,
Chart 5.2: Releases and Expenditure under SNP
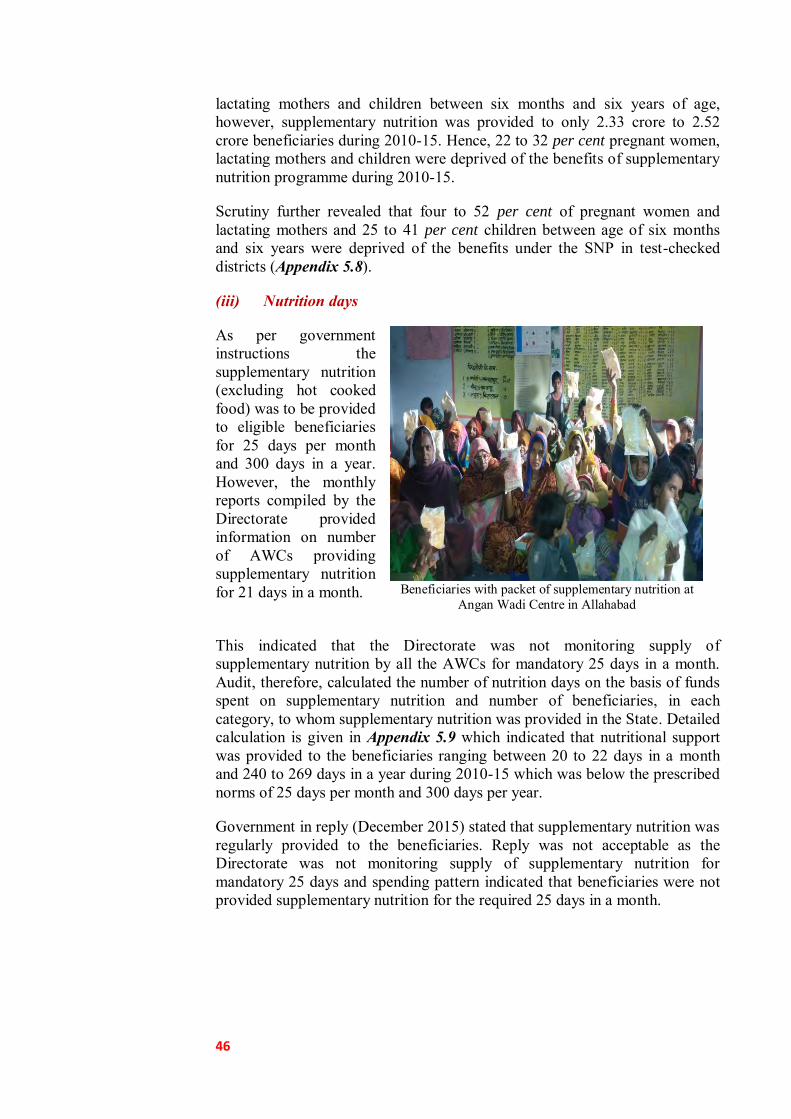
46
lactating mothers and children between six months and six years of age, however, supplementary nutrition was provided to only 2.33 crore to 2.52 crore beneficiaries during 2010-15. Hence, 22 to 32 per cent pregnant women, lactating mothers and children were deprived of the benefits of supplementary nutrition programme during 2010-15.
Scrutiny further revealed that four to 52 per cent of pregnant women and lactating mothers and 25 to 41 per cent children between age of six months and six years were deprived of the benefits under the SNP in test-checked districts (Appendix 5.8).
(iii) Nutrition days
As per government instructions the supplementary nutrition (excluding hot cooked food) was to be provided to eligible beneficiaries for 25 days per month and 300 days in a year. However, the monthly reports compiled by the Directorate provided information on number of AWCs providing supplementary nutrition for 21 days in a month.
Beneficiaries with packet of supplementary nutrition at
Angan Wadi Centre in Allahabad
This indicated that the Directorate was not monitoring supply of supplementary nutrition by all the AWCs for mandatory 25 days in a month. Audit, therefore, calculated the number of nutrition days on the basis of funds spent on supplementary nutrition and number of beneficiaries, in each category, to whom supplementary nutrition was provided in the State. Detailed calculation is given in Appendix 5.9 which indicated that nutritional support was provided to the beneficiaries ranging between 20 to 22 days in a month and 240 to 269 days in a year during 2010-15 which was below the prescribed norms of 25 days per month and 300 days per year.
Government in reply (December 2015) stated that supplementary nutrition was regularly provided to the beneficiaries. Reply was not acceptable as the Directorate was not monitoring supply of supplementary nutrition for mandatory 25 days and spending pattern indicated that beneficiaries were not provided supplementary nutrition for the required 25 days in a month.
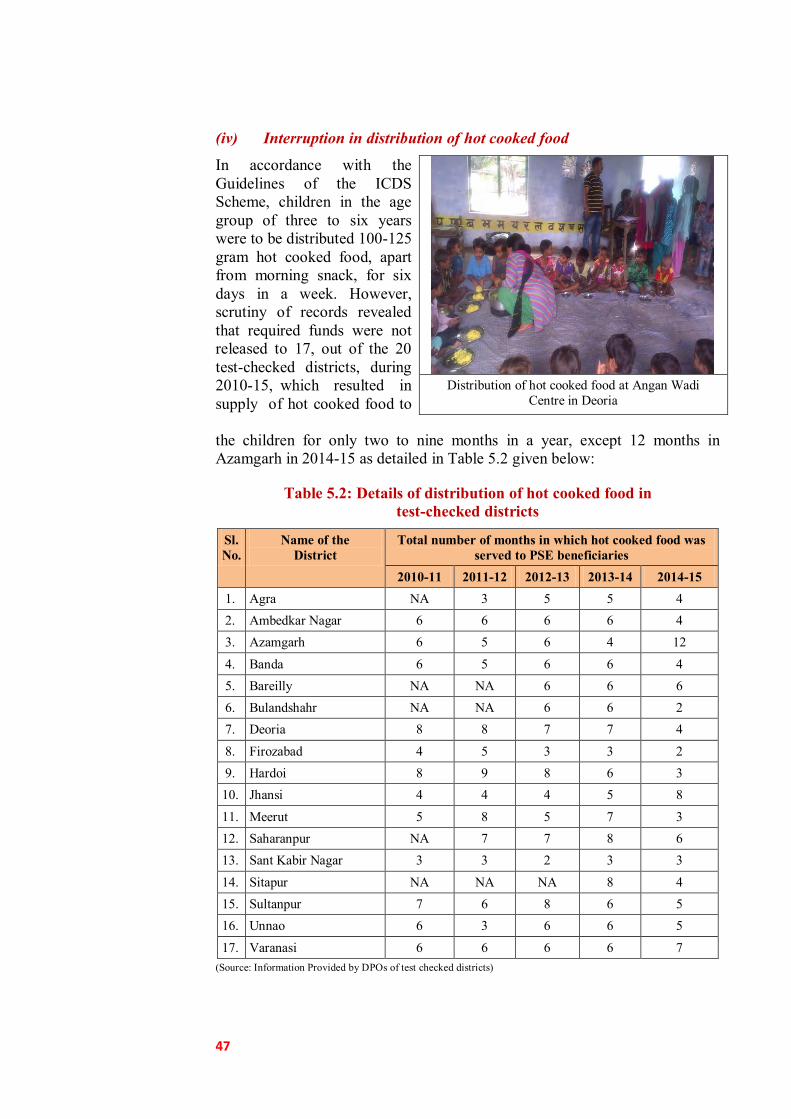
47
(iv) Interruption in distribution of hot cooked food
In accordance with the Guidelines of the ICDS Scheme, children in the age group of three to six years were to be distributed 100-125 gram hot cooked food, apart from morning snack, for six days in a week. However, scrutiny of records revealed that required funds were not released to 17, out of the 20 test-checked districts, during 2010-15, which resulted in supply of hot cooked food to
Distribution of hot cooked food at Angan Wadi
Centre in Deoria
the children for only two to nine months in a year, except 12 months in Azamgarh in 2014-15 as detailed in Table 5.2 given below:
Table 5.2: Details of distribution of hot cooked food in test-checked districts
Sl. No.
Name of the District
Total number of months in which hot cooked food was served to PSE beneficiaries
2010-11 2011-12 2012-13 2013-14 2014-15 1. Agra NA 3 5 5 4 2. Ambedkar Nagar 6 6 6 6 4 3. Azamgarh 6 5 6 4 12
4. Banda 6 5 6 6 4 5. Bareilly NA NA 6 6 6 6. Bulandshahr NA NA 6 6 2 7. Deoria 8 8 7 7 4
8. Firozabad 4 5 3 3 2 9. Hardoi 8 9 8 6 3 10. Jhansi 4 4 4 5 8
11. Meerut 5 8 5 7 3 12. Saharanpur NA 7 7 8 6 13. Sant Kabir Nagar 3 3 2 3 3
14. Sitapur NA NA NA 8 4 15. Sultanpur 7 6 8 6 5 16. Unnao 6 3 6 6 5
17. Varanasi 6 6 6 6 7 (Source: Information Provided by DPOs of test checked districts)
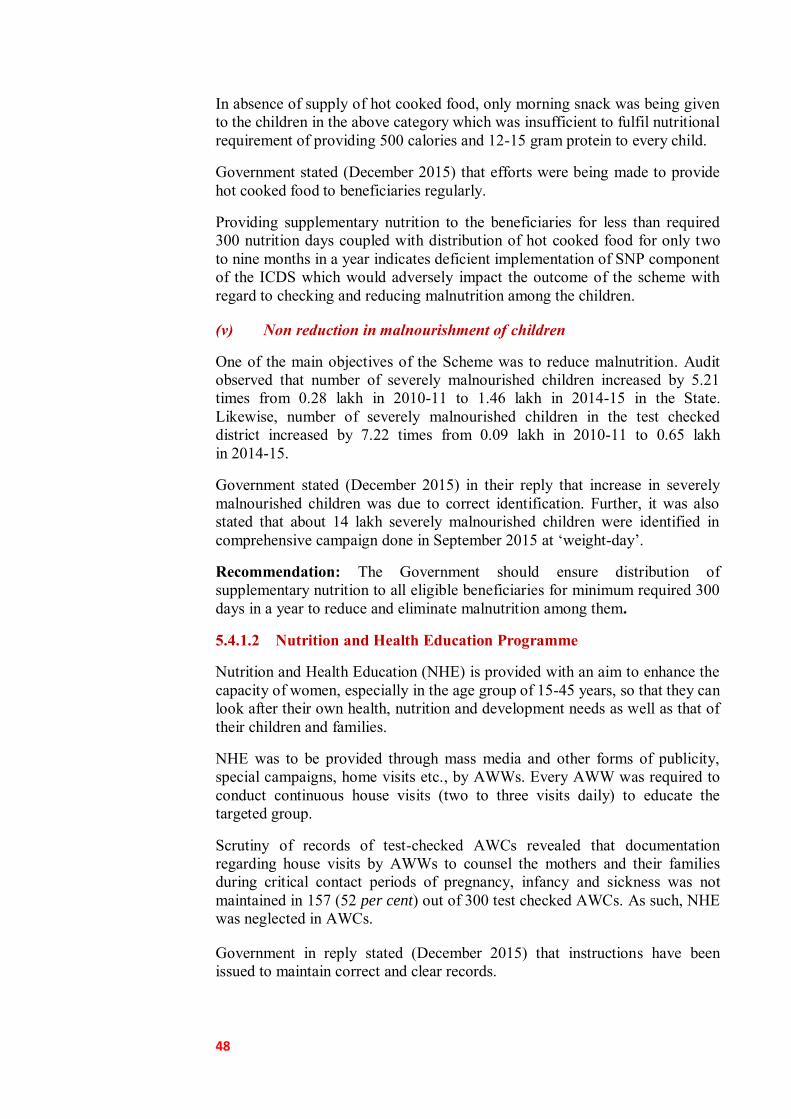
48
In absence of supply of hot cooked food, only morning snack was being given to the children in the above category which was insufficient to fulfil nutritional requirement of providing 500 calories and 12-15 gram protein to every child.
Government stated (December 2015) that efforts were being made to provide hot cooked food to beneficiaries regularly.
Providing supplementary nutrition to the beneficiaries for less than required 300 nutrition days coupled with distribution of hot cooked food for only two to nine months in a year indicates deficient implementation of SNP component of the ICDS which would adversely impact the outcome of the scheme with regard to checking and reducing malnutrition among the children.
(v) Non reduction in malnourishment of children
One of the main objectives of the Scheme was to reduce malnutrition. Audit observed that number of severely malnourished children increased by 5.21 times from 0.28 lakh in 2010-11 to 1.46 lakh in 2014-15 in the State. Likewise, number of severely malnourished children in the test checked district increased by 7.22 times from 0.09 lakh in 2010-11 to 0.65 lakh in 2014-15.
Government stated (December 2015) in their reply that increase in severely malnourished children was due to correct identification. Further, it was also stated that about 14 lakh severely malnourished children were identified in comprehensive campaign done in September 2015 at ‘weight-day’.
Recommendation: The Government should ensure distribution of supplementary nutrition to all eligible beneficiaries for minimum required 300 days in a year to reduce and eliminate malnutrition among them.
5.4.1.2 Nutrition and Health Education Programme
Nutrition and Health Education (NHE) is provided with an aim to enhance the capacity of women, especially in the age group of 15-45 years, so that they can look after their own health, nutrition and development needs as well as that of their children and families.
NHE was to be provided through mass media and other forms of publicity, special campaigns, home visits etc., by AWWs. Every AWW was required to conduct continuous house visits (two to three visits daily) to educate the targeted group.
Scrutiny of records of test-checked AWCs revealed that documentation regarding house visits by AWWs to counsel the mothers and their families during critical contact periods of pregnancy, infancy and sickness was not maintained in 157 (52 per cent) out of 300 test checked AWCs. As such, NHE was neglected in AWCs.
Government in reply stated (December 2015) that instructions have been issued to maintain correct and clear records.
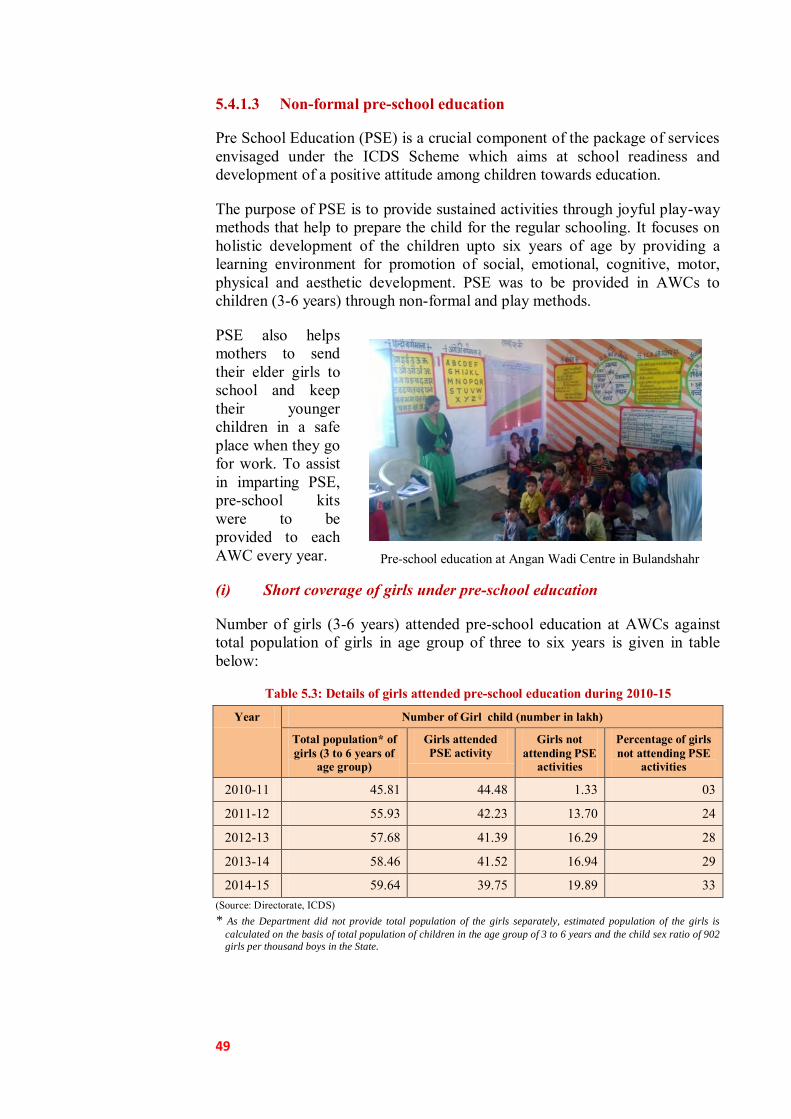
49
Pre-school education at Angan Wadi Centre in Bulandshahr
5.4.1.3 Non-formal pre-school education
Pre School Education (PSE) is a crucial component of the package of services envisaged under the ICDS Scheme which aims at school readiness and development of a positive attitude among children towards education.
The purpose of PSE is to provide sustained activities through joyful play-way methods that help to prepare the child for the regular schooling. It focuses on holistic development of the children upto six years of age by providing a learning environment for promotion of social, emotional, cognitive, motor, physical and aesthetic development. PSE was to be provided in AWCs to children (3-6 years) through non-formal and play methods.
PSE also helps mothers to send their elder girls to school and keep their younger children in a safe place when they go for work. To assist in imparting PSE, pre-school kits were to be provided to each AWC every year.
(i) Short coverage of girls under pre-school education
Number of girls (3-6 years) attended pre-school education at AWCs against total population of girls in age group of three to six years is given in table below:
Table 5.3: Details of girls attended pre-school education during 2010-15
Year Number of Girl child (number in lakh)
Total population* of girls (3 to 6 years of
age group)
Girls attended PSE activity
Girls not attending PSE
activities
Percentage of girls not attending PSE
activities
2010-11 45.81 44.48 1.33 03
2011-12 55.93 42.23 13.70 24
2012-13 57.68 41.39 16.29 28
2013-14 58.46 41.52 16.94 29
2014-15 59.64 39.75 19.89 33 (Source: Directorate, ICDS) * As the Department did not provide total population of the girls separately, estimated population of the girls is
calculated on the basis of total population of children in the age group of 3 to 6 years and the child sex ratio of 902
girls per thousand boys in the State.
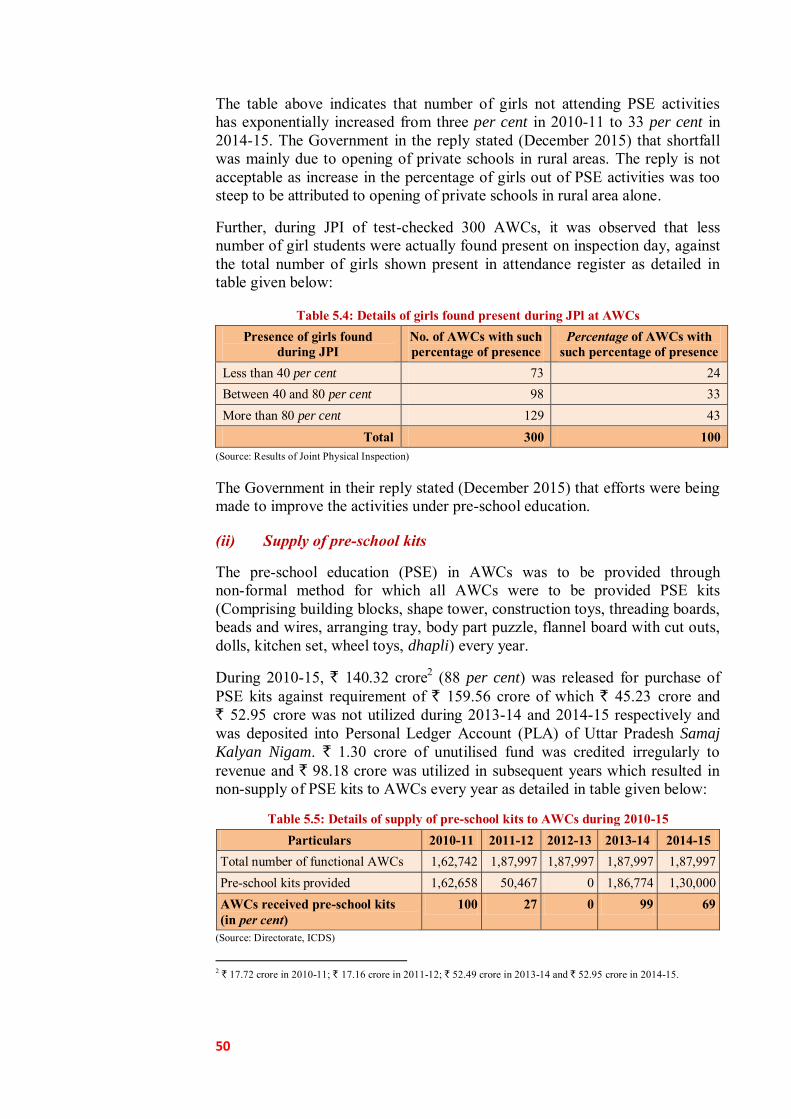
50
The table above indicates that number of girls not attending PSE activities has exponentially increased from three per cent in 2010-11 to 33 per cent in 2014-15. The Government in the reply stated (December 2015) that shortfall was mainly due to opening of private schools in rural areas. The reply is not acceptable as increase in the percentage of girls out of PSE activities was too steep to be attributed to opening of private schools in rural area alone.
Further, during JPI of test-checked 300 AWCs, it was observed that less number of girl students were actually found present on inspection day, against the total number of girls shown present in attendance register as detailed in table given below:
Table 5.4: Details of girls found present during JPl at AWCs Presence of girls found
during JPI No. of AWCs with such percentage of presence
Percentage of AWCs with such percentage of presence
Less than 40 per cent 73 24 Between 40 and 80 per cent 98 33 More than 80 per cent 129 43
Total 300 100 (Source: Results of Joint Physical Inspection)
The Government in their reply stated (December 2015) that efforts were being made to improve the activities under pre-school education.
(ii) Supply of pre-school kits
The pre-school education (PSE) in AWCs was to be provided through non-formal method for which all AWCs were to be provided PSE kits (Comprising building blocks, shape tower, construction toys, threading boards, beads and wires, arranging tray, body part puzzle, flannel board with cut outs, dolls, kitchen set, wheel toys, dhapli) every year.
During 2010-15, ` 140.32 crore2 (88 per cent) was released for purchase of PSE kits against requirement of ` 159.56 crore of which ` 45.23 crore and ` 52.95 crore was not utilized during 2013-14 and 2014-15 respectively and was deposited into Personal Ledger Account (PLA) of Uttar Pradesh Samaj
Kalyan Nigam. ` 1.30 crore of unutilised fund was credited irregularly to revenue and ` 98.18 crore was utilized in subsequent years which resulted in non-supply of PSE kits to AWCs every year as detailed in table given below:
Table 5.5: Details of supply of pre-school kits to AWCs during 2010-15 Particulars 2010-11 2011-12 2012-13 2013-14 2014-15
Total number of functional AWCs 1,62,742 1,87,997 1,87,997 1,87,997 1,87,997 Pre-school kits provided 1,62,658 50,467 0 1,86,774 1,30,000 AWCs received pre-school kits (in per cent)
100 27 0 99 69
(Source: Directorate, ICDS)
2 ` 17.72 crore in 2010-11; ` 17.16 crore in 2011-12; ` 52.49 crore in 2013-14 and ` 52.95 crore in 2014-15.

51
Thus, the objective of providing pre-school education to children in AWCs through non-formal method could not be achieved fully due to which a sound foundation for learning and development of these children was not ensured.
The Government in their reply stated (December 2015) that unutilized funds meant for pre-school kits would be utilized soon.
Recommendation: The Government should ensure supply of pre-school kits to AWCs every year for providing pre-school education to beneficiaries through non-formal methods.
5.4.2 Health services
Maternal and child health check-up/services like complete Ante-Natal Care (ANC), immunization, promotion of institutional delivery, post-natal care, new born care, immunization of infants and nutritional counselling to each child was to be provided by Health Department in rural areas through Community Health Centre (CHC)/Primary Health Centre (PHC) and sub-centres regularly. In order to extend the health services up to village level, in addition to health services provided at CHCs/PHCs/Sub-centres, health services like early registration of pregnancy, at least three ANCs, Iron Folic Acid supplementation, institutional delivery, immunization, Vitamin ‘A’ supplementation, regular health check-ups were also to be provided by ICDS with convergence of Health Department.
Various health services provided through ICDS platform with convergence of National Health Mission are discussed as under:
5.4.2.1 Health check-up
Health check-up included ante-natal care of expectant mothers, post-natal care of lactating mothers and care of children under six years of age especially those born with congenital defects or who were severely malnourished. Doctors were to be provided by Health Department preferably on monthly basis but at least once in a quarter for health check-up at AWC. Records of pre-natal care were to be kept in pre-natal cards. Post-natal visits of mothers were to be made twice within 10 days after delivery.
Scrutiny revealed that pre-natal and post-natal cards were not issued to expectant/lactating mothers in 217 (72 per cent) out of 300 test checked AWCs. Further, pregnancy and delivery register containing database of pregnant women was also not maintained in 78 (26 per cent) out of 300 test checked AWCs. This was indicative of poor pre-natal and post-natal health check-up services at these AWCs.
While accepting the fact, Government in their reply stated (December 2015) that fresh instructions are being issued to make the records up to date.
Recommendation: The Government should improve pre-natal and post-natal health check-up facilities at AWCs.

52
(i) Medicine kits
As per Guidelines of the ICDS Scheme, each AWC was to be provided one medicine kit every year consisting of easy to use and dispensable medicines for common ailments like fever, cold and worm infestation etc., including medicines and basic equipment for first aid.
Scrutiny revealed that ` 64 crore was provisioned and ` 58 crore3 was released for purchase of medicine kits during 2010-15 of which only ` 19.75 crore (34 per cent) was utilized within the respective financial year. Unutilised amount of ` 4.25 crore, pertaining to 2010-11, was utilized in subsequent years. Likewise unutilised amount of ` 1.31 crore, pertaining to 2011-12, has been lapsed to government account. Further, ` 30.94 crore of balance funds of 2013-15 was deposited into PLA of Uttar Pradesh Samaj
Kalyan Nigam of which ` 17.36 crore was utilized in subsequent years. Furthermore, ` 0.36 crore was credited irregularly to revenue at the end of 2013-14. Details of supply of medicine kits to AWCs during 2010-15 are indicated in Table below:
Table 5.6: Details of supply of medicine kits to AWCs during 2010-15
Particulars 2010-11 2011-12 2012-13 2013-14 2014-15 Total number of functional AWCs 1,62,742 1,87,997 1,87,997 1,87,997 1,87,997 Medicine kits provided 1,62,407 94,273 0 1,86,815 1,00,000 AWCs received medicine kits (in per cent)
100 50 0 99 53
(Source: Directorate, ICDS)
It would be seen from above table that no medicine kits were provided to any of the 1,87,997 functional AWCs in the State during 2012-13 and about 50 per cent AWCs were not issued medicine kits in 2011-12 and 2014-15. Hence, uninterrupted supply of medicines to the beneficiaries could not be ensured.
While accepting the fact, Government stated (December 2015) that medicine kits could not be supplied due to non-finalisation/delayed finalisation of tenders.
Recommendation: The Government should ensure supply of medicine kits to all AWCs without interruption for providing basic medical facilities to beneficiaries at AWCs.
(ii) Non-monitoring of children’s growth
With a view to improve the monitoring of growth of the children and to strengthen mother and child health care services, GoI directed (November 2014) to supply weighing machines, new growth charts and maternal and child protection (MCP) cards4 to all AWCs. Scrutiny of 3 ` 11.30 crore in 2010-11; ` 11.30 crore in 2011-12; ` 17.70 crore in 2013-14 and ` 17.70 crore in 2014-15. 4 To each mother to track the nutritional status, immunization schedule and developmental milestones for both the
child and the pregnant and lactating mothers.

53
records of test-checked districts revealed that new growth charts were not available in 60 to 95 per cent AWCs. Similarly, MCP cards, baby weighing machines and adult weighing machines were also not available in 91 to 100 per cent, 22 to 84 per cent and 22 to 84 per cent AWCs respectively, which was indicative of deficiency in health care services provided at AWCs (Appendix 5.10).
Government stated (December 2015) that ` one lakh was provided by Health Department to each district for procurement of growth chart and MCP cards.
5.4.2.2 Referral services
During health check-ups and growth monitoring sessions, sick and malnourished children as well as pregnant women and lactating mothers in need of prompt medical attention, were to be referred by AWCs to nearby CHC/PHC) and Nutrition Rehabilitation Centre for treatment.
Scrutiny of records of test-checked AWCs revealed that records of referred patients containing name, age, reason for referral, date of referral, place where referred, details of treatment given and outcome of treatment was not maintained in 247 (82 per cent) out of 300 test checked AWCs. As such, referral services were neglected in AWCs.
Government stated (December 2015) that joint efforts with Health Department were being made to improve the services.
5.4.2.3 Immunization programme
The focus of immunization programme is to ensure immunization of pregnant women and infants. Immunization of infants protects children from six vaccine preventable diseases-poliomyelitis, diphtheria, pertussis, tetanus, tuberculosis and measles which are major preventable causes of child mortality, disability, morbidity and related malnutrition. Further, children were also to be given Vitamin ‘A’ and booster doses under the immunization programme. Immunization of pregnant women against tetanus reduces maternal and neonatal mortality. Sub-Centres of Health Department were responsible for carrying out immunization of infants and pregnant women. The AWW was to assist the health functionaries in complete coverage of the targeted population for immunization as well as in organizing the fixed day immunization sessions on ‘Village Health Nutrition Days (VHND)’ at village level every month.
During JPI we observed that no records of immunization were maintained in 46 (15 per cent) out of 300 test checked AWCs. Though, remaining test checked AWCs maintained partial records of immunization but none of them maintained the records in prescribed format indicating number of children and women due for immunization and number immunized/left out, due date and actual date of immunization etc. Further, Vitamin ‘A’ supplement register was not maintained in 157 (52 per cent) out of 300 AWCs. Proper maintenance of immunization records is necessary to ensure that the prescribed immunization

54
Angan Wadi Workers undergoing training session at Allahabad
schedule is adhered to strictly and no child skips any important immunization/dose necessary for their healthy growth and development, free from major diseases and deficiencies.
Observance of Village Health and Nutrition Day (VHND)
With a view to reduce maternal and infant mortality and to strengthen mother and child health services, VHNDs were to be organized to provide comprehensive outreach services for pregnant women and children at their doorstep. VHND was to be organized at village level (each gram sabha) every month in coordination with AWW, ANM and ASHA. The objective of the VHND was complete ante-natal care, immunization, new born care, etc. AWW was to prepare list of beneficiary children, mobilise community to bring pregnant women and children to session site for services, and ensure weight measuring of malnourished children and enter their weight in growth chart/MCP cards.
Scrutiny revealed that records regarding observance of VHND and services provided during VHND were not being maintained at AWCs during 2010-15. Government in their reply stated (December 2015) that combined order by Health and Women and Child Development Departments has been issued for effective implementation of VHND.
5.5 Training and Capacity Development of the functionaries
Training and capacity building of functionaries is crucial as the achievement of programme goals depends on the effectiveness of frontline workers in delivery of Angan Wadi service.
Scrutiny revealed that against the Budget demand of ` 68 crore, ` 42 crore (62 per cent) was allocated and released under training component, of which only ` 37.62 crore (55 per cent of the demand) was utilised during 2010-15.
Core functionaries were to be imparted training in job courses and refresher courses

55
through 66 Angan Wadi Training Centres5 (AWTCs), four Middle Level Training Centres6 (MLTCs) and 25 District Mobile Training Teams7 (DMTTs).
Target and achievements for imparting job and refresher training slots to various ICDS functionaries during 2010-15 were as given in Appendix 5.11.
It indicated that shortfall in job and refresher training slots to various ICDS functionaries viz. CDPO, Lady Supervisor, AWW and AWH ranged between 55 to 77 per cent and 55 to 91 per cent respectively. As such, large numbers of ICDS functionaries remained untrained, as of March 2014, as given in Table below:
Table 5.7: Details of trained ICDS functionaries
Sl. No.
Name of the Post Staff-in-position
Trained Untrained (per cent)
Job Refresher Job Refresher
1. Child Development Project Officer 641 641 228 0 (0) 413(64)
2. Lady Supervisor 4,207 4,203 2,395 4(0) 1,812 (43)
3. Angan Wadi Worker 1,78,991 1,68,862 72,885 10,129(6) 1,06,106(59)
4. Angan Wadi Helper 1,56,270 1,41,622 68,039 14,648(9) 88,231(56) (Source: Directorate, ICDS)
It is evident from the above table that 10129 AWWs and 14648 AWHs were untrained in job courses and 43 per cent to 64 per cent functionaries were not imparted refresher training. Evidently, release of only 62 per cent funds against the budget demand hampered the implementation of training programme.
Government in reply (December 2015) stated that untrained functionaries were regularly being imparted training. Reply was not acceptable as trainings were not imparted regularly during 2010-15 and large numbers of functionaries remained untrained.
5.6 Monitoring GoI directed (March 2011) to constitute three tier district, block and AWC level monitoring and evaluation committees for effective monitoring of the Scheme. These committees were to monitor the functioning of AWCs; ensure the coverage of all the eligible beneficiaries; quality of supplementary nutrition; growth monitoring of children and monitoring of malnourished and severely malnourished children. These committees were also to ensure cleanliness and availability of toilets and drinking water facilities at AWC level and ensure convergence with medical department for immunization, referral services and health check-up activities. GoI further directed (October 2010) for continuous monitoring and inspection of ICDS projects 5 To train the AWWs. 6 To train the lady supervisors. 7 For providing operational training to AWHs, refresher training and induction training to AWWs.
56
and AWCs by various ICDS functionaries. Further, web-based Management Information System (MIS) was to be implemented at AWC level for submission of web-based MPRs.
However, we in audit observed that, though GoUP constituted (June 2011) above three tier committees but Monitoring and Evaluation Committees at district, block and AWC level did not meet regularly. Further, functionaries of ICDS also did not conduct regular inspections of AWCs. It was also noticed that revised web-based MIS was not implemented in AWCs in the State. The details are given in Appendix 5.12. Lack of monitoring had adverse impact on the implementation of the Scheme as discussed above.
Recommendation: The Government should ensure regular meetings of various committees and inspections by ICDS functionaries as per norms for effective monitoring of the scheme.
5.7 Conclusion
The implementation of ICDS Scheme was deficient as:
● There was huge shortage of AWCs against the prescribed norms and the AWCs were not having basic amenities like toilet, clean drinking water and kitchen facility;
(Paragraph 5.3.1 & 5.3.2)
● Large number of beneficiaries were not covered under supplementary nutrition programme, there were interruptions in supply of hot cooked food and pre-school kits were not supplied to large number of AWCs;
(Paragraph 5.4.1.1 (ii), 5.4.1.1 (iv) & 5.4.1.3 (ii))
● Medicine kits were not made available to nearly fifty per cent of functional AWCs, health check-up records were not maintained, growth of children was not monitored and no records of immunization and vitamin supplements were maintained by many AWCs; and
(Paragraph 5.4.2.1 & 5.4.2.3)
● Monitoring of the Scheme was also found lacking and revised web based MIS was not implemented.
(Paragraph 5.6 )
Deficient implementation of the scheme would adversely impact the scheme outcome which was evident from the fact that 42 per cent of total children in the State were underweight and 15 per cent were suffering from wasting. Hence, objective of providing health and nutritional support to pregnant and lactating mothers and children below six years of age could not be fully achieved and empowerment of women especially in rural areas continues to be a distant dream.


57
Chapter 6:
Adolescent Girls Introduction
To address the problems of adolescence, a significant phase of transition from childhood to adulthood and marked by physical changes accompanied by psychological changes, Kishori Shakti Yojana (KSY) and Rajiv Gandhi Scheme for Empowerment of Adolescent Girls or SABLA (SABLA) were launched through ICDS platform. The objectives of these schemes were to make adolescent girls (AGs) aware of health, nutrition, and lifestyle related behaviour and adolescent reproductive & sexual health needs to be positioned in this phase of life in order to improve the health of adolescent girls and facilitate an easier transition to womanhood. The important audit findings relating to these two schemes are discussed in succeeding paragraphs.
6.1 Kishori Shakti Yojana
Ministry of Women and Child Development (MWCD), GoI, in the year 2000, introduced a scheme called Kishori Shakti Yojana (KSY) to improve the nutrition and health status of girls in the age‐group of 11 to 18 years, to equip them to improve and upgrade their home‐based and vocational skills, and to promote their overall development, including awareness about their health, personal hygiene, nutrition, family welfare and management. The scheme was running in 53 districts of the State, of which 14 districts were covered under this performance audit.
Audit findings 6.1.1 Financial Management
It is a centrally sponsored scheme under which an amount of ` 1.10 lakh per block/ICDS project per annum for interventions to be carried out under the scheme is provided to the State through funds released for ICDS Scheme.
6.1.1.1 Allotment and expenditure
Against the requirement of ` 33.10 crore1 during 2010-15, ` 32.42 crore was allocated; ` 18.88 crore (58 per cent of allocated amount) was released; and ` 11.69 crore (62 per cent of released amount) was spent for implementation of the scheme in the State (Appendix 6.1). The Funds required, released and expenditure incurred under the scheme during 2010-15 is depicted in Chart 6.1 below:
1 Total 602 projects X 60 AGs/project X ` 1,833 X 5 years = ` 33,10,39,800.

58
6.62
4.64
4.5
0.14
6.62
6.62
3.31
3.31
6.62
1.66
0.01
1.65
6.62
2.66
1.95
0.7
6.62
3.31
1.92
1.39
0
1
2
3
4
5
6
7
8
Rs.
in c
rore
2010-11 2011-12 2012-13 2013-14 2014-15
Chart 6.1: Funds alloted, released and expenditure
Fund requirement Fund released Expenditure Surrender/lapsed
(Source: Directorate, ICDS)
Thus, there was huge gap between allocation and release and also between release and actual expenditure. Insufficient budget provisions and non-utilisation of available funds resulted in shortfall in physical achievement of the targets as discussed in paragraph 6.1.3.
Scrutiny of records in test checked districts revealed that against the requirement of ` 155.24 lakh only ` 139.34 lakh of training fund was released which in turn could not be utilised in 2014-15 as the amount was received on 31 March 2015 and lapsed due to late release of funds by Directorate, liability to the extent of ` 155.24 lakh has been created.
In reply, the Government stated that the scheme was implemented as per availability of the budget and the funds lapsed due to non-payment of bills by the district level authorities. Reply is not acceptable as department should have released the funds timely and also monitored implementation of the scheme closely to avoid slippages in implementation leading to surrender of funds.
6.1.2 Insignificant coverage of adolescent girls
The KSY scheme was initiated with the objective of improving nutrition and health status of AGs in the age group of 11-18 years but it provided for coverage of only 60 girls per Block (Project) in a year in 53 districts covered under the scheme. On the other hand, SABLA scheme implemented in remaining 22 districts of the State with similar objective had no such limitation and covered all the AGs in the block.
As a result of this ceiling of covering 60 AGs per block, it was noticed during scrutiny of records of test-checked 14 districts that against the total population of 70,74,240 AGs, only 35,100 AGs were covered under the KSY scheme during 2012-15(Appendix 6.2). Hence, only one per cent of the AGs in these districts could be covered under KSY. In other words, 99 per cent of the AGs

59
in the districts were deprived of the nutritional support and vocational training. Thus, the limited scope of the scheme defeated the very purpose of the introduction of the scheme.
On this being pointed out in audit, District Programme Officers (DPOs) of test checked districts stated that work was conducted as per availability of budget. In reply, the Government, however, accepted (December 2015) the facts.
Recommendation: The Government should expand the scope of the scheme to cover all adolescent girls, on the lines of SABLA scheme implemented in other 22 districts.
6.1.3 Nutritional support to AGs
Under KSY, one of the objectives was to improve the nutritional and health status of girls in the age group of 11-18 years. However, department ordered to provide supplementary nutrition to only three Adolescent Girls per AWC per year. This implied that most of the AGs were not covered under KSY for receiving nutritional support.
It was noticed in test-checked districts that in compliance of the departmental order, only 5 to 6 per cent of total population of adolescent girls were benefited with supplementary nutrition. Thus, about 95 per cent AGs were deprived of intended benefit of supplementary nutrition during 2012-15 (Appendix 6.3).
No specific reply was furnished by the Department but the Government during discussion in exit conference stated that the facts have been taken in cognizance and required action will be taken.
6.1.4 Health and Vocational training
Under the scheme, 1,80,600 AGs in 602 sanctioned projects in the State were to be imparted three days training in respect of health & nutrition and 60 days vocational training in two batches of 30 girls under each project/block. The vocational training covered area such as stitching, pickle making etc (Appendix 6.4). The status of training provided under the scheme was given in Table below:
Training under Kishori Shakti Yojana at Allahabad
Training under Kishori Shakti Yojana at Allahabad
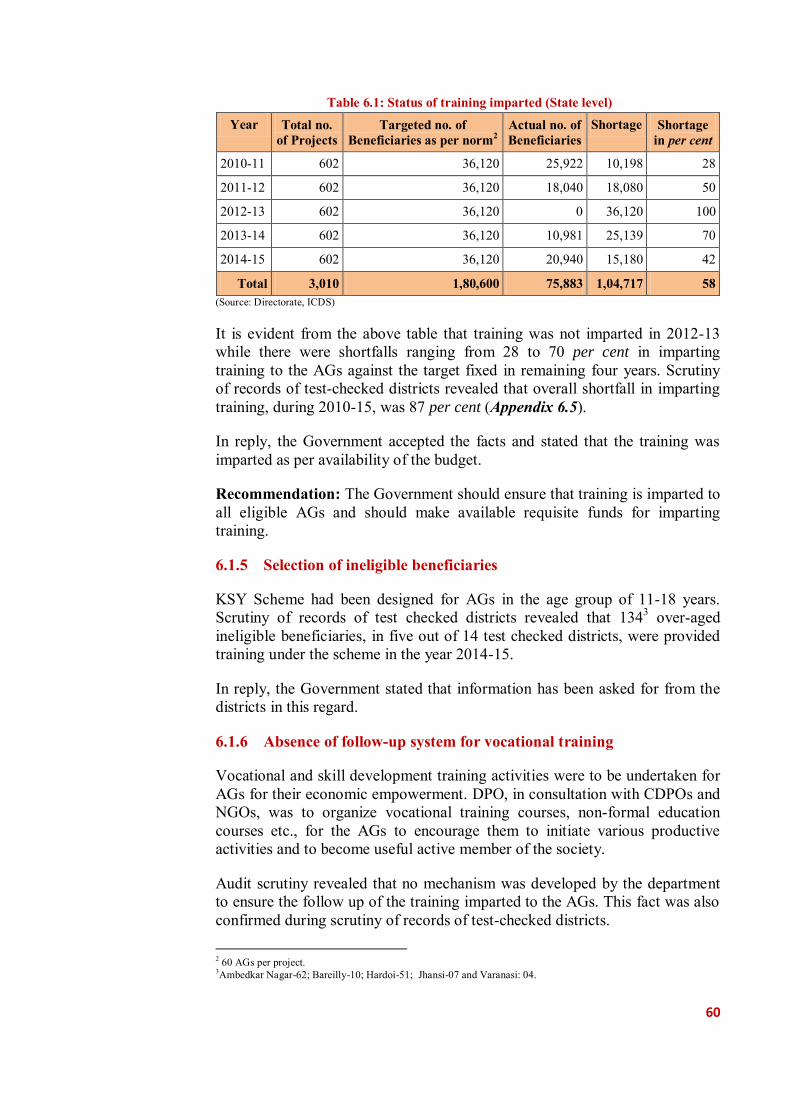
60
Table 6.1: Status of training imparted (State level) Year Total no.
of Projects Targeted no. of
Beneficiaries as per norm2 Actual no. of Beneficiaries
Shortage Shortage in per cent
2010-11 602 36,120 25,922 10,198 28
2011-12 602 36,120 18,040 18,080 50
2012-13 602 36,120 0 36,120 100
2013-14 602 36,120 10,981 25,139 70
2014-15 602 36,120 20,940 15,180 42
Total 3,010 1,80,600 75,883 1,04,717 58 (Source: Directorate, ICDS)
It is evident from the above table that training was not imparted in 2012-13 while there were shortfalls ranging from 28 to 70 per cent in imparting training to the AGs against the target fixed in remaining four years. Scrutiny of records of test-checked districts revealed that overall shortfall in imparting training, during 2010-15, was 87 per cent (Appendix 6.5).
In reply, the Government accepted the facts and stated that the training was imparted as per availability of the budget.
Recommendation: The Government should ensure that training is imparted to all eligible AGs and should make available requisite funds for imparting training.
6.1.5 Selection of ineligible beneficiaries
KSY Scheme had been designed for AGs in the age group of 11-18 years. Scrutiny of records of test checked districts revealed that 1343 over-aged ineligible beneficiaries, in five out of 14 test checked districts, were provided training under the scheme in the year 2014-15.
In reply, the Government stated that information has been asked for from the districts in this regard.
6.1.6 Absence of follow-up system for vocational training
Vocational and skill development training activities were to be undertaken for AGs for their economic empowerment. DPO, in consultation with CDPOs and NGOs, was to organize vocational training courses, non-formal education courses etc., for the AGs to encourage them to initiate various productive activities and to become useful active member of the society.
Audit scrutiny revealed that no mechanism was developed by the department to ensure the follow up of the training imparted to the AGs. This fact was also confirmed during scrutiny of records of test-checked districts.
2 60 AGs per project. 3Ambedkar Nagar-62; Bareilly-10; Hardoi-51; Jhansi-07 and Varanasi: 04.
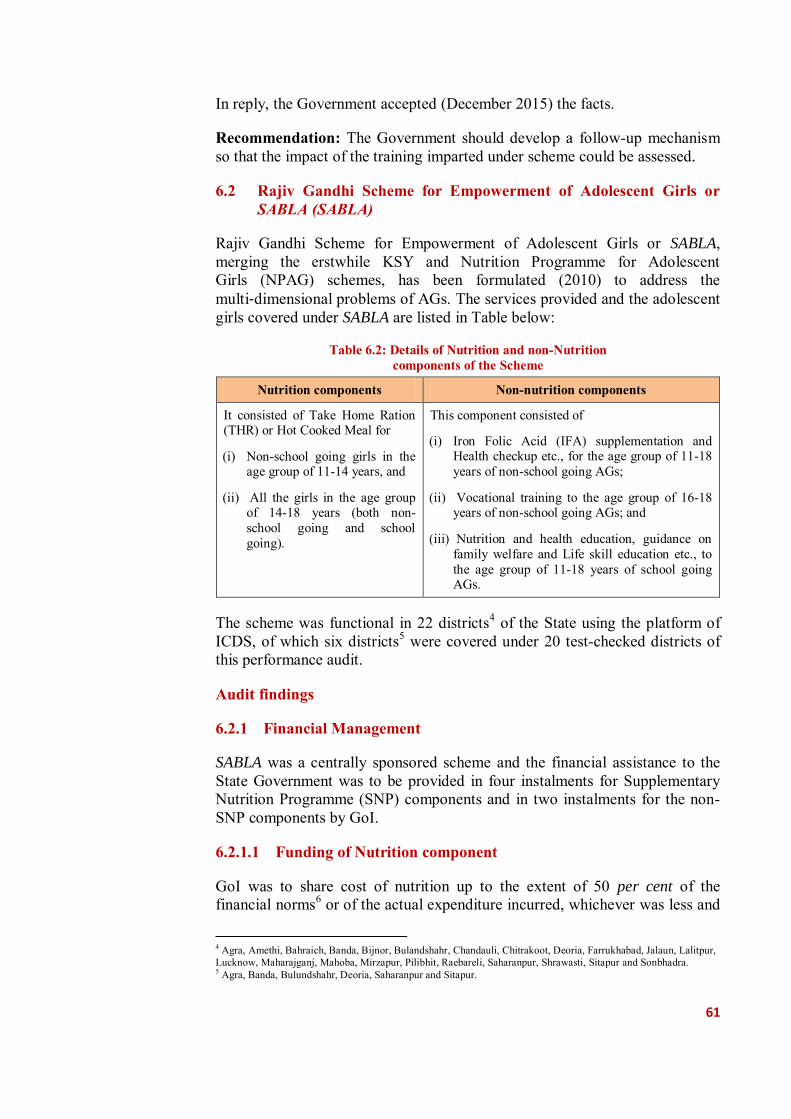
61
In reply, the Government accepted (December 2015) the facts.
Recommendation: The Government should develop a follow-up mechanism so that the impact of the training imparted under scheme could be assessed.
6.2 Rajiv Gandhi Scheme for Empowerment of Adolescent Girls or SABLA (SABLA)
Rajiv Gandhi Scheme for Empowerment of Adolescent Girls or SABLA, merging the erstwhile KSY and Nutrition Programme for Adolescent Girls (NPAG) schemes, has been formulated (2010) to address the multi‐dimensional problems of AGs. The services provided and the adolescent girls covered under SABLA are listed in Table below:
Table 6.2: Details of Nutrition and non-Nutrition components of the Scheme
Nutrition components Non-nutrition components
It consisted of Take Home Ration (THR) or Hot Cooked Meal for
(i) Non-school going girls in the age group of 11-14 years, and
(ii) All the girls in the age group of 14-18 years (both non-school going and school going).
This component consisted of
(i) Iron Folic Acid (IFA) supplementation and Health checkup etc., for the age group of 11-18 years of non-school going AGs;
(ii) Vocational training to the age group of 16-18 years of non-school going AGs; and
(iii) Nutrition and health education, guidance on family welfare and Life skill education etc., to the age group of 11-18 years of school going AGs.
The scheme was functional in 22 districts4 of the State using the platform of ICDS, of which six districts5 were covered under 20 test-checked districts of this performance audit.
Audit findings
6.2.1 Financial Management
SABLA was a centrally sponsored scheme and the financial assistance to the State Government was to be provided in four instalments for Supplementary Nutrition Programme (SNP) components and in two instalments for the non-SNP components by GoI.
6.2.1.1 Funding of Nutrition component
GoI was to share cost of nutrition up to the extent of 50 per cent of the financial norms6 or of the actual expenditure incurred, whichever was less and
4 Agra, Amethi, Bahraich, Banda, Bijnor, Bulandshahr, Chandauli, Chitrakoot, Deoria, Farrukhabad, Jalaun, Lalitpur, Lucknow, Maharajganj, Mahoba, Mirzapur, Pilibhit, Raebareli, Saharanpur, Shrawasti, Sitapur and Sonbhadra. 5 Agra, Banda, Bulundshahr, Deoria, Saharanpur and Sitapur.
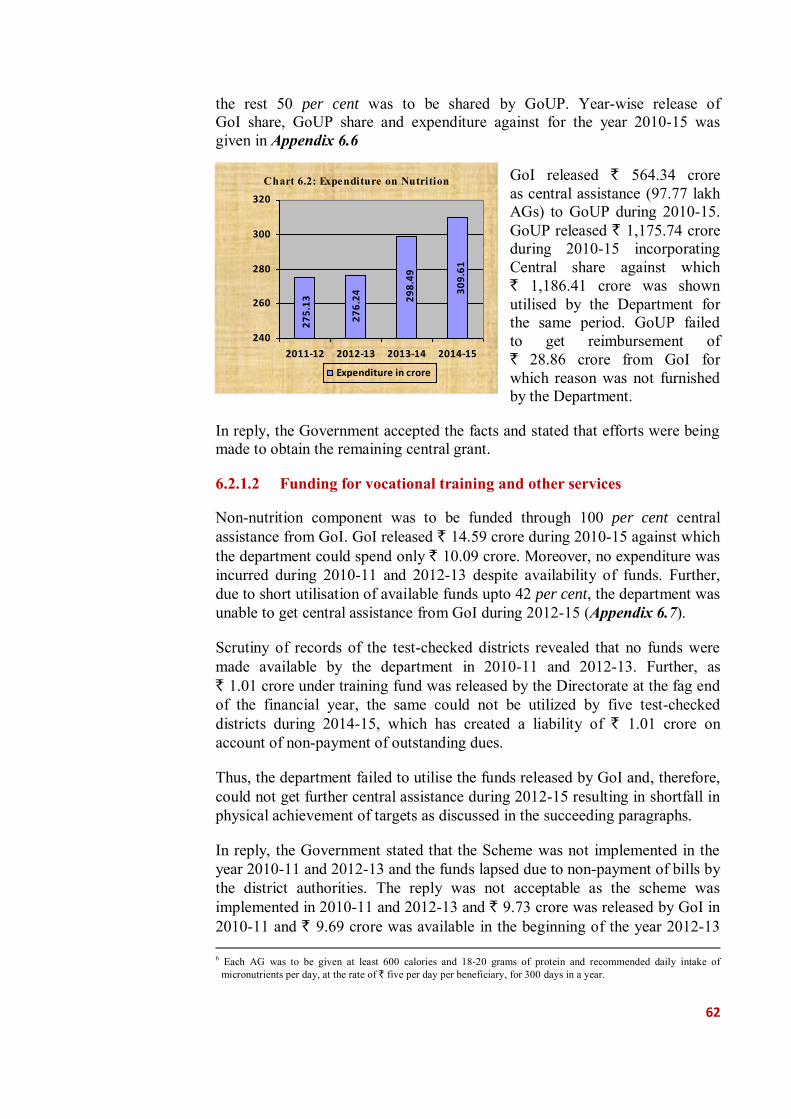
62
the rest 50 per cent was to be shared by GoUP. Year-wise release of GoI share, GoUP share and expenditure against for the year 2010-15 was given in Appendix 6.6
GoI released ` 564.34 crore as central assistance (97.77 lakh AGs) to GoUP during 2010-15. GoUP released ` 1,175.74 crore during 2010-15 incorporating Central share against which ` 1,186.41 crore was shown utilised by the Department for the same period. GoUP failed to get reimbursement of ` 28.86 crore from GoI for which reason was not furnished by the Department.
In reply, the Government accepted the facts and stated that efforts were being made to obtain the remaining central grant.
6.2.1.2 Funding for vocational training and other services
Non-nutrition component was to be funded through 100 per cent central assistance from GoI. GoI released ` 14.59 crore during 2010-15 against which the department could spend only ` 10.09 crore. Moreover, no expenditure was incurred during 2010-11 and 2012-13 despite availability of funds. Further, due to short utilisation of available funds upto 42 per cent, the department was unable to get central assistance from GoI during 2012-15 (Appendix 6.7).
Scrutiny of records of the test-checked districts revealed that no funds were made available by the department in 2010-11 and 2012-13. Further, as ` 1.01 crore under training fund was released by the Directorate at the fag end of the financial year, the same could not be utilized by five test-checked districts during 2014-15, which has created a liability of ` 1.01 crore on account of non-payment of outstanding dues.
Thus, the department failed to utilise the funds released by GoI and, therefore, could not get further central assistance during 2012-15 resulting in shortfall in physical achievement of targets as discussed in the succeeding paragraphs.
In reply, the Government stated that the Scheme was not implemented in the year 2010-11 and 2012-13 and the funds lapsed due to non-payment of bills by the district authorities. The reply was not acceptable as the scheme was implemented in 2010-11 and 2012-13 and ` 9.73 crore was released by GoI in 2010-11 and ` 9.69 crore was available in the beginning of the year 2012-13 6 Each AG was to be given at least 600 calories and 18‐20 grams of protein and recommended daily intake of
micronutrients per day, at the rate of ` five per day per beneficiary, for 300 days in a year.
Chart 6.2: Expenditure on Nutrition
27
5.1
3
27
6.2
4 30
9.6
1
29
8.4
9
240
260
280
300
320
2011-12 2012-13 2013-14 2014-15
Expenditure in crore
63
for the implementation of the scheme. As regards lapse of funds, government should have closely monitored the implementation of the scheme at district level to ensure that bills were paid timely by the district authorities.
6.2.2 Inadequate planning
The scheme guidelines issued by GoI provided for preparation of a plan to conduct baseline survey for identification of beneficiaries; to organize State, District and Project level workshops to introduce the scheme to the personnel of ICDS, functionaries of other Ministries/Departments and the implementing partners; to increase awareness/generate publicity about the scheme by developing IEC material; to establish effective convergence mechanism with other Departments7 at the State/UT/district/project/village level; and to select MNGOs/NGOs/CBOs for various non nutrition services in consultation with DMs, DPOs and CDPOs.
Scrutiny of records of the Directorate revealed that no such plan was prepared in the State for organising workshops, IEC activities and effective convergence mechanism with other departments/NGOs. This impacted the scheme adversely as non-nutrition components were not implemented, vocational training was not imparted to beneficiaries and huge number of beneficiaries were deprived of the benefits of supplementary nutrition. Further, scrutiny of records of test-checked districts also confirmed these facts.
In reply, the Government stated that Kishori Balika Module was provided with SABLA training kit, however, no reply was furnished in regard of planning.
6.2.3 Implementation
6.2.3.1 Nutrition Component
Take Home Ration (THR) at the rate of 150 gram per day in the form of amylase rich energy food was to be provided8 to each AG9 once in a week to meet required daily intake of protein and micronutrients of at least 600 calories and 18-20 grams of protein per day. For this purpose, ` Five per day was to be spent on each AG for 300 days in a year.
Scrutiny of records of test-checked six districts revealed that 13.45 lakh AGs were deprived of THR during 2011-15 (Appendix 6.8). This implied that 28.21 per cent of the eligible AGs did not get nutritional support under the scheme in these districts.
In reply, the Government stated that 85 per cent AGs were benefited under the component. Reply is not acceptable as the Government should have ensured
7 Education; Medical Health and Family Welfare; Labour and Employment; Youth Affairs; and PRIs. 8 Since November 2010. 9 11 to 14 years non-school going girls and all girls of 14 to 18 years.
64
availability of funds and THR for extending nutritional support to eligible AGs as intended in the scheme.
Recommendation: The Government should monitor and ensure that THR to all eligible adolescent girls is provided in all the districts as per approved scale.
6.2.3.2 Non-nutrition Component
Under this component, Iron Folic Acid (IFA) supplementation, Health check‐up and Referral services to out of school AGs of 11 to 18 years and Nutrition & Health Education (NHE), Counseling/Guidance on family welfare, Adolescent Reproductive & Sexual Health (ARSH), child care practices, Life Skill Education and accessing public services to all AGs of 11‐18 years were to be provided. Further, vocational training was to be imparted to all AGs in the age group of 16 to 18 years. The shortcomings noticed in audit are discussed in succeeding paragraphs.
(i) Lack of Vocational Training
Vocational training providers such as Central Government, State Government, public and private sector and industrial establishments were to provide counselling & vocational guidance, training facilities as per norms, post training support to trainees in getting employment, maintain data base on trainees trained and the outcome of the training. The department was to decide the number of girls and the suitable training modules for vocational training.
Audit scrutiny revealed that vocational training to AGs was not imparted in any of test-checked six districts during 2011-15 though ` 34.70 lakh given to the Director, Training and Employment Department, Lucknow during 2011-12 remained unspent. In absence of the vocational training, the AGs (aged 16-18 years) were deprived of skill development training required for improving their employability.
In reply, the Government accepted the facts and stated that efforts were being made to get the released fund returned.
Recommendation: The Government should ensure that vocational training is imparted to all adolescent girls as required under the scheme guidelines.
(ii) Inadequate supply of SABLA training KIT
A training kit was to be provided in every AWC to assist AGs in understanding various health, nutrition, social and legal issues. Activities were to be transacted in an interesting and interactive manner. The training kit contained a number of games and activities viz. flash cards, quiz games etc., to make learning process interactive and enjoyable.
65
Audit scrutiny revealed that only 26,084 training kits (10 per cent) against requirement of 2,60,865 kits10 in 52,173 AWC’s of 22 districts were provided in the year 2014-15 by the Directorate. Thus, due to inadequate supply of SABLA training kit, AGs were deprived in understanding various health, nutrition, social and legal issues in an interesting and interactive manner.
In reply, the Government stated that 150 SABLA training kits per project were provided, however in the test checked districts audit found that only 11 per cent (Appendix 6.9) SABLA training kits were provided during the year 2010-15.
Recommendation: The Government should ensure that training kits are supplied timely and issued to all AWCs as per scheme guidelines.
(iii) Non-maintenance of Kishori Card
A card for each AG, called as Kishori Card, was to be made available by the directorate and to be maintained at the AWC containing information regarding weight, height, Body Mass Index, IFA supplementation, referrals and services received under SABLA scheme.
Scrutiny of records of test-checked districts revealed that Kishori Cards were not made available by Director, ICDS to any of the districts during 2010-15. In absence of this card, health status of AGs could not be recorded, tracked and monitored.
In reply, the Government stated that Kishori Cards were provided in SABLA training kits. The reply was not acceptable as only 10 per cent SABLA training kits were provided in the State during the year 2010-15. Even then also, remaining 90 per cent AWCs were not provided with Kishori card.
6.3 Conclusions
● Kishori Shakti Yojana which has been implemented in 53 districts of the State covered only one per cent of the AGs and, therefore, had little impact on the nutritional status and vocational skills of AGs in the State. In comparison to KSY, the SABLA scheme implemented in remaining 22 districts of the State had much greater impact as it covered all AGs in the age group of 14 to 18 years and also non-school going AGs in the age group of 11 to 14 years.
(Paragraph 6.1.2)
● Under KSY no vocational and health training was imparted to AGs in 2012-13 while there were shortages ranging from 28 to 70 per cent in remaining four years.
(Paragraph 6.1.4) 10 One kit each to 52,173 AWCs per year for five years.
66
● Under SABLA scheme the funds allocation and utilization was much higher. However, 28 per cent of the eligible AGs were not provided Take Home Ration; vocational training was not imparted during 2011-15; and about 90 per cent of AWCs were not provided SABLA training kits.
(Paragraph 6.2.3.1 and 6.2.3.2 (i))
Thus, both the schemes viz., KSY and SABLA aimed at empowerment of adolescent girls had major structural and implementation deficiencies which led to denial of scheme benefits to majority of AGs in the State.


67
Chapter 7:
Crime Against Women
Introduction
Crime against women includes any act of gender-based violence that results in, or is likely to result in, physical, sexual or psychological harm or suffering to women, including threats of such acts, coercion or arbitrary deprivation of liberty, whether occurring in public or private life. The Constitution of India recognized equality rights of women in Articles 14, 15 and 16. Article 15 (3) allowed the State for making special provisions for women and children to prohibit discrimination on grounds of religion, race, caste, sex or place of birth. Despite the constitutional provisions and different gender specific laws in place, the problem of violence and crime against women has acquired phenomenal proportion.
The incidence of crime against women in India have been increasing continuously with 2.13 lakh reported cases in 2010 which rose to 3.37 lakh reported cases in 2014 registering a growth of 58 per cent in last four years. According to the report of National Crime Records Bureau (NCRB) for the year 2014, Uttar Pradesh earned the dubious distinction of leading the list of States where crime against women in 2014 was highest, accounting for 11.4 per cent of the total number of incidence of crime against women in the country.
Violence and crime against women is a social problem which is linked to gender inequality and violates the right of women to live without fear with freedom and dignity. The Committee on Crime Statistics setup by the Ministry of Statistics and Programme Implementation, GoI in their report submitted in June 2011 stated that it has been recognised that a sizable portion of criminal events are never reported to the police and are therefore not included in police or any other statistics. Further, the committee had concluded that NCRB captures even less than 0.16 per cent of the total crime against women. The National Family Health Survey-3 (latest) which collected data on ‘Help seeking by women’ who were victims of violence, brought out that only 2.1 per cent of the women who experience physical and sexual violence sought assistance from institutional sources such as police. The above findings of the NFHS would entail that the law enforcement authorities in the State should not be complacent about the relatively lower registered crime rate per one lakh of women population.
Audit analysed various crime data in respect of the State and financial and other support schemes implemented by the State Government for providing help, compensation, protection and rehabilitation of victims, and our findings are discussed below:
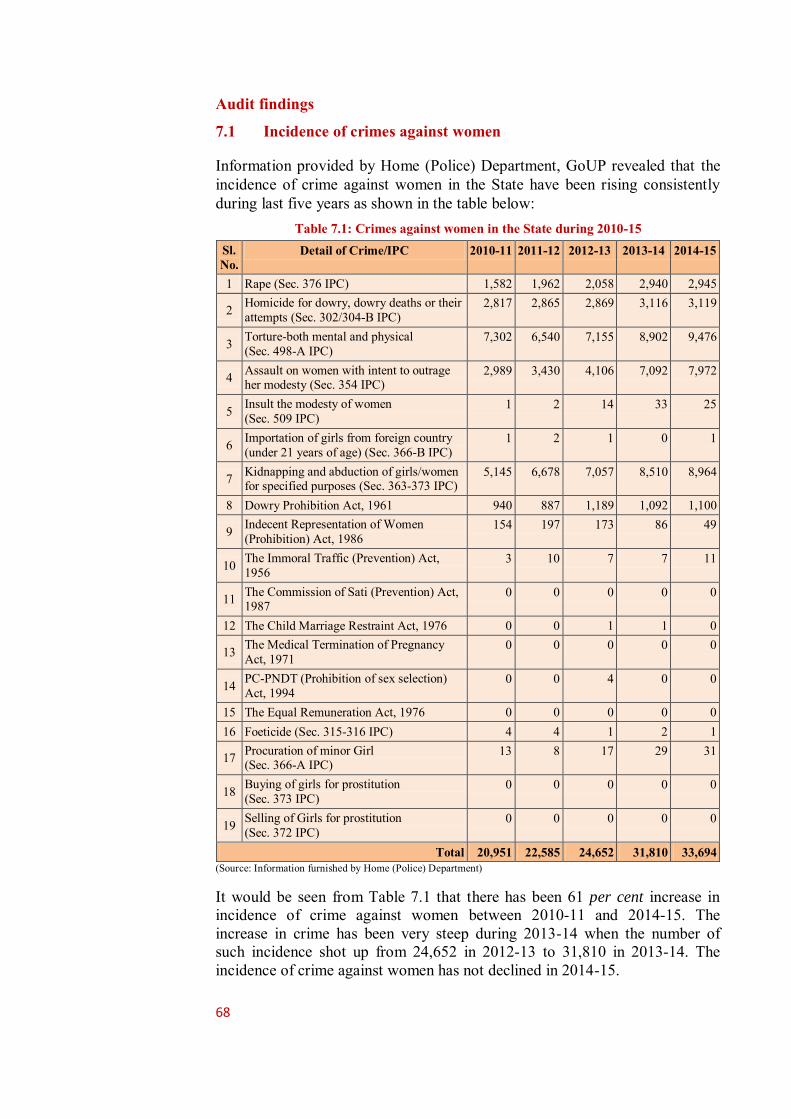
68
Audit findings 7.1 Incidence of crimes against women
Information provided by Home (Police) Department, GoUP revealed that the incidence of crime against women in the State have been rising consistently during last five years as shown in the table below:
Table 7.1: Crimes against women in the State during 2010-15 Sl. No.
Detail of Crime/IPC 2010-11 2011-12 2012-13 2013-14 2014-15
1 Rape (Sec. 376 IPC) 1,582 1,962 2,058 2,940 2,945
2 Homicide for dowry, dowry deaths or their attempts (Sec. 302/304-B IPC)
2,817 2,865 2,869 3,116 3,119
3 Torture-both mental and physical (Sec. 498-A IPC)
7,302 6,540 7,155 8,902 9,476
4 Assault on women with intent to outrage her modesty (Sec. 354 IPC)
2,989 3,430 4,106 7,092 7,972
5 Insult the modesty of women (Sec. 509 IPC)
1 2 14 33 25
6 Importation of girls from foreign country (under 21 years of age) (Sec. 366-B IPC)
1 2 1 0 1
7 Kidnapping and abduction of girls/women for specified purposes (Sec. 363-373 IPC)
5,145 6,678 7,057 8,510 8,964
8 Dowry Prohibition Act, 1961 940 887 1,189 1,092 1,100
9 Indecent Representation of Women (Prohibition) Act, 1986
154 197 173 86 49
10 The Immoral Traffic (Prevention) Act, 1956
3 10 7 7 11
11 The Commission of Sati (Prevention) Act, 1987
0 0 0 0 0
12 The Child Marriage Restraint Act, 1976 0 0 1 1 0
13 The Medical Termination of Pregnancy Act, 1971
0 0 0 0 0
14 PC-PNDT (Prohibition of sex selection) Act, 1994
0 0 4 0 0
15 The Equal Remuneration Act, 1976 0 0 0 0 0 16 Foeticide (Sec. 315-316 IPC) 4 4 1 2 1
17 Procuration of minor Girl (Sec. 366-A IPC)
13 8 17 29 31
18 Buying of girls for prostitution (Sec. 373 IPC)
0 0 0 0 0
19 Selling of Girls for prostitution (Sec. 372 IPC)
0 0 0 0 0
Total 20,951 22,585 24,652 31,810 33,694 (Source: Information furnished by Home (Police) Department)
It would be seen from Table 7.1 that there has been 61 per cent increase in incidence of crime against women between 2010-11 and 2014-15. The increase in crime has been very steep during 2013-14 when the number of such incidence shot up from 24,652 in 2012-13 to 31,810 in 2013-14. The incidence of crime against women has not declined in 2014-15.
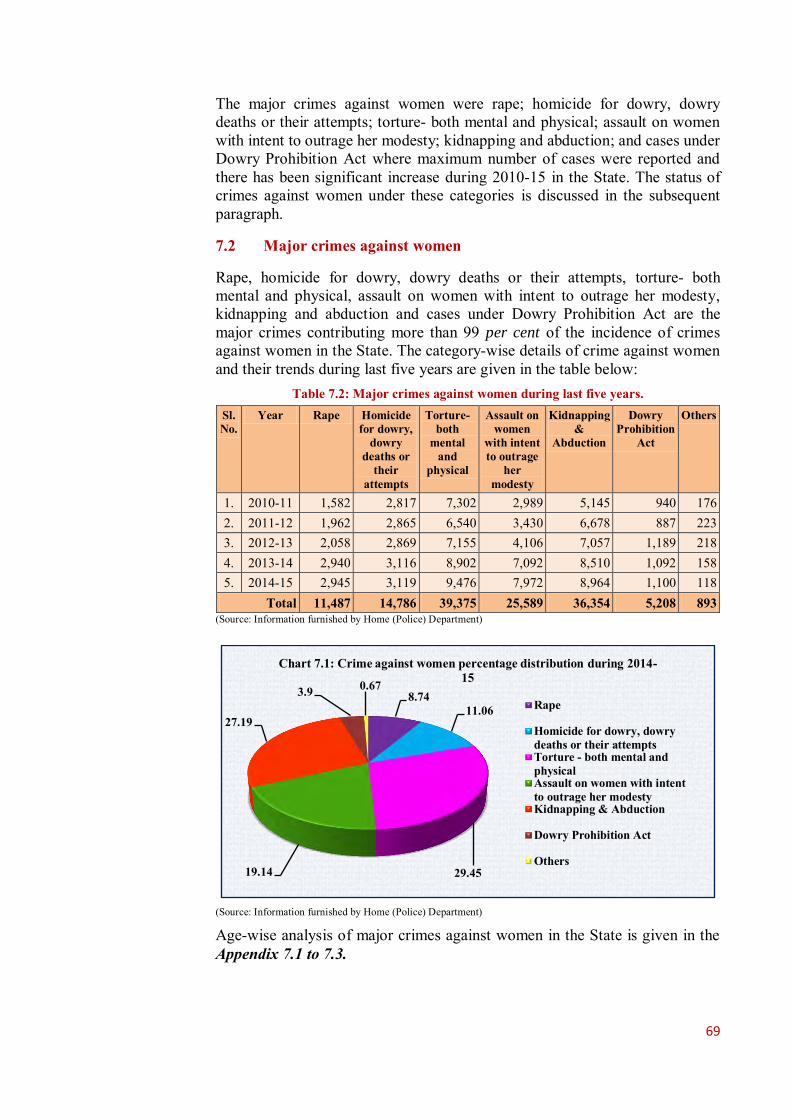
69
The major crimes against women were rape; homicide for dowry, dowry deaths or their attempts; torture- both mental and physical; assault on women with intent to outrage her modesty; kidnapping and abduction; and cases under Dowry Prohibition Act where maximum number of cases were reported and there has been significant increase during 2010-15 in the State. The status of crimes against women under these categories is discussed in the subsequent paragraph.
7.2 Major crimes against women
Rape, homicide for dowry, dowry deaths or their attempts, torture- both mental and physical, assault on women with intent to outrage her modesty, kidnapping and abduction and cases under Dowry Prohibition Act are the major crimes contributing more than 99 per cent of the incidence of crimes against women in the State. The category-wise details of crime against women and their trends during last five years are given in the table below:
Table 7.2: Major crimes against women during last five years. Sl. No.
Year Rape Homicide for dowry,
dowry deaths or
their attempts
Torture- both
mental and
physical
Assault on women
with intent to outrage
her modesty
Kidnapping &
Abduction
Dowry Prohibition
Act
Others
1. 2010-11 1,582 2,817 7,302 2,989 5,145 940 176 2. 2011-12 1,962 2,865 6,540 3,430 6,678 887 223 3. 2012-13 2,058 2,869 7,155 4,106 7,057 1,189 218 4. 2013-14 2,940 3,116 8,902 7,092 8,510 1,092 158 5. 2014-15 2,945 3,119 9,476 7,972 8,964 1,100 118
Total 11,487 14,786 39,375 25,589 36,354 5,208 893 (Source: Information furnished by Home (Police) Department)
(Source: Information furnished by Home (Police) Department)
Age-wise analysis of major crimes against women in the State is given in the Appendix 7.1 to 7.3.
8.74 11.06
29.45 19.14
27.19
3.9 0.67
Chart 7.1: Crime against women percentage distribution during 2014-15
Rape
Homicide for dowry, dowrydeaths or their attemptsTorture - both mental andphysicalAssault on women with intentto outrage her modestyKidnapping & Abduction
Dowry Prohibition Act
Others

70
We in audit observed that: ● Legally, rape has been defined in different sub-sections of section 375 and punishments are provisioned in sections 376 (1) and (2), 376 A, 376 B, 376 C, 376 D and 376 E of the Indian Penal Code (IPC). The number of rape cases increased (43 per cent) suddenly during 2013-14 and 2014-15 over the previous year. The most alarming fact is that the largest number (59 per cent) of victims of rape were minor girls (Appendix 7.1). Increase in the number of rape cases during last two years has been very significant (44 per cent in age group upto 10 years, 57 per cent in the age group 11 to 18 years, 27 per cent in the age group above 18 years). Districts with highest number of reported cases of rape during 2010-15 were Aligarh (392), Moradabad (377), Allahabad (348), Meerut (346) and Agra and Lucknow (328 each).
● There was 11 per cent increase in cases of homicide for dowry, dowry deaths or their attempts during last five years. Also, the number of reported cases under Dowry Prohibition Act, 1961 increased from 940 in 2010-11 to 1,100 in 2014-15 (17 per cent).
● The cases of Torture-both mental and physical increased from 7,302 in 2010-11 to 9,476 in 2014-15. There has been significant increase of 24 per cent in 2013-14 over the previous year.
● The cases of assault on women with intent to outrage her modesty have increased from 2989 in 2010-11 to 7972 in 2014-15. Maximum number (55 per cent) of victims for the said crime were minor girls (Appendix 7.2). In the year 2013-14 there was an increase of 73 per cent in the cases of assault on women. Districts with highest number of reported cases of assault on women with intent to outrage her modesty during 2010-15 were Lucknow (1205), Meerut (1125), Aligarh (1067), Agra (979) and Allahabad (767) in the State.
● The cases of kidnappings/abductions also increased consistently during 2010-15 with significant increase in 2013-14 and 2014-15. In this category of crime also, the maximum number (71 per cent) of victims were minor girls. For details see Appendix 7.3. Top five districts in the State with reported number of cases of kidnappings/abductions during 2010-15 were Aligarh (1524), Kanpur Nagar (1511), Agra (1502), Lucknow (1274) and Meerut (1109).
During discussion in exit conference (December 2015) the Government assured to take required action against the fact while taking its cognizance.
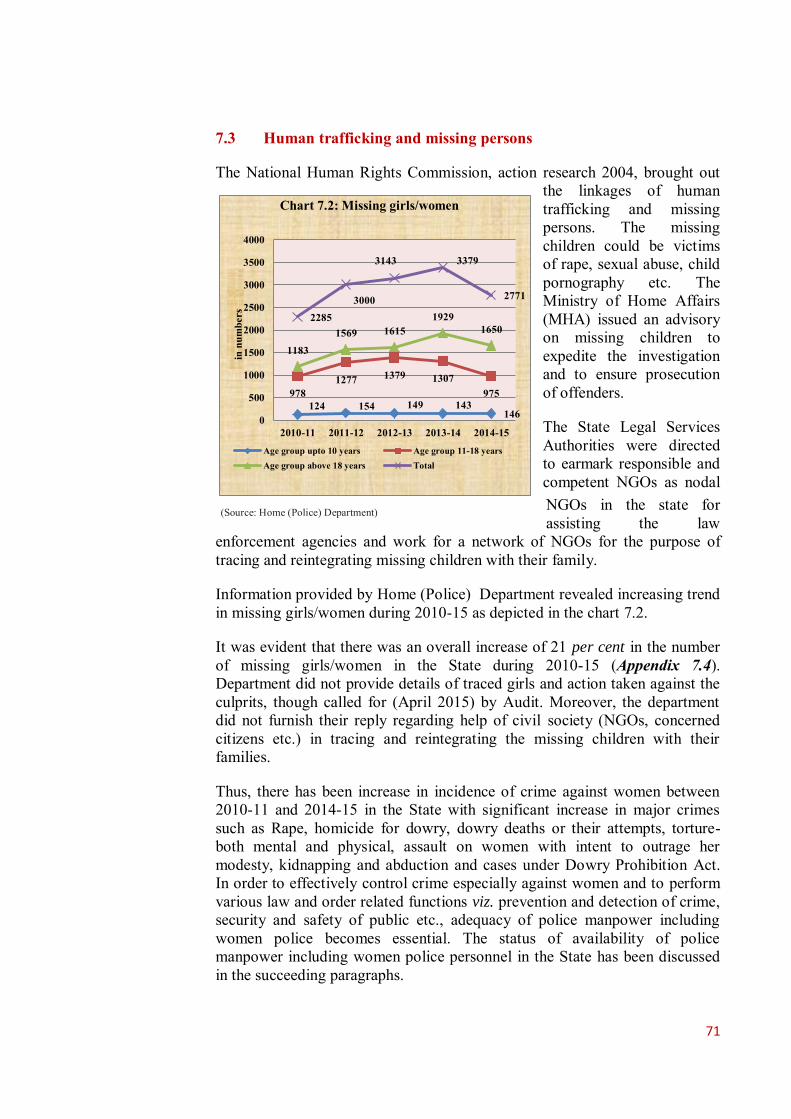
71
7.3 Human trafficking and missing persons
The National Human Rights Commission, action research 2004, brought out the linkages of human trafficking and missing persons. The missing children could be victims of rape, sexual abuse, child pornography etc. The Ministry of Home Affairs (MHA) issued an advisory on missing children to expedite the investigation and to ensure prosecution of offenders.
The State Legal Services Authorities were directed to earmark responsible and competent NGOs as nodal NGOs in the state for assisting the law
enforcement agencies and work for a network of NGOs for the purpose of tracing and reintegrating missing children with their family.
Information provided by Home (Police) Department revealed increasing trend in missing girls/women during 2010-15 as depicted in the chart 7.2.
It was evident that there was an overall increase of 21 per cent in the number of missing girls/women in the State during 2010-15 (Appendix 7.4). Department did not provide details of traced girls and action taken against the culprits, though called for (April 2015) by Audit. Moreover, the department did not furnish their reply regarding help of civil society (NGOs, concerned citizens etc.) in tracing and reintegrating the missing children with their families.
Thus, there has been increase in incidence of crime against women between 2010-11 and 2014-15 in the State with significant increase in major crimes such as Rape, homicide for dowry, dowry deaths or their attempts, torture- both mental and physical, assault on women with intent to outrage her modesty, kidnapping and abduction and cases under Dowry Prohibition Act. In order to effectively control crime especially against women and to perform various law and order related functions viz. prevention and detection of crime, security and safety of public etc., adequacy of police manpower including women police becomes essential. The status of availability of police manpower including women police personnel in the State has been discussed in the succeeding paragraphs.
124 154 149 143 146
978 1277 1379 1307
975
1183 1569 1615
1929 1650
2285 3000
3143 3379
2771
0
500
1000
1500
2000
2500
3000
3500
4000
2010-11 2011-12 2012-13 2013-14 2014-15
Chart 7.2: Missing girls/women
Age group upto 10 years Age group 11-18 yearsAge group above 18 years Total
in n
umbe
rs
(Source: Home (Police) Department)
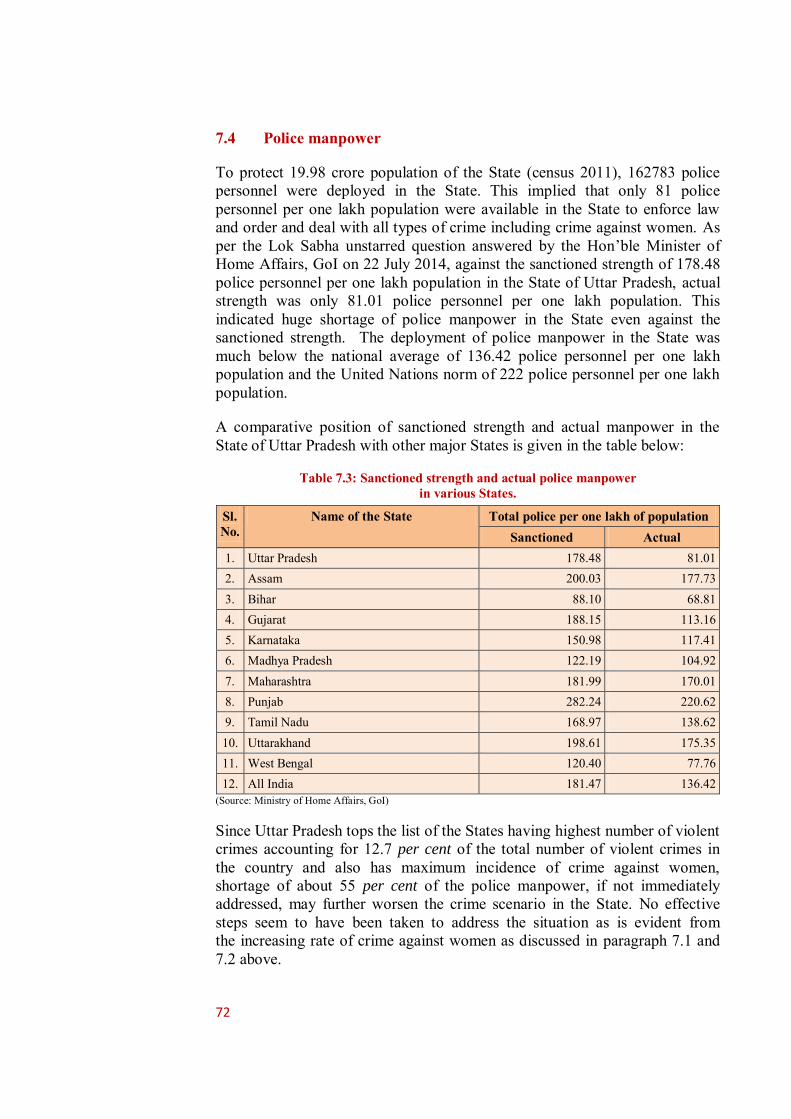
72
7.4 Police manpower
To protect 19.98 crore population of the State (census 2011), 162783 police personnel were deployed in the State. This implied that only 81 police personnel per one lakh population were available in the State to enforce law and order and deal with all types of crime including crime against women. As per the Lok Sabha unstarred question answered by the Hon’ble Minister of Home Affairs, GoI on 22 July 2014, against the sanctioned strength of 178.48 police personnel per one lakh population in the State of Uttar Pradesh, actual strength was only 81.01 police personnel per one lakh population. This indicated huge shortage of police manpower in the State even against the sanctioned strength. The deployment of police manpower in the State was much below the national average of 136.42 police personnel per one lakh population and the United Nations norm of 222 police personnel per one lakh population.
A comparative position of sanctioned strength and actual manpower in the State of Uttar Pradesh with other major States is given in the table below:
Table 7.3: Sanctioned strength and actual police manpower in various States.
Sl. No.
Name of the State Total police per one lakh of population Sanctioned Actual
1. Uttar Pradesh 178.48 81.01 2. Assam 200.03 177.73 3. Bihar 88.10 68.81 4. Gujarat 188.15 113.16 5. Karnataka 150.98 117.41 6. Madhya Pradesh 122.19 104.92 7. Maharashtra 181.99 170.01 8. Punjab 282.24 220.62 9. Tamil Nadu 168.97 138.62 10. Uttarakhand 198.61 175.35 11. West Bengal 120.40 77.76 12. All India 181.47 136.42
(Source: Ministry of Home Affairs, GoI)
Since Uttar Pradesh tops the list of the States having highest number of violent crimes accounting for 12.7 per cent of the total number of violent crimes in the country and also has maximum incidence of crime against women, shortage of about 55 per cent of the police manpower, if not immediately addressed, may further worsen the crime scenario in the State. No effective steps seem to have been taken to address the situation as is evident from the increasing rate of crime against women as discussed in paragraph 7.1 and 7.2 above.
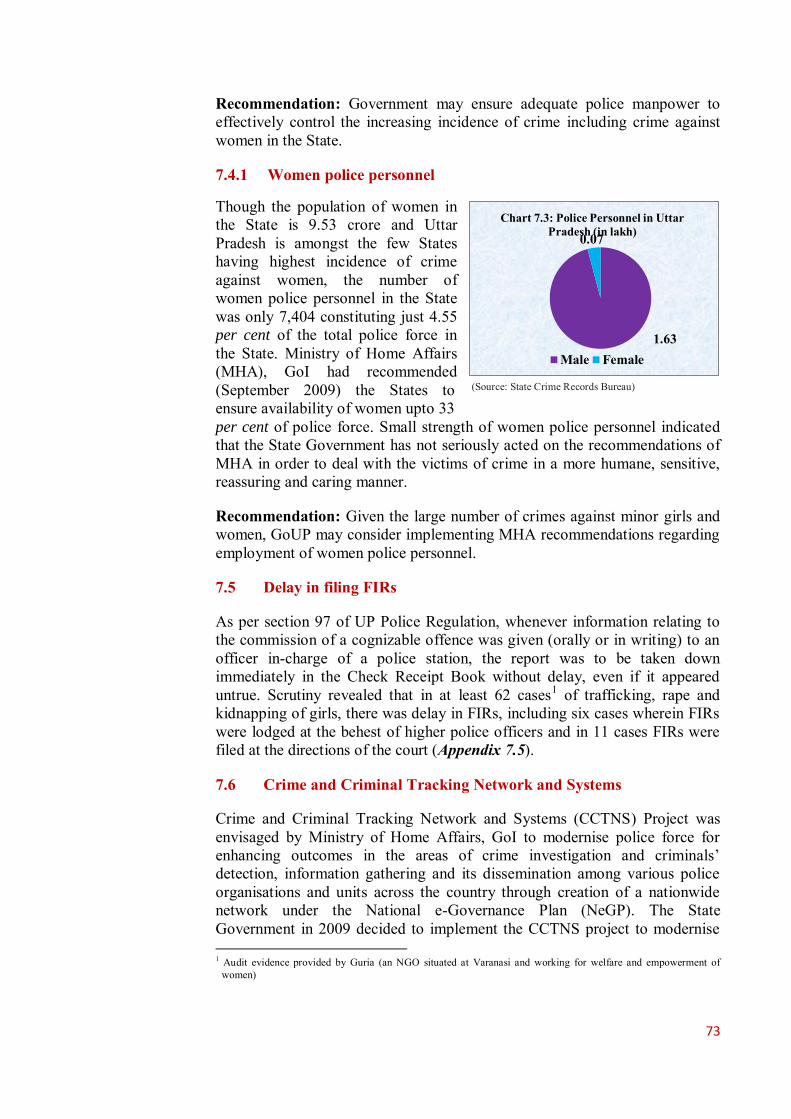
73
(Source: State Crime Records Bureau)
Recommendation: Government may ensure adequate police manpower to effectively control the increasing incidence of crime including crime against women in the State.
7.4.1 Women police personnel
Though the population of women in the State is 9.53 crore and Uttar Pradesh is amongst the few States having highest incidence of crime against women, the number of women police personnel in the State was only 7,404 constituting just 4.55 per cent of the total police force in the State. Ministry of Home Affairs (MHA), GoI had recommended (September 2009) the States to ensure availability of women upto 33 per cent of police force. Small strength of women police personnel indicated that the State Government has not seriously acted on the recommendations of MHA in order to deal with the victims of crime in a more humane, sensitive, reassuring and caring manner.
Recommendation: Given the large number of crimes against minor girls and women, GoUP may consider implementing MHA recommendations regarding employment of women police personnel.
7.5 Delay in filing FIRs
As per section 97 of UP Police Regulation, whenever information relating to the commission of a cognizable offence was given (orally or in writing) to an officer in-charge of a police station, the report was to be taken down immediately in the Check Receipt Book without delay, even if it appeared untrue. Scrutiny revealed that in at least 62 cases1 of trafficking, rape and kidnapping of girls, there was delay in FIRs, including six cases wherein FIRs were lodged at the behest of higher police officers and in 11 cases FIRs were filed at the directions of the court (Appendix 7.5).
7.6 Crime and Criminal Tracking Network and Systems
Crime and Criminal Tracking Network and Systems (CCTNS) Project was envisaged by Ministry of Home Affairs, GoI to modernise police force for enhancing outcomes in the areas of crime investigation and criminals’ detection, information gathering and its dissemination among various police organisations and units across the country through creation of a nationwide network under the National e-Governance Plan (NeGP). The State Government in 2009 decided to implement the CCTNS project to modernise 1 Audit evidence provided by Guria (an NGO situated at Varanasi and working for welfare and empowerment of
women)
1.63
0.07 Chart 7.3: Police Personnel in Uttar
Pradesh (in lakh)
Male Female

74
its police force. CCTNS Core Application Software (CAS) functionalities included four basic modules for Registration, Investigation, Prosecution, and Search and Reporting and a portal for providing Citizen interface. CCTNS aims at creating a comprehensive and integrated system for enhancing the efficiency and effectiveness of policing at all levels especially at the Police Station level through creation of a nationwide networked infrastructure for evolution of state-of-art tracking system.
The implementation of the project has, however, been considerably delayed in the State. Except for registration of FIRs, other functionalities/ modules of CAS are rarely being used by the police stations and higher offices though made functional. Further, Citizen centric services envisaged to be made available through Police portal and via SMS have not yet been made fully functional. Detailed findings on the implementation of this project are included in Chapter 2 of CAG’s Report No. 01 of 2016.
Due to delays in the implementation of CCTNS project, modernisation of police infrastructure has been adversely affected and the outcomes in the areas of crime investigation and criminals’ detection, information gathering and its dissemination among various police organisations and units across the country have been impacted.
Recommendation: GoUP may issue directions for effective use of all functionalities of CAS such as investigation, prosecution, search and reporting to enhance operational efficiency of the police department.
7.7 Compensation Schemes for victims of crimes
Financial assistance cannot compensate for the agony and mental stress a woman suffers due to heinous crimes such as rape, acid attack etc. Compensation schemes were formulated by GoI and GoUP from time to time to assist the victims in overcoming the trauma and provide support to lead a dignified and meaningful life. The implementation status of two such schemes viz. ‘Financial Assistance and Support Services to the Victims of Rape: A Scheme for Restorative Justice’ of GoI and ‘The Uttar Pradesh Victim Compensation Scheme’ of GoUP is discussed in succeeding paragraphs.
7.7.1 Financial Assistance and Support Services to the Victims of Rape
Under the direction2 of the Hon’ble Supreme Court, a scheme for restorative justice was formulated by GoI as ‘Financial Assistance and Support Services to Victims of Rape: A Scheme for Restorative Justice’. Under the scheme, Criminal Injuries Relief & Rehabilitation Boards at districts and state level were to be set up. The Scheme envisages total cash assistance of ` 1.50 lakh as well as restorative support services such as counselling, shelter, medical and legal aid upto ` 0.50 lakh.
2 Writ petition (criminal) number 362/93 (Delhi Domestic Working Women’s Forum versus Union of India and others).
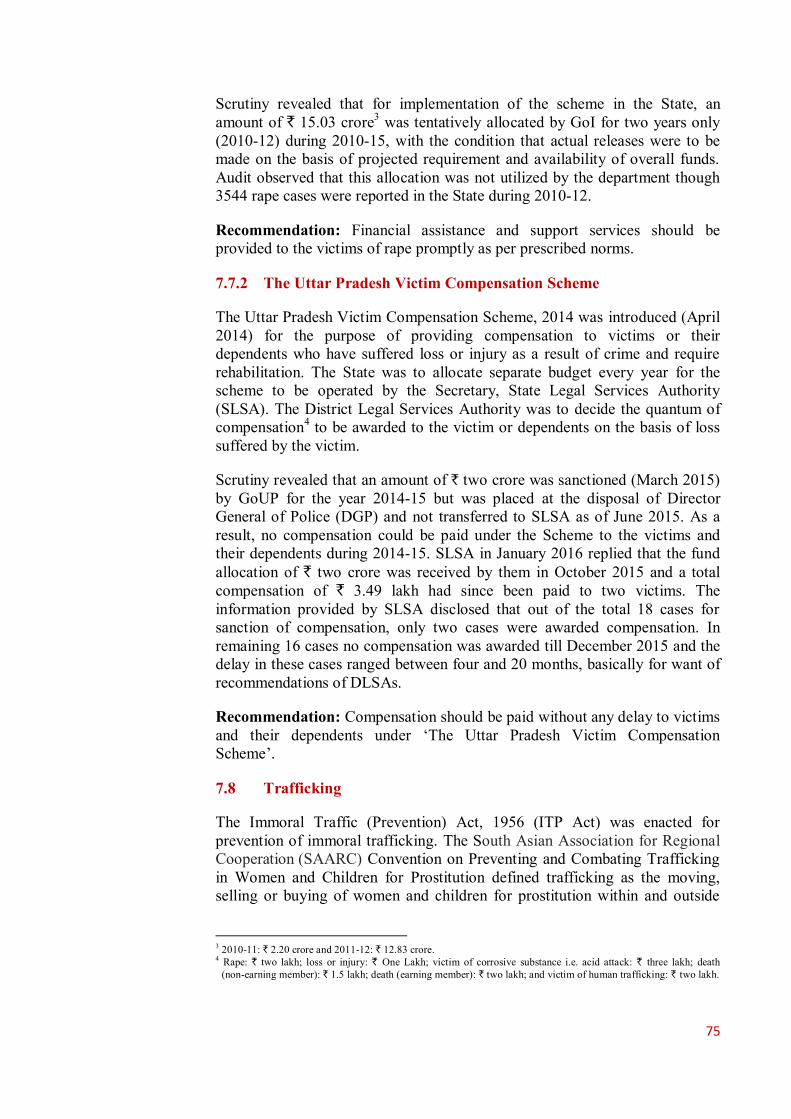
75
Scrutiny revealed that for implementation of the scheme in the State, an amount of ` 15.03 crore3 was tentatively allocated by GoI for two years only (2010-12) during 2010-15, with the condition that actual releases were to be made on the basis of projected requirement and availability of overall funds. Audit observed that this allocation was not utilized by the department though 3544 rape cases were reported in the State during 2010-12.
Recommendation: Financial assistance and support services should be provided to the victims of rape promptly as per prescribed norms.
7.7.2 The Uttar Pradesh Victim Compensation Scheme
The Uttar Pradesh Victim Compensation Scheme, 2014 was introduced (April 2014) for the purpose of providing compensation to victims or their dependents who have suffered loss or injury as a result of crime and require rehabilitation. The State was to allocate separate budget every year for the scheme to be operated by the Secretary, State Legal Services Authority (SLSA). The District Legal Services Authority was to decide the quantum of compensation4 to be awarded to the victim or dependents on the basis of loss suffered by the victim.
Scrutiny revealed that an amount of ` two crore was sanctioned (March 2015) by GoUP for the year 2014-15 but was placed at the disposal of Director General of Police (DGP) and not transferred to SLSA as of June 2015. As a result, no compensation could be paid under the Scheme to the victims and their dependents during 2014-15. SLSA in January 2016 replied that the fund allocation of ` two crore was received by them in October 2015 and a total compensation of ` 3.49 lakh had since been paid to two victims. The information provided by SLSA disclosed that out of the total 18 cases for sanction of compensation, only two cases were awarded compensation. In remaining 16 cases no compensation was awarded till December 2015 and the delay in these cases ranged between four and 20 months, basically for want of recommendations of DLSAs.
Recommendation: Compensation should be paid without any delay to victims and their dependents under ‘The Uttar Pradesh Victim Compensation Scheme’.
7.8 Trafficking
The Immoral Traffic (Prevention) Act, 1956 (ITP Act) was enacted for prevention of immoral trafficking. The South Asian Association for Regional Cooperation (SAARC) Convention on Preventing and Combating Trafficking in Women and Children for Prostitution defined trafficking as the moving, selling or buying of women and children for prostitution within and outside
3 2010-11: ` 2.20 crore and 2011-12: ` 12.83 crore. 4 Rape: ` two lakh; loss or injury: ` One Lakh; victim of corrosive substance i.e. acid attack: ` three lakh; death
(non-earning member): ` 1.5 lakh; death (earning member): ` two lakh; and victim of human trafficking: ` two lakh.
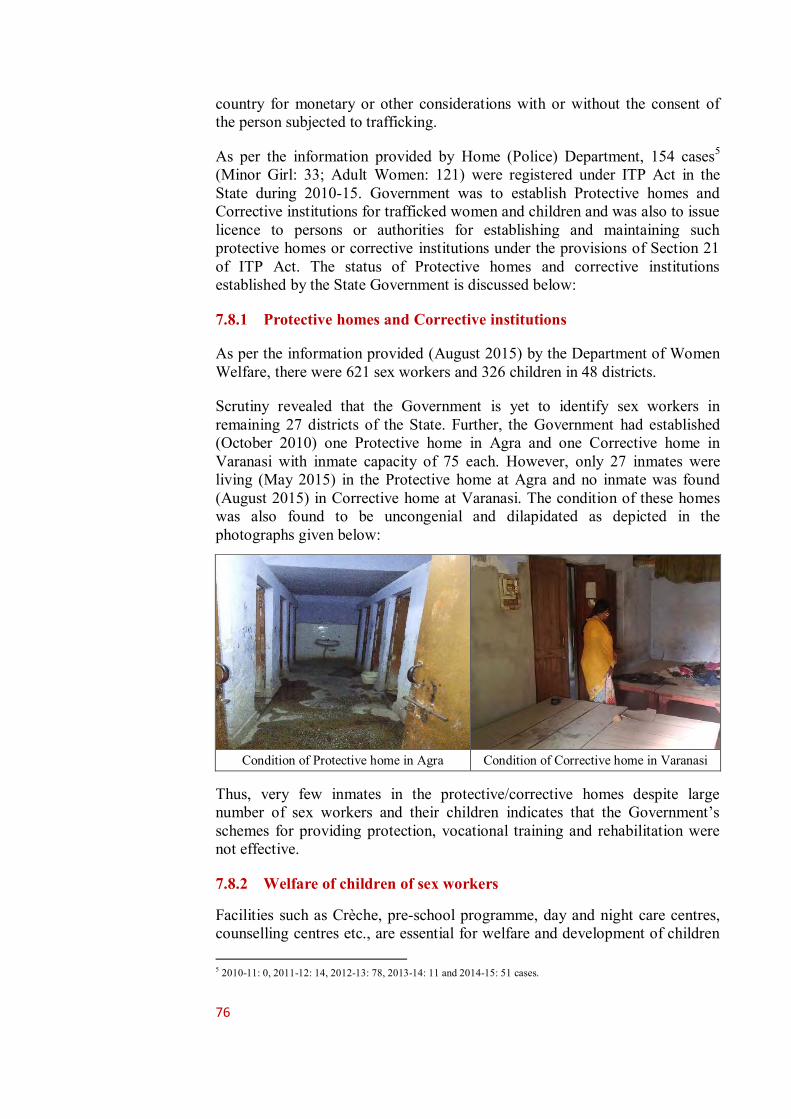
76
country for monetary or other considerations with or without the consent of the person subjected to trafficking.
As per the information provided by Home (Police) Department, 154 cases5 (Minor Girl: 33; Adult Women: 121) were registered under ITP Act in the State during 2010-15. Government was to establish Protective homes and Corrective institutions for trafficked women and children and was also to issue licence to persons or authorities for establishing and maintaining such protective homes or corrective institutions under the provisions of Section 21 of ITP Act. The status of Protective homes and corrective institutions established by the State Government is discussed below:
7.8.1 Protective homes and Corrective institutions
As per the information provided (August 2015) by the Department of Women Welfare, there were 621 sex workers and 326 children in 48 districts.
Scrutiny revealed that the Government is yet to identify sex workers in remaining 27 districts of the State. Further, the Government had established (October 2010) one Protective home in Agra and one Corrective home in Varanasi with inmate capacity of 75 each. However, only 27 inmates were living (May 2015) in the Protective home at Agra and no inmate was found (August 2015) in Corrective home at Varanasi. The condition of these homes was also found to be uncongenial and dilapidated as depicted in the photographs given below:
Condition of Protective home in Agra Condition of Corrective home in Varanasi
Thus, very few inmates in the protective/corrective homes despite large number of sex workers and their children indicates that the Government’s schemes for providing protection, vocational training and rehabilitation were not effective.
7.8.2 Welfare of children of sex workers
Facilities such as Crèche, pre-school programme, day and night care centres, counselling centres etc., are essential for welfare and development of children 5 2010-11: 0, 2011-12: 14, 2012-13: 78, 2013-14: 11 and 2014-15: 51 cases.

77
of sex workers. Scrutiny revealed that no action plan was prepared by the department to extend such facilities to the children of sex workers to ensure that they get adequate opportunities for a potentially bright future and get reintegrated with the society and do not join the sex trade.
During discussion in exit conference (December 2015), while taking cognizance of the fact, the Government assured to take required action.
7.9 UJJAWALA- Rescue and Rehabilitation of trafficked women
Introduction
Ujjawala is a scheme for the prevention of trafficking, rescue and rehabilitation of women and child victims of trafficking for commercial sexual exploitation. The scheme was launched in 2007 by the Ministry of Women and Child Development. It aims at reintegration and repatriation of victims including cross border victims.
The target groups or main beneficiaries of this scheme are women and child victims who have been trafficked for commercial sexual exploitation as well as those women and children who are vulnerable to becoming victims of this crime. These vulnerable sections include slum dwellers, children of sex workers, refugees, homeless victims of natural disasters, etc.
The scheme is being implemented in the State by the Department of Women Welfare through various Non-Governmental Organizations (NGOs) to provide direct aid and benefit to victims of trafficking. Immediate relief provided under the scheme includes provision of food, shelter, trauma care and counseling to the rescued victims. Later on, victims are also to be provided skill training, capacity building, job placement and guidance in income generating activities to empower them and help them live independently.
Ujjawala is a Centrally Sponsored scheme with GoI providing 90 per cent share of expenditure and balance 10 per cent being met by the implementing agency (NGO). The norms for providing grants to NGOs for Ujjawala projects are given in (Appendix 7.6). Component-wise assistance were directly provided to implementing agencies (NGOs) in two installments by the GoI. The first installment being normally released with the sanction of the project and the second and subsequent installments are to be released after submission of Utilisation Certificates (UCs) by the implementing agencies for the previous installments alongwith their own proportionate share of cost. Utilisation certificates provided by the Directorate revealed that only ` 66.07 lakh were released by GoI against which a total expenditure of ` 56.02 lakh was incurred during 2010-15.
Implementation
7.9.1 Non-functioning of Ujjawala projects
As per information provided by the Directorate, Women Welfare, only 13 Ujjawala projects were implemented in the State during 2010-11 to 2014-15. Details of the projects are given in Appendix 7.7. The scheme had five main

78
components, i.e., prevention, rescue, rehabilitation, re-integration and repatriation. Scrutiny however, revealed that only one (Barabanki district) out of these 13 Ujjawala projects sanctioned was covering all the five components of the scheme.
Audit examination further disclosed that out of 13 Ujjawala projects sanctioned by the Government, only three projects (Allahabad, Pratapgarh and Unnao) covering four components viz. prevention, rescue, rehabilitation and re-integration were located in the test checked districts. Audit found all the three projects closed and the District Probation Officer stated that the projects were not functional in the districts.
Audit further observed that no grants were released to NGOs in 2011-12 and 2014-15. It was also noticed that grants were released to 13 projects for a period ranging between six and 15 months only and second and subsequent installments were not released to 12 projects. No specific reasons were furnished by the Department for non-release of second installment. Since, NGOs are largely dependent on government grants (90 per cent) for running of the projects, non-release of grant in 12 out of 13 projects for a longer period indicated that the scheme had become largely non-functional. Although, Directorate Women Welfare stated that these 12 Ujjawala projects were running.
On being pointed out Directorate, Women Welfare replied that this problem persisted due to non-release of funds from GoI. Further, during discussion in exit conference, Government assured to take required action on the reported fact.
7.9.2 Non-coverage of border districts
Scheme guidelines envisaged for setting-up of transit centers viz. transit camp, food and other incidentals at border-check points in respect of cross border victims.
As per the report6 of the United Nations Office on Drugs and Crime (UNODC), districts of Uttar Pradesh adjoining Nepal were transit area and vulnerable to trafficking of women and girls. However, scrutiny of records of directorate, women welfare revealed that no Ujjawala home was established in districts7 bordering Nepal. Thus, one of the objectives of scheme to facilitate rescue and repatriation of cross-border victims was not ensured.
During discussion in exit conference, Government took the cognisance of the fact and assured to take required action.
7.9.3 Monitoring
As per guidelines, a State Level Monitoring Committee was to be formed under the Chairmanship of Principal Secretary, Woman Welfare Department 6 India Country assessment report – A review commissioned by UNODC. 7 Bahraich, Lakhimpur Khiri, Maharajganj, Pilibhit, Shrawasti and Siddhartnagar.
79
GoUP which was to meet at least twice a year to monitor the project. Further, the continuation of grant to the implementing agency was to be based on the satisfactory performance reported by the State. It was also envisaged that periodic inspection would be undertaken by the State. Separately periodic evaluations of the project were also to be undertaken by external agency such as reputed institutions, Panchayati Raj Institutions (PRI), block level institution and district level institution.
Scrutiny revealed that the State Level Monitoring Committee under the chairmanship of Principal Secretary, Woman Welfare Department was not formed. Further, periodic evaluations of the projects through reputed institutions, PRIs, block level institution and district level institution was not done. Norms/inspection schedules for periodic inspection were also not laid down by the Directorate.
On being pointed out in Audit, Directorate Women Welfare did not provide any specific reply, however, during discussion in exit conference, Government stated to take required action on the fact.
7.10 Conclusions ● Incidence of crime against women have been increasing consistently during last five years. The incidence of such crimes in the State are much higher as compared to all India average and most of the other States.
(Paragraph 7.1)
● The number of serious crimes against women such Rape, homicide for dowry, dowry deaths or their attempts, torture- both mental and physical, assault on women with intent to outrage her modesty, kidnapping and abduction and cases under Dowry Prohibition Act have increased considerably.
(Paragraph 7.2)
● Despite high incidence of crime, the State Government has not taken effective steps to significantly strengthen its police force as the actual police manpower per one lakh population in the State is amongst the lowest in the country.
(Paragraph 7.4)
● The Government schemes for providing financial and other support to the victims have not been implemented effectively. No financial assistance was provided under the scheme 'Financial Assistance and Support Services to the Victims of Rape' despite substantial allocation by GoI and there have been delays in release of compensation under The Uttar Pradesh Victim Compensation Scheme, and
(Paragraph 7.7.1 & 7.7.2)

80
● The Ujjawala projects for trafficked women were mostly non-functional. Further, no Ujjawala homes were established in districts bordering Nepal. Major destination centres for trafficking had no Ujjawala projects.
(Paragraph 7.9.1 & 7.9.2)


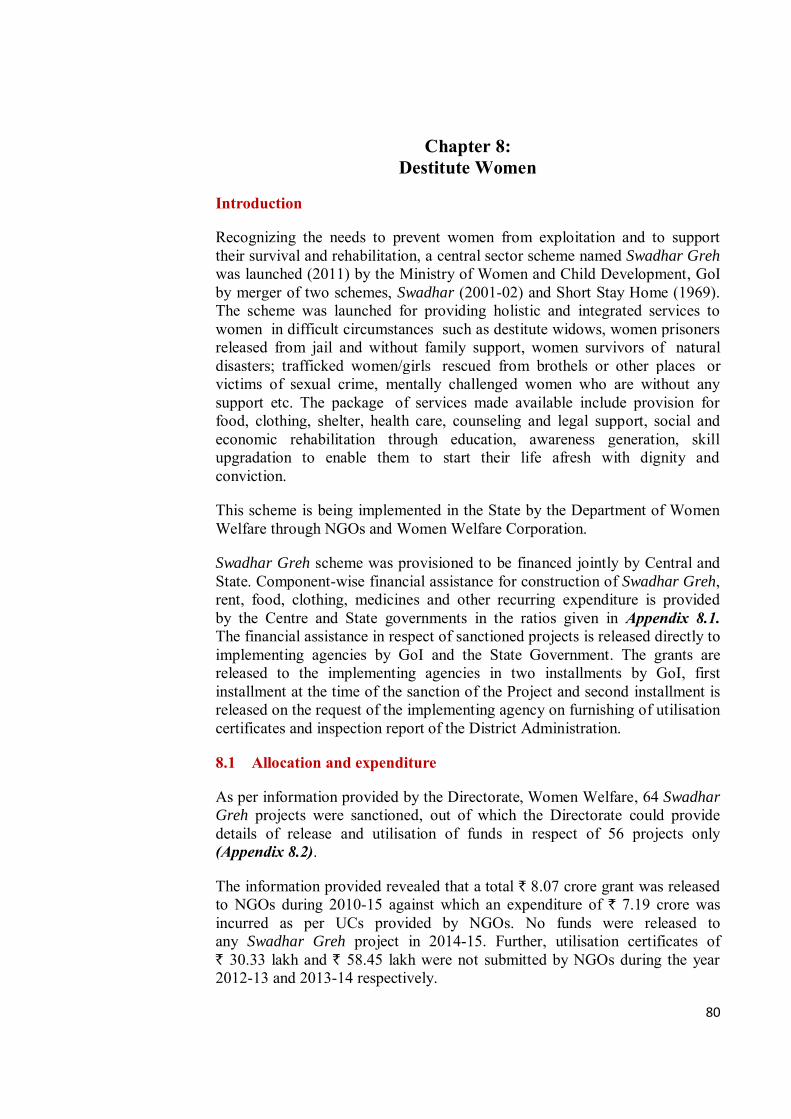
80
Chapter 8: Destitute Women
Introduction
Recognizing the needs to prevent women from exploitation and to support their survival and rehabilitation, a central sector scheme named Swadhar Greh was launched (2011) by the Ministry of Women and Child Development, GoI by merger of two schemes, Swadhar (2001-02) and Short Stay Home (1969). The scheme was launched for providing holistic and integrated services to women in difficult circumstances such as destitute widows, women prisoners released from jail and without family support, women survivors of natural disasters; trafficked women/girls rescued from brothels or other places or victims of sexual crime, mentally challenged women who are without any support etc. The package of services made available include provision for food, clothing, shelter, health care, counseling and legal support, social and economic rehabilitation through education, awareness generation, skill upgradation to enable them to start their life afresh with dignity and conviction.
This scheme is being implemented in the State by the Department of Women Welfare through NGOs and Women Welfare Corporation.
Swadhar Greh scheme was provisioned to be financed jointly by Central and State. Component-wise financial assistance for construction of Swadhar Greh, rent, food, clothing, medicines and other recurring expenditure is provided by the Centre and State governments in the ratios given in Appendix 8.1. The financial assistance in respect of sanctioned projects is released directly to implementing agencies by GoI and the State Government. The grants are released to the implementing agencies in two installments by GoI, first installment at the time of the sanction of the Project and second installment is released on the request of the implementing agency on furnishing of utilisation certificates and inspection report of the District Administration.
8.1 Allocation and expenditure
As per information provided by the Directorate, Women Welfare, 64 Swadhar
Greh projects were sanctioned, out of which the Directorate could provide details of release and utilisation of funds in respect of 56 projects only (Appendix 8.2).
The information provided revealed that a total ` 8.07 crore grant was released to NGOs during 2010-15 against which an expenditure of ` 7.19 crore was incurred as per UCs provided by NGOs. No funds were released to any Swadhar Greh project in 2014-15. Further, utilisation certificates of ` 30.33 lakh and ` 58.45 lakh were not submitted by NGOs during the year 2012-13 and 2013-14 respectively.

81
8.1.1 Irregular sanction of grant
Scrutiny of records of test-checked districts revealed that a Swadhar Greh established by an NGO (Navyug Gramodyog Samiti, Naini, Allahabad) in 2009-10 had informed the State Government about the closure of Swadhar
Greh project in September 2013 due to financial constraint.
The Department of Women Welfare, GoUP, however, failed to inform the GoI about the closure of Swadhar Greh project by the NGO. Consequently, grant1 of ` 7.61 lakh was released (September 2014) by GoI to the NGO for running the Swadhar Greh in the financial year 2013-14 also.
On this being pointed out by the Audit, Directorate, Women Welfare informed that a departmental enquiry was being conducted for irregular release of grant to NGO.
8.2 Implementation
The Swadhar Greh scheme envisions a supportive institutional framework for woman victim of difficult circumstances so that she could lead her life with dignity and conviction. It envisages that shelter, food, clothing and health as well as economic and social security are assured for such women. The benefit of the scheme was to be provided to women beneficiaries above the age of 18 years. Under the scheme new Swadhar Greh was to be setup in every district with capacity of 30 women. We observed in Audit that:
8.2.1 Non-establishment of District Women’s Welfare Committee
District Women’s Welfare Committee (DWWC) headed by District Magistrate including at least two women members was to be constituted in every district to look after the affairs of every Swadhar Greh in the district. DWWCs were to conduct need assessment in their respective districts and inform the State Government about the estimated number of destitute women so that the proposed Swadhar Greh could accommodate these destitute women. Further, DWWC was responsible for providing accreditation, forwarding and recommending proposals, sending recommendations for release of installments of the grant, undertaking periodic monitoring of the functioning of Swadhar Grehs in their districts.
Scrutiny of records of the Directorate and test-checked districts revealed that DWWCs were not formed in any of the districts. Hence, important functions of the Committee including need assessment and recommending proposals in the districts could not be performed. Therefore, the magnitude of prevalence of destitution in women in the districts remained un-assessed.
On being pointed out Directorate, Women Welfare confirmed the facts. Further, during discussion in exit conference, Government stated to take required action against reported facts and audit comments. 1 Building rent: ` 1.125 lakh; administrative expenditure: ` 3.00 lakh; office contingencies: ` 0.03 lakh; medical
expenses: ` 0.15 lakh; food of residents: ` 3.00 lakh; and pocket money: ` 0.30 lakh.
82
8.2.2 Non-establishment of Swadhar Greh in each district
As per guideline, Swadhar Greh was to be established in each district with intake capacity of 30 women.
Scrutiny revealed that Swadhar Greh were established in only 42 out of 75 districts in the State as of March 2015 in which five districts2 reported closure of scheme (Appendix 8.3).
Recommendation: The Government should undertake need based assessment to establish Swadhar Greh of required capacity in every district for destitute women.
8.2.3 Non-convergence with other programmes
The scheme guideline envisaged to establish necessary linkages with other programmes such as Non Formal Education, Skill Development and other programmes being implemented by GoUP and GoI.
Scrutiny of records of the Directorate, Women Welfare revealed that the State Department as well as implementing agencies had not established necessary linkages with other programme such as non-formal education, skill development, etc. Thus, the objective of upliftment and economic rehabilitation of inmates of Swadhar Greh through linkage with other programmes could not be ensured.
On being pointed out in Audit, Directorate Women Welfare did not provide any specific reply, however, during discussion in exit conference, Government stated to take required action against the fact.
Recommendation: The Government should ensure convergence with other departments for effective implementation of the Scheme.
8.3 Improper functioning of Swadhar Greh
As per information provided by the Directorate, 56 Swadhar Greh were running in the State. Only eight Swadhar Greh
3 were running in seven4
districts out of 20 test-checked districts. Scrutiny of records and joint physical inspection (JPI) of these eight Swadhar Greh conducted by Audit along with the representative of Department of Women Welfare revealed grossly inadequate infrastructure, excess reporting of beneficiaries, lack of support services, non-rehabilitation of inmates and improper maintenance of records. Various shortcomings noticed in running of Swadhar Greh are detailed in Appendix 8.4.
2 Allahabad, Azamgarh, Deoria, Jhansi and Varanasi 3 Chitrakoot Jan Kalyan Samiti, Banda, Jagriti, Ashtabhuja Nagar, Pratapgarh, Maxon Gromodyog Samiti, Charbag,
Lucknow at Pratapgarh, Panchsheel Swadhar Greh, Agra, Pragati Pathgamini, Sitapur Road, Lucknow at Ambedkar Nagar, Swadhar, Titowa, Sant Kabir Nagar, Lohia Public School Samiti, Lucknow at Sitapur, Avadh
Grameen Vikas Sansthan, Sultanpur. 4 Agra, Ambedkar Nagar, Banda, Pratapgarh, Sant Kabir Nagar, Sitapur and Sultanpur.
83
Swadhar Greh : Avadh Grameen Vikas Sansthan, Sultanpur
Recommendation: Government should ensure functioning of Swadhar Grehs as per provisions of Scheme Guidelines in regards to infrastructure, support services and rehabilitation of inmates.
8.4 Monitoring
A State Level Monitoring Committee was to be formed under the chairpersonship of Principal Secretary, Women Welfare Department, which was to meet at least twice a year to monitor the projects. At district level DWWC was responsible for periodic monitoring of the functioning of Swadhar Greh scheme. Swadhar Greh were to be monitored continuously by the District Administration in order to ensure their smooth functioning, identifying groups and suggesting steps that would lead to their better functioning.
Scrutiny of records of the directorate and test-checked districts revealed that the monitoring committees were not formed at State and districts level.
On being pointed out Directorate, Women Welfare replied that no such committees were constituted at district and State level.
Recommendation: The Government should constitute state and district level monitoring committees and ensure their regular meetings for effective implementation of the Scheme.
8.5 Conclusions
● District Women Welfare Committees for planning and implementation of the Swadhar Greh scheme in the districts were not constituted; as a result, the magnitude of prevalence of destitution in women in the districts remained un-assessed.
(Paragraph 8.2.1)
● Swadhar Grehs were not established in about half of the districts in the State depriving the destitute women of these districts of much needed help and support in the form of food, clothing, shelter, health care, counselling and social and economic rehabilitation.
(Paragraph 8.2.2)
● Inadequate infrastructure, excess reporting of beneficiaries, lack of support services, non-rehabilitation of inmates and improper maintenance of records were found in Swadhar Grehs, functioning in test checked districts.
(Paragraph 8.3)

85
Chapter 9:
Conclusions and Recommendations
9.1 Planning and Financial Management
● Government of UP has not adopted the Gender Budgeting even after 10 years of declaration of the State Women Policy statement and was not maintaining gender based budget data/information about allocation and expenditure.
(Paragraph 2.1.1)
Recommendation: The Government should take immediate steps to setup Gender Budgeting cells in its departments immediately and implement gender responsive budgeting in a time bound manner.
● Gender segregated data was not maintained by programme implementing agencies and, therefore, proper identification of beneficiaries, accurate need assessment of financial and other resources required, and setting realistic performance targets and goals were not feasible.
(Paragraph 2.1.2)
Recommendation: Gender segregated data should be maintained by the implementing agencies at all levels for proper planning and efficient implementation of the scheme and ensuring that the specific needs of women and girl child are taken care of adequately to minimise gender gap/disparities.
● In schemes such as PC-PNDT, MTP, MDR, Family Planning, KSY and UPVCS, there were significant savings ranging from 46 to 100 per cent indicating non-achievement of targets/goals in respect of these schemes due to lack of proper planning and inefficient implementation by implementing agencies and ineffective monitoring by the governance structure.
(Paragraph 2.2)
9.2 Missing Daughters Pre-Conception and Pre-natal Diagnostic Techniques (Prohibition of Sex Selection) Act, 1994
● The department was not ensuring timely submission of application for renewal by USG centres and taking action against the defaulters as prescribed Format H (where details about USG centre such as date of receipt of application, Name, address of applicant, etc. are mentioned) was not maintained. Thus, these centres functioned as deemed to have been registered during the intervening period.
(Paragraph 3.1.4.1) Recommendation: The Department should ensure timely renewal of registration to avoid functioning of centres as ‘deemed registered’.
86
● Irregularities such as illegal operations of ultrasound machines could not be ruled out as effective monitoring and inspection of all the USG centres in the district was not possible in the absence of proper maintenance of mandatory records and non-receipt of prescribed returns.
(Paragraph 3.1.4.3)
Recommendation: The Department should ensure the proper maintenance/up keep of mandatory records at USG centres as well as at DAA level.
● No inspection schedule was prescribed by GoUP for the period between April 2010 and June 2013. Only 4,681 inspections (25 per cent) were conducted by DAAs during 2014-15 against 18488 targeted in the State while only 1,561 against required 6608 inspections were carried out by DAAs of test-checked districts during 2014-15. Thus, there was a shortfall of 76 per
cent in inspections in the test checked districts.
(Paragraph 3.1.4.4)
Recommendation: The Government should ensure regular inspection of USG centres by District Appropriate Authorities.
● The department did not take any action for mapping of sale of USG equipment and also did not call for information regarding sale, installation and possession of USG equipment from the manufacturers, suppliers, dealers, etc., Therefore, number of USG equipment installed and the location of their placement were not known to the authorities to regulate the use of all the ultrasound machines. In absence of these information the possibility of misuse of ultrasound machines could not be ruled out.
(Paragraph 3.1.4.6)
Recommendation: The Government should effectively monitor the sale, supply and installation of USG machines to regulate and ensure their proper use as per PC-PNDT Act.
● The department did not know the whereabouts of the machines sealed for breach of the provisions of PCPNDT Act as one sealed machine was found to have been sold and two other machines were found to have been removed from the centres, without any intimation to the department.
(Paragraph 3.1.4.9)
Recommendation: The Department should ensure effective tracking of seized machines to avoid their unauthorised usages.
● Important provisions of PC-PNDT Act such as non-maintenance of patient details, non-submission of returns etc. were breached by 58 percent USG centres, however, neither any action was taken nor was any penalty imposed on the defaulting USG centres.
(Paragraph 3.1.4.11)

87
Recommendation: The Department should ensure adherence to the provision of the Act by USG centres and penal action should be taken against the defaulting centres.
● On one hand SSB, SAC and DACs did not meet regularly and on the other, they did not ensure proper follow up action on the decisions taken and directions given by them. This rendered the entire system of monitoring, created under the provisions of the PC-PNDT Act, ineffective and largely dysfunctional.
(Paragraph 3.1.5.2)
Recommendation: The Government should ensure regular meetings of SAC and DAC for monitoring the proper implementation of the provisions of Act.
● SIMC did not conduct adequate inspections of USG centres and failed to discharge their responsibility to monitor and ensure the proper implementation of PC-PNDT Act.
(Paragraph 3.1.5.3)
Recommendation: The Government should ensure regular inspection by SIMC for enforcement of the provisions of the Act.
● No dedicated toll free phone line was established as of October 2015 for registration of complaints violating the direction of SSB to establish a website and provide a dedicated toll free phone number for registering complaints.
(Paragraph 3.1.6)
Recommendation: The Government should establish a dedicated toll free phone line for registration of complaints and should also effectively monitor redressal of grievances by maintaining a separate database of complaints received relating to violations of PC-PNDT Act.
Medical Termination of Pregnancy Act, 1971
● As 1.19 lakh (out of 2.8 lakh) Medical Termination of Pregnancies were conducted during the year 2010-14 in the State pertained to rural areas having 46 CHCs registered under the Act, possibility of operation of large number of unauthorised MTP centres in smaller towns in the vicinity of rural areas cannot be ruled out.
(Paragraph 3.2.3)
● Only six per cent of 773 Community Health Centres (CHCs) in the State were having MTP facilities. As a result, majority of women in rural areas had no access to safe abortion services at affordable cost and reasonable distance from their habitations.
(Paragraph 3.2.3)
Recommendation: The Government should increase MTP facilities in rural areas by registering more CHCs under the Act.
88
● Only 548 (26.3 per cent) of 2,083 nursing homes/hospitals, having MTP facilities and operating in test-checked districts, were registered under MTP Act. Safe and hygienic conditions were not ensured in 226 un-registered CHCs in test checked districts while it was observed that in 7 out of 226 un-registered CHCs/PHCs had carried out terminations.
(Paragraph 3.2.4.1)
● Due to lack of inspections and monitoring, the department failed to recognize unregistered centres conducting MTPs and number of MTPs cases shown by the department was un-realistic as the department did not ensure reporting from unregistered hospitals.
(Paragraph 3.2.5.3)
Recommendation: The Government should ensure regular meetings of DLC and required inspection by CMOs, for effective monitoring of the provisions of the Act.
9.3 Controlling Maternal Mortality
Janani SurakhshaYojna
● Target for institutional deliveries was only 1.24 crore (46 per cent of registered pregnant women). Inadequate government health facilities, lack of access to government health centres and non-affordability of private nursing homes/hospitals may have forced rural poor to depend more on home deliveries to be done by unskilled birth attendant.
(Paragraph 4.1.2)
Recommendations:
(a) Achievement of targets for institutional deliveries should be ensured in all the districts of the State especially with higher population of rural poor.
(b) Adequate health infrastructure may be created in rural areas by establishing more CHCs/PHCs/Sub-Centres as per norms to ensure safe and hygienic institutional deliveries.
(c) Transparent system should be adopted by the Department for fixing the targets of institutional deliveries.
● Total number of safe deliveries in the State including Government institutions, Private nursing homes/hospitals and home deliveries by skill attendants would work out to 154.25 lakh against total registered pregnancies of 266.01 lakh during the period 2010-15. This implied that a large number of rural poor approximately 111.76 lakh (42 per cent) had to depend on home deliveries by unskilled birth attendants.
(Paragraph 4.1.3)
Recommendations:
(a) The shortfalls in achievement of targets for home deliveries by SBAs should be minimized by proper monitoring.
89
(b) Health infrastructure and Skilled Birth Attendant network in rural areas should be strengthened to minimize the number of unsafe deliveries through unskilled attendants.
Maternal Death Review
● Large number of maternal deaths (85 per cent) remained unreported and 86 per cent of maternal deaths remained un-reviewed to find the gaps in the service delivery and to ensure corrective measure.
(Paragraph 4.2.2)
Recommendation: The Government should put in place a more effective system to ensure that every case of maternal death is reported and reviewed to ascertain service delivery gaps for taking corrective measures.
Family Planning Programme
● 49 per cent of allotted funds (` 380.57 crore) under the scheme remained unutilized during 2010-15.
(Paragraph 4.3.1)
● Target fixed for females (tubectomy) was 20 times higher than the target fixed for males (vasectomy); while achievement for tubectomy was 41 times the achievement for vasectomy in terms of absolute numbers.
(Paragraph 4.3.2)
● There was short-fall in achievement of IUD targets ranging from 41 to 47 per cent while no targets were set for most common and non-invasive methods viz. oral-pills and condoms.
(Paragraph 4.3.3) Recommendations:
● The Government should enhance awareness in the society through IEC activities to increase inclination towards vasectomy and set prudent targets for both vasectomy and tubectomy.
● The Government should enhance awareness in the society through IEC activities to adopt spacing methods for family planning.
9.4 Improving Health and Nutritional Support Integrated Child Development Services (ICDS) Scheme
● The Department did not have authentic data relating to nutritional and anaemic status of girls and women, which deprived the Department from preparing plans to cater to the specific needs of girls and women to reduce the prevalence of anaemia among them.
(Paragraph 5.2.2)
Recommendation: The Government should evolve a mechanism to obtain gender segregated data at State level especially in respect of important
90
nutritional deficiencies for formulation of specific plan of action and taking corrective measures.
● Against the requirement of 2,85,429 AWCs in the State, only 1,90,145 AWCs (67 per cent) were sanctioned and 1,87,997 AWCs (66 per cent) were actually functional. Less number of functional AWCs, as compared to prescribed norms resulted in ineffective delivery of services.
(Paragraph 5.3.1)
Recommendation: The Government should ensure opening of AWCs as per population norms for effective implementation of the Scheme.
● Adequate infrastructure/basic amenities were not available in most of the AWCs thereby putting children, pregnant women and lactating mothers to lots of inconvenience and discomfort.
(Paragraph 5.3.2)
Recommendation: The Government should ensure required infrastructure and basic amenities at all AWCs for providing hygienic and safe environment to children and pregnant women/lactating mothers visiting AWCs.
● The State had 3.21 crore to 3.44 crore pregnant women, lactating mothers and children between six months and six years of age, however, supplementary nutrition was provided to only 2.33 crore to 2.52 crore beneficiaries. Hence, 22 to 32 per cent pregnant women, lactating mothers and children were deprived of the benefits of supplementary nutrition programme during 2010-15.
(Paragraph 5.4.1.1 (ii))
● Nutritional support was provided to the beneficiaries ranging between 20 to 22 days in a month and 240 to 269 days in a year during 2010-15 against the prescribed norms of 25 days per month and 300 days per year.
(Paragraph 5.4.1.1 (iii))
Recommendation: The Government should ensure distribution of supplementary nutrition to all eligible beneficiaries for minimum required 300 days to reduce and eliminate malnutrition among them.
● Number of girls not attending PSE activities has exponentially increased from three per cent in 2010-11 to 33 per cent in 2014-15.
(Paragraph 5.4.1.3 (i))
Recommendation: The Government should ensure supply of pre-school kits to AWCs every year for providing pre-school education to beneficiaries through non-formal methods.
● Pre-natal and post-natal health check-up services are inadequate as pre-natal and post-natal cards were not issued to expectant/lactating mothers in 217 (72 per cent) out of 300 test checked AWCs.
(Paragraph 5.4.2.1)
91
Recommendation: The Government should improve pre-natal and post-natal health check-up facilities at AWCs.
● Only ` 19.75 crore (34 per cent) of released amount of ` 58 crore was utilized for purchase of medicine kits during 2010-15 within the respective financial year. Medicine kits for common ailments like fever, cold, worm infection etc., were not supplied to 1,87,997 AWCs (100 per cent) in the State in 2012-13 and about 50 per cent AWCs were not issued medicine kits in 2011-12 and 2014-15.
(Paragraph 5.4.2.1 (i))
Recommendation: The Government should ensure supply of medicine kits to all AWCs without interruption for providing basic medical facilities to beneficiaries at AWCs.
● Records of referred patients containing name, age, reason for referral, date of referral, place where referred, details of treatment given and outcome of treatment was not maintained in 247 (82 per cent) out of 300 test checked AWCs. As such, referral services were neglected in AWCs.
(Paragraph 5.4.2.2)
Recommendation: The Government should ensure effective referral services at AWCs.
● Monitoring and Evaluation Committees at district, block and AWC level neither met regularly nor the functionaries of ICDS conducted regular inspections of AWCs. The revised web-based MIS was also not implemented in AWCs in the State.
(Paragraph 5.6)
Recommendation: The Government should ensure regular meetings of various committees and inspections by ICDS functionaries as per norms for effective monitoring of the scheme.
9.5 Adolescent Girls
Kishori Shakti Yojana
● Against the total population of 70,74,240 AGs, only 35,100 AGs were covered under the KSY scheme during 2012-15. Hence, only one per cent of the AGs in these districts could be covered under KSY. In other words, 99 per
cent of the AGs in the districts were deprived of the nutritional support and vocational training.
(Paragraph 6.1.2)
Recommendation: The Government should expand the scope of the scheme to cover all adolescent girls, on the lines of SABLA.

92
● Shortfall was noticed in imparting training ranging between 28 and 70 per cent, except in 2012-13 when training was not imparted, and in test-checked districts shortfall was 87 per cent.
(Paragraph 6.1.4)
Recommendation: The Government should ensure that training is imparted to all eligible AGs and availability of requisite training funds to districts.
Rajiv Gandhi Scheme for Empowerment of Adolescent Girls or SABLA
● An expenditure of ` 1,186.41 crore was incurred on the scheme during 2010-15 incorporating Central share of ` 564.34 crore and 97.77 lakh adolescent girls were covered under the scheme.
(Paragraph 6.2.1.1)
● Take Home Ration (THR) was not provided to 13.45 lakh adolescent girls in the test checked districts during 2011-15. This implied that 28.21 per cent of the eligible AGs did not get nutritional support under the scheme in these districts.
(Paragraph 6.2.3.1)
Recommendation: The Government should monitor and ensure that THR to all eligible adolescent girls is provided in all the districts as per approved scale.
● Vocational training was not imparted to any adolescent girls in any six test-checked districts during 2011-15.
(Paragraph 6.2.3.2 (i))
Recommendation: The Government should ensure that vocational training is imparted to all adolescent girls as required under the scheme guidelines.
● Only 26,084 training kits (10 per cent) against requirement of 2,60,865 kits in 52,173 AWC’s of 22 districts covered under the scheme were provided in the year 2014-15.
(Paragraph 6.2.3.2 (ii))
Recommendation: The Government should ensure that training kits are supplied timely and issued to all AWCs as per scheme guidelines.
9.6 Crime Against Women
● The incidence of crime against women in the State have been rising consistently during last five years. There has been 61 per cent increase in incidence of crime against women between 2010-11 and 2014-15. The increase in crime has been very steep during 2013-14 when the number of such incidence shot up from 24,652 in 2012-13 to 31,810 in 2013-14. The incidence of crime against women has not declined in 2014-15.
(Paragraph 7.1)

93
Police manpower
● Only 81 police personnel per one lakh population were available against the sanctioned strength of 178.48 police personnel per one lakh population in the State. Since Uttar Pradesh tops the list of the States having highest number of violent crimes accounting for 12.7 per cent of the total number of violent crimes in the country and also has maximum incidence of crime against women, shortage of about 55 per cent of the police manpower if not immediately bridged may further worsen the crime scenario in the State.
(Paragraph 7.4)
Recommendation: Government may ensure adequate police manpower to effectively control the increasing incidence of crime including crime against women in the State.
● Women police personnel constitute only 4.55 per cent of the total police force in the State against the Ministry of Home Affairs advisory of 33 per cent.
(Paragraph 7.4.1)
Recommendation: Given the large number of crimes against minor girls and women, GoUP may consider implementing MHA recommendations regarding employment of women police personnel.
Crime and Criminal Tracking Network and Systems
● Implementation of Crime and Criminal Tracking Network and Systems (CCTNS) has been considerably delayed in the State.
(Paragraph 7.6)
Recommendation: GoUP may issue directions for effective use of all functionalities of CAS such as investigation, prosecution, search and reporting to enhance operational efficiency of the police department.
Compensation schemes
● Under the direction of the Hon’ble Supreme Court, a scheme for restorative justice was formulated by GoI as ‘Financial Assistance and Support Services to Victims of Rape: A Scheme for Restorative Justice’. The allocation of ` 15.03 crore by GoI during 2010-12 as financial assistance under this scheme, was not utilised by the State though 3544 rape cases were reported in the State during the same period.
(Paragraph 7.7.1)
Recommendation: Financial assistance and support services should be provided to rape victims promptly as per prescribed norms.
● Out of the total 18 cases for sanction of compensation under The Uttar Pradesh Victim Compensation Scheme, only two cases have been awarded
94
compensation and remaining 16 cases are pending for four to 20 months on account of procedural delays.
(Paragraph 7.7.2)
Recommendation: Compensation should be paid without any delay to victims and their dependents under 'The Uttar Pradesh Victim Compensation Scheme'.
Ujjawala – Support Services for Trafficked Women
● Grants were released to 13 Ujjawala projects for a period ranging between six and 15 months only and second and subsequent installments were not released to 12 projects. Further, due to non-release of grant in 12 out of 13 projects for a longer period, the scheme had become largely non-functional.
(Paragraph 7.9.1)
● No Ujjawala homes were established in districts bordering Nepal which are major transit areas vulnerable to trafficking as per UN report.
(Paragraph 7.9.2)
Recommendation: The Government should establish Ujjawala homes in districts bordering Nepal and other major destination centres for trafficked women.
● The State Level Monitoring Committee was not formed and periodic evaluation of the projects through reputed institutions was not done.
(Paragraph 7.9.3)
Recommendation: Government should constitute provisioned monitoring committees for proper monitoring of Ujjawala projects.
9.7 Destitute Women
● District Women Welfare Committees (DWWCs) for planning and implementation of the Swadhar Greh scheme in the districts were not constituted, as a result, the magnitude of prevalence of destitution in women in the districts remained un-assessed.
(Paragraph 8.2.1)
Recommendation: DWWCs should be formed in the districts to assess the magnitude of prevalence of destitution among women in the districts.
● Swadhar Grehs were established in only 42 out of 75 districts in the State as of March 2015.
(Paragraph 8.2.2)

95
Recommendation: The Government should undertake need based assessment to establish Swadhar Greh of required capacity in every district for destitute women.
● The State Department as well as implementing agencies had not established necessary linkages with other programme such as non-formal education, skill development, etc., which resulted in non-achievement of the objective of upliftment and economic rehabilitation of inmates of Swadhar
Greh through linkage with other programmes.
(Paragraph 8.2.3)
Recommendation: The Government should ensure convergence with other departments for effective implementation of the Scheme.
● Inadequate infrastructure, excess reporting of beneficiaries, lack of support services, non-rehabilitation of inmates and improper maintenance of records were found in Swadhar Grehs, functioning in test checked districts.
(Paragraph 8.3)
Recommendation: Government should ensure functioning of Swadhar Grehs as per provisions of Scheme Guidelines regarding infrastructure, support services and rehabilitation of inmates.
(P. K. KATARIA) ALLAHABAD Principal Accountant General (G&SSA) THE Uttar Pradesh
COUNTERSIGNED
(SHASHI KANT SHARMA) NEW DELHI Comptroller and Auditor General of India THE

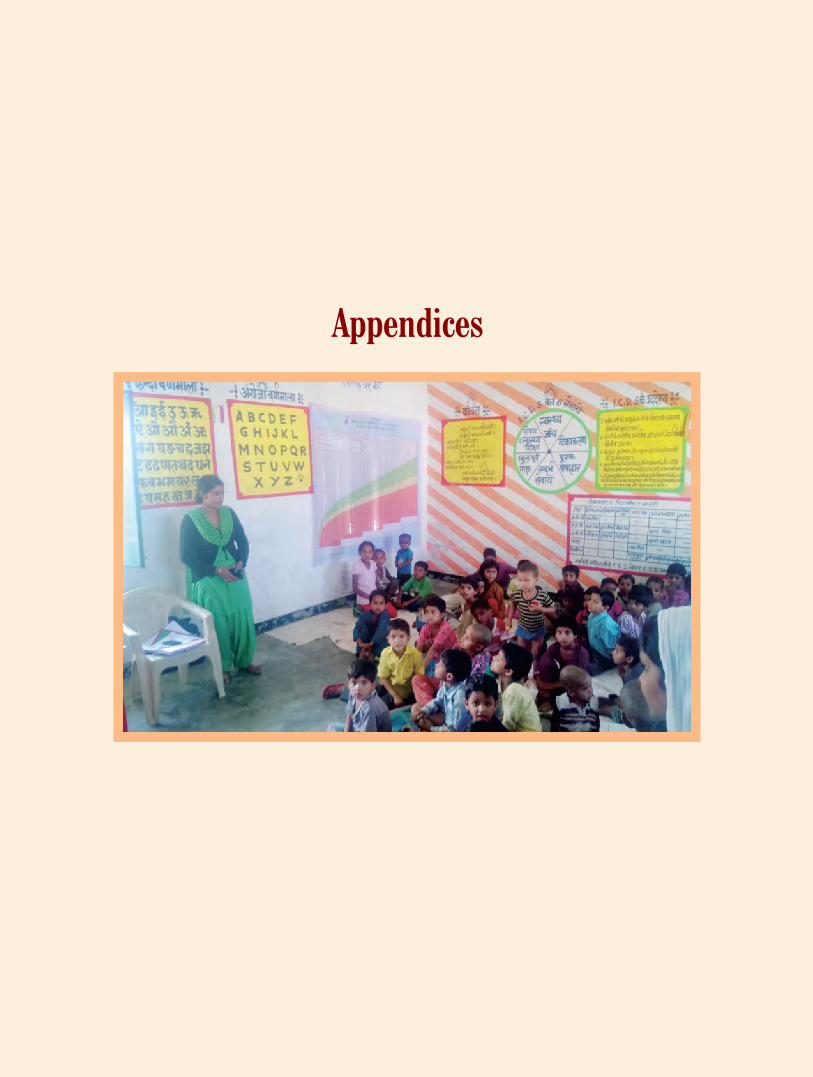

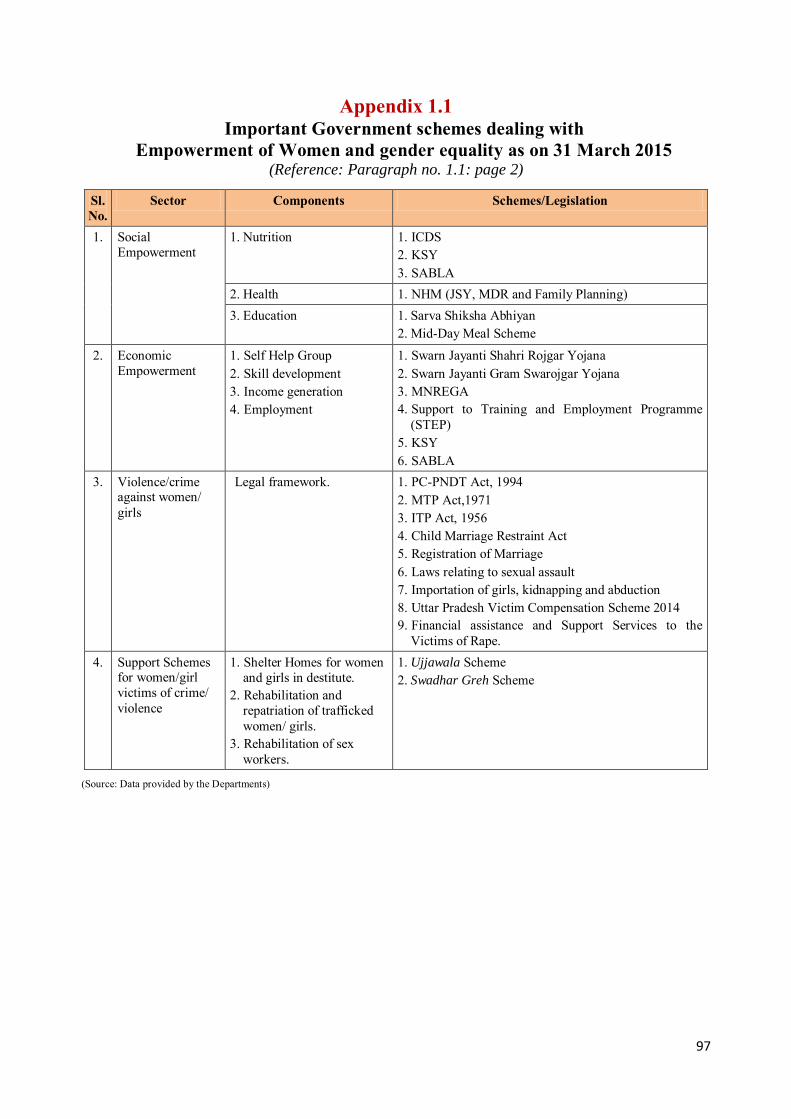
97
Appendix 1.1 Important Government schemes dealing with
Empowerment of Women and gender equality as on 31 March 2015 (Reference: Paragraph no. 1.1: page 2)
Sl. No.
Sector Components Schemes/Legislation
1. Social Empowerment
1. Nutrition 1. ICDS 2. KSY 3. SABLA
2. Health 1. NHM (JSY, MDR and Family Planning) 3. Education 1. Sarva Shiksha Abhiyan
2. Mid-Day Meal Scheme
2. Economic Empowerment
1. Self Help Group 2. Skill development 3. Income generation 4. Employment
1. Swarn Jayanti Shahri Rojgar Yojana 2. Swarn Jayanti Gram Swarojgar Yojana 3. MNREGA 4. Support to Training and Employment Programme
(STEP) 5. KSY 6. SABLA
3. Violence/crime against women/ girls
Legal framework.
1. PC-PNDT Act, 1994 2. MTP Act,1971 3. ITP Act, 1956 4. Child Marriage Restraint Act 5. Registration of Marriage 6. Laws relating to sexual assault 7. Importation of girls, kidnapping and abduction 8. Uttar Pradesh Victim Compensation Scheme 2014 9. Financial assistance and Support Services to the
Victims of Rape. 4. Support Schemes
for women/girl victims of crime/ violence
1. Shelter Homes for women and girls in destitute.
2. Rehabilitation and repatriation of trafficked women/ girls.
3. Rehabilitation of sex workers.
1. Ujjawala Scheme 2. Swadhar Greh Scheme
(Source: Data provided by the Departments)

98
Appendix 3.1 Roles and functions of various authorities under the PC-PNDT Act
(Reference: Paragraph no. 3.1.2; page 13)
Sl. No.
Authority Roles Functions
1. Central Supervisory Board (CSB)
Supervision Advises on policy matters, reviews and oversees implementation of the Act.
2. State Supervisory Board (SSB)
Supervision Creates awareness about the Act, reviews Appropriate Authority’s activities, monitors implementation and sends reports to CSB.
3. State Appropriate Authority (SAA)
Implementation of the Act at State level
To grant, suspend or cancel registration of USG Centres; to enforce standards prescribed for USG centres; to investigate complaints of breach of the provisions of this Act or the rules made thereunder and take immediate action on complaints for suspension or cancellation of registration.
4. State Advisory Committee (SAC)
Assisting SAA To aid and advise the Appropriate Authority in the discharge of its functions.
5. State Inspection and Monitoring Committee (SIMC)
Surprise Visits to USG centres
Conducts surprise visits to ultrasound centres; check their compliances, records, facilitate the process of search and seizure by the District Appropriate Authorities within the State.
6. District Appropriate Authority (DAA)
Implementation of the Act at district level
Implements the Act at the district level, registers ultrasound clinics/hospitals, inspects them, investigates complaints and files court complaints.
7. District Advisory Committee (DAC)
Assisting DAA Serves as an advisory to the DAA in implementing the Act, offers advice regarding registration of clinics, inspections and court complaints.
8. Sub-district Appropriate Authority
Implementation of the Act at Tehsil level
Implements the Act at the sub-district level, registers clinics, inspects clinics, investigates complaints and files court complaints.
9. Sub-district Advisory Committee
Assisting Sub-district Appropriate Authority
Serves as an advisory to the sub-district Appropriate Authority in implementing the Act, offers advice regarding registration of ultrasound centres, inspections and court complaints.
(Source: PC-PNDT Act and Rules)
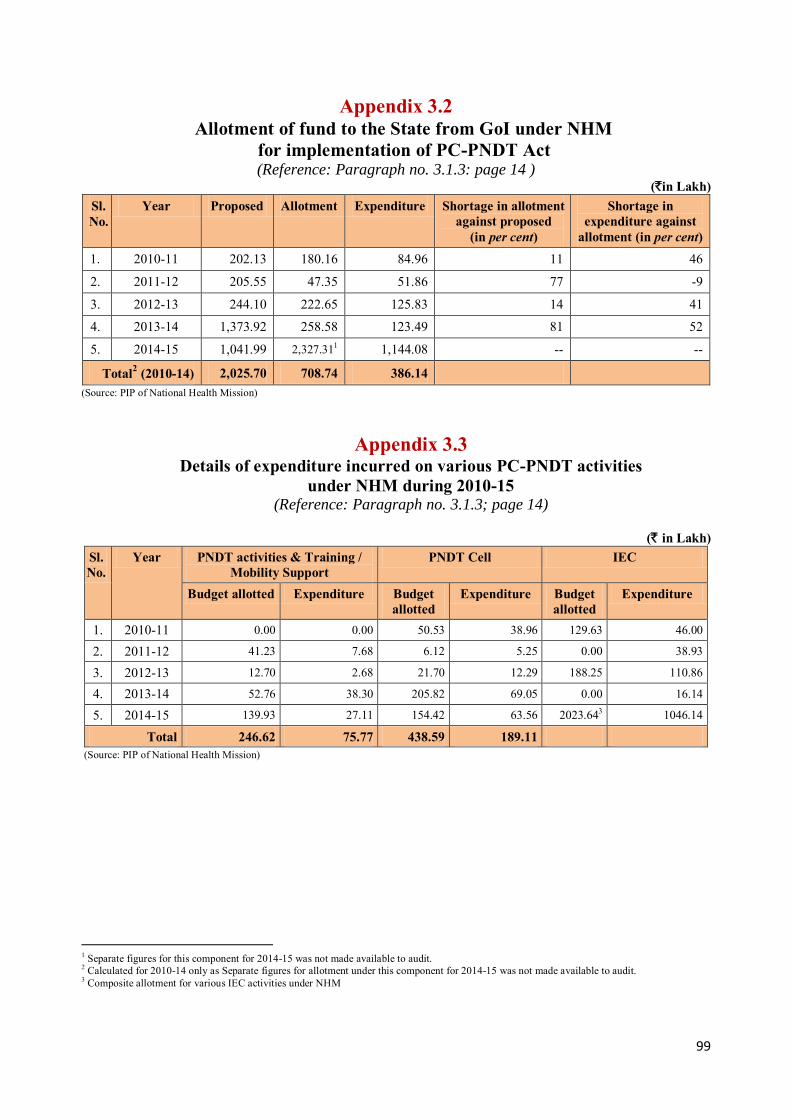
99
Appendix 3.2 Allotment of fund to the State from GoI under NHM
for implementation of PC-PNDT Act (Reference: Paragraph no. 3.1.3: page 14 )
(`in Lakh)
Sl. No.
Year Proposed Allotment Expenditure Shortage in allotment against proposed
(in per cent)
Shortage in expenditure against
allotment (in per cent) 1. 2010-11 202.13 180.16 84.96 11 46
2. 2011-12 205.55 47.35 51.86 77 -9
3. 2012-13 244.10 222.65 125.83 14 41
4. 2013-14 1,373.92 258.58 123.49 81 52
5. 2014-15 1,041.99 2,327.311 1,144.08 -- --
Total2 (2010-14) 2,025.70 708.74 386.14
(Source: PIP of National Health Mission)
Appendix 3.3 Details of expenditure incurred on various PC-PNDT activities
under NHM during 2010-15 (Reference: Paragraph no. 3.1.3; page 14)
(` in Lakh)
Sl. No.
Year PNDT activities & Training / Mobility Support
PNDT Cell IEC
Budget allotted Expenditure Budget allotted
Expenditure Budget allotted
Expenditure
1. 2010-11 0.00 0.00 50.53 38.96 129.63 46.00
2. 2011-12 41.23 7.68 6.12 5.25 0.00 38.93
3. 2012-13 12.70 2.68 21.70 12.29 188.25 110.86
4. 2013-14 52.76 38.30 205.82 69.05 0.00 16.14
5. 2014-15 139.93 27.11 154.42 63.56 2023.643 1046.14
Total 246.62 75.77 438.59 189.11 (Source: PIP of National Health Mission)
1 Separate figures for this component for 2014-15 was not made available to audit. 2 Calculated for 2010-14 only as Separate figures for allotment under this component for 2014-15 was not made available to audit. 3 Composite allotment for various IEC activities under NHM
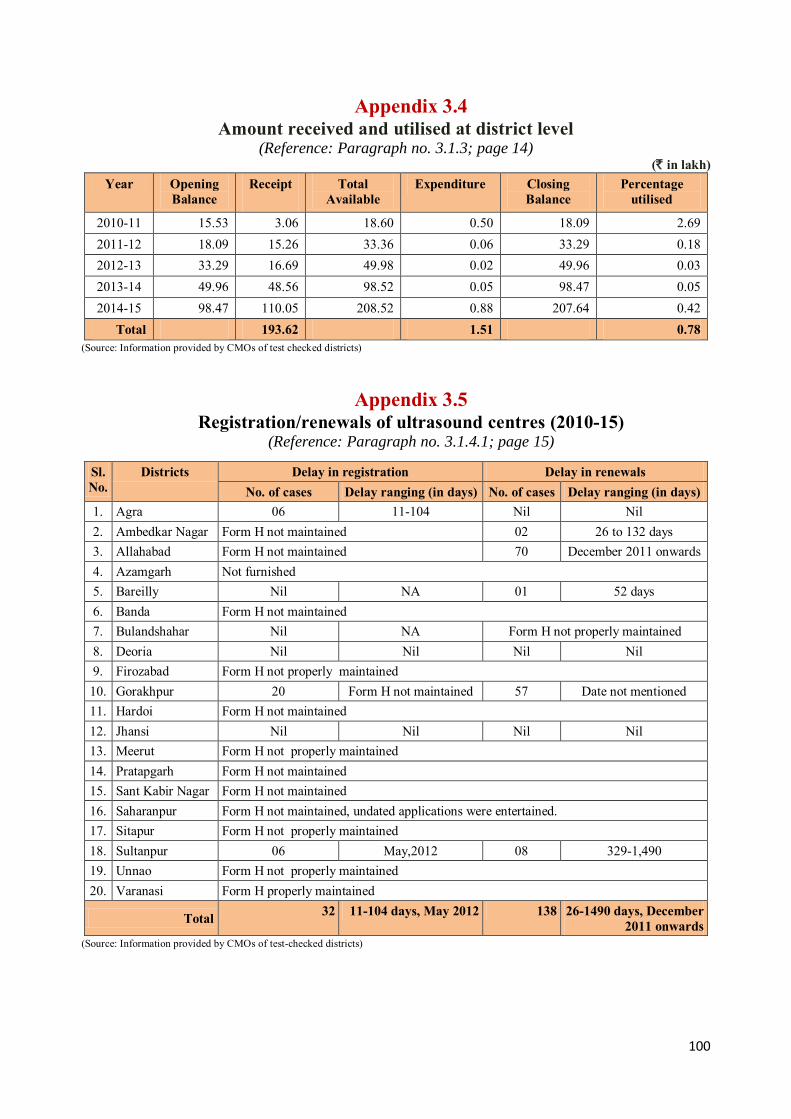
100
Appendix 3.4 Amount received and utilised at district level
(Reference: Paragraph no. 3.1.3; page 14) (` in lakh)
Year Opening Balance
Receipt
Total Available
Expenditure Closing Balance
Percentage utilised
2010-11 15.53 3.06 18.60 0.50 18.09 2.69 2011-12 18.09 15.26 33.36 0.06 33.29 0.18 2012-13 33.29 16.69 49.98 0.02 49.96 0.03 2013-14 49.96 48.56 98.52 0.05 98.47 0.05 2014-15 98.47 110.05 208.52 0.88 207.64 0.42
Total 193.62 1.51 0.78 (Source: Information provided by CMOs of test checked districts)
Appendix 3.5
Registration/renewals of ultrasound centres (2010-15) (Reference: Paragraph no. 3.1.4.1; page 15)
Sl. No.
Districts Delay in registration Delay in renewals No. of cases Delay ranging (in days) No. of cases Delay ranging (in days)
1. Agra 06 11-104 Nil Nil 2. Ambedkar Nagar Form H not maintained 02 26 to 132 days 3. Allahabad Form H not maintained 70 December 2011 onwards 4. Azamgarh Not furnished 5. Bareilly Nil NA 01 52 days 6. Banda Form H not maintained 7. Bulandshahar Nil NA Form H not properly maintained 8. Deoria Nil Nil Nil Nil 9. Firozabad Form H not properly maintained 10. Gorakhpur 20 Form H not maintained 57 Date not mentioned 11. Hardoi Form H not maintained 12. Jhansi Nil Nil Nil Nil 13. Meerut Form H not properly maintained 14. Pratapgarh Form H not maintained 15. Sant Kabir Nagar Form H not maintained 16. Saharanpur Form H not maintained, undated applications were entertained. 17. Sitapur Form H not properly maintained 18. Sultanpur 06 May,2012 08 329-1,490 19. Unnao Form H not properly maintained 20. Varanasi Form H properly maintained
Total 32 11-104 days, May 2012 138 26-1490 days, December 2011 onwards
(Source: Information provided by CMOs of test-checked districts)

101
Appendix 3.6 Joint Physical Inspection of 100 USG centres
(Reference: Paragraph no. 3.1.4.2; page 16)
Sl. No.
District No. of centres
inspected
No. of Form F / cases checked
Referral slip attached
No. of cases with incomplete
Form F
No. of Forms details of procedure conducted
not mentioned 1. Agra 05 66 10 25 25
2. Ambedkar Nagar 05 20 18 8 03
3. Allahabad 05 38 26 17 17
4. Azamgarh 05 50 50 0 0
5. Bareilly 05 115 25 21 21
6. Banda 05 105 40 65 0
7. Bulandshahr 05 50 50 0 0
8. Deoria 05 Nil 50 0 0
9. Firozabad 05 50 50 0 0
10. Gorakhpur 05 48 0 48 22
11. Hardoi 05 334 15 05 324
12. Jhansi 05 50 50 0 0
13. Meerut 05 50 50 0 0
14. Pratapgarh 05 169 03 166 133
15. Sant Kabir Nagar 05 33 24 27 0
16. Saharanpur 05 579 0 579 565
17. Sitapur 05 50 50 0 0
18. Sultanpur 05 30 0 0 0
19. Unnao 05 50 50 0 0
20. Varanasi 05 50 50 0 0
Total 100 1,937 611 961 1,110 (Source: JPI of test-checked districts)

102
Appendix 3.7
Maintenance of records in the test checked districts (2010-15) (Reference: Paragraph no. 3.1.4.3 & 3.1.4.11; page 18 & 21)
Sl. No.
Name of the District
No. of centres
registered as on Mar, 15 (Under section 18 & 19 Of
PCPNDT Act)
No. of inspection
report issued (Sec 18 A
Rule PNDT Rules, 2014)
Form-F {Record with
respect to patients
subjected to diagnostic
procedure to be maintained by USG centres}
Not Maintained (Rule 9
PCPNDT Rules, 1996)
Referral slip
(Doctors prescription for prenatal diagnostics)
not attached (Rule9(6) of PNDT
Rules, 1996)
Reasons for Diagnostic mentioned in Form-F (Rule 9 of
Rules, 1996)
Show cause notice issued
to USG
Centers
(U/s 20,PCPNDT Act)
Legal action
initiated for contraventi
on of the Act (U/s 20, 22, 23 & 25
of the PCPNDT Act,1994)
Total no of
centres at
default
1. Agra 287 Nil 47 NA Yes Nil 03 47
2. Ambedkar Nagar
21 40 21 NA NA NA Nil 21
3. Allahabad 187 Nil 33 NA NA NA NA 33 4. Azamgarh NA NA NA NA NA NA NA NA 5. Bareilly 147 Not maintained Not maintained 90 Yes 120 06 0 6. Banda 14 Nil 02 65 Yes Nil Nil 02 7. Bulandshahr 67 NA 0 Nil Yes 0 NA 67 8. Deoria 38 Nil Not maintained Nil No Nil 03 38 9. Firozabad 37 NA 37 20 Yes 2 NA 37 10. Gorakhpur 214 NA NA NA NA Nil 06 214 11. Hardoi 31 32 11 NA Yes Nil 01 11 12. Jhansi 61 Nil Nil Nil Yes Nil Nil Nil 13. Meerut 170 NA 0 NA NA 86 14 170 14. Pratapgarh 58 NA NA 169 Yes NA NA 58
15. Sant Kabir Nagar
17 NA 13 54 Yes NA NA 13
16. Saharanpur 107 NA 29 565 28 Nil 02 29 17. Sitapur 33 58 33 20 Yes Nil NA 33 18. Sultanpur 36 NA 36 50 Yes 13 NA 36 19. Unnao 20 NA 0 NA Yes NA NA 20 20. Varanasi 107 NA NA NA Yes NA NA 107
Total 1,652 130 262 1,033 28 221 35 936 (Source: Information provided by CMOs, test-checked districts)
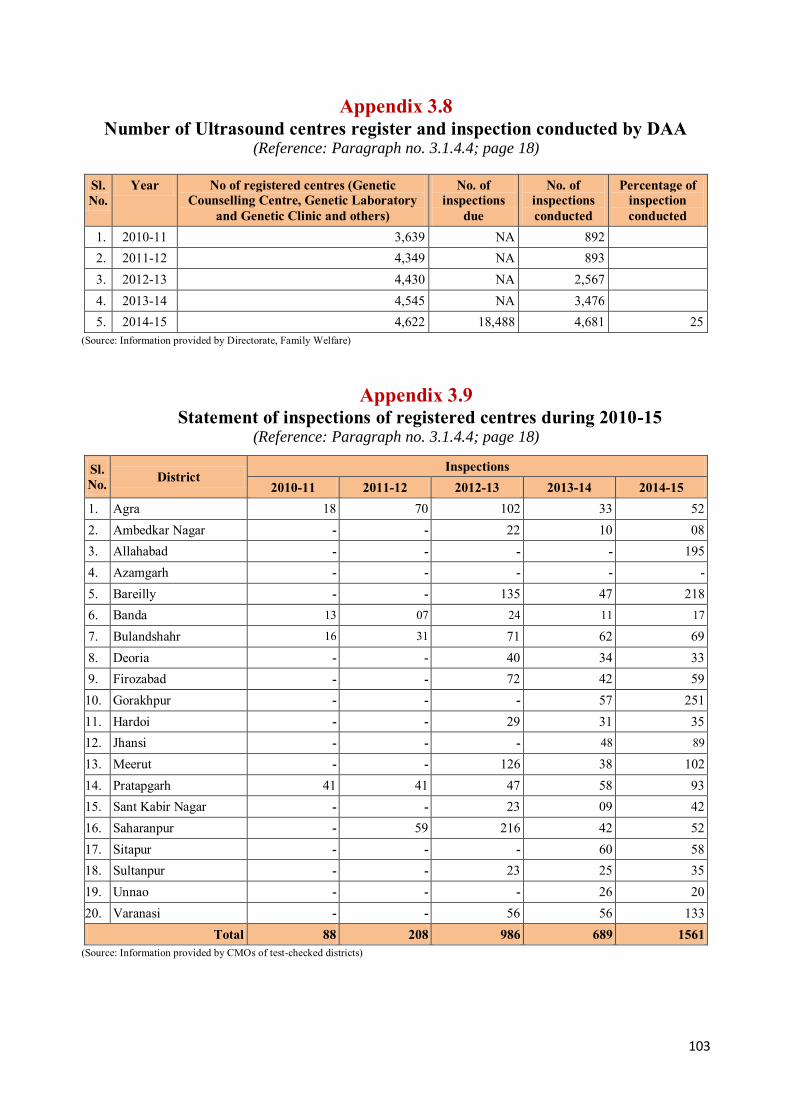
103
Appendix 3.8 Number of Ultrasound centres register and inspection conducted by DAA
(Reference: Paragraph no. 3.1.4.4; page 18)
Sl. No.
Year No of registered centres (Genetic Counselling Centre, Genetic Laboratory
and Genetic Clinic and others)
No. of inspections
due
No. of inspections conducted
Percentage of inspection conducted
1. 2010-11 3,639 NA 892 2. 2011-12 4,349 NA 893 3. 2012-13 4,430 NA 2,567 4. 2013-14 4,545 NA 3,476 5. 2014-15 4,622 18,488 4,681 25
(Source: Information provided by Directorate, Family Welfare)
Appendix 3.9 Statement of inspections of registered centres during 2010-15
(Reference: Paragraph no. 3.1.4.4; page 18)
Sl. No. District
Inspections 2010-11 2011-12 2012-13 2013-14 2014-15
1. Agra 18 70 102 33 52 2. Ambedkar Nagar - - 22 10 08 3. Allahabad - - - - 195 4. Azamgarh - - - - -
5. Bareilly - - 135 47 218 6. Banda 13 07 24 11 17
7. Bulandshahr 16 31 71 62 69 8. Deoria - - 40 34 33 9. Firozabad - - 72 42 59 10. Gorakhpur - - - 57 251 11. Hardoi - - 29 31 35 12. Jhansi - - - 48 89
13. Meerut - - 126 38 102 14. Pratapgarh 41 41 47 58 93 15. Sant Kabir Nagar - - 23 09 42 16. Saharanpur - 59 216 42 52 17. Sitapur - - - 60 58 18. Sultanpur - - 23 25 35 19. Unnao - - - 26 20 20. Varanasi - - 56 56 133
Total 88 208 986 689 1561 (Source: Information provided by CMOs of test-checked districts)

104
Appendix 3.10 Decisions/discussions in meetings at various levels not followed
(Reference: Paragraph no. 3.1.5.1; page 22)
Sl. No.
Date Decisions
A. State Supervisory Board
1. 06.04.2011
District Appropriate Authorities were directed to analyze Form F.
Centres against which court cases were pending for contravention of the PNDT Act may be inspected and regularly followed up. District Advisory committees may meet regularly.
2. 29.10.2012
A Toll free phone line may be developed to register complaints.
Meetings may be arranged with manufacturers/dealers of ultrasound machines. Tracking of all those women who were already having two or more girl child and had done ultrasound procedure may be initiated. Regular inspections of ultrasound centres may be ensured.
3. 16.3.2013 Meetings with medical practitioners and community may be arranged in every two months in each district.
4. 03.07.2013
Monthly reports by registered centres may be analyzed and all those centres who had not sent their monthly report for three consecutive months may be considered as unregistered and appropriate action may be taken. Online filing of Form F by ultrasound centres may be arranged.
Inspections of ultrasound centres may be maximized at the level of CMOs. All the centres committed breach of the provisions of the Act may be sealed and legal action may be initiated against them.
5. 30.05.2014 Public awareness were not done thus awareness programs may be initiated at large.
All the officers who were not cooperative in implementation of the Act may be identified and action may be taken against them.
B. State Advisory Committee 1. 18.05.2011 Advised to change the format of Form F
2. 22.02.2013
In order to stop sex selection the 12 to 20 weeks termination of pregnancies were required to be effectively monitored. MTP Act may also be effectively implemented, especially MTPs up to 12 to 20 weeks may be monitored. Status reports from districts may be called in this regard.
Online filing of Form F may be established. Appropriate authorities of bordering districts were advised for not allowing ultrasonography without identity cards in case of patient from other States.
3. 05.06.2013 SAA was advised for effective implementation of MTP Act, especially MTPs up to 12 to 20 weeks may be monitored. Status reports from districts may be called in this regard.
SAA was advised for making identity cards necessary for ultrasound in all the districts.
4. 08.05.2014
Details of pregnant women such as phone number, address etc. may be maintained in case of ultrasound was conducted during 12 to 20 weeks of pregnancy. Advised to form inspection and monitoring committee at zonal level.
Proposal for media workshop at regional level may be included in supplementary PIP of NHM.
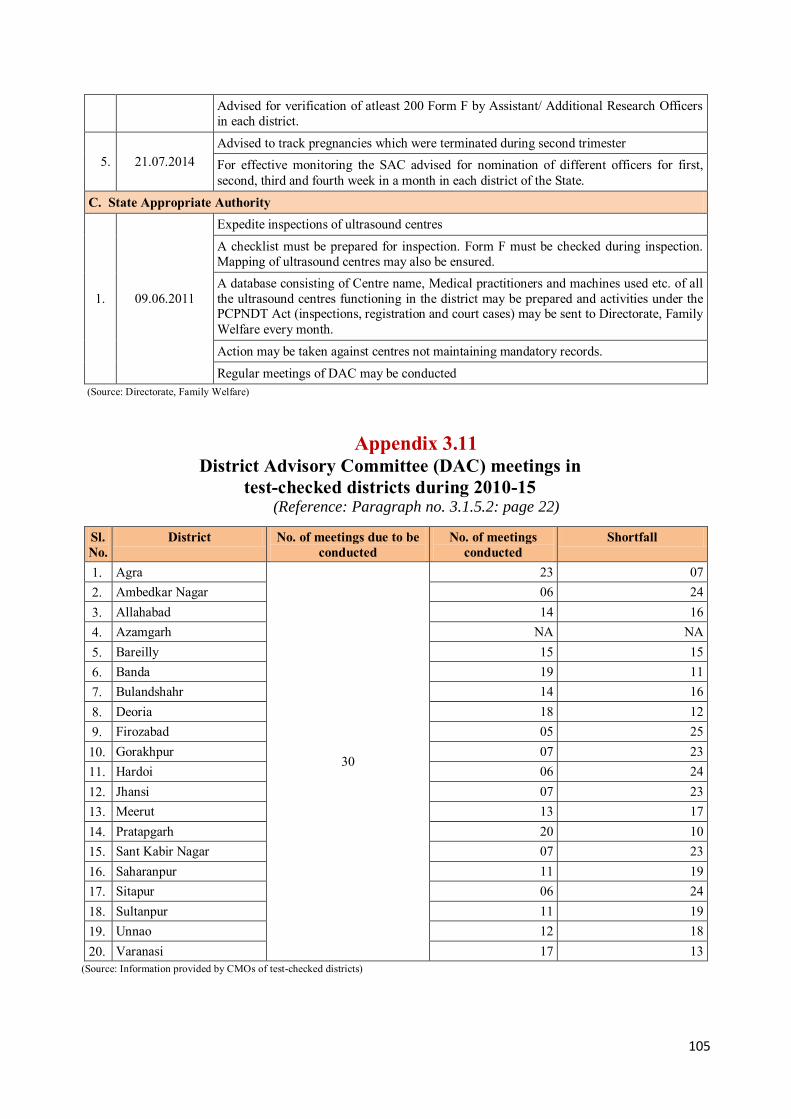
105
Advised for verification of atleast 200 Form F by Assistant/ Additional Research Officers in each district.
5. 21.07.2014 Advised to track pregnancies which were terminated during second trimester For effective monitoring the SAC advised for nomination of different officers for first, second, third and fourth week in a month in each district of the State.
C. State Appropriate Authority
1. 09.06.2011
Expedite inspections of ultrasound centres
A checklist must be prepared for inspection. Form F must be checked during inspection. Mapping of ultrasound centres may also be ensured. A database consisting of Centre name, Medical practitioners and machines used etc. of all the ultrasound centres functioning in the district may be prepared and activities under the PCPNDT Act (inspections, registration and court cases) may be sent to Directorate, Family Welfare every month.
Action may be taken against centres not maintaining mandatory records.
Regular meetings of DAC may be conducted (Source: Directorate, Family Welfare)
Appendix 3.11 District Advisory Committee (DAC) meetings in
test-checked districts during 2010-15 (Reference: Paragraph no. 3.1.5.2: page 22)
Sl. No.
District No. of meetings due to be conducted
No. of meetings conducted
Shortfall
1. Agra
30
23 07 2. Ambedkar Nagar 06 24 3. Allahabad 14 16 4. Azamgarh NA NA 5. Bareilly 15 15 6. Banda 19 11 7. Bulandshahr 14 16 8. Deoria 18 12 9. Firozabad 05 25 10. Gorakhpur 07 23 11. Hardoi 06 24 12. Jhansi 07 23 13. Meerut 13 17 14. Pratapgarh 20 10 15. Sant Kabir Nagar 07 23 16. Saharanpur 11 19 17. Sitapur 06 24 18. Sultanpur 11 19 19. Unnao 12 18 20. Varanasi 17 13
(Source: Information provided by CMOs of test-checked districts)
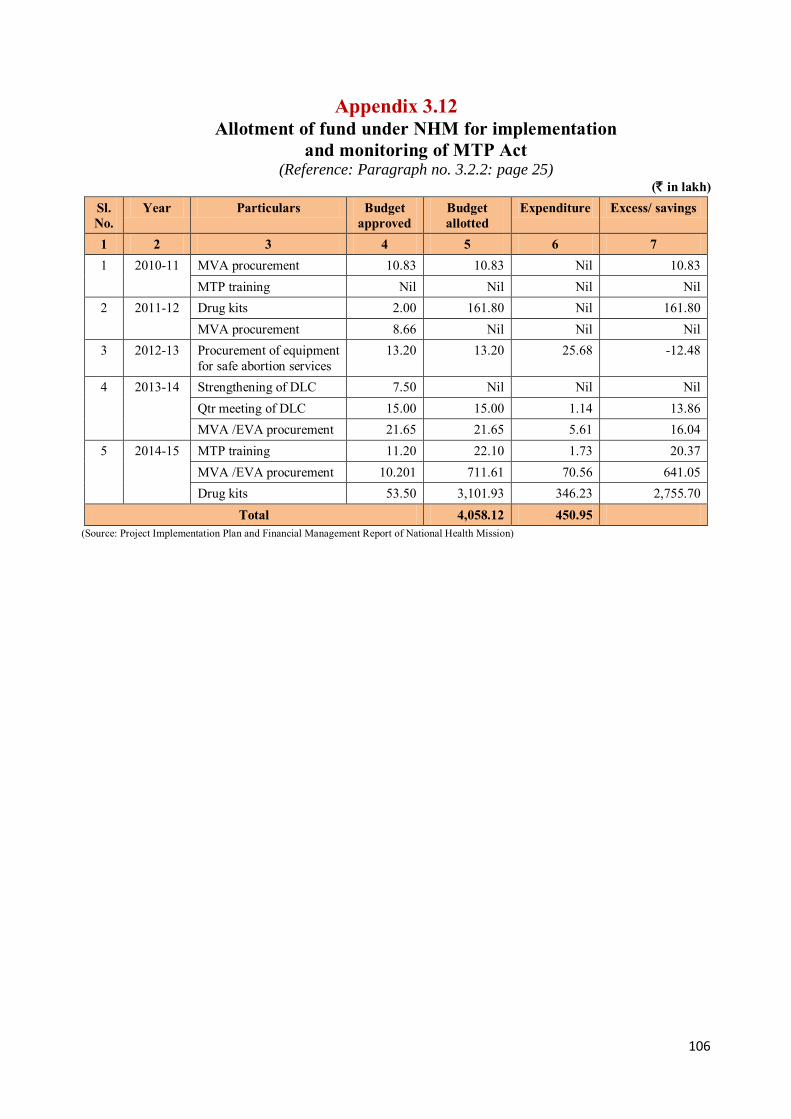
106
Appendix 3.12 Allotment of fund under NHM for implementation
and monitoring of MTP Act
(Reference: Paragraph no. 3.2.2: page 25) (` in lakh)
Sl. No.
Year Particulars Budget approved
Budget allotted
Expenditure Excess/ savings
1 2 3 4 5 6 7 1 2010-11 MVA procurement 10.83 10.83 Nil 10.83
MTP training Nil Nil Nil Nil 2 2011-12 Drug kits 2.00 161.80 Nil 161.80
MVA procurement 8.66 Nil Nil Nil 3 2012-13 Procurement of equipment
for safe abortion services 13.20 13.20 25.68 -12.48
4 2013-14 Strengthening of DLC 7.50 Nil Nil Nil Qtr meeting of DLC 15.00 15.00 1.14 13.86 MVA /EVA procurement 21.65 21.65 5.61 16.04
5 2014-15 MTP training 11.20 22.10 1.73 20.37 MVA /EVA procurement 10.201 711.61 70.56 641.05 Drug kits 53.50 3,101.93 346.23 2,755.70
Total 4,058.12 450.95 (Source: Project Implementation Plan and Financial Management Report of National Health Mission)
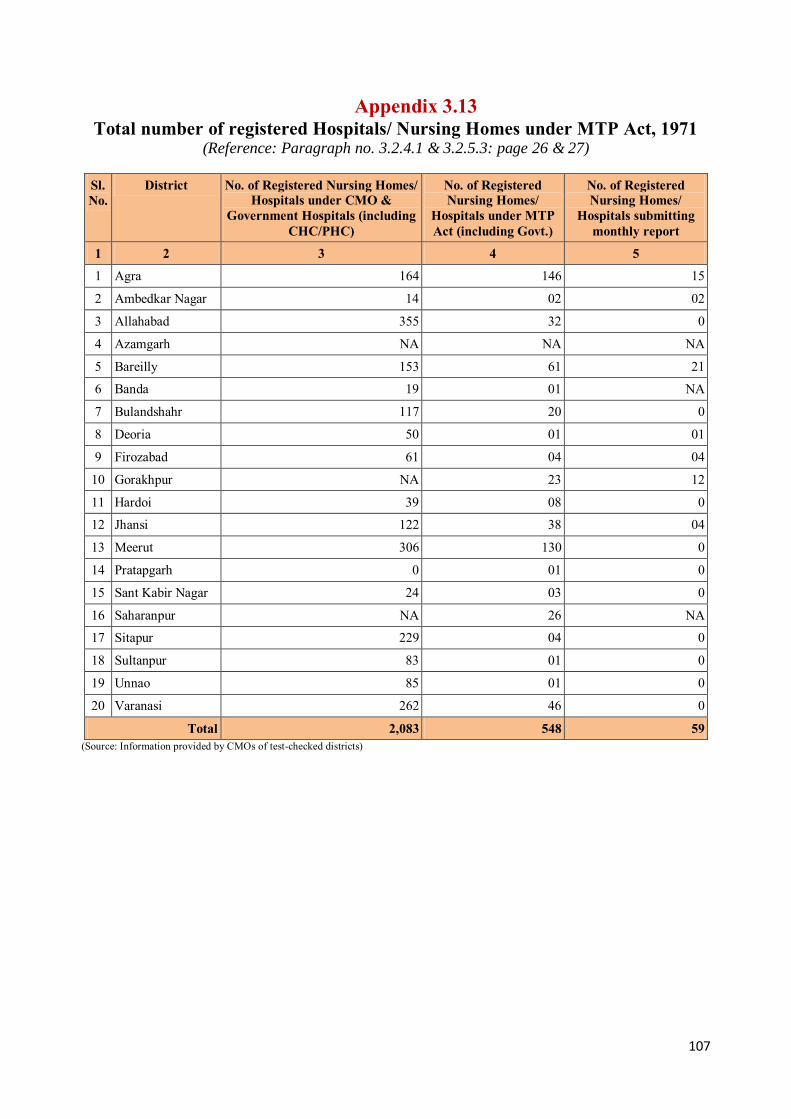
107
Appendix 3.13 Total number of registered Hospitals/ Nursing Homes under MTP Act, 1971
(Reference: Paragraph no. 3.2.4.1 & 3.2.5.3: page 26 & 27)
Sl. No.
District No. of Registered Nursing Homes/ Hospitals under CMO &
Government Hospitals (including CHC/PHC)
No. of Registered Nursing Homes/
Hospitals under MTP Act (including Govt.)
No. of Registered Nursing Homes/
Hospitals submitting monthly report
1 2 3 4 5
1 Agra 164 146 15
2 Ambedkar Nagar 14 02 02
3 Allahabad 355 32 0
4 Azamgarh NA NA NA
5 Bareilly 153 61 21
6 Banda 19 01 NA
7 Bulandshahr 117 20 0
8 Deoria 50 01 01
9 Firozabad 61 04 04
10 Gorakhpur NA 23 12
11 Hardoi 39 08 0
12 Jhansi 122 38 04
13 Meerut 306 130 0
14 Pratapgarh 0 01 0
15 Sant Kabir Nagar 24 03 0
16 Saharanpur NA 26 NA
17 Sitapur 229 04 0
18 Sultanpur 83 01 0
19 Unnao 85 01 0
20 Varanasi 262 46 0
Total 2,083 548 59 (Source: Information provided by CMOs of test-checked districts)
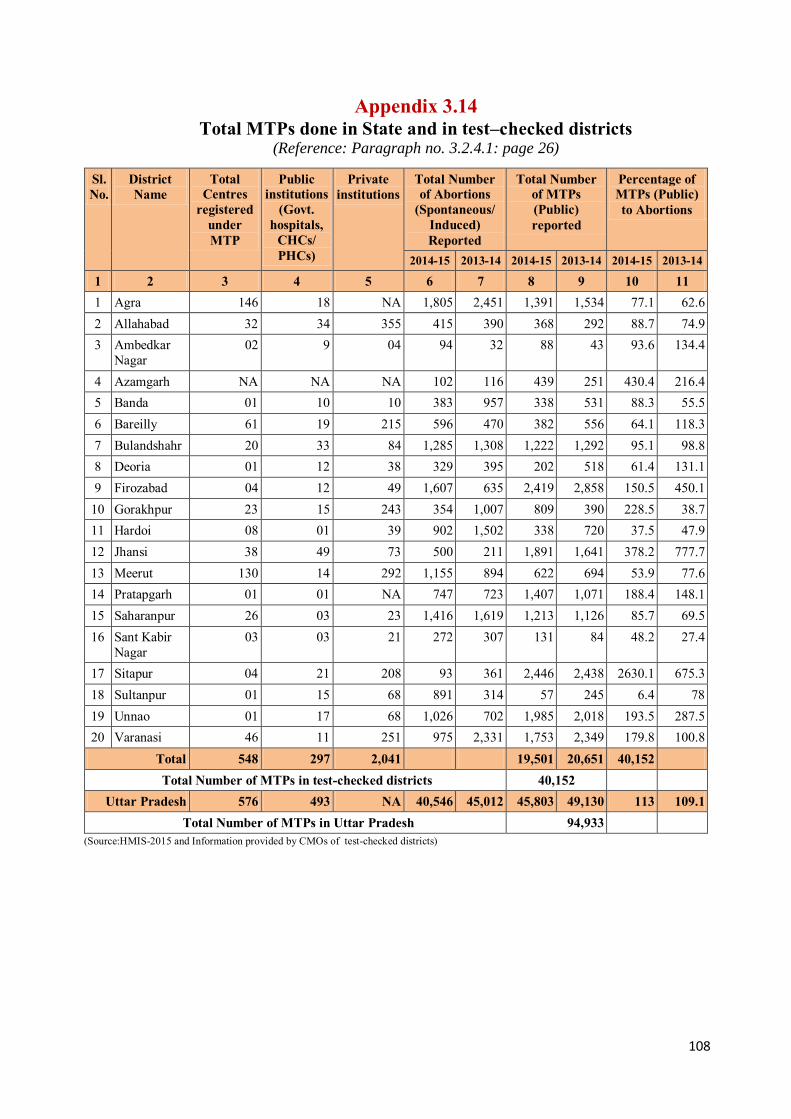
108
Appendix 3.14 Total MTPs done in State and in test–checked districts
(Reference: Paragraph no. 3.2.4.1: page 26)
Sl. No.
District Name
Total Centres
registered under MTP
Public institutions
(Govt. hospitals,
CHCs/ PHCs)
Private institutions
Total Number of Abortions
(Spontaneous/ Induced) Reported
Total Number of MTPs (Public) reported
Percentage of MTPs (Public) to Abortions
2014-15 2013-14 2014-15 2013-14 2014-15 2013-14
1 2 3 4 5 6 7 8 9 10 11 1 Agra 146 18 NA 1,805 2,451 1,391 1,534 77.1 62.6 2 Allahabad 32 34 355 415 390 368 292 88.7 74.9 3 Ambedkar
Nagar 02 9 04 94 32 88 43 93.6 134.4
4 Azamgarh NA NA NA 102 116 439 251 430.4 216.4 5 Banda 01 10 10 383 957 338 531 88.3 55.5 6 Bareilly 61 19 215 596 470 382 556 64.1 118.3 7 Bulandshahr 20 33 84 1,285 1,308 1,222 1,292 95.1 98.8 8 Deoria 01 12 38 329 395 202 518 61.4 131.1 9 Firozabad 04 12 49 1,607 635 2,419 2,858 150.5 450.1
10 Gorakhpur 23 15 243 354 1,007 809 390 228.5 38.7 11 Hardoi 08 01 39 902 1,502 338 720 37.5 47.9 12 Jhansi 38 49 73 500 211 1,891 1,641 378.2 777.7 13 Meerut 130 14 292 1,155 894 622 694 53.9 77.6 14 Pratapgarh 01 01 NA 747 723 1,407 1,071 188.4 148.1 15 Saharanpur 26 03 23 1,416 1,619 1,213 1,126 85.7 69.5 16 Sant Kabir
Nagar 03 03 21 272 307 131 84 48.2 27.4
17 Sitapur 04 21 208 93 361 2,446 2,438 2630.1 675.3 18 Sultanpur 01 15 68 891 314 57 245 6.4 78 19 Unnao 01 17 68 1,026 702 1,985 2,018 193.5 287.5 20 Varanasi 46 11 251 975 2,331 1,753 2,349 179.8 100.8
Total 548 297 2,041 19,501 20,651 40,152 Total Number of MTPs in test-checked districts 40,152
Uttar Pradesh 576 493 NA 40,546 45,012 45,803 49,130 113 109.1 Total Number of MTPs in Uttar Pradesh 94,933
(Source:HMIS-2015 and Information provided by CMOs of test-checked districts)
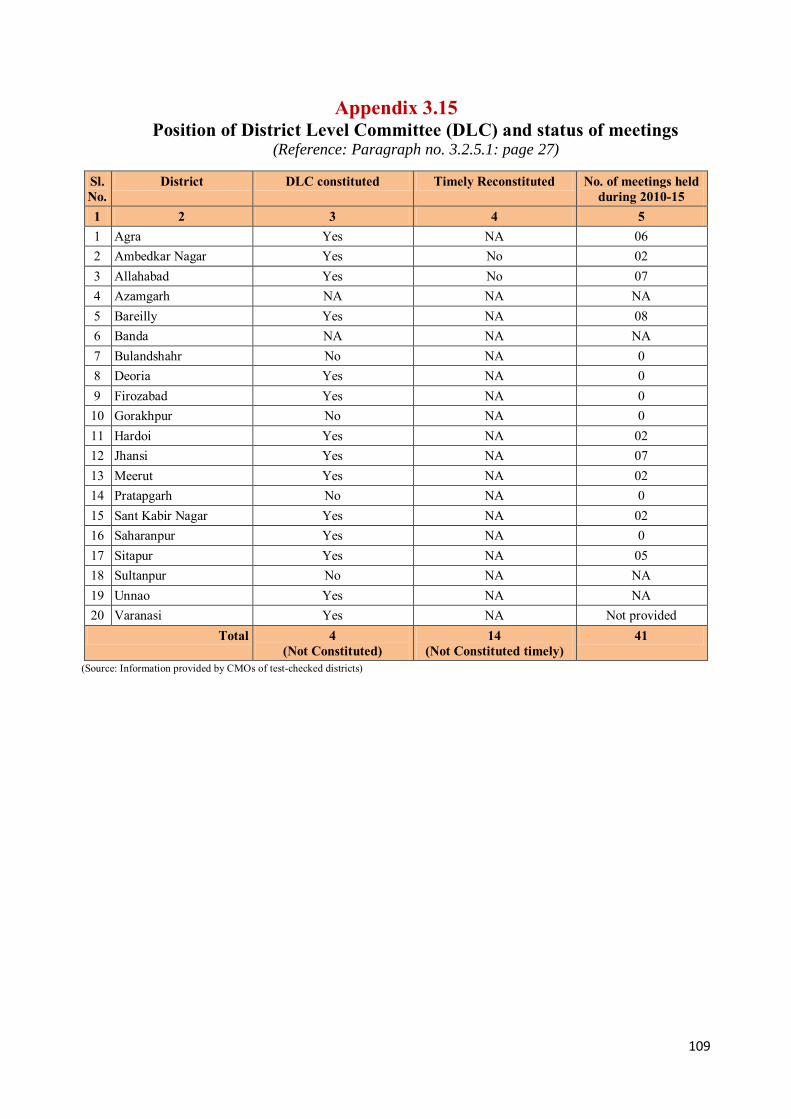
109
Appendix 3.15 Position of District Level Committee (DLC) and status of meetings
(Reference: Paragraph no. 3.2.5.1: page 27)
Sl. No.
District DLC constituted Timely Reconstituted No. of meetings held during 2010-15
1 2 3 4 5 1 Agra Yes NA 06 2 Ambedkar Nagar Yes No 02 3 Allahabad Yes No 07 4 Azamgarh NA NA NA 5 Bareilly Yes NA 08 6 Banda NA NA NA 7 Bulandshahr No NA 0 8 Deoria Yes NA 0 9 Firozabad Yes NA 0 10 Gorakhpur No NA 0 11 Hardoi Yes NA 02 12 Jhansi Yes NA 07 13 Meerut Yes NA 02 14 Pratapgarh No NA 0 15 Sant Kabir Nagar Yes NA 02 16 Saharanpur Yes NA 0 17 Sitapur Yes NA 05 18 Sultanpur No NA NA 19 Unnao Yes NA NA 20 Varanasi Yes NA Not provided
Total 4 (Not Constituted)
14 (Not Constituted timely)
41
(Source: Information provided by CMOs of test-checked districts)
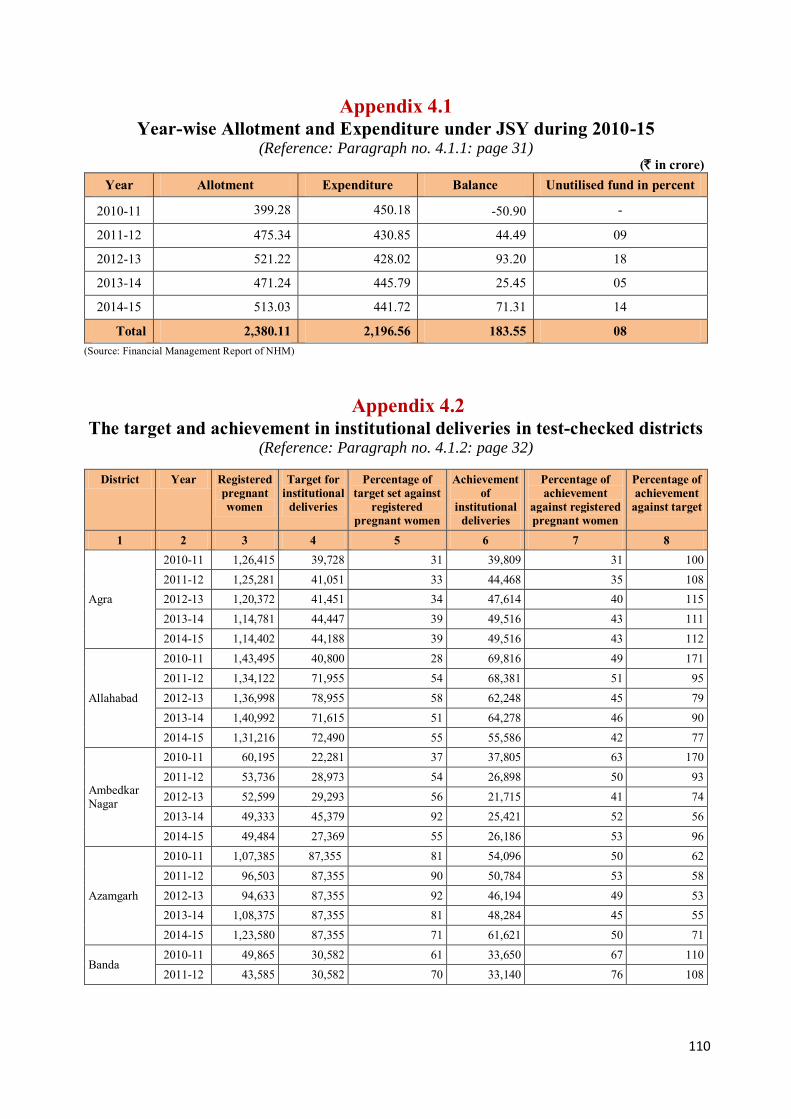
110
Appendix 4.1 Year-wise Allotment and Expenditure under JSY during 2010-15
(Reference: Paragraph no. 4.1.1: page 31) (` in crore)
Year Allotment Expenditure Balance Unutilised fund in percent
2010-11 399.28 450.18 -50.90 -
2011-12 475.34 430.85 44.49 09
2012-13 521.22 428.02 93.20 18
2013-14 471.24 445.79 25.45 05
2014-15 513.03 441.72 71.31 14
Total 2,380.11 2,196.56 183.55 08 (Source: Financial Management Report of NHM)
Appendix 4.2 The target and achievement in institutional deliveries in test-checked districts
(Reference: Paragraph no. 4.1.2: page 32)
District Year Registered pregnant women
Target for institutional
deliveries
Percentage of target set against
registered pregnant women
Achievement of
institutional deliveries
Percentage of achievement
against registered pregnant women
Percentage of achievement
against target
1 2 3 4 5 6 7 8
Agra
2010-11 1,26,415 39,728 31 39,809 31 100 2011-12 1,25,281 41,051 33 44,468 35 108 2012-13 1,20,372 41,451 34 47,614 40 115 2013-14 1,14,781 44,447 39 49,516 43 111 2014-15 1,14,402 44,188 39 49,516 43 112
Allahabad
2010-11 1,43,495 40,800 28 69,816 49 171 2011-12 1,34,122 71,955 54 68,381 51 95 2012-13 1,36,998 78,955 58 62,248 45 79 2013-14 1,40,992 71,615 51 64,278 46 90 2014-15 1,31,216 72,490 55 55,586 42 77
Ambedkar Nagar
2010-11 60,195 22,281 37 37,805 63 170 2011-12 53,736 28,973 54 26,898 50 93 2012-13 52,599 29,293 56 21,715 41 74 2013-14 49,333 45,379 92 25,421 52 56 2014-15 49,484 27,369 55 26,186 53 96
Azamgarh
2010-11 1,07,385 87,355 81 54,096 50 62 2011-12 96,503 87,355 90 50,784 53 58 2012-13 94,633 87,355 92 46,194 49 53 2013-14 1,08,375 87,355 81 48,284 45 55 2014-15 1,23,580 87,355 71 61,621 50 71
Banda 2010-11 49,865 30,582 61 33,650 67 110 2011-12 43,585 30,582 70 33,140 76 108
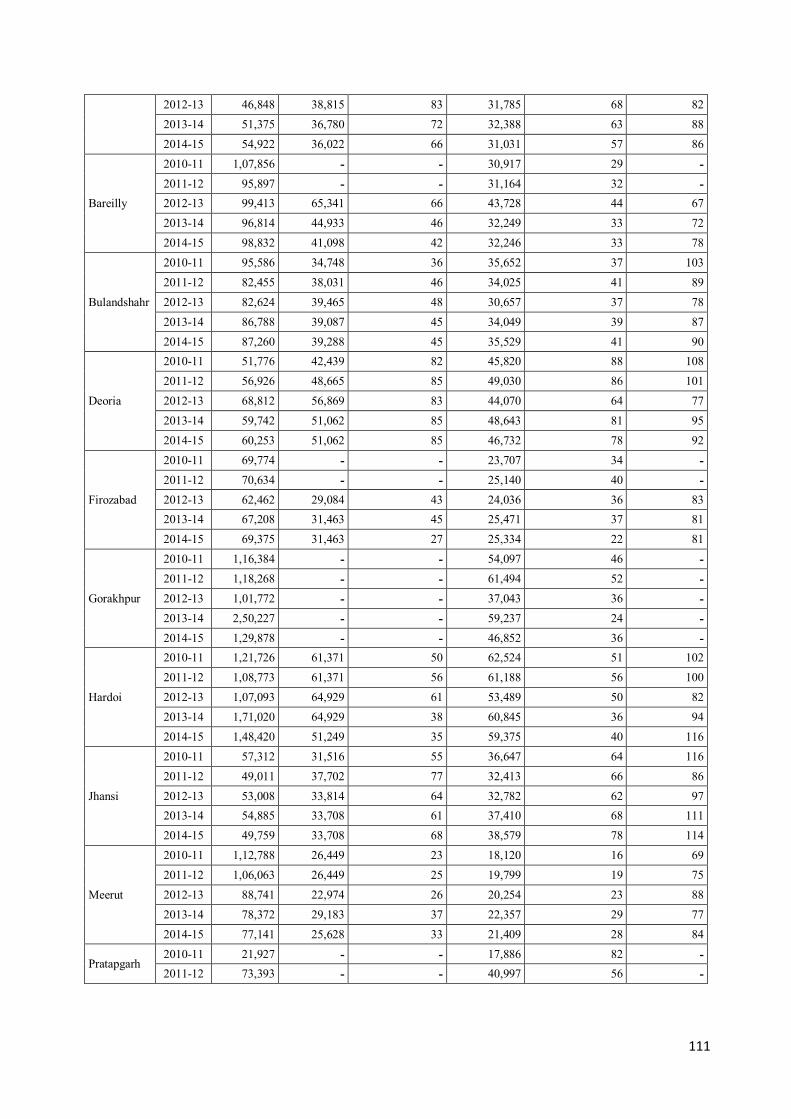
111
2012-13 46,848 38,815 83 31,785 68 82 2013-14 51,375 36,780 72 32,388 63 88 2014-15 54,922 36,022 66 31,031 57 86
Bareilly
2010-11 1,07,856 - - 30,917 29 - 2011-12 95,897 - - 31,164 32 - 2012-13 99,413 65,341 66 43,728 44 67 2013-14 96,814 44,933 46 32,249 33 72 2014-15 98,832 41,098 42 32,246 33 78
Bulandshahr
2010-11 95,586 34,748 36 35,652 37 103 2011-12 82,455 38,031 46 34,025 41 89 2012-13 82,624 39,465 48 30,657 37 78 2013-14 86,788 39,087 45 34,049 39 87 2014-15 87,260 39,288 45 35,529 41 90
Deoria
2010-11 51,776 42,439 82 45,820 88 108 2011-12 56,926 48,665 85 49,030 86 101 2012-13 68,812 56,869 83 44,070 64 77 2013-14 59,742 51,062 85 48,643 81 95 2014-15 60,253 51,062 85 46,732 78 92
Firozabad
2010-11 69,774 - - 23,707 34 - 2011-12 70,634 - - 25,140 40 - 2012-13 62,462 29,084 43 24,036 36 83 2013-14 67,208 31,463 45 25,471 37 81 2014-15 69,375 31,463 27 25,334 22 81
Gorakhpur
2010-11 1,16,384 - - 54,097 46 - 2011-12 1,18,268 - - 61,494 52 - 2012-13 1,01,772 - - 37,043 36 - 2013-14 2,50,227 - - 59,237 24 - 2014-15 1,29,878 - - 46,852 36 -
Hardoi
2010-11 1,21,726 61,371 50 62,524 51 102 2011-12 1,08,773 61,371 56 61,188 56 100 2012-13 1,07,093 64,929 61 53,489 50 82 2013-14 1,71,020 64,929 38 60,845 36 94 2014-15 1,48,420 51,249 35 59,375 40 116
Jhansi
2010-11 57,312 31,516 55 36,647 64 116 2011-12 49,011 37,702 77 32,413 66 86 2012-13 53,008 33,814 64 32,782 62 97 2013-14 54,885 33,708 61 37,410 68 111 2014-15 49,759 33,708 68 38,579 78 114
Meerut
2010-11 1,12,788 26,449 23 18,120 16 69 2011-12 1,06,063 26,449 25 19,799 19 75 2012-13 88,741 22,974 26 20,254 23 88 2013-14 78,372 29,183 37 22,357 29 77 2014-15 77,141 25,628 33 21,409 28 84
Pratapgarh 2010-11 21,927 - - 17,886 82 - 2011-12 73,393 - - 40,997 56 -

112
2012-13 74,163 - - 42,769 58 - 2013-14 81,673 - - 41,974 51 -- 2014-15 75,856 49,164 65 37,664 50 77
Saharanpur
2010-11 - - - - - - 2011-12 - - - - - - 2012-13 75,092 31,839 42 26,295 35 83 2013-14 1,07,456 38,653 36 27,702 26 72 2014-15 90,324 38,653 43 28,741 32 74
Sitapur
2010-11 1,35,600 - - 74,861 55 - 2011-12 1,35,637 72,030 53 77,553 57 108 2012-13 1,26,426 89,633 71 67,772 54 76 2013-14 1,77,246 78,229 44 75,504 43 97 2014-15 1,57,840 78,229 50 72,728 46 93
Sant Kabir Nagar
2010-11 40,254 25,147 62 31,812 79 127 2011-12 43,595 28,408 65 32,189 74 113 2012-13 43,808 31,249 71 29,525 67 94 2013-14 44,458 34,022 77 33,322 75 98 2014-15 45,480 34,721 76 31,803 70 92
Sultanpur
2010-11 93,804 58,068 62 58,880 63 101 2011-12 55,822 46,451 83 42,228 76 91 2012-13 46,876 46,451 99 37,714 80 81 2013-14 54,804 41,418 76 41,596 76 100 2014-15 53,108 41,418 78 39,934 75 96
Unnao
2010-11 86,756 32,123 37 36,333 42 113 2011-12 77,561 39,074 50 35,342 46 90 2012-13 69,509 40,958 59 32,858 47 80 2013-14 82,039 37,981 46 36,964 45 97 2014-15 78,577 42,938 55 38,246 49 89
Varanasi
2010-11 1,12,652 37,415 33 38,881 35 104 2011-12 1,00,451 39,227 39 35,923 36 92 2012-13 84,306 45,964 55 35,802 42 78 2013-14 1,02,153 69,660 68 37,867 37 54 2014-15 83,371 69,660 84 37,102 45 53
Total for 20 test-
checked districts
2010-11 16,90,483 6,17,261 37 8,07,412 48 131 2011-12 16,19,541 7,37,871 46 8,21,649 51 111 2012-13 16,40,301 9,14,666 56 8,11,165 49 89 2013-14 19,81,908 9,04,045 46 8,54,687 43 95 2014-15 18,26,087 9,34,854 51 8,56,749 47 92
(Source: Information provided by CMOs of test-checked districts and HMIS data) (-- = Not available)

113
Appendix 4.3 Year-wise Allotment and expenditure under MDR during 2010-15
(Reference: Paragraph no. 4.2.1: page 35)
(` in crore) Year Allotment Expenditure Balance Unutilised fund in per cent
2010-11 0.63 0.31 0.32 51
2011-12 0.57 0.11 0.46 81
2012-13 0.87 0.08 0.79 91
2013-14 4.42 1.06 3.36 76
2014-15 0.73 0.14 0.59 81
Total 7.22 1.70 5.52 76 (Source: Financial Management Report of NHM)
Appendix 4.4
Allotment and Expenditure under Family Planning during 2010-15 (Reference: Paragraph no. 4.3.1: page 37)
(` in crore) Year Allotment Expenditure Balance Unutilised fund in per cent
2010-11 83.45 44.27 39.18 47
2011-12 79.06 28.80 50.26 64
2012-13 67.43 32.61 34.82 52
2013-14 66.29 37.34 28.95 44
2014-15 84.34 51.65 32.69 39
Total 380.57 194.67 185.90 49 (Source: Financial Management Report of NHM)

114
Appendix 4.5 Year wise target and achievement of limiting methods
in test-checked districts (Reference: Paragraph no. 4.3.2: page 37)
District Year Vasectomy Tubectomy Target Achievement Percentage Target Achievement Percentage
1 2 3 4 5 6 7 8
Agra
2010-11 -- 107 -- -- 8,546 -- 2011-12 2,110 587 28 18,985 7,958 42 2012-13 2,110 460 22 18,985 8,477 45 2013-14 2,110 1,230 58 18,985 8,398 44 2014-15 2,110 948 45 18,985 7,783 41
Allahabad
2010-11 -- 501 -- -- 17,053 -- 2011-12 -- 866 -- -- 14,873 -- 2012-13 -- 688 -- -- 15,015 -- 2013-14 -- 654 -- -- 17,810 -- 2014-15 -- 845 -- -- 13,248 --
Ambedkar Nagar
2010-11 -- 19 -- -- 2,598 -- 2011-12 -- 13 -- -- 1,929 -- 2012-13 -- 5 -- -- 2,165 -- 2013-14 -- 3 -- -- 2,559 -- 2014-15 -- 3 -- -- 2,744 --
Azamgarh
2010-11 2,308 78 -- 20,777 8,826 -- 2011-12 2,308 24 -- 20,777 8,308 -- 2012-13 2,308 9 -- 20,777 7,721 -- 2013-14 2,308 1 -- 20,777 6,229 -- 2014-15 2,308 1 -- 20,777 6,579 --
Banda
2010-11 875 44 7,880 4,165 2011-12 875 06 7,880 3,345 2012-13 620 22 5,587 3,345 2013-14 620 14 5,587 3,414 2014-15 620 07 5,587 2,876
Bareilly
2010-11 2,104 216 -- 18,932 4,952 -- 2011-12 2,104 147 -- 18,932 4,647 -- 2012-13 2,104 147 -- 18,932 4,154 -- 2013-14 2,104 811 -- 18,932 5,229 -- 2014-15 2,104 1,649 -- 18,932 6,343 --
Bulandshahr
2010-11 1,707 209 12 15,365 5,041 33 2011-12 1,707 243 14 15,365 4,713 31 2012-13 1,707 181 11 15,365 4,124 27 2013-14 1,707 82 5 15,365 4,666 30

115
2014-15 1,707 58 3 15,365 4,700 31
Deoria
2010-11 1,595 13 1 14,357 6,000 42 2011-12 1,618 5 0 14,563 5,732 39 2012-13 1,618 4 0 14,563 5,235 36 2013-14 1,618 3 0 14,563 5,605 38 2014-15 1,618 9 1 14,563 4,122 28
Firozabad
2010-11 1,196 10 1 10,760 3,173 29 2011-12 1,196 6 1 10,760 2,646 25 2012-13 1,196 3 0 10,760 2,434 23 2013-14 1,196 7 1 10,760 2,435 23 2014-15 1,196 35 3 10,760 3,108 29
Gorakhpur
2010-11 -- 81 -- -- 11,611 -- 2011-12 -- 148 -- -- 13,080 -- 2012-13 -- 260 -- -- 12,245 -- 2013-14 -- 328 -- -- 12,761 -- 2014-15 -- 168 -- -- 11,271 --
Hardoi
2010-11 1,985 129 6 17,867 5,271 30 2011-12 1,985 43 2 17,867 3,759 21 2012-13 1,985 25 1 17,867 3,159 18 2013-14 1,985 11 1 17,867 3,256 18 2014-15 1,985 35 2 17,867 3,518 20
Jhansi
2010-11 1,020 24 2 9,181 9,297 101 2011-12 1,020 16 2 9,181 8,463 92 2012-13 26 15 58 12,280 8,937 73 2013-14 26 30 115 10,201 8,933 88 2014-15 26 21 81 10,201 8,845 87
Meerut
2010-11 1,717 489 28 15,820 6,633 42 2011-12 1,717 786 46 15,820 6,069 38 2012-13 1,717 286 17 15,820 4,868 31 2013-14 1,717 119 7 15,820 4,668 30 2014-15 1,717 279 16 15,820 4,601 29
Pratapgarh
2010-11 -- 46 -- -- 8,091 -- 2011-12 -- 245 -- -- 7,407 -- 2012-13 -- 253 -- -- 6,546 -- 2013-14 -- 46 -- -- 7,059 -- 2014-15 -- 18 -- -- 6,243 --
Saharanpur
2010-11 -- -- -- -- -- -- 2011-12 1,664 288 17 14,976 3,396 23 2012-13 1,664 97 6 14,976 2,996 20 2013-14 1,664 116 7 14,976 2,995 20 2014-15 1,664 68 4 14,976 2,549 17

116
Sitapur
2010-11 2,113 25 -- 19,019 9,164 48 2011-12 2,113 11 1 19,019 7,731 41 2012-13 2,113 2 0 19,019 7,761 41 2013-14 2,113 3 0 19,019 9,641 51 2014-15 2,113 6 0 19,019 8,835 46
Sant Kabir Nagar
2010-11 833 6 1 7,495 1,637 22 2011-12 833 6 1 7,495 1,324 18 2012-13 833 3 0 7,495 618 8 2013-14 833 16 2 7,495 2,028 27 2014-15 833 7 1 7,495 1,880 25
Sultanpur
2010-11 1,201 4 0 10,812 2,771 26 2011-12 1,201 3 0 10,812 2,662 25 2012-13 1,201 2 0 10,812 2,437 23 2013-14 1,201 7 1 10,812 2,276 21 2014-15 1,201 1 0 10,812 2,210 20
Unnao
2010-11 -- 20 -- -- 3,853 -- 2011-12 -- 7 -- -- 3,822 -- 2012-13 -- 5 -- -- 2,650 -- 2013-14 -- 7 -- -- 3,237 -- 2014-15 -- 6 -- -- 3,301 --
Varanasi
2010-11 189 138 73 18,207 12,361 68 2011-12 166 243 146 15,913 10,556 66 2012-13 166 450 271 15,913 9,935 62 2013-14 166 148 89 15,913 10,775 68 2014-15 166 253 152 15,913 10,192 64
All Test Checked Districts
2010-11 18,843 2,159 11 1,86,472 1,31,043 70 2011-12 22,617 3,693 16 2,18,345 1,22,420 56 2012-13 21,368 2,917 14 2,19,151 1,14,822 52 2013-14 21,368 3,636 17 2,17,072 1,23,974 57 2014-15 21,368 4,417 21 2,17,072 1,14,948 53
Grand Total 1,05,564 16,822 16 10,58,112 6,07,207 57 (Source: Information provided by CMOs of test-checked districts)
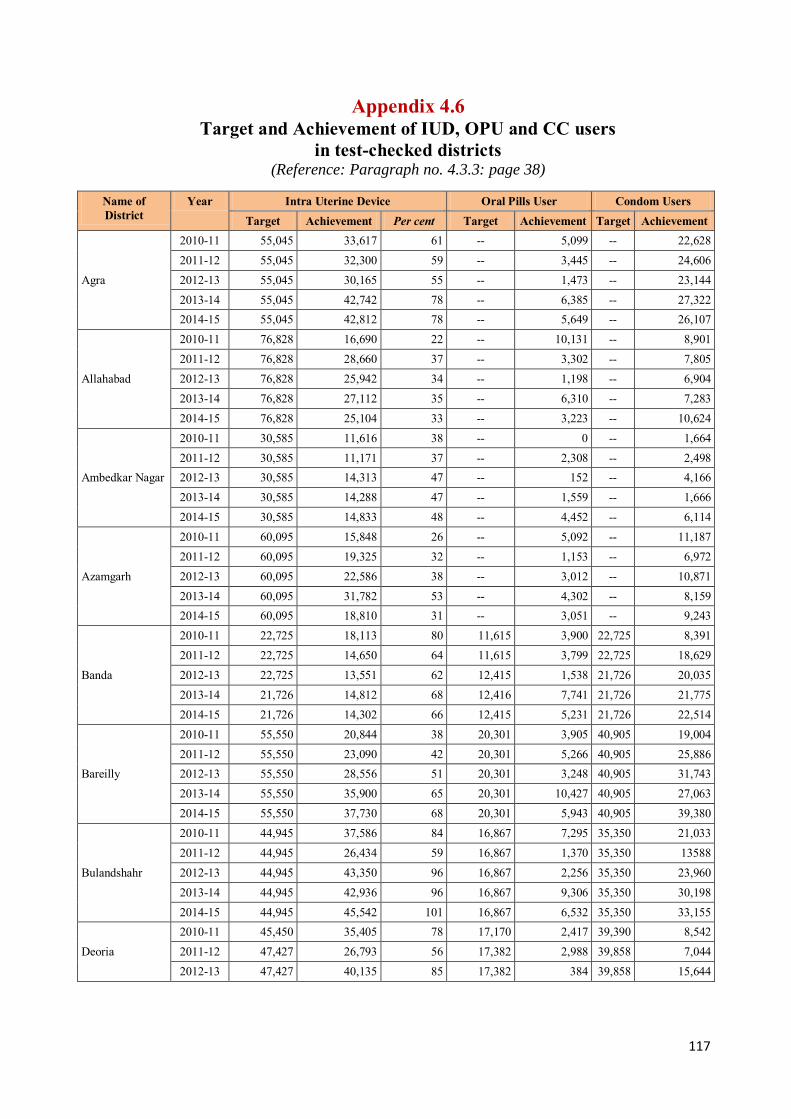
117
Appendix 4.6 Target and Achievement of IUD, OPU and CC users
in test-checked districts (Reference: Paragraph no. 4.3.3: page 38)
Name of District
Year Intra Uterine Device Oral Pills User Condom Users Target Achievement Per cent Target Achievement Target Achievement
Agra
2010-11 55,045 33,617 61 -- 5,099 -- 22,628 2011-12 55,045 32,300 59 -- 3,445 -- 24,606 2012-13 55,045 30,165 55 -- 1,473 -- 23,144 2013-14 55,045 42,742 78 -- 6,385 -- 27,322 2014-15 55,045 42,812 78 -- 5,649 -- 26,107
Allahabad
2010-11 76,828 16,690 22 -- 10,131 -- 8,901 2011-12 76,828 28,660 37 -- 3,302 -- 7,805 2012-13 76,828 25,942 34 -- 1,198 -- 6,904 2013-14 76,828 27,112 35 -- 6,310 -- 7,283 2014-15 76,828 25,104 33 -- 3,223 -- 10,624
Ambedkar Nagar
2010-11 30,585 11,616 38 -- 0 -- 1,664 2011-12 30,585 11,171 37 -- 2,308 -- 2,498 2012-13 30,585 14,313 47 -- 152 -- 4,166 2013-14 30,585 14,288 47 -- 1,559 -- 1,666 2014-15 30,585 14,833 48 -- 4,452 -- 6,114
Azamgarh
2010-11 60,095 15,848 26 -- 5,092 -- 11,187 2011-12 60,095 19,325 32 -- 1,153 -- 6,972 2012-13 60,095 22,586 38 -- 3,012 -- 10,871 2013-14 60,095 31,782 53 -- 4,302 -- 8,159 2014-15 60,095 18,810 31 -- 3,051 -- 9,243
Banda
2010-11 22,725 18,113 80 11,615 3,900 22,725 8,391 2011-12 22,725 14,650 64 11,615 3,799 22,725 18,629 2012-13 22,725 13,551 62 12,415 1,538 21,726 20,035 2013-14 21,726 14,812 68 12,416 7,741 21,726 21,775 2014-15 21,726 14,302 66 12,415 5,231 21,726 22,514
Bareilly
2010-11 55,550 20,844 38 20,301 3,905 40,905 19,004 2011-12 55,550 23,090 42 20,301 5,266 40,905 25,886 2012-13 55,550 28,556 51 20,301 3,248 40,905 31,743 2013-14 55,550 35,900 65 20,301 10,427 40,905 27,063 2014-15 55,550 37,730 68 20,301 5,943 40,905 39,380
Bulandshahr
2010-11 44,945 37,586 84 16,867 7,295 35,350 21,033 2011-12 44,945 26,434 59 16,867 1,370 35,350 13588 2012-13 44,945 43,350 96 16,867 2,256 35,350 23,960 2013-14 44,945 42,936 96 16,867 9,306 35,350 30,198 2014-15 44,945 45,542 101 16,867 6,532 35,350 33,155
Deoria 2010-11 45,450 35,405 78 17,170 2,417 39,390 8,542 2011-12 47,427 26,793 56 17,382 2,988 39,858 7,044 2012-13 47,427 40,135 85 17,382 384 39,858 15,644
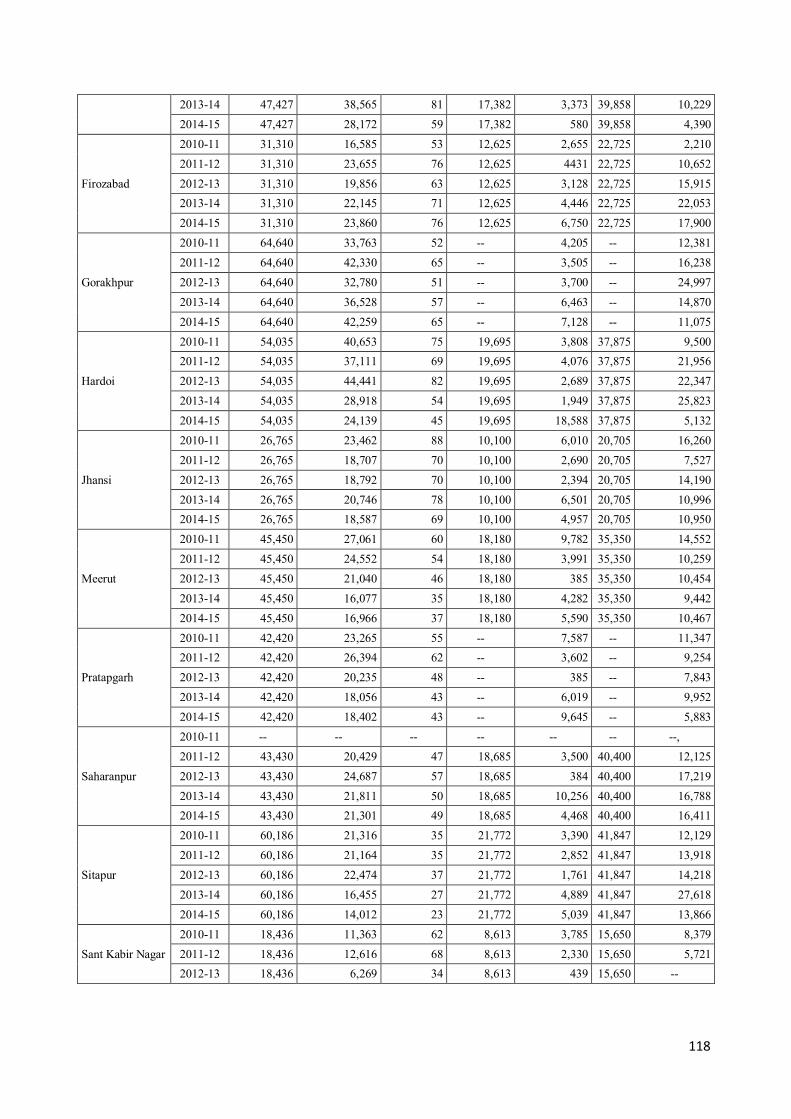
118
2013-14 47,427 38,565 81 17,382 3,373 39,858 10,229 2014-15 47,427 28,172 59 17,382 580 39,858 4,390
Firozabad
2010-11 31,310 16,585 53 12,625 2,655 22,725 2,210 2011-12 31,310 23,655 76 12,625 4431 22,725 10,652 2012-13 31,310 19,856 63 12,625 3,128 22,725 15,915 2013-14 31,310 22,145 71 12,625 4,446 22,725 22,053 2014-15 31,310 23,860 76 12,625 6,750 22,725 17,900
Gorakhpur
2010-11 64,640 33,763 52 -- 4,205 -- 12,381 2011-12 64,640 42,330 65 -- 3,505 -- 16,238 2012-13 64,640 32,780 51 -- 3,700 -- 24,997 2013-14 64,640 36,528 57 -- 6,463 -- 14,870 2014-15 64,640 42,259 65 -- 7,128 -- 11,075
Hardoi
2010-11 54,035 40,653 75 19,695 3,808 37,875 9,500 2011-12 54,035 37,111 69 19,695 4,076 37,875 21,956 2012-13 54,035 44,441 82 19,695 2,689 37,875 22,347 2013-14 54,035 28,918 54 19,695 1,949 37,875 25,823 2014-15 54,035 24,139 45 19,695 18,588 37,875 5,132
Jhansi
2010-11 26,765 23,462 88 10,100 6,010 20,705 16,260 2011-12 26,765 18,707 70 10,100 2,690 20,705 7,527 2012-13 26,765 18,792 70 10,100 2,394 20,705 14,190 2013-14 26,765 20,746 78 10,100 6,501 20,705 10,996 2014-15 26,765 18,587 69 10,100 4,957 20,705 10,950
Meerut
2010-11 45,450 27,061 60 18,180 9,782 35,350 14,552 2011-12 45,450 24,552 54 18,180 3,991 35,350 10,259 2012-13 45,450 21,040 46 18,180 385 35,350 10,454 2013-14 45,450 16,077 35 18,180 4,282 35,350 9,442 2014-15 45,450 16,966 37 18,180 5,590 35,350 10,467
Pratapgarh
2010-11 42,420 23,265 55 -- 7,587 -- 11,347 2011-12 42,420 26,394 62 -- 3,602 -- 9,254 2012-13 42,420 20,235 48 -- 385 -- 7,843 2013-14 42,420 18,056 43 -- 6,019 -- 9,952 2014-15 42,420 18,402 43 -- 9,645 -- 5,883
Saharanpur
2010-11 -- -- -- -- -- -- --, 2011-12 43,430 20,429 47 18,685 3,500 40,400 12,125 2012-13 43,430 24,687 57 18,685 384 40,400 17,219 2013-14 43,430 21,811 50 18,685 10,256 40,400 16,788 2014-15 43,430 21,301 49 18,685 4,468 40,400 16,411
Sitapur
2010-11 60,186 21,316 35 21,772 3,390 41,847 12,129 2011-12 60,186 21,164 35 21,772 2,852 41,847 13,918 2012-13 60,186 22,474 37 21,772 1,761 41,847 14,218 2013-14 60,186 16,455 27 21,772 4,889 41,847 27,618 2014-15 60,186 14,012 23 21,772 5,039 41,847 13,866
Sant Kabir Nagar 2010-11 18,436 11,363 62 8,613 3,785 15,650 8,379 2011-12 18,436 12,616 68 8,613 2,330 15,650 5,721 2012-13 18,436 6,269 34 8,613 439 15,650 --
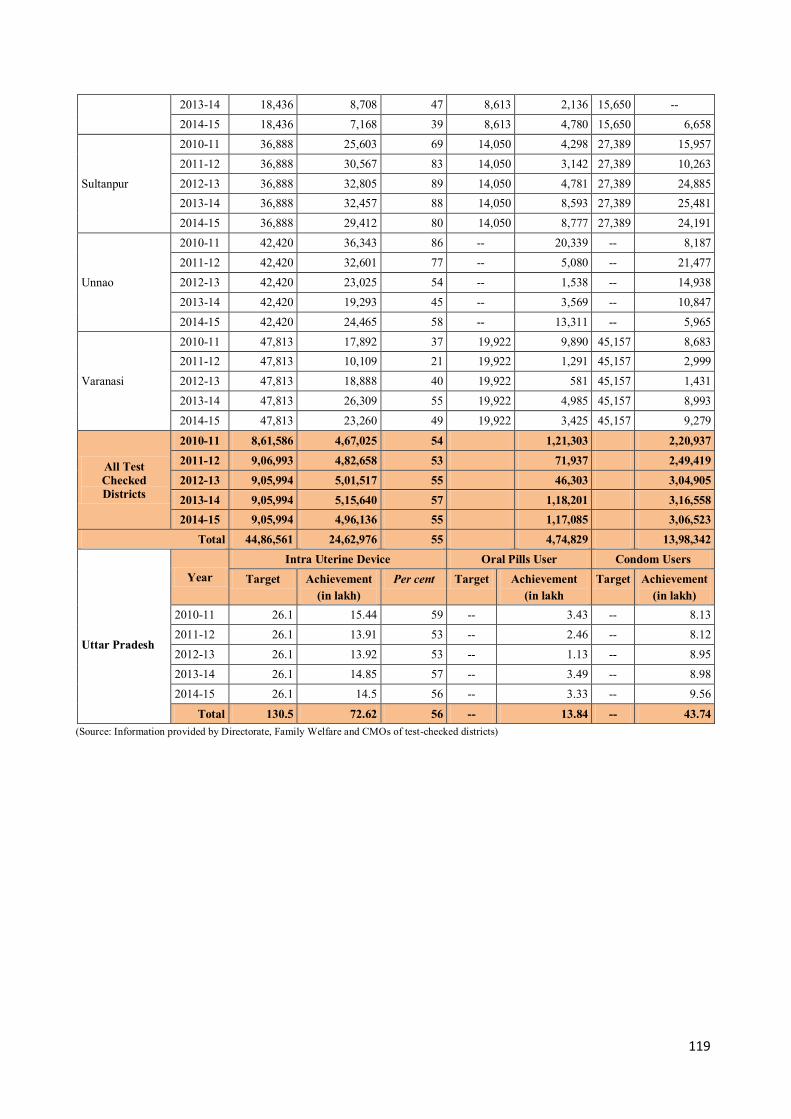
119
2013-14 18,436 8,708 47 8,613 2,136 15,650 -- 2014-15 18,436 7,168 39 8,613 4,780 15,650 6,658
Sultanpur
2010-11 36,888 25,603 69 14,050 4,298 27,389 15,957 2011-12 36,888 30,567 83 14,050 3,142 27,389 10,263 2012-13 36,888 32,805 89 14,050 4,781 27,389 24,885 2013-14 36,888 32,457 88 14,050 8,593 27,389 25,481 2014-15 36,888 29,412 80 14,050 8,777 27,389 24,191
Unnao
2010-11 42,420 36,343 86 -- 20,339 -- 8,187 2011-12 42,420 32,601 77 -- 5,080 -- 21,477 2012-13 42,420 23,025 54 -- 1,538 -- 14,938 2013-14 42,420 19,293 45 -- 3,569 -- 10,847 2014-15 42,420 24,465 58 -- 13,311 -- 5,965
Varanasi
2010-11 47,813 17,892 37 19,922 9,890 45,157 8,683 2011-12 47,813 10,109 21 19,922 1,291 45,157 2,999 2012-13 47,813 18,888 40 19,922 581 45,157 1,431 2013-14 47,813 26,309 55 19,922 4,985 45,157 8,993 2014-15 47,813 23,260 49 19,922 3,425 45,157 9,279
All Test Checked Districts
2010-11 8,61,586 4,67,025 54 1,21,303 2,20,937 2011-12 9,06,993 4,82,658 53 71,937 2,49,419 2012-13 9,05,994 5,01,517 55 46,303 3,04,905 2013-14 9,05,994 5,15,640 57 1,18,201 3,16,558 2014-15 9,05,994 4,96,136 55 1,17,085 3,06,523
Total 44,86,561 24,62,976 55 4,74,829 13,98,342
Uttar Pradesh
Year Intra Uterine Device Oral Pills User Condom Users
Target Achievement (in lakh)
Per cent Target Achievement (in lakh
Target Achievement (in lakh)
2010-11 26.1 15.44 59 -- 3.43 -- 8.13 2011-12 26.1 13.91 53 -- 2.46 -- 8.12 2012-13 26.1 13.92 53 -- 1.13 -- 8.95 2013-14 26.1 14.85 57 -- 3.49 -- 8.98 2014-15 26.1 14.5 56 -- 3.33 -- 9.56
Total 130.5 72.62 56 -- 13.84 -- 43.74 (Source: Information provided by Directorate, Family Welfare and CMOs of test-checked districts)
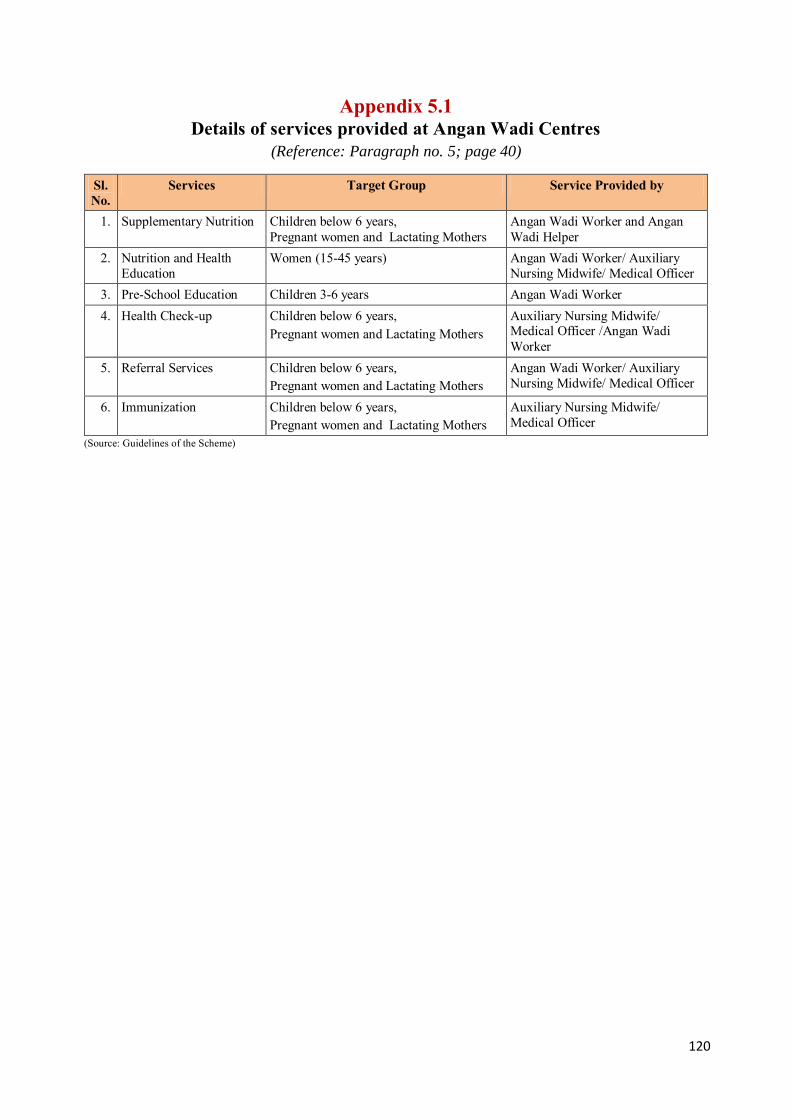
120
Appendix 5.1 Details of services provided at Angan Wadi Centres
(Reference: Paragraph no. 5; page 40)
Sl. No.
Services Target Group Service Provided by
1. Supplementary Nutrition Children below 6 years, Pregnant women and Lactating Mothers
Angan Wadi Worker and Angan Wadi Helper
2. Nutrition and Health Education
Women (15-45 years) Angan Wadi Worker/ Auxiliary Nursing Midwife/ Medical Officer
3. Pre-School Education Children 3-6 years Angan Wadi Worker 4. Health Check-up Children below 6 years,
Pregnant women and Lactating Mothers Auxiliary Nursing Midwife/ Medical Officer /Angan Wadi Worker
5. Referral Services Children below 6 years, Pregnant women and Lactating Mothers
Angan Wadi Worker/ Auxiliary Nursing Midwife/ Medical Officer
6. Immunization Children below 6 years, Pregnant women and Lactating Mothers
Auxiliary Nursing Midwife/ Medical Officer
(Source: Guidelines of the Scheme)

121
Appendix 5.2 Details and nutritional value of supplementary
nutrition provided to beneficiaries (Reference: Paragraph no. 5; page 40)
Sl. No.
Category of beneficiary
Name of supplement
ary nutrition
Per beneficiary per day
Rate and nutritional component approved
by GoI for per beneficiary per day
Quantity of daily nutritional
component supplied to beneficiaries
Rate (in `)
Protein (in gram)
Calorie Protein (in gram)
Calorie
(1) (2) (3) (4) (5) (6) (7) (8) (9)
1
General children between age of six months and three years
Weaning food *
For six days in a week at the rate of 120 gram per day once in a week (in form of THR4) 6.00 12-15 500 14.40 504
Severely malnourished children between age of six months and three years
For six days in a week at the rate of 200 gram per day once in a week (in form of THR) 9.00 20-25 800 24.00 840
2
General children between age of three years and six years
Hot cooked food in form of Khichdi/ Dalia
Approximately 100 to 125 gram per beneficiary per day
6.00 12-15 500 15-17 522-587 Morning snack
Daily 50 gram amylase rich energy food for four days in a week (except Wednesday and Friday) Local fruit/Gur-chana/ lai-chana two days in a week (on Wednesday and Friday)
3
Severely malnourished children between age of three years and six years
Amylase rich energy food **
In addition to above at Sl. No. 2, amylase rich energy food at the rate of 75 gram per day for six days in a week at once (in form of THR)
9.00 20-25 800 25-26 822-887
4 Pregnant women and lactating mothers
Amylase rich energy food **
For six days in a week at the rate of 140 gram per day once in a week (in form of THR)
7.00 18-20 600 18.20 602
(Source: Directorate, ICDS) * Weaning food constitute: wheat flour 25 per cent, soya flour 14 per cent, rice five per cent, corn five per cent, gram flour 15 per cent, sugar 25 per cent, vegetable oil 10 per cent, vitamin minerals one per cent. Nutritional component in per 100 gram weaning food: Calorie 420, Protein 12 gram, micronutrient - 50 per cent of RDA5.
** Amylase rich energy food constitute: wheat flour 25 per cent, soya flour 15 per cent, ragi five per cent, corn five per cent, peanut five per cent,
gram flour 10 per cent, sugar 25 per cent, vegetable oil nine per cent, vitamin minerals one per cent. Nutritional component in per 100 gram amylase rich energy food: Calorie 430, Protein 13 gram, micronutrient - 50 per cent of RDA.
4 Take Home Ration. 5 Recommended Dietary Allowance.
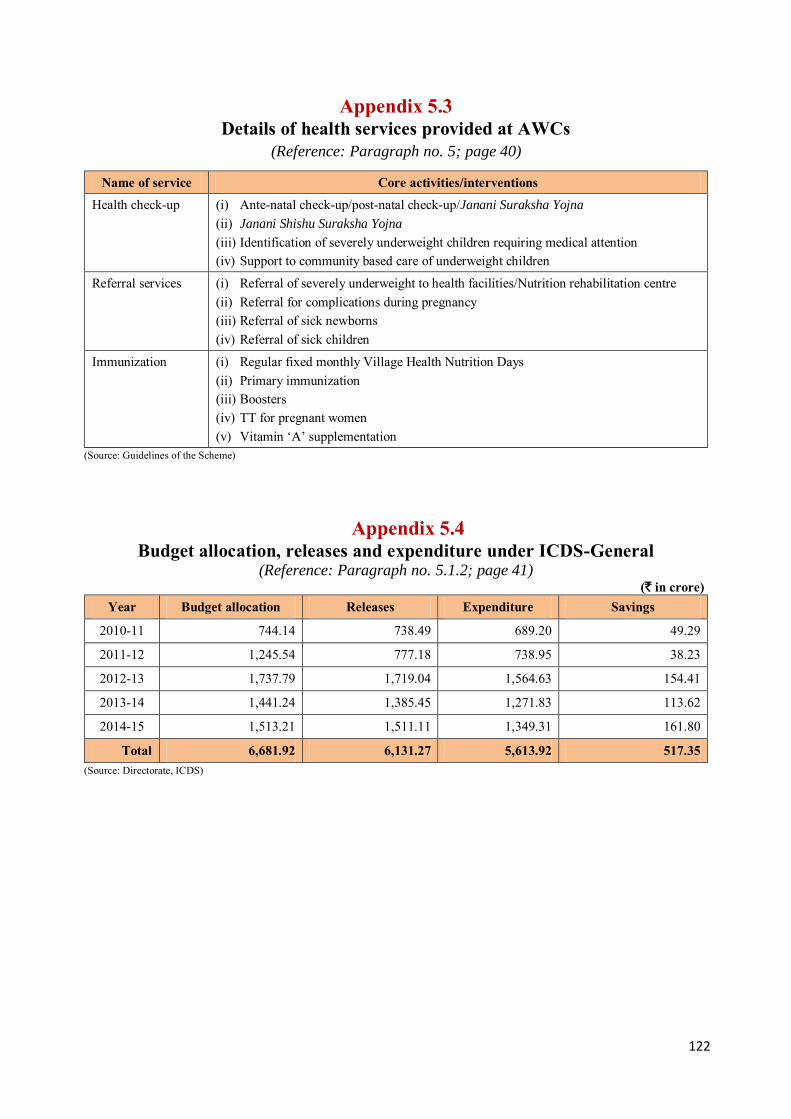
122
Appendix 5.3 Details of health services provided at AWCs
(Reference: Paragraph no. 5; page 40)
Name of service Core activities/interventions Health check-up (i) Ante-natal check-up/post-natal check-up/Janani Suraksha Yojna
(ii) Janani Shishu Suraksha Yojna
(iii) Identification of severely underweight children requiring medical attention (iv) Support to community based care of underweight children
Referral services (i) Referral of severely underweight to health facilities/Nutrition rehabilitation centre (ii) Referral for complications during pregnancy (iii) Referral of sick newborns (iv) Referral of sick children
Immunization (i) Regular fixed monthly Village Health Nutrition Days (ii) Primary immunization (iii) Boosters (iv) TT for pregnant women (v) Vitamin ‘A’ supplementation
(Source: Guidelines of the Scheme)
Appendix 5.4 Budget allocation, releases and expenditure under ICDS-General
(Reference: Paragraph no. 5.1.2; page 41) (` in crore)
Year Budget allocation Releases Expenditure Savings
2010-11 744.14 738.49 689.20 49.29
2011-12 1,245.54 777.18 738.95 38.23
2012-13 1,737.79 1,719.04 1,564.63 154.41
2013-14 1,441.24 1,385.45 1,271.83 113.62
2014-15 1,513.21 1,511.11 1,349.31 161.80
Total 6,681.92 6,131.27 5,613.92 517.35 (Source: Directorate, ICDS)

123
Appendix 5.5 Details of non-availability of basic amenities at AWCs
(Reference: Paragraph no. 5.3.2; page 43)
Sl. No.
Name of the District Total no. of Projects
Total no. of AWCs
Number of AWCs not having Toilet facility Safe drinking
water facility Kitchen facility
1. Agra 16 2,982 995 (33) 2,165 (73) 739 (25) 2. Allahabad 22 4,499 1,910 (42) 2,928 (65) 852 (19) 3. Ambedkar Nagar 10 2,548 1,865 (73) 2,238 (88) 993 (39) 4. Azamgarh 23 5,588 979 (18) 4,057 (73) 767 (14) 5. Banda 9 1,705 1,116 (65) 1,569 (92) 707 (41) 6. Bareilly 16 2,857 2,656 (93) 2,731 (96) 214 (7) 7. Bulandshahr 16 3,958 3,506 (89) 3,646 (92) 904 (23) 8. Deoria 17 3,243 2,512 (77) 2,966 (91) 432 (13) 9. Firozabad 11 2,540 1,778 (70) 1,889 (74) 988 (39) 10. Gorakhpur 20 4,032 2,822 (70) 3,746 (93) 872 (22) 11. Hardoi 20 3,930 3,814 (97) 39,12 (100) 616 (16) 12. Jhansi 9 1,379 1,234 (89) 1,371 (99) 303 (22) 13. Meerut 13 2,076 1,862 (90) 1,757 (85) 965 (46) 14. Pratapgarh 17 3,247 2,216 (68) 2,581 (79) 1,277 (39) 15. Saharanpur 12 3,408 2,736 (80) 2,925 (86) 1,641 (48) 16. Sant Kabir Nagar 10 1,765 251 (14) 980 (56) 251 (14) 17. Sitapur 20 4,232 3,657 (86) 4,101 (97) 4,063 (96) 18. Sultanpur 14 2,511 2,159 (86) 2,386 (95) 379 (15) 19. Unnao 17 3,352 2,734 (82) 3,203 (96) 297 (9) 20. Varanasi 9 3,914 2,798 (71) 2,606 (67) 1,207 (31)
Total 301 63,766 43,600 (68) 53,757 (84) 18,467 (29) (Source: Information provided by DPOs of test checked districts)
Appendix 5.6 Budget allocation and expenditure under Supplementary Nutrition Programme
(Reference: Paragraph no. 5.4.1.1(i); page 45)
(` in crore) Year Budget
demand Budget allocation Total
Budget Released
GoI Share State share spent
Total expenditure
(10+12)
Saving (6-13) Central State Total
(2+3) OB Releases Available
(7+8) Spent CB
(7-8)
(1) (2) (3) (4) (5) (6) (7) (8) (9) (10) (11) (12) (13) (14)
2010-11 2,853.20 1,361.89 1,361.89 2,723.78 2,720.02 -27.46 1,382.67 1,355.21 1,359.80 -4.59 1,359.80 2,719.60 0.42
2011-12 2,792.00 1,341.56 1,341.56 2,683.12 2,680.61 -4.59 1,316.00 1,311.41 1,340.14 -28.73 1,340.14 2,680.28 0.33
2012-13 2,682.50 1,332.25 1,332.25 2,664.50 2,664.50 -28.73 1,179.53 1,150.80 1,198.15 -47.35 1,198.15 2,396.30 268.20
2013-14 2,712.90 1,481.44 1,481.44 2,962.88 2,962.90 -47.35 1,100.86 1,053.51 1,480.89 -427.38 1,480.89 2,961.78 1.120
2014-15 3,343.61 1,821.80 1,821.80 3,643.60 3,643.61 -427.38 1,523.71 1,096.33 1,774.62 -678.29 1,774.62 3,549.24 94.37
Total 14,384.21 7,338.94 7,338.94 14,677.88 14,671.64 6,502.77 5,967.26 7,153.60 7,153.60 14,307.20 364.44 (Source: Directorate, ICDS)
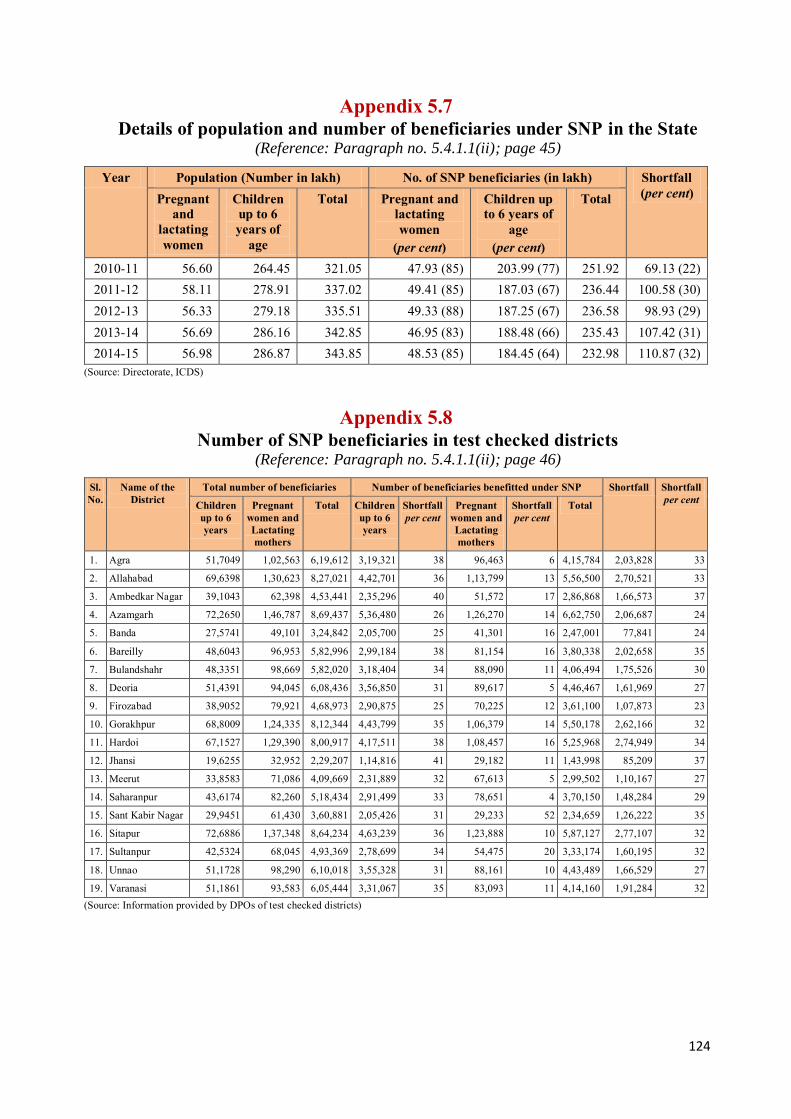
124
Appendix 5.7 Details of population and number of beneficiaries under SNP in the State
(Reference: Paragraph no. 5.4.1.1(ii); page 45)
Year Population (Number in lakh) No. of SNP beneficiaries (in lakh) Shortfall (per cent) Pregnant
and lactating women
Children up to 6 years of
age
Total Pregnant and lactating women
(per cent)
Children up to 6 years of
age (per cent)
Total
2010-11 56.60 264.45 321.05 47.93 (85) 203.99 (77) 251.92 69.13 (22) 2011-12 58.11 278.91 337.02 49.41 (85) 187.03 (67) 236.44 100.58 (30) 2012-13 56.33 279.18 335.51 49.33 (88) 187.25 (67) 236.58 98.93 (29) 2013-14 56.69 286.16 342.85 46.95 (83) 188.48 (66) 235.43 107.42 (31) 2014-15 56.98 286.87 343.85 48.53 (85) 184.45 (64) 232.98 110.87 (32)
(Source: Directorate, ICDS)
Appendix 5.8 Number of SNP beneficiaries in test checked districts
(Reference: Paragraph no. 5.4.1.1(ii); page 46)
Sl. No.
Name of the District
Total number of beneficiaries Number of beneficiaries benefitted under SNP Shortfall Shortfall per cent Children
up to 6 years
Pregnant women and Lactating mothers
Total Children up to 6 years
Shortfall per cent
Pregnant women and Lactating mothers
Shortfall per cent
Total
1. Agra 51,7049 1,02,563 6,19,612 3,19,321 38 96,463 6 4,15,784 2,03,828 33
2. Allahabad 69,6398 1,30,623 8,27,021 4,42,701 36 1,13,799 13 5,56,500 2,70,521 33
3. Ambedkar Nagar 39,1043 62,398 4,53,441 2,35,296 40 51,572 17 2,86,868 1,66,573 37
4. Azamgarh 72,2650 1,46,787 8,69,437 5,36,480 26 1,26,270 14 6,62,750 2,06,687 24
5. Banda 27,5741 49,101 3,24,842 2,05,700 25 41,301 16 2,47,001 77,841 24
6. Bareilly 48,6043 96,953 5,82,996 2,99,184 38 81,154 16 3,80,338 2,02,658 35
7. Bulandshahr 48,3351 98,669 5,82,020 3,18,404 34 88,090 11 4,06,494 1,75,526 30
8. Deoria 51,4391 94,045 6,08,436 3,56,850 31 89,617 5 4,46,467 1,61,969 27
9. Firozabad 38,9052 79,921 4,68,973 2,90,875 25 70,225 12 3,61,100 1,07,873 23
10. Gorakhpur 68,8009 1,24,335 8,12,344 4,43,799 35 1,06,379 14 5,50,178 2,62,166 32
11. Hardoi 67,1527 1,29,390 8,00,917 4,17,511 38 1,08,457 16 5,25,968 2,74,949 34
12. Jhansi 19,6255 32,952 2,29,207 1,14,816 41 29,182 11 1,43,998 85,209 37
13. Meerut 33,8583 71,086 4,09,669 2,31,889 32 67,613 5 2,99,502 1,10,167 27
14. Saharanpur 43,6174 82,260 5,18,434 2,91,499 33 78,651 4 3,70,150 1,48,284 29
15. Sant Kabir Nagar 29,9451 61,430 3,60,881 2,05,426 31 29,233 52 2,34,659 1,26,222 35
16. Sitapur 72,6886 1,37,348 8,64,234 4,63,239 36 1,23,888 10 5,87,127 2,77,107 32
17. Sultanpur 42,5324 68,045 4,93,369 2,78,699 34 54,475 20 3,33,174 1,60,195 32
18. Unnao 51,1728 98,290 6,10,018 3,55,328 31 88,161 10 4,43,489 1,66,529 27
19. Varanasi 51,1861 93,583 6,05,444 3,31,067 35 83,093 11 4,14,160 1,91,284 32 (Source: Information provided by DPOs of test checked districts)

125
Appendix 5.9 Details of calculation of total number of nutrition days in a month and year during 2010-15
(Reference: Paragraph no. 5.4.1.1(iii): page 46)
Year Children 6-72 months excluding severely malnourished
Severely malnourished children 6-72 months
Pregnant women and lactating mothers
Average days in a month for which supple-
mentary nutrition was provided to
each category of
beneficiaries
Average days in a year for
which supplementary nutrition was provided to
each category of beneficiary (Column 11 x 12 months)
Total expenditure incurred on
distribution of supplementary
nutrition as per utilisation
certificates (` in crore)
Total expenditure calculated in
audit which is most
approximately equal to actual expenditure on supplementary
nutrition during the year
(` in crore) (Column 4+7+10)
No. of Bene-
ficiaries in lakh
Cost norm per bene-ficiary per
day (in `)
Total expen- diture (` in
crore)1
No. of Bene-
ficiaries in lakh
Cost norm per
bene-ficiary per day (in `)
Total expen- diture (` in
crore)2
No. of Bene-
ficiaries in lakh
Cost norm per bene-ficiary per
day (in `)
Total expen- diture (`in
crore)3
(1) (2) (3) (4) (5) (6) (7) (8) (9) (10) (11) (12) (13) (14)
2010-11 203.70 4 2,098.27 0.28 6 4.33 47.93 5 617.15 21.46 258 2,719.60 2,719.75
2011-12 186.70 4 2,010.09 0.34 6 5.49 49.41 5 664.96 22.43 269 2,680.28 2,680.54
2012-13 186.66 4 1,795.52 0.59 6 8.51 49.33 5 593.14 20.04 240 2,396.30 2,397.17
2013-14 187.87 (4 & 6)4 2,269.82 0.61 (6 & 9)5 11.16 46.95 (5 & 7)6 681.58 20.00 240 2,961.78 2,962.56
2014-15 182.99 6 2,686.44 1.46 9 32.15 48.53 7 831.20 20.39 245 3,549.34 3,549.79 (Source: Information provided by Directorate, ICDS)
1 Column 2 x column 3 x column 11 x 12 months /100 ( to convert ` in lakh to ` in crore). 2 Column 5 x column 6 x column 11 x 12 months/100. 3 Column 8 x column 9 x column 11 x 12 months/100. 4 90.73 lakh children were provided supplementary nutrition at the rate of ` 4 per day and 97.14 lakh at the rate of ` 6 per day during the year. 5 0.28 lakh severely malnourished children were provided supplementary nutrition at the rate of ` 6 per day and 0.33 lakh at the rate of ` 9 per day during the year. 6 22.33 lakh pregnant women and lactating mothers were provided supplementary nutrition at the rate of ` 5 per day and 24.62 lakh at the rate of ` 7 per day during the year.
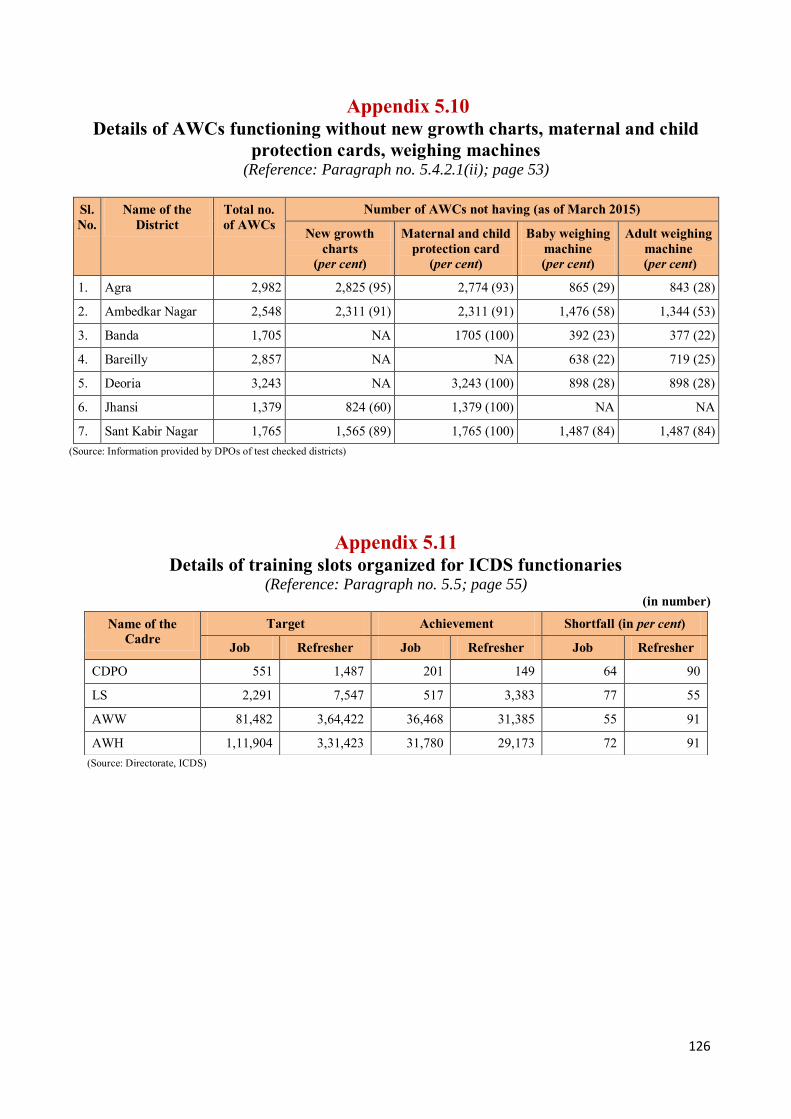
126
Appendix 5.10 Details of AWCs functioning without new growth charts, maternal and child
protection cards, weighing machines (Reference: Paragraph no. 5.4.2.1(ii); page 53)
Sl. No.
Name of the District
Total no. of AWCs
Number of AWCs not having (as of March 2015)
New growth charts
(per cent)
Maternal and child protection card
(per cent)
Baby weighing machine (per cent)
Adult weighing machine
(per cent)
1. Agra 2,982 2,825 (95) 2,774 (93) 865 (29) 843 (28)
2. Ambedkar Nagar 2,548 2,311 (91) 2,311 (91) 1,476 (58) 1,344 (53)
3. Banda 1,705 NA 1705 (100) 392 (23) 377 (22)
4. Bareilly 2,857 NA NA 638 (22) 719 (25)
5. Deoria 3,243 NA 3,243 (100) 898 (28) 898 (28)
6. Jhansi 1,379 824 (60) 1,379 (100) NA NA
7. Sant Kabir Nagar 1,765 1,565 (89) 1,765 (100) 1,487 (84) 1,487 (84) (Source: Information provided by DPOs of test checked districts)
Appendix 5.11 Details of training slots organized for ICDS functionaries
(Reference: Paragraph no. 5.5; page 55) (in number)
(Source: Directorate, ICDS)
Name of the Cadre
Target Achievement Shortfall (in per cent)
Job Refresher Job Refresher Job Refresher
CDPO 551 1,487 201 149 64 90
LS 2,291 7,547 517 3,383 77 55
AWW 81,482 3,64,422 36,468 31,385 55 91
AWH 1,11,904 3,31,423 31,780 29,173 72 91
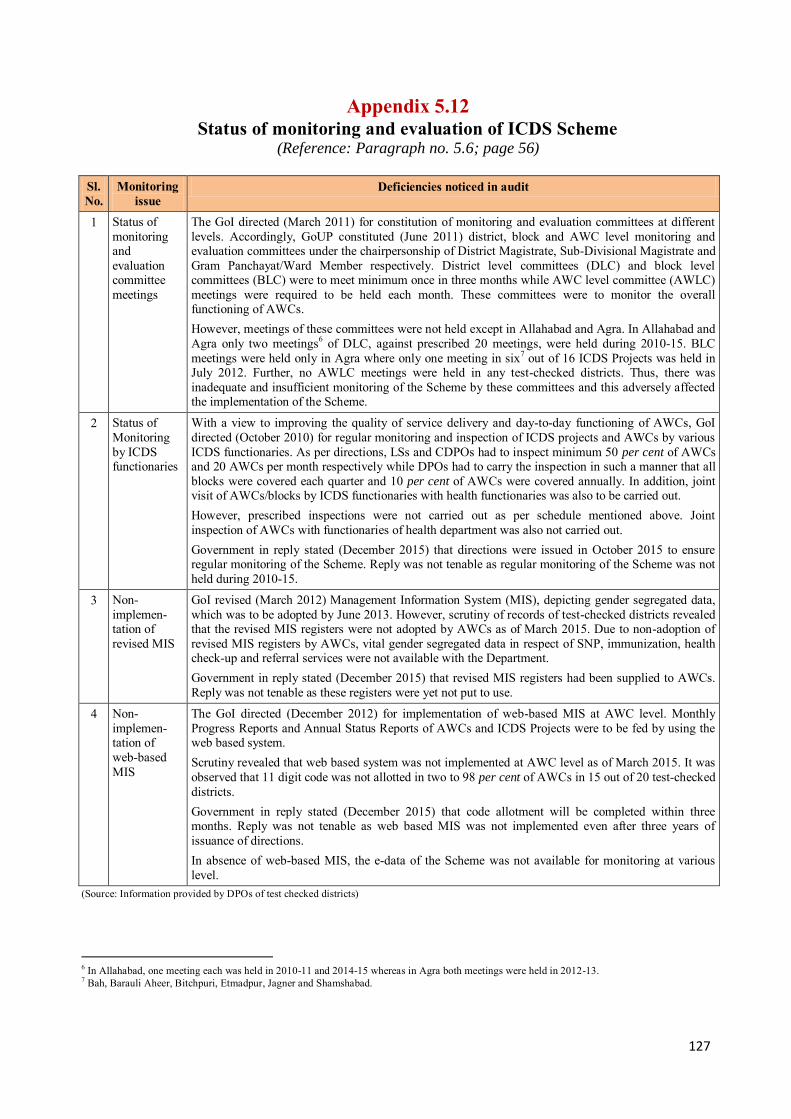
127
Appendix 5.12 Status of monitoring and evaluation of ICDS Scheme
(Reference: Paragraph no. 5.6; page 56)
Sl. No.
Monitoring issue
Deficiencies noticed in audit
1 Status of monitoring and evaluation committee meetings
The GoI directed (March 2011) for constitution of monitoring and evaluation committees at different levels. Accordingly, GoUP constituted (June 2011) district, block and AWC level monitoring and evaluation committees under the chairpersonship of District Magistrate, Sub-Divisional Magistrate and Gram Panchayat/Ward Member respectively. District level committees (DLC) and block level committees (BLC) were to meet minimum once in three months while AWC level committee (AWLC) meetings were required to be held each month. These committees were to monitor the overall functioning of AWCs. However, meetings of these committees were not held except in Allahabad and Agra. In Allahabad and Agra only two meetings6 of DLC, against prescribed 20 meetings, were held during 2010-15. BLC meetings were held only in Agra where only one meeting in six7 out of 16 ICDS Projects was held in July 2012. Further, no AWLC meetings were held in any test-checked districts. Thus, there was inadequate and insufficient monitoring of the Scheme by these committees and this adversely affected the implementation of the Scheme.
2 Status of Monitoring by ICDS functionaries
With a view to improving the quality of service delivery and day-to-day functioning of AWCs, GoI directed (October 2010) for regular monitoring and inspection of ICDS projects and AWCs by various ICDS functionaries. As per directions, LSs and CDPOs had to inspect minimum 50 per cent of AWCs and 20 AWCs per month respectively while DPOs had to carry the inspection in such a manner that all blocks were covered each quarter and 10 per cent of AWCs were covered annually. In addition, joint visit of AWCs/blocks by ICDS functionaries with health functionaries was also to be carried out. However, prescribed inspections were not carried out as per schedule mentioned above. Joint inspection of AWCs with functionaries of health department was also not carried out. Government in reply stated (December 2015) that directions were issued in October 2015 to ensure regular monitoring of the Scheme. Reply was not tenable as regular monitoring of the Scheme was not held during 2010-15.
3 Non-implemen-tation of revised MIS
GoI revised (March 2012) Management Information System (MIS), depicting gender segregated data, which was to be adopted by June 2013. However, scrutiny of records of test-checked districts revealed that the revised MIS registers were not adopted by AWCs as of March 2015. Due to non-adoption of revised MIS registers by AWCs, vital gender segregated data in respect of SNP, immunization, health check-up and referral services were not available with the Department. Government in reply stated (December 2015) that revised MIS registers had been supplied to AWCs. Reply was not tenable as these registers were yet not put to use.
4 Non-implemen-tation of web-based MIS
The GoI directed (December 2012) for implementation of web-based MIS at AWC level. Monthly Progress Reports and Annual Status Reports of AWCs and ICDS Projects were to be fed by using the web based system. Scrutiny revealed that web based system was not implemented at AWC level as of March 2015. It was observed that 11 digit code was not allotted in two to 98 per cent of AWCs in 15 out of 20 test-checked districts. Government in reply stated (December 2015) that code allotment will be completed within three months. Reply was not tenable as web based MIS was not implemented even after three years of issuance of directions. In absence of web-based MIS, the e-data of the Scheme was not available for monitoring at various level.
(Source: Information provided by DPOs of test checked districts)
6 In Allahabad, one meeting each was held in 2010-11 and 2014-15 whereas in Agra both meetings were held in 2012-13. 7 Bah, Barauli Aheer, Bitchpuri, Etmadpur, Jagner and Shamshabad.

128
Appendix 6.1 Funds released and expenditure (State level)
(Reference: Paragraph no. 6.1.1.1; page 57) (` in crore)
Sl. No.
Year Fund requirement as per norm8
Fund allotted
Funds released
Expenditure Surrender/Lapsed
1. 2010-11 6.622 9.24 4.64 4.50 0.14 2. 2011-12 6.622 6.62 6.62 3.31 3.31 3. 2012-13 6.622 6.62 1.66 0.01 1.65 4. 2013-14 6.622 6.62 2.65 1.95 0.70 5. 2014-15 6.622 3.32 3.31 1.92 1.39
Total 33.110 32.42 18.88 11.69 7.19 Percentage of released against allocated amount
58 Percentage of spent against released amount
62
(Source: Directorate, ICDS)
Appendix 6.2 Details of identified and targeted Adolescent Girls in
Test-checked districts and State (Reference: Paragraph no. 6.1.2; page 58)
Sl. No.
District 2012-13 2013-14 2014-15 Identified
AGs Selected AGs as
Beneficiary
Selected AGs
in per cent
Identified AGs
Selected AGs as
Beneficiary
Selected AGs in per cent
Identified AGs
Selected AGs as
Beneficiary
Selected AGs in per cent
1. Allahabad 3,24,557 1,320 0.41 3,18,601 1,320 0.41 3,54,952 1,320 0.37
2. Ambedkar Nagar
1,87,618 600 0.32 2,17,797 600 0.28 2,11,855 600 0.28
3. Azamgarh 75,326 1,380 1.83 4,68,946 1,380 0.29 1,69,971 1,380 0.81 4. Bareilly 2,12,820 960 0.45 2,18,105 960 0.44 57,413 960 1.67 5. Firozabad 1,23,785 660 0.53 94,964 660 0.70 1,00,856 660 0.65 6. Gorakhpur 1,71,310 1,200 0.70 1,42,662 1,200 0.84 1,11,949 1,200 1.07 7. Hardoi NA NA NA 2,21,079 1,200 0.54 2,23,185 1,200 0.54
8. Jhansi 78,308 540 0.69 79,491 540 0.68 67,633 540 0.80 9. Meerut 1,11,168 780 0.70 1,08,321 780 0.72 1,13,344 780 0.69 10. Pratapgarh 2,59,716 1,020 0.39 2,29,974 1,020 0.44 1,83,017 1,020 0.56
11. Sant Kabir Nagar
73,717 600 0.81 83,731 600 0.72 83,731 600 0.72
12. Sultanpur NA NA NA NA NA NA 1,95,945 840 0.43 13. Unnao 1,71,226 1,020 0.60 1,84,472 1,020 0.55 1,84,721 1,020 0.55 14. Varanasi 2,98,671 540 0.18 2,92,628 540 0.18 2,66,675 540 0.20
Total 20,88,222 10,620 0.51 26,60,771 11,820 0.44 23,25,247 12,660 0.54 Uttar Pradesh NA 36,120 NA 36,120
NA 36,120
(Source: Directorate, ICDS and Test-checked Districts)
8 ` 1,10,000 per project X 602 projects in the state

129
Appendix 6.3 Status of Identified and Benefited AGs for SNP
(Reference: Paragraph no. 6.1.3; page 59) (in numbers)
Sl. No
District 2012-13 2013-14 2014-15
Identified AGs
Selected AGs as
Beneficiary
Shortfall in
per cent
Identified AGs
Selected AGs as
Beneficiary
Shortfall in
per cent
Identified AGs
Selected AGs as
Beneficiary
Shortfall in
per cent
1. Allahabad 3,24,557 12,868 96 3,18,601 13,336 96 3,54,952 12,865 96
2. Ambedkar Nagar
1,87,618 7,465 96 2,17,797 7,631 97 2,11,855 7,476 96
3. Azamgarh 75,326 16,490 78 4,68,946 16,838 96 1,69,971 17,949 89
4. Bareilly 2,12,820 8,571 96 2,18,105 8,202 96 57,413 8,238 86
5. Firozabad 1,23,785 7,620 94 94,964 7,620 92 1,00,856 7,620 92
6. Gorakhpur 1,71,310 11,297 93 1,42,662 11,950 92 1,11,949 12,096 89
7. Hardoi NA NA NA 2,21,079 11,790 95 2,23,185 11,790 95
8. Jhansi 78,308 3,890 95 79,491 4,099 95 67,633 3,584 95
9. Meerut 1,11,168 6,093 95 1,08,321 7,481 93 1,13,344 6,219 95
10. Pratapgarh 2,59,716 9,741 96 2,29,974 9,741 96 1,83,017 9,745 95
11. Sultanpur NA NA NA NA NA NA 1,95,945 7,246 96
12. Sant Kabir Nagar
73,717 5,315 93 83,731 5,315 94 83,731 5,315 94
13. Unnao 1,71,226 10,006 94 1,84,472 10,056 95 1,84,721 10,056 95
14. Varanasi 2,98,671 11,742 96 2,92,628 11,742 96 2,66,675 11,742 96
Total 2088,222 1,11,098 95 26,60,771 1,25,801 95 23,25,247 1,31,941 94 (Source: DPO of test-checked districts)
Appendix 6.4
Components under KSY scheme (Reference: Paragraph no. 6.1.4; page 59)
Sl. No.
Name of the component Sl. No.
Name of the component
1 Stitching 9 Wooden work
2 Beautician 10 Computer training
3 Pickle making 11 Fashion designing
4 Painting 12 Soft toys making
5 Food Processing 13 Cookery and Bakery
6 Embroidery 14 Candle making
7 Chicken work 15 Mobile repairing
8 Knitting 16 Recipe from SNP
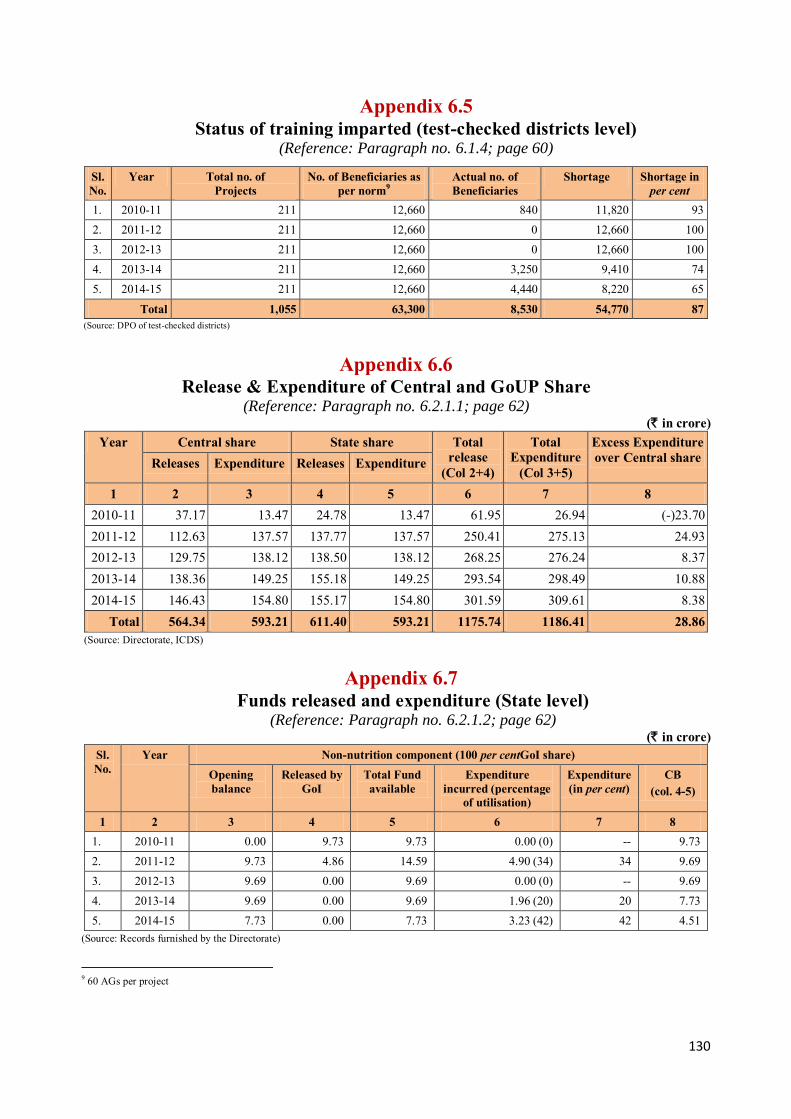
130
Appendix 6.5 Status of training imparted (test-checked districts level)
(Reference: Paragraph no. 6.1.4; page 60)
Sl. No.
Year Total no. of Projects
No. of Beneficiaries as per norm9
Actual no. of Beneficiaries
Shortage Shortage in per cent
1. 2010-11 211 12,660 840 11,820 93 2. 2011-12 211 12,660 0 12,660 100 3. 2012-13 211 12,660 0 12,660 100 4. 2013-14 211 12,660 3,250 9,410 74 5. 2014-15 211 12,660 4,440 8,220 65
Total 1,055 63,300 8,530 54,770 87 (Source: DPO of test-checked districts)
Appendix 6.6 Release & Expenditure of Central and GoUP Share
(Reference: Paragraph no. 6.2.1.1; page 62) (` in crore)
Year Central share State share Total release
(Col 2+4)
Total Expenditure
(Col 3+5)
Excess Expenditure over Central share Releases Expenditure Releases Expenditure
1 2 3 4 5 6 7 8 2010-11 37.17 13.47 24.78 13.47 61.95 26.94 (-)23.70 2011-12 112.63 137.57 137.77 137.57 250.41 275.13 24.93 2012-13 129.75 138.12 138.50 138.12 268.25 276.24 8.37 2013-14 138.36 149.25 155.18 149.25 293.54 298.49 10.88 2014-15 146.43 154.80 155.17 154.80 301.59 309.61 8.38
Total 564.34 593.21 611.40 593.21 1175.74 1186.41 28.86 (Source: Directorate, ICDS)
Appendix 6.7 Funds released and expenditure (State level)
(Reference: Paragraph no. 6.2.1.2; page 62) (` in crore)
Sl. No.
Year Non-nutrition component (100 per centGoI share) Opening balance
Released by GoI
Total Fund available
Expenditure incurred (percentage
of utilisation)
Expenditure (in per cent)
CB (col. 4-5)
1 2 3 4 5 6 7 8 1. 2010-11 0.00 9.73 9.73 0.00 (0) -- 9.73 2. 2011-12 9.73 4.86 14.59 4.90 (34) 34 9.69 3. 2012-13 9.69 0.00 9.69 0.00 (0) -- 9.69 4. 2013-14 9.69 0.00 9.69 1.96 (20) 20 7.73 5. 2014-15 7.73 0.00 7.73 3.23 (42) 42 4.51
(Source: Records furnished by the Directorate)
9 60 AGs per project
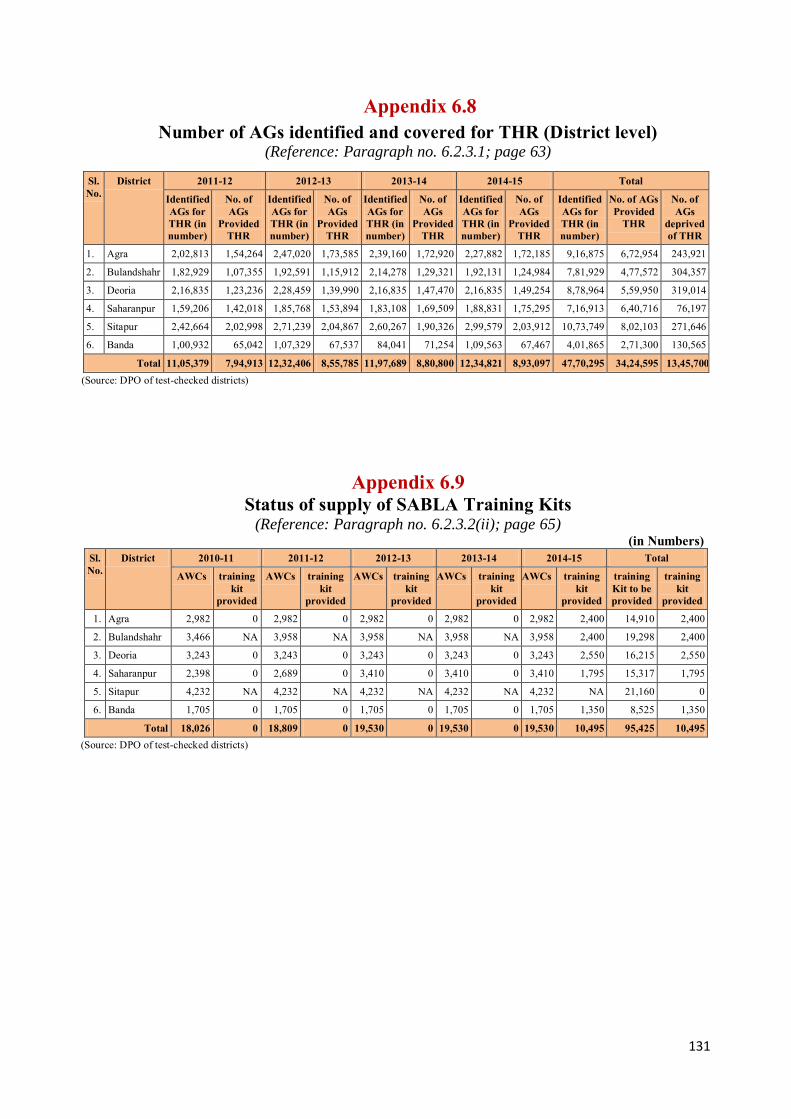
131
Appendix 6.8 Number of AGs identified and covered for THR (District level)
(Reference: Paragraph no. 6.2.3.1; page 63)
Sl. No.
District 2011-12 2012-13 2013-14 2014-15 Total
Identified AGs for THR (in number)
No. of AGs
Provided THR
Identified AGs for THR (in number)
No. of AGs
Provided THR
Identified AGs for THR (in number)
No. of AGs
Provided THR
Identified AGs for THR (in number)
No. of AGs
Provided THR
Identified AGs for THR (in number)
No. of AGs Provided
THR
No. of AGs
deprived of THR
1. Agra 2,02,813 1,54,264 2,47,020 1,73,585 2,39,160 1,72,920 2,27,882 1,72,185 9,16,875 6,72,954 243,921
2. Bulandshahr 1,82,929 1,07,355 1,92,591 1,15,912 2,14,278 1,29,321 1,92,131 1,24,984 7,81,929 4,77,572 304,357
3. Deoria 2,16,835 1,23,236 2,28,459 1,39,990 2,16,835 1,47,470 2,16,835 1,49,254 8,78,964 5,59,950 319,014
4. Saharanpur 1,59,206 1,42,018 1,85,768 1,53,894 1,83,108 1,69,509 1,88,831 1,75,295 7,16,913 6,40,716 76,197
5. Sitapur 2,42,664 2,02,998 2,71,239 2,04,867 2,60,267 1,90,326 2,99,579 2,03,912 10,73,749 8,02,103 271,646
6. B Banda 1,00,932 65,042 1,07,329 67,537 84,041 71,254 1,09,563 67,467 4,01,865 2,71,300 130,565
Total 11,05,379 7,94,913 12,32,406 8,55,785 11,97,689 8,80,800 12,34,821 8,93,097 47,70,295 34,24,595 13,45,700 (Source: DPO of test-checked districts)
Appendix 6.9 Status of supply of SABLA Training Kits
(Reference: Paragraph no. 6.2.3.2(ii); page 65) (in Numbers)
Sl. No.
District 2010-11 2011-12 2012-13 2013-14 2014-15 Total
AWCs training kit
provided
AWCs training kit
provided
AWCs training kit
provided
AWCs training kit
provided
AWCs training kit
provided
training Kit to be provided
training kit
provided
1. Agra 2,982 0 2,982 0 2,982 0 2,982 0 2,982 2,400 14,910 2,400
2. Bulandshahr 3,466 NA 3,958 NA 3,958 NA 3,958 NA 3,958 2,400 19,298 2,400
3. Deoria 3,243 0 3,243 0 3,243 0 3,243 0 3,243 2,550 16,215 2,550
4. Saharanpur 2,398 0 2,689 0 3,410 0 3,410 0 3,410 1,795 15,317 1,795
5. Sitapur 4,232 NA 4,232 NA 4,232 NA 4,232 NA 4,232 NA 21,160 0
6. Banda 1,705 0 1,705 0 1,705 0 1,705 0 1,705 1,350 8,525 1,350
Total 18,026 0 18,809 0 19,530 0 19,530 0 19,530 10,495 95,425 10,495 (Source: DPO of test-checked districts)
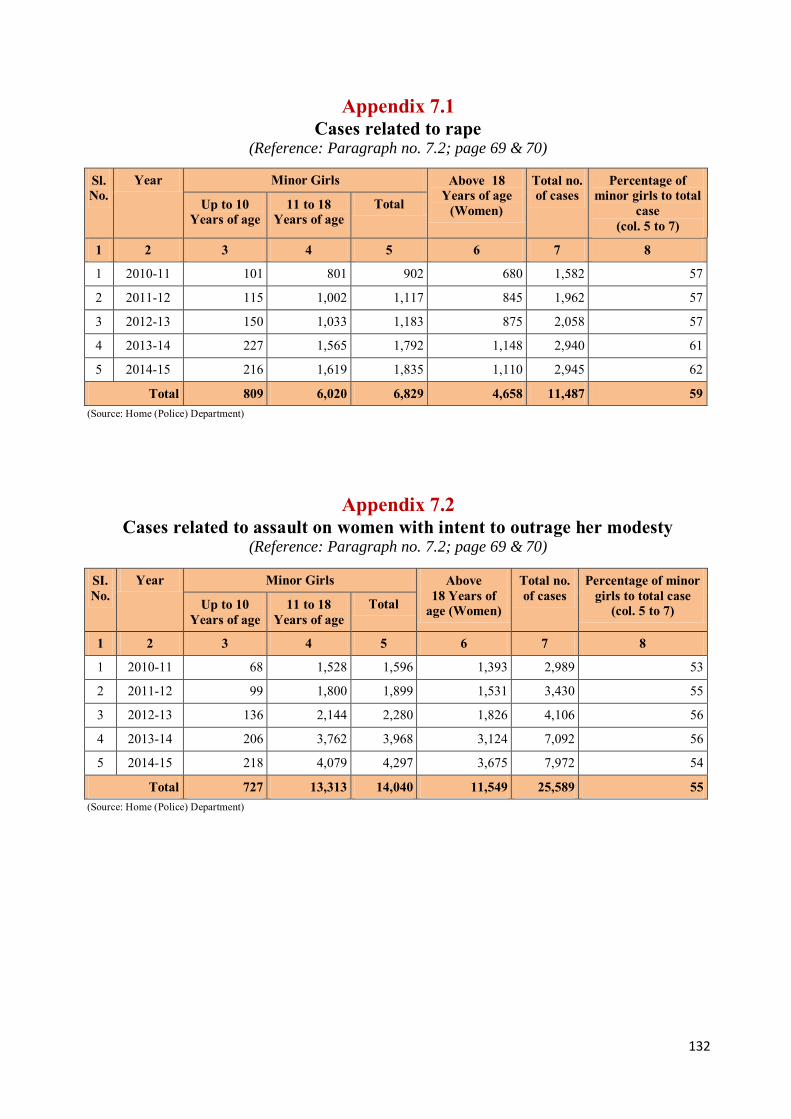
132
Appendix 7.1 Cases related to rape
(Reference: Paragraph no. 7.2; page 69 & 70)
Sl. No.
Year Minor Girls Above 18 Years of age
(Women)
Total no. of cases
Percentage of minor girls to total
case (col. 5 to 7)
Up to 10 Years of age
11 to 18 Years of age
Total
1 2 3 4 5 6 7 8
1 2010-11 101 801 902 680 1,582 57
2 2011-12 115 1,002 1,117 845 1,962 57
3 2012-13 150 1,033 1,183 875 2,058 57
4 2013-14 227 1,565 1,792 1,148 2,940 61
5 2014-15 216 1,619 1,835 1,110 2,945 62
Total 809 6,020 6,829 4,658 11,487 59 (Source: Home (Police) Department)
Appendix 7.2 Cases related to assault on women with intent to outrage her modesty
(Reference: Paragraph no. 7.2; page 69 & 70)
SI. No.
Year Minor Girls Above 18 Years of
age (Women)
Total no. of cases
Percentage of minor girls to total case
(col. 5 to 7) Up to 10 Years of age
11 to 18 Years of age
Total
1 2 3 4 5 6 7 8
1 2010-11 68 1,528 1,596 1,393 2,989 53
2 2011-12 99 1,800 1,899 1,531 3,430 55
3 2012-13 136 2,144 2,280 1,826 4,106 56
4 2013-14 206 3,762 3,968 3,124 7,092 56
5 2014-15 218 4,079 4,297 3,675 7,972 54
Total 727 13,313 14,040 11,549 25,589 55 (Source: Home (Police) Department)

133
Appendix 7.3 Cases related to kidnapping/abduction (Reference: Paragraph no. 7.2; page 69 & 70)
SI. No.
Year Minor Girls Above 18 Years of age
(Women)
Total no. of cases
Percentage of minor girls to total
case (col. 5 to 7) Up to 10 Years of age
11 to 18 Years of age
Total
1 2 3 4 5 6 7 8
1 2010-11 171 3,586 3,757 1,388 5,145 73
2 2011-12 101 4,624 4,725 1,953 6,678 71
3 2012-13 112 4,827 4,939 2,118 7,057 70
4 2013-14 181 5,771 5,952 2,558 8,510 70
5 2014-15 151 6,356 6,507 2,457 8,964 73
Total 716 25,164 25,880 10,474 36,354 71 (Source: Home (Police) Department)
Appendix 7.4 Cases related to missing girls/women
(Reference: Paragraph no. 7.3; page 71)
SI. No.
Year Minor Girls Above 18 Years of age
(Women)
Total no. of cases
Percentage of minor girls to total
case (col. 5 to 7) Up to 10
Years of age 11 to 18
Years of age Total
1 2 3 4 5 6 7 8
1 2010-11 124 978 1,102 1,183 2,285 48
2 2011-12 154 1,277 1,431 1,569 3,000 48
3 2012-13 149 1,379 1,528 1,615 3,143 49
4 2013-14 143 1,307 1,450 1,929 3,379 43
5 2014-15 146 975 1,121 1,650 2,771 40
Total 716 5,916 6,632 7,946 14,578 45
Increase per cent 18 39 21 (Source: Home (Police) Department)
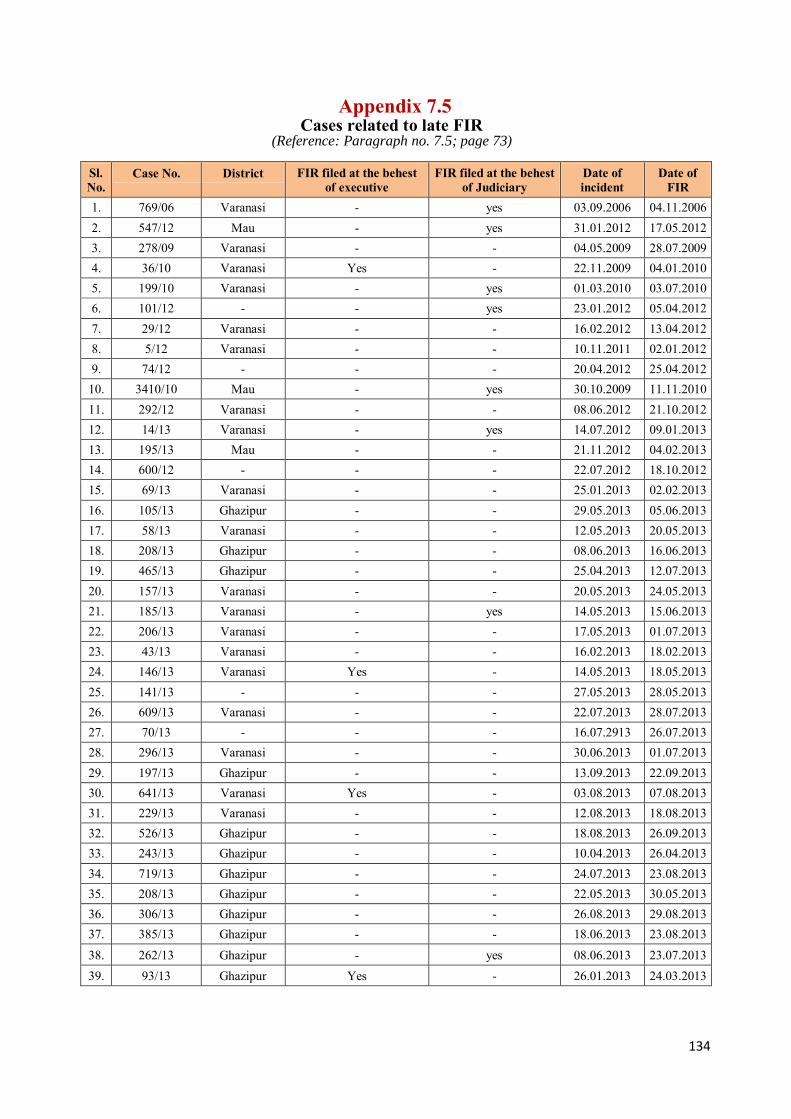
134
Appendix 7.5 Cases related to late FIR
(Reference: Paragraph no. 7.5; page 73)
Sl. No.
Case No. District FIR filed at the behest of executive
FIR filed at the behest of Judiciary
Date of incident
Date of FIR
1. 769/06 Varanasi - yes 03.09.2006 04.11.2006 2. 547/12 Mau - yes 31.01.2012 17.05.2012 3. 278/09 Varanasi - - 04.05.2009 28.07.2009 4. 36/10 Varanasi Yes - 22.11.2009 04.01.2010 5. 199/10 Varanasi - yes 01.03.2010 03.07.2010 6. 101/12 - - yes 23.01.2012 05.04.2012 7. 29/12 Varanasi - - 16.02.2012 13.04.2012 8. 5/12 Varanasi - - 10.11.2011 02.01.2012 9. 74/12 - - - 20.04.2012 25.04.2012
10. 3410/10 Mau - yes 30.10.2009 11.11.2010 11. 292/12 Varanasi - - 08.06.2012 21.10.2012 12. 14/13 Varanasi - yes 14.07.2012 09.01.2013 13. 195/13 Mau - - 21.11.2012 04.02.2013 14. 600/12 - - - 22.07.2012 18.10.2012 15. 69/13 Varanasi - - 25.01.2013 02.02.2013 16. 105/13 Ghazipur - - 29.05.2013 05.06.2013 17. 58/13 Varanasi - - 12.05.2013 20.05.2013 18. 208/13 Ghazipur - - 08.06.2013 16.06.2013 19. 465/13 Ghazipur - - 25.04.2013 12.07.2013 20. 157/13 Varanasi - - 20.05.2013 24.05.2013 21. 185/13 Varanasi - yes 14.05.2013 15.06.2013 22. 206/13 Varanasi - - 17.05.2013 01.07.2013 23. 43/13 Varanasi - - 16.02.2013 18.02.2013 24. 146/13 Varanasi Yes - 14.05.2013 18.05.2013 25. 141/13 - - - 27.05.2013 28.05.2013 26. 609/13 Varanasi - - 22.07.2013 28.07.2013 27. 70/13 - - - 16.07.2913 26.07.2013 28. 296/13 Varanasi - - 30.06.2013 01.07.2013 29. 197/13 Ghazipur - - 13.09.2013 22.09.2013 30. 641/13 Varanasi Yes - 03.08.2013 07.08.2013 31. 229/13 Varanasi - - 12.08.2013 18.08.2013 32. 526/13 Ghazipur - - 18.08.2013 26.09.2013 33. 243/13 Ghazipur - - 10.04.2013 26.04.2013 34. 719/13 Ghazipur - - 24.07.2013 23.08.2013 35. 208/13 Ghazipur - - 22.05.2013 30.05.2013 36. 306/13 Ghazipur - - 26.08.2013 29.08.2013 37. 385/13 Ghazipur - - 18.06.2013 23.08.2013
38. 262/13 Ghazipur - yes 08.06.2013 23.07.2013 39. 93/13 Ghazipur Yes - 26.01.2013 24.03.2013

135
40. 251/13 Mau - - 08.08.2013 15.08.2013
41. 87/13 Ghazipur - yes 17.02.2013 23.03.2013 42. 334/13 Varanasi - - 15.10.2013 17.10.2013 43. 272/13 Varanasi Yes - 14.08.2013 22.08.2013 44. 279/13 Varanasi - - 20.09.2013 22.09.2013 45. 248/13 Ghazipur - - 31.10.2013 21.11.2013 46. 916/13 Mau - - 21.10.2013 23.10.2013 47. 371/13 Mau - - 17.06.2013 18.09.2013 48. 365/13 Varanasi - - 18.10.2013 11.11.2013 49. 399/13 Varanasi - - 15.11.2013 26.11.2013 50. 562/13 Ghazipur - - 08.11.2013 21.11.2013 51. 659/13 Ghazipur - - 25.11.2013 01.12.2013 52. 2419/13 Ghazipur - - 16.11.2013 29.11.2013 53. 224/13 Mau - - 28.05.2013 11.09.2013 54. 843/11 Mau - yes 02.07.2011 28.11.2011 55. 263/13 Ghazipur - - 31.07.2013 04.09.2013 56. 180/12 Mau - yes 28.03.2012 23.05.2012 57. 28/14 Ghazipur - - 10.01.2014 15.01.2014 58. 8/14 Ghazipur - - 22.12.2013 03.01.2014 59. 4/14 Varanasi - - 06.01.2014 07.01.2014 60. 151/13 Varanasi - - 13.12.2013 15.12.2013 61. 27/07 Mau - - 07.01.2007 08.01.2007 62. 283/13 Varanasi Yes - 18.03.2011 24.06.2013
Total 06 11 (Source: Guria, NGO)
Appendix 7.6
Summary Statement of Grant under all components of the Ujjawala scheme for a year
(Reference: Paragraph no. 7.9; page 77)
Sl. No.
Name of the Component
Component-wise total budget (in `) for a year Grade-A Cities Grade-B Cities
Recurring Non-recurring Total Recurring Non-recurring Total 1 Prevention 1,66,500 0 1,66,500 1,66,500 0 1,66,500 2 Rescue 23,500 0 23,500 23,500 0 23,500 3 Rehabilitation 17,36,500 1,50,000 18,86,500 16,76,500 1,50,000 18,26,500 4 Re-integration 1,14,500 10,000 1,24,500 1,14,500 10,000 1,24,500
5 Repatriation-cross border
35,000 0 35,000 35,000 0 35,000
Total 20,76,000 1,60,000 22,36,000 20,16,000 1,60,000 21,76,000 Grand Total 22,36,000 21,76,000
(Source: Guidelines of Ujjawala scheme)
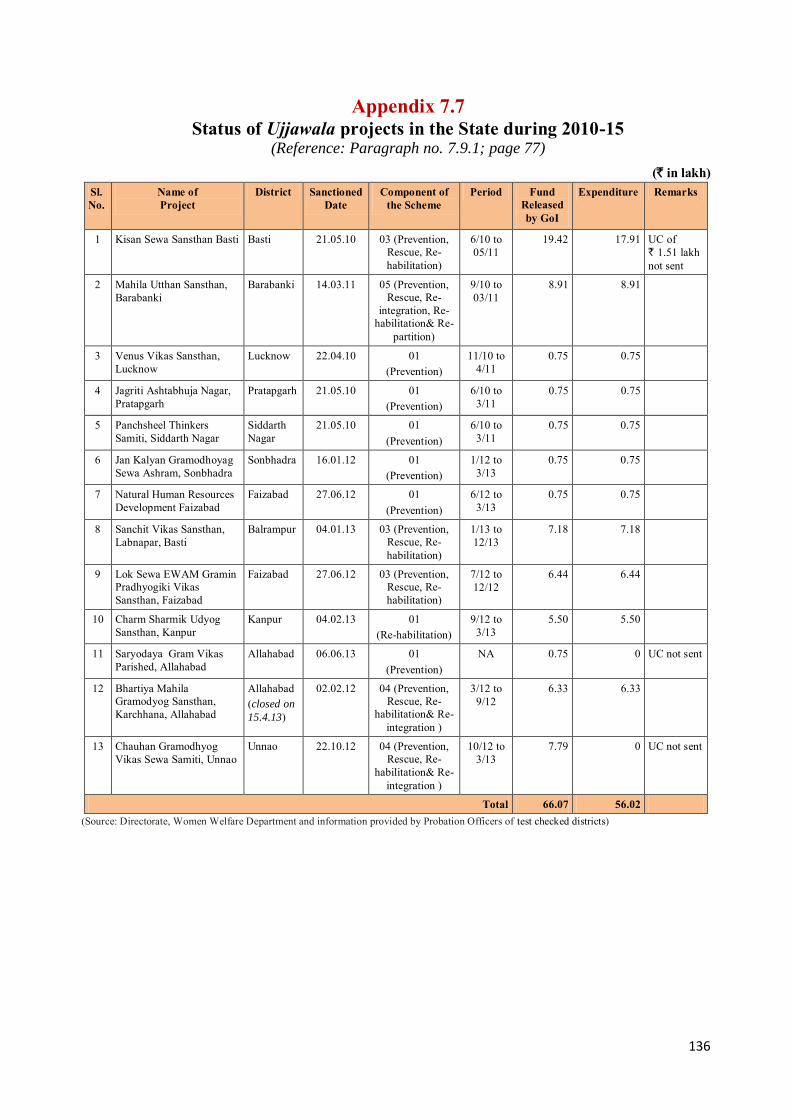
136
Appendix 7.7 Status of Ujjawala projects in the State during 2010-15
(Reference: Paragraph no. 7.9.1; page 77)
(` in lakh) Sl. No.
Name of Project
District Sanctioned Date
Component of the Scheme
Period Fund Released by GoI
Expenditure Remarks
1 Kisan Sewa Sansthan Basti Basti 21.05.10 03 (Prevention, Rescue, Re-habilitation)
6/10 to 05/11
19.42 17.91 UC of ` 1.51 lakh not sent
2 Mahila Utthan Sansthan, Barabanki
Barabanki 14.03.11 05 (Prevention, Rescue, Re-
integration, Re-habilitation& Re-
partition)
9/10 to 03/11
8.91 8.91
3 Venus Vikas Sansthan, Lucknow
Lucknow 22.04.10 01 (Prevention)
11/10 to 4/11
0.75 0.75
4 Jagriti Ashtabhuja Nagar, Pratapgarh
Pratapgarh 21.05.10 01 (Prevention)
6/10 to 3/11
0.75 0.75
5 Panchsheel Thinkers Samiti, Siddarth Nagar
Siddarth Nagar
21.05.10 01 (Prevention)
6/10 to 3/11
0.75 0.75
6 Jan Kalyan Gramodhoyag Sewa Ashram, Sonbhadra
Sonbhadra
16.01.12 01 (Prevention)
1/12 to 3/13
0.75 0.75
7 Natural Human Resources Development Faizabad
Faizabad 27.06.12 01 (Prevention)
6/12 to 3/13
0.75 0.75
8 Sanchit Vikas Sansthan, Labnapar, Basti
Balrampur 04.01.13 03 (Prevention, Rescue, Re-habilitation)
1/13 to 12/13
7.18 7.18
9 Lok Sewa EWAM Gramin Pradhyogiki Vikas Sansthan, Faizabad
Faizabad
27.06.12 03 (Prevention, Rescue, Re-habilitation)
7/12 to 12/12
6.44 6.44
10 Charm Sharmik Udyog Sansthan, Kanpur
Kanpur 04.02.13 01 (Re-habilitation)
9/12 to 3/13
5.50 5.50
11 Saryodaya Gram Vikas Parished, Allahabad
Allahabad 06.06.13 01 (Prevention)
NA 0.75 0 UC not sent
12 Bhartiya Mahila Gramodyog Sansthan, Karchhana, Allahabad
Allahabad (closed on
15.4.13)
02.02.12 04 (Prevention, Rescue, Re-
habilitation& Re-integration )
3/12 to 9/12
6.33 6.33
13 Chauhan Gramodhyog Vikas Sewa Samiti, Unnao
Unnao 22.10.12 04 (Prevention, Rescue, Re-
habilitation& Re-integration )
10/12 to 3/13
7.79 0 UC not sent
Total 66.07 56.02 (Source: Directorate, Women Welfare Department and information provided by Probation Officers of test checked districts)
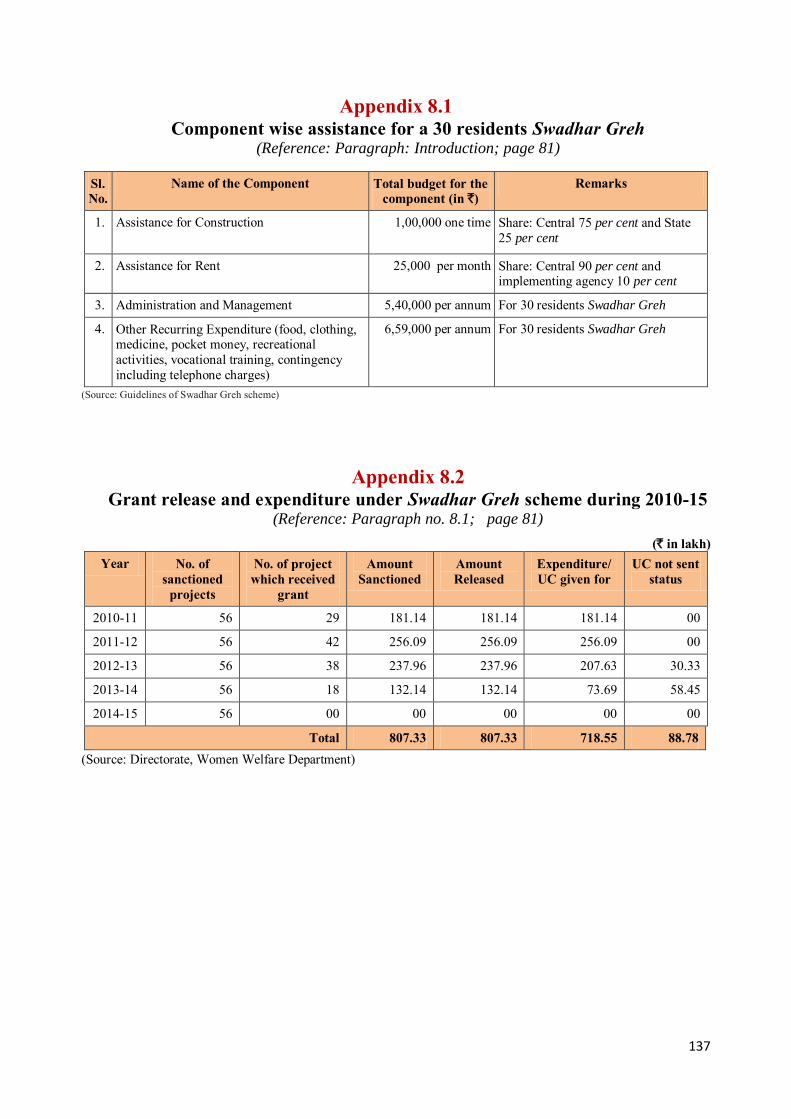
137
Appendix 8.1 Component wise assistance for a 30 residents Swadhar Greh
(Reference: Paragraph: Introduction; page 81)
Sl. No.
Name of the Component Total budget for the component (in `)
Remarks
1. Assistance for Construction
1,00,000 one time Share: Central 75 per cent and State 25 per cent
2. Assistance for Rent 25,000 per month Share: Central 90 per cent and implementing agency 10 per cent
3. Administration and Management 5,40,000 per annum For 30 residents Swadhar Greh
4. Other Recurring Expenditure (food, clothing, medicine, pocket money, recreational activities, vocational training, contingency including telephone charges)
6,59,000 per annum For 30 residents Swadhar Greh
(Source: Guidelines of Swadhar Greh scheme)
Appendix 8.2 Grant release and expenditure under Swadhar Greh scheme during 2010-15
(Reference: Paragraph no. 8.1; page 81)
(` in lakh) Year No. of
sanctioned projects
No. of project which received
grant
Amount Sanctioned
Amount Released
Expenditure/ UC given for
UC not sent status
2010-11 56 29 181.14 181.14 181.14 00
2011-12 56 42 256.09 256.09 256.09 00
2012-13 56 38 237.96 237.96 207.63 30.33
2013-14 56 18 132.14 132.14 73.69 58.45
2014-15 56 00 00 00 00 00
Total 807.33 807.33 718.55 88.78 (Source: Directorate, Women Welfare Department)
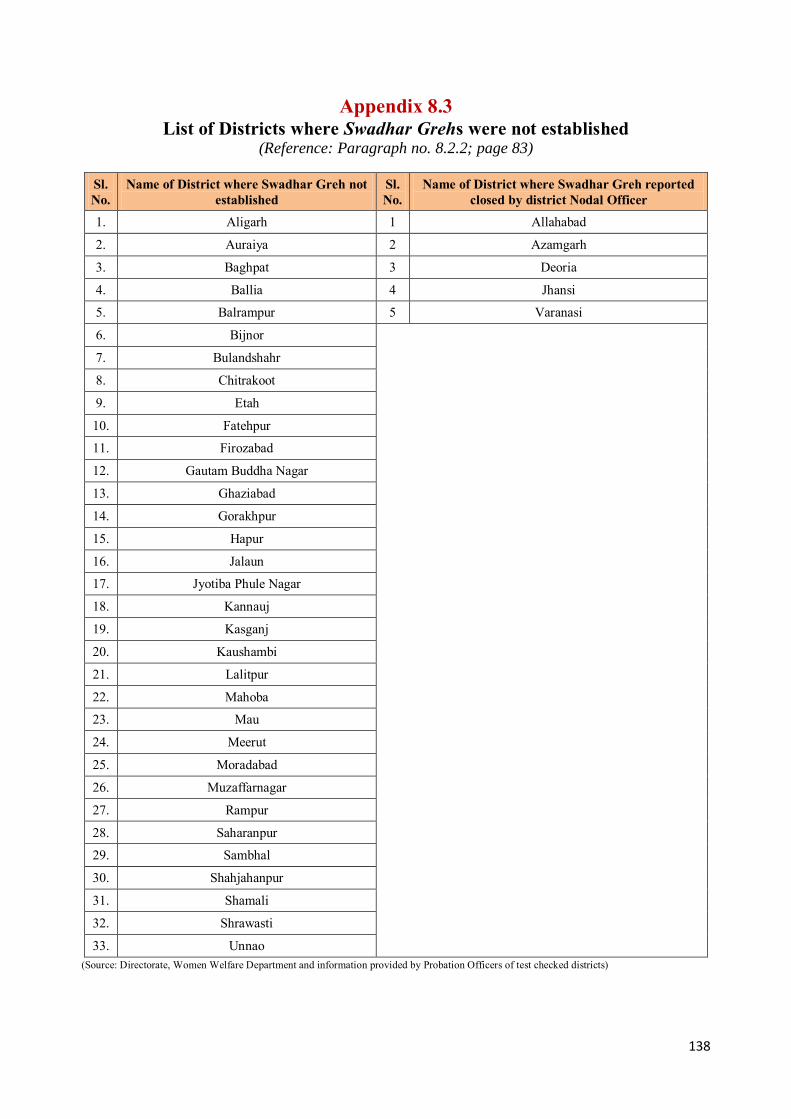
138
Appendix 8.3 List of Districts where Swadhar Grehs were not established
(Reference: Paragraph no. 8.2.2; page 83)
Sl. No.
Name of District where Swadhar Greh not established
Sl. No.
Name of District where Swadhar Greh reported closed by district Nodal Officer
1. Aligarh 1 Allahabad
2. Auraiya 2 Azamgarh
3. Baghpat 3 Deoria
4. Ballia 4 Jhansi
5. Balrampur 5 Varanasi
6. Bijnor
7. Bulandshahr
8. Chitrakoot
9. Etah
10. Fatehpur
11. Firozabad
12. Gautam Buddha Nagar
13. Ghaziabad
14. Gorakhpur
15. Hapur
16. Jalaun
17. Jyotiba Phule Nagar
18. Kannauj
19. Kasganj
20. Kaushambi
21. Lalitpur
22. Mahoba
23. Mau
24. Meerut
25. Moradabad
26. Muzaffarnagar
27. Rampur
28. Saharanpur
29. Sambhal
30. Shahjahanpur
31. Shamali
32. Shrawasti
33. Unnao (Source: Directorate, Women Welfare Department and information provided by Probation Officers of test checked districts)
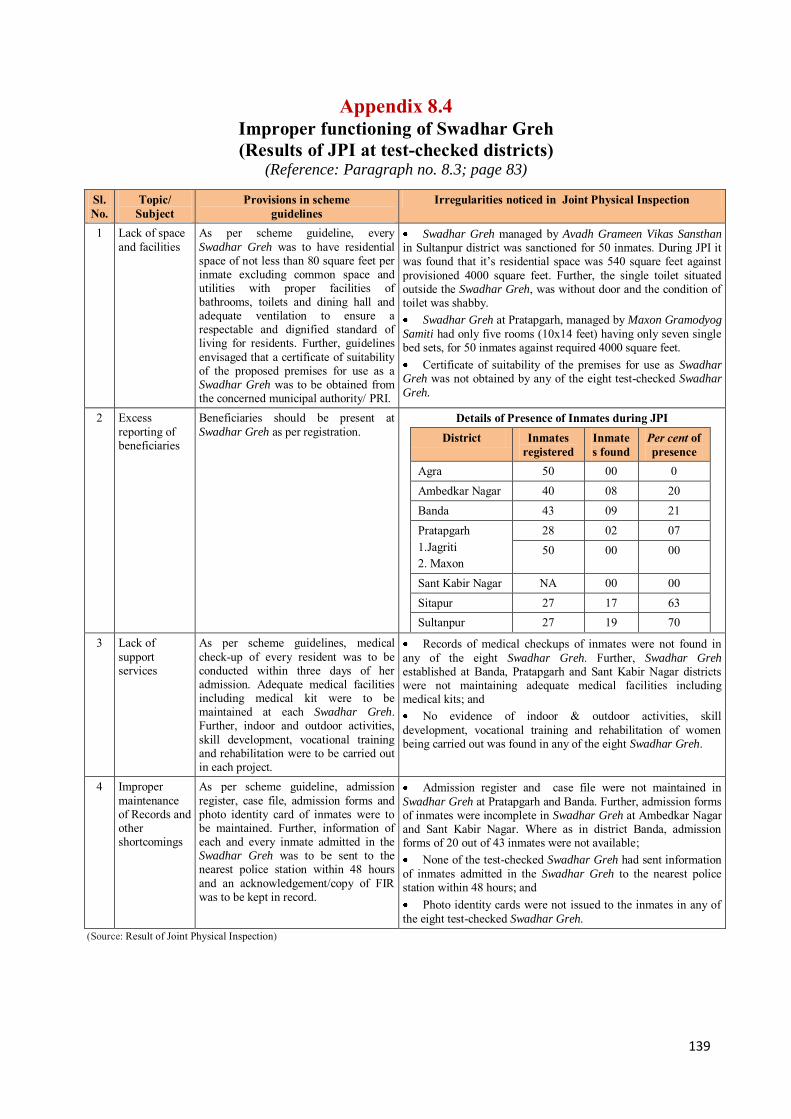
139
Appendix 8.4 Improper functioning of Swadhar Greh (Results of JPI at test-checked districts)
(Reference: Paragraph no. 8.3; page 83)
Sl. No.
Topic/ Subject
Provisions in scheme guidelines
Irregularities noticed in Joint Physical Inspection
1 Lack of space and facilities
As per scheme guideline, every Swadhar Greh was to have residential space of not less than 80 square feet per inmate excluding common space and utilities with proper facilities of bathrooms, toilets and dining hall and adequate ventilation to ensure a respectable and dignified standard of living for residents. Further, guidelines envisaged that a certificate of suitability of the proposed premises for use as a Swadhar Greh was to be obtained from the concerned municipal authority/ PRI.
Swadhar Greh managed by Avadh Grameen Vikas Sansthan in Sultanpur district was sanctioned for 50 inmates. During JPI it was found that it’s residential space was 540 square feet against provisioned 4000 square feet. Further, the single toilet situated outside the Swadhar Greh, was without door and the condition of toilet was shabby. Swadhar Greh at Pratapgarh, managed by Maxon Gramodyog
Samiti had only five rooms (10x14 feet) having only seven single bed sets, for 50 inmates against required 4000 square feet. Certificate of suitability of the premises for use as Swadhar
Greh was not obtained by any of the eight test-checked Swadhar
Greh.
2 Excess reporting of beneficiaries
Beneficiaries should be present at Swadhar Greh as per registration.
Details of Presence of Inmates during JPI District Inmates
registered Inmates found
Per cent of presence
Agra 50 00 0 Ambedkar Nagar 40 08 20 Banda 43 09 21 Pratapgarh 1.Jagriti 2. Maxon
28 02 07 50 00 00
Sant Kabir Nagar NA 00 00 Sitapur 27 17 63 Sultanpur 27 19 70
3 Lack of support services
As per scheme guidelines, medical check-up of every resident was to be conducted within three days of her admission. Adequate medical facilities including medical kit were to be maintained at each Swadhar Greh. Further, indoor and outdoor activities, skill development, vocational training and rehabilitation were to be carried out in each project.
Records of medical checkups of inmates were not found in any of the eight Swadhar Greh. Further, Swadhar Greh established at Banda, Pratapgarh and Sant Kabir Nagar districts were not maintaining adequate medical facilities including medical kits; and No evidence of indoor & outdoor activities, skill
development, vocational training and rehabilitation of women being carried out was found in any of the eight Swadhar Greh.
4 Improper maintenance of Records and other shortcomings
As per scheme guideline, admission register, case file, admission forms and photo identity card of inmates were to be maintained. Further, information of each and every inmate admitted in the Swadhar Greh was to be sent to the nearest police station within 48 hours and an acknowledgement/copy of FIR was to be kept in record.
Admission register and case file were not maintained in Swadhar Greh at Pratapgarh and Banda. Further, admission forms of inmates were incomplete in Swadhar Greh at Ambedkar Nagar and Sant Kabir Nagar. Where as in district Banda, admission forms of 20 out of 43 inmates were not available; None of the test-checked Swadhar Greh had sent information
of inmates admitted in the Swadhar Greh to the nearest police station within 48 hours; and Photo identity cards were not issued to the inmates in any of
the eight test-checked Swadhar Greh. (Source: Result of Joint Physical Inspection)
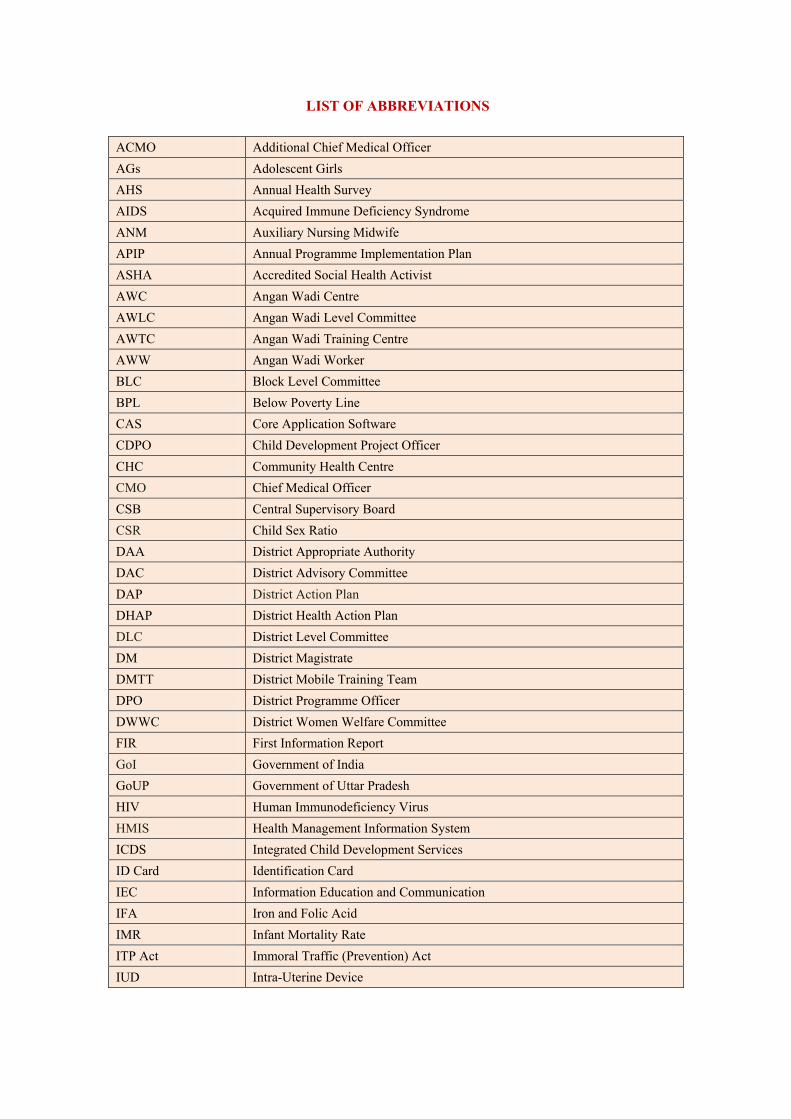
LIST OF ABBREVIATIONS
ACMO Additional Chief Medical Officer AGs Adolescent Girls AHS Annual Health Survey AIDS Acquired Immune Deficiency Syndrome ANM Auxiliary Nursing Midwife APIP Annual Programme Implementation Plan ASHA Accredited Social Health Activist AWC Angan Wadi Centre AWLC Angan Wadi Level Committee AWTC Angan Wadi Training Centre AWW Angan Wadi Worker BLC Block Level Committee BPL Below Poverty Line CAS Core Application Software CDPO Child Development Project Officer CHC Community Health Centre CMO Chief Medical Officer CSB Central Supervisory Board CSR Child Sex Ratio DAA District Appropriate Authority DAC District Advisory Committee DAP District Action Plan DHAP District Health Action Plan DLC District Level Committee DM District Magistrate DMTT District Mobile Training Team DPO District Programme Officer DWWC District Women Welfare Committee FIR First Information Report GoI Government of India GoUP Government of Uttar Pradesh HIV Human Immunodeficiency Virus HMIS Health Management Information System ICDS Integrated Child Development Services ID Card Identification Card IEC Information Education and Communication IFA Iron and Folic Acid IMR Infant Mortality Rate ITP Act Immoral Traffic (Prevention) Act IUD Intra-Uterine Device
List of Abbreviations
JSY Janani Suraksha Yojna JPI Joint Physical Inspection KSY Kishori Shakti Yojana
MDGs Millennium Development Goals MDR Maternal Death Review MIS Management Information System MLTC Middle Level Training Centre MMR Maternal Mortality Rate MHA Ministry of Home Affairs MPR Monthly Progress Report LS Lady Supervisor MTP Medical Termination of Pregnancy MWCD Ministry of Women and Child Development NA Not Available NCRB National Crime Record Bureau NGO Non-Government Organisation NHE Nutrition and Health Education NHM National Health Mission NPAG Nutrition Programme for Adolescent Girls PAB Project Approval Board P&R Protective and rehabilitative PC-PNDT Pre-Conception and Pre-Natal Diagnostic Techniques (Prohibition of Sex
Selection) PHC Primary Health Centre PIP Programme Implementation Plan PLA Personal Ledger Account PMC Project Monitoring Committee PRI Panchayati Raj Institution PSE Pre-School Education RGSEAG (SABLA) Rajiv Gandhi Scheme for Empowerment of Adolescent Girls SAA State Appropriate Authority SDM Sub-District Magistrate SAC State Advisory Committee SBA Skilled Birth Attendant SHGs Self Help Groups SIMC State Inspection and Monitoring Committee SLEC State Level Empowered Committee SNP Supplementary Nutrition Programme SSB State Supervisory Board SLSA State Legal Services Authority TFR Total Fertility Rate THR Take Home Ration

TT Tetanus Toxoid UCs Utilisation Certificates UID Unique Identification Number UNODC United Nations Office on Drugs and Crime USG Ultrasonography VHND Village Health and Nutrition Day VHSNC Village Health Sanitation and Nutrition Committee