Rhenium in ores of the Mikheevskoe Mo-Cu porphyry deposit, South Urals
15
ISSN 10757015, Geology of Ore Deposits, 2015, Vol. 57, No. 2, pp. 118–132. © Pleiades Publishing, Ltd., 2015. Original Russian Text © O.Yu. Plotinskaya, A.I. Grabezhev, R. Seltmann, 2015, published in Geologiya Rudnykh Mestorozhdenii, 2015, Vol. 57, No. 2, pp. 132–147. 118 INTRODUCTION At the present time, the main economic source of Re is porphyry copper deposits (Dill, 2010; Trach and Beskin, 2011), and molybdenite is the major carrier of this element. The reasons and factors affecting con centration and distribution of Re at porphyry molyb denum and copper deposits are discussed in many publications (Popov, 1977; Rekharskii et al., 1983; Fil imonova et al., 1984; Popov and Kudryavtsev. 1995; Sun et al., 2003, 2004; Berzina et al., 2005; Tessalina et al., 2008; Maksimyuk and Kulikova, 2013). To date, in Russia rhenium is a critical metal in very short sup ply (Trach and Beskin, 2011), and this determines the relevant study of its distribution at operating or devel oping porphyry deposits. Therefore, the Mikheevskoe porphyry copper deposit, being the only operated por phyry deposit in the Urals, is of obvious interest; it was explored and put into operation in the late 2013. According to www.mineral.ru, the reserves of this deposit are ca. 1.8 Mt Cu and 14 kt Mo. However, Trach and Beskin (2011) considered it to be prospect less for Re; according to these authors, the mean con tent of Re in molybdenite from the Mikheevskoe deposit is below 500 g/t with an average grade of Mo in ores ca. 0.004%. Nevertheless, recently, we registered an unusual high Re up to 0.6 wt % with extremely Corresponding author: O.Yu. Plotinskaya. Email: [email protected] irregular distribution in molybdenite grains, using an electron microprobe (EMP) (Grabezhev and Shaga lov, 2010; Grabezhev et al., 2010). Therefore, this study is focused on Re behavior at the deposit both in the ores and within individual grains of molybdenite. BRIEF CHARACTERISTICS OF GEOLOGY, ORES, AND WALLROCK ALTERATIONS The Mikheevskoe deposit, situated approximately 200 km south of Chelyabinsk (Fig. 1, insert), is located within the Novonikolaevka–Tarutino metallogenic zone, geotectonicaly localized at the boundary between the East Uralian volcanic terrane (Silurian to Devonian arcs) and Transuralian terrane (Carbonifer ous Andean type continental margin) (Puchkov, 2010). The Mikheevskoe deposit is a part of the Novonikolaevka ore field, which also comprises a few poorly documented porphyry occurrences (Shargor odskii et al., 2005). According to Grabezhev and Belgorodskii (1992) and Shargorodskii et al. (2005), the area of the Mikheevskoe deposit (Fig. 1) comprises Late Devo nian to Early Carboniferous and Early Carboniferous volcanosedimentary rocks. The lower bench com prises intercalated sandstone, tuffstone, basaltic andesite, and its tuff and tuffaceous breccia with sub ordinate siltstone, carbonaceous cherty rocks, and Rhenium in Ores of the Mikheevskoe Porphyry Cu–Mo Deposit, South Urals O. Yu. Plotinskaya a , A. I. Grabezhev b , and R. Seltmann c a Institute of Geology of Ore Deposits, Petrography, Mineralogy, and Geochemistry, Russian Academy of Sciences, Staromonetny per. 35, Moscow, 119017 Russia b Institute of Geology and Geochemistry, Ural Branch, Russian Academy of Sciences, Pochtovy per., 7, Yekaterinburg, 620151 Russia c Center for Russian and Central EurAsian Mineral Studies (CERCAMS), Department of Earth Sciences, Natural History Museum Cromwell Road, London SW7 5BD, UK Received July 09, 2014 Abstract—The distribution of Re in ores of the Mikheevskoe Mo–Cu deposit in the South Urals is studied. It is established that the grade of Re in the ores usually does not exceed 0.5 g/t. A positive correlation between concentrations of Re and Mo (correlation coefficient 0.94), and Re and Cu (correlation coefficient 0.52) is found. EMPA of individual flakes of molybdenite showed that a Re content higher than the detection limit has been measured in most flakes studied, as a rule as high as 0.4–0.5 wt %, but occasionally reaching 1.34 wt %. Rewithin flakes of molybdenite is irregularly distributed. Patchy, linear, and concentriczoned patterns of zones with elevated Re content (usually 0.5–1 wt % Re, sometimes higher) are found against the lower con tent (up to 0.2 wt % Re) that is regularly distributed within the flake. Later hydrothermal processes and mechanical deformation of flakes result in epigenetic Re redistribution in molybdenite that leads to homogenization of molyb denite composition and smoothing of primary pattern, or removal of Re from molybdenite. DOI: 10.1134/S1075701515020051
Transcript of Rhenium in ores of the Mikheevskoe Mo-Cu porphyry deposit, South Urals

ISSN 1075�7015, Geology of Ore Deposits, 2015, Vol. 57, No. 2, pp. 118–132. © Pleiades Publishing, Ltd., 2015.Original Russian Text © O.Yu. Plotinskaya, A.I. Grabezhev, R. Seltmann, 2015, published in Geologiya Rudnykh Mestorozhdenii, 2015, Vol. 57, No. 2, pp. 132–147.
118
INTRODUCTION
At the present time, the main economic source ofRe is porphyry copper deposits (Dill, 2010; Trach andBeskin, 2011), and molybdenite is the major carrier ofthis element. The reasons and factors affecting con�centration and distribution of Re at porphyry molyb�denum and copper deposits are discussed in manypublications (Popov, 1977; Rekharskii et al., 1983; Fil�imonova et al., 1984; Popov and Kudryavtsev. 1995;Sun et al., 2003, 2004; Berzina et al., 2005; Tessalinaet al., 2008; Maksimyuk and Kulikova, 2013). To date,in Russia rhenium is a critical metal in very short sup�ply (Trach and Beskin, 2011), and this determines therelevant study of its distribution at operating or devel�oping porphyry deposits. Therefore, the Mikheevskoeporphyry copper deposit, being the only operated por�phyry deposit in the Urals, is of obvious interest; it wasexplored and put into operation in the late 2013.According to www.mineral.ru, the reserves of thisdeposit are ca. 1.8 Mt Cu and 14 kt Mo. However,Trach and Beskin (2011) considered it to be prospect�less for Re; according to these authors, the mean con�tent of Re in molybdenite from the Mikheevskoedeposit is below 500 g/t with an average grade of Mo inores ca. 0.004%. Nevertheless, recently, we registeredan unusual high Re up to 0.6 wt % with extremely
Corresponding author: O.Yu. Plotinskaya. E�mail: [email protected]
irregular distribution in molybdenite grains, using anelectron microprobe (EMP) (Grabezhev and Shaga�lov, 2010; Grabezhev et al., 2010). Therefore, thisstudy is focused on Re behavior at the deposit both inthe ores and within individual grains of molybdenite.
BRIEF CHARACTERISTICS OF GEOLOGY, ORES, AND WALL�ROCK ALTERATIONS
The Mikheevskoe deposit, situated approximately200 km south of Chelyabinsk (Fig. 1, insert), is locatedwithin the Novonikolaevka–Tarutino metallogeniczone, geotectonicaly localized at the boundarybetween the East Uralian volcanic terrane (Silurian toDevonian arcs) and Transuralian terrane (Carbonifer�ous Andean type continental margin) (Puchkov,2010). The Mikheevskoe deposit is a part of theNovonikolaevka ore field, which also comprises a fewpoorly documented porphyry occurrences (Shargor�odskii et al., 2005).
According to Grabezhev and Belgorodskii (1992)and Shargorodskii et al. (2005), the area of theMikheevskoe deposit (Fig. 1) comprises Late Devo�nian to Early Carboniferous and Early Carboniferousvolcano�sedimentary rocks. The lower bench com�prises intercalated sandstone, tuffstone, basalticandesite, and its tuff and tuffaceous breccia with sub�ordinate siltstone, carbonaceous cherty rocks, and
Rhenium in Ores of the Mikheevskoe Porphyry Cu–Mo Deposit, South Urals
O. Yu. Plotinskayaa, A. I. Grabezhevb, and R. Seltmannc
a Institute of Geology of Ore Deposits, Petrography, Mineralogy, and Geochemistry, Russian Academy of Sciences, Staromonetny per. 35, Moscow, 119017 Russia
b Institute of Geology and Geochemistry, Ural Branch, Russian Academy of Sciences,Pochtovy per., 7, Yekaterinburg, 620151 Russia
c Center for Russian and Central EurAsian Mineral Studies (CERCAMS), Department of Earth Sciences, Natural History Museum Cromwell Road, London SW7 5BD, UK
Received July 09, 2014
Abstract—The distribution of Re in ores of the Mikheevskoe Mo–Cu deposit in the South Urals is studied.It is established that the grade of Re in the ores usually does not exceed 0.5 g/t. A positive correlation betweenconcentrations of Re and Mo (correlation coefficient 0.94), and Re and Cu (correlation coefficient 0.52) isfound. EMPA of individual flakes of molybdenite showed that a Re content higher than the detection limit hasbeen measured in most flakes studied, as a rule as high as 0.4–0.5 wt %, but occasionally reaching 1.34 wt %.Re within flakes of molybdenite is irregularly distributed. Patchy, linear, and concentric�zoned patterns ofzones with elevated Re content (usually 0.5–1 wt % Re, sometimes higher) are found against the lower con�tent (up to 0.2 wt % Re) that is regularly distributed within the flake. Later hydrothermal processes and mechanicaldeformation of flakes result in epigenetic Re redistribution in molybdenite that leads to homogenization of molyb�denite composition and smoothing of primary pattern, or removal of Re from molybdenite.
DOI: 10.1134/S1075701515020051

GEOLOGY OF ORE DEPOSITS Vol. 57 No. 2 2015
RHENIUM IN ORES OF THE MIKHEEVSKOE PORPHYRY Cu–Mo DEPOSIT 119
m250
200
150
100
50
0
3007 M50 3006 M43 M113058
50 m
1 2
3 4
5 6
7 8
9 10
11 12
13 14а b
91M168
2200220180
60° E
0.5 km
55° N
Yekaterinburg
Chelyabinsk
Magnitogorsk
50 km
3006
99
102
103104
2258 3033
M11M50
3007 3006 3058
M43 10405
Fig. 1. Simplified geological map and section along profile 103, after Shargorodskii et al. (2005). (1) Weathering profile (on thesection); (2–4) Upper Devonian to Lower Carboniferous volcano�sedimentary sequence: (2) coarse volcaniclastic rocks (tuff,tuffite), (3) basaltic andesite, (4) sandstone, tuffstone, and silicate; (5–6) Lower Carboniferous volcanic sequence: (5) aphyricbasalt, clastic lava, (6) cherty and carbonaceous–cherty rocks, sandstone; (7–9) Mikheevskoe igneous complex: (7) quartz dior�ite, (8) porphyritic diorite, (9) porphyry plagiogranodiorite; (10) Ulyanovsk igneous complex, porphyritic diorite and dacite; (11)serpentinite; (12) faults; (13) outline of mineralization with Cu grade of 0.3%; (14) proving holes and sampling intervals studiedhere ((a) on the map, (b) on the section).
basalt. The upper volcanic bench is composed of lavaand clastic lava of aphyric basalt intercalated withsandstone, silicite, and carbonaceous–cherty rockswith serpentinite bodies.
Intrusive rocks belong to the Ulyanovsk andMikheevskoe igneous complexes (Grabezhev and Bel�gorodskii, 1992; Grabezhev, 2014). The Late Devo�nian to Early Carboniferous intrusions of the Uly�

120
GEOLOGY OF ORE DEPOSITS Vol. 57 No. 2 2015
PLOTINSKAYA et al.
anovsk Complex are stocks and dikes of porphyriticdiorite and andesite, and less frequent dacite, rhyo�dacite, and dolerite. Porphyry copper–molybdenummineralization is related to the rocks of the Carbonif�erous Mikheevskoe Complex (Grabezhev and Belgor�odskii, 1992). These rocks are a few equigranular andporphyry varieties, among which diorite, porphyriticdiorite, plagiogranodiorite porphyry, and post�oreadamellite porphyry are the most abundant (Gra�bezhev and Belgorodskii, 1992). At depth, dikes andstocks may combine into the parental pluton (Gra�bezhev and Belgorodskii, 1992).
Pyrite and chalcopyrite are the major hypogenicore minerals; bornite, molybdenite, magnetite, andrutile are less abundant; cobaltite–gersdorffite, arse�nopyrite, sphalerite, galena, and native gold are rare.Molybdenite is found within quartz veinlets, where itis intergrown with chalcopyrite, bornite, chlorite,muscovite, or epidote, or occurs as filamentary stringswithout visible gangue minerals.
Ore mineralization is spatially related to the dikebelt of quartz diorite and its porphyries of 0.5 × 3 kmin area that is near�meridional extending between twolarge (ca. 1 km in diameter) diorite stocks of theMikheevskoe Complex. This structure makes itimpossible to obtain a clear scheme of metasomaticand ore zoning. Therefore, we provide only a briefcharacterization of the major types of metasomaticrocks and related ore mineralization. The sodic–calcicalteration found in the central zone of the deposit iscomposed of an actinolite ± epidote assemblage. Itaccompanies a magnetite mineralization overprintedby later pyrite, chalcopyrite, and molybdenite. Potas�
sic alteration is abundant in the central part particu�larly in the northern segment of the deposit. Alteredrocks composed of biotite + muscovite ± potassiumfeldspar accompany bornite–chalcopyrite mineral�ization. Phyllic alteration (quartz–sericite alteredrocks) is found everywhere and accompanies molyb�denite–chalcopyrite mineralization. Propylites (chlo�rite + epidote + sericite) are abundant at the marginsof the deposit. The most abundant chlorite–sericitemetasomatic rocks are transitional zones betweenphyllic and propylitic zones. The deposit is referred tothe diorite model of Hollister (1975).
ANALYTICAL TECHNIQUES
The content of Re in the ores was determined byspectrophotometry at the laboratory of the Ural Geo�logical Bureau and at the Institute of Mineralogy andGeochemistry of Rare Elements, Moscow, analystE.V. Poplavko. The samples selected from drill core(range of sampling from 0.5 to 2 m) were examined.The analytical technique was reported by Yatsimirskii(1967). The detection limit for Re is 0.01 ppm; theuncertainty of measurement does not exceed 15% rel�ative. The contents of Cu, Mo, and Re were deter�mined in 40 samples; the results obtained are given inTable 1.
The content of Re in individual grains of molybden�ite was measured on a Cameca SX�100 electronmicroprobe at the Institute of Geology and Geochem�istry, Ural Branch, Russian Academy of Sciences,analysts V.G. Gmyra and V.V. Khiller, and the NaturalHistory Museum in London, Great Britain, analyst
Table 1. Variations in the contents of Re, Mo, Cu, and their ratios in ores with a high grade of Mo
Drill hole, profileNumber of sam�
ples
Range of content (average)
Re, ppm Mo, ppm Cu, % Mo/Re Cu/Mo Re in MoS2, ppm
3006, profile 103 7
3007, profile 103 5
3058, profile 103 21
3033, profile 99 1 0.15 15 0.38 100 253 –
2258, profile 99 1 0.08 3 0.5 38 1667 –
2200, profile 80 3 –
2201, profile 80 2 –
Content of Re in molybdenite was calculated only for sampling with the number of samples greater than 5.
0.11–1.440.42( )
�������������������� 60–280115( )
��������������� 0.33–1.130.65( )
�������������������� 194–682360( )
����������������� 40–11162( )
��������������� 880–30842041( )
��������������������
0.21–1.220.48( )
�������������������� 88–360162( )
��������������� 0.12–1.790.70( )
�������������������� 250–593374( )
����������������� 9.4–17953( )
���������������� 1012–23991759( )
����������������������
0.01–2.720.24( )
�������������������� 5–1397121( )
��������������� 0.29–1.880.80( )
�������������������� 167–2600987( )
�������������������� 8.3–1660494( )
������������������� 231–35981349( )
��������������������
0.01–0.290.14( )
�������������������� 3–7026( )
���������� 0.2–0.50.4( )
��������������� 38–300193( )
��������������� 71.4–1000579( )
���������������������
0.06–0.280.17( )
�������������������� 15–2017.5( )
������������� 0.2–0.70.45( )
��������������� 71.4–250160.7( )
������������������� 133.3–350241.7( )
���������������������

GEOLOGY OF ORE DEPOSITS Vol. 57 No. 2 2015
RHENIUM IN ORES OF THE MIKHEEVSKOE PORPHYRY Cu–Mo DEPOSIT 121
J. Spratt. The X�ray mapping of analytical lines ReLα,ReMα, MoLa, SKα, CaKα, SiKα, FeKα, and ZnKα wascarried out at first, and then areas for spot analysiswere chosen. At the Institute of Geology andGeochemistry, Ural Branch, Russian Academy of Sci�ences, the operating conditions were: beam diameter1 μm, acceleration voltage 20–25 keV, current inten�sity 30–50 nA, and analytical lines ReLα, MoMβ,SiKα, AlKα, FeKα, SKα. In addition, Re frequently wasmeasured close to the same spots (with second passwith spectrometer change) with the ReMα analyticalline. In the case of line interference, automatic recal�culation was carried out as consistent with loaded pro�grams. The following standards were used: metallic Reand Mo, pyrite, and jadeite. The detection limit for Rewas 0.05 wt % (occasionally 0.09 wt %). At the NaturalHistory Museum, the operating conditions were:beam diameter 1–2 μm, acceleration voltage 20 keV,current intensity 20 nA, and analytical lines ReLα,MoLa, and SKα. The following standards were used:metallic Re and Mo, and sphalerite. Counting timewas, s: 30 S, 60 Mo, and 240 Re. The line interferencewas corrected for 0.002% Mo/S and 0.04% S/Mo. Thedetection limit for Re was 0.03 wt %.
The polytypes of molybdenite were determined on aXRD�7000 Shimadzu diffractometer operating at fil�tered Cu radiation, rate 1°/min, and 2Θ 4°–70° at theInstitute of Geology and Geochemistry, Ural Branch,Russian Academy of Sciences, analyst T.Ya. Gulyaeva.The region 2Θ 28°–53° was additionally measuredwith rate 0.2°/min to obtain a more qualitative X�raydiffraction pattern for the reliable identification ofpolytypes of molybdenite studied here. The flakes ofmolybdenite were crushed in jasper mortar; then, dueto lack of material, a thin layer of alcoholic suspensionwas applied on the glass mount. However, the qualita�tive X�ray powder diffraction patterns with completeset of reflections for quantitative determination ofpolytypes were not obtained because of lack of mate�rial. Therefore, the relationship of the 2H and 3Rpolytypes in the samples of molybdenite studied were
estimated with the X’Pert HightScore�plus programsupplied with a database of minerals.
VARIATIONS IN Re, Mo, AND Cu GRADES IN ORES
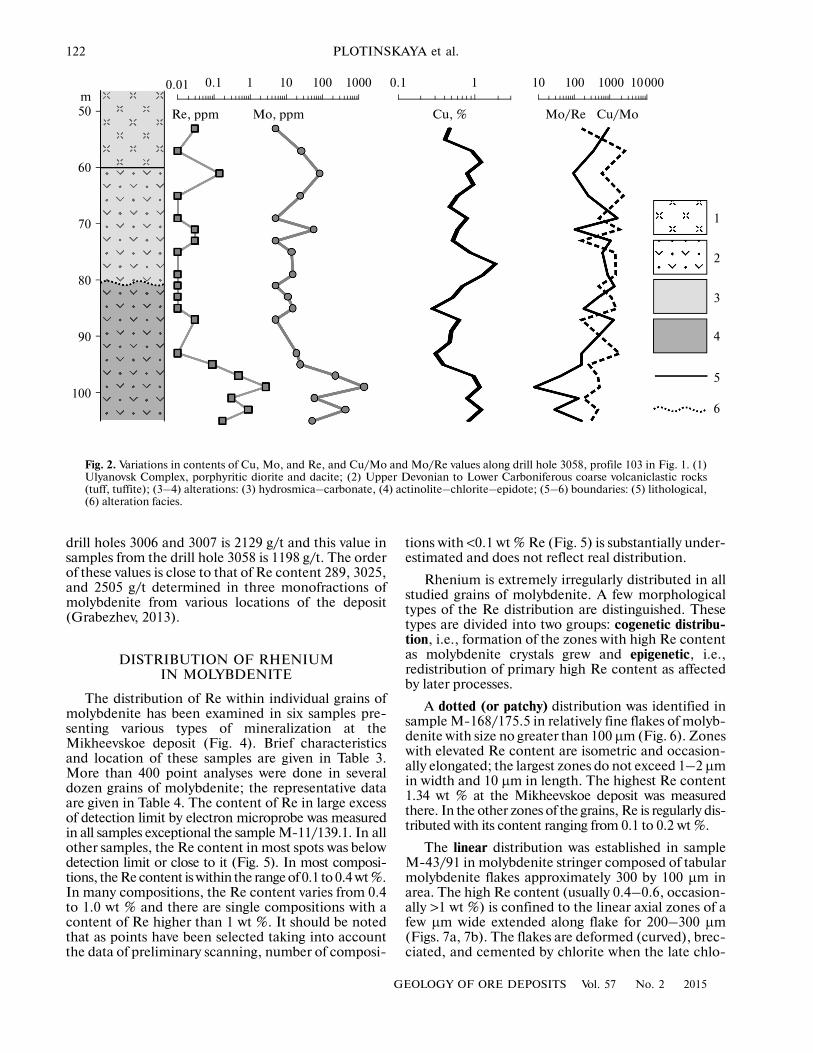
Most samples studied were selected along profile103 at the northern location of the deposit and a fewsamples came from the central and southern locations(Figs. 1, 2, Table 1). The Cu and Mo contents in thesamples studied range from 0.12 to 1.88 % and from3 to 1397 g/t, respectively. The Re grade varies from0.01 to 2.72 g/t, although usually it does not exceed1 g/t; the Mo/Re value ranges from 37.5 to 2600. Asshown in Fig. 2, the patterns of the Re and Mo contentare nearly conformable, whereas ranges of elevatedcontent of Re and Mo are partly consistent with thoseof Cu in the best studied drill hole 3058 at profile 103.
These observations are supported by correlationanalysis of sample data. A high positive correlation(correlation coefficient 0.94) was established betweenMo and Re (Fig. 3, Table 2). The content of Re isweakly positive related (at the limit of significance) tothat of Cu and is weakly positive related to the Cu/Movalue. However, if samples with Re < 0.03 g/t close tothe detection limit and measured with poor accuracyare excluded then the features are different. The posi�tive correlation between Re and Cu becomes signifi�cant (correlation coefficient 0.52), whereas negativecorrelation between Re and Cu/Mo value disappears.In this case, a significant negative correlation betweenCu/Mo and Mo/Re values (correlation coefficient⎯0.57) is established. However, the high positive cor�relation between Mo and Re (correlation coefficient0.94) is retained.
The high correlation between Mo and Re allowsestimation of mean concentration of Re in molybden�ite that ranges from a few hundred to a few thousandppm (Table 1). The data obtained are consistent withthose calculated of the basis of regression on the Reversus Mo plots: the average content in samples from
Table 2. Correlation coefficients between Re, Mo, Cu, and their ratios
All compositions, n = 40, rmin = 0.32 Compositions with Re > 0.03 g/t, n = 25, rmin = 0.40
Re Mo Cu Mo/Re Cu/Mo Re Mo Cu Mo/Re Cu/Mo
Re 1 Re 1
Mo 0.94 1 Mo 0.94 1
Cu 0.35 0.32 1 Cu 0.52 0.42 1
Mo/Re –0.23 –0.10 0.20 1 Mo/Re 0.18 0.35 0.03 1
Cu/Mo –0.35 –0.31 –0.02 –0.10 1 Cu/Mo –0.25 –0.25 –0.12 –0.57 1
n denotes number of analyses; rmin denotes minimum significant correlation coefficient for confidence level of 5%. Significant correla�tion coefficients are shown in bold.
122
GEOLOGY OF ORE DEPOSITS Vol. 57 No. 2 2015
PLOTINSKAYA et al.
drill holes 3006 and 3007 is 2129 g/t and this value insamples from the drill hole 3058 is 1198 g/t. The orderof these values is close to that of Re content 289, 3025,and 2505 g/t determined in three monofractions ofmolybdenite from various locations of the deposit(Grabezhev, 2013).
DISTRIBUTION OF RHENIUMIN MOLYBDENITE
The distribution of Re within individual grains ofmolybdenite has been examined in six samples pre�senting various types of mineralization at theMikheevskoe deposit (Fig. 4). Brief characteristicsand location of these samples are given in Table 3.More than 400 point analyses were done in severaldozen grains of molybdenite; the representative dataare given in Table 4. The content of Re in large excessof detection limit by electron microprobe was measuredin all samples exceptional the sample M�11/139.1. In allother samples, the Re content in most spots was belowdetection limit or close to it (Fig. 5). In most composi�tions, the Re content is within the range of 0.1 to 0.4 wt %.In many compositions, the Re content varies from 0.4to 1.0 wt % and there are single compositions with acontent of Re higher than 1 wt %. It should be notedthat as points have been selected taking into accountthe data of preliminary scanning, number of composi�
tions with <0.1 wt % Re (Fig. 5) is substantially under�estimated and does not reflect real distribution.
Rhenium is extremely irregularly distributed in allstudied grains of molybdenite. A few morphologicaltypes of the Re distribution are distinguished. Thesetypes are divided into two groups: cogenetic distribu�tion, i.e., formation of the zones with high Re contentas molybdenite crystals grew and epigenetic, i.e.,redistribution of primary high Re content as affectedby later processes.
A dotted (or patchy) distribution was identified insample M�168/175.5 in relatively fine flakes of molyb�denite with size no greater than 100 μm (Fig. 6). Zoneswith elevated Re content are isometric and occasion�ally elongated; the largest zones do not exceed 1–2 μmin width and 10 μm in length. The highest Re content1.34 wt % at the Mikheevskoe deposit was measuredthere. In the other zones of the grains, Re is regularly dis�tributed with its content ranging from 0.1 to 0.2 wt %.
The linear distribution was established in sampleM�43/91 in molybdenite stringer composed of tabularmolybdenite flakes approximately 300 by 100 μm inarea. The high Re content (usually 0.4–0.6, occasion�ally >1 wt %) is confined to the linear axial zones of afew μm wide extended along flake for 200–300 μm(Figs. 7a, 7b). The flakes are deformed (curved), brec�ciated, and cemented by chlorite when the late chlo�
m50
60
70
80
90
100
Re, ppm Mo, ppm Cu, % Mo/Re Cu/Mo
0.01 0.1 1 10 100 1000 10000
1
2
3
4
5
6
0.1 1 10 100 1000
Fig. 2. Variations in contents of Cu, Mo, and Re, and Cu/Mo and Mo/Re values along drill hole 3058, profile 103 in Fig. 1. (1)Ulyanovsk Complex, porphyritic diorite and dacite; (2) Upper Devonian to Lower Carboniferous coarse volcaniclastic rocks(tuff, tuffite); (3–4) alterations: (3) hydrosmica–carbonate, (4) actinolite–chlorite–epidote; (5–6) boundaries: (5) lithological,(6) alteration facies.

GEOLOGY OF ORE DEPOSITS Vol. 57 No. 2 2015
RHENIUM IN ORES OF THE MIKHEEVSKOE PORPHYRY Cu–Mo DEPOSIT 123
rite– carbonate veinlet cuts the stringer. In this case,the axial zone enriched in Re is curved together withflake (Figs. 7c, 7d). Number of linear zones enrichedin Re in these areas is less than that in not deformedareas; this indirectly testified to removal of Re frommolybdenite.
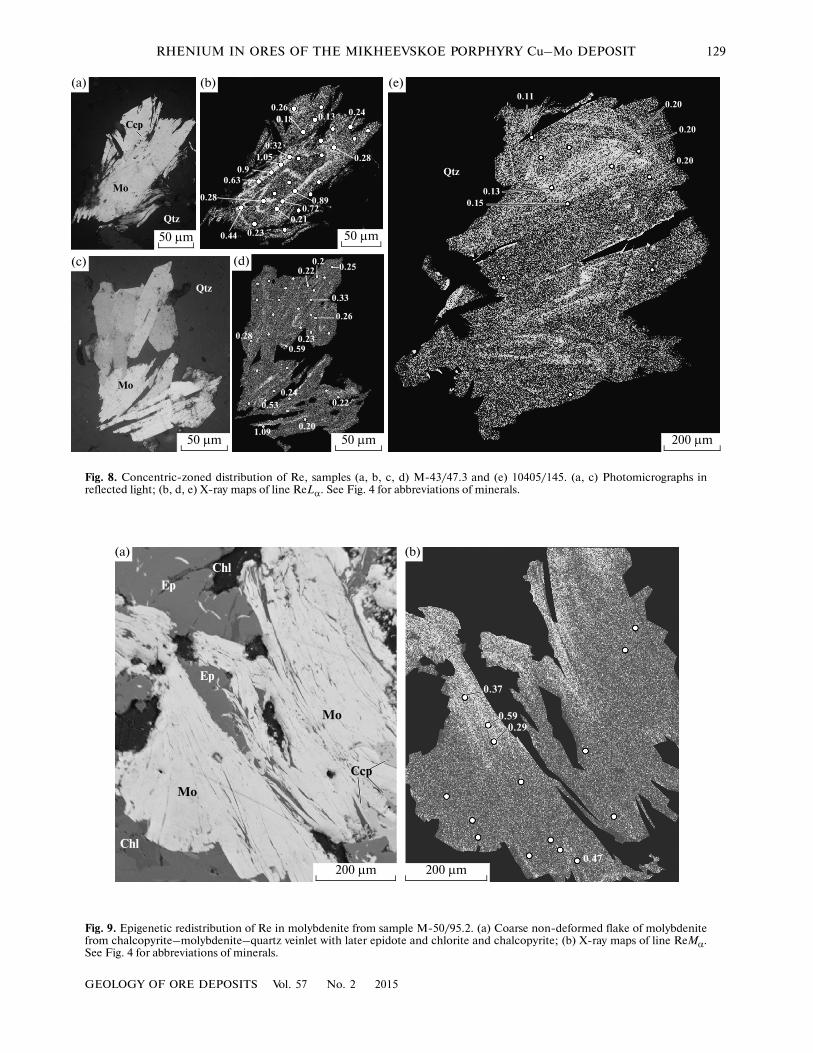
The concentric�zoned distribution was establishedin sample M�43/47.3 in rosettes of molybdenite 100 by200 μm composed of flakes of 30–50 by 100 μm. A fewgrowth zones with high Re content are identified inthese flakes as usual. The thickness of these zones is afew μm and number ranges from two to four. The Recontent reaches 1.1 wt %. Its concentration in the
space between zones of approximately 10 μm in widthis ca. 0.2 wt %. Chlorite developed at the margin ofmolybdenite flake causes splitting of the latter (Fig. 8).However, an appreciable redistribution of Re is notobserved.
With the more severe mechanical deformationobserved in large flake of molybdenite from sample10405/145 (Fig. 8e), the zones with high Re content(which were initially concentric) are deformedtogether with the flake. The highest Re content doesnot exceed 0.2 wt %; this indirectly indicates the redis�tribution of Re within the grain and partial homogeni�zation of the composition of molybdenite.
Mo, ppm10000
1000
100
10
10.01 0.1 1 10
(а)
3058
3006
3007
3033
2258
2201
2200
Cu, %10
1
0.10.01 0.1 1 10
(b)
Re, ppm Re, ppmCu/Mo10000
1000
100
10
10.01 0.1 1 10
(c)
Re, ppm
Cu/Mo10000
1000
100
10
110 100 1000 10000
(d)
Mo/Re
Re ≤ 0.03 ppm
Fig. 3. Binary plots (a) Mo versus Re, (b) Cu versus Re, (c) Cu/Mo versus Re, and (d) Cu/Mo versus Mo/Re of the ores of theMikheevskoe deposit.

124
GEOLOGY OF ORE DEPOSITS Vol. 57 No. 2 2015
PLOTINSKAYA et al.
1 cm 1 mm
100 μm500 μm1 cm
1 cm 1 mm
500 μm1 cm
Mo
(b)
Cal
Qtz
Mo
ApCal
AbMus
ChI
ChI
Cal
Mo
Mo
Mo
(e)(d)
Mo
Ccp
Mo
Ccp
CcpMo
Qtz
Ccp
Chl
Ab Ab
AbQtz
AbChl+Fng
Qtz
Mus+Chl
Act+Mt
Ccp+Ep
Mo
Mt
Mt
Ccp
Ccp
(a) (b)
(c) (d) (e)
(f) (g)
(h) (i)
Ру
Fig. 4. Typical molybdenite�bearing samples from the Mikheevskoe deposit. (a, c, f, h) Photos of specimens; (d, i) photomicro�graphs in reflected light; (b, e, g) back�scattered electron images. Detailed description of samples is given in Table 3. (a, b)Sample M�43/47.3, Quartz veinlet with pockets of molybdenite, apatite, and calcite hosted in basaltic andesite; (c, d, e) sam�ple M�43/91, strings of molybdenite hosted in basaltic andesite cut and deformed by quartz–carbonate–chlorite–chalcopy�rite veinlet; (f, g) sample M�11/139.1, quartz veinlet with pockets of molybdenite and chalcopyrite hosted in diorite; (h, i)sample M�168/175.7, magnetite–actinolite metasomatic rock replacing basalt with superimposed epidote–molybdenite–pyrite–chalcopyrite mineralization. (Ab) Albite, (Act) actinolite, (Ap) apatite, (Cal) calcite, (Ccp) chalcopyrite, (Chl) chlorite,(Ep) epidote, (Fng) phengite, (Mo) molybdenite, (Mt) magnetite, (Mus) muscovite, (Py) pyrite, (Qtz) quartz.

GEOLOGY OF ORE DEPOSITS Vol. 57 No. 2 2015
RHENIUM IN ORES OF THE MIKHEEVSKOE PORPHYRY Cu–Mo DEPOSIT 125
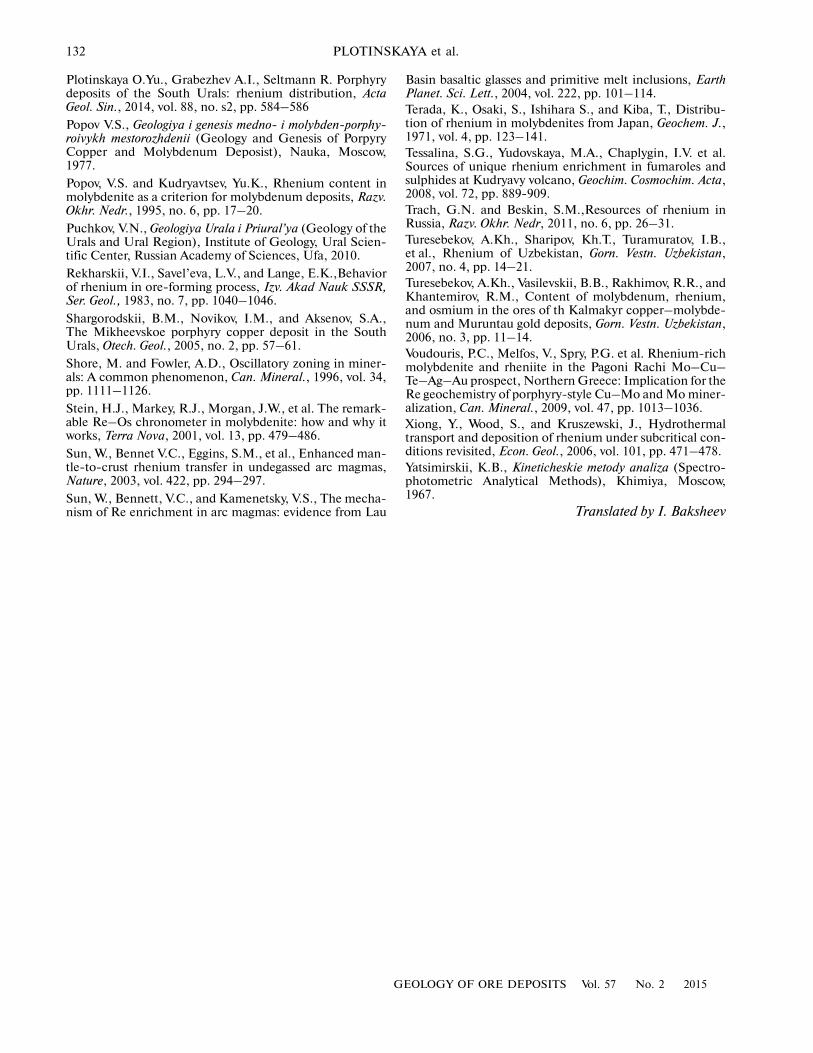
Epigenetic redistribution of Re is found in sampleM�50/95.2 in the aggregate composed of molybdenitegrains that is split and cemented by chalcopyrite, chlo�rite, and epidote (Fig. 9). Irregular�shaped zones withinthe grains and grain rims are enriched in Re up to 0.59and 0.47 wt %, respectively. Rhenium was apparentlyremoved from molybdenite along fractures and precipi�tated in rims as specific geochemical barrier.
DISCUSSION
Distribution of Re in Ores
Both Re and Mo are irregularly distributed in theores of the Mikheevskoe deposit. The Mo grade in thesamples studied is as high as 30–50 g/t as usual, and
sporadically, it is higher than 1000 g/t. Therefore, theRe content occasionally exceeds 5 g/t. The high posi�tive correlation between Mo and Re is accounted bythe fact that molybdenite is the only carrier of Re atthe deposit. The spatial separation of the zones withhigh Mo and Re grades of and those of copper�richores is explained by occurrence of the substantial partof molybdenite as fine stringers devoid of Cu minerals(e.g., in sample M�43/91) and by widespread propy�lites with molybdenite�free chalcopyrite–pyrite min�eralization. This causes the absence of a significantcorrelation between Mo and Cu.
The negative relation between Cu/Mo and Mo/Reand positive relation Re–Cu show that the Re contentin hydrothermal system (in fluid) is more or less uni�
Table 3. Description of ore�bearing samples selected for the study of rhenium distribution within separated grains of mo�lybdenite
Number of sample,
profileSample description Polytypes
of molybdenite
Maximum content of Re in molybden�
ite, wt %
M�43/47.3 profile 104
Altered (chlorite + sericite) basaltic andesite impregnated with chalcopyrite. Veinlet of gray quartz with sericite halo and pockets of chalcopyrite is cut by veinlet of white quartz with molybdenite. Molybdenite occurs as pockets of missoriented flakes of a few hundred µm to 1 mm in size. The flakes are intergrown with chal�copyrite, bornite, muscovite, and chlorite
Not analyzed 1.09
M�43/91profile 104
Altered (chlorite + sericite) basaltic andesite cut by strings of mo�lybdenite of 1 to 2 mm in thickness. Molybdenite occurs as flakes up to a few hundred µm in size, which form compact aggregate up to a few cm in size. Rare clusters of chalcopyrite and occasional bornite are observed; bornite is replaced by chalcopyrite. Quartz–carbonate–chlorite–chalcopyrite veinlent cuts and displaces stringer of molybdenite
Not analyzed 0.98
M�10405/145 profile 104
Biotite metasomatic rock with superimposed chlorite–epidote–sericite alteration. Quartz veinlet of 3 mm in thickness with pock�ets of chalcopyrite and impregnation of chalcopyrite in the rock. Pockets of molybdenite up to 1 mm in size are strongly deformed
2H – 91%3R – 9% or2H – 59%;3R – 41%
0.20
M�11/139.1 profile 102
Veinlet of white quartz with pockets of chalcopyrite and molyb�denite in altered (albite + sericite + chlorite) diorite. Pockets of molybdenite up to 1–2 mm in size are partly deformed in the vein�tet selvages. Molybdenite is intergrown with chalcopyrite, chlo�rite, and muscovite
2H – 86%3R – 14%or 2H – 50%; 3R – 50%;
0.06
M�50/95.2 profile 102a
Altered (chlorite + sericite) tuffstone cut by a series of molybden�ite� and chalcopyrite�bearing quartz veinlets. Clusters of bornite and chalcopyrite are rare
Not analyzed 0.59
M�168/175.7 profile 91
Magnetite–amphibole metasomatic rock that replaced basalt con�tains later epidote–pyrite–chalcopyrite mineralization. Rare fine tabular flakes of molybdenite (up to 100 µm) are intergrown with magnetite and chalcopyrite.
Not analyzed 1.34

126
GEOLOGY OF ORE DEPOSITS Vol. 57 No. 2 2015
PLOTINSKAYA et al.
n140
120
100
80
60
40
20
0 0.1 0.2 0.3 0.4 0.5 0.6 0.7 0.8 0.9 1.0 1.1 1.2 1.3 1.4Re, wt %
M�43/91
M�43/47.3
M�168/175.5
M�50/95.2
10405/145
M�11/139.1
Fig. 5. Histogram of Re content in molybdenite of the Mikheevskoe deposit on the basis of electron microprobe data.
form and its concentration in molybdenite is higherwhere molybdenite is less frequent, because molyb�denite accumulates all Re in the system. This opinionis the most common (Stein et al., 2001; Berzina, et al.2005). In addition, this feature was established at theUral porphyry molybdenum and copper deposits ingeneral (Grabezhev, 2013).
Rekharskii et al. (1983), Filimonova et al. (1984),and Newberry (19792) reported that molybdeniteformed at the early alkali stage or stage of potassic(potassium feldspar or biotite) alteration is Re�poor,whereas that of the acid leaching stage or stage of phyl�lic alteration (quartz–sericite metasomatic rocks) isenriched in Re. Such succession of alterations is typicalof all porphyry�type deposits including Mikheevskoe.However, no molybdenite related to potassic alterationwas found at the Mikheevskoe deposit, whereas themolybdenite examined is apparently related to a phyl�lic alteration that is overprinted by propylite, most fre�quently composed of epidote and chlorite.
Redox potential is considered to be another impor�tant factor affecting the solubility of Re in fluid.
According to experiments (Xiong et al., 2006), the sol�ubility of Re in oxidized fluid is higher than that inreductive solution. In other words, the oxidative con�ditions favorable to introduction of Re into the systemand predominant at the early stage of deposit enrichedin Re should be changed by reductive conditionsresulting in precipitation of this element. The molyb�denite�bearing assemblages are quite consistent withthis. In most samples studied (see Table 3), there isbornite replaced by chalcopyrite or is rimmed by chal�copyrite. Such paragenetic succession is caused bydecreasing fO2 and/or fS2 in fluid and explains that therims of the molybdenite flakes usually are depleted inRe. No bornite was found only in sample M�11/139.1,where molybdenite is Re�free. The reverse change ofreductive to oxidative conditions could result in partialdissolution of Re�bearing molybdenite and removal ofRe from this mineral.
Distribution of Re in Molybdenite
The irregular distribution of Re in molybdenite iscommon and has been identified with neutron activa�

GEOLOGY OF ORE DEPOSITS Vol. 57 No. 2 2015
RHENIUM IN ORES OF THE MIKHEEVSKOE PORPHYRY Cu–Mo DEPOSIT 127
100 μm
Chl
Amf
Ccp
Mo
Mo
Ep
Qtz
Ccp
Mt
Mt
Qtz
(a)
50 μm
Ccp
CcpAmf + Qtz
(e)
(d)
Ep
20 μm20 μm20 μm
0.12
0.22
0.71
1.040.47
0.11 0.140.11
0.39
1.32
0.17
0.130.16
1.101.34
(а) (b)
(c) (d) (e)
Fig. 6. Dotted (patchy) distribution of Re in molybdenite, sample M�168/175.5. From this point onward, numbers correspondto Re content (wt %) at analyzed points; at other points content of Re does not exceed 0.10 wt %. (a) Back�scattered electronimage of molybdenite flake of molybdenite (Mo) intergrown with chalcopyrite (Ccp), epidote (Ep), and magnetite (Mt) enclosedin quartz (Qtz) and amphibole (Amf); (b) photomicrograph of molybdenite flake enclosed in quartz in reflected light; (c, d, e) X�ray maps of line ReLα. See Fig. 4 for abbreviations of minerals.
tion (Terada et al., 1971), EMP analysis (Kovalenkeret al., 1974; Voudoris et al., 2009; Maksimyuk andKulikova, 2013), and LA�ICP�MS (Kosler et al.,2003; Aleinikoff et al., 2012; Chiobanu et al., 2013) inmolybdenite from deposits of various genetic types allover the world. Particularly in the Urals, the irregulardistribution of Re in molybdenite has been establishedat a few deposits and occurrences: East Artyomovsk(Grabezhev and Shagalov, 2010), Voznesenka por�phyry Mo�Cu (Grabezhev, 2012; Grabezhev andGmyra, 2014), Verkheuralsk porphyry Cu�Mo (Gra�bezhev, 2013) and Kalinovskoe porphyry Cu (Plotin�skaya et al., 2014).
Nevertheless, the nature of such distribution ispoorly investigated. According to Newberry (19791),Rekharskii et al. (1983) and Fiilmonova et al. (1984),appreciable admixture of Re is typical of molybdenite3R, whereas the structure of abundant molybdenite2H is not favorable to incorporation of Re. We haveestablished comparable amounts of the both poly�types in both Re�bearing molybdenite from sampleM�10405/145 and Re�free molybdenite from sampleM�11/139.1 (Table 3). Similar data were obtained at
the Maronia porphyry molybdenum deposit, Greece,where molybdenite contains up to 2.88 wt % Re (Mel�fos et al., 2002 and references therein). On the basis ofthe study of molybdenite from various deposits, Mak�simyuk and Kulikova (2013) suggested that the highRe content in molybdenite is caused by microinclu�sions of polytype 3R in molybdenite 2H. It would bereasonable to suggest a similar situation at theMikheevskoe deposit.
However, molybdenite from the Pagoni Rachideposit contains up to 4.7 wt % Re, but no polytype 3Rhas been identified (Voudoris et al., 2009). At the Hill�top deposit in the United States, both Re�bearing molyb�denite (>1000 ppm measured with LA�ICP�MS) andRe�free molybdenite belong to polytype 2H (Chiobanuet al., 2013). In this case, the authors attributed highRe content to lattice defects in molybdenite 2H.Kulikova and Maksimyuk (2013) also reported defectsin the structure of Re�bearing molybdenite. In addi�tion, according to the experimental study of the Re–Mo–S system (Drabek et al., 2010), substantialamount of Re is incorporated into molybdenite 2H(up to 2.2 wt % at 400°С).

128
GEOLOGY OF ORE DEPOSITS Vol. 57 No. 2 2015
PLOTINSKAYA et al.
100 μm
(а)
(c) (d)
100 μm
200 μm 200 μm
0.21
0.28
0.20
0.66
0.470.47
0.600.48
0.380.45
0.49
0.12
0.10
0.76
0.270.86
1.26
0.100.14
0.350.110.17
0.76
0.820.14
0.75
0.53
0.190.11 0.18
0.17
0.32
0.460.60
(b)
Fig. 7. Linear distribution of Re in molybdenite, sample M�43/91. (a, b) Non�deformed part of string, (c, d) deformed part ofstring; (a) photomicrograph in reflected light, (b, d) X�ray maps of line ReMα; (c) back�scattered electron image.
Rhenium is usually suggested to substitute molyb�denum in molybdenite, although mechanical impurityof Re as inclusions of rheniite could not be ruled out.Microinclusions of rheniite in molybdenite werefound at the Pagoni Rachi deposit (Voudoris et al.,2009), where they are easily visible in back�scatteredelectron images, and at the Kalmykyr deposit inUzbekistan (Turesebekov et al., 2006, 2007). Inter�growths of rheniite and Re�bearing molybdenite werefound in fumaroles of the Kudriavy volcano, KurilIslands (Korzhinsky et al., 1994; Chaplygin et al.,2007). However, undistinguishable in electron micro�scope nano�inclusions of rheniite in molybdenite areprobable. It is apparently that identification of Re spe�cies in molybdenite requires high�resolution study.Nevertheless, many features are common for bothchemical and mechanical admixtures.
For example, concentric or oscillatory zoned dis�tribution of Re found in sample M�43/47.3 regardlessof Re species could be explained by periodic variationsin growth rate of molybdenite crystal. With fastergrowth, the face of crystal captures more Re, while dif�fusion zone, the area of solution adjacent to crystal, is
depleted in Re. The growth slows down until diffusionzone saturated, and afterward the process repeats. Thismechanism suggests crystal growth in a closed system(Shore and Fowler, 1996). The zones enriched in Re(>0.5 wt %) within grains of molybdenite, the short�ness of the zone systems (up to 300 μm) abruptly bro�ken along striking, and the absence of relationshipbetween number of Re�rich zones in neighbor grainsof molybdenite indirectly testify to this mechanism.However, the long�term existence of isolated areas inacting hydrothermal system is unlikely. Therefore, theincorporation of Re into molybdenite is probablydetermined by external conditions (Shore and Fowler,1996), which are the aforementioned variations inphysicochemical characteristics of fluid. It cannot beruled out that the system opens and closes multiplyand this results in complex zoning.
CONCLUSIONS
The grade of Re in the ores of the Mikheevskoe depositdoes not exceed 0.5 g/t. The Re grade is correlated withMo content and to lesser extent with that of Cu.
GEOLOGY OF ORE DEPOSITS Vol. 57 No. 2 2015
RHENIUM IN ORES OF THE MIKHEEVSKOE PORPHYRY Cu–Mo DEPOSIT 129
(а)
50 μm 50 μm
200 μm50 μm 50 μm
Mo
Ccp
Qtz
Qtz
Mo
Qtz
0.260.130.18
0.24
0.28
0.32
0.890.72
0.21
1.05
0.90.63
0.28
0.44 0.23
0.220.2
0.25
0.33
0.26
0.230.59
0.28
0.240.220.53
0.201.09
0.150.13
0.110.20
0.20
0.20
(b) (e)
(c) (d)
Fig. 8. Concentric�zoned distribution of Re, samples (a, b, c, d) M�43/47.3 and (e) 10405/145. (a, c) Photomicrographs inreflected light; (b, d, e) X�ray maps of line ReLα. See Fig. 4 for abbreviations of minerals.
(а)
200 μm 200 μm
(b)
EpChl
Ep
Chl
Mo
Mo
Ccp
0.37
0.590.29
0.47
Fig. 9. Epigenetic redistribution of Re in molybdenite from sample M�50/95.2. (a) Coarse non�deformed flake of molybdenitefrom chalcopyrite–molybdenite–quartz veinlet with later epidote and chlorite and chalcopyrite; (b) X�ray maps of line ReMα.See Fig. 4 for abbreviations of minerals.

130
GEOLOGY OF ORE DEPOSITS Vol. 57 No. 2 2015
PLOTINSKAYA et al.
Tabl
e 4.
Rep
rese
nta
tive
ele
ctro
n m
icro
pro
be d
ata
(wt
%)
for
mo
lybd
enit
e
Sam
ple
, ch
arac
teri
stic
s№
SM
oR
eT
ota
lS
amp
le,
char
acte
rist
ics
№S
Mo
Re
To
tal
* S
ampl
e M
�168
/175
.5,
Fig
. 6c,
tabu
lar
grai
n o
f 40
× 8
0 µ
m in
siz
e1
39.3
158
.99
0.39
98.6
9S
ampl
e M
�43/
47.3
, Fig
s. 8
a, 8
b; fl
ake
of
mo
lybd
enit
e o
f 10
0 ×
200
µm
in
size
; rim
s ar
e sp
lit t
o fo
rm fi
lam
enta
ry
segr
egat
ion
s
138
.59
59.4
70.
2498
.30
239
.83
58.2
51.
3299
.40
237
.95
57.6
31.
0596
.63
339
.31
58.9
70.
1698
.44
338
.06
57.8
90.
9096
.85
439
.35
58.3
21.
1098
.77
438
.51
58.8
50.
6397
.99
539
.59
58.0
61.
3498
.99
538
.08
58.3
00.
7297
.10
639
.65
59.2
00.
1398
.98
638
.02
57.9
10.
8996
.82
* S
ampl
e M
�168
/175
.5, F
ig. 6
d, t
abu
lar
grai
n o
f 30
× 6
0 µ
m in
siz
e7
39.4
659
.70
0.12
99.2
8S
ampl
e M
�43/
47.3
, F
igs.
8c,
8d
, h
emi�
rose
tte
of
mo
lybd
enit
e o
f 10
0 ×
200
µm
in s
ize
com
po
sed
o
f n
on
�def
orm
ed f
lake
so
f 20
–30
× 7
0–80
µm
in s
ize
738
.84
59.5
70.
1998
.60
839
.68
59.6
10.
2299
.51
839
.05
59.1
00.
2398
.38
939
.56
59.3
90.
7199
.66
939
.13
59.2
20.
2698
.61
1039
.64
58.9
51.
0499
.63
1039
.09
59.6
50.
2598
.99
1139
.62
59.1
90.
4799
.28
1138
.87
59.5
50.
1698
.58
1239
.30
59.0
00.
1498
.43
1239
.25
59.3
30.
2098
.78
1339
.75
59.8
70.
1199
.73
1338
.96
59.8
10.
2298
.99
* S
ampl
e M
�168
/175
.5, F
ig. 6
e, is
omet
�ri
c gr
ain
of
30 ×
40 µ
m in
siz
e14
39.0
358
.60
0.22
97.8
514
39.1
259
.61
0.33
99.0
6
1539
.21
58.6
80.
1298
.02
1538
.45
59.5
60.
1098
.11
1639
.31
58.7
90.
0998
.19
1638
.48
58.8
50.
5997
.92
Sam
ple
M�4
3/91
, F
igs.
7a,
7b,
str
ing
of
mo
lybd
enit
e o
f ca
. 0.5
mm
in t
hic
k�n
ess
com
po
sed
of
par
alle
l tab
ula
r n
on
�d
efo
rmed
fla
kes
ran
gin
g fr
om 2
0 ×
50
to 1
00 ×
200
µm
in s
ize
137
.80
60.1
20.
2598
.17
1739
.05
59.1
70.
1898
.40
237
.73
59.4
70.
4797
.67
1838
.86
59.3
80.
1598
.39
337
.86
59.9
10.
1097
.87
1938
.65
59.0
80.
2898
.01
438
.41
59.9
90.
1298
.52
2038
.93
59.6
30.
1198
.67
538
.52
60.2
40.
1398
.89
2138
.89
60.0
70.
1399
.09
637
.92
59.7
80.
1797
.87
2238
.86
58.9
51.
0998
.90
738
.16
59.2
40.
4297
.82
Sam
ple
1040
5/14
5, F
ig. 8
e, la
rge
(0.5
× 1
mm
) st
ron
gly
def
orm
ed g
rain
o
f m
oly
bden
ite
139
.67
59.6
50.
0799
.49
838
.36
59.7
70.
1098
.23
239
.85
60.0
30.
1199
.99
937
.91
59.0
20.
5397
.46
339
.29
58.9
20.
1398
.34
1037
.97
59.3
60.
6497
.97
439
.21
59.3
60.
1598
.72
Sam
ple
M�4
3/91
, F
igs
7c,
7d,
stri
ng
of m
oly
bden
ite
of c
a. 0
.2 m
m th
ick
is d
e�fo
rmed
bec
ause
of
late
r cu
ttin
g ve
inle
t;
flak
es a
re c
urv
ed
1138
.16
58.7
20.
6597
.53
539
.35
59.6
20.
2099
.17
1238
.43
59.4
00.
1898
.01
639
.64
59.7
90.
2099
.63
1338
.42
59.7
00.
1998
.31
Sam
ple
M�5
0/92
.5,
Fig
. 9,
coar
se
flak
e1
39.9
859
.05
0.29
99.3
2
1438
.45
58.5
30.
5397
.51
239
.94
58.6
60.
5999
.19
1538
.96
59.8
90.
1098
.95
* S
ampl
e M
�11/
139.
1, F
ig. 4
g, la
rge
hem
i�ro
sett
e1
39.6
459
.38
0.03
99.0
3
1638
.63
59.0
90.
8298
.54
239
.82
59.4
3<
d.l
.99
.26
1738
.85
60.2
20.
3599
.42
339
.47
58.6
90.
0698
.21
*S
ampl
es w
ere
anal
yzed
at t
he N
atur
al H
isto
ry M
useu
m, L
ondo
n; o
ther
sam
ples
wer
e an
alyz
ed a
t the
Ins
titu
te o
f Geo
logy
and
Geo
chem
istr
y, U
ral B
ranc
h, R
ussi
an A
cade
my
of S
cien
ces.

GEOLOGY OF ORE DEPOSITS Vol. 57 No. 2 2015
RHENIUM IN ORES OF THE MIKHEEVSKOE PORPHYRY Cu–Mo DEPOSIT 131
Zones with an Re content above detection limit byelectron microprobe were found in most studied grainsof molybdenite. As rule, the content of Re is below0.4 wt %, but occasionally reaches 1.34 wt %.
Cogenetic admixture of Re is irregularly distributedwithin the flakes of molybdenite. The dot (patchy),linear, and concentric�zoned distribution of zonesenriched in Re�rich (usually 0.5–1 wt % Re, occasionallyhigher) against the lower content (up to 0.2 wt % Re) reg�ularly distributed within grain is established.
The later hydrothermal processes and mechanicaldeformation of the grains cause epigenetic redistribu�tion of Re in molybdenite that results in homogeniza�tion of the composition of molybdenite and fuzzy pri�mary zoning or removal of Re from molybdenite.
ACKNOWLEDGMENTS
This study was partially supported by the NaturalHistory Museum (CERCAMS Fellowship Program),Russian Foundation for Basic Research (projectnos. 12�05�00103a, 13�05�0622a, 14�05�00725a), thePresidium of Russian Academy of Sciences (programno. 5), and is a contribution to IGCP�592 sponsoredby UNESCO–IUGS. We are grateful to B.M. Shar�gorodskii for assistance, V.G. Gmyra, V.V. Khiller,T.Ya. Gulyaeva (Institute of Geology and Geochemis�try, Ural Branch, Russian Academy of Sciences), andJ. Spratt (Natural History Museum, London) for theirassistance with analytical study, and staff of theMikheevskoe GOK for its assistance in field work.
REFERENCES
Aleinikoff, J.N., Creaser, R.A., Lowers, H.A., et al., Multi�ple age components in individual molybdenite grains,Chem. Geol., 2012, vol. 300–301, pp. 55–60.Berzina, A.N., Sotnikov, V.I., Ekonomou�Eliopoulos, M.,et al., Distribution of rhenium in molybdenite from por�phyry Cu–Mo and Mo�Cu deposits of Russia (Siberia) andMongolia, Ore Geol. Rev., 2005, vol. 26, pp. 91–113.Chaplygin, I.V., Mozgova, N.N., Mokhov, A.V., et al., Min�erals of the system zns�cds from fumaroles of Kudriavy vol�cano, Iturup Island, Kuriles, Russia, Can. Mineral., 2007,vol. 45, pp. 709–722.Ciobanu, C.L., Cook, N.J., Kelson, C.R., et al., Trace ele�ment heterogeneity in molybdenite fingerprints stages ofmineralization, Chem. Geol., 2013, vol. 347, pp. 175–189.Dill, H.G., The “chessboard” classification scheme of min�eral deposits: mineralogy and geology from aluminum tozirconium, Earth�Sci. Rev., 2010, vol. 100, pp. 1–420.Drabek, M., Rieder, M., and Bohmova, V., The Re–Mo–Ssystem: new data on phase relations between 400 and1200°C, Eur. J. Mineral., 2010, vol. 22, pp. 479–484.Filimonova, L.E., Zhukov, N.M., and Malyavskaya, A.T.,The genetic aspets of polytypes and content of Re in molyb�denite at the porphyry copper deposits, Geokhimiya, 1984,no. 7, pp. 1040–1046.Grabezhev, A.I. and Belgorodskii, E.A., Produktivnye gran�itoidy i metasomatity medno�porfirovykh mestorozhdenii
(Economic Granitoids and Alterations of Poprphyry Cop�per Deposits), Yekaterinburg: Institute of Geology andGeochemistry, Urals Branch, Russian Academy of Sci�ences, 1992.Grabezhev, A.I. and Gmyra, V.G., Rhenium distribution indeformed molybdenite: evidence from the data of micro�probe scanning (Voznesenskoe porphyry copper deposit,South Urals, Russia), Dokl. Earth Sci., 2014, vo. 454,pp. 175–178.Grabezhev, A.I. and Shagalov, E.S., Rhenium distributionin molybdenite: results of microprobe scanning (porphyrycopper deposits, the Urals), Dokl. Earth Sci., 2010, vol. 431,pp. 351–355.Grabezhev, A.I., Plotinskaya, O.Yu., and Gmyra, V.G., Thedistribution of rhenium in molybdenite from porphyry cop�per deposits of the Urals: evidence from electron micro�probe scanning, Vest. Ural. Otd. Russian Mineral. Soc.,2010, no. 7, pp. 31–37.Grabezhev, A.I., Rhenium in porphyry copper deposits ofthe Urals, Geol. Ore Deposits, 2013, vol. 55, no. 1, pp. 13–26.Grabezhev, A.I., Rhenium�bearing porphyry copper sys�tems of the Urals: geological setting, and isotopic, petro�chemical, and age lateral zoning, Litosfera, 2012, no. 4,pp. 190–207.Grabezhev, A.I., The Novonikolaevka porphyry Cu–(Mo,Au)clusterm South Urals: pertochemistry of ore�bear�ing granitoids and alterations, Litosfera, 2014, no. 2,pp. 60–76.Hollister, V.F., An appraisal of the nature of some porphyrycopper deposits, Mineral. Sci. Engin., 1975, vol. 7,pp. 225—233.Korzhinsky, M.A., Tkachenko, S.I., Shmulovich, K.I.,et al. Discovery of a pure rhenium mineral at Kudriavy vol�cano, Nature, 1994, vol. 369, no. 6475, pp. 51–52.Kosler, J., Simonetti, A., Sylvester, P., et al., Laser ablationICP�MS measurements of Re/Os in molybdenites andimplications for Re–Os geochronology, Can. Mineral.,2003, vol. 41, pp. 307–320.Kovalenker, V.A., Laputina, I.P., and Vyalsov. L.N., On rhe�nium�rich molybdenite from the Talnakh copper–nickeldeposit, Norilsk diastrict, Dokl. AN SSSR, 1974, vol. 217,no. 1, pp. 187–189.Kulikova, I.M. and Maksimyuk, I.E., Morphological studyof species of admixture atoms in the crystal structure ofmolybdenite, New Data on Minerals, 2013, no. 48, pp. 71–81.Maksimyuk, I.E. and Kulikova, I.M., Species of rhenium inmolybdenite from various type ore deposits, Zap. RMO,2013, vol. 142, no. 2, pp. 94–106.Melfos, V., Vavelidis, M., Christofides, G., and Seidel, E.,Origin and evolution of the Tertiary Maronia porphyry cop�per–molybdenum deposit, Thrace, Greece, Miner. Depos�ita, 2002, vol. 37, pp. 648–668.Newberry, R.J.J.1, Polytypism in molybdenite (I): a non�equilibriun impurity�induced phenomenon, Amer. Min�eral., 1979, vol. 64, pp. 758–767.Newberry, R.J.J.2, Polytypism in molybdenite (II): rela�tionships between polytypism, ore deposition/alterationstages and rhenium contents, Amer. Mineral., 1979, vol. 64,pp. 768–775.
132
GEOLOGY OF ORE DEPOSITS Vol. 57 No. 2 2015
PLOTINSKAYA et al.
Plotinskaya O.Yu., Grabezhev A.I., Seltmann R. Porphyrydeposits of the South Urals: rhenium distribution, ActaGeol. Sin., 2014, vol. 88, no. s2, pp. 584–586
Popov V.S., Geologiya i genesis medno� i molybden�porphy�roivykh mestorozhdenii (Geology and Genesis of PorpyryCopper and Molybdenum Deposist), Nauka, Moscow,1977.
Popov, V.S. and Kudryavtsev, Yu.K., Rhenium content inmolybdenite as a criterion for molybdenum deposits, Razv.Okhr. Nedr., 1995, no. 6, pp. 17–20.
Puchkov, V.N., Geologiya Urala i Priural’ya (Geology of theUrals and Ural Region), Institute of Geology, Ural Scien�tific Center, Russian Academy of Sciences, Ufa, 2010.
Rekharskii, V.I., Savel’eva, L.V., and Lange, E.K.,Behaviorof rhenium in ore�forming process, Izv. Akad Nauk SSSR,Ser. Geol., 1983, no. 7, pp. 1040–1046.
Shargorodskii, B.M., Novikov, I.M., and Aksenov, S.A.,The Mikheevskoe porphyry copper deposit in the SouthUrals, Otech. Geol., 2005, no. 2, pp. 57–61.
Shore, M. and Fowler, A.D., Oscillatory zoning in miner�als: A common phenomenon, Can. Mineral., 1996, vol. 34,pp. 1111–1126.
Stein, H.J., Markey, R.J., Morgan, J.W., et al. The remark�able Re–Os chronometer in molybdenite: how and why itworks, Terra Nova, 2001, vol. 13, pp. 479–486.
Sun, W., Bennet V.C., Eggins, S.M., et al., Enhanced man�tle�to�crust rhenium transfer in undegassed arc magmas,Nature, 2003, vol. 422, pp. 294–297.
Sun, W., Bennett, V.C., and Kamenetsky, V.S., The mecha�nism of Re enrichment in arc magmas: evidence from Lau
Basin basaltic glasses and primitive melt inclusions, EarthPlanet. Sci. Lett., 2004, vol. 222, pp. 101–114.Terada, K., Osaki, S., Ishihara S., and Kiba, T., Distribu�tion of rhenium in molybdenites from Japan, Geochem. J.,1971, vol. 4, pp. 123–141.Tessalina, S.G., Yudovskaya, M.A., Chaplygin, I.V. et al.Sources of unique rhenium enrichment in fumaroles andsulphides at Kudryavy volcano, Geochim. Cosmochim. Acta,2008, vol. 72, pp. 889�909.Trach, G.N. and Beskin, S.M.,Resources of rhenium inRussia, Razv. Okhr. Nedr, 2011, no. 6, pp. 26–31.Turesebekov, A.Kh., Sharipov, Kh.T., Turamuratov, I.B.,et al., Rhenium of Uzbekistan, Gorn. Vestn. Uzbekistan,2007, no. 4, pp. 14–21.Turesebekov, A.Kh., Vasilevskii, B.B., Rakhimov, R.R., andKhantemirov, R.M., Content of molybdenum, rhenium,and osmium in the ores of th Kalmakyr copper–molybde�num and Muruntau gold deposits, Gorn. Vestn. Uzbekistan,2006, no. 3, pp. 11–14.Voudouris, P.C., Melfos, V., Spry, P.G. et al. Rhenium�richmolybdenite and rheniite in the Pagoni Rachi Mo–Cu–Te–Ag–Au prospect, Northern Greece: Implication for theRe geochemistry of porphyry�style Cu–Mo and Mo miner�alization, Can. Mineral., 2009, vol. 47, pp. 1013–1036.Xiong, Y., Wood, S., and Kruszewski, J., Hydrothermaltransport and deposition of rhenium under subcritical con�ditions revisited, Econ. Geol., 2006, vol. 101, pp. 471–478.Yatsimirskii, K.B., Kineticheskie metody analiza (Spectro�photometric Analytical Methods), Khimiya, Moscow,1967.
Translated by I. Baksheev