Changes in area and geodetic mass balance of small glaciers, Polar Urals, Russia, 1950–2008
12
Changes in area and geodetic mass balance of small glaciers, Polar Urals, Russia, 1950–2008 Maria SHAHGEDANOVA, 1 Gennady NOSENKO, 2 Irina BUSHUEVA, 2 Mikhail IVANOV 2 1 Department of Geography and Environmental Science and Walker Institute for Climate System Research, University of Reading, Reading, UK E-mail: [email protected] 2 Institute of Geography, Russian Academy of Sciences, Moscow, Russia ABSTRACT. Changes in area of 30 small glaciers (mostly <1km 2 ) in the northern Polar Urals (67.5– 68.258 8 N) between 1953 and 2000 were assessed using historic aerial photography from 1953 and 1960, ASTER and panchromatic Landsat ETM+ imagery from 2000, and data from 1981 and 2008 terrestrial surveys. Changes in volume and geodetic mass balance of IGAN and Obruchev glaciers were calculated using data from terrestrial surveys in 1963 and 2008. In total, glacier area declined by 22.3 3.9% in the 1953/60–2000 period. The areas of individual glaciers decreased by 4–46%. Surfaces of Obruchev and IGAN glaciers lowered by 22.5 1.7 m and 14.9 2.1 m. Over 45 years, geodetic mass balances of Obruchev and IGAN glaciers were –20.66 2.91 and –13.54 2.57 m w.e. respectively. Glacier shrinkage in the Polar Urals is related to a summer warming of 18C between 1953–81 and 1981–2008 and its rates are consistent with other regions of northern Asia but are higher than in Scandinavia. While glacier shrinkage intensified in the 1981–2000 period relative to 1953–81, increasing winter precipitation and shading effects slowed glacier wastage in 2000–08. 1. INTRODUCTION Glaciers in most parts of the world are currently receding in response to climatic warming (Solomon and others, 2007). The loss of glacier mass leads to changes in the local and regional water balance and to global sea-level rise. Model- ling studies suggest that very small glaciers (e.g. <0.5 km 2 ) will respond most strongly to the projected climatic warming (Oerlemans and others, 1998). A number of observational studies have convincingly demonstrated the enhanced vulnerability of very small glaciers to observed climatic warming (e.g. Paul and others, 2004; Granshaw and Fountain, 2006; Bolch and others, 2010). However, the strong links between the behaviour of very small glaciers and local topographic and climatic factors (Evans, 2011) make their response to climatic warming less certain (Kuhn and others, 1985; Hoffman and others, 2007; DeBeer and Sharp, 2009; Abermann and others, 2011). Assessments of responses of very small glaciers to climatic warming are hampered by a lack of data: such glaciers are often excluded from analyses due to difficulties in the application of satellite remote-sensing techniques and lack of mass- balance monitoring. To improve our understanding of the response of very small glaciers to the observed climatic warming and to inform future projections, it is important to investigate their behaviour in regions with various climatic and topographic conditions. The Ural Mountains, a range dividing geographical Europe and Asia, is a region where very small glaciers are widespread. Glaciers exist north of 648 N in the the Polar (66–688 N) and Subpolar (64–668 N) Urals (Fig. 1). Research into the glaciers of the Urals dates back to the early 1930s, when selected glaciers of the Subpolar Urals were first mapped (Alsehkov, 1935; Boch, 1935). Extensive aerial surveys were conducted in the 1950s and 1960s and their results were summarized in the catalogue of glaciers of the USSR (Troitskiy and Kemmerikh, 1966) and by Troitskiy and others (1966) and Khodakov (1978). According to these data, available as part of the World Glacier Inventory (WGI) from the US National Snow and Ice Data Center, Boulder, CO (Bedford and Haggerty, 1996; http://nsidc.org/data/ glacier_inventory/), there were 143 glaciers in the Polar and Subpolar Urals with a combined area of 28.66 km 2 .A regular glacier monitoring programme in the region con- tinued between 1957 and 1981, and mass-balance obser- vations of two reference glaciers, IGAN and Obruchev, were reported to the World Glacier Monitoring Service (http:// www.wgms.ch). Although, by the 1980s, glacier wastage had already been observed in the region (Tsvetkov and Tyuflin, 1981; Tsvetkov, 2006), regular glaciological moni- toring was discontinued. This resulted in a lack of data about the behaviour of the glaciers of the Urals, at a time when intensified retreat of small glaciers was reported worldwide (Dyurgerov and Meier, 2000; Kaser and others, 2006). Brief field surveys conducted in 2002 and 2005, in the Subpolar and Polar Urals respectively, revealed dramatic changes: not only had glaciers shrunk significantly, but some (e.g. Manaraga and Balban in the Subpolar Urals) disap- peared and were replaced by newly formed lakes (Glazovs- kiy and others, 2005). A further study of six Polar Ural glaciers by Solomina and others (2010) reported a consider- able wastage of three glaciers (IGAN, Obruchev and Berg), which lost 30–50% of their length between 1953 and 2008, but very small changes in the positions of the termini of the other three (Shumskiy, Avsyuk and Anuchin), confirming a wide range of responses of small glaciers to climatic warming. This varying behaviour is in line with earlier reports which also emphasized varied responses of the Polar Ural glaciers to climatic fluctuations, and is enhanced by the dependency of the regional glaciers on snowdrift and their orientation in the lee of westerly winds (Dolgushin, 1961). Journal of Glaciology, Vol. 58, No. 211, 2012 doi: 10.3189/2012JoG11J233 953
-
Upload
independent -
Category
Documents
-
view
3 -
download
0
Transcript of Changes in area and geodetic mass balance of small glaciers, Polar Urals, Russia, 1950–2008

Changes in area and geodetic mass balance of small glaciers,Polar Urals, Russia, 1950–2008
Maria SHAHGEDANOVA,1 Gennady NOSENKO,2 Irina BUSHUEVA,2
Mikhail IVANOV2
1Department of Geography and Environmental Science and Walker Institute for Climate System Research,University of Reading, Reading, UK
E-mail: [email protected] of Geography, Russian Academy of Sciences, Moscow, Russia
ABSTRACT. Changes in area of 30 small glaciers (mostly <1 km2) in the northern Polar Urals (67.5–68.2588N) between 1953 and 2000 were assessed using historic aerial photography from 1953 and 1960,ASTER and panchromatic Landsat ETM+ imagery from 2000, and data from 1981 and 2008 terrestrialsurveys. Changes in volume and geodetic mass balance of IGAN and Obruchev glaciers were calculatedusing data from terrestrial surveys in 1963 and 2008. In total, glacier area declined by 22.3�3.9% inthe 1953/60–2000 period. The areas of individual glaciers decreased by 4–46%. Surfaces of Obruchevand IGAN glaciers lowered by 22.5�1.7m and 14.9�2.1m. Over 45 years, geodetic mass balances ofObruchev and IGAN glaciers were –20.66�2.91 and –13.54� 2.57mw.e. respectively. Glaciershrinkage in the Polar Urals is related to a summer warming of 18C between 1953–81 and 1981–2008and its rates are consistent with other regions of northern Asia but are higher than in Scandinavia. Whileglacier shrinkage intensified in the 1981–2000 period relative to 1953–81, increasing winterprecipitation and shading effects slowed glacier wastage in 2000–08.
1. INTRODUCTIONGlaciers in most parts of the world are currently receding inresponse to climatic warming (Solomon and others, 2007).The loss of glacier mass leads to changes in the local andregional water balance and to global sea-level rise. Model-ling studies suggest that very small glaciers (e.g. <0.5 km2)will respond most strongly to the projected climaticwarming (Oerlemans and others, 1998). A number ofobservational studies have convincingly demonstrated theenhanced vulnerability of very small glaciers to observedclimatic warming (e.g. Paul and others, 2004; Granshawand Fountain, 2006; Bolch and others, 2010). However, thestrong links between the behaviour of very small glaciersand local topographic and climatic factors (Evans, 2011)make their response to climatic warming less certain (Kuhnand others, 1985; Hoffman and others, 2007; DeBeer andSharp, 2009; Abermann and others, 2011). Assessments ofresponses of very small glaciers to climatic warming arehampered by a lack of data: such glaciers are oftenexcluded from analyses due to difficulties in the applicationof satellite remote-sensing techniques and lack of mass-balance monitoring. To improve our understanding of theresponse of very small glaciers to the observed climaticwarming and to inform future projections, it is important toinvestigate their behaviour in regions with various climaticand topographic conditions.
The Ural Mountains, a range dividing geographicalEurope and Asia, is a region where very small glaciers arewidespread. Glaciers exist north of 648N in the the Polar(66–688N) and Subpolar (64–668N) Urals (Fig. 1). Researchinto the glaciers of the Urals dates back to the early 1930s,when selected glaciers of the Subpolar Urals were firstmapped (Alsehkov, 1935; Boch, 1935). Extensive aerialsurveys were conducted in the 1950s and 1960s and theirresults were summarized in the catalogue of glaciers of the
USSR (Troitskiy and Kemmerikh, 1966) and by Troitskiy andothers (1966) and Khodakov (1978). According to thesedata, available as part of the World Glacier Inventory (WGI)from the US National Snow and Ice Data Center, Boulder,CO (Bedford and Haggerty, 1996; http://nsidc.org/data/glacier_inventory/), there were 143 glaciers in the Polarand Subpolar Urals with a combined area of 28.66 km2. Aregular glacier monitoring programme in the region con-tinued between 1957 and 1981, and mass-balance obser-vations of two reference glaciers, IGAN and Obruchev, werereported to the World Glacier Monitoring Service (http://www.wgms.ch). Although, by the 1980s, glacier wastagehad already been observed in the region (Tsvetkov andTyuflin, 1981; Tsvetkov, 2006), regular glaciological moni-toring was discontinued. This resulted in a lack of data aboutthe behaviour of the glaciers of the Urals, at a time whenintensified retreat of small glaciers was reported worldwide(Dyurgerov and Meier, 2000; Kaser and others, 2006).
Brief field surveys conducted in 2002 and 2005, in theSubpolar and Polar Urals respectively, revealed dramaticchanges: not only had glaciers shrunk significantly, but some(e.g. Manaraga and Balban in the Subpolar Urals) disap-peared and were replaced by newly formed lakes (Glazovs-kiy and others, 2005). A further study of six Polar Uralglaciers by Solomina and others (2010) reported a consider-able wastage of three glaciers (IGAN, Obruchev and Berg),which lost 30–50% of their length between 1953 and 2008,but very small changes in the positions of the termini of theother three (Shumskiy, Avsyuk and Anuchin), confirming awide range of responses of small glaciers to climaticwarming. This varying behaviour is in line with earlierreports which also emphasized varied responses of the PolarUral glaciers to climatic fluctuations, and is enhanced by thedependency of the regional glaciers on snowdrift and theirorientation in the lee of westerly winds (Dolgushin, 1961).
Journal of Glaciology, Vol. 58, No. 211, 2012 doi: 10.3189/2012JoG11J233 953
According to Tsvetkov (2006), while the terminus positions ofIGAN, Anuchin, MGG and Karskiy glaciers did not changebetween 1953 and 1981, that of MGU glacier receded by850m (i.e. 30ma–1) in the same time interval, while mostother glaciers receded at slower rates of 2–5ma–1.
The lack of recent data on glacier change and thereported diversity of responses of individual glaciers make itimportant to investigate changes in map area of a largersample of glaciers in the Polar Urals as well as changes inglacier volume and mass balance. Not only will thisinformation improve our knowledge of the diverse be-haviour of small glaciers under climatic warming, but it willcontribute to our understanding of glacier change in theArctic fringe. This paper presents the first comprehensivesurvey of small glaciers in the Polar Urals since terminationof the regional glacier monitoring programme in 1981. Theobjectives of the paper are to: (1) quantify changes in thearea of 30 glaciers between 1953 (the years of the previouslarge-scale glacier inventories (Tables 1 and 2) and the early21st century; (2) quantify changes in surface elevation andvolume and calculate geodetic mass balances for twoformerly reference glaciers (Obruchev and IGAN) between1963 and 2008; and (3) relate the observed glacier changesto changes in regional air temperature and precipitation.Glaciological mass-balance records for IGAN and Obruchevglaciers, dating back to the 1958–80 period, are among theearliest mass-balance records in Russia and it is envisagedthat the estimated geodetic mass-balance data will supple-ment the earlier glaciological data (despite the differences intheir instrumental and physical biases) and help to validatemass-balance records reconstructed from proxy data.
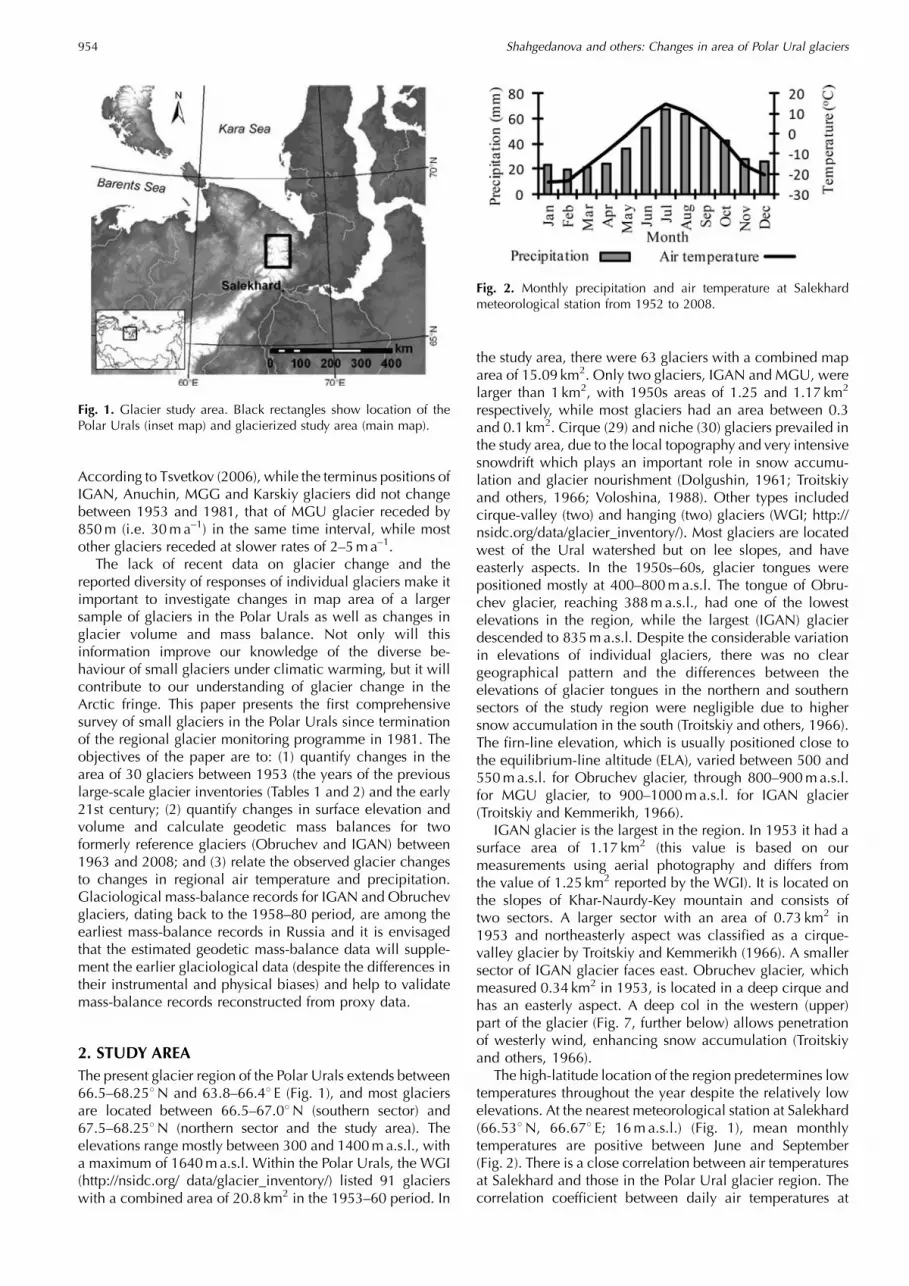
2. STUDY AREAThe present glacier region of the Polar Urals extends between66.5–68.258N and 63.8–66.48 E (Fig. 1), and most glaciersare located between 66.5–67.08N (southern sector) and67.5–68.258N (northern sector and the study area). Theelevations range mostly between 300 and 1400ma.s.l., witha maximum of 1640ma.s.l. Within the Polar Urals, the WGI(http://nsidc.org/ data/glacier_inventory/) listed 91 glacierswith a combined area of 20.8 km2 in the 1953–60 period. In
the study area, there were 63 glaciers with a combined maparea of 15.09 km2. Only two glaciers, IGAN and MGU, werelarger than 1 km2, with 1950s areas of 1.25 and 1.17 km2
respectively, while most glaciers had an area between 0.3and 0.1 km2. Cirque (29) and niche (30) glaciers prevailed inthe study area, due to the local topography and very intensivesnowdrift which plays an important role in snow accumu-lation and glacier nourishment (Dolgushin, 1961; Troitskiyand others, 1966; Voloshina, 1988). Other types includedcirque-valley (two) and hanging (two) glaciers (WGI; http://nsidc.org/data/glacier_inventory/). Most glaciers are locatedwest of the Ural watershed but on lee slopes, and haveeasterly aspects. In the 1950s–60s, glacier tongues werepositioned mostly at 400–800ma.s.l. The tongue of Obru-chev glacier, reaching 388ma.s.l., had one of the lowestelevations in the region, while the largest (IGAN) glacierdescended to 835ma.s.l. Despite the considerable variationin elevations of individual glaciers, there was no cleargeographical pattern and the differences between theelevations of glacier tongues in the northern and southernsectors of the study region were negligible due to highersnow accumulation in the south (Troitskiy and others, 1966).The firn-line elevation, which is usually positioned close tothe equilibrium-line altitude (ELA), varied between 500 and550ma.s.l. for Obruchev glacier, through 800–900ma.s.l.for MGU glacier, to 900–1000ma.s.l. for IGAN glacier(Troitskiy and Kemmerikh, 1966).
IGAN glacier is the largest in the region. In 1953 it had asurface area of 1.17 km2 (this value is based on ourmeasurements using aerial photography and differs fromthe value of 1.25 km2 reported by the WGI). It is located onthe slopes of Khar-Naurdy-Key mountain and consists oftwo sectors. A larger sector with an area of 0.73 km2 in1953 and northeasterly aspect was classified as a cirque-valley glacier by Troitskiy and Kemmerikh (1966). A smallersector of IGAN glacier faces east. Obruchev glacier, whichmeasured 0.34 km2 in 1953, is located in a deep cirque andhas an easterly aspect. A deep col in the western (upper)part of the glacier (Fig. 7, further below) allows penetrationof westerly wind, enhancing snow accumulation (Troitskiyand others, 1966).
The high-latitude location of the region predetermines lowtemperatures throughout the year despite the relatively lowelevations. At the nearest meteorological station at Salekhard(66.538N, 66.678 E; 16ma.s.l.) (Fig. 1), mean monthlytemperatures are positive between June and September(Fig. 2). There is a close correlation between air temperaturesat Salekhard and those in the Polar Ural glacier region. Thecorrelation coefficient between daily air temperatures at
Fig. 1. Glacier study area. Black rectangles show location of thePolar Urals (inset map) and glacierized study area (main map).
Fig. 2. Monthly precipitation and air temperature at Salekhardmeteorological station from 1952 to 2008.
Shahgedanova and others: Changes in area of Polar Ural glaciers954

Salekhard and temperatures obtained by the CampbellScientific automatic weather station installed between July2008 and August 2009 on IGAN glacier is 0.89. The ablationseason is short, lasting from the end of June to the end ofAugust, although in individual years glacier melt extends intoSeptember (Troitskiy and others, 1966). The 1963, 1969 and2000 ablation seasons, when glacier tongues were alreadyfree of seasonal snow by the end of June, were notableexceptions. Thus, ablation in 1963 was among the highest onrecord, averaging 3800mmw.e. on IGAN glacier (Troitskiyand others, 1966).
The Polar Ural region is dominated by westerly flow, anddepressions originating over the North Atlantic and theBarents Sea are the main source of precipitation throughoutthe year. The average precipitation at Salekhard is440mma–1. Precipitation at Bolshaya Khadata station(67.618N, 66.098 E; 264ma.s.l.), which functioned closeto the glacier tongues between 1958 and 1981, was610mma–1. The annual cycle of precipitation is character-ized by a summer maximum (Fig. 2), and more than half theannual precipitation (270mma–1 in the period 1970–2000at Salekhard) occurs between October and May as solidprecipitation. The reported precipitation measurements aresubject to large errors in the cold season because of bothunder-capture of snow by rain gauges, and frequentsnowdrifts (Groisman and Rankova, 2001). The averagewinter balances on IGAN and Obruchev glaciers between1958 and 1980 were 2.32 and 2.71mw.e. respectively, andthe average summer balances were –2.52 and –2.86mw.e.The region is characterized by strong interannual variabilityin both accumulation and ablation (Voloshina, 1988;Tsvetkov, 2006).
3. DATA AND METHODSChanges in the surface area of 30 glaciers were assessedusing aerial photographs acquired in 1953 and/or 1960 andthe Advanced Spaceborne Thermal Emission and ReflectionRadiometer (ASTER) and panchromatic Landsat EnhancedThematic Mapper Plus (ETM+) imagery from 2000 (Table 1).Smaller-scale aerial and terrestrial photogrammetric surveysof selected glaciers were conducted by the Institute ofGeography, Russian Academy of Sciences, (IGRAS) in thePolar Urals in 1968, 1973 and 1981 (Table 1). The 1973 and1981 data were used to assess glacier changes at highertemporal resolution. The 1968 data were excluded from theanalysis due to extensive snow cover that persisted till theend of the ablation season (Section 2). The lack of metadatafor the aerial surveys and lack of detail in the 1981 maps didnot allow us to construct DEMs from these sources. Twenty-eight measured glaciers had map areas larger than 0.1 km2
in 1953 (1960), and two glaciers had areas of 0.08 and0.09 km2 (Table 2). Glaciers smaller than 0.08 km2 were notassessed because it was difficult to distinguish betweenglacier ice and perennial snowpatches.
3.1. Aerial and satellite imageryThirty-six aerial photographs with a resolution of 1–3m forJuly 1953 and August 1960 covering the southern andnorthern sectors of the study area respectively wereobtained from the IGRAS archive (Tables 1 and 2). Aerialimagery for both years is available for IGAN, Obruchevand MGU glaciers. In both years, the imagery was cloud-free and the glacier tongues were free of seasonal snow at
the time of surveys, so aerial photographs were suitablefor mapping.
Two ASTER images (15m resolution; Table 1) acquiredunder nearly cloud-free conditions were obtained from theNASA Land Processes Distributed Active Archive Centerwhere they were orthorectified prior to the distribution usingPCI OrthoEngine software (Lang and Welch, 1999). Theimages did not include IGAN, Anuchin, Oleniy and BolshoyUsinskiy, and map areas of these glaciers were derived froman orthorectified panchromatic Landsat ETM+ image (15mresolution; path 167, row 12; Table 1). Both ASTER andpanchromatic Landsat ETM+ images were supplied inUniversal Transverse Mercator (UTM) zone N 41 and N 42WGS84 projection. The accuracy of the orthorectification ofboth ASTER and Landsat ETM+ imagery was verified using anetwork of interactive ground control points (GCPs)established during the GPS ground surveys in 2005 anddigital GPS (DGPS) surveys of Obruchev and IGAN glaciersin 2008. As a result of high air temperatures in May–June2000, seasonal snow melted on glacier tongues by the endof June, making the imagery suitable for mapping.
All the Polar Ural glaciers are separate ice bodies. Even athigher elevations, snow mostly disappeared from the stableterrain surrounding the glaciers, and their upper boundarieswere clearly visible on both aerial and satellite imagery.
3.2. Glacier mapping procedures and quantificationof errorsThe digitized aerial photographs from 1953, 1960 and 1973were co-registered to the orthorectified ASTER and LandsatETM+ images using a network of 10–15 GCPs per individualphotograph and ERDAS Imagine 9.0 software. The hydro-graphic and topographic features on stable terrain in thevicinity of glacier termini were used as GCPs. After co-registration, root-mean-square error (RMSEx,y) values notexceeding 5m were achieved, which is less than the size ofthe ASTER and panchromatic Landsat ETM+ pixels. Follow-ing co-registration, glacier outlines were manually mappedon ASTER, Landsat ETM+ and aerial imagery. Humaninterpretation was more suitable than automatic or semi-automatic procedures for extracting detailed informationfrom the imagery, because of the relatively small sample of
Table 1. Details of imagery used for mapping and glacier surveysconducted in the Polar Urals
Date Type of survey Glaciers
30 July 1953 Aerial photography 16 glaciers1 Aug 1960 Aerial photography 17 glaciersAug 1963 Theodolite survey IGAN, Obruchev20 Aug 1968 Aerial photography Obruchev, MGU, Synok,
Karskiy31 Aug 1973 Aerial photography MGG, MIIGAIK, Dolgushin,
Boch1981 Theodolite survey IGAN, Obruchev, Chernov,
Oleniy, Anuchin, MGU14 July 2000 ASTER 26 glaciers7 July 2000 Panchromatic
Landsat ETM+IGAN, Anuchin, Oleniy and
Bolshoy Usinskiy2005 Pilot GPS survey 8 glaciers2008 Field DGPS survey IGAN, Obruchev, Chernov,
MGU, Dolgushin
Shahgedanova and others: Changes in area of Polar Ural glaciers 955

glaciers and the limitations of automated techniques associ-ated with misclassification of water bodies that are wide-spread in the region (Raup and others, 2007; Bolch andothers, 2010). The error of co-registration of aerial photog-raphy and satellite imagery was estimated following amethodology proposed by Granshaw and Fountain (2006).A buffer, with a width of half of the RMSEx,y determined foreach aerial photograph, was created along the 1953, 1960,and 1973 and 2000 glacier outlines, and the error term wascalculated as an average ratio between the original areasand the areas with a buffer increment.
Debris cover and shadows, especially from cirque walls,are the well-known sources of uncertainty in glaciermapping. Continuous debris cover is not typical of the PolarUral glaciers, and many glaciers terminate in lakes, whichsimplifies terminus mapping. Two glaciers in the sample(Avsyuk and Kalesnik) have continuous debris cover on theirtongues, and the MGG and MIIGAIK glacier tongues featureintermittent debris cover. These glaciers were visited duringa pilot study in 2005, and the extent of debris cover wasmapped using a GPS. The difference between the extent ofdebris cover mapped in the field and from satellite imagerydid not exceed 1% of the debris-covered area. Based on thisresult, an additional error of 1% was assigned to both 2000and 1953 areas of these glaciers. Where glacier marginswere obscured by shadows, a contrast-stretching function
was applied to the imagery using ENVI 3.5 software. Thetotal error of glacier area change was calculated as an errorof co-registration, or as a root mean square of the three errorterms (co-registration and debris-cover-related error in 2000and 2008) where applicable (Table 2).
3.3. Ground-based surveys of 1963 and 2008Terrestrial theodolite surveys of IGAN and Obruchevglaciers were conducted by IGRAS on 10 and 28 August1963 respectively. During the surveys of 1963, tongues ofboth glaciers were already free of seasonal snow by mid-July(Section 2) and suitable for mapping: 1 : 5000 scale maps ofboth glaciers with equidistant contours of 5m wereproduced (Tsvetkov, 1969). Vertical precision of the 1963maps is estimated as �2.5m, which is the half-distancebetween the contours. The maps were scanned at 600 dpiresolution and the contours were digitized manually with anaccuracy of �0.2mm which is �1m in ground distance. Themaps were transformed to UTM zone N 41 (Obruchev) andzone N 42 (IGAN) on the WGS84 projection using ArcGIS9.2. Coordinates of GCPs established in 1963 and of notabletopographic features located in the vicinity of Obruchev andIGAN glaciers during the 2008 DGPS survey were used forgeoreferencing.
DGPS surveys of IGAN, Obruchev, Chernov, MGU andDolgushin glaciers were conducted between 28 July (IGAN)
Table 2. Glacier map areas and change statistics. Areas for the 1950s–60s are different from those listed by the WGI (http://nsidc.org/data/glacier_inventory/). �A is change in map area
Glacier 1953 1960 1968 1973 1981 2000 2008 �A (1953/60–2000)
km2 km2 km2 km2 km2 km2 km2 km2 %
IGAN 1.17 1.11 1.06 0.89 0.74 0.28* 23.9�2.7Bolshoy Usinskiy 0.70 0.67 0.03* 4.3�2.6Obruchev 0.34 0.33 0.30 0.30 0.25 0.24 0.09* 26.5�2.7Chernov 0.26 0.25 0.16 0.15 0.10 38.5�3.2Berg 0.26 0.24 0.02 7.7�3.2Kovalskiy 0.20 0.13 0.07* 35.0�3.4Lepehin 0.10 0.08 0.02* 20.0�4.0Shumskiy 0.17 0.11 0.06* 35.3�4.1Avsyuk 0.11 0.10 0.01* 9.1�5.3Kalesnik 0.18 0.16 0.02* 11.1�3.4Khabakov 0.12 0.09 0.03* 25.0�5.5Skrytniy 0.08 0.05 0.03* 37.5�6.7Avgevych 0.09 0.07 0.02* 22.2�5.4Oleniy 0.12 0.10 0.10 0.02* 16.7�5.2Anuchin 0.11 0.10 0.10 0.01* 9.1�5.2MGU 0.98 0.93 0.86 0.78 0.53 0.45 0.45* 45.9�2.7Synok 0.19 0.19 0.12 0.07* 36.8�3.1Karskiy 0.60 0.61 0.51 0.09* 15.0�2.6Palgov 0.15 0.1 0.05 33.3�6.1Markov 0.19 0.16 0.03 15.8�3.4Malysh 0.13 0.12 0.01 7.7�4.1Fedorov 0.25 0.23 0.02 8.0�2.7Shuchiy 0.47 0.37 0.10 21.3�2.1Tronov 0.22 0.20 0.02 9.1�2.8Aleshkov 0.31 0.26 0.05 16.1�2.4Terentyev 0.15 0.14 0.01 6.7�5.6MGG 0.47 0.46 0.38 0.09 19.1�3.3MIIGAIK 0.33 0.30 0.25 0.08 24.2�3.3Dolgushin 0.67 0.63 0.49 0.46 0.18 26.9�2.8Boch 0.10 0.10 0.09 0.01 10.0�6.2
Total 9.17 7.13 2.04 22.3�3.9
*1953 is used as reference year.
Shahgedanova and others: Changes in area of Polar Ural glaciers956

and 11 August (Obruchev) 2008 using Topcon Hiper ProDGPS. Boundaries of all four glaciers were mapped, andsurface elevation measurements were taken at Obruchev andIGAN glaciers. Only the northeast-facing sector of IGANwassurveyed because the state of the surface of the south-facingsector limited access. Therefore, the geodetic mass balanceof IGAN glacier reported here refers to its northeast (larger)sector, while glaciological mass balances reported in earlierpublications refer to the whole glacier. Surface elevationmeasurements were taken at the points of a quasi-regular gridwith a 40m mesh, with the total number of points being 430and 218 for IGAN and Obruchev glaciers respectively. Theglacier tongues were mainly free of seasonal snow at the timeof the 2008 survey. However, at the 1963 snowline positionthe thickness of seasonal snow averaged 0.4m on IGANglacier (975m a.s.l.) and 0.9m on Obruchev glacier (550ma.s.l.). Details of the 1963 snow depth surveys were availablefrom the IGRAS archive (unpublished field records), and in2008 the seasonal snow thickness was measured on bothglaciers along the 1963 profiles for the subsequent correctionof DEMs for seasonal snow cover.
Coordinates (longitude and latitude; x and y) andelevations (z) of the GCPs were measured with an accuracyof �0.07m (x, y) and �0.1m (z). In areas closer to cirquewalls in the accumulation zones, the accuracy dropped to�0.15m (x, y) and �0.2m (z). The glacier boundaries in theupper part of the accumulation zone remained unchangedon most glaciers since 1953/60 because avalanche nourish-ment dominates in these areas. The position of snow massdelivered by avalanches remained the same as in previousyears, as shown by the aerial and historical ground-basedphotography. However, there are exceptions where theupper boundary receded, as on the smaller sector of IGANand on MGU glacier.
3.4. Calculation of geodetic mass balance and volumechangesDEMs of IGAN and Obruchev glaciers with 5.5 and 3.5mresolution respectively were derived from the digitized 1963topographic maps and the 2008 DGPS survey data, using theArcGIS 9.2 triangular irregular network (TIN) method.Coordinates and elevations of the GCPs established onstable terrain both in 1963 and in 2008 were used as tiepoints for co-registration and relative control of the 1963and 2008 DEMs. Volume changes were calculated for thecommon glacier areas covered by the 1963 and 2008 DEMs,and the volume of the completely melted ice mass wasinferred from the 1963 DEM. Geodetic mass balance wascalculated following Fischer (2011) as a product ofvolume change and average ice density. Specific massbalance was calculated by dividing the value of geodeticmass balance by the average (1963 and 2008) glacier areafollowing Thibert and others (2008).
Information about ice density is required to convertchanges in glacier surface elevation into a mass change.Most geodetic mass-balance calculations assume thatchanges in elevation are due to the loss of ice with aconstant density of 900 kgm–3 (e.g. Andreassen, 1999;Arendt and others, 2002; Cogley, 2009). Zemp and others(2010) commented that this assumption often leads to anoverestimation of mass balance and recommended the useof an average of minimum and maximum assumptions onice and firn densities. In their calculation of Storglaciaren(Sweden) geodetic mass balance, Zemp and others (2010)
used an average density of 860 kgm–3 and applied adifference between the maximum and minimum estimatesof 60 kgm–3 as an uncertainty measure. Ice densitymeasurements were conducted annually on IGAN andObruchev glaciers between 1959 and 1963, providing anaverage value of 840 kgm–3 (Khodakov, 1966). More recentthree-dimensional measurements are not available and weused a value of 840 kgm–3 with an uncertainty term of�60 kgm-3.
3.5. Quantification of errors in geodetic mass balanceand volume changesErrors in the calculation of changes in glacier volume andgeodetic mass balance result from errors in the constructedDEMs and, in case of mass balance, uncertainty of icedensity measurements or assumptions. The probable sourcesof errors in DEMs are (1) uncertainties of maps and surveysused in DEM construction; (2) accuracy of map digitizing;(3) interpolation on a grid during DEM construction,especially if glacier topography is complex and is character-ized by steep slopes; and (4) seasonality in thickness change(Sapiano and others, 1998; Andreassen, 1999; Arendt andothers, 2002; Thibert and others 2008; Koblet and others,2010). Evaluations of DEM accuracy vary between complexand comprehensive error propagation analyses (e.g. Thibertand others, 2008), assessments based on a comparison of theDEM values with an independent set of GCPs located innon-glaciated terrain (e.g. Koblet and others, 2010), andrelative errors between two or more DEMs over the bedrock(e.g. Cox and March, 2004). The latter method is frequentlyused because relative errors and consistency between thehistorical and recent DEMs are more important for thecalculation of geodetic mass balance than absolute eleva-tions (Cox and March, 2004; Thibert and others, 2008).
In our assessment of errors, we considered (1) error inelevation change; (2) planimetric error of the calculatedglacier areas; (3) uncertainty in assumptions about icedensity; and (4) uncertainty due to the seasonality ofthickness change related to the seasonal snow cover. Tocorrect for changes in seasonal snow cover, the 2008 DEMwas corrected relative to the 1963 DEM using the 1963 and2008 snow depth measurements. To quantify errors inelevation change, the 2008 DEM was subtracted from the1963 DEM over the ice-free stable terrain, producing RMSEzof �2.1m and �1.7m for IGAN and Obruchev glaciersrespectively (14% and 7.5% of the observed average glaciersurface lowering). Relative errors are often higher over thebedrock than over glacier areas because of a less densenetwork of points (Cox and March, 2004; Koblet and others,2010) and it is likely that this error term is overestimated inthis study.
The planimetric error terms included (1) accuracy ofDGPS measurements taken as the lowest accuracy obtainedin the parts of the glacier with a weak satellite signal(�0.15m); (2) error of the 1963 map digitizing (�1.0m); and(3) accuracy of triangulation and DEM construction repre-sented by RMSEx,y (�4.5m and �5.0m for IGAN andObruchev glaciers respectively). The total planimetric errorswere �4.6m and �5.1m for IGAN and Obruchev glaciersrespectively, or 3.3% and 4.7% of their areas. We have notincluded an error term for the delineation of glacierboundaries, as these were very clearly defined both in1963 and 2008 in the absence of seasonal snow and debriscover on the glacier tongues.
Shahgedanova and others: Changes in area of Polar Ural glaciers 957

4. RESULTS
4.1. Changes in area of 30 glaciers since 1953/60Analysis of the satellite imagery has shown that in 2000there were 30 glaciers in the study region with a combinedmap area of 7.13�0.2 km2. This represents a net areareduction of 2.04�0.08 km2 from 1953/60 (Table 2). Over-all, the Polar Ural glaciers have lost 22.3� 3.9% of their1953/60 area, but the extent of shrinkage varies significantly,between 4% (Bolshoy Usinskiy glacier) and 46% (MGUglacier). Ten glaciers have lost not less than 25% of their areaover 40 (47) years. The two largest glaciers in the region,IGAN (both sectors are included in the planimetric measure-ments) and MGU, were classified by the WGI as cirque-valley. They exhibited the highest absolute and relative lossof area, averaging 34.9�2.7%. The cirque glaciers have lost20�3.9% of their 1953/60 area while niche glaciers havelost 14�4.1%. The difference in the rates of shrinkage ofcirque and niche glaciers may reflect the topographicallyfavourable, shaded locations of the niche glaciers. Seven-teen out of thirty glaciers in the study area have easterlyaspect and these glaciers have lost 22.4�3.9% of their area.Glaciers with northerly (four), northeasterly (six) and south-easterly (three) aspects have lost 20.3� 3.3%, 16.1�4%and 17.6� 2.8% respectively. The difference between theshrinkage rates of glaciers with different aspects is small andclose to the accuracy of area change measurements in thisdataset. Similarly, correlation between glacier size and areareduction is weak in the study region, possibly due to thesmall range of individual glacier areas (Fig. 3). Althoughchanges in area of glaciers smaller than 0.08 km2 in 1953/60were not quantified, it was noted that some of these verysmall glaciers (e.g. Baklund and Kulik) had melted com-pletely and had been replaced by lakes by 2000.
The ground-based surveys, conducted in 1981 and 2008,enabled a comparison of changes in the rates of area loss ofIGAN, MGU, Chernov, Obruchev and Dolgushin glaciers(Table 2; Fig. 4). For IGAN glacier this accelerated fourfoldin the last two decades of the 20th century. Between 1953and 1981, IGAN glacier lost on average 0.2% of its area peryear (9.4% of the 1953 area overall); between 1981 and2008, it lost on average 1.1% of 1981 area per year (30.2%of the 1981 area overall). The rate of area reduction of MGUglacier in the 1953–81 period was the highest of any glacierin the study region (Tsvetkov, 2006), and our analysisconfirms that this glacier exhibited the strongest shrinkage
Fig. 3. Change in glacier area between 1953/60 and 2000 versusindividual glacier area (as in 1953/60).
Fig. 4. Changes in map areas of the five largest glaciers of the PolarUrals between 1953 and 2008. Aerial photographs from 1953(1960 for Chernov and Dolgushin glaciers) are used as background.
Shahgedanova and others: Changes in area of Polar Ural glaciers958

(Table 2). The glacier snout receded so rapidly that Tsvetkovand Tyuflin (1981) recognized that the glacier should bereclassified as a cirque glacier. The repeat photography(Fig. 5), featuring formation of a proglacial lake, illustratesthe acceleration of MGU glacier recession in the 1974–91period relative to 1958–74. The rate of map area reductionof MGU glacier doubled from 0.7%a–1 (1953–81) to1.5%a–1 (1981–2008). In addition to a 46% loss of its
1953 area in the 1953–2000 period (Table 2), the glacier losta further 16% of its 2000 area in 2008. The proglacial lake,formed in the 1980s, occupied 28% of the 1953 MGUglacier area in 2008 (Fig. 6). Chernov glacier, which lost38.6% of its area between 1960 and 2000, is among thefastest-receding glaciers in the region (Table 2). Most of thewastage occurred after 1981, reaching 1.9%a–1 between1981 and 2000. The overall loss of map area by Obruchevglacier was lower, at 26% between 1953 and 2000 (Table 2),but its area reduction accelerated from 0.4%a–1 in the1953–81 period to 0.7%a–1 between 1981 and 2008.Repeat ground-based photographs from 1963 and 2005illustrate a more subdued retreat of Obruchev glacier(Fig. 7). Between 1968 and 1981, it did not exhibitmeasurable changes in its area (Table 2), and a smallincrease occurred from 0.29 km2 in 1963 to 0.30 km2 in1968. Although this change was small and close to theaccuracy of measurements, the glaciological mass-balancedata (Voloshina, 1988) confirm that Obruchev gained massbriefly in the 1960s.
4.2. Changes in volume and geodetic mass balance onIGAN and Obruchev glaciersChanges in characteristics of IGAN and Obruchev glaciersare shown in Table 3. Obruchev glacier, positioned at lowerelevations, experienced stronger downwasting at an averagerate of 0.5ma–1 between 1963 and 2008. As expected, thelargest changes occurred on the glacier tongue, wheresurface lowering exceeded 40–50m (Fig. 8). The field surveydata from the 1960s to the 1970s indicated that ice thickness
Fig. 6. MGU glacier in 2008. The inset image shows the extent ofthe lake in 2008 relative to the glacier size in 1953. Rectangleshows the area where separation between the glacier tongue andthe accumulation zone is likely to occur.
Table 3. Changes in characteristics of Obruchev glacier and northeastern sector of IGAN glacier between 1963 and 2008
Glacier Map area reduction Average surface lowering Max surface lowering Volume reduction Cumulative area-weightedmass balance
km2 m m 106m3 mw.e.
Obruchev* 0.049�0.002 22.5�1.7 63.4� 1.7 6.55� 0.8 –20.66�2.91IGAN{ 0.12�0.006 14.9�2.1 48.3� 2.1 10.14� 1.8 –13.54�2.57
*A difference in area change of Obruchev glacier between Tables 2 and 3 is due to a 0.01 km2 increase in glacier area between 1963 and 1968 (Section 4.1).{Changes in the northeastern sector of IGAN only, whereas Table 2 shows changes in the whole of IGAN glacier.
Fig. 5. Repeated ground-based photographs of MGU glacier in1958, 1974 and 1991. Strong glacier wastage occurred between1974 and 1991 with the formation of a contact lake.
Shahgedanova and others: Changes in area of Polar Ural glaciers 959

did not exceed 15–25m on the glacier snout, as a result ofintensive downwasting observed between 1953 and 1966(Macheret and Zhuravlev, 1981), hence this ice was entirelylost. Glacier downwasting was not limited to the ablationzone, and, even on the upper part of the accumulation zone,glacier thinning reached 30m (Fig. 8). Overall, the glacierlost (6.55�0.8)�106m3 of ice between 1963 and 2008.The cumulative area-weighted mass balance of Obruchevglacier for the 1963–2008 period was –20.66� 2.91mw.e.,and the average mass balance was –460� 65mmw.e. a–1.
Downwasting of the northeastern sector of IGAN glacier,whose snout is positioned �400m higher than the snout ofObruchev glacier, was more subdued (Fig. 9). While surfacelowering exceeded 40m on IGAN’s snout, thickness loss didnot exceed 10m in the lower part of the accumulation zoneand was within the error margin in its upper part. Overall, theglacier lost (10.14�1.8)�106m3 of ice between 1963 and2008. The cumulative area-weighted mass balance of IGANglacier for the 1963–2008 period was –13.54� 2.57mw.e.,and the average mass balance was –300�57mmw.e. a–1.
5. DISCUSSION5.1. Rates of glacier changeBy the beginning of the 21st century, glaciers of the PolarUrals had lost 22.3�3.9% of their area since 1953/60. Theuse of two reference years (1953 and 1960) should be notedwhen comparing wastage rates of individual glaciers. ThusIGAN, MGU and Obruchev glaciers, for which both 1953and 1960 measurements are available, lost 4.8% of theircombined area between 1953 and 1960, but while theshrinkage rate of 0.7%a–1 is not negligible, the overallreduction is comparable with error terms in the calculationof glacier shrinkage between the reference years and 2000.
For seven out of thirty glaciers, the area loss exceeded30% (Table 2). Five of these seven terminate in lakes and this
factor may have enhanced their wastage. The topography ofthe Polar Urals favours the formation of lakes, and theirdevelopment is perhaps more widespread than in otherglaciated regions. Glacier shrinkage accelerated towards theend of the 20th century. Thus the combined areas of IGAN,Obruchev and MGU glaciers declined by 14% in the 1953–81 period and by 33% in 1981–2008. Overall, these glacierslost 42.6% of their combined 1953 area; MGU glacier lost46% of its 1953 area by 2000 (Table 2) and 54% by 2008.Obruchev glacier lost 26.5% of its area by 2000 (29% by2008). A very rapid reduction in Obruchev’s area occurredin the early 1960s, when it declined from 0.33 km2 in 1960(Table 2) to 0.29 km2 in 1963 as indicated by the field surveydata, i.e. at a rate of 4%a–1. Obruchev glacier is positionedat low elevations, and spans a small range of altitudes(410–650ma.s.l.; Fig. 8), which is likely to be the factorexplaining its rapid recession between 1953 and 1963.Figure 7 shows that the glacier margin has retreated into theshaded cirque, and it is the combination of shading andsnowdrift enhanced by local topography that is likely to haveslowed glacier shrinkage.
Fig. 8. (a) Changes in surface elevation of Obruchev glacierbetween 1963 and 2008, and (b) profiles of the surface elevationsin 1963 and 2008. Solid straight line in (a) shows location of theprofiles.
Fig. 7. Repeated ground-based photographs of Obruchev glacier in1960 and 2005.
Shahgedanova and others: Changes in area of Polar Ural glaciers960

Table 4 compares changes in the annual rates of glaciershrinkage in the last two decades of the 20th century and thefirst decade of the 21st century for five glaciers. Threeglaciers exhibited a deceleration in relative loss of area. Theannual shrinkage rate decreased by over a factor of two forChernov glacier, which lost contact with its proglacial lakein 2005. MGU and IGAN glaciers receded at a greaterannual rate in the 2000–08 period than in 1981–2000, butthis increase was very small for MGU glacier. These trendsare consistent with an increase in the accumulation seasonprecipitation (Section 5.2) and the increased shelter affordedby cirque headwalls as tongues are lost. The sheltering is lessefficient in the case of IGAN glacier, which still has a well-defined glacier tongue and continues to recede at a higherrate. These topographic factors, protecting the cirqueglaciers today, are considered by Mangerud and others(2008) as a negative feedback limiting glacier growth in thePolar Urals during the Last Glacial Maximum: the lack ofshading affecting glaciers as they extended further from theircirques restricted their growth because the ELA on theglaciers of the Polar Urals is located below the climaticsnowline position (Troitskiy and others, 1966).
We were not able to quantify the thinning of MGUglacier; however, repeat photography reveals strong down-wasting which was already evident between 1953 and 1974when the first exposed rocks appeared in the central sectionof the accumulation area (Fig. 5). Between 1974 and 1991,downwasting intensified as shown by the larger area of the
exposed rocks (Fig. 5). In 2000, rock outcrops occupied 8%of the 1953 glacier area. A contact lake formed in the early1980s, and in 2008 it occupied 28% of the 1953 glacier area(Fig. 6). MGU glacier exhibited the strongest shrinkage in theassessed sample of glaciers (Table 2) and it is likely that boththe lake and the exposed rocks enhance its disintegrationthrough the supply of extra heat to the glacier margins. Thegrowing area of rock outcrops and exposed bedrocknarrowed the central sector of the glacier to just under120m (Fig. 6), limiting the mass flux, and it is likely that inthe near future the glacier tongue will be separated from theaccumulation area. Similar disintegration occurred onKarskiy glacier, located close to MGU. The expansion ofrock outcrops on a steep slope connecting the glacier tonguewith the larger cirque sector of the glacier positioned athigher elevations led to the loss of the entire glacier tonguein the late 1990s. Strong glacier downwasting and disin-tegration enhanced by the expansion of lakes and rockoutcrops in the Swiss Alps are discussed by Paul and others(2007). In the Polar Urals, separation of glacier sections byrock outcrops appears to be less widespread because mostglaciers are positioned in cirques.
A strong surface lowering averaging 22m (Table 3) andextending across the glacier including the accumulationzone was observed on Obruchev glacier, while the down-wasting of IGAN glacier positioned at higher elevations wasweaker. The maximum ice thickness of Obruchev glacierreached 120m in 1974 (Macheret and Zhuravlev, 1981),and the observed surface lowering of 20–30m in itsaccumulation zone (Fig. 8) implies that the glacier had lost15–25% of its depth in the accumulation zone by 2008. Themass balance of Obruchev glacier was –460mmw.e. a–1.The mass balance for the northeastern sector of IGANglacier, positioned at higher elevations, was falling at a rateof 300mmw.e. a–1. Combined with data on area change, themass-balance values show that cirque glaciers such asObruchev lose mass mainly through downwasting. As forIGAN, its mass-balance measurement would likely havebeen more strongly negative had we been able to include itssmaller east-facing sector. While we were not able toquantify changes in surface lowering of this sector, weobserved strong fragmentation of the glacier surface and theemergence of rock outcrops characteristic of downwasting.
5.2. Comparison with other regions and climaticcausesThe observed changes and intensification of wastage in thelast two decades of the 20th century are consistent with theobserved shrinkage of small glaciers in northern Asia, whilerates of glacier shrinkage in Scandinavia have been lower
Table 4. Annual area loss for five glaciers in the 1981–2000 (1973–2000 for Dolgushin glacier) and 2000–08 periods
Glacier 1981(1973)–2000 2000–08
km2 a–1 %a–1 km2 a–1 %a–1
IGAN 0.00895 0.84 0.01875 2.11Obruchev 0.00263 0.88 0.00125 0.5Chernov 0.00474 1.89 0.00125 0.78MGU 0.01316 1.69 0.01000 1.89Dolgushin 0.005185 0.82 0.00375 0.77
Fig. 9. Same as Figure 8, but for the northeastern sector of IGANglacier.
Shahgedanova and others: Changes in area of Polar Ural glaciers 961

(Andreassen and others, 2008; Paul and Andreassen, 2009;Koblet and others, 2010). Thus, small (0.5–1 km2) glaciers inthe Altai mountains, southern Siberia, lost 28� 6% of theirarea between 1952 and 2004 (Shahgedanova and others,2010), and those in the Suntar-Khayata mountains, north-eastern Siberia, lost 19% between 1945 and 2003 followinga �1.98C increase in summer temperature (Takahashi andothers, 2011). The small glaciers of the Byrranga mountains(northern Taimyr peninsula) lost 17% between 1967 and2003 (Kononov and Ananicheva, 2010).
While in these three regions glaciers develop underdifferent topographic conditions, the similar wastage ratespoint to a uniform climatic forcing. Between the mid-1980sand the first decade of the 21st century, summer tempera-tures in northern Asia increased by 1–1.58C (Shahgedanovaand others, 2010, 2011). Similar trends are confirmed by theclimatic records from Salekhard station located in relativeproximity to the glaciers of the Polar Urals (Fig. 10a). Thus,at Salekhard station the June–August mean temperature was10.98C between 1953 and 1981, and 11.98C between 1981and 2008. The 1953–81 period was not uniform with regardto glacier shrinkage rates, which appear to closely followtemperature fluctuations, with a strong retreat in the early1960s in the Polar Urals (Tsvetkov, 2006). The averagesummer temperature in 1953–68 was 11.78C, while the1970–79 decade was cold, with an average summertemperature of 10.18C. Solomina and others (2010) reportthat the pre-1900 glacier fluctuations in the Polar Urals weresynchronous with summer temperature fluctuations recon-structed from lichenometry and dendrochronology.
Changes in the accumulation season precipitation aremore difficult to assess due to uncertainties in bothprecipitation measurements (Groisman and Rankova,
2001) and reanalysis data. The October–March precipitationrecords from Salekhard station (Fig. 10b) and Pechora station(not shown), located southwest of the study area (65.128N,57.18 E), do not exhibit significant linear trends since 1953.The Salekhard record shows that average accumulationseason precipitation in the 1984–95 period (170mm) waslower than in 1996–2008 (200mm), but does not revealstatistically significant differences with the earlier years. TheUS National Centers for Environmental Prediction (NCEP)/US National Center for Atmospheric Research (NCAR)reanalysis data (Kalnay and others, 1996) averaged overthe 66–698N, 63–678 E region and the 1952–2008 periodshows a positive trend in October–March precipitationexplaining 16% of the total variance. According to thisdataset, the 1984–95 decade (when glacier wastageintensified) had the lowest winter precipitation on record,with an average accumulation season precipitation of160mm. This was significantly lower than in the 1973–84decade, when accumulation season precipitation averaged195mm and glacier wastage slowed. However, in the 1996–2008 period, accumulation season precipitation increasedto 200mm, and some glacier shrinkage rates declined(Table 4) although the general trend of glacier wastagecontinued. Precipitation totals retrieved from the EuropeanCentre for Medium-range Weather Forecasts ERA-40 re-analysis data (Uppala and others, 2005) averaged over the1957–2002 period (restricted by ERA-40 data availability)significantly exceed the Salekhard and NCEP/NCAR accu-mulation season totals (Fig. 10b); however, these data alsoconfirm that the 1973–84 decade was characterized byhigher snowfall than the 1984–95 decade. Bulygina andothers (2009) report a significant increase in various meas-ures of snow accumulation in the Polar Urals between 1966and 2007 including mean and maximum snow depth andnumber of days with snow cover exceeding 0.2m.
It may therefore be suggested that in the 1970s to early1980s a combination of higher accumulation-season pre-cipitation and lower summer temperatures contributed to arelatively slow glacier recession, while in 1984–95 positivetrends in summer temperature and negative anomalies inaccumulation season precipitation resulted in intensifiedglacier shrinkage. The accumulation season precipitationincrease observed in the region since 1996 slowed glaciershrinkage compared with 1981–2000 but did not fullycompensate for the effect of higher summer temperatures. Inthe Polar Urals, the impact of winter precipitation on glaciermass balance is strongly affected by local conditions due tohigh wind speeds and snowdrifting (Troitskiy and others,1966; Voloshina, 1988). Solomina and co-workers (personalcommunication from IGRAS, 2011) also observed that thepre-20th-century glacier fluctuations showed little correl-ation with changes in precipitation. It therefore appears thatthe late-20th-century glacier change in the Polar Uralsregion is forced by an increase in summer temperature, as inother glacierized regions of northern Asia (excluding thePacific), despite an increase in winter precipitation whichwas more pronounced than elsewhere in northern Asia inthe last decade.
6. CONCLUSIONSChanges in the area of 30 very small glaciers in the PolarUrals have been quantified, showing that these glaciers lost22.3% of their total area between the mid-20th century and
Fig. 10. Air-temperature (a) and precipitation time series (b) fromSalekhard meteorological station (Fig. 1), and reanalysis dataaveraged over the 66–698N, 63–678 E region. Straight solid anddashed lines in (a) show 1952–2008 average air temperature and� two standard deviations respectively.
Shahgedanova and others: Changes in area of Polar Ural glaciers962

the beginning of the 21st century. The observed glaciershrinkage intensified in 1981–2000 compared with the1953–81 period. Area-weighted geodetic mass balances oftwo glaciers, IGAN and Obruchev, in the 1963–2008period were calculated as –13.54�2.57mw.e. and–20.66�2.91mw.e. respectively. It has been noted inmany previous publications that the strong influence oftopographic and local meteorological conditions on smallglaciers makes it difficult to interpret changes in their sizeand thickness in the context of climate change. Indeed,glacier area loss varied strongly within the studied sample,from 4% to 46%, and in some cases local factors enhancingor limiting this were identified. Data for only five glacierswere available to assess changes in glacier shrinkage rates inthe first decade of the 21st century, when climatic warmingintensified. These data suggest that a combination ofincreasing cold-season precipitation and changes in glaciermorphology resulting in greater shading effects slowedglacier shrinkage in 2000–08 compared with 1981(1973)–2000 but did not fully compensate for the effects of summerwarming. The observed changes in summer temperature andglacier area in the Polar Urals since the mid-20th centuryare consistent with other regions of northern Asia excludingthe Pacific. This leads us to a cautious suggestion that acommon climate forcing of a 1.0–1.98C increase in theablation season temperature is responsible for the �20%loss in area of very small (<1 km2) glaciers in northern Asiafrom the mid-20th to early 21st century.
ACKNOWLEDGEMENTSThis project was supported by a grant from the NationalGeographic Committee for Research and Exploration andthe Russian Foundation for Basic Research. We are gratefulto the reviewers, I.S. Evans and H. Escher-Vetter, for helpfulcomments.
REFERENCESAbermann J, Kuhn M and Fischer A (2011) Climatic controls of
glacier distribution and glacier changes in Austria. Ann.Glaciol., 52(59), 83–90 (doi: 10.3189/172756411799096222)
Aleshkov NA (1935) Gora Sablya i ee ledniki [Mount Sablya and itsglaciers]. Trudy Lednik. Exped., 4, 56–74
Andreassen LM (1999) Comparing traditional mass balancemeasurements with long-term volume change extracted fromtopographical maps: a case study of Storbreen glacier inJotunheimen, Norway, for the period 1940–1997. Geogr. Ann.,81A(4), 467–476
Andreassen LM, Paul F, Kaab A and Hausberg JE (2008) Landsat-derived glacier inventory for Jotunheimen, Norway, anddeduced glacier changes since the 1930s. Cryosphere, 2(2),131–145
Arendt AA, Echelmeyer KA, Harrison WD, Lingle CS and ValentineVB (2002) Rapid wastage of Alaska glaciers and their contri-bution to rising sea level. Science, 297(5580), 382–386 (doi:10.1126/science.1072497)
Bedford D and Haggerty C (1996) New digitized glacier inventoryfor the former Soviet Union and China. Earth Syst. Monitor, 6(3),8–10
Boch SG (1935) Geomofologicheskii ocherk raiona gory Narodnoi[Geomorphological description of the Mount Narodnaya re-gion]. Trudy Lednik. Exped., 4, 118–140
Bolch T, Menounos B andWheate R (2010) Landsat-based inventoryof glaciers in western Canada, 1985–2005. Remote Sens.Environ., 114(1), 127–137 (doi: 10.1016/j.rse.2009.08.015)
Bulygina ON, Razuvaev VN and Korshunova NN (2009) Changesin snow cover over Northern Eurasia in the last few decades.Environ. Res. Lett., 4(4), 045026 (doi: 10.1088/1748-9326/4/4/045026)
Cogley JG (2009) Geodetic and direct mass-balance measurements:comparison and joint analysis. Ann. Glaciol., 50(50), 96–100(doi: 10.3189/172756409787769744)
Cox LH and March RS (2004) Comparison of geodetic andglaciological mass-balance techniques, Gulkana Glacier,Alaska, U.S.A. J. Glaciol., 50(170), 363–370 (doi: 10.3189/172756504781829855)
DeBeer CM and Sharp MJ (2009) Topographic influences on recentchanges of very small glaciers in the Monashee Mountains,British Columbia, Canada. J. Glaciol., 55(192), 691–700 (doi:10.3189/002214309789470851)
Dolgushin LD (1961) Main features of the modern glaciation of theUrals. IASH Publ. 54 (General Assembly of Helsinki 1960 –Snow and Ice), 335–347
Dyurgerov MB and Meier MF (2000) Twentieth century climatechange: evidence from small glaciers. Proc. Natl. Acad. Sci.USA (PNAS), 97(4), 1406–1411
Evans IS (2011) Glacier distribution and direction in Svalbard, AxelHeiberg Island and throughout the Arctic: general northwardtendencies. Pol. Polar Res., 32(3), 199–238
Fischer A (2011) Comparison of direct and geodetic mass balanceson a multi-annual time scale. Cryosphere, 5(1), 107–124 (doi:10.5194/tc-5-107-2011)
Glazovskiy AF, Nosenko GA and Tsvetkov DG (2005) LednikiUrala: Sovremennoe sostoyanie i perspektivy evolyutsii [Gla-ciers of the Urals: current state and future]. Mater. Glyatsiol.Issled. 98, 207–213
Granshaw FD and Fountain AG (2006) Glacier change (1958–1998) in the North Cascades National Park Complex, Washing-ton, USA. J. Glaciol., 52(177), 251–256 (doi: 10.3189/172756506781828782)
Groisman PYa and Rankova EYa (2001) Precipitation trends over theRussian permafrost-free zone: removing the artifacts ofpre-processing. Int. J. Climatol., 21(6), 657–678 (doi: 10.1002/joc.627)
Hoffman MJ, Fountain AG and Achuff JM (2007) 20th-century variations in area of cirque glaciers and glacierets, RockyMountain National Park, Rocky Mountains, Colorado, USA. Ann.Glaciol., 46, 349–354 (doi: 10.3189/172756407782871233)
Kalnay E and 21 others (1996) The NCEP/NCAR 40-year reanalysisproject. Bull. Am. Meteorol. Soc., 77(3), 437–471
Kaser G, Cogley JG, Dyurgerov MB, Meier MF and Ohmura A(2006) Mass balance of glaciers and ice caps: consensusestimates for 1961–2004. Geophys. Res. Lett., 33(19), L19501(doi: 10.1029/2006GL027511)
Khodakov VG (1966) Oledenenie Urala: processy Idoobrazovaniyai stroenie lednikov [Glaciation of the Urals: processes of iceformation and structure of glaciers]. Glyaciologiya [Glaciology],16, 221–256
Khodakov VG (1978) Vodno-ledovyy balans raionov sovremenno-go i drevnego oledeneniya SSSR [Water and ice balance ofregions of today and ancient glaciation of USSR]. Nauka,Moscow
Koblet T and 6 others (2010) Reanalysis of multi-temporal aerialimages of Storglaciaren, Sweden (1959–99) – Part 1: Determin-ation of length, area, and volume changes. Cryosphere, 4(3),333–343 (doi: 10.5194/tc-4-333-2010)
Kononov YuM and Ananicheva MD (2010) Otsenka izmeneniilednikov gor Byrranga po kosmicheskim snimkam i KataloguLednikov [Assessment of changes in glaciers of the ByrrangaMountains using satellite imagery and the Catalogue ofGlaciers]. Led i Sneg, 3(111), 19–26
Kuhn M, Markl G, Kaser G, Nickus U, Obleitner F and Schneider H(1985) Fluctuations of climate and mass balance: differentresponses of two adjacent glaciers. Z. Gletscherkd. Glazialgeol.,21(1–2), 409–416
Shahgedanova and others: Changes in area of Polar Ural glaciers 963

Lang HR and Welch R (1999) ATBD-AST-08 algorithm theoreticalbasis document for ASTER digital elevation models (standardproduct AST14), Version 3.0. http://eospso.gsfc.nasa.gov/eos_homepage/for_scientists/atbd/docs/ASTER/atbd-ast-14.pdf(accessed 13 April 2012)
Macheret YuYa and Zhuravlev AB (1981) Detal’naya radiolokat-sionnaya s’yemka tolshchiny l’da podlednogo rel’yefa gornykhlednikov [Detailed radio-sounding survey of ice thickness andunderlying topography of mountain glaciers]. Mater. Glyatsiol.Issled. 41, 115–133
Mangerud J, Gosse J, Matiouchkov A and Dolvik T (2008) Glaciersin the Polar Urals, Russia, were not much larger during the LastGlobal Glacial Maximum than today. Quat. Sci. Rev., 27(9–10),1047–1057 (doi: 10.1016/j.quascirev.2008.01.015)
Oerlemans J and 10 others (1998) Modelling the response ofglaciers to climate warming. Climate Dyn., 14(4), 267–274
Paul F and Andreassen LM (2009) A new glacier inventory for theSvartisen region, Norway, from Landsat ETM+ data: challengesand change assessment. J. Glaciol., 55(192), 607–618 (doi:10.3189/002214309789471003)
Paul F, Kaab A, Maisch M, Kellenberger T and Haeberli W (2004)Rapid disintegration of Alpine glaciers observed with satellitedata. Geophys. Res. Lett., 31(21), L21402 (doi: 10.1029/2004GL020816)
Paul F, Kaab A and Haeberli W (2007) Recent glacier changes in theAlps observed from satellite: consequences for future monitoringstrategies. Global Planet. Change, 56(1–2), 111–122
Raup B, Racoviteanu A, Khalsa SJS, Helm C, Armstrong R andArnaud Y (2007) The GLIMS geospatial glacier database: a newtool for studying glacier change. Global Planet. Change,56(1–2), 101–110 (doi: 10.1016/j.gloplacha.2006.07.018)
Sapiano JJ, Harrison WD and Echelmeyer KA (1998) Elevation,volume and terminus changes of nine glaciers in North America.J. Glaciol., 44(146), 119–135
Shahgedanova M, Nosenko G, Khromova T and Muraveyev A(2010) Glacier shrinkage and climatic change in the RussianAltai from the mid-20th century: an assessment using remotesensing and PRECIS regional climate model. J. Geophys. Res.,115(D16), D16107 (doi: 10.1029/2009JD012976)
Shahgedanova M, Popovnin VV, Aleynikov A and Stokes CR (2011)Geodetic mass balance of Azarova glacier, Kodar mountains,eastern Siberia, and its links to observed and projected climaticchange. Ann. Glaciol., 52(58), 129–137 (doi: 10.3189/172756411797252275)
Solomina O, Ivanov M and Bradwell T (2010) Lichenometricstudies on moraines in the Polar Urals. Geogr. Ann., Ser. A,92(1), 81–99 (doi: 10.1111/j.1468-0459.2010.00379.x)
Solomon S and 7 others eds (2007) Climate change 2007: thephysical science basis. Contribution of Working Group Ito the Fourth Assessment Report of the Intergovernmental Panelon Climate Change. Cambridge University Press, Cambridge
Takahashi S and 6 others (2011) Response of glaciers in the Suntar–Khayata range, eastern Siberia, to climate change. Ann. Glaciol.,52(58), 185–192 (doi: 10.3189/172756411797252086)
Thibert E, Blanc R, Vincent C and Eckert N (2008) Glaciologicaland volumetric mass-balance measurements: error analysis over51 years for Glacier de Sarennes, French Alps. J. Glaciol.,54(186), 522–532 (doi: 10.3189/002214308785837093)
Troitskiy LS and Kemmerikh AO (1966) Katalog lednikov SSSR –Ural [Glacier Inventory of the USSR – Urals] Vol. 3, Part 3.Gidrometeoizdat, Leningrad
Troitskiy LS and 6 others. (1966) Oledenenie Urala [Glaciation ofthe Urals]. Nauka, Moscow
Tsvetkov DG (1969) Opredelenie izmeneniya ob’emov gornyhlednikov po materialam stereofotorgammetricheskih s’emok[Calculating changes in volumes of mountain glaciers usingterrestrial photogrammetry]. Mater. Glyatsiol. Issled. 15,182–191
Tsvetkov DG (2006) Fotogeodezicheskii monitoring lednikovPolyarnogo Urala [Monitoring of the Polar Urals glaciers usinggeodetic and aerial photography surveys]. In Kotlyakov VM ed.Oledenenie Severnoj i Central’noj Evrazii v Sovremennujuepochu [Glaciation in north and central Eurasia at presenttime]. Nauka, Moscow
Tsvetkov DG and Tyuflin AS (1981) Katastroficheskaya degradatsiyalednika MGU na Polyarnom Urale [Catastrophic degradation ofthe MGU glacier in the Polar Urals]. Mater. Glyatsiol. Issled. 41,162–172
Uppala SM and 45 others (2005) The ERA-40 re-analysis.Q. J. R. Meteorol. Soc., 131(612), 2961–3212 (doi: 10.1256/qj.04.176)
Voloshina AP (1988) Some results of glacier mass balance researchon the glaciers of the polar Urals. Polar Geogr. Geol., 12(3),200–211
Zemp M and 6 others (2010) Reanalysis of multi-temporal aerialimages of Storglaciaren, Sweden (1959–99). Part 2: Comparisonof glaciological and volumetric mass balances. Cryosphere, 4(3),345–357 (doi: 10.5194/tc-4-345-2010)
MS received 14 November 2011 and accepted in revised form 11 April 2012
Shahgedanova and others: Changes in area of Polar Ural glaciers964